copyright white paper · copyright white paper table of contents copyright white paper - a view...
TRANSCRIPT

JCI Series No.19
S A R V H
Copyright White Paper - A view from the perspective of copyright industries (Vol.3)-
August 2009
Japan Copyright Institute Copyright Research and Information Center
Copyright White Paper Preface
Preface
This third edition of the Copyright White Paper, subtitled “Economic Aspects of the Copyright Industry,” has been released more than eight years since the publication of the first edition in November 2000 and the second edition in March of 2005. As reports of this nature are more valuable when published in series rather than as one-off publications, our initial intention was to release a revised white paper every three years. We regret that due to circumstances beyond our control, however, many years have passed before we were finally able to release this new edition.
The preface to the November 2000 edition notes a comment by Taichi Sakaiya, the then-Minister of Economic Planning, which was published in the Economic Survey of Japan 2000: “...Japan, a leader in developing a hardware-focused industrial society based on standardized mass production, remained the most advanced country in the world in the development and application of control technology. It lagged behind in the informatization process, however, due to its failure to transform social mindsets, practices and frameworks that were focused on the standardized mass production system.”
Japan’s economic growth rate, 3.8% in 1991, fell to -2.8% in 1998. The expansion of the Internet reversed this economic trend, as sales of personal computers finally surpassed those of televisions in 1999 and the popularity of cell phones began to grow dramatically. To support this development, the first edition of this white paper reported that Japan’s copyright industry represented 2.3% (later revised to 2.5% after further review) of the GDP in 1998.
The Basic Law for Building an Advanced Info-Communications Network Society was established in December 2000, shortly after the publication of the first edition. The government also launched the IT Strategy Headquarters in January 2001, indicating the pivotal role that IT businesses had acquired in key national strategies. At that time, while Japan's declining production output finally bottomed out and the economy pulled out of recession, the recovery was still slow and modest. Against this backdrop, the IT industry became a driving force behind national economic and industrial growth.
Pursuant to Article 8 of the Basic Law on Science and Technology, in June 2004 the Ministry of Education, Culture, Sports, Science and Technology released the third annual report on progress in science and technology industries for 2003. The report refers to the 21st century as a century of intelligence that sees the establishment of a knowledge-based society. Through the publication of our white papers, we share the same intention with the ministry; being able to promote and contribute to the establishment of such a society. In the second edition, we reported on the increasingly strong role the copyright industry plays in Japan’s economy, noting that the industry represented 3.0 % of the GDP in 2002. The industry achieved a remarkable annual

Copyright White Paper Preface
growth rate of 7.1% over the eight years between 1994 and 2002, while the GDP managed only 1.8% in average annual growth. In 2007, the industry represented 3.4% of the GDP and recorded an average annual growth rate of 5.2%, while the rate of GDP growth again remained at 1.8%. In 2008, the government’s intellectual property strategy headquarters recommended a study on a legal system that could flexibly address the needs of the digital business market and innovative business models.
With the publication of this third edition of the Copyright White Paper, the following facts must be mentioned.
The first edition was published in 2000 and the second edition was published in 2005. As these types of reports are intended to be published sequentially, it is ideal for all the reports to be created in an identical format. The U.S. and countries in the EU, Asia and Oceania also publish reports on the economic impact of the copyright industry. Cross-national comparisons would be easier if an international reporting format standard was established. In reality, however, each country used its own system and formulas that were not always compatible in terms of comparative study. In order to address the need for a uniform system, in 2003 the World Intellectual Property Organization (WIPO) created the Guide on Surveying the Economic Contribution of the Copyright-based Industries. Regrettably, we only became aware of the WIPO guidelines when the process for the second edition was already well under way and were unable to reflect them in our report at that time. The third edition, however, was prepared using these guidelines. A translation of the WIPO guidelines, as well as five reports on the correlation between the copyright industries and economies in other countries, was released as a supplementary volume of the second edition in March 2005. It should be noted that our third edition also includes the WIPO guidelines (translated by Masahiro Miura) and reports from the U.S. (translated by Koji Abe) and the EU (translated by Hiroko Takarada), all of which were prepared using the WIPO guidelines.
We also followed WIPO’s recommendation to regard copyright management organizations as an industry and included in the third edition are reviews on its estimated economic value (value added) and impact on employment.
Due to timing issues, the third edition does not refer to the global economic downturn triggered by the credit crisis in the U.S. caused by the subprime loan collapse. The negative impact on Japan’s economy was of course inevitable, as the real annualized GDP growth rate between October and December 2008 was posted at a shocking -12.1%. As the economic recovery is projected to take three years, the government is said to have prepared a three-year emergency plan in March 2009, which will also have an impact on employment figures. Once again, however, reviews on these issues are not included in the third edition for the aforementioned reason.
Copyright White Paper Preface
As was the case with the supplementary volume of the second edition, we intend to follow up on the third edition with translations of reports from the Philippines, the U.S., Canada, Hungary and various Arab nations, etc.
The publication of the third edition, as was the case with the first and second editions, is in no small part attributable to the significant assistance provided by Nomura Research Institute, Ltd., which included the collection and organization of the base materials. We would like to note our deep appreciation for their contribution.
We would also like to express our gratitude to the Society for Administration of Remuneration for Video Home Recording (SARVH) for providing financial assistance for the publication of the third edition of the Copyright White Paper through its common purpose fund, which promotes awareness of copyrights and related legal systems.
June, 2009 Koji Abe
Director of the Japan Copyright Institute Copyright Research and Information Center
Copyright White Paper List of Committee Members
List of Committee Members
Chairman Koji ABE Dr. jur.; Emeritus Professor, Okayama
University; Chief Director, Japan Copyright Institute, Copyright Research and Information Center
Member Yutaka KIMURA Former Director, Copyright Research and
Information Center [Until March 8, 2009]
Hiroshi SAITO Dr. jur.; Lawyer; Emeritus Professor, Niigata University
Nobuhiro NAKAYAMA Professor, Meiji University; Emeritus Professor, University of Tokyo; Lawyer; Of Counsel, Nishimura & Asahi
Masao HANDA Interim Chancellor, Executive Trustee, Aoyama Gakuin Educational Foundation
Masayuki MATSUDA Lawyer; Visiting Professor of Law, Chuo University Law School
Nobuo MONYA Dr. jur.; Professor of Law, Seikei Law School
Takeshi OHBAYASHI Managing Director, Japan Council of Performers' Organizations
Hiromi KAWAKAMI Director, Japanese Society for Rights of Authors, Composers and Publishers
Kenji TAKASUGI Board of Director, Secretary General, Recording Industry Association of Japan
Japan Copyright Institute Hiroko TAKARADA Research Fellow Masashi YOKOYAMA Research Fellow
Copyright Research and Information Center (CRIC) Hidetoshi KASUGA Secretary General Hitoshi KITAMURA Deputy Secretary General Hiroshi IKEDA Manager of Business Management Section
Nomura Research Institute, Ltd., Hideki MATSUO Hiroyuki NITTO Takashi KOBAYASHI Ryo MORITA
Copyright White Paper Table of Contents
Copyright White Paper
- A view from the perspective of copyright industries (Vol.3)-
Preface
List of Committee Members
Part I: Study Overview
Chapter 1: Copyright White Paper Third Edition: Study Results Summary .......................... 1
I Summaries of previous Copyright White Papers.......................................................... 1
II Key issues raised in Copyright White Paper, second edition, concerning future
studies ...................................................................................................................................... 2
III Copyright White Paper, third edition: areas of study .................................................. 3 1. Compliance with WIPO guidelines............................................................................ 3
2. Newly-added areas of study....................................................................................... 4
Chapter 2: Copyright White Paper third edition: study results summary ............................ 5
I JCI-classified Copyright Industries: study results summary...................................... 5
II JCI-classified Core Copyright Industries: study results summary ............................. 6 1. Total value added and workforce............................................................................... 6
2. Foreign trade .............................................................................................................. 6
III JCI-classified Inter-dependent copyright industry: study results summary.............. 8 1. Total value added and workforce............................................................................... 8
2. Foreign trade .............................................................................................................. 8
IV Compliance with WIPO guidelines: study results summary ....................................... 9 Part Ⅱ: Study Results and Estimation Method of JCI-classified Copyright Industries
Chapter 3: Overview of JCI-classified Core Copyright Industries ....................................... 10
I Overview of JCI-classified Core Copyright Industries ............................................... 10 1. Scale of JCI-classified copyright industry............................................................... 10
2. Positioning of the copyright industry in the national economy............................. 11
3. Positioning of the JCI-classified core copyright industry as a business industry....
................................................................................................................................... 12 4. Growth factors for JCI-classified core copyright industry..................................... 13
II Preconditions in estimation of the scale of the core copyright industry ................... 15 1. Indicators for the scale of the core copyright industry........................................... 15
2. Classification of the core copyright industries ....................................................... 18
III Estimation method of the scale of the core copyright industries............................... 20
Copyright White Paper Table of Contents
1. Data used in estimation ........................................................................................... 20
2. Estimation policy...................................................................................................... 23
3. Preconditions of statistics ........................................................................................ 24
4. Key issues and suggestions concerning future studies .......................................... 25
5. Types of estimation method for each industry sector ............................................ 26
6. Calculation procedure for value-added ................................................................... 94
7. Deflator for statistical values ................................................................................ 100
Chapter 4: Overview of JCI-classified Inter-dependent Copyright Industries .................. 103
I Definitions of JCI-classified inter-dependent copyright industries......................... 103 1. Definitions of JCI-classified inter-dependent copyright industries .................... 103
II Overview on Scale of JCI-classified Inter-Dependent Copyright Industries .......... 105 1. Overview on Scale of JCI-classified Inter-Dependent Copyright Industries...... 105
2. Positioning of JCI-classified inter-dependent copyright industry in the national
economy............................................................................................................................ 107 3. Growth factors for JCI-classified core copyright industry................................... 108
III Estimation method of the scale of JCI-classified inter-dependent copyright
industries ............................................................................................................................. 110 1. Data used in estimation ......................................................................................... 110
2. Preconditions of statistics ...................................................................................... 110
3. Calculation method of the Value of products........................................................ 110
4. Estimation method of the Value-added................................................................. 111
Chapter 5: A Workforce Overview of JCI-classified Core Copyright Industries ................ 115
I A workforce overview of JCI-classified core copyright industries ........................... 115 1. JCI-classified core copyright industry workforce ................................................. 115
2. Positioning of the copyright industry in the national workforce......................... 116
3. Positioning of JCI-classified core copyright industry as a industry.................... 117
4. Growth factors for JCI-classified core copyright industry................................... 118
II JCI-classified core copyright industry workforce study methodologies .................. 119 1. Data used for estimate ........................................................................................... 119
2. Estimate methodologies ......................................................................................... 119
3. Preconditions of statistics ...................................................................................... 120
4. Specific Estimation Method for Each Industrial Sector ...................................... 120
Chapter 6: Overview on Workforce in JCI-classified Inter-dependent Copyright Industries
................................................................................................................................... 160
I Overview on workforce in JCI-classified inter-dependent copyright industries .... 160 1. Workforce scale of JCI-classified inter-dependent copyright industries ............ 160

Copyright White Paper Table of Contents
2. Positioning of JCI-classified inter-dependent copyright industry in Japan’ s
workforce.......................................................................................................................... 162 3. Factors causing a downsize of workforce scale in JCI-classified inter-dependent
copyright industry ........................................................................................................... 163
II Methodologies to measure the scale of JCI-classified inter-dependent copyright
industry ................................................................................................................................ 165 1. Data used for estimate ........................................................................................... 165
2. Precondition of estimation ..................................................................................... 165
3. Methodologies to calculate number of workforce ................................................. 165
Chapter 7: A Foreign Trade Overview of the Copyright Industry ...................................... 166
I Definitions of foreign trade in the copyright industry ............................................. 166 1. Definitions of copyright trade ................................................................................ 166
2. Definitions of copyright trade in commercial products ........................................ 170
II Details for copyright industry trade value estimates............................................... 178
III Scale of copyright industry foreign trade (Estimates).............................................. 181 1. Scale of copyright trade.......................................................................................... 181
2. Scale of copyright trade in commercial products.................................................. 183
Part Ⅲ: Study Results and Estimate Methodologies Based on WIPO Guidelines
Chapter 8: WIPO Guidelines and Studies Based on WIPO Guidelines ............................. 193
I An overview of the WIPO guidelines ......................................................................... 193 1. An overview of the WIPO guidelines..................................................................... 193
2. WIPO guidelines: working group and completion time ....................................... 196
II Policies on WIPO-classified core copyright industries ............................................. 197 1. Definitions of WIPO-classified core copyright industries .................................... 197
2. Policies on WIPO-classified core copyright industries ......................................... 199
3. Outline of the survey on copyright collective management societies.................. 200
III Policies on WIPO-classified inter-dependent copyright industries ......................... 201 1. Definitions of WIPO-classified inter-dependent copyright industries ................ 201
2. Policies on WIPO-classified inter-dependent copyright industries..................... 202
Chapter 9 Outline of WIPO-Classified Copyright Industries ............................................. 204
I Outline of WIPO-classified Core Copyright Industries ............................................ 204 1. Scale of WIPO-classified copyright industry ........................................................ 204
2. Positioning of WIPO-classified copyright industry in the national economy ..... 206
3. Methodologies to estimate the industrial scale of copyright collective
management societies ..................................................................................................... 208
Copyright White Paper Table of Contents
II Outline on WIPO-Classified Inter-dependent Copyright Industries....................... 210 1. Outline on WIPO-classified inter-dependent copyright industries..................... 210
2. Positioning of WIPO-classified inter-dependent copyright industries in the
national economy............................................................................................................. 211 Chapter 10 Overview on Workforce in WIPO-Classified Copyright Industries .................. 213
I Overview on Workforce in WIPO-Classified Core Copyright Industries................................213
1. Workforce scale of WIPO-classified core copyright industries ............................ 213
2. Positioning of Fiscal 2007 Workforce in WIPO-classified Core Copyright
Industries in the National Workforce ............................................................................ 215 3. Methodology to estimate workforce scale of copyright collective management
societies............................................................................................................................ 217 Ⅱ Overview on Workforce Scale of WIPO-classified Inter-dependent Copyright Industries ..........
...................................................................................................................................................218
1. Workforce Scale of WIPO-classified Inter-dependent Copyright Industries...... 218
2. Positioning of workforce in WIPO-classified inter-dependent copyright industries
in the national workforce................................................................................................ 219
Part Ⅳ: Data
Chapter 11 Data ..................................................................................................................... 220
I Statistics and data used in the estimation................................................................ 220 Ⅱ Correspondence between the classification of copyright industries and the JSIC.......
...................................................................................................................................... 255

Part I: Study Overview
Copyright White Paper Chapter 1: Copyright White Paper third edition: study results summary
Part I: Study Overview Chapter 1: Copyright White Paper Third Edition: Study Results Summary I. Summaries of previous Copyright White Papers
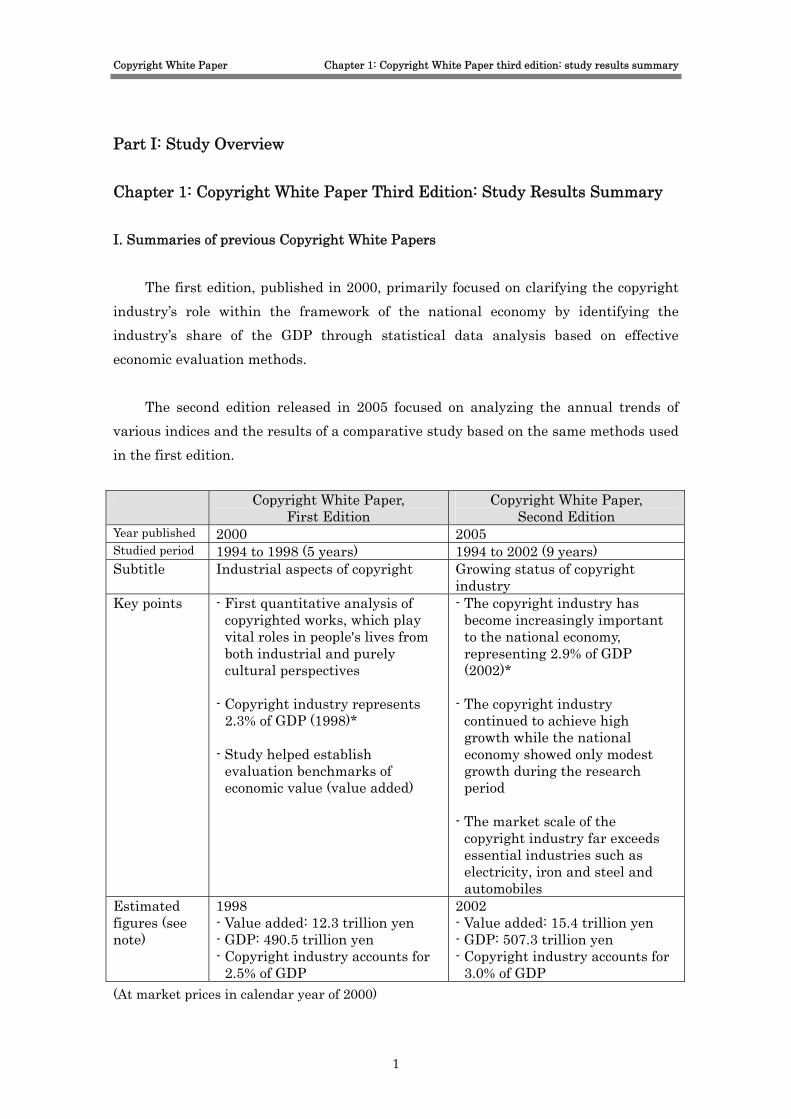
The first edition, published in 2000, primarily focused on clarifying the copyright industry’s role within the framework of the national economy by identifying the industry’s share of the GDP through statistical data analysis based on effective economic evaluation methods.
The second edition released in 2005 focused on analyzing the annual trends of various indices and the results of a comparative study based on the same methods used in the first edition.
Copyright White Paper, First Edition
Copyright White Paper, Second Edition
Year published 2000 2005 Studied period 1994 to 1998 (5 years) 1994 to 2002 (9 years) Subtitle Industrial aspects of copyright Growing status of copyright
industry Key points - First quantitative analysis of
copyrighted works, which play vital roles in people's lives from both industrial and purely cultural perspectives
- Copyright industry represents
2.3% of GDP (1998)* - Study helped establish
evaluation benchmarks of economic value (value added)
- The copyright industry has become increasingly important to the national economy, representing 2.9% of GDP (2002)*
- The copyright industry
continued to achieve high growth while the national economy showed only modest growth during the research period
- The market scale of the
copyright industry far exceeds essential industries such as electricity, iron and steel and automobiles
Estimated figures (see note)
1998 - Value added: 12.3 trillion yen - GDP: 490.5 trillion yen - Copyright industry accounts for
2.5% of GDP
2002 - Value added: 15.4 trillion yen - GDP: 507.3 trillion yen - Copyright industry accounts for
3.0% of GDP (At market prices in calendar year of 2000)
1
Copyright White Paper Chapter 1: Copyright White Paper third edition: study results summary
Note: The value added figures and GDP originally reported were later revised after further
review to those indicated in the table; 2.5% (1998) and 3.0% (2002). * Statistical amounts declared in the white papers are based on two types of values: real value and nominal value. It should be stipulated that 2000 is being used as the base year for the deflator to calculate the real value, and it should be noted “(At market prices in calendar year of 2000)”. II. Key issues raised in Copyright White Paper, second edition, concerning future studies
While the second edition was being developed, it was acknowledged that WIPO had developed study guidelines for the copyright industry (the Guide on Surveying the Economic Contribution of the Copyright-Based Industries; hereinafter the WIPO guidelines). The reports from EU countries were created in conformity with the WIPO guidelines (translated reports are available as a supplementary volume to the second edition).
The WIPO guidelines suggest that the copyright industry’s role be assessed in broader terms to include its contributions to national economies, such as providing employment, in addition to the value added by the industry and it was recognized that the third edition and future publications should reflect this new approach. (Note) Definition of copyright industries in the WIPO guideline (see page 193 for more details)
The WIPO guideline has defined the copyright industries in a broader sense, that is, the copyright industries include the industrial segments that “inter-dependently” relate to the copyright industries as well as those that directly engage in dealing with copyright products. Specifically, the copyright industries include the business entities that manufacture/ produce hardware devices indispensable to use of copyright products as well as component units (parts) of such devices. The former is defined as the “core-copyright indutries”, and the latter is the “inter-dependent copyright industries” in the WIPO guideline. According to the definition of the WIPO guideline definition, the study reported in the first and second editions of the white paper focused on “added values” of the “core-copyright industries.”
2

Copyright White Paper Chapter 1: Copyright White Paper third edition: study results summary
Although the concept to define the copyright industries defined in the first and second editions of the Copyright White Paper was same with the one for the definition of the “core-copyright industries” in the WIPO guideline, the classification system of industrial segments are different as the former has different industrial structures from the latter.
In the White Paper (series), the classification of the “core-copyright industries” will be referred as the “JCI classification” hereinafter after the abbreviation of the Japan Copyright Institute’s international name JCI (Japan Copyright Institute), whereas the classification in the WIPO guideline will be the “WIPO classification.” III. Copyright White Paper, third edition: areas of study 1. Compliance with WIPO guidelines
In the third edition of the Copyright White Paper, in compliance with the WIPO guidelines, the areas of study have been expanded to include employment, as well as foreign trades, in addition to value added. Value added and employment estimates also use the WIPO guideline aggregate method for the purpose of cross comparison.
1.Core Copyright Industry2.Inter-dependent copyright industry
3. Studies based on WIPO Guideline (Part Ⅲ)
Value added
Workforce
Foreign Trade
Studies based on JCI-classification (Part Ⅱ)
Areas of study in the first and the second edition
Regarding the survey on added value and foreign trades, the areas of study have
been expanded to include the “inter-dependnent copyright industries” in addition to the “core-copyright industries” under the definitions in the WIPO guideline.
3
Copyright White Paper Chapter 1: Copyright White Paper third edition: study results summary
In this white paper, the first section of the second chapter reports the overall study results, and the second section focuses on the study results under JCI classifications while the third section reports the study results under WIPO classification.
2. Newly-added areas of study
In the third edition of the Copyright White Paper, the photography business has been newly included in the copyright classification system (the JCI classifications). Although the photography business was excluded from the studies for the first and second editions due to limitations in data collection, the third edition now includes this sector as the necessary data is now available and is in compliance with the new study guidelines (see page 20 for more details). Accordingly, the JCI classification system now consists of fifteen business areas.
4
Copyright White Paper Chapter 2: Copyright White Paper third edition: study results summary
Chapter 2: Copyright White Paper third edition: study results summary I. JCI-classified Copyright Industries: study results summary
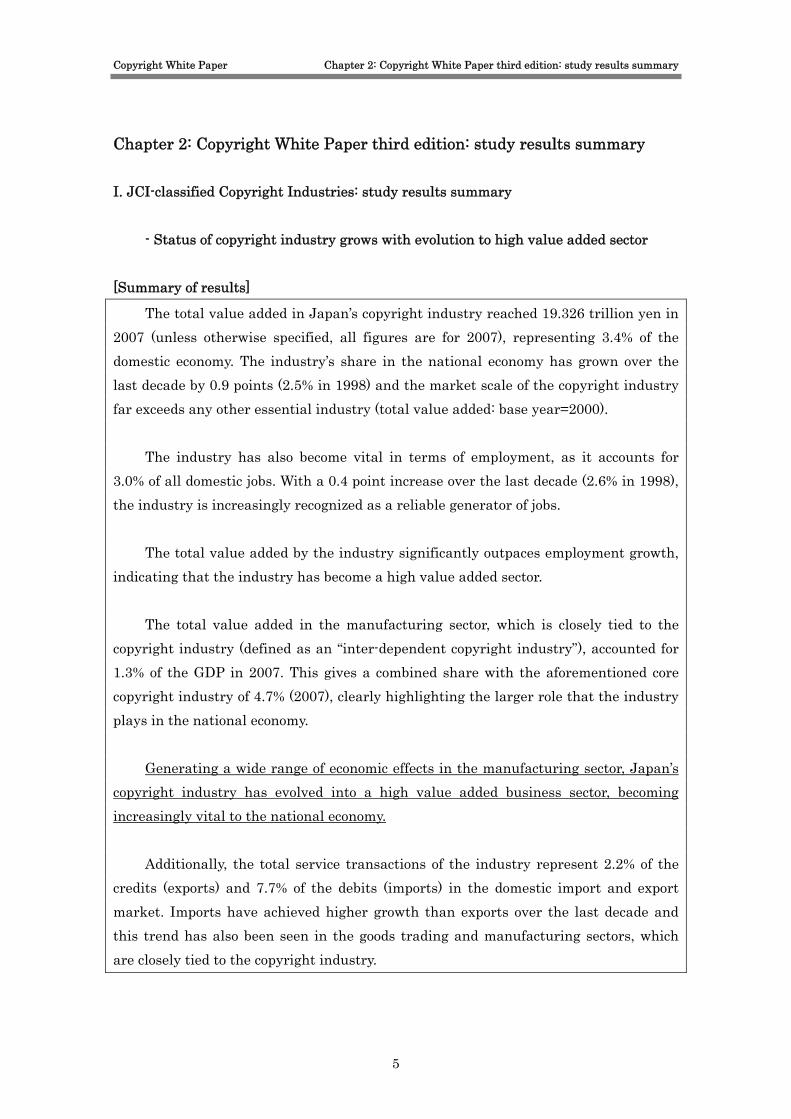
- Status of copyright industry grows with evolution to high value added sector [Summary of results]
The total value added in Japan’s copyright industry reached 19.326 trillion yen in 2007 (unless otherwise specified, all figures are for 2007), representing 3.4% of the domestic economy. The industry’s share in the national economy has grown over the last decade by 0.9 points (2.5% in 1998) and the market scale of the copyright industry far exceeds any other essential industry (total value added: base year=2000).
The industry has also become vital in terms of employment, as it accounts for 3.0% of all domestic jobs. With a 0.4 point increase over the last decade (2.6% in 1998), the industry is increasingly recognized as a reliable generator of jobs.
The total value added by the industry significantly outpaces employment growth, indicating that the industry has become a high value added sector.
The total value added in the manufacturing sector, which is closely tied to the copyright industry (defined as an “inter-dependent copyright industry”), accounted for 1.3% of the GDP in 2007. This gives a combined share with the aforementioned core copyright industry of 4.7% (2007), clearly highlighting the larger role that the industry plays in the national economy.
Generating a wide range of economic effects in the manufacturing sector, Japan’s copyright industry has evolved into a high value added business sector, becoming increasingly vital to the national economy.
Additionally, the total service transactions of the industry represent 2.2% of the credits (exports) and 7.7% of the debits (imports) in the domestic import and export market. Imports have achieved higher growth than exports over the last decade and this trend has also been seen in the goods trading and manufacturing sectors, which are closely tied to the copyright industry.
5
Copyright White Paper Chapter 2: Copyright White Paper third edition: study results summary
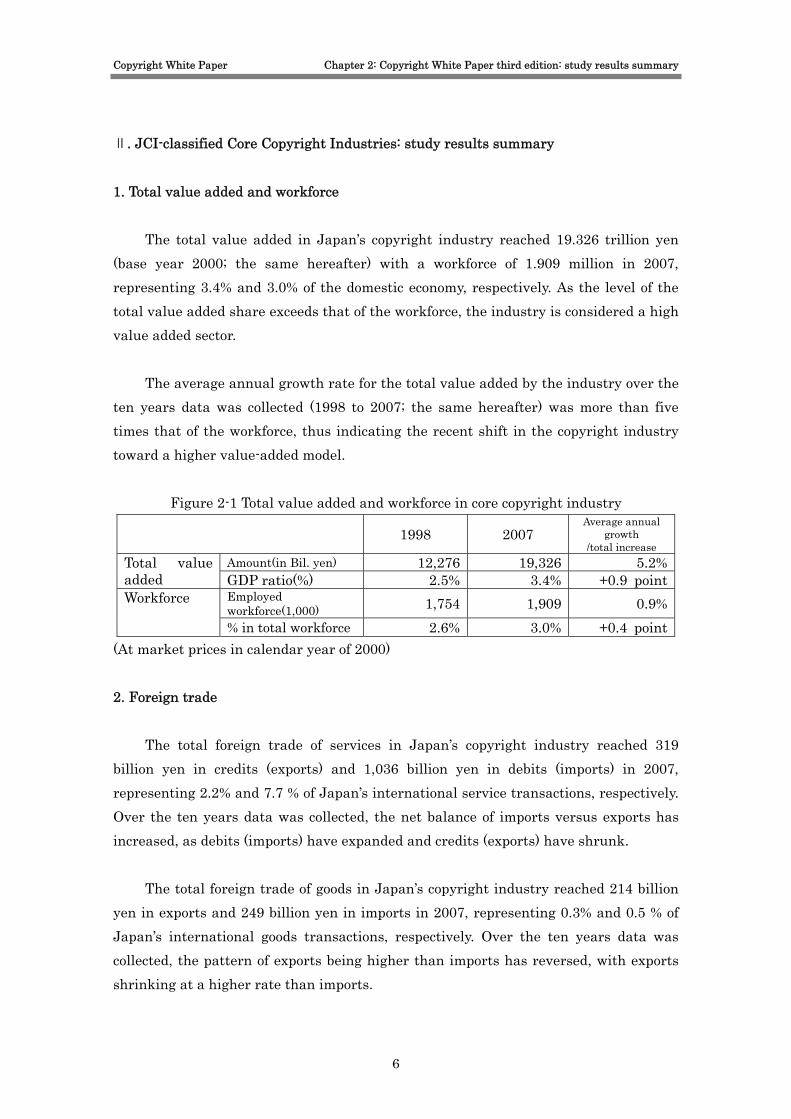
Ⅱ. JCI-classified Core Copyright Industries: study results summary 1. Total value added and workforce
The total value added in Japan’s copyright industry reached 19.326 trillion yen (base year 2000; the same hereafter) with a workforce of 1.909 million in 2007, representing 3.4% and 3.0% of the domestic economy, respectively. As the level of the total value added share exceeds that of the workforce, the industry is considered a high value added sector.
The average annual growth rate for the total value added by the industry over the ten years data was collected (1998 to 2007; the same hereafter) was more than five times that of the workforce, thus indicating the recent shift in the copyright industry toward a higher value-added model.
Figure 2-1 Total value added and workforce in core copyright industry
1998 2007 Average annual
growth /total increase
Amount(in Bil. yen) 12,276 19,326 5.2%Total value added GDP ratio(%) 2.5% 3.4% +0.9 point
Employed workforce(1,000) 1,754 1,909 0.9%Workforce
% in total workforce 2.6% 3.0% +0.4 point(At market prices in calendar year of 2000) 2. Foreign trade
The total foreign trade of services in Japan’s copyright industry reached 319 billion yen in credits (exports) and 1,036 billion yen in debits (imports) in 2007, representing 2.2% and 7.7 % of Japan’s international service transactions, respectively. Over the ten years data was collected, the net balance of imports versus exports has increased, as debits (imports) have expanded and credits (exports) have shrunk.
The total foreign trade of goods in Japan’s copyright industry reached 214 billion yen in exports and 249 billion yen in imports in 2007, representing 0.3% and 0.5 % of Japan’s international goods transactions, respectively. Over the ten years data was collected, the pattern of exports being higher than imports has reversed, with exports shrinking at a higher rate than imports.
6

Copyright White Paper Chapter 2: Copyright White Paper third edition: study results summary
Figure 2-2 Foreign Trade of Services in core copyright industry
1998 2007 Average annual
growth /total increase
Amount(in Bil. yen) 249 319 2.8%Exports Total trade ratio(%) 3.3% 2.2% -1.1 pointAmount(in Bil. yen) 860 1,036 2.1%Imports Total trade ratio(%) 6.6% 7.7% +1.1 point
Balance of payments Amount(in Bil. yen) -612 -717
(At market prices in calendar year of 2000)
Figure 2-3 Foreign Trade of Goods in core copyright industry
1998 2007 Average annual
growth /total increase
Amount(in Bil. yen) 301 214 -3.7%Exports Total trade ratio(%) 0.7% 0.3% -0.4 pointAmount(in Bil. yen) 268 249 -0.8%Imports Total trade ratio(%) 0.9% 0.5% -0.4 point
Balance of payments Amount(in Bil. yen) 33 -35
(At market prices in calendar year of 2000)
7
Copyright White Paper Chapter 2: Copyright White Paper third edition: study results summary
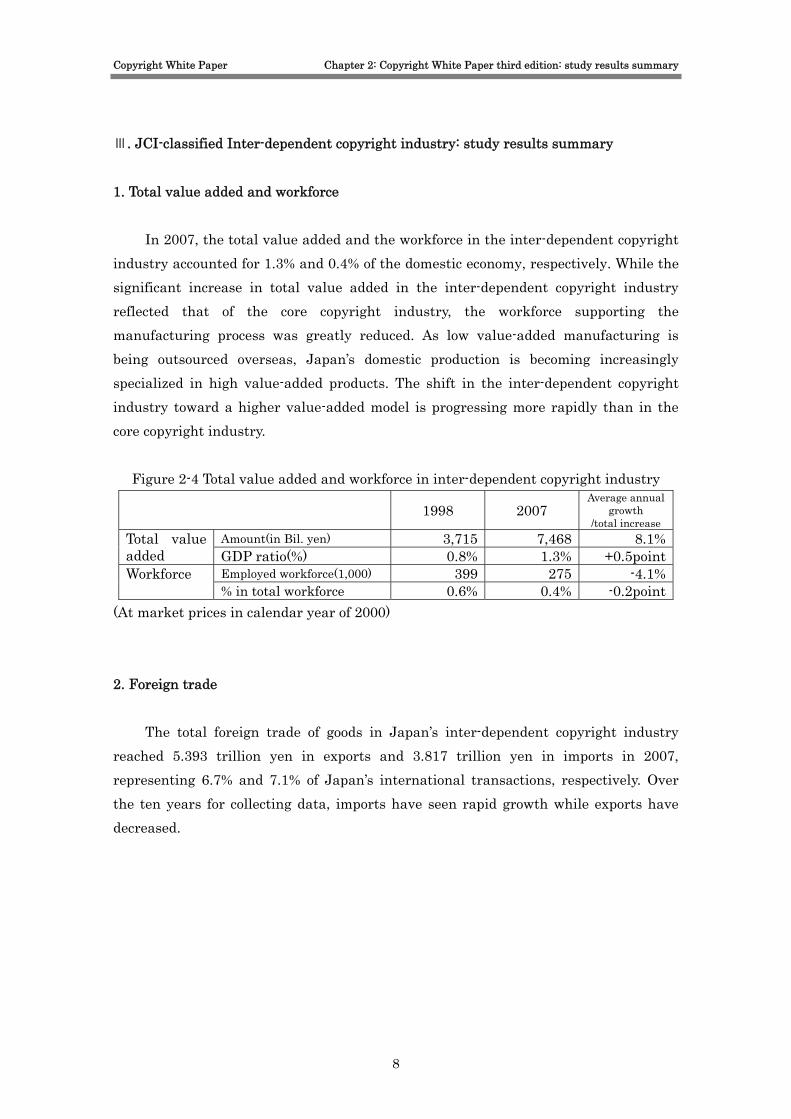
Ⅲ. JCI-classified Inter-dependent copyright industry: study results summary 1. Total value added and workforce
In 2007, the total value added and the workforce in the inter-dependent copyright industry accounted for 1.3% and 0.4% of the domestic economy, respectively. While the significant increase in total value added in the inter-dependent copyright industry reflected that of the core copyright industry, the workforce supporting the manufacturing process was greatly reduced. As low value-added manufacturing is being outsourced overseas, Japan’s domestic production is becoming increasingly specialized in high value-added products. The shift in the inter-dependent copyright industry toward a higher value-added model is progressing more rapidly than in the core copyright industry.
Figure 2-4 Total value added and workforce in inter-dependent copyright industry
1998 2007 Average annual
growth /total increase
Amount(in Bil. yen) 3,715 7,468 8.1%Total value added GDP ratio(%) 0.8% 1.3% +0.5point
Employed workforce(1,000) 399 275 -4.1%Workforce % in total workforce 0.6% 0.4% -0.2point
(At market prices in calendar year of 2000) 2. Foreign trade
The total foreign trade of goods in Japan’s inter-dependent copyright industry reached 5.393 trillion yen in exports and 3.817 trillion yen in imports in 2007, representing 6.7% and 7.1% of Japan’s international transactions, respectively. Over the ten years for collecting data, imports have seen rapid growth while exports have decreased.
8

Copyright White Paper Chapter 2: Copyright White Paper third edition: study results summary
Figure 2-5 Foreign Trade of Goods in inter-dependent copyright industry
1998 2007 Average annual
growth /total increase
Amount(in Bil. yen) 5,589 5,393 -0.4%Exports Total trade ratio(%) 13.2% 6.7% -6.5 pointAmount(in Bil. yen) 2,743 3,817 3.7%Imports Total trade ratio(%) 8.8% 7.1% -1.8 point
Balance of payments Amount(in Bil. yen) 2,847 1,576
(At market prices in calendar year of 2000) Ⅳ. Compliance with WIPO guidelines: study results summary
In 2007, the total value added and the workforce in Japan’s core copyright industries defined according to the WIPO classifications accounted for 3.0% and 2.2% of the domestic economy, respectively. The figures are smaller than those for the JCI-classified copyright industries. Similar discrepancies can be found in the inter-dependent copyright industry categories. This is due to the fact that, when considering Japan’s economic actuality, the range of business sectors included under the WIPO copyright industry classifications is more limited than the range under the JCI classifications (see page 199 for more details). Figure 2-6 WIPO-classified total value added and workforce in core copyright industry
1998 2007
Average annual growth
/total increase Amount(in Bil. yen) 10,609 17,123 5.5%Total value
added GDP ratio(%) 2.2% 3.0% +0.8 pointEmployed workforce(1,000) 1,168 1,435 2.3%Workforce
% in total workforce 1.8% 2.2% +0.4 point
(At market prices in calendar year of 2000)
Figure 2-7 WIPO-classified total value added and workforce in inter-dependent copyright industry
1998 2007
Average annual growth
/total increase Amount(in Bil. yen) 3,417 6,674 7.7%Total value
added GDP ratio(%) 0.7% 1.2% +0.5 pointEmployed workforce(1,000) 358 228 -4.9%Workforce
% in total workforce 0.5% 0.4% -0.1 point
(At market prices in calendar year of 2000)
9

Part Ⅱ: Study Results and Estimation Method of
JCI-classified Copyright Industries
Copyright White Paper Chapter 3: Overview of JCI-classified Core Copyright Industries
Part Ⅱ: Study Results and Estimation Method of JCI-classified Copyright Industries Chapter 3: Overview of JCI-classified Core Copyright Industries I. Overview of JCI-classified Core Copyright Industries 1. Scale of JCI-classified copyright industry
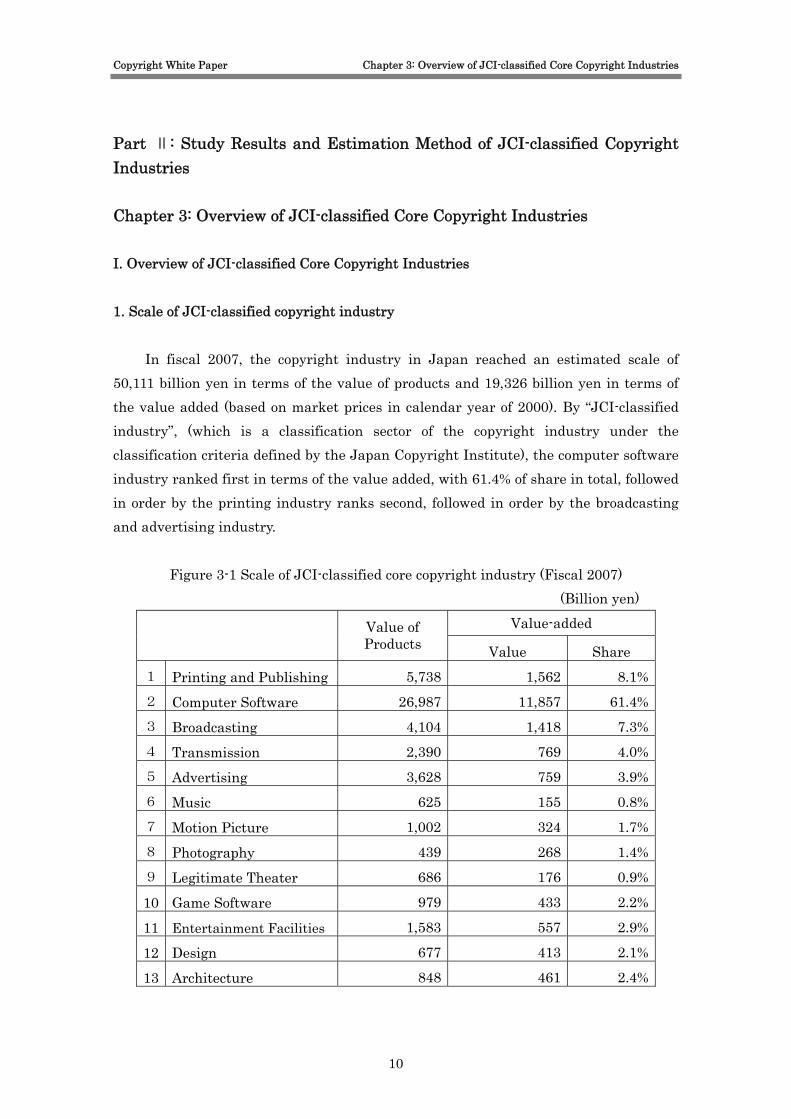
In fiscal 2007, the copyright industry in Japan reached an estimated scale of 50,111 billion yen in terms of the value of products and 19,326 billion yen in terms of the value added (based on market prices in calendar year of 2000). By “JCI-classified industry”, (which is a classification sector of the copyright industry under the classification criteria defined by the Japan Copyright Institute), the computer software industry ranked first in terms of the value added, with 61.4% of share in total, followed in order by the printing industry ranks second, followed in order by the broadcasting and advertising industry.
Figure 3-1 Scale of JCI-classified core copyright industry (Fiscal 2007) (Billion yen)
Value-added Value of
Products Value Share 1 Printing and Publishing 5,738 1,562 8.1% 2 Computer Software 26,987 11,857 61.4% 3 Broadcasting 4,104 1,418 7.3% 4 Transmission 2,390 769 4.0% 5 Advertising 3,628 759 3.9% 6 Music 625 155 0.8% 7 Motion Picture 1,002 324 1.7% 8 Photography 439 268 1.4% 9 Legitimate Theater 686 176 0.9%
10 Game Software 979 433 2.2%
11 Entertainment Facilities 1,583 557 2.9%
12 Design 677 413 2.1%
13 Architecture 848 461 2.4%
10
Copyright White Paper Chapter 3: Overview of JCI-classified Core Copyright Industries
14 Libraries and Museum 419 172 0.9%
15 Authors and Artists 6 3 0.0% Copyright Industry 50,111 19,326 100.0%
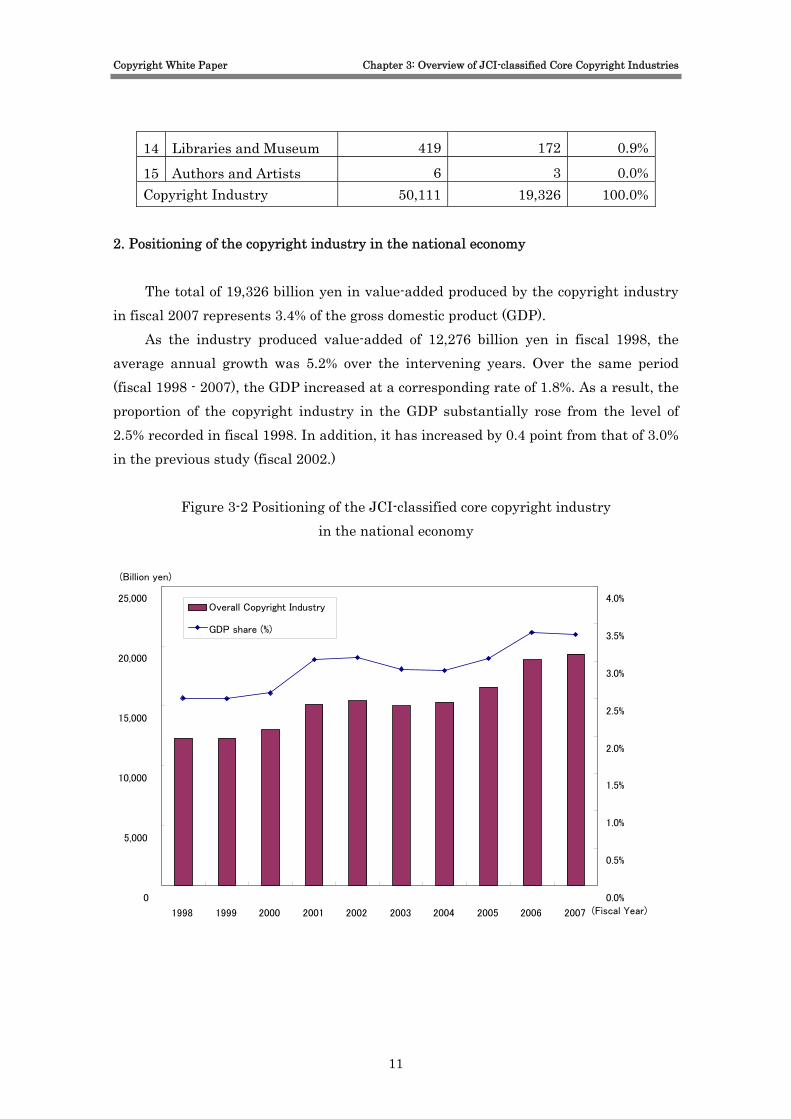
2. Positioning of the copyright industry in the national economy
The total of 19,326 billion yen in value-added produced by the copyright industry in fiscal 2007 represents 3.4% of the gross domestic product (GDP).
As the industry produced value-added of 12,276 billion yen in fiscal 1998, the average annual growth was 5.2% over the intervening years. Over the same period (fiscal 1998 - 2007), the GDP increased at a corresponding rate of 1.8%. As a result, the proportion of the copyright industry in the GDP substantially rose from the level of 2.5% recorded in fiscal 1998. In addition, it has increased by 0.4 point from that of 3.0% in the previous study (fiscal 2002.)
Figure 3-2 Positioning of the JCI-classified core copyright industry in the national economy
0
5,000
10,000
15,000
20,000
25,000
1998 1999 2000 2001 2002 2003 2004 2005 2006 2007 (Fiscal Year)
(Billion yen)
0.0%
0.5%
1.0%
1.5%
2.0%
2.5%
3.0%
3.5%
4.0% Overall Copyright Industry GDP share (%)
11
Copyright White Paper Chapter 3: Overview of JCI-classified Core Copyright Industries
(Billion yen) Average annual 1998 2002 2007 Growth rate a) JCI-classified core copyright industry 12,276 15,430 19,326 5.2%
b) GDP 490,499 507,265 575,343 1.8% GDP share(a/b) 2.5% 3.0% 3.4%
(At market prices in calendar year of 2000) Source: GDP, “Annual Report on National Income” (Economic and Social Research Institute, Cabinet Office, Government of Japan) (fixed for fiscal 2007) 3. Positioning of the JCI-classified core copyright industry as a business industry
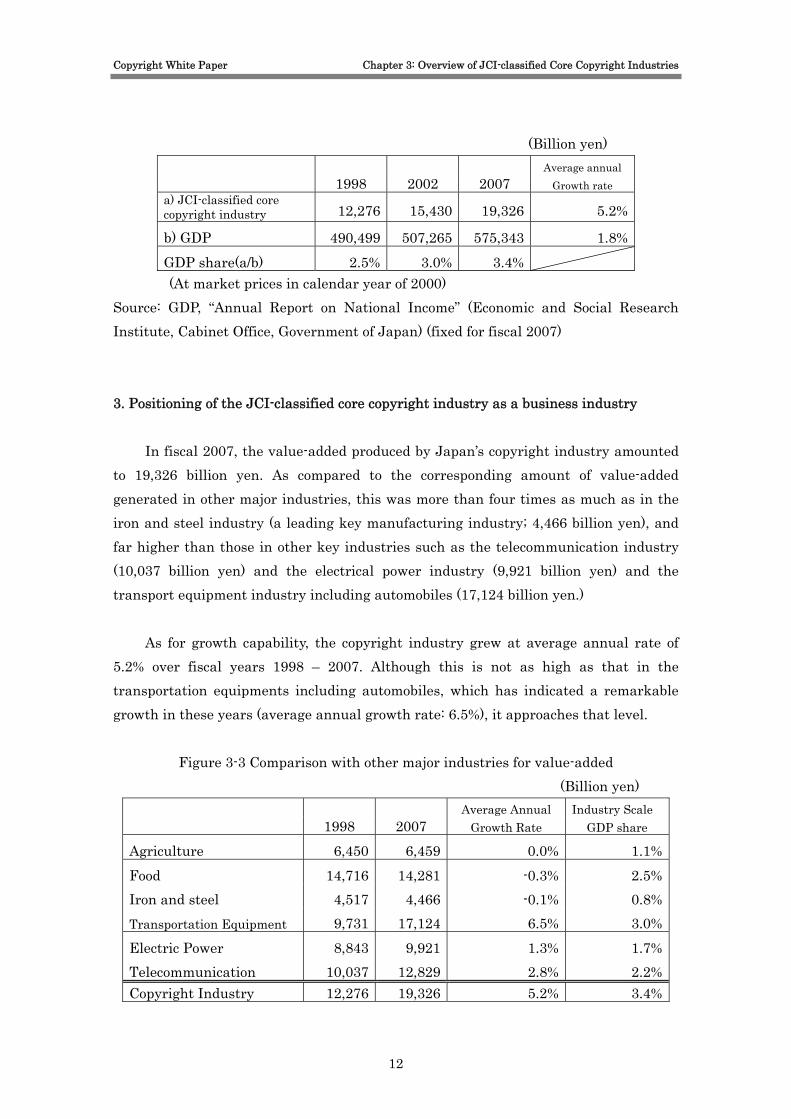
In fiscal 2007, the value-added produced by Japan’s copyright industry amounted to 19,326 billion yen. As compared to the corresponding amount of value-added generated in other major industries, this was more than four times as much as in the iron and steel industry (a leading key manufacturing industry; 4,466 billion yen), and far higher than those in other key industries such as the telecommunication industry (10,037 billion yen) and the electrical power industry (9,921 billion yen) and the transport equipment industry including automobiles (17,124 billion yen.)
As for growth capability, the copyright industry grew at average annual rate of 5.2% over fiscal years 1998 – 2007. Although this is not as high as that in the transportation equipments including automobiles, which has indicated a remarkable growth in these years (average annual growth rate: 6.5%), it approaches that level.
Figure 3-3 Comparison with other major industries for value-added (Billion yen)
Average Annual Industry Scale 1998 2007 Growth Rate GDP share
Agriculture 6,450 6,459 0.0% 1.1%Food 14,716 14,281 -0.3% 2.5%Iron and steel 4,517 4,466 -0.1% 0.8%Transportation Equipment 9,731 17,124 6.5% 3.0%Electric Power 8,843 9,921 1.3% 1.7%Telecommunication 10,037 12,829 2.8% 2.2%Copyright Industry 12,276 19,326 5.2% 3.4%
12
Copyright White Paper Chapter 3: Overview of JCI-classified Core Copyright Industries
Note: Figures for GDP share are as of fiscal 2007 Source: GDP, “Annual Report on National Income” (Economic and Social Research Institute, Cabinet Office, Government of Japan) (fixed for fiscal 2007) 4. Growth factors for JCI-classified core copyright industry
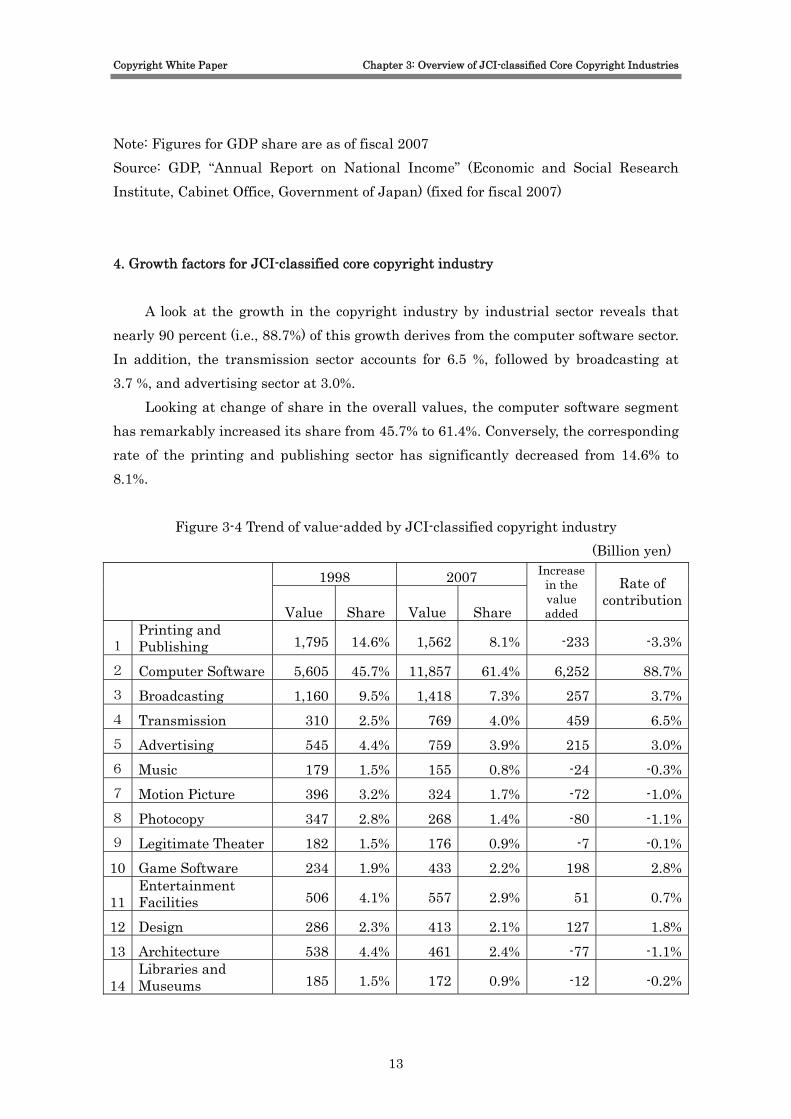
A look at the growth in the copyright industry by industrial sector reveals that nearly 90 percent (i.e., 88.7%) of this growth derives from the computer software sector. In addition, the transmission sector accounts for 6.5 %, followed by broadcasting at 3.7 %, and advertising sector at 3.0%.
Looking at change of share in the overall values, the computer software segment has remarkably increased its share from 45.7% to 61.4%. Conversely, the corresponding rate of the printing and publishing sector has significantly decreased from 14.6% to 8.1%.
Figure 3-4 Trend of value-added by JCI-classified copyright industry (Billion yen)
1998 2007
Value Share Value Share
Increase in the value added
Rate of contribution
1 Printing and Publishing 1,795 14.6% 1,562 8.1% -233 -3.3%
2 Computer Software 5,605 45.7% 11,857 61.4% 6,252 88.7%3 Broadcasting 1,160 9.5% 1,418 7.3% 257 3.7%4 Transmission 310 2.5% 769 4.0% 459 6.5%5 Advertising 545 4.4% 759 3.9% 215 3.0%6 Music 179 1.5% 155 0.8% -24 -0.3%7 Motion Picture 396 3.2% 324 1.7% -72 -1.0%8 Photocopy 347 2.8% 268 1.4% -80 -1.1%9 Legitimate Theater 182 1.5% 176 0.9% -7 -0.1%10 Game Software 234 1.9% 433 2.2% 198 2.8%
11 Entertainment Facilities 506 4.1% 557 2.9% 51 0.7%
12 Design 286 2.3% 413 2.1% 127 1.8%13 Architecture 538 4.4% 461 2.4% -77 -1.1%
14 Libraries and Museums 185 1.5% 172 0.9% -12 -0.2%
13

Copyright White Paper Chapter 3: Overview of JCI-classified Core Copyright Industries
15 Authors and Artists 7 0.1% 3 0.0% -4 -0.1%
Copyright Industry 12,276 100.0% 19,326 100.0% 7,050 100.0%
(At market prices in calendar year of 2000) Note: Rate of contribution = increase in the value-added in one sector/ increase in the value-added in the overall industry
14
Copyright White Paper Chapter 3: Overview of JCI-classified Core Copyright Industries
II. Preconditions in estimation of the scale of the core copyright industry 1. Indicators for the scale of the core copyright industry
This survey is aimed at clarifying the positioning of the copyright industry in the domestic economy. Accordingly, the primary objective is to calculate the industry’s share in the GDP, which is the most generally used indicator for the scale of a national economy.
It goes without saying that, in a calculation of the industry’s share in the GDP, the denominator will be the GDP as the total amount of value-added produced in Japan. Consequently, estimation of the scale of the copyright industry must also be based on value-added. 1) Definition of value-added The term “value-added” is defined as follows in National Economic Accounting: Value-added = Output at producers’ values* - Intermediate input
*Value of products, sales proceeds, business income, etc. Output at products’ value is an expression of the value of goods and services
produced at market prices. In other words, it indicates the value of all goods and services produced in the country in terms of market prices. Intermediate input indicates the intermediate products utilized for the production.
Accordingly, the “value-added” generated in a specific industrial segment is separately calculated without double counting even when aggregated the value-added generated in various industrial segments since the output at producers’ values realized in other industrial segments has been excluded in this calculation. * Market prices: prices are determined when products are traded in the market. Market prices mean values evaluated at the market. Therefore, no value-added will be accounted unless the products are traded in the market. 2) Composition of value-added
Value-added is calculated in the "Annual Report on National Income Statistics" (Economic Planning Agency), which naturally does not have a separate class for the
15
Copyright White Paper Chapter 3: Overview of JCI-classified Core Copyright Industries
copyright industry. Therefore, copyright industry value-added must be estimated using other statistical data and various surveys.
However, other statistics generally do not present data directly for value-added, and this makes it necessary to compile data needed for calculation of value-added.
The Value-added is also calculated by the following formula (2) as well as the one indicated above (1).. Value-added (1) = Output at producers' values - Intermediate input Value-added (2) = Operating surplus + Compensation of Employees + Consumption of Fixed capital + (Indirect taxes - Subsidies) (Value-added (1) = Value-added (2))
If data on value-added is no available, value-added is basically calculated by the formula (2) using “Operating surplus” and “Compensation of Employees”. In this formula, deduction of consumption of fixed capital yields the net value-added, and deduction of subsidies from indirect taxes, net indirect taxes.
Besides wages, allowances, bonuses, and other such cash payments, compensation of employees includes all sorts of fringe benefits and employee contributions to social security funds (health insurance associations, pension funds, etc.) and to other payments (retirement lump-sum grants, retirement pensions, etc.).
16
Copyright White Paper Chapter 3: Overview of JCI-classified Core Copyright Industries
(Reference information) GDP and GNP [Gross domestic product (GDP)]
The concept "domestic" is restricted in scope to economic principals residing within the national borders, and concerns mainly production activities. For example, it includes the Japanese subsidiaries of foreign firms as principals engaged in production activities within Japan, and excludes the subsidiaries of Japanese firms in other countries.
The gross domestic product is the total amount of value-added created as a result of the production activities of resident producers, i.e., companies, general governments, and private non-profit institutions serving households. [Gross national product (GNP)]
The concept "national" is restricted in scope to principals residing within the national borders, i.e., companies, general governments, private non-profit institutions serving households, and individuals. The individuals in question are basically all those who have resided for at least one year in the country in question, regardless of their nationality.
The gross national product is the total amount of income received by these resident principals, and adds net factor income received from other countries (compensation of employees, investment return, and other property income and entrepreneurial income) to the gross domestic product. *Factor income: value of products minus intermediate input, consumption of fixed capital, and indirect taxes
Source: "Annual Report on National Income Statistics" (Economic and Social Research Institute, Cabinet Office, Government of Japan)
17
Copyright White Paper Chapter 3: Overview of JCI-classified Core Copyright Industries
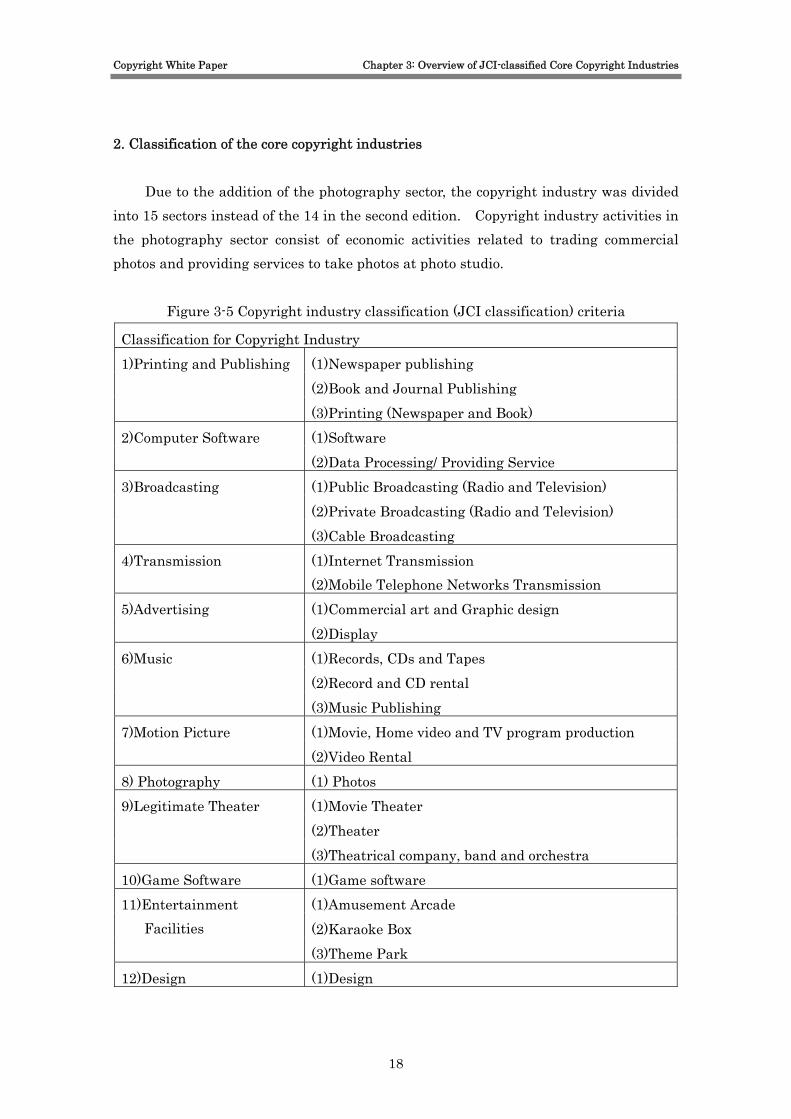
2. Classification of the core copyright industries
Due to the addition of the photography sector, the copyright industry was divided into 15 sectors instead of the 14 in the second edition. Copyright industry activities in the photography sector consist of economic activities related to trading commercial photos and providing services to take photos at photo studio.
Figure 3-5 Copyright industry classification (JCI classification) criteria
Classification for Copyright Industry (1)Newspaper publishing (2)Book and Journal Publishing
1)Printing and Publishing
(3)Printing (Newspaper and Book) (1)Software 2)Computer Software (2)Data Processing/ Providing Service (1)Public Broadcasting (Radio and Television) (2)Private Broadcasting (Radio and Television)
3)Broadcasting
(3)Cable Broadcasting 4)Transmission (1)Internet Transmission
(2)Mobile Telephone Networks Transmission (1)Commercial art and Graphic design 5)Advertising (2)Display (1)Records, CDs and Tapes (2)Record and CD rental
6)Music
(3)Music Publishing (1)Movie, Home video and TV program production 7)Motion Picture (2)Video Rental
8) Photography (1) Photos (1)Movie Theater (2)Theater
9)Legitimate Theater
(3)Theatrical company, band and orchestra 10)Game Software (1)Game software
(1)Amusement Arcade (2)Karaoke Box
11)Entertainment Facilities
(3)Theme Park 12)Design (1)Design
18

Copyright White Paper Chapter 3: Overview of JCI-classified Core Copyright Industries
13)Architecture (1)Architectural Design (1)Libraries 14)Libraries and Museums
(2)Museums and Art galleries 15)Authors and Artists (1)Authors and Artists, Musician
* In this survey, all products which are traded in the wholesaling and trading industries such as books, records, etc., do not include an increase of value added in the trading processes (namely, several market places are involved in trading goods from shipment by a manufacturer to sales at a retail shop).
19
Copyright White Paper Chapter 3: Overview of JCI-classified Core Copyright Industries
Ⅲ. Estimation method of the scale of the core copyright industries 1. Data used in estimation
The Research Institute intends to make general publication of the results of this survey and to implement it on a regular basis. The data employed in estimation therefore must be equipped with reliability secured by an official nature and survey continuity. 1) JSIC (Standard Industrial Classification for Japan)
Data equipped with the aforementioned reliability and continuity are drawn from national specified statistics and other statistical documents prepared by official entities. These statistics are compiled in line with the JSIC established by the Statistics Bureau, Management and Coordination Agency.
The various statistical work performed in this survey followed the JSIC (the latest installment was published in March 2002). 2) Basic statistics
Many of the copyright industries under JCI classification are categorized in the manufacturing or service sector in the JSIC. The estimates in this study are based on the "Census of Manufactures", which is one of the documents of national specified statistics for economic activities in the manufacturing sector, and the "Survey on Service Industries”, which sets forth corresponding statistics for the service sector. These two sources are collectively referred to as "basic statistics".
- Census of Manufactures (Ministry of Economy, Trade and Industry) - Survey on Service Industries (Ministry of Internal Affairs and Communications)
3) Supplementary statistics
While the basic statistics are compiled in accordance with the JSIC, the "Survey on Service Industries" handles data only down to the JSIC group level. In addition, in the case of some classes, the JSIC includes economic activities outside the scope of the copyright industry. Consistency in compilation consequently demands supplementation
20
Copyright White Paper Chapter 3: Overview of JCI-classified Core Copyright Industries
with other statistics. Because of their use to supplement the basic statistics, these sources are
collectively referred to as "supplementary statistics". As in the case of the basic statistics, efforts were made to use supplementary
statistics judged to have the best potential as regards official reliability and regular implementation. ・Annual Report on National Income Statistics (Economic and Social Research
Institute, Cabinet Office, Government of Japan) ・Survey of Selected Service Industries (Ministry of Economy, Trade and Industry) ・Statistics from Analysis of Corporate Financial Statements (Teikoku Databank,
Ltd.) ・Survey on the Telecommunications Industry (Ministry of Internal Affairs and
Communications) ・Survey of Information and Communication Industry (Ministry of Internal Affairs
and Communications) ・White Paper on the Printing Industry (Japan Association of Graphic Arts
Technology) ・Leisure White Paper (Japan Productivity Center for Socio-Economic Development) ・CESA Game White Paper (CESA: Computer Entertainment Software Association) ・Karaoke White Paper (All-Japan Karaoke Industrialist Association) ・RIAJ Year Book -A brief description of the Japanese Recording Industry-
(Recording Industry Association of Japan) ・Survey on CD rental store (Recording Industry Association of Japan) ・Statistics on Construction undertaken (Ministry of Land Infrastructure and
Transport) ・Cost Analysis Information for Building Works (Management Research Society for
Construction Industry) ・Statistics on Libraries in Japan (Japan Library Association) ・Museum White Paper (Japan Association of Museums) ・Radio & Television Yearbook (Japan Broadcasting Corporation: NHK) ・Japan Commercial Broadcasting Yearbook (The National Association of
Commercial Broadcasters in Japan) ・Public Welfare and Health Cost Survey (Japan Business Federation) ・Data provided by JASRAC (Japanese Society for Rights of Authors, Composers and
Publishers: JASRAC)
21

Copyright White Paper Chapter 3: Overview of JCI-classified Core Copyright Industries
・Data provided by MPA (Music Publishers Association of Japan: MPA) ・Survey on Amusement Industries (JAMMA, AOU, NSA) ・Financial Statement Report (Ministry of Finance)
22
Copyright White Paper Chapter 3: Overview of JCI-classified Core Copyright Industries
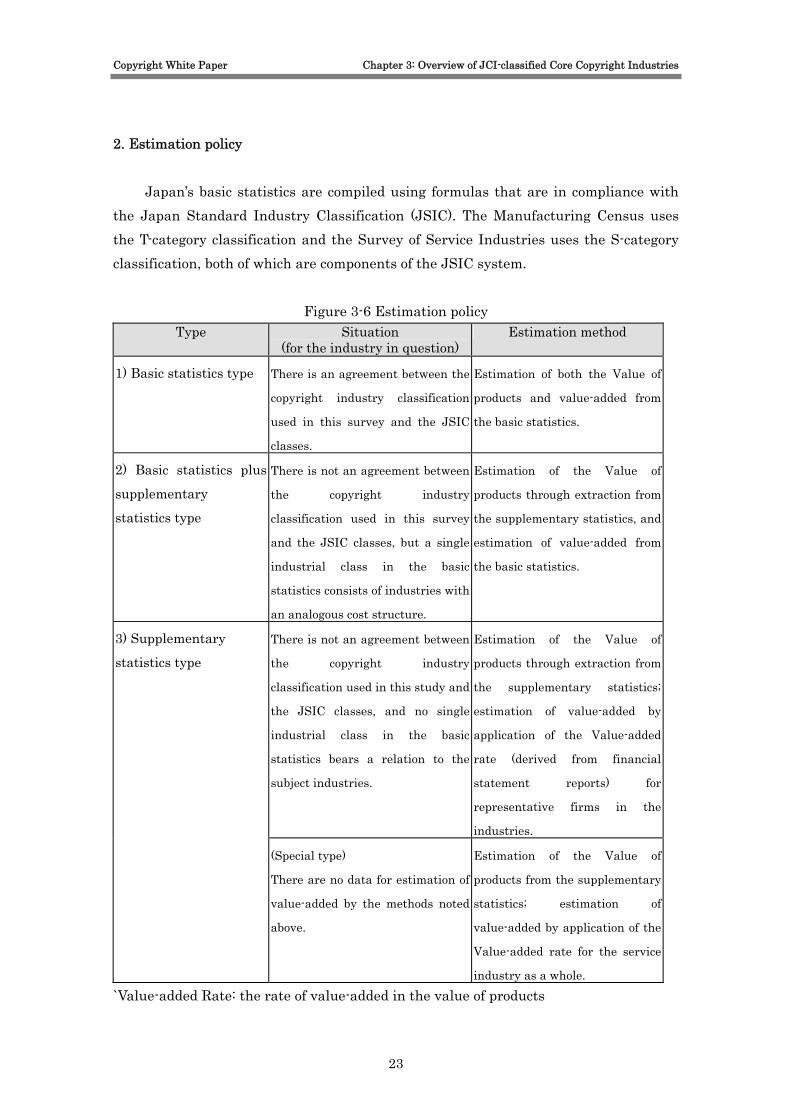
2. Estimation policy
Japan’s basic statistics are compiled using formulas that are in compliance with the Japan Standard Industry Classification (JSIC). The Manufacturing Census uses the T-category classification and the Survey of Service Industries uses the S-category classification, both of which are components of the JSIC system.
Figure 3-6 Estimation policy Type Situation
(for the industry in question) Estimation method
1) Basic statistics type There is an agreement between the
copyright industry classification
used in this survey and the JSIC
classes.
Estimation of both the Value of
products and value-added from
the basic statistics.
2) Basic statistics plus
supplementary
statistics type
There is not an agreement between
the copyright industry
classification used in this survey
and the JSIC classes, but a single
industrial class in the basic
statistics consists of industries with
an analogous cost structure.
Estimation of the Value of
products through extraction from
the supplementary statistics, and
estimation of value-added from
the basic statistics.
There is not an agreement between
the copyright industry
classification used in this study and
the JSIC classes, and no single
industrial class in the basic
statistics bears a relation to the
subject industries.
Estimation of the Value of
products through extraction from
the supplementary statistics;
estimation of value-added by
application of the Value-added
rate (derived from financial
statement reports) for
representative firms in the
industries.
3) Supplementary
statistics type
(Special type)
There are no data for estimation of
value-added by the methods noted
above.
Estimation of the Value of
products from the supplementary
statistics; estimation of
value-added by application of the
Value-added rate for the service
industry as a whole. `Value-added Rate: the rate of value-added in the value of products
23

Copyright White Paper Chapter 3: Overview of JCI-classified Core Copyright Industries
1) Basic statistics The basic statistical data used in this study to identify the scale of the copyright
industry is from the Manufacturing Census and the Survey of Service Industries, which include production value and total value added figures. Such figures can be used directly to calculate the production value and the total value added for this study when the JCI classifications match the JSIC classifications for the data. The printing sector of the copyright industry in this study, for example, matches Category 1610: Printing in the Manufacturing Census and the data can be used as is. 2) Basic statistics plus supplementary statistics (Combined statistics)
When the JCI classifications for this study and the JSIC classifications for the basic statistics do not match, the value-added rate of a business category with a similar cost structure in the basic statistics can still be applied for this study. For example, value-added rates for the rental recording and video sectors can be calculated using Category 88A: Audio Visual Recordings Rental in the Survey of Service Industries. 3) Supplementary statistics type
When there is no consistency between the classification used in the basic statistics and JCI classification, and it is not possible to make an estimate with manipulating the data of the former, the Value of products is estimated using supplementary statistics.
In case that no industry sector with an analogous cost structure is available in the basic statistics, the value-added rate is estimated using supplementary statistics or financial statement report of a leading enterprise in the concerned industry (more specifically, listed enterprises, those preparing for listing, and those that otherwise make continuous disclosure.) However, when there is no enterprise making continuous disclosure in the industry, the value-added rate for the entire service sector was used for that in said industry. 3. Preconditions of statistics
All estimates are calculated on a fiscal year basis.
24
Copyright White Paper Chapter 3: Overview of JCI-classified Core Copyright Industries
4. Key issues and suggestions concerning future studies
Despite the fact that Japan’s national policy advocates intellectual property driven nation building, statistical data concerning the copyright industry has, in fact, several flaws. The following issues were noted while conducting the study in order to more precisely identify the scale of the copyright industry. 1) Issues derived from the characteristics of Survey of Selected Service Industries
The study uses data from the Survey of Selected Service Industries to analyze various business sectors. Supplemental estimates to complete figures in the basic statics, such as the Survey of Service Industries, were not conducted, however. As such, the study report cites the raw total figures for annual sales and employment. This poses a problem as such figures can fluctuate widely as the number of establishments surveyed changes. 2) Issues derived from changes of target business sectors in Survey of Selected Service Industries
The target business sectors in the Survey of Selected Service Industries change every year due to on-going consolidation or the elimination of existing sectors or the establishment of new categories. For example, the information service sector, which existed up until 2005, was divided into two sectors: software and information processing/providing services in 2006. Sectors such as movie and performance theaters were eliminated in 2004. As the restructuring and alteration of business sectors is frequently implemented, the consistency of surveys is not ensured, thus making convoluted methods of estimation inevitable. 3) Issues derived from classification in Balance of Overseas Payments
As Balance of Overseas Payments provides only statistics by service type, it is not possible to obtain further detailed data such as estimates of value-added and workforce by industry.
For example, in Balance of Overseas Payments, payments in the sector of culture-performance and legitimate-theater service are divided broadly into two categories, that is, “expense related to operating culture-performance or legitimate theater” and “production cost, rental charge, and operating/broadcasting fee of audio/visual media including films and tapes”. In JCI classification, this balance
25
Copyright White Paper Chapter 3: Overview of JCI-classified Core Copyright Industries
represents the aggregation of payments accounted in two different sectors of “Legitimate Theater” and “Motion Picture”. As it was not possible to analyze such data in detail, however, estimation of service-imports/exports by industry was unavailable.
In addition, there is another issue of unclear expressions in the statistics items. For example, the “Industrial Right” of the item of “Usage Charge of Industrial Right & Mining Right” in Balance of Payments means the industrial property rights (that is, patent, utility model, design, and trademark rights.) On the other hand, as the word of “Industrial Right” is not common in the copyright business area, even experts in this area are difficult to define it. It is desirable to use an item, which is recognizable in each industry. 4) Issues derived from the item classification of Foreign Trade Statistics
Items of Foreign Trade Statistics are not classified under the concept of copyrighted works. For example, in the item of “Disk, Tape, Nonvolatile Semiconductor Storage, Smart-card and Other Media”, both recorded and unrecorded media are included. In this case, it was not possible to isolate the data on recorded media since no supplementary statistics was available.
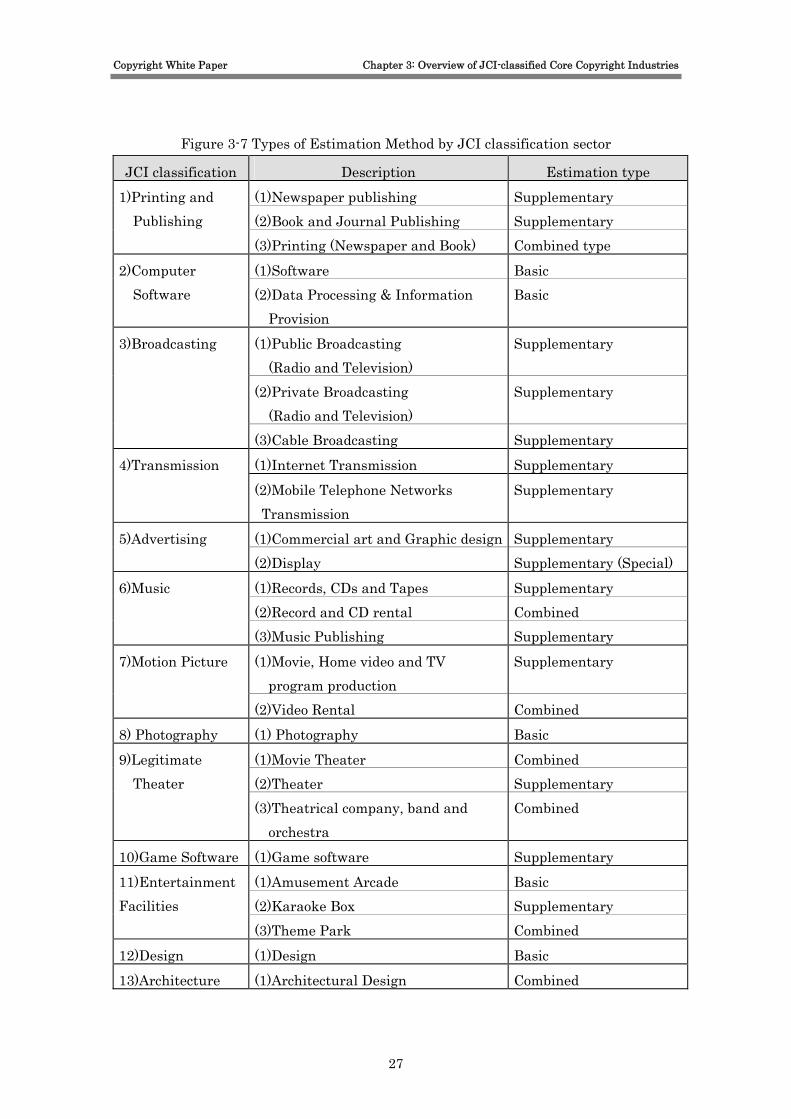
Considered the points indicated in the above items 3) and 4), it is desirable to redefine the items used in Balance of Payments and Foreign Trade Statistics reflected the current conditions of copyright industry. 5. Types of estimation method for each industry sector
Figure 3-7 shows the relationship between JCI classification and the types of estimation method employed for each contingent industry.
26
Copyright White Paper Chapter 3: Overview of JCI-classified Core Copyright Industries
Figure 3-7 Types of Estimation Method by JCI classification sector
JCI classification Description Estimation type (1)Newspaper publishing Supplementary (2)Book and Journal Publishing Supplementary
1)Printing and Publishing
(3)Printing (Newspaper and Book) Combined type (1)Software Basic 2)Computer
Software (2)Data Processing & Information Provision
Basic
(1)Public Broadcasting (Radio and Television)
Supplementary
(2)Private Broadcasting (Radio and Television)
Supplementary
3)Broadcasting
(3)Cable Broadcasting Supplementary (1)Internet Transmission Supplementary 4)Transmission (2)Mobile Telephone Networks Transmission
Supplementary
(1)Commercial art and Graphic design Supplementary 5)Advertising (2)Display Supplementary (Special) (1)Records, CDs and Tapes Supplementary (2)Record and CD rental Combined
6)Music
(3)Music Publishing Supplementary (1)Movie, Home video and TV
program production Supplementary 7)Motion Picture
(2)Video Rental Combined 8) Photography (1) Photography Basic
(1)Movie Theater Combined (2)Theater Supplementary
9)Legitimate Theater
(3)Theatrical company, band and orchestra
Combined
10)Game Software (1)Game software Supplementary (1)Amusement Arcade Basic (2)Karaoke Box Supplementary
11)Entertainment Facilities
(3)Theme Park Combined 12)Design (1)Design Basic 13)Architecture (1)Architectural Design Combined
27
Copyright White Paper Chapter 3: Overview of JCI-classified Core Copyright Industries
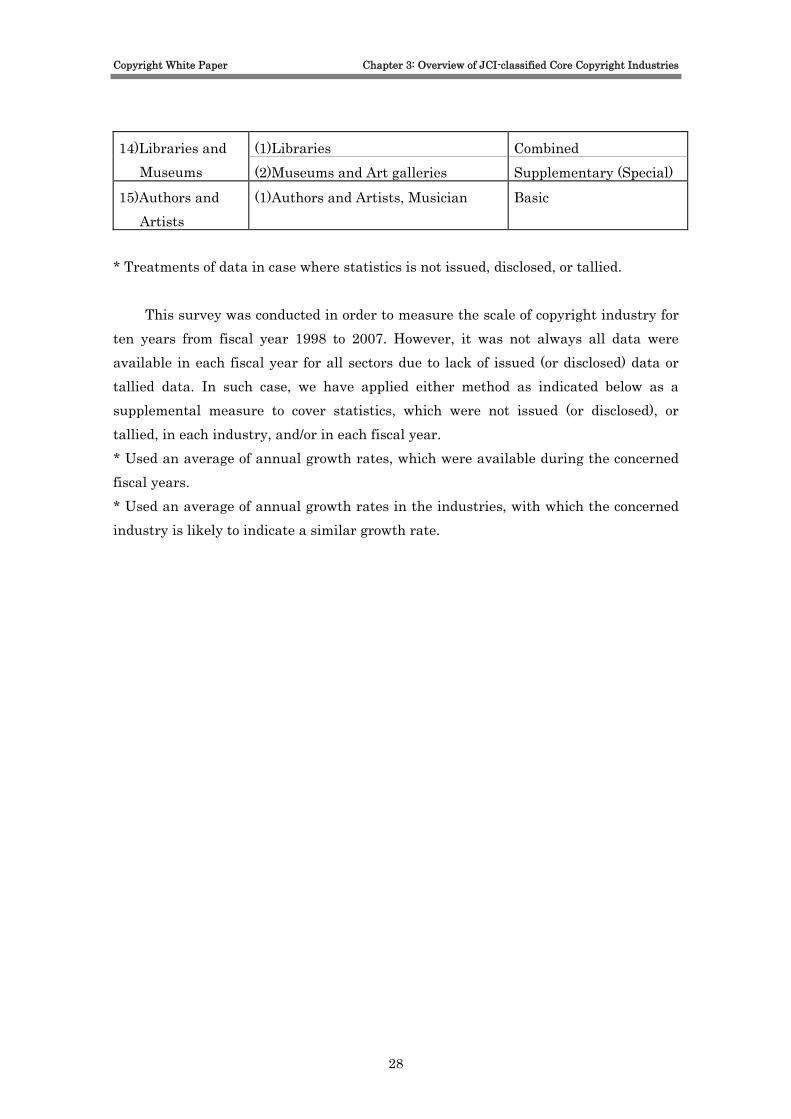
(1)Libraries Combined 14)Libraries and Museums (2)Museums and Art galleries Supplementary (Special) 15)Authors and Artists
(1)Authors and Artists, Musician Basic
* Treatments of data in case where statistics is not issued, disclosed, or tallied.
This survey was conducted in order to measure the scale of copyright industry for ten years from fiscal year 1998 to 2007. However, it was not always all data were available in each fiscal year for all sectors due to lack of issued (or disclosed) data or tallied data. In such case, we have applied either method as indicated below as a supplemental measure to cover statistics, which were not issued (or disclosed), or tallied, in each industry, and/or in each fiscal year. * Used an average of annual growth rates, which were available during the concerned fiscal years. * Used an average of annual growth rates in the industries, with which the concerned industry is likely to indicate a similar growth rate.
28
Copyright White Paper Chapter 3: Overview of JCI-classified Core Copyright Industries
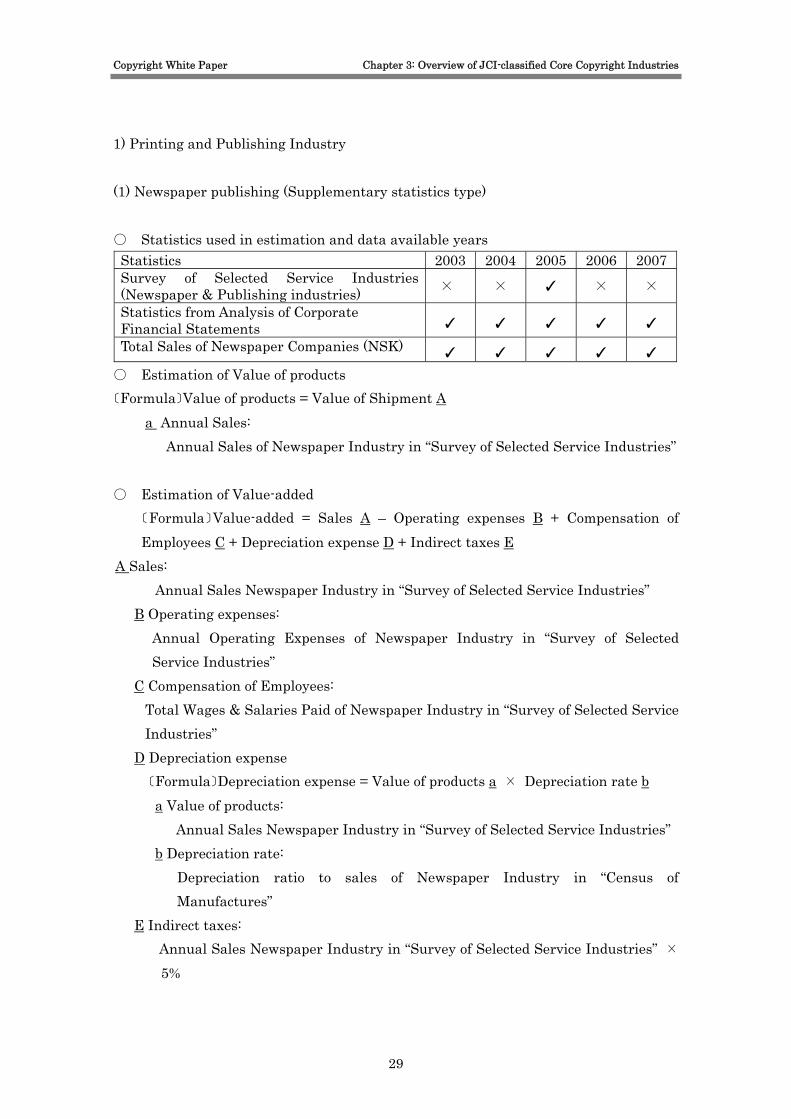
1) Printing and Publishing Industry (1) Newspaper publishing (Supplementary statistics type) ○ Statistics used in estimation and data available years Statistics 2003 2004 2005 2006 2007Survey of Selected Service Industries (Newspaper & Publishing industries) × × ✓ × ×
Statistics from Analysis of Corporate Financial Statements ✓ ✓ ✓ ✓ ✓ Total Sales of Newspaper Companies (NSK) ✓ ✓ ✓ ✓ ✓
○ Estimation of Value of products 〔Formula〕Value of products = Value of Shipment A a Annual Sales:
Annual Sales of Newspaper Industry in “Survey of Selected Service Industries” ○ Estimation of Value-added
〔Formula〕Value-added = Sales A – Operating expenses B + Compensation of Employees C + Depreciation expense D + Indirect taxes E
A Sales: Annual Sales Newspaper Industry in “Survey of Selected Service Industries”
B Operating expenses: Annual Operating Expenses of Newspaper Industry in “Survey of Selected Service Industries”
C Compensation of Employees: Total Wages & Salaries Paid of Newspaper Industry in “Survey of Selected Service Industries”
D Depreciation expense 〔Formula〕Depreciation expense = Value of products a × Depreciation rate b a Value of products:
Annual Sales Newspaper Industry in “Survey of Selected Service Industries” b Depreciation rate:
Depreciation ratio to sales of Newspaper Industry in “Census of Manufactures”
E Indirect taxes: Annual Sales Newspaper Industry in “Survey of Selected Service Industries” ×
5%
29
Copyright White Paper Chapter 3: Overview of JCI-classified Core Copyright Industries
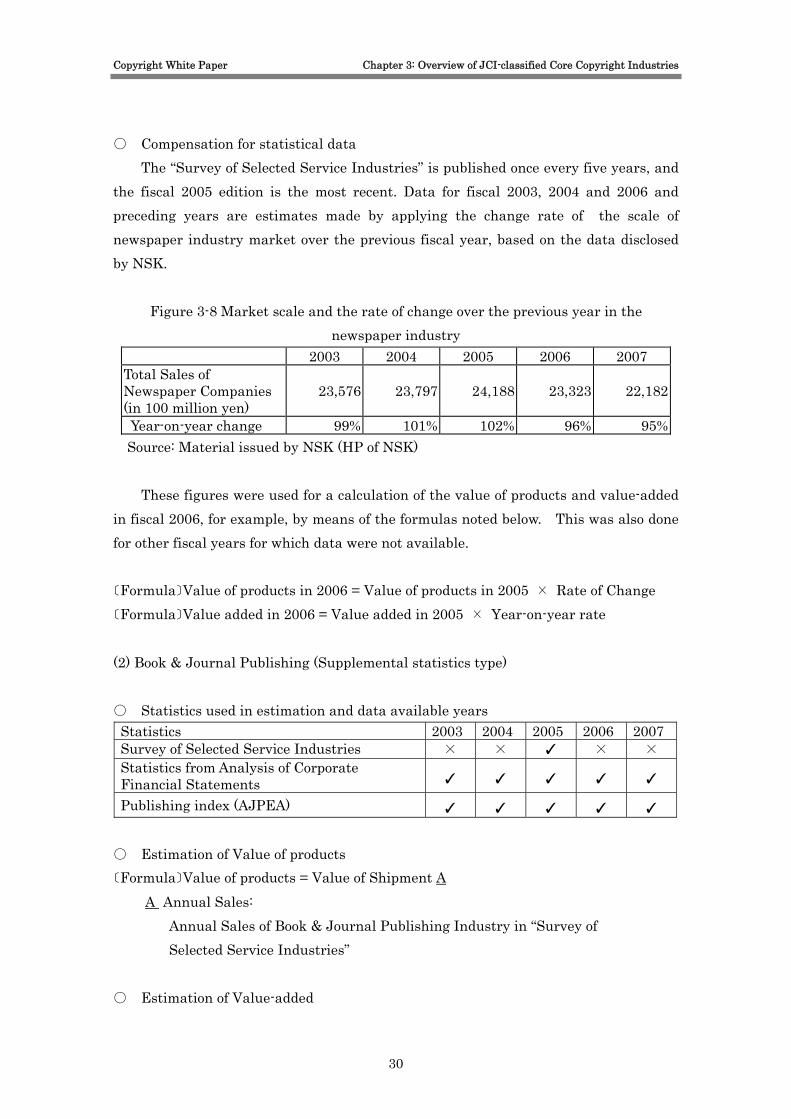
○ Compensation for statistical data The “Survey of Selected Service Industries” is published once every five years, and
the fiscal 2005 edition is the most recent. Data for fiscal 2003, 2004 and 2006 and preceding years are estimates made by applying the change rate of the scale of newspaper industry market over the previous fiscal year, based on the data disclosed by NSK.
Figure 3-8 Market scale and the rate of change over the previous year in the newspaper industry
2003 2004 2005 2006 2007 Total Sales of Newspaper Companies (in 100 million yen)
23,576 23,797 24,188 23,323 22,182
Year-on-year change 99% 101% 102% 96% 95% Source: Material issued by NSK (HP of NSK)
These figures were used for a calculation of the value of products and value-added in fiscal 2006, for example, by means of the formulas noted below. This was also done for other fiscal years for which data were not available. 〔Formula〕Value of products in 2006 = Value of products in 2005 × Rate of Change 〔Formula〕Value added in 2006 = Value added in 2005 × Year-on-year rate (2) Book & Journal Publishing (Supplemental statistics type) ○ Statistics used in estimation and data available years Statistics 2003 2004 2005 2006 2007 Survey of Selected Service Industries × × ✓ × × Statistics from Analysis of Corporate Financial Statements ✓ ✓ ✓ ✓ ✓
Publishing index (AJPEA) ✓ ✓ ✓ ✓ ✓ ○ Estimation of Value of products 〔Formula〕Value of products = Value of Shipment A A Annual Sales:
Annual Sales of Book & Journal Publishing Industry in “Survey of Selected Service Industries”
○ Estimation of Value-added
30
Copyright White Paper Chapter 3: Overview of JCI-classified Core Copyright Industries
〔Formula〕Value-added = Sales A – Operating expenses B + Compensation of Employees C + Depreciation expense D + Indirect taxes EA Sales:
Annual Sales of Book & Journal Publishing Industry in “Survey of Selected Service Industries”
B Operating expenses: Annual Operating Expenses of Book & Journal Publishing Industry in
“Survey of Selected Service Industries” C Compensation of Employees: Total Wages & Salaries Paid of Book & Journal Publishing Industry in
“Survey of Selected Service Industries” D Depreciation expense 〔Formula〕Depreciation expense = Value of products a × Depreciation
rate b a Value of products:
Annual Sales of Book & Journal Publishing Industry in “Survey of Selected Service Industries”
b Depreciation rate: Depreciation ratio to sales of Book & Journal Publishing Industry
in “Statistics from Analysis of Corporate Financial Statements” E Indirect taxes:
Annual Sales Newspaper Industry in “Survey of Selected Service Industries” × 5%
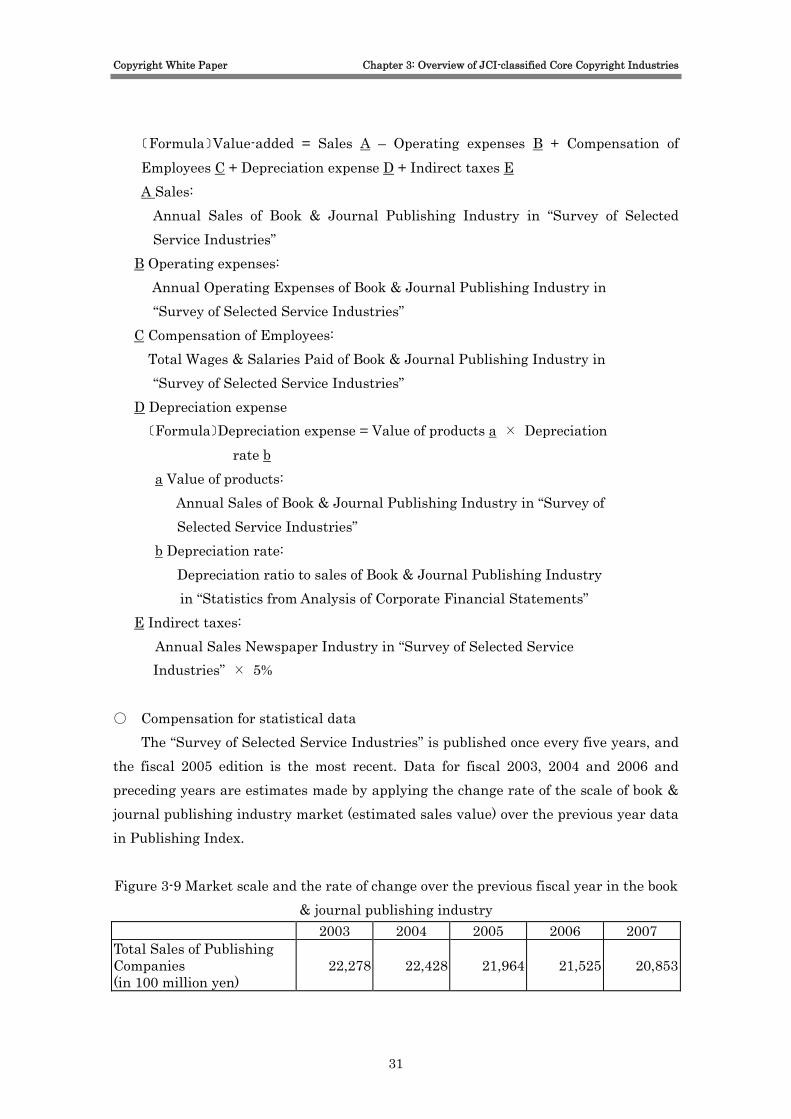
○ Compensation for statistical data
The “Survey of Selected Service Industries” is published once every five years, and the fiscal 2005 edition is the most recent. Data for fiscal 2003, 2004 and 2006 and preceding years are estimates made by applying the change rate of the scale of book & journal publishing industry market (estimated sales value) over the previous year data in Publishing Index. Figure 3-9 Market scale and the rate of change over the previous fiscal year in the book
& journal publishing industry 2003 2004 2005 2006 2007
Total Sales of Publishing Companies (in 100 million yen)
22,278 22,428 21,964 21,525 20,853
31
Copyright White Paper Chapter 3: Overview of JCI-classified Core Copyright Industries
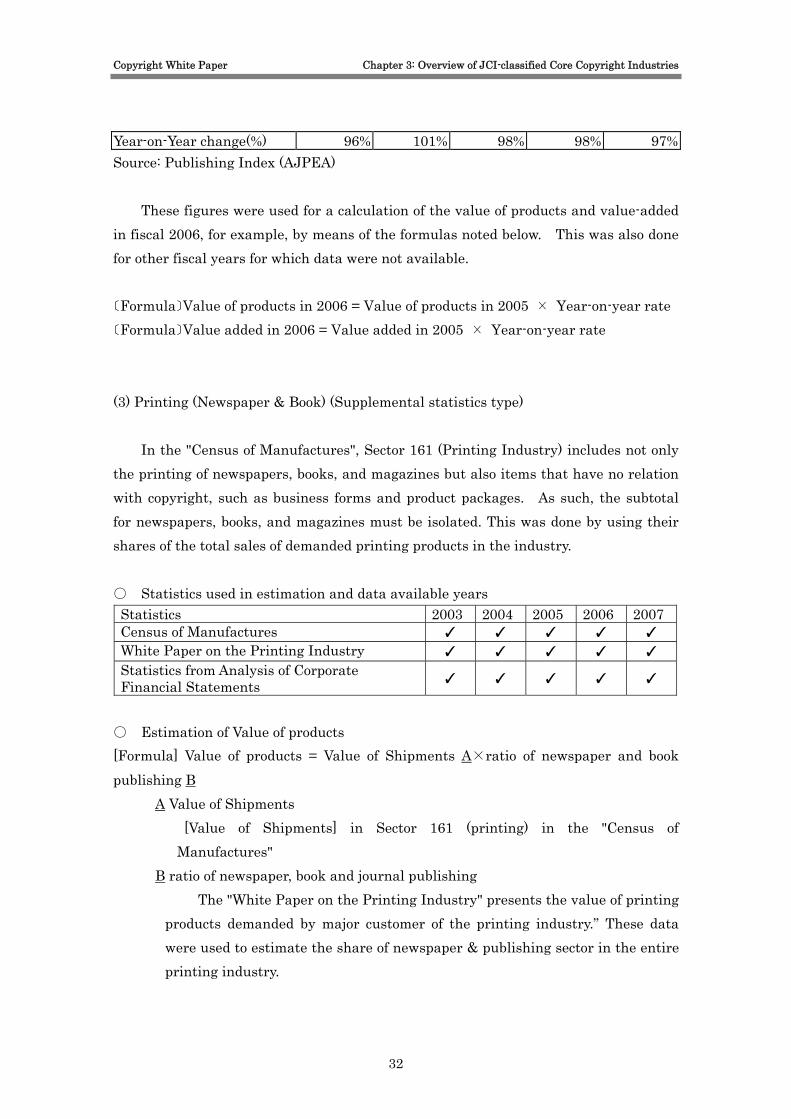
Year-on-Year change(%) 96% 101% 98% 98% 97%Source: Publishing Index (AJPEA)
These figures were used for a calculation of the value of products and value-added in fiscal 2006, for example, by means of the formulas noted below. This was also done for other fiscal years for which data were not available.
〔Formula〕Value of products in 2006 = Value of products in 2005 × Year-on-year rate 〔Formula〕Value added in 2006 = Value added in 2005 × Year-on-year rate (3) Printing (Newspaper & Book) (Supplemental statistics type)
In the "Census of Manufactures", Sector 161 (Printing Industry) includes not only the printing of newspapers, books, and magazines but also items that have no relation with copyright, such as business forms and product packages. As such, the subtotal for newspapers, books, and magazines must be isolated. This was done by using their shares of the total sales of demanded printing products in the industry. ○ Statistics used in estimation and data available years Statistics 2003 2004 2005 2006 2007 Census of Manufactures ✓ ✓ ✓ ✓ ✓ White Paper on the Printing Industry ✓ ✓ ✓ ✓ ✓ Statistics from Analysis of Corporate Financial Statements ✓ ✓ ✓ ✓ ✓
○ Estimation of Value of products [Formula] Value of products = Value of Shipments A×ratio of newspaper and book publishing B
A Value of Shipments [Value of Shipments] in Sector 161 (printing) in the "Census of Manufactures"
B ratio of newspaper, book and journal publishing The "White Paper on the Printing Industry" presents the value of printing
products demanded by major customer of the printing industry.” These data were used to estimate the share of newspaper & publishing sector in the entire printing industry.
32
Copyright White Paper Chapter 3: Overview of JCI-classified Core Copyright Industries
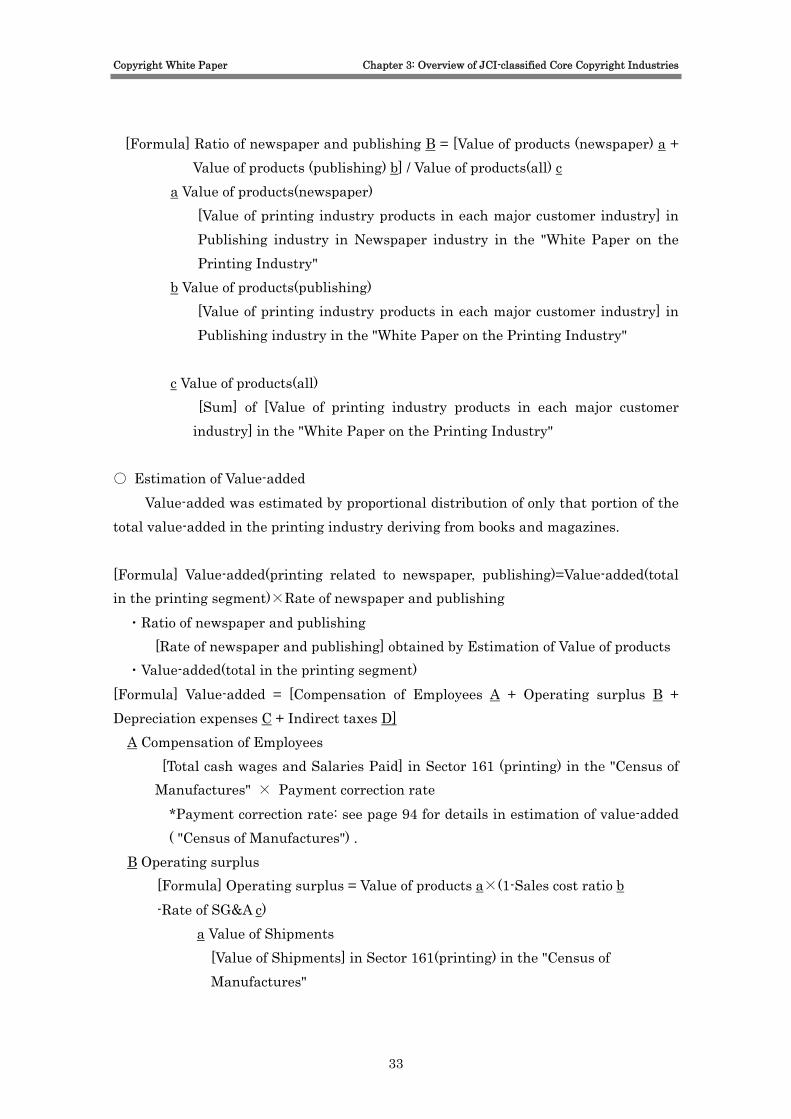
[Formula] Ratio of newspaper and publishing B = [Value of products (newspaper) a + Value of products (publishing) b] / Value of products(all) c
a Value of products(newspaper) [Value of printing industry products in each major customer industry] in Publishing industry in Newspaper industry in the "White Paper on the Printing Industry"
b Value of products(publishing) [Value of printing industry products in each major customer industry] in Publishing industry in the "White Paper on the Printing Industry"
c Value of products(all) [Sum] of [Value of printing industry products in each major customer
industry] in the "White Paper on the Printing Industry"
○ Estimation of Value-added
Value-added was estimated by proportional distribution of only that portion of the total value-added in the printing industry deriving from books and magazines. [Formula] Value-added(printing related to newspaper, publishing)=Value-added(total in the printing segment)×Rate of newspaper and publishing ・Ratio of newspaper and publishing
[Rate of newspaper and publishing] obtained by Estimation of Value of products ・Value-added(total in the printing segment)
[Formula] Value-added = [Compensation of Employees A + Operating surplus B + Depreciation expenses C + Indirect taxes D]
A Compensation of Employees [Total cash wages and Salaries Paid] in Sector 161 (printing) in the "Census of Manufactures" × Payment correction rate
*Payment correction rate: see page 94 for details in estimation of value-added ( "Census of Manufactures") .
B Operating surplus [Formula] Operating surplus = Value of products a×(1-Sales cost ratio b -Rate of SG&A c)
a Value of Shipments [Value of Shipments] in Sector 161(printing) in the "Census of Manufactures"
33
Copyright White Paper Chapter 3: Overview of JCI-classified Core Copyright Industries
b Sales cost ratio [Sales cost ratio] in Sector 274(printing) in the "Statistics from Analysis of Corporate Financial Statements"
c Rate of SG&A [Rate of SG&A expenses] in Sector 274(printing) in the "Statistics from Analysis of Corporate Financial Statements"
C Depreciation expenses [Formula] Depreciation expenses = Disposals of tangible fixed assets d + Depreciation of tangible fixed assets e
d Disposals of tangible fixed assets [Disposals of tangible fixed assets] in Sector 161(printing) in the "Census of Manufactures"
e Depreciation of tangible fixed assets [Depreciation of tangible fixed assets] in Sector 161 (printing) in the "Census of Manufactures"
D Indirect taxes [Formula] Indirect taxes = Value of products f×Indirect taxes rate g
f Value of products [Value of Shipments] in Sector 161 (printing) in the "Census of Manufactures"
g Indirect taxes rate Consumption tax rate of 5 %
*" Amount of printing products demanded by major customer type in the printing industry" ○ "Amount of printing products demanded by major customer type in the printing
industry", which was taken from the "White Paper on the Printing Industry" published each year by the Japan Association of Graphic Arts Technology, has not been disclosed since fiscal 2000. For this report, it was estimated on the assumption that the share of the total value-added in the printing and publishing industry occupied by the newspaper publishing industry has stayed the same since that year.
34
Copyright White Paper Chapter 3: Overview of JCI-classified Core Copyright Industries
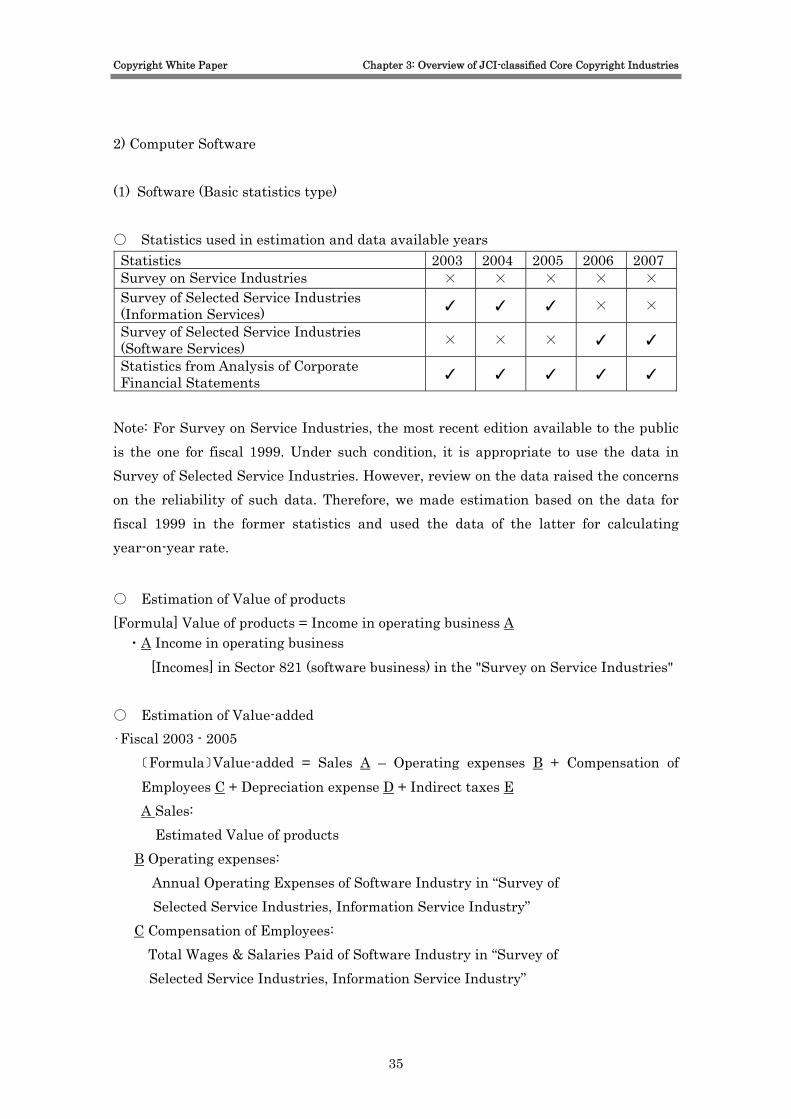
2) Computer Software (1) Software (Basic statistics type) ○ Statistics used in estimation and data available years Statistics 2003 2004 2005 2006 2007 Survey on Service Industries × × × × × Survey of Selected Service Industries (Information Services) ✓ ✓ ✓ × ×
Survey of Selected Service Industries (Software Services) × × × ✓ ✓
Statistics from Analysis of Corporate Financial Statements ✓ ✓ ✓ ✓ ✓
Note: For Survey on Service Industries, the most recent edition available to the public is the one for fiscal 1999. Under such condition, it is appropriate to use the data in Survey of Selected Service Industries. However, review on the data raised the concerns on the reliability of such data. Therefore, we made estimation based on the data for fiscal 1999 in the former statistics and used the data of the latter for calculating year-on-year rate.
○ Estimation of Value of products [Formula] Value of products = Income in operating business A・A Income in operating business
[Incomes] in Sector 821 (software business) in the "Survey on Service Industries" ○ Estimation of Value-added ・Fiscal 2003 - 2005
〔Formula〕Value-added = Sales A – Operating expenses B + Compensation of Employees C + Depreciation expense D + Indirect taxes EA Sales: Estimated Value of products
B Operating expenses: Annual Operating Expenses of Software Industry in “Survey of
Selected Service Industries, Information Service Industry” C Compensation of Employees: Total Wages & Salaries Paid of Software Industry in “Survey of
Selected Service Industries, Information Service Industry”
35
Copyright White Paper Chapter 3: Overview of JCI-classified Core Copyright Industries
D Depreciation expense 〔Formula〕Depreciation expense = Value of products a × Depreciation
rate b a Value of products:
Estimated Annual Sales b Depreciation rate:
Depreciation rate on sales of Software Industry in Statistics from “Analysis of Corporate Financial Statements, Information Service Industry”
E Indirect taxes: Annual Sales Software Industry in “Analysis of Corporate Financial Statements, Information Service Industry” × 5%
・Fiscal 2006-2007
[Formula] Value-added = Sales A – Operating expenses B + Compensation of Employees C + Depreciation rate D +Indirect taxes E A Sales [Annual Sales] of Software Industry in the “Survey of Selected Service Industries, Information Service Industry”
B Operating expenses
[Annual Operating Expenses] of Software Industry in the “Survey of Selected Service Industries, Information Service Industry”
C Compensation of Employees
[Total Wages & Salaries Paid] of Software Industry in the “Survey of Selected Service Industries, Information Service Industry”
D Depreciation expenses [Depreciation Expenses] of Software Industry in the “Survey of Selected Service
Industries, Information Service Industry” E Indirect taxes
[Annual Sales] of Software Industry in the “Survey of Selected Service
36

Copyright White Paper Chapter 3: Overview of JCI-classified Core Copyright Industries
Industries, Information Service Industry” ×5%
○ Compensation for statistical data ・Fiscal 2003 – 2005
The “Analysis of Corporate Financial Statement, Information Service Industry” was published once every fiscal year until fiscal 2005. Value of products in the software industry in fiscal 2003, 2004 is estimated by using the year-on-year rate of annual sales in the software industry of the Survey of Selected Service Industries, Information Service Industry.”
Figure 3-10 Annual Sales and the rate of change over the previous year in Software Industry
1999 2000 2001 2002 2003 2004 2005 Annual Sales (in million yen) 6,692,500 7,421,100 9,471,800 9,685,900 8,805,141 9,243,642 9,273,371
Year-on-year change(%) 106% 111% 128% 102% 91% 105% 100%
Source: Survey of Selected Service Industries, Information Service Industry
These figures were used for a calculation of the value of products and value-added in fiscal 2003, for example, by means of the formulas noted below. This was also done for other fiscal years for which data were not available.
[Formula] Value of products(2003)=Value of products(2002)×Rate of change [Formula] Value-added(2003)=Value-added(2002)×Rate of change ・Fiscal 2006 – 2007
The “Analysis of Corporate Financial Statement, Software Industry” is published once every fiscal year since fiscal 2006. Value of products in the software industry for fiscal years 2006 and 2007 is estimated by using the rate of change of annual sales in the software industry of the Survey of Selected Service Industries, Software Industry.”
Figure 3-11 Annual sales in the software industry and the rate of change over the previous fiscal year
2006 2007 Annual Sales (in million yen) 10,476,004 10,297,504 Rage of change(%) 113%(*) 98%
Source: Survey of Selected Service Industries, Data Processing/ Providing Service Industry
37
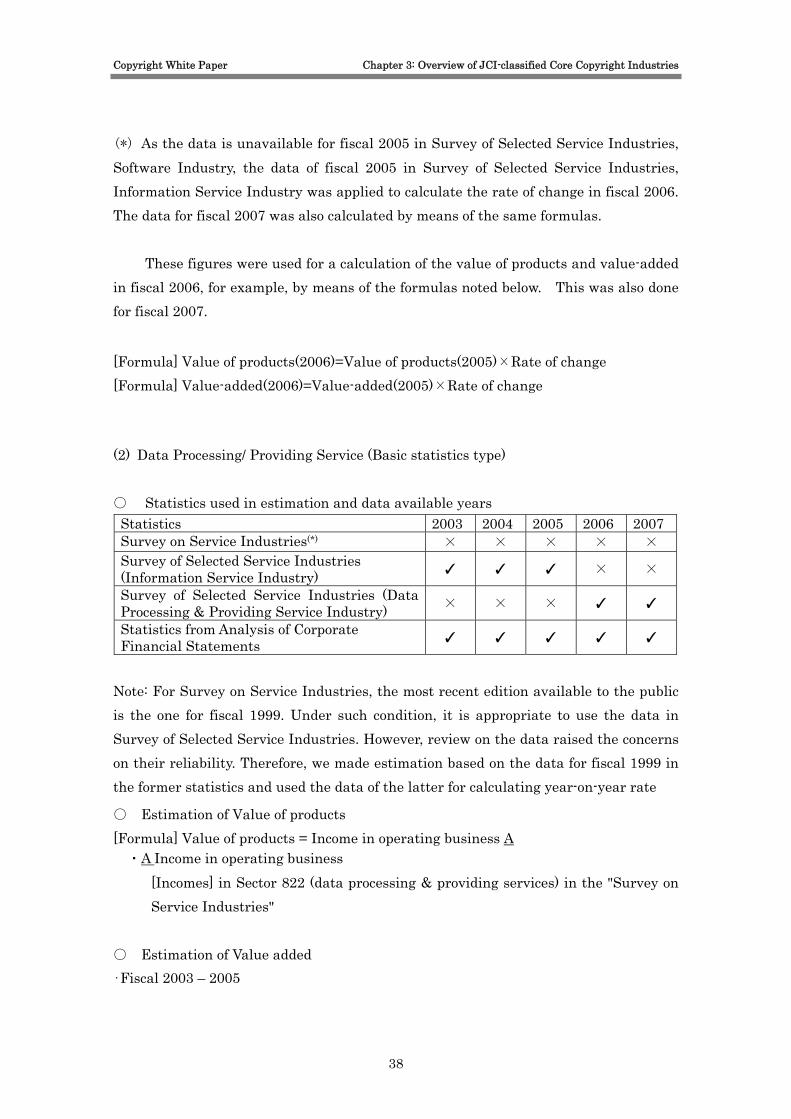
Copyright White Paper Chapter 3: Overview of JCI-classified Core Copyright Industries
(*) As the data is unavailable for fiscal 2005 in Survey of Selected Service Industries, Software Industry, the data of fiscal 2005 in Survey of Selected Service Industries, Information Service Industry was applied to calculate the rate of change in fiscal 2006. The data for fiscal 2007 was also calculated by means of the same formulas.
These figures were used for a calculation of the value of products and value-added in fiscal 2006, for example, by means of the formulas noted below. This was also done for fiscal 2007.
[Formula] Value of products(2006)=Value of products(2005)×Rate of change [Formula] Value-added(2006)=Value-added(2005)×Rate of change (2) Data Processing/ Providing Service (Basic statistics type) ○ Statistics used in estimation and data available years Statistics 2003 2004 2005 2006 2007 Survey on Service Industries(*) × × × × × Survey of Selected Service Industries (Information Service Industry) ✓ ✓ ✓ × ×
Survey of Selected Service Industries (Data Processing & Providing Service Industry) × × × ✓ ✓
Statistics from Analysis of Corporate Financial Statements ✓ ✓ ✓ ✓ ✓
Note: For Survey on Service Industries, the most recent edition available to the public is the one for fiscal 1999. Under such condition, it is appropriate to use the data in Survey of Selected Service Industries. However, review on the data raised the concerns on their reliability. Therefore, we made estimation based on the data for fiscal 1999 in the former statistics and used the data of the latter for calculating year-on-year rate
○ Estimation of Value of products [Formula] Value of products = Income in operating business A・A Income in operating business
[Incomes] in Sector 822 (data processing & providing services) in the "Survey on Service Industries"
○ Estimation of Value added ・Fiscal 2003 – 2005
38
Copyright White Paper Chapter 3: Overview of JCI-classified Core Copyright Industries
〔Formula〕Value-added in data processing & providing services = Value-added in data processing services + Value-added in data providing services * Process to estimate Value-added is the same for both data processing services and data providing services. Accordingly, data processing services industry is taken as an example for calculation process. 〔Formula〕Value-added = Sales A – Operating expenses B + Compensation of Employees C + Depreciation expense D + Indirect taxes EA Sales: Estimated Value of products
B Operating expenses: Annual Operating Expenses of Data-Processing Services in
“Survey of Selected Service Industries, Information Service Industry” C Compensation of Employees: Total Wages & Salaries Paid in Data-Processing/ Providing Services in “Survey
of Selected Service Industries, Information Service Industry” D Depreciation expense
〔Formula〕Depreciation expense = Value of products a × Depreciation rate b a Value of products:
Estimated Annual Sales b Depreciation rate:
Depreciation ratio to sales of Data-Processing/ Providing Services in Statistics from the “Analysis of Corporate Financial Statements, Information Service Industry”
E Indirect taxes: Annual Sales of Data-Processing/ Providing Services in the “Survey of Selected Service Industries, Information Service Industry” × 5%
・Fiscal 2006 – 2007
〔Formula〕Value-added = Sales A – Operating expenses B + Compensation of Employees C + Depreciation expense D + Indirect taxes EA Sales: Annual Sales in the “Survey of Selected Service Industries, Data
Processing & Providing Service Industry” B Operating expenses:
39
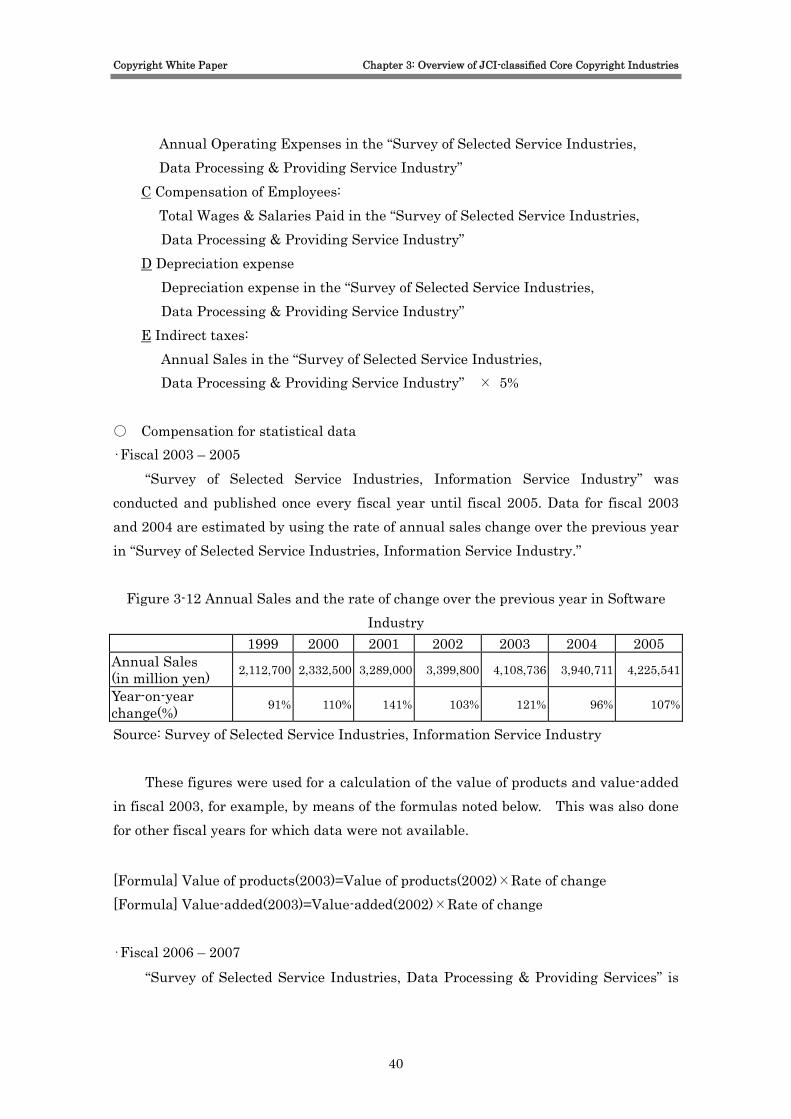
Copyright White Paper Chapter 3: Overview of JCI-classified Core Copyright Industries
Annual Operating Expenses in the “Survey of Selected Service Industries, Data Processing & Providing Service Industry”
C Compensation of Employees: Total Wages & Salaries Paid in the “Survey of Selected Service Industries,
Data Processing & Providing Service Industry” D Depreciation expense
Depreciation expense in the “Survey of Selected Service Industries, Data Processing & Providing Service Industry”
E Indirect taxes: Annual Sales in the “Survey of Selected Service Industries, Data Processing & Providing Service Industry” × 5%
○ Compensation for statistical data ・Fiscal 2003 – 2005
“Survey of Selected Service Industries, Information Service Industry” was conducted and published once every fiscal year until fiscal 2005. Data for fiscal 2003 and 2004 are estimated by using the rate of annual sales change over the previous year in “Survey of Selected Service Industries, Information Service Industry.”
Figure 3-12 Annual Sales and the rate of change over the previous year in Software Industry
1999 2000 2001 2002 2003 2004 2005 Annual Sales (in million yen) 2,112,700 2,332,500 3,289,000 3,399,800 4,108,736 3,940,711 4,225,541
Year-on-year change(%) 91% 110% 141% 103% 121% 96% 107%
Source: Survey of Selected Service Industries, Information Service Industry
These figures were used for a calculation of the value of products and value-added in fiscal 2003, for example, by means of the formulas noted below. This was also done for other fiscal years for which data were not available.
[Formula] Value of products(2003)=Value of products(2002)×Rate of change [Formula] Value-added(2003)=Value-added(2002)×Rate of change ・Fiscal 2006 – 2007
“Survey of Selected Service Industries, Data Processing & Providing Services” is
40
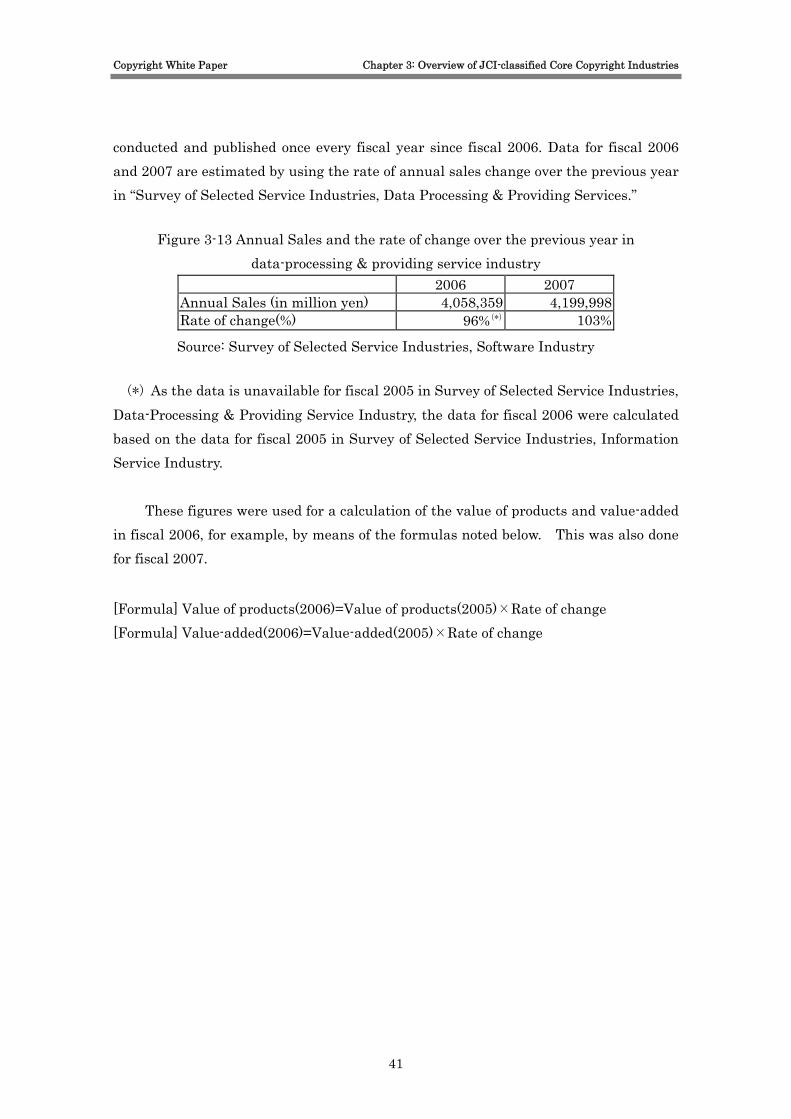
Copyright White Paper Chapter 3: Overview of JCI-classified Core Copyright Industries
conducted and published once every fiscal year since fiscal 2006. Data for fiscal 2006 and 2007 are estimated by using the rate of annual sales change over the previous year in “Survey of Selected Service Industries, Data Processing & Providing Services.”
Figure 3-13 Annual Sales and the rate of change over the previous year in data-processing & providing service industry
2006 2007 Annual Sales (in million yen) 4,058,359 4,199,998 Rate of change(%) 96%(*) 103%
Source: Survey of Selected Service Industries, Software Industry (*) As the data is unavailable for fiscal 2005 in Survey of Selected Service Industries,
Data-Processing & Providing Service Industry, the data for fiscal 2006 were calculated based on the data for fiscal 2005 in Survey of Selected Service Industries, Information Service Industry.
These figures were used for a calculation of the value of products and value-added in fiscal 2006, for example, by means of the formulas noted below. This was also done for fiscal 2007.
[Formula] Value of products(2006)=Value of products(2005)×Rate of change [Formula] Value-added(2006)=Value-added(2005)×Rate of change
41

Copyright White Paper Chapter 3: Overview of JCI-classified Core Copyright Industries
3) Broadcasting (1) Public Broadcasting (Supplementary statistics type) ○ Statistics used in estimation and data available years
Statistics 2003 2004 2005 2006 2007 Radio & Television Year book ✓ ✓ ✓ ✓ ✓
○ Estimation of Vale of products 〔Formula〕Value of products = Income in operating business A A: Income
Income in operating business in the P/L statement of Radio & Television Yearbook
○ Estimation of Value-added 〔Formula〕Value-added = Employer’s income A + Operating surplus B + Depreciation
expense C + Indirect tax D A Employer’s income:
Employment costs + Labor costs in the P/L statement of Radio & Television Yearbook
B Operating surplus: Operating profit in the P/L statement of Radio & Television Yearbook
C Depreciation: Depreciation expense in the P/L statement of Radio & Television Yearbook
D Indirect tax Ordinary revenue in the P/L statement of Radio & Television Yearbook × 5%
(2) Private Broadcasting (Supplementary statistics type) ○ Statistics used in estimation and data available years Statistics 2003 2004 2005 2006 2007 Survey on the Telecommunication Industry ✓ ✓ ✓ ✓ NA*
Japan Commercial Broadcasting Yearbook ✓ ✓ ✓ ✓ ✓ * The edition for fiscal 2007 will be published in June 2009. ○ Estimation of Value of products 〔Formula〕Value of products = Incomes A
42
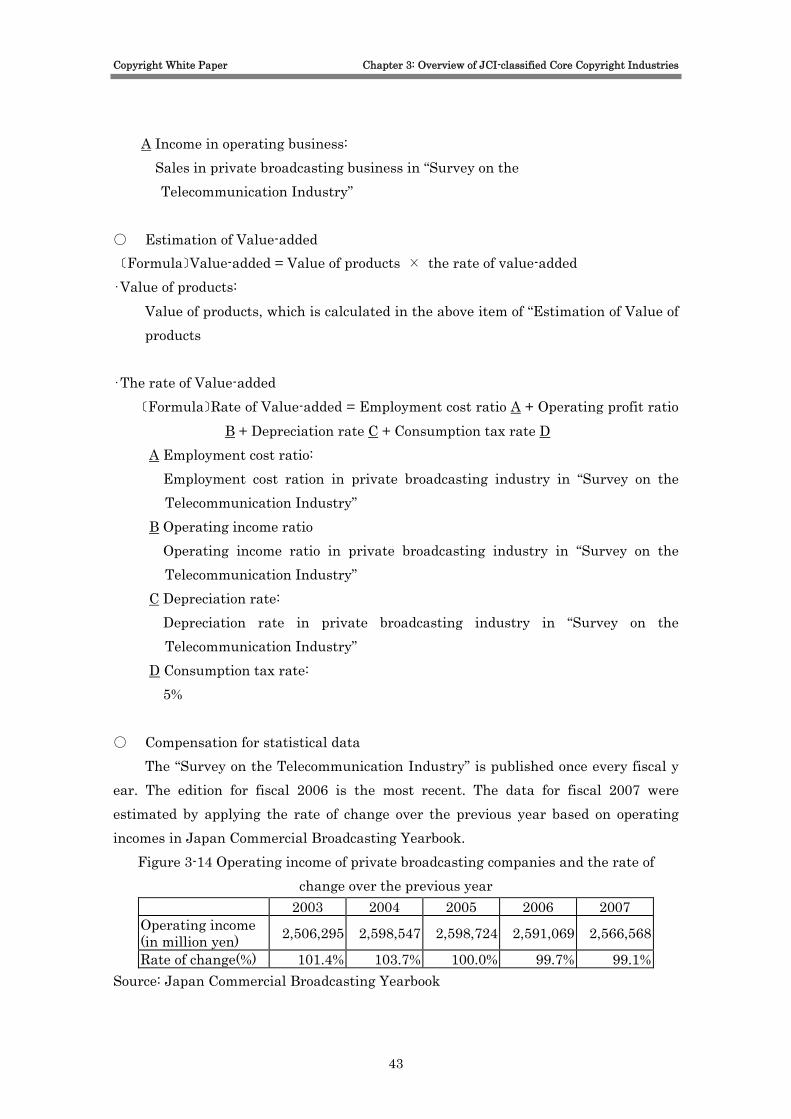
Copyright White Paper Chapter 3: Overview of JCI-classified Core Copyright Industries
A Income in operating business: Sales in private broadcasting business in “Survey on the
Telecommunication Industry”
○ Estimation of Value-added 〔Formula〕Value-added = Value of products × the rate of value-added ・Value of products:
Value of products, which is calculated in the above item of “Estimation of Value of products
・The rate of Value-added
〔Formula〕Rate of Value-added = Employment cost ratio A + Operating profit ratio B + Depreciation rate C + Consumption tax rate D
A Employment cost ratio: Employment cost ration in private broadcasting industry in “Survey on the
Telecommunication Industry” B Operating income ratio Operating income ratio in private broadcasting industry in “Survey on the
Telecommunication Industry” C Depreciation rate: Depreciation rate in private broadcasting industry in “Survey on the
Telecommunication Industry” D Consumption tax rate: 5%
○ Compensation for statistical data
The “Survey on the Telecommunication Industry” is published once every fiscal y ear. The edition for fiscal 2006 is the most recent. The data for fiscal 2007 were estimated by applying the rate of change over the previous year based on operating incomes in Japan Commercial Broadcasting Yearbook.
Figure 3-14 Operating income of private broadcasting companies and the rate of change over the previous year
2003 2004 2005 2006 2007 Operating income (in million yen) 2,506,295 2,598,547 2,598,724 2,591,069 2,566,568
Rate of change(%) 101.4% 103.7% 100.0% 99.7% 99.1% Source: Japan Commercial Broadcasting Yearbook
43

Copyright White Paper Chapter 3: Overview of JCI-classified Core Copyright Industries
These figures were used for a calculation of the value of products and value-added in fiscal 2007 by means of the formulas noted below.
[Formula] Value of products(2007)=Value of products(2006)×Rate of change [Formula] Value-added(2007)=Value-added(2006)×Rate of change (3) Cable Broadcasting (Supplementary statistics type) ○ Statistics used in estimation and data available years Statistics 2003 2004 2005 2006 2007 Survey on the Telecommunication Industry ✓ ✓ ✓ ✓ NA*Japan Commercial Broadcasting Yearbook ✓ ✓ ✓ ✓ ✓
* The edition for fiscal 2007 will be published in June 2009. ○ Estimation of Value of products 〔Formula〕Value of products = Incomes A A Income in operating business: Sales in cable broadcasting business in “Survey on the
Telecommunication Industry”
○ Estimation of Value-added 〔Formula〕Value-added = Value of products × the rate of value-added ・Value of products:
Value of products, which is calculated in the above item of “Estimation of Value of products
・The rate of Value-added
〔Formula〕Rate of Value-added = Employment cost ratio A + Operating profit ratio B + Depreciation rate C + Consumption tax rate D
A Employment cost ratio: Employment cost ration in cable broadcasting industry in “Survey on the
Telecommunication Industry” B Operating income ratio Operating income ratio in cable broadcasting industry in “Survey on the
Telecommunication Industry” C Depreciation rate:
44
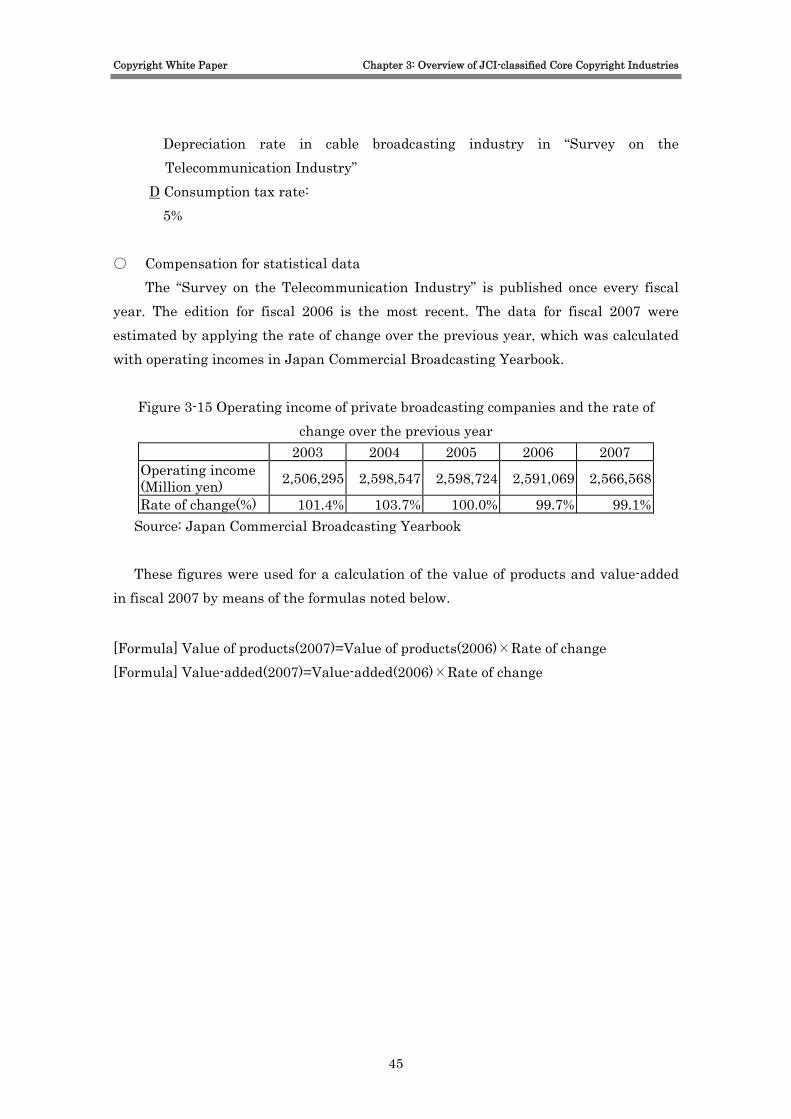
Copyright White Paper Chapter 3: Overview of JCI-classified Core Copyright Industries
Depreciation rate in cable broadcasting industry in “Survey on the Telecommunication Industry”
D Consumption tax rate: 5%
○ Compensation for statistical data The “Survey on the Telecommunication Industry” is published once every fiscal
year. The edition for fiscal 2006 is the most recent. The data for fiscal 2007 were estimated by applying the rate of change over the previous year, which was calculated with operating incomes in Japan Commercial Broadcasting Yearbook.
Figure 3-15 Operating income of private broadcasting companies and the rate of change over the previous year
2003 2004 2005 2006 2007 Operating income (Million yen) 2,506,295 2,598,547 2,598,724 2,591,069 2,566,568
Rate of change(%) 101.4% 103.7% 100.0% 99.7% 99.1% Source: Japan Commercial Broadcasting Yearbook
These figures were used for a calculation of the value of products and value-added
in fiscal 2007 by means of the formulas noted below.
[Formula] Value of products(2007)=Value of products(2006)×Rate of change [Formula] Value-added(2007)=Value-added(2006)×Rate of change
45
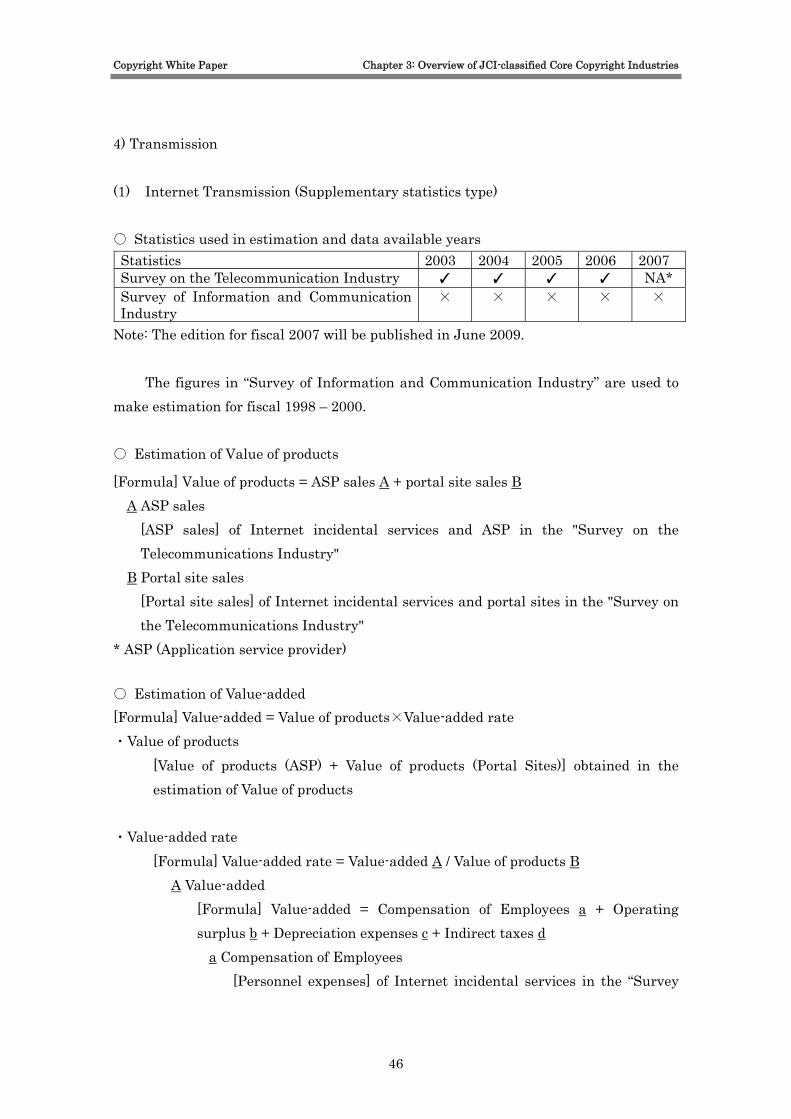
Copyright White Paper Chapter 3: Overview of JCI-classified Core Copyright Industries
4) Transmission (1) Internet Transmission (Supplementary statistics type) ○ Statistics used in estimation and data available years Statistics 2003 2004 2005 2006 2007 Survey on the Telecommunication Industry ✓ ✓ ✓ ✓ NA* Survey of Information and Communication Industry
× × × × ×
Note: The edition for fiscal 2007 will be published in June 2009.
The figures in “Survey of Information and Communication Industry” are used to make estimation for fiscal 1998 – 2000. ○ Estimation of Value of products
[Formula] Value of products = ASP sales A + portal site sales BA ASP sales
[ASP sales] of Internet incidental services and ASP in the "Survey on the Telecommunications Industry"
B Portal site sales [Portal site sales] of Internet incidental services and portal sites in the "Survey on the Telecommunications Industry"
* ASP (Application service provider) ○ Estimation of Value-added [Formula] Value-added = Value of products×Value-added rate ・Value of products
[Value of products (ASP) + Value of products (Portal Sites)] obtained in the estimation of Value of products
・Value-added rate
[Formula] Value-added rate = Value-added A / Value of products BA Value-added
[Formula] Value-added = Compensation of Employees a + Operating surplus b + Depreciation expenses c + Indirect taxes d
a Compensation of Employees [Personnel expenses] of Internet incidental services in the “Survey
46
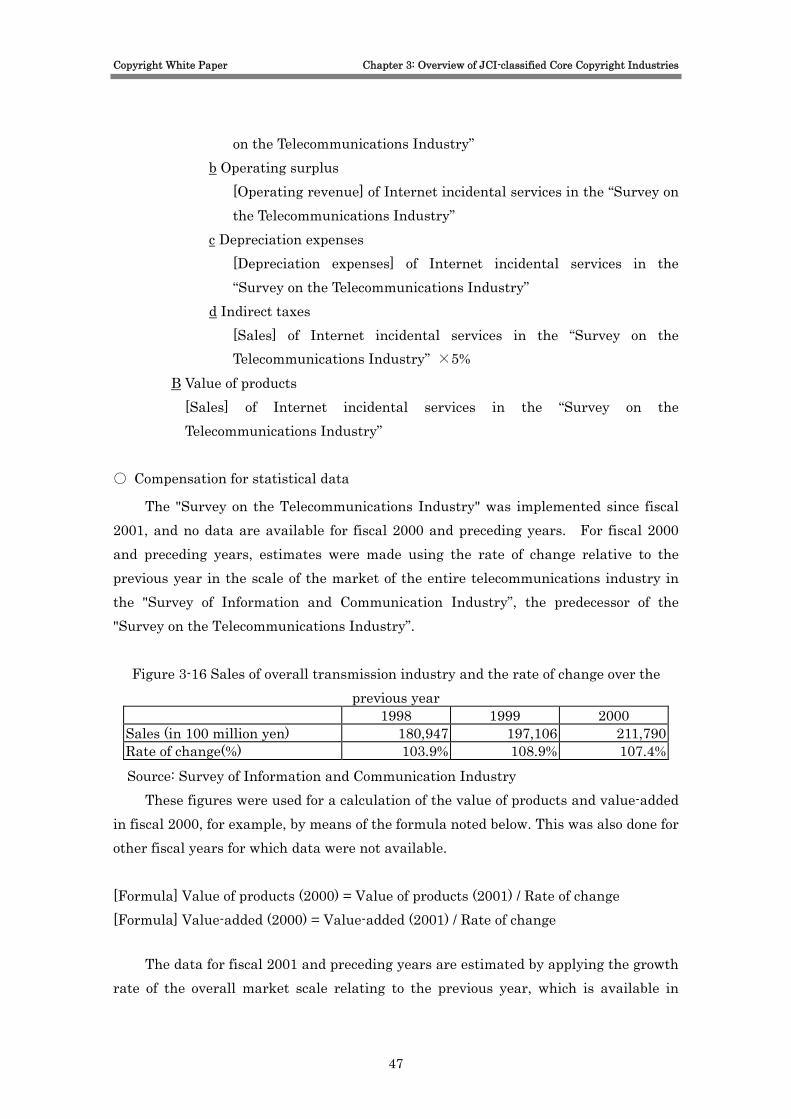
Copyright White Paper Chapter 3: Overview of JCI-classified Core Copyright Industries
on the Telecommunications Industry” b Operating surplus
[Operating revenue] of Internet incidental services in the “Survey on the Telecommunications Industry”
c Depreciation expenses [Depreciation expenses] of Internet incidental services in the “Survey on the Telecommunications Industry”
d Indirect taxes [Sales] of Internet incidental services in the “Survey on the Telecommunications Industry” ×5%
B Value of products [Sales] of Internet incidental services in the “Survey on the Telecommunications Industry”
○ Compensation for statistical data
The "Survey on the Telecommunications Industry" was implemented since fiscal 2001, and no data are available for fiscal 2000 and preceding years. For fiscal 2000 and preceding years, estimates were made using the rate of change relative to the previous year in the scale of the market of the entire telecommunications industry in the "Survey of Information and Communication Industry”, the predecessor of the "Survey on the Telecommunications Industry”.
Figure 3-16 Sales of overall transmission industry and the rate of change over the previous year
1998 1999 2000 Sales (in 100 million yen) 180,947 197,106 211,790Rate of change(%) 103.9% 108.9% 107.4%Source: Survey of Information and Communication Industry
These figures were used for a calculation of the value of products and value-added in fiscal 2000, for example, by means of the formula noted below. This was also done for other fiscal years for which data were not available. [Formula] Value of products (2000) = Value of products (2001) / Rate of change [Formula] Value-added (2000) = Value-added (2001) / Rate of change
The data for fiscal 2001 and preceding years are estimated by applying the growth rate of the overall market scale relating to the previous year, which is available in
47

Copyright White Paper Chapter 3: Overview of JCI-classified Core Copyright Industries
Survey on the Telecommunication Industry..
Figure 3-17 The Sales of Overall Telecommunication Industry and the rate of change
relative to the previous year 2001 2002 2003 2004 2005 2006
Sales (100 million yen) 226,453 196,417 196,386 180,888 180,988 187,018 Rate of change(%) 106.9% 86.7% 100.0% 92.1% 100.1% 103.3%Source: Survey on the Telecommunication Indusry
These figures were used for calculation of Value of products and Value-added in fiscal 2006, for example, by means of the formulas noted below. This was also done for other fiscal years for which data were not available.
[Formula] Value of products (2006) = Value of products (2005) × Rate of change [Formula] Value-added (2006) = Value-added (2005) × Rate of change (2) Mobile Telephone Network Transmission (Supplementary statistics type) ○ Statistics used and data available years Statistics 2003 2004 2005 2006 2007 Survey on the Telecommunication Industry ✓ ✓ ✓ ✓ NA* Survey of Information and Communication Industry × × × × ×
Note: The edition for fiscal 2007 will be published in June 2009.
The figures in “Survey of Information and Communication Industry” are used to make estimation for fiscal 1998 – 2000. ○ Estimation of Value of products
[Formula] Value of products = Sales A A Sales
[Sales] noted under Type I Telecommunication Careers in the "Survey on the Telecommunications Industry"
○ Estimation of Value-added [Formula] Value-added = Value of products×Value-added rate ・Value of products
48
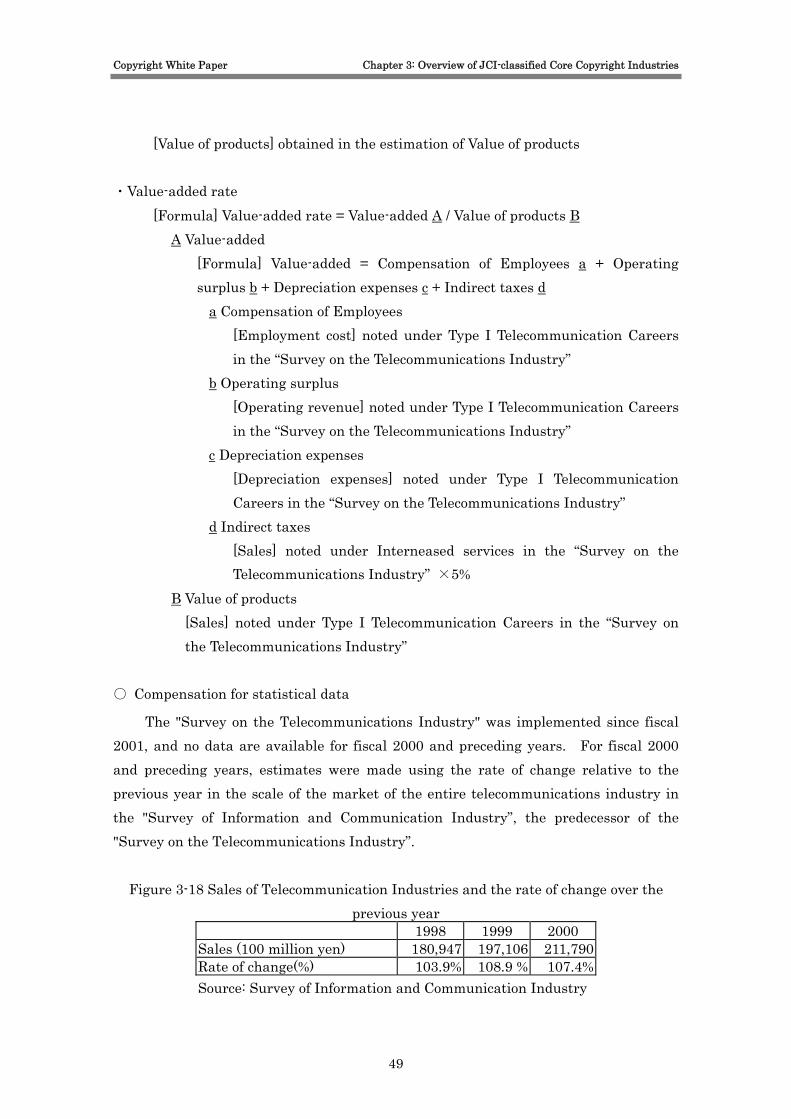
Copyright White Paper Chapter 3: Overview of JCI-classified Core Copyright Industries
[Value of products] obtained in the estimation of Value of products ・Value-added rate
[Formula] Value-added rate = Value-added A / Value of products B A Value-added
[Formula] Value-added = Compensation of Employees a + Operating surplus b + Depreciation expenses c + Indirect taxes d
a Compensation of Employees [Employment cost] noted under Type I Telecommunication Careers in the “Survey on the Telecommunications Industry”
b Operating surplus [Operating revenue] noted under Type I Telecommunication Careers in the “Survey on the Telecommunications Industry”
c Depreciation expenses [Depreciation expenses] noted under Type I Telecommunication Careers in the “Survey on the Telecommunications Industry”
d Indirect taxes [Sales] noted under Interneased services in the “Survey on the Telecommunications Industry” ×5%
B Value of products [Sales] noted under Type I Telecommunication Careers in the “Survey on the Telecommunications Industry”
○ Compensation for statistical data
The "Survey on the Telecommunications Industry" was implemented since fiscal 2001, and no data are available for fiscal 2000 and preceding years. For fiscal 2000 and preceding years, estimates were made using the rate of change relative to the previous year in the scale of the market of the entire telecommunications industry in the "Survey of Information and Communication Industry”, the predecessor of the "Survey on the Telecommunications Industry”.
Figure 3-18 Sales of Telecommunication Industries and the rate of change over the previous year
1998 1999 2000 Sales (100 million yen) 180,947 197,106 211,790 Rate of change(%) 103.9% 108.9 % 107.4% Source: Survey of Information and Communication Industry
49
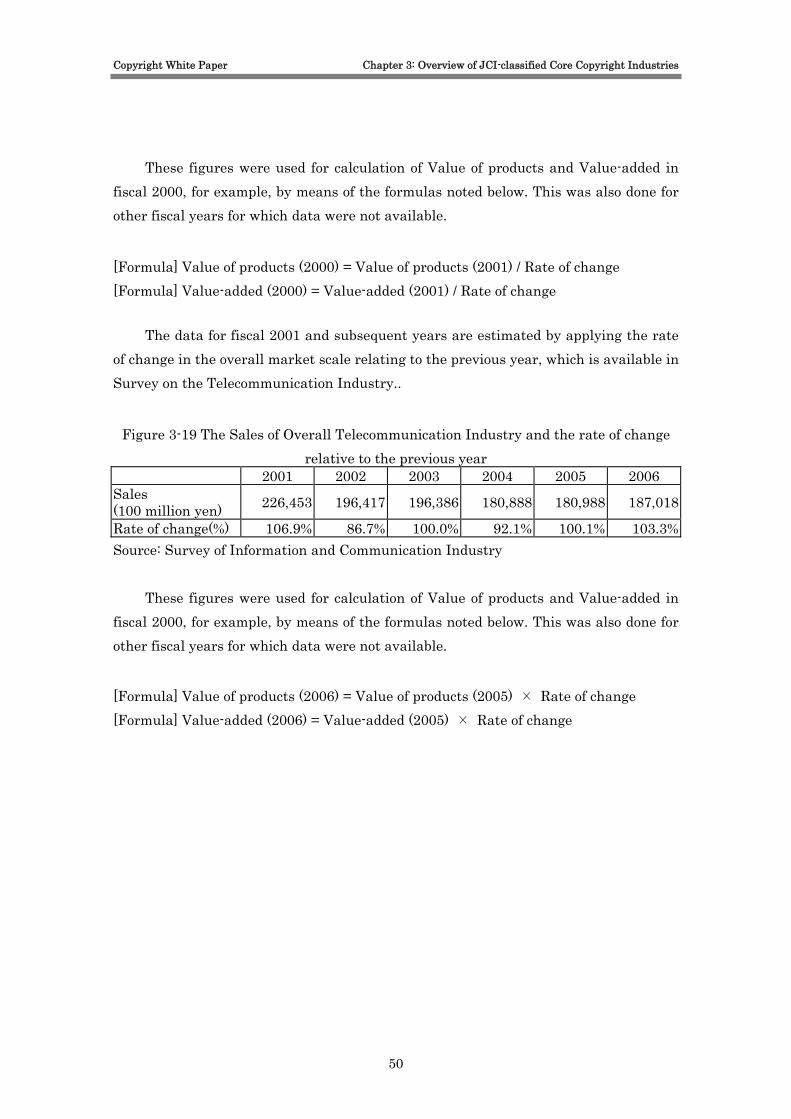
Copyright White Paper Chapter 3: Overview of JCI-classified Core Copyright Industries
These figures were used for calculation of Value of products and Value-added in
fiscal 2000, for example, by means of the formulas noted below. This was also done for other fiscal years for which data were not available.
[Formula] Value of products (2000) = Value of products (2001) / Rate of change [Formula] Value-added (2000) = Value-added (2001) / Rate of change
The data for fiscal 2001 and subsequent years are estimated by applying the rate of change in the overall market scale relating to the previous year, which is available in Survey on the Telecommunication Industry..
Figure 3-19 The Sales of Overall Telecommunication Industry and the rate of change relative to the previous year
2001 2002 2003 2004 2005 2006 Sales (100 million yen) 226,453 196,417 196,386 180,888 180,988 187,018
Rate of change(%) 106.9% 86.7% 100.0% 92.1% 100.1% 103.3%Source: Survey of Information and Communication Industry
These figures were used for calculation of Value of products and Value-added in fiscal 2000, for example, by means of the formulas noted below. This was also done for other fiscal years for which data were not available.
[Formula] Value of products (2006) = Value of products (2005) × Rate of change [Formula] Value-added (2006) = Value-added (2005) × Rate of change
50

Copyright White Paper Chapter 3: Overview of JCI-classified Core Copyright Industries
5) Advertising
(1) Commercial art and Graphic Design [Supplementary statistics type] ○ Statistics used in the estimation and data available years Statistics 2003 2004 2005 2006 2007 Survey on Service industries × ✓ × × × Survey of Selected Service Industries (Advertising agency) ✓ ✓ ✓ ✓ ✓
Financial statement report of advertising Agencies ✓ ✓ ✓ × ×
Financial statement report of advertising Production × × × × ×
The figures in Financial statement report of advertising agencies are used to
make estimation for fiscal 1998 – 2002.
○ Estimation of Value of products
There are no statistical data for the value of products in the advertising production industry. It was consequently estimated by extracting the portion of advertising production expenses from the value of products in the advertising agency industry. The rate of advertising production cost in the advertising agency industry was estimated from the cost structure of advertising agency business.
Figure 3-20 Relationship between Cost and Sales of Advertising agency
Sales
Cost of Sales
Selling Expense
Administrative Expense
Operating Profit
Media Cost
Advertising Production
Cost(*)
(*) This is equivalent to incomes of advertising production industry
51
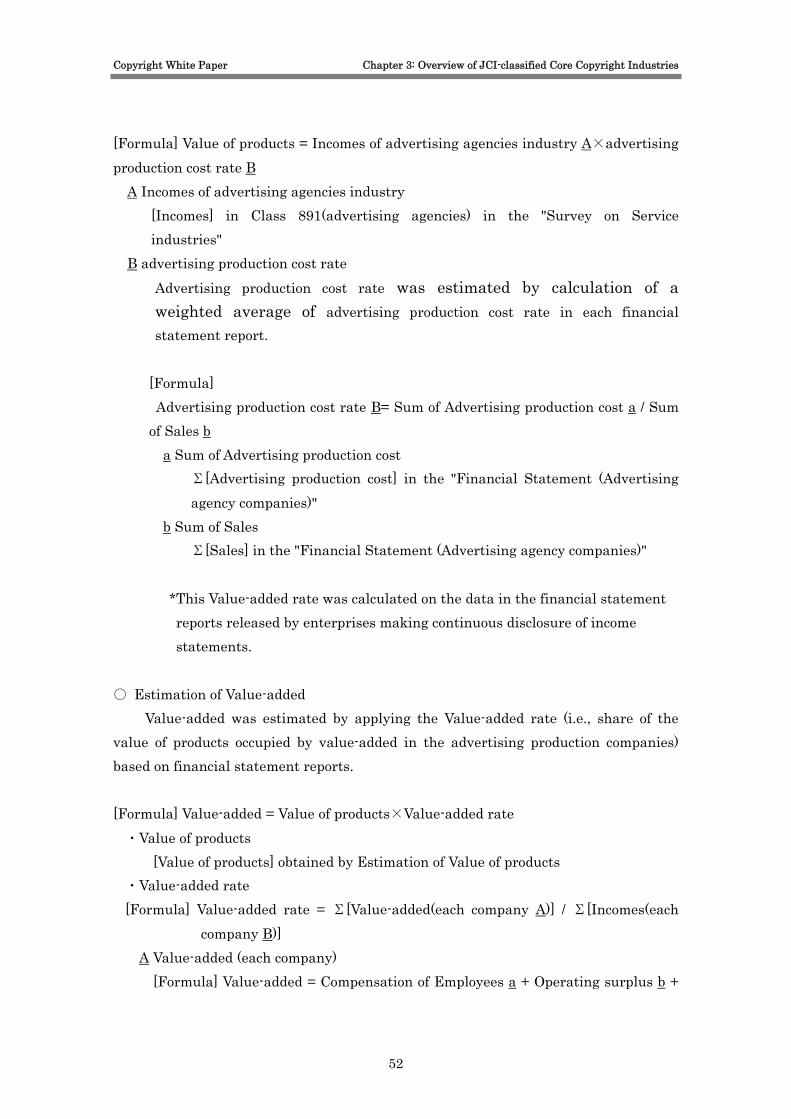
Copyright White Paper Chapter 3: Overview of JCI-classified Core Copyright Industries
[Formula] Value of products = Incomes of advertising agencies industry A×advertising production cost rate B
A Incomes of advertising agencies industry [Incomes] in Class 891(advertising agencies) in the "Survey on Service industries"
B advertising production cost rate Advertising production cost rate was estimated by calculation of a weighted average of advertising production cost rate in each financial statement report.
[Formula] Advertising production cost rate B= Sum of Advertising production cost a / Sum of Sales b
a Sum of Advertising production cost Σ[Advertising production cost] in the "Financial Statement (Advertising agency companies)"
b Sum of Sales Σ[Sales] in the "Financial Statement (Advertising agency companies)"
*This Value-added rate was calculated on the data in the financial statement reports released by enterprises making continuous disclosure of income statements.
○ Estimation of Value-added
Value-added was estimated by applying the Value-added rate (i.e., share of the value of products occupied by value-added in the advertising production companies) based on financial statement reports. [Formula] Value-added = Value of products×Value-added rate ・Value of products
[Value of products] obtained by Estimation of Value of products ・Value-added rate [Formula] Value-added rate = Σ[Value-added(each company A)] / Σ[Incomes(each
company B)] A Value-added (each company)
[Formula] Value-added = Compensation of Employees a + Operating surplus b +
52
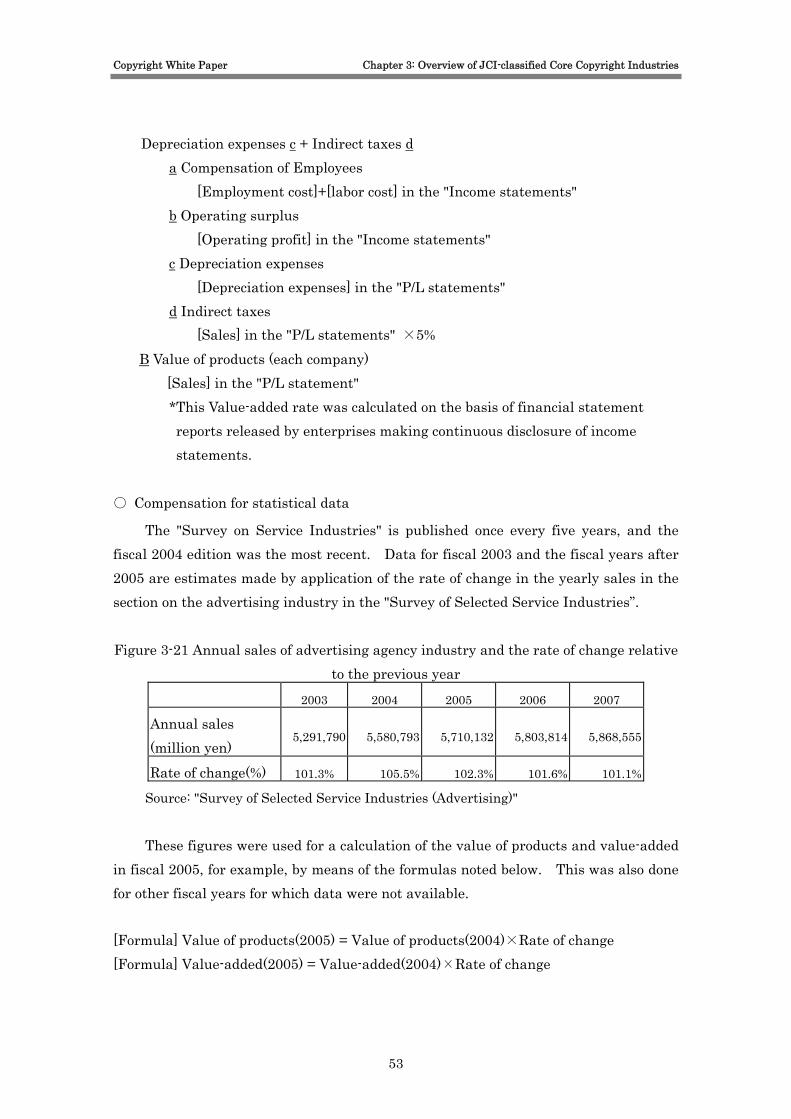
Copyright White Paper Chapter 3: Overview of JCI-classified Core Copyright Industries
Depreciation expenses c + Indirect taxes d a Compensation of Employees
[Employment cost]+[labor cost] in the "Income statements" b Operating surplus
[Operating profit] in the "Income statements" c Depreciation expenses
[Depreciation expenses] in the "P/L statements" d Indirect taxes
[Sales] in the "P/L statements" ×5% B Value of products (each company)
[Sales] in the "P/L statement" *This Value-added rate was calculated on the basis of financial statement reports released by enterprises making continuous disclosure of income statements.
○ Compensation for statistical data
The "Survey on Service Industries" is published once every five years, and the fiscal 2004 edition was the most recent. Data for fiscal 2003 and the fiscal years after 2005 are estimates made by application of the rate of change in the yearly sales in the section on the advertising industry in the "Survey of Selected Service Industries”. Figure 3-21 Annual sales of advertising agency industry and the rate of change relative
to the previous year 2003 2004 2005 2006 2007
Annual sales (million yen)
5,291,790 5,580,793 5,710,132 5,803,814 5,868,555
Rate of change(%) 101.3% 105.5% 102.3% 101.6% 101.1%
Source: "Survey of Selected Service Industries (Advertising)"
These figures were used for a calculation of the value of products and value-added
in fiscal 2005, for example, by means of the formulas noted below. This was also done for other fiscal years for which data were not available. [Formula] Value of products(2005) = Value of products(2004)×Rate of change [Formula] Value-added(2005) = Value-added(2004)×Rate of change
53
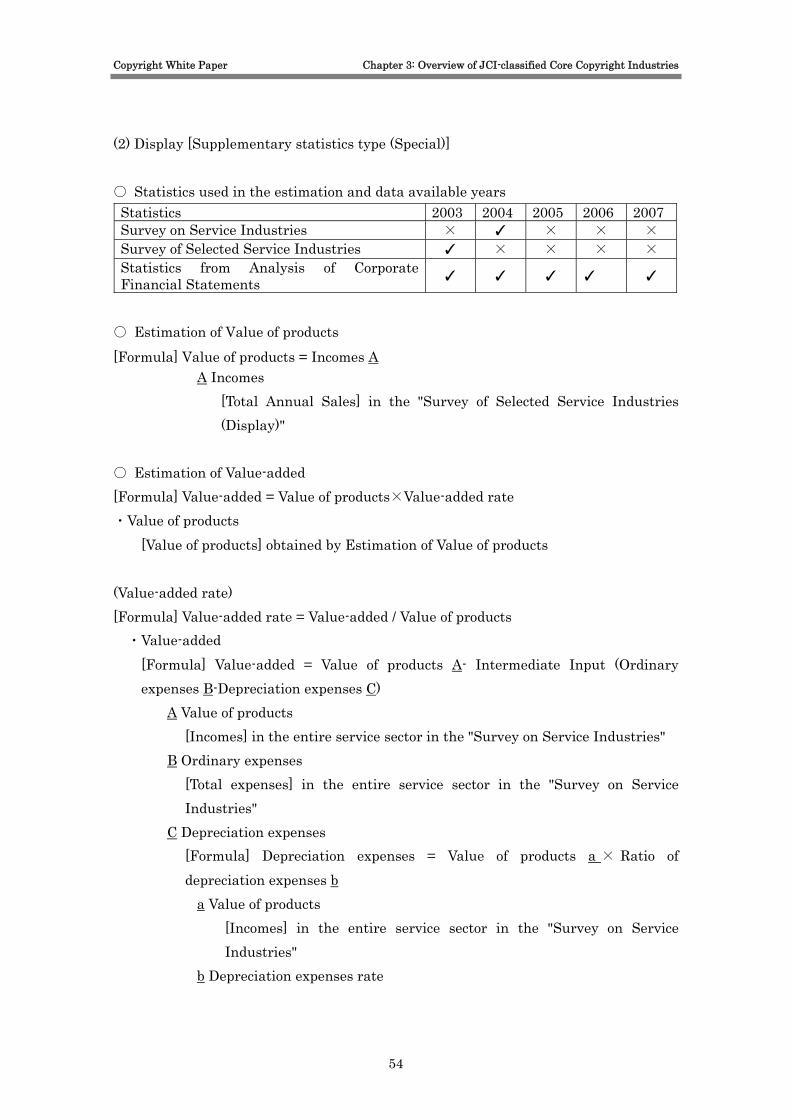
Copyright White Paper Chapter 3: Overview of JCI-classified Core Copyright Industries
(2) Display [Supplementary statistics type (Special)] ○ Statistics used in the estimation and data available years Statistics 2003 2004 2005 2006 2007 Survey on Service Industries × ✓ × × × Survey of Selected Service Industries ✓ × × × × Statistics from Analysis of Corporate Financial Statements ✓ ✓ ✓ ✓ ✓
○ Estimation of Value of products [Formula] Value of products = Incomes A
A Incomes [Total Annual Sales] in the "Survey of Selected Service Industries (Display)"
○ Estimation of Value-added [Formula] Value-added = Value of products×Value-added rate ・Value of products
[Value of products] obtained by Estimation of Value of products (Value-added rate) [Formula] Value-added rate = Value-added / Value of products ・Value-added
[Formula] Value-added = Value of products A- Intermediate Input (Ordinary expenses B-Depreciation expenses C)
A Value of products [Incomes] in the entire service sector in the "Survey on Service Industries"
B Ordinary expenses [Total expenses] in the entire service sector in the "Survey on Service Industries"
C Depreciation expenses [Formula] Depreciation expenses = Value of products a × Ratio of depreciation expenses b
a Value of products [Incomes] in the entire service sector in the "Survey on Service Industries"
b Depreciation expenses rate
54
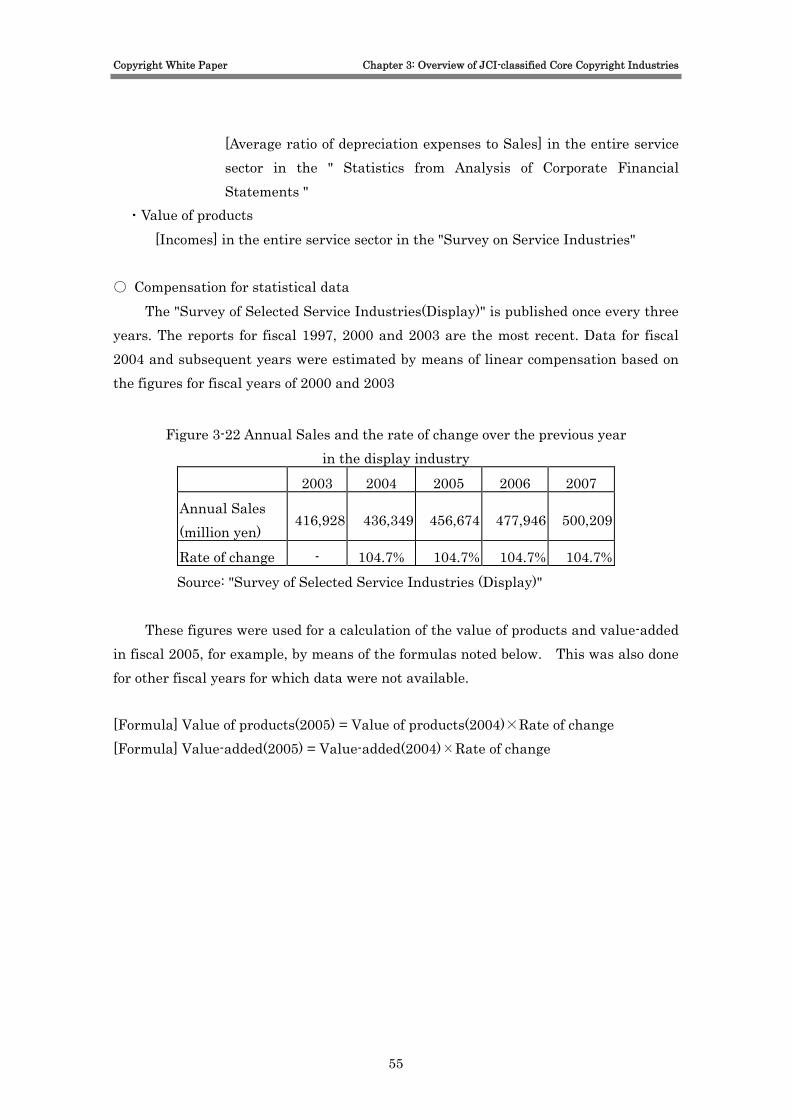
Copyright White Paper Chapter 3: Overview of JCI-classified Core Copyright Industries
[Average ratio of depreciation expenses to Sales] in the entire service sector in the " Statistics from Analysis of Corporate Financial Statements "
・Value of products [Incomes] in the entire service sector in the "Survey on Service Industries"
○ Compensation for statistical data
The "Survey of Selected Service Industries(Display)" is published once every three years. The reports for fiscal 1997, 2000 and 2003 are the most recent. Data for fiscal 2004 and subsequent years were estimated by means of linear compensation based on the figures for fiscal years of 2000 and 2003
Figure 3-22 Annual Sales and the rate of change over the previous year in the display industry
2003 2004 2005 2006 2007 Annual Sales (million yen)
416,928 436,349 456,674 477,946 500,209
Rate of change - 104.7% 104.7% 104.7% 104.7% Source: "Survey of Selected Service Industries (Display)"
These figures were used for a calculation of the value of products and value-added
in fiscal 2005, for example, by means of the formulas noted below. This was also done for other fiscal years for which data were not available. [Formula] Value of products(2005) = Value of products(2004)×Rate of change [Formula] Value-added(2005) = Value-added(2004)×Rate of change
55
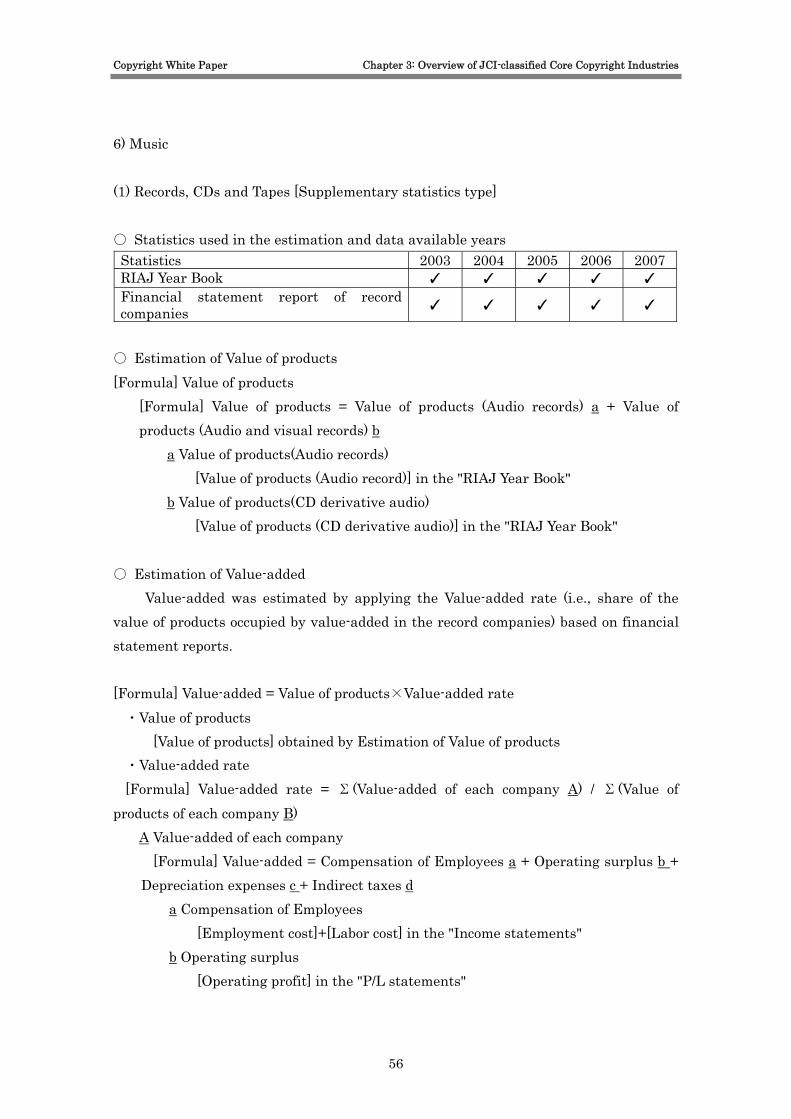
Copyright White Paper Chapter 3: Overview of JCI-classified Core Copyright Industries
6) Music (1) Records, CDs and Tapes [Supplementary statistics type] ○ Statistics used in the estimation and data available years Statistics 2003 2004 2005 2006 2007RIAJ Year Book ✓ ✓ ✓ ✓ ✓ Financial statement report of record companies ✓ ✓ ✓ ✓ ✓
○ Estimation of Value of products [Formula] Value of products
[Formula] Value of products = Value of products (Audio records) a + Value of products (Audio and visual records) b
a Value of products(Audio records) [Value of products (Audio record)] in the "RIAJ Year Book"
b Value of products(CD derivative audio) [Value of products (CD derivative audio)] in the "RIAJ Year Book"
○ Estimation of Value-added
Value-added was estimated by applying the Value-added rate (i.e., share of the value of products occupied by value-added in the record companies) based on financial statement reports. [Formula] Value-added = Value of products×Value-added rate ・Value of products
[Value of products] obtained by Estimation of Value of products ・Value-added rate [Formula] Value-added rate = Σ(Value-added of each company A) / Σ(Value of
products of each company B) A Value-added of each company
[Formula] Value-added = Compensation of Employees a + Operating surplus b + Depreciation expenses c + Indirect taxes d
a Compensation of Employees [Employment cost]+[Labor cost] in the "Income statements"
b Operating surplus [Operating profit] in the "P/L statements"
56
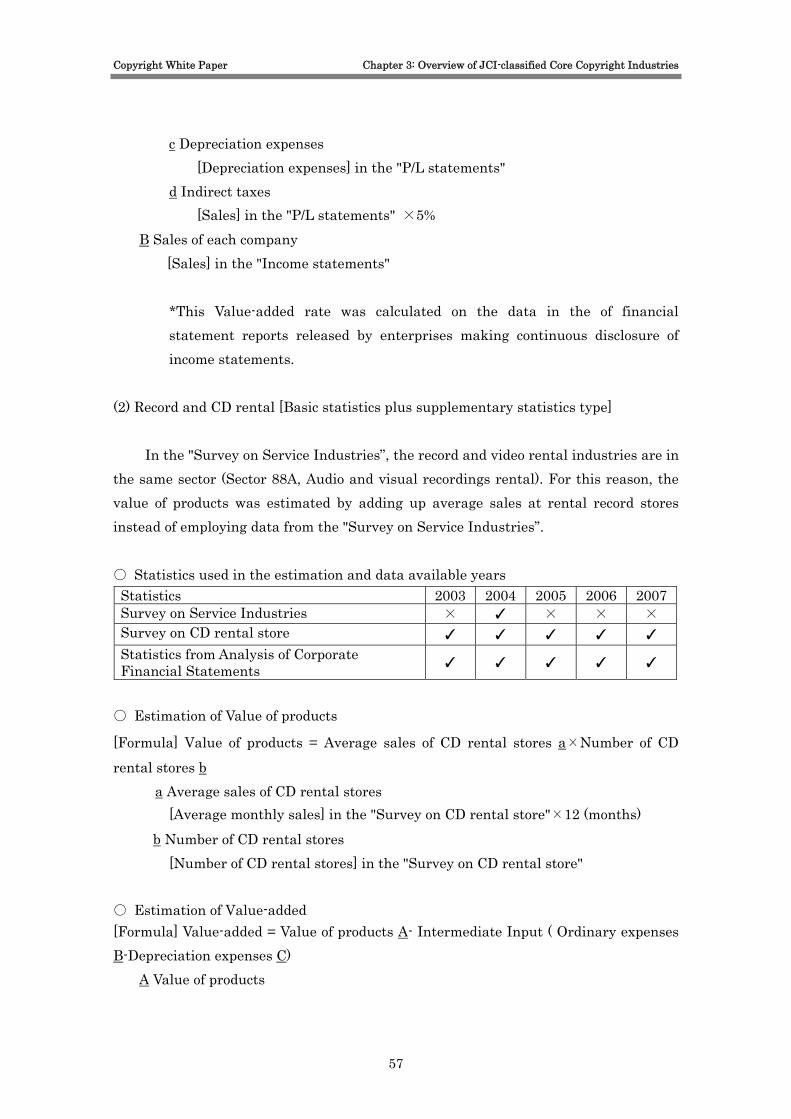
Copyright White Paper Chapter 3: Overview of JCI-classified Core Copyright Industries
c Depreciation expenses [Depreciation expenses] in the "P/L statements"
d Indirect taxes [Sales] in the "P/L statements" ×5%
B Sales of each company [Sales] in the "Income statements" *This Value-added rate was calculated on the data in the of financial statement reports released by enterprises making continuous disclosure of income statements.
(2) Record and CD rental [Basic statistics plus supplementary statistics type]
In the "Survey on Service Industries”, the record and video rental industries are in the same sector (Sector 88A, Audio and visual recordings rental). For this reason, the value of products was estimated by adding up average sales at rental record stores instead of employing data from the "Survey on Service Industries”. ○ Statistics used in the estimation and data available years Statistics 2003 2004 2005 2006 2007Survey on Service Industries × ✓ × × × Survey on CD rental store ✓ ✓ ✓ ✓ ✓ Statistics from Analysis of Corporate Financial Statements ✓ ✓ ✓ ✓ ✓
○ Estimation of Value of products
[Formula] Value of products = Average sales of CD rental stores a×Number of CD rental stores b
a Average sales of CD rental stores [Average monthly sales] in the "Survey on CD rental store"×12 (months)
b Number of CD rental stores [Number of CD rental stores] in the "Survey on CD rental store"
○ Estimation of Value-added [Formula] Value-added = Value of products A- Intermediate Input ( Ordinary expenses B-Depreciation expenses C)
A Value of products
57

Copyright White Paper Chapter 3: Overview of JCI-classified Core Copyright Industries
[Incomes] in Sector 88A(Audio and visual recordings rental) in the "Survey on Service industries"
B Total expenses [Ordinary expenses] in Sector 88A(Audio and visual recordings rental) in the "Survey on Service industries"
C Depreciation expenses [Formula] Depreciation expenses = Value of products a×Ratio of depreciation expenses b
a Value of products [Value of products] obtained by Estimation of Value of products b Depreciation expenses rate
[Ratio of depreciation expenses] in Sector 749 (miscellaneous goods rental and leasing) in the "Statistics from Analysis of Corporate Financial Statements"
(3) Music Publishing [Supplementary statistics type]
The income of music publishing enterprises consists of the master rights royalty, secondary use fees for broadcasting, the remuneration for commercial rental, and compensation for private recording. As compensation for copyright management, a copyright royalty is received from the Japanese Society for Rights of Authors, Composers and Publishers (JASRAC). The sum of this income, i.e., the income paid to music publishing enterprises as a whole, was taken as the scale of the industry in this class. ○ Statistics used in the estimation and data available years Statistics 2003 2004 2005 2006 2007RIAJ Year Book ✓ ✓ ✓ ✓ ✓ Data provided by JASRAC* ✓ ✓ ✓ ✓ ✓ Data provided by MPA* ✓ ✓ ✓ ✓ ✓ Financial statement report of music publishing Companies ✓ ✓ ✓ ✓ ✓
* JASRAC (Japanese Society for Rights of Authors, Composers and Publishers) * MPA (Music Publishers Association of Japan)
58
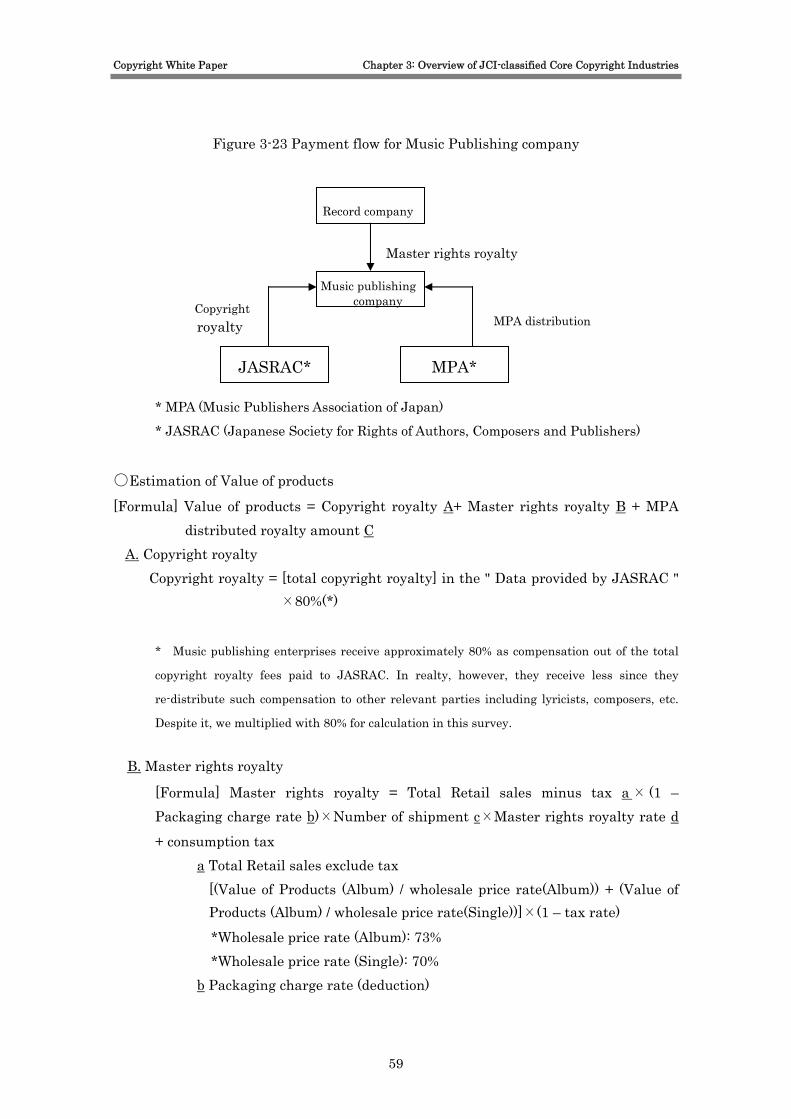
Copyright White Paper Chapter 3: Overview of JCI-classified Core Copyright Industries
Figure 3-23 Payment flow for Music Publishing company
R yecord compan
* MPA (Music Publishers Association of Japan)
* JASRAC (Japanese Society for Rights of Authors, Composers and Publishers)
○Estimation of Value of products
[Formula] Value of products = Copyright royalty A+ Master rights royalty B + MPA distributed royalty amount C
A. Copyright royalty Copyright royalty = [total copyright royalty] in the " Data provided by JASRAC "
×80%(*)
* Music publishing enterprises receive approximately 80% as compensation out of the total
copyright royalty fees paid to JASRAC. In realty, however, they receive less since they
re-distribute such compensation to other relevant parties including lyricists, composers, etc.
Despite it, we multiplied with 80% for calculation in this survey.
B. Master rights royalty
[Formula] Master rights royalty = Total Retail sales minus tax a × (1 – Packaging charge rate b)×Number of shipment c×Master rights royalty rate d + consumption tax
a Total Retail sales exclude tax [(Value of Products (Album) / wholesale price rate(Album)) + (Value of Products (Album) / wholesale price rate(Single))]×(1 – tax rate) *Wholesale price rate (Album): 73% *Wholesale price rate (Single): 70%
b Packaging charge rate (deduction)
MPA* JASRAC*
Master rights royalty
MPA distribution Copyright
Music publishing company
royalty
panyRecord com
59
Copyright White Paper Chapter 3: Overview of JCI-classified Core Copyright Industries
10% of Retail price c Rate of concerned shipment
We assumed 80% in this survey. d Master rights royalty rate
The range of the rate is from 12% to 15%. We assumed 12% in this survey.
C. MPA distributed royalty amount
The MPA provided the value for that subtotal of the amount received from the Recording Industry Association of Japan (RIAJ) that was distributed to music publishers.
○ Estimation of Value-added
Value-added was estimated by applying the Value-added rate (i.e., share of the value of products occupied by value-added in the music publishing companies) based on financial statement reports. [Formula] Value-added = Value of products×Value-added rate ・Value of products
[Value of products] obtained by Estimation of Value of products ・Value-added rate [Formula] Value-added rate = Σ[Value-added(each company A)] / Σ[Incomes(each
company B)] A Value-added (each company)
[Formula] Value-added = Compensation of Employees a + Operating surplus b + Depreciation expenses c + Indirect taxes d
a Compensation of Employees [Employment cost]+[Labor cost] in the "P/L statements"
b Operating surplus [Operating profit] in the "P/L statements"
c Depreciation expenses [Depreciation expenses] in the "P/L statements"
d Indirect taxes [Incomes] in the "Income statements"×5 %
B Sales (each company) [Sales] in the "P/L statements"
60

Copyright White Paper Chapter 3: Overview of JCI-classified Core Copyright Industries
*This Value-added rate was calculated on the data in the financial statement reports released by enterprises making continuous disclosure of income statements.
61
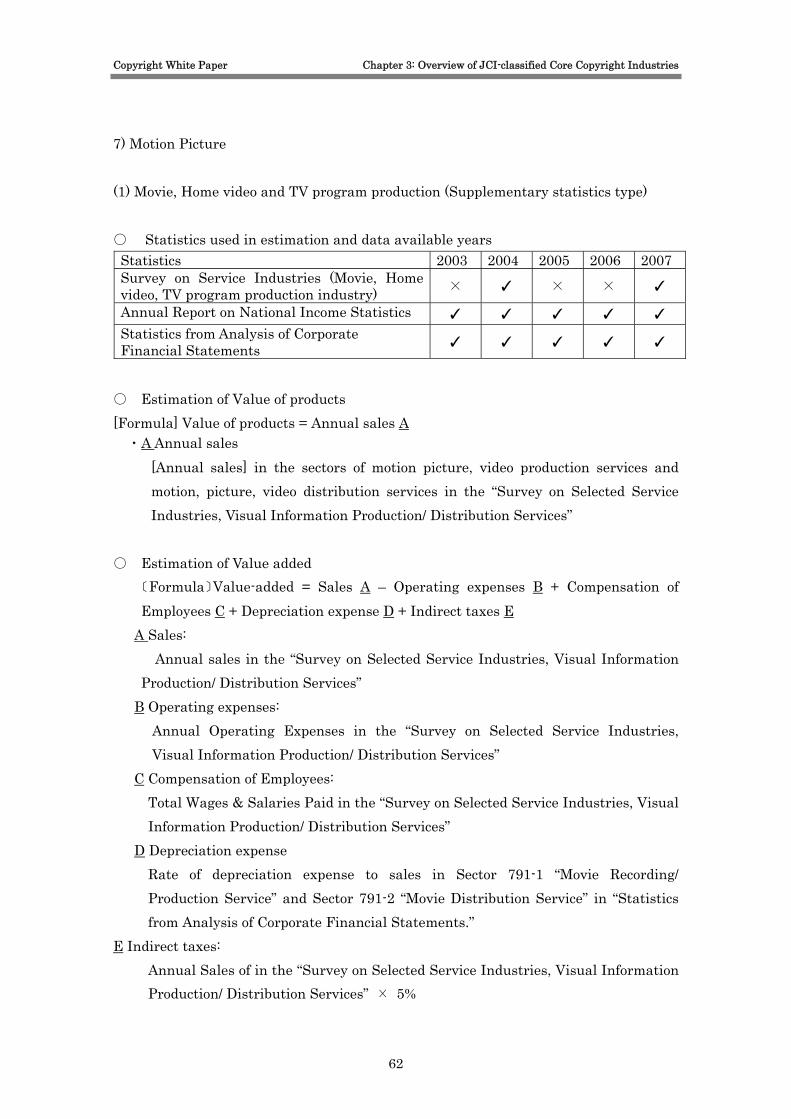
Copyright White Paper Chapter 3: Overview of JCI-classified Core Copyright Industries
7) Motion Picture (1) Movie, Home video and TV program production (Supplementary statistics type) ○ Statistics used in estimation and data available years Statistics 2003 2004 2005 2006 2007 Survey on Service Industries (Movie, Home video, TV program production industry) × ✓ × × ✓
Annual Report on National Income Statistics ✓ ✓ ✓ ✓ ✓ Statistics from Analysis of Corporate Financial Statements ✓ ✓ ✓ ✓ ✓
○ Estimation of Value of products [Formula] Value of products = Annual sales A
・A Annual sales [Annual sales] in the sectors of motion picture, video production services and motion, picture, video distribution services in the “Survey on Selected Service Industries, Visual Information Production/ Distribution Services”
○ Estimation of Value added
〔Formula〕Value-added = Sales A – Operating expenses B + Compensation of Employees C + Depreciation expense D + Indirect taxes E
A Sales: Annual sales in the “Survey on Selected Service Industries, Visual Information Production/ Distribution Services”
B Operating expenses: Annual Operating Expenses in the “Survey on Selected Service Industries, Visual Information Production/ Distribution Services”
C Compensation of Employees: Total Wages & Salaries Paid in the “Survey on Selected Service Industries, Visual
Information Production/ Distribution Services” D Depreciation expense Rate of depreciation expense to sales in Sector 791-1 “Movie Recording/
Production Service” and Sector 791-2 “Movie Distribution Service” in “Statistics from Analysis of Corporate Financial Statements.”
E Indirect taxes: Annual Sales of in the “Survey on Selected Service Industries, Visual Information Production/ Distribution Services” × 5%
62

Copyright White Paper Chapter 3: Overview of JCI-classified Core Copyright Industries
○ Compensation for statistical data
“Survey of Selected Service Industries, Visual Information Production/ Distribution Services” is conducted and published every three years. The recent years in which the surveys were conducted were fiscal years of 1998, 2001, and 2004, and 2007. For unavailable data, the figures in the surveys are used to make estimation by means of linear compensation. Figure 3-24 Annual Sales of Visual Information Production/ Distribution Services and
the rate of change over the previous year 2003 2004 2005 2006 2007
Annual Sales (in million yen) 552,901 563,011 560,508 558,016 555,535
Year-on-year change(%) 101.8% 101.8% 99.6% 99.6% 99.6%
Source: Survey of Selected Service Industries, Visual Information Production/ Distribution Service Industry
These figures were used for a calculation of the value of products and value-added
in fiscal 2005, for example, by means of the formulas noted below. This was also done for other fiscal years for which data were not available.
[Formula] Value of products(2005)=Value of products(2004)×Rate of change [Formula] Value-added(2005)=Value-added(2004)×Rate of change (2) Video rental (Combined type)
In the "Survey on Service Industries”, the record and video rental industries are in the same Sector 88A (audio and visual recordings rental). The value of products in the video rental industry was therefore estimated by subtracting the value of products in the record rental industry from the total in Sector 88A. Value-added was estimated by applying the share of the total value of products occupied by value-added in Sector 88A, because the record rental and video rental industries have an analogous cost structure.
63
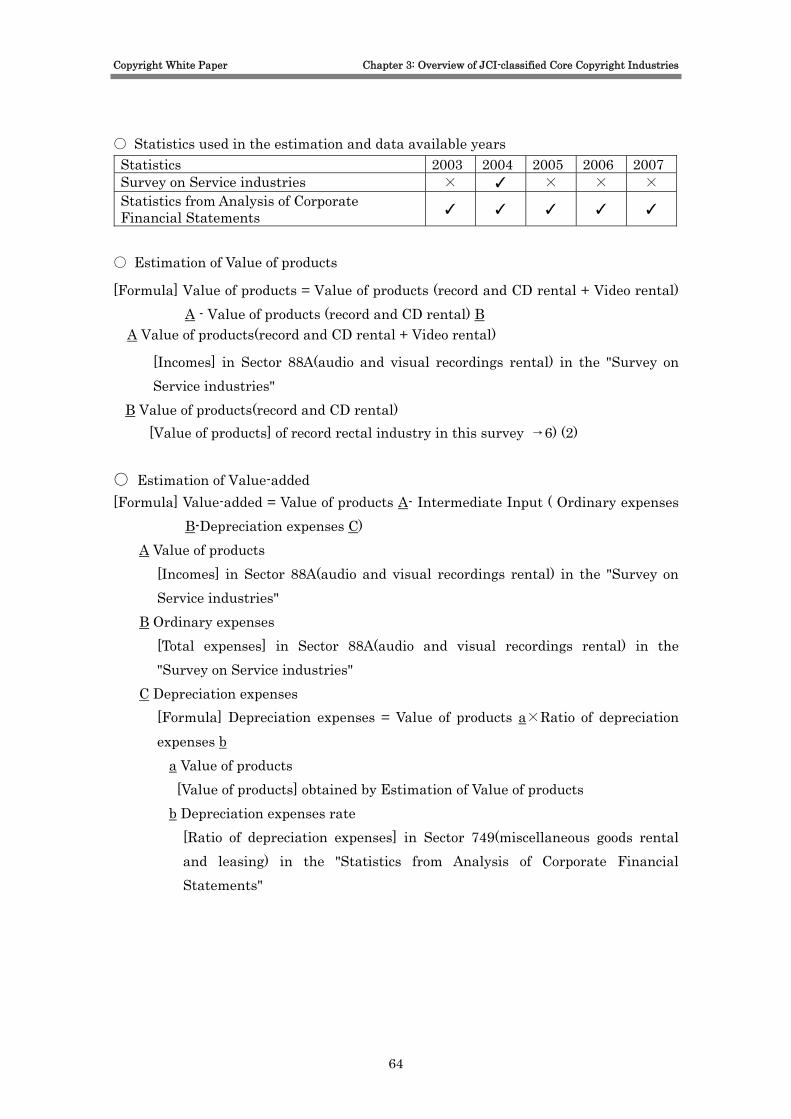
Copyright White Paper Chapter 3: Overview of JCI-classified Core Copyright Industries
○ Statistics used in the estimation and data available years Statistics 2003 2004 2005 2006 2007 Survey on Service industries × ✓ × × × Statistics from Analysis of Corporate Financial Statements ✓ ✓ ✓ ✓ ✓
○ Estimation of Value of products
[Formula] Value of products = Value of products (record and CD rental + Video rental) A - Value of products (record and CD rental) B
A Value of products(record and CD rental + Video rental)
[Incomes] in Sector 88A(audio and visual recordings rental) in the "Survey on Service industries"
B Value of products(record and CD rental) [Value of products] of record rectal industry in this survey →6) (2)
○ Estimation of Value-added [Formula] Value-added = Value of products A- Intermediate Input ( Ordinary expenses
B-Depreciation expenses C) A Value of products
[Incomes] in Sector 88A(audio and visual recordings rental) in the "Survey on Service industries"
B Ordinary expenses [Total expenses] in Sector 88A(audio and visual recordings rental) in the "Survey on Service industries"
C Depreciation expenses [Formula] Depreciation expenses = Value of products a×Ratio of depreciation expenses b
a Value of products [Value of products] obtained by Estimation of Value of products b Depreciation expenses rate
[Ratio of depreciation expenses] in Sector 749(miscellaneous goods rental and leasing) in the "Statistics from Analysis of Corporate Financial Statements"
64
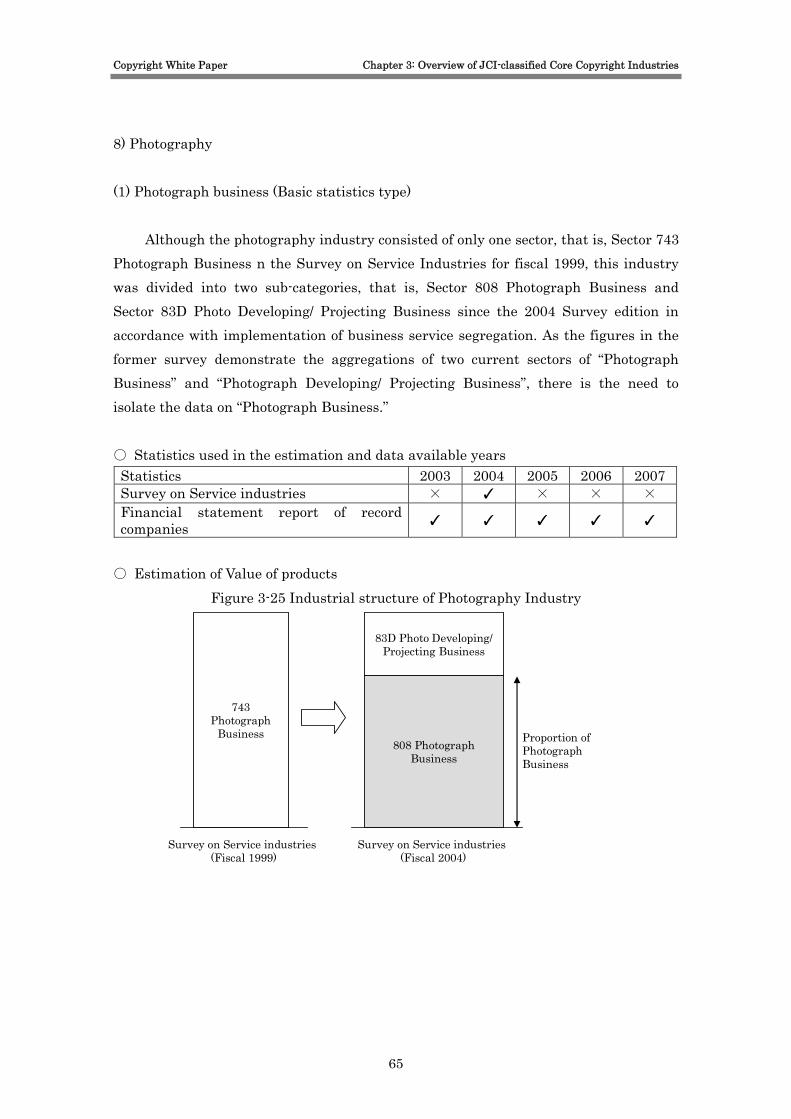
Copyright White Paper Chapter 3: Overview of JCI-classified Core Copyright Industries
8) Photography (1) Photograph business (Basic statistics type)
Although the photography industry consisted of only one sector, that is, Sector 743 Photograph Business n the Survey on Service Industries for fiscal 1999, this industry was divided into two sub-categories, that is, Sector 808 Photograph Business and Sector 83D Photo Developing/ Projecting Business since the 2004 Survey edition in accordance with implementation of business service segregation. As the figures in the former survey demonstrate the aggregations of two current sectors of “Photograph Business” and “Photograph Developing/ Projecting Business”, there is the need to isolate the data on “Photograph Business.” ○ Statistics used in the estimation and data available years Statistics 2003 2004 2005 2006 2007Survey on Service industries × ✓ × × × Financial statement report of record companies ✓ ✓ ✓ ✓ ✓
○ Estimation of Value of products
Figure 3-25 Industrial structure of Photography Industry
83D Photo Developing/ Projecting Business
808 Photograph Business
Proportion of Photograph Business
743Photograph
Business
Survey on Service industries(Fiscal 1999)
Survey on Service industries(Fiscal 2004)
65
Copyright White Paper Chapter 3: Overview of JCI-classified Core Copyright Industries
・Fiscal 1999 [Formula] Value of products = Income A × Proportion of Photograph Business B
A Incomes: [Incomes] of Sector 743 Photograph Business in the “Survey on Service Industries”
B Proportion of Photograph Business in the industry: [Formula] Proportion of Photograph Business = Value of products in “Photograph Business” a / (a + Value of products in Photo Developing/ Projecting Business b) a Incomes of Sector 808 Photograph Business in the Survey on Service
Industries (fiscal 2004) b Income of Sector 83D Photograph Developing/Projecting Business in the
Survey on Service Industries (fiscal 2004) ・Fiscal 2004 [Formula] Value of products = Income A
A: Incomes [Incomes] of Sector 808 Photograph Business in the “Survey on Service Industries”
○ Estimation of Value-added [Formula] Value-added = Value of products×Value-added rate ・Value of products
[Value of products] obtained by Estimation of Value of products ・Value-added rate [Formula] Value-added rate = Value-added rate / Value of products Value-added: 〔Formula〕Value-added = Value of products A – Intermediate input (Ordinary
expenses B – Depreciation expenses C) A Value-added:
[Income] in Sector 808 Photograph Business in the Survey on Service Industries B Ordinary expenses 〔Ordinary expenses〕in Sector 808 Photograph Business in the Survey on
Service Industries C Depreciation expenses
[Formula] Depreciation expenses = Value of products a × Rate of Depreciation b
66
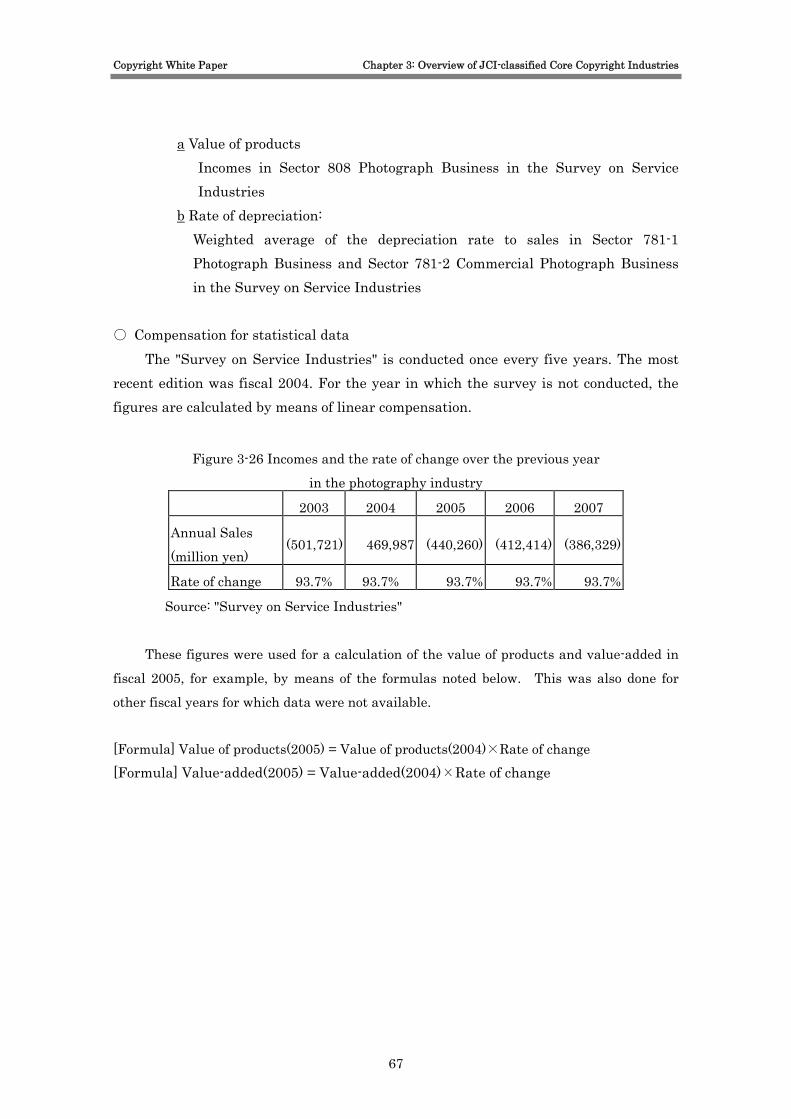
Copyright White Paper Chapter 3: Overview of JCI-classified Core Copyright Industries
a Value of products Incomes in Sector 808 Photograph Business in the Survey on Service Industries
b Rate of depreciation: Weighted average of the depreciation rate to sales in Sector 781-1
Photograph Business and Sector 781-2 Commercial Photograph Business in the Survey on Service Industries
○ Compensation for statistical data
The "Survey on Service Industries" is conducted once every five years. The most recent edition was fiscal 2004. For the year in which the survey is not conducted, the figures are calculated by means of linear compensation.
Figure 3-26 Incomes and the rate of change over the previous year
in the photography industry
2003 2004 2005 2006 2007
Annual Sales
(million yen) (501,721) 469,987 (440,260) (412,414) (386,329)
Rate of change 93.7% 93.7% 93.7% 93.7% 93.7%
Source: "Survey on Service Industries"
These figures were used for a calculation of the value of products and value-added in
fiscal 2005, for example, by means of the formulas noted below. This was also done for
other fiscal years for which data were not available.
[Formula] Value of products(2005) = Value of products(2004)×Rate of change [Formula] Value-added(2005) = Value-added(2004)×Rate of change
67
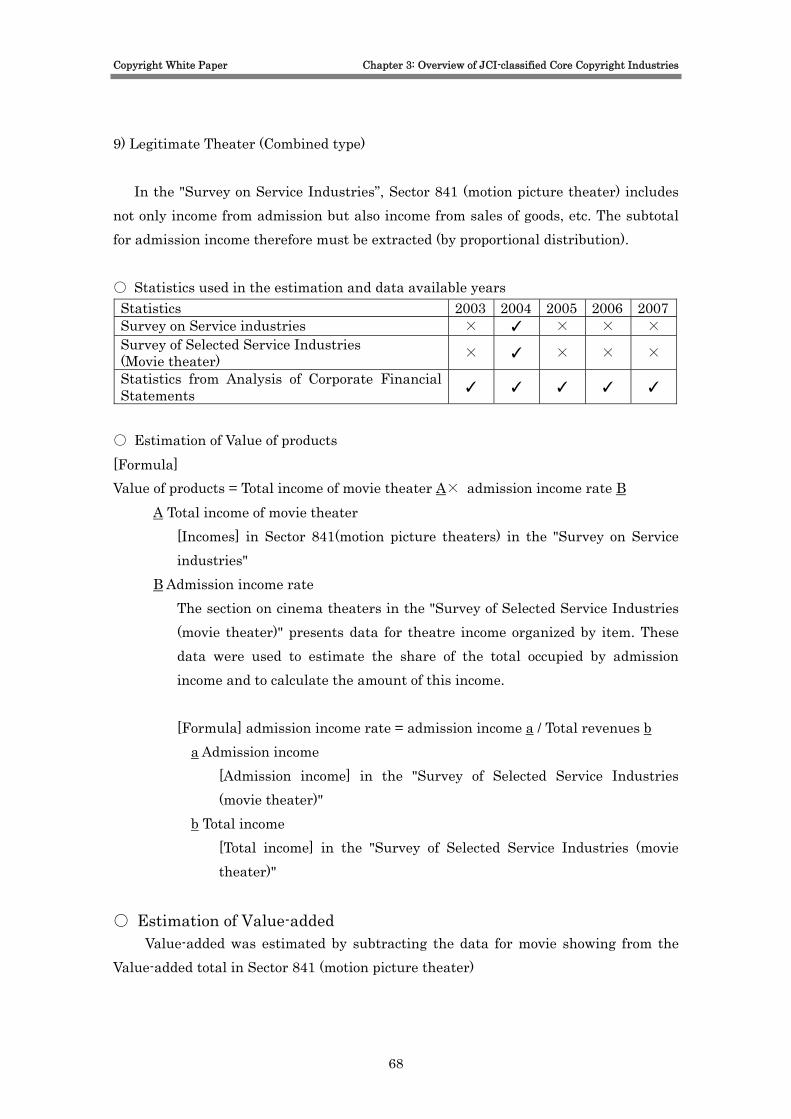
Copyright White Paper Chapter 3: Overview of JCI-classified Core Copyright Industries
9) Legitimate Theater (Combined type)
In the "Survey on Service Industries”, Sector 841 (motion picture theater) includes not only income from admission but also income from sales of goods, etc. The subtotal for admission income therefore must be extracted (by proportional distribution). ○ Statistics used in the estimation and data available years Statistics 2003 2004 2005 2006 2007Survey on Service industries × ✓ × × × Survey of Selected Service Industries (Movie theater) × ✓ × × ×
Statistics from Analysis of Corporate Financial Statements ✓ ✓ ✓ ✓ ✓
○ Estimation of Value of products [Formula] Value of products = Total income of movie theater A× admission income rate B
A Total income of movie theater [Incomes] in Sector 841(motion picture theaters) in the "Survey on Service industries"
B Admission income rate The section on cinema theaters in the "Survey of Selected Service Industries (movie theater)" presents data for theatre income organized by item. These data were used to estimate the share of the total occupied by admission income and to calculate the amount of this income. [Formula] admission income rate = admission income a / Total revenues b
a Admission income [Admission income] in the "Survey of Selected Service Industries (movie theater)"
b Total income [Total income] in the "Survey of Selected Service Industries (movie theater)"
○ Estimation of Value-added
Value-added was estimated by subtracting the data for movie showing from the Value-added total in Sector 841 (motion picture theater)
68
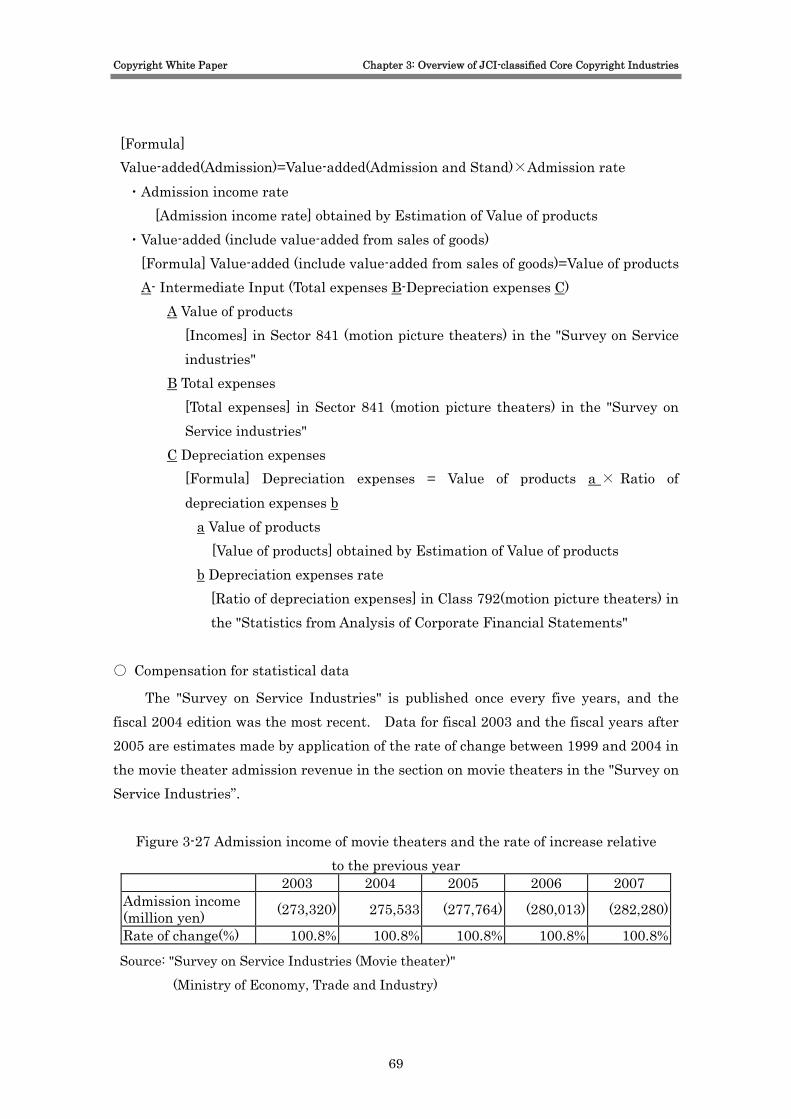
Copyright White Paper Chapter 3: Overview of JCI-classified Core Copyright Industries
[Formula] Value-added(Admission)=Value-added(Admission and Stand)×Admission rate ・Admission income rate
[Admission income rate] obtained by Estimation of Value of products ・Value-added (include value-added from sales of goods)
[Formula] Value-added (include value-added from sales of goods)=Value of products A- Intermediate Input (Total expenses B-Depreciation expenses C)
A Value of products [Incomes] in Sector 841 (motion picture theaters) in the "Survey on Service industries"
B Total expenses [Total expenses] in Sector 841 (motion picture theaters) in the "Survey on Service industries"
C Depreciation expenses [Formula] Depreciation expenses = Value of products a × Ratio of depreciation expenses b
a Value of products [Value of products] obtained by Estimation of Value of products
b Depreciation expenses rate [Ratio of depreciation expenses] in Class 792(motion picture theaters) in the "Statistics from Analysis of Corporate Financial Statements"
○ Compensation for statistical data
The "Survey on Service Industries" is published once every five years, and the fiscal 2004 edition was the most recent. Data for fiscal 2003 and the fiscal years after 2005 are estimates made by application of the rate of change between 1999 and 2004 in the movie theater admission revenue in the section on movie theaters in the "Survey on Service Industries”.
Figure 3-27 Admission income of movie theaters and the rate of increase relative to the previous year
2003 2004 2005 2006 2007 Admission income (million yen) (273,320) 275,533 (277,764) (280,013) (282,280)
Rate of change(%) 100.8% 100.8% 100.8% 100.8% 100.8%
Source: "Survey on Service Industries (Movie theater)"
(Ministry of Economy, Trade and Industry)
69
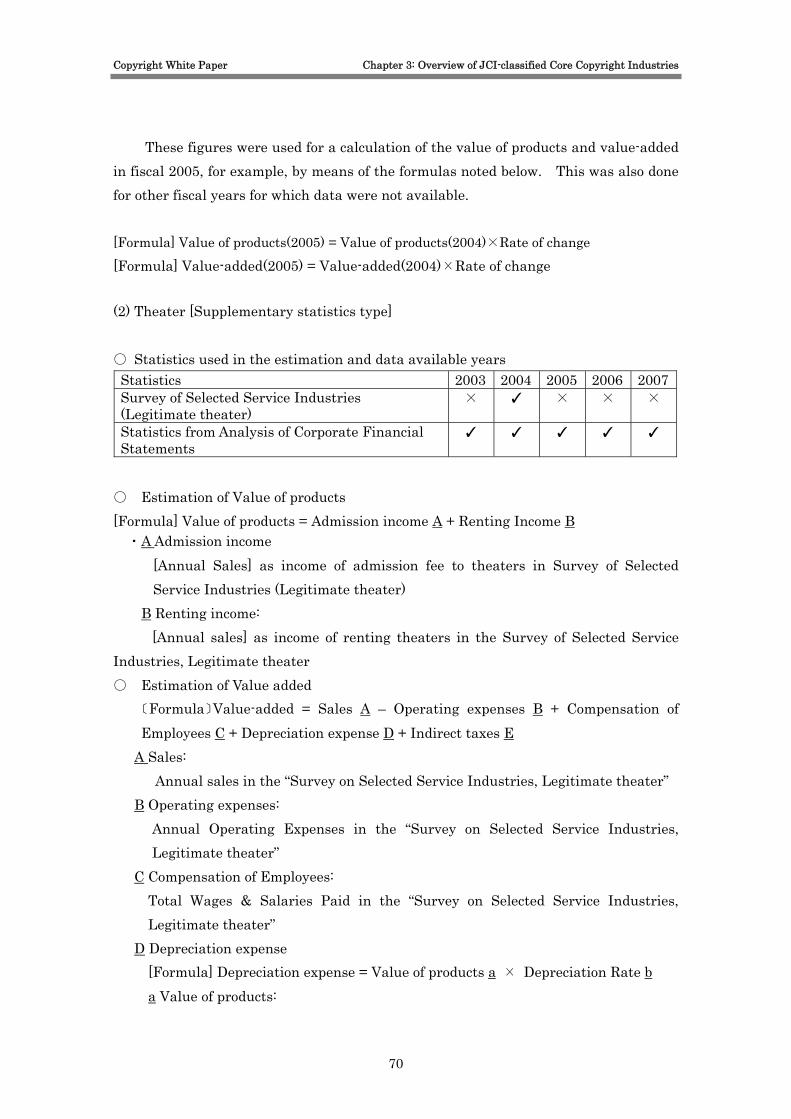
Copyright White Paper Chapter 3: Overview of JCI-classified Core Copyright Industries
These figures were used for a calculation of the value of products and value-added in fiscal 2005, for example, by means of the formulas noted below. This was also done for other fiscal years for which data were not available. [Formula] Value of products(2005) = Value of products(2004)×Rate of change [Formula] Value-added(2005) = Value-added(2004)×Rate of change (2) Theater [Supplementary statistics type] ○ Statistics used in the estimation and data available years Statistics 2003 2004 2005 2006 2007Survey of Selected Service Industries (Legitimate theater)
× ✓ × × ×
Statistics from Analysis of Corporate Financial Statements
✓ ✓ ✓ ✓ ✓
○ Estimation of Value of products [Formula] Value of products = Admission income A + Renting Income B
・A Admission income [Annual Sales] as income of admission fee to theaters in Survey of Selected Service Industries (Legitimate theater)
B Renting income: [Annual sales] as income of renting theaters in the Survey of Selected Service Industries, Legitimate theater ○ Estimation of Value added
〔Formula〕Value-added = Sales A – Operating expenses B + Compensation of Employees C + Depreciation expense D + Indirect taxes E
A Sales: Annual sales in the “Survey on Selected Service Industries, Legitimate theater”
B Operating expenses: Annual Operating Expenses in the “Survey on Selected Service Industries, Legitimate theater”
C Compensation of Employees: Total Wages & Salaries Paid in the “Survey on Selected Service Industries,
Legitimate theater” D Depreciation expense [Formula] Depreciation expense = Value of products a × Depreciation Rate b a Value of products:
70
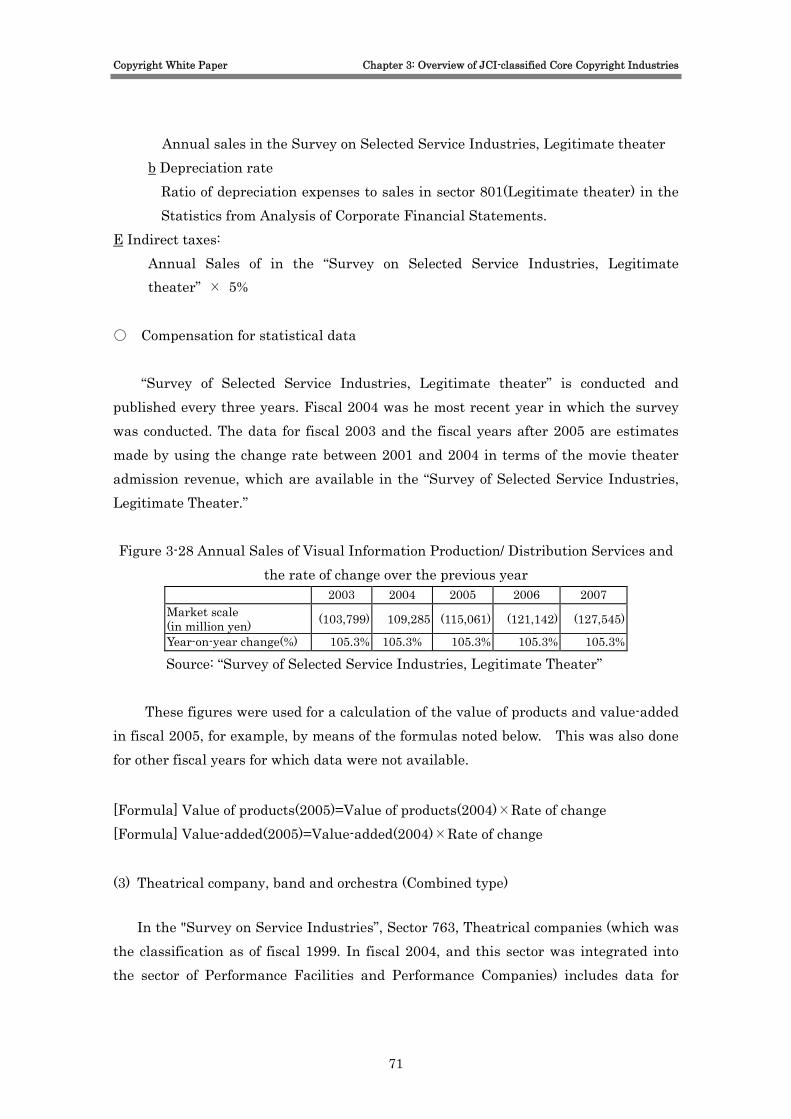
Copyright White Paper Chapter 3: Overview of JCI-classified Core Copyright Industries
Annual sales in the Survey on Selected Service Industries, Legitimate theater b Depreciation rate Ratio of depreciation expenses to sales in sector 801(Legitimate theater) in the
Statistics from Analysis of Corporate Financial Statements. E Indirect taxes:
Annual Sales of in the “Survey on Selected Service Industries, Legitimate theater” × 5%
○ Compensation for statistical data
“Survey of Selected Service Industries, Legitimate theater” is conducted and published every three years. Fiscal 2004 was he most recent year in which the survey was conducted. The data for fiscal 2003 and the fiscal years after 2005 are estimates made by using the change rate between 2001 and 2004 in terms of the movie theater admission revenue, which are available in the “Survey of Selected Service Industries, Legitimate Theater.” Figure 3-28 Annual Sales of Visual Information Production/ Distribution Services and
the rate of change over the previous year 2003 2004 2005 2006 2007
Market scale (in million yen) (103,799) 109,285 (115,061) (121,142) (127,545)
Year-on-year change(%) 105.3% 105.3% 105.3% 105.3% 105.3%
Source: “Survey of Selected Service Industries, Legitimate Theater”
These figures were used for a calculation of the value of products and value-added in fiscal 2005, for example, by means of the formulas noted below. This was also done for other fiscal years for which data were not available.
[Formula] Value of products(2005)=Value of products(2004)×Rate of change [Formula] Value-added(2005)=Value-added(2004)×Rate of change (3) Theatrical company, band and orchestra (Combined type)
In the "Survey on Service Industries”, Sector 763, Theatrical companies (which was the classification as of fiscal 1999. In fiscal 2004, and this sector was integrated into the sector of Performance Facilities and Performance Companies) includes data for
71

Copyright White Paper Chapter 3: Overview of JCI-classified Core Copyright Industries
groups entertaining through sports, etc., athletic as well as theatrical and musical companies. Data for theatrical company and band & orchestra are estimates made by using the share of “Theaters” in “Theaters and Performance Facilities.” ○ Statistics used in estimation and data available years Statistics 2003 2004 2005 2006 2007 Survey on Service Industries × ✓ × × × Annual Report on National Income Statistics ✓ ✓ ✓ ✓ ✓
○ Estimation of Value of products
Figure 3-29 Industrial Structure Surrounding “Theatrical Companies and Band & Orchestra” 762 Performance
Theaters & Performance Facilities (excluding those
indicated separately)
763 Theatrical companies
Dramatic companies, Orchestra
and dancing companies
Theatrical companies
Theatrical companies rate
Dramatic companies, Orchestra and dancing companiesrate
842 Performances (except otherwise classified), Theatrical companies
Survey on Service industries(Fiscal 1999)
Survey on Service industries(Fiscal 2004)
[Formula]Value of precuts = Value of products of all Theatrical Companies, Bands
& Orchestras, and Performance Companies A× Performance Company rate B×Theatrical Company, and Band & Orchestra rate C
A Value of products of Theatrical Companies, Band & Orchestra, and Performance Companies:
「Incomes」of Sector 763, Theatrical Companies in the[Survey on Service Industries]
B Performance Company rate : [Formula]Performance Company rate= Income of “Performance Companies” a
÷(a+ Income of “Performance Theatres & Performance Facilities (excluded those indicated separately)” b)
a Income of “Performance Companies” : [Incomes] of “Theatrical Companies” in the “Survey on Service Industries”
b Income of “Performance Theaters & Performance Facilities (excluding those indicated separately):
72
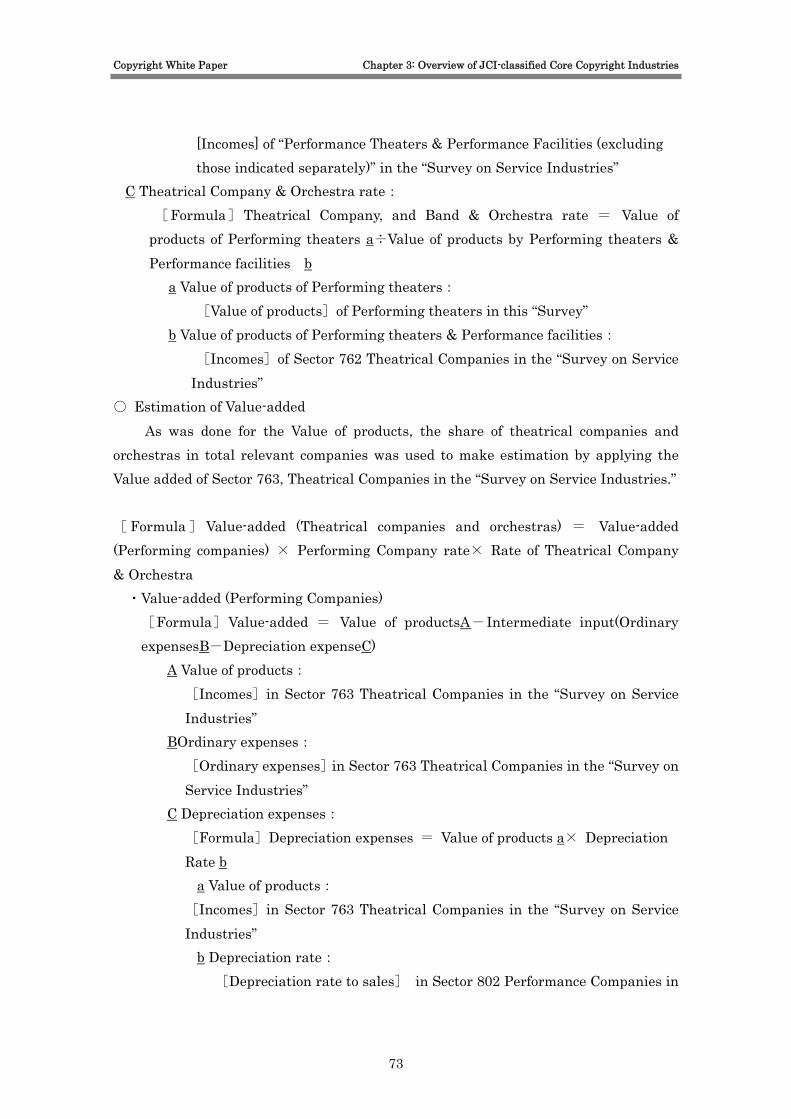
Copyright White Paper Chapter 3: Overview of JCI-classified Core Copyright Industries
[Incomes] of “Performance Theaters & Performance Facilities (excluding those indicated separately)” in the “Survey on Service Industries”
C Theatrical Company & Orchestra rate: [Formula]Theatrical Company, and Band & Orchestra rate = Value of
products of Performing theaters a÷Value of products by Performing theaters & Performance facilities b
a Value of products of Performing theaters: [Value of products]of Performing theaters in this “Survey”
b Value of products of Performing theaters & Performance facilities: [Incomes]of Sector 762 Theatrical Companies in the “Survey on Service
Industries” ○ Estimation of Value-added
As was done for the Value of products, the share of theatrical companies and orchestras in total relevant companies was used to make estimation by applying the Value added of Sector 763, Theatrical Companies in the “Survey on Service Industries.” [ Formula ] Value-added (Theatrical companies and orchestras) = Value-added (Performing companies) × Performing Company rate× Rate of Theatrical Company & Orchestra ・Value-added (Performing Companies) [Formula]Value-added = Value of productsA-Intermediate input(Ordinary expensesB-Depreciation expenseC)
A Value of products: [Incomes]in Sector 763 Theatrical Companies in the “Survey on Service Industries”
BOrdinary expenses: [Ordinary expenses]in Sector 763 Theatrical Companies in the “Survey on Service Industries”
C Depreciation expenses: [Formula]Depreciation expenses = Value of products a× Depreciation Rate b
a Value of products: [Incomes]in Sector 763 Theatrical Companies in the “Survey on Service Industries”
b Depreciation rate: [Depreciation rate to sales] in Sector 802 Performance Companies in
73

Copyright White Paper Chapter 3: Overview of JCI-classified Core Copyright Industries
the “Annual Report on National Income Statistics” ・Performance Company rate :
[Formula] Performance company rate = Income of “Performance Company” A ÷(A+ Income of “Theaters & Performance Facilities” (excluding those indicated separately) B
A Income of “Performance Companies”: [Incomes]of “Performance Companies” in the “Survey on Service Industries”
B Incomes of “Theaters & Performance Facilities (excluding those indicated separately):
[ Incomes]of “Theaters & Performance Facilities (excluding those indicated separately)
・Theatrical Company & Orchestra rate: [Formula]Theatrical Company & Orchestra rate = Theater rate = Value of Products (Theater) A÷ Value of products (Theaters & Performance Facilities”)B
A Value of products(Theaters): Value of products in (2) “Theater” above
BValue of products (Theater & Performance Facilities): [Incomes]of Performance Facilities in Sector 762, Theaters in the “Survey on Service Industries”
74

Copyright White Paper Chapter 3: Overview of JCI-classified Core Copyright Industries
10) Game Software (Supplementary Type) (1) Game Software [Basic statistics plus supplementary statistics type] ○ Statistics used in the estimation and data available years Statistics 2003 2004 2005 2006 2007CESA Game White Paper(CESA* 1) ✓ ✓ ✓ ✓ ✓ Survey on Amusement Industries (JAMMA, AOU, NSA *2) ✓ ✓ ✓ ✓ ✓
*1: CESA (Computer Entertainment Software Association) *2: JAMMA (Japan Amusement Machinery Manufacturers Association, AOU(All Nippon Amusement Machine Operators’ Union), NSA(Nihon Shopping Center Amusement Park Operators Association) ○ Estimation of Value of products [Formula] Value of products = Game software for home use A
+ Game software for business use B A Game software for home use
Game software for home use [Domestic]+[Exportation] in the "CESA Game White Paper"
B Game software for business use [Sales] of amusement machine for business use in "Survey on Amusement Industries"×Software rate a
a Software rate Sales in the game software industry consist of the sum of hardware and
software sales. Data for fiscal 1998 and succeeding years present subtotals for software sales. These data were used to calculate the share of the total occupied by software.
○ Estimation of Value-added
Value-added was estimated by applying the Value-added rate in Software Industry of this survey. [Formula] Value-added = Value of products A×Value-added rate B
A Value of products [Value of products] obtained by Estimation of Value of products
B Value-added rate
75

Copyright White Paper Chapter 3: Overview of JCI-classified Core Copyright Industries
[Formula] Value-added rate = Value-added (Software industry) a / Value of products (Software industry) b
a Value-added(Software industry) [Value-added] obtained by Estimation of Value of products ((2) 1) Software)
b Value of products(Software industry) [Value of products] obtained by Estimation of Value of products ((2) 1) Software)
76
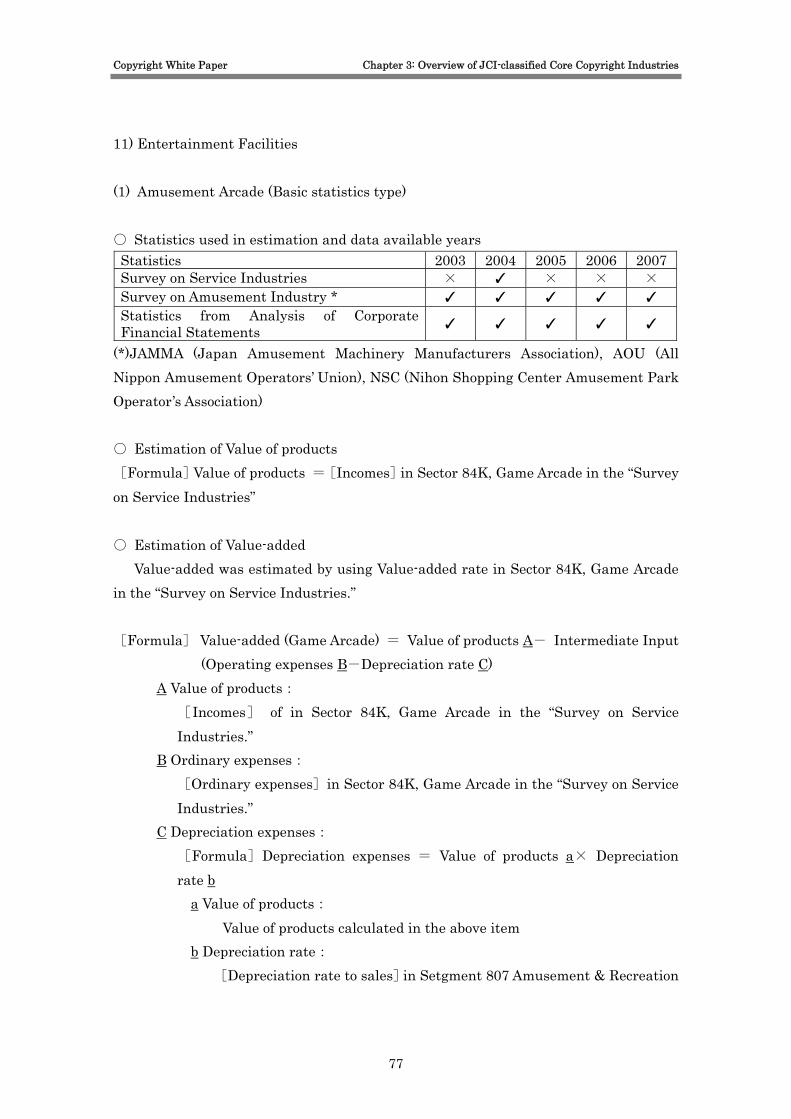
Copyright White Paper Chapter 3: Overview of JCI-classified Core Copyright Industries
11) Entertainment Facilities (1) Amusement Arcade (Basic statistics type) ○ Statistics used in estimation and data available years Statistics 2003 2004 2005 2006 2007Survey on Service Industries × ✓ × × × Survey on Amusement Industry * ✓ ✓ ✓ ✓ ✓ Statistics from Analysis of Corporate Financial Statements ✓ ✓ ✓ ✓ ✓
(*)JAMMA (Japan Amusement Machinery Manufacturers Association), AOU (All Nippon Amusement Operators’ Union), NSC (Nihon Shopping Center Amusement Park Operator’s Association) ○ Estimation of Value of products [Formula]Value of products =[Incomes]in Sector 84K, Game Arcade in the “Survey on Service Industries” ○ Estimation of Value-added
Value-added was estimated by using Value-added rate in Sector 84K, Game Arcade in the “Survey on Service Industries.” [Formula] Value-added (Game Arcade) = Value of products A- Intermediate Input
(Operating expenses B-Depreciation rate C) A Value of products:
[Incomes] of in Sector 84K, Game Arcade in the “Survey on Service Industries.”
B Ordinary expenses: [Ordinary expenses]in Sector 84K, Game Arcade in the “Survey on Service Industries.”
C Depreciation expenses: [Formula]Depreciation expenses = Value of products a× Depreciation rate b
a Value of products: Value of products calculated in the above item
b Depreciation rate: [Depreciation rate to sales]in Setgment 807 Amusement & Recreation
77

Copyright White Paper Chapter 3: Overview of JCI-classified Core Copyright Industries
Facilities in the “Statistics from Analysis of Corporate Financial Statements”
○ Compensation of for statistics data
The “Survey on Service Industries” is published once every five years, and the latest edition is for fiscal 2004. The survey on Section 84K, Game Arcade was implemented since fiscal 2004. As such, the data for fiscal 2003 and 2005 and preceding years were estimated by using the growth rate of sales on operation in the Survey on Amusement Industry.”
Figure 3-30 Sales on Operation and the rate of increase from the previous year 2003 2004 2005 2006 2007
Incomes (million yen) 637,700 649,200 682,500 702,900 678,100 Rate of change(%) 105.3% 101.8% 105.1% 103.0% 96.5% (Source)Survey on Amusement Industry (*)
(*)JAMMA (Japan Amusement Machinery Manufacturers Association), AOU (All Nippon Amusement Operators’ Union), NSC (Nihon Shopping Center Amusement Park Operator’s Association)
These figures were used for a calculation of the value of products and value-added in fiscal 2005, for example, by means of the formulas noted below. This was also done for other fiscal years for which data were not available. 〔Formula〕Value of products in 2005 = Value of products in 2004 × Rate of change 〔Formula〕Value added in 2005 = Value added in 2004 × Rate of change (2) Karaoke Box (Supplementary type) ○ Statistics used in estimation and data available years Statistics 2003 2004 2005 2006 2007Karaoke White Paper ✓ ✓ ✓ ✓ ✓ Statistics from Analysis of Corporate Financial Statements ✓ ✓ ✓ ✓ ✓
Financial Statement Report of Karaoke Box Company ✓ ✓ ✓ ✓ ✓
○ Estimation of Value of products
78
Copyright White Paper Chapter 3: Overview of JCI-classified Core Copyright Industries
[Formula]Value of products = [Karaoke Box market scale] in the user-market scale in the “Karaoke White Paper”
○ Estimation of Value-added
The Value-added was estimated by using the Value-added rate of Karaoke Industry, which was calculated with the data in financial statement of Karaoke Industry. [Formula]Value-added= Value of products × Value-added rate ・Value of products:
Value of products in Karaoke industry obtained in the above formula ・Value-added rate [Formula]Value-added rate=Σ{Value-added of each companyA}÷Σ{Value of
products of each companyB} A Value-added of each company:
[Formula]Value-added = Compensation of Employees a+Operating surplus b+ Depreciation expenses c+ Indirect tax d
a Compensation of Employees: [Employment expenses]+[Labor costs]in P/L statement
b Operating surplus: [Operating profit]in P/L Statement
c Depreciation expenses: [Depreciation expenses]in P/L statement
d Indirect tax: [Sales] in P/L statement ×5%
B Value of products of each company: [Sales] in P/L statement * “Value-added rate” by the above formula was calculated based on the data
in the financial statement report of company which has made continuous disclosure.
(3) Theme Park [Basic statistics plus supplementary statistics type]
In the "Survey on Service Industries”, theme parks are included in Sector 845 (public gardens and amusement parks). The value of products was based on the theme park data presented in the amusement and theme park section of the
79
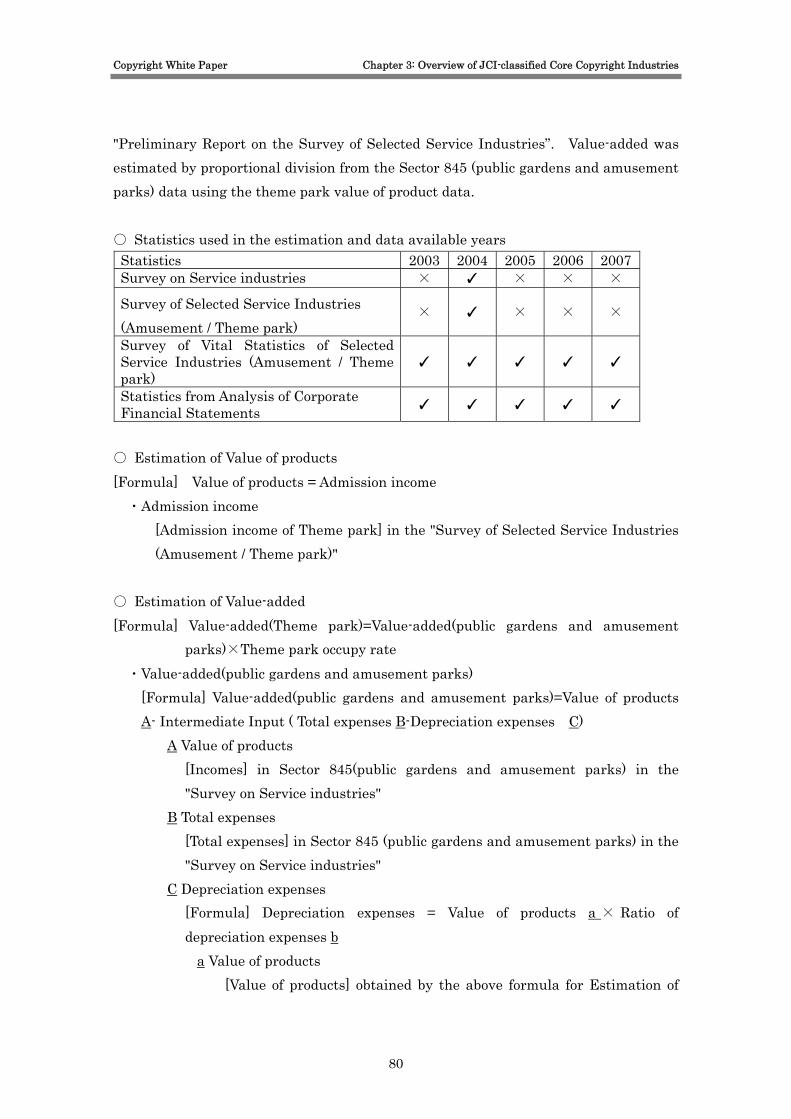
Copyright White Paper Chapter 3: Overview of JCI-classified Core Copyright Industries
"Preliminary Report on the Survey of Selected Service Industries”. Value-added was estimated by proportional division from the Sector 845 (public gardens and amusement parks) data using the theme park value of product data. ○ Statistics used in the estimation and data available years Statistics 2003 2004 2005 2006 2007 Survey on Service industries × ✓ × × ×
Survey of Selected Service Industries (Amusement / Theme park)
× ✓ × × ×
Survey of Vital Statistics of Selected Service Industries (Amusement / Theme park)
✓ ✓ ✓ ✓ ✓
Statistics from Analysis of Corporate Financial Statements ✓ ✓ ✓ ✓ ✓
○ Estimation of Value of products [Formula] Value of products = Admission income ・Admission income
[Admission income of Theme park] in the "Survey of Selected Service Industries (Amusement / Theme park)"
○ Estimation of Value-added [Formula] Value-added(Theme park)=Value-added(public gardens and amusement
parks)×Theme park occupy rate ・Value-added(public gardens and amusement parks)
[Formula] Value-added(public gardens and amusement parks)=Value of products A- Intermediate Input ( Total expenses B-Depreciation expenses C)
A Value of products [Incomes] in Sector 845(public gardens and amusement parks) in the "Survey on Service industries"
B Total expenses [Total expenses] in Sector 845 (public gardens and amusement parks) in the "Survey on Service industries"
C Depreciation expenses [Formula] Depreciation expenses = Value of products a × Ratio of depreciation expenses b
a Value of products [Value of products] obtained by the above formula for Estimation of
80
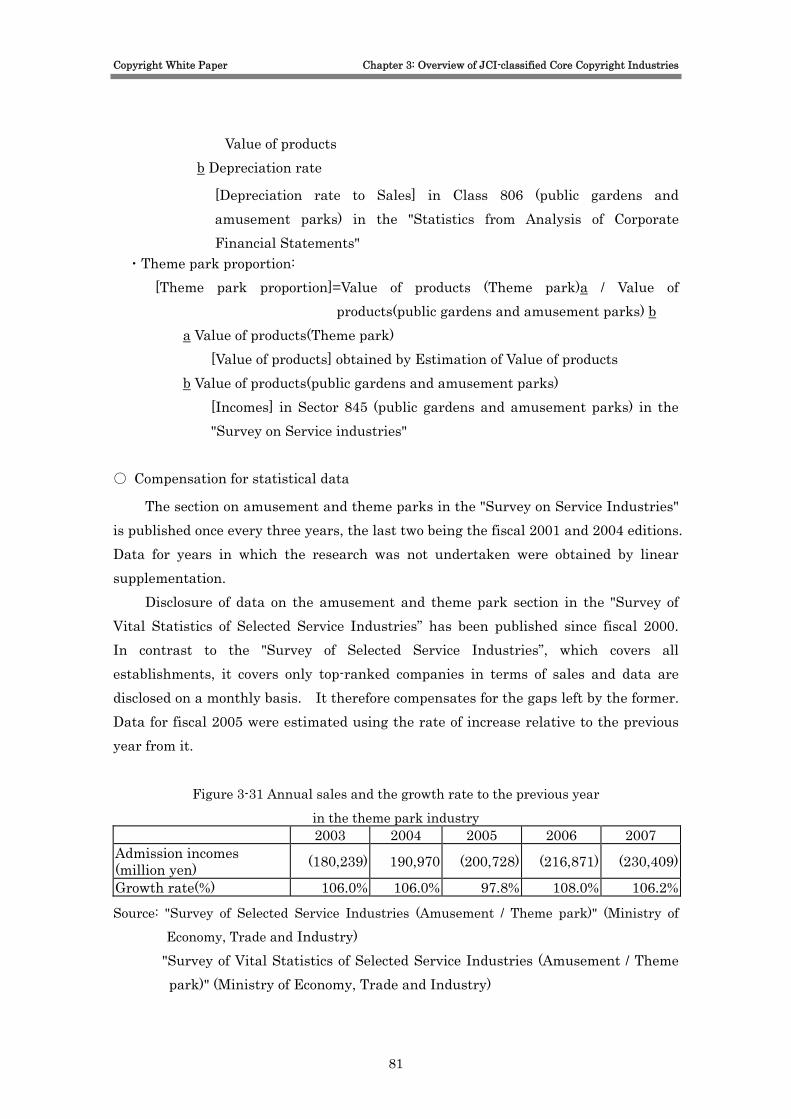
Copyright White Paper Chapter 3: Overview of JCI-classified Core Copyright Industries
Value of products b Depreciation rate
[Depreciation rate to Sales] in Class 806 (public gardens and amusement parks) in the "Statistics from Analysis of Corporate Financial Statements"
・Theme park proportion: [Theme park proportion]=Value of products (Theme park)a / Value of
products(public gardens and amusement parks) b a Value of products(Theme park)
[Value of products] obtained by Estimation of Value of products b Value of products(public gardens and amusement parks)
[Incomes] in Sector 845 (public gardens and amusement parks) in the "Survey on Service industries"
○ Compensation for statistical data
The section on amusement and theme parks in the "Survey on Service Industries" is published once every three years, the last two being the fiscal 2001 and 2004 editions. Data for years in which the research was not undertaken were obtained by linear supplementation.
Disclosure of data on the amusement and theme park section in the "Survey of Vital Statistics of Selected Service Industries” has been published since fiscal 2000. In contrast to the "Survey of Selected Service Industries”, which covers all establishments, it covers only top-ranked companies in terms of sales and data are disclosed on a monthly basis. It therefore compensates for the gaps left by the former. Data for fiscal 2005 were estimated using the rate of increase relative to the previous year from it.
Figure 3-31 Annual sales and the growth rate to the previous year
in the theme park industry 2003 2004 2005 2006 2007
Admission incomes (million yen) (180,239) 190,970 (200,728) (216,871) (230,409)
Growth rate(%) 106.0% 106.0% 97.8% 108.0% 106.2%
Source: "Survey of Selected Service Industries (Amusement / Theme park)" (Ministry of Economy, Trade and Industry)
"Survey of Vital Statistics of Selected Service Industries (Amusement / Theme park)" (Ministry of Economy, Trade and Industry)
81

Copyright White Paper Chapter 3: Overview of JCI-classified Core Copyright Industries
These figures were used for a calculation of the value of products and value-added in fiscal 2005, for example, by means of the formulas noted below. This was also done for other fiscal years for which data were not available.
[Formula] Value of products (2005) = value of products (2004) × Growth rate to previous year
[Formula] Value added (2005) = Value added (2004) × Growth rate to previous year
82

Copyright White Paper Chapter 3: Overview of JCI-classified Core Copyright Industries
12) Design (1) Design [Basic statistics type] ○ Statistics used in the estimation and data available years Statistics 2003 2004 2005 2006 2007Survey on Service industries × ✓ × × × Statistics from Analysis of Corporate Financial Statements ✓ ✓ ✓ ✓ ✓
○ Estimation of Value of products
[Formula] Value of products = Incomes ・Incomes
[Incomes] in Sector 80H (design service) in the "Survey on Service industries"
○ Estimation of Value-added [Formula] Value-added = Value of products A- Intermediate Input ( Total expenses B-Depreciation expenses C)
A Value of products [Incomes] in Sector 80H (design service) in the "Survey on Service industries"
B Total expenses [Total expenses] in Sector 80H (design service) in the "Survey on Service industries"
C Depreciation expenses [Formula] Depreciation expenses = Value of products a×Depreciation rate b
a Value of products [Value of products] obtained by Estimation of Value of products
b Depreciation rate
[Depreciation rate to Sales] in Class 851-2(advertising) in the "Statistics from Analysis of Corporate Financial Statements"
○ Compensation for statistical data
The "Survey of Selected Service Industries (Designing) " is published once every five years. The most recent edition was fiscal 2004. Data for years in which the survey was not implemented were estimated by linear compensation.
83
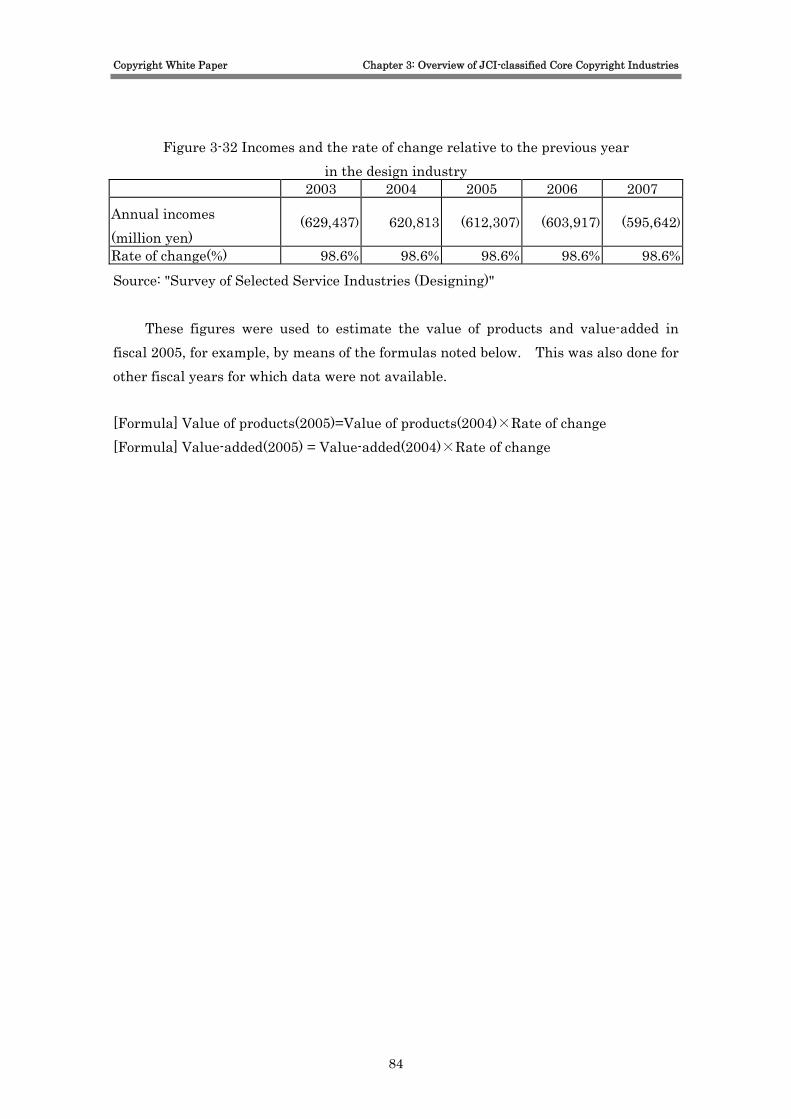
Copyright White Paper Chapter 3: Overview of JCI-classified Core Copyright Industries
Figure 3-32 Incomes and the rate of change relative to the previous year in the design industry
2003 2004 2005 2006 2007
Annual incomes (million yen)
(629,437) 620,813 (612,307) (603,917) (595,642)
Rate of change(%) 98.6% 98.6% 98.6% 98.6% 98.6%Source: "Survey of Selected Service Industries (Designing)"
These figures were used to estimate the value of products and value-added in fiscal 2005, for example, by means of the formulas noted below. This was also done for other fiscal years for which data were not available. [Formula] Value of products(2005)=Value of products(2004)×Rate of change [Formula] Value-added(2005) = Value-added(2004)×Rate of change
84
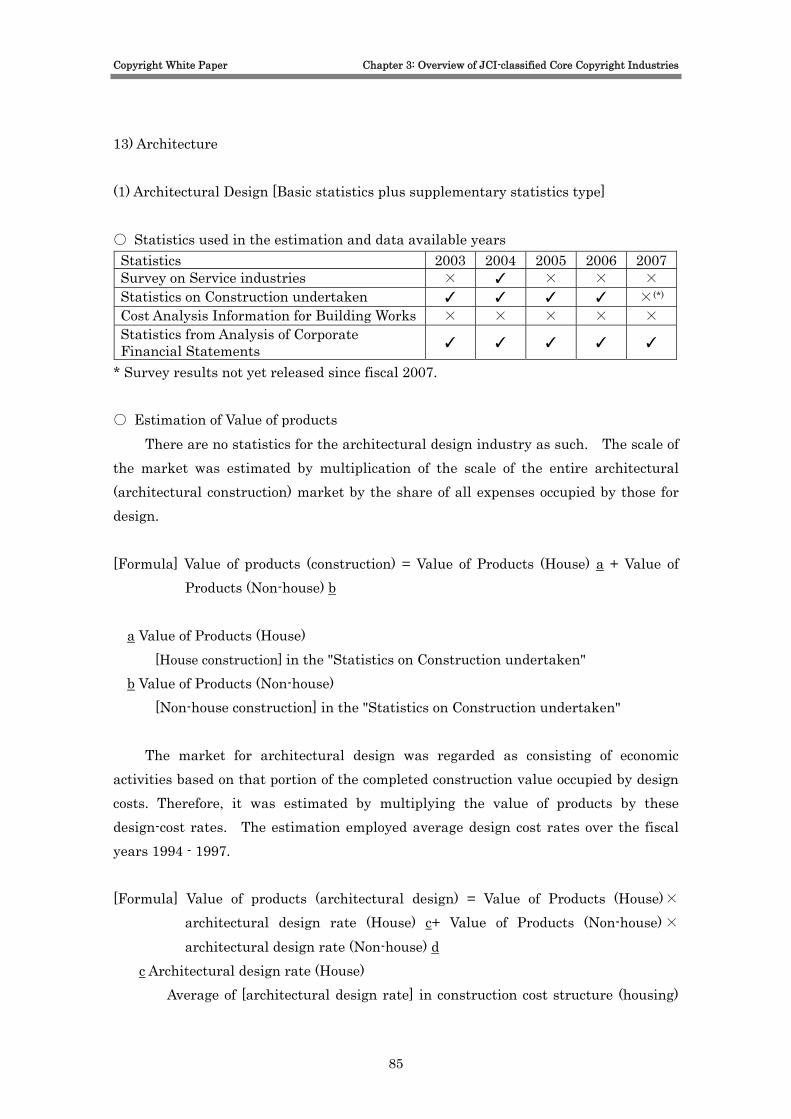
Copyright White Paper Chapter 3: Overview of JCI-classified Core Copyright Industries
13) Architecture (1) Architectural Design [Basic statistics plus supplementary statistics type] ○ Statistics used in the estimation and data available years Statistics 2003 2004 2005 2006 2007Survey on Service industries × ✓ × × × Statistics on Construction undertaken ✓ ✓ ✓ ✓ ×(*)
Cost Analysis Information for Building Works × × × × × Statistics from Analysis of Corporate Financial Statements ✓ ✓ ✓ ✓ ✓
* Survey results not yet released since fiscal 2007. ○ Estimation of Value of products
There are no statistics for the architectural design industry as such. The scale of the market was estimated by multiplication of the scale of the entire architectural (architectural construction) market by the share of all expenses occupied by those for design. [Formula] Value of products (construction) = Value of Products (House) a + Value of
Products (Non-house) b a Value of Products (House)
[House construction] in the "Statistics on Construction undertaken" b Value of Products (Non-house)
[Non-house construction] in the "Statistics on Construction undertaken"
The market for architectural design was regarded as consisting of economic activities based on that portion of the completed construction value occupied by design costs. Therefore, it was estimated by multiplying the value of products by these design-cost rates. The estimation employed average design cost rates over the fiscal years 1994 - 1997. [Formula] Value of products (architectural design) = Value of Products (House)×
architectural design rate (House) c+ Value of Products (Non-house)×architectural design rate (Non-house) d
c Architectural design rate (House) Average of [architectural design rate] in construction cost structure (housing)
85
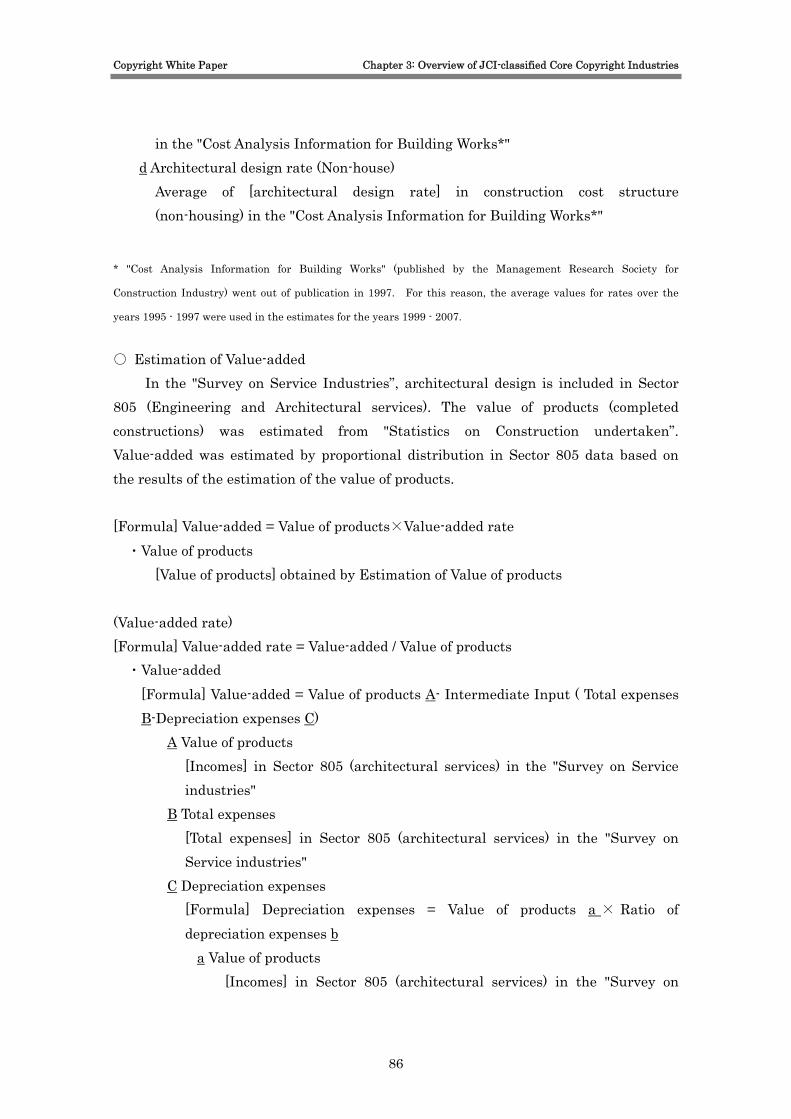
Copyright White Paper Chapter 3: Overview of JCI-classified Core Copyright Industries
in the "Cost Analysis Information for Building Works*" d Architectural design rate (Non-house)
Average of [architectural design rate] in construction cost structure (non-housing) in the "Cost Analysis Information for Building Works*"
* "Cost Analysis Information for Building Works" (published by the Management Research Society for
Construction Industry) went out of publication in 1997. For this reason, the average values for rates over the
years 1995 - 1997 were used in the estimates for the years 1999 - 2007.
○ Estimation of Value-added
In the "Survey on Service Industries”, architectural design is included in Sector 805 (Engineering and Architectural services). The value of products (completed constructions) was estimated from "Statistics on Construction undertaken”. Value-added was estimated by proportional distribution in Sector 805 data based on the results of the estimation of the value of products. [Formula] Value-added = Value of products×Value-added rate ・Value of products
[Value of products] obtained by Estimation of Value of products (Value-added rate) [Formula] Value-added rate = Value-added / Value of products ・Value-added
[Formula] Value-added = Value of products A- Intermediate Input ( Total expenses B-Depreciation expenses C)
A Value of products [Incomes] in Sector 805 (architectural services) in the "Survey on Service industries"
B Total expenses [Total expenses] in Sector 805 (architectural services) in the "Survey on Service industries"
C Depreciation expenses [Formula] Depreciation expenses = Value of products a × Ratio of depreciation expenses b
a Value of products [Incomes] in Sector 805 (architectural services) in the "Survey on
86
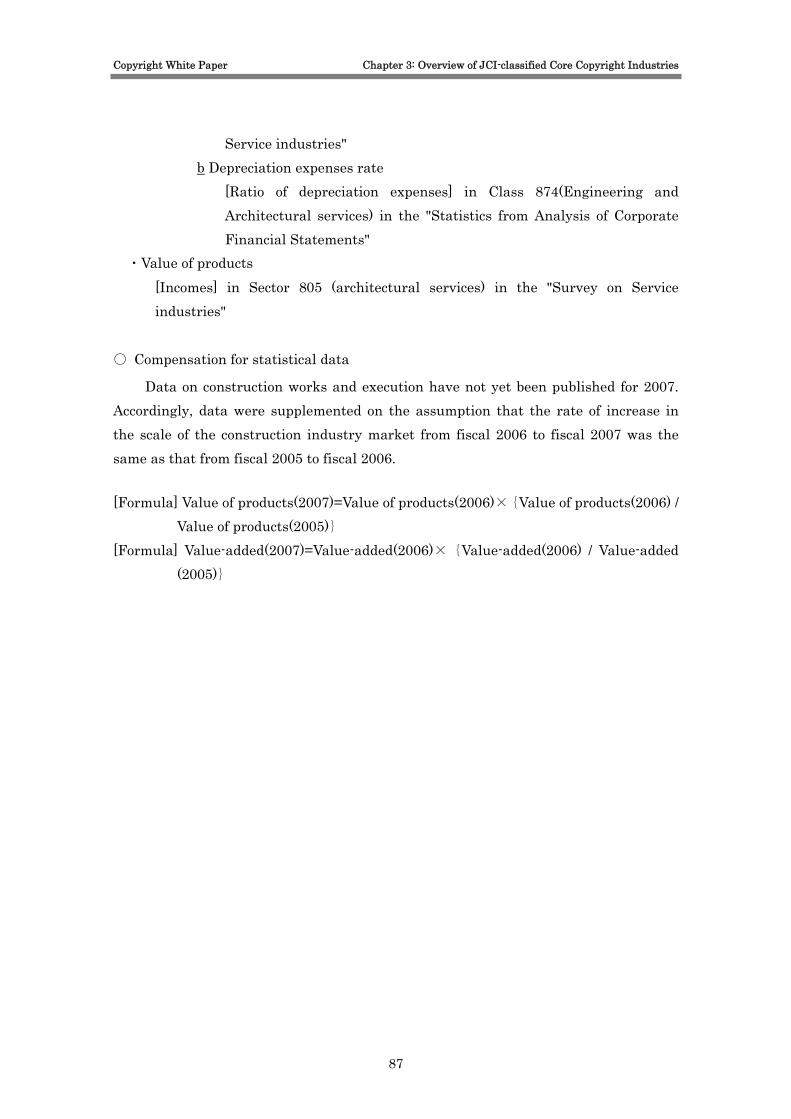
Copyright White Paper Chapter 3: Overview of JCI-classified Core Copyright Industries
Service industries" b Depreciation expenses rate
[Ratio of depreciation expenses] in Class 874(Engineering and Architectural services) in the "Statistics from Analysis of Corporate Financial Statements"
・Value of products [Incomes] in Sector 805 (architectural services) in the "Survey on Service industries"
○ Compensation for statistical data
Data on construction works and execution have not yet been published for 2007. Accordingly, data were supplemented on the assumption that the rate of increase in the scale of the construction industry market from fiscal 2006 to fiscal 2007 was the same as that from fiscal 2005 to fiscal 2006. [Formula] Value of products(2007)=Value of products(2006)×{Value of products(2006) /
Value of products(2005)} [Formula] Value-added(2007)=Value-added(2006)×{Value-added(2006) / Value-added
(2005)}
87
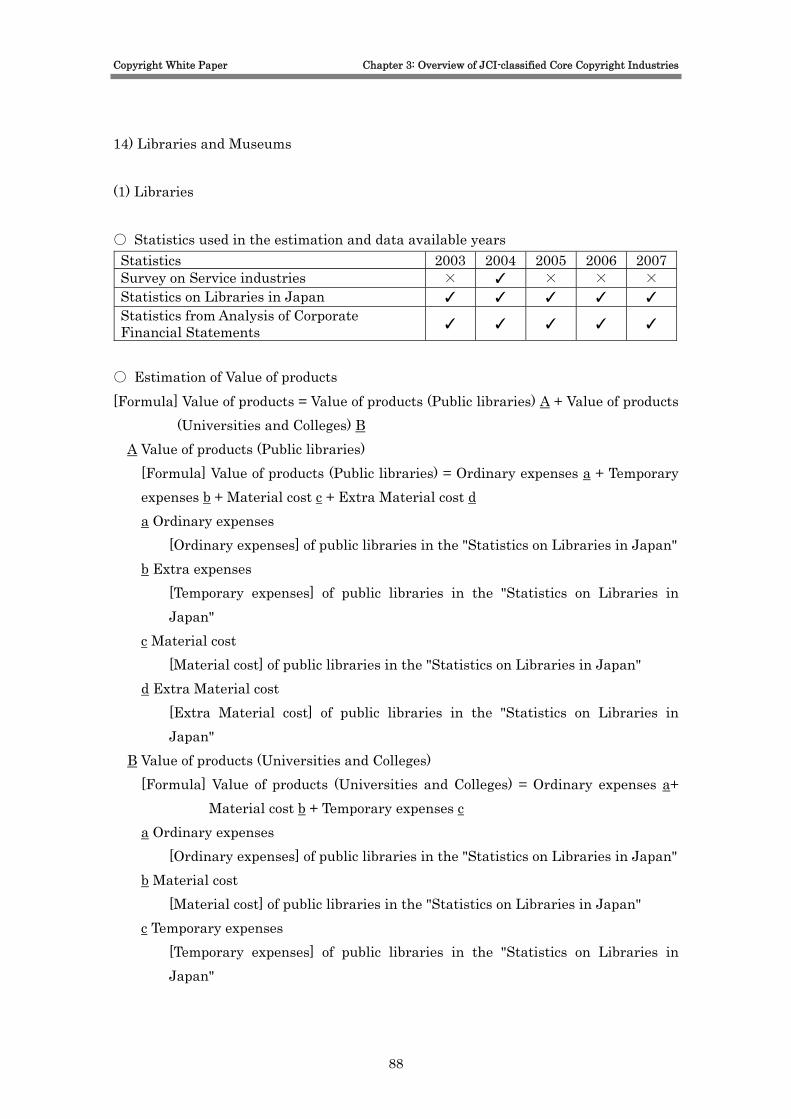
Copyright White Paper Chapter 3: Overview of JCI-classified Core Copyright Industries
14) Libraries and Museums (1) Libraries ○ Statistics used in the estimation and data available years Statistics 2003 2004 2005 2006 2007Survey on Service industries × ✓ × × × Statistics on Libraries in Japan ✓ ✓ ✓ ✓ ✓ Statistics from Analysis of Corporate Financial Statements ✓ ✓ ✓ ✓ ✓
○ Estimation of Value of products [Formula] Value of products = Value of products (Public libraries) A + Value of products
(Universities and Colleges) B A Value of products (Public libraries)
[Formula] Value of products (Public libraries) = Ordinary expenses a + Temporary expenses b + Material cost c + Extra Material cost d a Ordinary expenses
[Ordinary expenses] of public libraries in the "Statistics on Libraries in Japan" b Extra expenses
[Temporary expenses] of public libraries in the "Statistics on Libraries in Japan"
c Material cost [Material cost] of public libraries in the "Statistics on Libraries in Japan"
d Extra Material cost [Extra Material cost] of public libraries in the "Statistics on Libraries in Japan"
B Value of products (Universities and Colleges) [Formula] Value of products (Universities and Colleges) = Ordinary expenses a+
Material cost b + Temporary expenses c a Ordinary expenses
[Ordinary expenses] of public libraries in the "Statistics on Libraries in Japan" b Material cost
[Material cost] of public libraries in the "Statistics on Libraries in Japan" c Temporary expenses
[Temporary expenses] of public libraries in the "Statistics on Libraries in Japan"
88
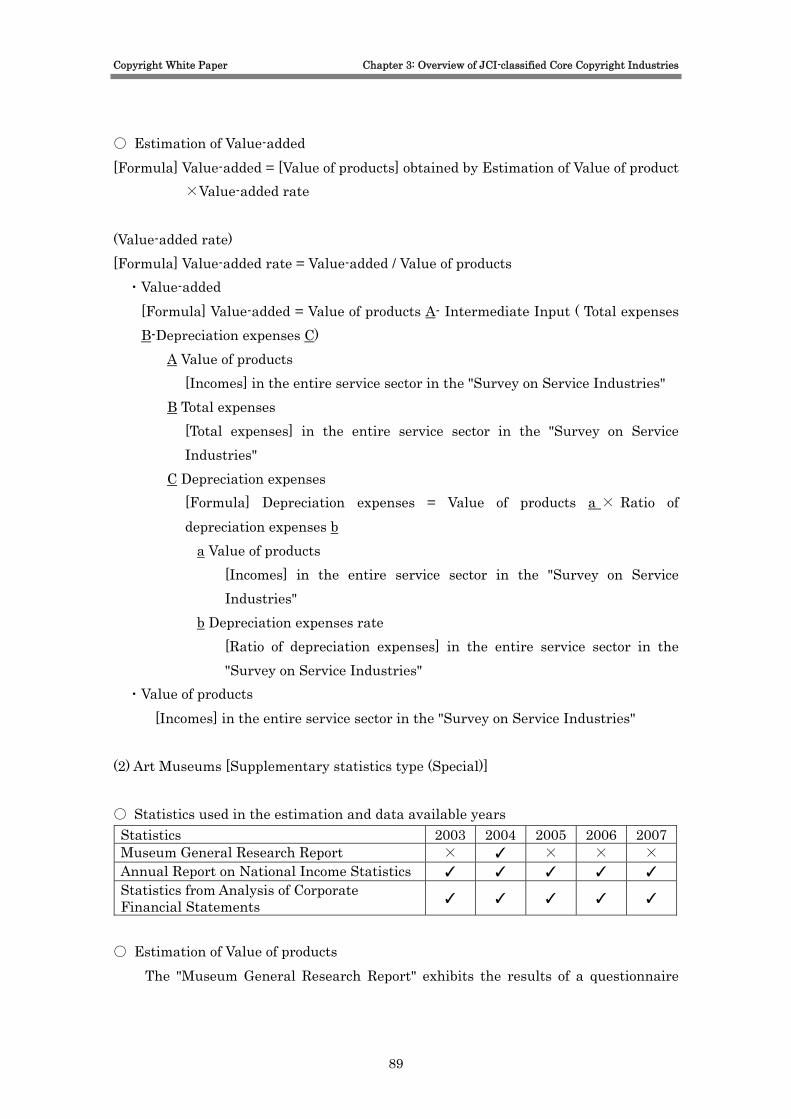
Copyright White Paper Chapter 3: Overview of JCI-classified Core Copyright Industries
○ Estimation of Value-added [Formula] Value-added = [Value of products] obtained by Estimation of Value of product
×Value-added rate (Value-added rate) [Formula] Value-added rate = Value-added / Value of products ・Value-added
[Formula] Value-added = Value of products A- Intermediate Input ( Total expenses B-Depreciation expenses C)
A Value of products [Incomes] in the entire service sector in the "Survey on Service Industries"
B Total expenses [Total expenses] in the entire service sector in the "Survey on Service Industries"
C Depreciation expenses [Formula] Depreciation expenses = Value of products a × Ratio of depreciation expenses b
a Value of products [Incomes] in the entire service sector in the "Survey on Service Industries"
b Depreciation expenses rate [Ratio of depreciation expenses] in the entire service sector in the "Survey on Service Industries"
・Value of products [Incomes] in the entire service sector in the "Survey on Service Industries"
(2) Art Museums [Supplementary statistics type (Special)] ○ Statistics used in the estimation and data available years Statistics 2003 2004 2005 2006 2007Museum General Research Report × ✓ × × × Annual Report on National Income Statistics ✓ ✓ ✓ ✓ ✓ Statistics from Analysis of Corporate Financial Statements ✓ ✓ ✓ ✓ ✓
○ Estimation of Value of products
The "Museum General Research Report" exhibits the results of a questionnaire
89
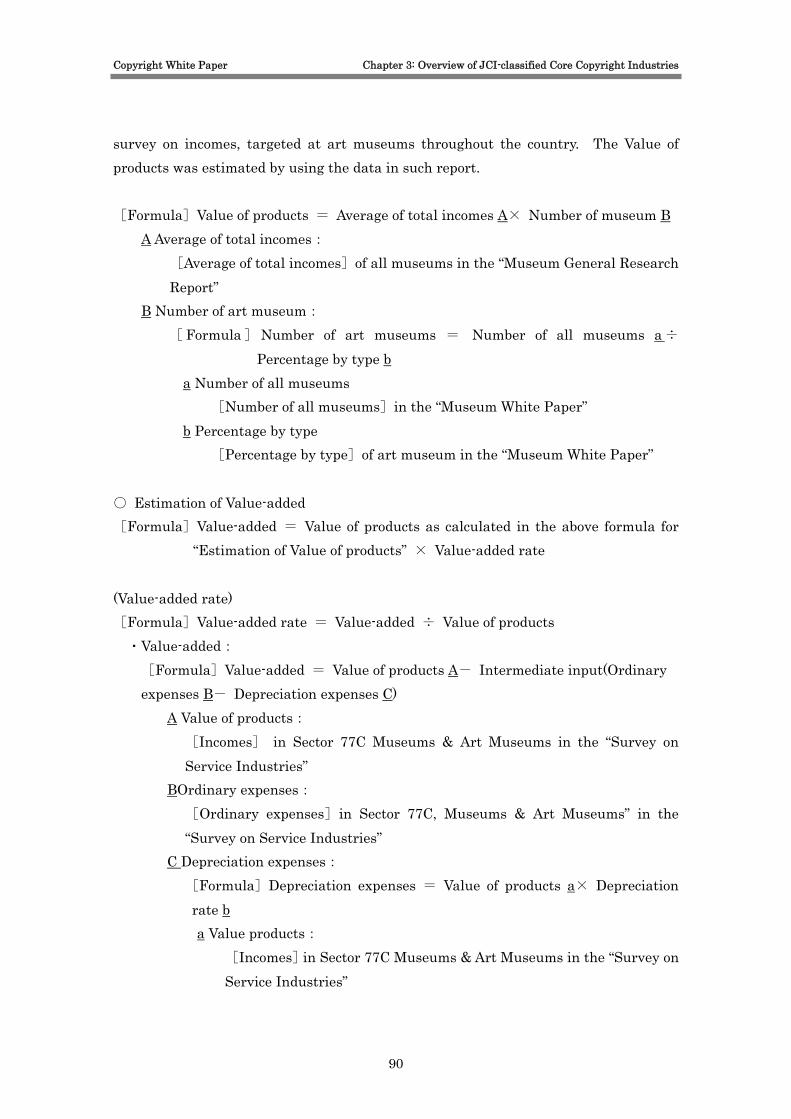
Copyright White Paper Chapter 3: Overview of JCI-classified Core Copyright Industries
survey on incomes, targeted at art museums throughout the country. The Value of products was estimated by using the data in such report. [Formula]Value of products = Average of total incomes A× Number of museum B
A Average of total incomes: [Average of total incomes]of all museums in the “Museum General Research Report”
B Number of art museum: [ Formula] Number of art museums = Number of all museums a÷
Percentage by type b a Number of all museums
[Number of all museums]in the “Museum White Paper” b Percentage by type
[Percentage by type]of art museum in the “Museum White Paper” ○ Estimation of Value-added [Formula]Value-added = Value of products as calculated in the above formula for
“Estimation of Value of products” × Value-added rate (Value-added rate) [Formula]Value-added rate = Value-added ÷ Value of products ・Value-added: [Formula]Value-added = Value of products A- Intermediate input(Ordinary expenses B- Depreciation expenses C)
A Value of products: [Incomes] in Sector 77C Museums & Art Museums in the “Survey on Service Industries”
BOrdinary expenses: [Ordinary expenses]in Sector 77C, Museums & Art Museums” in the “Survey on Service Industries”
C Depreciation expenses: [Formula]Depreciation expenses = Value of products a× Depreciation rate b a Value products:
[Incomes]in Sector 77C Museums & Art Museums in the “Survey on Service Industries”
90

Copyright White Paper Chapter 3: Overview of JCI-classified Core Copyright Industries
b Depreciation rate: Average of[Depreciation rate to sales] in Service Industries in the “Statistics from Analysis of Corporate Financial Statements”
・Value of products: [Incomes] in Sector 77C Museums & Art Museums in the “Survey on Service Industries”
○ Compensation for statistical data
The surveys were not conducted since fiscal 2005 and the preceding years to compile the statistics on the "Museum White Paper". Data for fiscal 2005 and the subsequent years, which official statistics was not available, were estimated by using the income growth rate relative to the previous year in Sector 77C Museums & Art Museums in the “Survey on Service Industries” for fiscal years of 1999 – 2004.
Figure 3-33 Incomes of Museums & Art Museums and the rate of increase relative to the previous year
2003 2004 2005 2006 2007 Scale of market (million yen) (36,299 ) 32,511 (29,118 ) (26,080 ) (23,358 )
Change of rate (%) 90% 90% 90% 90% 90% Source: Survey on Service Industries
These figures were used for calculation of the value of products and value-added in
fiscal 2005, for example, by means of the formulas noted below. [Formula] Value of products(2005)=Value of products(2004)×Rate of change [Formula] Value-added(2005)=Value-added(2004)×Rate of change
91

Copyright White Paper Chapter 3: Overview of JCI-classified Core Copyright Industries
15) Authors and Artists (1) Authors and Artists, Musician [Basic statistics type] ○ Statistics used in the estimation and data available years Statistics 2003 2004 2005 2006 2007Survey on Service industries × ✓ × × × Annual Report on National Income Statistics ✓ ✓ ✓ ✓ ✓ Statistics from Analysis of Corporate Financial Statements ✓ ✓ ✓ ✓ ✓
○ Estimation of Value of products
[Formula] Value of products = Incomes ・Incomes
[Incomes] in Sector 807(authors and artists) in the "Survey on Service industries" ○ Estimation of Value-added [Formula] Value-added = Value of products A- Intermediate Input ( Ordinary expenses B-Depreciation expenses C)
A Value of products [Incomes] in Sector 807 (authors and artists) in the "Survey on Service industries"
B Ordinary expenses [Ordinary expenses] in Sector 875 (authors and artists) in the "Survey on Service industries"
C Depreciation expenses [Formula] Depreciation expenses = Value of products a×Ratio of depreciation expenses b
a Value of products [Value of products] obtained by Estimation of Value of products
b Depreciation expenses rate
[Depreciation rate to Sales] in Class 807 (authors and artists) in the "Statistics from Analysis of Corporate Financial Statements"
○ Compensation for statistical data
Editions of the "Survey on Service Industries" are published every five years. The
92
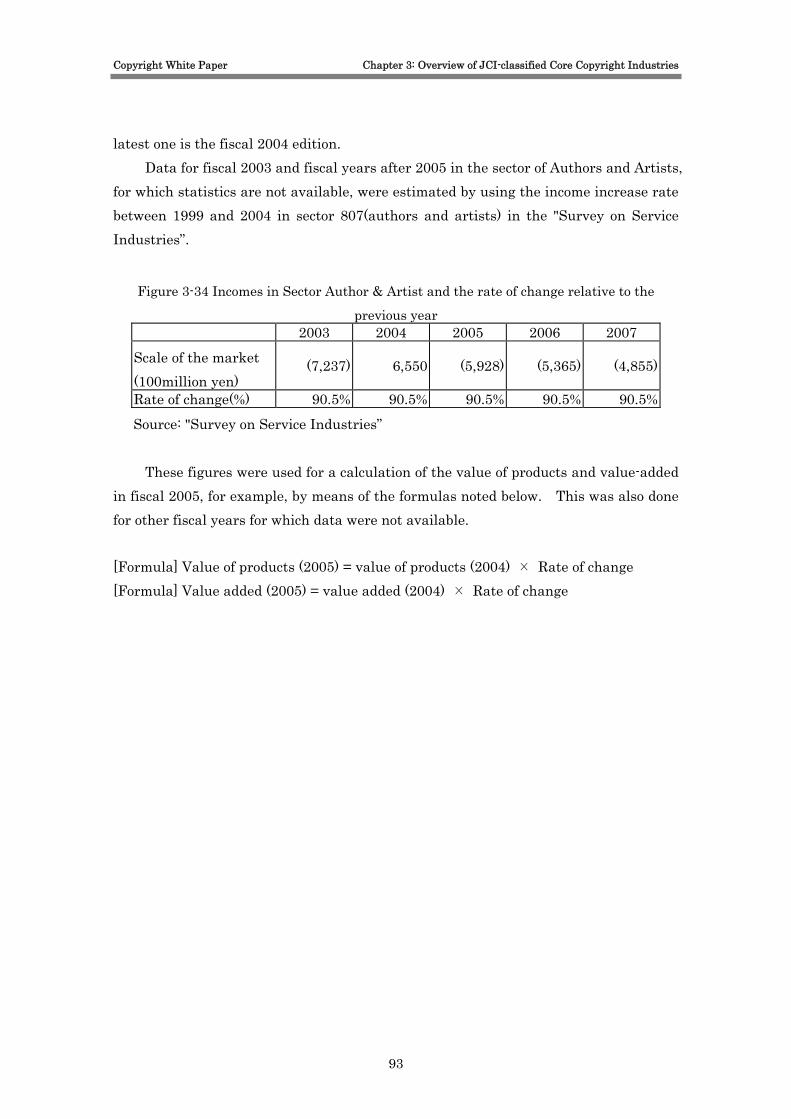
Copyright White Paper Chapter 3: Overview of JCI-classified Core Copyright Industries
latest one is the fiscal 2004 edition. Data for fiscal 2003 and fiscal years after 2005 in the sector of Authors and Artists,
for which statistics are not available, were estimated by using the income increase rate between 1999 and 2004 in sector 807(authors and artists) in the "Survey on Service Industries”.
Figure 3-34 Incomes in Sector Author & Artist and the rate of change relative to the
previous year 2003 2004 2005 2006 2007
Scale of the market (100million yen)
(7,237) 6,550 (5,928) (5,365) (4,855)
Rate of change(%) 90.5% 90.5% 90.5% 90.5% 90.5% Source: "Survey on Service Industries”
These figures were used for a calculation of the value of products and value-added in fiscal 2005, for example, by means of the formulas noted below. This was also done for other fiscal years for which data were not available. [Formula] Value of products (2005) = value of products (2004) × Rate of change [Formula] Value added (2005) = value added (2004) × Rate of change
93
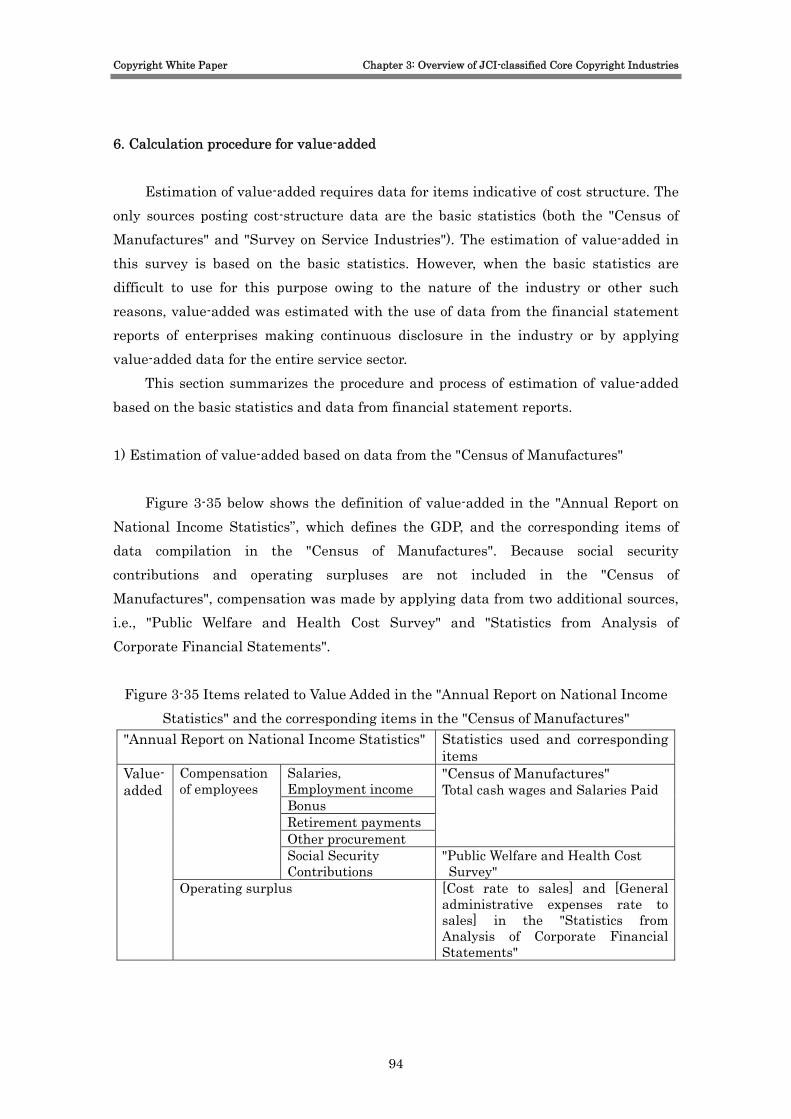
Copyright White Paper Chapter 3: Overview of JCI-classified Core Copyright Industries
6. Calculation procedure for value-added
Estimation of value-added requires data for items indicative of cost structure. The only sources posting cost-structure data are the basic statistics (both the "Census of Manufactures" and "Survey on Service Industries"). The estimation of value-added in this survey is based on the basic statistics. However, when the basic statistics are difficult to use for this purpose owing to the nature of the industry or other such reasons, value-added was estimated with the use of data from the financial statement reports of enterprises making continuous disclosure in the industry or by applying value-added data for the entire service sector.
This section summarizes the procedure and process of estimation of value-added based on the basic statistics and data from financial statement reports. 1) Estimation of value-added based on data from the "Census of Manufactures"
Figure 3-35 below shows the definition of value-added in the "Annual Report on National Income Statistics”, which defines the GDP, and the corresponding items of data compilation in the "Census of Manufactures". Because social security contributions and operating surpluses are not included in the "Census of Manufactures", compensation was made by applying data from two additional sources, i.e., "Public Welfare and Health Cost Survey" and "Statistics from Analysis of Corporate Financial Statements".
Figure 3-35 Items related to Value Added in the "Annual Report on National Income Statistics" and the corresponding items in the "Census of Manufactures"
"Annual Report on National Income Statistics" Statistics used and corresponding items
Salaries, Employment income Bonus Retirement payments Other procurement
"Census of Manufactures" Total cash wages and Salaries Paid
Compensation of employees
Social Security Contributions
"Public Welfare and Health Cost Survey"
Value-added
Operating surplus
[Cost rate to sales] and [General administrative expenses rate to sales] in the "Statistics from Analysis of Corporate Financial Statements"
94
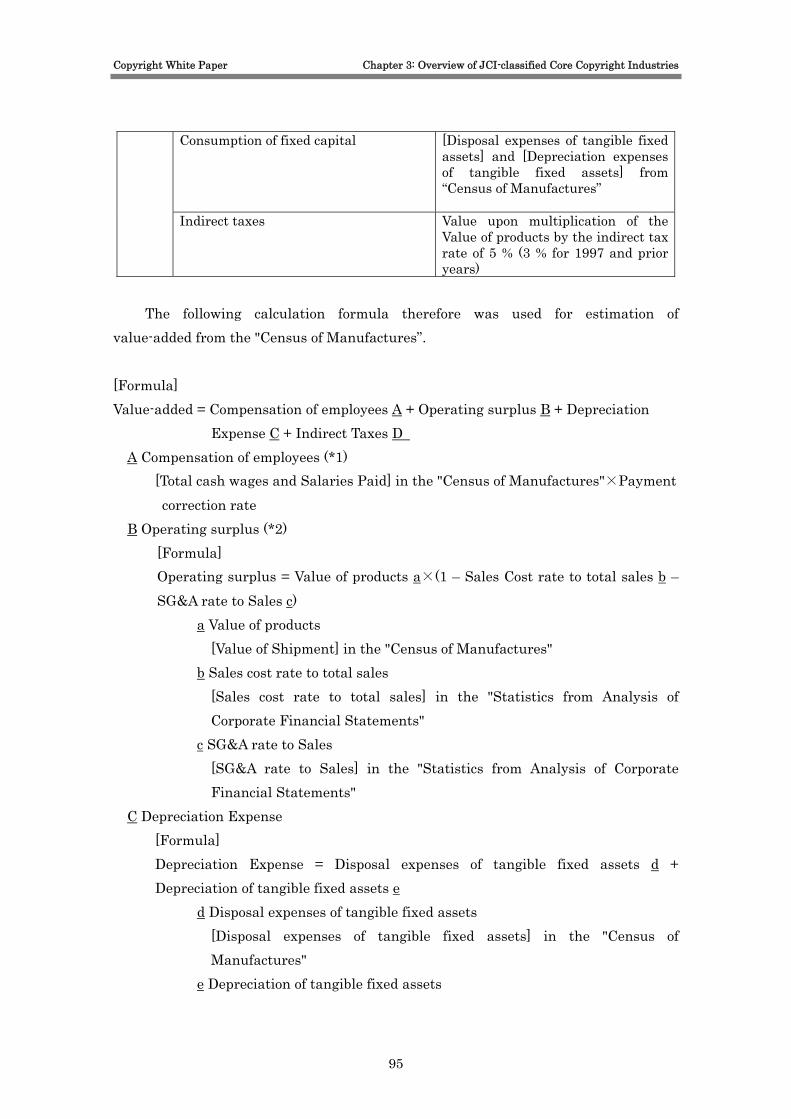
Copyright White Paper Chapter 3: Overview of JCI-classified Core Copyright Industries
Consumption of fixed capital [Disposal expenses of tangible fixed assets] and [Depreciation expenses of tangible fixed assets] from “Census of Manufactures”
Indirect taxes Value upon multiplication of the Value of products by the indirect tax rate of 5 % (3 % for 1997 and prior years)
The following calculation formula therefore was used for estimation of
value-added from the "Census of Manufactures”. [Formula] Value-added = Compensation of employees A + Operating surplus B + Depreciation Expense C + Indirect Taxes D
A Compensation of employees (*1) [Total cash wages and Salaries Paid] in the "Census of Manufactures"×Payment correction rate
B Operating surplus (*2) [Formula] Operating surplus = Value of products a×(1 – Sales Cost rate to total sales b – SG&A rate to Sales c)
a Value of products [Value of Shipment] in the "Census of Manufactures"
b Sales cost rate to total sales [Sales cost rate to total sales] in the "Statistics from Analysis of Corporate Financial Statements"
c SG&A rate to Sales [SG&A rate to Sales] in the "Statistics from Analysis of Corporate Financial Statements"
C Depreciation Expense [Formula] Depreciation Expense = Disposal expenses of tangible fixed assets d + Depreciation of tangible fixed assets e
d Disposal expenses of tangible fixed assets [Disposal expenses of tangible fixed assets] in the "Census of Manufactures"
e Depreciation of tangible fixed assets
95
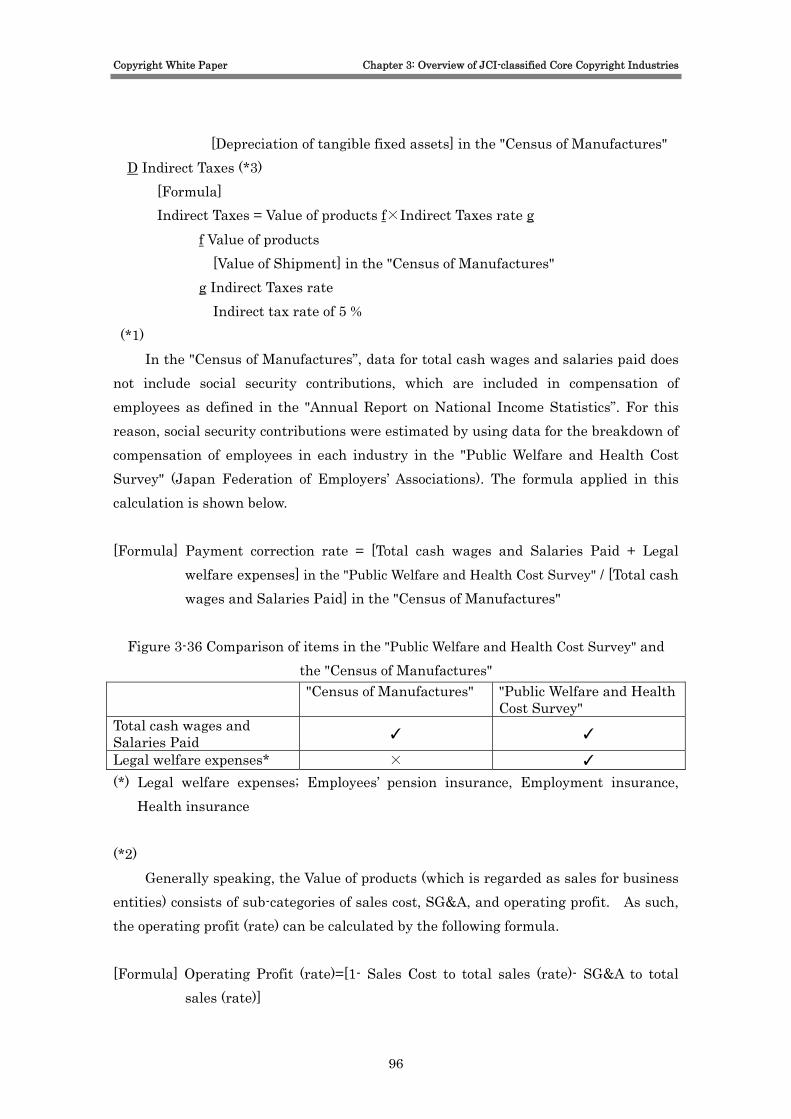
Copyright White Paper Chapter 3: Overview of JCI-classified Core Copyright Industries
[Depreciation of tangible fixed assets] in the "Census of Manufactures" D Indirect Taxes (*3)
[Formula] Indirect Taxes = Value of products f×Indirect Taxes rate g
f Value of products [Value of Shipment] in the "Census of Manufactures"
g Indirect Taxes rate Indirect tax rate of 5 %
(*1) In the "Census of Manufactures”, data for total cash wages and salaries paid does
not include social security contributions, which are included in compensation of employees as defined in the "Annual Report on National Income Statistics”. For this reason, social security contributions were estimated by using data for the breakdown of compensation of employees in each industry in the "Public Welfare and Health Cost Survey" (Japan Federation of Employers’ Associations). The formula applied in this calculation is shown below.
[Formula] Payment correction rate = [Total cash wages and Salaries Paid + Legal
welfare expenses] in the "Public Welfare and Health Cost Survey" / [Total cash wages and Salaries Paid] in the "Census of Manufactures"
Figure 3-36 Comparison of items in the "Public Welfare and Health Cost Survey" and
the "Census of Manufactures" "Census of Manufactures" "Public Welfare and Health
Cost Survey" Total cash wages and Salaries Paid ✓ ✓
Legal welfare expenses* × ✓ (*) Legal welfare expenses; Employees’ pension insurance, Employment insurance,
Health insurance (*2)
Generally speaking, the Value of products (which is regarded as sales for business entities) consists of sub-categories of sales cost, SG&A, and operating profit. As such, the operating profit (rate) can be calculated by the following formula.
[Formula] Operating Profit (rate)=[1- Sales Cost to total sales (rate)- SG&A to total
sales (rate)]
96
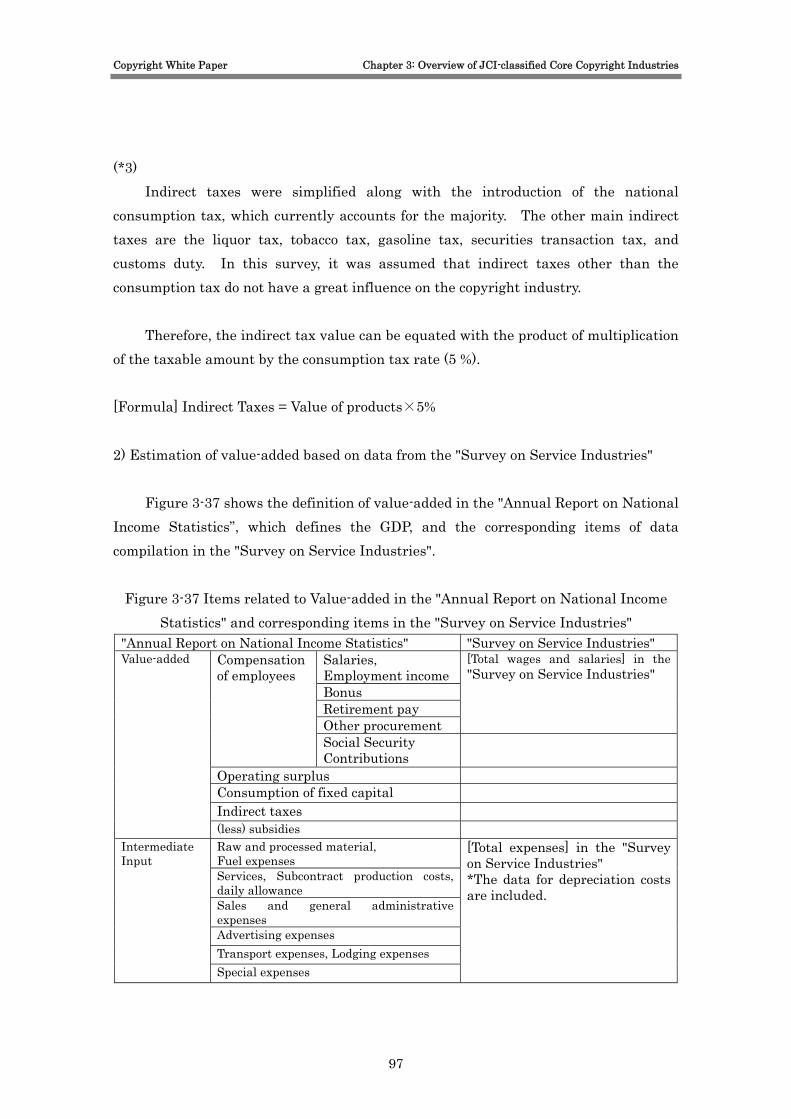
Copyright White Paper Chapter 3: Overview of JCI-classified Core Copyright Industries
(*3)
Indirect taxes were simplified along with the introduction of the national consumption tax, which currently accounts for the majority. The other main indirect taxes are the liquor tax, tobacco tax, gasoline tax, securities transaction tax, and customs duty. In this survey, it was assumed that indirect taxes other than the consumption tax do not have a great influence on the copyright industry.
Therefore, the indirect tax value can be equated with the product of multiplication of the taxable amount by the consumption tax rate (5 %).
[Formula] Indirect Taxes = Value of products×5%
2) Estimation of value-added based on data from the "Survey on Service Industries"
Figure 3-37 shows the definition of value-added in the "Annual Report on National Income Statistics”, which defines the GDP, and the corresponding items of data compilation in the "Survey on Service Industries".
Figure 3-37 Items related to Value-added in the "Annual Report on National Income Statistics" and corresponding items in the "Survey on Service Industries"
"Annual Report on National Income Statistics" "Survey on Service Industries" Salaries, Employment incomeBonus Retirement pay Other procurement
[Total wages and salaries] in the "Survey on Service Industries"
Compensation of employees
Social Security Contributions
Operating surplus Consumption of fixed capital Indirect taxes
Value-added
(less) subsidies Raw and processed material, Fuel expenses Services, Subcontract production costs, daily allowance Sales and general administrative expenses Advertising expenses Transport expenses, Lodging expenses
Intermediate Input
Special expenses
[Total expenses] in the "Survey on Service Industries" *The data for depreciation costs are included.
97
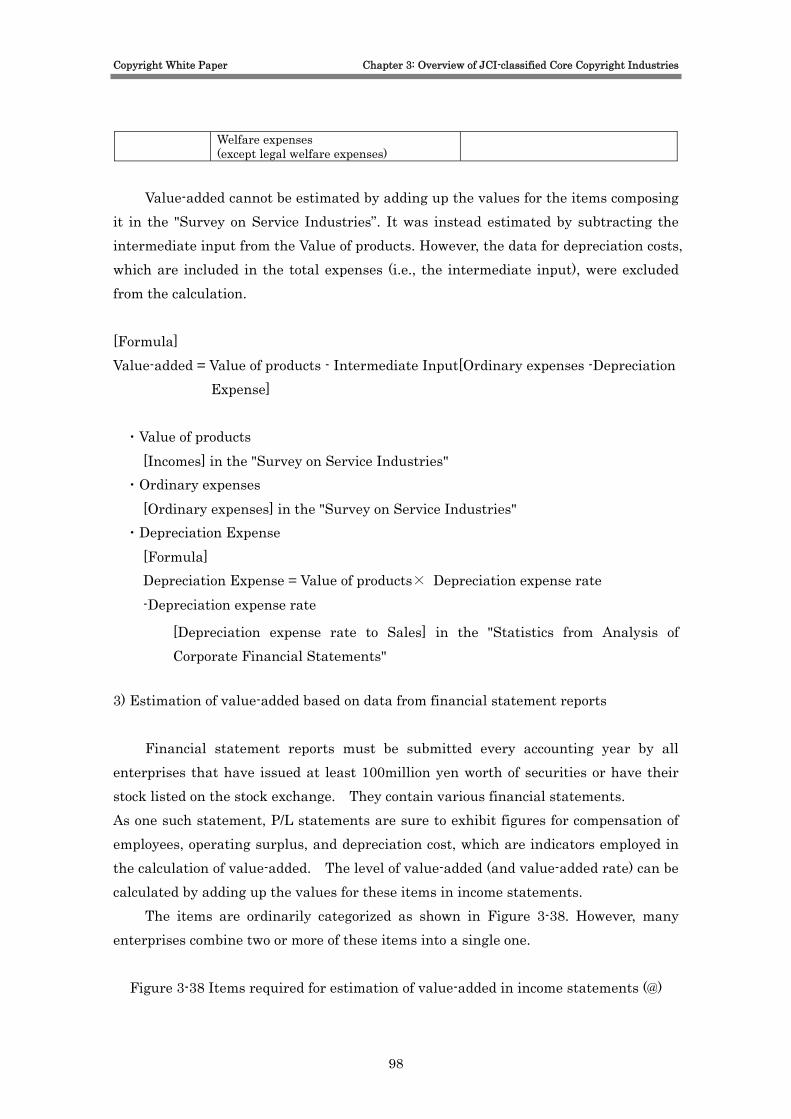
Copyright White Paper Chapter 3: Overview of JCI-classified Core Copyright Industries
Welfare expenses (except legal welfare expenses)
Value-added cannot be estimated by adding up the values for the items composing
it in the "Survey on Service Industries”. It was instead estimated by subtracting the intermediate input from the Value of products. However, the data for depreciation costs, which are included in the total expenses (i.e., the intermediate input), were excluded from the calculation. [Formula] Value-added = Value of products - Intermediate Input[Ordinary expenses -Depreciation Expense] ・Value of products
[Incomes] in the "Survey on Service Industries" ・Ordinary expenses
[Ordinary expenses] in the "Survey on Service Industries" ・Depreciation Expense
[Formula] Depreciation Expense = Value of products× Depreciation expense rate -Depreciation expense rate
[Depreciation expense rate to Sales] in the "Statistics from Analysis of Corporate Financial Statements"
3) Estimation of value-added based on data from financial statement reports
Financial statement reports must be submitted every accounting year by all enterprises that have issued at least 100million yen worth of securities or have their stock listed on the stock exchange. They contain various financial statements. As one such statement, P/L statements are sure to exhibit figures for compensation of employees, operating surplus, and depreciation cost, which are indicators employed in the calculation of value-added. The level of value-added (and value-added rate) can be calculated by adding up the values for these items in income statements.
The items are ordinarily categorized as shown in Figure 3-38. However, many enterprises combine two or more of these items into a single one.
Figure 3-38 Items required for estimation of value-added in income statements (@)
98
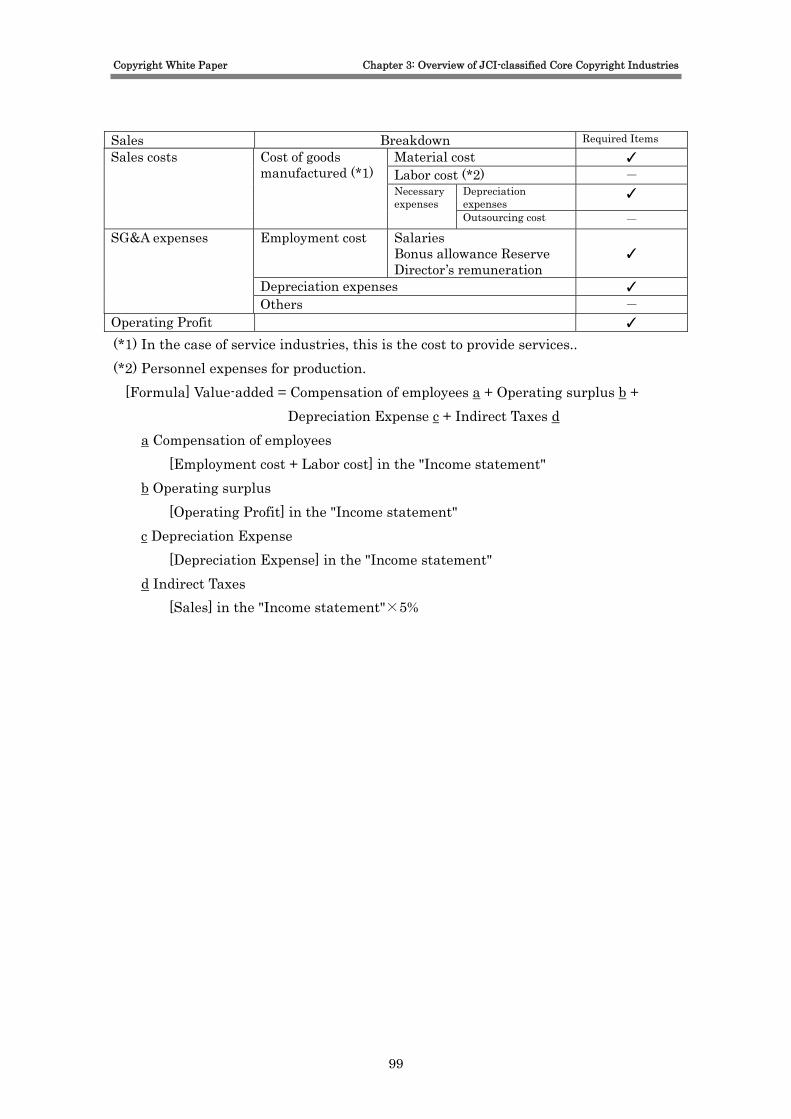
Copyright White Paper Chapter 3: Overview of JCI-classified Core Copyright Industries
Sales Breakdown Required Items
Material cost ✓ Labor cost (*2) -
Depreciation expenses
✓
Sales costs Cost of goods manufactured (*1)
Necessary expenses
Outsourcing cost - Employment cost Salaries
Bonus allowance Reserve Director’s remuneration
✓
Depreciation expenses ✓
SG&A expenses
Others - Operating Profit ✓ (*1) In the case of service industries, this is the cost to provide services.. (*2) Personnel expenses for production.
[Formula] Value-added = Compensation of employees a + Operating surplus b + Depreciation Expense c + Indirect Taxes d
a Compensation of employees [Employment cost + Labor cost] in the "Income statement"
b Operating surplus [Operating Profit] in the "Income statement"
c Depreciation Expense [Depreciation Expense] in the "Income statement"
d Indirect Taxes [Sales] in the "Income statement"×5%
99

Copyright White Paper Chapter 3: Overview of JCI-classified Core Copyright Industries
7. Deflator for statistical values 1) Deflator
Comparison of estimates of the scale of the copyright industry over each of the fiscal years 1998 - 2007 requires conversion from current prices to constant prices (i.e., adjustment for the fluctuation in current prices due to inflation or deflation). The deflator announced for each year by the Economic and Social Research Institute, Cabinet Office, Government of Japan will be used to change the current prices into constant prices based on calendar year of 2000. Because separate deflators are announced for each industrial sector, the survey applied that for the sector including the constituent copyright industry. Figure 3-28 shows the kind of deflator used in each class of the copyright industry, and Figure 3-29, the corresponding deflator values.
Figure 3-39 Copyright industry classes and deflators used
Copyright industry classes Deflator values used
(1)Newspaper publishing Printing and
Publishing
(2)Book and Journal Publishing Printing and
Publishing
1)Printing and
Publishing
(3)Printing (Newspaper and Book) Printing and
Publishing
(1)Software Service 2)Computer Software
(2)Data Processing and Information
Provision Service
(1)Public Broadcasting Service
(2)Private Broadcasting Service
3)Broadcasting
(3)Cable Broadcasting Service
(1)Internet Transmission Telecommunication 4)Transmission
(2)Mobile Phone Network Transmission Telecommunication
(1)Commercial art and Graphic design Service 5)Advertising
(2)Display Service
(1)Records, CDs and Tapes Miscellaneous
Manufacturing
(2)Record and CD rental Service
6)Music
(3)Music Publishing Service
100

Copyright White Paper Chapter 3: Overview of JCI-classified Core Copyright Industries
(1)Movie, Home video and TV program
production
Service 7)Motion Picture
(2)Video Rental Service
8) Photography (1) Photography Service
(1)Movie Theater Service
(2)Theater Service
9)Legitimate Theater
(3)Theatrical company, band and
orchestra
Service
10)Game Software (1)Game software Service
(1)Amusement Arcade Service
(2)Karaoke Box Service
11)Entertainment
Facilities
(3)Theme Park Service
12)Design (1)Design Service
13)Architecture (1)Architectural Design Service
(1)Libraries Service 14)Libraries and
Museums (2)Museums and Art galleries Service
15)Authors and
Artists
(1)Authors and Artists, Musician Service
Figure 3-40 Deflator values
Industries 1998 1999 2000 2001 2002 2003 2004 2005 2006 2007
Printing and
Publishing
96.8 99.8 100.0 100.5 101.1 100.3 99.3 98.4 96.9 94.0
Miscellaneous
Manufacturing
108.4 105.9 100.0 99.5 97.7 93.8 91.4 88.5 84.7 79.8
Service 101.1 100.5 100.0 98.2 96.2 94.0 92.4 90.1 88.4 88.0
Telecommunication 110.3 105.7 100.0 91.4 86.5 84.6 83.1 82.0 81.2 78.8
GDP 102.8 101.6 100.0 98.7 97.2 95.4 94.1 92.5 91.9 90.2
Source: " Annual Report on National Income " (Economic and Social Research Institute,
Cabinet Office, Government of Japan) * The deflator values announced by the Economic and Social Research Institute, Cabinet Office, Government of Japan are not fixed; they are subject to revision. This is because various basic data for (more precise) deflator calculation are announced
101
Copyright White Paper Chapter 3: Overview of JCI-classified Core Copyright Industries
after the announcement of the (initial) deflator value. Ordinarily, however, the (initial) value is not changed greatly, meaning that the adjustment is minimal. 2) Calculation of constant prices
The following formula was employed for calculation of constant prices using the aforementioned deflator.
[Formula] Actual prices = Σ[Nominal price / deflator value] in each industrial sector]
102
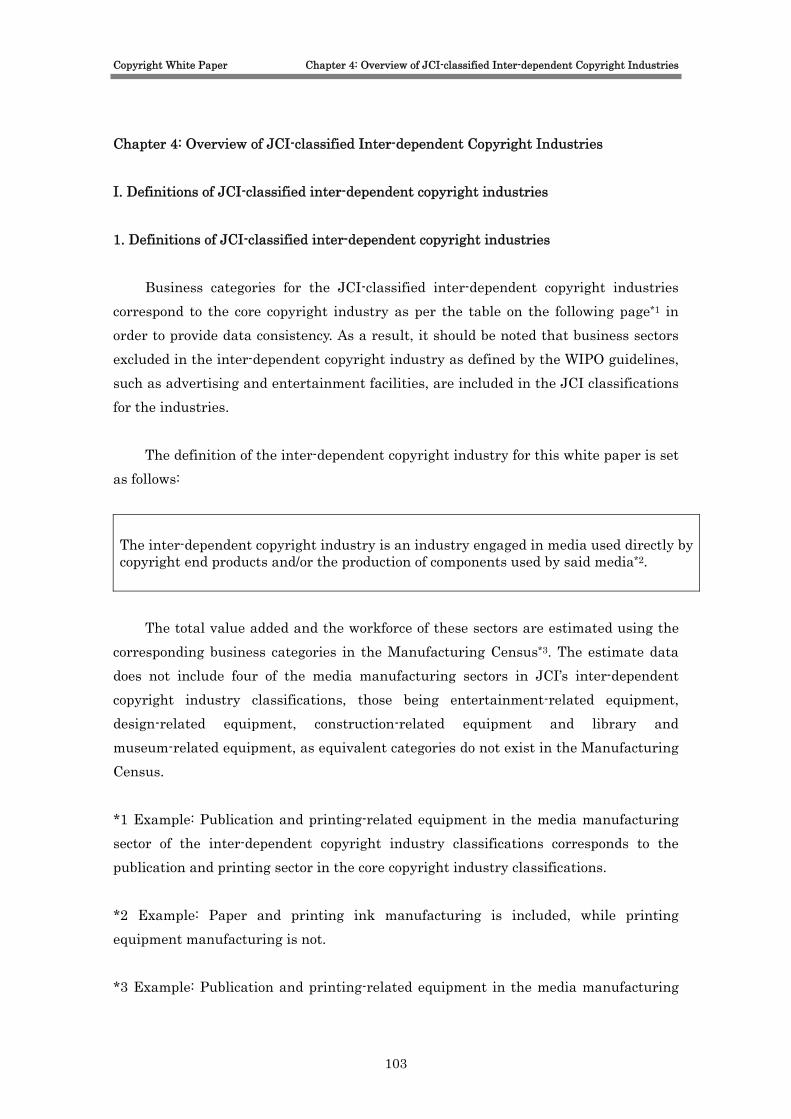
Copyright White Paper Chapter 4: Overview of JCI-classified Inter-dependent Copyright Industries
Chapter 4: Overview of JCI-classified Inter-dependent Copyright Industries I. Definitions of JCI-classified inter-dependent copyright industries 1. Definitions of JCI-classified inter-dependent copyright industries
Business categories for the JCI-classified inter-dependent copyright industries correspond to the core copyright industry as per the table on the following page*1 in order to provide data consistency. As a result, it should be noted that business sectors excluded in the inter-dependent copyright industry as defined by the WIPO guidelines, such as advertising and entertainment facilities, are included in the JCI classifications for the industries.
The definition of the inter-dependent copyright industry for this white paper is set as follows:
The inter-dependent copyright industry is an industry engaged in media used directly by copyright end products and/or the production of components used by said media*2.
The total value added and the workforce of these sectors are estimated using the
corresponding business categories in the Manufacturing Census*3. The estimate data does not include four of the media manufacturing sectors in JCI’s inter-dependent copyright industry classifications, those being entertainment-related equipment, design-related equipment, construction-related equipment and library and museum-related equipment, as equivalent categories do not exist in the Manufacturing Census. *1 Example: Publication and printing-related equipment in the media manufacturing sector of the inter-dependent copyright industry classifications corresponds to the publication and printing sector in the core copyright industry classifications. *2 Example: Paper and printing ink manufacturing is included, while printing equipment manufacturing is not. *3 Example: Publication and printing-related equipment in the media manufacturing
103
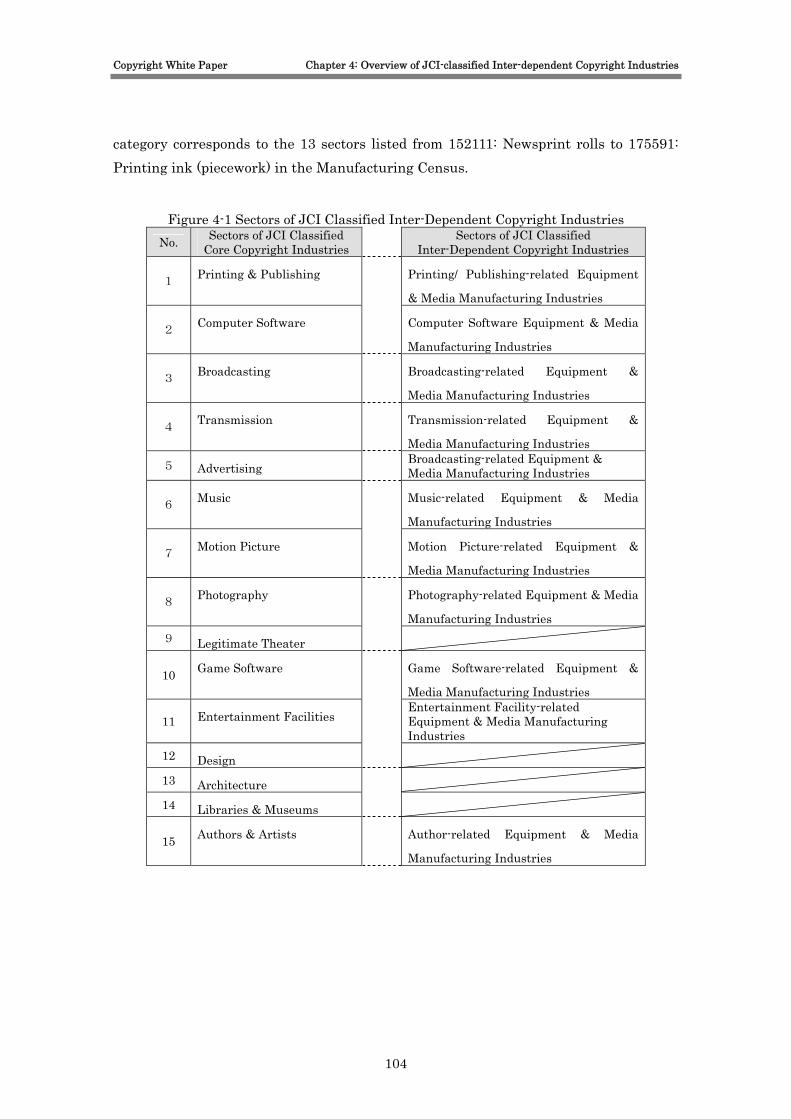
Copyright White Paper Chapter 4: Overview of JCI-classified Inter-dependent Copyright Industries
category corresponds to the 13 sectors listed from 152111: Newsprint rolls to 175591: Printing ink (piecework) in the Manufacturing Census.
Figure 4-1 Sectors of JCI Classified Inter-Dependent Copyright Industries No. Sectors of JCI Classified
Core Copyright Industries Sectors of JCI Classified
Inter-Dependent Copyright Industries
1 Printing & Publishing
Printing/ Publishing-related Equipment
& Media Manufacturing Industries
2 Computer Software
Computer Software Equipment & Media
Manufacturing Industries
3 Broadcasting
Broadcasting-related Equipment &
Media Manufacturing Industries
4 Transmission
Transmission-related Equipment &
Media Manufacturing Industries
5 Advertising Broadcasting-related Equipment &
Media Manufacturing Industries
6 Music
Music-related Equipment & Media
Manufacturing Industries
7 Motion Picture
Motion Picture-related Equipment &
Media Manufacturing Industries
8 Photography
Photography-related Equipment & Media
Manufacturing Industries 9 Legitimate Theater
10 Game Software
Game Software-related Equipment &
Media Manufacturing Industries
11 Entertainment Facilities Entertainment Facility-related
Equipment & Media Manufacturing Industries
12 Design
13 Architecture
14 Libraries & Museums
15 Authors & Artists
Author-related Equipment & Media
Manufacturing Industries
104

Copyright White Paper Chapter 4: Overview of JCI-classified Inter-dependent Copyright Industries
II Overview on Scale of JCI-classified Inter-Dependent Copyright Industries 1. Overview on Scale of JCI-classified Inter-Dependent Copyright Industries
In fiscal 2007, the inter-dependent copyright industry in Japan reached an estimated scale of 35,305 billion yen in terms of the value of products and 7,468 billion yen in terms of the value-added (based on market prices in calendar year of 2000.) By industry, the “Computer Software-related Equipment & Media Manufacturing Industries” ranked first in terms of the value-added, followed in order by the “Broadcasting-related Equipment & Media Manufacturing Industries” and the “Photography-related Equipment & Media Manufacturing Industries.”
Figure 4-2 Scale of JCI Classified Inter-Dependent Copyright Industries (Fiscal 2007) (n billion yen)
Value-added Value of products Value Proportion
1 Printing/ Publishing-related Equipment &
Media Manufacturing Industries 2,100 557 7.5%
2 Computer Software-related Equipment & Media Manufacturing
Industries 7,993 1,546 20.7%
3 Broadcasting-related Equipment &
Media Manufacturing Industries 3,432 643 8.6%
4 Transmission-related Equipment &
Media Manufacturing Industries 6,879 1,526 20.4%
5 Music-related Equipment & Media
Manufacturing Industries 2,903 734 9.8%
6 Motion Picture-related Equipment&
Media Manufacturing Industries 2,464 458 6.1%
7 Photography-related Equipment &
Media Manufacturing Industries 4,502 1,165 15.6%
8 Game Software-related Equipment &
Media Manufacturing Industries 212 44 0.6%
9 Advertising-related Equipment & Media Manufacturing Industries 473 147 2.0%
10 Entertainment Facility-related 4,322 637 8.5%
105
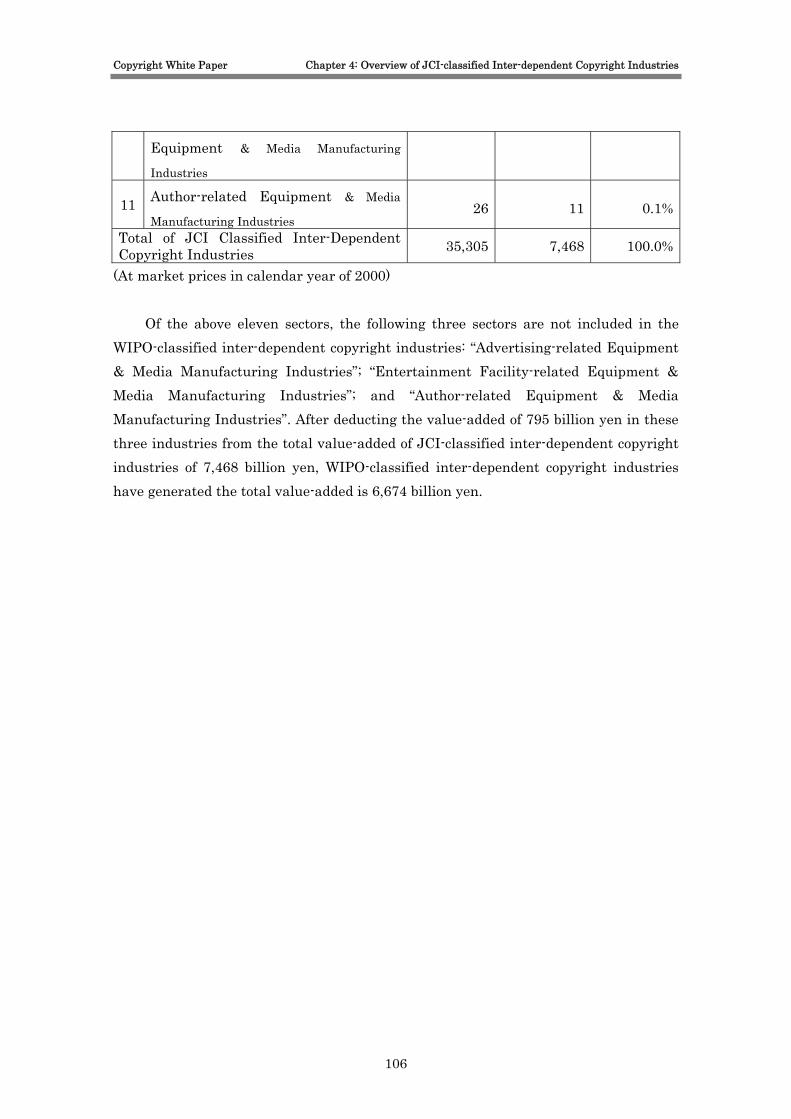
Copyright White Paper Chapter 4: Overview of JCI-classified Inter-dependent Copyright Industries
Equipment & Media Manufacturing
Industries
11 Author-related Equipment & Media
Manufacturing Industries 26 11 0.1%
Total of JCI Classified Inter-Dependent Copyright Industries 35,305 7,468 100.0%
(At market prices in calendar year of 2000)
Of the above eleven sectors, the following three sectors are not included in the WIPO-classified inter-dependent copyright industries: “Advertising-related Equipment & Media Manufacturing Industries”; “Entertainment Facility-related Equipment & Media Manufacturing Industries”; and “Author-related Equipment & Media Manufacturing Industries”. After deducting the value-added of 795 billion yen in these three industries from the total value-added of JCI-classified inter-dependent copyright industries of 7,468 billion yen, WIPO-classified inter-dependent copyright industries have generated the total value-added is 6,674 billion yen.
106
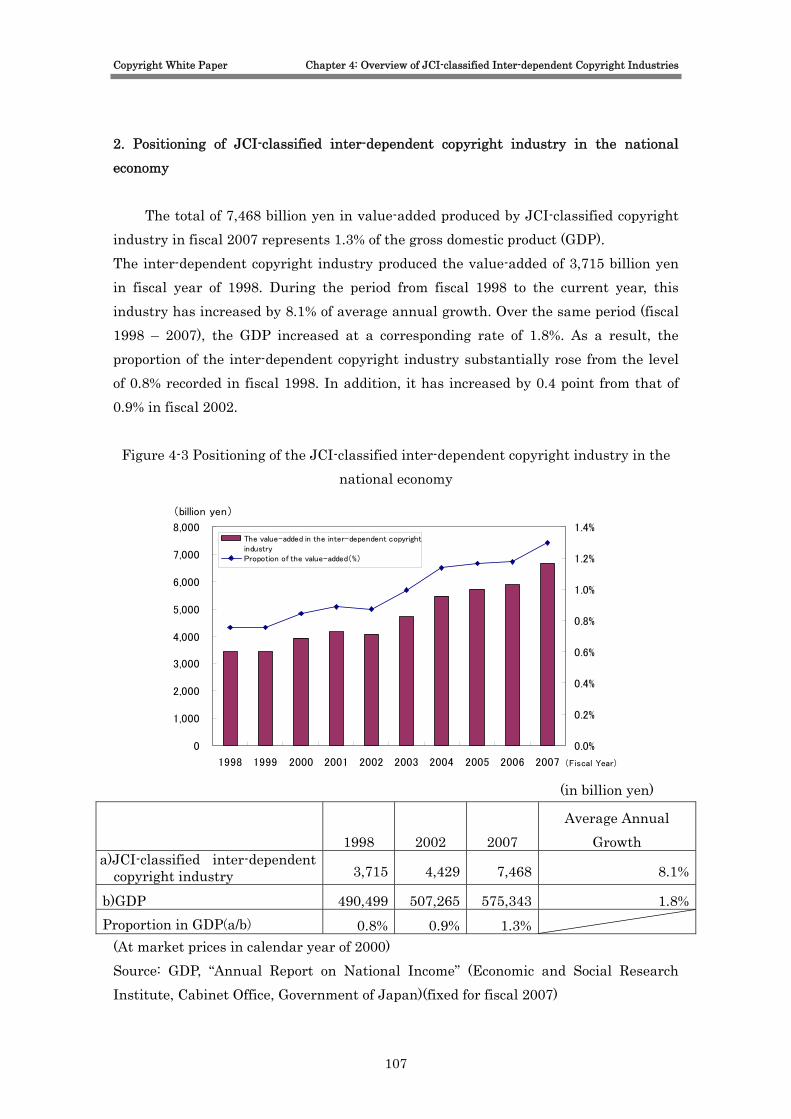
Copyright White Paper Chapter 4: Overview of JCI-classified Inter-dependent Copyright Industries
2. Positioning of JCI-classified inter-dependent copyright industry in the national economy
The total of 7,468 billion yen in value-added produced by JCI-classified copyright industry in fiscal 2007 represents 1.3% of the gross domestic product (GDP). The inter-dependent copyright industry produced the value-added of 3,715 billion yen in fiscal year of 1998. During the period from fiscal 1998 to the current year, this industry has increased by 8.1% of average annual growth. Over the same period (fiscal 1998 – 2007), the GDP increased at a corresponding rate of 1.8%. As a result, the proportion of the inter-dependent copyright industry substantially rose from the level of 0.8% recorded in fiscal 1998. In addition, it has increased by 0.4 point from that of 0.9% in fiscal 2002.
Figure 4-3 Positioning of the JCI-classified inter-dependent copyright industry in the national economy
0
1,000
2,000
3,000
4,000
5,000
6,000
7,000
8,000
1998 1999 2000 2001 2002 2003 2004 2005 2006 2007 (Fiscal Year)
(billion yen)
0.0%
0.2%
0.4%
0.6%
0.8%
1.0%
1.2%
1.4%The value-added in the inter-dependent copyrightindustryPropotion of the value-added(%)
(in billion yen)
1998 2002 2007 Average Annual
Growth a)JCI-classified inter-dependent
copyright industry 3,715 4,429 7,468 8.1%
b)GDP 490,499 507,265 575,343 1.8%Proportion in GDP(a/b) 0.8% 0.9% 1.3%
(At market prices in calendar year of 2000) Source: GDP, “Annual Report on National Income” (Economic and Social Research Institute, Cabinet Office, Government of Japan)(fixed for fiscal 2007)
107
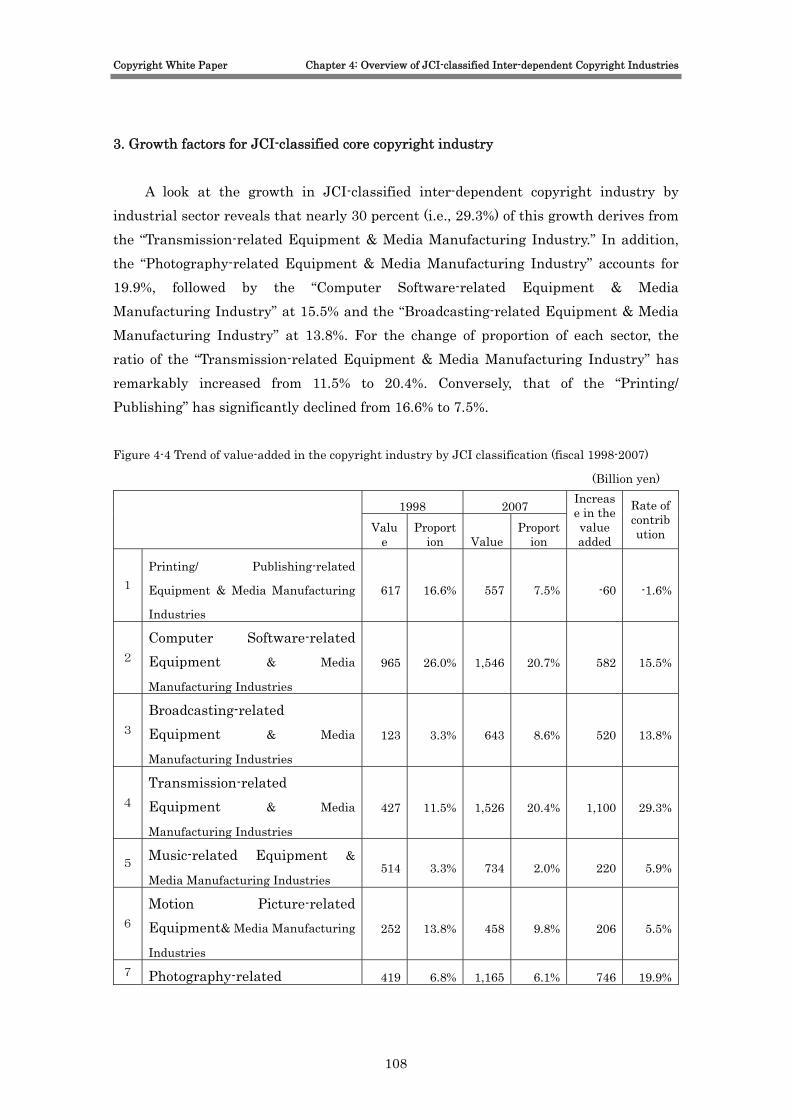
Copyright White Paper Chapter 4: Overview of JCI-classified Inter-dependent Copyright Industries
3. Growth factors for JCI-classified core copyright industry
A look at the growth in JCI-classified inter-dependent copyright industry by industrial sector reveals that nearly 30 percent (i.e., 29.3%) of this growth derives from the “Transmission-related Equipment & Media Manufacturing Industry.” In addition, the “Photography-related Equipment & Media Manufacturing Industry” accounts for 19.9%, followed by the “Computer Software-related Equipment & Media Manufacturing Industry” at 15.5% and the “Broadcasting-related Equipment & Media Manufacturing Industry” at 13.8%. For the change of proportion of each sector, the ratio of the “Transmission-related Equipment & Media Manufacturing Industry” has remarkably increased from 11.5% to 20.4%. Conversely, that of the “Printing/ Publishing” has significantly declined from 16.6% to 7.5%. Figure 4-4 Trend of value-added in the copyright industry by JCI classification (fiscal 1998-2007)
(Billion yen)
1998 2007
Valu
e Proport
ion ValueProport
ion
Increase in the value added
Rate of contribution
1 Printing/ Publishing-related
Equipment & Media Manufacturing
Industries
617 16.6% 557 7.5% -60 -1.6%
2 Computer Software-related Equipment & Media
Manufacturing Industries 965 26.0% 1,546 20.7% 582 15.5%
3 Broadcasting-related Equipment & Media
Manufacturing Industries 123 3.3% 643 8.6% 520 13.8%
4 Transmission-related Equipment & Media
Manufacturing Industries 427 11.5% 1,526 20.4% 1,100 29.3%
5 Music-related Equipment &
Media Manufacturing Industries 514 3.3% 734 2.0% 220 5.9%
6 Motion Picture-related Equipment& Media Manufacturing
Industries 252 13.8% 458 9.8% 206 5.5%
7 Photography-related 419 6.8% 1,165 6.1% 746 19.9%
108
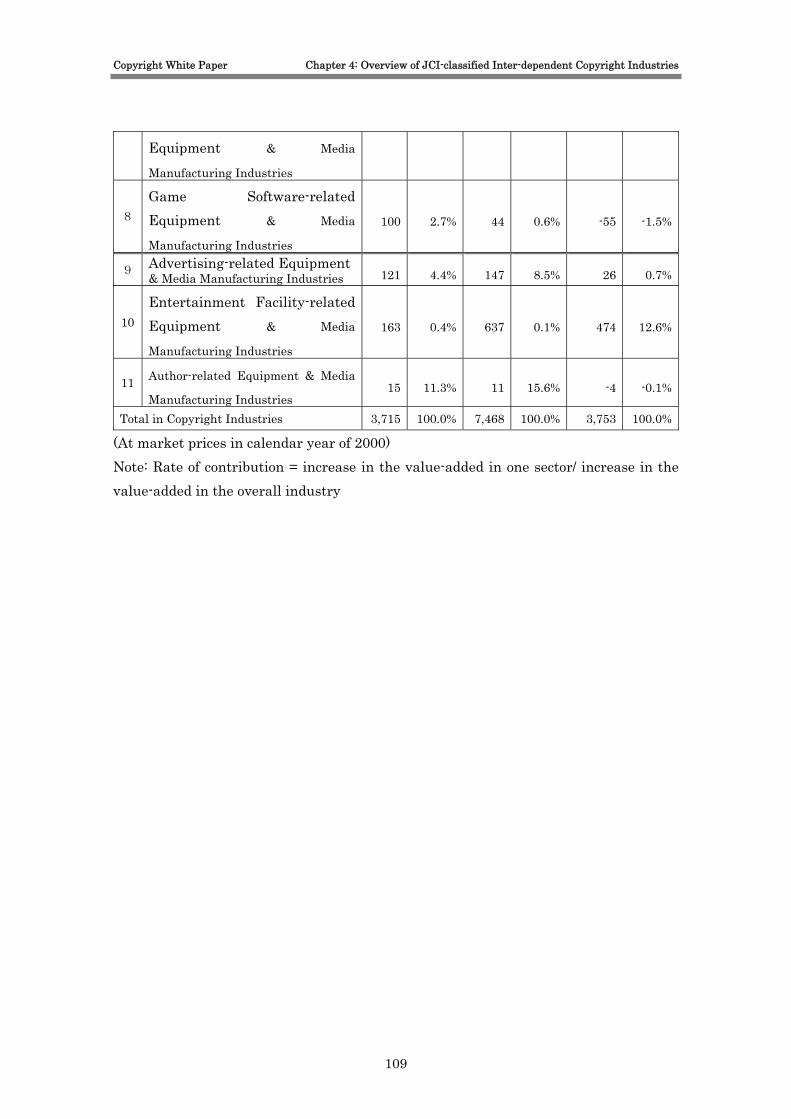
Copyright White Paper Chapter 4: Overview of JCI-classified Inter-dependent Copyright Industries
Equipment & Media
Manufacturing Industries
8 Game Software-related Equipment & Media
Manufacturing Industries 100 2.7% 44 0.6% -55 -1.5%
9 Advertising-related Equipment & Media Manufacturing Industries 121 4.4% 147 8.5% 26 0.7%
10 Entertainment Facility-related Equipment & Media
Manufacturing Industries 163 0.4% 637 0.1% 474 12.6%
11 Author-related Equipment & Media
Manufacturing Industries 15 11.3% 11 15.6% -4 -0.1%
Total in Copyright Industries 3,715 100.0% 7,468 100.0% 3,753 100.0%
(At market prices in calendar year of 2000) Note: Rate of contribution = increase in the value-added in one sector/ increase in the value-added in the overall industry
109

Copyright White Paper Chapter 4: Overview of JCI-classified Inter-dependent Copyright Industries
Ⅲ . Estimation method of the scale of JCI-classified inter-dependent copyright industries 1. Data used in estimation
The Inter-dependent copyright industry is defined as the industry engaged in media used directly by copyright end products and/or the production of components used by said media. The data employed in estimation, therefore, are mainly those disclosed in “Census of Manufactures”, unlike the calculation method applied in the core copyright industry. In addition, the data in the “Statistics from Analysis of Corporate Financial Statements” are used for calculating the rate of sales cost to sales and the SG&A rate to sales. ○ Statistics used in estimation and data available years Statistics 2003 2004 2005 2006 2007 Census of Manufacturers ✓ ✓ ✓ ✓ ✓ Statistics from Analysis of Corporate Financial Statements ✓ ✓ ✓ ✓ ✓
2. Preconditions of statistics
All estimates are made on a fiscal year basis. 3. Calculation method of the Value of products
Estimation of the Value of products of the inter-dependent copyright industries is made by using the data of the Value of Shipment in “Census of Manufacturers.” It is necessary to note that the figure in a single sector of JCI classification represents of the aggregation of the figures of several items in “Census of Manufacturers”. For further detail, please refer page 113. ○ Estimation of the Value of products [Formula]Value of products = Value of shipment of product A
A Value of shipment of product [Value of shipment of products]by industry in “Census of Manufacturers”
110
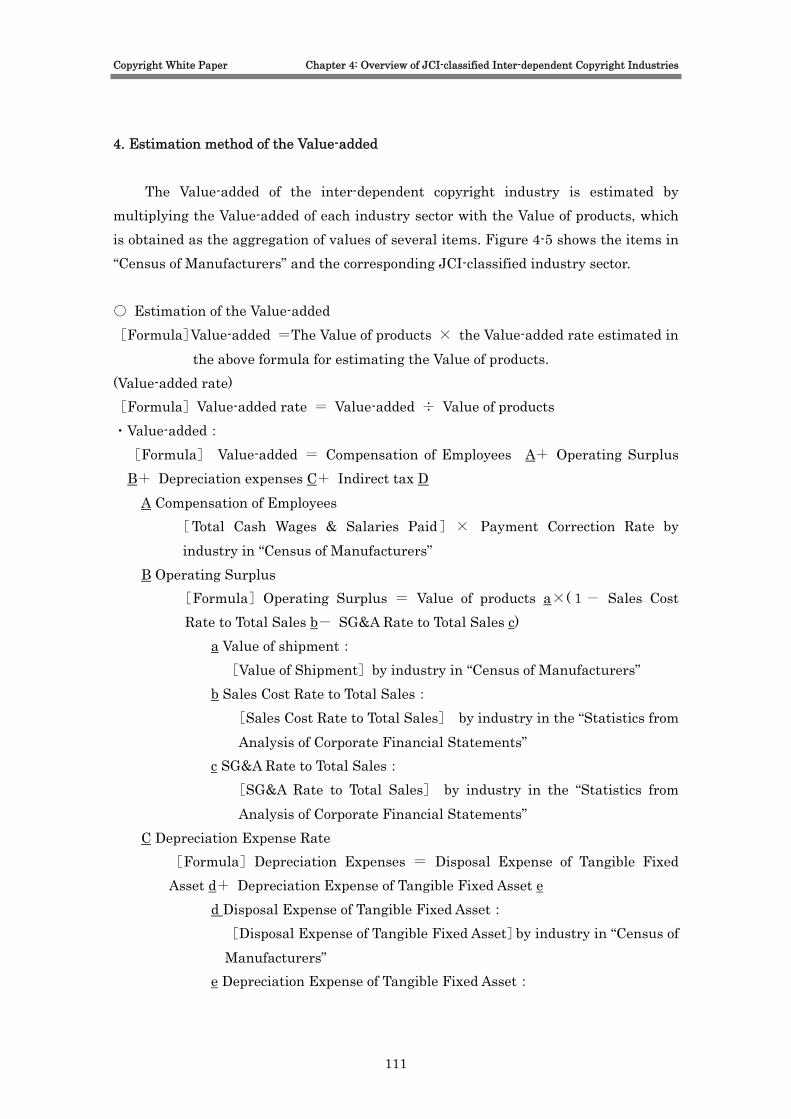
Copyright White Paper Chapter 4: Overview of JCI-classified Inter-dependent Copyright Industries
4. Estimation method of the Value-added
The Value-added of the inter-dependent copyright industry is estimated by multiplying the Value-added of each industry sector with the Value of products, which is obtained as the aggregation of values of several items. Figure 4-5 shows the items in “Census of Manufacturers” and the corresponding JCI-classified industry sector. ○ Estimation of the Value-added [Formula]Value-added =The Value of products × the Value-added rate estimated in
the above formula for estimating the Value of products. (Value-added rate) [Formula]Value-added rate = Value-added ÷ Value of products ・Value-added:
[Formula] Value-added = Compensation of Employees A+ Operating Surplus B+ Depreciation expenses C+ Indirect tax D
A Compensation of Employees [Total Cash Wages & Salaries Paid]× Payment Correction Rate by industry in “Census of Manufacturers”
B Operating Surplus [Formula]Operating Surplus = Value of products a×(1- Sales Cost Rate to Total Sales b- SG&A Rate to Total Sales c)
a Value of shipment: [Value of Shipment]by industry in “Census of Manufacturers”
b Sales Cost Rate to Total Sales: [Sales Cost Rate to Total Sales] by industry in the “Statistics from Analysis of Corporate Financial Statements”
c SG&A Rate to Total Sales: [SG&A Rate to Total Sales] by industry in the “Statistics from Analysis of Corporate Financial Statements”
C Depreciation Expense Rate [Formula]Depreciation Expenses = Disposal Expense of Tangible Fixed Asset d+ Depreciation Expense of Tangible Fixed Asset e
d Disposal Expense of Tangible Fixed Asset: [Disposal Expense of Tangible Fixed Asset]by industry in “Census of Manufacturers”
e Depreciation Expense of Tangible Fixed Asset:
111
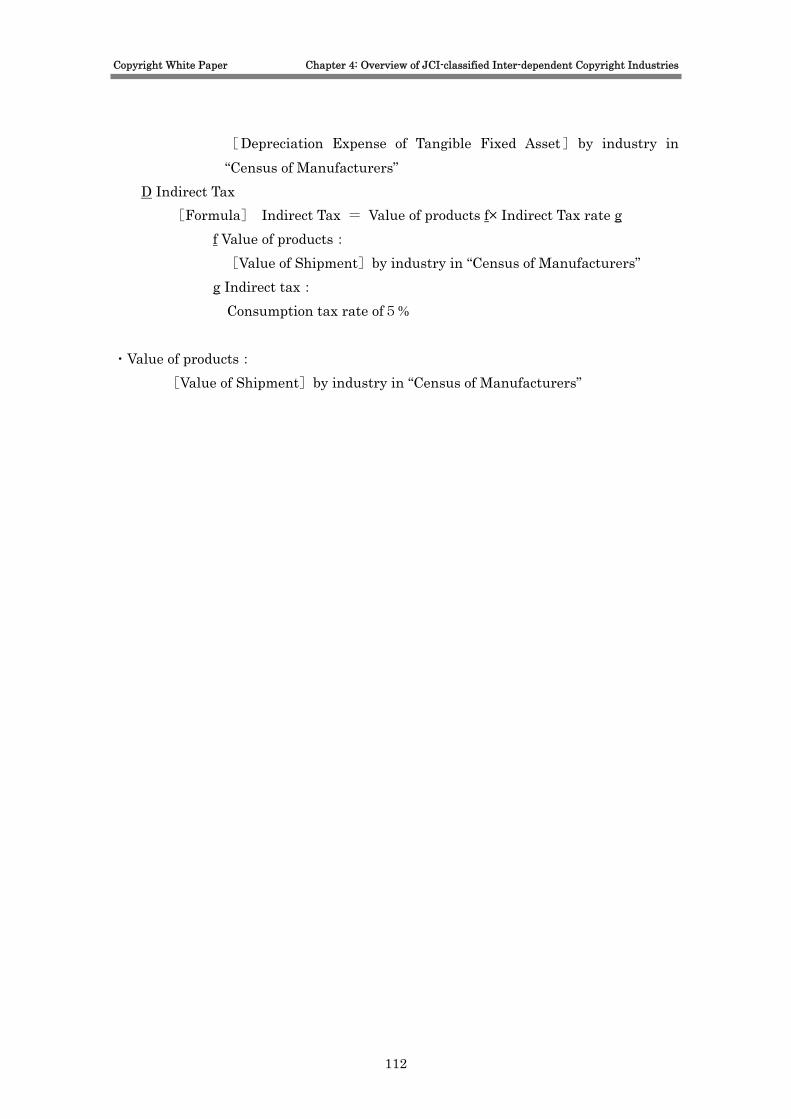
Copyright White Paper Chapter 4: Overview of JCI-classified Inter-dependent Copyright Industries
[Depreciation Expense of Tangible Fixed Asset]by industry in “Census of Manufacturers”
D Indirect Tax [Formula] Indirect Tax = Value of products f× Indirect Tax rate g
f Value of products: [Value of Shipment]by industry in “Census of Manufacturers”
g Indirect tax: Consumption tax rate of5%
・Value of products:
[Value of Shipment]by industry in “Census of Manufacturers”
112

Copyright White Paper Chapter 4: Overview of JCI-classified Inter-dependent Copyright Industries
Figure 4-5 Industry Sector of JCI-Classified Inter-Dependent Copyright Industries and the Corresponding Sector in “Census of Manufacturers”
Commoditycode
Commodity classification name JSIC Code JSIC Name
152111 Rolls of newsprint 1520 Paper152112 Non-painted printing paper152113 Painted printing paper152114 Special printing paper152115 Information paper152116 Writing paper and drawing paper152117 Unbleached wrapping paper152118 Bleached wrapping paper152191 Paper and machine-made Japanese paper (
piecework )175511 Ordinary ink 1755 Printing ink175512 Newspaper ink175513 Vanish for printing ink175591 Printing ink ( piecework )279311 Magnetic tapes (raw) 2793 Magnetic tapes and discs279312 Magnetic discs (raw)279391 Raw magnetic tapes and discs ( piecework )282111 General computers 2821282112 Office computers282113 Work stations282114 Parts, attachments and accessories of data
processing machines, digital and analogcomputers and auxiliary equipment
282191 Data processing machines, digital and analogcomputers, equipment and accessories (piecework )
282211 Personal computers 2822 Personal computer 282212 Parts, attachments and accessories of
personal computers282291 Personal computers, parts, attachments and
accessories ( piecework )282311 Magnetic disc equipment 2823 Storage282312 Optical disc equipment282313 Flexible disc equipment282319 Miscellaneous external memories282321 Parts, attachments and accessories of
external memories282391 External memories parts, attachments and
accessories ( piecework )281211 Radio and TV broadcasting equipment 2812 Radio communication equipment281291 Radio communication equipment ( piecework281311 Radio receivers 2813 Radio and television set receivers 281312 Television receivers, except liquid crystal
receivers281313 Liquid crystal television receivers281391 Radio and television receivers ( piecework )244116 Telecommunication cable 2441244191 Electric wire and cable ( piecework )244212 Optical fiber cable, including composite cable 2442244291 Optical fiber cable ( piecework )281131 Digital transmission equipment 2811 Communication equipment wired 281191 Wired communication equipment ( piecework281213 Cellular telephone sets and PHS telephone
sets2812 Radio communication equipment
281291 Radio communication equipment ( piecework279311 Magnetic tapes (raw) 2793 Magnetic tapes and discs279312 Magnetic discs (raw)279391 Raw magnetic tapes and discs ( piecework )281411 Stereo sets 2814 Electric audio equipment281412 Car stereo sets281413 Tape recorders281414 Digital audio disc players281415 High fidelity (HI-FI) amplifiers281416 Speaker systems for HI-FI and cars281419 Miscellaneous electric audio equipment281422 Parts, attachments and accessories of
electric audio equipment281491 Electric audio equipment, and parts,
attachments and accessories ( piecework )291511 Acoustic parts 2915291512 Magnetic heads291591 Electro acoustic transducers, magnetic heads
and small motors ( piecework )322111 Pianos 3221 Pianos322211 Guitars, including electric guitars 3222 Guitars 322911 Electronic musical instruments 3229322919 Miscellaneous Western and Japanese musical
instruments322921 Parts, attachments and accessories of
musical instruments322991 Musical instruments, parts and materials (
piecework )274211 Video tape recording and duplicating
equipment (VTR, EVR)2742
274212 Video cameras, including integrated VTR-EVR, except broadcast video cameras
274214 Parts, attachments and accessories of videorecording and duplicating equipment
279311 Magnetic tapes (raw) 2793 Magnetic tapes and discs 279312 Magnetic discs (raw)279391 Raw magnetic tapes and discs ( piecework )291512 Magnetic heads 2915291591 Electro acoustic transducers, magnetic heads
and small motors ( piecework )315311 Motion picture equipment 3153315321 Parts, attachments and accessories of
motion picture equipment315391 Motion picture equipment, and parts,
attachments and accessories ( piecework )
Commodity classification name for “Census of Manufacturers JSIC Name
Computer, except personal computer
1.Printing/ Publishing-related Equipment &Media Manufacturing Industries
6.Motion Picture-related Equipment& MediaManufacturing Industries
5.Music-related Equipment & MediaManufacturing Industries
JCI classification
Motion picture equipment and theirparts
3.Broadcasting-related Equipment & MediaManufacturing Industries
4.Transmission-related Equipment & MediaManufacturing Industries
2.Computer Software-related Equipment &Media Manufacturing Industries
Electric wire and cable, except opticalfiber cableOptical fiber cables, includingtelecommunication composite cables
Electro acoustic transducers,magnetic heads and small motors
Miscellaneous musical instruments,parts and materials
Video recording and duplicatingequipment
Electro acoustic transducers,magnetic heads and small motors
113
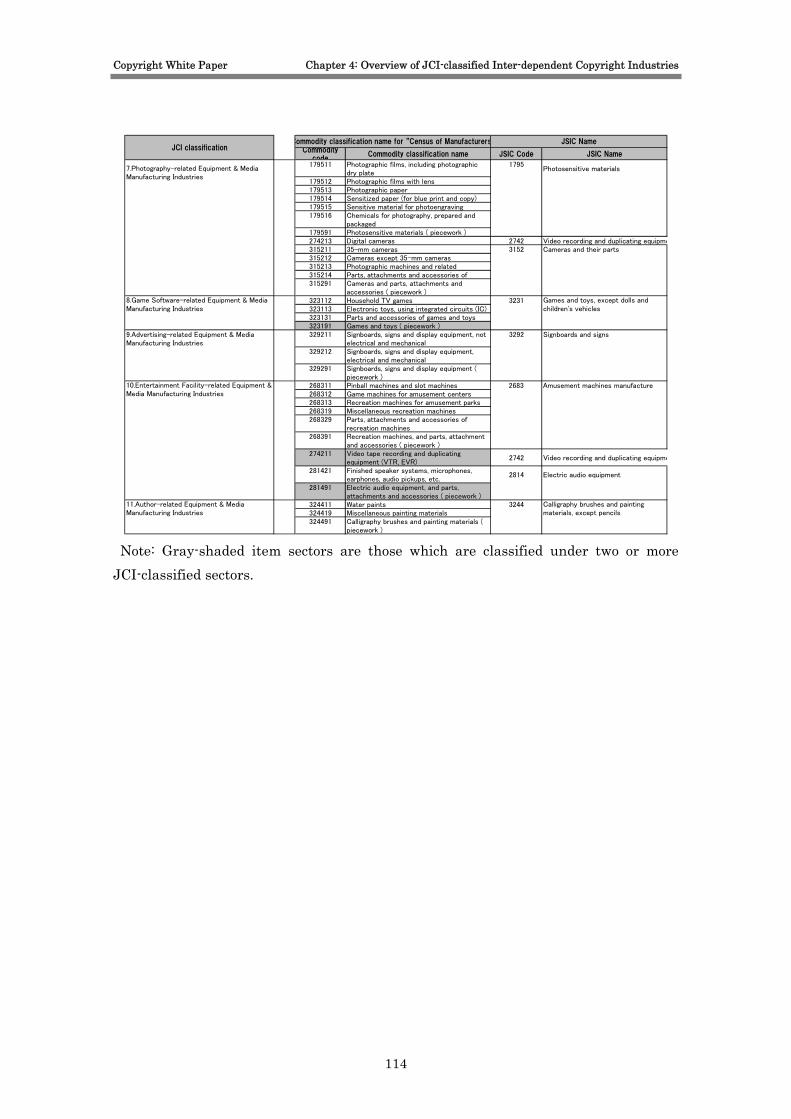
Copyright White Paper Chapter 4: Overview of JCI-classified Inter-dependent Copyright Industries
Commoditycode
Commodity classification name JSIC Code JSIC Name
179511 Photographic films, including photographicdry plate
1795Photosensitive materials
179512 Photographic films with lens179513 Photographic paper179514 Sensitized paper (for blue print and copy)179515 Sensitive material for photoengraving179516 Chemicals for photography, prepared and
packaged179591 Photosensitive materials ( piecework )274213 Digital cameras 2742 Video recording and duplicating equipme315211 35-mm cameras 3152 Cameras and their parts 315212 Cameras except 35-mm cameras315213 Photographic machines and related315214 Parts, attachments and accessories of315291 Cameras and parts, attachments and
accessories ( piecework )323112 Household TV games323113 Electronic toys, using integrated circuits (IC)323131 Parts and accessories of games and toys323191 Games and toys ( piecework )329211 Signboards, signs and display equipment, not
electrical and mechanical3292 Signboards and signs
329212 Signboards, signs and display equipment,electrical and mechanical
329291 Signboards, signs and display equipment (piecework )
268311 Pinball machines and slot machines 2683 Amusement machines manufacture 268312 Game machines for amusement centers268313 Recreation machines for amusement parks268319 Miscellaneous recreation machines268329 Parts, attachments and accessories of
recreation machines268391 Recreation machines, and parts, attachment
and accessories ( piecework )274211 Video tape recording and duplicating
equipment (VTR, EVR)2742 Video recording and duplicating equipme
281421 Finished speaker systems, microphones,earphones, audio pickups, etc.
2814 Electric audio equipment
281491 Electric audio equipment, and parts,attachments and accessories ( piecework )
324411 Water paints 3244324419 Miscellaneous painting materials324491 Calligraphy brushes and painting materials (
piecework )
Commodity classification name for “Census of Manufacturers
7.Photography-related Equipment & MediaManufacturing Industries
JCI classification
11.Author-related Equipment & MediaManufacturing Industries
10.Entertainment Facility-related Equipment &Media Manufacturing Industries
9.Advertising-related Equipment & MediaManufacturing Industries
8.Game Software-related Equipment & MediaManufacturing Industries
Calligraphy brushes and paintingmaterials, except pencils
JSIC Name
Games and toys, except dolls andchildren's vehicles
3231
Note: Gray-shaded item sectors are those which are classified under two or more JCI-classified sectors.
114
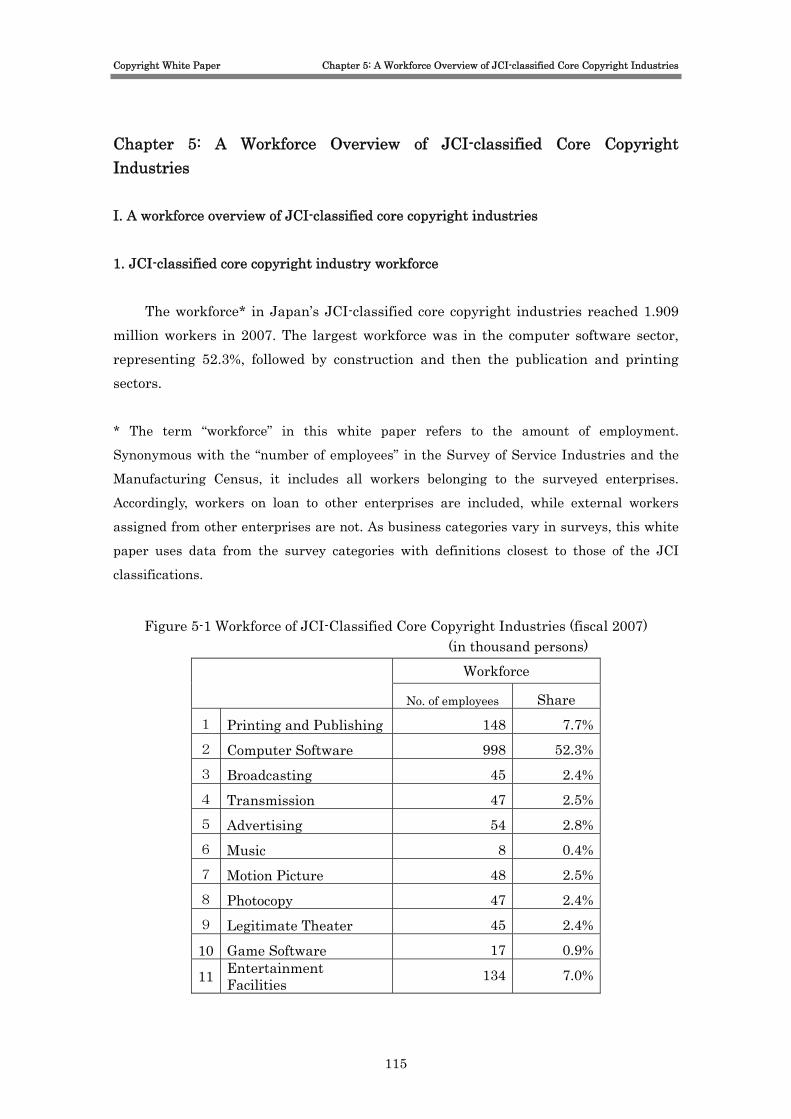
Copyright White Paper Chapter 5: A Workforce Overview of JCI-classified Core Copyright Industries
Chapter 5: A Workforce Overview of JCI-classified Core Copyright Industries I. A workforce overview of JCI-classified core copyright industries 1. JCI-classified core copyright industry workforce
The workforce* in Japan’s JCI-classified core copyright industries reached 1.909 million workers in 2007. The largest workforce was in the computer software sector, representing 52.3%, followed by construction and then the publication and printing sectors.
* The term “workforce” in this white paper refers to the amount of employment.
Synonymous with the “number of employees” in the Survey of Service Industries and the
Manufacturing Census, it includes all workers belonging to the surveyed enterprises.
Accordingly, workers on loan to other enterprises are included, while external workers
assigned from other enterprises are not. As business categories vary in surveys, this white
paper uses data from the survey categories with definitions closest to those of the JCI
classifications.
Figure 5-1 Workforce of JCI-Classified Core Copyright Industries (fiscal 2007) (in thousand persons)
Workforce
No. of employees Share 1 Printing and Publishing 148 7.7% 2 Computer Software 998 52.3% 3 Broadcasting 45 2.4% 4 Transmission 47 2.5% 5 Advertising 54 2.8% 6 Music 8 0.4% 7 Motion Picture 48 2.5% 8 Photocopy 47 2.4% 9 Legitimate Theater 45 2.4%
10 Game Software 17 0.9%
11 Entertainment Facilities 134 7.0%
115

Copyright White Paper Chapter 5: A Workforce Overview of JCI-classified Core Copyright Industries
12 Design 46 2.4%
13 Architecture 245 12.8%
14 Libraries and Museums 25 1.3%
15 Authors and Artists 2 0.1% Total in the copyright industry 1,909 100.0%
2. Positioning of the copyright industry in the national workforce
The total workforce of 1.909 million in the core copyright industry represents 3.0% of Japan’s overall workforce in fiscal 2007. The workforce in the core copyright industry was 1.754 million in number in fiscal 1998. During the concerned period, the workers in the industry have increased at 0.9% of average annual growth. Over the same period (fiscal 1998 – 2007), Japan’s overall workforce has increased at a corresponding rate of -0.3%. As a result, the proportion of the workforce in the core copyright industry rose from the level of 2.6% recorded in fiscal 1998.
Figure 5-2 Positioning of the copyright industry in the national economy
0
500
1,000
1,500
2,000
2,500
3,000
1998 1999 2000 2001 2002 2003 2004 2005 2006 2007 (Fiscal Year)
(thousand persons)
0.0%
0.5%
1.0%
1.5%
2.0%
2.5%
3.0%
3.5%
The workforce in the core copyright industry
Proportion of the workforce(%)
116

Copyright White Paper Chapter 5: A Workforce Overview of JCI-classified Core Copyright Industries
(in thousand persons)
Average Annual
1998 2002 2007 Growth a) JCI-classified
Core Copyright Industry
1,754 1,678 1,909 0.9%
b) No. of workers 66,276 63,592 64,451 -0.3% Share in all workers(a/b) 2.6% 2.6% 3.0%
(Source) No. of workers : the number of employees in “Annual Report on
National Income” (fixed for fiscal 2007)
3. Positioning of JCI-classified core copyright industry as a industry
In fiscal 2007, the number of employees in Japans core copyright industry amounted to 1.909 million workers. This represents a significant number as compared to the corresponding number of workforce in other major industries such as “General Machinery” (1.353 million workers), “Electric Machinery” (1.626 million) and “Transport Equipments” including automobiles (1.252 million).
As for growth capability, the copyright industry grew at 0.9% of average annual growth rate over fiscal years 1998 – 2007. Although this is not as high as the corresponding rate of a key growth industry like the “Transport Equipment” industry including automobiles (at 1.5% of average annual average), it is still regarded as significant level as compared to other industries with negative growth.
Figure 5-3 Comparison with other major industries in respect of workforce (in thousand workers)
1998 2007
Average Annual Growth
Workforce % in all workers
Food 1,617 1,585 -0.2% 2.5% General Machinery 1,399 1,353 -0.4% 2.1% Electric Machinery 2,031 1,626 -2.4% 2.5% Transport Equipment 1,098 1,252 1.5% 1.9% Copyright Industry 1,754 1,909 0.9% 3.0%
(Note)Figures for Workforce Propo9rtion are as of fiscal 2007 (Source)”Annual Report on National Income” (fixed for fiscal 2007)
117
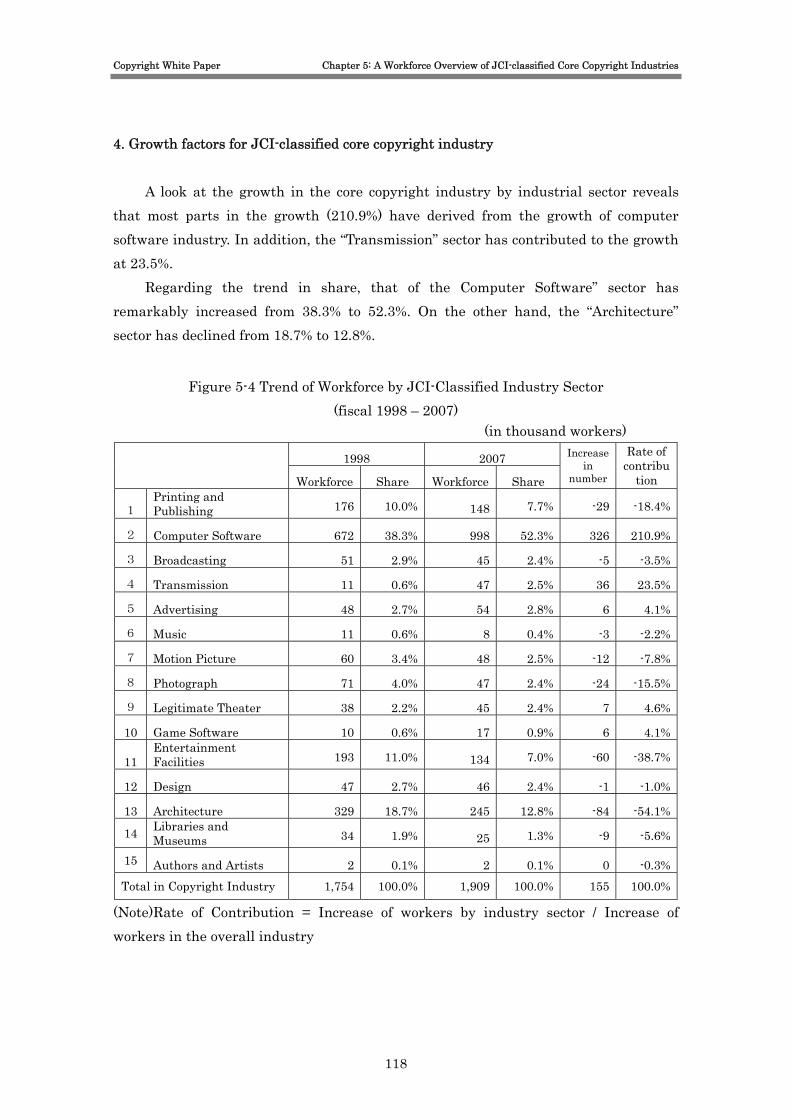
Copyright White Paper Chapter 5: A Workforce Overview of JCI-classified Core Copyright Industries
4. Growth factors for JCI-classified core copyright industry
A look at the growth in the core copyright industry by industrial sector reveals that most parts in the growth (210.9%) have derived from the growth of computer software industry. In addition, the “Transmission” sector has contributed to the growth at 23.5%.
Regarding the trend in share, that of the Computer Software” sector has remarkably increased from 38.3% to 52.3%. On the other hand, the “Architecture” sector has declined from 18.7% to 12.8%.
Figure 5-4 Trend of Workforce by JCI-Classified Industry Sector (fiscal 1998 – 2007)
(in thousand workers)
1998 2007
Workforce Share Workforce Share
Increase in
number
Rate of contribu
tion
1 Printing and Publishing 176 10.0% 148 7.7% -29 -18.4%
2 Computer Software 672 38.3% 998 52.3% 326 210.9%
3 Broadcasting 51 2.9% 45 2.4% -5 -3.5%
4 Transmission 11 0.6% 47 2.5% 36 23.5%
5 Advertising 48 2.7% 54 2.8% 6 4.1%
6 Music 11 0.6% 8 0.4% -3 -2.2%
7 Motion Picture 60 3.4% 48 2.5% -12 -7.8%
8 Photograph 71 4.0% 47 2.4% -24 -15.5%
9 Legitimate Theater 38 2.2% 45 2.4% 7 4.6%
10 Game Software 10 0.6% 17 0.9% 6 4.1%
11 Entertainment Facilities 193 11.0% 134 7.0% -60 -38.7%
12 Design 47 2.7% 46 2.4% -1 -1.0%
13 Architecture 329 18.7% 245 12.8% -84 -54.1%
14 Libraries and Museums 34 1.9% 25 1.3% -9 -5.6%
15 Authors and Artists 2 0.1% 2 0.1% 0 -0.3%Total in Copyright Industry 1,754 100.0% 1,909 100.0% 155 100.0%
(Note)Rate of Contribution = Increase of workers by industry sector / Increase of workers in the overall industry
118
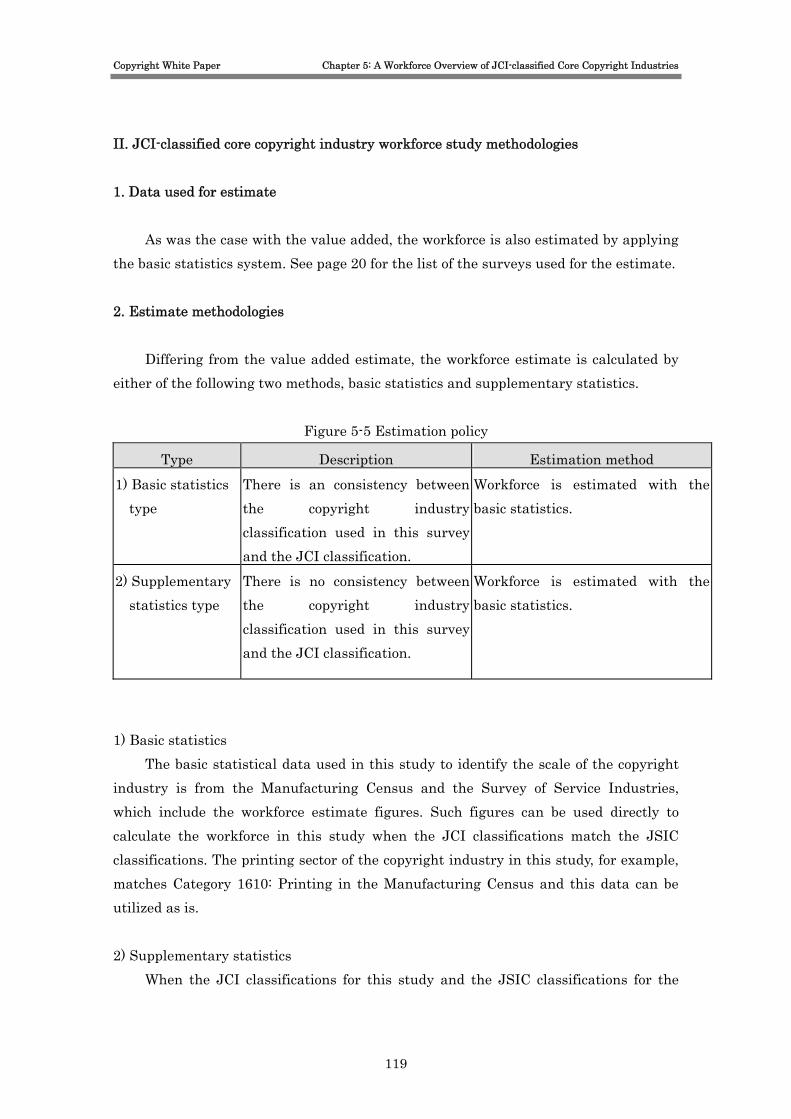
Copyright White Paper Chapter 5: A Workforce Overview of JCI-classified Core Copyright Industries
II. JCI-classified core copyright industry workforce study methodologies 1. Data used for estimate
As was the case with the value added, the workforce is also estimated by applying the basic statistics system. See page 20 for the list of the surveys used for the estimate. 2. Estimate methodologies
Differing from the value added estimate, the workforce estimate is calculated by either of the following two methods, basic statistics and supplementary statistics.
Figure 5-5 Estimation policy
Type Description Estimation method 1) Basic statistics
type There is an consistency between the copyright industry classification used in this survey and the JCI classification.
Workforce is estimated with the basic statistics.
2) Supplementary statistics type
There is no consistency between the copyright industry classification used in this survey and the JCI classification.
Workforce is estimated with the basic statistics.
1) Basic statistics
The basic statistical data used in this study to identify the scale of the copyright industry is from the Manufacturing Census and the Survey of Service Industries, which include the workforce estimate figures. Such figures can be used directly to calculate the workforce in this study when the JCI classifications match the JSIC classifications. The printing sector of the copyright industry in this study, for example, matches Category 1610: Printing in the Manufacturing Census and this data can be utilized as is. 2) Supplementary statistics
When the JCI classifications for this study and the JSIC classifications for the
119
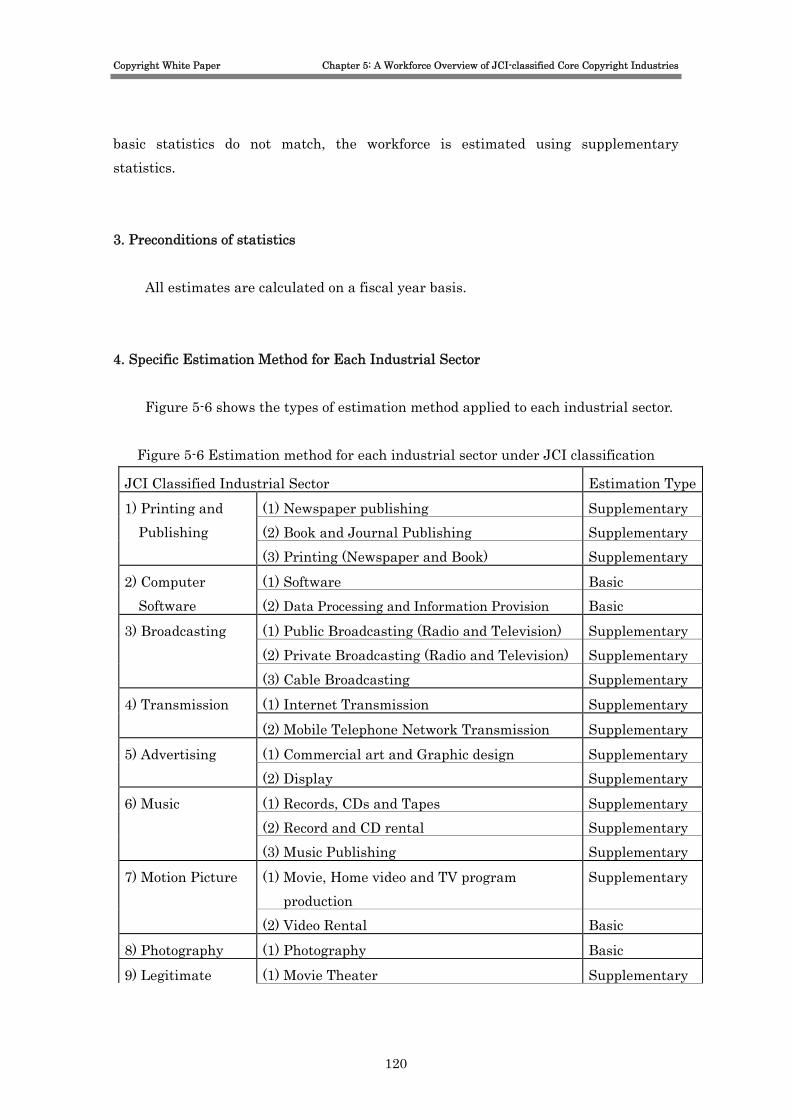
Copyright White Paper Chapter 5: A Workforce Overview of JCI-classified Core Copyright Industries
basic statistics do not match, the workforce is estimated using supplementary statistics. 3. Preconditions of statistics
All estimates are calculated on a fiscal year basis. 4. Specific Estimation Method for Each Industrial Sector
Figure 5-6 shows the types of estimation method applied to each industrial sector.
Figure 5-6 Estimation method for each industrial sector under JCI classification
JCI Classified Industrial Sector Estimation Type(1) Newspaper publishing Supplementary (2) Book and Journal Publishing Supplementary
1) Printing and Publishing
(3) Printing (Newspaper and Book) Supplementary (1) Software Basic 2) Computer
Software (2) Data Processing and Information Provision Basic (1) Public Broadcasting (Radio and Television) Supplementary (2) Private Broadcasting (Radio and Television) Supplementary
3) Broadcasting
(3) Cable Broadcasting Supplementary (1) Internet Transmission Supplementary 4) Transmission (2) Mobile Telephone Network Transmission Supplementary (1) Commercial art and Graphic design Supplementary 5) Advertising (2) Display Supplementary (1) Records, CDs and Tapes Supplementary (2) Record and CD rental Supplementary
6) Music
(3) Music Publishing Supplementary (1) Movie, Home video and TV program production
Supplementary 7) Motion Picture
(2) Video Rental Basic 8) Photography (1) Photography Basic 9) Legitimate (1) Movie Theater Supplementary
120
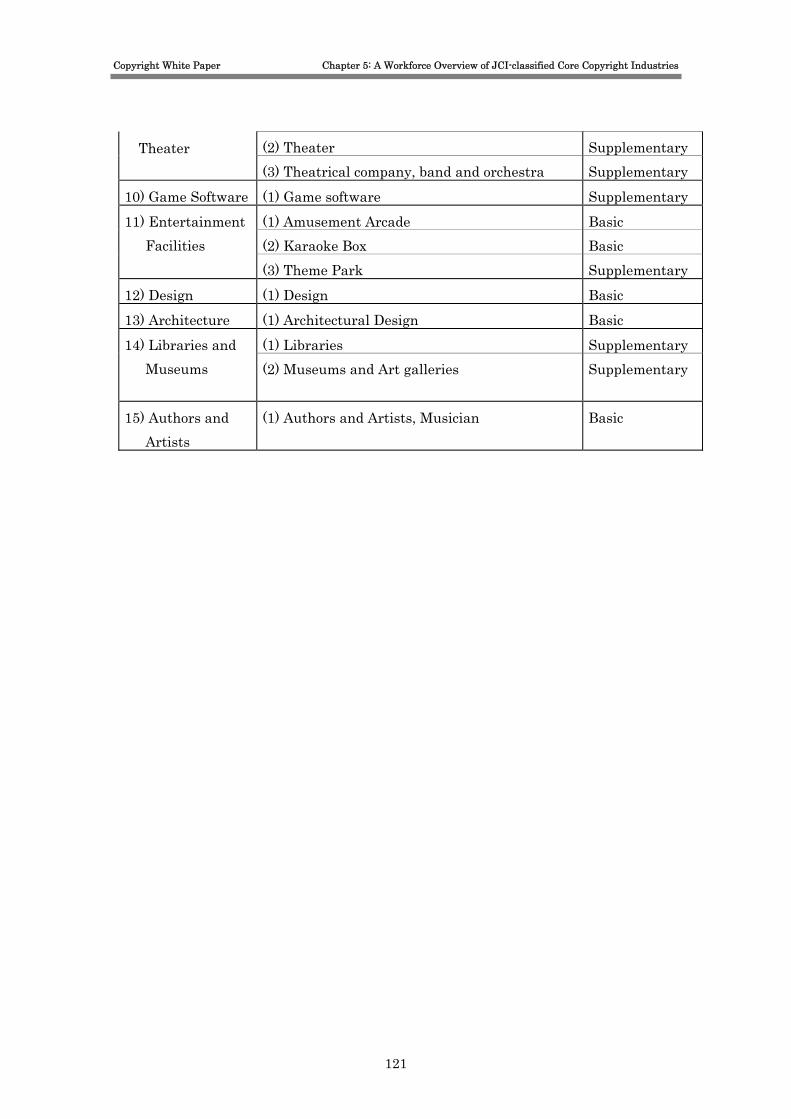
Copyright White Paper Chapter 5: A Workforce Overview of JCI-classified Core Copyright Industries
(2) Theater Supplementary Theater (3) Theatrical company, band and orchestra Supplementary
10) Game Software (1) Game software Supplementary (1) Amusement Arcade Basic (2) Karaoke Box Basic
11) Entertainment Facilities
(3) Theme Park Supplementary 12) Design (1) Design Basic 13) Architecture (1) Architectural Design Basic
(1) Libraries Supplementary 14) Libraries and Museums
(2) Museums and Art galleries Supplementary
15) Authors and Artists
(1) Authors and Artists, Musician Basic
121

Copyright White Paper Chapter 5: A Workforce Overview of JCI-classified Core Copyright Industries
1) Printing and Publishing Industry (1) Newspaper publishing (Supplementary statistics type) ○ Statistics used in estimation and data available years Statistics 2003 2004 2005 2006 2007Survey of Selected Service Industries (Newspaper & Publishing industries) × × ✓ × ×
Total Sales of Newspaper Companies (NSK) ✓ ✓ ✓ ✓ ✓ ○ Estimation of workforce [Formula]Workforce = Number of employees A
A Number of employees: [Number of employees]of Newspaper industry in the “Survey of Selected Industries”
○ Compensation for statistical data The “Survey of Selected Service Industries” is published once every five years, and
the fiscal 2005 edition is the most recent. Data for fiscal 2003, 2004 and 2006 and subsequent years are estimates made by applying the change rate of the scale of newspaper industry market over the previous fiscal year, based on the data disclosed by NSK. Figure 5-7 Market scale and the rate of change over the previous year in the newspaper industry
2003 2004 2005 2006 2007 Market Scale (100 million yen) 23,576 23,797 24,188 23,323 22,182
Rate of change(%) 99% 101% 102% 96% 95%
Source: Material issued by NSK (HP of NSK)
These figures were used for a calculation of workforce in fiscal 2006, for example, by means of the formulas noted below. This was also done for other fiscal years for which data were not available. 〔Formula〕Workforce in 2006 = Workforce in 2005 × Rate of Change
122

Copyright White Paper Chapter 5: A Workforce Overview of JCI-classified Core Copyright Industries
(2) Book & Journal Publishing (Supplemental statistics type) ○ Statistics used in estimation and data available years Statistics 2003 2004 2005 2006 2007 Survey of Selected Service Industries × × ✓ × × Publishing index (AJPEA) ✓ ✓ ✓ ✓ ✓
○ Estimation of Workforce [Formula]Workforce = Number of employees A
A Number of employees: [Number of employees]of Publishing industry in the “Survey of Selected Industries”
○ Compensation for statistical data
The “Survey of Selected Service Industries” is published once every five years, and the fiscal 2005 edition is the most recent. Data for fiscal 2003, 2004 and 2006 and subsequent years are estimates made by applying the change rate of the scale of newspaper industry market over the previous fiscal year, based on the data in the “Publishing Index”. Figure 5-8 Market scale and the rate of change over the previous year in the newspaper industry
2003 2004 2005 2006 2007 Market Scale (100million yen) 22,278 22,428 21,964 21,525 20,853
Rate of change(%) 96% 101% 98% 98% 97% Source: Publishing Index
These figures were used for a calculation of workforce in fiscal 2006, for example,
by means of the formulas noted below. This was also done for other fiscal years for which data were not available. 〔Formula〕Workforce in 2006 = Workforce in 2005 × Rate of Change (3) Printing (Newspaper & Book) (Supplemental statistics type)
In the "Census of Manufactures", Sector 161 (Printing Industry) includes not only the printing of newspapers, books, and magazines but also items that have no relation with copyright, such as business forms and product packages. As such, the subtotal
123

Copyright White Paper Chapter 5: A Workforce Overview of JCI-classified Core Copyright Industries
for newspapers, books, and magazines must be isolated. This was done by using their shares of the total sales of demanded printing products in the industry. ○ Statistics used in estimation and data available years Statistics 2003 2004 2005 2006 2007 Census of Manufactures ✓ ✓ ✓ ✓ ✓ White Paper on the Printing Industry ✓ ✓ ✓ ✓ ✓
○ Estimation of Workforce [Formula]Workforce = Number of employees A× Ratio of newspaper and book
publishing B A Number of employees: [ Number of employees ] in Sector 161 Printing Industry in “Census of Manufacturers”
B Ratio of newspaper and book publishing : The "White Paper on the Printing Industry" presents the value of printing products demanded by major customer of the printing industry.” These data were used to estimate the share of newspaper & publishing sector in the entire printing industry.
[Formula] Ratio of newspaper and publishing B = [Value of products (newspaper) a +
Value of products (publishing) b] / Value of products(all) c a Value of products(newspaper)
[Value of printing industry products in each major customer industry] in Publishing industry in Newspaper industry in the "White Paper on the Printing Industry"
b Value of products(publishing) [Value of printing industry products in each major customer industry] in Publishing industry in the "White Paper on the Printing Industry"
c Value of products(all) [Value of printing industry products in each major customer industry] in
All industry in the "White Paper on the Printing Industry"
*" Amount of printing products demanded by major customer type in the printing industry"
"Amount of printing products demanded by major customer type in the printing industry", which was taken from the "White Paper on the Printing Industry" published
124

Copyright White Paper Chapter 5: A Workforce Overview of JCI-classified Core Copyright Industries
each year by the Japan Association of Graphic Arts Technology, has not been disclosed since fiscal 2000. For this report, it was estimated on the assumption that the share of the total value-added in the printing and publishing industry occupied by the newspaper publishing industry has stayed the same since that year.
125
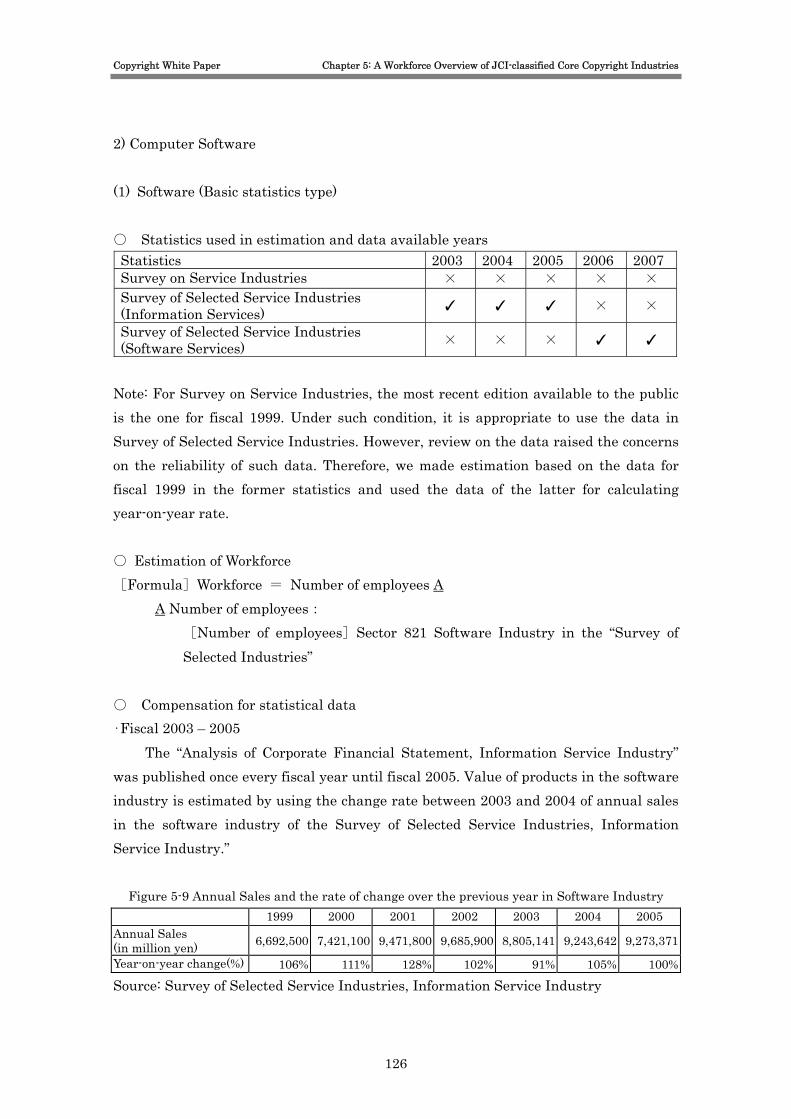
Copyright White Paper Chapter 5: A Workforce Overview of JCI-classified Core Copyright Industries
2) Computer Software (1) Software (Basic statistics type) ○ Statistics used in estimation and data available years Statistics 2003 2004 2005 2006 2007 Survey on Service Industries × × × × × Survey of Selected Service Industries (Information Services) ✓ ✓ ✓ × ×
Survey of Selected Service Industries (Software Services) × × × ✓ ✓
Note: For Survey on Service Industries, the most recent edition available to the public is the one for fiscal 1999. Under such condition, it is appropriate to use the data in Survey of Selected Service Industries. However, review on the data raised the concerns on the reliability of such data. Therefore, we made estimation based on the data for fiscal 1999 in the former statistics and used the data of the latter for calculating year-on-year rate. ○ Estimation of Workforce [Formula]Workforce = Number of employees A
A Number of employees: [Number of employees]Sector 821 Software Industry in the “Survey of Selected Industries”
○ Compensation for statistical data ・Fiscal 2003 – 2005
The “Analysis of Corporate Financial Statement, Information Service Industry” was published once every fiscal year until fiscal 2005. Value of products in the software industry is estimated by using the change rate between 2003 and 2004 of annual sales in the software industry of the Survey of Selected Service Industries, Information Service Industry.”
Figure 5-9 Annual Sales and the rate of change over the previous year in Software Industry 1999 2000 2001 2002 2003 2004 2005
Annual Sales (in million yen) 6,692,500 7,421,100 9,471,800 9,685,900 8,805,141 9,243,642 9,273,371
Year-on-year change(%) 106% 111% 128% 102% 91% 105% 100%
Source: Survey of Selected Service Industries, Information Service Industry
126
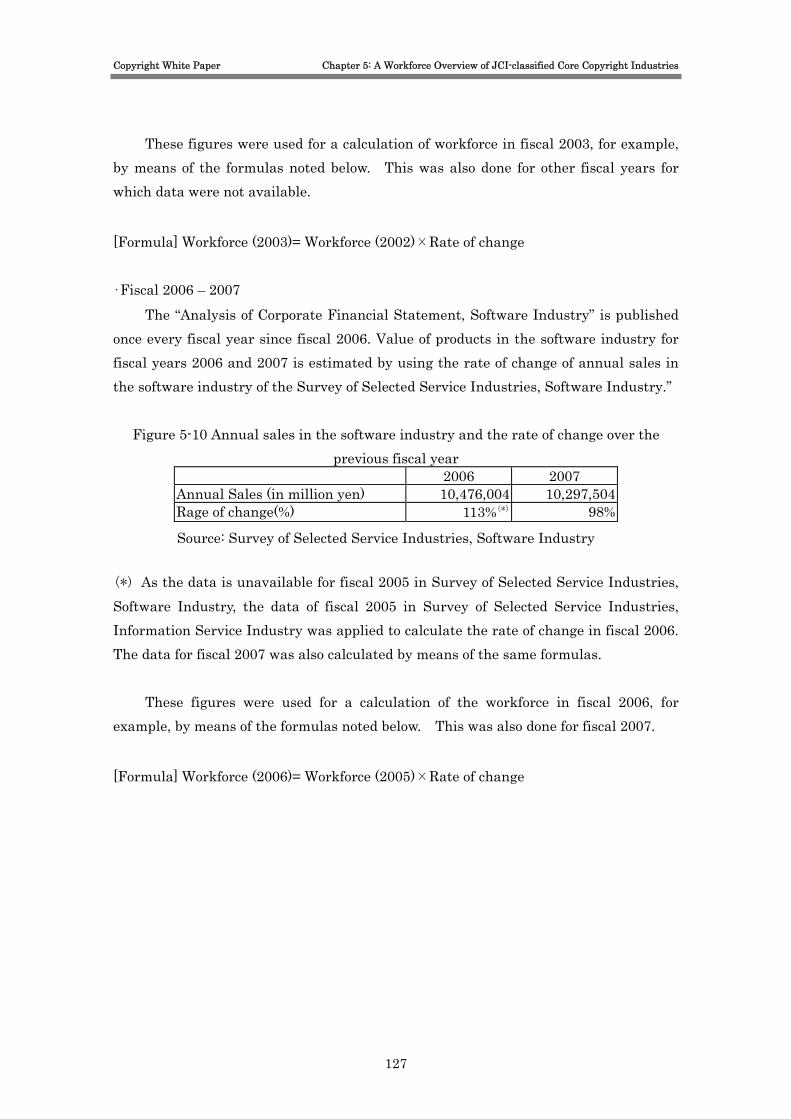
Copyright White Paper Chapter 5: A Workforce Overview of JCI-classified Core Copyright Industries
These figures were used for a calculation of workforce in fiscal 2003, for example, by means of the formulas noted below. This was also done for other fiscal years for which data were not available.
[Formula] Workforce (2003)= Workforce (2002)×Rate of change
・Fiscal 2006 – 2007 The “Analysis of Corporate Financial Statement, Software Industry” is published
once every fiscal year since fiscal 2006. Value of products in the software industry for fiscal years 2006 and 2007 is estimated by using the rate of change of annual sales in the software industry of the Survey of Selected Service Industries, Software Industry.”
Figure 5-10 Annual sales in the software industry and the rate of change over the previous fiscal year
2006 2007 Annual Sales (in million yen) 10,476,004 10,297,504 Rage of change(%) 113%(*) 98%
Source: Survey of Selected Service Industries, Software Industry (*) As the data is unavailable for fiscal 2005 in Survey of Selected Service Industries, Software Industry, the data of fiscal 2005 in Survey of Selected Service Industries, Information Service Industry was applied to calculate the rate of change in fiscal 2006. The data for fiscal 2007 was also calculated by means of the same formulas.
These figures were used for a calculation of the workforce in fiscal 2006, for example, by means of the formulas noted below. This was also done for fiscal 2007.
[Formula] Workforce (2006)= Workforce (2005)×Rate of change
127
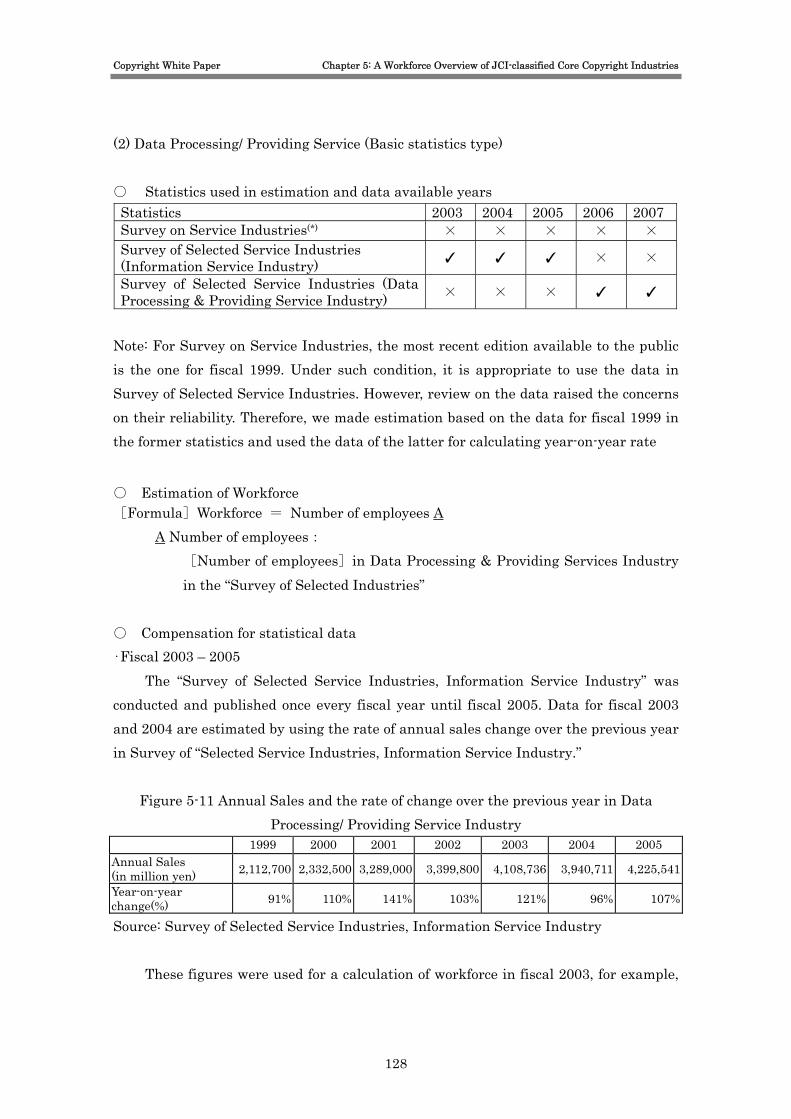
Copyright White Paper Chapter 5: A Workforce Overview of JCI-classified Core Copyright Industries
(2) Data Processing/ Providing Service (Basic statistics type) ○ Statistics used in estimation and data available years Statistics 2003 2004 2005 2006 2007 Survey on Service Industries(*) × × × × × Survey of Selected Service Industries (Information Service Industry) ✓ ✓ ✓ × ×
Survey of Selected Service Industries (Data Processing & Providing Service Industry) × × × ✓ ✓
Note: For Survey on Service Industries, the most recent edition available to the public is the one for fiscal 1999. Under such condition, it is appropriate to use the data in Survey of Selected Service Industries. However, review on the data raised the concerns on their reliability. Therefore, we made estimation based on the data for fiscal 1999 in the former statistics and used the data of the latter for calculating year-on-year rate
○ Estimation of Workforce [Formula]Workforce = Number of employees A
A Number of employees: [Number of employees]in Data Processing & Providing Services Industry in the “Survey of Selected Industries”
○ Compensation for statistical data ・Fiscal 2003 – 2005
The “Survey of Selected Service Industries, Information Service Industry” was conducted and published once every fiscal year until fiscal 2005. Data for fiscal 2003 and 2004 are estimated by using the rate of annual sales change over the previous year in Survey of “Selected Service Industries, Information Service Industry.”
Figure 5-11 Annual Sales and the rate of change over the previous year in Data Processing/ Providing Service Industry
1999 2000 2001 2002 2003 2004 2005 Annual Sales (in million yen) 2,112,700 2,332,500 3,289,000 3,399,800 4,108,736 3,940,711 4,225,541
Year-on-year change(%) 91% 110% 141% 103% 121% 96% 107%
Source: Survey of Selected Service Industries, Information Service Industry
These figures were used for a calculation of workforce in fiscal 2003, for example,
128
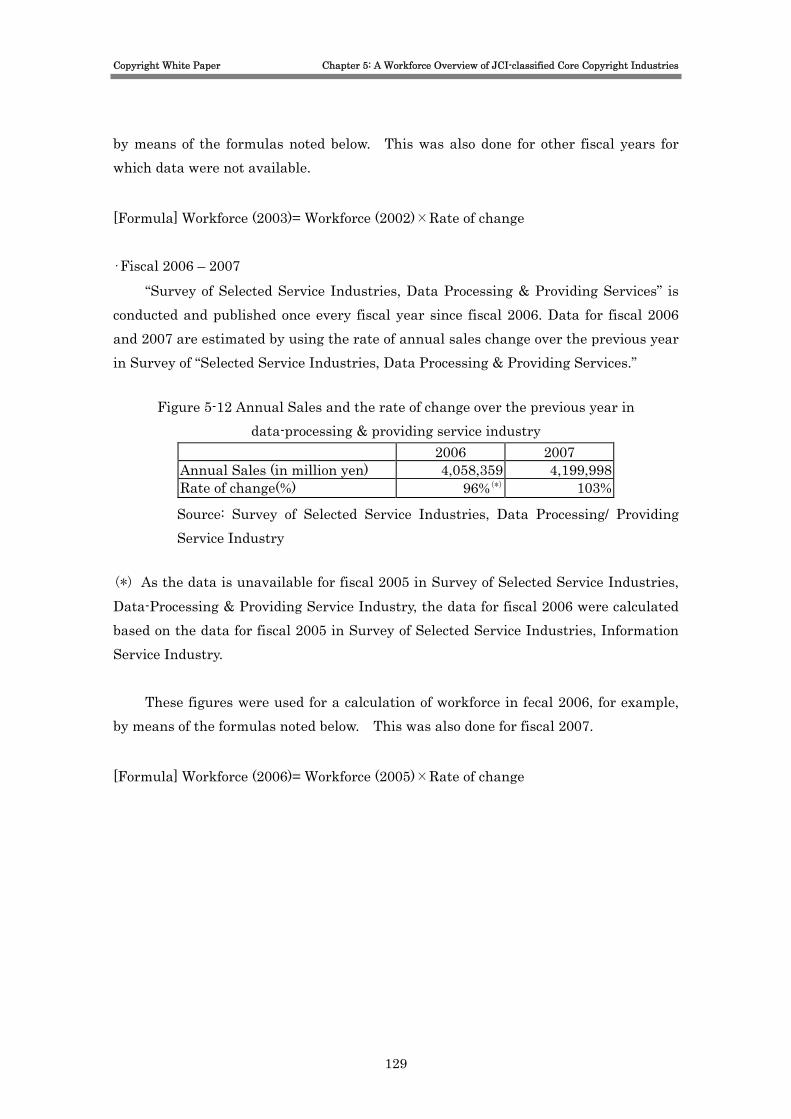
Copyright White Paper Chapter 5: A Workforce Overview of JCI-classified Core Copyright Industries
by means of the formulas noted below. This was also done for other fiscal years for which data were not available.
[Formula] Workforce (2003)= Workforce (2002)×Rate of change ・Fiscal 2006 – 2007
“Survey of Selected Service Industries, Data Processing & Providing Services” is conducted and published once every fiscal year since fiscal 2006. Data for fiscal 2006 and 2007 are estimated by using the rate of annual sales change over the previous year in Survey of “Selected Service Industries, Data Processing & Providing Services.”
Figure 5-12 Annual Sales and the rate of change over the previous year in data-processing & providing service industry
2006 2007 Annual Sales (in million yen) 4,058,359 4,199,998 Rate of change(%) 96%(*) 103%
Source: Survey of Selected Service Industries, Data Processing/ Providing Service Industry
(*) As the data is unavailable for fiscal 2005 in Survey of Selected Service Industries, Data-Processing & Providing Service Industry, the data for fiscal 2006 were calculated based on the data for fiscal 2005 in Survey of Selected Service Industries, Information Service Industry.
These figures were used for a calculation of workforce in fecal 2006, for example, by means of the formulas noted below. This was also done for fiscal 2007.
[Formula] Workforce (2006)= Workforce (2005)×Rate of change
129

Copyright White Paper Chapter 5: A Workforce Overview of JCI-classified Core Copyright Industries
3) Broadcasting (1) Public Broadcasting (Supplementary statistics type) ○ Statistics used in estimation and data available years
Statistics 2003 2004 2005 2006 2007 Survey on Information and Communication Industry ✓ ✓ ✓ ✓ N/A*Radio & Television Year book ✓ ✓ ✓ ✓ ✓
* The edition for fiscal 2007 will be published in June 2009. ○ Estimation of Workforce [Formula]Workforce = Number of employees A
A Number of employees: [Number of employees]in Public Broadcasting Industry in the “Survey of on Information and Communication Industry”
○ Compensation for statistical data The “Survey on the Telecommunication Industry” is published every fiscal year
since 1999. The edition for fiscal 2006 is the most recent. The data for fiscal years of 1998 and 2007 were estimated by applying the rate of change over the previous year in terms of operating incomes in Radio & Television Yearbook.
Figure 5-13 Operating income of NHK and the rate of change over the previous year 1998 1999
Incomes (million yen) 633,712 645,042 Rate of change(%) - 101.8%
Source : Radio & Television Yearbook
These figures are used for estimation of the Value of products and the Value-added in fiscal 1998 by means of the formula noted below: [Formula] Value of products(1998)= Value of products(1999)÷ Rate of change
Figure 5-14 Income of NHK and the rate of change over the previous year 2006 2007
Incomes (million yen) 675,607 684,796Rate of change(%) - 101.4%
Source : Radio & Television Yearbook
130

Copyright White Paper Chapter 5: A Workforce Overview of JCI-classified Core Copyright Industries
These figures are used for calculation of the Value of products and the
Value-added in fiscal 2007 by means of the formula noted below:
[Formula] Value of products(2007)= Value of products(2006) × Rate of change (2) Private Broadcasting (Supplementary statistics type) ○ Statistics used in estimation and data available years Statistics 2003 2004 2005 2006 2007 Japan Commercial Broadcasting Yearbook ✓ ✓ ✓ ✓ ✓
○ Estimation of Workforce [Formula]Workforce = Number of employees A
A Number of employees: [Number of employees]in the data on digital terrestrial television in the “Japan Commercial Broadcasting Yearbook”
(3) Cable Broadcasting (Supplementary statistics type) ○ Statistics used in estimation and data available years Statistics 2003 2004 2005 2006 2007 Survey on the Telecommunication Industry ✓ ✓ ✓ ✓ NA*Japan Commercial Broadcasting Yearbook ✓ ✓ ✓ ✓ ✓
* The edition for fiscal 2007 will be published in June 2009. ○ Estimation of Workforce [Formula]Workforce = Number of employees A
A Number of employees: [Number of employees]in Cable Broadcasting Industry in the “Survey of on Information and Communication Industry”
○ Compensation for statistical data
The “Survey on the Telecommunication Industry” is published once every fiscal year. The edition for fiscal 2006 is the most recent. The data for fiscal 2007 were estimated by applying the rate of change over the previous year, which was calculated with operating incomes in Japan Commercial Broadcasting Yearbook.
131
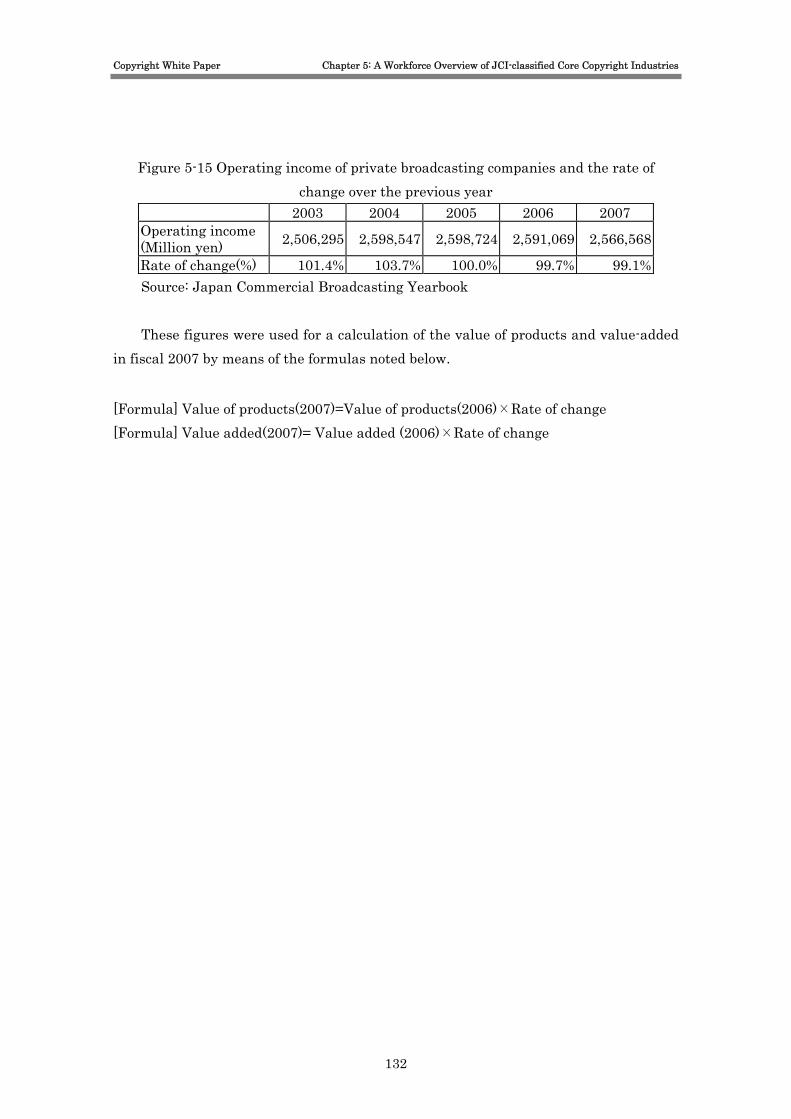
Copyright White Paper Chapter 5: A Workforce Overview of JCI-classified Core Copyright Industries
Figure 5-15 Operating income of private broadcasting companies and the rate of
change over the previous year 2003 2004 2005 2006 2007
Operating income (Million yen) 2,506,295 2,598,547 2,598,724 2,591,069 2,566,568
Rate of change(%) 101.4% 103.7% 100.0% 99.7% 99.1% Source: Japan Commercial Broadcasting Yearbook
These figures were used for a calculation of the value of products and value-added
in fiscal 2007 by means of the formulas noted below.
[Formula] Value of products(2007)=Value of products(2006)×Rate of change [Formula] Value added(2007)= Value added (2006)×Rate of change
132
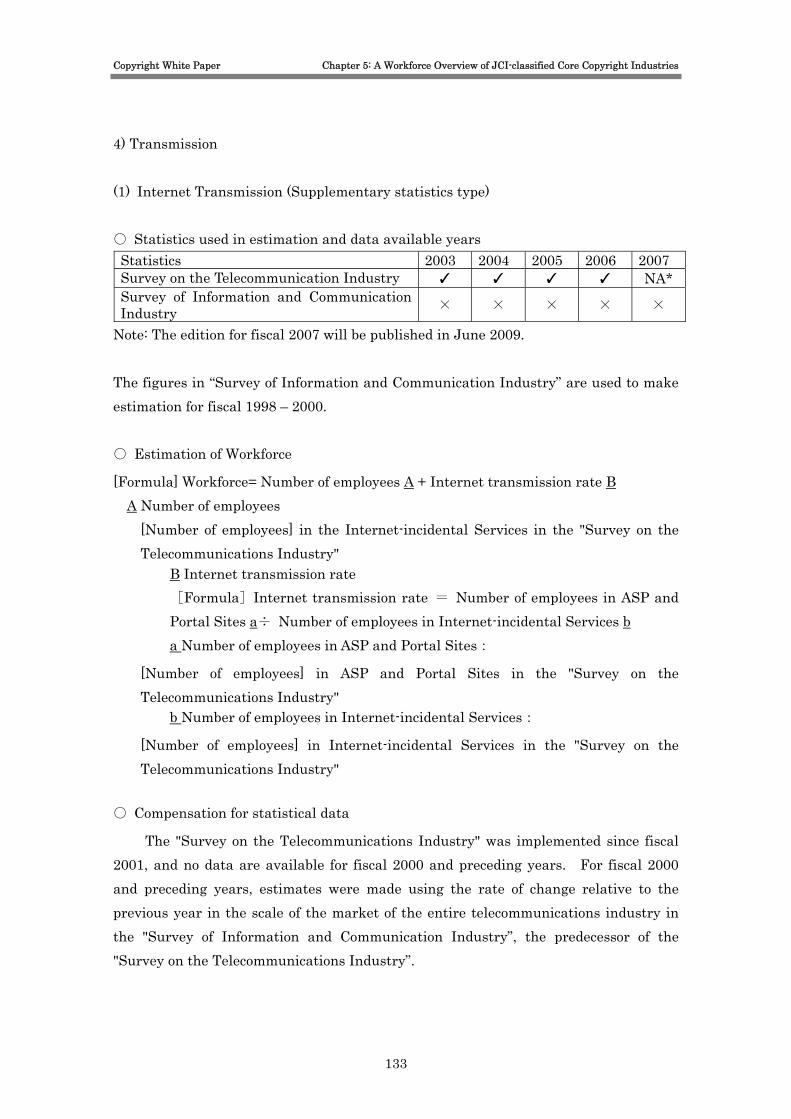
Copyright White Paper Chapter 5: A Workforce Overview of JCI-classified Core Copyright Industries
4) Transmission (1) Internet Transmission (Supplementary statistics type) ○ Statistics used in estimation and data available years Statistics 2003 2004 2005 2006 2007 Survey on the Telecommunication Industry ✓ ✓ ✓ ✓ NA* Survey of Information and Communication Industry × × × × ×
Note: The edition for fiscal 2007 will be published in June 2009. The figures in “Survey of Information and Communication Industry” are used to make estimation for fiscal 1998 – 2000. ○ Estimation of Workforce
[Formula] Workforce= Number of employees A + Internet transmission rate B A Number of employees
[Number of employees] in the Internet-incidental Services in the "Survey on the Telecommunications Industry"
B Internet transmission rate [Formula]Internet transmission rate = Number of employees in ASP and Portal Sites a÷ Number of employees in Internet-incidental Services b a Number of employees in ASP and Portal Sites:
[Number of employees] in ASP and Portal Sites in the "Survey on the Telecommunications Industry"
b Number of employees in Internet-incidental Services:
[Number of employees] in Internet-incidental Services in the "Survey on the Telecommunications Industry"
○ Compensation for statistical data
The "Survey on the Telecommunications Industry" was implemented since fiscal 2001, and no data are available for fiscal 2000 and preceding years. For fiscal 2000 and preceding years, estimates were made using the rate of change relative to the previous year in the scale of the market of the entire telecommunications industry in the "Survey of Information and Communication Industry”, the predecessor of the "Survey on the Telecommunications Industry”.
133
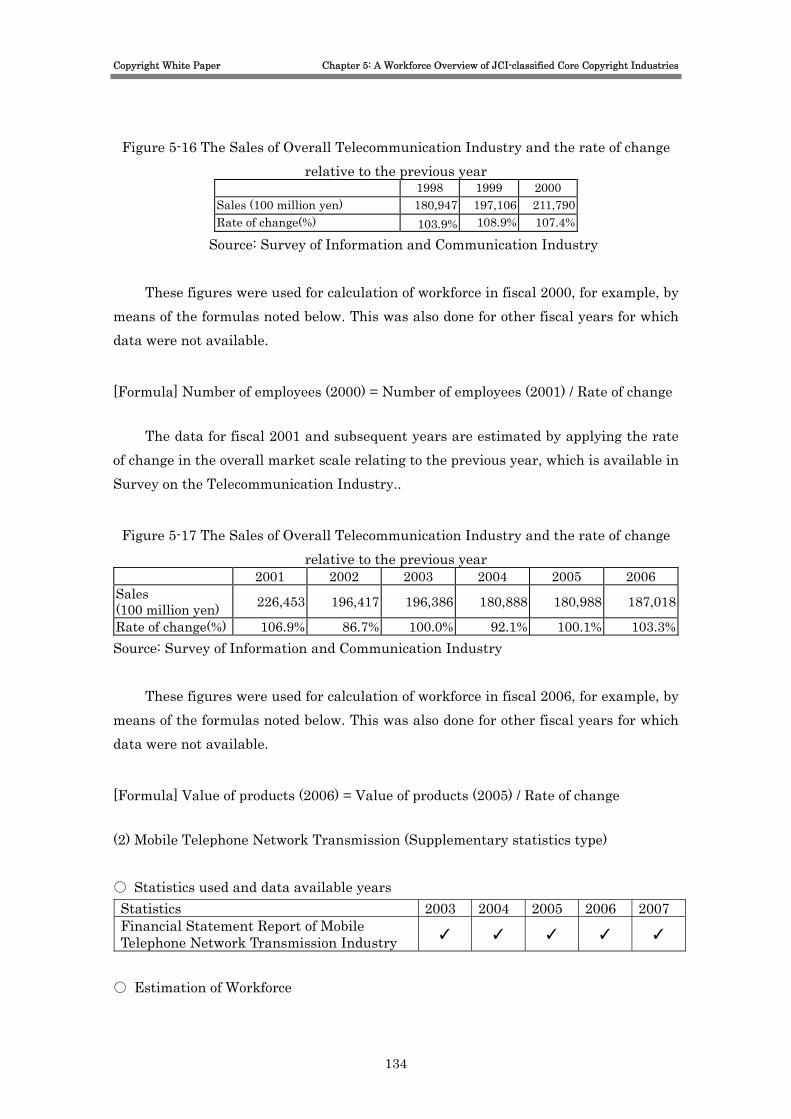
Copyright White Paper Chapter 5: A Workforce Overview of JCI-classified Core Copyright Industries
Figure 5-16 The Sales of Overall Telecommunication Industry and the rate of change relative to the previous year
1998 1999 2000 Sales (100 million yen) 180,947 197,106 211,790 Rate of change(%) 103.9% 108.9% 107.4%
Source: Survey of Information and Communication Industry
These figures were used for calculation of workforce in fiscal 2000, for example, by means of the formulas noted below. This was also done for other fiscal years for which data were not available.
[Formula] Number of employees (2000) = Number of employees (2001) / Rate of change
The data for fiscal 2001 and subsequent years are estimated by applying the rate of change in the overall market scale relating to the previous year, which is available in Survey on the Telecommunication Industry..
Figure 5-17 The Sales of Overall Telecommunication Industry and the rate of change relative to the previous year
2001 2002 2003 2004 2005 2006 Sales (100 million yen) 226,453 196,417 196,386 180,888 180,988 187,018
Rate of change(%) 106.9% 86.7% 100.0% 92.1% 100.1% 103.3%Source: Survey of Information and Communication Industry
These figures were used for calculation of workforce in fiscal 2006, for example, by means of the formulas noted below. This was also done for other fiscal years for which data were not available.
[Formula] Value of products (2006) = Value of products (2005) / Rate of change (2) Mobile Telephone Network Transmission (Supplementary statistics type)
○ Statistics used and data available years Statistics 2003 2004 2005 2006 2007 Financial Statement Report of Mobile Telephone Network Transmission Industry ✓ ✓ ✓ ✓ ✓
○ Estimation of Workforce
134

Copyright White Paper Chapter 5: A Workforce Overview of JCI-classified Core Copyright Industries
[Formula] Workforce= Number of employees A A Number of employees :
Σ{[Number of employees] in the “Financial Statement Report” in Mobile Telephone Network Transmission Industry}
135
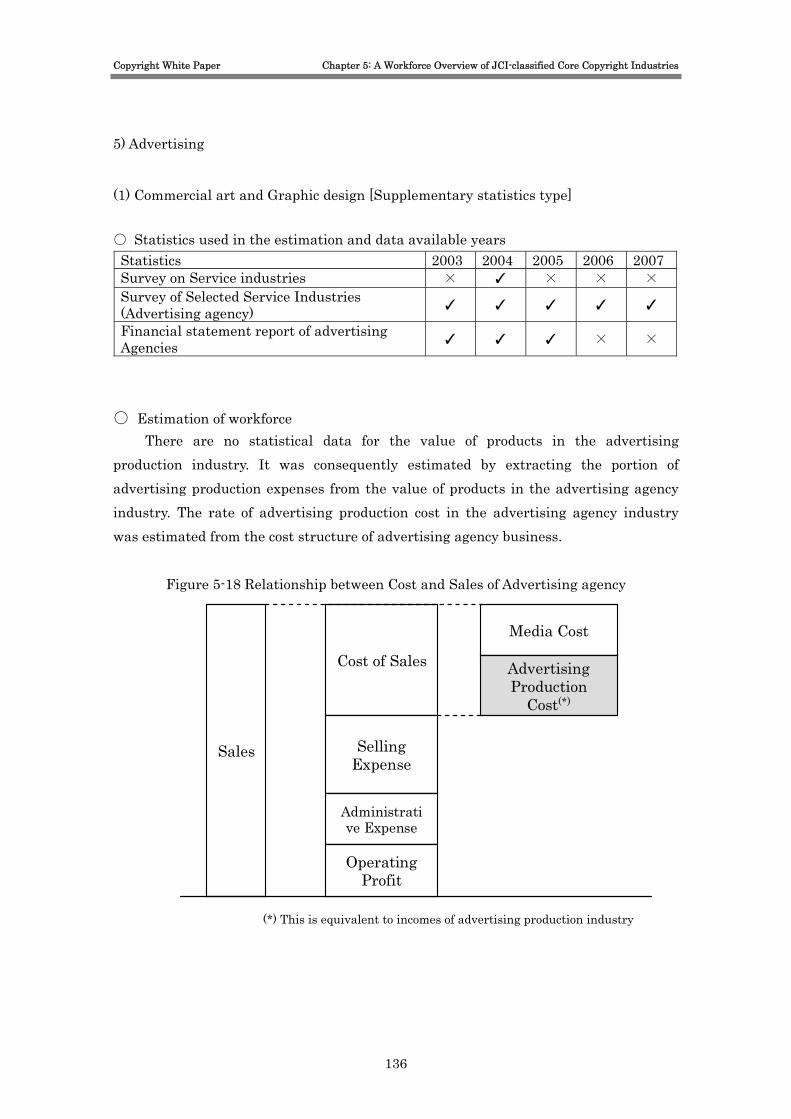
Copyright White Paper Chapter 5: A Workforce Overview of JCI-classified Core Copyright Industries
5) Advertising
(1) Commercial art and Graphic design [Supplementary statistics type] ○ Statistics used in the estimation and data available years Statistics 2003 2004 2005 2006 2007 Survey on Service industries × ✓ × × × Survey of Selected Service Industries (Advertising agency) ✓ ✓ ✓ ✓ ✓
Financial statement report of advertising Agencies ✓ ✓ ✓ × ×
○ Estimation of workforce
There are no statistical data for the value of products in the advertising production industry. It was consequently estimated by extracting the portion of advertising production expenses from the value of products in the advertising agency industry. The rate of advertising production cost in the advertising agency industry was estimated from the cost structure of advertising agency business.
Figure 5-18 Relationship between Cost and Sales of Advertising agency
Sales
Cost of Sales
Selling Expense
Administrative Expense
Operating Profit
Media Cost
Advertising Production
Cost(*)
(*) This is equivalent to incomes of advertising production industry
136

Copyright White Paper Chapter 5: A Workforce Overview of JCI-classified Core Copyright Industries
[Formula] Number of employees = Number of employees in advertising agencies industry A×advertising production cost rate B
A Number of employees in advertising agencies industry [Number of employees] in Sector 891(advertising agencies) in the "Survey on Service industries"
B advertising production cost rate Advertising production cost rate was estimated with of a weighted average of advertising production cost rate in each financial statement report.
[Formula] Advertising production cost rate = Sum of Advertising production cost a / Sum of Sales b
a Sum of Advertising production cost Σ[Advertising production cost] in the "Financial Statement (Advertising agency companies)"
b Sum of Sales Σ[Sales] in the "Financial Statement (Advertising agency companies)"
*This Value-added rate was calculated on a basis of financial statement reports released by enterprises making continuous disclosure of income statements.
○ Compensation for statistical data
The "Survey on Service Industries" is published once every five years, and the fiscal 2004 edition was the most recent. Data for fiscal 2003 and the fiscal years after 2005 are estimates made by application of the rate of change in the yearly sales in the section on the advertising industry in the "Survey of Selected Service Industries”.
Figure 5-19 Number of regular employees in advertising industry and the rate of change over the previous year
2003 2004 2005 2006 2007 No. of regular employees 34,607 35,376 38,098 40,183 41,192
Rate of change(%) 96% 102% 108% 105% 103%
Source: "Survey of Selected Service Industries (Advertising)" These figures were used for a calculation of workforce in fiscal 2005, for example,
by means of the formulas noted below. This was also done for other fiscal years for which data were not available. [Formula] No. of Workforce (2005) = No. of Workforce (2004)×Rate of change
137
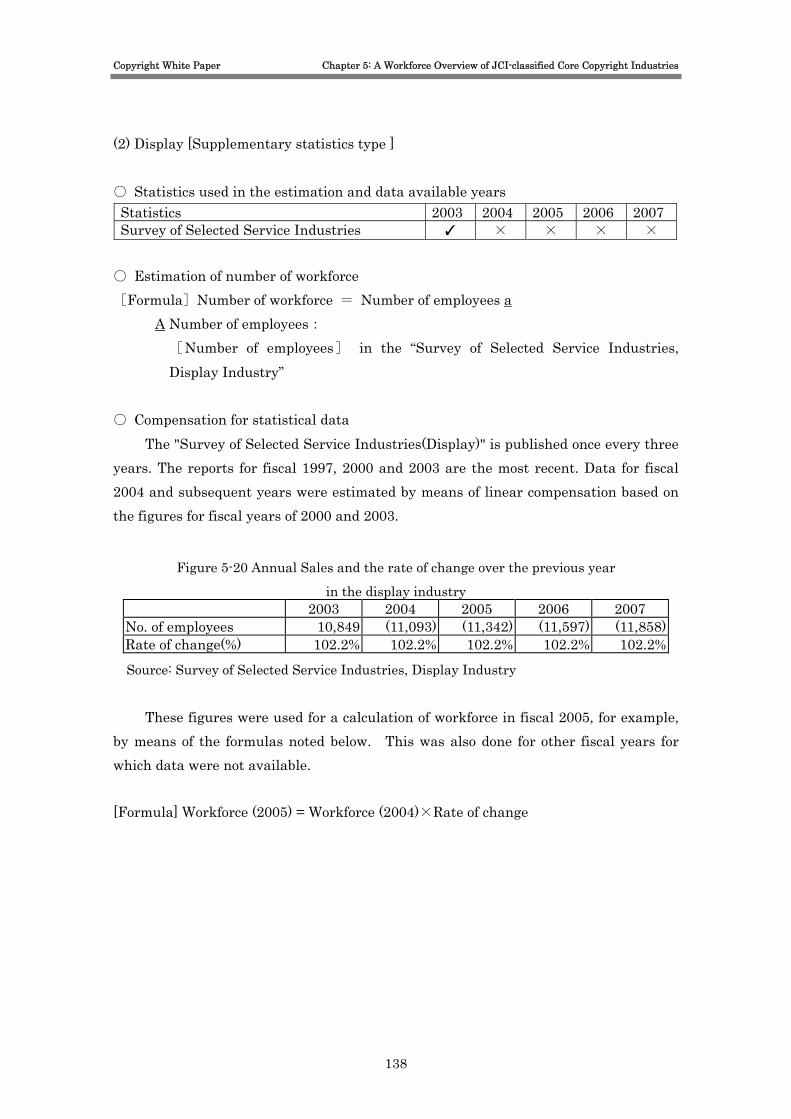
Copyright White Paper Chapter 5: A Workforce Overview of JCI-classified Core Copyright Industries
(2) Display [Supplementary statistics type ] ○ Statistics used in the estimation and data available years Statistics 2003 2004 2005 2006 2007 Survey of Selected Service Industries ✓ × × × ×
○ Estimation of number of workforce [Formula]Number of workforce = Number of employees a
A Number of employees: [Number of employees] in the “Survey of Selected Service Industries, Display Industry”
○ Compensation for statistical data
The "Survey of Selected Service Industries(Display)" is published once every three years. The reports for fiscal 1997, 2000 and 2003 are the most recent. Data for fiscal 2004 and subsequent years were estimated by means of linear compensation based on the figures for fiscal years of 2000 and 2003.
Figure 5-20 Annual Sales and the rate of change over the previous year
in the display industry 2003 2004 2005 2006 2007
No. of employees 10,849 (11,093) (11,342) (11,597) (11,858)Rate of change(%) 102.2% 102.2% 102.2% 102.2% 102.2%Source: Survey of Selected Service Industries, Display Industry
These figures were used for a calculation of workforce in fiscal 2005, for example,
by means of the formulas noted below. This was also done for other fiscal years for which data were not available. [Formula] Workforce (2005) = Workforce (2004)×Rate of change
138
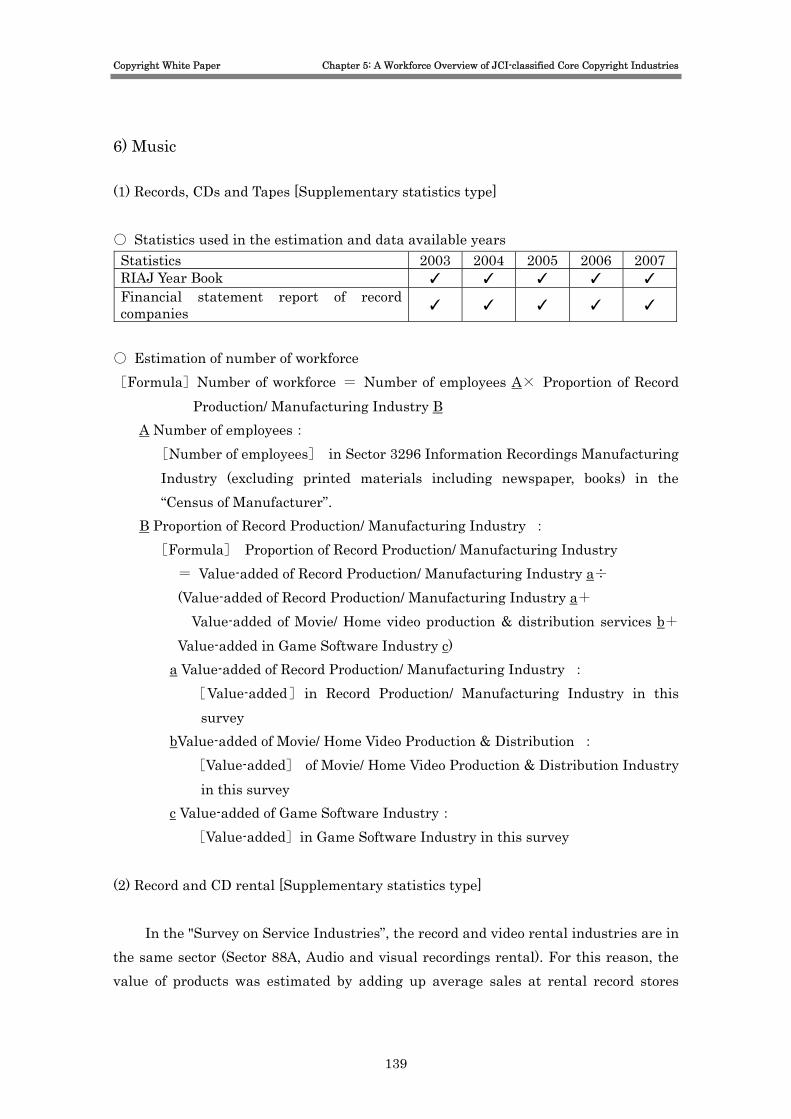
Copyright White Paper Chapter 5: A Workforce Overview of JCI-classified Core Copyright Industries
6) Music (1) Records, CDs and Tapes [Supplementary statistics type] ○ Statistics used in the estimation and data available years Statistics 2003 2004 2005 2006 2007RIAJ Year Book ✓ ✓ ✓ ✓ ✓ Financial statement report of record companies ✓ ✓ ✓ ✓ ✓
○ Estimation of number of workforce [Formula]Number of workforce = Number of employees A× Proportion of Record
Production/ Manufacturing Industry B A Number of employees:
[Number of employees] in Sector 3296 Information Recordings Manufacturing Industry (excluding printed materials including newspaper, books) in the “Census of Manufacturer”.
B Proportion of Record Production/ Manufacturing Industry : [Formula] Proportion of Record Production/ Manufacturing Industry
= Value-added of Record Production/ Manufacturing Industry a÷ (Value-added of Record Production/ Manufacturing Industry a+
Value-added of Movie/ Home video production & distribution services b+ Value-added in Game Software Industry c)
a Value-added of Record Production/ Manufacturing Industry : [Value-added] in Record Production/ Manufacturing Industry in this
survey bValue-added of Movie/ Home Video Production & Distribution :
[Value-added] of Movie/ Home Video Production & Distribution Industry in this survey
c Value-added of Game Software Industry: [Value-added]in Game Software Industry in this survey
(2) Record and CD rental [Supplementary statistics type]
In the "Survey on Service Industries”, the record and video rental industries are in the same sector (Sector 88A, Audio and visual recordings rental). For this reason, the value of products was estimated by adding up average sales at rental record stores
139

Copyright White Paper Chapter 5: A Workforce Overview of JCI-classified Core Copyright Industries
instead of employing data from the "Survey on Service Industries”. ○ Statistics used in the estimation and data available years Statistics 2003 2004 2005 2006 2007Survey on Service Industries × ✓ × × × Estimation of Value-added in this survey ✓ ✓ ✓ ✓ ✓
○ Estimation of number of workforce [Formula]Number of workforce = Number of employees A× Proportion of Record
and CD rental B A Number of employees:
[Number of employees] in Sector 88A Audio and visual recordings rental in the “Survey on Service Industries”.
B Proportion of Record and CD rental : [Formula] Proportion of Record and CD rental
= Value-added of Record and CD rental a÷ (Value-added of Record and CD rental a+Value-added of Video rental b)
a Value-added of Record and CD rental : [Value-added]in Record and CD rental in this survey
bValue-added of Video rental : [Value-added] of Video rental in this survey
(3) Music Publishing [Supplementary statistics type]
As the appropriate statistics was not available for estimating workforce in the music publishing industry, number of workforce was estimated with number of workforce in other industries having strong business ties with the music publishing industry. Accordingly, in this survey, number of workforce was estimated by employing number of workforce in the record production/ manufacturing industry and the proportion of value-added estimated in this survey. ○ Statistics used in the estimation and data available years Statistics 2003 2004 2005 2006 2007Number of workforce in this survey ✓ ✓ ✓ ✓ ✓ Value-added estimated in this survey ✓ ✓ ✓ ✓ ✓
140
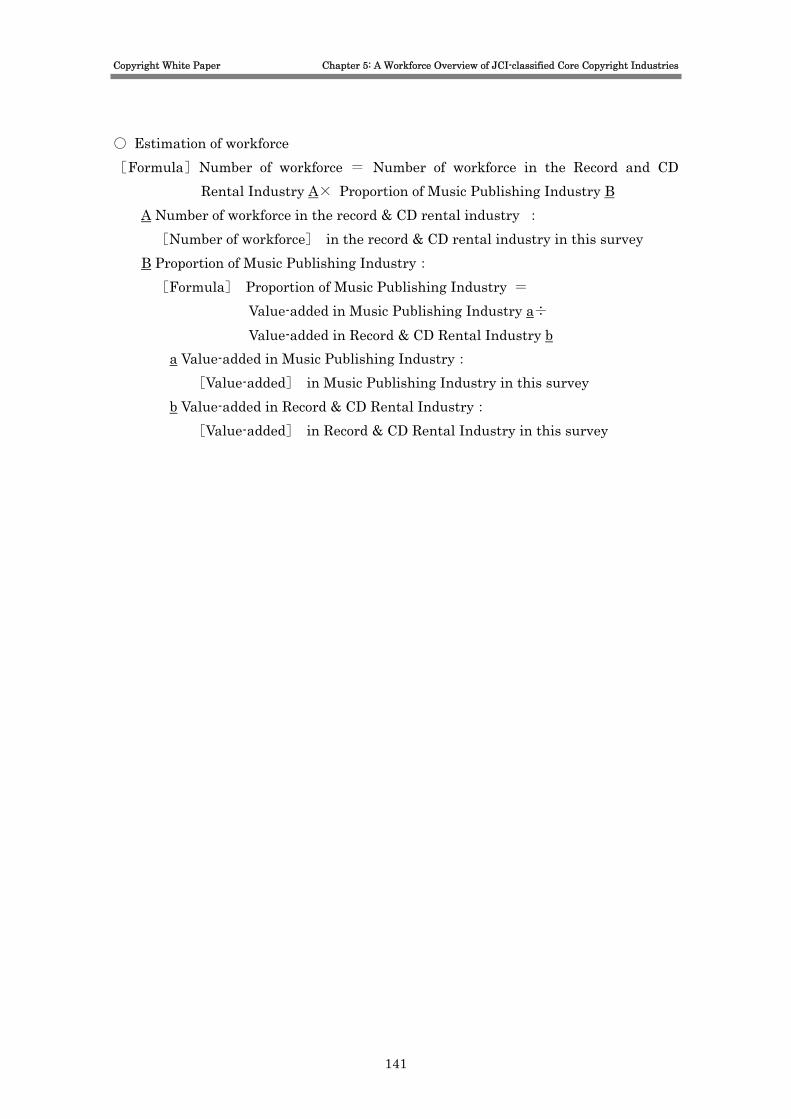
Copyright White Paper Chapter 5: A Workforce Overview of JCI-classified Core Copyright Industries
○ Estimation of workforce [Formula]Number of workforce = Number of workforce in the Record and CD
Rental Industry A× Proportion of Music Publishing Industry B A Number of workforce in the record & CD rental industry : [Number of workforce] in the record & CD rental industry in this survey
B Proportion of Music Publishing Industry: [Formula] Proportion of Music Publishing Industry =
Value-added in Music Publishing Industry a÷ Value-added in Record & CD Rental Industry b
a Value-added in Music Publishing Industry: [Value-added] in Music Publishing Industry in this survey
b Value-added in Record & CD Rental Industry: [Value-added] in Record & CD Rental Industry in this survey
141

Copyright White Paper Chapter 5: A Workforce Overview of JCI-classified Core Copyright Industries
7) Motion Picture (1) Movie, Home video and TV program production (Supplementary statistics type) ○ Statistics used in estimation and data available years Statistics 2003 2004 2005 2006 2007 Survey on Service Industries (Movie, Home video, TV program production industry) × ✓ × × ✓
○ Estimation of Number of workforce [Formula] Number of workforce = Number of employees A
・A Number of employees [Number of employees] in the sectors of motion picture, video production services and motion, picture, video distribution services in the “Survey on Selected Service Industries, Visual Information Production/ Distribution Services”
○ Compensation for statistical data
“Survey of Selected Service Industries, Visual Information Production/ Distribution Services” is conducted and published every three years. The recent years in which the surveys were conducted were fiscal years of 1998, 2001, 2004 and 2007. For unavailable data, the figures in the surveys are used to make estimation by means of linear compensation.
Figure 5-21 Number of employees in Visual Information Production/ Distribution Services and the rate of change over the previous year
2003 2004 2005 2006 2007 No. of employees 6,253 5,908 6,669 7,528 8,498 Rate of Change (%) 94.5% 94.5% 112.9% 112.9% 112.9%
Source: Survey of Selected Service Industries, Visual Information Production/ Distribution Service Industry
These figures were used for a calculation of the value of products and value-added
in fiscal 2005, for example, by means of the formulas noted below. This was also done for other fiscal years for which data were not available.
[Formula] Number of workforce (2005) = No. of employees (2004)×Rate of change
142
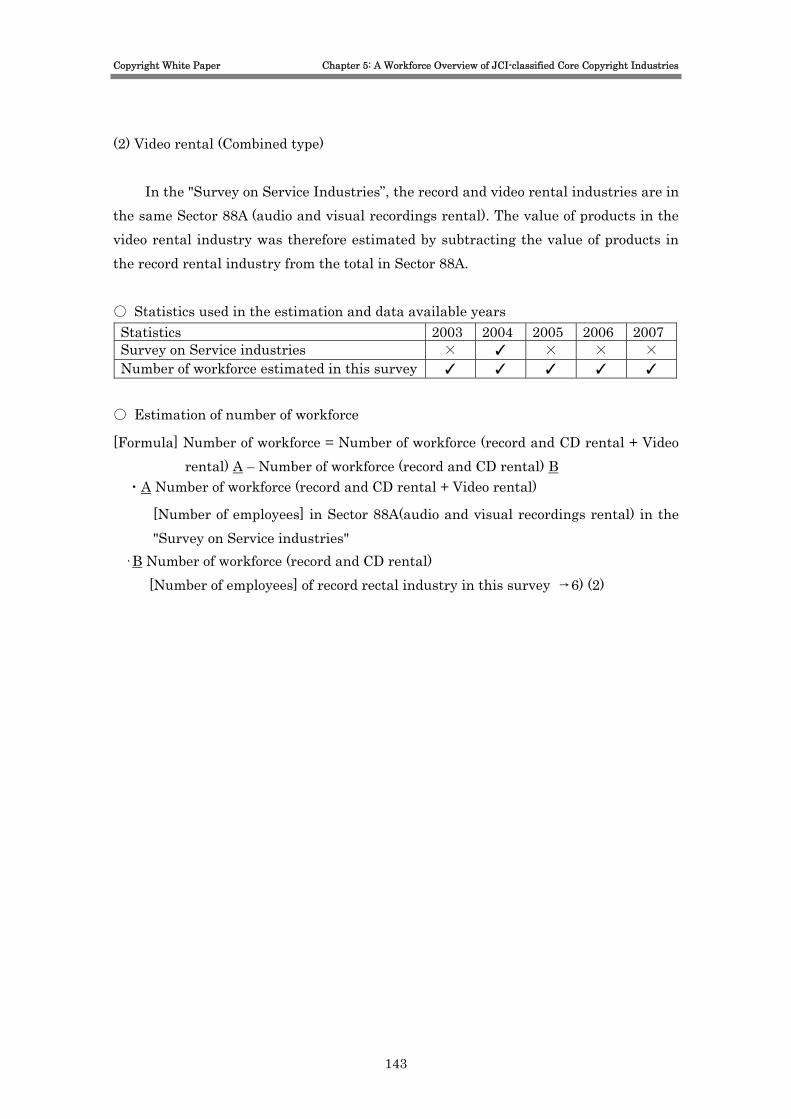
Copyright White Paper Chapter 5: A Workforce Overview of JCI-classified Core Copyright Industries
(2) Video rental (Combined type)
In the "Survey on Service Industries”, the record and video rental industries are in the same Sector 88A (audio and visual recordings rental). The value of products in the video rental industry was therefore estimated by subtracting the value of products in the record rental industry from the total in Sector 88A. ○ Statistics used in the estimation and data available years Statistics 2003 2004 2005 2006 2007 Survey on Service industries × ✓ × × × Number of workforce estimated in this survey ✓ ✓ ✓ ✓ ✓
○ Estimation of number of workforce
[Formula] Number of workforce = Number of workforce (record and CD rental + Video rental) A – Number of workforce (record and CD rental) B
・A Number of workforce (record and CD rental + Video rental)
[Number of employees] in Sector 88A(audio and visual recordings rental) in the "Survey on Service industries"
・B Number of workforce (record and CD rental) [Number of employees] of record rectal industry in this survey →6) (2)
143
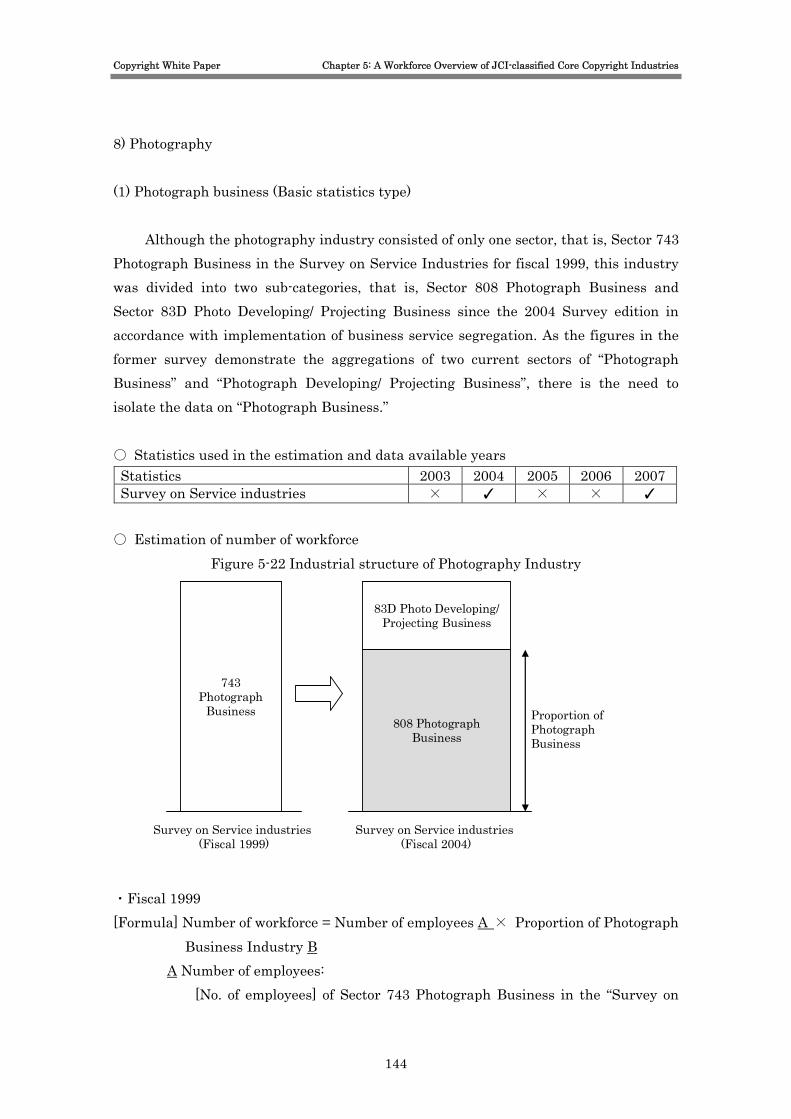
Copyright White Paper Chapter 5: A Workforce Overview of JCI-classified Core Copyright Industries
8) Photography (1) Photograph business (Basic statistics type)
Although the photography industry consisted of only one sector, that is, Sector 743 Photograph Business in the Survey on Service Industries for fiscal 1999, this industry was divided into two sub-categories, that is, Sector 808 Photograph Business and Sector 83D Photo Developing/ Projecting Business since the 2004 Survey edition in accordance with implementation of business service segregation. As the figures in the former survey demonstrate the aggregations of two current sectors of “Photograph Business” and “Photograph Developing/ Projecting Business”, there is the need to isolate the data on “Photograph Business.” ○ Statistics used in the estimation and data available years Statistics 2003 2004 2005 2006 2007Survey on Service industries × ✓ × × ✓
○ Estimation of number of workforce
Figure 5-22 Industrial structure of Photography Industry
83D Photo Developing/
Projecting Business
808 Photograph Business
Proportion of Photograph Business
743Photograph
Business
Survey on Service industries(Fiscal 1999)
Survey on Service industries(Fiscal 2004)
・Fiscal 1999 [Formula] Number of workforce = Number of employees A × Proportion of Photograph
Business Industry B A Number of employees:
[No. of employees] of Sector 743 Photograph Business in the “Survey on
144

Copyright White Paper Chapter 5: A Workforce Overview of JCI-classified Core Copyright Industries
Service Industries” B Proportion of Photograph Business Industry:
[Formula] Proportion of Photograph Business Industry= Value of products in “Photograph Business” a / (a + Value of products in Photo Developing/ Projecting Business b) a Incomes of Sector 808 Photograph Business in the Survey on Service
Industries (fiscal 2004) b Income of Sector 83D Photograph Developing/Projecting Business in the
Survey on Service Industries (fiscal 2004) ・Fiscal 2004 [Formula] Number of workforce = Number of employees A
A: Number of employees [Number of employees] of Sector 808 Photograph Business Service in the “Survey on Service Industries”
○ Compensation for statistical data
The "Survey on Service Industries" is conducted once every five years. The most recent edition was fiscal 2004. For the year in which the survey is not conducted, the figures are calculated by means of linear compensation.
Figure 5-23 Number of employees and the rate of change over the previous year
in the photography industry 2003 2004 2005 2006 2007
No. of employees (56,027) 53,505 (51,097) (48,797) (46,601)Rate of change(%) 95.5% 95.5% 95.5% 95.5% 95.5%
Source: "Survey on Service Industries"
These figures were used for a calculation of number of workforce in fiscal 2005, for
example, by means of the formulas noted below. This was also done for other fiscal years
for which data were not available.
[Formula] Number of workforce (2005) = Number of workforce (2004)×Rate of change
145
Copyright White Paper Chapter 5: A Workforce Overview of JCI-classified Core Copyright Industries
9) Legitimate Theater (Combined type) (1) Movie Theater [Supplementary statistics type]
In the "Survey on Service Industries”, Sector 841 (motion picture theater) includes not only income from admission but also income from sales of goods, etc. The subtotal for admission income therefore must be extracted (by proportional distribution). ○ Statistics used in the estimation and data available years Statistics 2003 2004 2005 2006 2007Survey on Service industries × ✓ × × × Survey of Selected Service Industries (Movie theater) × ✓ × × ×
○ Estimation of Number of Workforce [Formula] Number of workforce = Total number of employees in movie theater A× admission income rate B
A Total number of employees in movie theater [Number of employees] in Sector 841(motion picture theaters) in the "Survey on Service industries"
B Admission income rate The section on cinema theaters in the "Survey of Selected Service Industries (movie theater)" presents data for theatre income organized by item. These data were used to estimate the share of the total occupied by admission income and to calculate the amount of this income. [Formula] admission income rate = admission income a / Total revenues b
a Admission income [Admission income] in the "Survey of Selected Service Industries (movie theater)"
b Total income [Total income] in the "Survey of Selected Service Industries (movie theater)"
○ Compensation for statistical data
The "Survey on Service Industries" is published once every five years, and the
146
Copyright White Paper Chapter 5: A Workforce Overview of JCI-classified Core Copyright Industries
fiscal 2004 edition was the most recent. Data for fiscal 2003 and the fiscal years after 2005 are estimates made by application of the rate of change between 1999 and 2004 in the movie theater admission revenue in the section on movie theaters in the "Survey on Service Industries”.
Figure 5-24 Number of employees in movie theaters and the rate of increase relative to the previous year
2003 2004 2005 2006 2007 No. of employees (14,832) 15,184 (15,544) (15,913) (16,290) Rate of change(%) 102.4% 102.4% 102.4% 102.4% 102.4%
Source: "Survey on Service Industries (Movie theater)"
(Ministry of Economy, Trade and Industry) These figures were used for a calculation of number of workforce in fiscal 2005, for
example, by means of the formulas noted below. This was also done for other fiscal years for which data were not available. [Formula] Number of workforce (2005) = Number of workforce (2004)×Rate of change (2) Theater [Supplementary statistics type] ○ Statistics used in the estimation and data available years Statistics 2003 2004 2005 2006 2007Survey of Selected Service Industries (Legitimate theater) × ✓ × × ×
○ Estimation of number of workforce
[Formula] Number of workforce = Number of employees A A Number of employees: {Number of employees} in the “Survey of Selected Service Industries, Theater”
○ Compensation for statistical data “Survey of Selected Service Industries, Legitimate theater” is conducted and
published every three years. Fiscal 2004 was he most recent year in which the survey was conducted. The data for fiscal 2003 and the fiscal years after 2005 are estimates made by using the change rate between 2001 and 2004 in terms of the movie theater admission revenue, which are available in the “Survey of Selected Service Industries, Legitimate Theater.”
147
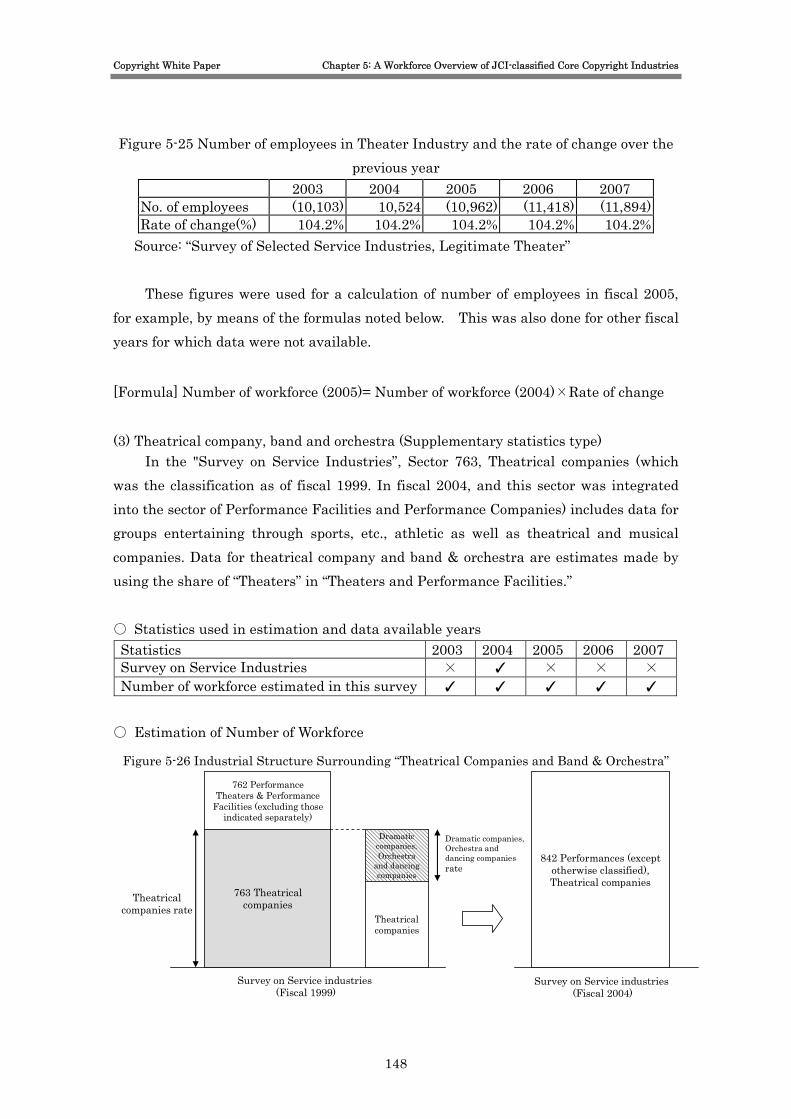
Copyright White Paper Chapter 5: A Workforce Overview of JCI-classified Core Copyright Industries
Figure 5-25 Number of employees in Theater Industry and the rate of change over the previous year
2003 2004 2005 2006 2007 No. of employees (10,103) 10,524 (10,962) (11,418) (11,894) Rate of change(%) 104.2% 104.2% 104.2% 104.2% 104.2%
Source: “Survey of Selected Service Industries, Legitimate Theater”
These figures were used for a calculation of number of employees in fiscal 2005, for example, by means of the formulas noted below. This was also done for other fiscal years for which data were not available.
[Formula] Number of workforce (2005)= Number of workforce (2004)×Rate of change (3) Theatrical company, band and orchestra (Supplementary statistics type)
In the "Survey on Service Industries”, Sector 763, Theatrical companies (which was the classification as of fiscal 1999. In fiscal 2004, and this sector was integrated into the sector of Performance Facilities and Performance Companies) includes data for groups entertaining through sports, etc., athletic as well as theatrical and musical companies. Data for theatrical company and band & orchestra are estimates made by using the share of “Theaters” in “Theaters and Performance Facilities.” ○ Statistics used in estimation and data available years Statistics 2003 2004 2005 2006 2007 Survey on Service Industries × ✓ × × × Number of workforce estimated in this survey ✓ ✓ ✓ ✓ ✓
○ Estimation of Number of Workforce
Figure 5-26 Industrial Structure Surrounding “Theatrical Companies and Band & Orchestra” 762 Performance
Theaters & Performance Facilities (excluding those
indicated separately)
763 Theatrical companies
Dramatic companies, Orchestra
and dancing companies
Theatrical companies
Theatrical companies rate
Dramatic companies, Orchestra and dancing companiesrate
842 Performances (except otherwise classified), Theatrical companies
Survey on Service industries(Fiscal 1999)
Survey on Service industries(Fiscal 2004)
148
Copyright White Paper Chapter 5: A Workforce Overview of JCI-classified Core Copyright Industries
[Formula]Number of workforce = Number of employees in all Theatrical Companies, Bands & Orchestras, and Performance Companies A × Performance Company rate B×Theatrical Company, and Band & Orchestra rate C
A Number of employees in Theatrical Companies, Band & Orchestra, and Performance Companies:
「No. of employees」of Sector 763, Theatrical Companies in the[Survey on Service Industries]
B Performance Company rate : [Formula]Performance Company rate= Number of employees in “Performance
Companies” a ÷(a+ No. of employees in “Performance Theatres & Performance Facilities (excluded those indicated separately)” b)
a No. of employees in “Performance Companies” : [No. of employees] in “Theatrical Companies” in the “Survey on Service
Industries” b No. of employees in “Performance Theaters & Performance Facilities
(excluding those indicated separately): [No. of employees] in “Performance Theaters & Performance Facilities (excluding those indicated separately)” in the “Survey on Service Industries”
C Theatrical Company & Orchestra rate: [Formula]Theatrical Company, and Band & Orchestra rate = Number of
workforce in Performing theaters a÷ Number of employees in Performing theaters & Performance facilities b
a Number of workforce in Performing theaters: [Number of workforce]in this “Survey”
b Number of employees in Performing theaters & Performance facilities: [No. of employees]in Sector 762 Theatrical Companies in the “Survey on
Service Industries”
149

Copyright White Paper Chapter 5: A Workforce Overview of JCI-classified Core Copyright Industries
10) Game Software (Commercial & Home use) (1) Game Software [Supplementary statistics type] ○ Statistics used in the estimation and data available years Statistics 2003 2004 2005 2006 2007Financial Statement Report in Game Software Industry ✓ ✓ ✓ ✓ ✓
Value of products estimated in this survey ✓ ✓ ✓ ✓ ✓ Value-added estimated in this survey ✓ ✓ ✓ ✓ ✓
○ Estimation of Number of Workforce [Formula]Number of workforce = Sum of employees in top seven game software
companies ÷Share of top seven game software companies B A Sum of employees in top seven game software companies :
Σ{[Number of employees] of top seven game software companies} B Share of top seven game software companies: [Formula]Sales share of top seven game software companies
= Sum of sales of top seven game software companies a ÷ Market scale of game software industry b
a Sum of sales of top seven game software companies : Σ{[Sales] of top seven game software companies}
bMarket scale of game software industry: [Value of products] of Game Software Industry in this Survey
150
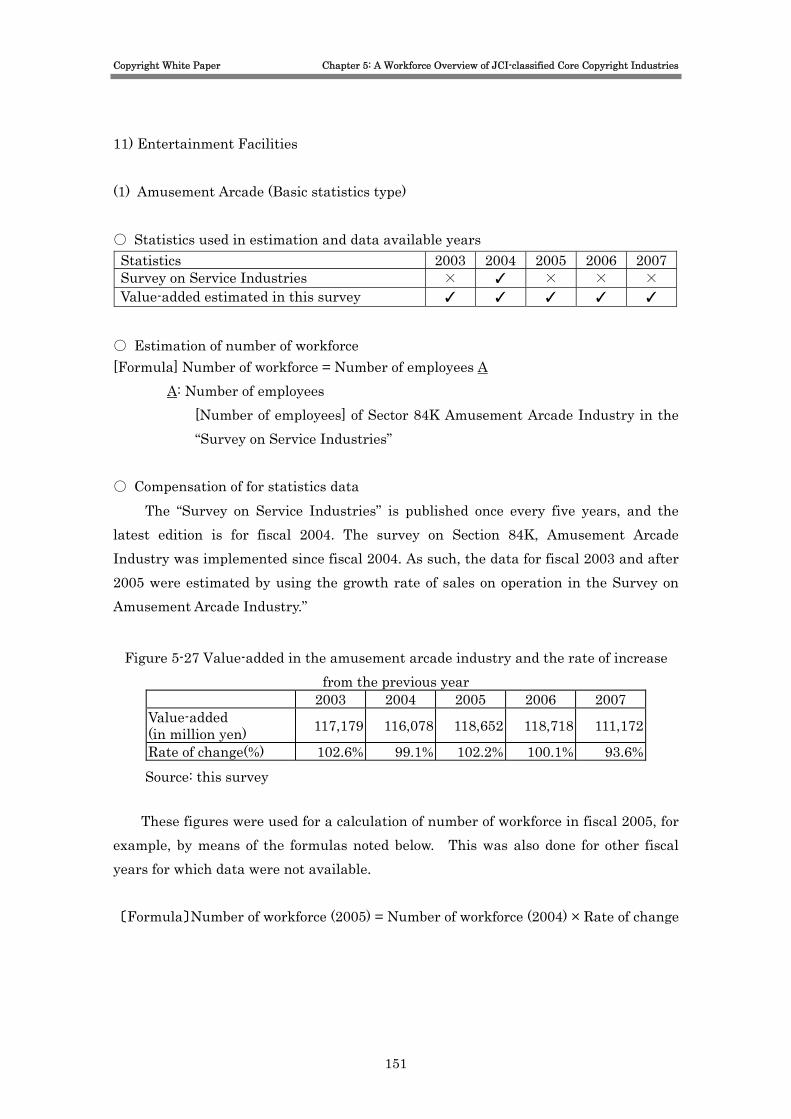
Copyright White Paper Chapter 5: A Workforce Overview of JCI-classified Core Copyright Industries
11) Entertainment Facilities (1) Amusement Arcade (Basic statistics type) ○ Statistics used in estimation and data available years Statistics 2003 2004 2005 2006 2007Survey on Service Industries × ✓ × × × Value-added estimated in this survey ✓ ✓ ✓ ✓ ✓
○ Estimation of number of workforce [Formula] Number of workforce = Number of employees A
A: Number of employees [Number of employees] of Sector 84K Amusement Arcade Industry in the “Survey on Service Industries”
○ Compensation of for statistics data
The “Survey on Service Industries” is published once every five years, and the latest edition is for fiscal 2004. The survey on Section 84K, Amusement Arcade Industry was implemented since fiscal 2004. As such, the data for fiscal 2003 and after 2005 were estimated by using the growth rate of sales on operation in the Survey on Amusement Arcade Industry.”
Figure 5-27 Value-added in the amusement arcade industry and the rate of increase from the previous year
2003 2004 2005 2006 2007 Value-added (in million yen) 117,179 116,078 118,652 118,718 111,172
Rate of change(%) 102.6% 99.1% 102.2% 100.1% 93.6% Source: this survey
These figures were used for a calculation of number of workforce in fiscal 2005, for example, by means of the formulas noted below. This was also done for other fiscal years for which data were not available. 〔Formula〕Number of workforce (2005) = Number of workforce (2004) × Rate of change
151

Copyright White Paper Chapter 5: A Workforce Overview of JCI-classified Core Copyright Industries
(2) Karaoke Box (Basic type) ○ Statistics used in estimation and data available years Statistics 2003 2004 2005 2006 2007Survey on Service Industries × ✓ × × × Value-added estimated in this survey ✓ ✓ ✓ ✓ ✓
○ Estimation of number of workforce [Formula] Number of workforce = Number of employees A
A: Number of employees [Number of employees] of Sector 84M Karaoke Box Industry in the “Survey on Service Industries”
○ Compensation of for statistics data
The “Survey on Service Industries” is published once every five years, and the latest edition is for fiscal 2004. The survey on Section 84M Karaoke Box Industry was implemented since fiscal 2004. As such, the data for fiscal 2003 and after 2005 were estimated by using the growth rate of sales on operation in the Survey on Karaoke Box Industry.”
Figure 5-28 Value-added in the amusement arcade industry and the rate of increase from the previous year
2003 2004 2005 2006 2007 Value-added (in million yen) 79,032 73,398 73,191 73,690 70,005
Rate of change(%) 88.2% 92.9% 99.7% 100.7% 95.0% Source: this survey
These figures were used for a calculation of number of workforce in fiscal 2005, for example, by means of the formulas noted below. This was also done for other fiscal years for which data were not available. 〔Formula〕Number of workforce (2005) = Number of workforce (2004) × Rate of change
152
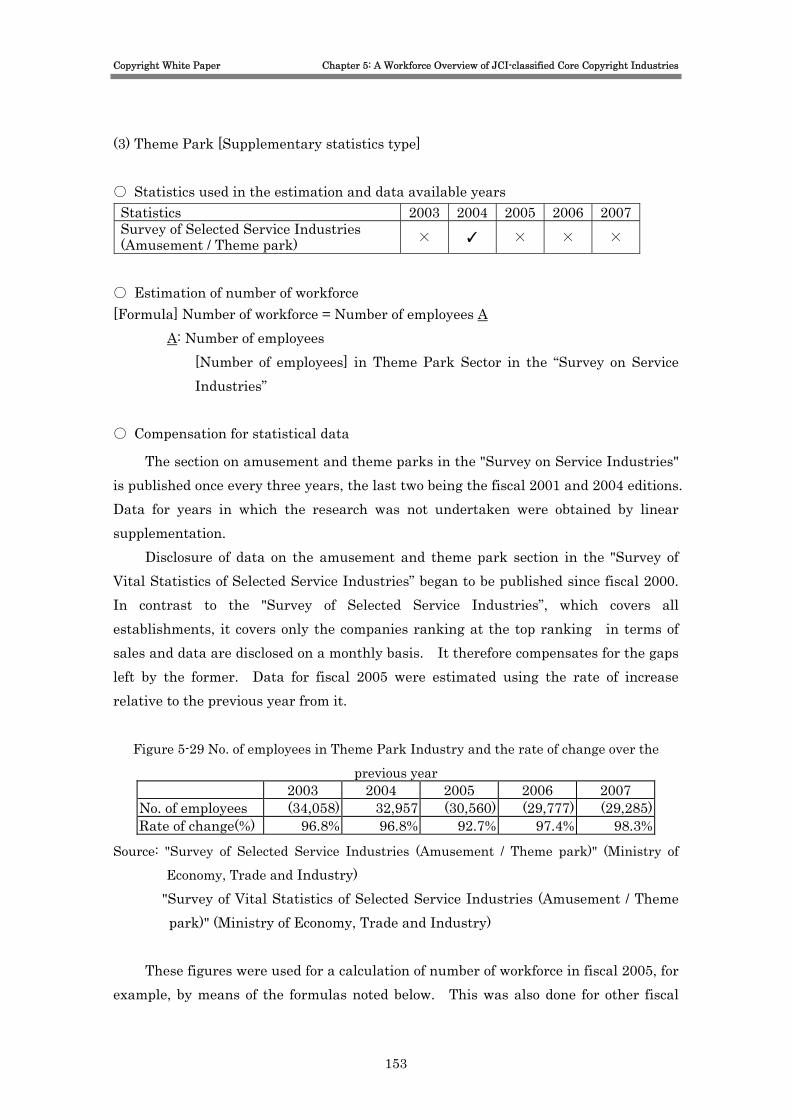
Copyright White Paper Chapter 5: A Workforce Overview of JCI-classified Core Copyright Industries
(3) Theme Park [Supplementary statistics type] ○ Statistics used in the estimation and data available years Statistics 2003 2004 2005 2006 2007 Survey of Selected Service Industries (Amusement / Theme park) × ✓ × × ×
○ Estimation of number of workforce [Formula] Number of workforce = Number of employees A
A: Number of employees [Number of employees] in Theme Park Sector in the “Survey on Service Industries”
○ Compensation for statistical data
The section on amusement and theme parks in the "Survey on Service Industries" is published once every three years, the last two being the fiscal 2001 and 2004 editions. Data for years in which the research was not undertaken were obtained by linear supplementation.
Disclosure of data on the amusement and theme park section in the "Survey of Vital Statistics of Selected Service Industries” began to be published since fiscal 2000. In contrast to the "Survey of Selected Service Industries”, which covers all establishments, it covers only the companies ranking at the top ranking in terms of sales and data are disclosed on a monthly basis. It therefore compensates for the gaps left by the former. Data for fiscal 2005 were estimated using the rate of increase relative to the previous year from it.
Figure 5-29 No. of employees in Theme Park Industry and the rate of change over the
previous year 2003 2004 2005 2006 2007
No. of employees (34,058) 32,957 (30,560) (29,777) (29,285) Rate of change(%) 96.8% 96.8% 92.7% 97.4% 98.3%
Source: "Survey of Selected Service Industries (Amusement / Theme park)" (Ministry of Economy, Trade and Industry)
"Survey of Vital Statistics of Selected Service Industries (Amusement / Theme park)" (Ministry of Economy, Trade and Industry)
These figures were used for a calculation of number of workforce in fiscal 2005, for example, by means of the formulas noted below. This was also done for other fiscal
153

Copyright White Paper Chapter 5: A Workforce Overview of JCI-classified Core Copyright Industries
years for which data were not available.
[Formula] Number of workforce (2005) = Number of workforce (2004) × Growth rate to previous year
154
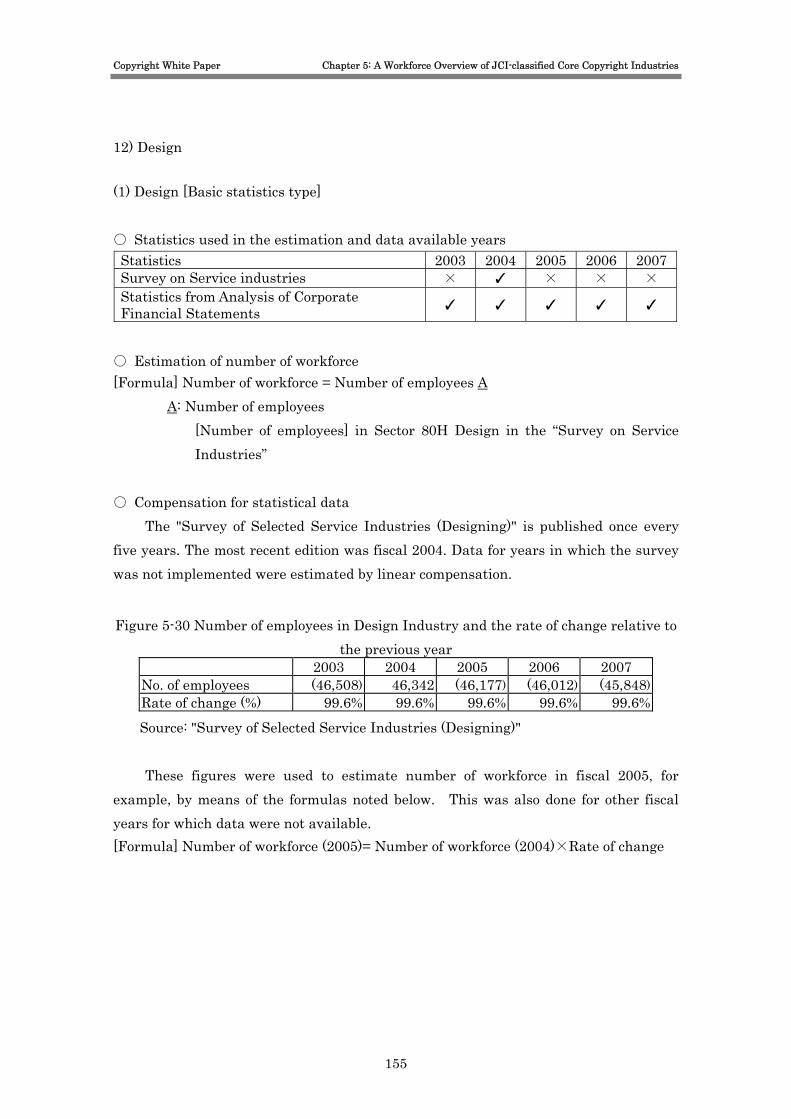
Copyright White Paper Chapter 5: A Workforce Overview of JCI-classified Core Copyright Industries
12) Design (1) Design [Basic statistics type] ○ Statistics used in the estimation and data available years Statistics 2003 2004 2005 2006 2007Survey on Service industries × ✓ × × × Statistics from Analysis of Corporate Financial Statements ✓ ✓ ✓ ✓ ✓
○ Estimation of number of workforce [Formula] Number of workforce = Number of employees A
A: Number of employees [Number of employees] in Sector 80H Design in the “Survey on Service Industries”
○ Compensation for statistical data The "Survey of Selected Service Industries (Designing)" is published once every
five years. The most recent edition was fiscal 2004. Data for years in which the survey was not implemented were estimated by linear compensation.
Figure 5-30 Number of employees in Design Industry and the rate of change relative to
the previous year 2003 2004 2005 2006 2007
No. of employees (46,508) 46,342 (46,177) (46,012) (45,848) Rate of change (%) 99.6% 99.6% 99.6% 99.6% 99.6%
Source: "Survey of Selected Service Industries (Designing)"
These figures were used to estimate number of workforce in fiscal 2005, for example, by means of the formulas noted below. This was also done for other fiscal years for which data were not available. [Formula] Number of workforce (2005)= Number of workforce (2004)×Rate of change
155
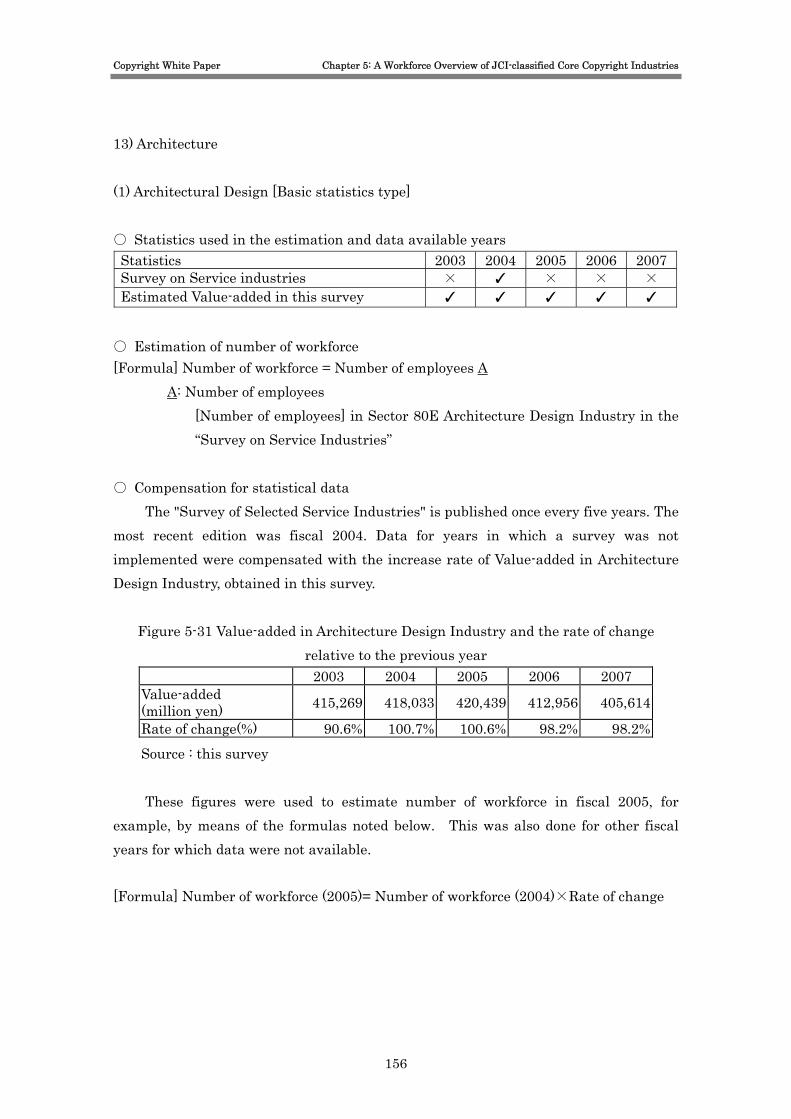
Copyright White Paper Chapter 5: A Workforce Overview of JCI-classified Core Copyright Industries
13) Architecture (1) Architectural Design [Basic statistics type] ○ Statistics used in the estimation and data available years Statistics 2003 2004 2005 2006 2007Survey on Service industries × ✓ × × × Estimated Value-added in this survey ✓ ✓ ✓ ✓ ✓
○ Estimation of number of workforce [Formula] Number of workforce = Number of employees A
A: Number of employees [Number of employees] in Sector 80E Architecture Design Industry in the “Survey on Service Industries”
○ Compensation for statistical data The "Survey of Selected Service Industries" is published once every five years. The
most recent edition was fiscal 2004. Data for years in which a survey was not implemented were compensated with the increase rate of Value-added in Architecture Design Industry, obtained in this survey.
Figure 5-31 Value-added in Architecture Design Industry and the rate of change relative to the previous year
2003 2004 2005 2006 2007 Value-added (million yen) 415,269 418,033 420,439 412,956 405,614
Rate of change(%) 90.6% 100.7% 100.6% 98.2% 98.2%
Source : this survey These figures were used to estimate number of workforce in fiscal 2005, for
example, by means of the formulas noted below. This was also done for other fiscal years for which data were not available. [Formula] Number of workforce (2005)= Number of workforce (2004)×Rate of change
156
Copyright White Paper Chapter 5: A Workforce Overview of JCI-classified Core Copyright Industries
14) Libraries and Museums (1) Libraries ○ Statistics used in the estimation and data available years Statistics 2003 2004 2005 2006 2007Statistics on Libraries in Japan ✓ ✓ ✓ ✓ ✓
○ Estimation of Number of Workforce [Formula] Number of workforce = Number of workforce in public libraries A + Number
of workforce in universities and colleges B A Number of workforce in public libraries
[Formula] Number of workforce (Public libraries) = No. of full-time staff a + No. of concurrently-serving staff b
a Number of full-time staff [No. of full-time staff] of public libraries in the "Statistics on Libraries in Japan"
b Number of concurrently-serving staff [No. of concurrently-serving staff] of public libraries in the "Statistics on Libraries in Japan"
B Number of workforce in university/ college libraries [Formula] Number of workforce in university/ college libraries
= Number of full-time staff a+ Number of concurrently-serving staff b a Number of full-time staff
[No. of full-time staff] in university/ college libraries in the "Statistics on Libraries in Japan"
b Number of concurrently-serving staff [No. of concurrently-serving staff] university/ college libraries in the "Statistics on Libraries in Japan"
(2) Art Museums [Supplementary statistics type] ○ Statistics used in the estimation and data available years Statistics 2003 2004 2005 2006 2007Museum General Research Report × ✓ × × × Value-added obtained in this survey ✓ ✓ ✓ ✓ ✓
157

Copyright White Paper Chapter 5: A Workforce Overview of JCI-classified Core Copyright Industries
○ Estimation of Number of Workforce The "Museum General Research Report" exhibits the results of a questionnaire
survey on incomes, targeted at art museums throughout the country. The Value of products was estimated by using the data in such report. [Formula]Number of workforce =Average of staff number A×Number of museums B
A Average of staff number: [Average of staff number]of all museums in the “Museum General Research Report”
B Number of art museum: [ Formula] Number of art museums = Number of all museums a÷ Percentage by type b a Number of all museums
[Number of all museums]in the “Museum White Paper” b Percentage by type
[Percentage by type]of art museum in the “Museum White Paper” ○ Compensation for statistical data
The surveys are not conducted on a regular basis to issue the “Museum White Paper”. The most recent edition was for fiscal 2004. Data for those years, in which the survey was not conducted, were calculated with the increase rate of Value-added in the Art Museum Industry in this Survey. Figure 5-32 Value-added in the Art Museum Industry and the rate of change relative to
the previous year 2003 2004 2005 2006 2007
Value-added (million yen) 21,520 19,275 17,263 15,462 13,848
Rate of change(%) 89.6% 89.6% 89.6% 89.6% 89.6%
Source : this survey
These figures were used to estimate number of workforce in fiscal 2005, for example, by means of the formulas noted below. This was also done for other fiscal years for which data were not available. [Formula] Number of workforce (2005)= Number of workforce (2004)×Rate of change
158

Copyright White Paper Chapter 5: A Workforce Overview of JCI-classified Core Copyright Industries
15) Authors and Artists (1) Authors and Artists, Musician [Basic statistics type] ○ Statistics used in the estimation and data available years Statistics 2003 2004 2005 2006 2007Survey on Service industries × ✓ × × ×
○ Estimation of Number of Workforce
[Formula] Number of Workforce = Number of employees A ・A Number of employees
[No. of employees] in Sector 807(authors and artists) in the "Survey on Service industries"
○ Compensation for statistical data
Editions of the "Survey on Service Industries" are published every five years. The latest one is the fiscal 2004 edition. As appropriate statistics on the “Author & Artist Industry” is not available for fiscal 2003 and fiscal years after 2005, data on these years were estimated by using the increase rate in Sector 807 Author & Artist Industry in the editions for fiscal years of 1999 – 2004 of the Survey on Service Industries.”
Figure 5-33 Number of employees in Sector Author & Artist and the rate of change relative
to the previous year 2003 2004 2005 2006 2007
No. of employees (1,819) 1,766 (1,714) (1,664) (1,616)Rate of change(%) 97.1% 97.1% 97.1% 97.1% 97.1%
Source: "Survey on Service Industries”
These figures were used for a calculation of number of workforce in fiscal 2005, for example, by means of the formulas noted below. This was also done for other fiscal years for which data were not available. [Formula] Number of workforce (2005) = Number of workforce (2004) × Rate of change
159

Copyright White Paper Chapter 6: Overview on Workforce in JCI-classified Inter-dependent Copyright Industries
Chapter 6: Overview on Workforce in JCI-classified Inter-dependent Copyright Industries Ⅰ. Overview on workforce in JCI-classified inter-dependent copyright industries 1. Workforce scale of JCI-classified inter-dependent copyright industries
In fiscal 2007, the workforce in Japan’s JCI-classified inter-dependent copyright industries reached 267,000 workers. By JCI-classified industry sector, the largest workforce was in the “Transmission-related Equipment & Media-Manufacturing Industry” with 17.9% of share, followed in order by the “Computer Software-related Equipment & Media Manufacturing Industry” and the “Music-related Equipment & Media Manufacturing Industry.”
Figure 6-1 Workforce Scale in JCI-classified Inter-dependent Copyright Industry (Fiscal 2007) (in thousand workers)
Workforce Scale No. of
workforce Proportion
1 Printing/ Publishing-related Equipment &
Media Manufacturing Industries 26 9.8%
2 Computer Software-related Equipment & Media Manufacturing
Industries 44 16.6%
3 Broadcasting-related Equipment &
Media Manufacturing Industries 14 5.2%
4 Transmission-related Equipment &
Media Manufacturing Industries 48 17.9%
5 Music-related Equipment & Media
Manufacturing Industries 39 14.5%
6 Motion Picture-related Equipment&
Media Manufacturing Industries 17 6.3%
7 Photography-related Equipment &
Media Manufacturing Industries 37 13.7%
8 Game Software-related Equipment &
Media Manufacturing Industries 3 1.3%
160

Copyright White Paper Chapter 6: Overview on Workforce in JCI-classified Inter-dependent Copyright Industries
9 Advertising-related & Media Manufacturing Industries 18 6.9%
10 Entertainment Facility-related Equipment &
Media Manufacturing Industries 19 7.2%
11 Author-related Equipment & Media
Manufacturing Industry 2 0.7%
Total in JCI-classified inter-dependent copyright industries 267 100.0%
161

Copyright White Paper Chapter 6: Overview on Workforce in JCI-classified Inter-dependent Copyright Industries
2. Positioning of JCI-classified inter-dependent copyright industry in Japan’s workforce
The total workforce of 267,000 in JCI-classified copyright industry in fiscal 2007 represents 0.4% of Japan’s overall workforce.
The number of workforce in the inter-dependent copyright industry was 399,000 in fiscal 1998. During the period from fiscal 1998 to the current year, this industry has decreased by 4.3% in average annual growth. Over the same period (fiscal 1998 – 2007), the growth rate of Japan’s total workforce was -0.3%, which indicated a decline in number. As a result, because of the larger declining rate of workers in Japan, the proportion of workforce in the concerned industry declined from the level of 0.6% recorded in fiscal 1998 to the current level. Figure 6-2 Positioning of the JCI-classified inter-dependent copyright industry in Japan’s total workforce
0
100
200
300
400
500
600
1998 1999 2000 2001 2002 2003 2004 2005 2006 2007 (Fiscal Year)
(thousand persons)
0.0%
0.2%
0.4%
0.6%
0.8%The workforce in the core copyright industry
Proportion of the workforce(%)
(in thousand workers)
1998 2002 2007
Average AnnualGrowth
rate a) JCI-classified
inter-dependent copyright industries
399 323 267 -4.3%
b) Japan’s total workers 66,276 63,592 64,451 -0.3% Ratio in Japan’s workforce (a/b) 0.6% 0.5% 0.4%
(Source) No. of workers : the number of employees in “Annual Report on National Income” (fixed for
fiscal 2007)
162
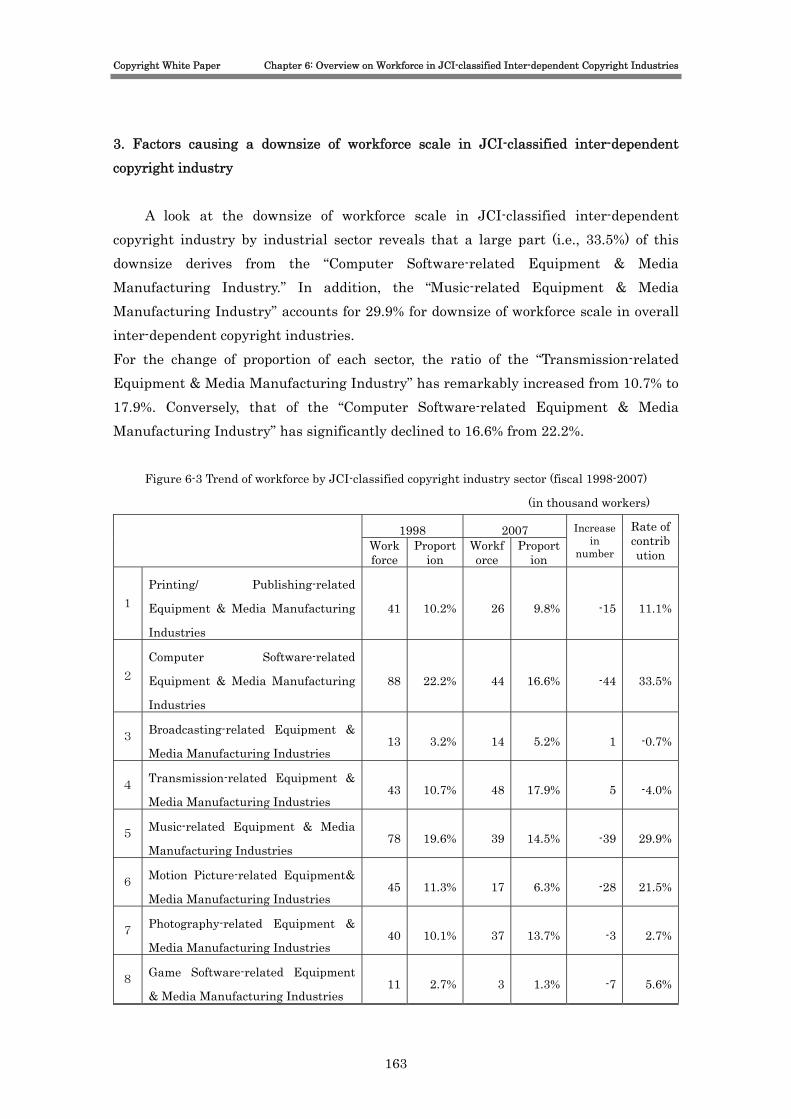
Copyright White Paper Chapter 6: Overview on Workforce in JCI-classified Inter-dependent Copyright Industries
3. Factors causing a downsize of workforce scale in JCI-classified inter-dependent copyright industry
A look at the downsize of workforce scale in JCI-classified inter-dependent copyright industry by industrial sector reveals that a large part (i.e., 33.5%) of this downsize derives from the “Computer Software-related Equipment & Media Manufacturing Industry.” In addition, the “Music-related Equipment & Media Manufacturing Industry” accounts for 29.9% for downsize of workforce scale in overall inter-dependent copyright industries. For the change of proportion of each sector, the ratio of the “Transmission-related Equipment & Media Manufacturing Industry” has remarkably increased from 10.7% to 17.9%. Conversely, that of the “Computer Software-related Equipment & Media Manufacturing Industry” has significantly declined to 16.6% from 22.2%.
Figure 6-3 Trend of workforce by JCI-classified copyright industry sector (fiscal 1998-2007)
(in thousand workers)
1998 2007
Workforce
Proportion
Workforce
Proportion
Increase in
number
Rate of contribution
1 Printing/ Publishing-related
Equipment & Media Manufacturing
Industries
41 10.2% 26 9.8% -15 11.1%
2 Computer Software-related
Equipment & Media Manufacturing
Industries
88 22.2% 44 16.6% -44 33.5%
3 Broadcasting-related Equipment &
Media Manufacturing Industries 13 3.2% 14 5.2% 1 -0.7%
4 Transmission-related Equipment &
Media Manufacturing Industries 43 10.7% 48 17.9% 5 -4.0%
5 Music-related Equipment & Media
Manufacturing Industries 78 19.6% 39 14.5% -39 29.9%
6 Motion Picture-related Equipment&
Media Manufacturing Industries 45 11.3% 17 6.3% -28 21.5%
7 Photography-related Equipment &
Media Manufacturing Industries 40 10.1% 37 13.7% -3 2.7%
8 Game Software-related Equipment
& Media Manufacturing Industries 11 2.7% 3 1.3% -7 5.6%
163
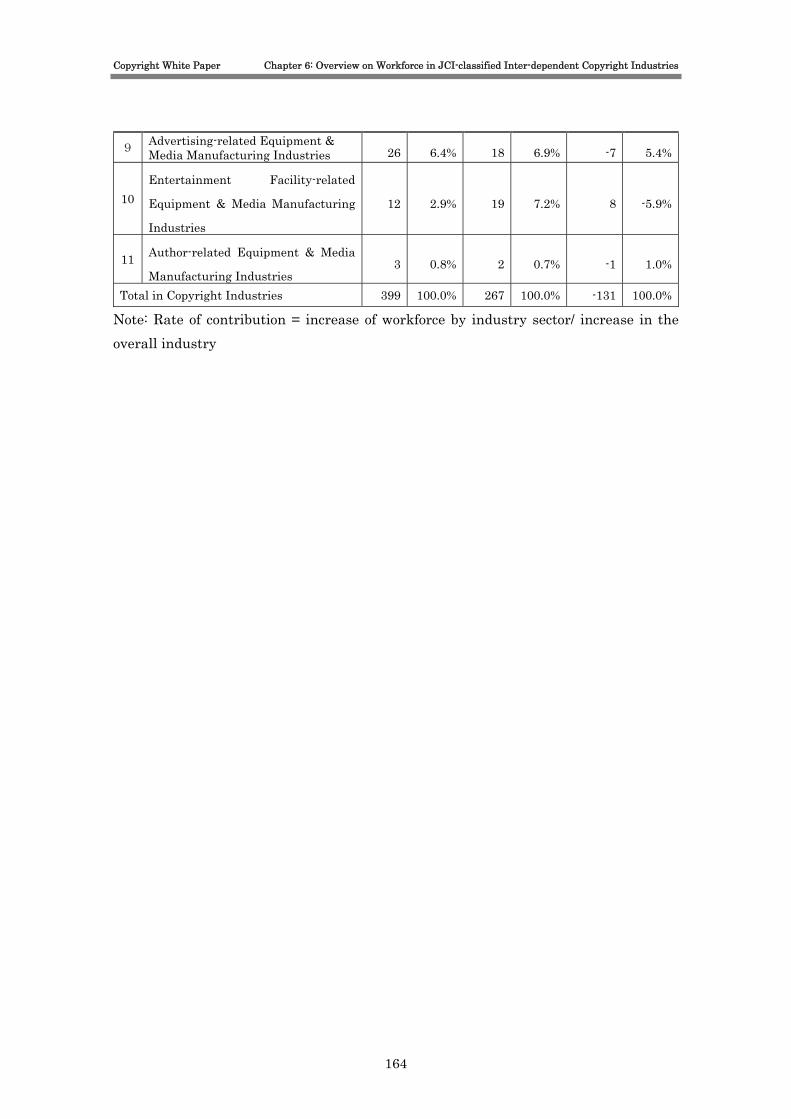
Copyright White Paper Chapter 6: Overview on Workforce in JCI-classified Inter-dependent Copyright Industries
9 Advertising-related Equipment & Media Manufacturing Industries 26 6.4% 18 6.9% -7 5.4%
10 Entertainment Facility-related
Equipment & Media Manufacturing
Industries
12 2.9% 19 7.2% 8 -5.9%
11 Author-related Equipment & Media
Manufacturing Industries 3 0.8% 2 0.7% -1 1.0%
Total in Copyright Industries 399 100.0% 267 100.0% -131 100.0%
Note: Rate of contribution = increase of workforce by industry sector/ increase in the overall industry
164
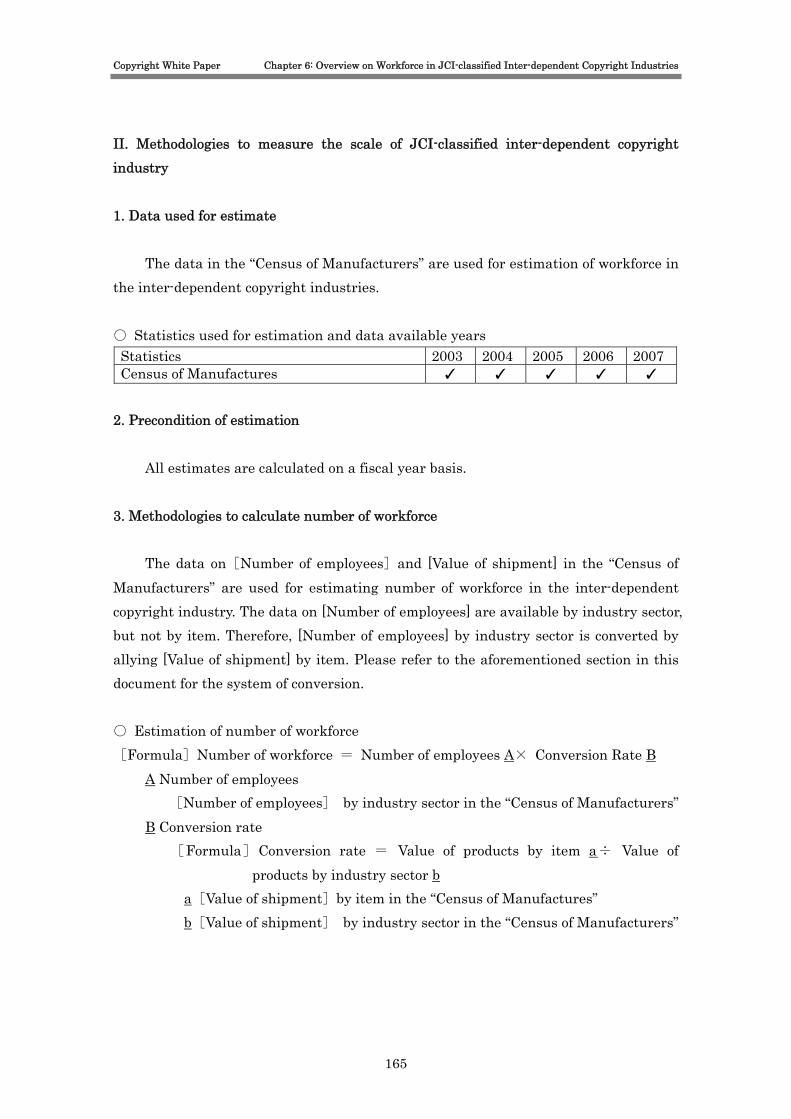
Copyright White Paper Chapter 6: Overview on Workforce in JCI-classified Inter-dependent Copyright Industries
II. Methodologies to measure the scale of JCI-classified inter-dependent copyright industry 1. Data used for estimate
The data in the “Census of Manufacturers” are used for estimation of workforce in the inter-dependent copyright industries. ○ Statistics used for estimation and data available years Statistics 2003 2004 2005 2006 2007 Census of Manufactures ✓ ✓ ✓ ✓ ✓
2. Precondition of estimation
All estimates are calculated on a fiscal year basis. 3. Methodologies to calculate number of workforce
The data on[Number of employees]and [Value of shipment] in the “Census of Manufacturers” are used for estimating number of workforce in the inter-dependent copyright industry. The data on [Number of employees] are available by industry sector, but not by item. Therefore, [Number of employees] by industry sector is converted by allying [Value of shipment] by item. Please refer to the aforementioned section in this document for the system of conversion. ○ Estimation of number of workforce [Formula]Number of workforce = Number of employees A× Conversion Rate B
A Number of employees [Number of employees] by industry sector in the “Census of Manufacturers”
B Conversion rate [Formula]Conversion rate = Value of products by item a÷ Value of
products by industry sector b a[Value of shipment]by item in the “Census of Manufactures” b[Value of shipment] by industry sector in the “Census of Manufacturers”
165

Copyright White Paper Chapter 7: A Foreign Trade Overview of the Copyright Industry
Chapter 7: A Foreign Trade Overview of the Copyright Industry I. Definitions of foreign trade in the copyright industry
Foreign trade in the copyright industry can be divided into two categories based on transaction types.
The first category includes copyright trade, such as payments for the use of copyrighted materials (literature, academic, art and music materials) and for the use of cultural and entertainment services that involve copyright use. Among economic activities, this is regarded as “foreign trade in services."
The second category includes transactions of copyright products, in which copyrighted materials (literature, academic, art and music materials) are traded as commercial products. Among economic activities, this is regarded as “foreign trade of goods."
Accordingly, foreign trade in the copyright industry consists of two trading types: services and products.
Figure 7-1 Types of Foreign Trade in Copyright Industry Types of Foreign Trade of Copyright Industry
1. Copyright Trade
2. Copyright Trade in commercial products
Foreign Trade in Services
Foreign Trade in Goods
1. Definitions of copyright trade
Copyright trade is considered to be the trade of services and quantitatively analyzed as the balance on services in economic statistics and consists of the following items:
166

Copyright White Paper Chapter 7: A Foreign Trade Overview of the Copyright Industry
Figure 7-2 Statistical Cassifications in Trade Value in Services Items Description of items and principal examples
Balance of payments in services
Transportation Truism & travel Other services Communication
services
Construction services
Insurance services
Financial services Information
services Payments/ receipts of fees on on-line data services provided from residents to non-residents or vice versa, and news-providing services by news media. (1) Payments/ receipts of the following fees on services related to computers: ・ Usage fees, data-processing fees, data-providing fees (data creation, outsourcing of
computation works, time-sharing, database, on-line services, etc.) ・ Fees on outsourcing the software development works. ・ Repair/ maintenance charges. ・ Coaching.. (2)Payments/ receipts of fees on news-providing services by mass media (including
news videos, films) Royalties and
license fees Payments/ receipts of usage fees related to industrial rights such as patent rights, and trademarks, mining rights, and copyrights from residents to non-residents, or vice versa.
Usage fees on industrial rights and mining rights (Note 1)
(1) Payments/ receipts of usage fees on industrial rights (patent rights, utility model rights, design rights, and trademarks).
(2) Payments/ rights of usage fees on mining rights (exploitation rights and pre-exploitation rights).
(3) Payments/ receipts of usage fees on know-how (technical information). (4) Payments/ receipts of various expenses on obtaining franchise membership. (5) Payments/ receipts of usage fees on intellectual property rights almost equivalent to
the above-mentioned rights. (6) Payments/ receipts of instruction fees on techniques and business management
related to the rights mentioned in the above items from (1) to (4). Usage fees on
copyright products (Note 1 & 2)
Payments/ receipts of usage fees on copyright products such as literatures, academic works, art works, music, etc. Copyright products include software and character goods.
Other profit-making business services
Payments/ receipts of expenses on trades on other various services than those mentioned in the above items, accounted in both residents and non-residents. Regarding goods and services as well as nonmonetary gold which are purchased or sold in a significantly short period without custom clearance in Japan such as gold dealing, the balance accounted in such trade activities shall be recorded as service fees. In addition, the balance in intermediary trade, other trade-related activities, and operational-service trade shall be recorded.
Intermediary trade & other trade-related activities (Note 1) Operational lease (Note 1) Other
operations/specialized technology services (Note 1)
◆ Promotion fees (1) Payments/ receipts of fees on business promotions such as TV commercials, and fees
on developing advertisement (commercials, posters, giveaways). (2) Payments/ receipts of expenses on organizing exhibitions and trade shows. (3) Payments/ receipts of expenses on commodity-sales promotion activities. ◆ Consulting/ coaching fees related to legal/ accounting matters, agent fees, auditing
fees, etc.
167

Copyright White Paper Chapter 7: A Foreign Trade Overview of the Copyright Industry
(1) Payments/ receipts of legal advisory fees, accounting audit fees, tax-service fees, etc. (2) Payments/ receipts of consulting fees on business management. (3) Payments/ receipts of agent-business fees such as preparing documents related to
legal/ accounting matters. ◆ Payments/ receipts of expenses on research-development: baseline research, application research, new-product development, etc. ◆ Other expenses related to professional services: payments/ receipts of expenses on professional services. The principal examples are as follows: ・ Architecture, engineering, and other technical services (architecture design in the
urban-development project, planning/ drawing/ supervising of construction, experiments/ examination of product, etc.)
・ Agricultural/ mining services (extermination of disease and insect damage, agricultural improvement, mining analysis, etc.)
・ Other professional services (market research, transaction/ interpretation, patent application, agent services for registration, medical services, etc.)
Cultural and recreational services
Payments/ receipts of production costs, rental fees, related to audio/ visual services, from residents to non-residents, or vice versa. ◆ Expenses related to culture or recreation (1) Payments/ receipts of revenues in organizing entertainment events such as
show-performance, recreational/ music/ sporting/ cultural events (selling performance rights, admission fees, performing fees paid to entertainers, athletes, etc.), or other related expenses in organizing events (venue, promotion activities, performing fees paid to entertainer, athletes, etc.)
(2) Payments/ receipts of performing fees paid to entertainers/ athletes who are performing at TV programs, etc.)
(3) Payments/ receipts of entrance fees or membership fees which are accounted at obtaining the membership of association, club, academic organization, or other group.
◆ Production costs, rental fees, and screening/ broadcasting fees, of image/ audio media such as films, tapes, etc. (1) Payments/ receipts of production costs of motion-picture films (including TV films,
video tapes), sound-related tapes, records, etc. Production costs also include performing fees paid to actors and compensations paid to producers.
(2) Payments/ receipts of rectal fees, screening/ broadcasting fees, and distribution-right usage fees.
Government services, n.i.e.
"Government services, n.i.e." is a residual category associated with the public sector and covers services not included in the above categories.
Note 1: These items are those appeared in the data obtained in the BOJ’s “Time-series Statistical
Data Research Site”
Note 2: These items are not independently used in the BOJ’s “Time-series Statistical Data Research
Site”. In practice, the values are obtained with deducting the value of “usage fees of
industrial/ mining right” from the “usage fees of patent rights.”
Source: Generated by NRI based on the “Codes for International Balance of Payments & Description
thereof” and the “Descriptions on International Balance of Payments” issued by the BOJ
Based on the aforementioned statistical classifications, the following four
categories emerged as candidates applicable for copyright trade analysis: - Information services; - Copyright-related usage fees; - Cultural/entertainment services; and
168
Copyright White Paper Chapter 7: A Foreign Trade Overview of the Copyright Industry
- Other operations/specialized technology services
The other operations/specialized technology services listed above, however, also include business activities not related to copyright trade. Furthermore, the trade value in this category, at around a few trillion yen, far exceeds the other three, which each total roughly a few hundred billion yen.
This would require extraction of the applicable data from the total trade value for this particular category. This could not be accommodated, however, as subcategory breakdowns for these four categories were not available from any published statistics.
As using the total trade value of the other operations/specialized technology services without extraction would lead to overvaluing the trading activities of the copyright industry, the following three categories, excluding the other operations/specialized technology services, were analyzed in this study: - Information services; - Copyright-related usage fees; and - Cultural/entertainment services
As mentioned previously, since subcategory breakdowns for these service categories were not available, subcategory estimations of copyright transactions could not be conducted, unlike for value added estimates, in which 15 subcategories were analyzed.
Accordingly, in this study, the combined trade value of the aforementioned three categories was considered to be the trade value of foreign trade activities in the copyright industry.
169

Copyright White Paper Chapter 7: A Foreign Trade Overview of the Copyright Industry
2. Definitions of copyright trade in commercial products 1) Foreign Trade in Core-copyright Industry
Copyright product trading is considered to be the trade of goods and quantitatively analyzed as the balance on trade in economic statistics, specifically in the trade statistics that contain trade values by product. Products are categorized with 9-digit item numbers.
The items in the shaded columns in the table below emerged as applicable candidates for copyright product analysis. Figure 7-3 Statistical Items of Foreign Trade of Goods in Core-copyright Industry(2009)
Section VI PRODUCTS OF THE CHEMICAL OR ALLIED INDUSTRIES Chapter 37 Photographic or cinematographic goods. 37.04 3704.00 000 Photographic plates, film, paper, paperboard and textiles, exposed
but not developed. 37.05 Photographic plates and film, exposed and developed, other
than cinematographic film. 3705.10 000 - For offset reproduction 3705.90 000 - Other 37.06 Cinematographic film, exposed and developed, whether or not
incorporating sound track or consisting only of sound track. 3706.10 000 - Of a width of 35 mm or more 3706.90 000 - Other Chapter 48 Paper and paperboard; articles of paper pulp, of paper or of
paperboard. Chapter 49 Printed books, newspapers, pictures and other products of the
printing industry; manuscripts, typescripts and plans. Section XVI MACHINERY AND MECHANICAL APPLIANCES; ELECTRICAL
EQUIPMENT; PARTS THEREOF; SOUND RECORDERS AND REPRODUCERS, TELEVISION IMAGE AND SOUND RECORDERS AND REPRODUCERS, AND PARTS AND ACCESSORIES OF SUCH ARTICLES
Chapter 85 Electrical machinery and equipment and parts thereof; sound recorders and reproducers, television image and sound recorders and reproducers, and parts and accessories of such articles.
85.23 Discs, tapes, solid-state non-volatile storage devices, "smart cards" and other media for the recording of sound or of other phenomena, whether or not recorded, including matrices and masters for the production of discs, but excluding products of Chapter 37
- Magnetic media 8523.21 000 -- Cards incorporating a magnetic stripe 8523.29 000 -- Other 8523.40 000 - Optical media - Semiconductor media 8523.51 000 --Solid-state non-volatile storage devices 8523.52 -- "Smart cards" 100 --- Proximity cards and tags
170
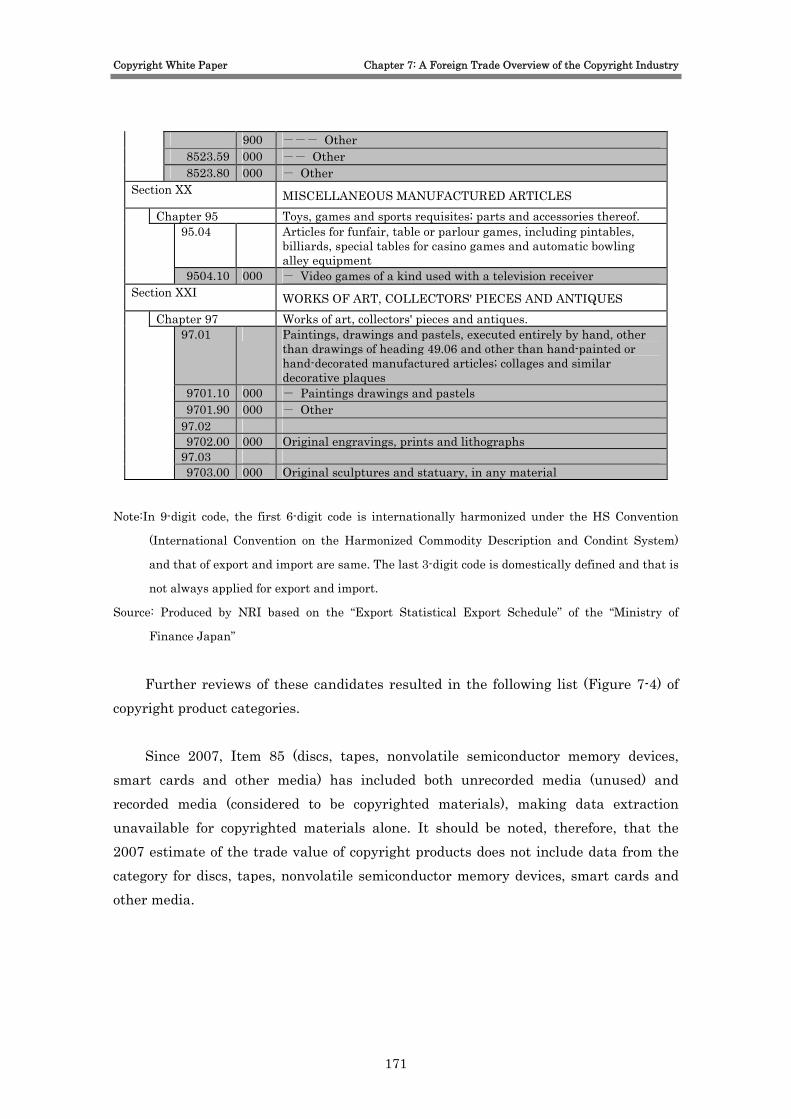
Copyright White Paper Chapter 7: A Foreign Trade Overview of the Copyright Industry
900 --- Other 8523.59 000 -- Other 8523.80 000 - Other
Section XX MISCELLANEOUS MANUFACTURED ARTICLES
Chapter 95 Toys, games and sports requisites; parts and accessories thereof. 95.04 Articles for funfair, table or parlour games, including pintables,
billiards, special tables for casino games and automatic bowling alley equipment
9504.10 000 - Video games of a kind used with a television receiver Section XXI WORKS OF ART, COLLECTORS' PIECES AND ANTIQUES
Chapter 97 Works of art, collectors' pieces and antiques. 97.01 Paintings, drawings and pastels, executed entirely by hand, other
than drawings of heading 49.06 and other than hand-painted or hand-decorated manufactured articles; collages and similar decorative plaques
9701.10 000 - Paintings drawings and pastels 9701.90 000 - Other 97.02 9702.00 000 Original engravings, prints and lithographs 97.03 9703.00 000 Original sculptures and statuary, in any material
Note:In 9-digit code, the first 6-digit code is internationally harmonized under the HS Convention
(International Convention on the Harmonized Commodity Description and Condint System)
and that of export and import are same. The last 3-digit code is domestically defined and that is
not always applied for export and import.
Source: Produced by NRI based on the “Export Statistical Export Schedule” of the “Ministry of
Finance Japan”
Further reviews of these candidates resulted in the following list (Figure 7-4) of
copyright product categories.
Since 2007, Item 85 (discs, tapes, nonvolatile semiconductor memory devices, smart cards and other media) has included both unrecorded media (unused) and recorded media (considered to be copyrighted materials), making data extraction unavailable for copyrighted materials alone. It should be noted, therefore, that the 2007 estimate of the trade value of copyright products does not include data from the category for discs, tapes, nonvolatile semiconductor memory devices, smart cards and other media.
171
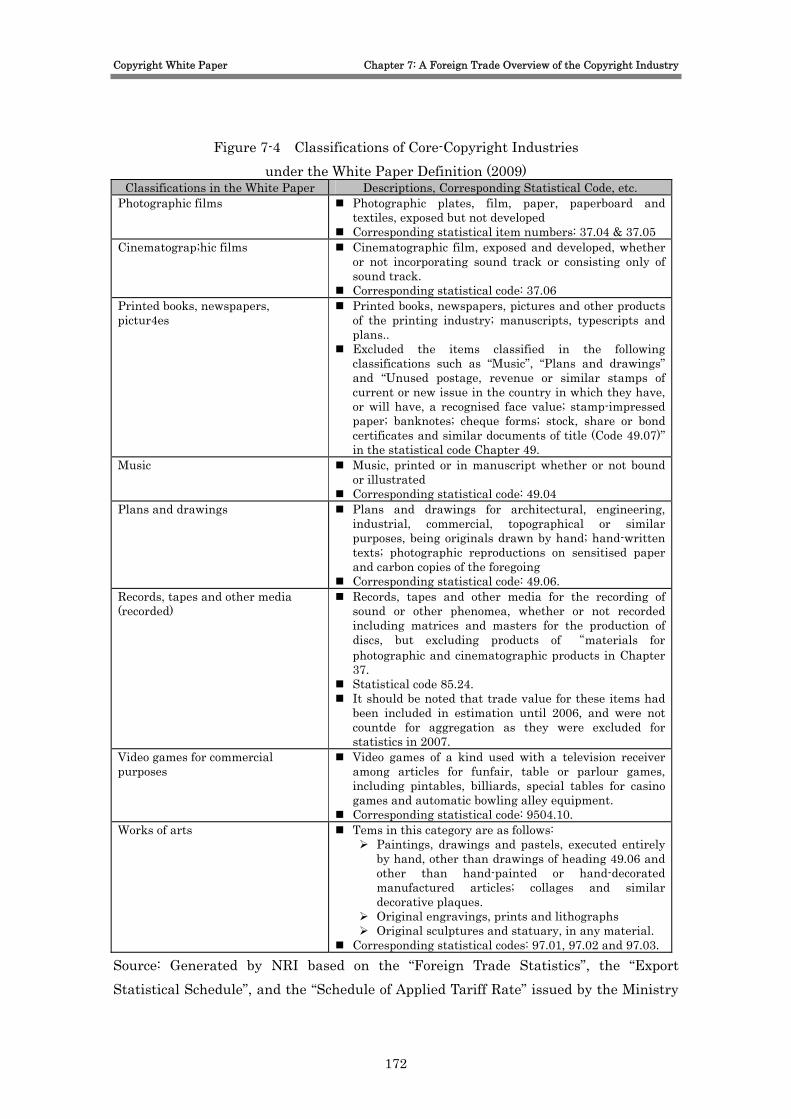
Copyright White Paper Chapter 7: A Foreign Trade Overview of the Copyright Industry
Figure 7-4 Classifications of Core-Copyright Industries under the White Paper Definition (2009)
Classifications in the White Paper Descriptions, Corresponding Statistical Code, etc. Photographic films Photographic plates, film, paper, paperboard and
textiles, exposed but not developed Corresponding statistical item numbers: 37.04 & 37.05
Cinematograp;hic films Cinematographic film, exposed and developed, whether or not incorporating sound track or consisting only of sound track.
Corresponding statistical code: 37.06 Printed books, newspapers, pictur4es
Printed books, newspapers, pictures and other products of the printing industry; manuscripts, typescripts and plans..
Excluded the items classified in the following classifications such as “Music”, “Plans and drawings” and “Unused postage, revenue or similar stamps of current or new issue in the country in which they have, or will have, a recognised face value; stamp-impressed paper; banknotes; cheque forms; stock, share or bond certificates and similar documents of title (Code 49.07)” in the statistical code Chapter 49.
Music Music, printed or in manuscript whether or not bound or illustrated
Corresponding statistical code: 49.04 Plans and drawings Plans and drawings for architectural, engineering,
industrial, commercial, topographical or similar purposes, being originals drawn by hand; hand-written texts; photographic reproductions on sensitised paper and carbon copies of the foregoing
Corresponding statistical code: 49.06. Records, tapes and other media (recorded)
Records, tapes and other media for the recording of sound or other phenomea, whether or not recorded including matrices and masters for the production of discs, but excluding products of “materials for photographic and cinematographic products in Chapter 37.
Statistical code 85.24. It should be noted that trade value for these items had
been included in estimation until 2006, and were not countde for aggregation as they were excluded for statistics in 2007.
Video games for commercial purposes
Video games of a kind used with a television receiver among articles for funfair, table or parlour games, including pintables, billiards, special tables for casino games and automatic bowling alley equipment.
Corresponding statistical code: 9504.10. Works of arts Tems in this category are as follows:
Paintings, drawings and pastels, executed entirely by hand, other than drawings of heading 49.06 and other than hand-painted or hand-decorated manufactured articles; collages and similar decorative plaques.
Original engravings, prints and lithographs Original sculptures and statuary, in any material.
Corresponding statistical codes: 97.01, 97.02 and 97.03. Source: Generated by NRI based on the “Foreign Trade Statistics”, the “Export Statistical Schedule”, and the “Schedule of Applied Tariff Rate” issued by the Ministry
172

Copyright White Paper Chapter 7: A Foreign Trade Overview of the Copyright Industry
of Finance Japan.
2) Foreign Trade of Inter-dependent Copyright Industry
The classification of the inter-dependent copyright industrial goods is shown in the below table:
Figure 7-5 Classifications of Inter-dependnent Copyright Industries under the White Paper Definition
Section VI PRODUCTS OF THE CHEMICAL OR ALLIED INDUSTRIES
Chapter 32 Tanning or dyeing extracts; tannins and their derivatives; dyes, pigments and other colouring matter; paints and varnishes; putty and other mastics; inks.
32.07 000
Prepared pigments, prepared opacifiers and prepared colours, vitrifiable enamels and glazes, engobes (slips), liquid lustres and similar preparations, of a kind used in the ceramic, enamelling or glass industry; glass frit and other glass, in the form of powder, granules or flakes.
32.12 000
Pigments (including metallic powders and flakes) dispersed in non-aqueous media, in liquid or paste form, of a kind used in the manufacture of paints (including enamels); stamping foils; dyes and other colouring matter put up in forms or packings for retail sale.
32.13 000 Artists', students' or signboard painters' colours, modifying tints, amusement colours and the like, in tablets, tubes, jars, bottles, pans or in similar forms or packings.
32.15 000 Printing ink, writing or drawing ink and other inks, whether or not concentrated or solid.
Chapter 37 Photographic or cinematographic goods.
37.01 000 Photographic plates and film in the flat, sensitised, unexposed, of any material other than paper, paperboard or textiles; instant print film in the flat, sensitised, unexposed, whether or not in packs.
37.02 000 Photographic film in rolls, sensitised, unexposed, of any material other than paper, paperboard or textiles; instant print film in rolls, sensitised, unexposed.
37.03 000 Photographic paper, paperboard and textiles, sensitised, unexposed.
37.07 000
Chemical preparations for photographic uses (other than varnishes, glues, adhesives and similar preparations); unmixed products for photographic uses, put up in measured portions or put up for retail sale in a form ready for use.
Section X PULP OF WOOD OR OF OTHER FIBROUS CELLULOSIC MATERIAL; RECOVERED (WASTE AND SCRAP) PAPER OR PAPERBOARD; PAPER AND PAPERBOARD AND ARTICLES THEREOF
Chapter 48 Paper and paperboard; articles of paper pulp, of paper or of paperboard. 48.01 000 Newsprint, in rolls or sheets.
173

Copyright White Paper Chapter 7: A Foreign Trade Overview of the Copyright Industry
48.02 000
Uncoated paper and paperboard, of a kind used for writing, printing or other graphic purposes, and non perforated punch-cards and punch tape paper, in rolls or rectangular (including square) sheets, of any size, other than paper of heading 48.01 or 48.03; hand-made paper and paperboard.
48.10 000
Paper and paperboard, coated on one or both sides with kaolin (China clay) or other inorganic substances, with or without a binder, and with no other coating, whether or not surface-coloured, surface -decorated or printed, in rolls or rectangular (including square) sheets, of any size.
Section XVI
MACHINERY AND MECHANICAL APPLIANCES; ELECTRICAL EQUIPMENT; PARTS THEREOF; SOUND RECORDERS AND REPRODUCERS, TELEVISION IMAGE AND SOUND RECORDERS AND REPRODUCERS, AND PARTS AND ACCESSORIES OF SUCH ARTICLES
Chapter 84 Nuclear reactors, boilers, machinery and mechanical appliances; parts thereof.
84.69 000 Typewriters other than printers of heading 84.43; word-processing machines
84.71 000
Automatic data processing machines and units thereof; magnetic or optical readers, machines for transcribing data onto data media in coded form and machines for processing such data, not elsewhere specified or included
Chapter 85 Electrical machinery and equipment and parts thereof; sound recorders and reproducers, television image and sound recorders and reproducers, and parts and accessories of such articles.
85.17 000
Telephone sets, including telephones for celular networks or for other wireless networks; other apparatus for the transmission or reception of voice, images or other data, including apparatus for communication in a wired or wireless network (such as a loca or wide area network), other than transmission or reception apparatus of heading 84.43, 85.25, 85.27 or 85.28
85.18 000
Microphones and stands therefor; loudspeakers, whetehr or not mounted in their enclosures; headphones and earphones, whether or not combined with a microphone, and sets consisting of a microphone and one or more loudspeakers; audio-frequency electric amplifiers; electric sound amplifier sets
85.19 000 Sound recording or reproducing apparatus
85.21 000 Video recording or reproducing apparatus, whether or not incorporating a video tuner
85.23 000
Discs, tapes, solid-state non-volatile storage devices, "smart cards" and other media for the recording of sound or of other phenomena, whether or not recorded, including matrices and masters for the production of discs, but excluding products of Chapter 37
85.25 000
Transmission apparatus for radio-broadcasting or television, whether or not incorporating reception apparatus or sound recording or reproducing apparatus; television cameras, digital cameras and video camera recorders
85.27 000 Reception apparatus for radio-broadcasting, whether or not combined, in the same housing, with sound recording or reproducing apparatus or a clock
85.28 000
Monitors and projectors, not incorporating television reception apparatus; reception apparatus for television, whether or not incorporating radio-broadcast receivers or sound or video recording or reproducing apparatus
174
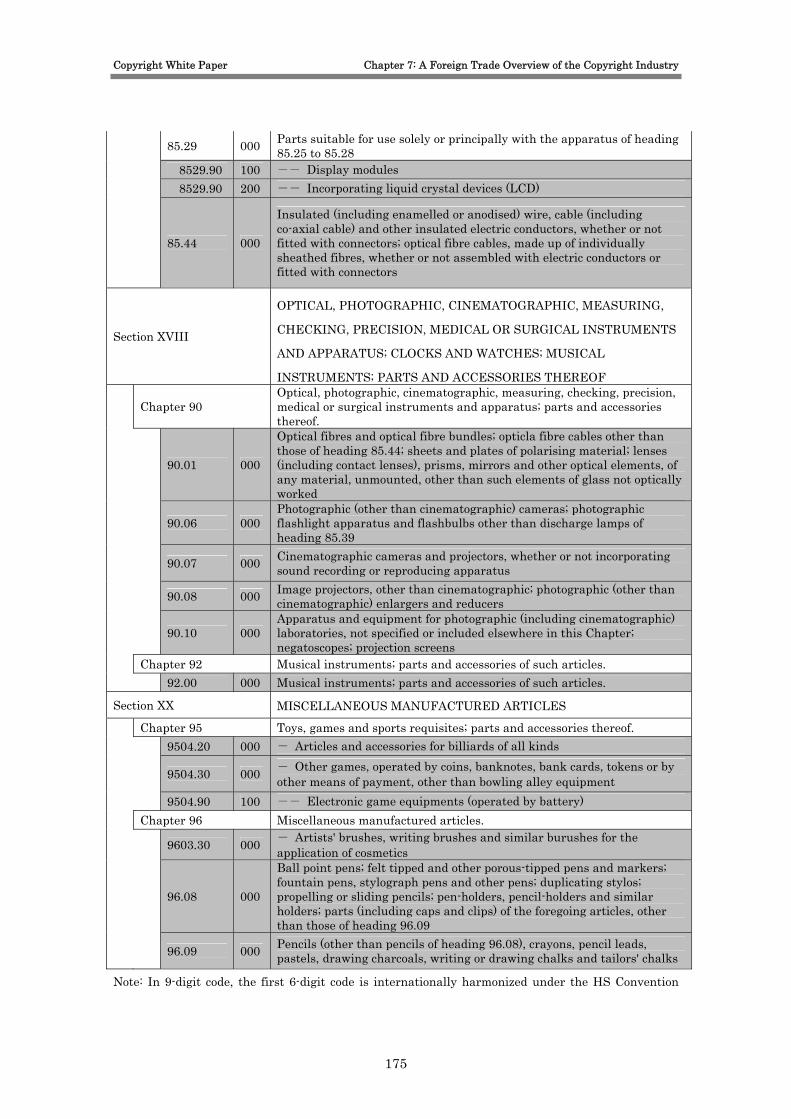
Copyright White Paper Chapter 7: A Foreign Trade Overview of the Copyright Industry
85.29 000 Parts suitable for use solely or principally with the apparatus of heading 85.25 to 85.28
8529.90 100 -- Display modules 8529.90 200 -- Incorporating liquid crystal devices (LCD)
85.44 000
Insulated (including enamelled or anodised) wire, cable (including co-axial cable) and other insulated electric conductors, whether or not fitted with connectors; optical fibre cables, made up of individually sheathed fibres, whether or not assembled with electric conductors or fitted with connectors
Section XVIII
OPTICAL, PHOTOGRAPHIC, CINEMATOGRAPHIC, MEASURING,
CHECKING, PRECISION, MEDICAL OR SURGICAL INSTRUMENTS
AND APPARATUS; CLOCKS AND WATCHES; MUSICAL
INSTRUMENTS; PARTS AND ACCESSORIES THEREOF
Chapter 90 Optical, photographic, cinematographic, measuring, checking, precision, medical or surgical instruments and apparatus; parts and accessories thereof.
90.01 000
Optical fibres and optical fibre bundles; opticla fibre cables other than those of heading 85.44; sheets and plates of polarising material; lenses (including contact lenses), prisms, mirrors and other optical elements, of any material, unmounted, other than such elements of glass not optically worked
90.06 000 Photographic (other than cinematographic) cameras; photographic flashlight apparatus and flashbulbs other than discharge lamps of heading 85.39
90.07 000 Cinematographic cameras and projectors, whether or not incorporating sound recording or reproducing apparatus
90.08 000 Image projectors, other than cinematographic; photographic (other than cinematographic) enlargers and reducers
90.10 000 Apparatus and equipment for photographic (including cinematographic) laboratories, not specified or included elsewhere in this Chapter; negatoscopes; projection screens
Chapter 92 Musical instruments; parts and accessories of such articles. 92.00 000 Musical instruments; parts and accessories of such articles.
Section XX MISCELLANEOUS MANUFACTURED ARTICLES
Chapter 95 Toys, games and sports requisites; parts and accessories thereof. 9504.20 000 - Articles and accessories for billiards of all kinds
9504.30 000 - Other games, operated by coins, banknotes, bank cards, tokens or by other means of payment, other than bowling alley equipment
9504.90 100 -- Electronic game equipments (operated by battery) Chapter 96 Miscellaneous manufactured articles.
9603.30 000 - Artists' brushes, writing brushes and similar burushes for the application of cosmetics
96.08 000
Ball point pens; felt tipped and other porous-tipped pens and markers; fountain pens, stylograph pens and other pens; duplicating stylos; propelling or sliding pencils; pen-holders, pencil-holders and similar holders; parts (including caps and clips) of the foregoing articles, other than those of heading 96.09
96.09 000 Pencils (other than pencils of heading 96.08), crayons, pencil leads, pastels, drawing charcoals, writing or drawing chalks and tailors' chalks
Note: In 9-digit code, the first 6-digit code is internationally harmonized under the HS Convention
175

Copyright White Paper Chapter 7: A Foreign Trade Overview of the Copyright Industry
(International Convention on the Harmonized Commodity Description and Condint System)
and that of export and import are same. The last 3-digit code is domestically defined and that is
not always applied for export and import.
Source: Produced by NRI based on the “Export Statistical Export Schedule” of the “Ministry of
Finance Japan”
Further reviews of these candidates resulted in the following list of copyright
product categories:
Figure 7-6 Classifications of Inter-dependent Copryright Industrial Products under the White Paper Definition
Classification under the White Paper Definition
Description, correspondoing statistical code, etc.
Paper Newsprint, in rolls or sheets, uncoated paper and
paperboard, of a kind used for writing, printing or other graphic purposes, and paperboard (excluding paper and paperboard of a kind used as a base for photosensitive, heat-sensitive or electro-sensitive paper or paperboard classified statistical code 4802.20)
Corredponding statistical codes: 48.01, 48.02, and 48.10
Printing ink Printing ink; writing or drawing ink. Corresponding statistical code: 32.15
Computer Typewriters; word-processing machines; automatic data
processing machines and units thereof; magnetic or optical readers.
Corresponding statistical codes: 84.69 and 84.71.
Recording media Discs, tapes, solid-state non-volatile storage devices,
"smart cards" and other media for the recording of sound or of other phenomena, whether or not recorded, including matrices and masters for the production of discs, but excluding products of Chapter 37
Corresponding statistical code: 85.23
Transmission & reception apparatus
for broadcasting
Transmission apparatus for radio-broadcasting or television,television cameras, digital cameras and video camera recorders
Corresponding statistical codes: 85.25, 85.27, and 85.28
Transmission/ reception cables and
telephones
Telephone sets, including telephones for cellular networks or for other wireless networks; other apparatus for the transmission or reception of voice, images or other data; wires/cables; optical figre cables.
Corresponding statistical codes: 85.17, 85.44, and 90.01.
Musical instruments Musical instruments; parts and accessories of such
articles. Corresponding statistical code: 92
Sound recording or reproducing
apparatus and microphones
Microphones; loudspeakers; headphones; earphones; sound-recording or reproducing apparatus.
Corresponding statistical codes: 85.18, 85.19
Cinematographic apparatus and
equipments
Video recording or reproducing apparatus; cinematographic cameras: image projectors.
Corresponding statistical codes: 85.21, 90.07 and 90.10
Photographic apparatus and Photographic plates and films in sensitized (but not
176
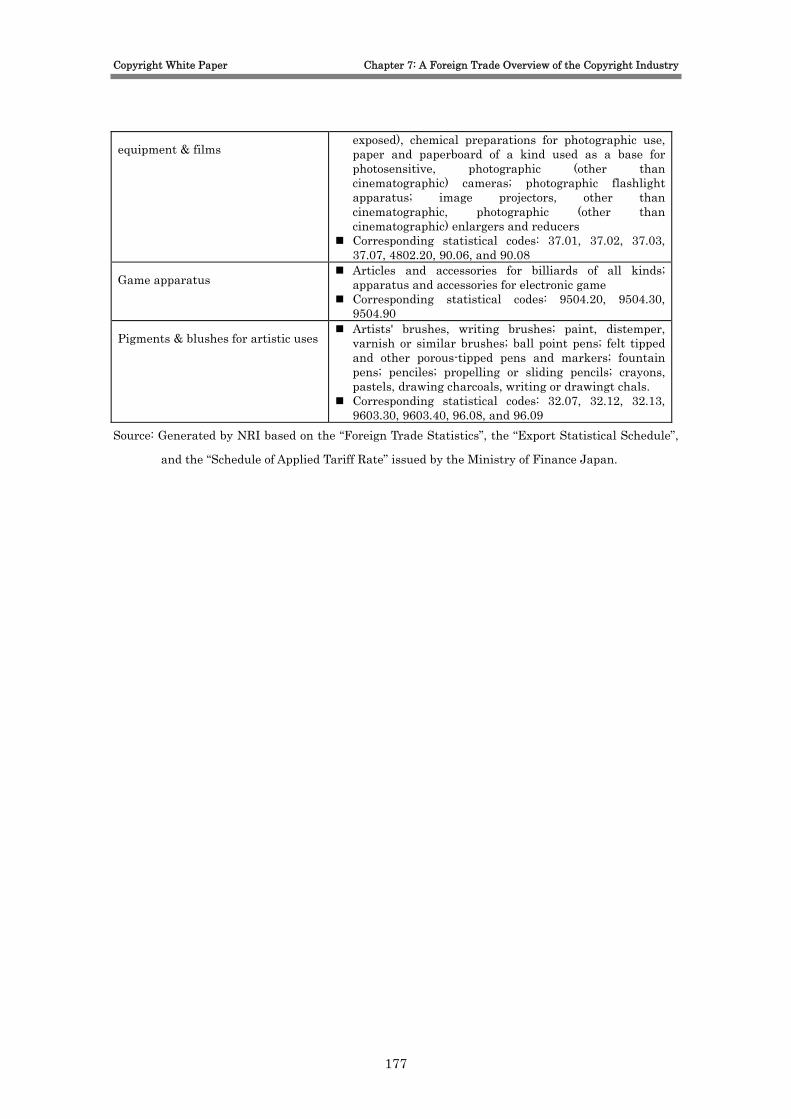
Copyright White Paper Chapter 7: A Foreign Trade Overview of the Copyright Industry
equipment & films exposed), chemical preparations for photographic use, paper and paperboard of a kind used as a base for photosensitive, photographic (other than cinematographic) cameras; photographic flashlight apparatus; image projectors, other than cinematographic, photographic (other than cinematographic) enlargers and reducers
Corresponding statistical codes: 37.01, 37.02, 37.03, 37.07, 4802.20, 90.06, and 90.08
Game apparatus Articles and accessories for billiards of all kinds;
apparatus and accessories for electronic game Corresponding statistical codes: 9504.20, 9504.30,
9504.90
Pigments & blushes for artistic uses Artists' brushes, writing brushes; paint, distemper,
varnish or similar brushes; ball point pens; felt tipped and other porous-tipped pens and markers; fountain pens; penciles; propelling or sliding pencils; crayons, pastels, drawing charcoals, writing or drawingt chals.
Corresponding statistical codes: 32.07, 32.12, 32.13, 9603.30, 9603.40, 96.08, and 96.09
Source: Generated by NRI based on the “Foreign Trade Statistics”, the “Export Statistical Schedule”,
and the “Schedule of Applied Tariff Rate” issued by the Ministry of Finance Japan.
177

Copyright White Paper Chapter 7: A Foreign Trade Overview of the Copyright Industry
II. Details for copyright industry trade value estimates
The following tables show the statistics used for estimating trade values in the copyright ndustry and the years in which data were available: ○ Statistics used for estimating trade valudes
○ Years in which data were available for each statistics Statistics 1998 1999 2000 2001 2002 2003 2004 2005 2006 2007Balance of Payments Statistics (BOJ)
✓ ✓ ✓ ✓ ✓ ✓ ✓ ✓ ✓ ✓
Foreign Trade Statistics(the Ministry of Finance Japan)
✓ ✓ ✓ ✓ ✓ ✓ ✓ ✓ ✓ ✓
Corresponding copyright-industry classification Used Statistics Information service Copyright-related usage fees
Foreign trade in services
Cultural/entertainment services
Balance of Payments Statistics (BOJ)
Photographic films Cinematographic films Printed books, newspapers, pictures
Musics Plans and drawings Records, tapes and other media (recorded) Video games for commercial purposes
Core-copyright dustries in
Works of arts Paper Printing inks Computer Recording media Transmission & reception apparatus for broadcasting Transmission/ reception cables and telephones Musical instruments Sound recording or reproducing apparatus & equipments and microphonesCinematographic apparatus and equipments Photographic apparatus & equipments and films Game apparatus
Foreign trade of goods
Inter-dependent copyright industries
Pigments and blushes for artistic uses
Foreign Trade Statistics(the Ministry of Finance Japan)
178
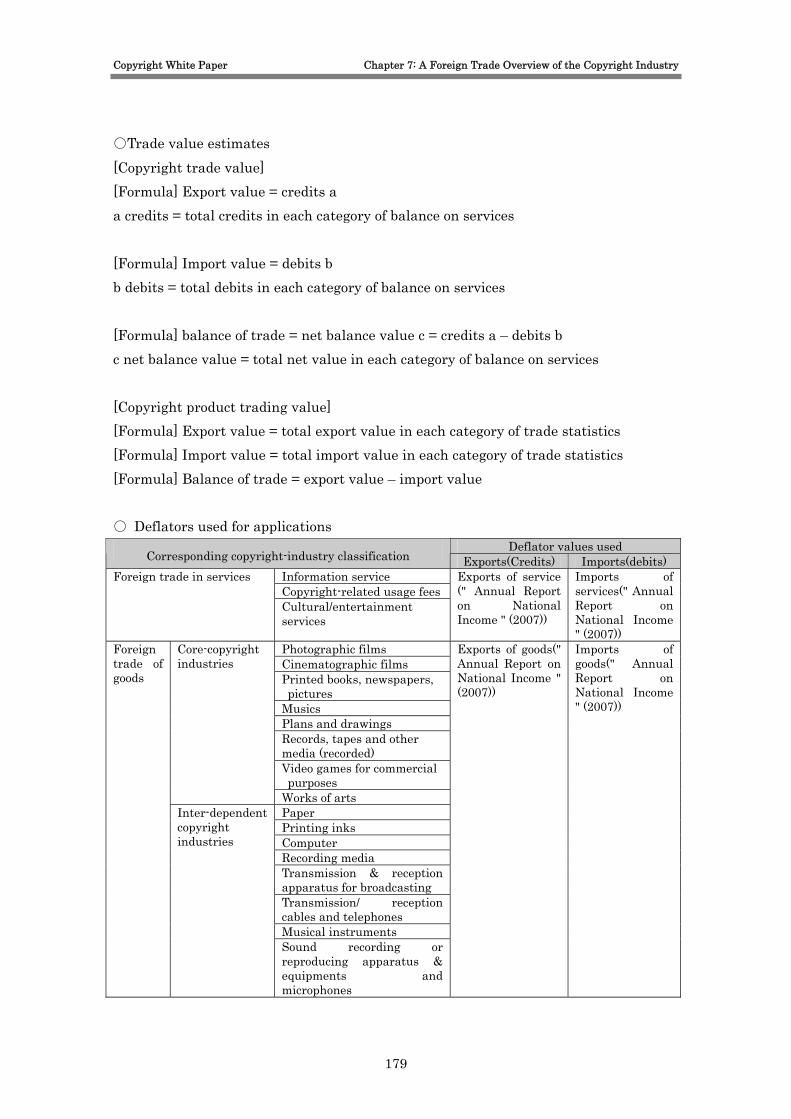
Copyright White Paper Chapter 7: A Foreign Trade Overview of the Copyright Industry
○Trade value estimates [Copyright trade value] [Formula] Export value = credits a a credits = total credits in each category of balance on services [Formula] Import value = debits b b debits = total debits in each category of balance on services [Formula] balance of trade = net balance value c = credits a – debits b c net balance value = total net value in each category of balance on services [Copyright product trading value] [Formula] Export value = total export value in each category of trade statistics [Formula] Import value = total import value in each category of trade statistics [Formula] Balance of trade = export value – import value ○ Deflators used for applications
Deflator values used Corresponding copyright-industry classification Exports(Credits) Imports(debits)
Information service Copyright-related usage fees
Foreign trade in services
Cultural/entertainment services
Exports of service (" Annual Report on National Income " (2007))
Imports of services(" Annual Report on National Income " (2007))
Photographic films Cinematographic films Printed books, newspapers, pictures
Musics Plans and drawings Records, tapes and other media (recorded) Video games for commercial purposes
Core-copyright industries
Works of arts Paper Printing inks Computer Recording media Transmission & reception apparatus for broadcasting Transmission/ reception cables and telephones Musical instruments
Foreign trade of goods
Inter-dependent copyright industries
Sound recording or reproducing apparatus & equipments and microphones
Exports of goods(" Annual Report on National Income " (2007))
Imports of goods(" Annual Report on National Income " (2007))
179
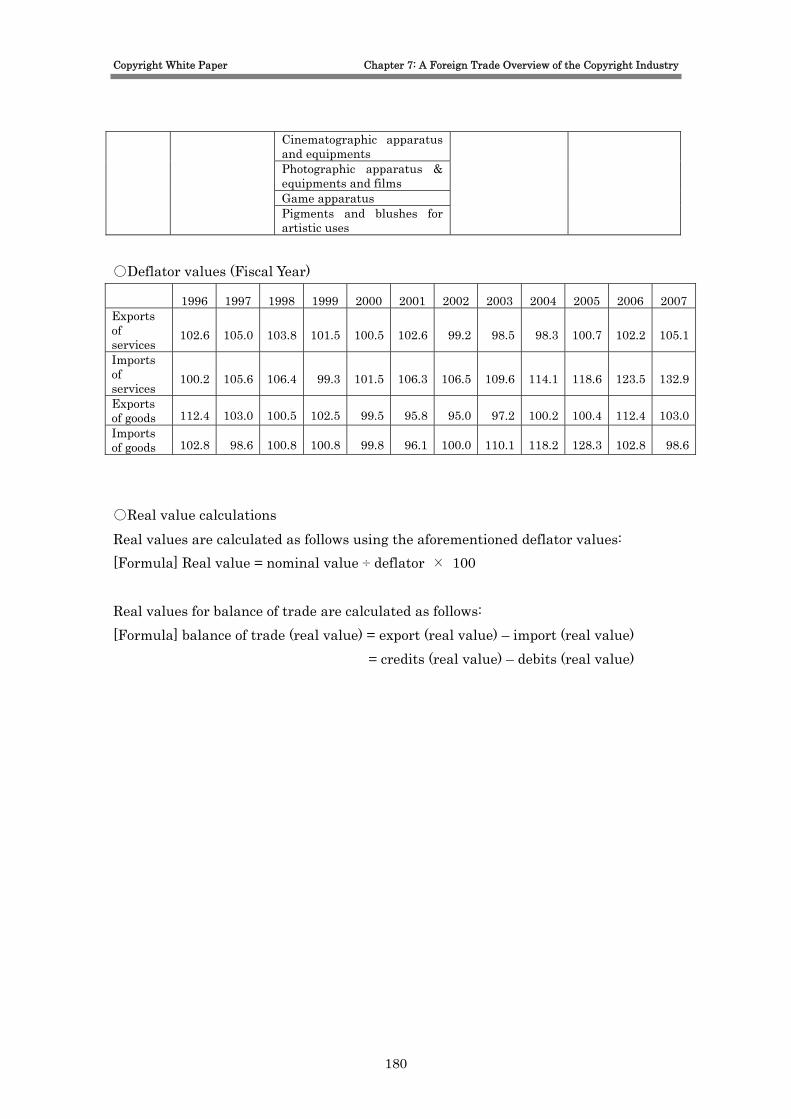
Copyright White Paper Chapter 7: A Foreign Trade Overview of the Copyright Industry
Cinematographic apparatus and equipments Photographic apparatus & equipments and films Game apparatus Pigments and blushes for artistic uses
○Deflator values (Fiscal Year) 1996 1997 1998 1999 2000 2001 2002 2003 2004 2005 2006 2007
Exports of services
102.6 105.0 103.8 101.5 100.5 102.6 99.2 98.5 98.3 100.7 102.2 105.1
Imports of services
100.2 105.6 106.4 99.3 101.5 106.3 106.5 109.6 114.1 118.6 123.5 132.9
Exports of goods 112.4 103.0 100.5 102.5 99.5 95.8 95.0 97.2 100.2 100.4 112.4 103.0Imports of goods 102.8 98.6 100.8 100.8 99.8 96.1 100.0 110.1 118.2 128.3 102.8 98.6
○Real value calculations Real values are calculated as follows using the aforementioned deflator values: [Formula] Real value = nominal value ÷ deflator × 100 Real values for balance of trade are calculated as follows: [Formula] balance of trade (real value) = export (real value) – import (real value)
= credits (real value) – debits (real value)
180

Copyright White Paper Chapter 7: A Foreign Trade Overview of the Copyright Industry
III. Scale of copyright industry foreign trade(Estimates) 1. Scale of copyright trade 1) Scale of copyright trade: an overview
Japan’s copyright trade values (real values) for 2007 are 319 billion yen in credits (exports) and 1,036 trillion yen in debits (imports), making the excess of debits over credits 717 billion in the balance of trade.
Figure 7-7 Trade values of copyright foreign trade (Fiscal 2007) (Billion yen)
Credits (Exports) Debits (Imports) Net balance value (balance of trade)
Information service 105 326 -222Copyright-related usage fees 200 597 -397Cultural/entertainment services 15 113 -98Total 319 1,036 -717
(At market prices in calendar year of 2000) 2) Scale of copyright trade: trends
An analysis of Japan’s copyright foreign trade values (real values) indicates that the excess of debits over credits has been growing since 2003. This was mainly due to an increase in copyright usage fees.
Figure 7-8 Change of copyright foreign trades in the Core-copyright industries (real values)
-1,200
-1,000
-800
-600
-400
-200
0
200
400
1998 1999 2000 2001 2002 2003 2004 2005 2006 2007
-1,200
-1,000
-800
-600
-400
-200
0
200
400
Credits(Exports) Debits(Imports) Balance
(Billion yen)
181
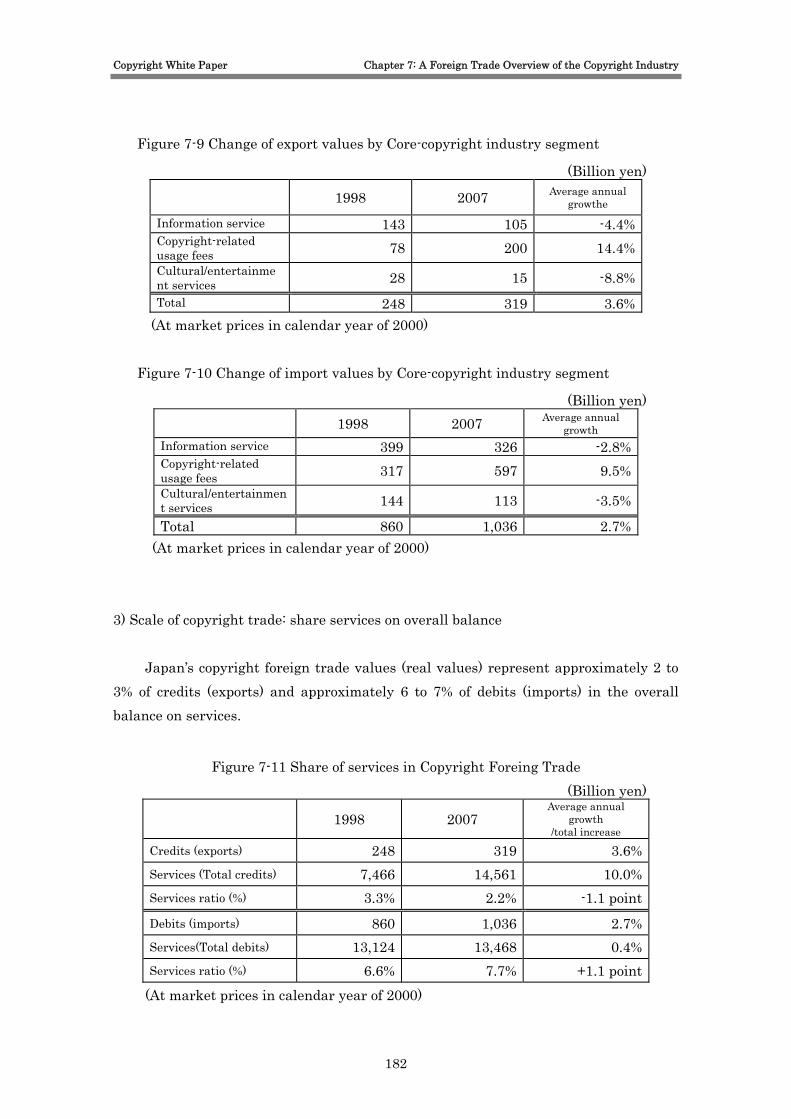
Copyright White Paper Chapter 7: A Foreign Trade Overview of the Copyright Industry
Figure 7-9 Change of export values by Core-copyright industry segment
(Billion yen) 1998 2007 Average annual
growthe Information service 143 105 -4.4% Copyright-related usage fees 78 200 14.4% Cultural/entertainment services 28 15 -8.8% Total 248 319 3.6%
(At market prices in calendar year of 2000)
Figure 7-10 Change of import values by Core-copyright industry segment
(Billion yen) 1998 2007 Average annual
growth Information service 399 326 -2.8% Copyright-related usage fees 317 597 9.5% Cultural/entertainment services 144 113 -3.5%
Total 860 1,036 2.7% (At market prices in calendar year of 2000)
3) Scale of copyright trade: share services on overall balance
Japan’s copyright foreign trade values (real values) represent approximately 2 to 3% of credits (exports) and approximately 6 to 7% of debits (imports) in the overall balance on services.
Figure 7-11 Share of services in Copyright Foreing Trade (Billion yen)
1998 2007
Average annual growth
/total increase Credits (exports) 248 319 3.6% Services (Total credits) 7,466 14,561 10.0% Services ratio (%) 3.3% 2.2% -1.1 point Debits (imports) 860 1,036 2.7% Services(Total debits) 13,124 13,468 0.4% Services ratio (%) 6.6% 7.7% +1.1 point
(At market prices in calendar year of 2000)
182
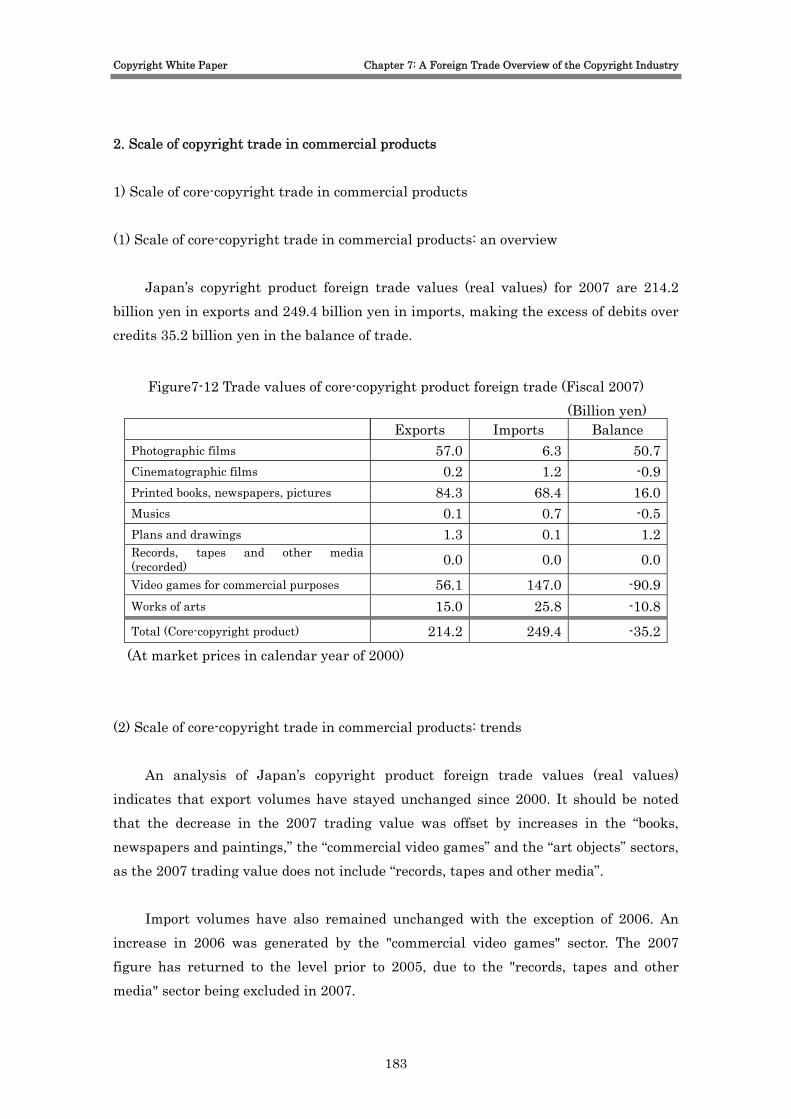
Copyright White Paper Chapter 7: A Foreign Trade Overview of the Copyright Industry
2. Scale of copyright trade in commercial products 1) Scale of core-copyright trade in commercial products (1) Scale of core-copyright trade in commercial products: an overview
Japan’s copyright product foreign trade values (real values) for 2007 are 214.2 billion yen in exports and 249.4 billion yen in imports, making the excess of debits over credits 35.2 billion yen in the balance of trade.
Figure7-12 Trade values of core-copyright product foreign trade (Fiscal 2007) (Billion yen)
Exports Imports Balance Photographic films 57.0 6.3 50.7Cinematographic films 0.2 1.2 -0.9Printed books, newspapers, pictures 84.3 68.4 16.0Musics 0.1 0.7 -0.5Plans and drawings 1.3 0.1 1.2Records, tapes and other media (recorded) 0.0 0.0 0.0Video games for commercial purposes 56.1 147.0 -90.9Works of arts 15.0 25.8 -10.8Total (Core-copyright product) 214.2 249.4 -35.2
(At market prices in calendar year of 2000) (2) Scale of core-copyright trade in commercial products: trends
An analysis of Japan’s copyright product foreign trade values (real values) indicates that export volumes have stayed unchanged since 2000. It should be noted that the decrease in the 2007 trading value was offset by increases in the “books, newspapers and paintings,” the “commercial video games” and the “art objects” sectors, as the 2007 trading value does not include “records, tapes and other media”.
Import volumes have also remained unchanged with the exception of 2006. An increase in 2006 was generated by the "commercial video games" sector. The 2007 figure has returned to the level prior to 2005, due to the "records, tapes and other media" sector being excluded in 2007.
183
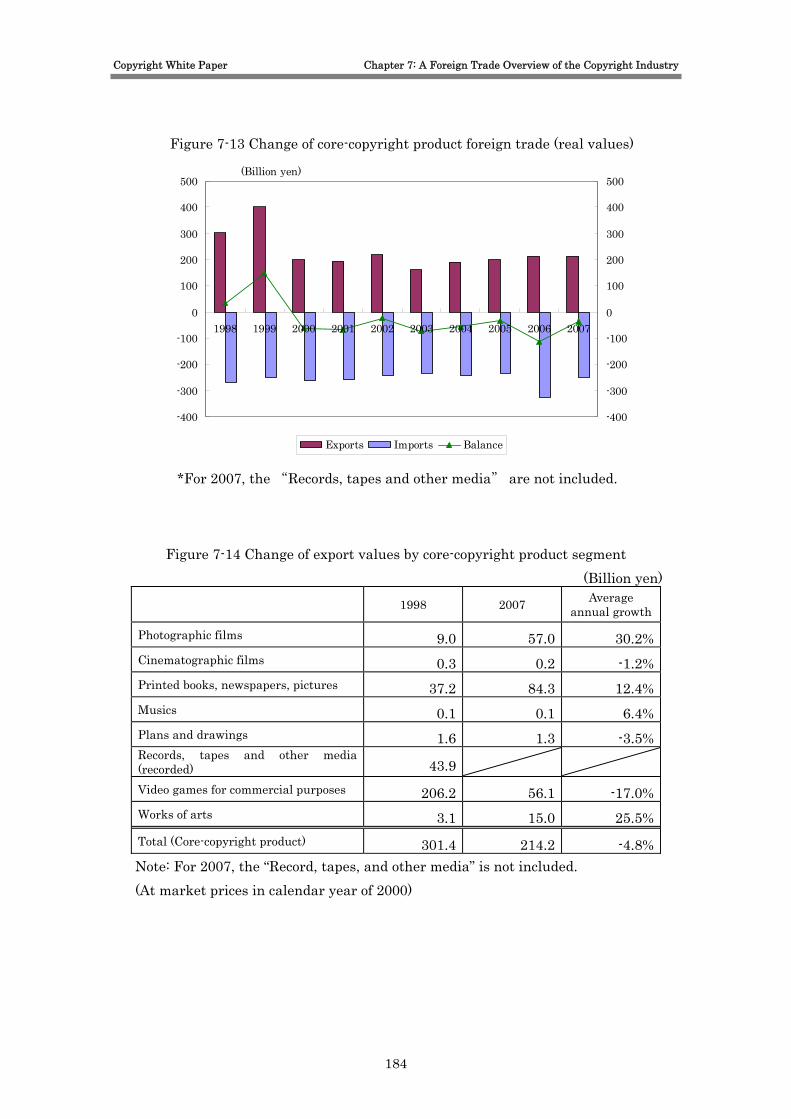
Copyright White Paper Chapter 7: A Foreign Trade Overview of the Copyright Industry
Figure 7-13 Change of core-copyright product foreign trade (real values)
-400
-300
-200
-100
0
100
200
300
400
500
1998 1999 2000 2001 2002 2003 2004 2005 2006 2007
-400
-300
-200
-100
0
100
200
300
400
500
Exports Imports Balance
(Billion yen)
*For 2007, the “Records, tapes and other media” are not included.
Figure 7-14 Change of export values by core-copyright product segment (Billion yen)
1998 2007 Average annual growth
Photographic films 9.0 57.0 30.2%Cinematographic films 0.3 0.2 -1.2%Printed books, newspapers, pictures 37.2 84.3 12.4%Musics 0.1 0.1 6.4%Plans and drawings 1.6 1.3 -3.5%Records, tapes and other media (recorded) 43.9Video games for commercial purposes 206.2 56.1 -17.0%Works of arts 3.1 15.0 25.5%Total (Core-copyright product) 301.4 214.2 -4.8%Note: For 2007, the “Record, tapes, and other media” is not included. (At market prices in calendar year of 2000)
184
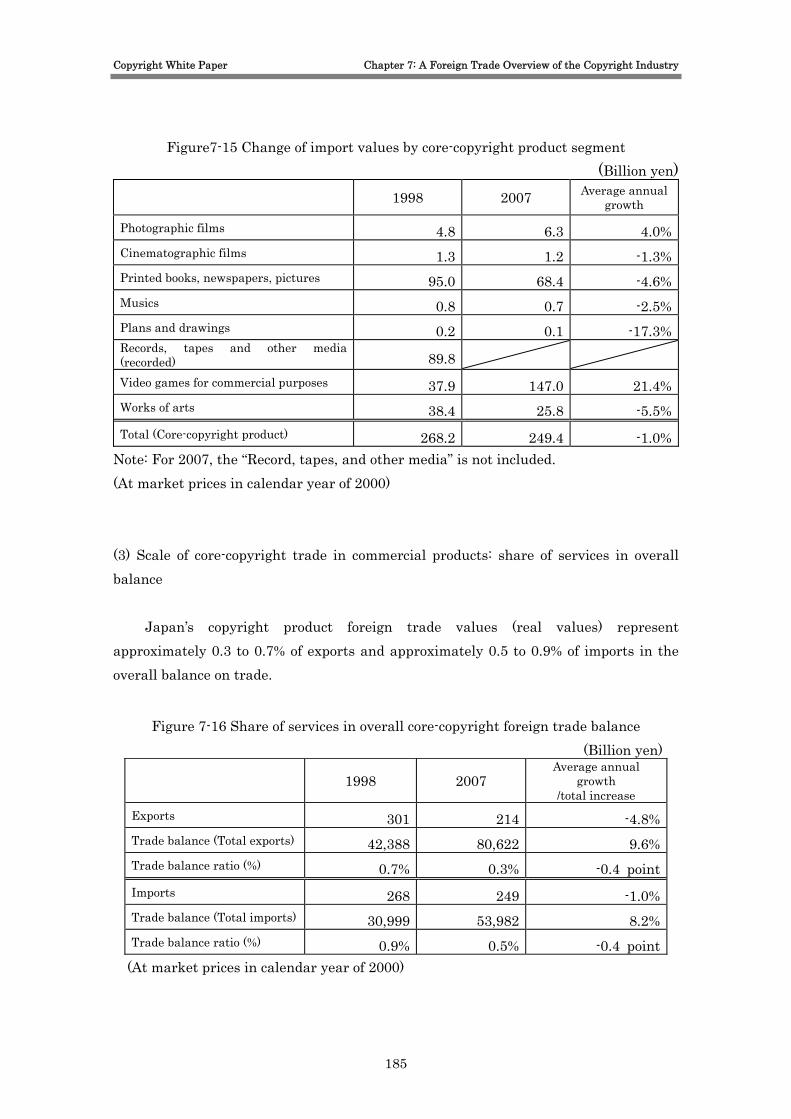
Copyright White Paper Chapter 7: A Foreign Trade Overview of the Copyright Industry
Figure7-15 Change of import values by core-copyright product segment (Billion yen)
1998 2007 Average annual growth
Photographic films 4.8 6.3 4.0%Cinematographic films 1.3 1.2 -1.3%Printed books, newspapers, pictures 95.0 68.4 -4.6%Musics 0.8 0.7 -2.5%Plans and drawings 0.2 0.1 -17.3%Records, tapes and other media (recorded) 89.8 Video games for commercial purposes 37.9 147.0 21.4%Works of arts 38.4 25.8 -5.5%Total (Core-copyright product) 268.2 249.4 -1.0%
Note: For 2007, the “Record, tapes, and other media” is not included. (At market prices in calendar year of 2000) (3) Scale of core-copyright trade in commercial products: share of services in overall balance
Japan’s copyright product foreign trade values (real values) represent approximately 0.3 to 0.7% of exports and approximately 0.5 to 0.9% of imports in the overall balance on trade.
Figure 7-16 Share of services in overall core-copyright foreign trade balance (Billion yen)
1998 2007
Average annual growth
/total increase Exports 301 214 -4.8%Trade balance (Total exports) 42,388 80,622 9.6%Trade balance ratio (%) 0.7% 0.3% -0.4 pointImports 268 249 -1.0%Trade balance (Total imports) 30,999 53,982 8.2%Trade balance ratio (%) 0.9% 0.5% -0.4 point
(At market prices in calendar year of 2000)
185
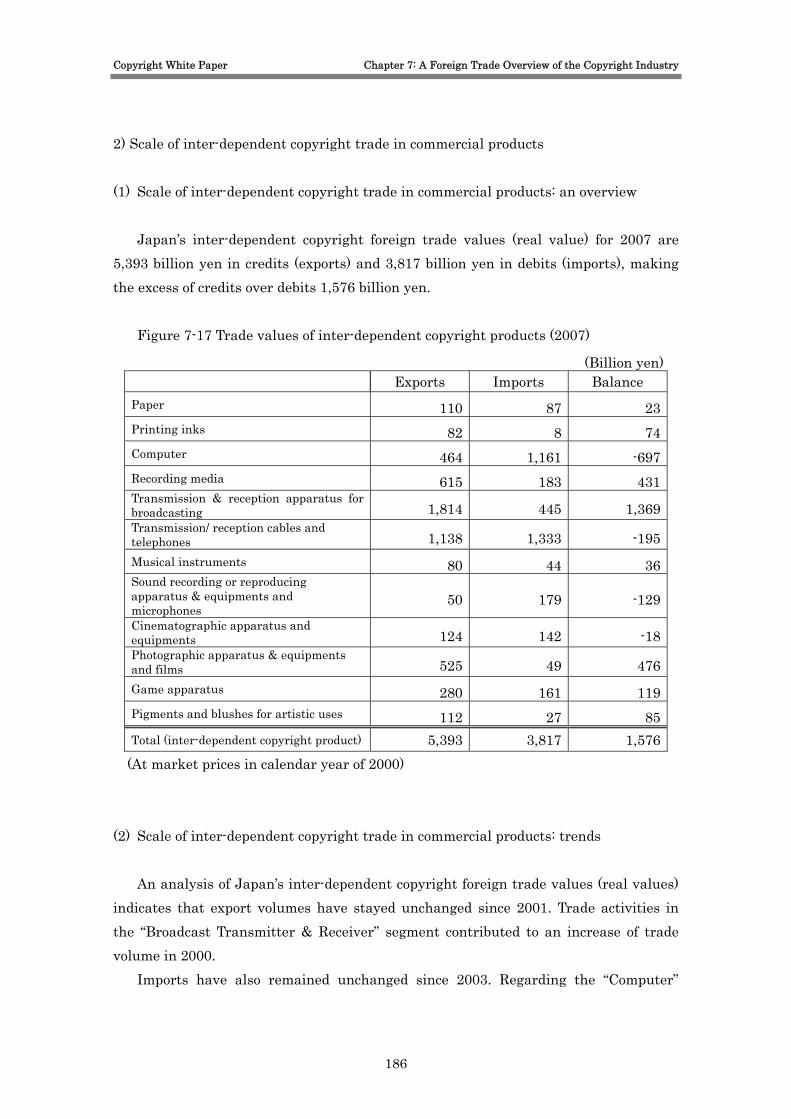
Copyright White Paper Chapter 7: A Foreign Trade Overview of the Copyright Industry
2) Scale of inter-dependent copyright trade in commercial products (1) Scale of inter-dependent copyright trade in commercial products: an overview
Japan’s inter-dependent copyright foreign trade values (real value) for 2007 are
5,393 billion yen in credits (exports) and 3,817 billion yen in debits (imports), making the excess of credits over debits 1,576 billion yen.
Figure 7-17 Trade values of inter-dependent copyright products (2007)
(Billion yen) Exports Imports Balance Paper 110 87 23Printing inks 82 8 74Computer 464 1,161 -697Recording media 615 183 431Transmission & reception apparatus for broadcasting 1,814 445 1,369Transmission/ reception cables and telephones 1,138 1,333 -195Musical instruments 80 44 36Sound recording or reproducing apparatus & equipments and microphones
50 179 -129
Cinematographic apparatus and equipments 124 142 -18Photographic apparatus & equipments and films 525 49 476Game apparatus 280 161 119Pigments and blushes for artistic uses 112 27 85Total (inter-dependent copyright product) 5,393 3,817 1,576
(At market prices in calendar year of 2000)
(2) Scale of inter-dependent copyright trade in commercial products: trends An analysis of Japan’s inter-dependent copyright foreign trade values (real values)
indicates that export volumes have stayed unchanged since 2001. Trade activities in the “Broadcast Transmitter & Receiver” segment contributed to an increase of trade volume in 2000.
Imports have also remained unchanged since 2003. Regarding the “Computer”
186

Copyright White Paper Chapter 7: A Foreign Trade Overview of the Copyright Industry
segment, after reached a peak in 2003 demonstrating an upward trend, in 2007 the trade values have declined to the level of 1998.
Figure 7-18 Change of foreign trades in the inter-dependent copyright industries (real values)
0
2,000
4,000
6,000
8,000
1998 1999 2000 2001 2002 2003 2004 2005 2006 2007
(Billion yen)
-6,000
-4,000
-2,000
Exports Imports Balance
*For 2007, the “Record, tapes, and other media” is not included.
Figure 7-19 Change of export values by inter-dependent copyright industry segment
(Billion yen)
1998 2007 Average annual growth
Paper 71 110 5.0%Printing inks 60 82 3.6%Computer 1,778 464 -13.9%Recording media 289 615 8.8%Transmission & reception apparatus for broadcasting 1,110 1,814 5.6%Transmission/ reception cables and
732telephones 1,138 5.0%Musical instruments 104 80 -2.8%Sound recording or reproducing apparatus & equipments and microphones
194 50 -14.0%
Cinematographic apparatus and equipments 477 124 -13.9%Photographic apparatus & equipments and films 559 525 -0.7%Game apparatus 99 280 12.3%
187
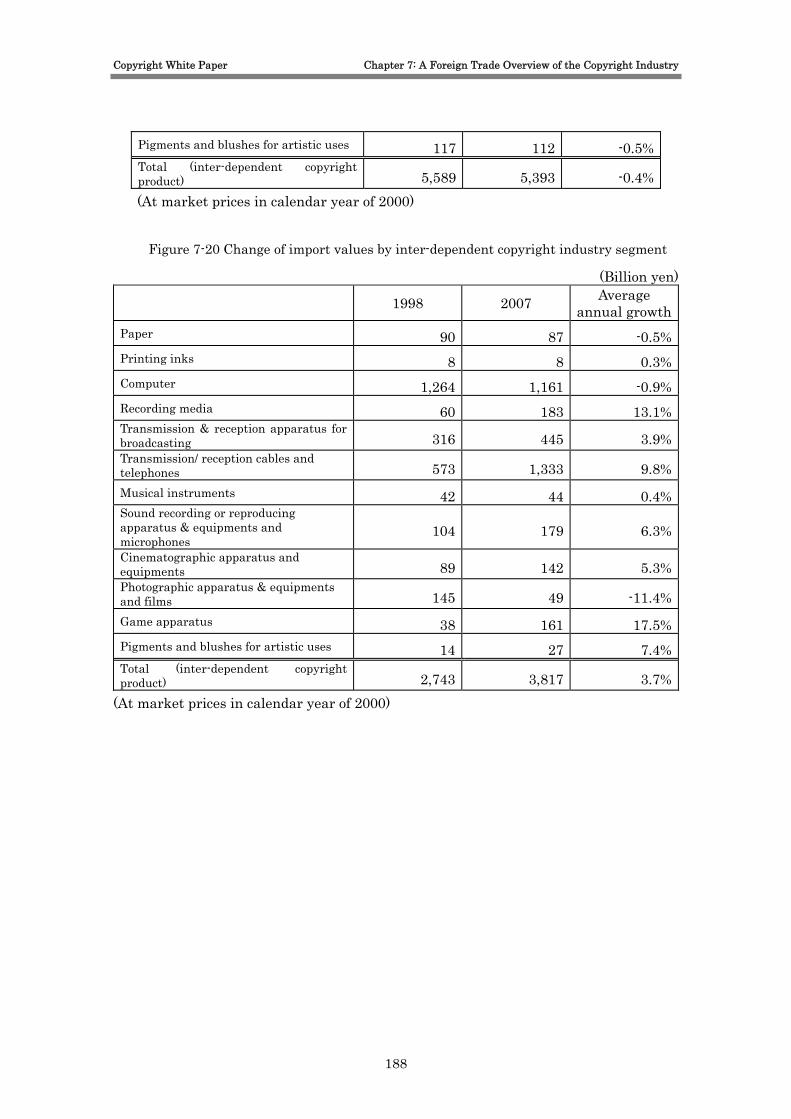
Copyright White Paper Chapter 7: A Foreign Trade Overview of the Copyright Industry
Pigments and blushes for artistic uses 117 112 -0.5%Total (inter-dependent copyright product) 5,589 5,393 -0.4%(At market prices in calendar year of 2000)
Figure 7-20 Change of import values by inter-dependent copyright industry segment
(Billion yen)
1998 2007 Average annual growth
Paper 90 87 -0.5%Printing inks 8 8 0.3%Computer 1,264 1,161 -0.9%Recording media 60 183 13.1%Transmission & reception apparatus for broadcasting 316 445 3.9%Transmission/ reception cables and telephones 573 1,333 9.8%Musical instruments 42 44 0.4%Sound recording or reproducing apparatus & equipments and microphones
104 179 6.3%
Cinematographic apparatus and equipments 89 142 5.3%Photographic apparatus & equipments
145 49 -11.4%and films Game apparatus 38 161 17.5%Pigments and blushes for artistic uses 14 27 7.4%Total (inter-dependent copyright product) 2,743 3,817 3.7%
(At market prices in calendar year of 2000)
188
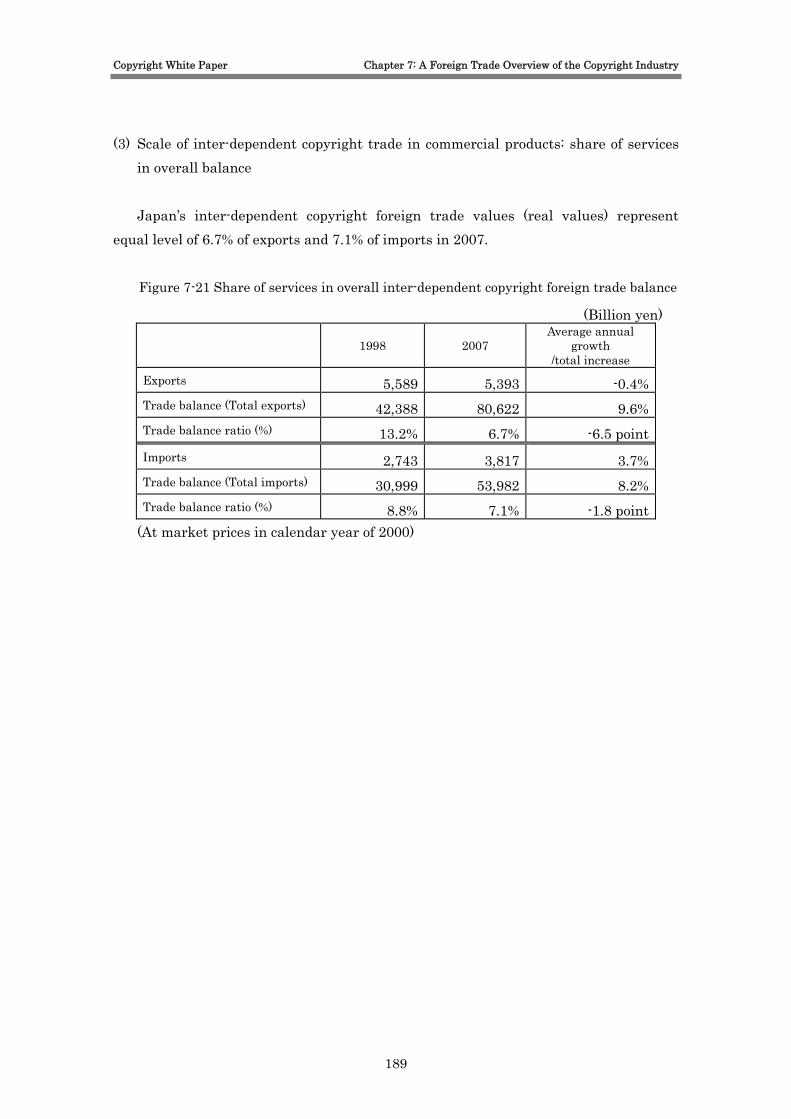
Copyright White Paper Chapter 7: A Foreign Trade Overview of the Copyright Industry
(3) Scale of inter-dependent copyright trade in commercial products: share of services in overall balance Japan’s inter-dependent copyright foreign trade values (real values) represent
equal level of 6.7% of exports and 7.1% of imports in 2007. Figure 7-21 Share of services in overall inter-dependent copyright foreign trade balance
(Billion yen)
1998 2007 Average annual
growth /total increase
Exports 5,589 5,393 -0.4% Trade balance (Total exports) 42,388 80,622 9.6% Trade balance ratio (%) 13.2% 6.7% -6.5 point Imports 2,743 3,817 3.7% Trade balance (Total imports) 30,999 53,982 8.2% Trade balance ratio (%) 8.8% 7.1% -1.8 point
(At market prices in calendar year of 2000)
189

Copyright White Paper Chapter 7: A Foreign Trade Overview of the Copyright Industry
[Reference] Foreign trade definitions 1) Definitions of foreign trade
Foreign trade is defined as follows:
- The act of buying/selling goods with a trading partner in a foreign country - Exports refer to the act of selling and sending goods to a foreign country and imports refer to the act of buying and bringing in goods from a foreign country
(Source: Japan External Trade Organization (JETRO); documents from its website)
In addition to goods, foreign trade also includes trade in services, which is defined as follows:
The act of internationally trading financial, transportation, communications, construction and logistical services
(Source: The Ministry of Economy, Trade and Industry; documents from its website)
The World Trade Organization (WTO) categorizes trade in services into the following four modes: (1) A service is supplied by a service provider to a customer overseas without leaving the country (Mode 1: cross-border service supply) (2) A service is supplied by a local service provider to a service consumer from a foreign country (Mode 2: consumption abroad) (3) A service is supplied by a service provider through a commercial presence such as branches or foreign-owned companies in a foreign country (Mode 3: commercial presence abroad) (4) A service is supplied by a service provider to a customer overseas through the presence of temporary workers or specialists (Mode 4: movement of natural persons)
190
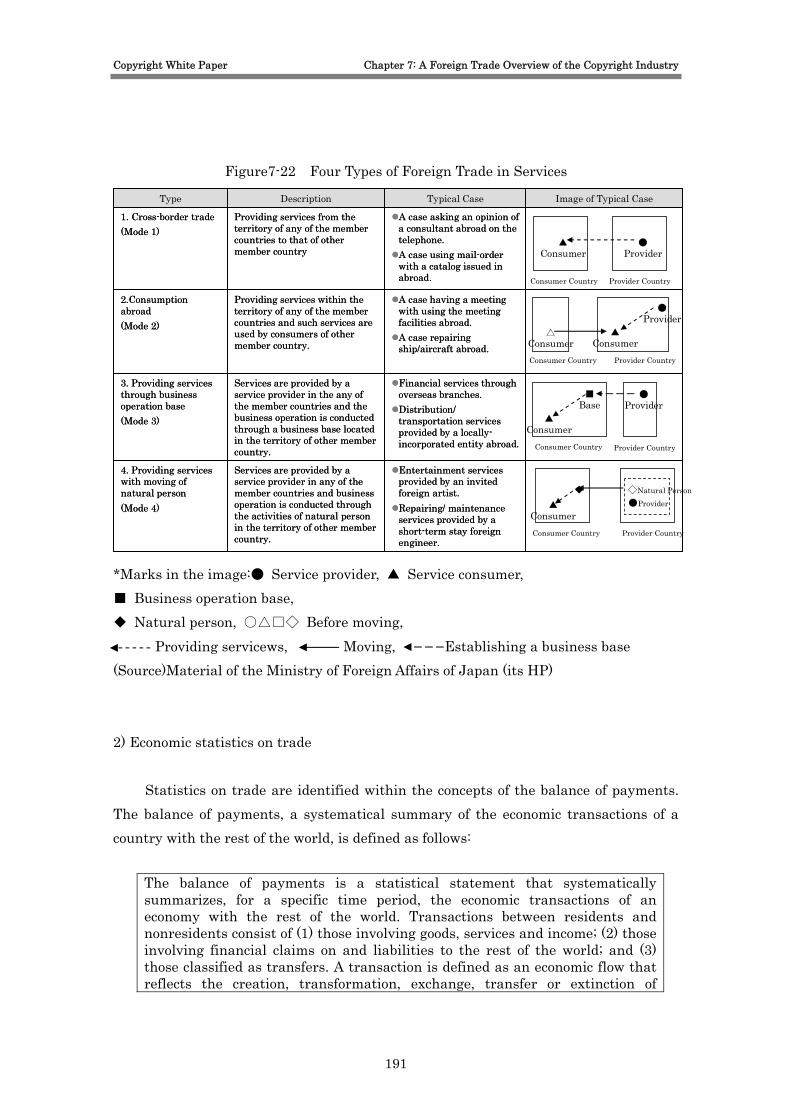
Copyright White Paper Chapter 7: A Foreign Trade Overview of the Copyright Industry
Figure7-22 Four Types of Foreign Trade in Services
Entertainment services provided by an invited foreign artist.Repairing/ maintenance services provided by a short-term stay foreign engineer.
Services are provided by a service provider in any of the member countries and business operation is conducted through the activities of natural person in the territory of other member country.
4. Providing services with moving of natural person(Mode 4)
Financial services through overseas branches.Distribution/ transportation services provided by a locally-incorporated entity abroad.
Services are provided by a service provider in the any of the member countries and the business operation is conducted through a business base located in the territory of other member country.
3. Providing services through business operation base(Mode 3)
A case having a meeting with using the meeting facilities abroad.A case repairing ship/aircraft abroad.
Providing services within the territory of any of the member countries and such services are used by consumers of other member country.
2.Consumption abroad (Mode 2)
Providing services from the territory of any of the member countries to that of other member country
Description
A case asking an opinion of a consultant abroad on the telephone.A case using mail-order with a catalog issued in abroad.
Typical Case
1. Cross-border trade (Mode 1)
Image of Typical Case Type
Consumer Country Provider Country
▲Consumer
●Provider
Provider Country
△Consumer
●Provider
▲Consumer
Provider Country
▲Consumer
●Provider
■Base
Consumer Country Provider Country
▲Consumer
●Provider◇Natural Person◆
Consumer Country
Consumer Country
*Marks in the image:● Service provider, ▲ Service consumer, ■ Business operation base, ◆ Natural person, ○△□◇ Before moving, Providing servicews, Moving, Establishing a business base (Source)Material of the Ministry of Foreign Affairs of Japan (its HP) 2) Economic statistics on trade
Statistics on trade are identified within the concepts of the balance of payments. The balance of payments, a systematical summary of the economic transactions of a country with the rest of the world, is defined as follows:
The balance of payments is a statistical statement that systematically summarizes, for a specific time period, the economic transactions of an economy with the rest of the world. Transactions between residents and nonresidents consist of (1) those involving goods, services and income; (2) those involving financial claims on and liabilities to the rest of the world; and (3) those classified as transfers. A transaction is defined as an economic flow that reflects the creation, transformation, exchange, transfer or extinction of
191
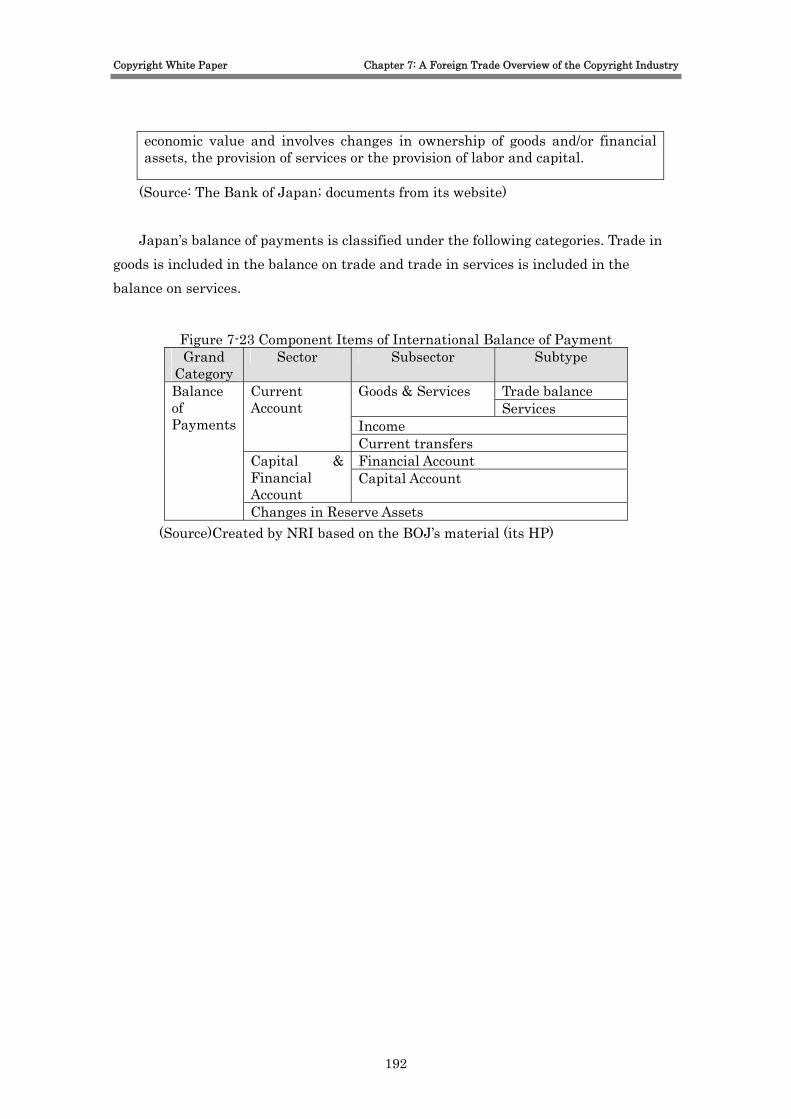
Copyright White Paper Chapter 7: A Foreign Trade Overview of the Copyright Industry
economic value and involves changes in ownership of goods and/or financial assets, the provision of services or the provision of labor and capital.
(Source: The Bank of Japan; documents from its website)
Japan’s balance of payments is classified under the following categories. Trade in goods is included in the balance on trade and trade in services is included in the balance on services.
Figure 7-23 Component Items of International Balance of Payment Grand
CategorySector Subsector Subtype
Trade balance Goods & Services Services
Income
Current Account
Current transfers
Balance of Payments
Financial Account Capital & Financial Account
Capital Account
Changes in Reserve Assets (Source)Created by NRI based on the BOJ’s material (its HP)
192

Part Ⅲ: Study Results and Estimate Methodologies Based on
WIPO Guidelines
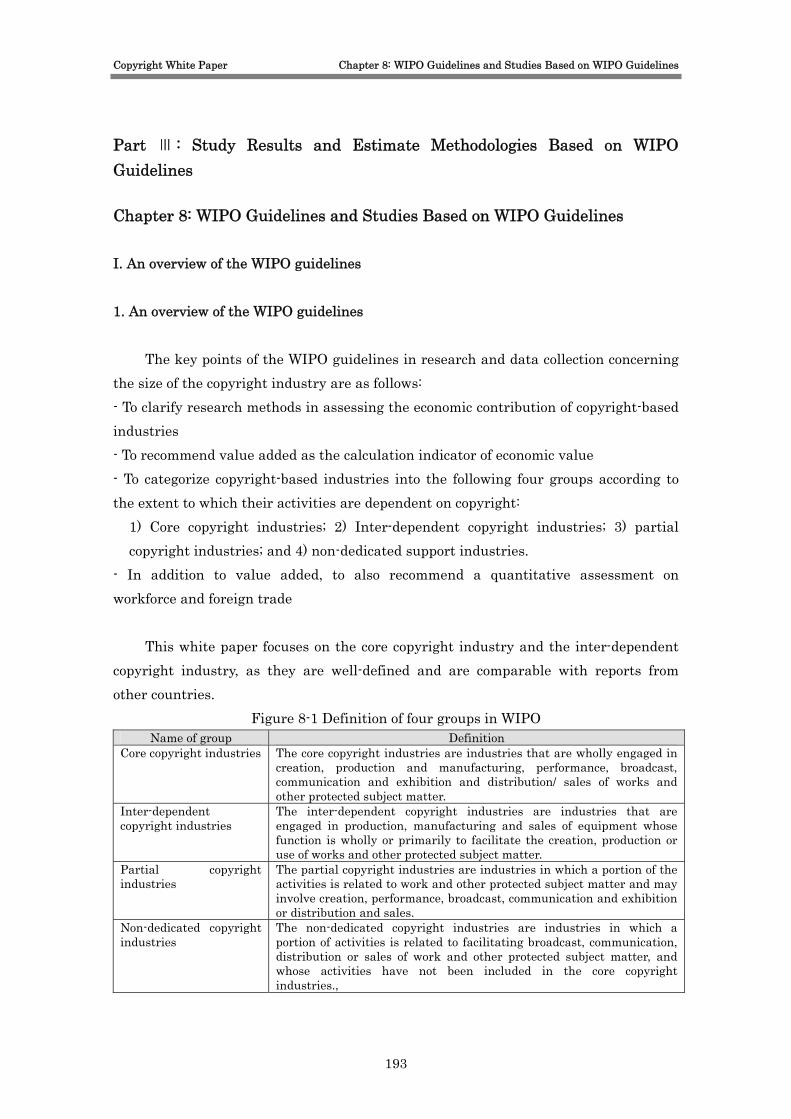
Copyright White Paper Chapter 8: WIPO Guidelines and Studies Based on WIPO Guidelines
Part Ⅲ : Study Results and Estimate Methodologies Based on WIPO Guidelines Chapter 8: WIPO Guidelines and Studies Based on WIPO Guidelines I. An overview of the WIPO guidelines 1. An overview of the WIPO guidelines
The key points of the WIPO guidelines in research and data collection concerning the size of the copyright industry are as follows: - To clarify research methods in assessing the economic contribution of copyright-based industries - To recommend value added as the calculation indicator of economic value - To categorize copyright-based industries into the following four groups according to the extent to which their activities are dependent on copyright:
1) Core copyright industries; 2) Inter-dependent copyright industries; 3) partial copyright industries; and 4) non-dedicated support industries.
- In addition to value added, to also recommend a quantitative assessment on workforce and foreign trade
This white paper focuses on the core copyright industry and the inter-dependent copyright industry, as they are well-defined and are comparable with reports from other countries.
Figure 8-1 Definition of four groups in WIPO Name of group Definition
Core copyright industries The core copyright industries are industries that are wholly engaged in creation, production and manufacturing, performance, broadcast, communication and exhibition and distribution/ sales of works and other protected subject matter.
Inter-dependent copyright industries
The inter-dependent copyright industries are industries that are engaged in production, manufacturing and sales of equipment whose function is wholly or primarily to facilitate the creation, production or use of works and other protected subject matter.
Partial copyright industries
The partial copyright industries are industries in which a portion of the activities is related to work and other protected subject matter and may involve creation, performance, broadcast, communication and exhibition or distribution and sales.
Non-dedicated copyright industries
The non-dedicated copyright industries are industries in which a portion of activities is related to facilitating broadcast, communication, distribution or sales of work and other protected subject matter, and whose activities have not been included in the core copyright industries.,
193

Copyright White Paper Chapter 8: WIPO Guidelines and Studies Based on WIPO Guidelines
(Source) “Guide on Surveying the Economic Contribution of Copyright-based Industries” * The quotation from WIPO’s guideline shall be subject to the description in Japanese translation of the “Copyright White Paper (Vol.2)” Separate Volume.
Figure 8-2 Examples of WIPO Copyright-based Industries Type of Copyright Industry Main Groups of Industries Subgroups
Press and Literature Authors, writers, translators; Newspapers; News and feature agencies; Magazines/periodicals; Book publishing; Cards and maps, directories and other published material; Pre-press, printing, and post-press of Books, magazines, newspapers, Advertising materials; Wholesale and retail of press and literature (book stores, newsstands, etc.); Libraries
Core Copyright
Music, Theatrical Productions, Operas
Composers, lyricists, arrangers, choreographers, directors, performers and other personnel; Printing and publishing of music; Production/manufacturing of recorded music; Wholesale and retail of recorded music (sale and rental); Artistic and literary creation and interpretation; Performances and allied agencies (bookings,ticket agencies, etc.)
Motion Picture and Video Writers, directors, actors etc.; Motion picture and video production and distribution; Motion picture exhibition; Video rentals and sales, video on demand; Allied services
Radio and Television National radio and television broadcasting companies; Other radio and television broadcasters; Independent producers; Cable television (systems and channels); Satellite television; Allied services
Photography Studios and commercial photography Photo agencies and libraries
Software and Databases Programming, development and design, manufacturing; Wholesale and retail prepackaged software
194

Copyright White Paper Chapter 8: WIPO Guidelines and Studies Based on WIPO Guidelines
(business programs, video games, educational programs etc.); Database processing and publishing
Visual and Graphic Arts Artists; Art galleries, other wholesale and retail; Picture framing and other allied services; Graphic design
Advertising services Agencies, buying services Copyright Collecting Societies -
Manufacture Interdependent
industries TV sets, Radios, VCRs, CD Players, DVD Players, Cassette Players,
Wholesale and retail
Electronic Game Equipment, and other similar equipment
Computers and Equipment Manufacture Wholesale and retail (sales and rental)
Musical Instruments Manufacture Wholesale and retail (sales and rental)
Photographic and Cinematographic Instruments
Manufacture Wholesale and retail (sales and rental)
Photocopiers Manufacture Wholesale and retail (sales and rental)
Blank Recording Material Manufacture Wholesale and retail
Paper Manufacture Wholesale and retail
Partial Copyright Industries
Apparel, textiles and footwearJewelry and coins Other crafts Furniture Household goods, china and glass Wallcoverings and carpets Toys and games Architecture, engineering, surveying Interior design Museums
Non-dedicated Support Industries
General wholesale and retailing General transportation Telephony and Internet
(Source) “Guide on Surveying the Economic Contribution of Copyright-based Industries”
195
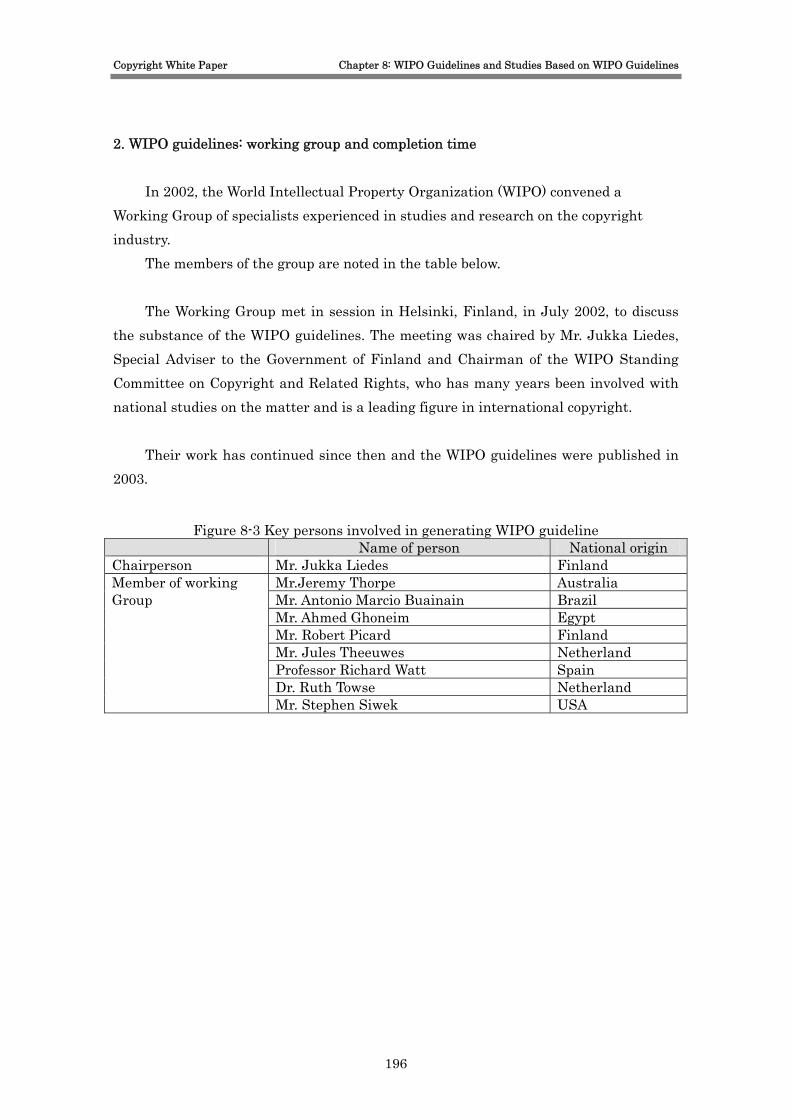
Copyright White Paper Chapter 8: WIPO Guidelines and Studies Based on WIPO Guidelines
2. WIPO guidelines: working group and completion time
In 2002, the World Intellectual Property Organization (WIPO) convened a Working Group of specialists experienced in studies and research on the copyright industry.
The members of the group are noted in the table below.
The Working Group met in session in Helsinki, Finland, in July 2002, to discuss the substance of the WIPO guidelines. The meeting was chaired by Mr. Jukka Liedes, Special Adviser to the Government of Finland and Chairman of the WIPO Standing Committee on Copyright and Related Rights, who has many years been involved with national studies on the matter and is a leading figure in international copyright.
Their work has continued since then and the WIPO guidelines were published in 2003.
Figure 8-3 Key persons involved in generating WIPO guideline Name of person National origin
Chairperson Mr. Jukka Liedes Finland Member of working Mr.Jeremy Thorpe Australia Group Mr. Antonio Marcio Buainain Brazil Mr. Ahmed Ghoneim Egypt Mr. Robert Picard Finland Mr. Jules Theeuwes Netherland Professor Richard Watt Spain Dr. Ruth Towse Netherland Mr. Stephen Siwek USA
196
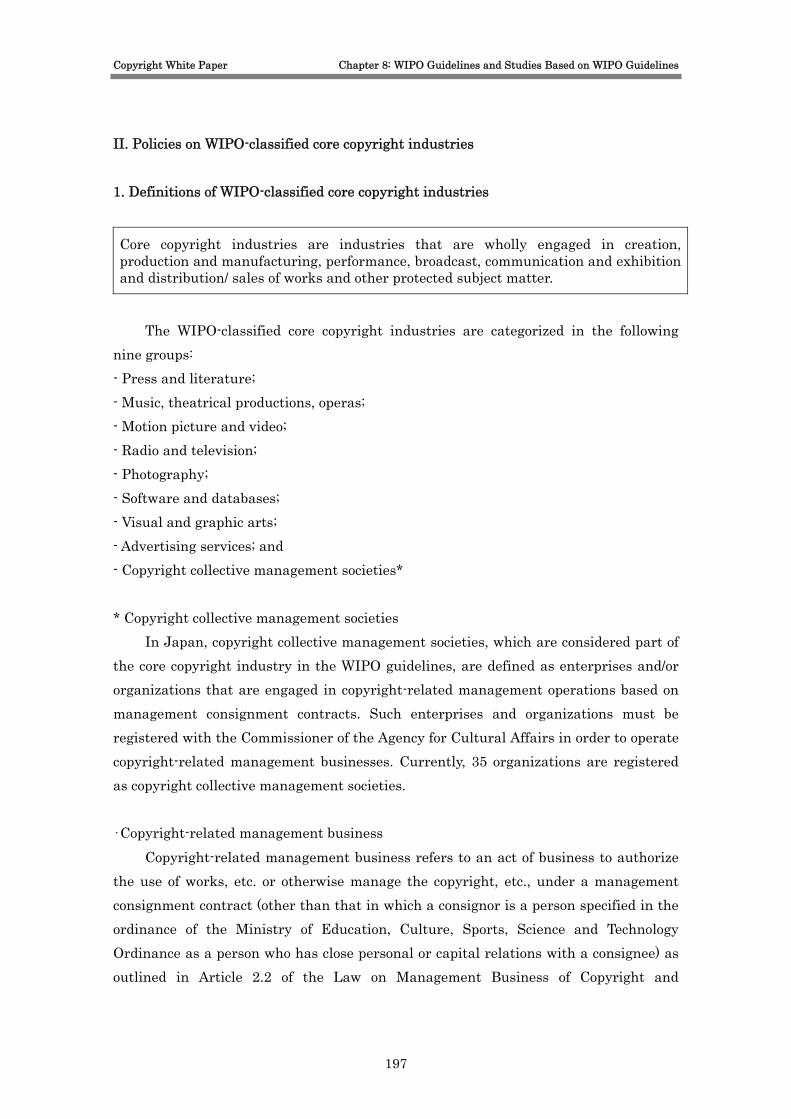
Copyright White Paper Chapter 8: WIPO Guidelines and Studies Based on WIPO Guidelines
II. Policies on WIPO-classified core copyright industries 1. Definitions of WIPO-classified core copyright industries
Core copyright industries are industries that are wholly engaged in creation, production and manufacturing, performance, broadcast, communication and exhibition and distribution/ sales of works and other protected subject matter.
The WIPO-classified core copyright industries are categorized in the following
nine groups: - Press and literature; - Music, theatrical productions, operas; - Motion picture and video; - Radio and television; - Photography; - Software and databases; - Visual and graphic arts; - Advertising services; and - Copyright collective management societies* * Copyright collective management societies
In Japan, copyright collective management societies, which are considered part of the core copyright industry in the WIPO guidelines, are defined as enterprises and/or organizations that are engaged in copyright-related management operations based on management consignment contracts. Such enterprises and organizations must be registered with the Commissioner of the Agency for Cultural Affairs in order to operate copyright-related management businesses. Currently, 35 organizations are registered as copyright collective management societies. ・Copyright-related management business
Copyright-related management business refers to an act of business to authorize the use of works, etc. or otherwise manage the copyright, etc., under a management consignment contract (other than that in which a consignor is a person specified in the ordinance of the Ministry of Education, Culture, Sports, Science and Technology Ordinance as a person who has close personal or capital relations with a consignee) as outlined in Article 2.2 of the Law on Management Business of Copyright and
197
Copyright White Paper Chapter 8: WIPO Guidelines and Studies Based on WIPO Guidelines
Neighboring Rights enacted in 2001. ・Management consignment contract
A management consignment contract is any of the following contracts other than those in which, when a consignee authorizes the use of copyrighted works, performance, sound recordings, over the air broadcasts and cable broadcasts, a consignor (or a consignor of the contract if that consignor is a consignee of any of the following contracts relating to the works) is to decide the royalty rates as outlined in Article 2.1 of the Law on Management Business of Copyright and Neighboring Rights enacted in 2001. (i) A trust contract by which a consignor transfers his or her copyright or neighboring rights to a consignee who is entrusted to authorize the use of his or her works, etc. or otherwise manage the copyright, etc., concerned; and (ii) A mandate contract by which a consignor entrusts a consignee to act as an agent or a proxy to authorize the exploitation of his or her works, etc. and manage the copyright, etc., correspondingly.
198

Copyright White Paper Chapter 8: WIPO Guidelines and Studies Based on WIPO Guidelines
2. Policies on WIPO-classified core copyright industries
Industrial sectors for the WIPO-classified core copyright industries are categorized as per the table below. Visual and graphic arts data was excluded from the estimate process, however, as it was difficult to extract data for this sector as an individual industry. Furthermore, surveys of copyright collective management societies were conducted independently, as no official statistics for this category were available.
Figure 8-4 Industrial sectors of core copyright industries under WIPO classification Industrial sectors of core copyright industries under WIPO classification Industrial sectors of core copyright industries under JCI classification
Main Groups of Industries Subgroups Main Groups of Industries Subgroups
newspapers
news and feature agencies
magazines/periodicals
book publishing
cards, maps, directories and other published materials
pre-press, printing, and post-press of books, magazines,newspapers, advertising materialswholesale and retail of press and literature (book stores,news stands)libraries 14)Libraries and Museums (1)Libraries
authors, writers, translators 15)Authors and Artists Part of (1)Authors and Artists, Musician
printing and publishing of music
production/manufacturing of recorded music
wholesale and retail of recorded music (sale and rental)
artistic and literary creation and interpretation
performances and allied agencies (booking agencies, ticketagencies)
9)Legitimate Theater(2)Theater and (3)Theatrical company, band andorchestra
composers, lyricists, arrangers, choreographers, directors,performers and other personnel
15)Authors and Artists Part of (1)Authors and Artists, Musician
writers, directors, actors etc.
motion picture and video production and distribution
video rentals and sales including video on demand
allied services
motion picture exhibition 9)Legitimate Theater (1)Movie Theater
national radio and television broadcasting companies
other radio and television broadcasters
independent producers
cable television (systems and channels)
satellite television
allied services
studios and commercial photography
photo agencies and libraries (photo-finishing labs shouldnot be included)programming, development and design
manufacturing, wholesale and retail prepackaged software(business programs, video games, educational programsetc.)
database processing and publishing
artists
art galleries and other wholesale and retail
picture framing and other allied services
graphic design
Advertising servicesagencies, buying services (the price of advertising shouldnot be included)
5)Advertising All
Copyright CollectiveManagement Societies
Copyright Collective Management Societies
4)Transmission All
11)Entertainment Facilities All
12)Design All
13)Architecture All
14)Libraries and Museums (2)Museums and Art galleries
Visual and graphic arts data was excluded from the estimate process,however, as it was difficult to extract data for this sector as an individualindustry.
Surveys of copyright collective management societies were conductedindependently.
1)Printing and Publishing
Motion picture and video7)Motion Picture All
All
6)Music All
3)Broadcasting All
2)Computer Software and10)Game Software
All
8) Photography AllPhotography
Software and databases
Visual and graphic arts
Press and literature
Music, theatricalproductions, operas
Radio and television
199

Copyright White Paper Chapter 8: WIPO Guidelines and Studies Based on WIPO Guidelines
3. Outline of the survey on copyright collective management societies With cooperation of concerned groups and companies, we have conducted the following survey on copyright collective management societies for the purpose of collecting data required for estimation of industrial scale. • Survey period: April 7 to April 15, 2009 • Number of targeted groups: 35 (all business entities and groups which have been
registered in the Patent Office as copyright collective management societies as of the day of April 7, 2009.)
• Number of effective replies: 13 cases • Matters of survey: (1) Total copyright management & administrative expenses (2) Number of staff
200
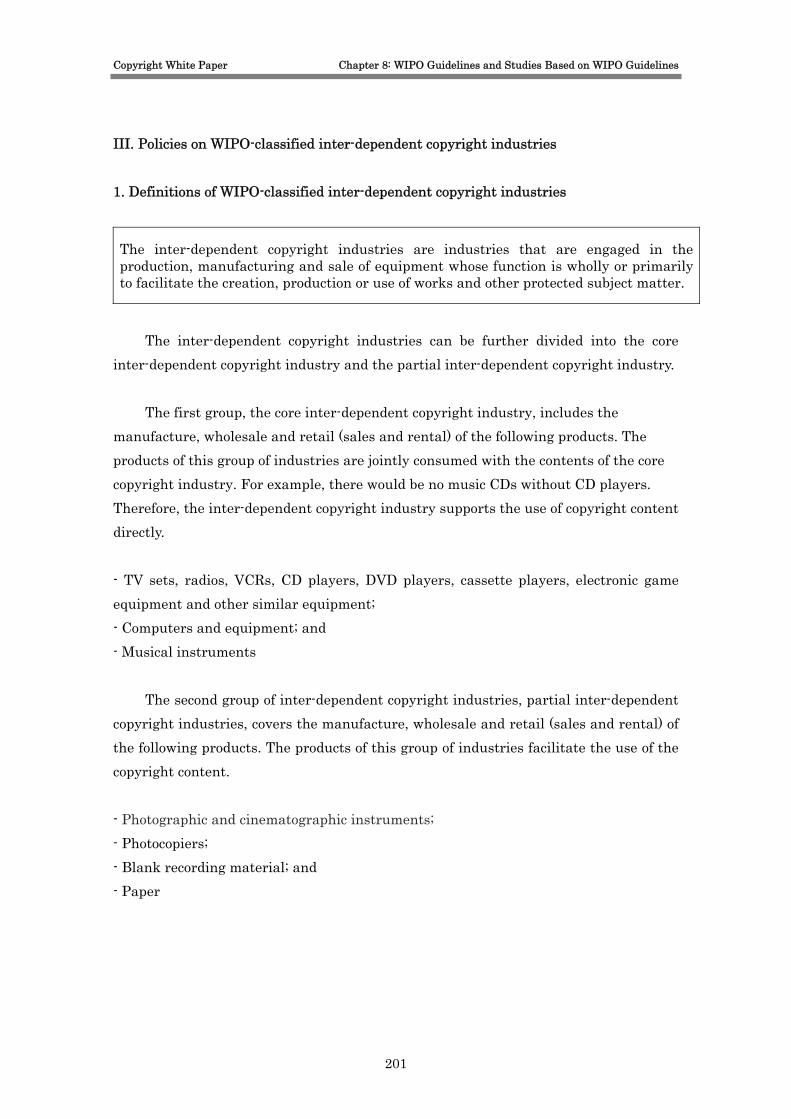
Copyright White Paper Chapter 8: WIPO Guidelines and Studies Based on WIPO Guidelines
III. Policies on WIPO-classified inter-dependent copyright industries 1. Definitions of WIPO-classified inter-dependent copyright industries
The inter-dependent copyright industries are industries that are engaged in the production, manufacturing and sale of equipment whose function is wholly or primarily to facilitate the creation, production or use of works and other protected subject matter.
The inter-dependent copyright industries can be further divided into the core
inter-dependent copyright industry and the partial inter-dependent copyright industry.
The first group, the core inter-dependent copyright industry, includes the manufacture, wholesale and retail (sales and rental) of the following products. The products of this group of industries are jointly consumed with the contents of the core copyright industry. For example, there would be no music CDs without CD players. Therefore, the inter-dependent copyright industry supports the use of copyright content directly. - TV sets, radios, VCRs, CD players, DVD players, cassette players, electronic game equipment and other similar equipment; - Computers and equipment; and - Musical instruments
The second group of inter-dependent copyright industries, partial inter-dependent copyright industries, covers the manufacture, wholesale and retail (sales and rental) of the following products. The products of this group of industries facilitate the use of the copyright content. - Photographic and cinematographic instruments; - Photocopiers; - Blank recording material; and - Paper
201

Copyright White Paper Chapter 8: WIPO Guidelines and Studies Based on WIPO Guidelines
2. Policies on WIPO-classified inter-dependent copyright industries
The business sectors for the WIPO-classified inter-dependent copyright industries correspond to the JCI classifications as shown in the table below. It should be noted that some of the WIPO-classified categories combine multiple JCI-classified categories (e.g., TV sets, radios, VCRs, CD players, DVD players, cassette players, electronic game equipment and other similar equipment).
Also note that some of the categories in the JCI classifications do not have corresponding categories in the WIPO classifications (e.g., advertisement-related equipment in the media manufacturing sector).
Figure 8-5 Business sectors of the inter-dependent copyright industries under WIPO classification
Commoditycode
Commodity classification name
152111 Rolls of newsprint paper152112 Non-painted printing paper152113 Painted printing paper152114 Special printing paper152115 Information paper152116 Writing paper and drawing paper152117 Unbleached wrapping paper152118 Bleached wrapping paper152191 Paper and machine-made Japanese paper (
piecework )175511 Ordinary ink photocopiers175512 Newspaper ink175513 Vanish for printing ink175591 Printing ink ( piecework )279311 Magnetic tapes (raw) computers and equipment279312 Magnetic discs (raw)279391 Raw magnetic tapes and discs ( piecework )282111 General computers282112 Office computers282113 Work stations282114 Parts, attachments and accessories of data
processing machines, digital and analogcomputers and auxiliary equipment
282191 Data processing machines, digital and analogcomputers, equipment and accessories (piecework )
282211 Personal computers282212 Parts, attachments and accessories of
personal computers282291 Personal computers, parts, attachments and
accessories ( piecework )282311 Magnetic disc equipment blank recording material282312 Optical disc equipment282313 Flexible disc equipment282319 Miscellaneous external memories282321 Parts, attachments and accessories of
external memories282391 External memories parts, attachments and
accessories ( piecework )281211 Radio and TV broadcasting equipment281291 Radio communication equipment ( piecework281311 Radio receivers281312 Television receivers, except liquid crystal
receivers281313 Liquid crystal television receivers281391 Radio and television receivers ( piecework )244116 Telecommunication cable244191 Electric wire and cable ( piecework )244212 Optical fiber cable, including composite cable244291 Optical fiber cable ( piecework )281131 Digital transmission equipment281191 Wired communication equipment ( piecework281213 Cellular telephone sets and PHS telephone
sets281291 Radio communication equipment ( piecework
TV sets, Radios, VCRs, CD Players,DVD Players, Cassette Players,Electronic Game equipment, and othersimilar equipment
2.Computer Software-related Equipment &Media Manufacturing Industries
3.Broadcasting-related Equipment & MediaManufacturing Industries
4.Transmission-related Equipment & MediaManufacturing Industries
JCI classification WIPO classificationCommodity classification name for “Census of Manufacturers
1.Printing/ Publishing-related Equipment &Media Manufacturing Industries
202
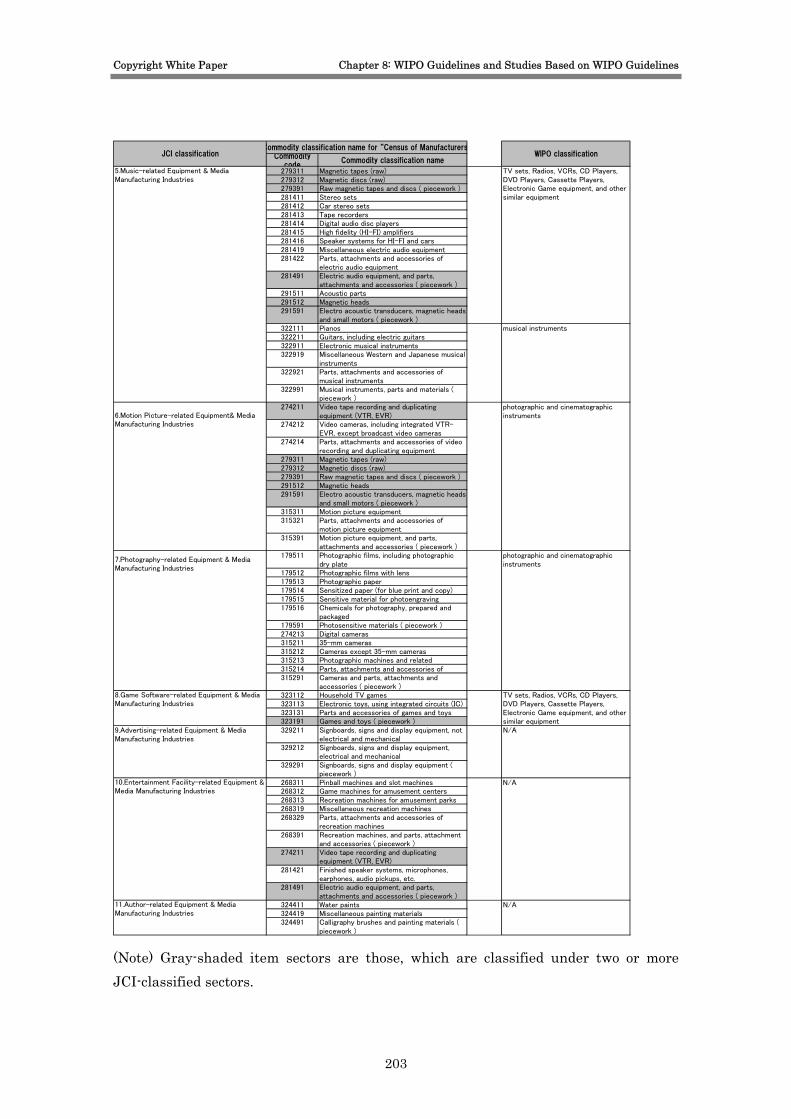
Copyright White Paper Chapter 8: WIPO Guidelines and Studies Based on WIPO Guidelines
Commoditycode
Commodity classification name
279311 Magnetic tapes (raw)279312 Magnetic discs (raw)279391 Raw magnetic tapes and discs ( piecework )281411 Stereo sets281412 Car stereo sets281413 Tape recorders281414 Digital audio disc players281415 High fidelity (HI-FI) amplifiers281416 Speaker systems for HI-FI and cars281419 Miscellaneous electric audio equipment281422 Parts, attachments and accessories of
electric audio equipment281491 Electric audio equipment, and parts,
attachments and accessories ( piecework )291511 Acoustic parts291512 Magnetic heads291591 Electro acoustic transducers, magnetic heads
and small motors ( piecework )322111 Pianos musical instruments322211 Guitars, including electric guitars322911 Electronic musical instruments322919 Miscellaneous Western and Japanese musical
instruments322921 Parts, attachments and accessories of
musical instruments322991 Musical instruments, parts and materials (
piecework )274211 Video tape recording and duplicating
equipment (VTR, EVR)photographic and cinematographicinstruments
274212 Video cameras, including integrated VTR-EVR, except broadcast video cameras
274214 Parts, attachments and accessories of videorecording and duplicating equipment
279311 Magnetic tapes (raw)279312 Magnetic discs (raw)279391 Raw magnetic tapes and discs ( piecework )291512 Magnetic heads291591 Electro acoustic transducers, magnetic heads
and small motors ( piecework )315311 Motion picture equipment315321 Parts, attachments and accessories of
motion picture equipment315391 Motion picture equipment, and parts,
attachments and accessories ( piecework )179511 Photographic films, including photographic
dry platephotographic and cinematographicinstruments
179512 Photographic films with lens179513 Photographic paper179514 Sensitized paper (for blue print and copy)179515 Sensitive material for photoengraving179516 Chemicals for photography, prepared and
packaged179591 Photosensitive materials ( piecework )274213 Digital cameras315211 35-mm cameras315212 Cameras except 35-mm cameras315213 Photographic machines and related315214 Parts, attachments and accessories of315291 Cameras and parts, attachments and
accessories ( piecework )323112 Household TV games323113 Electronic toys, using integrated circuits (IC)323131 Parts and accessories of games and toys323191 Games and toys ( piecework )329211 Signboards, signs and display equipment, not
electrical and mechanicalN/A
329212 Signboards, signs and display equipment,electrical and mechanical
329291 Signboards, signs and display equipment (piecework )
268311 Pinball machines and slot machines N/A268312 Game machines for amusement centers268313 Recreation machines for amusement parks268319 Miscellaneous recreation machines268329 Parts, attachments and accessories of
recreation machines268391 Recreation machines, and parts, attachment
and accessories ( piecework )274211 Video tape recording and duplicating
equipment (VTR, EVR)281421 Finished speaker systems, microphones,
earphones, audio pickups, etc.281491 Electric audio equipment, and parts,
attachments and accessories ( piecework )324411 Water paints N/A324419 Miscellaneous painting materials324491 Calligraphy brushes and painting materials (
10.Entertainment Facility-related Equipment &Media Manufacturing Industries
11.Author-related Equipment & MediaManufacturing Industries
TV sets, Radios, VCRs, CD Players,DVD Players, Cassette Players,Electronic Game equipment, and othersimilar equipment
TV sets, Radios, VCRs, CD Players,DVD Players, Cassette Players,Electronic Game equipment, and othersimilar equipment
JCI classification
piecework )
Commodity classification name for “Census of ManufacturersWIPO classification
6.Motion Picture-related Equipment& MediaManufacturing Industries
7.Photography-related Equipment & MediaManufacturing Industries
8.Game Software-related Equipment & MediaManufacturing Industries
9.Advertising-related Equipment & MediaManufacturing Industries
5.Music-related Equipment & MediaManufacturing Industries
(Note) Gray-shaded item sectors are those, which are classified under two or more JCI-classified sectors.
203
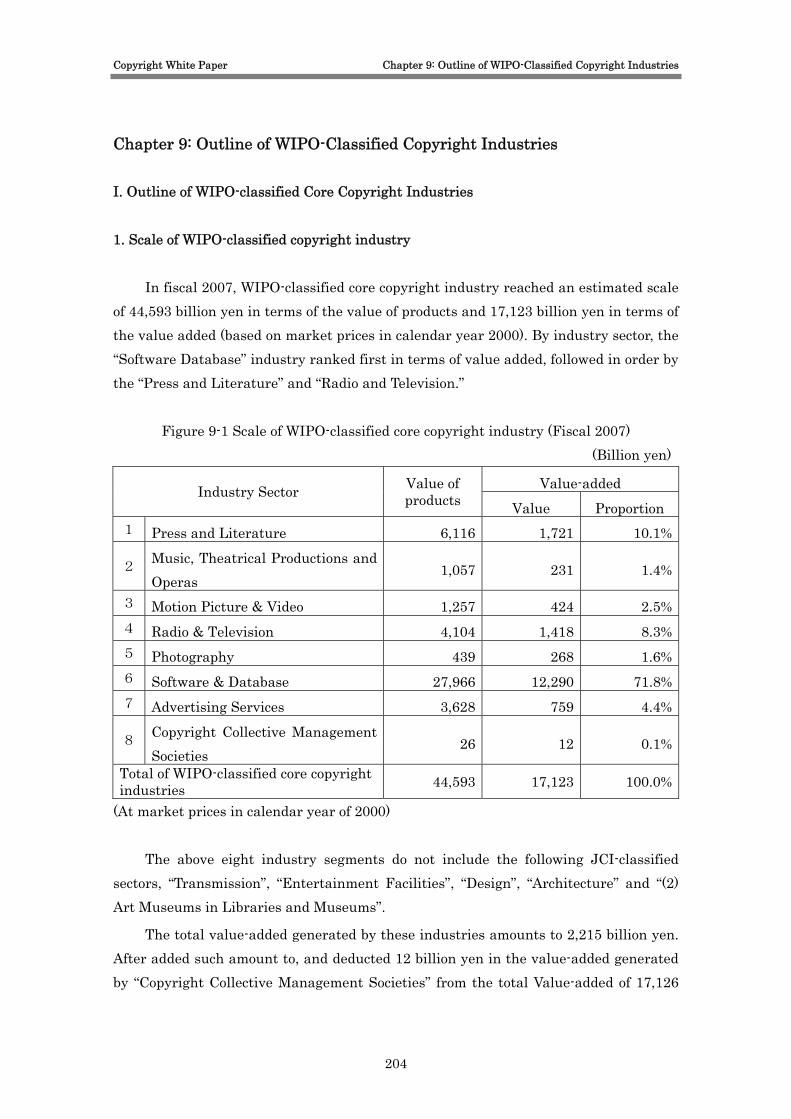
Copyright White Paper Chapter 9: Outline of WIPO-Classified Copyright Industries
Chapter 9: Outline of WIPO-Classified Copyright Industries I. Outline of WIPO-classified Core Copyright Industries 1. Scale of WIPO-classified copyright industry
In fiscal 2007, WIPO-classified core copyright industry reached an estimated scale of 44,593 billion yen in terms of the value of products and 17,123 billion yen in terms of the value added (based on market prices in calendar year 2000). By industry sector, the “Software Database” industry ranked first in terms of value added, followed in order by the “Press and Literature” and “Radio and Television.”
Figure 9-1 Scale of WIPO-classified core copyright industry (Fiscal 2007) (Billion yen)
Value-added Industry Sector Value of products Value Proportion
1 Press and Literature 6,116 1,721 10.1%
2 Music, Theatrical Productions and Operas
1,057 231 1.4%
3 Motion Picture & Video 1,257 424 2.5%4 Radio & Television 4,104 1,418 8.3%5 Photography 439 268 1.6%6 Software & Database 27,966 12,290 71.8%7 Advertising Services 3,628 759 4.4%
8 Copyright Collective Management Societies
26 12 0.1%
Total of WIPO-classified core copyright industries 44,593 17,123 100.0%
(At market prices in calendar year of 2000)
The above eight industry segments do not include the following JCI-classified sectors, “Transmission”, “Entertainment Facilities”, “Design”, “Architecture” and “(2) Art Museums in Libraries and Museums”.
The total value-added generated by these industries amounts to 2,215 billion yen. After added such amount to, and deducted 12 billion yen in the value-added generated by “Copyright Collective Management Societies” from the total Value-added of 17,126
204
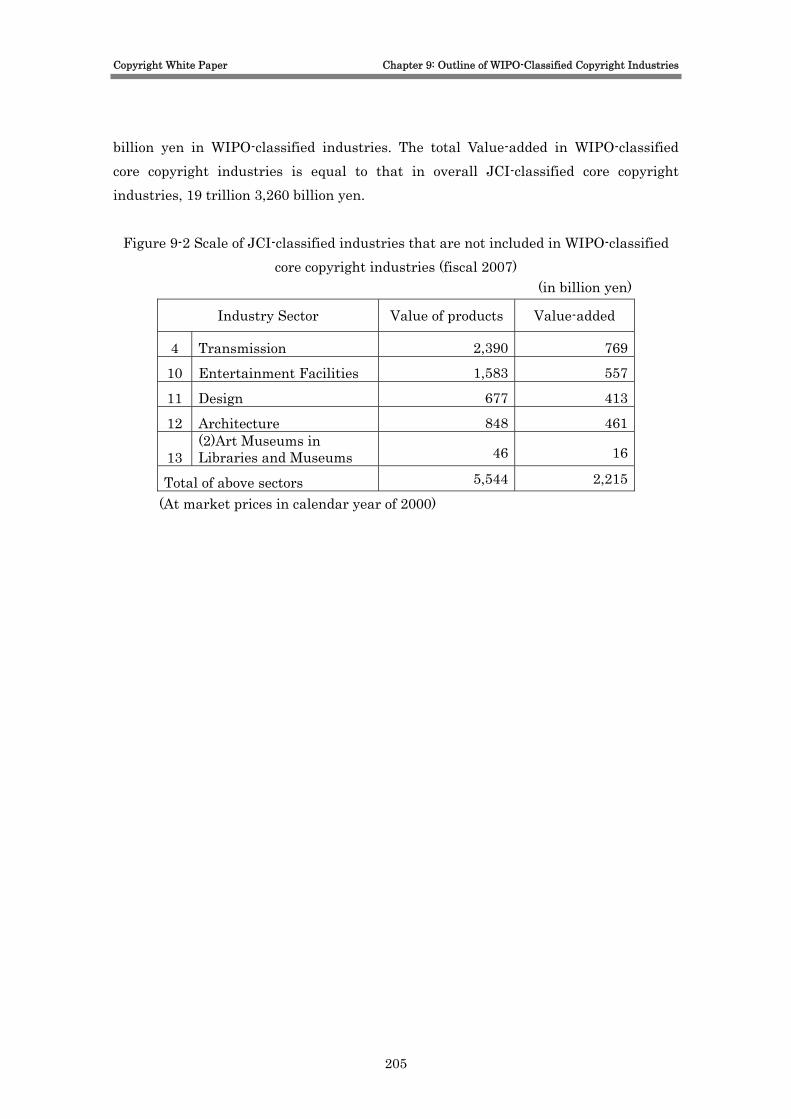
Copyright White Paper Chapter 9: Outline of WIPO-Classified Copyright Industries
billion yen in WIPO-classified industries. The total Value-added in WIPO-classified core copyright industries is equal to that in overall JCI-classified core copyright industries, 19 trillion 3,260 billion yen.
Figure 9-2 Scale of JCI-classified industries that are not included in WIPO-classified
core copyright industries (fiscal 2007) (in billion yen)
Industry Sector Value of products Value-added
4 Transmission 2,390 769
10 Entertainment Facilities 1,583 557
11 Design 677 413
12 Architecture 848 461
13 (2)Art Museums in Libraries and Museums 46 16
Total of above sectors 5,544 2,215 (At market prices in calendar year of 2000)
205
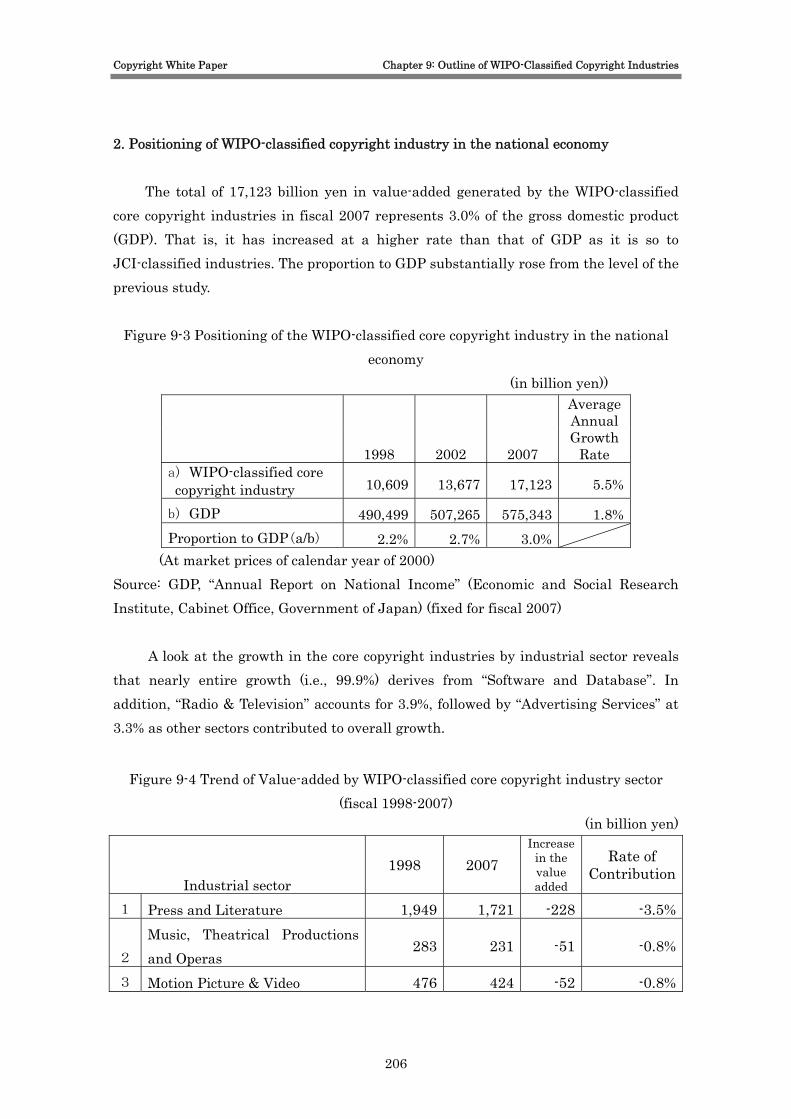
Copyright White Paper Chapter 9: Outline of WIPO-Classified Copyright Industries
2. Positioning of WIPO-classified copyright industry in the national economy
The total of 17,123 billion yen in value-added generated by the WIPO-classified core copyright industries in fiscal 2007 represents 3.0% of the gross domestic product (GDP). That is, it has increased at a higher rate than that of GDP as it is so to JCI-classified industries. The proportion to GDP substantially rose from the level of the previous study.
Figure 9-3 Positioning of the WIPO-classified core copyright industry in the national economy
(in billion yen))
Average Annual
1998 2002 2007 Growth
Rate a) WIPO-classified core copyright industry 10,609 13,677 17,123 5.5%
b) GDP 490,499 507,265 575,343 1.8% Proportion to GDP(a/b) 2.2% 2.7% 3.0%
(At market prices of calendar year of 2000) Source: GDP, “Annual Report on National Income” (Economic and Social Research Institute, Cabinet Office, Government of Japan) (fixed for fiscal 2007)
A look at the growth in the core copyright industries by industrial sector reveals that nearly entire growth (i.e., 99.9%) derives from “Software and Database”. In addition, “Radio & Television” accounts for 3.9%, followed by “Advertising Services” at 3.3% as other sectors contributed to overall growth.
Figure 9-4 Trend of Value-added by WIPO-classified core copyright industry sector (fiscal 1998-2007)
(in billion yen)
Industrial sector 1998 2007
Increase in the value added
Rate of Contribution
1 Press and Literature 1,949 1,721 -228 -3.5%
2 Music, Theatrical Productions and Operas
283 231 -51 -0.8%
3 Motion Picture & Video 476 424 -52 -0.8%
206

Copyright White Paper Chapter 9: Outline of WIPO-Classified Copyright Industries
4 Radio & Television 1,160 1,418 257 3.9%5 Photography 347 268 -80 -1.2%6 Software & Database 5,839 12,290 6,450 99.0%7 Advertising Services 545 759 215 3.3%
8 Copyright Collective Management Societies
10 12 3 0.0%
Total of WIPO-classified core copyright industries 10,611 17,126 6,514 100.0%
(At market prices in calendar year of 2000) Note: Rate of contribution = increase in the value-added in one segment/ increase in the value-added in the overall industry Source: GDP, “Annual Report on National Income” (Economic and Social Research Institute, Cabinet Office, Government of Japan) (fixed for fiscal 2007)
207

Copyright White Paper Chapter 9: Outline of WIPO-Classified Copyright Industries
3. Methodologies to estimate the industrial scale of copyright collective management societies
For estimating the scale of WIPO-classified core copyright industries, the data are collected following the classification noted in Figure 8-4. Regarding copyright collective management societies, however, its industrial scale is calculated by means of the estimation methodologies noted below based on the results of the independent survey (refer to the above section on the “outline on the survey on copyright collective management societies”) ○ Estimation of Value of products [Formula]Value of products = Sum of copyright management & administrative expenses A÷ Rate of SG&A to sales B
A Sum of copyright management & administrative expenses: [Formula]Sum of copyright management & administrative expenses =
Σ{Sum of copyright management & administrative expenses of each entity a}
a Sum of copyright management & administrative expenses of each entity: [Sum of copyright management & administrative expenses]in the “Survey on Copyright Collective Management Societies”
* Of 35 entities, 13 entities replied the questionnaires. As business size of each replied entity is different, however, we have employed an extended measurement by setting a standard value in accordance with the business size of entity.
B Rate of SG&A to sales: [Formula]Rate of SG&A to sales =Σ{SG&A of each entity a}
÷Σ{Sales of each entity b} a SG&A of each entity: 「SG&A]in the “Business Report”
b Sales of each entity: [Sales] in the “Business Report”
* The above “rate of SG&A to sales” was calculated with the business reports released by entities making continuous disclosure of income statements.
○ Estimation of Value-added
208
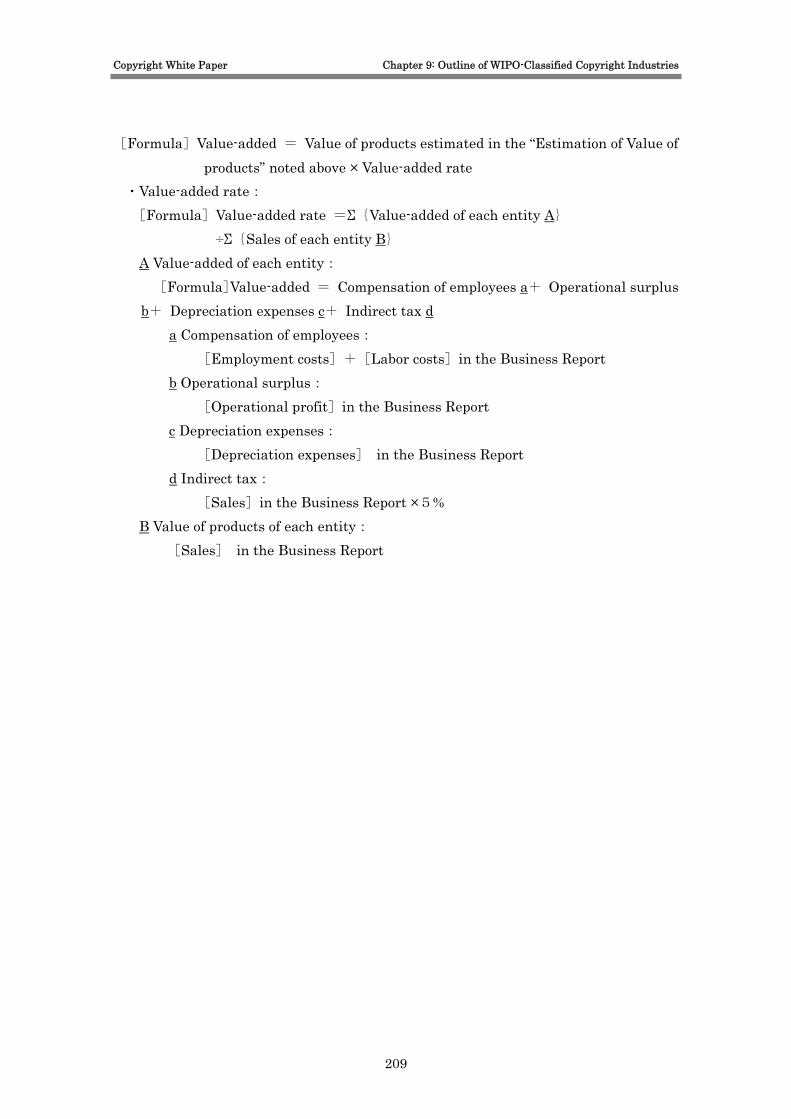
Copyright White Paper Chapter 9: Outline of WIPO-Classified Copyright Industries
[Formula]Value-added = Value of products estimated in the “Estimation of Value of products” noted above × Value-added rate
・Value-added rate: [Formula]Value-added rate =Σ{Value-added of each entity A}
÷Σ{Sales of each entity B} A Value-added of each entity: [Formula]Value-added = Compensation of employees a+ Operational surplus
b+ Depreciation expenses c+ Indirect tax d a Compensation of employees:
[Employment costs]+[Labor costs]in the Business Report b Operational surplus:
[Operational profit]in the Business Report c Depreciation expenses:
[Depreciation expenses] in the Business Report d Indirect tax:
[Sales]in the Business Report ×5% B Value of products of each entity:
[Sales] in the Business Report
209
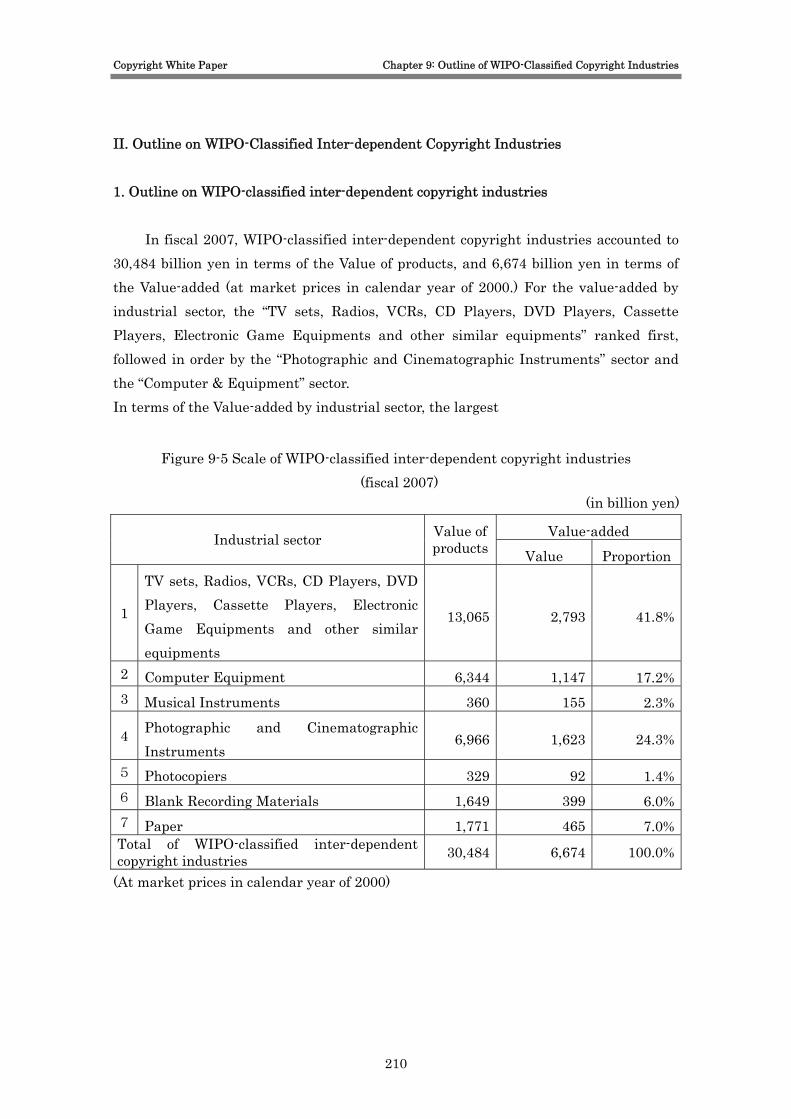
Copyright White Paper Chapter 9: Outline of WIPO-Classified Copyright Industries
II. Outline on WIPO-Classified Inter-dependent Copyright Industries 1. Outline on WIPO-classified inter-dependent copyright industries
In fiscal 2007, WIPO-classified inter-dependent copyright industries accounted to 30,484 billion yen in terms of the Value of products, and 6,674 billion yen in terms of the Value-added (at market prices in calendar year of 2000.) For the value-added by industrial sector, the “TV sets, Radios, VCRs, CD Players, DVD Players, Cassette Players, Electronic Game Equipments and other similar equipments” ranked first, followed in order by the “Photographic and Cinematographic Instruments” sector and the “Computer & Equipment” sector. In terms of the Value-added by industrial sector, the largest
Figure 9-5 Scale of WIPO-classified inter-dependent copyright industries (fiscal 2007)
(in billion yen)
Value-added Industrial sector Value of products Value Proportion
1
TV sets, Radios, VCRs, CD Players, DVD Players, Cassette Players, Electronic Game Equipments and other similar equipments
13,065 2,793 41.8%
2 Computer Equipment 6,344 1,147 17.2%3 Musical Instruments 360 155 2.3%
4 Photographic and Cinematographic Instruments
6,966 1,623 24.3%
5 Photocopiers 329 92 1.4%6 Blank Recording Materials 1,649 399 6.0%7 Paper 1,771 465 7.0%Total of WIPO-classified inter-dependent copyright industries 30,484 6,674 100.0%
(At market prices in calendar year of 2000)
210
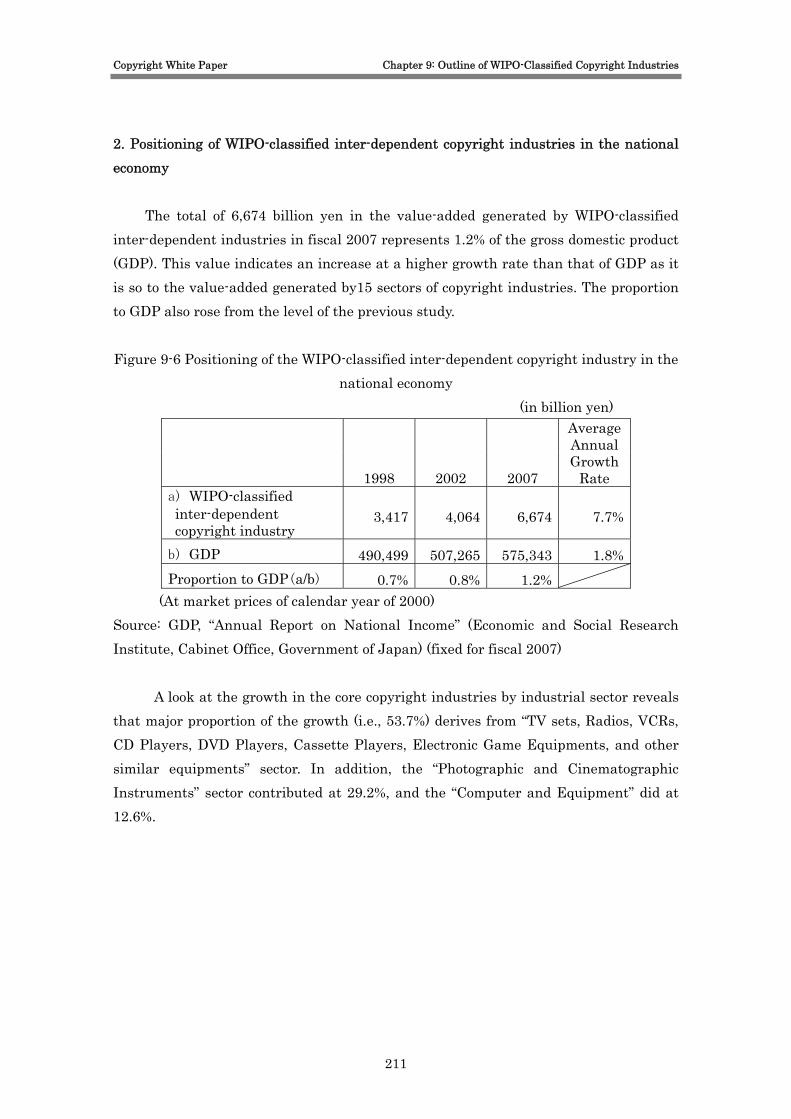
Copyright White Paper Chapter 9: Outline of WIPO-Classified Copyright Industries
2. Positioning of WIPO-classified inter-dependent copyright industries in the national economy
The total of 6,674 billion yen in the value-added generated by WIPO-classified inter-dependent industries in fiscal 2007 represents 1.2% of the gross domestic product (GDP). This value indicates an increase at a higher growth rate than that of GDP as it is so to the value-added generated by15 sectors of copyright industries. The proportion to GDP also rose from the level of the previous study. Figure 9-6 Positioning of the WIPO-classified inter-dependent copyright industry in the
national economy (in billion yen)
Average Annual
1998 2002 2007 Growth
Rate a) WIPO-classified inter-dependent copyright industry
3,417 4,064 6,674 7.7%
b) GDP 490,499 507,265 575,343 1.8% Proportion to GDP(a/b) 0.7% 0.8% 1.2%
(At market prices of calendar year of 2000) Source: GDP, “Annual Report on National Income” (Economic and Social Research Institute, Cabinet Office, Government of Japan) (fixed for fiscal 2007) A look at the growth in the core copyright industries by industrial sector reveals that major proportion of the growth (i.e., 53.7%) derives from “TV sets, Radios, VCRs, CD Players, DVD Players, Cassette Players, Electronic Game Equipments, and other similar equipments” sector. In addition, the “Photographic and Cinematographic Instruments” sector contributed at 29.2%, and the “Computer and Equipment” did at 12.6%.
211

Copyright White Paper Chapter 9: Outline of WIPO-Classified Copyright Industries
Figure 9-7 Trend of the value-added by WIPO-classified inter-dependent copyright industry sector (fiscal 1998-2007)
(in billion yen)
Industrial sector 1998 2007
Increase in the value
Rate of contribut
ion(*)
1
TV sets, Radios, VCRs, CD Players, DVD Players, Cassette Players, Electronic Game Equipments and other similar equipments
1,045 2,793 1,747 53.7%
2 Computer & Equipment 737 1,147 410 12.6%3 Musical Instruments 118 155 36 1.1%
4 Photographic and Cinematographic Instruments
671 1,623 952 29.2%
5 Photocopiers 77 92 15 0.5%6 Blank Recording Materials 228 399 172 5.3%7 Paper 540 465 -75 -2.3%Total of WIPO-classified inter-dependent copyright industries 3,417 6,674 3,257 100.0%
(At market prices in calendar year of 2000) Note: Rate of contribution = increase in the value-added in one segment/ increase in the value-added in the overall industry Source: GDP, “Annual Report on National Income” (Economic and Social Research Institute, Cabinet Office, Government of Japan) (fixed for fiscal 2007)
212

Copyright White Paper Chapter 10: Overview on Workforce in WIPO-Classified Copyright Industries
Chapter 10: Overview on Workforce in WIPO-Classified Copyright Industries I. Overview on Workforce in WIPO-Classified Core Copyright Industries 1. Workforce scale of WIPO-classified core copyright industries
The workforce* in WIPO-classified core copyright industries reached 1,435,000 workers in 2007. Thee “Software & Database” sector ranked first, followed in order by “Press and Literature” and “Motion Picture and Video.”
Figure 10-1 Workforce by WIPO-classified core copyright industry (fiscal 2007) (in thousand persons)
Workforce Industrial sector No. of
workforce Proportion 1 Press and Literature 172 12.0%
2 Music, Theatrical Productions and Operas
40 2.8%
3 Motion Picture & Video 61 4.2% 4 Radio & Television 45 3.2% 5 Photography 47 3.2% 6 Software & Database 1,015 70.7% 7 Advertising Services 54 3.8%
8 Copyright Collective Management Societies
1 0.1%
Total of WIPO-classified core copyright industries 1,435 100.0%
The above eight industrial sectors do not include the following JCI-classified
sectors, “Transmission”, “Entertainment Facilities”, “Design”, “Architecture” and “(2) Art Museum of Libraries & Museums”.
Number of workforce in these industries accounts to 474,000 workers. After added these workers to 1,435,000, and deducted the workforce of 1,000 working in copyright collective management societies from the total workforce in WIPO-classified core copyright industries, the total workforce is 1,909,000 equal to that of JCI-classified industries.
213
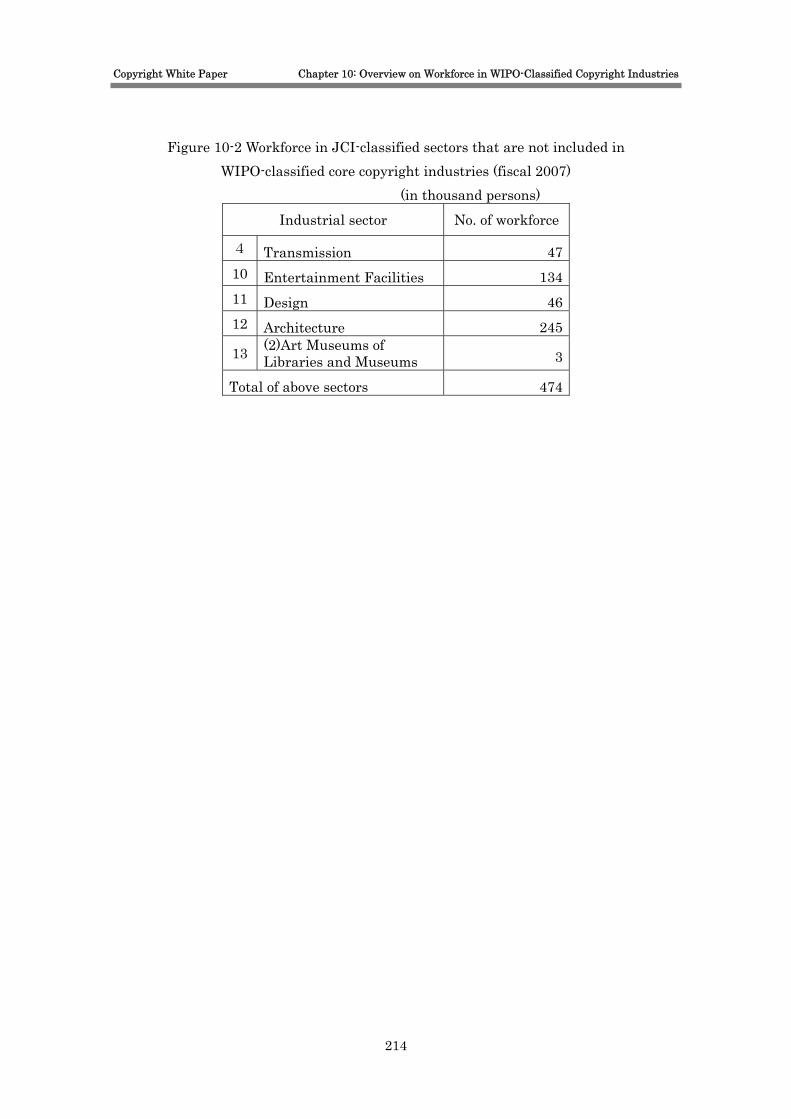
Copyright White Paper Chapter 10: Overview on Workforce in WIPO-Classified Copyright Industries
Figure 10-2 Workforce in JCI-classified sectors that are not included in WIPO-classified core copyright industries (fiscal 2007)
(in thousand persons) Industrial sector No. of workforce
4 Transmission 47 10 Entertainment Facilities 134 11 Design 46 12 Architecture 245
13 (2)Art Museums of Libraries and Museums 3
Total of above sectors 474
214

Copyright White Paper Chapter 10: Overview on Workforce in WIPO-Classified Copyright Industries
2. Positioning of Fiscal 2007 Workforce in WIPO-classified Core Copyright Industries in the National Workforce
In fiscal 2007, the workforce in WIPO-classified core copyright industries accounts to 1,388,000 workers, representing 2.2% of the national workforce. This number of workforce indicates an increase at a higher growth rate than that of the national workforce as it is so to the growth in JCI-classified copyright industries. The proportion to the national workforce also rose from the level of the previous study.
Figure 10-3 Positioning of WIPO-classified core copyright industries (workforce) in the national workforce
(in thousand persons)
Average Annual
1998 2002 2007 Growth
Rate a)WIPO-classified core copyright industries 1,168 1,154 1,435 2.3%
b)National workforce 66,276, 63,592, 64,451, -0.3% Proportion to national workforce(a/b) 1.8% 1.8% 2.2%
(Source)National workforce: number of employees in the “Annual Report on National Income Statistics” (fixed for fiscal 2007)
A look at the growth in the copyright industries by industrial sector reveals that
nearly entire growth (124.3%) derives from “Software & Database” sector.
Figure 10-4 Trend of workforce by WIPO-classified core copyright industry sector (fiscal 1998-2007)
(in thousand persons)
Industrial sector 1998 2007
Increase in
number
Rate of contributi
on(*)
1 Press and Literature 205 172 -33 -12.5%
2 Music, Theatrical Productions and Operas
38 40 2 0.8%
3 Motion Picture & Video 71 61 -11 -3.9%4 Radio & Television 51 45 -5 -2.0%
215

Copyright White Paper Chapter 10: Overview on Workforce in WIPO-Classified Copyright Industries
5 Photography 71 47 -24 -8.9%6 Software & Database 683 1,015 332 124.3%7 Advertising Services 48 54 6 2.3%
8 Copyright Collective Management Societies
1 1 0 0.0%
Total of WIPO-classified core copyright industries 1,168 1,435 267 100.0%
Note: Rate of contribution = increase in the value-added in one segment/ increase in the value-added in the overall industry
216
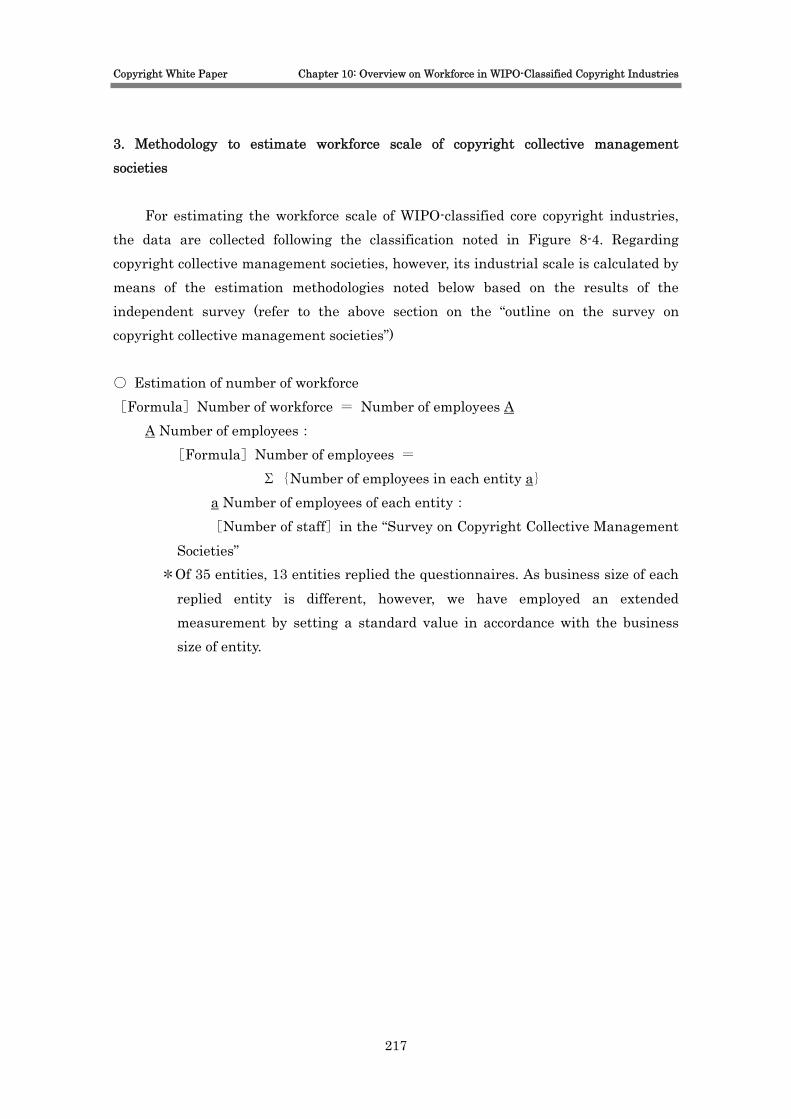
Copyright White Paper Chapter 10: Overview on Workforce in WIPO-Classified Copyright Industries
3. Methodology to estimate workforce scale of copyright collective management societies
For estimating the workforce scale of WIPO-classified core copyright industries, the data are collected following the classification noted in Figure 8-4. Regarding copyright collective management societies, however, its industrial scale is calculated by means of the estimation methodologies noted below based on the results of the independent survey (refer to the above section on the “outline on the survey on copyright collective management societies”) ○ Estimation of number of workforce [Formula]Number of workforce = Number of employees A
A Number of employees: [Formula]Number of employees =
Σ{Number of employees in each entity a} a Number of employees of each entity: [Number of staff]in the “Survey on Copyright Collective Management
Societies” *Of 35 entities, 13 entities replied the questionnaires. As business size of each
replied entity is different, however, we have employed an extended measurement by setting a standard value in accordance with the business size of entity.
217

Copyright White Paper Chapter 10: Overview on Workforce in WIPO-Classified Copyright Industries
II. Overview on Workforce Scale of WIPO-classified Inter-dependent Copyright Industries 1. Workforce Scale of WIPO-classified Inter-dependent Copyright Industries
The workforce in WIPO-classified inter-dependent copyright industries reached 228,000 workers in fiscal 2007. The “TV sets, Radios, VCRs, CD Players, DVD Players, Cassette Players, Electronic Game Equipments, and other similar equipments” sector ranked first in terms of the workforce. The second largest sector was “Photographic and Cinematographic Instruments”, followed by “Computer and Equipment.” Figure 10-5 Workforce by WIPO-classified inter-dependent copyright industrial sector
(fiscal 2007) (in thousand persons)
Workforce Industrial sector No. of
workforce Proportion
1
TV sets, Radios, VCRs, CD Players, DVD Players, Cassette Players, Electronic Game Equipments and other similar equipments
94 41.4%
2 Computer & Equipment 32 13.8% 3 Musical Instruments 10 4.2%
4 Photographic and Cinematographic Instruments
53 23.4%
5 Photocopiers 6 2.7% 6 Blank Recording Materials 13 5.7% 7 Paper 20 8.8% Total of WIPO-classified inter- copyright dependent industries 228 100.0%
218

Copyright White Paper Chapter 10: Overview on Workforce in WIPO-Classified Copyright Industries
2. Positioning of workforce in WIPO-classified inter-dependent copyright industries in the national workforce
In fiscal 2007, the workforce in WIPO-classified inter-dependent copyright industries accounted to 228,000, representing 0.4% of the national workforce. The trend of this workforce is different from that in JCI-classified classification. That is, it has significantly declined from the trend of the national workforce, and it also decreased from the level of the previous study.
Figure 10-6 Positioning of WIPO-classified inter-dependent copyright industries (workforce) in the national workforce
(in thousand persons)
Average Annual
1998 2002 2007 Growth
Rate a)WIPO-classified inter-dependent copyright industries
358 282 228 -4.9%
b) National workforce 66,276 63,592 64,451 -0.3% Proportion to national workforce(a/b) 0.5% 0.4% 0.4%
(At market prices in calendar year of 2000) (Source)National workforce: Number of workers in the “Annual Report on
National Income Statistics” (fixed for fiscal 2007)
219

Part Ⅳ: Data
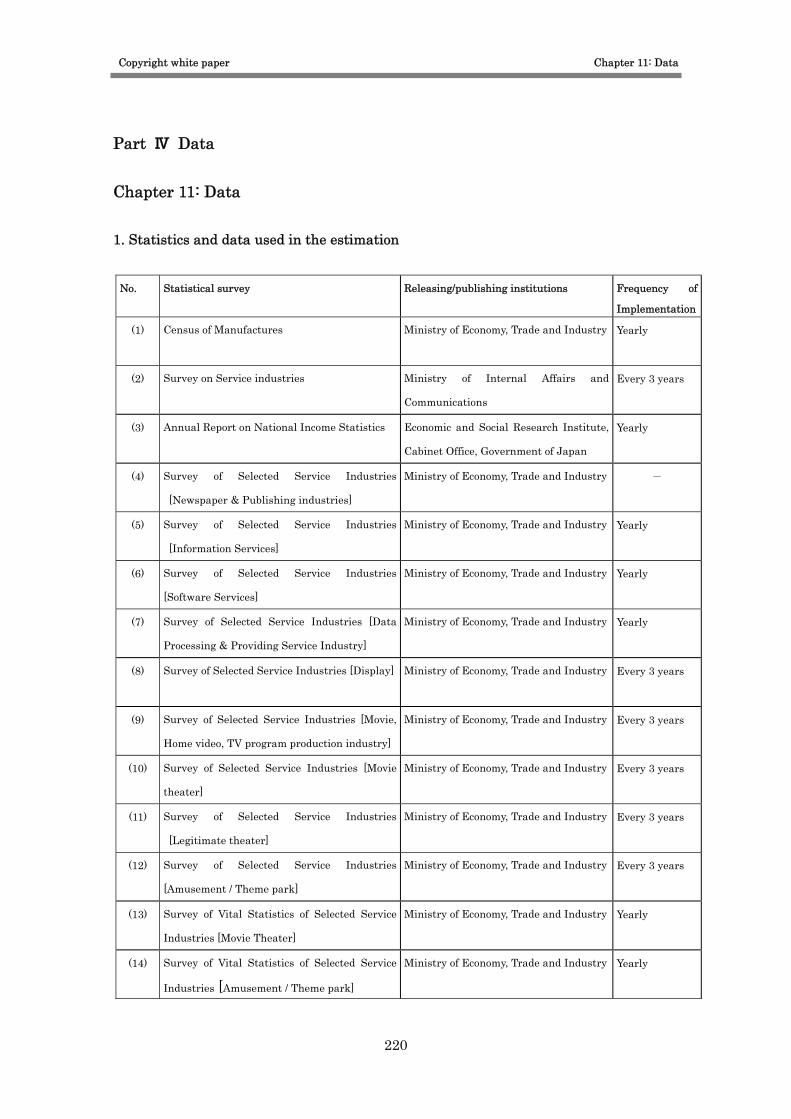
Copyright white paper Chapter 11: Data
Part Ⅳ Data Chapter 11: Data 1. Statistics and data used in the estimation
No. Statistical survey Releasing/publishing institutions Frequency of
Implementation
(1) Census of Manufactures
Ministry of Economy, Trade and Industry Yearly
(2) Survey on Service industries Ministry of Internal Affairs and
Communications
Every 3 years
(3) Annual Report on National Income Statistics Economic and Social Research Institute,
Cabinet Office, Government of Japan
Yearly
(4) Survey of Selected Service Industries
[Newspaper & Publishing industries]
Ministry of Economy, Trade and Industry -
(5) Survey of Selected Service Industries
[Information Services]
Ministry of Economy, Trade and Industry Yearly
(6) Survey of Selected Service Industries
[Software Services]
Ministry of Economy, Trade and Industry Yearly
(7) Survey of Selected Service Industries [Data
Processing & Providing Service Industry]
Ministry of Economy, Trade and Industry Yearly
(8) Survey of Selected Service Industries [Display]
Ministry of Economy, Trade and Industry Every 3 years
(9) Survey of Selected Service Industries [Movie,
Home video, TV program production industry]
Ministry of Economy, Trade and Industry Every 3 years
(10) Survey of Selected Service Industries [Movie
theater]
Ministry of Economy, Trade and Industry Every 3 years
(11) Survey of Selected Service Industries
[Legitimate theater]
Ministry of Economy, Trade and Industry Every 3 years
(12) Survey of Selected Service Industries
[Amusement / Theme park]
Ministry of Economy, Trade and Industry Every 3 years
(13) Survey of Vital Statistics of Selected Service
Industries [Movie Theater]
Ministry of Economy, Trade and Industry Yearly
(14) Survey of Vital Statistics of Selected Service
Industries [Amusement / Theme park]
Ministry of Economy, Trade and Industry Yearly
220

Copyright white paper Chapter 11: Data
(15) Statistics from Analysis of Corporate Financial
Statements
Teikoku Databank, Ltd. Yearly
(16) White Paper on the Printing Industry Japan Association of Graphic Arts
Technology
Yearly
(17) Total Sales of Newspaper companies
Nihon Shinbun Kyokai Yearly
(18) Annual Report of Publication The All Japan Magazine and Book
Publisher's and Editor's Association
Yearly
(19) Survey on the Telecommunications Industry Ministry of Internal Affairs and
Communications
Yearly
(20) Radio & Television Yearbook
Japan Broadcasting Corporation: NHK Yearly
(21) Japan Commercial Broadcasting Yearbook The National Association of Commercial
Broadcasters in Japan
Yearly
(22) Advertising Expenditures in Japan Total
Dentsu Inc. Yearly
(23) RIAJ Year Book
-a brief description of the Japanese Recording
Industries-
Recording Industry Association of Japan Yearly
(24) Survey on CD rental stores
Recording Industry Association of Japan Yearly
(25) Production Data of the past 10 years
Recording Industry Association of Japan Yearly
(26) Data provided by JASRAC
JASRAC Yearly
(27) CESA Game White Paper Computer Entertainment Software
Association
Yearly
(28) Survey on Amusement Industries
JAMMA、AOU、NSA* Yearly
(29) Karaoke White Paper All-Japan Karaoke Industrialist
Association
Yearly
(30) Statistics on Construction undertaken Ministry of Land Infrastructure and
Transport
Yearly
(31) Cost Analysis Information for Building Works Management Research Society for
Construction Industry
Yearly
(32) Statistics on Libraries in Japan
Japan Library Association Yearly
221
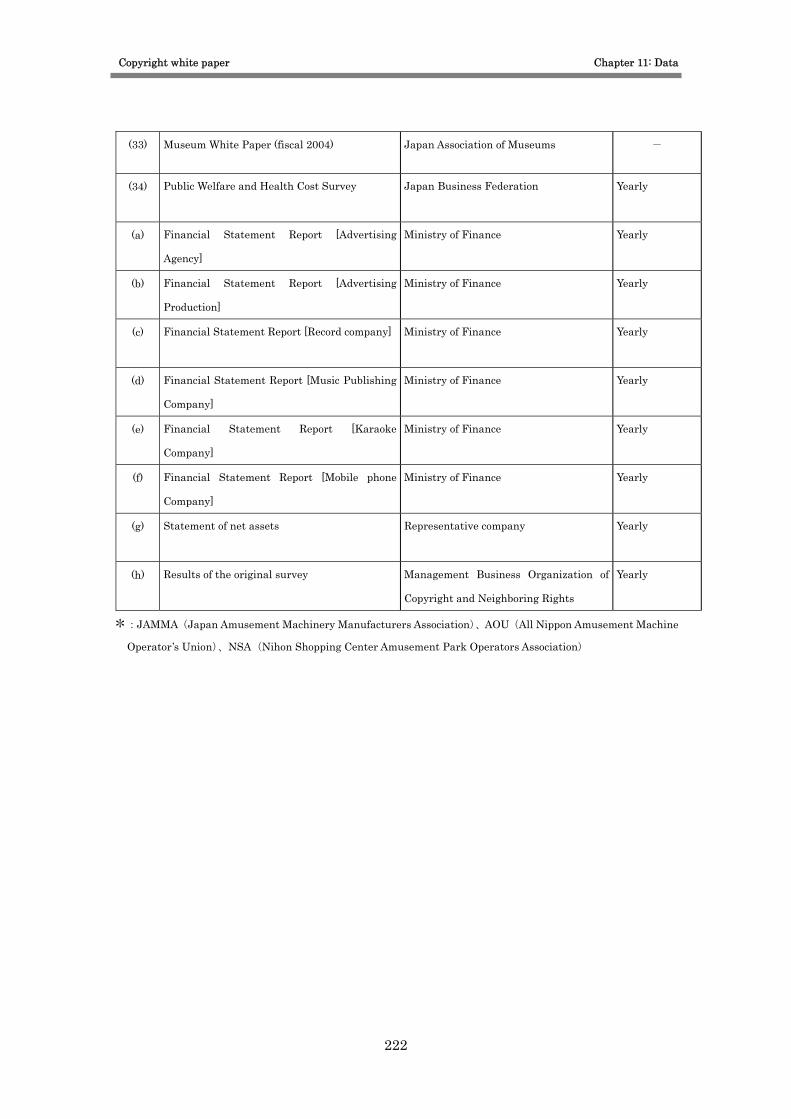
Copyright white paper Chapter 11: Data
(33) Museum White Paper (fiscal 2004)
Japan Association of Museums -
(34) Public Welfare and Health Cost Survey
Japan Business Federation Yearly
(a) Financial Statement Report [Advertising
Agency]
Ministry of Finance Yearly
(b) Financial Statement Report [Advertising
Production]
Ministry of Finance Yearly
(c) Financial Statement Report [Record company]
Ministry of Finance Yearly
(d) Financial Statement Report [Music Publishing
Company]
Ministry of Finance Yearly
(e) Financial Statement Report [Karaoke
Company]
Ministry of Finance Yearly
(f) Financial Statement Report [Mobile phone
Company]
Ministry of Finance Yearly
(g) Statement of net assets
Representative company Yearly
(h) Results of the original survey Management Business Organization of
Copyright and Neighboring Rights
Yearly
*:JAMMA(Japan Amusement Machinery Manufacturers Association)、AOU(All Nippon Amusement Machine
Operator’s Union)、NSA(Nihon Shopping Center Amusement Park Operators Association)
222

(1)Census of Manufactures (Ministry of Economy, Trade and Industry) ○ 1.Statistical Tables by Respective Industry (4-digit industrial subclassification) (1) Establishment with 4 or more employees ○ 1.Statistical Tables by Respective Industry (4-digit industrial subclassification) (1) Establishment with 30 or more employees
(Million yen) JSIC[Groups] Tangible fixed asset Fiscal
Year No. Classification Total cash wages and Salaries Paid
Value of Shipment Write- offs Depreciation Subtotal
Number of employees
1610 Printing 1,503,103 7,587,539 41,011 265,988 306,999 331,4541998
3296 Information recording materials, except newspapers, books, other printed products, etc. 38,880 241,575 - - - 7,765
1610 Printing 1,423,251 6,852,605 40,944 251,615 292,559 314,3371999
3296 Information recording materials, except newspapers, books, other printed products, etc. 33,885 255,541 - - - 7,009
1610 Printing 1,386,430 6,878,514 37,690 248,382 286,072 309,5852000
3296 Information recording materials, except newspapers, books, other printed products, etc. 36,370 603,008 - - - 7,351
1610 Printing 1,317,597 6,774,396 30,033 204,665 234,698 302,8092001
3296 Information recording materials, except newspapers, books, other printed products, etc. 32,462 198,521 - - - 7,304
1610 Printing 1,267,264 6,492,009 29,725 174,351 204,076 293,7012002
3296 Information recording materials, except newspapers, books, other printed products, etc. 30,037 176,972 2,562 9,725 12,287 6,512
1610 Printing 1,208,877 6,347,589 30,718 162,694 193,412 289,2082003
3296 Information recording materials, except newspapers, books, other printed products, etc. 31,106 358,203 1,491 8,360 9,851 6,124
1610 Printing 1,158,190 6,171,149 30,961 161,071 192,032 278,2122004
3296 Information recording materials, except newspapers, books, other printed products, etc. 29,891 378,826 3,429 7,178 10,607 6,162
1610 Printing 1,159,808 6,104,794 42,565 147,586 190,151 275,8352005
3296 Information recording materials, except newspapers, books, other printed products, etc. 29,370 398,970 2,356 7,289 9,645 6,113
1610 Printing 1,105,570 6,000,175 24,861 149,206 174,067 268,1512006
3296 Information recording materials, except newspapers, books, other printed products, etc. 25,785 554,771 1,044 8,142 9,186 5,741
223
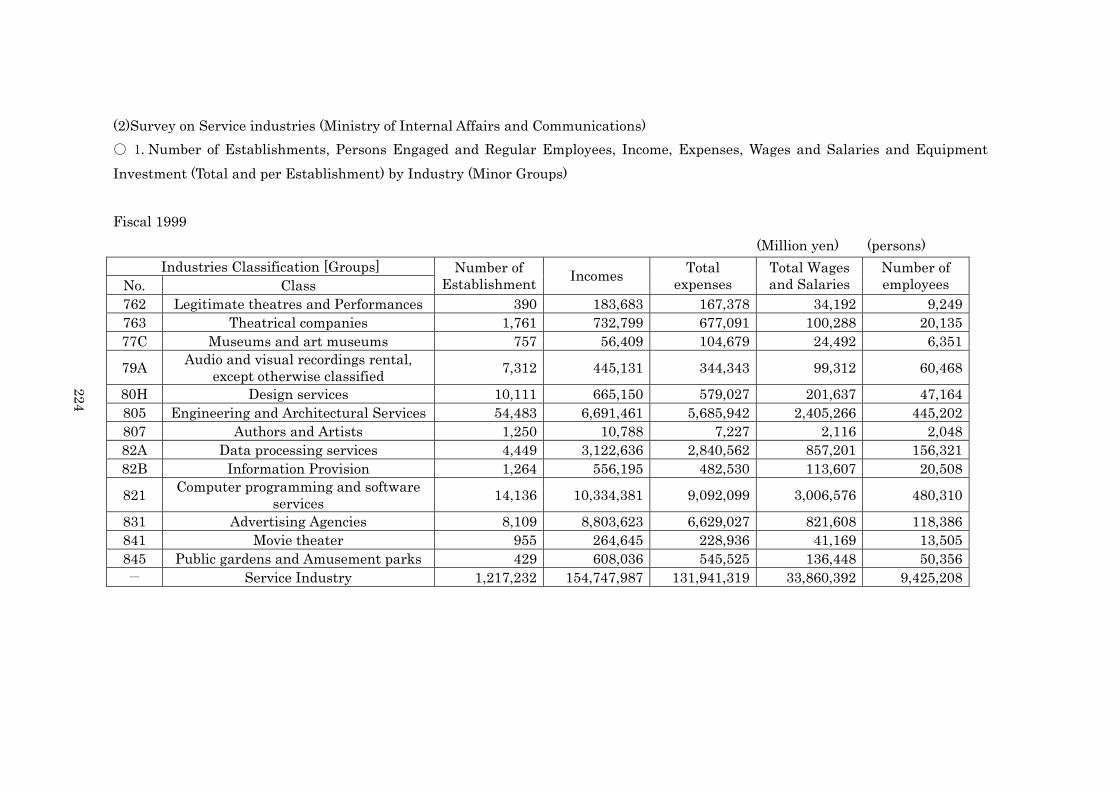
(2)Survey on Service industries (Ministry of Internal Affairs and Communications) ○ 1.Number of Establishments, Persons Engaged and Regular Employees, Income, Expenses, Wages and Salaries and Equipment Investment (Total and per Establishment) by Industry (Minor Groups) Fiscal 1999
(Million yen) (persons) Industries Classification [Groups]
No. Class Number of
Establishment Incomes Total expenses
Total Wages and Salaries
Number of employees
762 Legitimate theatres and Performances 390 183,683 167,378 34,192 9,249763 Theatrical companies 1,761 732,799 677,091 100,288 20,13577C Museums and art museums 757 56,409 104,679 24,492 6,351
79A Audio and visual recordings rental, except otherwise classified 7,312 445,131 344,343 99,312 60,468
80H Design services 10,111 665,150 579,027 201,637 47,164805 Engineering and Architectural Services 54,483 6,691,461 5,685,942 2,405,266 445,202807 Authors and Artists 1,250 10,788 7,227 2,116 2,04882A Data processing services 4,449 3,122,636 2,840,562 857,201 156,32182B Information Provision 1,264 556,195 482,530 113,607 20,508
821 Computer programming and software services 14,136 10,334,381 9,092,099 3,006,576 480,310
831 Advertising Agencies 8,109 8,803,623 6,629,027 821,608 118,386841 Movie theater 955 264,645 228,936 41,169 13,505845 Public gardens and Amusement parks 429 608,036 545,525 136,448 50,356- Service Industry 1,217,232 154,747,987 131,941,319 33,860,392 9,425,208
224
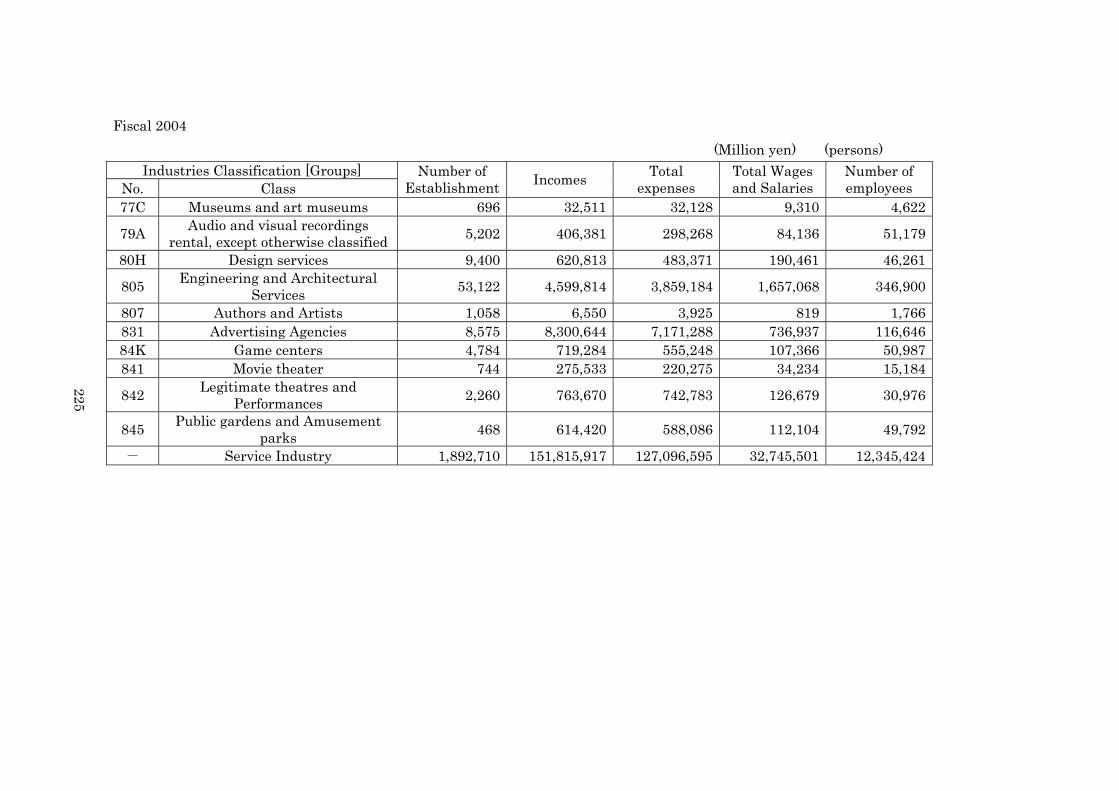
Fiscal 2004 (Million yen) (persons)
Industries Classification [Groups] No. Class
Number of Establishment Incomes Total
expenses Total Wages and Salaries
Number of employees
77C Museums and art museums 696 32,511 32,128 9,310 4,622
79A Audio and visual recordings rental, except otherwise classified 5,202 406,381 298,268 84,136 51,179
80H Design services 9,400 620,813 483,371 190,461 46,261
805 Engineering and Architectural Services 53,122 4,599,814 3,859,184 1,657,068 346,900
807 Authors and Artists 1,058 6,550 3,925 819 1,766831 Advertising Agencies 8,575 8,300,644 7,171,288 736,937 116,64684K Game centers 4,784 719,284 555,248 107,366 50,987841 Movie theater 744 275,533 220,275 34,234 15,184
842 Legitimate theatres and Performances 2,260 763,670 742,783 126,679 30,976
845 Public gardens and Amusement parks 468 614,420 588,086 112,104 49,792
- Service Industry 1,892,710 151,815,917 127,096,595 32,745,501 12,345,424
225
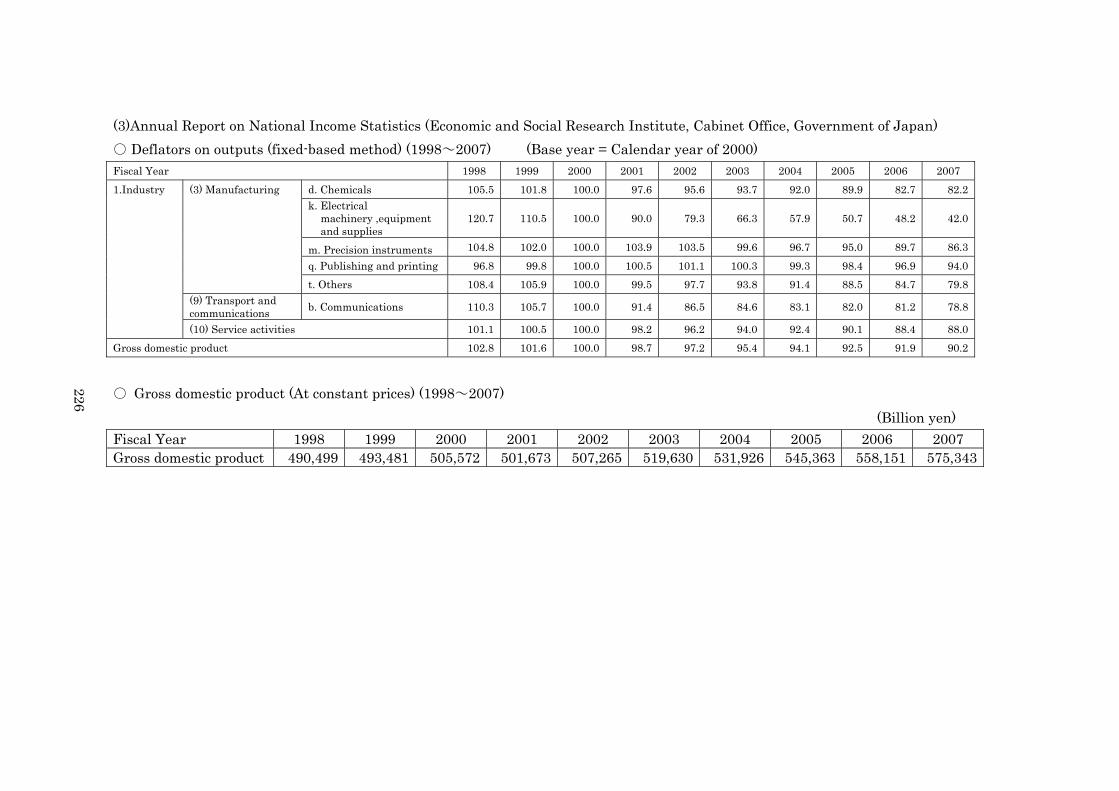
(3)Annual Report on National Income Statistics (Economic and Social Research Institute, Cabinet Office, Government of Japan) ○ Deflators on outputs (fixed-based method) (1998~2007) (Base year = Calendar year of 2000) Fiscal Year 1998 1999 2000 2001 2002 2003 2004 2005 2006 2007 1.Industry (3) Manufacturing d. Chemicals 105.5 101.8 100.0 97.6 95.6 93.7 92.0 89.9 82.7 82.2
k. Electrical
machinery ,equipment and supplies
120.7 110.5 100.0 90.0 79.3 66.3 57.9 50.7 48.2 42.0
m. Precision instruments 104.8 102.0 100.0 103.9 103.5 99.6 96.7 95.0 89.7 86.3 q. Publishing and printing 96.8 99.8 100.0 100.5 101.1 100.3 99.3 98.4 96.9 94.0 t. Others 108.4 105.9 100.0 99.5 97.7 93.8 91.4 88.5 84.7 79.8
(9) Transport and communications b. Communications 110.3 105.7 100.0 91.4 86.5 84.6 83.1 82.0 81.2 78.8
(10) Service activities 101.1 100.5 100.0 98.2 96.2 94.0 92.4 90.1 88.4 88.0Gross domestic product 102.8 101.6 100.0 98.7 97.2 95.4 94.1 92.5 91.9 90.2
○ Gross domestic product (At constant prices) (1998~2007) 226
(Billion yen) Fiscal Year 1998 1999 2000 2001 2002 2003 2004 2005 2006 2007 Gross domestic product 490,499 493,481 505,572 501,673 507,265 519,630 531,926 545,363 558,151 575,343

(4) Survey of Selected Service Industries [Newspaper & Publishing industries] (Ministry of Economy, Trade and Industry) ○ Ⅰ Annual sales
(Million yen) Fiscal Year 2005 Newspaper 2,385,961Publishing 2,604,050 ○ Ⅱ Annual operating costs
(Million yen) Fiscal Year 2005 Newspaper 2,415,299Publishing 2,585,734 227 ○ Ⅱ Total wages and salaries
(Million yen) Fiscal Year 2005 Newspaper 562,485Publishing 444,003 ○ Ⅱ Number of employees
(persons) Fiscal Year 2005 Newspaper 60,831Publishing 62,608
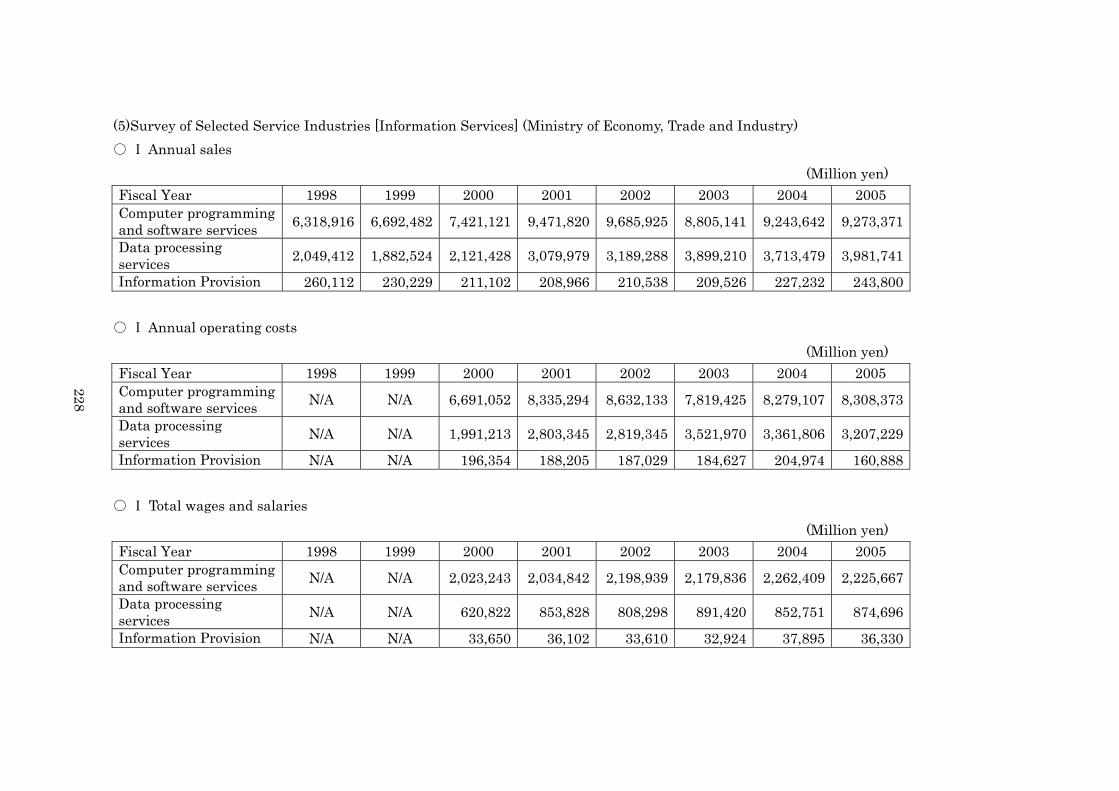
(5)Survey of Selected Service Industries [Information Services] (Ministry of Economy, Trade and Industry) ○ Ⅰ Annual sales
(Million yen) Fiscal Year 1998 1999 2000 2001 2002 2003 2004 2005 Computer programming and software services 6,318,916 6,692,482 7,421,121 9,471,820 9,685,925 8,805,141 9,243,642 9,273,371
Data processing services 2,049,412 1,882,524 2,121,428 3,079,979 3,189,288 3,899,210 3,713,479 3,981,741
Information Provision 260,112 230,229 211,102 208,966 210,538 209,526 227,232 243,800 ○ Ⅰ Annual operating costs
(Million yen) Fiscal Year 1998 1999 2000 2001 2002 2003 2004 2005 Computer programming and software services N/A N/A 6,691,052 8,335,294 8,632,133 7,819,425 8,279,107 8,308,373
Data processing services N/A N/A 1,991,213 2,803,345 2,819,345 3,521,970 3,361,806 3,207,229
Information Provision N/A N/A 196,354 188,205 187,029 184,627 204,974 160,888
228
○ Ⅰ Total wages and salaries
(Million yen) Fiscal Year 1998 1999 2000 2001 2002 2003 2004 2005 Computer programming and software services N/A N/A 2,023,243 2,034,842 2,198,939 2,179,836 2,262,409 2,225,667
Data processing services N/A N/A 620,822 853,828 808,298 891,420 852,751 874,696
Information Provision N/A N/A 33,650 36,102 33,610 32,924 37,895 36,330
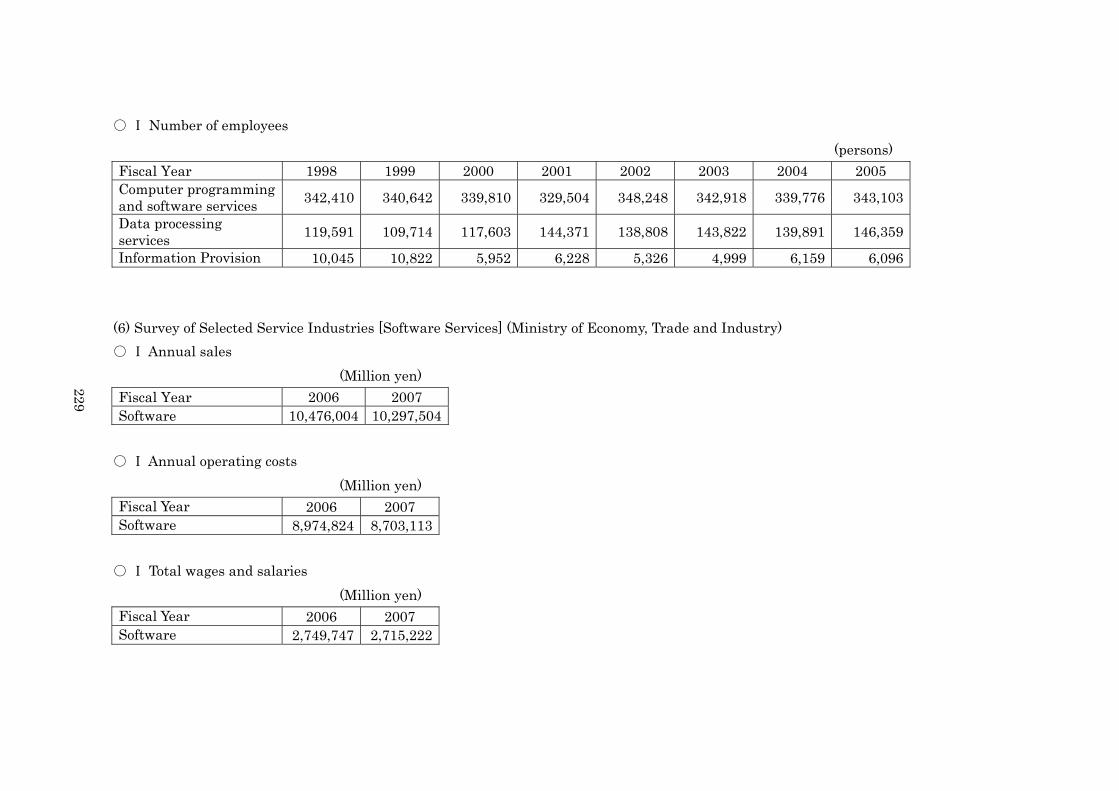
○ Ⅰ Number of employees (persons)
Fiscal Year 1998 1999 2000 2001 2002 2003 2004 2005 Computer programming and software services 342,410 340,642 339,810 329,504 348,248 342,918 339,776 343,103
Data processing services 119,591 109,714 117,603 144,371 138,808 143,822 139,891 146,359
Information Provision 10,045 10,822 5,952 6,228 5,326 4,999 6,159 6,096 (6) Survey of Selected Service Industries [Software Services] (Ministry of Economy, Trade and Industry) ○ Ⅰ Annual sales
(Million yen) Fiscal Year 2006 2007 Software 10,476,004 10,297,504
229
○ Ⅰ Annual operating costs
(Million yen) Fiscal Year 2006 2007 Software 8,974,824 8,703,113
○ Ⅰ Total wages and salaries
(Million yen) Fiscal Year 2006 2007 Software 2,749,747 2,715,222
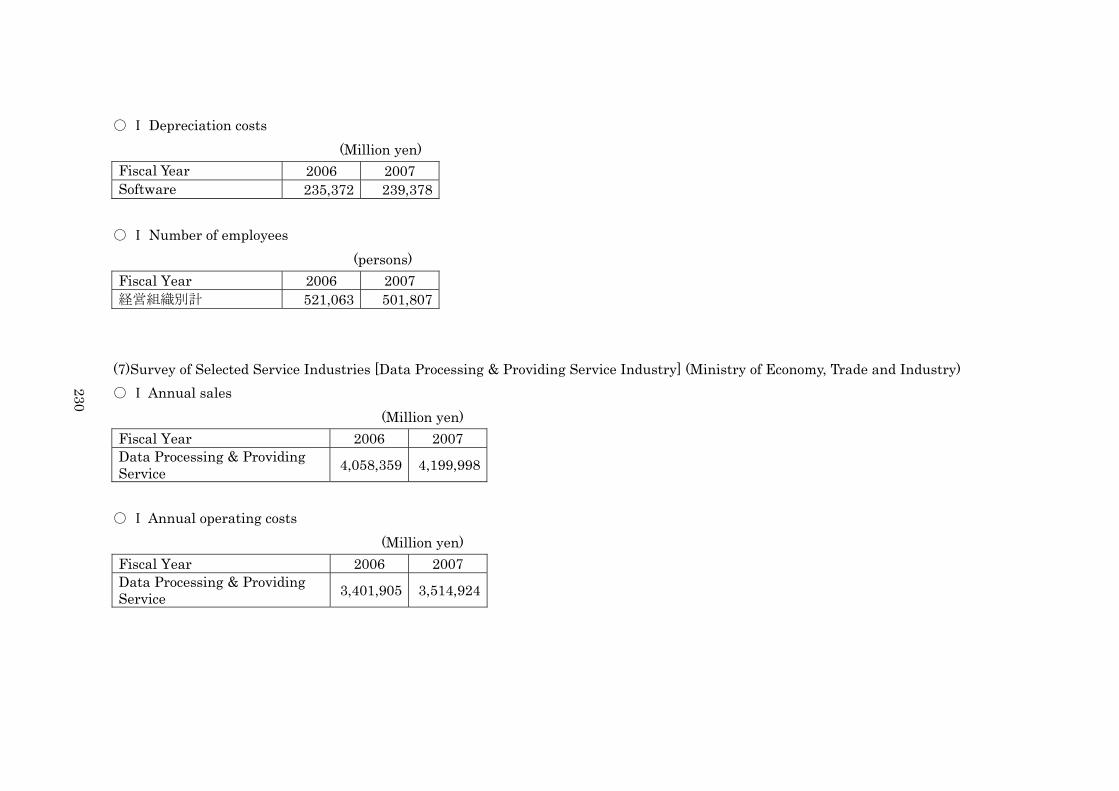
○ Ⅰ Depreciation costs (Million yen)
Fiscal Year 2006 2007 Software 235,372 239,378
○ Ⅰ Number of employees
(persons) Fiscal Year 2006 2007 経営組織別計 521,063 501,807
(7)Survey of Selected Service Industries [Data Processing & Providing Service Industry] (Ministry of Economy, Trade and Industry) ○ Ⅰ Annual sales 230
(Million yen) Fiscal Year 2006 2007 Data Processing & Providing Service 4,058,359 4,199,998
○ Ⅰ Annual operating costs
(Million yen) Fiscal Year 2006 2007 Data Processing & Providing Service 3,401,905 3,514,924
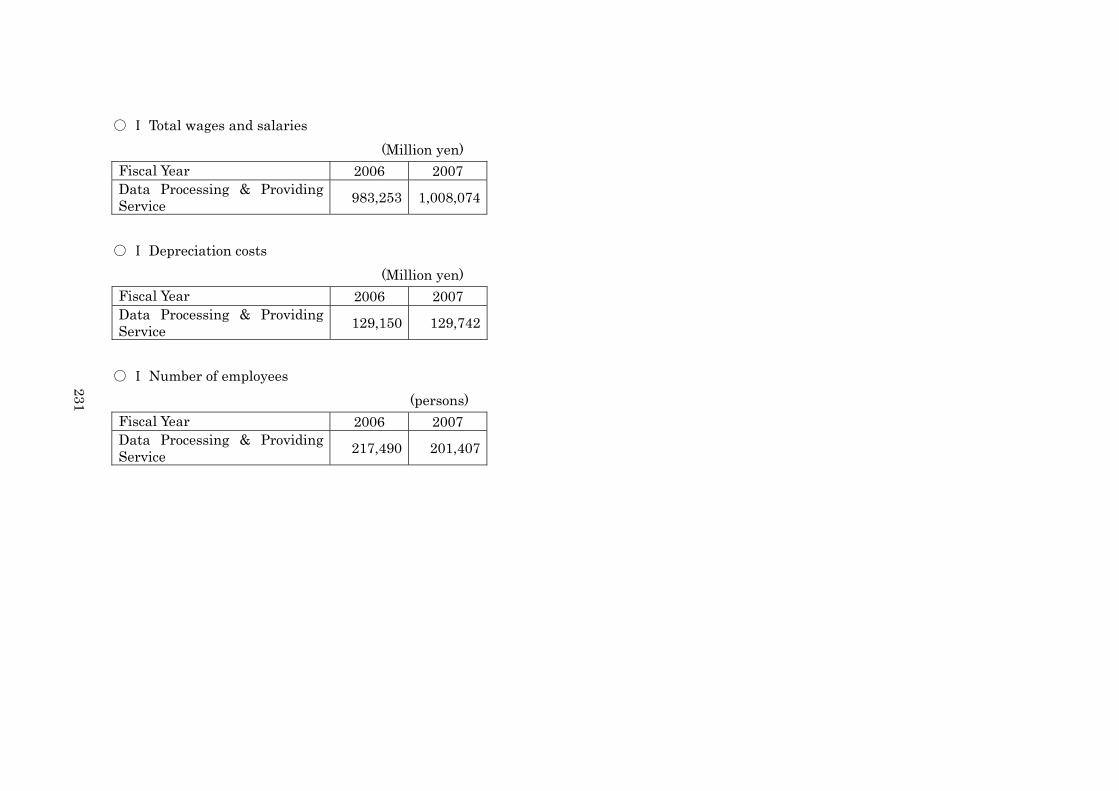
○ Ⅰ Total wages and salaries (Million yen)
Fiscal Year 2006 2007 Data Processing & Providing Service 983,253 1,008,074
○ Ⅰ Depreciation costs
(Million yen) Fiscal Year 2006 2007 Data Processing & Providing Service 129,150 129,742
○ Ⅰ Number of employees
(persons)
231
Fiscal Year 2006 2007 Data Processing & Providing Service 217,490 201,407
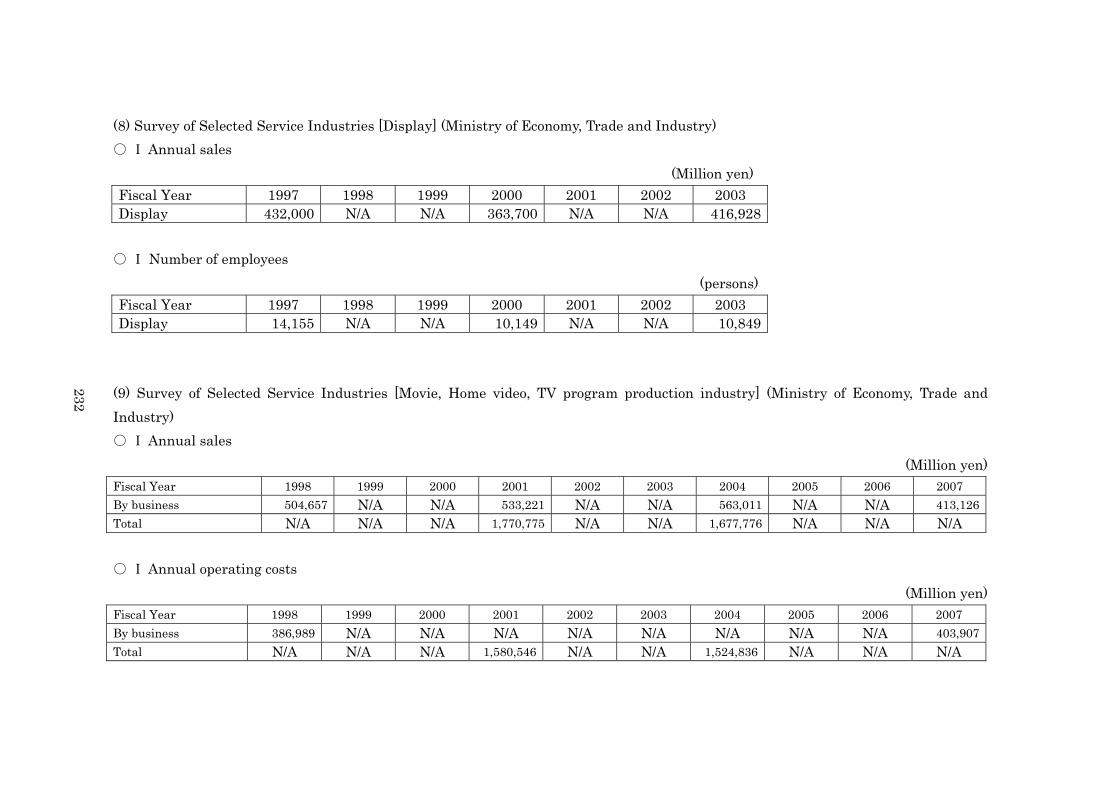
(8) Survey of Selected Service Industries [Display] (Ministry of Economy, Trade and Industry) ○ Ⅰ Annual sales
(Million yen) Fiscal Year 1997 1998 1999 2000 2001 2002 2003 Display 432,000 N/A N/A 363,700 N/A N/A 416,928
○ Ⅰ Number of employees
(persons) Fiscal Year 1997 1998 1999 2000 2001 2002 2003 Display 14,155 N/A N/A 10,149 N/A N/A 10,849
(9) Survey of Selected Service Industries [Movie, Home video, TV program production industry] (Ministry of Economy, Trade and Industry)
232
○ Ⅰ Annual sales (Million yen)
Fiscal Year 1998 1999 2000 2001 2002 2003 2004 2005 2006 2007 By business 504,657 N/A N/A 533,221 N/A N/A 563,011 N/A N/A 413,126Total N/A N/A N/A 1,770,775 N/A N/A 1,677,776 N/A N/A N/A
○ Ⅰ Annual operating costs
(Million yen) Fiscal Year 1998 1999 2000 2001 2002 2003 2004 2005 2006 2007 By business 386,989 N/A N/A N/A N/A N/A N/A N/A N/A 403,907Total N/A N/A N/A 1,580,546 N/A N/A 1,524,836 N/A N/A N/A
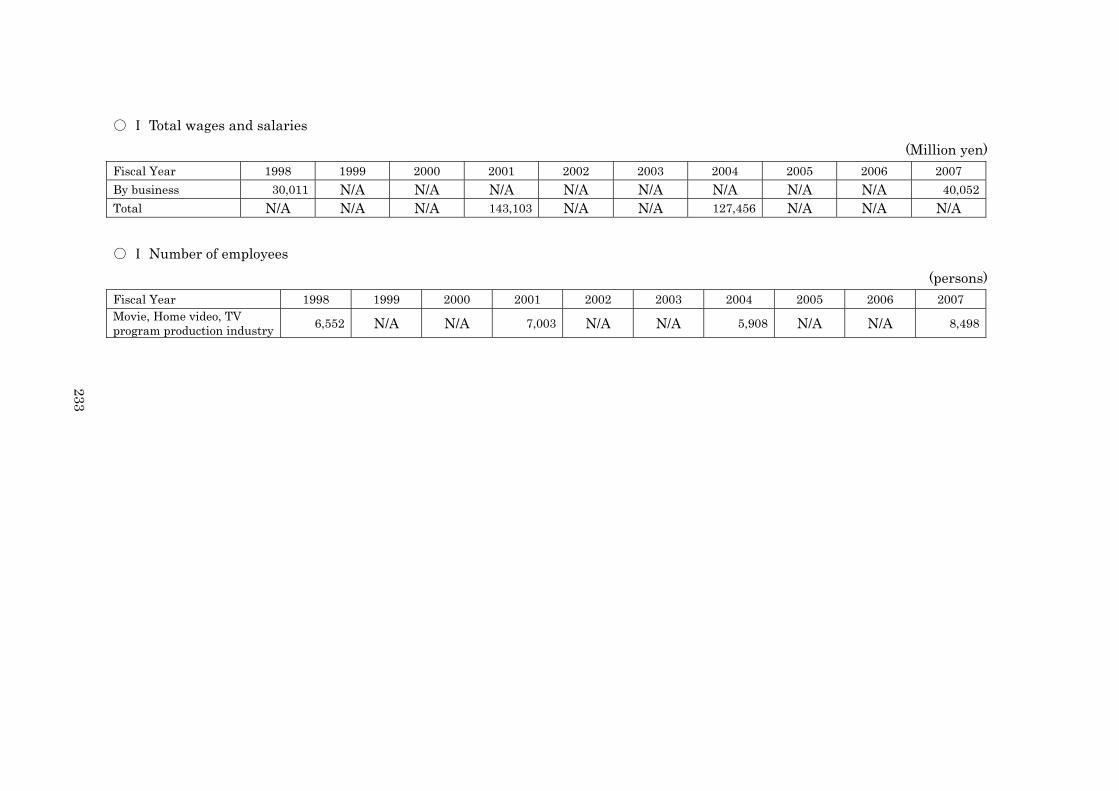
○ Ⅰ Total wages and salaries (Million yen)
Fiscal Year 1998 1999 2000 2001 2002 2003 2004 2005 2006 2007 By business 30,011 N/A N/A N/A N/A N/A N/A N/A N/A 40,052Total N/A N/A N/A 143,103 N/A N/A 127,456 N/A N/A N/A ○ Ⅰ Number of employees
(persons) Fiscal Year 1998 1999 2000 2001 2002 2003 2004 2005 2006 2007 Movie, Home video, TV program production industry 6,552 N/A N/A 7,003 N/A N/A 5,908 N/A N/A 8,498
233

(10) Survey of Selected Service Industries [Movie theater] (Ministry of Economy, Trade and Industry) ○ Ⅰ Annual sales
(Million yen) Fiscal Year 1997 1998 1999 2000 2001 2002 2003 2004 Admission Income 131,474 N/A N/A N/A 169,889 N/A N/A 183,860Total Income 151,069 N/A N/A N/A 204,264 N/A N/A 228,643
(11) Survey of Selected Service Industries [Legitimate theater] (Ministry of Economy, Trade and Industry) ○ Ⅰ Annual sales
(Million yen) Fiscal Year 2001 2002 2003 2004 Admission Income 84,876 N/A N/A 99,169 Renting Income 8,763 N/A N/A 10,116 Total Income 267,200 N/A N/A 289,362
234
○ Ⅰ Annual operating costs
(Million yen) Fiscal Year 2001 2002 2003 2004 Legitimate theater 256,743 N/A N/A 272,668
○ Ⅰ Total wages and salaries
(Million yen) Fiscal Year 2001 2002 2003 2004 Legitimate theater 53,850 N/A N/A 53,657
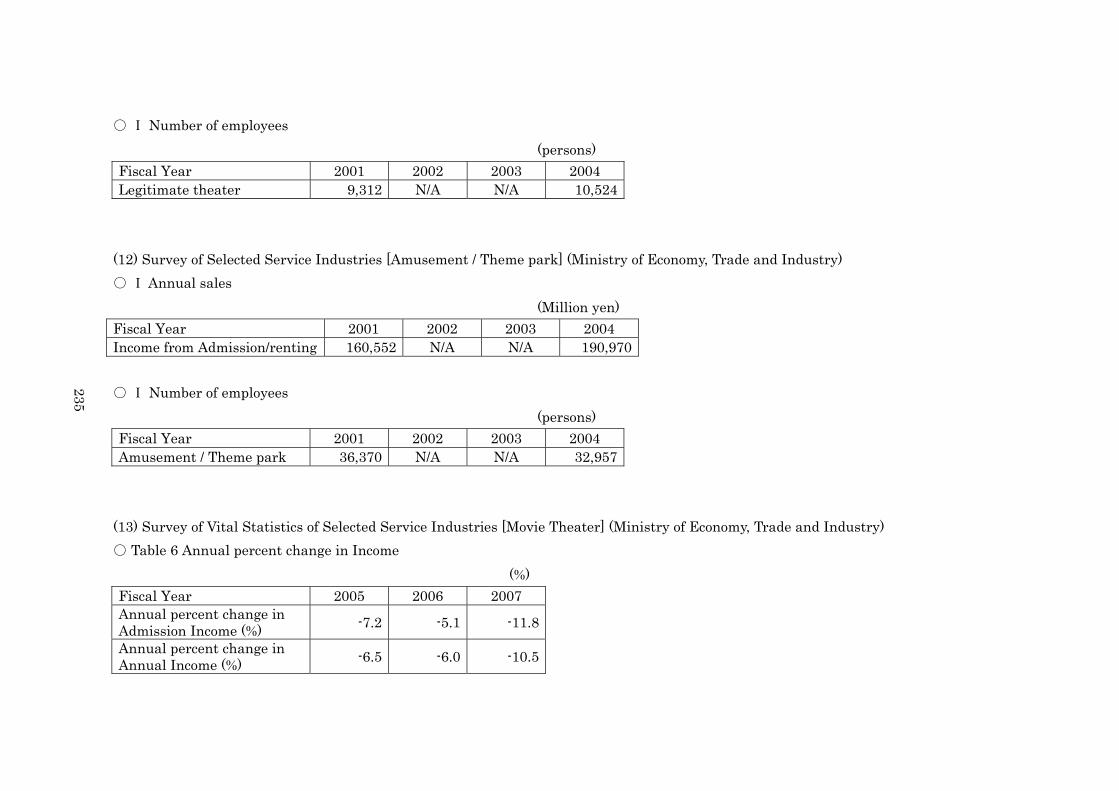
○ Ⅰ Number of employees (persons)
Fiscal Year 2001 2002 2003 2004 Legitimate theater 9,312 N/A N/A 10,524
(12) Survey of Selected Service Industries [Amusement / Theme park] (Ministry of Economy, Trade and Industry) ○ Ⅰ Annual sales
(Million yen) Fiscal Year 2001 2002 2003 2004 Income from Admission/renting 160,552 N/A N/A 190,970 ○ Ⅰ Number of employees 235
(persons) Fiscal Year 2001 2002 2003 2004 Amusement / Theme park 36,370 N/A N/A 32,957
(13) Survey of Vital Statistics of Selected Service Industries [Movie Theater] (Ministry of Economy, Trade and Industry) ○ Table 6 Annual percent change in Income
(%) Fiscal Year 2005 2006 2007 Annual percent change in Admission Income (%) -7.2 -5.1 -11.8
Annual percent change in Annual Income (%) -6.5 -6.0 -10.5
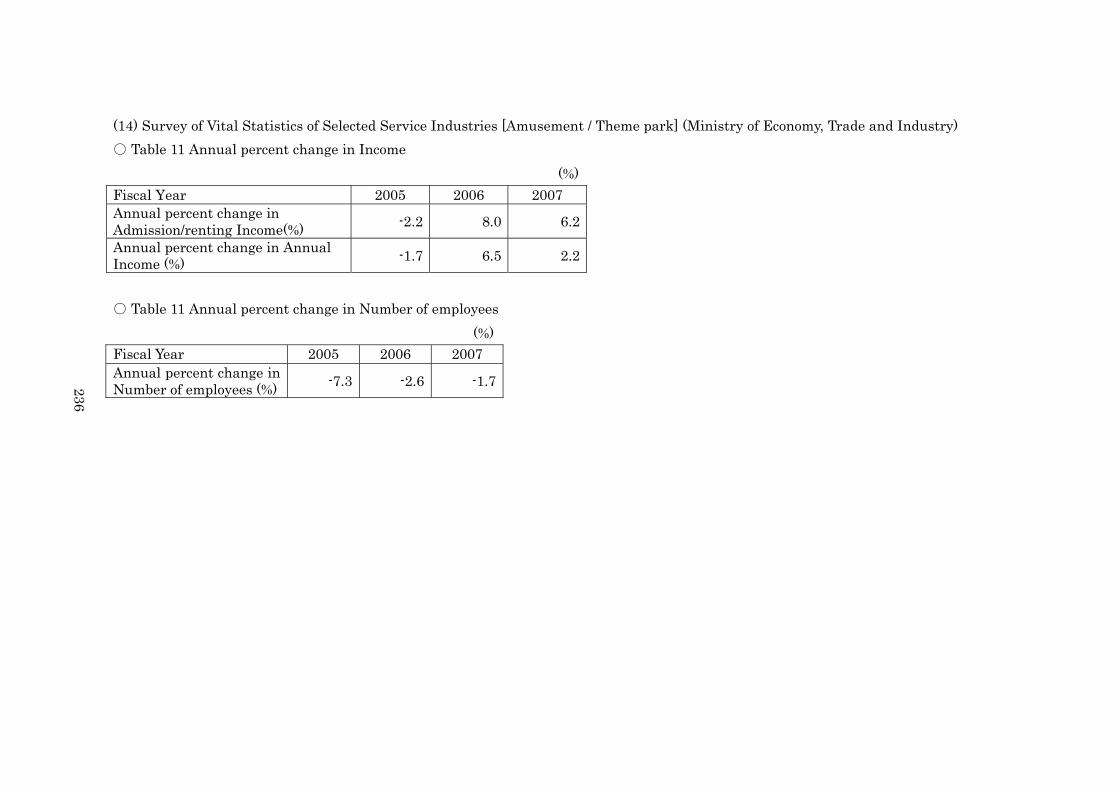
(14) Survey of Vital Statistics of Selected Service Industries [Amusement / Theme park] (Ministry of Economy, Trade and Industry) ○ Table 11 Annual percent change in Income
(%) Fiscal Year 2005 2006 2007 Annual percent change in Admission/renting Income(%) -2.2 8.0 6.2
Annual percent change in Annual Income (%) -1.7 6.5 2.2
○ Table 11 Annual percent change in Number of employees
(%) Fiscal Year 2005 2006 2007 Annual percent change in Number of employees (%) -7.3 -2.6 -1.7236

(15) Statistics from Analysis of Corporate Financial Statement (Teikoku Databank, Ltd.) ○ Ratio of depreciation expense to sales (%)
(%) Teikoku Industrial Classification Fiscal Year
No. Classification name 1998 1999 2000 2001 2002 2003 2004 2005 2006 2007 - Service industry 5.98 6.15 5.60 5.25 4.92 4.52 4.38 4.28 1.89 2.06
271 Newspaper publishing - - - - - 2.54 2.60 2.38 1.60 2.01 - Publishing - - - - - 1.76 1.19 1.09 0.68 0.94 - Printing - - - - - 3.56 3.54 3.44 2.55 3.03
749 Miscellaneous Goods rental and Leasing 7.72 7.75 7.78 7.26 6.67 6.58 7.05 6.80 2.24 3.36
791-1 Motion picture production 4.63 3.89 6.44 3.83 4.38 2.64 2.78 2.19 1.29 1.69 791-2 Motion picture distribution - 8.00 14.51 1.70 2.14 3.08 2.91 1.97 2.25 3.15 792 Motion picture theater 6.85 7.24 7.78 7.03 6.76 5.45 5.68 6.51 3.46 5.23
801 Legitimate theatres and Performances 7.51 15.23 15.89 13.60 12.81 10.58 10.81 8.64 7.12 6.66
802 Theatrical companies 7.21 3.29 3.66 1.74 2.04 1.59 1.46 1.59 1.63 1.33 806 Parks, Amusement parks 13.61 16.88 12.01 13.65 11.61 9.97 11.61 12.58 7.73 6.54
807 Amusement and Recreation facilities 10.06 8.08 6.08 6.63 6.65 5.66 7.62 9.42 2.33 2.81
812 Private broadcasting 4.82 4.63 4.59 4.83 4.87 4.14 4.46 4.18 6.53 6.08 813 Cable broadcasting 24.28 27.24 8.64 16.64 9.81 8.53 8.29 8.16 13.07 7.18
851-1 Advertising Agencies 0.59 0.64 0.48 0.56 0.71 0.75 0.72 0.61 0.38 0.68 851-2 Advertising Production 0.76 1.62 0.89 0.85 1.81 1.38 2.09 1.98 0.67 0.99
874 Engineering and Architectural Services 1.24 1.25 1.16 1.56 1.47 1.50 1.44 1.58 0.92 1.33
875 Authors and Artists - N/A - - N/A - - N/A - -
237

(16) White Paper on the Printing Industry (Japan Association of Graphic Arts Technology) ○ Document 4-2-x Value of printing industry products in each major customer industry
(Million yen) Group Subgroup 1997 1998 1999 2000
Publishing 694,200 N/A N/A 675,300Printing and Publishing Newspaper 232,600 N/A N/A 211,700Total 7,722,800 N/A N/A 7,133,900 (17) Total Sales of Newspaper companies (Nihon Shinbun Kyokai)
(Million yen) Fiscal Year 1998 1999 2000 2001 2002 2003 2004 2005 2006 2007 Total Sales of Newspaper companies 24,848 24,688 25,223 24,890 23,721 23,576 23,797 24,188 23,323 22,182 238
(18) Annual Report of Publication (The All Japan Magazine and Book Publisher's and Editor's Association) ○ Estimation of Sales
(Million yen) Fiscal Year 1998 1999 2000 2001 2002 2003 2004 2005 2006 2007 Estimation of Sales 25,416 24,607 23,966 23,250 23,105 22,278 22,428 21,964 21,525 20,853

(19) Survey on the Information and Communication Industry (Ministry of Internal Affairs and Communications) ○ Sales of each Service
(Million yen) Fiscal Year 2003 2004 2005 2006 Private broadcasting 2,574,377 2,537,048 2,641,975 2,622,056Cable broadcasting 254,498 308,292 268,760 332,837 ○ 3.Profit structure/ Operating cost and profit of Telecommunications Industries <Private broadcasting>
(%) Fiscal Year 2003 2004 2005 2006 Ratio of Employee expenses (%) 15.6 14.5 13.5 13.5Ratio of Operating profit (%) 7.6 7.5 6.9 6.1Depreciation expenses (%) 4.1 4.1 5.0 5.3
239
<Cable broadcasting>
(%) Fiscal Year 2003 2004 2005 2006 Ratio of Employee expenses (%) 14.2 15.8 15.0 14.3Ratio of Operating profit (%) 8.2 8.5 11.3 11.3Depreciation expenses (%) 17.6 12.0 15.3 14.0
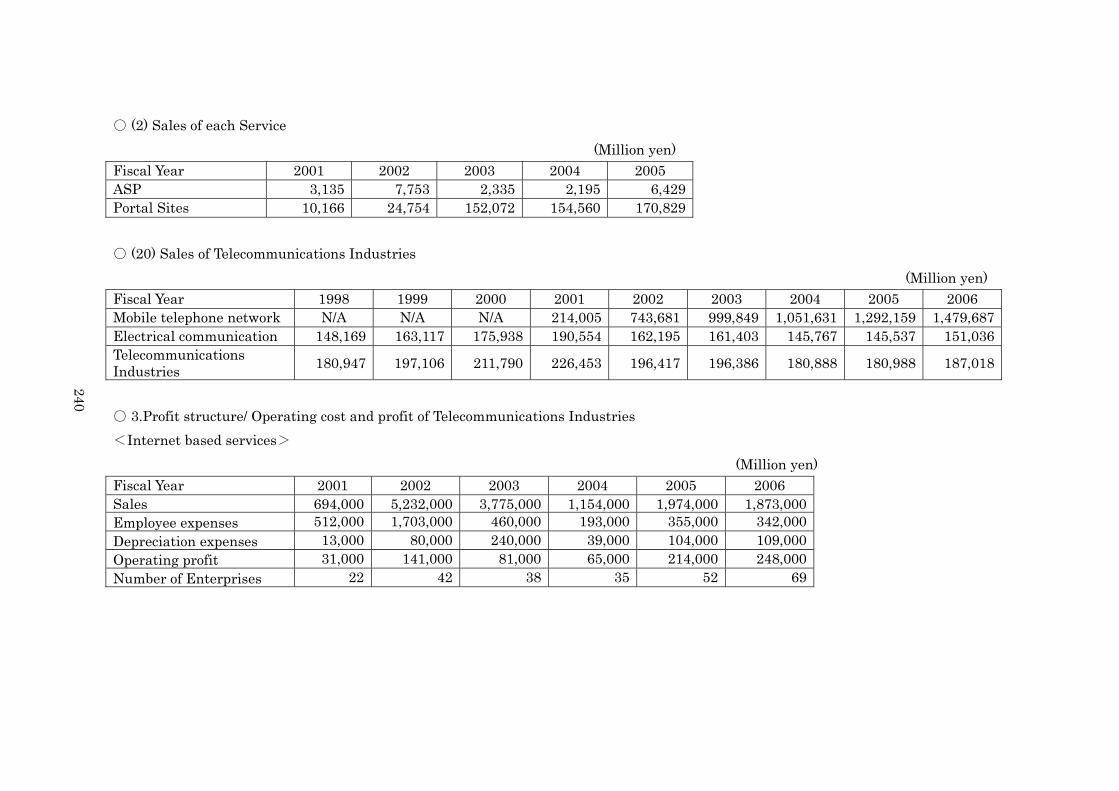
○ (2) Sales of each Service (Million yen)
Fiscal Year 2001 2002 2003 2004 2005 ASP 3,135 7,753 2,335 2,195 6,429Portal Sites 10,166 24,754 152,072 154,560 170,829 ○ (20) Sales of Telecommunications Industries
(Million yen) Fiscal Year 1998 1999 2000 2001 2002 2003 2004 2005 2006 Mobile telephone network N/A N/A N/A 214,005 743,681 999,849 1,051,631 1,292,159 1,479,687 Electrical communication 148,169 163,117 175,938 190,554 162,195 161,403 145,767 145,537 151,036 Telecommunications Industries 180,947 197,106 211,790 226,453 196,417 196,386 180,888 180,988 187,018
240
○ 3.Profit structure/ Operating cost and profit of Telecommunications Industries <Internet based services>
(Million yen) Fiscal Year 2001 2002 2003 2004 2005 2006 Sales 694,000 5,232,000 3,775,000 1,154,000 1,974,000 1,873,000Employee expenses 512,000 1,703,000 460,000 193,000 355,000 342,000Depreciation expenses 13,000 80,000 240,000 39,000 104,000 109,000Operating profit 31,000 141,000 81,000 65,000 214,000 248,000Number of Enterprises 22 42 38 35 52 69
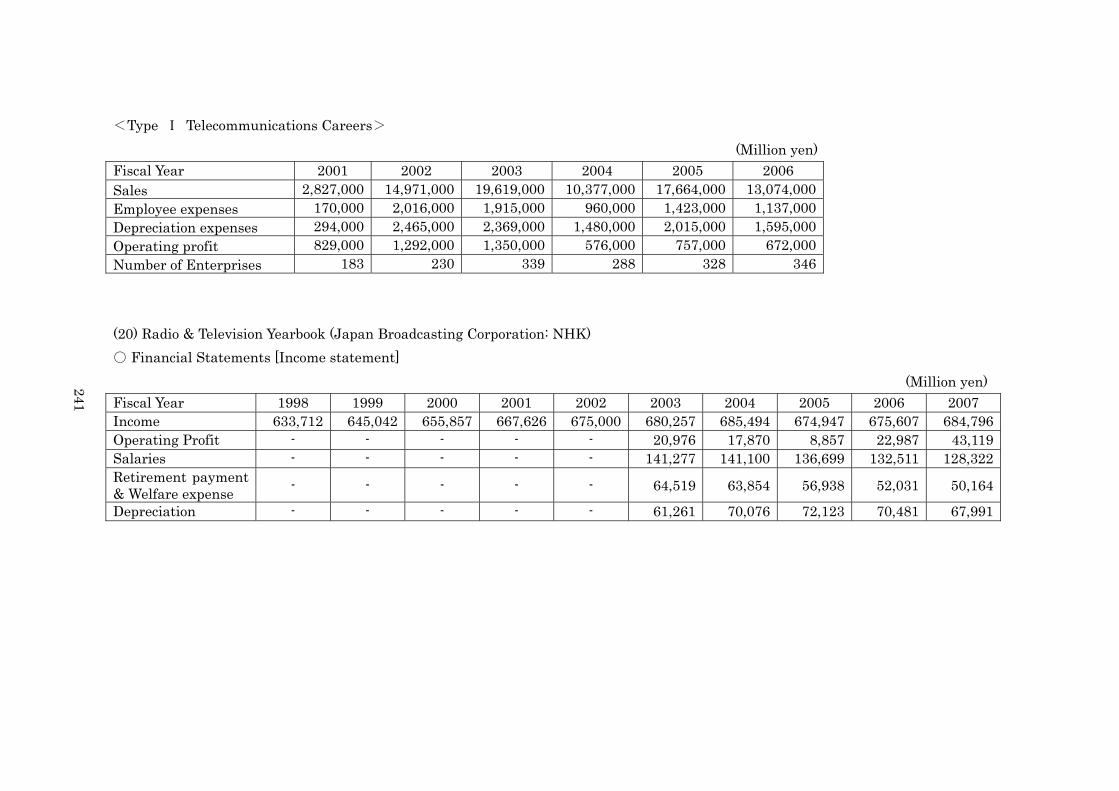
<Type Ⅰ Telecommunications Careers> (Million yen)
Fiscal Year 2001 2002 2003 2004 2005 2006 Sales 2,827,000 14,971,000 19,619,000 10,377,000 17,664,000 13,074,000Employee expenses 170,000 2,016,000 1,915,000 960,000 1,423,000 1,137,000Depreciation expenses 294,000 2,465,000 2,369,000 1,480,000 2,015,000 1,595,000Operating profit 829,000 1,292,000 1,350,000 576,000 757,000 672,000Number of Enterprises 183 230 339 288 328 346 (20) Radio & Television Yearbook (Japan Broadcasting Corporation: NHK) ○ Financial Statements [Income statement]
(Million yen) 241 Fiscal Year 1998 1999 2000 2001 2002 2003 2004 2005 2006 2007 Income 633,712 645,042 655,857 667,626 675,000 680,257 685,494 674,947 675,607 684,796 Operating Profit - - - - - 20,976 17,870 8,857 22,987 43,119 Salaries - - - - - 141,277 141,100 136,699 132,511 128,322 Retirement payment & Welfare expense - - - - - 64,519 63,854 56,938 52,031 50,164
Depreciation - - - - - 61,261 70,076 72,123 70,481 67,991

(21) Japan Commercial Broadcasting Yearbook (The National Association of Commercial Broadcasters in Japan) ○ Management status of Commercial Broadcasting companies (Financial Statements)
(Million yen) Fiscal Year 1998 1999 2000 2001 2002 2003 2004 2005 2006 2007 Incomes 2,429,488 2,471,022 2,632,079 2,580,960 2,472,400 2,506,295 2,598,547 2,598,724 2,591,069 2,566,568 (22) Advertising Expenditures in Japan Total (Dentsu Inc.)
(Million yen) Fiscal Year 2004 2005 2006 2007 POP 1,745 1,782 1,845 1,886Exhibitions/Screen Displays 3,315 3,522 3,456 3,584242 (23) RIAJ Year Book (Recording Industry Association of Japan) ○ Production Trend
(Million yen) Fiscal Year 1998 1999 2000 2001 2002 2003 2004 2005 2006 2007 Audio Records 587,879 551,294 515,376 489,578 431,806 387,987 368,610 359,800 344,518 327,175AV-compound Records 26,387 23,300 19,791 16,100 14,250 N/A N/A N/A N/A N/A
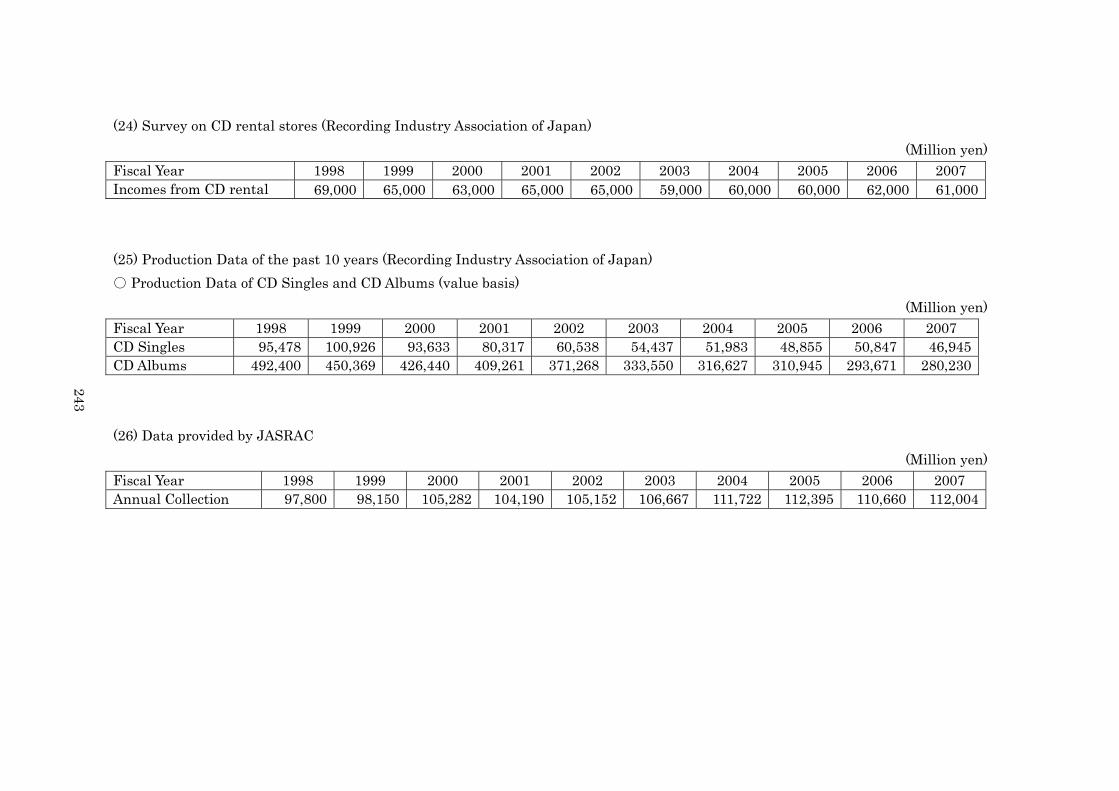
(24) Survey on CD rental stores (Recording Industry Association of Japan) (Million yen)
Fiscal Year 1998 1999 2000 2001 2002 2003 2004 2005 2006 2007 Incomes from CD rental 69,000 65,000 63,000 65,000 65,000 59,000 60,000 60,000 62,000 61,000 (25) Production Data of the past 10 years (Recording Industry Association of Japan) ○ Production Data of CD Singles and CD Albums (value basis)
(Million yen) Fiscal Year 1998 1999 2000 2001 2002 2003 2004 2005 2006 2007 CD Singles 95,478 100,926 93,633 80,317 60,538 54,437 51,983 48,855 50,847 46,945CD Albums 492,400 450,369 426,440 409,261 371,268 333,550 316,627 310,945 293,671 280,230 243
(26) Data provided by JASRAC
(Million yen) Fiscal Year 1998 1999 2000 2001 2002 2003 2004 2005 2006 2007 Annual Collection 97,800 98,150 105,282 104,190 105,152 106,667 111,722 112,395 110,660 112,004
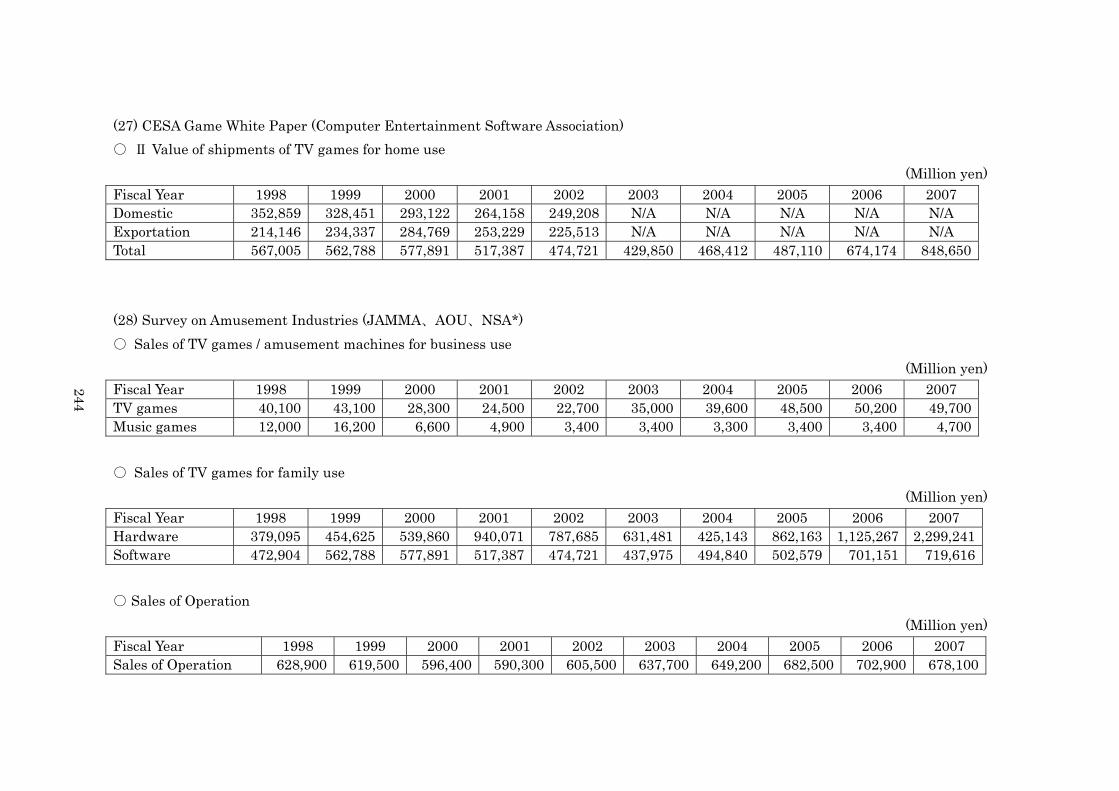
(27) CESA Game White Paper (Computer Entertainment Software Association) ○ Ⅱ Value of shipments of TV games for home use
(Million yen) Fiscal Year 1998 1999 2000 2001 2002 2003 2004 2005 2006 2007 Domestic 352,859 328,451 293,122 264,158 249,208 N/A N/A N/A N/A N/A Exportation 214,146 234,337 284,769 253,229 225,513 N/A N/A N/A N/A N/A Total 567,005 562,788 577,891 517,387 474,721 429,850 468,412 487,110 674,174 848,650 (28) Survey on Amusement Industries (JAMMA、AOU、NSA*) ○ Sales of TV games / amusement machines for business use
(Million yen) Fiscal Year 1998 1999 2000 2001 2002 2003 2004 2005 2006 2007 TV games 40,100 43,100 28,300 24,500 22,700 35,000 39,600 48,500 50,200 49,700Music games 12,000 16,200 6,600 4,900 3,400 3,400 3,300 3,400 3,400 4,700
244
○ Sales of TV games for family use
(Million yen) Fiscal Year 1998 1999 2000 2001 2002 2003 2004 2005 2006 2007 Hardware 379,095 454,625 539,860 940,071 787,685 631,481 425,143 862,163 1,125,267 2,299,241Software 472,904 562,788 577,891 517,387 474,721 437,975 494,840 502,579 701,151 719,616 ○ Sales of Operation
(Million yen) Fiscal Year 1998 1999 2000 2001 2002 2003 2004 2005 2006 2007 Sales of Operation 628,900 619,500 596,400 590,300 605,500 637,700 649,200 682,500 702,900 678,100
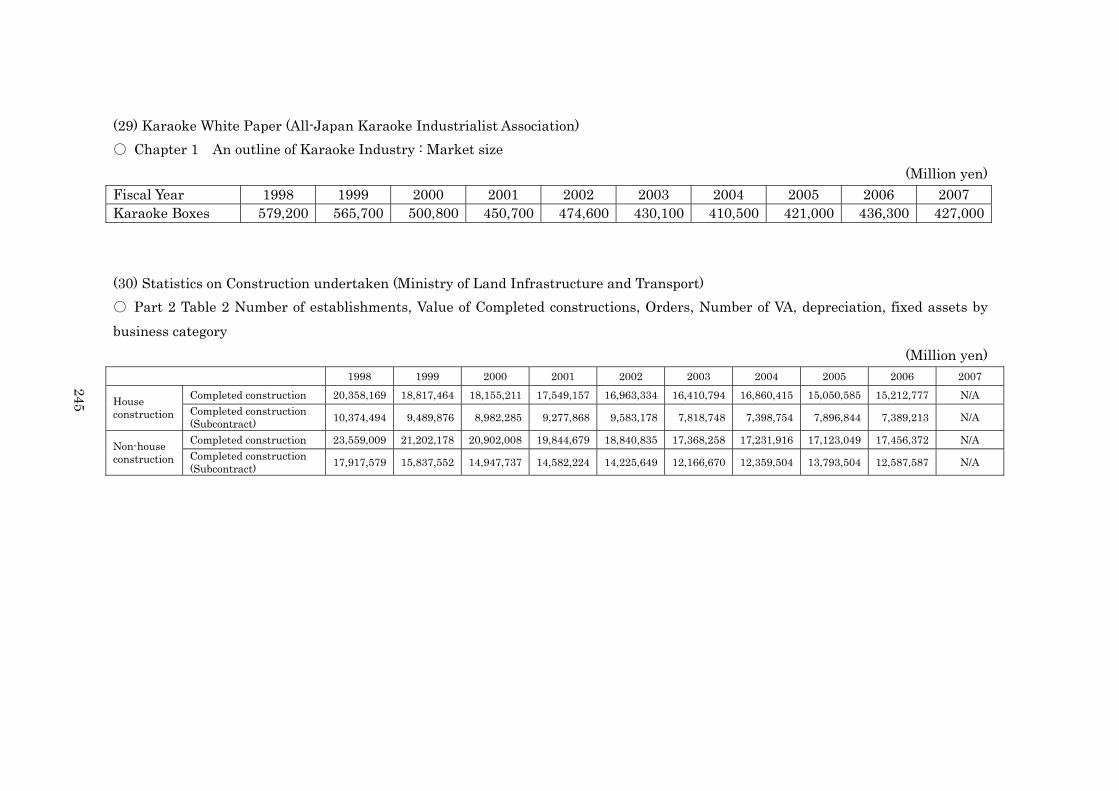
(29) Karaoke White Paper (All-Japan Karaoke Industrialist Association) ○ Chapter 1 An outline of Karaoke Industry : Market size
(Million yen) Fiscal Year 1998 1999 2000 2001 2002 2003 2004 2005 2006 2007 Karaoke Boxes 579,200 565,700 500,800 450,700 474,600 430,100 410,500 421,000 436,300 427,000 (30) Statistics on Construction undertaken (Ministry of Land Infrastructure and Transport) ○ Part 2 Table 2 Number of establishments, Value of Completed constructions, Orders, Number of VA, depreciation, fixed assets by business category
(Million yen) 1998 1999 2000 2001 2002 2003 2004 2005 2006 2007
Completed construction 20,358,169 18,817,464 18,155,211 17,549,157 16,963,334 16,410,794 16,860,415 15,050,585 15,212,777 N/A House construction Completed construction
(Subcontract) 10,374,494 9,489,876 8,982,285 9,277,868 9,583,178 7,818,748 7,398,754 7,896,844 7,389,213 N/A
Completed construction 23,559,009 21,202,178 20,902,008 19,844,679 18,840,835 17,368,258 17,231,916 17,123,049 17,456,372 N/A Non-house construction Completed construction
(Subcontract) 17,917,579 15,837,552 14,947,737 14,582,224 14,225,649 12,166,670 12,359,504 13,793,504 12,587,587 N/A
245
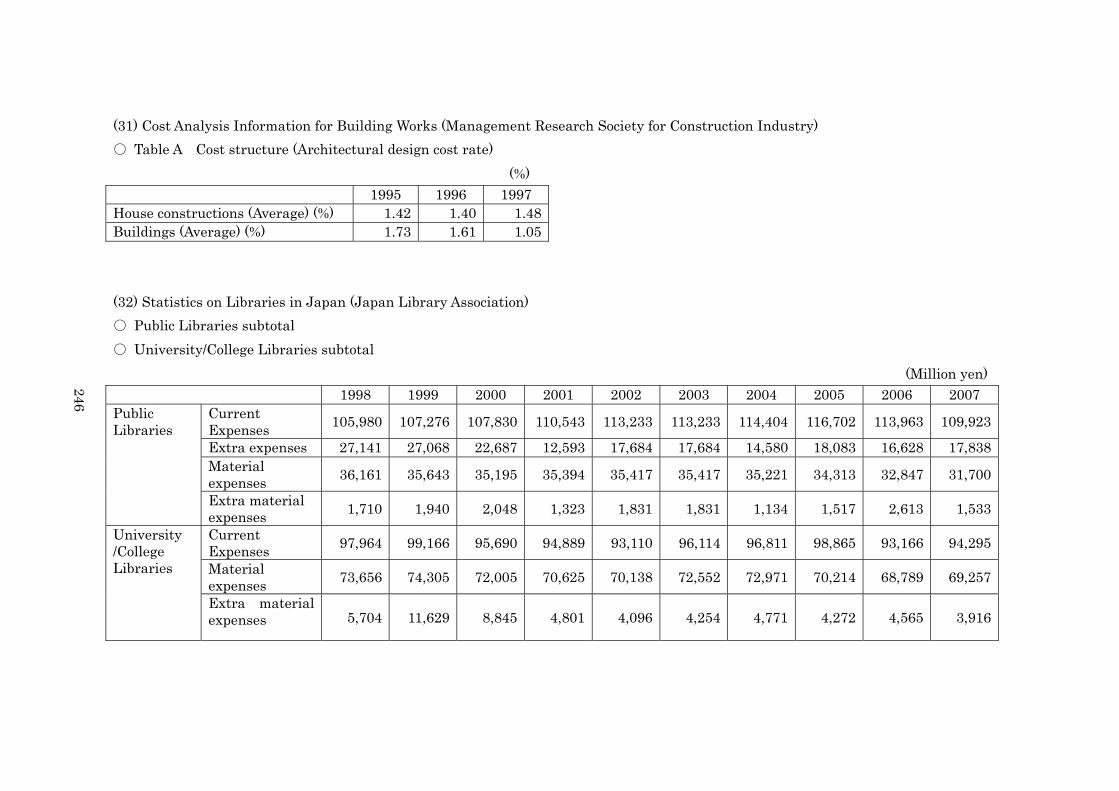
(31) Cost Analysis Information for Building Works (Management Research Society for Construction Industry) ○ Table A Cost structure (Architectural design cost rate)
(%) 1995 1996 1997 House constructions (Average) (%) 1.42 1.40 1.48Buildings (Average) (%) 1.73 1.61 1.05 (32) Statistics on Libraries in Japan (Japan Library Association) ○ Public Libraries subtotal ○ University/College Libraries subtotal
(Million yen) 1998 1999 2000 2001 2002 2003 2004 2005 2006 2007
Current Expenses 105,980 107,276 107,830 110,543 113,233 113,233 114,404 116,702 113,963 109,923
Extra expenses 27,141 27,068 22,687 12,593 17,684 17,684 14,580 18,083 16,628 17,838 Material expenses 36,161 35,643 35,195 35,394 35,417 35,417 35,221 34,313 32,847 31,700
Public Libraries
Extra material expenses 1,710 1,940 2,048 1,323 1,831 1,831 1,134 1,517 2,613 1,533
Current Expenses 97,964 99,166 95,690 94,889 93,110 96,114 96,811 98,865 93,166 94,295
Material expenses 73,656 74,305 72,005 70,625 70,138 72,552 72,971 70,214 68,789 69,257
University /College Libraries
Extra material expenses 5,704 11,629 8,845 4,801 4,096 4,254 4,771 4,272 4,565 3,916
246

○ Number of Staff in Public Libraries ○ Number of Staff in University/College Libraries
(persons) 1998 1999 2000 2001 2002 2003 2004 2005 2006 2007
full-time 15,535 15,454 15,276 15,347 15,284 14,932 14,664 14,302 14,070 13,573Public Libraries part-time 1,156 1,206 1,277 1,258 1,260 1,367 1,344 1,339 1,408 1,335
full-time 8,867 8,675 8,403 8,060 7,809 7,468 7,132 6,841 6,438 6,209University /College Libraries
part-time 1,470 1,481 1,489 1,510 1,483 1,389 1,418 1,481 1,473 1,508
(33) Museum White Paper (Fiscal 2004) (Japan Association of Museums) ○ Total Income 247 (Million yen) 2004 Average of Total Income 138Number of museum 408 ○ Number of Staff
(persons) 2004 Number of museum 404Average Number of Staff 8.7
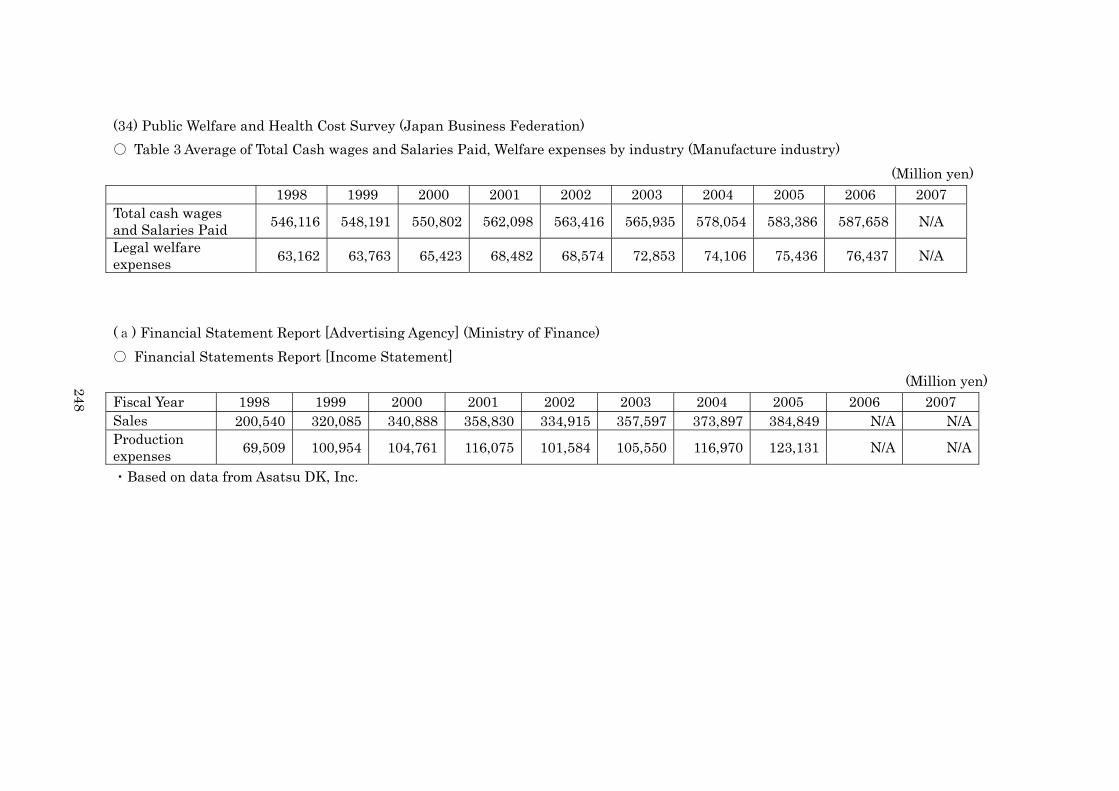
(34) Public Welfare and Health Cost Survey (Japan Business Federation) ○ Table 3 Average of Total Cash wages and Salaries Paid, Welfare expenses by industry (Manufacture industry)
(Million yen) 1998 1999 2000 2001 2002 2003 2004 2005 2006 2007 Total cash wages and Salaries Paid 546,116 548,191 550,802 562,098 563,416 565,935 578,054 583,386 587,658 N/A
Legal welfare expenses 63,162 63,763 65,423 68,482 68,574 72,853 74,106 75,436 76,437 N/A
(a) Financial Statement Report [Advertising Agency] (Ministry of Finance) ○ Financial Statements Report [Income Statement]
(Million yen) 248 Fiscal Year 1998 1999 2000 2001 2002 2003 2004 2005 2006 2007 Sales 200,540 320,085 340,888 358,830 334,915 357,597 373,897 384,849 N/A N/AProduction expenses 69,509 100,954 104,761 116,075 101,584 105,550 116,970 123,131 N/A N/A
・Based on data from Asatsu DK, Inc.
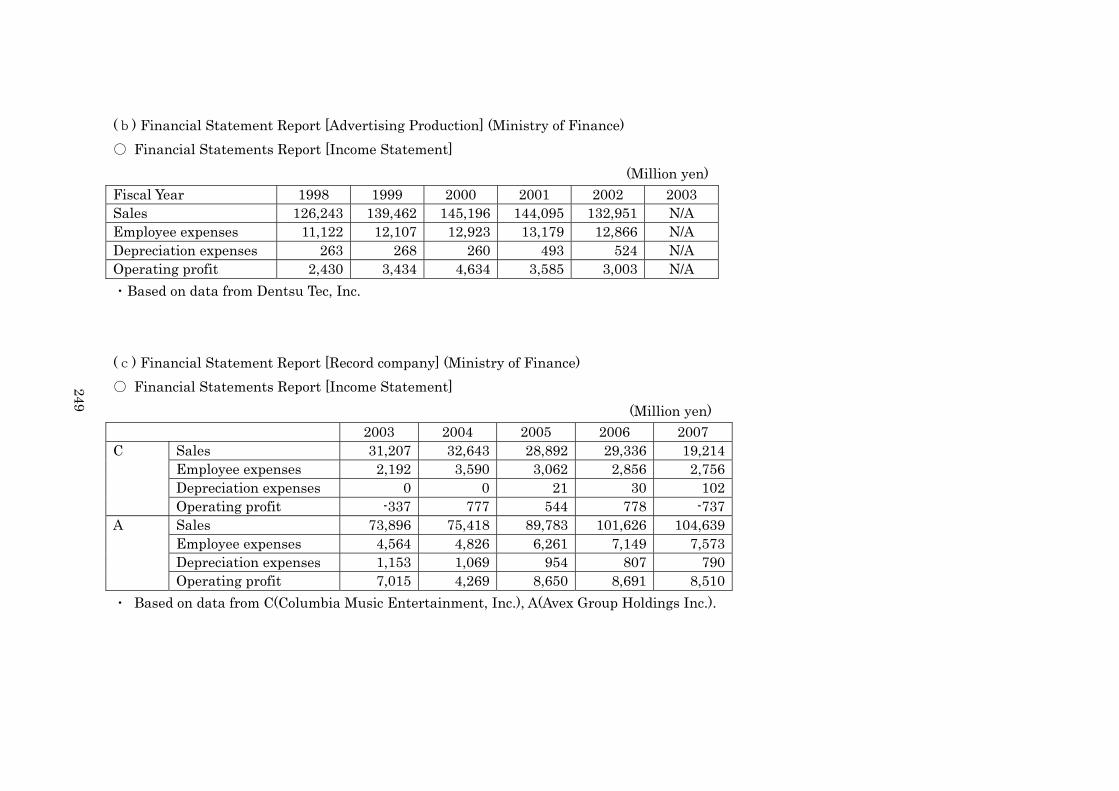
(b) Financial Statement Report [Advertising Production] (Ministry of Finance) ○ Financial Statements Report [Income Statement]
(Million yen) Fiscal Year 1998 1999 2000 2001 2002 2003 Sales 126,243 139,462 145,196 144,095 132,951 N/A Employee expenses 11,122 12,107 12,923 13,179 12,866 N/A Depreciation expenses 263 268 260 493 524 N/A Operating profit 2,430 3,434 4,634 3,585 3,003 N/A ・Based on data from Dentsu Tec, Inc. (c) Financial Statement Report [Record company] (Ministry of Finance) ○ Financial Statements Report [Income Statement] 249
(Million yen) 2003 2004 2005 2006 2007 C Sales 31,207 32,643 28,892 29,336 19,214 Employee expenses 2,192 3,590 3,062 2,856 2,756 Depreciation expenses 0 0 21 30 102 Operating profit -337 777 544 778 -737A Sales 73,896 75,418 89,783 101,626 104,639 Employee expenses 4,564 4,826 6,261 7,149 7,573 Depreciation expenses 1,153 1,069 954 807 790 Operating profit 7,015 4,269 8,650 8,691 8,510・ Based on data from C(Columbia Music Entertainment, Inc.), A(Avex Group Holdings Inc.).
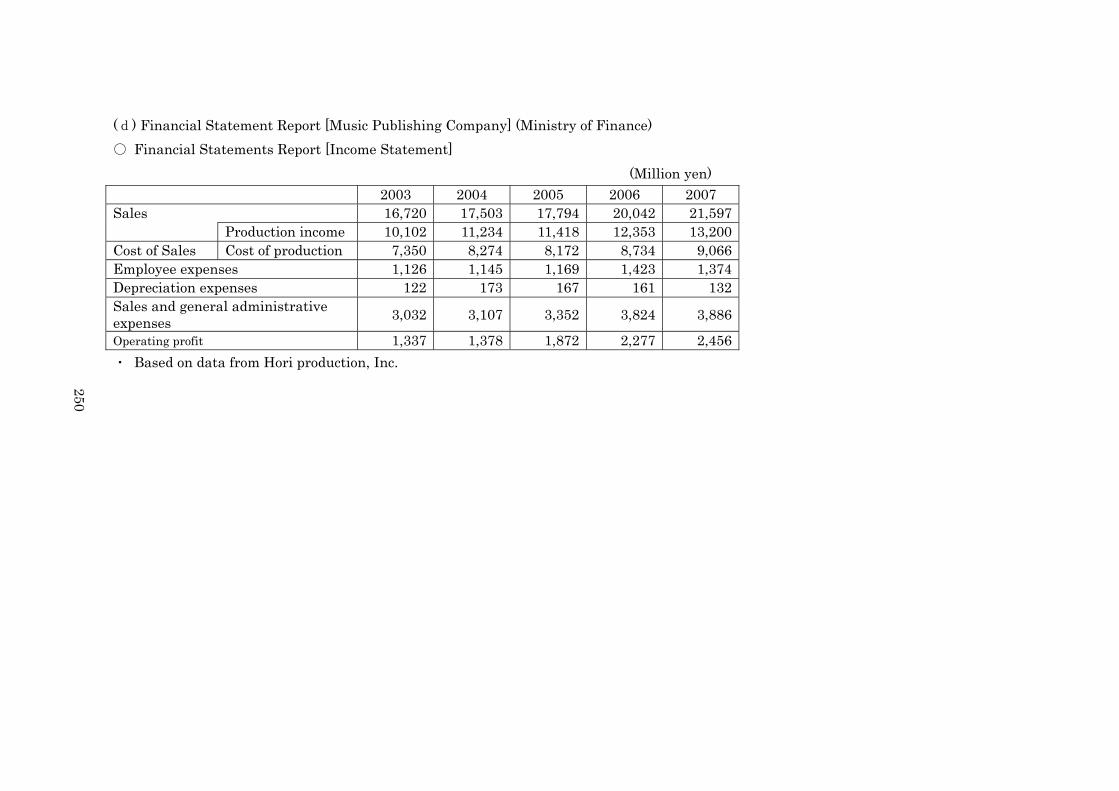
(d) Financial Statement Report [Music Publishing Company] (Ministry of Finance) ○ Financial Statements Report [Income Statement]
(Million yen) 2003 2004 2005 2006 2007 Sales 16,720 17,503 17,794 20,042 21,597 Production income 10,102 11,234 11,418 12,353 13,200Cost of Sales Cost of production 7,350 8,274 8,172 8,734 9,066Employee expenses 1,126 1,145 1,169 1,423 1,374Depreciation expenses 122 173 167 161 132Sales and general administrative expenses 3,032 3,107 3,352 3,824 3,886
Operating profit 1,337 1,378 1,872 2,277 2,456・ Based on data from Hori production, Inc. 250
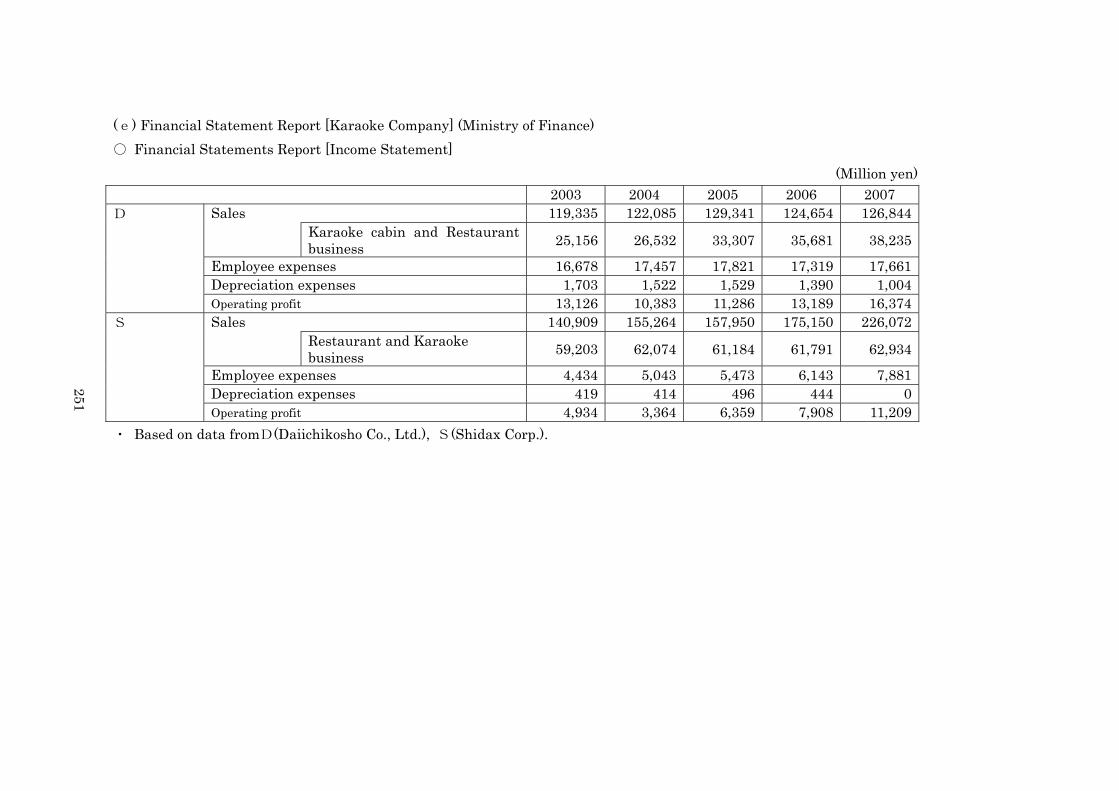
(e) Financial Statement Report [Karaoke Company] (Ministry of Finance) ○ Financial Statements Report [Income Statement]
(Million yen) 2003 2004 2005 2006 2007 D Sales 119,335 122,085 129,341 124,654 126,844 Karaoke cabin and Restaurant
business 25,156 26,532 33,307 35,681 38,235
Employee expenses 16,678 17,457 17,821 17,319 17,661 Depreciation expenses 1,703 1,522 1,529 1,390 1,004 Operating profit 13,126 10,383 11,286 13,189 16,374S Sales 140,909 155,264 157,950 175,150 226,072 Restaurant and Karaoke
business 59,203 62,074 61,184 61,791 62,934
Employee expenses 4,434 5,043 5,473 6,143 7,881 Depreciation expenses 419 414 496 444 0 Operating profit 4,934 3,364 6,359 7,908 11,209
251
・ Based on data fromD(Daiichikosho Co., Ltd.), S(Shidax Corp.).
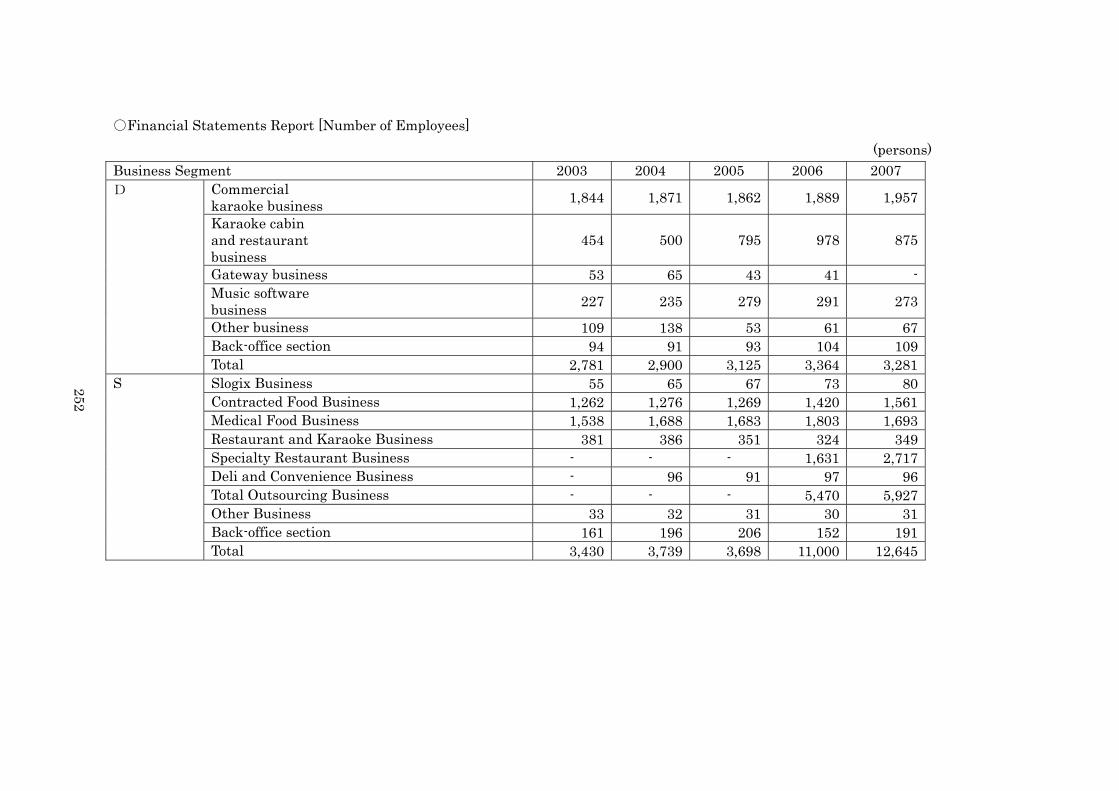
○Financial Statements Report [Number of Employees] (persons)
Business Segment 2003 2004 2005 2006 2007 D Commercial
karaoke business 1,844 1,871 1,862 1,889 1,957
Karaoke cabin and restaurant business
454 500 795 978 875
Gateway business 53 65 43 41 - Music software
business 227 235 279 291 273
Other business 109 138 53 61 67 Back-office section 94 91 93 104 109 Total 2,781 2,900 3,125 3,364 3,281S Slogix Business 55 65 67 73 80 Contracted Food Business 1,262 1,276 1,269 1,420 1,561 Medical Food Business 1,538 1,688 1,683 1,803 1,693 Restaurant and Karaoke Business 381 386 351 324 349 Specialty Restaurant Business - - - 1,631 2,717 Deli and Convenience Business - 96 91 97 96 Total Outsourcing Business - - - 5,470 5,927 Other Business 33 32 31 30 31 Back-office section 161 196 206 152 191 Total 3,430 3,739 3,698 11,000 12,645
252

(f) Financial Statement Report [Mobile phone Company] (Ministry of Finance) ○Financial Statements Report [Number of Employees]
(persons) Fiscal Year 1998 1999 2000 2001 2002 2003 2004 2005 2006 2007 NTT Docomo 4,450 15,100 18,015 19,700 20,792 21,241 21,527 21,646 21,591 22,100 KDDI 2,990 7,361 14,303 13,575 13,341 13,128 12,373 14,021 14,358 15,865 Softbank 3,078 4,132 7,076 7,593 6,973 3,285 2,582 2,728 3,842 5,112 Eaccess N/A N/A N/A N/A N/A N/A N/A N/A N/A N/A WILLCOM N/A N/A N/A N/A N/A N/A 875 945 997 1,038 (g) Statement of net assets (Representative company) ○「Statement of net assets」 253 (Yen) 2007 Sales 14,853,603,876Current expense 14,849,153,876Employee expenses 1,133,065,169 Salaries, bonus 861,155,150 Temporary salaries 44,635,935 Provision for retirement payment
for directors 36,718,334
Provision for retirement payment 112,128,380 Bonus payment reserve 78,427,370Depreciation expenses 5,451,817・Based on data from JASRAC.
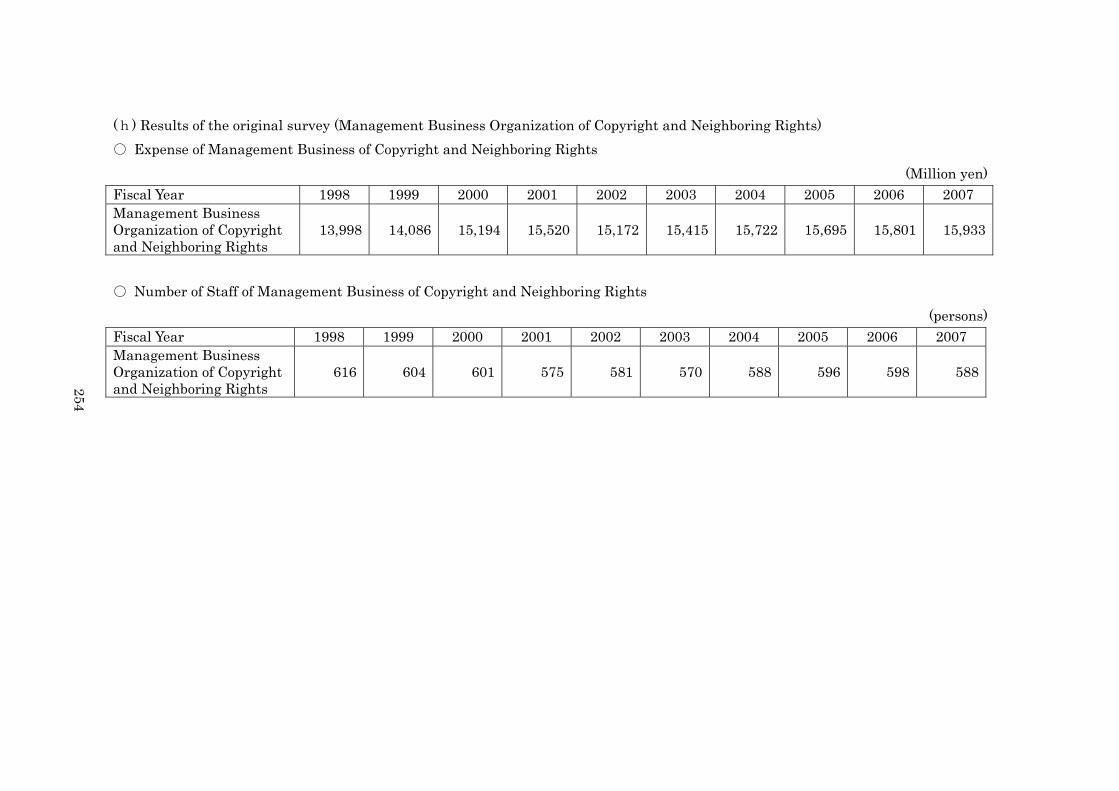
(h) Results of the original survey (Management Business Organization of Copyright and Neighboring Rights) ○ Expense of Management Business of Copyright and Neighboring Rights
(Million yen) Fiscal Year 1998 1999 2000 2001 2002 2003 2004 2005 2006 2007 Management Business Organization of Copyright and Neighboring Rights
13,998 14,086 15,194 15,520 15,172 15,415 15,722 15,695 15,801 15,933
○ Number of Staff of Management Business of Copyright and Neighboring Rights
(persons) Fiscal Year 1998 1999 2000 2001 2002 2003 2004 2005 2006 2007 Management Business Organization of Copyright and Neighboring Rights
616 604 601 575 581 570 588 596 598 588
254
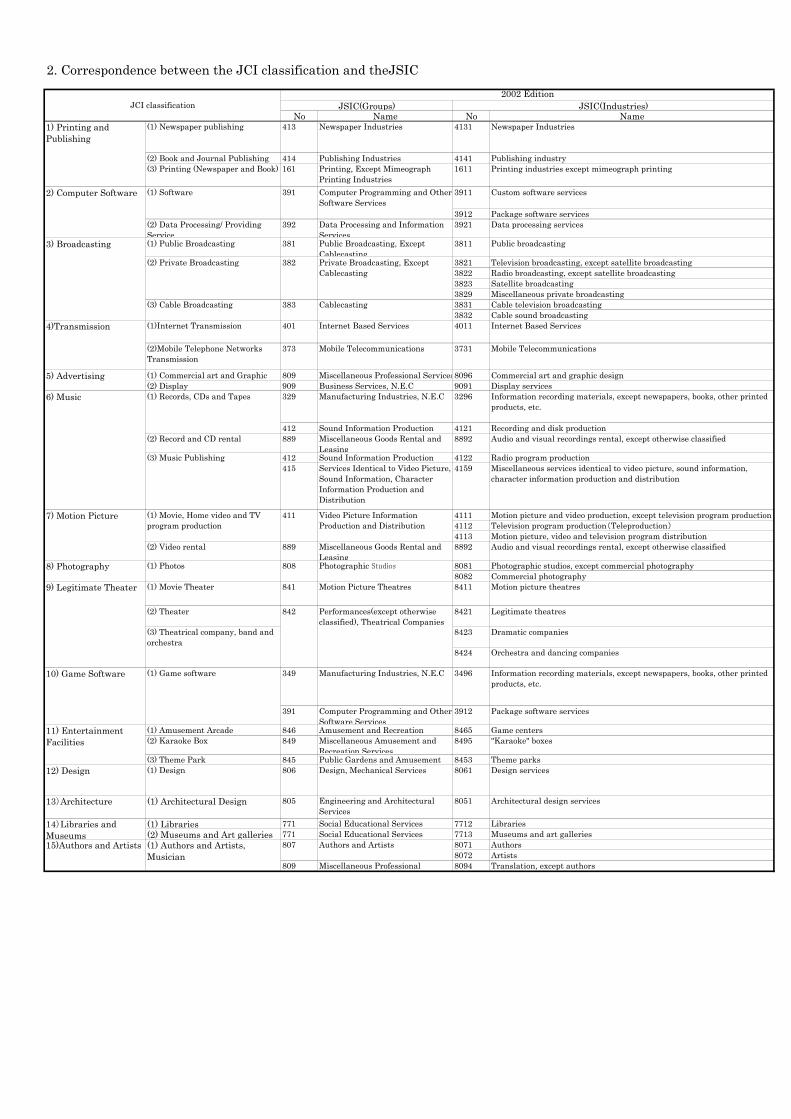
2. Correspondence between the JCI classification and theJSIC
No Name No Name
(2) Book and Journal Publishing 414 Publishing Industries 4141 Publishing industry(3) Printing (Newspaper and Book) 161 Printing, Except Mimeograph
Printing Industries1611 Printing industries except mimeograph printing
3911 Custom software services
3912 Package software services(2) Data Processing/ ProvidingService
392 Data Processing and InformationServices
3921 Data processing services
(1) Public Broadcasting 381 Public Broadcasting, ExceptCablecasting
3811 Public broadcasting
3821 Television broadcasting, except satellite broadcasting3822 Radio broadcasting, except satellite broadcasting3823 Satellite broadcasting3829 Miscellaneous private broadcasting3831 Cable television broadcasting3832 Cable sound broadcasting
(1)Internet Transmission 401 Internet Based Services 4011 Internet Based Services
(2)Mobile Telephone NetworksTransmission
373 Mobile Telecommunications 3731 Mobile Telecommunications
(1) Commercial art and Graphic 809 Miscellaneous Professional Services8096 Commercial art and graphic design(2) Display 909 Business Services, N.E.C 9091 Display services
329 Manufacturing Industries, N.E.C 3296 Information recording materials, except newspapers, books, other printedproducts, etc.
412 Sound Information Production 4121 Recording and disk production(2) Record and CD rental 889 Miscellaneous Goods Rental and
Leasing8892 Audio and visual recordings rental, except otherwise classified
412 Sound Information Production 4122 Radio program production415 Services Identical to Video Picture,
Sound Information, CharacterInformation Production andDistribution
4159 Miscellaneous services identical to video picture, sound information,character information production and distribution
4111 Motion picture and video production, except television program production4112 Television program production(Teleproduction)4113 Motion picture, video and television program distribution
(2) Video rental 889 Miscellaneous Goods Rental andLeasing
8892 Audio and visual recordings rental, except otherwise classified
8081 Photographic studios, except commercial photography8082 Commercial photography
(1) Movie Theater 841 Motion Picture Theatres 8411 Motion picture theatres
(2) Theater 8421 Legitimate theatres
8423 Dramatic companies
8424 Orchestra and dancing companies
349 Manufacturing Industries, N.E.C 3496 Information recording materials, except newspapers, books, other printedproducts, etc.
391 Computer Programming and OtherSoftware Services
3912 Package software services
(1) Amusement Arcade 846 Amusement and Recreation 8465 Game centers(2) Karaoke Box 849 Miscellaneous Amusement and
Recreation Services8495 "Karaoke" boxes
(3) Theme Park 845 Public Gardens and Amusement 8453 Theme parks12) Design (1) Design 806 Design, Mechanical Services 8061 Design services
13)Architecture (1) Architectural Design 805 Engineering and ArchitecturalServices
8051 Architectural design services
(1) Libraries 771 Social Educational Services 7712 Libraries(2) Museums and Art galleries 771 Social Educational Services 7713 Museums and art galleries
8071 Authors8072 Artists
809 Miscellaneous Professional 8094 Translation, except authors
JCI classification2002 Edition
(1) Authors and Artists,Musician
15)Authors and Artists
11) EntertainmentFacilities
7) Motion Picture
9) Legitimate Theater
14)Libraries andMuseums
(1) Movie, Home video and TVprogram production
(3) Theatrical company, band andorchestra
10) Game Software (1) Game software
(2) Private Broadcasting
8) Photography (1) Photos 808 Photographic Studios
(3) Cable Broadcasting
JSIC(Groups) JSIC(Industries)
(1) Software
6) Music
3) Broadcasting
5) Advertising
(1) Records, CDs and Tapes
(3) Music Publishing
Computer Programming and OtherSoftware Services
(1) Newspaper publishing1) Printing andPublishing
2) Computer Software
807 Authors and Artists
411 Video Picture InformationProduction and Distribution
382 Private Broadcasting, ExceptCablecasting
383
4)Transmission
842 Performances(except otherwiseclassified), Theatrical Companies
4131 Newspaper Industries
Cablecasting
413 Newspaper Industries
391
- JCI Series No.19-
Copyright White Paper - A view from the perspective of copyright industries (Vol.3)-
published by COPYRIGHT RESEARCH AND INFORMATION CENTER(CRIC) Tokyo Opera City Tower 3-20-2 Nishi-Shinjuku Shinjuku-ku Tokyo 163-1411 JAPAN TEL. +81-3-5353-6921 FAX. +81-3-5353-6920 E-mail. [email protected] URL. http://www.cric.or.jp
©COPYRIGHT RESEARCH AND INFORMATION CENTER 2009
The survey regarding the white paper was conducted by SARVH financial support on the purpose of diffusion of copyright system.