copyright is owned by the author of the thesis. permission ... · foundation, dr. rod dishman,...
TRANSCRIPT

Copyright is owned by the Author of the thesis. Permission is given for a copy to be downloaded by an individual for the purpose of research and private study only. The thesis may not be reproduced elsewhere without the permission of the Author.
An examination of Hellison’s (2003) Teaching Personal and Social
Responsibility model, its validity and effectiveness for primary
school aged children in New Zealand.
A thesis in partial fulfilment of the requirements for the degree of
Doctor of Philosophy
in
Psychology
At Massey University, Albany,
New Zealand.
Michael Hayes Smith
2014

COPYRIGHT NOTICE
Copyright resides with the author, and is governed by the Copyright Act1994.
No permission, or provision, is given in any manner for the sharing, copying,
or transmitting of this document either in part or in its entirety.

ii
Abstract
The Hellison (2003) model was developed with a goal to enable any participant in its
application to develop their personal and social responsibility. The literature
demonstrates that the model has been typically made available for youth, as an
after-school programme option, in which participation is voluntary.
This thesis examined a longitudinal intervention over one scholastic year of an
application of Hellison’s (2003) model as part of the curriculum in a New Zealand
primary school. Within the model, the five levels of personal and social responsibility,
1) Respect, 2) Participation, 3) Self-direction, 4) Caring, and 5) Outside the training
venue, are already translated into five operationalised goals; 1) Self-control and
respect, 2) Self-motivation, 3) On-task independence, 4) Sensitivity and
responsiveness, and 5) Trying these ideas in other areas of life. The intervention, a
forty week training programme using a ten lesson plan format, repeated four times,
utilised the goal structure of the model to formulate the individual lesson plans. The
lesson plans, to convey the five social goals of the model in accordance with
Hellison’s (2003) guidelines, included a karate skill set as the physical activity
component of the training sessions. Two cohorts were recruited into the study, from
two scholastically equivalent schools, one to receive the intervention (n = 36), and
one to act as control (n = 49). The control group completed the measures only and
did not receive the intervention.
Each goal of the model was empirically assessed to determine change over time
whilst participating in the current application of the model. A time series empirical
approach was used and psychometrically reliable and valid instruments were

iii
administered at six equal-distant intervals. At each of the six intervals, four self-
reporting measures were completed by the child participants. Rosenberg’s Self-
Efficacy Scale (S-ES), Dishman’s Self-Motivation Inventory for Children (SMI-C9),
Muris’s Self-Efficacy Questionnaire for Children (SEQ-C), and Caprara and
Pastorelli’s Prosocial Behavior Scale. A separate measure, Polit’s Positive Behavior
Scale, was completed each by the participant’s parent, and the participant’s class
teacher, at each of the six intervals.
Statistical analysis using regression model fitting on the data obtained from the
empirical measures demonstrated that scores increased for the intervention
participants on each measure over the course of the current study. A linear model
was evident from the analysis. Multivariate repeated analysis of the four child self-
reporting measures demonstrated that the mean positive change, on goals 1 - 4, was
greatest for the intervention group. Equality of means analysis also confirmed that
the intervention group had the highest level of improvement in positive behaviour, as
reported by the parents and teachers, on goal 5.
Secondary analysis using Guttman (1947, 1950) scaling enabled a detailed
examination of the model’s stage-like progression premise. The intention of the
analysis was to determine if any participant could progress through the five stages,
each in succession, as the model posits that they should. Scalograms were
constructed at each of the six intervals to produce a Coefficient of Reproducibility,
one each for the intervention and control groups. From the twelve coefficients, a
mean Coefficient of Reproducibility ≥ .90 was acceptable evidence of temporal
reliability of the scalograms in the current study.

iv
Guttman (1950) Scalogram Analysis demonstrated that a four-item scalogram, for
the child self-reporting measures, and a five-item quasi-scalogram, combining the
child self-reporting measures with a mean score of the parent and teacher measure,
was found in the current study. In a research first, the Teaching Personal and Social
Responsibility model was demonstrated to possess stage progression in its goal
structure.
Further, participants in the intervention group demonstrated that they progressed
along a single continuum, one stage after another, as the Hellison (2003) model
claimed. However, the goals in the current study developed in a differing order than
those proposed by the Hellison (2003) model. Specifically, the stage sequence
discovered was firstly goal 2) Self-motivation, followed by goal 3) On-task
independence, before goal 1) Self-control and respect, which was third. Goal 4)
Sensitivity and responsiveness, and 5) Trying these ideas in other areas of life,
emerged in the sequence as the model predicted. A repeated, between groups,
analysis demonstrated that a significant difference between the intervention group
and control group existed from sixteen weeks and beyond.
The findings from the current study make a significant contribution to the literature. A
detailed, empirical protocol, a research first of its type, was demonstrated to be
reliable for the assessment of participant development whilst engaged in an
application of the model. A revised Hellison (2003) model was valid, and effective,
for the intervention participants as the model posits. A wider application of the
Hellison model is warranted and continued research is recommended. A replication
of the current study, as well as research of a school-wide application, of the revised
Hellison (2003) model is suggested.

v
Acknowledgements
Firstly, I would like to thank the research participants that took part in this study.
Conducting research centred on children is a sensitive undertaking. Without the
participation of the two schools, their principals, teachers, support staff and most
particularly, the students themselves, this study would not have been possible. Also
to the parents of the students, a particular mention here. Without the unequivocal
support from the parents of the students, equally this study could not have been
conducted. In being allowed the privilege of delivering this study, I was solemnly
aware that I was equally responsible for their pride and joy whilst participating,
namely their children. In many respects, a collaborated effort was achieved, for
which my mere thanks seem insufficient. To each of them however, your efforts
sincerely appreciated, thank you.
I would like to acknowledge my supervision team who have diligently watched over
my career through this study, it has been a long and challenging process. Thank you
to Dr. Richard Fletcher for his ongoing commitment to my efforts, particularly in his
guidance in establishing this study and keeping it focused at each step along the
way. Thank you to Professor Stuart Carr whom reawakened not only my passion for
learning, but most importantly reminding me the benefits of remaining objective, to
‘hold everything up to the light’. To each of them both, your scholarly direction and
professional expertise provided, I shall remain forever grateful. I also make a special
mention to the Office of the Assistant Vice Chancellor (Māori and Pasifika), Massey
University, for the Pūrehuroa Awards for which I was a most grateful recipient.

vi
I would like to express my gratitude to Professor Don Hellison for his Teaching
Personal and Social Responsibility model. I also like to thank him, Dr. Paul Wright,
and Dr. David Walsh for their initial correspondence and encouragement when I was
first formulating ideas about this project. I am also grateful to the Morris Rosenberg
Foundation, Dr. Rod Dishman, Professor Peter Muris, Professor Gian Vittorio
Caprara, and Dr. Sylvia Epps for their permissions for the use of their respective
measures in the current study. From all of these sources that enabled my research,
without which I could not have undertaken this work, my thanks to you all.
Last but certainly not least, I must thank my family who have provided their support
and assistance over these years of my career. To my mother Kaye, my eternal
gratitude, who has lived alongside this study, every step of the way. To my father
David, a retired police officer who sadly passed away during this time, thank you
most especially for all the esoteric discussions that influenced my thinking around
child welfare and crime prevention. It will be my hope that I continue to be the person
they have always hoped me to be. I also take this opportunity to thank the many
friends and extended family who have given their ongoing understanding and
support, despite my prolonged absence from their lives. Finally to Katie, if ever any
one individual has invested so much for so little, I look forward to now being able to
return her kindness, love, and support.

vii
Table of Contents
Abstract ii
Acknowledgements vi
Table of Contents viii
List of Tables xv
List of Figures xviii
Chapter One:
Thesis Question and Critical Literature Review 1
Thesis Question 1
‘How’ does the model predict that a child will become progressively more
personally and socially responsible? 2
Details of the five levels in the model 4
From levels to goals 5
Context and the Teaching Personal and Social Responsibility model 11
Country 11
Socioeconomic 11
Beyond sport 13
Beyond school 15
Age 15

viii
The evolution of physical education, and an opportunity for the current study 16
Research evidence on the Hellison (2003) model 17
Steps versus Curves: A theoretical reappraisal of the Hellison (2003) model 25
A role for stage change and the development of personal and
social responsibility 28
An argument for maturational change and the development of personal and
social responsibility 32
An acid test for choosing between Figures 1, 2, and 3. 33
Summary 35
Hypotheses 36
Chapter Two:
Methodology 37
Participants and environment 37
Recruitment 39
Procedure 40
The Lesson Plan 41

ix
Activities as the basis of the Lesson Plan 43
Matching the Lesson Plan to the Teaching Personal and
Social Responsibility model 47
Overview of a typical lesson in the current study 49
The final activity session of the current study 52
Measures used in the current study 53
Rosenberg's Self-Esteem Scale (S-ES) 54
Dishman's Self-Motivation Inventory for Children (SMI-C9) 55
Muris's Self-Efficacy Questionnaire for Children (SEQ-C) 57
Caprara’s Prosocial Behaviour Scale (PBS) 59
Positive Behavior Scale (Parent and Teacher versions) 61
Data collection and administration 63
Study timelines 65
Data analysis and rational 67
Statistical measurement of individual change over time 68

x
Statistical measurement of group change over time 71
The application of Guttman scaling in the current study 72
Chapter Three:
Preliminary Results 73
Reliability analysis 74
Determination of Variance in the data 78
Assessing the variance in the child measures 78
Results from the control group on the child measures 80
Results from the intervention group on the child measures 81
Overview of the child measures 88
Assessing the variance from the Positive Behavior Scale –
parent and teacher measure 90
Assessment of the Positive Behavior Scale by teachers (PBS (T)) 91
Results from the control group on the teachers measure 91
Results from the intervention group on the teachers measure 92

xi
Assessment of the Positive Behavior Scale by parents (PBS (P)) 93
Results from the control group on the parents measure 93
Results from the intervention group on the parents measure 94
Variety of trajectories in the Positive Behavior Scale 95
Overview of the Positive Behavior Scale - parent and teacher measure 102
Comparisons between the teacher and parent results 106
Preliminary correlation analysis of all measures in the current study 108
Chapter Four:
Statistical analysis: Child, parent and teacher measures 115
Multivariate repeated measures (child measures) 115
Independent t-tests (parent and teacher measure) 123
Chapter Five:
Guttman Scalograms: Construction and Analysis 126
Was there a scalogram? 126
Did the participants in the Intervention group, but not in the Control,
climb up the scalogram over time? 136

xii
Conclusions 142
Chapter Six:
Discussion 143
Revisiting the Hypotheses 144
Theoretical implications from the hypotheses 146
Practical implications from the hypotheses 149
Contribution to Research 152
The choice of medium in the application of the model 153
Empirical assessment of the model 154
Timeframes for change over time 156
Empirical measurement of the model 158
Scalogram utilisation to examine stage progression properties
of the model 163
Generalisation of the model in the current study 165
Limitations of the current study 167

xiii
Future Directions 169
Conclusion 170
References 173
Appendices 181
Appendix A: Teacher Information Sheet
Appendix B: Teacher Consent Form
Appendix C: Child Participant Information Sheet
Appendix D: Child Participant Consent
Appendix E: Parent Participant Information Sheet
Appendix F: Parent Participant Consent
Appendix G: Teacher Confidentiality Agreement
Appendix H: Karate Authorisation
Appendix I: Session Plans
Appendix J: Individual fitted OLS trajectories
Appendix K: OLS Regressions
Appendix L: Scalograms

xiv
List of Tables
Table 1: Hellison’s Teaching Personal and Social Responsibility levels as Goals.
Table 2: Summarised research conducted on the Teaching Personal and Social
Responsibility (2003) model.
Table 3: Demographic characteristics of participants.
Table 4: Mapping the lesson plan to the goals of the Hellison (2003) model.
Table 5: Measures used to assess the constructs of the responsibility goals.
Table 6: Testing protocol.
Table 7: Timelines of the current study:
Intervention and test administration timeline. Session plan timeline.
Table 8: Means and Standard Deviations (SD) for all child self-reporting measures
(including subscales) for control and intervention groups.
Table 9: Means and Standard Deviations (SD) for the Positive Behavior Scale
(teachers(T) and parents(P) by subscale) for control and intervention
groups.
Table 10: Reliability analysis of all measures (including subscales) calculated with
Cronbach’s alpha.
Table 11: Control correlations for the Positive Behavior Scale between teachers and
parents (Initial Estimates and Rates of Change).

xv
Table 12: Control correlations between child self-reporting measures
(Initial Estimates and Rates of Change).
Table 13: Intervention correlations for the Positive Behavior Scale between parents
and teachers (Initial Estimates and Rates of Change).
Table 14: Intervention correlations between child self-reporting measures
(Initial Estimates and Rates of Change).
Table 15: Multivariate tests using Pillai’s Trace.
Table 16: Estimated marginal means by Group.
Table 17: Estimated marginal means by Time.
Table 18: Mean change difference between Time points.
Table 19: Coefficients of Reproducibility for all measures – control (n=49) and
intervention groups (n=36).
Table 20: Between groups comparison, rates of progress at all time points,
goals 1 - 4.
Table 21: Between groups comparison, rates of progress at all time points,
goals 1 - 5.
Table 22: Control results from exploratory OLS regression models for the PBS,
SMI-C9, and S-ES measures.
Table 23: Control results from exploratory OLS regression models for the SEQ-C
subscales.
Table 24: Control results from exploratory OLS regression models for the PBS(T)
subscales.
xvi
Table 25: Control results from exploratory OLS regression models for the PBS(P)
subscales.
Table 26: Intervention results from exploratory OLS regression models for PBS,
SMI-C9, and S-ES measures.
Table 27: Intervention results from exploratory OLS regression models for the
SEQ-C subscales.
Table 28: Intervention results from exploratory OLS regression models for the
PBS(T) subscales.
Table 29: Intervention results from exploratory OLS regression models for the
PBS(P) subscales.

xvii
List of Figures
Figure 1: A model of ‘How’ Hellison’s model should work.
Figure 2: A schemata of independently developing personal and social responsibility
skills of varying difficulty.
Figure 3: A schemata of concurrently developing personal and social responsibility
skills of equal difficulty.
Figure 4: An exemplar of the lesson plan for Respect.
Figure 5: Control OLS trajectories for the S-ES measure.
Figure 6: Intervention OLS trajectories for the S-ES measure.
Figure 7: Control OLS trajectories for the SMI-C9 measure.
Figure 8: Intervention OLS trajectories for the SMI-C9 measure.
Figure 9: Control OLS trajectories for the SEQ-C (A subscale) measure.
Figure 10: Intervention OLS trajectories for the SEQ-C (A subscale) measure.
Figure 11: Control OLS trajectories for the SEQ-C (S subscale) measure.
Figure 12: Intervention OLS trajectories for the SEQ-C (S subscale) measure.
Figure 13: Control OLS trajectories for the SEQ-C (E subscale) measure.
Figure 14: Intervention OLS trajectories for the SEQ-C (E subscale) measure.
Figure 15: Control OLS trajectories for the PBS measure.
Figure 16: Intervention OLS trajectories for the PBS measure.
Figure 17: Standardised OLS mean trajectories by measure - Control group.
Figure 18: Standardised OLS mean trajectories by measure - Intervention Group.
xviii
Figure 19: Control OLS trajectories for the Positive Behavior Scale (T)
(subscale SC).
Figure 20: Intervention OLS trajectories for the Positive Behavior Scale (T)
(subscale SC).
Figure 21: Control OLS trajectories for the Positive Behavior Scale (T)
(subscale A).
Figure 22: Intervention OLS trajectories for the Positive Behavior Scale (T)
(subscale A).
Figure 23: Control OLS trajectories for the Positive Behavior Scale (T)
(subscale C).
Figure 24: Intervention OLS trajectories for the Positive Behavior Scale (T)
(subscale C).
Figure 25: Control OLS trajectories for the Positive Behavior Scale (P)
(subscale SC).
Figure 26: Intervention OLS trajectories for the Positive Behavior Scale (P)
(subscale SC).
Figure 27: Control OLS trajectories for the Positive Behavior Scale (P)
(subscale A).
Figure 28: Intervention OLS trajectories for the Positive Behavior Scale (P)
(subscale A).
Figure 29: Control OLS trajectories for the Positive Behavior Scale (P)
(subscale C).
Figure 30: Intervention OLS trajectories for the Positive Behavior Scale (P)
(subscale C).

xix
Figure 31: Teachers standardised OLS mean trajectories by subscale –
Control group.
Figure 32: Teachers standardised OLS mean trajectories by subscale –
Intervention group.
Figure 33: Parents standardised OLS mean trajectories by subscale –
Control group.
Figure 34: Parents standardised OLS mean trajectories by subscale –
Intervention group.
Figure 35: Estimated Marginal Means of self-esteem by group.
Figure 36: Estimated Marginal Means of self-motivation by group.
Figure 37: Estimated Marginal Means of self-efficacy by group.
Figure 38: Estimated Marginal Means of prosocial behaviour by group.
Figure 39: Group Statistics and Independent Samples Test for the Positive
Behaviour Scale (PBS) completed by teachers (T).
Figure 40: Group Statistics and Independent Samples Test for the Positive
Behaviour Scale (PBS) completed by parents (P).
Figure 41: Control scalograms: Child measures – Time 1 and Time 2.
Figure 42: Control scalograms: Child measures – Time 3 and Time 4.
Figure 43: Control scalograms: Child measures – Time 5 and Time 6.
Figure 44: Intervention scalograms: Child measures – Time 1 and Time 2.
Figure 45: Intervention scalograms: Child measures – Time 3 and Time 4.
xx
Figure 46: Intervention scalograms: Child measures – Time 5 and Time 6.
Figure 47: Control teacher / parent scalograms - Time 1 and Time 2.
Figure 48: Control teacher / parent scalograms - Time 3 and Time 4.
Figure 49: Control teacher / parent scalograms - Time 5 and Time 6.
Figure 50: Intervention teacher / parent scalograms - Time 1 and Time 2.
Figure 51: Intervention teacher / parent scalograms - Time 3 and Time 4.
Figure 52: Intervention teacher / parent scalograms - Time 5 and Time 6.
Figure 53: A representation of a perfect Guttman scale for the current study,
according to the Hellison (2003) model.
Figure 54: Rearranging the columns according to Guttman (1950) – Intervention
group at Time 1.
Figure 55: Counting errors (rearranging the rows according to Guttman (1950)) –
Intervention group at Time 1.
Figure 56: Mean scale scores as a function of time and treatment group –
Goals 1 - 4 only.
Figure 57: Quasi-scalogram by treatment group – Goals 1 - 5.

1
Chapter One
Thesis Question and Critical Literature Review
Thesis question
The study seeks to determine the validity and effectiveness of the Teaching Personal
and Social Responsibility model (Hellison, 2003) for primary school aged children in
New Zealand. The goal of the model is to enable any participant in its application to
develop their personal and social responsibility, through physical activity and social
interaction. Although the model is known and cited by many authors in school based
education and in physical activity research, there remains a shortage of empirical
evidence that either questions or supports its validity (Gould & Carson, 2008).
Being able to address the needs of the developing child, whilst meeting educational
expectations, is a multi-faceted task with ongoing challenges requiring proven tools
and resources to enable success. The Teaching Personal and Social Responsibility
model is Hellison’s (2003) attempt to provide one potential option for doing so. The
aim of this thesis is to examine the validity of the model empirically, in the context of
physical education within the primary school curriculum in New Zealand.
One focus of The New Zealand Curriculum’s (Ministry of Education, 2007)
“educational standards” is to provide children with the means and resources to
become a personally and socially responsible member of society, matching the goals
that Hellison’s (2003) Teaching Personal and Social Responsibility model sets out to
achieve. The New Zealand Curriculum (Ministry of Education, 2007) claims to

2
represent a progressive change from the traditional approaches to this area of
education for school aged children. Whilst maintaining traditional academic
achievement targets, the change includes the requirement for the development of
social skills and the desire for every student to become socially and personally
responsible. There thus remains a gap in the New Zealand Curriculum for a
programme to contribute to the Ministry of Education’s (2007) requirement for
personally and socially responsible students graduating from New Zealand
schooling.
An empirical investigation of the Hellison (2003) model in the New Zealand
educational setting is required for both theory and contemporary educational
practice. There are two questions asked by the current study a) is the model valid,
and if so, b) does participation in an application based on the model effectively elicit
a progressively more personally and socially responsible child over time, in the New
Zealand educational context, as the model predicts should happen?
‘How’ does the model predict that a child will become progressively more personally
and socially responsible?
The Teaching Personal and Social Responsibility model was initially structured
around exposing high school aged participants to physical activity and developing
their awareness of social interactions between each other. The proposed ‘levels’ of
responsibility stem from a physical activity lesson plan in which several conceptually
distinct social ‘levels’ are progressively taught to the participants during training
sessions. Hellison (2003) states that as participants pass through their continued
work and exposure to the model (for example, by applying the lessons learnt during

3
class time), their individual awareness of their ability to initiate personal
responsibility, and take on greater responsibility, should each increase over time.
Figure 1: A model of ‘How’ Hellison’s model should work.
Figure 1 is an illustration specifically constructed by the present author for the
current study, in order to graphically represent the ‘levels’ in Hellison’s (2003) model.
Theoretically, according to Hellison (2003), each ‘level’ of responsibility is a
precursor to the next step. Hence, the model should possess what Guttman (1947)
might refer to as scalability, or having a ‘ladder sequence’, with one rung having to
be progressed through before a participant can advance to the next step (in personal
then social responsibility). Figure 1 is representative of this theoretical sequence.
Over time, the five incremental ‘levels’ of personal and social responsibility build
upon each proceeding ‘level’. Thus, respect climbs from the model’s outset;

4
participation takes a little longer to commence; self-direction a little longer still, and
so on. In this way, if the model is valid, a set sequence of developmental stages
should be evident in any given application of the model.
Details of the five levels in the model
From Figure 1, Hellison (2003) set out five ‘levels’ of his model. From Hellison
(2003), briefly these are: (1) Respect. Participants at ‘level’ 1 of the model may
demonstrate minimal social responsibility in following societal rules, but no personal
responsibility (perhaps electing not to complete school homework, for example).
‘Level’ 1 of the model also acknowledges that whilst a participant can elect to not
take part in any activity, the participant respects the rights of others to do so, without
interference from them, for example. For Hellison (1983, 2003), the respect for
others and the self are expressions of social respect at ‘level’ 1 of the model.
(2) Participation. The children at ‘level’ 2 of the model are able to demonstrate
respect for their peers, others, and themselves. The children are also engaging with
the training lessons, but only under supervision from the facilitator. Components of
‘level’ 2 also include the children actively engaging, choosing to be involved, in the
assigned physical activities from the training sessions, and making personal effort.
(3) Self-direction. ‘Level’ 3 of the model recognises that participants are not only
respectful of themselves, but also of others. They also elect to take part in the
intervention, and are motivated to achieve the activity tasks set by the intervention as
well as exploring personal goals of interest to the participant. Participants working at
this ‘level’ are thus capable of making independent choices for personal goals, at

5
their own discretion, from the training sessions (making time to practice a physical
skill activity for example), and following it through.
(4) Caring. Performing at ‘level’ 4 of the model is illustrated when a participant elects
to help others when asked to do so. Actively co-operating with others, willingly
working with peers, and doing so without expectations of extrinsic rewards are
indications of a participant working at ‘level’ 4 of the model. A participant at this
‘level’ is also considered as operating at ‘Level’ 4 when making a positive
contribution during the training session, for example by leading a group activity such
as a stretch warm-up prior to physical activity.
(5) Outside the Training Venue. At the final ‘level’, ‘level’ 5, participants have
understood and put into practice the previous four ‘levels’ of the model. They are
applying what they have learned to other areas in their lives. To quote Hellison
(2003), “level 5 ultimately means being a role model for others” (p.36). Participants
can elect to extend their personal responsibility for their well-being and that of others
to the class room, sport team, and at home, for example.
From levels to goals
For the purposes of clarity in the current study, the Hellison (2003) model has five
sequential ‘levels’ of responsibility. The ‘levels’ of the model are latent, theoretical
constructs. Hellison translated them into operational, everyday behavioural terms, as
‘goals’ with one or more components that could be evaluated. The set of goals are a
‘learning progression’ where each goal is, in theory, progressed through in a stage-
like manner.

6
Hellison (2003) puts forward these ‘classroom goals’, displayed in Table 1. Put
simply, Hellison’s model contains five ‘levels’ of personal and social responsibility
(Figure 1). For each level of personal and social responsibility, Hellison has set a
goal to be ‘achieved’ before moving on to the next level of personal and social
responsibility (Table 1). The goal structure provided by the model also serves as a
guide for the construction of training sessions in the application of the model.
Table 1
Hellison’s Teaching Personal and Social Responsibility levels as Goals.
Level 1: Respect
Goal 1: Self-control and respect
Level 2: Participation
Goal 2: Self-motivation
Level 3: Self-direction
Goal 3: On-task independence
Level 4: Caring
Goal 4: Sensitivity and responsiveness
Level 5: Outside the Training Venue
Goal 5: Trying these ideas in other areas of life
According to Table 1, respect is outwardly evident whenever the participant respects
the rights and feelings of others. The first indication of progress here however, for

7
participants in the model, is a degree of participant Self-control. Self-control is
essential for respecting the rights and feelings of others, for example not controlling
their own behaviour or interfering with other students (Hellison, 2003). Participants at
goal one may not participate in any training session, or show much mastery or
improvement in set tasks from the training session, but they are in theory able to
control their behaviour sufficiently that they do not interfere with the other students'
right to learn, or the facilitator's right to deliver the model. Participants are also able
to achieve session tasks (for example, practicing a skill), without prompting by the
facilitator to stay on task, and without ongoing supervision from the facilitator.
The first goal in Table 1 (Self-control) acknowledges that all participants have the
right to be included in activities and that should any interpersonal disagreement
arise, then an amicable solution will be found between the participants, within the
safety of the training environment. In terms of respect, participants may start out with
little respect or value for others, or arguably themselves. At the other end of the
continuum, participants may develop self-respect fully. Hellison (2003) believes that
participants normally oscillate between these two extremes, gradually progressing
more towards a greater degree of respect for self and others. Hence, in multiple
ways, the first goal of Hellison’s (2003) model can be said to entail, in psychological
terms, self-control, self-respect, self-worth, and respect for others.
The next operational goal of Hellison’s, in Table 1, is Self-motivation (in the training
session). Self-motivation influences personal choices and aspirations, in terms of
wants and needs, and shapes goal-directed behaviour to the achievement of them
(Wentzel, 1991). In the model itself, participants are encouraged by the facilitator to
explore new activity tasks and potential challenges of the particular training session,

8
a karate technique never attempted before for example, as they are presented by the
facilitator. According to Hellison, it is here that participants may discover their first
challenges with the tasks assigned to them. For example, as new physical activities
are given, and coupled with a limited understanding of what it means to be
personally and socially responsible, the participants may find themselves wanting to
no longer be involved or simply feel overwhelmed.
To counter this issue for self-motivation, these participants are then initially actively
directed by the facilitator to seek out their personal courage to persist, to stay
focused on their assigned activities, and to continue to achieve the task at hand.
Participant self-motivation is the overreaching attribute required here. The
participants working through this goal, according to the model, not only show respect
but also willingly engage in the activities with others in the group, accepting the
various challenges that may arise. Having come to terms with the second goal in
Table 1, the participants supposedly, in theory, begin to engage in physical activities
independently of others. They begin to understand their role, working alongside and
in conjunction with others, whilst achieving their tasks successfully. In short,
participants progress through, from Table 1, the goal of Participation.
On-task independence of the participants is the next Hellison goal in Table 1.
Completing activity tasks without input from others entails the goal of On-task
independence. Participants at this level, theoretically, not only show respect and
involve themselves fully in the task at hand but they are also able to work, with other
participants, or on their own, without direct supervision. They can, supposedly,
identify their own needs and begin to plan and carry out their own aspirations and
actively contribute to the model both as individuals and as part of the learning

9
environment with others. In so doing, those operating at this third level have their first
exposure to goal setting achievement and a sense of independence.
It is here that the greatest potential deterrent to participant achievement in the model
is identified by Hellison, that being dealing successfully with peer expectations, such
as fulfilling the demands of others, rather than focusing on their own goals (Hellison,
2003). Hellison believes that it is essential for participants who are taking personal
responsibility for their own actions and making independent choices, to not rely on
others. In taking on a greater degree of personal responsibility, participants are also
becoming socially aware of, and sensitive to, others and that they also have personal
goals to accomplish. Being able to put into practice these two aspects, namely
resisting peer pressure and respecting others, are what is required to achieve the
third goal of the model outlined in Table 1 (On-task independence).
The fourth goal from Hellison in Table 1 is leadership roles and helping others. The
goal here is teaching and learning Sensitivity and responsiveness in the group
setting. It includes working towards the helping of others when asked. Caring and
compassion are viewed by Hellison (2003) as being core attributes of the
participants for the fourth goal. Individual self-control occurs before outwardly
focused caring for others. For this fourth goal in the model, participants are already
self-directed and goal orientated but now are motivated to extend their sense of
responsibility beyond themselves, by cooperating with, and leading, those around
them. By giving support when asked to do so by others, showing concern when
appropriate, and helping in any way that may be required, participants are able to
achieve the fourth goal from Table 1.

10
Working independently from one another, and from the facilitator, allows the
participants to freely apply themselves to the task at hand. Participants should also
be able to engage with other participants, work together if they choose, and to assist
one another in working with Sensitivity and responsiveness (Table 1) through the
physical activity that has been assigned. For example, in accomplishing a physical
activity task amongst themselves, each must exercise care and patience with one
another as each participant may have differing proficiencies, may require assistance,
or simply require additional time to complete the physical activity task.
The final Hellison goal for participants in the model is seen as the most advanced
goal of the Teaching Personal and Social Responsibility model outlined in Figure 1
and Table 1. The focus of the last goal is extending past the previous goal
achievements that are on a personal level, to a community level in exterior
environments outside of the model setting itself. The participants are encouraged to
extend their own responsibility by Trying these ideas in other areas of life (Table 1).
By evaluating firsthand how goal setting can work for them, the child is able to
determine the effectiveness of the model personally, and implement it in their own
lives accordingly, in their own way, at their discretion. Finally, being a role model for
others and leading by example is the focus of the final goal (Table 1). To develop the
final goal of the model in the current study, participants were actively encouraged to
embrace what they had learned from the in-class training sessions and to apply them
externally from the training venue. For example, by setting and completing a goal for
themselves at home, in the playground, or perhaps in a sports team.

11
Context and the Teaching Personal and Social Responsibility model
The Hellison model has been developed with the aim of improving participant levels
of personal and social responsibility. The model, structured around a sequence of
five progressive goals, was developed in the United States of America with high
school aged participants. The environment was predominantly of the lower
socioeconomic setting, providing adolescents with an optional after school extension
class, within existing school facilities. Further, a pervading question of the model’s
legitimacy remains as the majority of academic research has focused on the model’s
ability to generalise from the training environment to other settings, which has yet to
be conclusively empirically demonstrated. These are all contextually related factors,
i.e. a) Country, b) Socioeconomic, c) Beyond sport, d) Beyond school, and e) Age,
that may have a bearing on the current study.
a) Country. During 1970, Hellison began working with high school students in
Portland, Oregon, in an attempt to develop a youth model in the form of an after
school activity that actively addressed their social needs. At the time, place, and for
the age-group, these were deemed to be respect for one another, caring for others,
and cooperative skills (Hellison, 1985). What was initially developed out of a desire
to meet unfulfilled social and educational needs for youth in the United States of
America became The Teaching Personal and Social Responsibility model (Hellison,
1985). A question therefore arises, as the model originally was developed in
America, will the model generalise to a New Zealand context.
b) Socioeconomic. Hellison (2003) associates lower socioeconomic settings to
include elevated risks of such issues as disruptive behaviour, intolerance, vandalism,

12
and poor psychosocial development. Hellison (2003) sought to provide a resource to
counter such issues with a constructive goal orientated model that could be delivered
within the familiarity of a school setting.
Of particular interest to special need groups and in specialised educational settings,
Martinek and Schilling (2003) contributed to the academic literature with a nine year
after-school sport and skills programme, focusing on the development of youth
leadership. Their case study found from participant interviews that the Hellison
model could serve a place in teaching values to specific groups, specifically children
and adolescents in minority or low socioeconomic backgrounds. A comparative case
study (two implementations of the Hellison (2003) model were evaluated
simultaneously) by Pascual and associates (2011) found, from non-participant
observations and interviews, that participation in the Hellison (2003) model can
encourage children to put more effort into their school work. The participants of
Pascual and associates’ (2011) research were children of lower socioeconomic
groups, typically found in decile one schools.
In New Zealand, the decile rating a school is given relates to the economic and
social factors of the community immediately surrounding it. A decile is a statistical
term, meaning that a group or population has been divided into ten equally sized
groups, giving ten deciles. Hence 10% of schools are grouped within each decile; for
example there are approximately 10% of New Zealand schools grouped in the decile
one category and so on. Schools in decile one have the highest proportion of
students from low socioeconomic communities (Ministry of Education, 2007).

13
Research contributed by Martinek and Schilling (2003), and Pascual and associates
(2011), adds academic support for the choice of environment in which the current
study was conducted, as the current study would be implemented in decile one,
associated with lower socioeconomic conditions, educational settings in New
Zealand. It is feasible to speculate therefore, that an application of the model may
likewise demonstrate similar findings.
c) Beyond sport. There are alternative programmes that aim to promote personal
development from sports participation within the educational setting. For example,
Siedentop (1994) provided the Sport Education Model with the aim to promote
competent sports minded individuals for youth. However, Siedentop’s model (1994)
is contained within the practice and experience of sport itself, not to the classroom
and not outside of the sporting context which is the aim of the Hellison (2003) model.
Hellison (2003) says that his model, whilst using any physical or sporting activity, can
be a positive means for enabling youth development in personal and social
responsibility. However, the evidence from academic research is inconclusive.
Wright and Li (2009) evaluated Hellison’s (2003) claim conducting a cross sectional,
single administration of youth development assessment measures. Their findings of
minor positive correlations across four scales: affective context, support for youth
development, opportunities to engage youth as resources, and belonging, could be
called into question as their participants made a personal decision to be part of their
programme at the outset. Participants electing to participate are operating with a
sense of respect, wanting to participate, and independently choose to become
involved in the programme. It could be argued then that these participants were
already functioning at level 3 of the model (Figure 1) prior to commencement. The

14
current study therefore seeks to address student self-selecting participation, by
implementing the model for all students, during schooling hours, effectively removing
the potential for any self-selection bias suggested from the Wright and Li (2009)
study.
Hartmann (2003), in a review of social intervention initiatives, identified 621 existing
sporting and recreational programmes in the United States of America. The majority
of which were within school evaluations where single administration test studies
were conducted without control groups. Hartmann’s (2003) review revealed that
these evaluations were performed for funding and in-school development purposes,
as opposed to a systematic appraisal of the programmes or their participants. With
specific reference to the Teaching Personal and Social Responsibility model,
Hartmann (2003) does note it as an example of a ‘scholarly social intervention
initiative’, but goes on to say that the model has little evidence of empirical change in
its participants.
Hartmann (2003), in an attempt to be inclusive of intervention programmes utilising
sport, arguably overlooked that the Teaching Personal and Social Responsibility
model uses not sport but physical education as a mechanism for intervention
delivery. Physical activity, for motor skill development for example, is potentially
different from engaging in competitive team sports, purely for enjoyment for example.
In essence, it has not been conclusively demonstrated that physical activity has the
ability to change personal and social responsibility. Whilst making that distinction,
Hartmann’s (2003) review does put into perspective a long standing issue
addressing the existing research. Contexts taken into account, it is not that existing

15
sport and recreational programmes do not work; it is that there is insufficient
conclusive empirical evidence in the literature to claim that they do.
d) Beyond school. There is case study literature by Walsh (2008), and Walsh,
Ozaeta, and Wright (2010), where the model was utilised in interschool sport, and in
after hour extension classes, conducted within the school environment. These two
studies investigated their respective interventions, and positive themes from
participant interviews were apparent, but were unable to verify two significant issues:
(1) that participation in an application of the Teaching Personal and Social
Responsibility model had any direct relation with increased personal and social
responsibility and (2), that the results did not confirm that what had been learned by
the participants, whilst engaged in the model, was demonstrated outside of the
school setting. Hence, the current study shall empirically test each progressive goal
for change and also investigate if participants are able to generalise the final goal of
the Hellison (2003) model outside of the school environment.
e) Age. Hellison (2003) describes the model as a set of ideas that can foster
personal and social responsibility in ‘child’ participants (implying pre-adolescence
perhaps), even though he developed it with high school youth. He asserts, on the
basis of personal observation and anecdote, that what began as his approach to
handling the attitudes, values and behaviours of disadvantaged youth has evolved
into a key set of ideas used to develop, in any students, responsibility for their own
development and well being and contributing to the well being of others. However
this proposal has yet to be tested empirically with students of a different age group,
in particular the younger primary school age as distinct from a secondary (high)
school.

16
There is theoretical scope for the Hellison (2003) model to be implemented with
younger persons. For example, Kellam, Ling, Merisca, Brown, and Ialongo (1998) in
their study of aggressive and disruptive behaviour found that the youngest
participants among the sample of adolescents benefitted more from a school based
intervention based on classroom team-based behaviour management than did older
students. Examining their results for aggression and disruptive class behaviours
specifically, a typical child of twelve years of age was postulated as being
significantly less likely to engage in such disruptive behaviour if they had participated
in an intervention targeting good behaviours whilst promoting self-esteem at primary
school age. Accordingly, the sample in the current study is a younger participant
demographic. To the best of the author’s knowledge, the Hellison (2003) model has
not been specifically tested with younger, primary school aged participants. The
thesis related point is that we can examine if younger persons will benefit from the
Hellison (2003) model, which also focuses on self-control and respect for self and
others (refer Table 1) and do so before the onset of adolescence, as Kellam and
associates (1998) indicate.
The evolution of physical education, and an opportunity for the current study
Research studies by Laker (2000), and Loland (2006), hypothesised that there are
specific needs of children that school based education are expected to address. If
they are left unattended or not provided, educational aspirations for a socially
responsible, educated, and productive member of society are unlikely to be met.
Laker (2000) presented an analytical framework for a revision of the role of
traditional physical educators in main stream schooling, where sports skills coaching
and exercise is replaced with an increased focus on physical education contributing

17
to desirable social and interpersonal skills. Loland (2006) also contends that physical
education is capable of more than just physical exercise, that physical education is
an additional opportunity to socially interact and develop interpersonal skills, but the
opportunity is rarely implemented. Hence, the current study aims to test whether
Hellison’s (2003) model may arguably fulfil the role for physical education envisaged
by Laker and Loland. The current study will therefore be delivered as part of the
physical education curriculum during regular school hours.
Hellison (1983, 2003) believed that the Teaching Personal and Social Responsibly
model, using physical education, has a place in the school curriculum, in the
everyday classroom environment. Appropriate implementation of the model may
assist not only in the development of students, but also in managing negative
aspects of traditional classroom behaviour, such as students disrupting others or not
sharing equipment or resources for example. Hence, it could be expected that the
model will lead to changes in the way teachers evaluate their students in regular
classes. More specifically, it is predicted that participant behaviour and choices
found in the current study will be perceptible by respective classroom teachers. In so
doing, results will provide empirical evidence that may support utilisation of the
Hellison (2003) model in mainstream primary schooling in New Zealand.
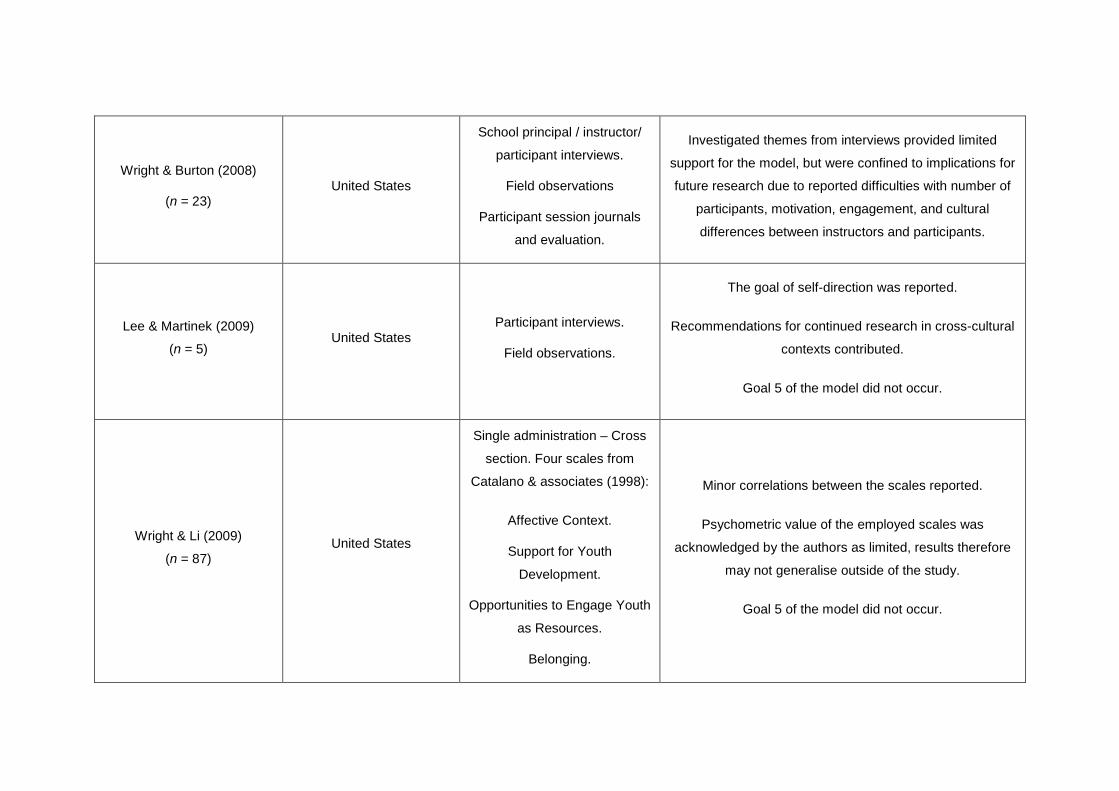
Research evidence on the Hellison (2003) model
Table 2 is a brief summary of model based intervention research conducted on the
Hellison (2003) model. The summary presents nine studies that were conducted in
the United States of America, two that were conducted in Spain, and one conducted
in New Zealand.

Table 2 Summarised research conducted on the Teaching Personal and Social Responsibility (2003) model.
Source Location of Study Measurements Outcomes Wright, White, & Gaebler-
Spira (2004)
(n = 5)
United States
Field observations.
Parent / physician / therapist
interviews.
Attributions of positive participant achievement generally
tied to increases in physical ability, as opposed to realising
the models’ goals.
Hammond-Diedrich & Walsh
(2006)
(n = 8)
United States Participant interviews.
Field observations. A supportive theme for leadership development reported.
Martinek, Schilling, &
Hellison (2006)
(n = 4)
United States Participant interviews.
Field observations.
Authors introduce ‘stage concepts’ to describe level
development in the model.
Individual case summaries support goals 1-4 of the model.
Walsh (2008)
(n = 12) United States
Participant & instructor
interviews.
Field observations.
Participant weekly journals.
Supportive themes of the goals reported.
Researchers recognised the inability to distinguish results
as being strictly due to the intervention or the existing
programme.
Wright & Burton (2008)
(n = 23) United States
School principal / instructor/
participant interviews.
Field observations
Participant session journals
and evaluation.
Investigated themes from interviews provided limited
support for the model, but were confined to implications for
future research due to reported difficulties with number of
participants, motivation, engagement, and cultural
differences between instructors and participants.
Lee & Martinek (2009)
(n = 5) United States
Participant interviews.
Field observations.
The goal of self-direction was reported.
Recommendations for continued research in cross-cultural
contexts contributed.
Goal 5 of the model did not occur.
Wright & Li (2009)
(n = 87) United States
Single administration – Cross
section. Four scales from
Catalano & associates (1998):
Affective Context.
Support for Youth
Development.
Opportunities to Engage Youth
as Resources.
Belonging.
Minor correlations between the scales reported.
Psychometric value of the employed scales was
acknowledged by the authors as limited, results therefore
may not generalise outside of the study.
Goal 5 of the model did not occur.

Walsh, Ozaeta, & Wright
(2010)
(n = 13)
United States
Participant / teacher interviews.
Field observations.
Participant session journals.
Generalisation of goals 1-4 of the model reported by child
participants.
Teachers reported an inability to distinguish results as
being strictly due to the intervention or the existing
programme.
Wright, Li, Ding, & Pickering
(2010)
(n = Intervention 62 /
Control 122)
United States
Field observations.
Focus groups.
Child participant evaluation of
the intervention.
Pre-Post – Educational
variables:
Conduct ratings - positive and
negative behaviours.
Absence.
Tardiness.
Grades.
Instructors reported each of the five goals of the model
were apparent for the child participants.
Majority of child participants reported that their behaviour
improved, although less than half of the child participants
believed the model helped them improve in their school
which may contradict the instructors report for goal 5 of the
model.
Minor increase in positive behaviours.
Minor decrease in negative behaviours, absence, and
tardiness.
Authors acknowledge minor academic grade improvement
may be connected to participation in the model.

Escartí, Gutiérrez, Pascual,
and Llopis (2010)
(n = Intervention 21 /
Control 21)
Spain
Teacher Interview.
Pre-Post:
Multidimensional Scales of
Perceived Self-Efficacy
(MSPSE).
Supportive themes for the goals of the model reported in
interviews.
Minor improvement in self-regulatory efficacy.
Non-significant change social self-efficacy.
Non-significant change assertive self-efficacy.
Goal 5 of the model did not occur.
Pascual and associates
(2011)
(n = 22 in Case 1 /
25 in Case 2)
Spain Teacher Interviews.
Field observations.
Support for goals 1-3 of the model only reported for
Case 1.
Gordon (2010)
(n = Intervention 57 /
Control 36)
New Zealand
Field Observations.
Teacher / student interviews.
Repeated data sources:
Participant reflection.
Goal setting.
School detentions.
Supportive themes recognised goals 1-4 of the model.
Student participants reported a positive impact on
behavioural choices from participation.
Variation in occurrence of school detentions inconclusive
between the study groups.
Goal 5 of the model did not occur.

22
From Table 2, in terms of outcome, none of these studies found conclusive evidence
for goal 5 of the model (Figure 1), which may call into doubt the validity of the final
goal of the Hellison (2003) model. However, six of these studies reported supportive
themes for goals 1 - 4 of the model from interviews and field observations. In
addition, three of these studies reported positive benefits from participation, including
increases in physical ability or an increased sense of belonging. Whilst these results
are encouraging; they are not directly tied to the goals of the Hellison (2003) model.
Two studies from Table 2 report successful applications of the Hellison (2003)
model, yet their results are open to interpretation. One study conducted by Wright,
Li, Ding, and Pickering (2010) investigated an implementation of the model using
educational outcomes, field observations, and feedback from their child participants
and programme instructors as measurement of change in their behaviour and in their
school grades. From a pre-post evaluation, they found support for each of the five
goals of the model from the instructors. However, less than half of the child
participants believed that the programme assisted them in any other aspect of their
school experience, apart from meeting the requirements of the programme itself.
Wright and associates (2010) did report an improvement in mean rates of absence,
behavioural conduct ratings, and tardiness. However, the differences between
reported mean scores for the intervention and control groups were small. They also
acknowledge that the result for grade point average, which decreased during the
intervention but at a lesser rate than did the control, may be tied to participation in
their implementation of the model, but this was inconclusive.
The current study improves on Wright and associates’ (2010) design by increasing
the frequency of measurement, to address influences such as maturational change

23
over time for example, assessing the goals of the model (Table 1) individually and
progressively, and examining outcomes against the level structure of Hellison’s
(2003) model (Figure 1). Additionally, Walsh and associates (2010) conducted a
study of 13 participants and from interviews, found support from the participants for
goals 1 - 4 of the Hellison (2003) model. For example, supportive statements also
included that the model could be used in addressing everyday classroom learning
concerns, according the teachers interviewed, and be able to be applied to social
situations outside of the educational environment, such as interschool events and in
the home. However, teachers in the Walsh and associates’ (2010) study also
reported an inability to distinguish between the intervention and the existing
programme in determining which contributed to the increase in positive behaviours
that they had observed.
Both Wright and associates’ (2010), and Walsh and associates’ (2010) studies
reported conflicting interpretations of the implementation, from participant’s
perspectives, when compared to those obtained from teachers and instructors. In
both investigations, caution should be exercised regarding any claim made that
participation in an application of the model was effective. Multiple developmental and
maturational influences may well have been present for the participants. For
example, learning styles, peer socialisation, and parenting, may have impacted
upon, and potentially confounded, their investigations. Further, there was no specific
evidence given that goals 4 or 5 of the model where exhibited by any participant in
their studies. Specifically, neither caring for other participants or, a demonstration of
the model Outside of the training environment, was conclusively evident (Table 1).

24
The thesis related point here is that a rigorous empirical investigation is required
before substantive claims as to the model’s effectiveness can be made.
From Table 2, Wright and Li’s (2009) experimental evaluation of the model did use a
single administration of four youth development scales. Whilst their study
demonstrated correlations between respective measure scores, they did not find
conclusive evidence for the effectiveness of the Hellison (2003) model or that any
participant displayed development from the intervention Outside of the training
environment (Table 1). It may be that the Hellison model is unsuited to being
examined using empirical methods, that the administration of psychological
measures during training sessions is impractical, for example. A valid point is made
by Martinek (2000) that interrupting an application of the model, having children
complete questionnaires during training sessions for example, may detract from, and
detrimentally restrict, the training lesson if conducted concurrently. The current study
would administer measures at a time separate from the training sessions, so that the
participants did not have their sessions interrupted, and that the application of the
model progressed unhindered.
An issue identified throughout the research of Hellison’s (2003) Teaching Personal
and Social Responsibility model is the want of visible external validity of the models’
goals Outside of the training environment where they were first learnt. With reference
to the current study and Table 1, the final goal of the model has been a predominant
focus of research. Effectiveness of an application of the Hellison (2003) model for
participants has largely hinged on reaching the final goal (Table 1) and hence,
successfully participated in the programme. Confirmation of the final goal, according
to theory, requires that the participant, having progressed through the previous four
25
goals, is then able to exhibit the four goals in a new context, for example, outside of
the initial training venue, at home or at school. For the current study, external validity
of the final goal could come from the application of an external measure, completed
by the participant’s parent and teacher, on emergent observable behaviours of the
participant.
The research highlighted from Table 2 has not explored the possibility for a test of
the Hellison (2003) model in terms of stage development. Martinek, Schilling, and
Hellison (2006) have previously described the goals of the model as being likened to
‘stage concepts’. Figure 1 implies that participants should develop increased levels
of personal and social responsibility through active involvement over time. However
this assertion has never been put to a conclusive independent test. The question is
whether students step through a set of progressive goals in sequence; or, whether a
more continuous smooth improvement is evident. The current study offers a fresh
perspective here as each goal of the model is empirically assessed using
established measures, both independently and as an indicator, of change over time
in terms of participant progress.
Steps versus Curves: A theoretical reappraisal of the Hellison (2003) model
Having seen that the research on Hellison’s (2003) model leaves at least two major
questions unanswered, we can ask ‘how’ a validation could be operationalised. A
theoretical core of Hellison’s (2003) model is that each goal cannot be reached until
a predecessor has been achieved. For example, the emergence of self-motivation
depends on pre-established self-control and respect (from Table 1). As we have
seen, for the governing stage theory to be correct, the model would be expected to

26
demonstrate that any participant in the model would progressively move through the
goals in Table 1.
Perhaps the best-known exemplar of a stage theory, in the area of personal
development, is Maslow’s needs hierarchy (Crain, 2011). Maslow (1968) believed
that people who are hungry can only focus on food; that participation depends on
first building self-esteem. Similarly perhaps, rational goal-directed work from Table 1
may only be achieved after a child has first discovered personal insight. According to
how well a provided education is supportive of inner growth potential, child
development is conditional upon gains made from their experience and
understanding the external world. Whilst Maslow (1968) did not consider his work in
terms of stage development per se, his ideas of a progressive and cumulative
ascension may have broad relevance to teaching personal and social responsibility.
A key difference between the models of Maslow and Hellison is timeframe. The
Hellison model for intervention is relatively short, focusing on childhood and
adolescence. Maslow referred to the development of the individual over the period of
a lifetime. Nonetheless Maslow’s hierarchy was put to the test in a management
study of attitudes by Haire, Ghiselli, and Porter (1966), and this test may contain
clues as to how to test Hellison’s (2003) model. Their rationale was that levels of
satisfaction with each need should follow a set pattern. Mean scores for satisfaction
at a lower level, physiological needs for example, should reliably be higher than
satisfaction with higher-order needs, such as self-esteem. Put simply, group mean
for security needs satisfaction should always be higher satiated than the mean for
self-actualisation, since the latter should never be satisfied before the former,
according to theory.

27
Haire and associates (1966), based on this logic of descending means,
operationalised a concurrent test of the ladder hypothesis. At any given point in time,
as in Figure 1, the mean score for a stage one construct should always be higher, on
the average, than the mean score for a stage two construct; and so on. Hence, for
the current study, the first goal of self-control and respect should occur before that of
self-motivation. Hence the mean scores for self-control and respect should tend to
be higher than for self-motivation.
In a single administration of a survey of male managers from 14 countries, Haire and
associates (1966) found that the mean factor Maslowian scores ascended
hierarchically, for example no country had self-esteem ‘on’ (versus ‘off’) high with
personal security ‘off’ (versus ‘on’), satisfying one lower-order need, on average,
ahead of its higher-order need.
However, the path to self-actualisation was not exactly as predicted in every country
sampled. On average across 14 countries, ‘esteem’ scores tended to be higher than,
i.e. satiated before, the first two levels of the theory, suggesting that esteem was a
precursor to, rather than a consequence of, security and social needs and therefore
against Maslow’s order. For the current study, Haire and associates’ research (1966)
poses a critical question: Although there was a recognised order in each country
group, ‘European’ countries responded as predicted, ‘Non-European’ countries each
differed in their needs ranking. The result suggests a need to test whether Hellison’s
(2003) stage-like model is also consistent across contexts. A question arises for
stage development and the Hellison (2003) model; does the model generalise to
New Zealand primary school children (in low decile schools), but also not only in
terms of context, but also in the specified order of stages. For example, at any given

28
point in time, would self-control and respect be greater than self-motivation in the
current study.
The thesis goes further than the research contributed by Haire and associates
(1966). The current study would apply a repeated measure longitudinal design so
that the reliability of stage ordering could be assessed over time (validity) as well as
progress over time up the hierarchy (effectiveness). In collecting longitudinal data, it
is possible to measure change over time that the model predicts, as well as being
able to determine which sequence of goals is in effect at any given time point, as
well as over time. Whilst it is conceivable that a sequence may be evident in one
‘snapshot’, but not over time, the essence of the Hellison stage-like model is to move
up a ladder sequence rather than just position on one. We could expect to see the
order of the goals occurring in sequence, beginning with respect through to outside
the training venue, as set out in Table 1.
A role for stage change in the development of personal and social responsibility
Perhaps the leading contributor in psychology of stage developmental thought and
research is Jean Piaget (Crain, 2011). Piaget refers to development as being a
spontaneous course of action that comes specifically from the child who is an active
agent in their own learning. Piaget (1969) stated that for children to truly develop,
they must be given opportunities to discover concepts on their own terms. Similarly
perhaps, Hellison (2003) points out that for the model to be valid, a divergence from
a traditional instructional approach to facilitating interest and challenge for the
participant allowing them to solve problems on their own is required. Hence a

29
comparison between the two approaches might be broadly informative for
developing a test of the latter one.
Piaget himself believed that argument and disagreement between children is a
necessary progression in the promotion of cognitive development (Berk & Winsler,
1995). Conversely, they may develop independently of their social context. Shayer
and Beasley (1987) reported from a pre-post investigation over a two year period
that 12 year old school children moved from the initial concrete operational period
(the capacity to think systemically in relation to objects and activities), and its phase
of generalisation to formal operational thinking (the capacity to think systemically in
abstract and hypothetical terms). What was less clear however is whether they did
so in maturational steps, a product of natural biological maturity perhaps or more
smoothly over time, from personal experience and academic and social learning. In
essence for the current study, would the Hellison (2003) model present as Figure 1,
or, would the model appear as Piaget might have believed it may, as represented by
Figure 2.
In the author’s view, (Figure 2) child participants might conceivably begin from a start
point where, in theory according to Hellison (2003), they are not demonstrating any
goal of the model. From that initial point, it may be contended that the difficulties of
the goals moderate their acquisition, and that through maturational development,
each goal should occur in progressive stages and each subsequent goal should
increase at a rate less than the goal before it. Hence, Figure 2 demonstrates that
each goal begins to develop from intervention commencement, yet the goals
increase as a reflection of difficulty, i.e. respect should develop faster than any other

30
goal, yet each goal is still advancing, but at a slower rate for each subsequent goal in
turn.
Figure 2: A schemata of independently developing personal and social responsibility
skills of varying difficulty.
Hellison’s (2003) model has moral developmental undertones. Kohlberg (1981)
developed his own model of six moral stages of development incorporating and
expanding upon Piaget’s earlier work. Whilst Kohlberg’s model postdates and
arguably supersedes Piaget’s in terms of scope and classification for moral thinking,
the principals of stage-related attainment are similar to those of Piaget’s. It is
noteworthy that both the Piaget and Kohlberg models address moral thought but are
less directed towards actual acts of moral behaviour. Additionally, Kohlberg’s six
31
stage theory does not predict that children would typically move past the first two or
three levels of moral development until teenage years, effectively removing the
higher levels from consideration when dealing with younger children (Colby, 1987).
Likewise for the Teaching Personal and Social responsibility model, Hellison (2003)
expects that the later goals of his model may not be reached by everyone, especially
so perhaps, by younger children (versus adolescents).
Referring back to Table 1, goals four and five are unlikely to be achieved by younger
participants, although no specific age range is given by Hellison (2003). In the
current study, it may be discovered, as these stage theorists suggest, children do not
progress into higher levels of a developmental model until later in life. In Figure 1,
this would be represented by a tapering and flattening of trajectory lines, ostensibly
from goal 3 of the model, and goal 4 and 5 may not be apparent for younger
participants at all.
Montessori’s (1936) theory of stage development introduces the concept of ‘sensitive
periods’ of developmental change. These run throughout childhood. Montessori
differs from other developmentalists however in that her primary focus was, like
Hellison, the teaching of children, rather than like Piaget and Kohlberg. Her
aspirations of development for children also resemble the goal structure of the
Teaching Personal and Social Responsibility model. Montessori (1948) sought to
embrace and allow a child’s spontaneous tendencies to direct their own learning just
as Hellison (2003) has. Both theorists also embrace the aspiration for model
participants to become independent, to seek out new challenges, and to develop
their personal goals, however only Hellison aspires for them to take them into the
community beyond the school, in the final goals of his model (Table 1). To the best

32
of the author’s knowledge, this kind of proposition about ‘transfer of training’ has
never been directly empirically tested before. Figure 1 offers an opportunity, and
structured model of goals (Table 1), to do so by investigating changes in perception
of participant behaviours from the perspectives of their teachers and parents.
An argument for maturational change and the development of personal and social
responsibility
In antithesis to the Hellison and other general stage models, Albert Bandura (1986)
argues that the whole idea of stage development is false, and that stage
development is an abstraction invented by those that lack the ability to accurately
define and differentiate child thinking. For Bandura, a general stage concept does
not acknowledge individual developmental differences or explain particular thinking
skills such as reading or writing, for example. In his view, stage concepts do not
allow for gradual and continuous development of specific thinking skills. Bandura’s
(2001) position then would counter the stage progression notion of the Hellison
(2003) model outlined in Figure 1, stating instead that a child naturally acquires
knowledge and skills through interaction with others in a timeframe unique to each
individual (Figure 3). Therefore, all social skills, no matter how difficult, are learnable
by social learning.
In Figure 3, we would expect to see, according to Bandura, a gradual increase over
each of the constructs for all participants. On average there would be no lock step
progression of any individual goal as the Hellison (2003) model predicts. For
example, self-control, or ‘self-regulation’ as Bandura (1986) refers to it, is directly tied
to achievement and the development of personal standards. Children generally elect

33
to follow the evaluative standards of peers as opposed to those aspired for by
parents and teachers according to Bandura’s (1977) observational learning premise.
In effect, Bandura’s premise would arguably appear as Figure 3.
Figure 3: A schemata of concurrently developing personal and social responsibility
skills of equal difficulty.
An acid test for choosing between Figures 1, 2, and 3.
To explore, empirically and systematically, which Figure may be the best fit to match
the current study outcomes, Scalogram Analysis is suggested. Stage model
scalability, for the purposes of the current study, simply implies that any participant
demonstrably progresses through the goals, first one then the next, of the ladder, in

34
this case with the rungs presupposed by the Teaching Personal and Social
Responsibility model.
The concept of Scalogram Analysis was developed by Guttman (1944), and his final
version of it was published in Stouffer and associates (1950). Guttman devised
‘Scalogram’ from ‘scalo’ and ‘gram’ meaning scale, written to form a record (gram). A
scalogram provides a record of how many steps, i.e., stages, in a sequence, a given
individual, or group, has managed to ascend. Guttman developed the idea of a
scalable interpretation of attitudes whilst investigating morale and other issues of the
United States Army during the Second World War. Essentially, Guttman (1944)
proposed that in responding to a set of items, any given individual who answers a
question in the affirmative is also agreeing to all other items preceding it. In effect, a
respondents’ subsequent scale score is an accurate and reliable representation of all
items that were endorsed (versus not), and is as such, a definition of the
respondent’s attitude spectrum. Hence, it is perfect for the current study, which
seeks to explore if there is a ladder, and whether a programme of intervention is able
to move individuals progressively up it. In so doing, the current study would be able
to empirically qualify the premise for the stage-like theory of the Hellison (2003)
model and the order of progression for participants through it.
As a model of scaling, the Guttman approach was developed as a critical alternative
to that of the Likert or Thurstone technique. The prediction of a total score is
contingent with establishing that a series of items fit a unidimensional continuum. In
establishing that any item constitutes a component of a single dimension, the scale
aims to predict responses to all of its items based upon cut scores. In accepting that
each value is representative of an underlying single dimension, each quantitative

35
value is scalable and can be determined by scalogram analysis (Guttman, 1944,
1947, 1950). Put simply, the Guttman approach allows different scales, like a
measure for self-motivation and a measure for on-task independence in the current
study for example, to be scaled together.
The current study would be able to construct multiple scalograms of the goals in
Table 1 at each concurrent time point and across time. A comparison of the resulting
scalograms should provide a clear indicator of which is the closest fit to the
hypothesised figures of 1, 2, or 3. Thus the demonstration of a scalogram, at each
time point, would confirm the stage validity theory for the Hellison (2003) model. In
turn, participants progressing upward through the stages would show evidence of the
models’ effectiveness.
Summary
The primary aim of the current study was the robust examination of the Teaching
Personal and Social Responsibility (Hellison 2003) model. The current study was
conducted in a school setting during school hours, and recruited entire class cohorts
to participate as part of an everyday educational syllabus activity, not all of whom
would otherwise have self-selected into the model. A structured plan for intervention
delivery, in this case by the lesson plan format provided by Hellison (2003), was
followed. Hence, a strong methodological design that incorporates a matched control
group from a second school, statistically reliable measures, and catering to potential
favourable self-reporting bias by utilising objective assessment from multiple
sources, would provide for a robust empirical examination of Hellison’s (2003)

36
Teaching Personal and Social Responsibility model. Hence, two specific hypotheses
are to be evaluated in the current study.
Hypotheses
Following an intervention model based closely on Hellison’s training guidelines
(Hellison, 2003); in an economically deprived New Zealand primary school utilising
physical education during school hours:
1) Independently of point in time, the children’s responses on Hellison’s goals
will form a consistent scalogram, meaning that,
2) Over time, participants in an intervention group will progress upwards through
the stages in 1.

37
Chapter Two
Methodology
The current research is a longitudinal study conducted over a scholastic year with
the aim of testing the Hellison (2003) Teaching Social and Personal Responsibility
model. The study was administered within two primary schools situated in Auckland,
New Zealand. The in-school intervention was facilitated by the study’s author under
supervision by the participating schools and Massey University. Ethical approval for
the study was granted on 30 March 2009 by the Northern Human Ethics Committee
which is accredited by the HRC (Ethics committee reference number MUHECN
09/004).
Participants and environment
Participants were two groups of year five and year six primary school students from
two separate schools, rated decile one by the Ministry of Education, from
geographically separate locations in Auckland (refer Table 3). The total number of
participants in the study was 85 students between 8 and 10 years of age, with a
mean of 9.61 years for the intervention group and 9.80 years for the control group.
Table 3 illustrates the group demographic characteristics.
As the participants were two intact groups, the two participating schools were
randomly assigned as the intervention school and the control school for the purposes
of assigning which school was to be the site for intervention delivery. The study was

38
made available to all students of the participating schools in the year five and year
six band, the difference in the size of each group is the class size in each school.
Table 3
Demographic characteristics of participants.
Group n Age (M / SD) Gender
Intervention 36 9.61 years / 0.88 18m / 18f
Control 49 9.80 years / 0.69 21m / 28f
The study included, as opposed to attempting to match group size for exact
numerical equivalency, all students in this way to circumvent any issues concerning
segregation or alienation of any student by being excluded from the larger control
group. The intervention group consisted of 36 students and the control group 49
students. The number of participants in each group may give rise to an initial
concern for statistical power and for any significance gained from assessment in the
current study (Cohen, 1988). However, Fairweather (1991) demonstrated that a
sample of 30 participants is sufficient to meet the requirements for statistical power
and for the subsequent interpretation of significance with four variables. In addition,
following previous research in the area of sport and decision-making specifically, the
number of participants in the current study is also sufficient for a longitudinal design
(Glass, 1997; Gratton & Jones 2004). Peterman and Bradford (1987), and
Fairweather (1991) also discuss the advantage of such longer multiple testing
designs, as opposed to a pre-post type approach, as these have a higher statistical
power for detecting change over time due to the number of replications of

39
measurement and the greater amount of physical time over which the study is
conducted.
A longitudinal design was chosen for the current study, a key strength of the current
design was to provide six waves of data collection, adding strength to statistical
power when examining the Teaching Personal and Social Responsibility model. The
longitudinal design also provided the opportunity to collect data from multiple
sources to examine any change that occurred over time for the intervention group,
throughout the course of the study. The control school would complete only the test
assessment phases of the study and not receive the intervention.
Recruitment
An ongoing consultation with both participating schools was conducted to familiarise
the school staff with the study and the roles they would play in it. A full overview of
the study, how the in-school intervention would be delivered, and how testing of the
intervention would be conducted was fully disclosed with teaching staff. In addition,
separate information letters were issued to teaching staff also requesting their
consent and for their participation in the current study (refer Appendices A and B).
In accordance with school policies and in adherence with rules as set out by the
Northern Human Ethics Committee, every identified student and participant in the
research study was given the right to opt out of the study which also included a right
to do so at any time during the study. Individual information sheets were issued to
every participant in the study and individual consents were issued and obtained
(refer Appendices C-F). A further letter from each participating school was issued to

40
every participant’s parent or guardian outlining the study and should they wish, gave
the choice to not participate by opting out of the study by returning a letter signed to
that effect. There was only one request made for a student to be excluded from the
study. The student was individually catered for by their school during any activities
connected to the current study. Lastly, an individual confidentiality agreement was
issued to all participating teaching staff, in both schools (refer Appendix G).
Procedure
The author was the intervention facilitator for the current study. The author invested
four months prior to commencement, to study the Hellison (2003) model and plan
intervention delivery. Becoming fully conversant with the model would address the
historical concern expressed in the literature where ill prepared or unfamiliar
facilitations of the model have met with a lack of success due to incorrect delivery
(Mrugala, 2002). Some provisos then were taken into account for delivering the
current study. Specifically, these provisos were: (1) being clear and consistent with
all participants the expectations of every activity session, and (2) being clear and
concise with all participants the importance for accuracy and honesty during the six
testing administrations, at every test occasion.
In order to examine the model in a scholastic environment, the Teaching Personal
and Social Responsibility model was introduced in one primary school as part of their
weekly physical education session allocation over one calendar year as the
intervention. The control group did not receive the intervention. Two sessions were
conducted for the students every week in the school. Prior to commencing the
current study, training and familiarisation for the classroom teachers and senior
41
school staff of the implementation school was conducted to explain the model and
the study intentions. This ensured that the school staff supported the implementation
of the Teaching Personal and Social Responsibility model. In addition, familiarisation
for the intervention students was also conducted. Prior to commencement, two in-
class discussions familiarising the students with the Teaching Personal and Social
Responsibility model were carried out. Using the Teaching Personal and Social
Responsibility goal progression as a visual cue (refer Introduction, Table 1), the
students were given an explanation of the model and how it would be put to use in
their physical education sessions. Finally for the participants, an open question and
answer session was made available to the students to address any issues or
concerns.
The application of the Teaching Personal and Social Responsibility model was
administered using the prescribed lesson plan as set out by Hellison (2003).
The Lesson Plan
For Teaching Personal and Social Responsibility to be successful it was essential
that the facilitator was consistent to the day-to-day session delivery in the school
training environment. Establishing a lesson format that is clear and made explicit to
students was the strategy utilised in this intervention. To support the Teaching
Personal and Social Responsibility framework, Hellison (2003) suggests a standard
lesson format which was utilised in this study. It is comprised of five elements and
these are outlined here, taken directly from the Teaching Personal and Social
Responsibility model of Hellison (2003):

42
The first element covered in the lesson plan is Counselling Time.
Connecting one-to-one with students was attempted in each session.
Each student must know they have strengths, are unique, can make a
contribution and feel that they are valued. A positive comment to each
individual each lesson is recommended.
An Awareness Talk is the second element. The Awareness Talk was
done at the beginning of each session, was kept brief and it is here
where understanding of the five goals of responsibility begins, and
beginning gradually and progressing through the goals as the
intervention was delivered. Following initial coaching, the Awareness
Talk was used as an opportunity to remind participants of their
responsibilities to themselves and to others.
Introducing Teaching Personal and Social Responsibility into the class
activity is the third element. Here it is important to use the model’s
instructional tools to integrate teaching responsibility with teaching the
physical activity tasks. Developing the model’s tools that promote
participants’ awareness of others was required. Individual
empowerment and group empowerment were also developed allowing
for the participants to take on greater responsibility for meeting lesson
objectives.
Conducting a Group Meeting at the end of the session is the fourth
element. The meeting provided opportunities for students to share
their ideas and thoughts on the lesson and the intervention as a
whole. They were invited to discuss problems, even comment on the
delivery from the instructor, raise issues and suggest possible
solutions and changes.
The final element of the lesson plan is Reflection Time. Here an
opportunity is provided for each student to evaluate their own
attitudes, intentions and behaviour in relation to the five goals of
responsibility. In the current study, every student was provided their
own journal to record these details at the end of every session. Each

43
student also rated their behaviour with an overall corresponding
number between 1 – 5, representative of which goal they had
performed at most during the training session.
A further detailed explanation of Hellison’s prescribed lesson plan can be viewed in
the Teaching Responsibility through Physical Education (Hellison, 2003).
Activities as the basis of the Lesson Plan
In the current implementation of the Teaching Personal and Social Responsibility
model, the students were progressively exposed to the responsibility goals, moving
through the goals as the primary focus of the sessions. Each session followed the
lesson plan format and a routine structure to each session of the intervention was
established. In order to deliver the lesson plan, a choice of physical activity in which
the students can participate is required. Hellison (2003) states that the choices of
physical activity used in the intervention are to be made by the facilitator. Any choice
of physical activity that the intervention facilitator is confident to instruct participants
in, fulfils the physical requirements of the Teaching Personal and Social
Responsibility model. For the current study, the author elected to utilise his formal
martial arts qualification in, and the techniques of, Go-Kan-Ryu karate as the basis of
the physical activity component of the intervention for the participants. The author
gained permission from Go-Kan-Ryu New Zealand management to utilise their
karate skill set in the current study (refer Appendix H).
The choice of a karate skill set to be used as the basis of the chosen activity allowed
for a progressive design of planned physical activity instructional teaching. The
karate exercises were easily replicated by the participants over time and with

44
practice, and followed a predictable pattern in terms of how each session was
conducted. Put simply, in order to deliver the Teaching Personal and Social
Responsibility model successfully, Hellison (2003) suggests that participants be
challenged but at the same time structuring the activity choice so that every
participant is able to experience success in the task at hand. Acknowledging these
factors, the karate skill set was kept simple whilst assuming that participants had no
previous experience of karate skills.
A ten lesson teaching plan was developed for the physical activity sessions in which
the karate skills were taught. The ten lesson plan was repeated four times over the
scholastic year, allowing for school holiday break periods, providing 40 weeks of
sessions in total for participants. An in-class check list of the repeating ten lesson
plan, referred to as sessions 1–10 as employed in the current study, outlining the
Teaching Personal and Social Responsibility theme of each session, is included as
Appendix I. The ten lesson plan additionally highlights the specific goal of the
Hellison (2003) model being focused on for that session, the karate skills taught, and
the lesson awareness for each session. A typical training session, utilising the first
lesson of the ten lesson plan format of the current study, is detailed in Figure 4.

45
Session Structure Lesson Plan Example
Counselling Time
Goal focus of the session – Respect:
• Greeting each student in person, by name, as they enter the
gym session. Inviting every participant to group together in
preparation for the awareness talk for the session ahead.
Awareness Talk Awareness Talk – Discussing Respect:
• To open the lesson, today’s class is about the basic karate
formalities, the basic punch, and the first block.
• An opportunity to talk with students about their responsibilities
for the session. Discussing respect for others, self-respect, and
control of what is said and how we speak with others.
Discussing respectful verbal exchanges, the right to be
included in activities, treating one another as equals.
Activity
Activity – Learning a new karate skill set:
• Bow (Rei)
• Standing Stance (Heiko Dachi)
• Stomach Punch (Chudan Tsuki)
• Head Punch (Jodan Tsuki)
• Head Block (Age Uke)
• Partner Drills – Standing in front of a partner, mirroring each
other going through each of these activities in the skill set.
Talking quietly with one another improving their physical karate
technique together, as prompted by the facilitator whom used
verbal improvement cues.

46
Activity
Continued
• Group Drills – Using the same activity set, groups of four or five
were formed and the activities were repeated. Each participant
in turn calling out the activity set performed. Only those
participants calling the activity set are speaking at that time.
• Single Drills – In their own time and space, each participant
practices the entire skill set twice independently from other
participants.
Group Meeting Group Meeting – Discussing Respect:
• An opportunity to talk with students about the challenge of
learning new ideas. Discussing how well they applied
themselves to the new skills. Discussing how drill work felt with
a partner, in a group, and individually.
• An opportunity for students to share their thoughts and feelings
about giving, and receiving, feedback from their peers.
Discussing how and where they may put these new ideas and
thoughts into practice.
Reflection Time Reflection Time – Journal writing:
• Recording personal thoughts and aspirations, anything relevant
to the participant from the session. Included here were aspects
such as how well they thought they applied the goal focus
during the session, how well they could relate to giving respect,
and if and how they felt to have respect returned - using the 1-
5 scale, 1 being ‘not very well’ to 5 being ‘very well’ at their
discretion.
• Recording a personal self evaluation, setting an achievement
goal.
Figure 4: An exemplar of the lesson plan for Respect.
47
Matching the Lesson Pan to the Teaching Personal and Social Responsibility model
A typical lesson of the current study would be one of the lesson plans taken from the
ten lesson plan format. The ten lesson plan format (refer Appendix I) was
constructed utilising the five respective goals of the Hellison (2003) Teaching
Personal and Social Responsibility model. The ten lesson plan illustrates the
respective goals of the intervention which are denoted as ‘theme’ for each lesson.
Each theme of the lessons delivered in the current study was taken directly from the
Hellison (2003) model. Each of the five themed lessons was repeated twice, in
succession, giving ten lessons in total. The ten lesson plan sequence directly follows
the progressive responsibility goals of the Hellison (2003) model. For simplification,
Table 4 outlines the lesson format structure with respective responsibility goal and
goal focus of the Hellison (2003) model.
In structuring the 10 lesson plan, particular attention was given to what Hellison
(2003) refers to as a graduated exposure to the model. Hellison explains his model
as a progressive series of goals delivered differently than traditional subjects of main
stream schooling. As such, participants will initially be unfamiliar and perhaps
hesitant to engage with the model. Essentially, the model has one predicted
outcome, increased personal and social responsibility in participants. The outcome is
arrived at by working through the themes of the model, focusing on accomplishing
one goal before being able to progress to the next. Two sessions were conducted at
the intervention school per week, keeping the same lesson theme for that week. The
twice weekly sessions allowed the participants to gain a clear understanding of each
respective theme without being overwhelmed. As subsequent weeks ensued and
progressive exposure to the model and its themes were delivered, participants were

48
gradually able to work through the new tasks and themes without undue difficulty.
Repeating the ten lesson plan format thus provided familiarity whilst increasingly
exposing the participants to the Teaching Personal and Social Responsibility model
(Hellison, 2003). Structuring the intervention in such a manner provided interest and
challenge for participants, whilst adhering to the requirements of the Hellison (2003)
model that forecasts a successful outcome through participation.
Table 4
Mapping the lesson plan to the goals of the Hellison (2003) model.
Responsibility Lesson Format Lesson Theme Responsibility Goal
Goal 1 Lesson One / Two Respect Self-control and respect
Goal 2 Lesson Three / Four Participation Self-motivation
Goal 3 Lesson Five / Six Self Direction On-task independence
Goal 4 Lesson Seven / Eight Caring Sensitivity and responsiveness
Goal 5 Lesson Nine / Ten Outside the Training Venue
Trying these ideas in other areas of
life.

49
In formulating the activity component of the intervention in the current study, the
progressive nature of the Hellison (2003) model was also put into practice. There is a
stage structure to the model from an initial involvement, the progression through it,
and on to achieving greater personal and social responsibility. As can be observed in
the ten lesson plan (refer Appendix I, and Figure 4), the activity component is also a
series of progressive stages matching the goals of responsibility of the Hellison
(2003) model. Each lesson is structured, beginning with an introduction from the
facilitator demonstrating what is to be performed for the physical activity.
Progressively through the activity component, the participants take on the
responsibility for conducting the activity format themselves, with the facilitator
available if required.
As the participants practice and work through the physical activity tasks set by the
session theme, the individual participants are personally and independently
responsible for working through the physical activity tasks themselves. The
development of independence for the participants in the Hellison (2003) model is the
bridge between self-esteem and then personal motivation, and the subsequent onset
of prosocial behaviour, leading to positive behaviour outside of the training venue
hall based activity sessions. For clarification, the structure of a typical lesson is now
outlined.
Overview of a typical lesson in the current study
Beginning the session with all student participants present, the focus of the personal
and social responsibility behaviours were explained, in order to create awareness in
the participants of their respective role in the session. The session’s focus was

50
always related to one of the goals, with which the students were familiar and which
were posted using cue cards on the walls of the gym hall for visual reference.
Following the introduction, the session’s physical activities and guidelines were
explained to the participants. The aim of the activity was for the students to both
practice responsibility and conduct themselves in accordance with the session
theme. The activity component of the session forms the greatest time segment and
is where the Teaching Personal and Social Responsibility goals are put into practice
by the participants. The physical activities were designed according to the goals set
out in the Teaching Personal and Social Responsibility model (Hellison, 2003). The
variety of karate skills that were provided ensured that the level of difficulty did not
exceed the capacities of the students, so that they all had a chance to experience
success.
In every session, the karate activity skill set was initially demonstrated by the
facilitator so that participants had a brief exposure to the skill set. Participants would
then perform the same skill set, replicating the karate skills as demonstrated by the
facilitator whom performed the skill set with the participants. After the initial run
through, participants then paired up with a partner of their choosing, and again the
same activity set was conducted whilst facing one another. The facilitator only then
verbally conducted the same karate activity skill set whilst the participants executed
the skill set. The partnered pairs where then asked to provide quiet feedback
between themselves, assisting one another in correcting their initial techniques. The
partner drill was then repeated once more, the participants again giving quiet
feedback between the pair at completion of the sequence.

51
Following the partner drill work, the next feature of the activity component of the
session was group interactivity. Here the participants gathered themselves into
groups of four and between themselves chose one group member to be the group
leader. The participant group leader would then verbally conduct, and physically
perform, the karate skill set with the group whilst the other group members
performed the skill set at the group leader’s direction. Once the skill set was
completed, the group leader changed to the next person in the group, and so on,
until each member had a turn in leading the group through the skill set. Each group
conducted the same skill set exercise in their own time. The facilitator remained
within proximity to the groups as they worked through their skills sets and was
available to all participants if questions arose or clarification was required.
Assistance or direction was only given by the facilitator if invited to do so by the
participants.
For the final part of the activity component, all of the participants were given the
opportunity to practice the skill set independently. Working on their own, each
participant practiced the skill set in their own time to their own standard. Again, the
facilitator was on hand should questions or queries arise from participants.
Participants were able to signal for attention from the facilitator by simply raising a
hand.
Having completed the activity section of the session, a group meeting was always
held in the last ten minutes of the session. The participants sat together with the
author and discussed what the session meant for them and this gave the opportunity
to share opinions, feelings and ideas about the intervention in general and the
session in particular. Every participant had the opportunity to speak. Participants
52
were encouraged to think of their contribution and efforts during the session in
relation to the goals of the Teaching Personal and Social Responsibility model.
Particular attention was given to reactions and thoughts relating to the goal focus of
the session and how the goal focus could be put into practice outside of the session
in other aspects of their lives.
The final part of the session allowed for self-evaluation. Remaining seated as they
were during the meeting, participant journals were individually distributed. The daily
session concluded with an evaluation by each student of his or her own behaviour
during the session in relation to the goal being worked on during that session, their
interactions with their peers, and of the author himself. The participants gave a self
evaluation in terms of personal and social responsibility from goal one to five, five
being the highest, reflecting their contribution and level of functioning during the
session as a whole. Participants were additionally encouraged to think about setting
a personal goal for themselves that they thought they could achieve for the coming
week and record it for their future reference. The final five minutes of the session
was allocated for the journal activity.
The final activity session of the current study
In the last week of the current study, a single grading class to assess the practical
karate skills of the participants was conducted where all participants were awarded
an achievement certificate. The grading class is not a prerequisite of the Hellison
(2003) model and was conducted solely for the benefit of the participants. In
addition, the grading class was conducted in December and after the final test

53
administration was completed as to not influence any participant when completing
their final measures.
Measures used in the current study
To evaluate the operational constructs of the Teaching Personal and Social
Responsibility model as described by Hellison (2003), measures were chosen to
assess each of the progressive responsibility goals as set out in the introduction
section of the current study (refer Table 5).
Table 5
Measures used to assess the constructs of the responsibility goals.
Responsibility Construct Measure
Goal 1 Self-Esteem Self-Esteem Scale
Goal 2 Self-Motivation Self-Motivation Inventory-C9
Goal 3 Self-Efficacy Self-Efficacy Questionnaire-C
Goal 4 Prosocial Behaviour Prosocial Behaviour Scale
Goal 5 Positive Behaviour Positive Behavior Scale

54
Each measure was administrated simultaneously during the model delivery. One
baseline measure was given prior to intervention commencement and five additional
administrations were conducted, approximately at eight week intervals, including a
final battery at study conclusion. An outline of each measure, and the rationale for
the respective choice of measure, is now presented.
Rosenberg's Self-Esteem Scale (S-ES)
As multiple attributes are evident for the 1st goal of the model, goal 1 could be
measured with a single prevailing construct. An option is provided by Hellison (1991,
1995) where one of the earliest ambitions for participants in his model was the
development of self-esteem. In considering the Rosenberg Self-Esteem Scale for
use in the current study to measure participant’s self-esteem, a number of other
potential psychometric measures were discounted. In a comparative review of self-
esteem measures, Blascovich and Tomaka (1991) demonstrated that the Rosenberg
Self-Esteem Scale has consistently high reliability in terms of internal reliability and
test-retest correlations, more so than any other measure focusing solely on self-
esteem. Further in their review, they point out that the Rosenberg Self-Esteem Scale
is the standard next to which new measures examining self-esteem are compared
and measured, and is quick to administer.
As an established measure of self-esteem, the Rosenberg Self-Esteem Scale has
demonstrated favourable properties including high internal reliability (α = .90) and
validity in general populations (Schmitt & Allik, 2005). The Rosenberg Self-Esteem
Scale has consistently demonstrated its utility for younger populations, positive
construct and convergent validity is noted and the measure is noted as being

55
unidimensional (Hagborg, 1993). In examining discriminant validity of the measure,
Fleming and Courtney (1984) found no significant correlations between self-esteem
scores and age (0.13) or vocabulary (-0.04). A meta-study of the measure across 53
surveyed nations revealed the mean reliability to be substantial, Cronbach's alpha
measuring .81 (Schmitt & Allik, 2005).
The Rosenberg Self-Esteem Scale is a 10 item, pencil-paper, student questionnaire
that measures overall self-esteem (Wylie, 1989). Each item is rated on a four point
Likert scale from 1 (strongly agree) to 4 (strongly disagree). Items 2, 5, 6, 9, 10 are
reverse scored. Higher scores indicate higher levels of self-esteem. Schmitt and Allik
(2005) additionally contribute that due to the extensive history of its use, its
uncomplicated language, and being quick to administer, that the measure is
particularly suitable for children.
Accordingly, the Rosenberg Self-Esteem Scale was selected for utilisation on the
basis that the measure also allows for specific self-evaluations to be combined into
an overall value of self-esteem providing what Hagborg (1993) and Huang and Dong
(2012) refer to as an excellent brief measure of global self-esteem. The Scale was
employed in the current study to measure the degree of change over time in the
student participant’s personal perception of their self-esteem, the construct for goal
one of the Teaching Personal and Social Responsibility model.
Dishman's Self-Motivation Inventory for Children (SMI-C9)
An assessment measure for goal two in the model had to be general enough to be
utilised by school aged children, but also have empirical validity in application to the

56
assessment of self-motivation in the context of physical activity. Of particular interest
to the current study, Motl, Dishman, Felton and Pate (2003) have examined
Dishman’s Self-Motivation Inventory for Children after earlier research by Biddle and
associates (1996) identified the lack of a valid measure to assess self-motivation in
children. Biddle and associates (1996) had concluded, on the basis of five
independent studies of English speaking children, that the positively worded
measure can be used reliably in intervention studies that examine self-motivation in
a physical activity context. Motl and associates (2003) subsequently verified that the
measure demonstrated strong evidence of multi-group and longitudinal factorial
invariance from a large sample of adolescent girls in their longitudinal study of
physical activity.
The Dishman Self-Motivation Inventory for Children is a 9 item pencil-paper student
questionnaire that measures overall self-motivation (Marshall & Biddle, 2001). Each
item is rated on a four point Likert scale from 1 (very unlike me) to 4 (very much like
me). All items are positively worded and positively scored. Higher scores indicate
higher levels of self-motivation. The Self-Motivation Inventory for Children is also
simple to administer and takes minutes to complete.
The Dishman Self-Motivation Inventory for Children has demonstrated acceptable
properties including acceptable reliability and validity with the specific population of
children (Motl, et al., 2003; Dishman, et al., 2008). The measure has demonstrated
high internal consistency when employed with the child population. Acceptable
evidence has also been demonstrated to support factor validity and measurement
equivalence in the measure (Smith & Bar-Eli, 2007). The measure has acceptable
internal consistency and test-retest reliability, and has reasonable concurrent and

57
predictive validity. Cronbach's alpha reliability coefficient was noted as being
acceptable at .83 (Marshall & Biddle, 2001).
In the current study, the choice of measure examining self-motivation is the second
measure to be administered in a battery of measures to be completed by the student
participants. The Dishman Self-Motivation Inventory for Children is the only measure
of its type that provides not only empirical value, but is also quick and uncomplicated
in administration. On the basis of these identified factors, the Dishman measure was
selected for the current study to assess goal two of the Hellison (2003) model;
student participant’s development of self-motivation.
Muris's Self-Efficacy Questionnaire for Children (SEQ-C)
Psychological measures examining self-efficacy are predominantly single domain
specific, for example, focusing on reading tasks or writing skills in isolation.
Additionally, as noted with self-motivation as the second goal of the model,
measures to examine self-efficacy specifically in children, are likewise sparse. In
order to examine goal three of the Hellison (2003) model, several measures would
have to be traditionally employed as multiple domains of influence are in operation.
Hellison (2003) has stated that at goal three, student participants are becoming
noticeably independent. By explanation of becoming independent, Hellison (2003)
believes that it is at goal three in his model where students may be improving in
academic ability, forming positive social relationships, and being emotionally aware
both in terms of their own feelings but also being sensitive to others. A review of the
academic literature provided one potentially suitable measure that simultaneously
examines these developmental aspects in children.

58
Muris (2001) developed the Self-Efficacy Questionnaire for Children having identified
that the assessment of self-efficacy in youth had been historically conducted using
adult measures adapted for the task. The questionnaire itself is comprised of three
subscales which link directly to Hellison’s (2003) aspirations for goal three of the
Teaching Personal and Social Responsibility model. Muris (2001) explains the
subscales as representative of three domains of self-efficacy; social self-efficacy, the
subjects’ perceived capability, peer relationships and assertiveness, academic self-
efficacy, the subjects’ perceived ability to fulfill learning objectives, and emotional
self-efficacy, the subjects’ perceived capability in successfully dealing with emotions.
The Muris Self-Efficacy Questionnaire for Children is a 24 item, pencil-paper, student
questionnaire that measures children’s perceptions of their social self-efficacy (ability
to relate and get along with other peers), emotional self-efficacy (ability to regulate
unpleasant emotions), and academic self-efficacy (ability to succeed in school and
display appropriate learning behaviours). The three subscales each contain eight
items in which participants rate their competence goal on a 5-point Likert scale from
1 (not at all) to 5 (very well). Scores are summed to yield a measure of self-efficacy
for each domain (Muris, 2001). All items are positively scored and higher scores
indicate higher levels of self-efficacy.
The measure has demonstrated acceptable reliability and validity in assessing
multidimensional self-efficacy (Suldo, Shaunessy, & Hardesty, 2008). The study
conducted by Suldo and associates (2008) demonstrated correlations between the
subscales of this measure to be positive and moderate in magnitude and the internal
consistencies for each subscale to be acceptable. The mean reliability coefficient for
the self-efficacy subscales was noted at .86 in their study. The measure has

59
demonstrated that the internal consistency reliability is satisfactory for the
assessment of self-efficacy in a normal sample of school aged children (Muris, 2001,
2002). Acceptable evidence has also been demonstrated to support factor validity in
the measure. Cronbach's alpha reliability coefficients for the subscales were reported
as .85 social self-efficacy, .86 emotional self-efficacy, and .88 for academic self-
efficacy (Muris, 2001). Finally, the subscales of the measure are significantly
intercorrelated. Children’s self-efficacy covaries across the three domains (Muris,
2001). As a specific measure designed to assess self-efficacy in children, the
measure was designated as the assessment measure for goal three of the Teaching
Personal and Social Responsibility model in the current study.
Caprara’s Prosocial Behaviour Scale (PBS)
Traditional approaches to the assessment of prosocial behaviour in children have
predominantly focused upon behavioural assessment from a third party, for example
a parent or teacher. Measures initially sought to examine such aspects of behaviour
as proactive aggression, related factors such as anxiety and depression, inattention,
and truancy. Analysis then demonstrated that the absence of such behavioural
aspects suggested that prosocial behaviour was what remained. Another approach
has been attempting to assess the construct through related concepts such as
friendliness, conformity, honesty, the display of emotional empathy, emotional
regulation, and altruism, again, from the perspective of a third party. Neither of these
options was specifically addressing the need for a self-reporting assessment of
prosocial behaviour that children could complete in the current study. A self-reporting
measure was required that specifically evaluated what student participants believed
of themselves at a prosocial level.

60
The assessment of the student participants’ level of functioning at goal four of the
Hellison (2003) model required a valid measure with wording appropriate for
children. Following ongoing research that began with Caprara and Pastorelli (1989)
assessing emotional susceptibility, they subsequently developed the Prosocial
Behaviour Scale (Capara & Pastorelli, 1993). The measure was initially developed
and employed for use with school aged children between seven and ten years of
age. The Scale is comprised of simply worded statement questions that children are
readily able to comprehend. Accordingly, the Scale is straightforward to administer
and takes minutes to complete.
The measure itself is a 15 item, pencil-paper, student questionnaire that measures
prosocial behaviour (Caprara & Pastorelli, 1993). Each item is rated on a 3-point
Likert scale from 1 (often) to 3 (never). Various items offer a description of a child’s
behaviour denoting altruism, sensitivity, trust, caring, and agreeableness each found
in Hellison’s goal 4 of the model. Each item is positively scored, 5 items serve as a
control and do not contribute to the final score. Higher scores indicate higher levels
of prosocial behaviour.
Measuring prosocial behaviour, the Caprara Prosocial Behaviour Scale has
demonstrated acceptable properties including acceptable reliability and validity (De
Minzi, Lemos, & Mesurado, 2011). The Scale has since been validated, with high
reliability coefficients, in a number of studies and continued research by Caprara and
Pastorelli (1993), and Bandura, Caprara, Barbaranelli, Gerbino, and Pastorelli
(2003). Bandura and associates (2003) stated that the Cronbach’s alpha of .95 for
reliability was significant in their study. In addition, they revealed through factor
analysis, a single factor structure for the measure. High alpha coefficients confirm

61
the internal consistency of the Caprara Prosocial Behaviour Scale and acceptable
evidence has also been demonstrated to support the factorial structure of the Scale
examined through principal component analysis (Caprara, Capanna, Steca, &
Paciello, 2005).
In the current study, the Caprara Prosocial Behaviour Scale was used to assess self-
reported prosocial behaviours of the student participants. The results from the
measure would indicate the degree to which each participant was able to
demonstrate goal four of the Teaching Personal and Social Responsibility model.
Positive Behavior Scale (Parent and Teacher versions)
Goal five is the final goal of the Hellison (2003) Teaching Personal and Social
Responsibility model. Participants at goal five of the model are able to demonstrate
the previous four goals of the model, which could be noted by any observer, and do
so outside of the training environment where the goals of the model were learnt. An
objective assessment then was required to determine if generalisation of the model’s
goals outside of the school hall had occurred for the student participants. In the
current study, it is here at goal five where the triangulation of assessment was
conducted. The objective measure chosen would be completed both by the teacher
and parent of the participating student.
Likewise, similar to the development of a prosocial measure, the development of
such a measure to examine positive behaviour has suffered in the literature as to
what constitutes a positive behaviour, including being able to measure the concept.
Traditionally, positive behaviour in children has been measured by the absence of

62
problem behaviours such as aggression, anger, or defiance, rather than the
presence of positive behaviours such as relational social skills, autonomy, or
responsibility. An additional consideration for an appropriate measure choice in the
current study was the setting for the intervention. The student participants in the
current study were predominantly from low-income families typically associated with
the decile one educational rating, the chosen measure was required to have been
validated for use in such a demographic.
To address these issues, the Positive Behavior Scale (Polit, 1998) was considered.
The Positive Behavior Scale was initially developed to examine positive behaviours
of children whom had been identified as having an economically disadvantaged
background (Quint, Bos, & Polit, 1997). It has since been verified as a reliable
measure of positive behaviour of children in home and school settings (Epps, Park,
Huston, & Ripke, 2003; Gennetian, & Miller, 2002; Linver, Roth, & Brooks-Gunn,
2009). Due to its versatility, the current study was able to utilise this measure for
parents and school teachers, perceived important adults of the child participants,
separately and independently from one another whilst measuring the same construct
(Epps, et al., 2003). The measure provided two separate streams of information to
compare and contrast the development of positive behaviours in the child
participants objectively.
The Positive Behavior Scale for parents and teachers was selected as the
assessment measure for goal five of the Teaching Personal and Social
Responsibility model. The measure asks identical questions in both versions but is
prefaced by either ‘your child’ for the parent version or ‘your student’ for the teacher
version. It is a 25 item pencil-paper adult questionnaire that measures positive
63
behaviour and is divided into three subscales for use in child populations (Gennetian
& Miller, 2002). The three subscales are social competence and sensitivity (is helpful
and cooperative), autonomy (is independent), and compliance (usually does what I
tell (him/her) to do, waits for his/her turn during activities). Items are rated on a five
point Likert scale from 1 (never) to 5 (all of the time). All items are positively worded
and positively scored. Each item is scored on a 1-5 scale. Higher scores indicate
higher levels of positive behaviour in the child by the observing parent or teacher.
As a measure of objective positive behaviour, the Positive Behavior Scale for
parents and teachers has demonstrated acceptable properties including high
reliability and high correlations for validity for use in the specific population of child
measurement (Gennetian & Miller, 2002). In the Gennetian and Miller (2002) study,
the Cronbach’s alpha for the measure is recorded at .95 with a mean of .86 across
the subscales. The Positive Behavior Scale has demonstrated high internal
consistency when employed with the target population of children. Acceptable
evidence has also been demonstrated to support factor validity and significant
measurement equivalence in the subscales for the measure, the alpha coefficients
for each of the subscales were above .90 (Epps, et al., 2003).
Data collection and administration
The current study was implemented over one scholastic year, delivering the
Teaching Personal and Social Responsibility model to the intervention school. Table
6 illustrates the testing schedule. As a longitudinal design was chosen for the current
study, a key strength of the design was having multiple waves of data collection. The
six waves, three more than the minimum recommended by Singer and Willett (2003),

64
would sufficiently illustrate change over time across the measures as completed by
the study participants.
Table 6
Testing protocol.
Administration Date Test Location Child Measures Parent / Teacher Measure
1 March School S-ES, SMI-C9, SEQ-C, & PBS
Positive Behavior Scale
2 May School S-ES, SMI-C9, SEQ-C, & PBS
Positive Behavior Scale
3 July School S-ES, SMI-C9, SEQ-C, & PBS
Positive Behavior Scale
4 September School S-ES, SMI-C9, SEQ-C, & PBS
Positive Behavior Scale
5 October School S-ES, SMI-C9, SEQ-C, & PBS
Positive Behavior Scale
6 December School S-ES, SMI-C9, SEQ-C, & PBS
Positive Behavior Scale
At each of the six test time points, the Self-Esteem Scale, Self-Motivation Inventory,
Self-Efficacy Questionnaire, and the Prosocial Behaviour Scale (denoted as S-ES,
SMI-C9, SEQ-C, & PBS respectively in Table 6) were completed by the student
participants; a Positive Behavior Scale was completed by the students’ class
teacher, and one also completed by the child’s nominated parent (refer Table 6). Six
testing administrations were conducted in total, at both participating schools, which

65
included a baseline set of measures collected at intervention commencement. The
strategy for the triangulation of assessment here involving the participants, their
teachers and parents, was to obtain quantitative results from more than one source
simultaneously. Every participant was assigned a unique alphanumeric identification
code to protect identities.
The administration of the test items for the students was conducted in the familiarity
of their usual classroom during time made available by the participating schools. The
class teachers agreed to complete one questionnaire for each of their students in
their own time as not to impact on their usual classroom teaching requirements.
Each student participant also took a parent questionnaire home to be completed by
the designated parent, ensuring that the same parent completed the questionnaire
each time. The completed questionnaire was returned in a provided sealed envelope
to the school. A dedicated drop box was provided for this purpose in both
participating schools.
Study timelines
As a summary of the intervention timeline for the current study, Table 7 presents
schedules for test administration and session plan delivery by weeks of the
intervention. As previously presented, the specificity of the test administration is
outlined in Table 6. The training session plans are individually detailed in Appendix I.

Table 7 Timelines of the current study: Intervention and test administration timeline.
Session plan timeline.
Week 1 Week 8 Week 16 Week 24 Week 32 Week 40 Week 41
Intervention start / 1st Test
Administration
2nd Test Administration
3rd Test Administration
4th Test Administration
5th Test Administration
6th Test Administration
Grading class / Intervention end
Week 1 Week 2 Week 3 Week 4 Week 5 Week 6 Week 7 Week 8 Week 9 Week 10
Session Plan 1 /
Session Plan 2
Session Plan 3 /
Session Plan 4
Session Plan 5 /
Session Plan 6
Session Plan 7 /
Session Plan 8
Session Plan 9 /
Session Plan 10
Session Plan 1 /
Session Plan 2
Session Plan 3 /
Session Plan 4
Session Plan 5 /
Session Plan 6
Session Plan 7 /
Session Plan 8
Session Plan 9 /
Session Plan 10
Week 11 Week 12 Week 13 Week14 Week 15 Week 16 Week 17 Week 18 Week 19 Week 20
Session Plan 1 /
Session Plan 2
Session Plan 3 /
Session Plan 4
Session Plan 5 /
Session Plan 6
Session Plan 7 /
Session Plan 8
Session Plan 9 /
Session Plan 10
Session Plan 1 /
Session Plan 2
Session Plan 3 /
Session Plan 4
Session Plan 5 /
Session Plan 6
Session Plan 7 /
Session Plan 8
Session Plan 9
/Session Plan 10
Week 21 Week 22 Week 23 Week 24 Week 25 Week 26 Week 27 Week 28 Week 29 Week 30
Session Plan 1 /
Session Plan 2
Session Plan 3 /
Session Plan 4
Session Plan 5 /
Session Plan 6
Session Plan 7 /
Session Plan 8
Session Plan 9 /
Session Plan 10
Session Plan 1 /
Session Plan 2
Session Plan 3 /
Session Plan 4
Session Plan 5 /
Session Plan 6
Session Plan 7 /
Session Plan 8
Session Plan 9 /
Session Plan 10
Week 31 Week 32 Week 33 Week34 Week 35 Week 36 Week 37 Week 38 Week 39 Week 40
Session Plan 1 /
Session Plan 2
Session Plan 3 /
Session Plan 4
Session Plan 5 /
Session Plan 6
Session Plan 7 /
Session Plan 8
Session Plan 9 /
Session Plan 10
Session Plan 1 /
Session Plan 2
Session Plan 3 /
Session Plan 4
Session Plan 5 /
Session Plan 6
Session Plan 7 /
Session Plan 8
Session Plan 9 /
Session Plan 10

67
Data analysis and rational
A time series investigation was chosen as the longitudinal design for the current
study. While typically, time series analysis is used where cyclical and recurring
processes are anticipated, in the present study the time series design allowed for the
examination of change over time in the participants engaged in the current
intervention study using the Teaching Personal and Social Responsibility model
(Hellison, 2003). The examination of change was administered utilising the five
measures, repeated six times, over the course of the current study. The aim of the
six administrations of measurement was to gather sufficient information as to provide
meaningful individual growth trajectories for every participant. Glass (1997), Gratton
and Jones (2004), Singer and Willett (2003) state that six sessions of data
administration and collection are sufficient to conduct a time series design. The
Hellison (2003) model does not state any determinant or specification as to when, or
at what point from participation, that any individual becomes personally and socially
responsible. As such, it was not possible to predict onset or growth for measurement
at any specific point during the intervention. Consequently, measurement was time-
structured with all participants on an identical schedule (Singer & Willett, 2003). Put
simply, the repeated measures were equally spaced over the course of the
intervention, thus offering both balance and symmetry whilst examining change in
the levels of participant responding across the measures sampled.
A complete data set from each test administration of all participants was compiled
using simple spreadsheets enabling track and trace of data. In the current study,
data collection did not suffer from missing data concerns due to non-completed,
incomplete, or lost questionnaires. There are no missing items in the final data set.

68
At the end of the school intervention phase of the study, a complete person-period
data set was organised and constructed utilising SPSS Version 19.0 for Windows
(SPSS Inc., 2010) to begin the analysis.
Before in-depth analysis of the participant data could be conducted and then drawn
from, measure reliability in the current study was an important requirement to be
established. Utilising Cronbach’s alpha coefficients for reliability at all administration
points across all measures, including respective measure subscales, would meet this
requirement (Nunnally, 1978). Having verified the reliability of the measures
employed in this study, individual and group empirical growth plots from the person-
period data set could be produced.
Statistical measurement of individual change over time
Utilising SPSS, empirical growth plots for each student participant provided an initial
indication of change over the course of the current study. A visual inspection of the
individual growth plots suggested using a parametric approach and straight line fitted
trajectories were to be applied to smooth the empirical growth records. Individual
records of the student participants demonstrated a potential fit with each projected
linear trajectory. The multiple waves of data, and initial indicators from the straight
line trajectories, provided sufficient information to select and apply a linear change
model for subsequent analysis. The resulting linear trajectories were then able to be
summarised for every student participant using exploratory ordinary least squares
(OLS) regression model fitting.

69
OLS regression trajectories were conducted for every participant over every
measure used in the current study. Utilising SPSS, the OLS trajectories were
superimposed on the participant’s respective empirical growth plots. A distinction
was then made apparent between the participants both visually in graph form, but
also in numerical summaries obtained from performing the regression. The
numerical records from the within-person regression summarised the respective
closeness of fit to trajectory lines and growth trajectories for each participant over the
course of the current study. The graphs and numerical records, generated by OLS
regression modelling, summarise how the individuals changed over the course of the
current study.
Individual trajectories demonstrated the participants change over time, for each
measure. Having explored individual change over time, individual trajectories were
then compared. Examining every participant’s smoothed trajectory simultaneously
illustrated interindividual differences between the participants that had occurred over
time. Continuing with OLS regression methods, a collection of fitted OLS trajectories
for every participant for each measure was constructed. One graph featuring every
participant’s trajectory, with a corresponding numerical record, was produced for
each measure employed. For each graph, an average summary trajectory was
additionally superimposed upon the collection of individual OLS trajectories. The
average summary trajectory allowed for the comparison between individual change
in relation to group change.
In selecting a linear individual change model for the current study, each participant’s
growth is summarised as the fitted intercept and fitted slope for each measure
obtained from the numerical records generated from the OLS regression procedures.

70
A comparison of initial intercepts for each of the participants illustrated the
interindividual differences between participants across each measure at study
commencement, and the initial intercepts are the estimate of each participant’s initial
status at that point. The variation in the fitted slopes illustrated the interindividual
differences in the rates of change in each of the measures sampled over the course
of the current study.
To summarise the OLS trajectories, standardisation of the measures provided an
overview of measure trajectories by group. The simultaneous presentation allowed
for a comparison for each measure, including respective subscales, at each
administration during the current study. Visual differences are made apparent
between the participant groups across the six times points. Standardisation of the
measures completed by the children, and measures completed by the parents and
the teachers were reported separately.
To determine the nature of the relationship between the initial status and the rate of
change of individual differences, analysis of correlation coefficients between
intercepts and slopes was conducted. The correlation coefficients illustrated the
nature of the relationship between participants’ initial status at study commencement
and the rate of any subsequent change over the course of the current study, for each
of the employed measures. Numerical records produced from the correlation
coefficient analysis display interactional relationships between the measures
indicating if change over time was illustrated by any measure(s) in particular, or by
the group of measures as a whole. A determination of the nature of the relationship
between the measures could then be described by comparing any participant’s initial

71
status for each measure in relation to the rate of change observed over the same
measure in the current study.
Statistical measurement of group change over time
To conclude the analysis, a repeated measures (multivariate repeated measures
manova) analysis would be applied to the four measures completed by the student
participants over the six time points. Statistical power has been previously addressed
for the current study. However the differences between group compositions required
a more conservative estimate of the effects. Pillai’s Trace multivariate test was used
because of its robustness in the presence of unequal dependent variate variance
(Olson, 1976). Mean differences between the groups, across the six time points were
assessed for each of the measures at the multivariate level due to a violation of
assumptions for sphericity. As multivariate tests were used, univariate tests were
substituted with an analysis of subjects effects as it is equivalent to a one-way
analysis of variance (Ho, 2006). Differences of the mean scores for each of the
measures indicated intervention differences and were accordingly interpreted.
Comparisons were made for respective effects between the groups and over the
time points. A statistical claim was made regarding the mean differences between
the intervention and control groups from participating in an application of the
Teaching Personal and Social Responsibility model for the current study.
Finally for the parent and teacher assessment, independent t-tests were used to
determine if the parent and teacher groups differed on the Positive Behavior Scale.
One each would be completed for the parent and teacher of both the intervention
and control groups for differences in terms of their means over the course of the

72
current study. In comparing the results of the independent t-tests, an indication
would be given for group differences of mean significant change in positive
behaviour from the observations of their respective parents and teachers.
The application of Guttman scaling in the current study
A secondary analysis was possible in examining the data so that both items and
subjects can be assessed as a single cumulative dimension of the measures at each
time point. In so doing, it was possible to test the stage-like progression assumption
of the Hellison’s (2003) Teaching Personal and Social Responsibility model. In the
current study, the possibility for stage progression was assessed using Guttman’s
(1950) scaling protocol, referred to as Scalogram Analysis. Specifically, Scalogram
Analysis was employed to determine if the administered measures in the current
study possessed scalability and could therefore form a scalogram. Scalogram
analysis requires the transformation of measure scores to a mean score per item per
individual. An assessment to see if respondents could climb the scalogram over
time, from repeat administrations of what becomes a unidimensional scale of the
combined measures at each time point, could be conducted. Further detail in the
application of Scalogram Analysis in the current study is detailed in Chapter 5 of this
thesis.

73
Chapter 3
Preliminary Results
This chapter begins the presentation of the results obtained from the analysis of the
data collected in the current study. The data collection phases during the intervention
proved crucial to the analysis in two ways. Firstly, there are no missing items from
any of the measures and second, there was a complete return rate on all of the
questionnaires, from every administration. Thus the current study explores the data
as it was collected, without having to complete missing data procedures, and
avoiding any potential for bias that missing information may promote.
The results of the reliability analysis performed on all composite measures employed
are presented initially. An assessment of the amount of variance within the data
across all measures was then conducted using ordinary least squares regression
model fitting. Having confirmed the degree of variance, a correlation analysis was
performed to determine if measures co-varied. The degree of association between
the measures would identify if any of the measures had greater sensitivity to the
intervention, and if one or more measures performed in accordance with any other in
terms of initial equivalence or rate of change. Standardisation of the mean score of
each of the measures was then performed, and then presented simultaneously,
allowing for a visual assessment and comparison of the rate of averaged change
between the study groups. Of consequence to the current study, the results taken
together would give an initial indication if change in the intervention group occurred
in accordance with the stage progression theory of the Hellison (2003) model, or
otherwise.
74
Reliability analysis
To make certain that the results were well supported and accurate; an initial step of
confirming the reliability of the main outcome measures was required. The integrity
of the overall analysis and study results would then be reinforced. Whilst reliability of
the variable measures employed in this study have been demonstrated in the
literature as previously discussed, it was necessary to re-assess their reliability
within the specific context of the present study.
The reliability analysis was performed using SPSS Version 19.0 for Windows (SPSS
Inc., 2010). For ease of visual reference, means and standard deviations are
presented in Table 8 for the self-reporting measures completed by the child
participants, and Table 9 for the Positive Behavior Scale completed by their
respective class teacher and designated parent. Table 10 provides the results of the
reliability analysis for all of the measures completed in the current study. As evident
in Table 10, the average alphas across the measures were acceptable, each greater
than α = 0.70. The reliability analysis of the measures demonstrates psychometric
evidence for all of the utilised measures based on thresholds cited within the
literature (Nunnally, 1978).
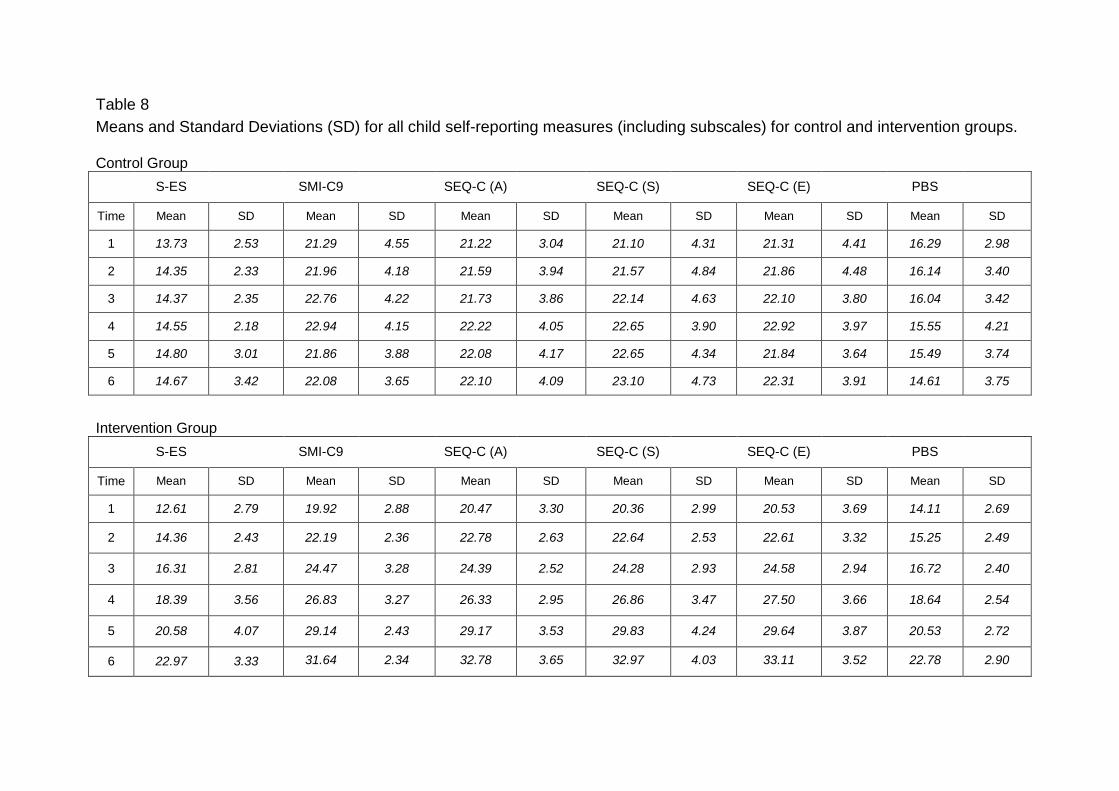
Table 8 Means and Standard Deviations (SD) for all child self-reporting measures (including subscales) for control and intervention groups.
Control Group S-ES SMI-C9 SEQ-C (A) SEQ-C (S) SEQ-C (E) PBS
Time Mean SD Mean SD Mean SD Mean SD Mean SD Mean SD
1 13.73 2.53 21.29 4.55 21.22 3.04 21.10 4.31 21.31 4.41 16.29 2.98
2 14.35 2.33 21.96 4.18 21.59 3.94 21.57 4.84 21.86 4.48 16.14 3.40
3 14.37 2.35 22.76 4.22 21.73 3.86 22.14 4.63 22.10 3.80 16.04 3.42
4 14.55 2.18 22.94 4.15 22.22 4.05 22.65 3.90 22.92 3.97 15.55 4.21
5 14.80 3.01 21.86 3.88 22.08 4.17 22.65 4.34 21.84 3.64 15.49 3.74
6 14.67 3.42 22.08 3.65 22.10 4.09 23.10 4.73 22.31 3.91 14.61 3.75
Intervention Group S-ES SMI-C9 SEQ-C (A) SEQ-C (S) SEQ-C (E) PBS
Time Mean SD Mean SD Mean SD Mean SD Mean SD Mean SD
1 12.61 2.79 19.92 2.88 20.47 3.30 20.36 2.99 20.53 3.69 14.11 2.69
2 14.36 2.43 22.19 2.36 22.78 2.63 22.64 2.53 22.61 3.32 15.25 2.49
3 16.31 2.81 24.47 3.28 24.39 2.52 24.28 2.93 24.58 2.94 16.72 2.40
4 18.39 3.56 26.83 3.27 26.33 2.95 26.86 3.47 27.50 3.66 18.64 2.54
5 20.58 4.07 29.14 2.43 29.17 3.53 29.83 4.24 29.64 3.87 20.53 2.72
6 22.97 3.33 31.64 2.34 32.78 3.65 32.97 4.03 33.11 3.52 22.78 2.90

Table 9 Means and Standard Deviations (SD) for the Positive Behavior Scale (teachers(T) and parents(P) by subscale) for control and intervention groups.
Control Group PBS T (Sc) PBS T (A) PBS T (C) PBS P (Sc) PBS P (A) PBS P (C)
Time Mean SD Mean SD Mean SD Mean SD Mean SD Mean SD
1 34.29 6.11 16.84 2.39 28.08 4.18 34.82 5.60 15.43 2.81 26.76 4.08
2 35.63 6.01 16.96 2.57 28.29 3.97 36.31 5.72 15.49 3.03 27.71 4.66
3 34.53 5.73 16.82 2.94 29.29 4.25 35.18 6.18 16.18 3.29 27.84 4.79
4 35.06 7.55 16.69 3.10 29.06 6.02 36.92 6.31 16.20 3.00 29.33 5.94
5 37.20 6.25 17.43 2.64 30.10 4.92 36.35 6.20 16.43 3.12 28.71 5.49
6 37.43 6.12 17.33 2.36 29.43 4.75 36.80 6.60 15.84 2.79 29.18 4.98
Intervention Group PBS T (Sc) PBS T (A) PBS T (C) PBS P (Sc) PBS P (A) PBS P (C)
Time Mean SD Mean SD Mean SD Mean SD Mean SD Mean SD
1 32.31 4.68 15.03 2.12 27.28 3.25 32.72 4.55 14.56 1.93 27.31 2.91
2 32.92 4.56 15.42 2.02 27.97 2.97 34.00 4.60 15.97 1.92 28.72 2.67
3 35.56 4.58 16.31 1.86 29.36 3.34 36.25 5.78 17.00 2.32 29.75 2.99
4 36.81 3.96 17.14 1.69 31.97 3.32 37.94 5.21 18.14 2.55 32.39 4.11
5 40.78 4.40 18.97 1.46 35.00 3.13 42.53 4.63 20.42 2.26 35.78 4.40
6 44.61 3.83 21.22 1.39 38.08 2.94 46.17 4.41 22.75 1.93 39.61 3.68

Table 10 Reliability analysis of all measures (including subscales) calculated with Cronbach’s alpha.
Key Child Measures: Teacher / Parent Measure: S-ES Self-Esteem Scale PBS T (Sc) Positive Behavior Scale - Teacher (Social competence subscale) SMI-C9 Self-Motivation Inventory (C9) PBS T (A) Positive Behavior Scale - Teacher (Autonomy subscale) SEQ-C (A) Self-Efficacy (Academic subscale) PBS T (C) Positive Behavior Scale - Teacher (Compliance subscale) SEQ-C (S) Self-Efficacy (Social subscale) PBS P (Sc) Positive Behavior Scale - Parent (Social competence subscale) SEQ-C (E) Self-Efficacy (Emotional subscale) PBS P (A) Positive Behavior Scale - Parent (Autonomy subscale) PBS Positive Behavior Scale PBS P (C) Positive Behavior Scale - Parent (Compliance subscale)
Time S-ES SMI-C9 SEQ-C (A)
SEQ-C (S)
SEQ-C (E)
PBS PBS T (Sc)
PBS T (A)
PBS T (C)
PBS P (Sc)
PBS P (A)
PBS P (C)
1 .84 .84 .83 .82 .80 .82 .89 .85 .94 .92 .89 .94
2 .89 .83 .80 .85 .81 .83 .92 .92 .94 .93 .92 .94
3 .82 .84 .80 .82 .84 .78 .91 .92 .95 .92 .93 .95
4 .85 .84 .83 .83 .81 .82 .93 .92 .94 .94 .93 .94
5 .85 .86 .86 .85 .83 .80 .92 .92 .94 .94 .93 .95
6 .85 .85 .86 .84 .82 .77 .93 .92 .95 .95 .92 .94
Average Alpha α
.85 .84 .83 .84 .82 .80 .92 .91 .94 .93 .92 .94
78
Determination of variance in the data
For the current study, being able to determine the degree of empirical equivalency
between the study groups was an important feature of the investigation. Through the
employed measures at study outset for the control and intervention groups, the
mean initial intercepts at the first administration were similar. For the child, parent,
and teacher results, it was demonstrated that near identical empirical groups of
participants existed for evaluation in the current study. Further points on group
equivalency are detailed in each respective section hereafter.
To adequately explore and report the data clearly, the analysis is presented in two
parts. The first section examines the collected data from the measures completed by
the child participants; the second section examines the collected data from the
measures completed by the child’s class teacher and respective designated parent.
Assessing the variance in the child measures
An exploration of the child variables (self esteem, self motivation, self efficacy, and
prosocial behaviour) was required to determine the degree of variability in these
measures. In the current study, the control and intervention groups of child
participants completed these four separate subjective self evaluation measures six
times during the course of the study. It was expected that sufficient variability in each
respective outcome variable would exist.
For exploratory purposes, ordinary least squares (OLS) regression model fitting
using SPSS was employed initially at an individual level for every participant in each

79
group in the current study (Appendix J). Fitted OLS trajectories were determined and
averaged change trajectories are used to illustrate comparative differences between
the study groups for each measure. A significant degree of variance in the current
study between the intervention and control groups was demonstrated.
Graphical representations for the results of the regression model fitting are
presented in Figure 5 through to Figure 16. Each measure has a companion pair of
figures. For ease of reference, the graphed results for each measure are initially from
the control group followed by the intervention group. Results are presented at the
level of sample average in both groups. The mean summary of each measure is
displayed using a single red trajectory across each of the six sampled time points.
When comparing the range of trajectories between the control and intervention
groups at study outset, the control group demonstrates a minor representation of
individuals with higher initial points at study commencement in two of the measures
surveyed. Referring to the self-motivation measure and the social and autonomy
subscales of the self-efficacy measure (refer Figures 7, 9 and 11 respectively), there
is a visual difference between these and the intervention group (refer Figures 8, 10,
and 12). Despite the variation, the commencement points of the OLS averaged
trajectories are equivalent between the two groups. The equivalency in the averaged
trajectories in each of the measures at study commencement demonstrates sufficient
matching between the intervention and control groups prior to the implementation of
the current study. Referring to the initial intercepts at time point one for each
measure (Figures 5-16), the single red line in each of the measures illustrate a
similar averaged trajectory commencement for both the control and intervention
groups for the child measures.

80
Results from the control group on the child measures
The pattern of average change for the control group generally demonstrated a
maintained averaged OLS trajectory, for each self reporting measure over the time
frame of the current study. There are some minor variations, including mixed positive
and negative change, in the control group for some of the participants in each
measure.
The range of individual trajectories in the self esteem measure (Figure 5) is narrow
indicating an almost static result for this measure across the control group
participants during the course of the current study. The self-motivation and self-
efficacy measures demonstrate the greatest degree of variation (Figures 7, 9, 11,
and 13) in the control group. At the group level, the averaged OLS trajectories
illustrate a sustained result over the course of the current study for each measure
and respective subscale with one exception. The self-efficacy social subscale
demonstrates a minor increase over the course of the current study (Figure 11). In
addition, each measure demonstrated significant variation at an individual level, in
terms of positive and negative growth trajectories.
In the last self-reporting measure surveyed, the averaged trajectory for the Prosocial
Behaviour Scale (PBS) illustrates a continued decrease in the rate of change over
the course of the current study for the control group, with a marked decline at the
final time point (Figure 15).

81
Results from the intervention group on the child measures
In comparison, for each of the self-reporting measures completed by the members of
the intervention group, increased positive change over the course of the study was
reported. In addition, the average change for the intervention group is prominent,
demonstrated by the start point, slope, and finish point of the single red trajectory
line in every measure. Additionally, there are several noteworthy occurrences in the
self-reporting measures from the children of the intervention group.
For the intervention participants, the averaged OLS trajectories demonstrate near
linear rates of positive change in both the self-esteem measure (S-ES) displayed in
Figure 6 and the self-motivation measure (SMI-C9) in Figure 8. The self-efficacy
measure (SEQ-C) demonstrated some minor variations in terms of the rate of
positive change, noted on the academic (A) and emotional (E) subscales (refer
Figures 10 and 14). The steepness of growth for a minority of the intervention
subjects, who began with higher than average initial start points in the measure,
demonstrated a slower rate of positive change over time. The Prosocial Behaviour
Scale (PBS) illustrated the slowest rate of initial growth, over time points 1-3, of all
the self reporting measures surveyed in the current study for the intervention group
(Figure 16). Further, a marked increased in the rate of positive change is noted from
time point five to study conclusion at time point six.

82
Figure 5: Control OLS trajectories for the S-ES measure.
Figure 6: Intervention OLS trajectories for the S-ES measure.

83
Figure 7: Control OLS trajectories for the SMI-C9 measure.
Figure 8: Intervention OLS trajectories for the SMI-C9 measure.
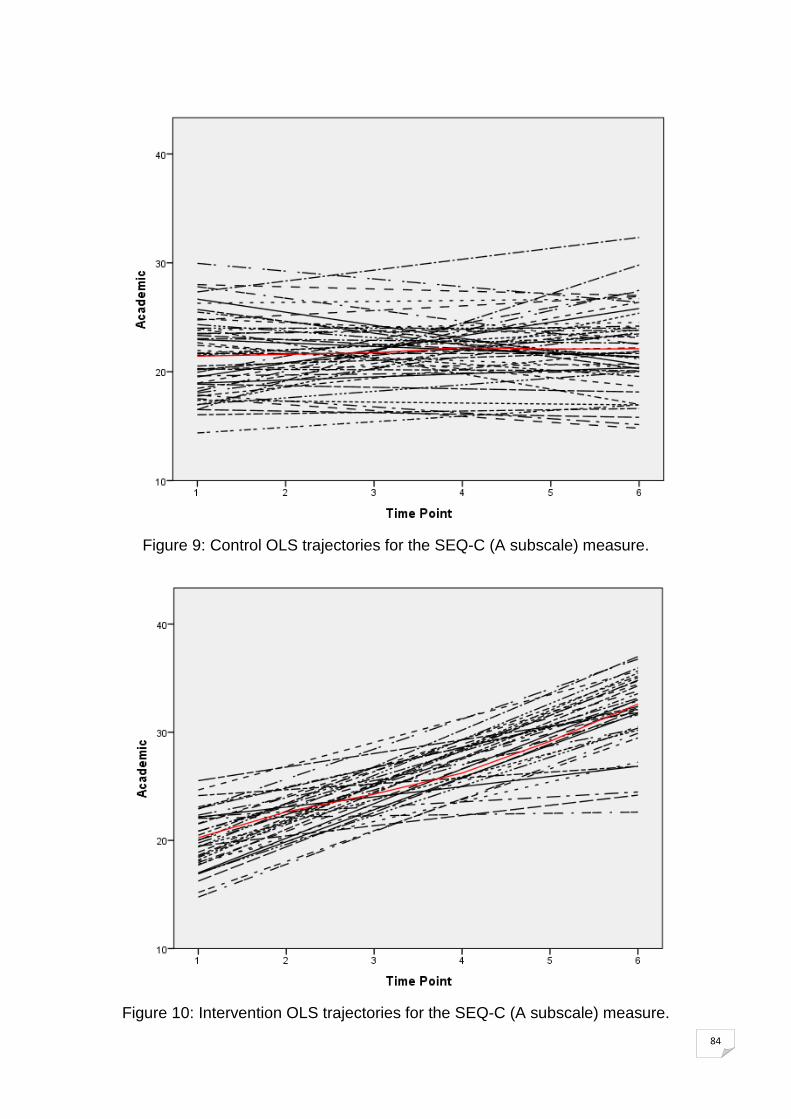
84
Figure 9: Control OLS trajectories for the SEQ-C (A subscale) measure.
Figure 10: Intervention OLS trajectories for the SEQ-C (A subscale) measure.

85
Figure 11: Control OLS trajectories for the SEQ-C (S subscale) measure.
Figure 12: Intervention OLS trajectories for the SEQ-C (S subscale) measure.

86
Figure 13: Control OLS trajectories for the SEQ-C (E subscale) measure.
Figure 14: Intervention OLS trajectories for the SEQ-C (E subscale) measure.

87
Figure 15: Control OLS trajectories for the PBS measure.
Figure 16: Intervention OLS trajectories for the PBS measure.

88
Overview of the child measures
To summarise, the following two graphs illustrate the standardised mean OLS
trajectories for each child measure completed in the current study. Each measure’s
trajectory line respectively demonstrates the standardised average rate of change
over time in Figure 17 for the control group and Figure 18 for the intervention group.
For reference, the measures are denoted as S-ES (Self-Esteem Scale), SMI-C9
(Self-Motivation Inventory), SEQ-C(A) (Self-Efficacy Questionnaire, academic
subscale), SEQ-C(S) (Self-Efficacy Questionnaire, social subscale), SEQ-C(E) (Self-
Efficacy Questionnaire, emotional subscale), and PBS (Prosocial Behaviour Scale).
40
45
50
55
60
65
70
75
80
85
90
Time 1 Time 2 Time 3 Time 4 Time 5 Time 6
Mea
n To
tal S
core
s
S-ES SaI-C9 SEQ-C (A) SEQ-C (S) SEQ-C (E) tBS
Figure 17: Standardised OLS mean trajectories by measure - Control group.

89
40
45
50
55
60
65
70
75
80
85
90
Time 1 Time 2 Time 3 Time 4 Time 5 Time 6
Mea
n To
tal S
core
SES SaI-C9 SEQ-C (A) SEQ-C (S) SEQ-C (E) tBS
Figure 18: Standardised OLS mean trajectories by measure - Intervention group.
Differences between the intervention and control sample are visibly perceptible when
comparing Figures 17 and 18. Of the measures sampled, the participants in the
control group had no remarkable variation in the rate of positive change across these
measures during the current study. When comparing initial start points with time six
in isolation, the majority of the measures illustrate a sustained averaged trajectory
line (Figure 17). There are notable exceptions illustrated over the time points
however. The Self-Motivation Inventory (SMI-C9) demonstrated an initial gradual
increase in the measure to point four before declining back at point five. The social
Self-Efficacy Questionnaire subscale (SEQ-C(S)) demonstrated an averaged minor
90
increase over the current study. Finally, the Positive Behavior Scale (PBS)
demonstrated a continued decline for the control participants over the same period of
time.
The results for the intervention group are outstanding for all the child measures
surveyed (Figure 18). Having previously demonstrated empirical equivalence at
commencement, the results for the intervention group demonstrate reliable and
considerable rates of positive change across all sampled measures at every time
point. These standardised results for the intervention sample illustrate increased and
improved responding by the child participants throughout the current study. Further
analysis of the interaction of the measures between the groups was warranted.
Assessing the variance from the Positive Behavior Scale - parent and teacher
measure
The second section here explores the results from the Positive Behavior Scale (Polit,
1998), completed by the teachers and parents of the participants in each group. The
Positive Behavior Scale is comprised of three subscales. The subscales are social
competence (SC), autonomy (A), and compliance (C). Two versions of the Positive
Behavior Scale are used, one version for teachers and the second for parents. For
the ease of reference, these two versions of the Positive Behavior Scale are denoted
as PBS(T) for the teacher version and PBS(P) for the parent version. The results
gained from both versions of this measure were hypothesised to show progressive
positive change across all subscales in the intervention group. In comparison, results
from the control group were expected to show consistent scores or possible minimal
positive change due to maturation over the course of the current study.
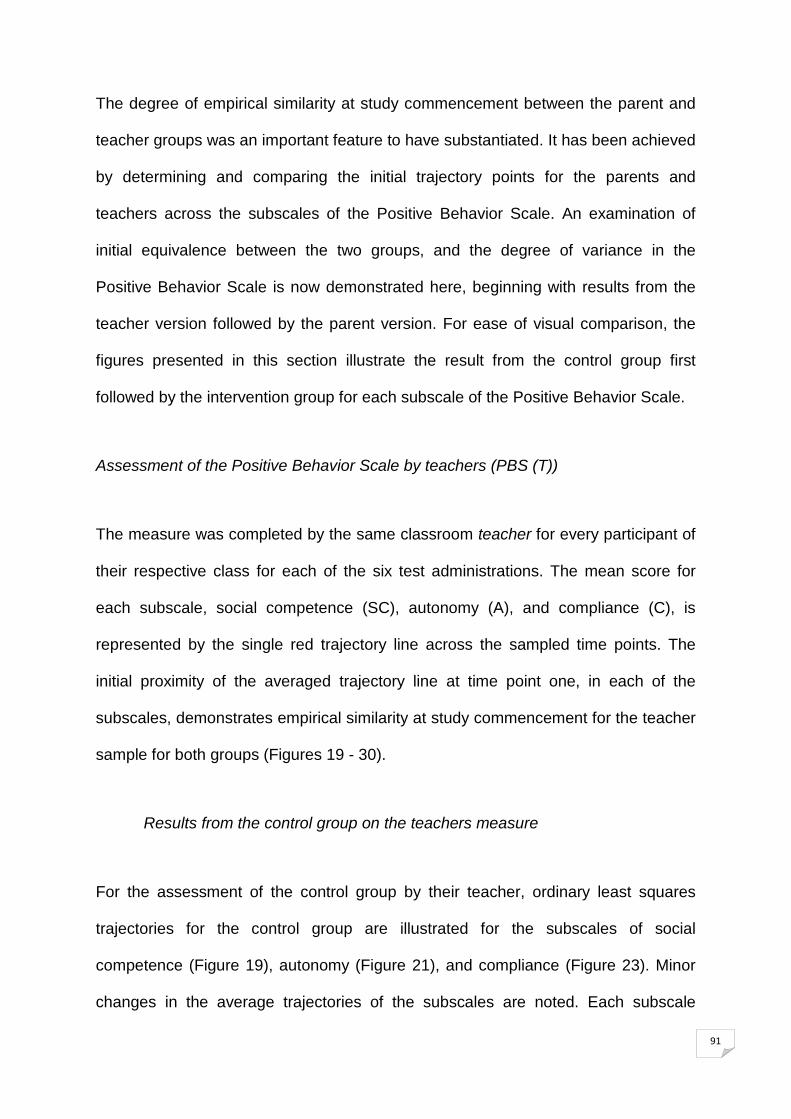
91
The degree of empirical similarity at study commencement between the parent and
teacher groups was an important feature to have substantiated. It has been achieved
by determining and comparing the initial trajectory points for the parents and
teachers across the subscales of the Positive Behavior Scale. An examination of
initial equivalence between the two groups, and the degree of variance in the
Positive Behavior Scale is now demonstrated here, beginning with results from the
teacher version followed by the parent version. For ease of visual comparison, the
figures presented in this section illustrate the result from the control group first
followed by the intervention group for each subscale of the Positive Behavior Scale.
Assessment of the Positive Behavior Scale by teachers (PBS (T))
The measure was completed by the same classroom teacher for every participant of
their respective class for each of the six test administrations. The mean score for
each subscale, social competence (SC), autonomy (A), and compliance (C), is
represented by the single red trajectory line across the sampled time points. The
initial proximity of the averaged trajectory line at time point one, in each of the
subscales, demonstrates empirical similarity at study commencement for the teacher
sample for both groups (Figures 19 - 30).
Results from the control group on the teachers measure
For the assessment of the control group by their teacher, ordinary least squares
trajectories for the control group are illustrated for the subscales of social
competence (Figure 19), autonomy (Figure 21), and compliance (Figure 23). Minor
changes in the average trajectories of the subscales are noted. Each subscale
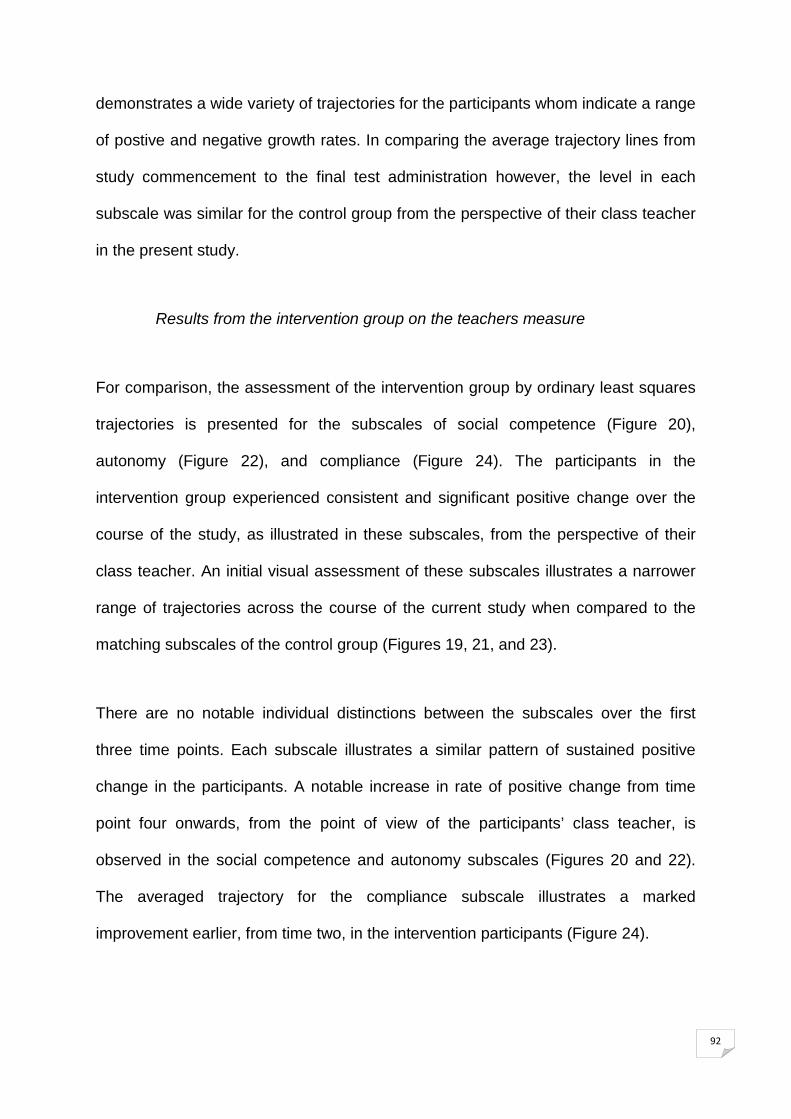
92
demonstrates a wide variety of trajectories for the participants whom indicate a range
of postive and negative growth rates. In comparing the average trajectory lines from
study commencement to the final test administration however, the level in each
subscale was similar for the control group from the perspective of their class teacher
in the present study.
Results from the intervention group on the teachers measure
For comparison, the assessment of the intervention group by ordinary least squares
trajectories is presented for the subscales of social competence (Figure 20),
autonomy (Figure 22), and compliance (Figure 24). The participants in the
intervention group experienced consistent and significant positive change over the
course of the study, as illustrated in these subscales, from the perspective of their
class teacher. An initial visual assessment of these subscales illustrates a narrower
range of trajectories across the course of the current study when compared to the
matching subscales of the control group (Figures 19, 21, and 23).
There are no notable individual distinctions between the subscales over the first
three time points. Each subscale illustrates a similar pattern of sustained positive
change in the participants. A notable increase in rate of positive change from time
point four onwards, from the point of view of the participants’ class teacher, is
observed in the social competence and autonomy subscales (Figures 20 and 22).
The averaged trajectory for the compliance subscale illustrates a marked
improvement earlier, from time two, in the intervention participants (Figure 24).

93
Assessment of the Positive Behavior Scale by parents (PBS (P))
The Positive Behavior Scale(P) was completed by the parents of the participants. It
is identical to the teacher version, with phrasing altered for the parent perspective,
and it has the same set of three subscales. As with the teacher version, the three
subscales are social competence (SC), autonomy (A), and compliance (C). The
Positive Behavior Scale(P) was completed by the same dedicated parent of each
respective child participant at each administration throughout the study.
Near equivalent starting points at study implementation on each subscale are
demonstrated in the results for the parents of both the control and intervention
groups. Referring to the average single red trajectory lines, the lines in each
subscale illustrate empirical similarity between the parents of the control and
intervention groups at study commencement (Figures 25 - 30).
Results from the control group on the parents measure
The results from the parents of the control group participants are presented as
ordinary least squares trajectories illustrating the social competence (Figure 25),
autonomy (Figure 27), and compliance (Figure 29) subscales. In comparing
respective initial points with final points on each subscale, the parents perspective
demonstrates an average sustained result across the course of the current study
without major improvement in the control participants.
Similarly to the teachers of the control group, the parent trajectories display an
average result sustained over the course of the current study for the participants.

94
The averaged trajectory lines do manifest minor fluctuations in the subscales,
however, they are not meaningful to the final outcome. The subscales also highlight
a similar range of individual trajectories noted in the teacher subscales (Figures 19,
21, and 23).
Results from the intervention group on the parents measure
The results of the Positive Behavior Scale from the parents’ perspective of their
respective children are presented using ordinary least squares trajectories and are
illustrated using the same subscales. Similarly to the teachers results for the
intervention group, social competence (Figure 26), autonomy (Figure 28), and
compliance (Figure 30) subscales each demonstrate a narrower range of individual
trajectory lines when compared to the parents of the control group (Figures 25, 27,
and 29), both at study commencement through to study conclusion. In addition, the
start points of the averaged trajectories (single red line) are similar for both the
parent (Figures 26, 28, and 30) and teacher assessments (Figures 20, 22, and 24) of
the intervention group demonstrating empirical equivalence.
Across each of the subscales, rates of increased positive growth are reported by the
parents of the intervention participants over the course of the current study. Similarly
to the teacher results for the intervention group, the social competence and
autonomy subscales display a marked escalation in the averaged trajectory line from
time point 4. The compliance subscale also demonstrates a similar rate of increase,
although earlier from time point 3. For both the parent and teacher perspective, the
compliance subscale accelerated first during the current study. Also, both the parent

95
and teacher groups report a similar range of individual change trajectories, each
being positive, across each of the subscales.
Variety of trajectories from the Positive Behavior Scale
It was consistently demonstrated in the results from the Positive Behavior Scale
completed by the teachers and parents that a wide range of individual trajectories
were presented in the control sample. In comparison, the intervention group results
display a narrower range and variety of trajectories. A visual observation may
suggest that both parents and teachers of one group of participants were aware of
the current study to the point of demonstrating some form of response bias.
However, the control and intervention groups were not numerically equivalent in
terms of the number of participants in each group. By equating the two groups
numerically, potentially removing 13 individuals from the control trajectories, it would
quieten some of the noise in the control data and visually improve the appearance of
the grouped trajectories. However, the initial status of the averaged trajectory for
both groups, across each of the subscales, is near equivalent at study outset. The
rate, and degree, of change demonstrated in both groups from the average initial
status onwards does differ between the two groups during the course of the current
study, not at study outset.

96
Figure 19: Control OLS trajectories for the Positive Behavior Scale (T)
(subscale SC).
Figure 20: Intervention OLS trajectories for the Positive Behavior Scale (T)
(subscale SC).

97
Figure 21: Control OLS trajectories for the Positive Behavior Scale (T)
(subscale A).
Figure 22: Intervention OLS trajectories for the Positive Behavior Scale (T)
(subscale A).

98
Figure 23: Control OLS trajectories for the Positive Behavior Scale (T)
(subscale C).
Figure 24: Intervention OLS trajectories for the Positive Behavior Scale (T)
(subscale C).
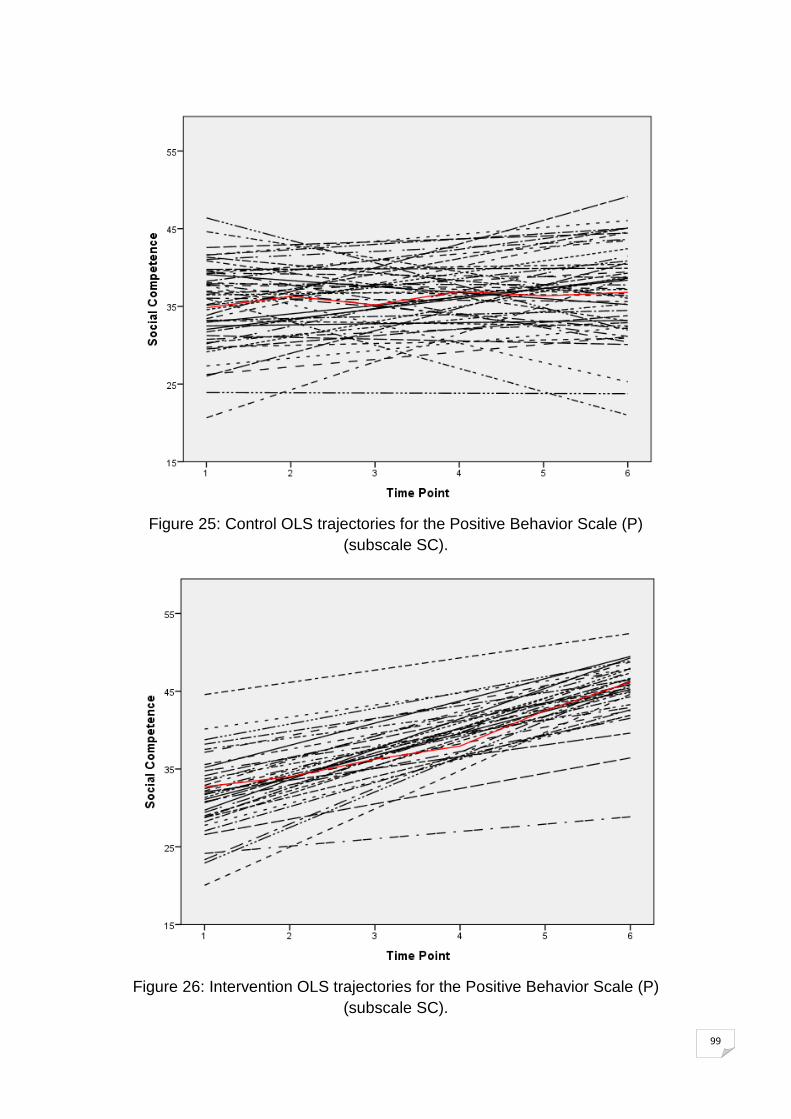
99
Figure 25: Control OLS trajectories for the Positive Behavior Scale (P)
(subscale SC).
Figure 26: Intervention OLS trajectories for the Positive Behavior Scale (P)
(subscale SC).

100
Figure 27: Control OLS trajectories for the Positive Behavior Scale (P)
(subscale A).
Figure 28: Intervention OLS trajectories for the Positive Behavior Scale (P)
(subscale A).

101
Figure 29: Control OLS trajectories for the Positive Behavior Scale (P)
(subscale C).
Figure 30: Intervention OLS trajectories for the Positive Behavior Scale (P)
(subscale C).

102
Overview of the Positive Behavior Scale - parent and teacher measure
The standardised mean OLS trajectories for the Positive Behavior Scale employed in
the current study are summarised in the following section. For ease of reference, the
subscales of the Positive Behavior Scale (PBS) for the teacher (T) and parent (P)
versions are denoted as social competence (SC), autonomy (A), and compliance
(C). Each OLS trajectory line represents a subscale of the Positive Behavior Scale
and respectively demonstrates the average rate of change over time for each
participant group from the perspective of the participants’ class teacher and parent.
40
45
50
55
60
65
70
75
80
85
90
95
Time 1 Time 2 Time 3 Time 4 Time 5 Time 6
Mea
n To
tal S
core
tBS(T) (SC) tBS(T) (A) tBS(T) (C)
Figure 31: Teachers standardised OLS mean trajectories by subscale – Control
group.
From the teacher’s perspective, Figure 31 illustrates the result for the control group.
The results for the control group did not improve or increase significantly on average

103
over the course of the current study. A visual comparison of the time point summary
across of the subscales highlights near flat trajectories across the course of the
current study, indicating minimal change over time for the control participants. There
is one instance of decline in each of the subscales at time point four, which was not
considered significant in the context of the final result for the control group. The
participants of the control group demonstrated a minor increase in the social
competency (SC) and autonomy (A) subscales from the teacher’s perspective, but a
decrease in compliance (C) over the course of the current study.
40
45
50
55
60
65
70
75
80
85
90
95
Time 1 Time 2 Time 3 Time 4 Time 5 Time 6
Mea
n To
tal S
core
tBS(T) (SC) tBS(T) (A) tBS(T) (C)
Figure 32: Teachers standardised OLS mean trajectories by subscale -Intervention
group.
In comparison, the averaged result of the intervention sample increased and
improved throughout the study as illustrated in Figure 32. The intervention group
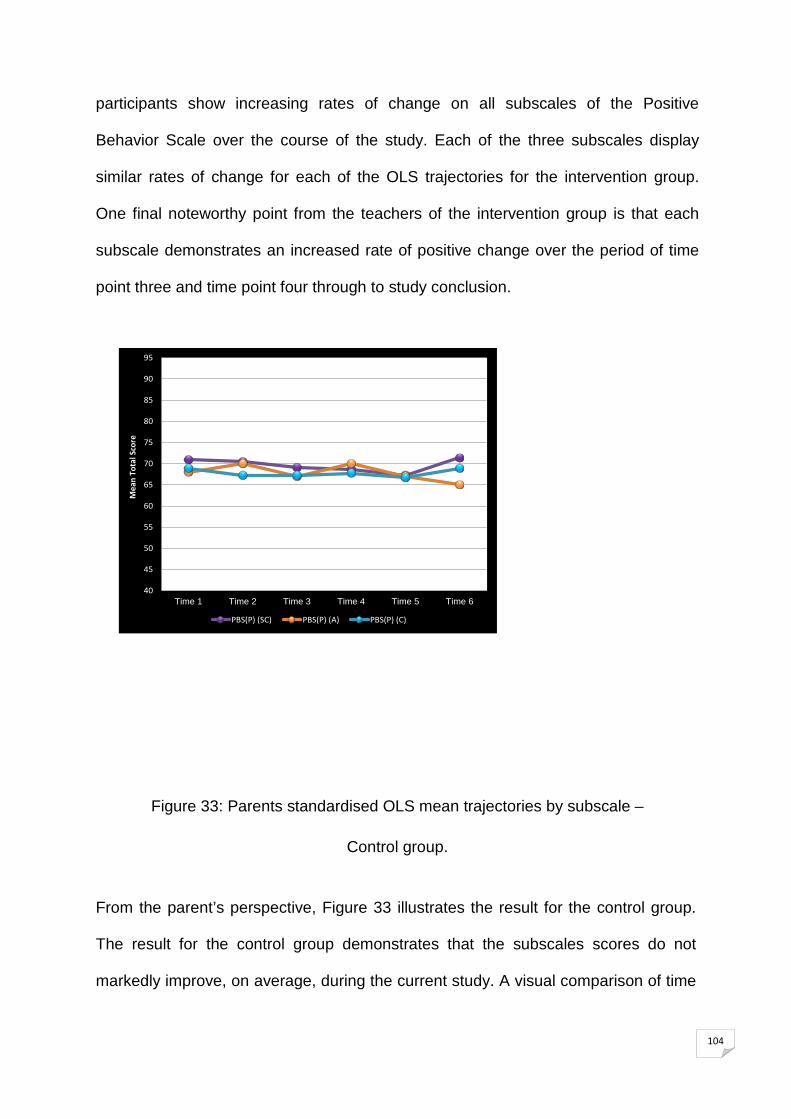
104
participants show increasing rates of change on all subscales of the Positive
Behavior Scale over the course of the study. Each of the three subscales display
similar rates of change for each of the OLS trajectories for the intervention group.
One final noteworthy point from the teachers of the intervention group is that each
subscale demonstrates an increased rate of positive change over the period of time
point three and time point four through to study conclusion.
40
45
50
55
60
65
70
75
80
85
90
95
Time 1 Time 2 Time 3 Time 4 Time 5 Time 6
Mea
n To
tal S
core
tBS(t) (SC) tBS(t) (A) tBS(t) (C)
Figure 33: Parents standardised OLS mean trajectories by subscale –
Control group.
From the parent’s perspective, Figure 33 illustrates the result for the control group.
The result for the control group demonstrates that the subscales scores do not
markedly improve, on average, during the current study. A visual comparison of time

105
point summary scores across each of the subscales highlights near flat trajectories
across the course of the current study, indicating minimal change over time for the
control participants. The near flat trajectories demonstrate that the initial status of the
trajectories were equivalent until time point 4. At time point 4, the subscales decline
to time point 5. From time point 5 the autonomy subscale continues to decline, where
as the social competence and compliance subscales return to points similar to time
point one.
In comparing the standardised OLS mean trajectories from the parent’s perspective,
marked differences are visibly made evident when comparing the control group with
the result from the intervention group illustrated in Figure 34.
40
45
50
55
60
65
70
75
80
85
90
95
Time 1 Time 2 Time 3 Time 4 Time 5 Time 6
Mea
n To
tal S
Core
tBS(t) (SC) tBS(t) (A) tBS(t) (C)
Figure 34: Parents standardised OLS mean trajectories by subscale –
Intervention group.
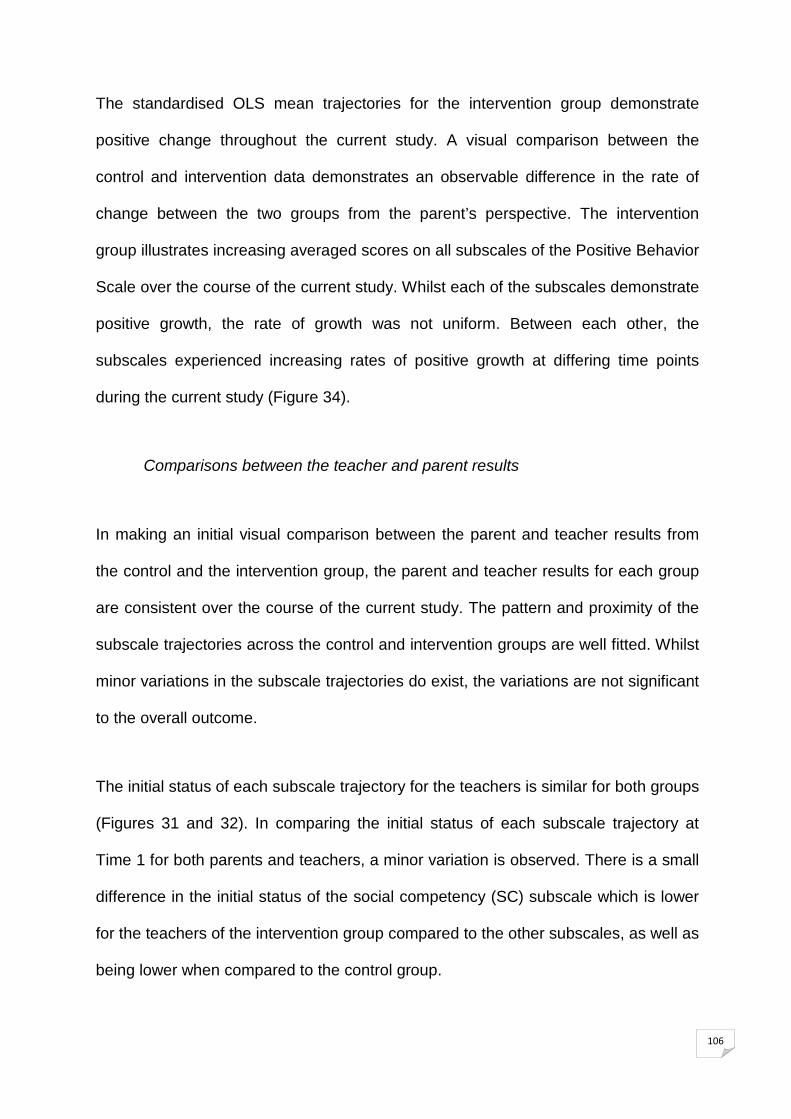
106
The standardised OLS mean trajectories for the intervention group demonstrate
positive change throughout the current study. A visual comparison between the
control and intervention data demonstrates an observable difference in the rate of
change between the two groups from the parent’s perspective. The intervention
group illustrates increasing averaged scores on all subscales of the Positive Behavior
Scale over the course of the current study. Whilst each of the subscales demonstrate
positive growth, the rate of growth was not uniform. Between each other, the
subscales experienced increasing rates of positive growth at differing time points
during the current study (Figure 34).
Comparisons between the teacher and parent results
In making an initial visual comparison between the parent and teacher results from
the control and the intervention group, the parent and teacher results for each group
are consistent over the course of the current study. The pattern and proximity of the
subscale trajectories across the control and intervention groups are well fitted. Whilst
minor variations in the subscale trajectories do exist, the variations are not significant
to the overall outcome.
The initial status of each subscale trajectory for the teachers is similar for both groups
(Figures 31 and 32). In comparing the initial status of each subscale trajectory at
Time 1 for both parents and teachers, a minor variation is observed. There is a small
difference in the initial status of the social competency (SC) subscale which is lower
for the teachers of the intervention group compared to the other subscales, as well as
being lower when compared to the control group.

107
The parents of the control and intervention groups illustrate near identical start points
at Time 1, indicating a similar disposition in the parents in relating their observations
of their respective child (Figures 33 and 34). There is a minor variation for the
parents of the intervention group where the social competence (SC) and compliance
(C) subscales initial status is marginally lower compared to the parents of the control
group at Time 1.
Scrutinising at a closer level, a number of details emerge. In comparing the teacher’s
standardised trajectories from Figure 32 with those of the parent’s in Figure 34, the
parents of the intervention group report a marginally higher rate of scores over all the
subscales than did the teachers of the intervention group. The parents and teachers
for the intervention group reported growth rates in autonomy (A) and compliance (C)
greater than rates of change in social competency (SC) over the course of the
current study. Further, at study conclusion both the autonomy (A) and compliance (C)
subscales finish at similar points from the teacher and parent perspectives of the
intervention group. For the control group, the parents reported less autonomy overall
of their respective child than did the teachers of the same group at study completion
(Figures 33 and 31 respectively). In addition, the teachers of the control group
reported a minor decline in compliance in their students in the current study.
When comparing the Positive Behavior Scale (PBS) standardised results from adults
overall, the teachers and parents for the intervention group indicated positive change
over time across all three subscales for the participants (Figures 32 and 34). The
teachers and parents of the control group did not report any significant increase in
any of the subscales of the measure over the course of the current study (Figures 31
and 33).

108
Preliminary correlation analysis of all measures in the current study
The results presented thus far illustrate variation over time in the intervention group.
In comparison, the control group demonstrate a maintained average result over the
course of this study. Given that some variance exists in the intervention sample, the
investigation of possible predictors is warranted. If indicative predictors were
included in the analysis, the degree of variability in the data may be abridged
conclusively. To determine which parameters may be included, a complete
correlation analysis was carried out.
As a linear model was suitable for the data, a regression analysis using the ordinary
least squares (OLS) estimates of intercepts and rates of change of outcome
variables made it possible to test for the degree of inter-relation between the
measures employed for the intervention sample. This was also completed for the
control sample to enable comparison. In fitting the ordinary least squares regression
model as a function of linear time to each student’s data and constructing bivariate
correlations, a summation of the results for each child participant is available in
Appendix K. The ordinary least squares regression models for the measures used in
the current study appear as Tables 22 – 25 for the control participants, and Tables
26 – 29 for the intervention particpants.
Using the estimated slopes and intercepts for each measure, a bivariate correlation
analysis was performed. It allowed for the identification of any significant
relationships between the respective measures. Tables 11 and 12 display the
correlations between the measures for the control participants. Tables 13 and 14
illustrate the correlations between the measures for the intervention particpants. The
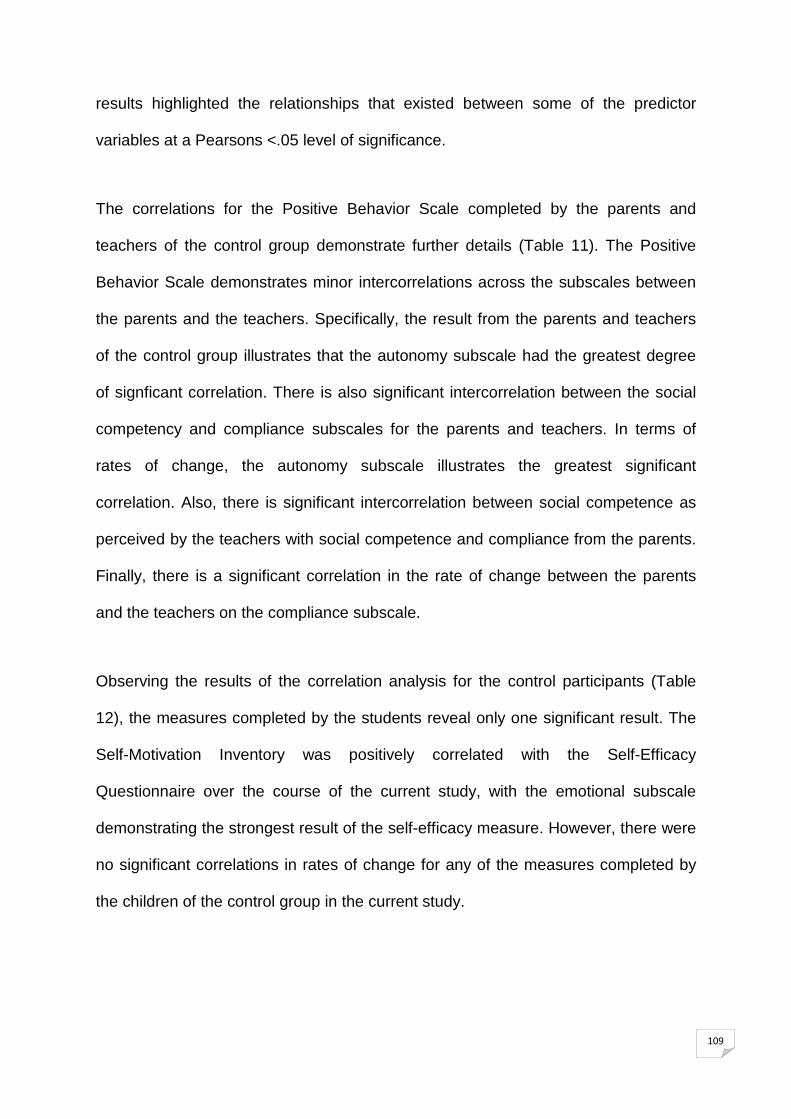
109
results highlighted the relationships that existed between some of the predictor
variables at a Pearsons <.05 level of significance.
The correlations for the Positive Behavior Scale completed by the parents and
teachers of the control group demonstrate further details (Table 11). The Positive
Behavior Scale demonstrates minor intercorrelations across the subscales between
the parents and the teachers. Specifically, the result from the parents and teachers
of the control group illustrates that the autonomy subscale had the greatest degree
of signficant correlation. There is also significant intercorrelation between the social
competency and compliance subscales for the parents and teachers. In terms of
rates of change, the autonomy subscale illustrates the greatest significant
correlation. Also, there is significant intercorrelation between social competence as
perceived by the teachers with social competence and compliance from the parents.
Finally, there is a significant correlation in the rate of change between the parents
and the teachers on the compliance subscale.
Observing the results of the correlation analysis for the control participants (Table
12), the measures completed by the students reveal only one significant result. The
Self-Motivation Inventory was positively correlated with the Self-Efficacy
Questionnaire over the course of the current study, with the emotional subscale
demonstrating the strongest result of the self-efficacy measure. However, there were
no significant correlations in rates of change for any of the measures completed by
the children of the control group in the current study.

Table 11 Control correlations for the Positive Behavior Scale for teachers and parents (Initial Estimates and Rates of Change).
Note. ** p<.01; * p<.05 significance level (2-tailed; Pearson correlation). Significant ** p<.01 correlations are in bold.
PBSPa PBSPaRoC PBSPsc PBSPscRoC PBSPc PBSPcRoC PBSTa PBSTaRoC PBSTsc PBSTscRoC PBSTc PBSTcRoC
PBSPautonomy - -.655** .000
.324* .023
-.086 .557
.508** .000
-.048 .745
.627** .000
-.390** .006
.280
.051 -.030 .839
.238
.100 -.031 .833
PBSPautonomyRoC
- -.233 .108
.391** .006
-.392** .005
.394** .005
-.420** .003
.567** .000
-.159 .276
.250
.083 -.234 .106
.252
.080 PBSPsocialcomp - -.722**
.000 .685** .000
-.334* .019
.365** .010
-.171 .241
.526** .000
-.263 .068
.280
.052 -.106 .470
PBSPsocialcompRoC
- -.608** .000
.680** .000
-.140 .337
.183
.209 -.357* .012
.423** .002
-.245 .090
.230
.112 PBSPcompliance
- -.671** .000
.428** .002
-.335* .019
.387** .006
-.262 .069
.362* .010
-.271 .060
PBSPcomplianceRoC
- -.115 .430
.273
.057 -.176 .227
.399** .005
-.311* .030
.478** .001
PBSTautonomy
- -.705** .000
.290* .043
-.097 .506
.348* .014
-.121 .409
PBSTautonomyRoC
- -.171 .241
.405** .004
-.288* .045
.395** .005
PBSTsocailcomp
- -.576** .000
.259
.073 -.167 .251
PBSTsocialcompRoC
- -.340* .017
.540** .000
PBSTcompliance
- -.715** .000
PBSTcomplianceRoC
-

Table 12 Control correlations for child self-reporting measures (Initial Estimates and Rates of Change).
SEQa SEQaRoC SEQs SEQsRoC SEQe SEQeRoC PBS PBSRoC SMI SMIRoC SES SESRoC
SEQacademic
- -.672**
.000 .865**
.000 -.586**
.000 .864**
.000 -.616**
.007 -.134 .358
.088
.549 .526**
.000 -.131
.371 -.166 .255
.001
.997 SEQaRoC
- -.568**
.007 .798**
.000 -.499**
.000 .756**
.000 .211 .145
.149
.306 -.252
.081 .296*
.039 -.116 .427
.287*
.045 SEQsocial
- -.771**
.000 .843**
.000 -.601**
.000 -.074 .615
-.025 .864
.535**
.000 -.162 .267
-.180 .215
.072
.625 SEQsRoC
- -.564**
.000 .766**
.000 .166 .253
.204
.159 -.276
.055 .248
.085 -.026 .857
.127
.383 SEQemotional
- -.745**
.000 -.141 .334
.162
.267 .588**
.000 -.199 .169
-.231 .111
.011
.939 SEQeRoC
- .298* .037
.050
.734 -.356*
.012 .328*
.022 .012 .935
.195
.180 PBS
- -.120
.412 -.112 .446
.161
.270 -.062 .673
.133
.362 PBSRoC
- .103
.481 .031
.832 -.114 .435
.032
.826 SMI
- -.688**
.000 -.035 .810
-.003 .985
SMIRoC
- -.217 .134
.301*
.036 SES
- -.681** .000
SESRoC
-
Note. ** p<.01; * p<.05 significance level (2-tailed; Pearson correlation). Significant ** p<.01 correlations are in bold.

Table 13
Intervention correlations for the Positive Behavior Scale for parents and teachers (Initial Estimates and Rates of Change).
PBSPa PBSPaRoC PBSPsc PBSPscRoC PBSPc PBSPcRoC PBSTa PBSTaRoC PBSTsc PBSTscRoC PBSTc PBSTcRoC
PBSPautonomy - -.773** .359* -.314 .336* -.033 .805** -.730** .442** -.326 .518** -.350* .000 .032 .062 .045 .847 .000 .000 .007 .052 .061 .036
PBSPautonomyRoC
- .004 .982
.302
.006 -.138 .423
.245
.151 -.518** .001
.525** .001
-.091 .596
.273
.107 -.211 .217
.428** .009
PBSPsocialcomp - -.745**
.000 .400* .016
-.003 .986
.398* .016
-.345* .039
.796** .000
-.516** .001
.543** .001
-.181 .292
PBSPsocialcompRoC
- -.291 .085
.248
.144 -.368* .027
.421* .011
-.614** .000
.692** .000
-.453** .006
.447** .006
PBSPcompliance
- -.706** .000
.408* .013
-.366* .028
.306
.069 -.279 .099
.606** .000
-.441** .007
PBSPcomplianceRoC
- -.074 .668
.110
.524 .074 .667
.159
.355 -.287 .089
.576** .000
PBSTautonomy
- -.803** .000
.449** .006
-.317 .060
.665** .000
-.419* .011
PBSTautonomyRoC
- -.375* .024
.339* .043
-.623** .000
.475** .003
PBSTsocialcomp
- -.801** .000
.572** .001
-.256 .020
PBSTsocialcompRoC
- -.458** .005
.463** .004
PBSTcompliance
- -.751** .000
PBSTcomplianceRoC
-
Note. ** p<.01; * p<.05 significance level (2-tailed; Pearson correlation). Significant ** p<.01 correlations are in bold.

Table 14 Intervention correlations for child self-reporting measures (Initial Estimates and Rates of Change).
SEQa SEQaRoC SEQs SEQsRoC SEQe SEQeRoC PBS PBSRoC SMI SMIRoC SES SESRoC SEQacademic
- -.785**
.000
.823**
.000
-.617** .000
.836**
.000
-.613** .000
.117
.301
-.270
.111
.324
.054
-.273
.107
-.298 .078
.102
.555
SEQaRoC
- -.725** .000
.878**
.000
-.639** .000
.829**
.000
-.471**
.004
.487**
.003
-.282
.095
.453**
.006
.203
.236
-.127 .461
SEQsocial
- -.734**
.000
.790**
.000
-.648**
.000
.185
.279
-.385* .020
.333*
.047
-.344*
.040
-.322 .056
.101
.558
SEQsRoC
- -.539** .001
.811**
.000
-.497** .002
.553** .000
-.245 .150
.447**
.006
.218
.202
-.158 .359
SEQemotional
- -.728**
.000
.094
.586
-.140 .415
.378*
.023
-.293 .083
-.293
.083
.227
.183
SEQeRoC
- -.413* .012
.397* .017
-.298
.077
.448**
.006
.145
.397
-.214 .209
PBS
- -.715**
.000
-.019 .911
-.010
.952
-.112
.514
.167
.330
PBSRoC
- -.116 .500
.255
.134
.223
.191
-.050
.772
SMI
- -.802**
.000
.143
.406
.062
.718
SMIRoC
- -.058 .736
-.060
.727
SES
- -.560** .000
SESRoC
-
Note. ** p<.01; * p<.05 significance level (2-tailed; Pearson correlation). Significant ** p<.01 correlations are in bold.

114
In contrast, from the teachers and parents of the intervention group, the rates of
change demonstrate multiple, moderately significant, intercorrelations across the
respective subscales (Table 13). For the intervention group, the parent autonomy
subscale and the teacher compliance subscale each demonstrate predominance
over all other subscales. There is also a single signficant intercorrelation for the
social competence subscale. In terms of rates of change, the subscales illustrate a
similar result. There is a signficant intercorrelation between the teacher compliance
subscale, and each of the parent subscales. Additionally, in terms of rates of change,
the autonomy and the social competence subscales each illustrate significant
intercorrelation.
The results for the intervention group do not demonstrate any strong positive
correlations between the individual child self-reporting measures (Table 14).
However, there are significant negative intercorrelations between the Prosocial
Behaviour Scale and the rates of change of the Self-Efficacy Questionnaire.
Conversely, there is significant intercorrelation between the rates of change for the
academic and social self-efficacy subscales with the Prosocial Behaviour Scale.
Additionally, each of the self-efficacy subscales are positively intercorrelated with the
Self-Motivation Inventory in terms of rates of change.
The data for the intervention group did not demonstrate the existance of multiple
predictor variables. No individual measure can be isolated as having a significant
predominant relationship over any other measure. However, the rates of change did
indicate that the scores continuously increased throughtout the current study across
the measures for the intervention participants. In comparison, minor variations in the
measures and rates of change across the measures are noted for the control group.

115
Chapter 4
Statistical analysis: Child, parent and teacher measures
In establishing that a linear relationship between the measures was demonstrated,
and that high correlations between the measures did not exist, further detailed
analysis of the variance in the measure scores was possible. For the child measures,
a simultaneous test for statistically significant differences between the control and
intervention conditions on all four measures was conducted using multivariate
repeated measures (MANOVA). For the measure of the parents and teachers
perspectives of the child participants, independent samples t-tests were performed to
detect statistically significant differences between the control and intervention
conditions over the course of the current study.
Multivariate repeated measures (child measures)
A multivariate analysis of variance was performed on the four measures completed
by the child participants; self-esteem (SE-S), self-motivation (SMI-C9), self-efficacy
(SEQ-C), and prosocial behaviour (Prosocial Behaviour Scale). Grouping was
separated between intervention or control conditions and six time intervals served as
within-subjects variables. Sphericity was initially inspected using Mauchly’s Test,
which tests for the equivalence of the hypothesized and the observed
variance/covariance patterns for each of the measures. Each of the four Mauchly’s
statistics were highly significant; self-esteem W = .31, χ2 (14) = 95.50, p < .001, self-
motivation, W = .49, χ2 (14) = 58.27, p < .001, self-efficacy W = .27, χ2 (14) = 106.50,
p < .001, and prosocial behaviour W = .38, χ2 (14) = 78.23, p < .001. All four

116
measures suggest that the observed matrices do not have approximately equal
variances and equal co-variances. As the assumption of sphericity is violated for
each measure, multivariate statistics are interpreted using Pillai’s Trace.
All of the multivariate tests were significant and observed power is acceptable (Table
15). Pillai’s Trace was used as the number of participants in each group are not
equal (n = 36 intervention, n = 49 control). The multivariate tests of the child self-
reporting measures suggest that the measure scores across the six time points have
at least one mean vector pairing which produced a significant difference.
Table 15
Multivariate tests using Pillai’s Trace (all significant at p < .001).
* p < .05
Effect V F df1 df2 Observed
Power*
Measures .98 1434.505 3 81 1.0
Measures x Group .35 14.536 3 81 1.0
Time .85 92.144 5 79 1.0
Time x Group .81 69.008 5 79 1.0
Measures x Time .78 16.208 15 69 1.0
Measures x Time x Group .54 5.285 15 69 1.0

117
Though the multivariate test of the child measures suggests the significance of at
least one mean pairing, it is unclear from the multivariate test as to which individual
comparison the observed mean difference is significant. In order to make the
determination, a series of individual measure comparisons are presented in Table
16. The means presented in Table 16 indicate that the control group had significantly
lower scores for self-esteem (M = 14.41), self-motivation (M = 22.14), self-efficacy
(M = 66.08), and prosocial behaviour (M = 15.68) over the course of the current
study (p < .05).
Table 16
Estimated marginal means by Group.
Measure Group Mean 95% Confidence Interval
Lower Bound Upper Bound
Self-Esteem Intervention 17.537 16.758 18.316
Control 14.412 13.743 15.080
Self-Motivation Intervention 25.699 24.716 26.682
Control 22.146 21.304 22.989
Self-Efficacy Intervention 78.472 75.680 81.265
Control 66.085 63.691 68.479
Prosocial Behaviour Intervention 18.023 17.067 18.980
Control 15.687 14.867 16.507

118
In referring to Table 17, for the time and group interaction, Pillai’s Trace indicates
that the interaction is statistically significant, suggesting the measure scores made
across the six time points improved dependent upon intervention group membership
V = .54, F = 5.29, df = (15,69), p < .001.
To aid in the interpretation of the mean interaction effects, individual estimated
marginal mean graphs are presented for each measure. The plotted graphs are
determined by the measure scores of estimated marginal means (Table 17). Figures
35 - 38 demonstrate student participant responses from each of the measures, for
the intervention and control groups, at each time point. There is a consistent rate of
greater linear growth illustrated in each of the figures for the intervention group when
compared to the control group.
Tests of within-subjects contrasts present the contrasts between the responses from
the measures obtained across the six time points. Table 18 presents the mean
change, across the time points, between the intervention and control groups. In
conjunction with Figures 35 - 38, the results indicate that the change in each
measure between the Time points is significantly different between the intervention
and control groups (p < .05). Between the groups, the contrasts presented in Table
18 are all significant. Table 18 indicates the scores across the measures are
statistically different between groups and the greatest level of mean change across
each Time points was experienced by the intervention group (p < .001).

119
Table 17 Estimated marginal means by Time.
Measure Group Time Mean 95% Confidence Interval Lower Bound Upper Bound
Self-Esteem
Intervention
1 12.611 11.735 13.487 2 14.361 13.574 15.148 3 16.306 15.459 17.152 4 18.389 17.447 19.331 5 20.583 19.424 21.742 6 22.972 21.850 24.095
Control
1 13.735 12.984 14.486 2 14.347 13.673 15.021 3 14.367 13.642 15.093 4 14.551 13.743 15.359 5 14.796 13.802 15.789 6 14.673 13.711 15.636
Self-Motivation
Intervention
1 19.917 18.612 21.221 2 22.194 21.025 23.364 3 24.472 23.195 25.749 4 26.833 25.572 28.095 5 29.139 28.030 30.248 6 31.639 30.591 32.687
Control
1 21.286 20.168 22.404 2 21.959 20.957 22.962 3 22.755 21.660 23.850 4 22.939 21.858 24.020 5 21.857 20.907 22.807 6 22.082 21.183 22.980
Self-Efficacy
Intervention
1 61.361 58.031 64.691 2 68.028 64.413 71.643 3 73.250 69.917 76.583 4 80.694 77.282 84.107 5 88.639 84.948 92.330 6 98.861 95.080 102.642
Control
1 63.633 60.779 66.487 2 65.020 61.922 68.119 3 65.980 63.123 68.837 4 67.796 64.871 70.721 5 66.571 63.408 69.735 6 67.510 64.269 70.751
Prosocial Behaviour
Intervention
1 14.111 13.177 15.046
2 15.361 14.353 16.370 3 16.722 15.718 17.726 4 18.639 17.444 19.834 5 20.528 19.419 21.637 6 22.778 21.645 23.911
Control
1 16.286 15.485 17.087 2 16.143 15.278 17.007 3 16.041 15.180 16.901 4 15.551 14.527 16.575 5 15.490 14.539 16.441 6 14.612 13.641 15.584

120
Figure 35: Estimated Marginal Means of self-esteem by group.
Figure 36: Estimated Marginal Means of self-motivation by group.
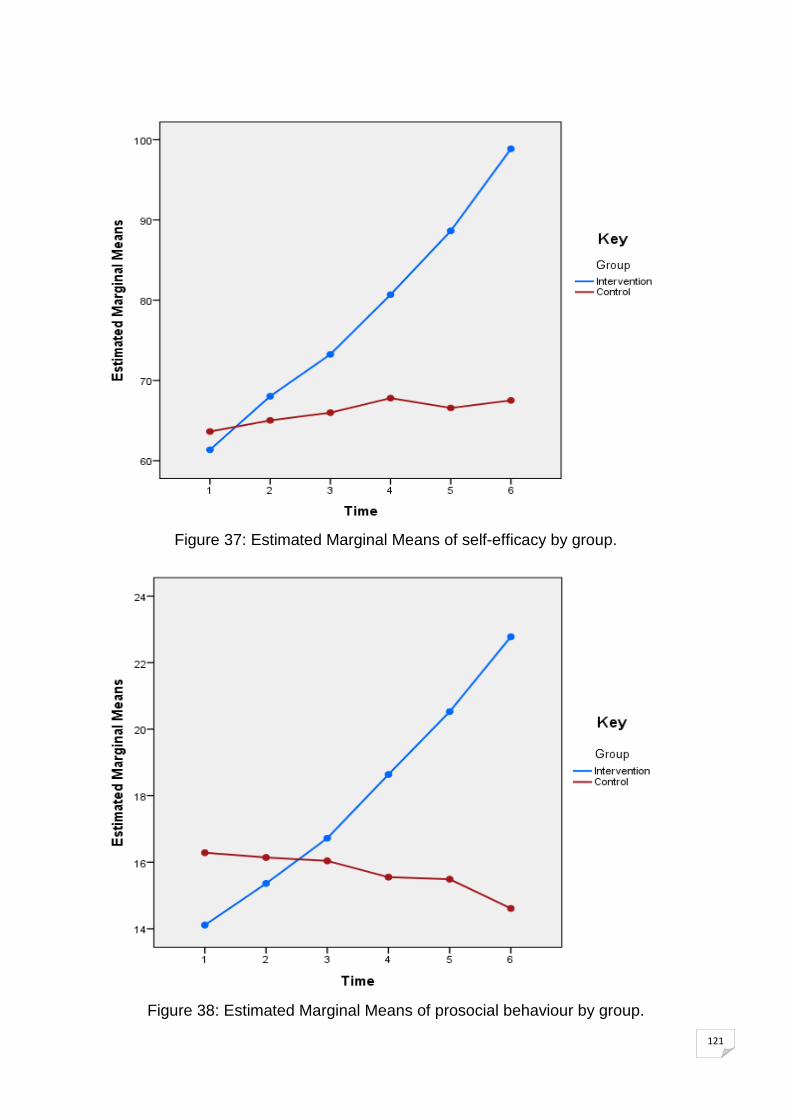
121
Figure 37: Estimated Marginal Means of self-efficacy by group.
Figure 38: Estimated Marginal Means of prosocial behaviour by group.

Table 18
Mean change difference between Time points (all significant at p < .001).
Group Measure Time1 to Time2 Time2 to Time3 Time3 to Time4 Time4 to Time5 Time5 to Time6
Self-Esteem 1.75 1.94 2.08 2.19 2.38
Self-Motivation 2.27 2.28 2.36 2.31 2.50
Intervention Self-Efficacy 6.67 5.22 7.44 7.94 10.22
Prosocial Behaviour 1.25 1.36 1.92 1.89 2.25
Self-Esteem 0.61 0.02 0.18 0.24 -0.12
Self-Motivation 0.67 0.80 0.18 -1.08 0.22
Control Self-Efficacy 1.39 0.96 1.82 -1.22 0.94
Prosocial Behaviour -0.14 -0.10 -0.49 -0.06 -0.88
123
Independent t-tests (parent and teacher measure)
As a comparison between the teachers and parents, independent-samples t-
tests were conducted to compare the Positive Behavior Scale (PBS) data, for
the teacher (T) and parent (P) perspectives, in the intervention and control
conditions.
Group Statistics
Group N Mean Std. Deviation Std. Error Mean
PBS(T) Intervention 216 86.12 12.884 .877
Control 294 81.74 11.201 .653
Figure 39: Group Statistics and Independent Samples Test for the Positive
Behavior Scale (PBS) completed by teachers (T).
Referring to Figure 39 for the PBS(T) result, a Levene’s test indicated unequal
variances (F = 10.39, p = .001), so degrees of freedom were adjusted from
Independent Samples Test
Levene's Test
for Equality of
Variances
t-test for Equality of Means
F
Sig.
t
df
Sig. (2-
tailed)
Mean
Difference
Std. Error
Difference
95% Confidence
Interval of the
Difference
Lower Upper
PBS(T)
Equal variances
assumed 10.386 .001 4.092 508 .000 4.379 1.070 2.276 6.481
Equal variances
not assumed 4.005 424.103 .000 4.379 1.093 2.230 6.528
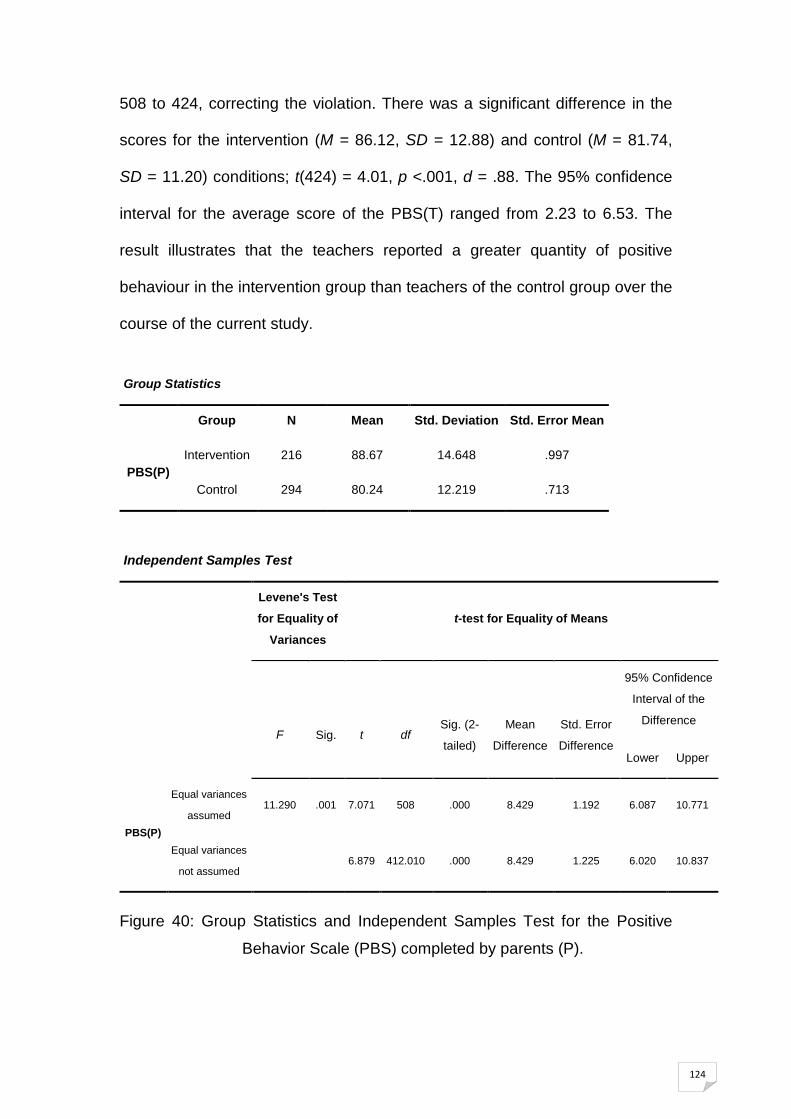
124
508 to 424, correcting the violation. There was a significant difference in the
scores for the intervention (M = 86.12, SD = 12.88) and control (M = 81.74,
SD = 11.20) conditions; t(424) = 4.01, p <.001, d = .88. The 95% confidence
interval for the average score of the PBS(T) ranged from 2.23 to 6.53. The
result illustrates that the teachers reported a greater quantity of positive
behaviour in the intervention group than teachers of the control group over the
course of the current study.
Group Statistics
Group N Mean Std. Deviation Std. Error Mean
PBS(P) Intervention 216 88.67 14.648 .997
Control 294 80.24 12.219 .713
Independent Samples Test
Levene's Test
for Equality of
Variances
t-test for Equality of Means
F
Sig.
t
df
Sig. (2-
tailed)
Mean
Difference
Std. Error
Difference
95% Confidence
Interval of the
Difference
Lower Upper
PBS(P)
Equal variances
assumed 11.290 .001 7.071 508 .000 8.429 1.192 6.087 10.771
Equal variances
not assumed 6.879 412.010 .000 8.429 1.225 6.020 10.837
Figure 40: Group Statistics and Independent Samples Test for the Positive
Behavior Scale (PBS) completed by parents (P).

125
For the PBS(P) result presented in Figure 40, a Levene’s test indicated
unequal variances (F = 11.29, p = .001), so degrees of freedom were adjusted
from 508 to 412. There was a significant difference in the scores for the
intervention (M = 88.67, SD = 14.65) and control (M = 80.24, SD = 12.22)
conditions; t(412) = 6.88, p <.001, d = 1.51. The 95% confidence interval for
the average score of the PBS(P) ranged from 6.02 to 10.84. The result
demonstrates that the parents reported a higher amount of positive behaviour
in the intervention group than parents of the control group over the course of
the current study.
126
Chapter 5
Guttman Scalograms: Construction and analyses
In the previous chapter, assessments of the child, parent and teacher
measures demonstrated statistically significant changes in mean scores over
time, on each of Hellison’s goals separately (Table 1, p6). The participants in
the intervention group benefited from the intervention, on each goal, over
time. From the measures over time, it was also possible to track differential
rates of progression between the intervention and control groups. However, it
has not yet been demonstrated that any stage-like changes over time
occurred, i.e. sequencing. As explored in chapter one, one way to check if the
children’s progress followed a set stage-like sequence, is to assess whether
their responses form a Guttman scalogram. Further, it is still unknown if stage
change occurred in the same order that the Hellison (2003) model predicts.
We saw in chapter one how, in some contexts, stages can sometimes be
reversed. In effect therefore, two specific questions remain for the present
thesis, a) was there a scalogram, and b) if the answer to a) is yes, did the
participants in the intervention, but not the control, group climb up the
scalogram over time?
a) Was there a scalogram?
Guttman (1947, 1950) scaling has in the past been used in the development
of measures of attitudes among adolescents towards substance abuse
(Andrews, Hops, Ary, Lichtenstein, Tildesley, 1991), as well as attitudes

127
towards treatment planning and client evaluation in counselling therapy
(Shorkey & Whiteman, 1977). These prior works are in the area of health, and
therapy, and are only indirectly linked to social responsibility development.
More specifically, Guttman Scalogram Analysis has never been applied to the
assessment of the Hellison (2003) model.
There are two parts to the Scalogram Analysis in the current study. First the
four child self-report measures of self-esteem, self-motivation, self-efficacy,
and prosocial behaviour could form a four-item Guttman scale, at each of the
six measurement points in time. Second, the addition of a parent and teacher
measure of positive behaviour (outside the training venue itself) was
administered over all six time points. This could form, potentially, a five-item
quasi-Guttman scalogram (‘quasi’ because the parents and teachers did not
rate the children on goals 1 - 4, nor did the children rate themselves on goal 5,
and the parent and teacher score was designed to be combined into one
index). To recap, there were six time points in the current study. At all six, the
children completed self-report measures for goals 1 – 4 (Table 1, p6). At each
of the six time points, the parents and teachers completed their measure for
goal 5 of the model (Table 1, p6). The parents and teachers did not complete
any other measure, apart from a goal 5 measure, at times 1 through 6.
The parent and teacher measure for goal 5 was computed by taking the
average of the two scores, per item, one for the parent and one from the
teacher, at each of the six time points. Because the parents and teachers did
not have the opportunity to rate goals 1 - 4, nor did the students rate goal 5,
two separate Guttman scalograms would be constructed: One for the child

128
self-report measures, and a second which additionally included the parent and
teacher measure (a quasi-Guttman test).
An illustrative representation of a perfect Guttman scale is schematised in
Figure 53, based upon subjects (participant ‘ID’) and items (measures) from
the current study.
Self - Reports Parent/Teacher Goal 1 Goal 2 Goal 3 Goal 4 Goal 5
ID Self-Esteem
Self-Motivation
Self-Efficacy
Prosocial Behaviour
Positive behaviour
3B2 1 1 1 1 0 3B5 1 1 1 0 0 3C9 1 1 0 0 0 4B1 1 0 0 0 0 4B2 0 0 0 0 0 4B5 0 0 0 0 0 . . . . . . . . . . . . 4B7 1 0 0 1 0 4D2 1 0 1 0 0 4D3 0 0 1 0 0 Count 4 3 2 1 0
Key: 1 = above the mid-point (‘on’).
0 = below the mid-point (‘off’).
Figure 53: A representation of a perfect Guttman scale for the current study,
according to the Hellison (2003) model.
Step one in any Guttman protocol consists in creating binary variables (‘1’ for
‘on’ and ‘0’ for off). Each child’s scores were re-coded, on each continuous
measure, into a binary variable, about the mid-point. Thus if a child’s mean
score per item per measure was above the mid-point of ‘3’ it was designated

129
‘1’ (i.e. ‘on’). If it fell below, it was re-coded to ‘0’ (i.e. ‘off’). The same process
was applied to all six measures of goal 5, given by parent and teacher scores,
using average score per item per factor (goal 5 score), across both parent and
teacher perspectives.
In step two of Guttman’s (1950) protocol, the data is then initially organised in
columns, left to right, in goal order according to Hellison’s (2003) model. The
columns in Figure 53 were arranged in the sequence proposed by Hellison’s
model, i.e. goal 1 = self-esteem, 2 = self-motivation, 3 = self-efficacy, 4 =
prosocial behaviour, and 5 = positive behaviour. Individual participant item
response patterns were then ordered alpha-numerically by participant, in a
descending order, by row.
In the next step of the Guttman (1950) protocol, he recommends that the task
is to minimise ‘errors’ across the item response patterns. Items whose
columns contain greater numbers of ‘1’s are moved to the left of columns with
a lower tally of ‘1’s. Figure 54 is an exemplar of one such table, of the
intervention group, for the four child self-reporting measures only, at Time 1.
The logic here is that lower level needs should be endorsed more often than
higher level needs.
Comparing Figure 54 and Figure 53, the order of the measures found from the
scalogram test in the current study did not match the expected order of the
Hellison (2003) model presented in Figure 1.

130
Hellison Order:
Self-Esteem Self-Motivation
Self-Efficacy Prosocial Behaviour
Guttman* Order:
Self-Motivation
Self-Efficacy Self-Esteem Prosocial Behaviour
ID
3B1 0 1 0 0 3B2 0 0 0 0 3B3 0 0 0 0 3C1 0 0 0 0
3C10 1 0 1 0 3C11 0 0 1 0 3C12 0 0 0 0 3C13 0 0 1 0 3C14 0 0 0 0 3C2 1 1 0 0 3C3 0 1 0 0 3C4 0 1 0 0 3C5 0 0 0 1 3C6 0 0 0 0 3C7 0 0 0 0 3C8 0 0 0 0 3C9 1 0 0 0 4B1 1 0 0 0 4B2 0 0 0 0 4B3 0 0 1 0 4B4 0 0 0 0 4B5 0 0 0 0 4B6 0 0 0 1 4B7 1 0 0 1 4C1 1 1 0 0 4C2 1 1 0 0 4C3 1 1 0 0 4C4 1 0 1 0 4C5 0 0 0 0 4C6 1 1 0 1 4C7 0 0 0 0 4C8 0 0 0 0 4C9 0 0 0 0 4D1 0 0 0 0 4D2 1 0 1 0 4D3 0 0 1 0
Total Count 11 8 7 4
Figure 54: Rearranging the columns according to Guttman (1950) -
Intervention group at Time 1.
*NOTE: Refers to temporal order based on this current study’s Guttman analysis of our dataset.

131
Specifically in Figure 54, the total count of item scores of the participants was
highest for self-motivation (11), then self-efficacy (8), followed by self-esteem
(7), and lastly by prosocial behaviour (4). Thus, following Guttman’s (1950)
protocol, the goal of self-esteem (goal 1 in the Hellison model) was
interchanged with self-motivation and self-efficacy (goals 2 and 3 of the
Hellison model).
This type of finding (i.e., columns interchanging) is important because,
according to Guttman (1950), if there is a hierarchy to be found, then the order
of the goals proposed in the Hellison (2003) model could be invalid as they
would not form a scalogram (based on Figure 54). A check of whether the
reversals of the columns found in Figure 54 occurred at other time points was
conducted. Importantly, at each of the six time points in the current study, the
Guttman order of the measures demonstrated in Figure 54 was identical for
both intervention and control groups, and regardless of four or five items in the
scalogram. Hence, the reordering of the Hellison (2003) goals across all time
points is reliable.
Step five in the Guttman (1950) protocol is the rearrangement of the individual
participant item response patterns (i.e., rows). The previous alpha-numerical
ordering of individual item response patterns in Figure 54 was rearranged.
Figure 55 demonstrates the rearrangement of the individual item participant
response patterns for the intervention group at Time 1. In Figure 55, response
patterns which only contain consecutive ‘1’s, without errors, were placed first
(3C2-4B1). Patterns that demonstrate any number of non-consecutive ‘1’

132
scores were then added next (3B1-4D3), followed lastly by any pattern
containing purely ‘0’s (3B2-4D1).
ID Self-Motivation
Self-Efficacy
Self-Esteem
Prosocial Behaviour
3C2 1 1 0 0 4C1 1 1 0 0 4C2 1 1 0 0 4C3 1 1 0 0 3C9 1 0 0 0 4B1 1 0 0 0
3B1 0 1 0 0
3C10 1 0 1 0 3C11 0 0 1 0 3C13 0 0 1 0 3C3 0 1 0 0 3C4 0 1 0 0 3C5 0 0 0 1 4B3 0 0 1 0 4B6 0 0 0 1 4B7 1 0 0 1 4C4 1 0 1 0 4C6 1 1 0 1 4D2 1 0 1 0 4D3 0 0 1 0 3B2 0 0 0 0 3B3 0 0 0 0 3C1 0 0 0 0
3C12 0 0 0 0 3C14 0 0 0 0 3C6 0 0 0 0 3C7 0 0 0 0 3C8 0 0 0 0 4B2 0 0 0 0 4B4 0 0 0 0 4B5 0 0 0 0 4C5 0 0 0 0 4C7 0 0 0 0 4C8 0 0 0 0 4C9 0 0 0 0 4D1 0 0 0 0
Key: = working example.
Figure 55: Counting errors (rearranging the rows according to Guttman
(1950)) - Intervention group at Time 1.
3B1 0 1 0 0

133
The logic here is that with the previous reordering of the columns, and rows
now rearranged, the process provides a triangular pattern, expected in
cumulative scales (Robson, 1993). In Figure 55, the red cutting line serves as
a visual marker, highlighting a triangular pattern, which also serves as a visual
separation between error free and error response patterns.
The next step in Guttman’s protocol (1950) is the counting of errors. An error
is defined as any response of ‘0’ occurring ahead of ‘1’ (to the left of) in any
participant response pattern. In the case of ‘3B1’ from Figure 55 (boxed
working example) the response pattern of ‘0 1 0 0’ contains an error (a need
state cannot be met before its antecedent need is satisfied). For ‘3B1’s
responses (in the text box) to be error free, the response line would have to
be either ‘1 1 0 0’ or ‘0 0 0 0’, not ‘0 1 0 0’. Either way however, for the
purposes of tallying errors, there is only one error in this case, in accordance
with the protocol in Guttman (1950). Errors were therefore counted using this
process for all scalograms, at each time point.
In the next step in Guttman’s (1950) protocol, a Coefficient of Reproducibility
is calculated by counting up the number of errors in each scalogram, and
dividing these errors by the total number of responses, then subtracting the
result from a value of one, as per the following formula:-
Coefficient of Reproducibility:
= 1.0 – (n errors) / total responses
= 1.0 – (n errors) / [(n items) x (n respondents)]

134
Firstly, Coefficients of Reproducibility were generated from Scalogram
Analysis of the child self-report measures used for both the control and
intervention groups separately. Secondly, Coefficients of Reproducibility were
produced by combining the four child self-reporting measures with the single
parent and teacher measure, at each of the six time points. Separately at
each of the six time points, a single coefficient for the intervention group, and
the control group, was thus produced. In total, twelve Coefficients of
Reproducibility were calculated (Table 19).
Table 19
Coefficients of Reproducibility for all measures – control (n = 49) and
intervention groups (n = 36).
Self-Reported Goals 1 - 4 Self-Reported and
Parent/Teacher Goals Combined
Control Intervention Control Intervention
Time 1 0.88 0.90 0.87 0.89
Time 2 0.89 0.90 0.88 0.89
Time 3 0.88 0.92 0.88 0.91
Time 4 0.88 0.93 0.86 0.93
Time 5 0.89 0.95 0.88 0.96
Time 6 0.90 0.98 0.90 0.98
x̄ 0.88 x̄ 0.93 x̄ 0.87 x̄ 0.92
x̄ 0.91 x̄ 0.90
135
In Table 19, the mean Coefficients of Reproducibility for the control group fall
(marginally) below the 0.90 threshold that is recommended by Guttman
(1950). Nevertheless, Robson (1993) states that for a Coefficient of
Reproducibility to be statistically meaningful, it should be calculated over more
than one occasion and averaged to account for error. Over six time points in
the current study, the averaged Coefficient of Reproducibility meets the
criterion of ≥ 0.90 (0.91, Table 19).
From the child self-reported measures for goals 1 - 4, across Time one to
Time six, the mean Coefficient of Reproducibility was 0.91 (Table 19). When
combining the child self-report measures for goals 1 - 4 with the parent and
teacher measure for goal 5, across Time 1 to Time 6, the mean (quasi)
Coefficient of Reproducibility was 0.90 (Table 19). These coefficients meet the
criterion for Guttman’s original error specification of ≥ .90 (Edwards, 1957).
Each respective Guttman scalogram of the control and intervention groups,
with Coefficients of Reproducibility noted for each, is included as Appendix L.
Therefore, the averaged Coefficients of Reproducibility produced in the
current study are acceptable. We can infer that the goals of personal and
social responsibility form a Guttman scalogram, and quasi-scalogram, and
that the order of the stages is temporally reliable.

136
b) Did the participants in the Intervention group, but not in the
Control, climb up the scalogram over time?
As the scalograms were established with a greater than or equal to .9
Coefficient of Reproducibility, we may proceed with the final step in the
Guttman (1950) protocol. To determine if the intervention participants climbed
up the revised scalogram over the course of the current study, each individual
participant was assigned respective scale scores. From Guttman’s (1950)
protocol, the assignment of an individual scale score was based on the count
of ‘1’ responses observed in the participants’ item response pattern.
Therefore, an individual scale score could be any value between 0 (no ‘1’
responses) and 4 (four ‘1’ responses) for the self-reporting scalogram, and 0
and 5 for the quasi-scalogram.
In keeping with Guttman’s (1950) recommendations, it is feasible to combine
the data to obtain a group representation. The participants’ scale scores were
averaged, at each time point, to provide a group scale score, at each time
point, one each for the intervention group and the control group. Over the six
time points, two scale scores were calculated for every participant, in the
intervention and control groups. One scale score for the child self-reporting
measures, and the second combined the child self-reporting measure with the
averaged score of the parent and teacher measure.
Mean scale scores were plotted for each group, intervention and control, at
each of the six time points in the current study for goals 1 - 4 (Figure 56), and
1 – 5 (Figure 57). The separation between the means is also presented (dʹ ).

Figure 56: Mean scale scores as a function of time and treatment group – Goals 1 - 4 only.
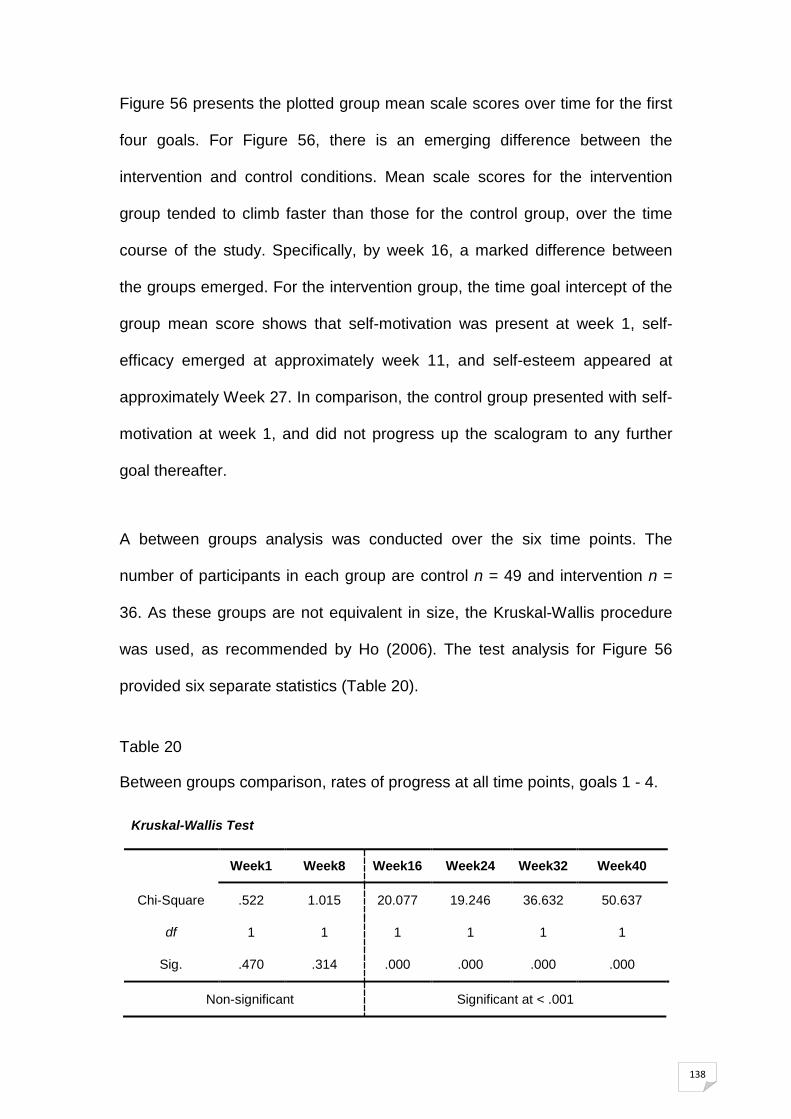
138
Figure 56 presents the plotted group mean scale scores over time for the first
four goals. For Figure 56, there is an emerging difference between the
intervention and control conditions. Mean scale scores for the intervention
group tended to climb faster than those for the control group, over the time
course of the study. Specifically, by week 16, a marked difference between
the groups emerged. For the intervention group, the time goal intercept of the
group mean score shows that self-motivation was present at week 1, self-
efficacy emerged at approximately week 11, and self-esteem appeared at
approximately Week 27. In comparison, the control group presented with self-
motivation at week 1, and did not progress up the scalogram to any further
goal thereafter.
A between groups analysis was conducted over the six time points. The
number of participants in each group are control n = 49 and intervention n =
36. As these groups are not equivalent in size, the Kruskal-Wallis procedure
was used, as recommended by Ho (2006). The test analysis for Figure 56
provided six separate statistics (Table 20).
Table 20
Between groups comparison, rates of progress at all time points, goals 1 - 4.
Kruskal-Wallis Test
Week1 Week8 Week16 Week24 Week32 Week40
Chi-Square .522 1.015 20.077 19.246 36.632 50.637
df 1 1 1 1 1 1
Sig. .470 .314 .000 .000 .000 .000
Non-significant Significant at < .001

139
For Table 20, at week 16 and beyond, there is significant difference between
the intervention and control group; χ2 (1, n = 85) = 20.077, p < .001. At week
24, the difference between the conditions was significant; χ2 (1, n = 85) =
19.246, p < .001. Week 32 demonstrated a significant difference; χ2 (1, n = 85)
= 36.632, p < .001. Lastly, at week 40, the difference between the intervention
and control group was also significant; χ2 (1, n = 85) = 50.637, p < .001.
Figure 57 extends the number of rungs in the Guttman hierarchy to a quasi-
scalogram of five goals, by including parent and teacher perceptions of
positive behaviour (a ‘quasi’-Guttman scalogram). In Figure 57, the same
divergant pattern in Figure 56 emerges. From study outset to week 16, the
intervention group demonstrates a steady rate of climb. In comparison, the
control group reaches asymptote at week 16.
In Figure 57, the time goal intercept of the group mean score, for the
intervention participants, demonstrated that self-motivation was apparent at
week 1. The intercept for self-efficacy occured at approximately week 10, and
self-esteem at approximately week 20. At 32 weeks, prosocial behaviour was
apparent. In comparison, the control group demonstrated that the same
pattern in Figure 56 was evident, where the control did not progress from goal
one, which presented at week 1.

140
Following the Kruskal-Wallis procedure, the test analysis for Figure 57
provided six separate statisitcs (Table 21).
Table 21
Between groups comparison, rates of progress at all time points, goals 1 - 5.
Kruskal-Wallis Test
Week1 Week8 Week16 Week24 Week32 Week40
Chi-Square .591 1.507 20.801 20.815 40.607 55.180
df 1 1 1 1 1 1
Sig. .442 .220 .000 .000 .000 .000
Non-significant Significant at < .001
For Table 21, from week 16, there is significant difference between the
intervention and control group; χ2 (1, n = 85) = 20.801, p < .001. At week 24,
the significant difference between the conditions was χ2 (1, n = 85) = 20.815, p
< .001. A significant difference at week 32 was also demonstrated; χ2 (1, n =
85) = 40.607, p < .001. For the final time point at week 40, a significant
difference was demonstrated between the intervention and control group; χ2
(1, n = 85) = 55.180, p < .001.

Figure 57: Quasi-scalogram by treatment group – Goals 1 - 5.

142
Conclusions
a) Was there a scalogram?
The goals of the Hellison model formed a scalogram, replicable at six time points,
regardless of whether there were four or five items in the Guttman hierarchy, both for
the intervention and control groups. The sequence of the goals found was not in the
order proposed by Hellison (2003).
b) Did the participants in the Intervention group, but not in the
Control, climb up the scalogram over time?
Having determined a revised stage sequence in the current study, Scalogram
Analyses indicated that the intervention group, but not the control, did climb up the
scalogram. Participants of the intervention group demonstrated increasing scale
scores from week 16, where a significant difference gap emerged between the
intervention and control group, which continued across the subsequent time points.

143
Chapter 6
Discussion
The current study empirically assessed a longitudinal intervention utilising the
Teaching Personal and Social Responsibility model developed by Hellison (2003) in
a New Zealand primary school as part of the school curriculum. The research
literature had acknowledged limitations of contributed works demonstrating tentative
findings for the model. A specific criticism noted in the research literature highlighted
inconclusive empirical work conducted to examine and confirm model effectiveness.
Academic research had also demonstrated the inability of the model to generalise
out of the environment where instruction took place, questioning the model’s validity.
There is also a deficit of international research on the model generated from within
school curriculums. Additionally, and specifically for the current study, there is an
absence of research examining the effectiveness of the model in a New Zealand
primary school.
In addressing these points in the current study, hypotheses were formulated to
examine the Teaching Personal and Social Responsibility model developed by
Hellison (2003). Essentially, two pertinent questions were identified that an empirical
investigation could address.

144
Revisiting the hypotheses
1) Independently of point in time, the children’s responses on Hellison’s goals will
form a consistent scalogram, meaning that,
2) Over time, participants in an intervention group will progress upwards through
the stages in 1.
The first hypothesis was directed at the model’s validity. From empirical measures,
participant progress was mapped over the course of their involvement in the current
study. The analysis of participant rates of change over time demonstrated that the
intervention group progressively increased their rates of progress across the goals
from study commencement, and also progressively throughout the current study.
However, the data demonstrated that although the participants did progress through
the goals, they did so in a sequence which differs from the one proposed by the
Teaching Personal and Social Responsibility model (Hellison, 2003) outlined in
Table 1.
For the first hypothesis, the goal sequence found in the current study demonstrated
that the development of self-motivation occurred first, consistently scoring highest
throughout the current study. Self-motivation was also closely paired with the rate of
development in self-efficacy for the intervention participants. Self-esteem, which was
postulated to have occurred first, was third in the sequence of positive change
progression. Prosocial behaviour, as relayed by the child participants and positive
behaviour, as observed by parents and teachers, occurred as the Hellison (2003)
goal order predicted.

145
The first and second hypotheses are inextricably linked. The first hypothesis sought
to determine if the model possessed the necessary properties that enabled the
construction of a scalogram. The second hypothesis sought to determine if the
application of the model was effective for the participants in the current study. If
participants of the intervention group were able to progress along the continuum, by
stage progression of the model’s five goals in the scalograms, then the second
hypothesis could be verified. In a first for the research literature, the use of Guttman
(1947, 1950) scaling empirically demonstrated that any participant could advance
along the goals in progressive stages of a revised Hellison (2003) model. Thus, the
measures used in the current study had successfully formed scalograms, at each of
the six time points.
Twelve Coefficients of Reproducibility were generated from the scalograms,
constructed from the child self-reporting measures, which in turn were combined with
the parent and teacher measure. The averaged Coefficients of Reproducibility over
the current study were empirically acceptable. In another first for the research
literature, the scalograms demonstrated that the four child self-reporting measures
formed a means by which the Hellison (2003) model could be empirically examined.
With the addition of the data provided by the parent and teacher objective measure,
the scalograms for the child measures were extended at each and every time point,
which allowed for an assessment of goal 5 of the Hellison model.
For the second hypothesis specifically, the Scalogram Analysis made evident that
the intervention group did empirically progress through each goal of the Hellison
(2003) model. Increasing scale scores for the intervention group demonstrated that
over time, participants of the intervention group scaled upwards on each of the

146
measures in the current study. For the assessment of the fifth goal of the model
specifically, the parents and teachers initially reported little progression for the
participants, as the Hellison model expected. As the current study progressed, the
gradual onset of the fifth goal of the model was evident from the Scalogram Analysis
of the parents and teachers measure. The current study did demonstrate that the
fifth goal of the Hellison (2003) model was feasible, and occurred as the model
predicted.
Theoretical implications from the hypotheses
The stage-like premise of the Hellison (2003) model was evident from the analysis.
Thus, from a theoretical standpoint, the findings from the current study offer a fresh
perspective. In the introduction of this thesis, potential theoretical influences were
offered as to the explanations of development for children, which were explored in
the context of the Hellison (2003) model.
The intervention participants did take on observational learning. The physical activity
component of learning the karate skill set was demonstrated to them by the
facilitator. The children participated by practicing their emerging skills, in groups and
individually, over many weeks. Concurrently, they were exploring social skills initially
set out for them in a new context, and in a new medium; the Hellison model. Over
time, children were able to initiate their own tasks and goals, and negotiate with
others, in completing the activities of the training sessions. Arguably, the children
were making transitions from observational learning to social learning throughout the
delivery of the current application of the model. The goals of the Hellison model
however are social goals. Development within the application of the model, and

147
learning new social skills is contingent on the child’s understanding and ability to
progress through the social goals of the model in order to become more personally
and socially responsible.
Piaget (1969) valued social interactions as means of learning, more than did
Montessori (1936) who felt that social interaction was a distraction from educational
achievement. Both agreed, however, that children be allowed to work on their own
tasks whilst the teacher stepped back from instructional tuition. According to Piaget
and Montessori’s respective theoretical positions, if personal discovery and learning
on their own was to occur, the teacher simply being present, for the child’s sense of
security, is all that is required. The position is similar in the delivery of the Hellison
(2003) model whereby after initial instruction is provided, the facilitator gradually
withdraws allowing children to explore the physical activities and set their own
targets and goals.
Piagetian supporters could make a claim that participation in an application of the
Teaching Personal and Social Responsibility model is a ‘moderately novel
occurrence’. A similar view may be expressed by Montessori (1936) where
promoting a child’s interest and enthusiasm for a new challenge would then lead to
the development of independence, which appears to have been the case in the
current study. However, it is a reasonable suggestion, particularly after many weeks
of involvement, that participants in any application of the model may not have found
it particularly novel, but did perceive value from being involved and participating in a
unique experience.

148
The physical activity components of the training sessions are initially based on
modelling by the facilitator, as a demonstration of the karate skills were required. The
facilitator also spoke with participants about the theme of each training session in
relation to the goals of the Hellison model. Bandura (1986) would therefore argue
that social training practices are at the core of any child’s ability to become
personally and socially responsible. Further, in setting standards to evaluate
personal achievements, rating ones abilities, and generally providing a means for
self-evaluation is reflective of self-motivated learning, and therefore components of
the Hellison (2003) model.
However, Bandura (1986) appears to have set aside that children are able to learn
from their own experiences, and that interaction with others is necessary in order to
gauge (and perhaps test, in moments of conflict) their development of social goals.
Arguably, as Kohlberg (1981) may suggest, the development of socialisation occurs
in stages whereby parents and teachers do not teach every outcome of what it may
mean to be personally and socially responsible. Kohlberg may, instead, contend that
through the child actively engaging with peers, that social experiences promote the
development of social goals, as was suggested by the current study.
In the context of the question asked in the introduction, which Figure of 1, 2, or 3
best represents the findings of the current study, indications were apparent
throughout the analysis. Initial data from the regression analysis suggested that
Figure 3 may have been the closest fit, and in agreement with Bandura’s theoretical
position; the child participants progressed along the respective measures at an
approximately equal rate of progress. At a deeper level of analysis, we saw from
multivariate repeated measures and from equality of means tests that participant

149
progress through the goals was a closer fit to Figure 2. The rate of progress had
suggested an apparent distinction between the goals, demonstrating varying levels
of increasing difficulty form the rates of change, and arguably therefore, more
reflective of a Piagetian theoretical position. As we were looking specifically for
verification of stage properties of the model however, further examination from
Scalogram Analysis revealed that participants in the current study progressed along
the goals in a manner more closely representative of Figure 1, as a revised Hellison
model postulated that they should.
Thusly, it is a reasonable speculation that as a theoretical orientation, Hellison’s
(2003) Teaching Personal and Social Responsibility model is closely aligned with
Piagetian thought in terms of a philosophical position. Arguably, there are also
specific instances where Bandura’s Social Learning theory is apparent in Hellison’s
(2003) model. Hellison’s model is, in the author’s opinion, a novel and unique model
where participants learnt from exemplified modelling initially, from which children in
turn, explored and developed through social interaction and personal discovery in a
series of stages, revealed by the revised Hellison model.
Practical implications from the hypotheses
Examining the finding for the first hypothesis in more detail, the construct of self-
esteem clearly separated the goals between the earlier onset of personal motivation
and self-efficacy, and the later onset of prosocial behaviours for the intervention
participants. The onset of self-esteem in the current study was a reminder of a
similar finding from the Haire and associates (1966) study. Self-esteem was not the
precursor to subsequent indicators that it was predicted to be, but was itself an
150
outcome of previously held self-perceptions of personal accomplishments. Arguably,
based on the finding in the current study, self-motivation and self-efficacy played an
earlier role in the development of personal and social responsibility than did self-
esteem, which differs from previously held beliefs as to the order of the progressive
goal structure of the Hellison (2003) model.
In ascertaining that self-motivation (goal 2 in the Hellison model) was the first goal,
and self-efficacy (goal 3 in the Hellison model) the second goal progressed through
by the intervention participants of the current study, theoretical underpinnings of the
Hellison (2003) model could be cast in new directions. For example, in terms of self-
motivation arising first in the goal sequence, the Hellison model may be likened to
Maier’s (1955) theory of work motivation. Whilst the context differs, Maier’s
preposition is that task performance is the product of a belief in personal ability
coupled with the motivation to achieve, shaped by situational constraints.
In terms of the theory behind the Hellison (2003) model, there is a reasonable
comparison between an application of the model, and Maier’s position. In essence,
participants are challenged with new developmental goals to achieve in an
application of the Hellison model. The participant, who is self-motivated to be
involved, who in turn, believes in their ability to rise to the challenge of new tasks, is
thus exploring their creative and developmental potential that Maier (1955), and
arguably Hellison (2003), envisioned. For the participants of the intervention group
then, progress in the Hellison (2003) model stemmed from the will to be involved
which was tied to a subsequent increase in a sense of achievement, which then led
in turn to an increased belief in personal value. A revised theory then would suggest
that self-motivation is the principal goal, closely tied to self-efficacy, as sequence

151
precursors to self-esteem. It may be reasonable to suggest, that from Maier’s
theoretical position, the order of the goals found in the current study is supported.
Therefore, it may be beneficial to revisit and re-evaluate the theoretical premise of
the Hellison (2003) model, in terms of the order of the goals, based on the findings of
the current study.
In terms of practice, putting the finding for the first hypotheses into another
perspective, an explanation comes directly from Hellison (2011). In the course of the
current study, the third edition of the Teaching Personal and Social Responsibility
model was published (Hellison, 2011). In the most recent edition, the nature of the
cumulative levels was reviewed. Hellison states that the goals were formulated to
“indicate a progression (though not a strict one)” (Hellison, 2011, p31). Hellison
continues by explaining that the goals provide a structure for what he refers to as ‘a
loose teaching-learning progression’ (p32). The progressive premise of the model
has been maintained, in theory, for Hellison’s third edition (2011). Hellison noted that
the progression itself, through the goals of his model, is open to interpretation and
not a rigid sequence.
Arguably, Hellison’s position may stem from the need for research verifying goal
progression and its development before it could be stated conclusively. However, the
current study has demonstrated the progressive stage-like premise of the model and
therefore provided scope for a re-evaluation of the position. Martinek and associates
(2006) have explored the notion of stage development targeting just one goal, the
development of leadership and helping others, the fourth goal of the Hellison (2003)
model. The current study is an extensive elaboration on the idea behind Martinek
and associates’ (2006) research by applying it to the Hellison model in its entirety. In

152
essence, committing to continued research on the stage-like sequence of the
Teaching Personal and Social Responsibility model is warranted on the basis of the
findings presented in the current study. Additional evidence from a replicated study
would extend the present research and further the understanding of stage
progression in the Hellison model.
In terms of impact on the delivery of the model, the finding of the first hypothesis is of
limited consequence. The order of the goals found in the current study was different
to those posited by Hellison (2003). An important factor here is that each goal was
verified, albeit in a different order. The current application taught progressive training
sessions as per the Hellison guidelines, in a sequential order that matched the goal
structure of the model (Appendix I). Between study commencement and the second
test administration, the training sessions had already completed one full rotation. All
participants therefore had been exposed to the five goals, and respective training
sessions of the model, twice within that timeframe. Thus, the order of the training
sessions in the current study likely had minimal, if any, effect on the outcome
sequence of the goals.
Contribution to research
The current study sought to contribute to the existing literature by addressing the gap
in the research that called for a robust empirical investigation of the Hellison (2003)
Teaching Personal and Social Responsibility model. In addition, the current study
sought to provide possibilities and direction in answering historical criticisms of the
model and of the research conducted on it thus far. Having tested the hypotheses for
153
the current study, additional findings were revealed pertaining to specific issues
raised in the research literature.
The choice of medium in the application of the Hellison model
As set out in Chapter Two Methodology, a choice of physical activity was required as
it would form the majority (in terms of time) of the content of any training session.
Hellison (2003) leaves the decision of the type of medium chosen for the training
sessions to the facilitator. Essentially any form of physical activity will suffice and
Hellison (2003) refers to the use of basketball, volleyball, martial arts, football, and
softball as choices personally used. The key factor is that the facilitator is to be fully
conversant with the content of the model, whilst delivering proficient and
knowledgeable instruction in the choice of physical activity.
The current application of the model utilised a karate skill set as the choice of
physical activity. The author of this study, a proficient martial arts instructor with 38
years of experience, facilitated the application of the model in the current study. The
use of a martial art as the physical activity content has been used previously as a
selected medium. For example, a martial arts programme where his model was used
is specifically cited by Hellison (2003, p73). However, it may be a reasonable
speculation that a programme utilising a martial art may have inherent ‘advantages’
over other choices of physical activity. For example, traditional martial arts are
synonymous with highly structured activity, discipline, etiquette, and a progressive
regimen of physical skills, normally conducted in a dedicated venue referred to as a
‘dōjō’ (formal training hall). It was also necessary, in adherence with Hellison’s
(2003) guidelines, to relinquish power from the traditional karate instructor to karate
154
student relationship. For example, a participant given instructions to be followed
throughout a training session is common practice in traditional karate. In comparison,
in accordance with the development of their own personal and social responsibility
as the Hellison model aspires, a participant is working through their activity tasks at
their own direction.
To counter the speculation and any potential confounding power dynamic as Hellison
(2003) has highlighted, traditional approaches to teaching a martial art were treated
differently in the current study. In many ways, traditional aspects of karate teaching
were removed from the physical activity content for the participants. For example,
the participants did not wear karate uniforms, a progressive grading system of karate
skills was not followed, and the venue was their own school hall. Simply, it was only
specifically selected physical karate skills (as detailed in the Methodology and
Appendix I) that were maintained. The purpose of the current study was to examine
the application of the Hellison model, as opposed to a study of how well the
participants acclimatised to a karate school, or perform as karate students.
For the purposes of the current study, the use of a modified karate skills teaching
programme, in accordance with Hellison’s (2003) guidelines, was effective in
delivering the physical activity component of the model.
Empirical assessment of the model
Existing research in the academic literature has demonstrated a predisposition as to
establishing whether participants in reality become more personally and socially
responsible from participation in an application of the model. Arguably, the historical
literature has relied upon the single outcome to determine the model’s legitimacy. As

155
such, the predominance of the existing literature is targeted at the generalisation of
the model to other parts of participants’ lives as evidence of the model’s efficacy. A
critical oversight then of the existing research was made evident. In general,
participants are postulated not be personally and socially responsible prior to
participation in the model. Therefore, any progress from that point towards the final
goal of the model must be considered a positive gain irrespective of achieving the
final goal of the model by any participant.
To examine the goals of the model empirically in the current study, a choice of which
measures to utilise for the assessment of the variables was required. The Hellison
model is structured around educational and developmental achievement, and is not
a psychological model. For the purposes of application and assessment however,
the current study required the Hellison (2003) model to be behaviourally
operationalised. In so doing, assessment measures were selected on a best fit basis
to the goals and foci of each stage of the Hellison model.
The empirical measures chosen had each demonstrated reliable and valid properties
prior to their selection. However, their application in assessing participant change
and progress along the goal continuums of the Hellison (2003) model is a first for the
literature, and the model. There are numerous additional or alternative objectives,
values, and developmental goals that could be associated with youth that may be
evaluated. Arguably, the choice of measures was but one set of possibilities in an
attempt to address the call for an empirical evaluation of the Teaching Personal and
Social Responsibility model. For the purposes of the current study, each measure
did demonstrate consistent acceptable reliability over all time points. Data collected
from each test administration provided for detailed analysis of participant change
156
over time whilst participating in the current application of the Hellison model. For
academic continuity and comparative purposes, replication using the measures of
the current study is recommended. Their associated reliability and validity in relation
to their assessment of the Hellison (2003) model may be established as a choice of
psychological constructs and measures in subsequent research.
To the best of the author’s knowledge, a principal criticism of the model’s goals of
personal and social responsibility was that there has not been a conclusive
independent empirical test verifying the existence of the specific goals within the
model. The current study is the first to individually target each of the goals within the
model to test their legitimacy. In verifying the existence of each of the five goals, the
current study also empirically verified that a participant was able to progressively
move along each measured continuum for the five goals of the model. A critical issue
simultaneously identified was the length of time, and intervals of measurement, that
was required to perceive changes of personal and social responsibility in
participants.
Timeframes for change over time
The academic literature has long lamented the want of conclusive evidence of
efficacy for the Hellison (2003) model; research time frames may provide some
assistance. The current study revealed that short term interventions are unlikely to
provide the expected results, from participation, that the model postulates. Over the
40 week duration of the current application of the Hellison (2003) model,
measurement data for the intervention group consistently provided evidence of
157
progressive change over time. The data demonstrated that the positive change
occurred gradually and progressively over one scholastic year.
In terms of meaningful differences between the intervention and control, the current
study highlighted that it was at the 16 week mark (time point 3) that a clear,
statistically significant, separation occurred. Thus, in the current application of the
model, 3 months passed before the intervention group began to pull away from the
control, based on the data from the measures. The emergence of the separation
continued at successive time points. At 24 weeks into the study, the earlier trend at
16 weeks continued and demonstrated that the separation remained evident. At the
32 week marker (time point five), the differences had increased further.
At 40 weeks (time point six), the separation had escalated and continued, and there
was still room for progress by the intervention group. Averaged group data had
shown that linear trajectories appeared across every empirical measure, and in the
scalograms. Further, based on the grouped trajectories, it was illustrated that the
group data had not yet reached the maximum capacity to distinguish participant
development. With the inclusion of more time in the application of the current study,
further gains may well have been demonstrated by the intervention participants.
Therefore, on the basis of the findings in the current study, it is reasonable to
conclude that the development of personal and social responsibility occurs over
many months. Thus, future applications of the Hellison model should consider similar
timeframes as employed by the current study.

158
Empirical measurement of the model
In conducting an empirical study using reliable and valid measurement, the current
study effectively put to rest the argument that the model is unlikely to provide
sufficient capacity or opportunity that would allow for a traditional empirical
investigation (Martinek, 2000). Martinek explained that due to the practical nature of
the model, and that child dynamics are sensitive to the slightest variation, a
traditional approach investigating the model may have a detrimental impact upon
model delivery during the training sessions. For the current study, the warning from
Martinek was well heeded and catered to. The six separate administrations of the
measurements employed were conducted during allocated timeslots during the
school day, and not on a day when a training session was scheduled. In so doing,
there was no interruption to the intervention and no change in schedule of which day
the training sessions were conducted.
The current study reviewed the academic literature and had identified the absence of
a control group in numerous studies conducted on the Hellison (2003) model. Whilst
positive outcomes from participation were often reported, inconclusive and anecdotal
evidence meant that contributed research is open to the possibilities of alternative
interpretations of their findings. In identifying the gap in the literature for a robust
empirical investigation, the inclusion of a control group in the present study
answered the call for comparative evidence to be obtained in conjunction with an
intervention study. For the current study, due to a limitation in the number of students
in the intervention school, an additional school was required to provide the control
group. Concerns for a corresponding representation in the control group were
addressed having been recruited from an identical decile rating school. In addition, it

159
was demonstrated from the data across the measures at study commencement that
the two groups were empirically similar.
The cooperation from both schools was essential in administrating the empirical
measurement protocol. The schools in the current study allowed time within the daily
curriculum to enable the testing for the child participants to be conducted. The
measurement protocol comprised of four child self-report measures assessing their
perception of their individual progress. Equally, the commitment from the parents
and teachers in the completion of their assessment measure provided a way of
independently testing for the onset and development of personal and social
responsibility in the participants. The measure completed each by the participants’
respective teacher and parent reported an objective assessment of the child’s
progress. Whilst the four child self-reporting measures were completed as they saw
themselves, the measure from the parents and teachers was an observational
assessment.
The current study had effectively put into practice a triangulation of assessment
between the child participants, their class teacher, and their respective parent. As it
was successful in the current study, such a collaborative approach to research
measurement is recommended in future research endeavours of the Teaching
Personal and Social Responsibility model.
The task of data collection was a meticulous undertaking. At each of the time points,
there was maximum student attendance to complete the administered tests. There
was no missing data from the child-self reporting measures during the current study.
A complete return rate of the questionnaires from the parents and the teachers was

160
also recorded at every time point. There were occasions when the day, and time,
chosen for test administration had to be flexible with the school. It was noted by the
researcher that the current study was given priority over many day to day
considerations of a school setting. It was evident that the parents and teachers had
recognised the current study as a worthwhile endeavour to which they had given
their full support.
All of the measures utilised in the current study demonstrated acceptable empirical
equivalence at the commencement of the study for both groups. An important feature
for the current study to establish, it served to illustrate the similarity of the two
sampled groups prior to the implementation of Hellison’s (2003) Teaching Personal
and Social Responsibility model. The educational and social similarity of the schools
from which the participants were recruited was provided by a decile rating ascribed
by the New Zealand Ministry of Education. However, it was important to be able to
independently verify that both groups were similar across the constructs measured.
In so doing, concerns over any differences or subsequent change over the course of
the study, that may have been attributed to differences between the groups prior to
study commencement, could be minimised.
Regression analysis of the collected data demonstrated that comparative differences
existed between the intervention group and the control group across all the
measures. The data demonstrated that the intervention group experienced greater
rates of change than the control group across all the administered measures in the
course of the current study. The differences over time in the rate of change across
the trajectories demonstrated an increased rate of positive growth, across all
measures, for the intervention group. In comparison, the scores across the
161
measures for the control group were constant, with minor statistically non-significant
fluctuations, over the course of the study.
In comparing the data from the multivariate repeated analysis of the child self-
reporting measures, the finding demonstrated that for the intervention group
participants, the application of the Hellison (2003) model in the current study was
effective. Statistical power for repeated measures multivariate analysis, a concern in
the current study due to the number of participants as raised in the Methodology
(p35), was demonstrated as acceptable. The combination of the number of variables,
and the repeated measurement of them over the six time points, had effectively
provided a robust empirical design that produced acceptable statistical power, as
Fairweather (1991), and Peterman and Bradford (1987) indicated it should.
According to the data from their four self-reporting measures, the intervention
participants progressed along the first four goals of the Hellison (2003) model. For
the fifth goal, a comparison of parent and teacher responses, between the
intervention and control conditions, was conducted to independently perceive any
increase in observed positive behaviour of the child participants. Over the six time
points, a reported increase in positive behaviour would verify if participants had
effectively demonstrated the fifth goal of the Hellison (2003) model ‘Outside the
Training Venue’, in effect ‘Trying these ideas in other areas of life’. Independent t-
tests, comparing the parents and teachers equality of means, were conducted to
identify statistically significant differences between the control and intervention
groups. The data confirmed that the parents and teachers reported significantly
greater positive behaviour in the intervention group than of the control group over the
course of the current study. The use of independent t-tests served as a suitable
162
comparative assessment of the responses from the measure of positive behaviour in
the current study.
Of the intervention students, the majority did progress along the revised continuum
of the Hellison model. However, this was not the case with every student that took
part. During the course of the current study, there were two students in particular that
had difficulty with consistent engagement with the training sessions. Hellison (2003)
contends that the majority of participants can improve their ‘day-to-day consistency’
(p30), and some will vary from one training session to the next in the course of the
development, but variation can be expected. However, where participants are unable
to progress, then an alternate step(s) are required. As it was in the current study, two
students with previously undiagnosed medical conditions were placed in the
intervention primary school at the beginning of the year. It was revealed from
specialist services, during the course of the current study, that one child was
diagnosed with foetal-alcohol syndrome, and the other, with type 1 diabetes.
The two children did not consistently self-report progress across the application
timeframe, and often their objective assessments of their behaviour did not reflect a
significant increase in positive behaviours. To the credit of both children however,
these two children attempted to be involved and follow the training sessions. Where,
on occasion, either of these two children were no longer able to participate, the
intervention school had a teacher aide available for dedicated care outside of the
training venue.
To recap, the empirical methodology employed in the current study had provided
compelling data from reliable measures to analyse differing rates of change for the

163
intervention and control conditions. The methodology had also highlighted that a
longitudinal study with six test intervals provided sufficient data for analysis. Using
participant self-evaluation measures, combined with observational data from parents
and teachers, was an effective approach to data generation and collection. Given the
previously discussed timeframes where change over time occurred during the 40
week application of the model, a pre-post design would have been unable to provide
data for such analysis. A pre-post design also would have been unable to distinguish
the progressive stage properties of the Hellison (2003) model.
Scalogram utilisation to examine stage progression properties of the model
Having previously outlined the utilisation of Guttman (1950) scaling, the current study
recognises the significant result obtained from Scalogram Analysis which formed an
important part of the assessment protocol. The current study investigated the
feasibility of the Hellison (2003) model for possessing progressive stage-
development properties, having identified that the historical literature had thus far
overlooked the opportunity. Whilst examining for global change in self-perceptions by
the participants over the course of the current study, the assessment using
Scalogram Analysis of the goal sequence of the Hellison (2003) model allowed for a
discrete analysis of each goal of the model over time. A four-item scalogram was
demonstrated for the four child self-report measures. When combining the parent
and teacher measure and the child self-report measures together, a five-item quasi-
scalogram was formed.
The Scalogram Analysis showed that the rate, and timing, of progression across the
individual measures by the intervention participants highlighted two points. Firstly,

164
individual progression through the goals of the Hellison model was demonstrated by
the rate of increasing scores across the measures. The analysis showed that the
development of, and differentiation between, the goals of the Hellison (2003) model
could be confirmed. It was possible then to demonstrate over time, at a group level,
when each goal of the model was progressed through by the intervention
participants. The ability to make such a specific determination has not been
previously available, as demonstrated by inconclusive empirical evidence in the
academic literature.
Secondly, averaging the data from the Positive Behavior Scale completed by the
parents and teachers provided an objective assessment of participant change over
time. The five-item quasi-scalogram confirmed that from the parents and teacher
viewpoint, they were able to discern in the intervention participants, that increased
change in positive behaviours over time had occurred. The inclusion of the parent
and teacher data in the scalogram provided a reliable, objective, assessment of the
participants, revealing evidentiary change in positive behaviour and attitude that the
fifth goal of the Hellison (2003) model predicts.
The scalograms formed across the time points were temporally reliable having met
the averaged Coefficient of Reproducibility criterion. The scalograms had also
established a revised goal structure for the Hellison model, which in turn,
demonstrated the validity for the Hellison (2003) model. In comparing the data from
the Kruskal-Wallis analysis for the intervention and control conditions, the significant
differences between the groups can be attributed to the intervention and thus
eliminate the possibility of maturational effects. The scalograms provided evidence

165
that the Hellison (2003) model was effective, and beneficial, for the intervention
participants.
The current study had successfully revealed a method by which progress through
each of the goals of the Hellison (2003) model could be empirically determined. In a
first for the academic literature using Scalogram Analysis, the current study had
established that the Teaching Personal and Social Responsibility model can be
interpreted, measured, and examined as an attitude scale for the purposes of future
research.
Generalisation of the model in the current study
The current study investigated the Hellison (2003) model for the composition of five
goals of personal and social responsibility as the model proposed. However, perhaps
the single most prevailing criticism from the academic research is that participants
have not conclusively demonstrated the final goal of the model. Goal five states that
participants are able to display their developed personal and social responsibility
outside of the venue where instruction took place. However, the literature has not
conclusively stated that goal five of the model is achievable, or that any participant
could progress and improve to a point where goal five was demonstrated to an
observable level by others. The current study then had devised an empirical means
that could effectively answer both these points.
Over the course of the current study, the class teacher and the parent of every
participant completed the Positive Behavior Scale, relaying their perception of
positive behaviour in the participants. In having both the teachers and the parents
complete the assessment of the participants, the data from each was able to be
166
compared between them simultaneously both for impartiality and empirical
equivalence, but primarily to ascertain participant progress through goal five of the
model. In the attempt to answer the most prevalent question of the model arising in
the academic literature, the current study empirically verified the fifth goal of the
Hellison (2003) model.
From the observational measure completed by the parents and teachers, empirical
tests of independent means indicated that the difference between the groups was
significant. Their observations of the intervention group participants confirmed that
the majority of the children had demonstrated goal 5 of the Hellison (2003) model.
However, the narrow range and limited variety in responses for the measure, when
compared with the control group, demonstrated that the adult responders of the
intervention group may have been biased in their assessment of the children. The
initial regression data from the Positive Behavior Scale initially highlighted a potential
flaw in the equivalence of the control and intervention group teachers and parents.
Namely, that they believed that the children had benefited more favourably, in terms
of initial scores and the degree of positive change, over the course of the current
study and they were not truly objective in their assessment. However, in examining
the data of the Positive Behavior Scale more critically, the differences emerge during
the course of the intervention and not at study outset. Initial equivalence was made
manifest between the respective groups of adult responders, by the comparison of
initial intercepts, across the subscales of the Positive Behavior Scale at study outset.
The use of the Positive Behavior Scale administered to two sets of observers
provided an important and valuable result. For comparative purposes in validity, its

167
use in a similar manner in future research examining generalisation of the Hellison
(2003) model is recommended.
Limitations of the current study
Whilst the current study may triumph a number of successes and make a valuable
contribution to the academic literature, there are limitations and provisos that require
consideration. Firstly, whilst the groups were complete class cohorts, and were
typical of the mainstream school class composition in New Zealand, the number of
participants in each group was small, in empirical research terms. In this regard, the
small group size limits the degree of generalisability of the results, restricting chiefly
only to the participants in the particular sample. However, the variation in the results
when comparing the two groups is indisputable. The result gained provides a
significant source from which conclusions and directions can both guide and facilitate
future research. It would also be beneficial to replicate the current study outside of
the New Zealand context for comparison.
Secondly, the sample groups were recruited from equivalent decile one schools, as
defined by New Zealand’s Ministry of Education. As such, the recruited groups are
representative only of that demographic. To be able to put the result gained from the
current study into a global perspective, additional research conducted in differing
decile schools, as well as private schools, would provide additional outcomes for
comparison. In changing the context of the intervention, with participants of
ostensibly differing socioeconomic backgrounds that decile ratings indicate, it may
offer opportunities in examining intervention impacts for participants across the
educational profile.

168
Thirdly, the primary school participants in the current study were from a narrow age
range, averaging 9.7 years. Continued research with differing child age groups may
be useful in determining variations across age ranges, and to determine if the
findings of the current study generalise to other age bands. For example, in terms of
age and school environment, as children reach 10 years of age, it is commonplace in
New Zealand that a progression from a primary school setting to an intermediate
school setting occurs. Further research targeting the change in age, with the change
in school environment, may offer additional research opportunities for applications of
the Hellison (2003) model. Such a study has not yet been conducted in New
Zealand.
Finally, the current study acknowledges an identified remaining question surrounding
the Hellison (2003) model. Having participated in the current study, the question as
to what extent do participants maintain or develop their new found levels of personal
and social responsibility post study conclusion remains unanswered. For the current
study, there was no follow up analysis of the participating cohorts. The question
remained outside of the scope of the present study, with one notable exception for
the author. Two years post intervention, two child participants from the intervention
group recognised the author at some distance in a public shopping complex. Both of
whom are now finishing their intermediate school year prior to the start of high
school, ran to catch the author. Having then brought the author back to their
respective families in person, time was spent relaying their life events since the study
completed. The children, now in essence young adolescents, departed leaving the
author with family members. Here, the author was thanked for the contribution made
to their children’s lives, but most significantly by their own volition, that their children

169
continue to demonstrate a significant behavioural difference at home as a result of
their participation in the present study.
Future directions
The current study has successfully demonstrated methodological considerations for
empirical evaluation that can be utilised in future research of the Teaching Personal
and Social Responsibility model. In addition, a principal innovation of the current
study was the examination of the individual goals of the Hellison (2003) model. The
academic literature has been predominantly focused upon an outcome result of an
observable increase in personal and social responsibility in participants. The result
from the present study signifies that participants can also be examined at a discrete
level for incremental change over time for each of the goals in the Hellison (2003)
model. Arguably, there is also scope, for a comparative investigation for each of the
goals of the model in isolation, as a series of independent goals.
The model was developed with small groups of participants and Hellison (2003)
suggests that in his experience group numbers are customarily less than twenty. A
potential conflict then between mainstream class sizes in New Zealand schools,
which are typically higher, with the number of group participants typically associated
in interventions by Hellison (2003), is noted. However, the current study has
successfully demonstrated that an intervention with a larger cohort is feasible. In so
doing, potentially negative factors such as only dealing with partial numbers of
classroom participants, or self-selecting individuals into an optional activity for
example, as the only means of conducting an intervention study using the Hellison
(2003) model, can be dismissed. Future research, whilst remaining mindful of the

170
experience and advice from Hellison (2003), need not necessarily be restricted to a
small group of participants. There is no guideline within the model however for a
level of tolerance as to the maximum number of participants for any one intervention.
Having successfully delivered the intervention in the current study to complete class
cohorts, a number of possible future research directions have been discussed, some
additional research questions arise. Principal amongst these would be establishing
the feasibility of introducing the model into main-stream schooling. Whilst school
regulatory and educational requirements remain to be catered to, the possibility for
an entire school delivery of the model would be a significant step toward the want to
graduate personally and socially responsible students into society expressed by New
Zealand’s Ministry of Education (2007).
Studies here could address issues such as multiple class sizes, initiate complete
school streaming between educational subjects as well as classroom settings, but
would also include teacher training and support that a school wide study would
require. Perhaps the most significant obstacle would be the resistance of existing
teaching practice that has been found in historical research which also would have to
be catered for (Mrugala, 2002). As it was for the present study, a guide to initiate
such work does not yet exist but the opportunity has been identified.
Conclusion
The intervention of current study was conducted in a solitary school over the period
of one scholastic year. Whilst the current study has demonstrated empirical strength
and significant findings, the study stands alone without corroborative empirical
evidence from any other research. In delivering the present intervention study, the

171
findings from the work answer many previously identified criticisms. Predominantly of
these was the question for empirical validity of the Hellison (2003) model. In
reiterating Hartmann (2003) who made the summation that it was not that the model
does not work, there is a lack of evidence to support that it does. Noting the
limitations of the current study, the effectiveness of the Hellison (2003) model has
been empirically demonstrated. In accepting that the current study has created a
precedent in the research of the Hellison (2003) model, the gap in the research
literature narrows, and future research now has new directions.
In contemplating new directions, the current study has contributed an alternative
technique in evaluating the delivery of the Teaching Personal and Social
Responsibility model for future research. The current study successfully established
that the Hellison (2003) model can be gauged and examined as an attitude using
Guttman scaling. An attitude scale derived from participant scores can then be
objectively compared to parent and teacher perspectives, or any objective observer.
Each goal of the model thusly can be measured and analysed. The contribution
provides an empirical basis to formulate detailed research that specifically answers
the long lasting call for a means to empirically examine the Hellison (2003) model,
and do so for each goal of the model, as opposed to one single outcome.
The current study has made a significant contribution to the research literature, and
in so doing, provided opportunities for school aged children and their development in
the future. Arguably, elements of what John and Evelyn Dewey (1915) hoped for are
present in the Hellison (2003) model. As progressive educators look to provide
means and ways to deliver meaningful education, so increases the demands for
curricular diversity and innovation. There now exists a reasonable basis to consider

172
Hellison’s (2003) Teaching Personal and Social Responsibility model as an inclusive
option in the developing role of main-stream education. In providing an empirically
validated assessment for the efficacy of the Hellison (2003) model, further empirical
research with a view to incorporation into educational curriculums is warranted.
In conclusion, the present thesis has described the rationale, development, and
findings of empirically investigating Hellison’s (2003) Teaching Personal and Social
Responsibility model. The Hellison (2003) model is a valid programme for teaching
personal and social responsibility in primary school aged children in New Zealand.
The application of the model in the current study was effective, and benefited the
participants of the intervention group. It is hoped that the present study be replicated,
and broadened, so that the body of empirical evidence increases and contributes
further to the understanding of development of personal and social responsibility in
school aged children.

173
References
Andrews, J. A., Hops, H., Ary, D., Lichtenstein, E., & Tildesley, E. (1991). The
construction, validation and use of a Guttman scale of adolescent substance
use: An investigation of family relationships. Journal of Drug Issues, 21(3),
557-572.
Bandura, A. (1977). Social learning theory. Englewood Cliffs, NJ: Prentice-Hall.
Bandura, A. (1986). Social foundations of thought and action: A social cognitive
theory. Englewood Cliffs, NJ: Prentice-Hall.
Bandura, A. (2001). Social cognitive theory: An agentic perspective. Annual Review
of Psychology, 52(1), 1-26.
Bandura, A., Caprara, G. V., Barbaranelli, C., Gerbino, M., & Pastorelli, C. (2003).
Role of affective self-regulatory efficacy in diverse spheres of psychosocial
functioning. Child Development, 74(3), 769-782.
Berk, L. E., & Winsler, A. (1995). Scaffolding children’s learning: Vygotsky and early
childhood education. Washington, DC: National Association for the Education
of Young Children.
Biddle, S., Akande, D., Armstrong, N., Ashcroft, M., Brooke, R., & Goudas, M.
(1996). The Self-Motivation Inventory modified for Children: Evidence on
psychometric properties and its use in physical exercise. International Journal
of Sport Psychology, 27(3), 237-250.
Blascovich, J., & Tomaka, J. (1991). Measures of self-esteem. Measures of
Personality and Social Psychological Attitudes, 1, 115-160.
Caprara, G. V., & Pastorelli, C. (1989). Toward a reorientation of research on
aggression. European Journal of Personality, 3(2), 121-138.
Caprara, G. V., & Pastorelli, C. (1993). Early emotional instability, prosocial
behaviour, and aggression: Some methodological aspects. European Journal
of Personality, 7(1), 19-36.
174
Caprara, G. V., Capanna, C., Steca, P., & Paciello, M. (2005). Misura e Determinanti
Personali Della Prosocialità. Un approccio sociale cognitivo. Giornale Italiano
Di Psicologia, 32(2), 287-307.
Cohen, J. (1988). Statistical power analysis for the behavioural sciences. New
Jersey: Lawrence Erlbaum Associates, Inc.
Colby, B. N. (1987). Well-Being: A theoretical program. American Anthropologist,
89(4), 879-895.
Crain, W. (2011). Theories of development: Concepts and applications. Boston, MA:
Prentice Hall.
De Minzi, M., Lemos, V., & Mesurado, B. (2011). Relationship among children's
perception of parental relationship and parental empathy and prosocial
behaviour during childhood (English). Avances En Psicologia
Latinoamericana, 29(2), 330-343.
Dewey, J., & Dewey, E. (1915). Schools of to-morrow. New York: E.P. Dutton and
Company.
Dishman, R. K., Ickes, W. W., Morgan, W. P., Lavallee, D., Williams, J. M., & Jones,
M. V. (2008). Self-motivation and adherence to habitual physical activity. In D.
Lavallee, J. M. Williams, & M. V. Jones (Eds.), Key studies in sport and
exercise psychology (74-92). Maidenhead, BRK England: Open University
Press.
Edwards, A. L. (1957). Techniques of attitude scale construction. Englewood Cliffs,
NJ: Prentice-Hall.
Epps, S. R., Park, S. E., Huston, A. C., & Ripke, M. (2003, March). Psychometric
analyses of the Positive Behavior Scale in the New Hope Project and the
Panel Study of Income Dynamics. Paper presented at the Positive Youth
Indicators Conference for Child Trends, Washington, DC. Retrieved from
http://www.gse.harvard.edu/faculty_research/profiles/cv/sylvia_epps.pdf.

175
Escartí, A., Gutiérrez, M., Pascual, C., & Llopis, R. (2010). Implementation of the
Personal and Social Responsibility model to improve self-efficacy during
physical education classes for primary school children. International Journal of
Psychology and Psychological Therapy, 10(3), 387-402.
Fairweather, P. G. (1991). Statistical power and design requirements for
environmental monitoring. Australian Journal of Marine and Freshwater
Research, 42, 555-67.
Fleming, J. S., & Courtney, B. E. (1984). The dimensionality of self-esteem: II.
Hierarchical facet model for revised measurement scales. Journal of
Personality and Social Psychology, 46(2), 404.
Gennetian, L. A., & Miller, C. (2002). Children and welfare reform: A view from an
experimental welfare program in Minnesota. Child Development, 73(2), 601-
620.
Glass, G. V. (1997). Interrupted time-series quasi-experiments. Complimentary
Methods for Research in Education, 2, 589-608.
Gordon, B. (2010). Teaching personal and social responsibility through physical
education: An examination of the Teaching Personal and Social Responsibility
model when taught in a New Zealand secondary school. Saarbrucken,
Germany: Lambert Academic Publishing.
Gould, D., & Carson, S. (2008). Life skills development through sport: Current status
and future directions. International Review of Sport and Exercise Psychology,
1(1), 58-78.
Gratton, C., & Jones, I. (2004). Research methods for sport studies. London:
Routledge.
Guttman, L. L. (1944). A basis for scaling qualitative data. American Sociological
Review, 9, 139-150.
Guttman, L. L. (1947). On Festinger’s evaluation of scale analysis. Psychological
Bulletin Measurement, 44, 451-465.
Guttman, L. L. (1950). Relation of Scalogram Analysis to other techniques.
Measurement and Prediction, 4, 172-212.

176
Hagborg, W. J. (1993). The Rosenberg Self-Esteem Scale and Harter's Self-
Perception Profile for Adolescents: A concurrent validity study. Psychology in
the Schools, 30(2), 132-136.
Haire, M., Ghiselli, E. E., & Porter, L. W. (1966). Managerial thinking: An
international study. Oxford: John Wiley & Sons.
Hammond-Diedrich, K. C., & Walsh, D. (2006). Empowering youth through a
responsibility-based cross-age teacher program: An investigation into impact
and possibilities. Physical Educator, 63(3), 134.
Hartmann, D. (2003). Theorizing sport as social intervention: A view from the
grassroots. Quest, 55(2), 118-140.
Hellison, D. R. (1983). Teaching self-responsibility (and more). Journal of Physical
Education, Recreation and Dance, 54, 23-28.
Hellison, D. R. (1985). Goals and strategies for teaching physical education.
Champaign, IL: Human Kinetics.
Hellison, D. R. (1991). The whole person in physical education scholarship: Toward
integration. Quest, 43(3), 307-318.
Hellison, D. R. (2003). Teaching responsibility through physical activity (2nd ed.).
Champaign, IL: Human Kinetics.
Hellison, D. R. (2011). Teaching responsibility through physical activity (3rd ed.).
Champaign, IL: Human Kinetics.
Ho, R. (2006). Handbook of univariate and multivariate data analysis and
interpretation with SPSS. Florida: CRC Press.
Huang, C., & Dong, N. (2012). Factor structures of the Rosenberg Self-Esteem
Scale. European Journal of Psychological Assessment, 28(2), 132-138.
Kellam, S. G., Ling, X., Merisca, R., Brown, C. H., & Ialongo, N. (1998). The effect of
the level of aggression in the first grade classroom on the course and
malleability of aggressive behavior into middle school. Development and
Psychopathology, 10(2), 165-185.

177
Kohlberg, L. (1981). The philosophy of moral development: Moral stages and the
idea of justice: Vol.1. Essays on moral development. New York: Harper &
Row.
Laker, A. (2000). Beyond the boundaries of physical education. New York:
Routledge.
Lee, O., & Martinek, T. (2009). Navigating two cultures: An investigation of cultures
of a responsibility-based physical activity program and school. Research
Quarterly for Exercise and Sport, 80(2), 230-240.
Linver, M. R., Roth, J. L., & Brooks-Gunn, J. (2009). Patterns of adolescents’
participation in organized activities: Are sports best when combined with other
activities? Developmental Psychology, 45(2), 354-367.
Loland, S. (2006). Morality, medicine, and meaning: Towards an integrated
justification of physical education. Quest, 58(1), 60-70.
Maier, N. R. F. (1955). Psychology in industry: A psychological approach to industrial
problems. Boston: Houghton Mifflin.
Marshall, S. J., & Biddle, S. J. H. (2001). The Transtheoretical Model of behavior
change: A meta-analysis of applications to physical activity and exercise.
Annals of Behavioral Medicine, 23, 229–246.
Martinek, T. (2000). Program evaluation. In D. Hellison, N. Cutforth, J. Kallusky, T.
Martinek, M. Parker, & J. Stiehl (Eds.), Serving underserved youth through
physical activity: Toward a model for school-university collaboration (pp. 211-
228). Champaign, IL: Human Kinetics.
Martinek, T., & Schilling, T. (2003). Developing compassionate leadership in
underserved youths. Journal of Physical Education, Recreation & Dance,
74(5), 33-39.
Martinek, T., Schilling, T., & Hellison, D. (2006). The development of compassionate
and caring leadership among adolescents. Physical Education and Sport
Pedagogy, 11(2), 141-157.
Maslow, A. (1968). Toward a psychology of being (2nd ed.). New York: Van
Nostrand Reihold.

178
Ministry of Education. (2007). The New Zealand Curriculum. Wellington, New
Zealand: Learning Media.
Montessori, M. (1936). The secret of childhood (M.J. Costelloe, trans.). New York:
Ballantine Books, 1966.
Montessori, M. (1948). From childhood to adolescence (A.M. Joosten, trans.). New
York: Schocken, 1973.
Motl, R., Dishman, R., Felton, G., & Pate, R. (2003). Self-motivation and physical
activity among black and white adolescent girls. Medicine and Science in
Sports and Exercise, 35(1), 128-136.
Mrugala, K. (2002). An exploratory study of responsibility model practitioners.
Unpublished doctoral dissertation: University of Illinois at Chicago.
Muris, P. (2001). A brief questionnaire for measuring self-efficacy in youths. Journal
of Psychopathology and Behavioural Assessment, 23(3), 145–149.
Muris, P. (2002). Relationships between self-efficacy and symptoms of anxiety
disorders and depression in a normal adolescent sample. Personality and
Individual Differences, 32(2), 337–348.
Nunnally, J. C. (1978). Psychometric Theory. New York: McGraw-Hill.
Olson, C. L. (1976). On choosing a test statistic in multivariate analysis of variance.
Psychological Bulletin, 83, 579-586.
Pascual, C., Escartí, A., Llopis, R., Gutíerrez, M., Marín, D., & Wright, P. M. (2011).
Implementation fidelity of a program designed to promote personal and social
responsibility through physical education: A comparative case study.
Research Quarterly for Exercise and Sport, 82(3), 499-511.
Peterman, R. M., & Bradford, M. J. (1987). Statistical power of trends in fish
abundance. Canadian Journal of Fisheries and Aquatic Sciences, 44(11),
1879-1889.
Piaget, J. (1969). Science of education and the psychology of the child (D.Coltman,
trans.). New York: Viking, 1970.

179
Polit, D. F. (1998). The Positive Behavior Scale. Saratoga Springs, NY: Humananalysis.
Quint, J. C., Bos, J. M., & Polit, D. F. (1997). New Chance: Final report on a
comprehensive program for young mothers in poverty and their children. New
York: Manpower Demonstration Research Corporation.
Robson, C. (1993). Real world research: A resource for social scientists and
practitioner-researchers. Oxford, UK: Blackwell Publishers.
Schmitt, D. P., & Allik, J. (2005). Simultaneous administration of the Rosenberg Self-
Esteem Scale in 53 nations: Exploring the universal and culture-specific
features of global self-esteem. Journal of Personality and Social Psychology,
89(4), 623-642.
Shayer, M., & Beasley, F. (1987). Does instrumental enrichment work? British
Educational Research Journal, 13(2), 101-119.
Shorkey, C. T., & Whiteman, V. L. (1977). Development of the Rational Behavior
Inventory: Initial validity and reliability. Educational and Psychological
Measurement, 37(2), 527-534.
Siedentop, D. (1994). Sport education: Quality PE through positive sport
experiences. Champaign, IL: Human Kinetics.
Singer, J. D., & Willett, J. B. (2003). Applied longitudinal data analysis: Modeling
change and event occurrence. New York: Oxford University Press.
Smith, D., & Bar-Eli, M. (Eds.). (2007). Essential readings in sport and exercise
psychology. Champaign, IL: Human Kinetics.
Stouffer, S. A., Guttman, L., Suchman, E. A., Lazarsfeld, P. F., Star, S. A., &
Clausen, J. A. (1950). Measurement and prediction. New Jersey: Princeton
University Press.
Suldo, S. M., Shaunessy, E., & Hardesty, R. (2008). Relationships among stress,
coping, and mental health in high-achieving high school students. Psychology
in the Schools, 45(4), 273-290.

180
Walsh, D. (2008). Helping youth in underserved communities envision possible
futures: An extension of the Teaching Personal and Social Responsibility
model. Research Quarterly for Exercise and Sport, 79(2), 209-221.
Walsh, D., Ozaeta, J., & Wright, P. M. (2010). Transference of responsibility model
goals to the school environment: Exploring the impact of a coaching club
program. Physical Education and Sport Pedagogy, 15(1), 15-28.
Wentzel, K. R. (1991). Social competence at school: Relation between social
responsibility and academic achievement. Review of Educational Research,
61(1), 1-24.
Wright, P. M., & Burton, S. (2008). Implementation and outcomes of a responsibility-
based physical activity program integrated into an intact high school physical
education class. Journal of Teaching in Physical Education, 27(2), 138-154.
Wright, P. M., & Li, W. (2009). Exploring the relevance of positive youth development
in urban physical education. Physical Education and Sport Pedagogy, 14(3),
241-251.
Wright, P., White, K., & Gaebler-Spira, D. (2004). Exploring the relevance of the
Personal and Social Responsibility model in adapted physical activity: A
collective case study. Journal of Teaching in Physical Education, 23(1), 71-81.
Wright, P. M., Li, W., Ding, S., & Pickering, M. (2010). Integrating a personal and
social responsibility program into a Wellness course for urban high school
students: Assessing implementation and educational outcomes. Sport,
Education and Society, 15(3), 277-298.
Wylie, R. C. (1989). Measures of self-concept. Lincoln NE, USA: University of
Nebraska Press.

181
Appendix A
Teacher Information Sheet
Evaluation of the Teaching Personal and Social Responsibility programme (T.P.S.R.).
INFORMATION SHEET for TEACHERS
Researcher Introduction Hello, I am Michael Hayes Smith a M.Sc. (Psychology) graduate and Ph.D. candidate with Massey University at Albany. I have 22 years applicable martial art and teaching experience. I am supported in this project by Dr. Richard Fletcher and Prof. Stuart Carr, two highly competent and skilled supervisors at Massey University who are experienced with research and projects in this field. The project is an evaluation of an in-school educational programme. We aim to assess its effectiveness, contribute to literature, and provide potential options for educational development in New Zealand for primary school aged children. The Teaching Personal and Social Responsibility programme (T.P.S.R.) is to be located in two schools in Auckland. Project Description and Invitation The T.P.S.R. programme has demonstrated effectiveness addressing the educational development of programme participants in other countries, but has not yet been trialled here in New Zealand. A proven model, as is the aim of this work, acceptable to Governmental and Non-Governmental agencies can provide options for educational change without committing additional scholastic resources such as time, personnel, and finances. The T.P.S.R. programme is to be administered in two participant schools over one scholastic year. As a participant in this study, your views, contributions and observations are part of this work. Questionnaires will be completed at pre-set intervals throughout this period to gain your feedback. Data administration and collection from this will be completed at school, remain anonymous, kept secure, and be destroyed in due course in accordance with all rules and regulations. Your willingness to be involved with this project is paramount and earnestly invited. Participant Identification and Recruitment This programme is tailored for year 6 primary school children from Auckland. No pre-selection criteria apply as the programme is made available to all year 6 students at the schools direction and choice. The two schools will identify the programme participants and recruitment will be made by these schools and will direct participants into the programme at their discretion. No discomfort or risk to any participant as a result of participation is expected. Project Procedures The participants in schools will be part of a weekly physical education programme for a one hour class, once a week. The programme focuses on the development of physical motor skills, karate self-defence skills, and the participant’s ability to work in conjunction with other students. The same

182
participants will also complete questionnaires asking for their feedback on the programme and their involvement in it. These will be completed at six-weekly intervals. As a teacher in connection with each of the in-school participants, you will be asked to complete questionnaires about their individual involvement and progress in the programme as well. This will enable valuable feedback. This will take approximately 20 minutes every 6 weeks of the programme. Data Management Each participant will be assigned an independent alpha-numeric code known only to the researcher. All of the information and questionnaires, administration and collection, will be completed at school, remain anonymous, kept secure, and will be destroyed within five years. The final publication of the research is expected during 2010 and a summary will be made available to all participants upon request. Participant’s Rights As a participant in this study, you have the right to:
• decline to answer any particular question; • withdrawal from the programme at any time; • ask any questions about the study at any time during participation; • provide information on the understanding that your name will not be used; • be given access to a summary of the project findings when it is concluded; • please note that the completion and return of the questionnaires implies your consent.
Project Contacts Researcher:
Michael Smith Ph. 021 250 0998. [email protected] Supervision Team:
Dr. Richard Fletcher Ph. (09) 414 0800. [email protected]
Professor Stuart Carr Ph. (09) 414 0800. [email protected]
Committee Approval Statement This project has been reviewed and approved by the Massey University Human Ethics Committee: Northern, Application 09/004. If you have any concerns about the conduct of this research, please contact Dr Denise Wilson, Chair, Massey University Human Ethics Committee: Northern, telephone 09 414 0800 x9070, email [email protected].

183
Appendix B
Teacher Consent Form
Evaluation of the Teaching Personal and Social Responsibility programme (T.P.S.R.).
PARTICIPANT CONSENT FORM - Teacher
I have read the Information Sheet and have had the details of the study explained to me. My
questions have been answered to my satisfaction, and I understand that I may ask further questions
at any time.
I agree to participate in this study under the conditions set out in the Information Sheet.
I agree to share information regarding the child participants for the purposes of the T.P.S.R.
programme with Michael Smith. I understand the information will be kept confidential at all times.
Signature: Date: Full Name - printed

184
Appendix C
Child Participant Information Sheet
Involvement and Evaluation of the Teaching Personal and Social Responsibility programme in
school (T.P.S.R.).
INFORMATION SHEET FOR PARTICIPANTS (you). Who am I? Hello, I am Michael Smith a graduate and Doctorial candidate with Massey University at Albany. I have 22 years martial art and teaching experience. Nice to meet you. Why am I here? As part of the physical education classes at your school this year, I will be sharing Karate, self-defence and personal awareness training with you. You are able to take part once a week, in the afternoons, straight after lunch for an hour. What will you have to do? Take part, get involved, and enjoy. Remember that this is still part of the P.E. classes in school. You will get to learn some martial art skills and learn some practical self-defence safety. Also, from time to time, I will ask you to answer some questionnaires about the classes, what you think of them, and how you think you are doing. It will take about ten minutes to fill out the questionnaires. It is your choice to do them. What happens to all this Information? All of the questionnaires, and all your information that you choose to share, is kept safe at all times. No one else has access to them. When the school year finishes, a final report about this programme is made to your school, your parents, and to you if you wish. At no time will your name be used in any publication. You have rights In taking part, you have the right to:
• not to answer any particular question on the questionnaires; • ask any questions about the study at any time during taking part; • provide information knowing that your name will not be used; • be given a summary of the things we find out when it is finished; • and please note that completing and returning questionnaires means it’s ok
for me to use them to evaluate and provide feedback about the work being done.

185
What happens if I have other questions? All questions are good. Feel free to ask myself, or your teacher. Remember, respectful questions will always give you respectful answers. Making Contact You will see me in school often and you will be able to talk with me in class every school week. Outside of this time, if you need to make contact with me, please talk with your teacher first.
Committee Approval Statement This project has been reviewed and approved by the Massey University Human Ethics Committee: Northern, Application 09/004. If you have any concerns about the conduct of this research, please contact Dr Denise Wilson, Chair, Massey University Human Ethics Committee: Northern, telephone 09 414 0800 x9070, email [email protected].

186
Appendix D
Child Participant Consent
Evaluation of the Teaching Personal and Social Responsibility programme in school (T.P.S.R.).
PARTICIPANT CONSENT FORM - Individual
I have read the Information Sheet and have had the details of the study explained to me. My
questions have been answered to my satisfaction, and I understand that I may ask further questions
at any time.
I agree to participate in this study under the conditions set out in the Information Sheet.
Signature: Date: Full Name - printed

187
Appendix E
Parent Participant Information Sheet
Evaluation of the Teaching Personal and Social Responsibility programme (T.P.S.R.).
INFORMATION SHEET for PARENTS
Who am I? Hello, I am Michael Hayes Smith a M.Sc. (Psychology) graduate and Ph.D. candidate with Massey University at Albany. I have 22 years applicable martial art and teaching experience. I am supported in this project by Dr. Richard Fletcher and Professor Stuart Carr from Massey University. Our contact details are located on the next page. What is it all about? The project is an evaluation of an in-school educational programme. I hope to provide potential options for educational development in New Zealand for primary school aged children. The programme focuses on the development of physical motor skills, karate self-defence skills, and the children’s ability to work in conjunction with others. What are we doing? The children in schools will be part of a weekly physical education (P.E.) programme for a one hour class, once a week. The same children will also complete questionnaires asking for their feedback on the programme and their involvement in it. These will be completed at six-weekly intervals. We do require your consent for your child to participate in this programme. I will also be asking from your child’s school, permission to share information between myself and your child’s teacher regarding their progress in the programme and ask for your consent to do this. No costs or fees for this programme will be charged, it is free. As a parent or caregiver in connection with one of the in-school participants, you will also be asked to complete questionnaires from time to time about their involvement and progress in the programme as well. This will enable valuable feedback and for you to actively contribute to the programme and your child’s progress. Your willingness to be involved with this project is paramount and earnestly invited.

188
What happens to my information? Will I be identified? No identification of any person, you or your child, will be made. Each participant will be assigned an independent alpha-numeric code known only to myself; your identity will remain at all times confidential. Completing the questionnaires will be done at a time and location of your choosing, remain anonymous, kept secure, and will be destroyed within five years. The final publication of the research is expected during 2010 and a summary will be made available to all participants upon request. Participant’s Rights
As a participant in this study, you have the right to:
• decline to answer any particular question; • withdrawal from the programme at any time; • ask any questions about the study at any time during participation; • provide information on the understanding that your name will not be used; • be given access to a summary of the project findings when it is concluded; • please note that the completion and return of the questionnaires implies your
consent. Project Contacts Researcher: Michael Smith Ph. 021 250 0998.
[email protected] Supervision Team: Dr. Richard Fletcher Ph. (09) 414 0800.
[email protected] Professor Stuart Carr Ph. (09) 414 0800.
Committee Approval Statement This project has been reviewed and approved by the Massey University Human Ethics Committee: Northern, Application 09/004 If you have any concerns about the conduct of this research, please contact Dr Denise Wilson, Chair, Massey University Human Ethics Committee: Northern, telephone 09 414 0800 x9070, email [email protected].
189
Appendix F
Parent Participant Consent
Evaluation of the in-school Teaching Personal and Social Responsibility programme (T.P.S.R.).
PARTICIPANT CONSENT FORM - Parent
I have read the Information Sheet and have had the details of the study explained to me. My
questions have been answered to my satisfaction, and I understand that I may ask further questions
at any time.
I agree to my child (please print name of your child here) participating
in the T.P.S.R. programme at school.
I agree to participate in this study under the conditions set out in the Information Sheet.
I agree to allow my child’s school and teachers to share information with Michael Smith for the
T.P.S.R. programme. I understand the information will be kept confidential at all times.
Signature: Date: Full Name - printed

190
Appendix G
Teacher Confidentiality Agreement
Evaluation of the Teaching Personal and Social Responsibility programme.
CONFIDENTIALITY AGREEMENT
I ................................................................................................................. (Full Name - printed)
agree to keep confidential all information concerning the project .................................................
I will not retain or copy any information involving the project.
Signature: Date:

191
Appendix H: Karate Authorisation

192
Appendix I: Session Plans
1 Hour Session Plan: 1
Theme: Respect Counselling Time Awareness Talk:
• to open the lesson, today is about the basic formalities, the basic punch, and the first block.
• is the opportunity to remind students about their responsibilities that
day. Respect for others, respect for self, control of what we say and how it is said. Also a focus on peaceful negotiation, right to be included, treating one another as equals.
Lesson: Teaching the skill set –
Bow (Rei) Standing Stance (Heiko Dachi) Stomach Punch (Chudan Tsuki) Head Punch (Jodan Tsuki) Head Block (Age Uke) Partner Drills – Mirroring each other Group Drills – Working together Single Drills – Independent practice
Group Meeting Reflection Time

193
1 Hour Session Plan: 2
Theme: Respect Counselling Time Awareness Talk:
• to open the lesson, today is about some new stances, a punch and the first kick skill.
• is the opportunity to remind students about their responsibilities that
day. Respect for others, respect for self, control of what we say and how it is said. Also a focus on peaceful negotiation, right to be included, treating one another as equals.
Lesson: Teaching the skill set –
Long Fighting Stance (Zenkutsu Dachi) Sumo Stance (Shiko Dachi) Short Punch (Shita Tsuki) Front Kick (Mae Geri) Partner Drills – Mirroring each other Group Drills – Working together Single Drills – Independent practice
Group Meeting Reflection Time

194
1 Hour Session Plan: 3
Theme: Participation Counselling Time Awareness Talk:
• to open the lesson, todays is about another new stance, a new strike, block and the powerful round kick.
• is the opportunity to remind students about their responsibilities that
day. Responsibility for self-motivation, participation, involvement, concentration, task achievement, goal awareness.
Lesson: Teaching the skill set –
Horse Stance (Kiba Dachi) Round Elbow (Mawashi Empi) Lower Level Block (Gadan Barai) Round Kick (Muwashi Geri) Partner Drills – Mirroring each other Group Drills – Working together Single Drills – Independent practice
Group Meeting Reflection Time

195
1 Hour Session Plan: 4
Theme: Participation Counselling Time Awareness Talk:
• to open the lesson, the short fighting and the back leaning stances, a new block and the side kick.
• is the opportunity to remind students about their responsibilities that
day. Responsibility for self-motivation, participation, involvement, concentration, task achievement, goal awareness.
Lesson: Teaching the skill set –
Short Fighting Stance (Han Zenkutsu Dachi) Back Leaning Stance (Kokutsu Dachi) Outside Block (Soto Uke) Side Kick (Yoko Geri) Partner Drills – Mirroring each other Group Drills – Working together Single Drills – Independent practice
Group Meeting Reflection Time

196
1 Hour Session Plan: 5
Theme: Self-Direction Counselling Time Awareness Talk:
• to open the lesson, today is about stringing the basics together into a pattern. The first kata formats.
• is the opportunity to remind students about their responsibilities that
day. Self planning, reflective positive self-choices, self-supervision of personal needs and interests in context of goals of the physical training. Working towards long-term achievement awareness.
Lesson: Teaching the skill set –
1st Kata (Taigyuku Shodan) (Foot Work Only) 1st Kata (Taigyuku Shodan) (Complete) 2nd Kata (Taigyuku Nidan) (Foot Work Only) Partner Drills – Mirroring each other Group Drills – Working together Single Drills – Independent practice
Group Meeting Reflection Time

197
1 Hour Session Plan: 6
Theme: Self-Direction Counselling Time Awareness Talk:
• to open the lesson, today’s is the cat stance, a new block, strike and the back kick.
• is the opportunity to remind students about their responsibilities that
day. Self planning, reflective positive self-choices, self-supervision of personal needs and interests in context of goals of the physical training. Working towards long-term achievement awareness.
Lesson: Teaching the skill set –
Cat Stance (Nekoashi Dachi) Front Back Fist (Uraken Uchi) Sweeping Block (Gedan Uke) Back Kick (Ushiro Geri) Partner Drills – Mirroring each other Group Drills – Working together Single Drills – Independent practice
Group Meeting Reflection Time

198
1 Hour Session Plan: 7
Theme: Caring Counselling Time Awareness Talk:
• to open the lesson, today is mostly about the advanced blocks and the side back fist.
• is the opportunity to remind students about their responsibilities that
day. Awareness that any individual is able to make positive contributions every day. Listening and responding, understanding that that strength can be found in recognising the needs and feelings of others.
Lesson: Teaching the skill set –
Side Back Fist (Yoko Uraken Uchi) Inside Block (Uchi Uke) Double Block (Chuge Uke) Hooking Block (Kake Uke) Partner Drills – Mirroring each other Group Drills – Working together Single Drills – Independent practice
Group Meeting Reflection Time

199
1 Hour Session Plan: 8
Theme: Caring Counselling Time Awareness Talk:
• to open the lesson, today is about the hour glass stance, a new strike, a block, and partner drills facing one another for comparisons and exchanging feedback between partners.
• is the opportunity to remind students about their responsibilities that
day. Awareness that any individual is able to make positive contributions every day. Listening and responding, understanding that that strength can be found in recognising the needs and feelings of others.
Lesson: Teaching the skill set –
Hour Glass Stance (Sanchin Dachi) Ridge Hand (Haito Uchi) Round Block (Mawashi Uke) Partner Drills – Mirroring each other Group Drills – Working together Single Drills – Independent practice
Group Meeting Reflection Time

200
1 Hour Session Plan: 9
Theme: Outside the Training Venue Counselling Time Awareness Talk:
• to open the lesson, today is about the rising elbow, the knife hands, and partner drills facing one another for comparisons and exchanging feedback between partners.
• is the opportunity to remind students about their responsibilities that
day. Taking all that you know and applying it at home, school, on the street. Understanding their role in personal well-being and that of others. What it means to be a role model to others.
Lesson: Teaching the skill set –
Rising Elbow (Hijiate) Inside Knife Hand (Soto Shuto Uchi) Outside Knife Hand (Uchi Shuto Uchi) Partner Drills – Mirroring each other Group Drills – Working together Single Drills – Independent practice
Group Meeting Reflection Time

201
1 Hour Session Plan: 10
Theme: Outside the Training Venue Counselling Time Awareness Talk:
• to open the lesson, today is about the etiquette, the execution, and the focus of the formal kata. This is the last learning step in their karate skill set.
• is the opportunity to remind students about their responsibilities that
day. Taking all that you know and applying it at home, school, on the street. Understanding their role in personal well-being and that of others. What it means to be a role model to others.
Lesson: Teaching the skill set –
1st Kata (Taigyuku Shodan) (Complete) 2nd Kata (Taigyuku Nidan) (Foot Work Only) 2nd Kata (Taigyuku Nidan) (Complete) Partner Drills – Mirroring each other Group Drills – Working together Single Drills – Independent practice
Group Meeting Reflection Time

202
Appendix J: Individual fitted OLS trajectories
Control S-ES fitted OLS trajectories.
Control SMI-C9 fitted OLS trajectories.
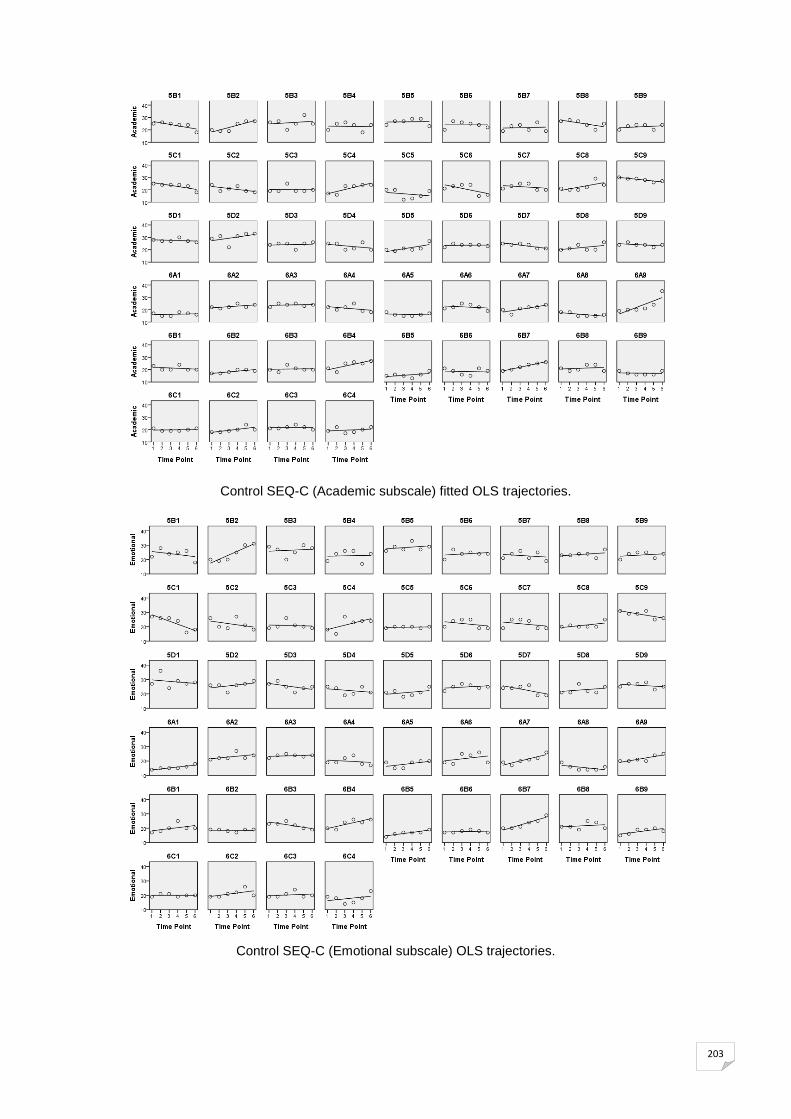
203
Control SEQ-C (Academic subscale) fitted OLS trajectories.
Control SEQ-C (Emotional subscale) OLS trajectories.
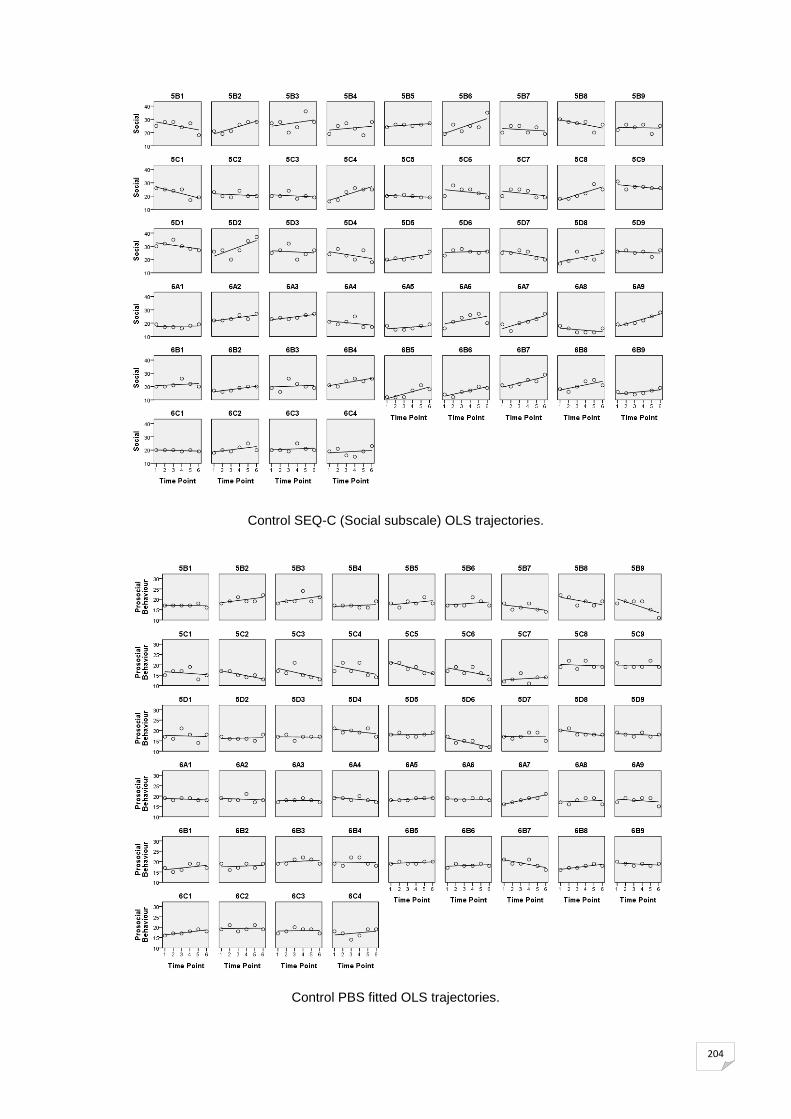
204
Control SEQ-C (Social subscale) OLS trajectories.
Control PBS fitted OLS trajectories.

205
Control Positive Behavior Scale(T) fitted OLS trajectories for Social Competence.
Control Positive Behavior Scale(T) fitted OLS trajectories for Autonomy.

206
Control Positive Behavior Scale(T) fitted OLS trajectories for Compliance.
Control Positive Behavior Scale(P) fitted OLS trajectories for Social Competence.

207
Control Positive Behavior Scale(P) fitted OLS trajectories for Autonomy.
Control Positive Behavior Scale(P) fitted OLS trajectories for Compliance.

208
Intervention S-ES fitted OLS trajectories.
Intervention SMI-C9 fitted OLS trajectories.

209
Intervention SEQ-C (Academic subscale) fitted OLS trajectories.
Intervention SEQ-C (Emotional subscale) OLS trajectories.

210
Intervention SEQ-C (Social subscale) OLS trajectories.
Intervention PBS fitted OLS trajectories.

211
Intervention Positive Behavior Scale(T) fitted OLS trajectories for Social Competence.
Intervention Positive Behavior Scale(T) fitted OLS trajectories for Autonomy.

212
Intervention Positive Behavior Scale(T) fitted OLS trajectories for Compliance.
Intervention Positive Behavior Scale(P) fitted OLS trajectories for Social Competence.
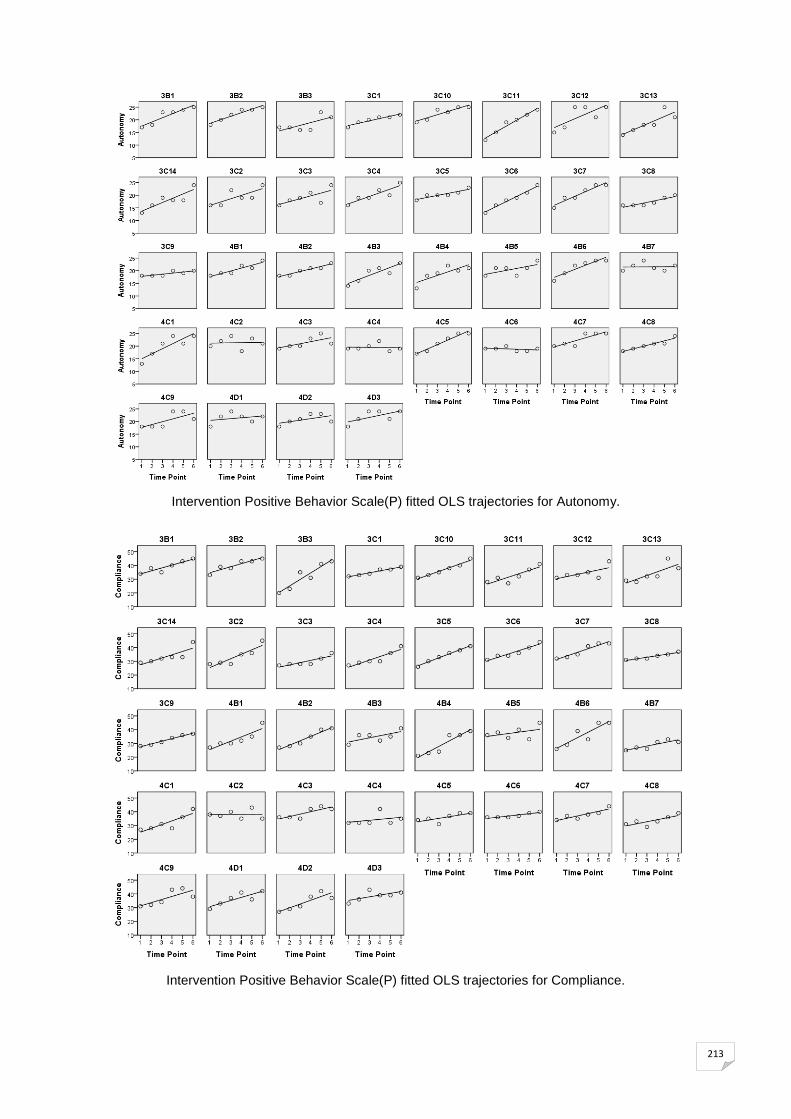
213
Intervention Positive Behavior Scale(P) fitted OLS trajectories for Autonomy.
Intervention Positive Behavior Scale(P) fitted OLS trajectories for Compliance.

Appendix K: OLS Regressions Table 22 Control results from exploratory OLS regression models for the PBS, SMI-C9, and S-ES measures.
PBS Initial Status
Rate of Change
SMI-C9 Initial Status
Rate of Change
SE-S Initial Status
Rate of Change
ID
Estimate
Error
Estimate
Error
R²
Residual Variance
Estimate
Error
Estimate
Error
R²
Residual Variance
Estimate
Error
Estimate
Error
R²
Residual Variance
5B1 11.87 0.68 -0.20 0.17 0.25 0.53 25.20 0.49 0.37 0.12 0.69 0.27 22.07 1.40 0.31 0.36 0.16 2.28 5B2 18.20 1.24 0.23 0.32 0.11 1.77 28.73 1.45 -0.26 0.37 0.11 2.42 22.33 1.59 0.43 0.41 0.22 2.90 5B3 18.00 1.99 0.57 0.51 0.24 4.57 31.47 1.52 -1.09 0.39 0.66 2.68 14.87 0.72 0.23 0.19 0.27 0.60 5B4 11.40 0.97 -0.26 0.25 0.21 1.09 22.20 3.76 0.37 0.96 0.04 16.27 18.80 0.42 0.20 0.11 0.47 0.20 5B5 15.07 1.29 0.74 0.33 0.56 1.92 20.67 2.15 1.00 0.55 0.45 5.33 19.13 1.77 -0.37 0.45 0.14 3.60 5B6 17.00 1.65 0.29 0.42 0.10 3.14 26.13 0.77 -0.09 0.20 0.05 0.68 21.67 1.94 0.01 0.50 0.00 4.33 5B7 15.07 0.82 -0.69 0.21 0.73 0.78 28.40 2.65 -0.26 0.68 0.03 8.09 21.00 0.93 0.01 0.24 0.00 1.00 5B8 21.33 1.51 -1.14 0.39 0.69 2.62 18.73 1.91 1.17 0.49 0.59 4.20 18.53 1.18 0.23 0.30 0.12 1.60 5B9 15.20 0.49 -0.63 0.12 0.86 0.27 23.73 3.08 -0.54 0.79 0.11 10.92 19.53 1.35 0.23 0.35 0.10 3.78 5C1 12.40 0.90 -0.69 0.23 0.69 0.94 30.13 2.43 -1.94 0.62 0.71 6.82 19.13 1.15 0.20 0.30 0.10 1.53 5C2 12.67 0.59 -0.43 0.15 0.67 0.40 28.53 1.70 -1.06 0.44 0.60 3.32 23.73 1.11 -0.54 0.28 0.48 1.42 5C3 19.20 2.34 -0.91 0.60 0.37 6.34 24.07 4.08 0.03 1.05 0.00 19.20 19.80 0.78 0.20 0.20 0.20 0.70 5C4 20.40 2.61 -0.83 0.67 0.28 7.87 22.47 3.06 0.06 0.79 0.00 10.82 18.33 2.16 0.57 0.56 0.21 5.40 5C5 22.40 1.17 -1.26 0.30 0.81 1.59 22.93 2.14 -0.89 0.55 0.39 5.28 19.80 1.26 -0.09 0.32 0.02 1.84 5C6 11.73 0.34 -0.40 0.09 0.84 0.13 26.33 0.98 -1.86 0.25 0.93 1.12 21.80 1.24 -0.37 0.32 0.25 1.77 5C7 12.20 0.85 0.09 0.22 0.04 0.84 22.33 2.30 0.14 0.59 0.01 6.12 15.53 1.07 0.66 0.27 0.59 1.32 5C8 21.00 1.99 -0.43 0.51 0.15 4.57 24.60 1.73 -0.31 0.44 0.11 3.44 20.67 0.73 -0.14 0.19 0.13 0.62 5C9 19.60 1.43 -0.03 0.37 0.02 2.37 27.07 0.60 -0.26 0.15 0.41 0.42 19.53 1.35 0.23 0.35 0.10 2.10 5D1 17.73 2.42 -0.11 0.62 0.01 6.78 23.53 2.47 0.80 0.63 0.28 7.03 17.67 1.59 0.57 0.41 0.33 2.90 5D2 14.33 0.59 -0.57 0.15 0.78 0.40 22.47 2.58 0.91 0.66 0.32 7.68 19.33 1.74 0.71 0.45 0.39 3.48 5D3 15.00 1.17 -0.57 0.30 0.48 1.57 19.73 2.33 0.89 0.60 0.35 6.28 19.47 1.35 -0.23 0.35 0.10 2.10 5D4 20.33 1.31 -0.29 0.34 0.15 1.98 22.80 3.09 0.06 0.79 0.00 10.99 19.13 1.26 0.06 0.32 0.01 1.82 5D5 17.73 1.22 0.03 0.31 0.02 1.70 22.53 1.35 0.37 0.35 0.22 2.10 19.20 1.40 0.37 0.36 0.21 2.27 5D6 14.87 0.30 -0.63 0.08 0.94 0.10 22.67 2.53 0.57 0.65 0.16 7.40 18.07 0.89 0.46 0.23 0.50 0.92 5D7 17.07 1.67 0.03 0.43 0.01 3.20 29.87 1.75 -1.20 0.45 0.64 3.53 16.93 1.29 0.54 0.33 0.40 1.92 5D8 20.73 0.89 -0.54 0.23 0.58 0.92 21.47 1.77 0.77 0.45 0.42 3.60 16.87 1.42 0.66 0.36 0.45 2.32 5D9 18.60 0.87 -0.17 0.22 0.13 0.87 23.27 1.91 -0.03 0.49 0.00 4.20 18.73 0.78 0.17 0.20 0.15 0.70 6A1 16.67 1.51 -0.86 0.39 0.55 2.62 19.40 0.83 -0.40 0.21 0.47 0.80 23.67 4.16 0.29 1.07 0.02 19.98 6A2 19.00 1.41 -0.14 0.36 0.04 2.29 18.73 0.89 0.46 0.23 0.50 0.92 19.33 1.95 0.57 0.50 0.24 4.40 6A3 17.60 0.57 -0.03 0.15 0.01 0.37 22.80 2.08 0.06 0.53 0.00 4.99 19.73 2.50 0.17 0.64 0.02 7.20 6A4 19.60 0.90 -0.31 0.23 0.31 0.94 18.27 1.05 1.11 0.27 0.81 1.28 20.80 3.16 1.06 0.81 0.30 11.49 6A5 12.73 0.49 -0.69 0.13 0.88 0.28 13.53 1.07 0.66 0.27 0.59 1.32 20.53 0.53 -0.06 0.14 0.04 0.32 6A6 17.07 0.78 -0.83 0.20 0.81 0.70 19.07 2.14 0.89 0.55 0.39 5.28 15.33 0.54 0.01 0.14 0.00 0.33 6A7 14.73 2.45 0.74 0.63 0.26 6.92 18.73 1.02 0.17 0.26 0.10 1.20 19.33 0.64 0.29 0.16 0.43 0.48 6A8 13.53 0.30 -0.77 0.08 0.96 0.10 18.20 1.24 0.23 0.32 0.11 1.77 21.27 1.40 -0.31 0.36 0.16 2.28 6A9 12.20 0.49 -0.63 0.12 0.86 0.27 16.93 1.79 0.97 0.46 0.53 3.70 18.53 1.01 0.51 0.26 0.50 1.18 6B1 16.87 0.77 -0.49 0.20 0.60 0.68 20.87 0.84 0.66 0.22 0.70 0.82 19.27 1.05 0.69 0.27 0.62 1.28 6B2 17.07 1.67 0.03 0.43 0.01 3.20 12.80 1.57 0.49 0.40 0.27 2.84 18.60 1.60 0.11 0.41 0.02 2.94 6B3 19.47 1.33 0.20 0.34 0.08 2.03 17.07 1.67 1.17 0.43 0.65 3.20 20.07 1.53 0.17 0.39 0.05 2.70 6B4 19.80 1.70 -0.09 0.44 0.01 3.34 20.53 3.46 -0.34 0.89 0.04 13.82 14.87 2.10 1.23 0.54 0.56 5.10 6B5 19.00 0.50 0.14 0.13 0.24 0.29 15.13 0.39 -0.09 0.10 0.15 0.18 25.47 3.46 -0.94 0.89 0.22 13.82 6B6 12.60 0.87 -0.17 0.22 0.13 0.87 15.33 1.77 0.86 0.45 0.47 3.62 13.53 1.01 1.09 0.26 0.81 1.18 6B7 21.60 1.34 -0.74 0.35 0.54 2.09 13.73 0.74 1.60 0.19 0.95 0.63 18.07 0.78 1.03 0.20 0.87 0.70 6B8 16.47 0.53 -0.66 0.14 0.86 0.32 23.33 1.84 -0.57 0.47 0.27 3.90 22.33 5.42 0.43 1.39 0.02 33.90 6B9 20.60 1.30 -0.89 0.33 0.64 1.94 15.13 0.77 -0.09 0.20 0.05 0.68 22.80 1.97 -0.66 0.51 0.30 4.49 6C1 12.93 1.22 -0.03 0.31 0.02 1.70 21.53 1.64 0.23 0.42 0.07 3.10 16.80 1.40 0.63 0.36 0.43 2.27 6C2 19.40 1.27 0.03 0.33 0.02 1.87 17.27 2.24 1.11 0.57 0.48 5.78 16.27 1.59 1.26 0.41 0.70 2.92 6C3
18.00 1.32 0.01 0.34 0.01 2.00 16.53 1.52 1.09 0.39 0.66 2.68 21.67 1.61 -0.29 0.41 0.11 2.98 6C4 13.60 0.57 -0.17 0.15 0.26 0.37 16.60 1.46 0.11 0.37 0.02 2.44 26.00 3.87 -0.86 0.99 0.16 17.29

Table 23 Control results from exploratory OLS regression models for the SEQ-C subscales.
Academic Initial Status
Rate of Change
Social Initial Status
Rate of Change
Emotional Initial Status
Rate of Change
ID
Estimate
Error
Estimate
Error
R²
Residual Variance
Estimate
Error
Estimate
Error
R²
Residual Variance
Estimate
Error
Estimate
Error
R²
Residual Variance
5B1 27.87 1.87 -1.20 0.48 0.61 4.03 29.20 3.18 -1.20 0.82 0.35 11.70 26.33 3.35 -0.71 0.86 0.15 12.98 5B2 16.33 1.89 1.86 0.49 0.79 4.12 17.13 1.78 1.91 0.46 0.81 3.68 14.87 2.04 2.66 0.52 0.87 4.82 5B3 24.33 3.94 0.43 1.01 0.04 17.90 23.87 5.21 0.94 1.34 0.11 31.32 25.60 3.73 0.26 0.96 0.02 16.09 5B4 23.13 3.25 -0.09 0.83 0.03 12.18 21.33 4.15 0.57 1.07 0.07 19.90 22.27 3.93 0.11 1.01 0.00 17.78 5B5 26.20 2.61 0.09 0.67 0.04 7.84 24.27 0.74 0.40 0.19 0.53 0.63 27.00 2.48 0.43 0.64 0.10 7.07 5B6 24.00 2.71 0.01 0.70 0.01 8.50 17.20 3.81 2.23 0.98 0.56 16.77 22.80 2.28 0.34 0.58 0.08 5.99 5B7 21.33 3.03 0.14 0.78 0.01 10.62 23.47 2.81 -0.37 0.72 0.06 9.10 23.87 2.76 -0.34 0.71 0.06 8.82 5B8 28.87 2.25 -1.06 0.58 0.46 5.82 30.80 2.68 -1.23 0.69 0.44 8.27 22.27 1.89 0.40 0.49 0.14 4.13 5B9 21.40 1.96 0.31 0.50 0.09 4.44 24.07 2.84 -0.11 0.73 0.01 9.28 22.07 2.14 0.31 0.55 0.08 5.28 5C1 26.80 1.57 -1.09 0.40 0.64 2.84 28.47 2.15 -1.66 0.55 0.69 5.32 30.53 2.29 -2.20 0.59 0.78 6.03 5C2 23.47 1.98 -0.80 0.51 0.38 4.53 22.00 2.01 -0.29 0.52 0.07 4.64 24.73 3.57 -0.83 0.92 0.17 14.70 5C3 20.27 2.50 -0.03 0.64 0.05 7.20 21.27 2.03 -0.31 0.52 0.08 4.78 21.33 2.73 -0.14 0.70 0.01 8.62 5C4 15.27 1.93 1.69 0.49 0.74 4.28 14.80 2.18 2.06 0.56 0.77 5.49 16.53 3.57 1.51 0.92 0.41 14.68 5C5 18.40 3.62 -0.54 0.93 0.08 15.09 20.73 0.60 -0.26 0.15 0.41 0.42 19.47 0.53 0.06 0.14 0.04 0.32 5C6 25.40 3.20 -1.40 0.82 0.42 11.80 25.47 3.33 -0.66 0.86 0.13 12.82 24.00 2.88 -0.57 0.74 0.13 9.57 5C7 23.73 2.31 -0.40 0.59 0.10 6.13 24.40 2.78 -0.69 0.71 0.19 8.94 23.73 3.08 -0.54 0.79 0.11 10.92 5C8 18.27 2.62 1.26 0.67 0.47 7.92 15.00 2.28 2.00 0.59 0.74 6.00 18.80 1.68 0.63 0.43 0.35 3.27 5C9 30.67 0.64 -0.71 0.16 0.82 0.48 29.20 1.81 -0.63 0.46 0.31 3.77 32.00 1.74 -1.00 0.45 0.56 3.50 5D1 28.20 1.38 -0.20 0.35 0.07 2.20 33.53 2.41 -0.91 0.62 0.35 6.68 30.20 4.09 -0.49 1.05 0.05 19.34 5D2 26.33 3.82 1.00 0.98 0.21 16.83 20.20 4.34 2.37 1.12 0.53 21.77 23.53 2.43 0.66 0.62 0.22 6.82 5D3 23.67 2.21 0.14 0.57 0.02 5.62 26.93 4.09 -0.31 1.05 0.02 19.28 28.07 2.32 -0.83 0.60 0.33 6.20 5D4 24.93 2.65 -0.60 0.68 0.16 8.13 26.93 3.51 -1.03 0.90 0.25 14.20 23.93 2.62 -0.46 0.67 0.10 7.92 5D5 17.33 2.00 1.14 0.51 0.55 4.62 18.27 1.38 0.97 0.35 0.65 2.20 19.20 2.34 0.51 0.60 0.15 6.34 5D6 23.47 1.07 0.06 0.27 0.01 1.32 25.13 1.75 0.20 0.45 0.05 3.53 23.73 1.69 0.31 0.43 0.12 3.28 5D7 26.33 0.98 -0.86 0.25 0.74 1.12 27.80 2.05 -1.09 0.53 0.52 4.84 26.73 2.33 -1.11 0.60 0.46 6.28 5D8 19.53 2.34 0.66 0.60 0.23 6.32 17.20 3.06 1.23 0.78 0.38 10.77 21.33 2.53 0.43 0.65 0.10 7.40 5D9 25.20 1.13 -0.34 0.29 0.26 1.49 26.40 1.88 -0.26 0.48 0.07 4.09 26.93 1.81 -0.31 0.46 0.10 3.78 6A1 15.93 1.24 0.11 0.32 0.03 1.78 17.47 1.26 0.06 0.32 0.01 1.82 13.20 0.65 0.66 0.17 0.80 0.49 6A2 21.07 1.29 0.46 0.33 0.32 1.92 20.73 1.40 0.89 0.36 0.60 2.28 21.00 1.99 0.57 0.51 0.24 4.57 6A3 23.33 1.18 0.14 0.30 0.05 1.62 21.80 0.82 0.77 0.21 0.77 0.77 23.07 1.02 0.17 0.26 0.10 1.20 6A4 23.00 2.39 -0.57 0.61 0.18 6.57 22.20 2.91 -0.63 0.75 0.15 9.77 20.93 2.68 -0.31 0.69 0.05 8.28 6A5 16.67 1.18 -0.14 0.30 0.05 1.62 15.33 1.59 0.43 0.41 0.22 2.90 15.60 2.07 0.69 0.53 0.29 4.94 6A6 23.27 2.14 -0.31 0.55 0.08 5.28 18.33 3.68 1.14 0.94 0.27 15.62 19.53 3.46 0.66 0.89 0.12 13.82 6A7 16.93 1.81 1.11 0.46 0.59 3.78 13.87 2.43 1.94 0.62 0.71 6.82 15.73 1.45 1.46 0.37 0.79 2.42 6A8 18.07 1.11 -0.54 0.28 0.48 1.42 16.73 1.96 -0.54 0.50 0.23 4.42 17.60 1.69 -0.60 0.43 0.32 3.30 6A9 13.87 3.58 2.66 0.92 0.68 14.82 15.67 1.18 1.86 0.30 0.90 1.62 18.07 1.22 1.03 0.31 0.73 1.70 6B1 22.27 1.81 -0.31 0.46 0.10 3.78 20.40 2.36 0.31 0.61 0.06 6.44 17.40 2.48 0.74 0.64 0.25 7.09 6B2 16.40 0.83 0.60 0.21 0.66 0.80 15.27 0.78 0.83 0.20 0.81 0.70 18.60 0.87 -0.03 0.22 0.00 0.87 6B3 20.20 2.05 0.09 0.53 0.01 4.84 19.53 3.50 0.23 0.90 0.02 14.10 25.20 1.42 -0.91 0.37 0.61 2.34 6B4 18.47 2.12 1.49 0.54 0.65 5.18 19.60 1.46 1.11 0.37 0.69 2.44 18.47 1.70 1.34 0.44 0.70 3.32 6B5 13.87 1.78 0.51 0.46 0.24 3.68 9.13 2.10 1.77 0.54 0.73 5.10 13.87 0.68 0.80 0.17 0.84 0.53 6B6 19.00 2.60 -0.14 0.67 0.01 7.79 11.33 1.44 1.43 0.37 0.79 2.40 17.27 0.82 0.11 0.21 0.07 0.78 6B7 17.47 0.39 1.49 0.10 0.98 0.18 18.00 1.49 1.57 0.38 0.81 2.57 16.87 1.15 1.80 0.30 0.90 1.53 6B8 20.27 2.36 0.26 0.61 0.04 6.42 16.07 2.51 1.31 0.64 0.51 7.28 20.67 2.37 0.29 0.61 0.05 6.48 6B9 17.47 1.52 -0.09 0.39 0.01 2.68 13.80 1.40 0.63 0.36 0.43 2.27 15.13 1.35 0.77 0.35 0.55 2.10 6C1 19.53 1.01 0.09 0.26 0.03 1.18 20.27 0.42 -0.17 0.11 0.39 0.20 20.00 0.93 0.02 0.24 0.00 1.00 6C2 16.93 1.67 0.83 0.43 0.48 3.20 17.87 2.09 0.80 0.54 0.36 5.03 18.47 2.30 0.77 0.59 0.30 6.10 6C3
21.67 1.42 0.01 0.37 0.01 2.33 19.93 2.17 0.26 0.56 0.05 5.42 19.53 2.00 0.23 0.51 0.05 4.60 6C4 18.67 2.08 0.29 0.53 0.07 4.98 17.53 3.03 0.37 0.78 0.05 10.60 15.73 3.11 0.60 0.80 0.12 11.13

Table 24 Control results from exploratory OLS regression models for the PBS (T) subscales.
Social Competence Initial Status
Rate of Change
Autonomy Initial Status
Rate of Change
Compliance Initial Status
Rate of Change
ID
Estimate
Error
Estimate
Error
R²
Residual Variance
Estimate
Error
Estimate
Error
R²
Residual Variance
Estimate
Error
Estimate
Error
R²
Residual Variance
5B1 36.07 2.82 0.17 0.73 0.01 9.20 18.20 2.18 -0.34 0.56 0.09 5.49 23.67 2.26 0.57 0.58 0.19 5.90 5B2 34.87 3.57 0.51 0.92 0.07 14.68 19.40 1.41 -0.40 0.36 0.23 2.30 26.07 2.84 1.31 0.73 0.45 9.28 5B3 37.67 3.03 -0.86 0.78 0.23 10.62 14.73 0.34 -0.40 0.09 0.84 0.13 37.00 2.66 -2.29 0.68 0.74 8.14 5B4 32.73 2.14 0.31 0.55 0.08 5.28 19.33 2.37 -0.29 0.61 0.05 6.48 23.87 2.12 0.51 0.54 0.18 5.18 5B5 40.67 7.93 -1.86 2.04 0.17 72.62 17.93 0.34 -0.60 0.09 0.92 0.13 32.80 2.03 -1.23 0.52 0.58 4.77 5B6 35.07 3.28 0.74 0.84 0.16 12.42 14.53 2.48 0.37 0.64 0.08 7.10 30.73 2.82 -0.83 0.73 0.25 9.20 5B7 36.60 4.38 0.54 1.12 0.06 22.09 17.87 1.07 -0.34 0.27 0.28 1.32 24.13 1.37 1.49 0.35 0.82 2.18 5B8 40.27 4.96 -1.74 1.27 0.32 28.42 18.87 2.01 -0.49 0.52 0.18 4.68 36.27 4.24 -1.89 1.09 0.43 20.78 5B9 37.87 8.14 -1.20 2.09 0.08 76.53 14.47 1.50 -0.23 0.39 0.08 2.60 21.53 4.02 1.23 1.03 0.26 18.60 5C1 33.67 0.32 0.14 0.08 0.43 0.12 17.67 1.77 -0.14 0.45 0.02 3.62 28.60 2.35 -0.03 0.60 0.00 6.37 5C2 36.67 6.64 1.43 1.71 0.15 50.90 13.00 2.66 1.29 0.68 0.47 8.14 27.80 4.16 0.34 1.07 0.03 19.99 5C3 32.93 1.91 -0.03 0.49 0.00 4.20 20.73 1.40 -1.11 0.36 0.70 2.28 35.27 3.04 -2.60 0.78 0.74 10.63 5C4 36.07 5.24 0.03 1.35 0.00 31.70 17.53 2.92 -0.06 0.75 0.00 9.82 23.67 1.44 1.57 0.37 0.82 2.40 5C5 31.60 1.30 0.11 0.33 0.03 1.94 15.00 2.43 0.14 0.62 0.01 6.79 24.80 3.84 -0.66 0.99 0.10 16.99 5C6 42.27 3.76 -1.31 0.96 0.32 16.28 14.27 2.82 0.83 0.73 0.25 9.20 30.47 5.17 0.06 1.33 0.00 30.82 5C7 25.00 4.89 1.43 1.26 0.24 27.57 8.80 2.33 1.77 0.60 0.69 6.27 16.60 3.03 2.26 0.78 0.68 10.59 5C8 23.73 5.45 3.31 1.40 0.58 34.28 16.67 3.01 -0.29 0.77 0.03 10.48 25.67 4.21 -0.29 1.08 0.02 20.48 5C9 31.13 2.56 0.20 0.66 0.02 7.53 19.47 2.38 -0.80 0.61 0.30 6.53 26.27 3.97 -0.17 1.02 0.01 18.20 5D1 31.00 3.52 1.14 0.90 0.29 14.29 19.33 3.34 0.57 0.86 0.33 2.90 30.40 4.59 -0.40 1.18 0.03 24.30 5D2 37.80 3.72 1.34 0.96 0.33 15.99 19.33 3.34 0.57 0.86 0.10 12.90 26.00 4.42 2.57 1.14 0.56 22.57 5D3 33.87 4.47 2.80 1.15 0.60 23.03 17.47 1.66 0.49 0.43 0.25 3.18 24.00 1.88 2.43 0.48 0.86 4.07 5D4 37.73 4.03 -1.69 1.04 0.40 18.78 17.80 2.33 -0.23 0.60 0.04 6.27 29.80 4.88 -0.94 1.25 0.12 27.49 5D5 31.33 4.87 0.57 1.25 0.05 27.40 18.67 2.71 -0.71 0.70 0.21 8.48 26.80 1.57 -0.51 0.40 0.29 2.84 5D6 34.00 3.93 1.86 1.01 0.46 17.79 18.13 1.48 0.20 0.38 0.06 2.53 26.93 2.49 1.40 0.64 0.55 7.13 5D7 38.40 3.71 1.17 0.95 0.27 15.87 18.53 0.84 -0.06 0.22 0.02 0.82 24.87 4.28 2.37 1.10 0.54 21.10 5D8 33.53 5.11 2.09 1.31 0.39 30.18 20.73 2.70 -0.26 0.69 0.03 8.42 30.27 4.31 0.54 1.11 0.06 21.42 5D9 28.20 3.57 2.80 0.92 0.70 14.70 20.20 2.08 -0.34 0.53 0.09 4.99 27.40 3.34 2.17 0.86 0.62 12.87 6A1 26.60 2.69 1.97 0.69 0.67 8.37 12.67 1.46 0.71 0.38 0.47 2.48 23.40 4.20 1.17 1.08 0.23 20.37 6A2 35.00 1.00 0.29 0.26 0.24 1.14 15.00 1.65 0.29 0.42 0.10 3.14 24.53 1.48 0.80 0.38 0.53 2.53 6A3 35.33 3.54 2.29 0.91 0.61 14.48 14.07 1.96 1.46 0.50 0.68 4.42 30.60 0.97 -0.74 0.25 0.69 1.09 6A4 34.60 1.85 1.11 0.47 0.58 3.94 13.67 2.00 1.14 0.51 0.55 4.62 30.60 1.46 1.11 0.37 0.69 2.44 6A5 21.67 1.31 0.71 0.34 0.53 1.98 16.07 0.34 -0.40 0.09 0.84 0.13 26.27 1.69 0.11 0.43 0.02 3.28 6A6 22.93 0.78 0.83 0.20 0.81 0.70 19.33 0.32 0.14 0.08 0.43 0.12 37.53 1.56 -0.34 0.40 0.15 2.82 6A7 27.40 0.87 1.03 0.22 0.84 0.87 13.47 0.72 0.77 0.19 0.81 0.60 26.40 0.27 0.46 0.07 0.91 0.09 6A8 25.47 2.74 1.49 0.70 0.53 8.68 15.33 0.54 0.01 0.14 0.00 0.33 26.47 0.68 0.20 0.17 0.25 0.53 6A9 34.13 4.40 0.34 1.13 0.02 22.32 20.33 0.32 -0.14 0.08 0.43 0.12 30.07 1.53 0.17 0.39 0.05 2.70 6B1 26.00 0.70 0.57 0.18 0.71 0.57 11.20 0.55 0.51 0.14 0.77 0.34 26.07 2.31 1.60 0.59 0.65 6.13 6B2 25.00 2.10 0.57 0.54 0.22 5.07 16.20 1.26 0.09 0.32 0.02 1.84 26.07 1.93 -0.11 0.49 0.01 4.28 6B3 30.40 3.37 2.46 0.86 0.67 13.09 16.27 1.22 0.97 0.31 0.71 1.70 24.53 4.22 2.80 1.08 0.63 20.53 6B4 25.20 2.68 1.23 0.69 0.44 8.27 11.33 1.51 0.86 0.39 0.55 2.62 21.67 1.77 0.86 0.45 0.47 3.62 6B5 44.47 3.46 0.06 0.89 0.00 13.82 15.07 0.42 0.17 0.11 0.39 0.20 23.33 1.18 0.86 0.30 0.67 1.62 6B6 33.53 2.00 0.23 0.51 0.05 4.60 15.07 0.78 0.03 0.20 0.01 0.70 27.67 1.31 -0.29 0.34 0.15 1.98 6B7 33.73 3.89 1.74 1.00 0.43 17.42 19.67 0.54 0.01 0.14 0.00 0.33 28.93 2.96 1.40 0.76 0.46 10.13 6B8 38.67 2.79 0.71 0.72 0.20 8.98 19.00 0.83 0.14 0.21 0.10 0.79 30.07 2.98 0.89 0.77 0.25 10.28 6B9 37.80 4.34 -0.23 1.12 0.01 21.77 17.00 1.14 0.02 0.29 0.00 1.50 36.87 2.39 -1.77 0.61 0.68 6.60 6C1 50.60 6.20 -2.17 1.59 0.32 44.37 21.00 2.31 -0.71 0.59 0.27 6.14 32.13 4.11 -0.80 1.06 0.13 19.53 6C2 35.13 2.12 0.49 0.54 0.17 5.18 13.67 1.28 0.43 0.33 0.30 1.90 35.00 1.34 -0.57 0.34 0.41 2.07 6C3
42.93 3.70 -0.31 0.95 0.03 15.78 16.60 1.64 0.54 0.42 0.29 3.09 25.87 1.90 0.09 0.49 0.01 4.18 6C4 28.80 0.55 -0.09 0.14 0.09 0.34 14.53 0.30 0.23 0.08 0.69 0.10 28.67 0.73 -0.14 0.19 0.13 0.62

Table 25 Control results from exploratory OLS regression models for the PBS (P) subscales.
Social
Competence Initial Status
Rate of Change
Autonomy Initial Status
Rate of Change
Compliance Initial Status
Rate of Change
ID
Estimate
Error
Estimate
Error
R²
Residual Variance
Estimate
Error
Estimate
Error
R²
Residual Variance
Estimate
Error
Estimate
Error
R²
Residual Variance
5B1 39.87 3.62 -0.77 0.93 0.15 15.10 19.80 2.18 -0.94 0.56 0.41 5.49 25.80 1.86 0.34 0.48 0.11 3.99 5B2 37.93 1.67 -0.03 0.43 0.00 3.20 18.20 1.67 -0.20 0.43 0.05 3.20 29.80 2.69 -0.09 0.69 0.00 8.34 5B3 37.80 1.26 -0.09 0.32 0.02 1.84 11.13 0.77 -0.09 0.20 0.05 0.68 26.47 0.53 0.06 0.14 0.04 0.32 5B4 32.93 3.54 0.26 0.91 0.02 14.42 17.93 2.22 -0.03 0.57 0.00 5.70 23.47 4.87 1.06 1.25 0.15 27.32 5B5 40.20 2.05 -2.49 0.53 0.85 4.84 19.47 0.72 -1.23 0.19 0.92 0.60 32.73 2.00 -1.40 0.51 0.65 4.63 5B6 34.00 2.14 1.14 0.55 0.52 5.29 17.20 3.78 -0.06 0.97 0.00 16.49 30.93 2.74 -0.60 0.70 0.15 8.63 5B7 38.33 6.15 0.86 1.58 0.07 43.62 18.00 0.83 0.14 0.21 0.10 0.79 26.60 5.42 2.11 1.39 0.37 33.94 5B8 41.40 8.78 -1.83 2.25 0.14 88.87 15.33 1.13 0.29 0.29 0.19 1.48 29.00 6.60 -0.14 1.70 0.00 50.29 5B9 39.00 3.78 -3.00 0.97 0.70 16.50 11.47 1.26 0.06 0.32 0.01 1.82 36.00 5.06 -3.00 1.30 0.57 29.50 5C1 30.80 2.71 3.06 0.70 0.83 8.49 19.87 0.30 0.23 0.08 0.69 0.10 26.53 3.43 2.23 0.88 0.61 13.60 5C2 37.07 3.26 -0.11 0.84 0.00 12.28 12.20 1.70 1.09 0.44 0.61 3.34 27.00 2.29 0.43 0.59 0.12 6.07 5C3 42.33 7.84 -1.00 2.01 0.06 70.83 18.53 1.50 -0.77 0.39 0.50 2.60 34.20 5.52 -1.20 1.42 0.15 35.20 5C4 33.00 4.80 1.57 1.23 0.29 26.57 19.27 0.89 -0.46 0.23 0.50 0.92 27.87 3.10 1.37 0.80 0.43 11.10 5C5 36.13 5.68 -0.09 1.46 0.00 37.18 11.53 2.10 0.37 0.54 0.11 5.10 27.27 3.80 -1.03 0.98 0.22 16.70 5C6 42.40 2.30 -1.54 0.59 0.63 6.09 16.47 1.82 0.34 0.47 0.12 3.82 30.07 1.29 -0.26 0.33 0.13 1.92 5C7 28.67 5.82 0.86 1.50 0.08 39.12 11.00 0.75 0.71 0.19 0.78 0.64 20.07 4.87 1.46 1.25 0.25 27.42 5C8 31.87 4.02 1.09 1.03 0.22 18.68 14.87 1.21 0.51 0.31 0.41 1.68 27.53 2.57 0.37 0.66 0.07 7.60 5C9 40.53 2.58 0.51 0.66 0.13 7.68 16.60 1.09 -0.17 0.28 0.09 1.37 30.60 4.26 0.69 1.09 0.09 20.94 5D1 36.00 1.99 0.57 0.51 0.24 4.57 16.87 1.78 0.51 0.46 0.24 3.68 28.13 2.10 0.63 0.54 0.25 5.10 5D2 40.93 4.49 0.69 1.15 0.08 23.28 16.20 2.46 0.94 0.63 0.36 6.99 27.93 3.62 1.40 0.93 0.36 15.13 5D3 40.73 2.68 0.89 0.69 0.29 8.28 12.07 1.84 1.46 0.47 0.70 3.92 24.40 5.11 2.46 1.31 0.47 30.09 5D4 49.27 2.84 -2.89 0.73 0.80 9.28 15.13 2.60 0.06 0.67 0.00 7.82 34.20 6.64 -1.49 1.70 0.16 50.84 5D5 17.07 3.96 3.60 1.02 0.76 18.13 18.67 2.26 -0.57 0.58 0.19 5.90 22.67 3.01 0.71 0.77 0.18 10.48 5D6 39.40 5.01 -0.11 1.29 0.00 28.94 17.27 2.14 0.11 0.55 0.01 5.28 29.40 4.07 0.46 1.04 0.05 19.09 5D7 46.33 6.61 -1.71 1.70 0.20 50.48 20.13 2.34 -0.66 0.60 0.23 6.32 31.93 4.53 0.83 1.16 0.11 23.70 5D8 39.73 8.05 0.03 2.07 0.00 74.70 21.27 2.78 -0.46 0.71 0.09 8.92 32.27 7.40 -0.03 1.90 0.00 63.20 5D9 38.33 9.24 -0.29 2.37 0.00 98.48 21.87 3.86 -0.91 0.99 0.18 17.18 28.87 5.70 0.80 1.46 0.07 37.53 6A1 30.20 2.85 1.51 0.73 0.52 9.34 13.87 1.52 0.51 0.39 0.30 2.68 25.33 3.29 0.71 0.84 0.15 12.48 6A2 27.20 3.66 1.94 0.94 0.52 15.49 15.07 0.60 0.46 0.15 0.69 0.42 25.60 0.97 0.54 0.25 0.54 1.09 6A3 37.80 1.86 -0.94 0.48 0.49 3.99 16.00 0.83 -0.14 0.21 0.10 0.79 31.00 1.93 -0.86 0.49 0.43 4.29 6A4 33.33 0.32 -0.14 0.08 0.43 0.12 14.27 0.34 0.40 0.09 0.84 0.13 23.27 1.72 2.54 0.44 0.89 3.42 6A5 31.47 0.30 -0.23 0.08 0.69 0.10 10.33 0.32 0.14 0.08 0.43 0.12 22.67 0.64 0.29 0.16 0.43 0.48 6A6 32.33 0.32 0.14 0.08 0.43 0.12 14.53 0.30 0.23 0.08 0.69 0.10 29.47 1.77 -1.23 0.45 0.65 3.60 6A7 27.93 3.83 2.26 0.98 0.57 16.92 13.87 0.77 0.51 0.20 0.63 0.68 16.60 1.64 1.54 0.42 0.77 3.09 6A8 25.27 0.78 0.97 0.20 0.85 0.70 10.33 0.54 0.01 0.14 0.00 0.33 22.60 1.30 0.69 0.33 0.51 1.94 6A9 36.87 2.30 1.37 0.59 0.57 6.10 14.33 3.01 0.29 0.77 0.03 10.48 20.00 6.54 2.14 1.68 0.29 49.29 6B1 26.33 0.85 1.00 0.22 0.84 0.83 10.53 1.37 0.51 0.35 0.35 2.18 20.40 0.57 1.17 0.15 0.94 0.37 6B2 23.93 1.02 -0.03 0.26 0.00 1.20 14.67 0.64 0.29 0.16 0.43 0.48 25.80 1.24 -0.23 0.32 0.11 1.77 6B3 31.20 2.60 2.23 0.67 0.74 7.77 17.07 0.60 0.46 0.15 0.69 0.42 26.00 1.06 1.14 0.27 0.82 1.29 6B4 30.33 0.59 0.43 0.15 0.67 0.40 12.13 0.30 -0.23 0.08 0.69 0.10 16.13 0.68 1.20 0.17 0.92 0.53 6B5 29.33 1.70 1.00 0.44 0.57 3.33 11.27 0.60 0.54 0.15 0.75 0.42 20.27 1.22 0.83 0.31 0.64 1.70 6B6 23.13 2.90 2.91 0.74 0.79 9.68 11.53 1.50 1.23 0.39 0.72 2.60 18.93 1.40 2.11 0.36 0.90 2.28 6B7 29.53 0.30 0.23 0.08 0.69 0.10 12.33 0.32 0.14 0.08 0.43 0.12 21.47 0.39 -0.09 0.10 0.15 0.18 6B8 33.27 3.69 1.97 0.95 0.52 15.70 17.27 1.96 0.26 0.50 0.06 4.42 27.27 2.54 1.54 0.65 0.58 7.42 6B9 36.33 4.02 0.14 1.03 0.00 18.62 20.13 1.64 -0.23 0.42 0.07 3.10 31.73 1.40 -0.69 0.36 0.47 2.28 6C1 39.20 2.87 -1.34 0.74 0.45 9.49 18.87 1.18 -0.77 0.30 0.62 1.60 28.07 1.29 -0.26 0.33 0.13 1.92 6C2 39.40 0.57 0.17 0.15 0.26 0.37 14.67 0.32 0.14 0.08 0.43 0.12 24.87 1.15 0.80 0.30 0.65 1.53 6C3
42.20 2.42 0.37 0.62 0.08 6.77 11.60 0.57 0.97 0.15 0.92 0.37 28.93 2.75 -0.03 0.71 0.00 8.70 6C4 30.73 4.09 1.31 1.05 0.28 19.28 13.60 0.87 0.83 0.22 0.78 0.87 24.33 2.08 1.29 0.53 0.59 4.98

Table 26 Intervention results from exploratory OLS regression models for PBS, SMI-C9, and S-ES measures.
PBS Initial Status
Rate of Change
SMI-C9 Initial Status
Rate of Change
SE-S Initial Status
Rate of Change
ID
Estimate
Error
Estimate
Error
R²
Residual Variance
Estimate
Error
Estimate
Error
R²
Residual Variance
Estimate
Error
Estimate
Error
R²
Residual Variance
3B1 11.67 0.64 1.71 0.16 0.96 0.48 12.47 1.52 2.49 0.39 0.91 2.68 12.40 0.90 0.31 0.23 0.31 0.94 3B2 10.20 1.40 2.37 0.36 0.92 2.27 15.33 1.70 3.00 0.44 0.92 3.33 10.87 0.95 1.80 0.24 0.93 1.03 3B3 9.73 1.45 2.46 0.37 0.92 2.42 16.40 1.64 2.46 0.42 0.90 3.09 8.00 1.36 2.71 0.35 0.94 2.14 3C1 11.53 0.30 1.23 0.08 0.98 0.10 17.00 1.49 2.57 0.38 0.92 2.57 9.60 1.17 1.26 0.30 0.81 1.59 3C10 10.73 1.22 2.17 0.31 0.92 1.70 19.13 2.39 1.77 0.61 0.68 6.60 11.20 1.68 2.37 0.43 0.88 3.27 3C11 10.47 2.19 2.20 0.56 0.79 5.53 17.47 1.33 2.20 0.34 0.91 2.03 16.80 0.49 1.63 0.12 0.98 0.27 3C12 9.60 0.90 2.11 0.23 0.95 0.94 17.93 1.59 2.26 0.41 0.88 2.92 11.13 1.37 2.49 0.35 0.93 2.18 3C13 14.87 1.52 1.51 0.39 0.79 2.68 11.67 2.81 2.86 0.72 0.80 9.12 11.93 1.96 2.26 0.50 0.83 4.42 3C14 10.80 1.31 2.34 0.34 0.92 1.99 18.00 0.96 2.43 0.25 0.96 1.07 9.60 1.85 2.11 0.47 0.83 3.94 3C2 14.60 1.30 1.11 0.33 0.74 1.94 21.93 1.02 1.83 0.26 0.92 1.20 8.13 1.35 2.77 0.35 0.94 2.10 3C3 10.13 0.98 1.63 0.25 0.91 1.10 14.73 2.02 3.17 0.52 0.90 4.70 9.07 1.29 2.74 0.33 0.94 1.92 3C4 13.07 0.89 1.46 0.23 0.91 0.92 18.47 0.98 1.77 0.25 0.93 1.10 7.60 2.16 2.83 0.55 0.87 5.37 3C5 17.33 1.28 1.57 0.33 0.85 1.90 14.33 2.00 2.86 0.51 0.89 4.62 8.33 1.07 3.00 0.28 0.97 1.33 3C6 10.07 1.53 2.03 0.39 0.87 2.70 17.67 2.15 2.00 0.55 0.77 5.33 8.53 1.52 3.09 0.39 0.94 2.68 3C7 12.20 1.68 2.23 0.43 0.87 3.27 17.60 1.60 2.69 0.41 0.91 2.94 12.13 0.84 2.06 0.22 0.96 0.82 3C8 10.80 1.08 2.91 0.28 0.97 1.34 14.40 1.34 2.74 0.35 0.94 2.09 8.33 1.64 3.14 0.42 0.93 3.12 3C9 10.27 1.69 1.69 0.43 0.79 3.28 22.27 1.51 1.40 0.39 0.77 2.63 12.93 1.05 2.11 0.27 0.94 1.28 4B1 10.27 0.74 1.40 0.19 0.93 0.63 20.00 1.78 2.29 0.46 0.86 3.64 7.53 1.56 2.94 0.40 0.93 2.82 4B2 11.20 0.55 2.51 0.14 0.99 0.34 15.47 1.15 3.20 0.30 0.97 1.53 10.93 0.60 2.54 0.15 0.99 0.42 4B3 10.27 1.19 2.40 0.31 0.94 1.63 16.40 1.17 3.46 0.30 0.97 1.59 14.07 2.33 0.31 0.60 0.06 6.28 4B4 9.33 1.36 2.14 0.35 0.90 2.12 15.13 1.15 2.20 0.30 0.93 1.53 10.87 1.52 2.09 0.39 0.88 2.68 4B5 11.33 0.64 1.29 0.16 0.94 0.48 15.47 1.21 2.49 0.31 0.94 1.68 4.40 1.88 2.74 0.48 0.89 4.09 4B6 17.87 1.56 0.94 0.40 0.58 2.82 13.60 0.97 3.26 0.25 0.98 1.09 9.53 1.48 2.80 0.38 0.93 2.53 4B7 20.73 1.59 -0.54 0.41 0.31 2.92 21.33 1.28 1.57 0.33 0.85 1.90 9.00 1.00 2.71 0.26 0.97 1.14 4C1 11.47 0.68 2.20 0.17 0.98 0.53 20.60 1.60 2.11 0.41 0.87 2.94 5.33 1.31 2.71 0.34 0.94 1.98 4C2 7.93 1.24 2.69 0.32 0.95 1.78 21.20 1.82 2.09 0.47 0.83 3.84 13.20 1.05 2.23 0.27 0.94 1.27 4C3 11.00 1.00 1.71 0.26 0.92 1.14 22.53 0.53 1.66 0.14 0.97 0.32 6.07 1.45 2.46 0.37 0.92 2.42 4C4 8.87 0.77 1.51 0.20 0.94 0.68 22.33 1.44 1.57 0.37 0.82 2.40 12.60 1.83 1.83 0.47 0.79 3.87 4C5 14.47 1.70 1.06 0.44 0.60 3.32 13.60 2.27 3.11 0.58 0.88 5.94 10.20 1.26 1.09 0.32 0.74 1.84 4C6 20.20 0.65 0.94 0.17 0.89 0.49 20.47 0.84 2.06 0.22 0.96 0.82 11.53 2.22 1.51 0.57 0.64 5.68 4C7 8.53 0.68 1.80 0.17 0.96 0.53 9.53 1.66 3.51 0.43 0.94 3.18 7.40 1.50 1.46 0.38 0.78 2.59 4C8 12.60 0.90 1.11 0.23 0.85 0.94 21.53 1.35 0.23 0.35 0.10 2.10 9.67 0.89 1.57 0.23 0.92 0.90 4C9 8.60 0.87 1.83 0.22 0.94 0.87 20.60 0.90 1.69 0.23 0.93 0.94 10.40 1.06 0.60 0.27 0.55 1.30 4D1 12.93 0.42 0.97 0.11 0.95 0.20 12.93 1.22 2.97 0.31 0.96 1.70 9.27 1.79 1.97 0.46 0.82 3.70 4D2 11.93 0.60 1.54 0.15 0.96 0.42 22.60 0.83 1.40 0.21 0.91 0.80 17.27 0.34 1.40 0.09 0.98 0.13 4D3 10.67 0.89 2.57 0.23 0.97 0.90 18.53 2.29 2.80 0.59 0.85 6.03 14.27 2.58 0.97 0.66 0.35 7.70

Table 27 Intervention results from exploratory OLS regression models for the SEQ-C subscales.
Academic Initial Status
Rate of Change
Social Initial Status
Rate of Change
Emotional Initial Status
Rate of Change
ID
Estimate
Error
Estimate
Error
R²
Residual Variance
Estimate
Error
Estimate
Error
R²
Residual Variance
Estimate
Error
Estimate
Error
R²
Residual Variance
3B1 22.67 2.46 0.71 0.63 0.24 6.98 20.33 1.86 2.29 0.48 0.85 3.98 21.53 3.33 1.66 0.86 0.48 12.82 3B2 21.53 0.84 2.66 0.22 0.97 0.82 16.53 0.98 3.37 0.25 0.98 1.10 18.93 1.53 2.83 0.39 0.93 2.70 3B3 18.60 2.30 2.26 0.59 0.79 6.09 16.53 1.18 3.23 0.30 0.97 1.60 15.73 1.72 3.46 0.44 0.94 3.42 3C1 18.40 0.97 2.46 0.25 0.96 1.09 20.20 1.40 2.37 0.36 0.92 2.27 16.60 1.43 2.97 0.37 0.94 2.37 3C1
15.27 1.29 2.54 0.33 0.94 1.92 16.73 0.78 2.03 0.20 0.96 0.70 18.00 1.14 2.00 0.29 0.92 1.50
3C1
14.27 1.24 2.69 0.32 0.95 1.78 15.47 1.62 2.20 0.42 0.87 3.03 13.40 1.50 2.74 0.38 0.93 2.59 3C1
15.73 1.38 3.17 0.35 0.95 2.20 16.40 2.07 3.89 0.53 0.93 4.94 16.07 1.40 3.31 0.36 0.95 2.28
3C1
11.73 1.67 3.03 0.43 0.93 3.20 14.53 1.93 2.66 0.50 0.88 4.32 12.67 2.21 2.86 0.57 0.86 5.62 3C1
15.40 1.71 3.03 0.44 0.92 3.37 15.80 1.74 3.06 0.45 0.92 3.49 14.33 1.36 3.86 0.35 0.97 2.12
3C2 26.13 1.98 1.20 0.51 0.58 4.53 22.53 1.01 1.09 0.26 0.81 1.18 27.47 1.52 1.49 0.39 0.78 2.68 3C3 19.00 1.49 2.57 0.38 0.92 2.57 19.87 2.15 2.94 0.55 0.88 5.32 21.33 2.18 1.71 0.56 0.70 5.48 3C4 25.87 2.30 0.23 0.59 0.04 6.10 24.33 1.89 0.14 0.49 0.02 4.12 25.80 2.32 0.20 0.60 0.03 6.20 3C5 17.33 1.77 2.14 0.45 0.85 3.62 17.47 2.04 2.06 0.52 0.79 4.82 20.00 1.81 2.14 0.47 0.84 3.79 3C6 17.13 0.98 2.63 0.25 0.96 1.10 20.73 0.78 2.03 0.20 0.96 0.70 19.93 1.11 2.26 0.28 0.94 1.42 3C7 15.33 1.97 3.29 0.51 0.91 4.48 14.33 2.18 3.71 0.56 0.92 5.48 18.13 2.52 2.34 0.65 0.77 7.32 3C8 13.07 1.53 3.17 0.39 0.94 2.70 9.27 1.89 3.40 0.49 0.92 4.13 14.53 1.18 2.37 0.30 0.94 1.60 3C9 13.80 1.91 3.20 0.49 0.91 4.20 16.00 2.14 2.86 0.55 0.87 5.29 15.00 1.24 2.86 0.32 0.95 1.79 4B1 20.73 1.36 1.60 0.35 0.84 2.13 19.27 0.78 1.83 0.20 0.95 0.70 20.13 0.84 2.34 0.22 0.97 0.82 4B2 15.07 1.05 2.89 0.27 0.97 1.28 14.00 1.65 3.29 0.42 0.94 3.14 16.60 1.12 2.69 0.29 0.96 1.44 4B3 16.60 2.34 3.40 0.60 0.89 6.30 14.00 1.00 3.71 0.26 0.98 1.14 15.40 1.34 3.46 0.35 0.96 2.09 4B4 16.27 1.53 1.83 0.39 0.84 2.70 13.53 1.18 2.23 0.30 0.93 1.60 12.67 1.89 2.86 0.49 0.90 4.12 4B5 16.07 2.24 3.31 0.57 0.89 5.78 18.00 1.65 3.29 0.42 0.94 3.14 14.67 2.55 3.29 0.65 0.86 7.48 4B6 12.33 1.64 2.86 0.42 0.92 3.12 11.87 2.00 3.23 0.51 0.91 4.60 8.60 1.64 3.54 0.42 0.95 3.09 4B7 21.93 1.69 0.11 0.43 0.02 3.28 22.47 2.58 -0.09 0.66 0.00 7.68 20.80 2.55 0.34 0.65 0.06 7.49 4C1 21.27 1.38 1.83 0.35 0.87 2.20 20.93 2.06 2.26 0.53 0.82 4.92 24.67 1.07 2.00 0.28 0.93 1.33 4C2 21.07 1.93 1.89 0.49 0.78 4.28 22.53 1.01 2.09 0.26 0.94 1.18 21.53 0.98 2.23 0.25 0.95 1.10 4C3 22.47 0.95 2.20 0.24 0.95 1.03 19.53 1.75 2.80 0.45 0.91 3.53 18.93 2.02 2.97 0.52 0.89 4.70 4C4 14.40 1.60 3.31 0.41 0.94 2.94 13.93 2.14 4.11 0.55 0.93 5.28 19.67 2.55 2.71 0.65 0.81 7.48 4C5 14.73 1.11 3.46 0.28 0.97 1.42 14.33 1.13 3.29 0.29 0.97 1.48 13.00 1.86 4.00 0.48 0.95 4.00 4C6 21.73 1.59 0.46 0.41 0.24 2.92 22.33 2.53 0.57 0.65 0.16 7.40 21.20 1.74 0.94 0.45 0.53 3.49 4C7 17.53 1.07 2.94 0.27 0.97 1.32 19.13 1.26 2.06 0.32 0.91 1.82 17.33 1.70 3.00 0.44 0.92 3.33 4C8 18.53 2.25 0.94 0.58 0.40 5.82 18.73 1.81 0.89 0.46 0.48 3.78 18.07 2.33 0.89 0.60 0.35 6.28 4C9 13.93 1.53 2.97 0.39 0.93 2.70 16.87 1.82 2.66 0.47 0.89 3.82 14.20 1.74 2.94 0.45 0.92 3.49 4D1 17.73 2.98 2.31 0.77 0.70 10.28 17.33 3.80 2.14 0.97 0.55 16.62 16.53 3.03 2.37 0.78 0.70 10.60 4D2 19.07 0.89 2.46 0.23 0.97 0.92 15.67 1.18 2.86 0.30 0.96 1.62 15.47 1.07 3.06 0.27 0.97 1.32 4D3 15.27 1.72 3.26 0.44 0.93 3.42 16.13 2.09 3.20 0.54 0.90 5.03 16.00 1.78 2.71 0.46 0.90 3.64
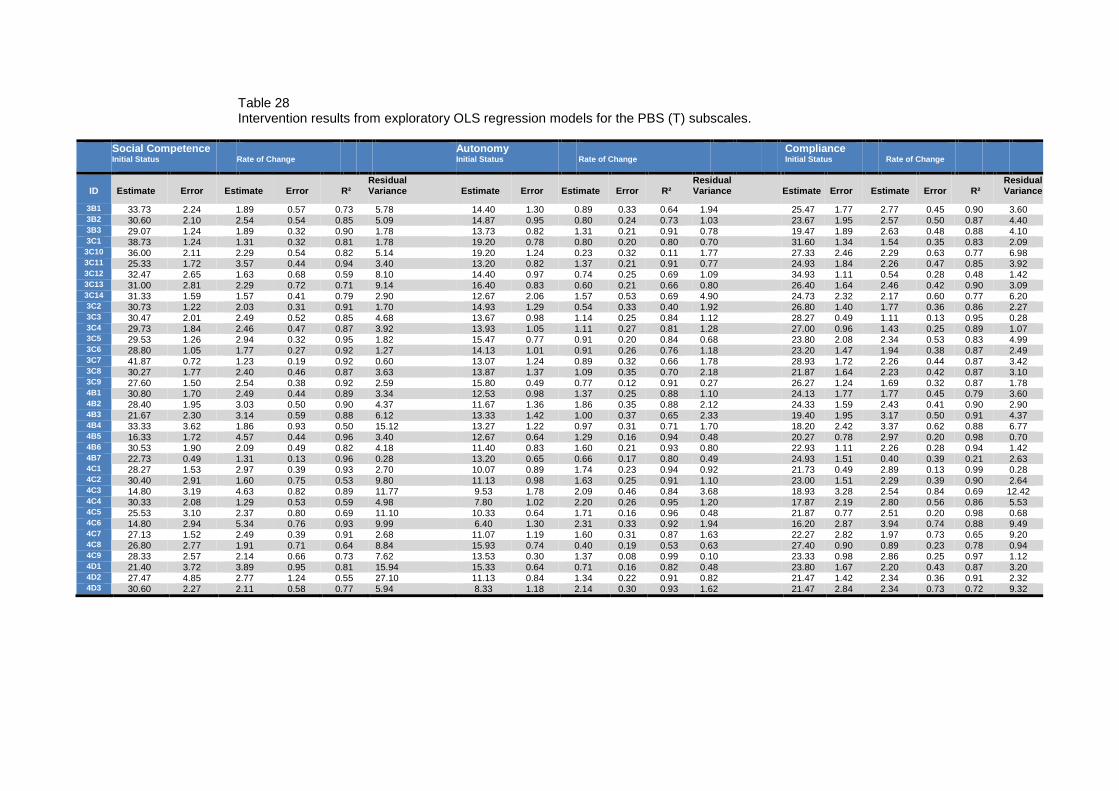
Table 28 Intervention results from exploratory OLS regression models for the PBS (T) subscales.
Social Competence Initial Status
Rate of Change
Autonomy Initial Status
Rate of Change
Compliance Initial Status
Rate of Change
ID
Estimate
Error
Estimate
Error
R²
Residual Variance
Estimate
Error
Estimate
Error
R²
Residual Variance
Estimate
Error
Estimate
Error
R²
Residual Variance
3B1 33.73 2.24 1.89 0.57 0.73 5.78 14.40 1.30 0.89 0.33 0.64 1.94 25.47 1.77 2.77 0.45 0.90 3.60 3B2 30.60 2.10 2.54 0.54 0.85 5.09 14.87 0.95 0.80 0.24 0.73 1.03 23.67 1.95 2.57 0.50 0.87 4.40 3B3 29.07 1.24 1.89 0.32 0.90 1.78 13.73 0.82 1.31 0.21 0.91 0.78 19.47 1.89 2.63 0.48 0.88 4.10 3C1 38.73 1.24 1.31 0.32 0.81 1.78 19.20 0.78 0.80 0.20 0.80 0.70 31.60 1.34 1.54 0.35 0.83 2.09
3C10 36.00 2.11 2.29 0.54 0.82 5.14 19.20 1.24 0.23 0.32 0.11 1.77 27.33 2.46 2.29 0.63 0.77 6.98 3C11 25.33 1.72 3.57 0.44 0.94 3.40 13.20 0.82 1.37 0.21 0.91 0.77 24.93 1.84 2.26 0.47 0.85 3.92 3C12 32.47 2.65 1.63 0.68 0.59 8.10 14.40 0.97 0.74 0.25 0.69 1.09 34.93 1.11 0.54 0.28 0.48 1.42 3C13 31.00 2.81 2.29 0.72 0.71 9.14 16.40 0.83 0.60 0.21 0.66 0.80 26.40 1.64 2.46 0.42 0.90 3.09 3C14 31.33 1.59 1.57 0.41 0.79 2.90 12.67 2.06 1.57 0.53 0.69 4.90 24.73 2.32 2.17 0.60 0.77 6.20 3C2 30.73 1.22 2.03 0.31 0.91 1.70 14.93 1.29 0.54 0.33 0.40 1.92 26.80 1.40 1.77 0.36 0.86 2.27 3C3 30.47 2.01 2.49 0.52 0.85 4.68 13.67 0.98 1.14 0.25 0.84 1.12 28.27 0.49 1.11 0.13 0.95 0.28 3C4 29.73 1.84 2.46 0.47 0.87 3.92 13.93 1.05 1.11 0.27 0.81 1.28 27.00 0.96 1.43 0.25 0.89 1.07 3C5 29.53 1.26 2.94 0.32 0.95 1.82 15.47 0.77 0.91 0.20 0.84 0.68 23.80 2.08 2.34 0.53 0.83 4.99 3C6 28.80 1.05 1.77 0.27 0.92 1.27 14.13 1.01 0.91 0.26 0.76 1.18 23.20 1.47 1.94 0.38 0.87 2.49 3C7 41.87 0.72 1.23 0.19 0.92 0.60 13.07 1.24 0.89 0.32 0.66 1.78 28.93 1.72 2.26 0.44 0.87 3.42 3C8 30.27 1.77 2.40 0.46 0.87 3.63 13.87 1.37 1.09 0.35 0.70 2.18 21.87 1.64 2.23 0.42 0.87 3.10 3C9 27.60 1.50 2.54 0.38 0.92 2.59 15.80 0.49 0.77 0.12 0.91 0.27 26.27 1.24 1.69 0.32 0.87 1.78 4B1 30.80 1.70 2.49 0.44 0.89 3.34 12.53 0.98 1.37 0.25 0.88 1.10 24.13 1.77 1.77 0.45 0.79 3.60 4B2 28.40 1.95 3.03 0.50 0.90 4.37 11.67 1.36 1.86 0.35 0.88 2.12 24.33 1.59 2.43 0.41 0.90 2.90 4B3 21.67 2.30 3.14 0.59 0.88 6.12 13.33 1.42 1.00 0.37 0.65 2.33 19.40 1.95 3.17 0.50 0.91 4.37 4B4 33.33 3.62 1.86 0.93 0.50 15.12 13.27 1.22 0.97 0.31 0.71 1.70 18.20 2.42 3.37 0.62 0.88 6.77 4B5 16.33 1.72 4.57 0.44 0.96 3.40 12.67 0.64 1.29 0.16 0.94 0.48 20.27 0.78 2.97 0.20 0.98 0.70 4B6 30.53 1.90 2.09 0.49 0.82 4.18 11.40 0.83 1.60 0.21 0.93 0.80 22.93 1.11 2.26 0.28 0.94 1.42 4B7 22.73 0.49 1.31 0.13 0.96 0.28 13.20 0.65 0.66 0.17 0.80 0.49 24.93 1.51 0.40 0.39 0.21 2.63 4C1 28.27 1.53 2.97 0.39 0.93 2.70 10.07 0.89 1.74 0.23 0.94 0.92 21.73 0.49 2.89 0.13 0.99 0.28 4C2 30.40 2.91 1.60 0.75 0.53 9.80 11.13 0.98 1.63 0.25 0.91 1.10 23.00 1.51 2.29 0.39 0.90 2.64 4C3 14.80 3.19 4.63 0.82 0.89 11.77 9.53 1.78 2.09 0.46 0.84 3.68 18.93 3.28 2.54 0.84 0.69 12.42 4C4 30.33 2.08 1.29 0.53 0.59 4.98 7.80 1.02 2.20 0.26 0.95 1.20 17.87 2.19 2.80 0.56 0.86 5.53 4C5 25.53 3.10 2.37 0.80 0.69 11.10 10.33 0.64 1.71 0.16 0.96 0.48 21.87 0.77 2.51 0.20 0.98 0.68 4C6 14.80 2.94 5.34 0.76 0.93 9.99 6.40 1.30 2.31 0.33 0.92 1.94 16.20 2.87 3.94 0.74 0.88 9.49 4C7 27.13 1.52 2.49 0.39 0.91 2.68 11.07 1.19 1.60 0.31 0.87 1.63 22.27 2.82 1.97 0.73 0.65 9.20 4C8 26.80 2.77 1.91 0.71 0.64 8.84 15.93 0.74 0.40 0.19 0.53 0.63 27.40 0.90 0.89 0.23 0.78 0.94 4C9 28.33 2.57 2.14 0.66 0.73 7.62 13.53 0.30 1.37 0.08 0.99 0.10 23.33 0.98 2.86 0.25 0.97 1.12 4D1 21.40 3.72 3.89 0.95 0.81 15.94 15.33 0.64 0.71 0.16 0.82 0.48 23.80 1.67 2.20 0.43 0.87 3.20 4D2 27.47 4.85 2.77 1.24 0.55 27.10 11.13 0.84 1.34 0.22 0.91 0.82 21.47 1.42 2.34 0.36 0.91 2.32 4D3 30.60 2.27 2.11 0.58 0.77 5.94 8.33 1.18 2.14 0.30 0.93 1.62 21.47 2.84 2.34 0.73 0.72 9.32

Table 29 Intervention results from exploratory OLS regression models for the PBS (P) subscales.
Social Competence Initial Status
Rate of Change
Autonomy Initial Status
Rate of Change
Compliance Initial Status
Rate of Change
ID
Estimate
Error
Estimate
Error
R²
Residual Variance
Estimate
Error
Estimate
Error
R²
Residual Variance
Estimate
Error
Estimate
Error
R²
Residual Variance
3B1 32.33 2.40 2.86 0.62 0.84 6.62 14.53 1.15 1.80 0.30 0.90 1.53 23.73 2.54 3.46 0.65 0.88 7.42 3B2 30.47 2.41 2.91 0.62 0.85 6.68 11.53 2.31 2.09 0.59 0.75 6.18 21.80 2.63 3.34 0.68 0.86 7.99 3B3 29.67 1.77 2.14 0.45 0.85 3.62 15.33 1.59 0.57 0.41 0.33 2.90 17.00 4.24 3.86 1.09 0.76 20.79 3C1 36.53 1.56 1.66 0.40 0.81 2.82 16.80 0.55 0.91 0.14 0.91 0.34 30.33 0.59 1.43 0.15 0.96 0.40
3C10 38.60 1.64 1.54 0.42 0.77 3.09 18.27 1.11 1.26 0.28 0.83 1.42 27.60 0.90 2.69 0.23 0.97 0.94 3C11 36.73 1.02 2.03 0.26 0.94 1.20 10.47 0.84 2.34 0.22 0.97 0.82 23.87 2.74 2.51 0.70 0.76 8.68 3C12 33.60 1.83 1.97 0.47 0.81 3.87 12.60 1.09 1.83 0.28 0.91 1.37 25.93 2.45 2.26 0.63 0.76 6.92 3C13 33.13 1.64 1.63 0.42 0.79 3.10 12.47 2.10 1.77 0.54 0.73 5.10 23.87 4.17 2.80 1.07 0.63 20.03 3C14 31.80 4.55 1.91 1.17 0.40 23.84 11.47 1.50 1.77 0.39 0.84 2.60 24.73 3.08 2.46 0.79 0.71 10.92 3C2 27.47 1.98 3.20 0.51 0.91 4.53 14.60 2.48 1.26 0.64 0.49 7.09 21.87 3.63 3.09 0.93 0.73 15.18 3C3 29.53 2.52 2.66 0.65 0.81 7.32 15.27 2.14 1.11 0.55 0.51 5.28 24.13 1.77 1.63 0.45 0.76 3.60 3C4 24.67 1.28 3.57 0.33 0.97 1.90 10.73 1.53 2.03 0.39 0.87 2.70 23.07 2.11 2.60 0.54 0.85 5.13 3C5 28.13 1.33 3.20 0.34 0.96 2.03 12.80 1.24 1.63 0.32 0.87 1.77 22.60 0.87 2.97 0.22 0.98 0.87 3C6 28.67 1.36 2.14 0.35 0.90 2.12 11.40 0.57 2.03 0.15 0.98 0.37 23.80 1.02 2.20 0.26 0.95 1.20 3C7 43.00 1.99 1.57 0.51 0.70 4.57 14.20 1.02 1.80 0.26 0.92 1.20 28.73 1.51 2.60 0.39 0.92 2.63 3C8 31.80 1.47 2.34 0.38 0.91 2.49 13.20 0.82 1.23 0.21 0.90 0.77 24.60 0.87 1.97 0.22 0.95 0.87 3C9 28.27 1.22 2.83 0.31 0.95 1.70 15.87 0.68 0.80 0.17 0.84 0.53 25.60 0.57 1.97 0.15 0.98 0.37 4B1 29.93 2.62 2.54 0.67 0.78 7.92 13.73 1.69 1.31 0.43 0.70 3.28 26.60 1.88 1.26 0.48 0.63 4.09 4B2 25.07 1.59 3.74 0.41 0.95 2.92 12.27 1.22 1.83 0.31 0.90 1.70 22.33 1.51 3.14 0.39 0.94 2.62 4B3 23.93 2.84 3.11 0.73 0.82 9.28 11.67 2.26 1.43 0.58 0.60 5.90 20.60 1.73 2.69 0.44 0.90 3.44 4B4 24.93 2.67 2.83 0.68 0.81 8.20 13.93 1.89 1.40 0.49 0.67 4.13 15.73 2.75 4.03 0.71 0.89 8.70 4B5 18.33 3.71 4.57 0.95 0.85 15.90 10.13 1.52 1.91 0.39 0.86 2.68 21.60 2.35 2.83 0.60 0.85 6.37 4B6 29.73 3.18 3.17 0.82 0.79 11.70 12.40 1.64 1.74 0.42 0.81 3.09 21.93 1.55 3.69 0.40 0.96 2.78 4B7 23.20 2.08 0.94 0.53 0.44 4.99 13.40 0.97 0.46 0.25 0.46 1.09 24.20 1.57 1.09 0.40 0.64 2.84 4C1 36.07 6.31 1.46 1.62 0.17 45.92 9.80 1.31 2.06 0.34 0.90 1.99 23.33 4.12 2.14 1.06 0.51 19.62 4C2 30.53 1.90 1.51 0.49 0.71 4.18 12.40 1.56 1.60 0.40 0.80 2.80 23.53 2.97 2.51 0.76 0.73 10.18 4C3 15.13 3.18 4.91 0.82 0.90 11.68 10.67 1.74 1.71 0.45 0.79 3.48 19.73 4.63 2.17 1.19 0.46 24.70 4C4 26.13 2.30 2.63 0.59 0.83 6.10 8.80 0.82 1.77 0.21 0.95 0.77 22.47 1.01 1.91 0.26 0.93 1.18 4C5 24.93 2.75 3.83 0.71 0.88 8.70 9.33 1.13 2.29 0.29 0.94 1.48 31.40 3.43 0.74 0.88 0.15 13.59 4C6 18.73 3.56 4.60 0.91 0.86 14.63 7.40 1.30 2.31 0.33 0.92 1.94 20.27 2.74 3.40 0.70 0.85 8.63 4C7 25.80 2.90 3.20 0.74 0.82 9.70 10.93 1.02 1.83 0.26 0.92 1.20 21.53 1.56 1.94 0.40 0.85 2.82 4C8 24.60 1.95 1.97 0.50 0.80 4.37 13.60 0.57 0.97 0.15 0.92 0.37 29.80 1.08 0.49 0.28 0.43 1.34 4C9 25.80 3.40 3.91 0.87 0.83 13.34 14.33 0.59 1.57 0.15 0.96 0.40 27.20 3.89 2.66 1.00 0.64 17.49 4D1 26.00 2.88 3.43 0.74 0.84 9.57 17.40 0.97 0.74 0.25 0.69 1.09 25.47 2.15 2.34 0.55 0.82 5.32 4D2 35.00 7.29 2.14 1.87 0.25 61.29 11.67 0.89 1.57 0.23 0.92 0.90 25.40 1.34 1.74 0.35 0.86 2.09 4D3 29.20 2.25 2.51 0.58 0.83 5.84 8.00 1.65 2.29 0.42 0.88 3.14 17.73 3.38 3.17 0.87 0.77 13.20

222
Appendix L: Scalograms
Coefficient of reproducibility 0.89 Coefficient of reproducibility 0.90
Figure 41: Control scalograms: Child measures – Time 1 and Time 2.
ID SMI-C9
SEQ-C PBS S-ES ID SMI-
C9 SEQ-
C S-ES PBS
5B1 1 1 1 0 5B1 1 1 1 0 5B3 1 1 0 0 5B6 1 1 1 0 5C1 1 1 0 0 5C6 1 1 1 0 5D7 1 1 0 0 5D3 1 1 1 0 5D9 1 1 0 0 6A3 1 1 1 0 5C2 1 1 0 0 5B3 1 1 0 0 5C6 1 0 0 0 5B4 1 1 0 0 5C8 1 0 0 0 5B5 1 1 0 0 5B2 1 0 1 0 5B7 1 1 0 0 5D5 1 0 1 0 5B9 1 1 0 0 5B6 1 0 1 0 5C1 1 1 0 0 5B7 1 0 1 0 5C7 1 1 0 0 5C9 1 1 0 1 5D1 1 1 0 0 5C9 1 1 0 1 5D2 1 1 0 0 5B9 0 0 1 0 5D4 1 1 0 0 5D1 0 1 0 0 5D6 1 1 0 0 5D6 0 1 0 0 5D7 1 0 0 0 5B5 0 1 1 0 5D9 1 0 0 0 5D4 0 1 0 1 6C1 1 0 0 0 5C3 1 0 1 0 5B2 1 0 1 0 5D8 1 0 0 1 5B8 1 1 0 1 5D2 0 1 1 0 5C2 1 0 1 0 5D3 0 1 0 0 5C4 1 0 1 1 6A4 0 0 1 0 5C5 1 0 1 1 6B3 0 0 1 0 5C8 1 0 1 1 6B7 0 0 0 1 5C9 1 1 0 1 5B4 0 0 1 0 5D8 0 0 0 1 5C4 0 0 1 0 6A1 0 0 1 0 5C5 0 0 0 0 6A4 0 0 1 0 5C7 0 0 0 0 6A5 0 0 1 0 6A1 0 0 0 0 6B5 0 0 1 0 6A2 0 0 0 0 6B9 0 0 1 0 6A3 0 0 0 0 6C2 0 0 0 1 6A5 0 0 0 0 6C3 0 0 1 0 6A6 0 0 0 0 5C3 0 0 0 0 6A7 0 0 0 0 5D5 0 0 0 0 6A8 0 0 0 0 6A2 0 0 0 0 6A9 0 0 0 0 6A6 0 0 0 0 6B1 0 0 0 0 6A7 0 0 0 0 6B2 0 0 0 0 6A8 0 0 0 0 6B4 0 0 0 0 6A9 0 0 0 0 6B5 0 0 0 0 6B1 0 0 0 0 6B6 0 0 0 0 6B2 0 0 0 0 6B8 0 0 0 0 6B3 0 0 0 0 6B9 0 0 0 0 6B4 0 0 0 0 6C1 0 0 0 0 6B6 0 0 0 0 6C2 0 0 0 0 6B7 0 0 0 0 6C3 0 0 0 0 6B8 0 0 0 0 6C4 0 0 0 0 6C4 0 0 0 0
Scalogram Key
1 = On
0 = Off
= Approximated line of the triangulated pattern

223
ID SMI-C9
SEQ-C S-ES PBS ID SMI-
C9 SEQ-
C S-ES PBS
5B1 1 1 1 0 5B2 1 1 1 0 5B4 1 1 1 0 5B1 1 1 1 0 5B6 1 1 1 0 5B9 1 1 1 0 5B9 1 1 1 0 5C1 1 1 1 0 5C4 1 1 1 0 5C2 1 1 1 0 5B5 1 1 0 0 5D1 1 1 1 0 5B7 1 1 0 0 5D2 1 1 1 0 5B8 1 1 0 0 5D6 1 1 1 0 5C1 1 1 0 0 6B8 1 1 1 0 5C9 1 1 0 0 5B4 1 1 0 0 5D6 1 1 0 0 5B5 1 1 0 0 5D7 1 1 0 0 5C7 1 1 0 0 5D8 1 1 0 0 5D7 1 1 0 0 6A6 1 1 0 0 6A3 1 1 0 0 5C7 1 1 0 0 6A6 1 1 0 0 6B8 1 0 0 0 6B1 1 1 0 0 5D5 1 0 0 0 6C2 1 1 0 0 5B3 1 0 0 0 6C3 1 1 0 0 5C8 1 0 0 0 5C9 1 1 0 0 5D2 1 0 0 0 5D4 1 0 0 0 5D1 1 1 0 1 5B3 1 1 0 1 5C2 1 0 1 0 5B6 1 1 0 1 5D9 0 1 0 0 5B7 1 0 1 0 5B2 1 0 1 1 5B8 0 1 0 0 6B1 1 0 1 0 5C3 1 0 1 0 6B4 1 1 0 1 5C4 1 1 0 1 5C3 1 1 0 1 5C6 0 1 1 0 5C6 0 1 0 0 5C8 1 0 1 1 5D4 0 0 1 0 5D5 1 0 1 0 6A3 0 1 1 0 5D8 1 0 1 0 6B3 0 1 0 1 5D9 0 1 0 0 5D3 0 1 0 0 6A2 0 1 1 1 6A1 0 0 1 0 6A4 1 1 0 1 6A8 0 0 1 0 6B3 1 0 1 1 6B5 0 0 1 0 6B4 1 1 0 1 6C3 0 0 1 0 6B7 0 1 0 1 6C4 0 0 1 0 6C1 1 0 1 0 5C5 0 0 0 0 5C5 0 0 0 0 6A2 0 0 0 0 5D3 0 0 0 0 6A4 0 0 0 0 6A1 0 0 0 0 6A5 0 0 0 0 6A5 0 0 0 0 6A7 0 0 0 0 6A7 0 0 0 0 6A9 0 0 0 0 6A8 0 0 0 0 6B2 0 0 0 0 6A9 0 0 0 0 6B6 0 0 0 0 6B2 0 0 0 0 6B7 0 0 0 0 6B5 0 0 0 0 6B9 0 0 0 0 6B6 0 0 0 0 6C1 0 0 0 0 6B9 0 0 0 0 6C2 0 0 0 0 6C4 0 0 0 0
Coefficient of reproducibility 0.88 Coefficient of reproducibility 0.87
Figure 42: Control scalograms: Child measures – Time 3 and Time 4.

224
ID SMI-C9
SEQ-C S-ES PBS ID SMI-
C9 SEQ-
C S-ES PBS
5C9 1 1 1 1 5B2 1 1 1 1 5D4 1 1 1 0 5B6 1 1 1 0 5B1 1 1 1 0 5D2 1 1 1 0 5B2 1 1 1 0 6A9 1 1 1 0 5B6 1 1 1 0 6B7 1 1 1 0 5D2 1 1 1 0 5B4 1 1 0 0 5D6 1 1 1 0 5B5 1 1 0 0 5B3 1 1 0 0 5B8 1 1 0 0 5B7 1 1 0 0 5C8 1 1 0 0 5C4 1 1 0 0 5C9 1 1 0 0 5D1 1 1 0 0 5D1 1 1 0 0 5D3 1 1 0 0 5D3 1 1 0 0 6A6 1 1 0 0 5D5 1 1 0 0 6C1 1 0 0 0 5D6 1 1 0 0 5B8 1 0 0 0 5D8 1 1 0 0 5D8 1 0 1 0 6A3 1 1 0 0 5B5 1 1 0 1 5D9 1 1 0 0 5C2 1 0 1 0 5C7 1 0 0 0 5C3 1 0 1 0 5B3 1 1 0 1 5D5 1 0 1 0 5B1 1 0 1 0 5D7 1 0 1 0 5B7 1 0 1 0 5D9 1 0 1 0 5B9 0 1 0 0 6A3 0 1 0 0 5C4 0 1 0 0 6A4 1 0 1 0 6A2 0 1 1 0 6A9 0 1 0 0 6A4 1 0 1 0 6B1 1 0 1 0 6A1 0 0 1 0 6B3 1 0 0 1 6A7 0 1 0 1 6B4 0 1 1 0 6B1 1 0 1 0 6B7 0 1 1 0 6C2 1 0 1 0 6B8 0 1 0 0 6C3 1 0 1 0 6C2 0 1 0 1 6B4 0 1 0 0 5B4 0 0 0 0 5C2 0 0 1 0 5B9 0 0 0 0 5C1 0 0 0 0 5C1 0 0 0 0 5C3 0 0 0 0 5C5 0 0 0 0 5C5 0 0 0 0 5C6 0 0 0 0 5C6 0 0 0 0 5C7 0 0 0 0 5D4 0 0 0 0 5C8 0 0 0 0 5D7 0 0 0 0 6A1 0 0 0 0 6A5 0 0 0 0 6A2 0 0 0 0 6A6 0 0 0 0 6A5 0 0 0 0 6A8 0 0 0 0 6A7 0 0 0 0 6B2 0 0 0 0 6A8 0 0 0 0 6B3 0 0 0 0 6B2 0 0 0 0 6B5 0 0 0 0 6B5 0 0 0 0 6B6 0 0 0 0 6B6 0 0 0 0 6B8 0 0 0 0 6B9 0 0 0 0 6B9 0 0 0 0 6C3 0 0 0 0 6C1 0 0 0 0 6C4 0 0 0 0 6C4 0 0 0 0
Coefficient of reproducibility 0.89 Coefficient of reproducibility 0.90
Figure 43: Control scalograms: Child measures – Time 5 and Time 6.

225
ID SMI-C9
SEQ-C S-ES PBS ID SMI-
C9 SEQ-
C S-ES PBS
3C2 1 1 0 0 3C1
1 1 1 1 4C1 1 1 0 0 4C2 1 1 1 1 4C2 1 1 0 0 4D2 1 1 1 0 4C3 1 1 0 0 3B3 1 1 0 0 3C9 1 0 0 0 3C1 1 1 0 0 4B1 1 0 0 0 3C2 1 1 0 0 3B1 0 1 0 0 3C4 1 1 0 0
3C10 1 0 1 0 3C6 1 1 0 0 3C11 0 0 1 0 4B1 1 1 0 0 3C13 0 0 1 0 4B3 1 1 0 0 3C3 0 1 0 0 4C1 1 1 0 0 3C4 0 1 0 0 4C3 1 1 0 0 3C5 0 0 0 1 4C4 1 1 0 0 4B3 0 0 1 0 4C8 1 0 0 0 4B6 0 0 0 1 4C9 1 0 0 0 4B7 1 0 0 1 3B2 0 1 1 0 4C4 1 0 1 0 3C1
1 0 1 0
4C6 1 1 0 1 3C1
1 0 1 0 4D2 1 0 1 0 3C3 0 1 0 0 4D3 0 0 1 0 3C5 1 1 0 1 3B2 0 0 0 0 3C7 1 0 1 0 3B3 0 0 0 0 3C8 0 0 1 0 3C1 0 0 0 0 3C9 1 0 1 0
3C12 0 0 0 0 4B2 1 0 1 0 3C14 0 0 0 0 4B5 0 1 0 0 3C6 0 0 0 0 4B6 0 0 1 0 3C7 0 0 0 0 4B7 1 1 0 1 3C8 0 0 0 0 4C6 1 0 1 1 4B2 0 0 0 0 4C7 0 1 0 0 4B4 0 0 0 0 4D1 0 1 0 0 4B5 0 0 0 0 4D3 1 0 1 0 4C5 0 0 0 0 3B1 0 0 0 0 4C7 0 0 0 0 3C1
0 0 0 0
4C8 0 0 0 0 3C1
0 0 0 0 4C9 0 0 0 0 4B4 0 0 0 0 4D1 0 0 0 0 4C5 0 0 0 0
Coefficient of reproducibility 0.90 Coefficient of reproducibility 0.89
Figure 44: Intervention scalograms: Child measures – Time 1 and Time 2.

226
ID SMI-C9
SEQ-C S-ES PBS ID SMI-
C9 SEQ-
C S-ES PBS
3C7 1 1 1 1 3C14 1 1 1 1 4C5 1 1 1 1 3C4 1 1 1 1 3B2 1 1 1 0 3C5 1 1 1 1
3C12 1 1 1 0 3C8 1 1 1 1 3C3 1 1 1 0 4B2 1 1 1 1 3C4 1 1 1 0 4C5 1 1 1 1 3C6 1 1 1 0 3B2 1 1 1 0 3C9 1 1 1 0 3B3 1 1 1 0 4B1 1 1 1 0 3C1 1 1 1 0 4B2 1 1 1 0 3C10 1 1 1 0 4B7 1 1 1 0 3C11 1 1 1 0 4C2 1 1 1 0 3C12 1 1 1 0 4C4 1 1 1 0 3C2 1 1 1 0 4C8 1 1 1 0 3C3 1 1 1 0 4D2 1 1 1 0 3C6 1 1 1 0 4D3 1 1 1 0 3C7 1 1 1 0 3C1 1 1 0 0 3C9 1 1 1 0
3C14 1 1 0 0 4B1 1 1 1 0 4B3 1 1 0 0 4C2 1 1 1 0 4B5 1 1 0 0 4C4 1 1 1 0 4C1 1 1 0 0 4C8 1 1 1 0 4C3 1 1 0 0 4D2 1 1 1 0 4C9 1 0 0 0 4B3 1 1 0 0 3B1 0 1 0 0 4B5 1 1 0 0 3B3 0 1 0 0 4C3 1 1 0 0
3C10 0 1 1 0 4C9 1 1 0 0 3C11 1 0 1 0 3B1 0 1 1 0 3C13 0 0 1 1 3C13 1 0 1 1 3C2 1 1 0 1 4B4 0 0 1 0 3C5 0 1 1 1 4B6 1 0 1 1 3C8 1 0 1 1 4B7 1 0 1 0 4B4 1 0 1 0 4C1 1 1 0 1 4B6 1 0 1 1 4C6 1 1 0 1 4C6 1 0 1 1 4C7 0 1 0 0 4C7 0 1 0 0 4D1 1 0 1 0 4D1 0 0 1 0 4D3 1 1 0 1
Coefficient of reproducibility 0.91 Coefficient of reproducibility 0.93
Figure 45: Intervention scalograms: Child measures – Time 3 and Time 4.

227
ID SMI-C9
SEQ-C S-ES PBS ID SMI-
C9 SEQ-C S-ES PBS
3B2 1 1 1 1 3B2 1 1 1 1 3B3 1 1 1 1 3B3 1 1 1 1 3C1
1 1 1 1 3C1
1 1 1 1
3C1
1 1 1 1 3C1
1 1 1 1 3C1
1 1 1 1 3C1
1 1 1 1
3C5 1 1 1 1 3C1
1 1 1 1 3C7 1 1 1 1 3C1
1 1 1 1
3C8 1 1 1 1 3C2 1 1 1 1 4B2 1 1 1 1 3C4 1 1 1 1 4B6 1 1 1 1 3C5 1 1 1 1 4C1 1 1 1 1 3C6 1 1 1 1 4C2 1 1 1 1 3C7 1 1 1 1 4D3 1 1 1 1 3C8 1 1 1 1 3C1
1 1 1 0 3C9 1 1 1 1
3C1
1 1 1 0 4B2 1 1 1 1 3C2 1 1 1 0 4B3 1 1 1 1 3C3 1 1 1 0 4B4 1 1 1 1 3C6 1 1 1 0 4B6 1 1 1 1 3C9 1 1 1 0 4C1 1 1 1 1 4B1 1 1 1 0 4C2 1 1 1 1 4B4 1 1 1 0 4C3 1 1 1 1 4B5 1 1 1 0 4C6 1 1 1 1 4C3 1 1 1 0 4D2 1 1 1 1 4C4 1 1 1 0 4D3 1 1 1 1 4D1 1 1 1 0 3C1 1 1 1 0 4D2 1 1 1 0 3C3 1 1 1 0 3C1 1 1 0 0 4B1 1 1 1 0 4C7 1 1 0 0 4B5 1 1 1 0 4C9 1 1 0 0 4C4 1 1 1 0 3B1 1 1 0 1 4C5 1 1 1 0 3C4 0 0 1 0 4D1 1 1 1 0 4B3 1 1 0 1 4C7 1 1 1 0 4B7 0 0 1 0 4C9 1 1 0 0 4C5 1 1 0 1 3B1 1 1 0 1 4C6 1 0 1 1 4B7 1 0 1 0 4C8 0 0 1 0 4C8 0 0 1 0
Coefficient of reproducibility 0.95 Coefficient of reproducibility 0.98
Figure 46: Intervention scalograms: Child measures – Time 5 and Time 6.

228
ID Parent Teacher ID Parent Teacher 5B8 1 1 5D4 1 1 5D2 1 1 5D8 1 1 6B9 1 1 5C9 1 0 5B6 1 0 5D2 1 0 5B5 0 1 5D7 1 0 5B1 0 0 5D9 1 0 5B2 0 0 5D6 0 1 5B3 0 0 6B7 0 1 5B4 0 0 6B8 0 1 5B7 0 0 6C1 0 1 5B9 0 0 5B1 0 0 5C1 0 0 5B2 0 0 5C2 0 0 5B3 0 0 5C3 0 0 5B4 0 0 5C4 0 0 5B5 0 0 5C5 0 0 5B6 0 0 5C6 0 0 5B7 0 0 5C7 0 0 5B8 0 0 5C8 0 0 5B9 0 0 5C9 0 0 5C1 0 0 5D1 0 0 5C2 0 0 5D3 0 0 5C3 0 0 5D4 0 0 5C4 0 0 5D5 0 0 5C5 0 0 5D6 0 0 5C6 0 0 5D7 0 0 5C7 0 0 5D8 0 0 5C8 0 0 5D9 0 0 5D1 0 0 6A1 0 0 5D3 0 0 6A2 0 0 5D5 0 0 6A3 0 0 6A1 0 0 6A4 0 0 6A2 0 0 6A5 0 0 6A3 0 0 6A6 0 0 6A4 0 0 6A7 0 0 6A5 0 0 6A8 0 0 6A6 0 0 6A9 0 0 6A7 0 0 6B1 0 0 6A8 0 0 6B2 0 0 6A9 0 0 6B3 0 0 6B1 0 0 6B4 0 0 6B2 0 0 6B5 0 0 6B3 0 0 6B6 0 0 6B4 0 0 6B7 0 0 6B5 0 0 6B8 0 0 6B6 0 0 6C1 0 0 6B9 0 0 6C2 0 0 6C2 0 0 6C3 0 0 6C3 0 0 6C4 0 0 6C4 0 0
Coefficient of reproducibility 0.99 Coefficient of reproducibility 0.96
Figure 47: Control parent / teacher scalograms - Time 1 and Time 2.

229
ID Parent Teacher ID Parent Teacher 5D2 1 1 5D2 1 1 5D7 1 1 5D3 1 1 5B7 1 0 6B8 1 1 5C1 1 0 5B7 1 0 5C3 1 0 5B8 1 0 5C9 1 0 5C1 1 0 5D4 1 0 5C3 1 0 5D9 1 0 5C4 1 0 6B8 1 0 5C9 1 0 6C3 1 0 5D1 1 0 5C2 0 1 5D6 1 0 5D1 0 1 5D8 1 0 5D3 0 1 5D9 1 0 5D8 0 1 5C2 0 1 6A9 0 1 5C6 0 1 6B3 0 1 6A3 0 1 6B7 0 1 6A4 0 1 6C1 0 1 6A9 0 1 5B1 0 0 6B3 0 1 5B2 0 0 6B7 0 1 5B3 0 0 6C1 0 1 5B4 0 0 5B1 0 0 5B5 0 0 5B2 0 0 5B6 0 0 5B3 0 0 5B8 0 0 5B4 0 0 5B9 0 0 5B5 0 0 5C4 0 0 5B6 0 0 5C5 0 0 5B9 0 0 5C7 0 0 5C5 0 0 5C6 0 0 5C7 0 0 5C8 0 0 5C8 0 0 5D5 0 0 5D4 0 0 5D6 0 0 5D5 0 0 6A1 0 0 5D7 0 0 6A2 0 0 6A1 0 0 6A3 0 0 6A2 0 0 6A4 0 0 6A5 0 0 6A5 0 0 6A6 0 0 6A6 0 0 6A7 0 0 6A7 0 0 6A8 0 0 6A8 0 0 6B1 0 0 6B1 0 0 6B2 0 0 6B2 0 0 6B4 0 0 6B4 0 0 6B5 0 0 6B5 0 0 6B6 0 0 6B6 0 0 6B9 0 0 6B9 0 0 6C2 0 0 6C2 0 0 6C3 0 0 6C4 0 0 6C4 0 0
Coefficient of reproducibility 0.92 Coefficient of reproducibility 0.92
Figure 48: Control parent / teacher scalograms - Time 3 and Time 4.

230
ID Parent Teacher ID Parent Teacher 5B7 1 1 5C4 1 1 5D2 1 1 5D2 1 1 5D3 1 1 5D3 1 1 5D6 1 1 5D7 1 1 6B3 1 1 5D8 1 1 6B8 1 1 6B3 1 1 5B4 1 0 5C2 1 0 5B6 1 0 5C9 1 0 5C1 1 0 5D1 1 0 5C3 1 0 5D6 1 0 5C4 1 0 6A3 1 0 6A9 1 0 6A9 1 0 6B6 1 0 6B6 1 0 5D7 0 1 6B7 1 0 5D8 0 1 5B7 0 1 5D9 0 1 5C1 0 1 6A3 0 1 5C8 0 1 6A4 0 1 5D9 0 1 6B5 0 1 6A2 0 1 6B7 0 1 6A4 0 1 5B1 0 0 6A7 0 1 5B2 0 0 6B8 0 1 5B3 0 0 5B1 0 0 5B5 0 0 5B2 0 0 5B8 0 0 5B3 0 0 5B9 0 0 5B4 0 0 5C2 0 0 5B5 0 0 5C5 0 0 5B6 0 0 5C6 0 0 5B8 0 0 5C7 0 0 5B9 0 0 5C8 0 0 5C3 0 0 5C9 0 0 5C5 0 0 5D1 0 0 5C6 0 0 5D4 0 0 5C7 0 0 5D5 0 0 5D4 0 0 6A1 0 0 5D5 0 0 6A2 0 0 6A1 0 0 6A5 0 0 6A5 0 0 6A6 0 0 6A6 0 0 6A7 0 0 6A8 0 0 6A8 0 0 6B1 0 0 6B1 0 0 6B2 0 0 6B2 0 0 6B4 0 0 6B4 0 0 6B5 0 0 6B9 0 0 6B9 0 0 6C1 0 0 6C1 0 0 6C2 0 0 6C2 0 0 6C3 0 0 6C3 0 0 6C4 0 0 6C4 0 0
Coefficient of reproducibility 0.93 Coefficient of reproducibility 0.92
Figure 49: Control parent / teacher scalograms - Time 5 and Time 6.
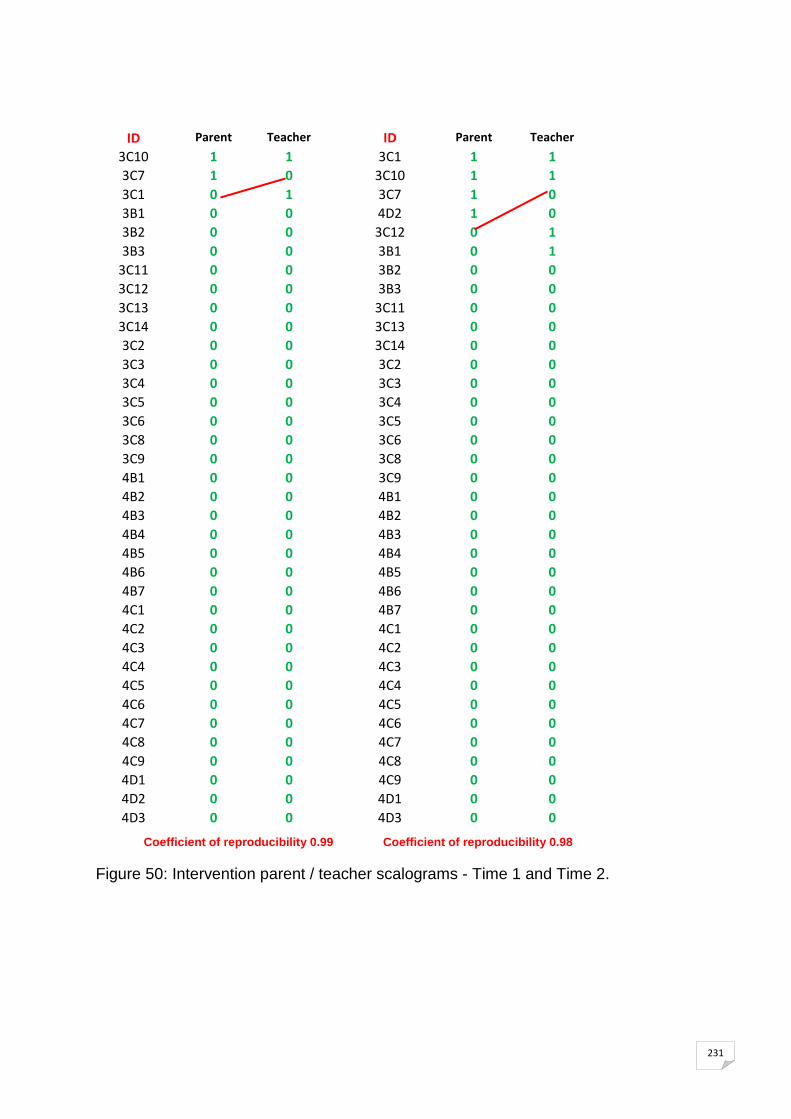
231
ID Parent Teacher ID Parent Teacher 3C10 1 1 3C1 1 1 3C7 1 0 3C10 1 1 3C1 0 1 3C7 1 0 3B1 0 0 4D2 1 0 3B2 0 0 3C12 0 1 3B3 0 0 3B1 0 1
3C11 0 0 3B2 0 0 3C12 0 0 3B3 0 0 3C13 0 0 3C11 0 0 3C14 0 0 3C13 0 0 3C2 0 0 3C14 0 0 3C3 0 0 3C2 0 0 3C4 0 0 3C3 0 0 3C5 0 0 3C4 0 0 3C6 0 0 3C5 0 0 3C8 0 0 3C6 0 0 3C9 0 0 3C8 0 0 4B1 0 0 3C9 0 0 4B2 0 0 4B1 0 0 4B3 0 0 4B2 0 0 4B4 0 0 4B3 0 0 4B5 0 0 4B4 0 0 4B6 0 0 4B5 0 0 4B7 0 0 4B6 0 0 4C1 0 0 4B7 0 0 4C2 0 0 4C1 0 0 4C3 0 0 4C2 0 0 4C4 0 0 4C3 0 0 4C5 0 0 4C4 0 0 4C6 0 0 4C5 0 0 4C7 0 0 4C6 0 0 4C8 0 0 4C7 0 0 4C9 0 0 4C8 0 0 4D1 0 0 4C9 0 0 4D2 0 0 4D1 0 0 4D3 0 0 4D3 0 0
Coefficient of reproducibility 0.99 Coefficient of reproducibility 0.98
Figure 50: Intervention parent / teacher scalograms - Time 1 and Time 2.

232
ID Parent Teacher ID Parent Teacher 3C1 1 1 3C1 1 1
3C10 1 1 3C10 1 1 4D2 1 1 3C11 1 1 3C11 1 0 3C12 1 1 3C7 1 0 3C13 1 1 4C1 1 0 3C5 1 1
3C12 0 1 3C7 1 1 3C2 0 1 3C9 1 1 3B1 0 1 4B2 1 1 3B2 0 0 4B4 1 1 3B3 0 0 4D2 1 1
3C13 0 0 3B2 1 0 3C14 0 0 3C6 1 0 3C3 0 0 3C8 1 0 3C4 0 0 4B6 1 0 3C5 0 0 4C9 1 0 3C6 0 0 4D1 1 0 3C8 0 0 3B1 0 1 3C9 0 0 3C2 0 1 4B1 0 0 3C3 0 1 4B2 0 0 4C1 0 1 4B3 0 0 3B3 0 0 4B4 0 0 3C14 0 0 4B5 0 0 3C4 0 0 4B6 0 0 4B1 0 0 4B7 0 0 4B3 0 0 4C2 0 0 4B5 0 0 4C3 0 0 4B7 0 0 4C4 0 0 4C2 0 0 4C5 0 0 4C3 0 0 4C6 0 0 4C4 0 0 4C7 0 0 4C5 0 0 4C8 0 0 4C6 0 0 4C9 0 0 4C7 0 0 4D1 0 0 4C8 0 0 4D3 0 0 4D3 0 0
Coefficient of reproducibility 0.97 Coefficient of reproducibility 0.96
Figure 51: Intervention parent / teacher scalograms - Time 3 and Time 4.

233
ID Parent Teacher ID Parent Teacher 3B1 1 1 3B1 1 1 3B2 1 1 3B2 1 1 3C1 1 1 3B3 1 1
3C10 1 1 3C1 1 1 3C11 1 1 3C10 1 1 3C12 1 1 3C11 1 1 3C13 1 1 3C12 1 1 3C2 1 1 3C13 1 1 3C3 1 1 3C14 1 1 3C4 1 1 3C2 1 1 3C5 1 1 3C3 1 1 3C7 1 1 3C4 1 1 3C8 1 1 3C5 1 1 3C9 1 1 3C6 1 1 4B2 1 1 3C7 1 1 4B3 1 1 3C8 1 1 4B4 1 1 3C9 1 1 4B5 1 1 4B1 1 1 4B6 1 1 4B2 1 1 4C2 1 1 4B3 1 1 4C6 1 1 4B4 1 1 4C7 1 1 4B5 1 1 4C9 1 1 4B6 1 1 3C6 1 0 4C1 1 1 4D1 1 0 4C2 1 1 4C4 1 0 4C3 1 1 4D2 1 0 4C4 1 1 4C1 0 1 4C5 1 1 4C3 0 1 4C6 1 1 4C5 0 1 4C7 1 1 4D3 0 1 4C9 1 1 3B3 0 0 4D1 1 1
3C14 0 0 4D2 1 1 4B1 0 0 4D3 1 1 4B7 0 0 4B7 0 0 4C8 0 0 4C8 0 1
Coefficient of reproducibility 0.96 Coefficient of reproducibility 0.99
Figure 52: Intervention parent / teacher scalograms - Time 5 and Time 6.