copyright (c) 2006 hra-nca1 hra-nca “compensation 2006” september 7, 2006 capital hilton human...
TRANSCRIPT

Copyright (C) 2006 HRA-NCA 1
HRA-NCA“Compensation 2006”
September 7, 2006 • Capital Hilton
Human Resource AssociationOf the National Capital Area
DC SHRM
Copyright (C) 2006 HRA-NCA 2
2006 Compensation Survey
Welcome
Carolyn CuppernullPresident, HRA-NCA
Human Resource AssociationOf the National Capital Area
DC SHRM
Copyright (C) 2006 HRA-NCA 3
2006 Compensation Survey
Introductions, Benefits Survey
Doug LwinHRA-NCA Director of Surveys
Human Resource AssociationOf the National Capital Area
DC SHRM
Copyright (C) 2006 HRA-NCA 4
Agenda• Introductions, Benefits Survey
– Doug Lwin, HRA-NCA Director of Surveys
• 2006 Compensation Highlights– Cara Carter, Watson Wyatt
• Trends in Policies & Practices– Brian Jackson, American Diabetes Association
• Government Contractor Compensation Highlights– Alan Chvotkin, Senior VP & Counsel, Professional Services Council
• Online Survey Query Tool – Angelo Kostopoulos, AKRON, Inc.
• Questions and Answers
Human Resource AssociationOf the National Capital Area
DC SHRM

Copyright (C) 2006 HRA-NCA 5
• Mission of HRA-NCA– To promote the exchange of ideas and practices and the
development of mutual assistance among Human Resource professionals
• Government Contractors Survey – Partnership with Professional Services Counsel (PSC)
• New Benefits Survey - Partnership with WACABA and WEB
Human Resource AssociationOf the National Capital Area
DC SHRM
Survey History
Human Resource AssociationOf the National Capital Area
DC SHRM
Copyright (C) 2006 HRA-NCA 6
• 265 respondents
• Data collected March 1 – April 30, 2006
• Survey Results available at: http://survey.akroninc.net/hrancaportal
Inaugural Benefits Survey
Human Resource AssociationOf the National Capital Area
DC SHRM

Copyright (C) 2006 HRA-NCA 7
• Chris Braccio• Jesse Cantrill• Cara Carter• Alan Chvotkin• Brian Jackson• Erika Johnson• Doug Lwin• Barbara Miller• Sonya Ousley Lee• Angelo Kostopoulos (AKRON Inc.)
Human Resource AssociationOf the National Capital Area
DC SHRM
Compensation Committee Members
Human Resource AssociationOf the National Capital Area
DC SHRM
Copyright (C) 2006 HRA-NCA 8
2006 Compensation Survey
Survey Highlights from Job Data
Cara CarterWatson Wyatt
Human Resource AssociationOf the National Capital Area
DC SHRM

Copyright (C) 2006 HRA-NCA 9
Topics• Participants • Survey Contents• New & Revised Jobs• Several Year-to-Year Comparisons
• Job Classifications Compared to 2005• Individual Jobs Compared to 2005
• New Hire Rates• Variable Pay
Human Resource AssociationOf the National Capital Area
DC SHRM

Copyright (C) 2006 HRA-NCA 10
Participants• 2006 pay data for 77,568 incumbents in 320 jobs were submitted by 348 participants (compares to 73,296 incumbents and 347 employers in 2005)
2006 HRA Comp Survey Participation by Incumbents Reported (N=77,568)
Financial Services12%
Government8%
Health Care24%
Publishing and Broadcasting
2%
Technology and Science
19%
Telecom, ISP and Network Services
1%
All Others4%
Associations5%
Education7%
Professional Services
11%
Hospitality, Transportation,
Services2%
Manufacturing and Construction
0%
Non Profit5%
28% of incuments reported are Government Contractors, which include employers from several primary-activity groups.
Human Resource AssociationOf the National Capital Area
DC SHRM
Copyright (C) 2006 HRA-NCA 11
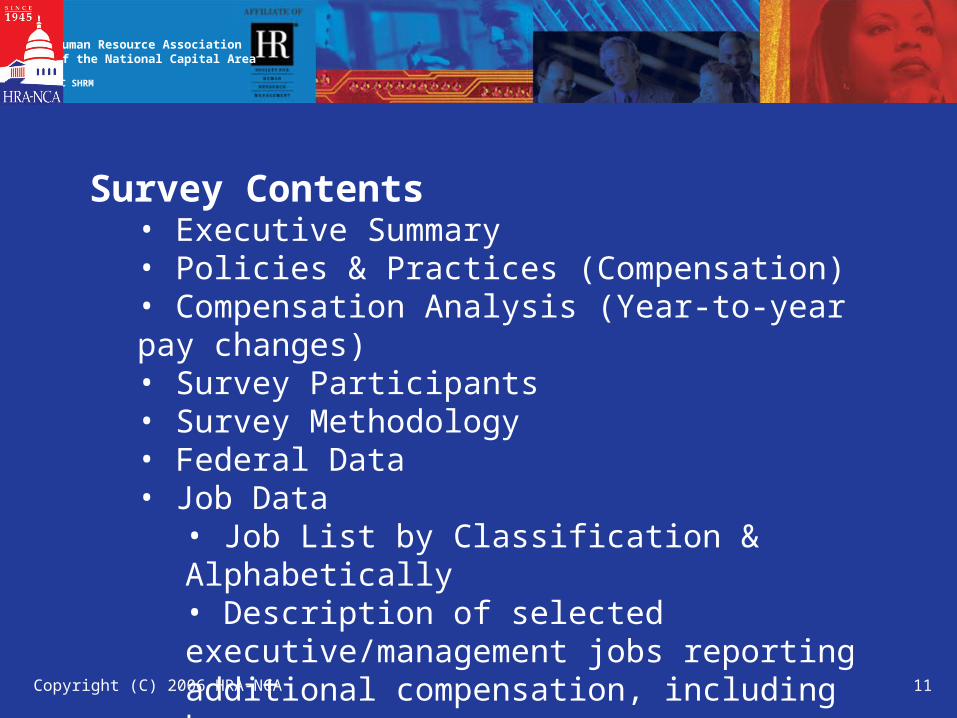
Survey Contents • Executive Summary• Policies & Practices (Compensation)• Compensation Analysis (Year-to-year pay changes)• Survey Participants• Survey Methodology• Federal Data• Job Data
• Job List by Classification & Alphabetically• Description of selected executive/management jobs reporting additional compensation, including bonuses• Executive Jobs listed first
Human Resource AssociationOf the National Capital Area
DC SHRM

Copyright (C) 2006 HRA-NCA 12
Job Data – Information Reported for Each Job• Median salary (50th percentile) is the middle number in an ordered list. Most Compensation professionals use this more often than averages.
• For 2006 survey results, the Average salary (mean) is about 1.4% higher than median (incumbent-weighted); however, it is 8.8% higher for Chief/Exec jobs
• 10th , 25th, 75th, 90th percentiles• Online query will show standard deviation• Employer pay ranges
Human Resource AssociationOf the National Capital Area
DC SHRM

Copyright (C) 2006 HRA-NCA 13
Job Data – Information Reported for Each Job
• New hire rates are reported.
• Year-to-year change is shown for past three years.
• Variable pay data for 23 executive and management jobs were submitted
• FLSA Status
• Security Clearance Status
Human Resource AssociationOf the National Capital Area
DC SHRM

Copyright (C) 2006 HRA-NCA 14
New and Revised Jobs• An executive section was introduced in 2005. This is now found at the beginning of the Job Data• For 2006, a new section called “Program / Project Management” was introduced:
Section
TitleJob #
Focus# ER's / EE's10th P25th P50th P (Median)75th P90th PAverageRange Spread (10th-90thP)
1601Program / Project Manager
Program / Project Mgmt
Manages programs/projects which are moderately complex or are a portion of a larger program.
98.2118.5
Program / Project Mgmt
Program / Project Director1602
Manages relatively large, complex or risk-related
programs/projects.
50 / 551
96.6
158.1117.0
111.3
Program / Project Mgmt
Program / Project Senior Director
1603Has oversight responsibility for
complex and/or high risk programs/projects.
133.8155.0
41 / 336
122.3
98.6
140.0176.0139.6
132.6
62.9 85.4 112.866 / 960
79.5
111% 85% 56%
Human Resource AssociationOf the National Capital Area
DC SHRM
Copyright (C) 2006 HRA-NCA 15
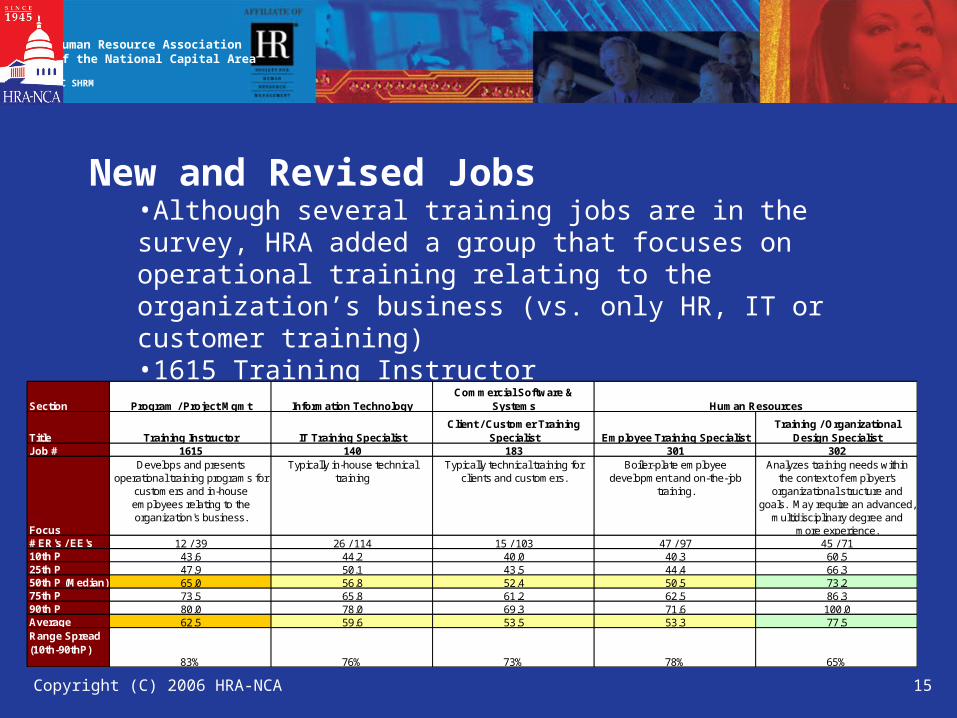
New and Revised Jobs•Although several training jobs are in the survey, HRA added a group that focuses on operational training relating to the organization’s business (vs. only HR, IT or customer training)•1615 Training Instructor•1616 Training Manager
Section
TitleJob #
Focus# ER's / EE's10th P25th P50th P (Median)75th P90th PAverageRange Spread (10th-90thP)
83% 76% 73% 78%
44.4
45 / 71
66.343.6 44.2 40.0 40.3 60.5
62.5
65.869.353.5
Training / Organizational Design Specialist
302Analyzes training needs within
the context of employer's organizational structure and
goals. May require an advanced, multidisciplinary degree and
more experience.
73.286.3100.077.5
65%
Commercial Software & Systems
Client / Customer Training Specialist
183Typically technical training for
clients and customers.
52.461.2
15 / 103
43.5
Information Technology
IT Training Specialist140
Typically in-house technical training
26 / 114
50.1
78.059.6
Boiler-plate employee development and on-the-job
training.
50.562.571.653.3
47 / 97
56.8
Employee Training Specialist301
Human Resources
1615Training Instructor
Program / Project Mgmt
Develops and presents operational training programs for
customers and in-house employees relating to the organization's business.
65.073.5
12 / 39
47.9
80.0
Human Resource AssociationOf the National Capital Area
DC SHRM
Copyright (C) 2006 HRA-NCA 16
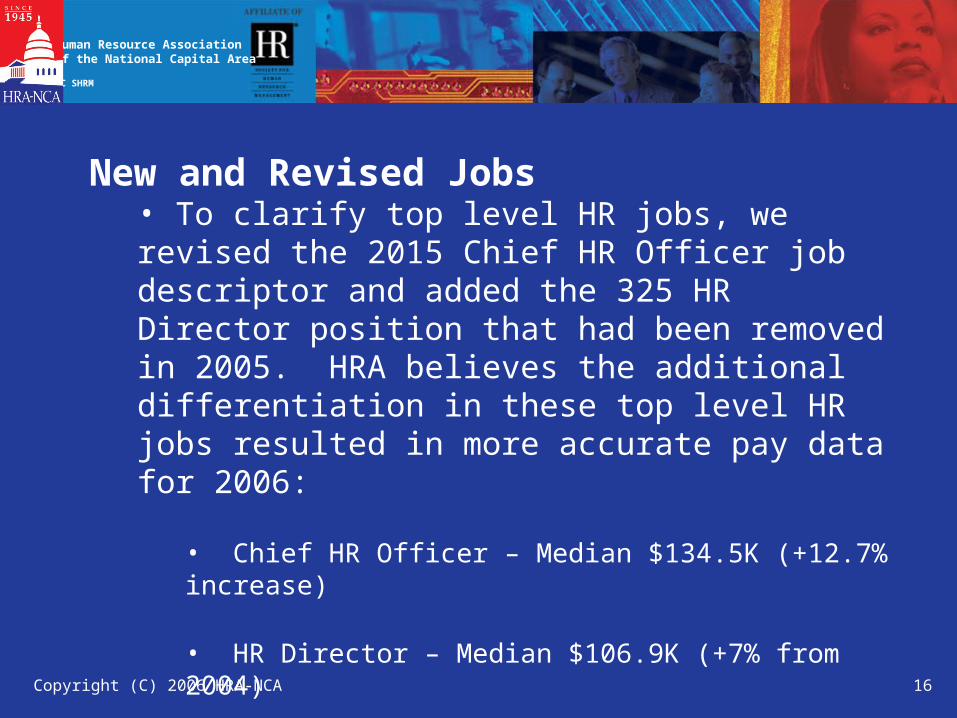
New and Revised Jobs• To clarify top level HR jobs, we revised the 2015 Chief HR Officer job descriptor and added the 325 HR Director position that had been removed in 2005. HRA believes the additional differentiation in these top level HR jobs resulted in more accurate pay data for 2006:
• Chief HR Officer – Median $134.5K (+12.7% increase)
• HR Director – Median $106.9K (+7% from 2004)
Human Resource AssociationOf the National Capital Area
DC SHRM

Copyright (C) 2006 HRA-NCA 17
New and Revised Jobs• Other new jobs added for 2006:
•1610 Program Services Specialist (not-for-profit)
•1611 Program Services Director (not-for-profit)
•1620 Logistics Analyst
•1621 Senior Logistics Analyst
Human Resource AssociationOf the National Capital Area
DC SHRM

Copyright (C) 2006 HRA-NCA 18
Several Year-to-Year Comparisons• Pay increase budgets are shown in Section II, page 2.
• Actual pay increase to employees is shown in Section II, page 5.
• The year-to-year change to the median and average salary of each job is shown in Section IV, page 14.
• Additional analysis of this section follows
Human Resource AssociationOf the National Capital Area
DC SHRM

Copyright (C) 2006 HRA-NCA 19
• Corrections to the Compensation Analysis section, page 3, Summary Index:
• Average rate of change across all jobs is 3.05% (as in table).• Average rate of repeat participants is 3.11% (as in table)• Median rate of change across all jobs is 3.34% (as in table)• Median rate of change among repeat participants is 2.99% (as in table)
• Similar correction to Executive Summary, page 3, Federal Government Pay: Change 4.4% to 3.34%
Year to Year Change to the Median Salary
Human Resource AssociationOf the National Capital Area
DC SHRM

Copyright (C) 2006 HRA-NCA 20
• Incumbent-weighted average change is 3.3%.
News media provide other data including average employee pay,
cost of living, and purchasing power.
Year to Year Change to the Median Salary by Job Classification
Job Group % ChangeProgram/Project Mgmt N/ACustomer Svc & Product Support 14.1%Food Services 12.6%Telecom & Satellite Comm 9.3%Computer Operations & Networks 5.3%Warehousing & Manufacturing 4.9%Accounting, Finance & Purchasing 4.3%Bldg Facilities & Maintenance 3.9%Mgmt Services & Research 3.8%Human Resources 3.6%Banking 3.5%Information Technology 3.5%Secretarial & Clerical 3.3%Legal 3.3%Federal Government 3.1%General Support 2.9%Media & Communications 2.0%Healthcare 1.9%Commercial Software & Systems 1.7%Engineering & Field Svcs 1.4%Media & Communications 1.3%Housekeeping 0.8%Biomedical & Laboratory Svcs 0.3%Marketing & Sales 0.2%Trades, Craft & Labor -0.6%Printing & Binding -7.9%
Human Resource AssociationOf the National Capital Area
DC SHRM

Copyright (C) 2006 HRA-NCA 21
Individual Jobs Compared to 2005(see Section III, page 5)
• Different employer mixes and the number of incumbents reported can skew market reported rates from year to year for a single survey• 80% of HRA jobs have increased/decreased by less than 10%• The remaining 20% of high/low increases should be reviewed more carefully• At the median:
225 jobs went up (195 from 2004-2005).19 stayed the same (16 from 2004-2005).65 went down (70 from 2004-2005).
Human Resource AssociationOf the National Capital Area
DC SHRM

Copyright (C) 2006 HRA-NCA 22
Individual Jobs Compared to 2005(see Section III, page 5)
•High year-to-year increases to the median salary include:
Different employer mix partially accounts for the large increase, but even when analyzing repeat participants, this group as a whole appears to have experienced large pay increases.
Senior Customer Service Rep (54%)Customer Service Reps (36%)
Significantly more incumbents reported in 2006Economist (23%)Client Customer Training Specialist (29%)
Chief Engineering Officer (34%) – Employers reporting down from 22 to 18; *range spread has decreased substantially from 106% to 67% * Range Spread is calculated as (90thP-10thP)/10thP
Human Resource AssociationOf the National Capital Area
DC SHRM
Copyright (C) 2006 HRA-NCA 23
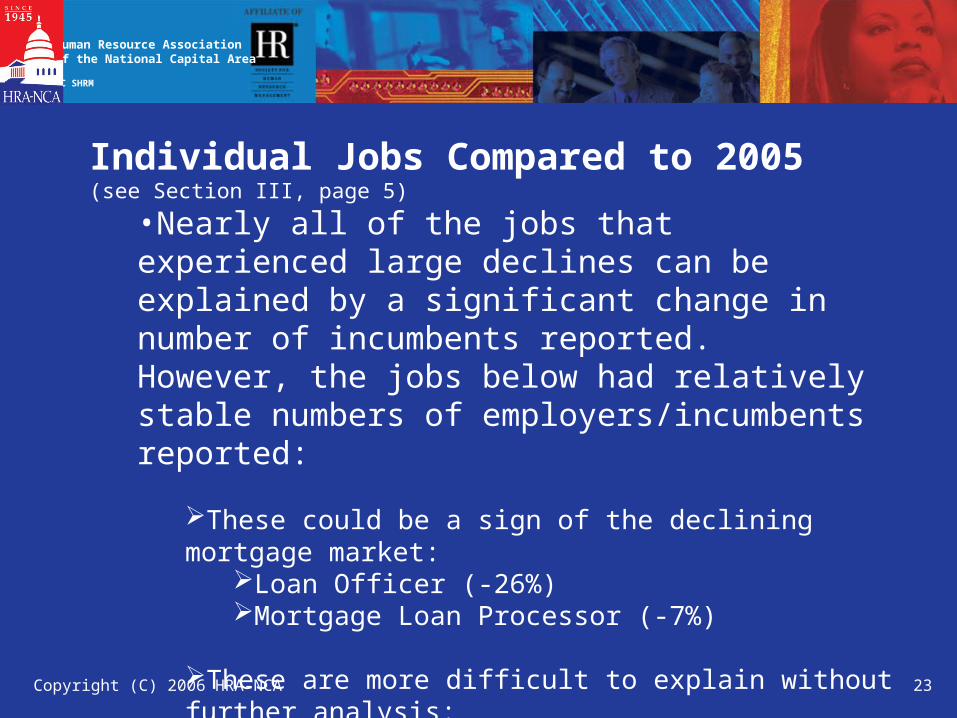
Individual Jobs Compared to 2005(see Section III, page 5)
•Nearly all of the jobs that experienced large declines can be explained by a significant change in number of incumbents reported. However, the jobs below had relatively stable numbers of employers/incumbents reported:
These could be a sign of the declining mortgage market:Loan Officer (-26%)Mortgage Loan Processor (-7%)
These are more difficult to explain without further analysis:General Counsel (-8%)Sales Manager (-5%)
Human Resource AssociationOf the National Capital Area
DC SHRM

Copyright (C) 2006 HRA-NCA 24
New Hire Rates
• New hire rates that were reported by 5 or more employers are listed for 114 jobs• 82% of these jobs have lower new hire rates as compared to the median• The average, median and employer weighted average new hire rate is 93% of the median• However, these jobs (primarily Senior Accounting & Technology) reported especially higher new hire rates as compared to the market median:
Job Code Title
Total Survey
ER's
ERs Reporting New Hire
2006
New Hire ER's as % of Total
ER's
New Hire as % of Median
New Hire as % of
Avg118 IT Project Manager 55 8 15% 115% 113%212 Accountant III 126 11 9% 112% 109%130 Systems Programmer 25 5 20% 112% 112%338 Research Director 40 5 13% 112% 98%355 Security Officer 25 6 24% 111% 110%318 Benefits Specialist 89 9 10% 108% 109%160 Network Security Administrator 46 5 11% 107% 105%220 Senior Budget Analyst 51 6 12% 107% 105%1123 Systems/Electronics Engineer IV 30 7 23% 106% 106%174 Software Developer IV 41 5 12% 105% 104%
Human Resource AssociationOf the National Capital Area
DC SHRM

Copyright (C) 2006 HRA-NCA 25
Variable Pay• Section II (page 7) reports half of participating employers provide incentives and bonuses, similar to last year.
• Variable pay was reported for 26 executive and management jobs with 3017 incumbents.
CEO received 42% of salary; down from 48% last yearAverage award was 28%, up slightly from 27% last yearChief Human Resources Officer received 20% median and 36% average, up significantly from 13% last year due to survey job descriptor revisions.Compensation and Benefits Director received 11% median and 22% average bonus, up significantly from 7% average last year.
Human Resource AssociationOf the National Capital Area
DC SHRM

Copyright (C) 2006 HRA-NCA 26
2006 Compensation Survey
Compensation Policies and Practices
Brian JacksonCompensation, Benefits, and Systems
American Diabetes Association
Human Resource AssociationOf the National Capital Area
DC SHRM

Copyright (C) 2006 HRA-NCA 27
Pay Increase Budgets Referral Bonuses
Pay Increase Practices in 2005 Severance Pay
Non-Cash Performance Awards Employee Turnover
Incentive Cash Compensation Shift Differentials
Stock Options for Non-Executive Staff
On-Call/Standby Pay Practices
Signing Bonuses Security Clearance
Retention and Completion Bonuses
2006 Compensation Policies and Practices Surveyed
Human Resource AssociationOf the National Capital Area
DC SHRM

Copyright (C) 2006 HRA-NCA 28
2006 Compensation Policies and Practices
Section Lay out
• Survey Question Asked
• Summary of Results
• Data displayed in table format
Human Resource AssociationOf the National Capital Area
DC SHRM

Copyright (C) 2006 HRA-NCA 29
2006 Compensation and Policy Practices
Data Cuts• Location
DC, MD, VA and Baltimore
• Full Time Employees
Fewer than 100, 100-499 and 500 or more
• Type of Employer
Government Contractor, Association/Non-Profit and All Others
Human Resource AssociationOf the National Capital Area
DC SHRM
Copyright (C) 2006 HRA-NCA 30
Human Resource AssociationOf the National Capital Area
DC SHRM
Human Resource AssociationOf the National Capital Area
DC SHRM
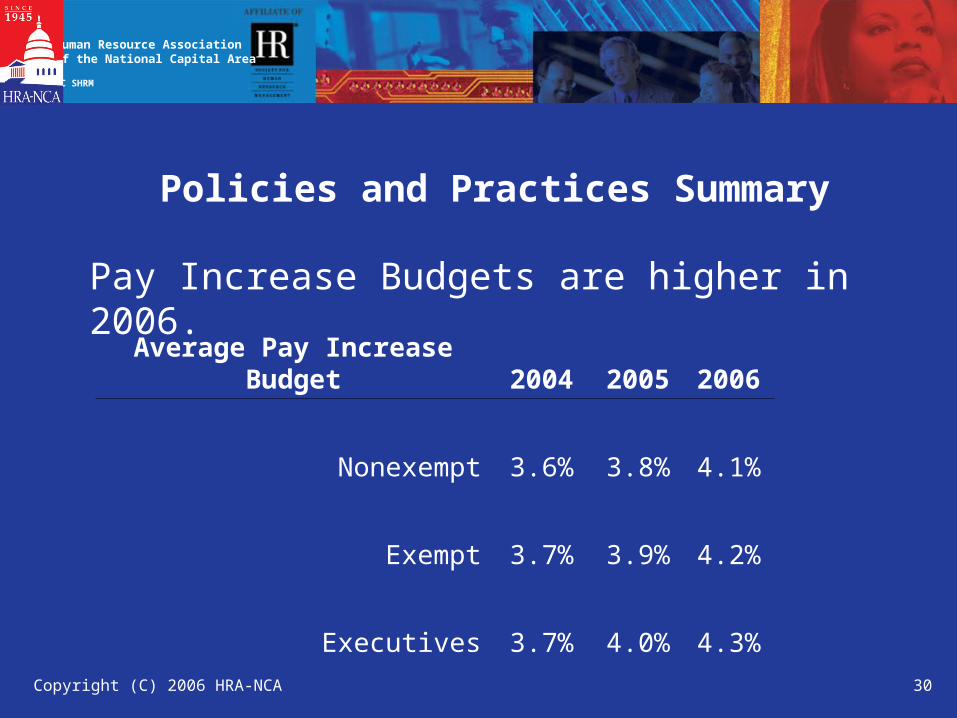
Policies and Practices Summary
Pay Increase Budgets are higher in 2006.
Average Pay Increase Budget 2004 2005 2006
Nonexempt 3.6% 3.8% 4.1%
Exempt 3.7% 3.9% 4.2%
Executives 3.7% 4.0% 4.3%
Human Resource AssociationOf the National Capital Area
DC SHRM

Copyright (C) 2006 HRA-NCA 31
Human Resource AssociationOf the National Capital Area
DC SHRM
Human Resource AssociationOf the National Capital Area
DC SHRM
Policies and Practices Summary
Promotion Increase Budgets are unchanged from 2005.
Average Promotion Budget 2004 2005 2006
1.8% 3.3% 3.4%
Human Resource AssociationOf the National Capital Area
DC SHRM
Copyright (C) 2006 HRA-NCA 32
Human Resource AssociationOf the National Capital Area
DC SHRM
Human Resource AssociationOf the National Capital Area
DC SHRM
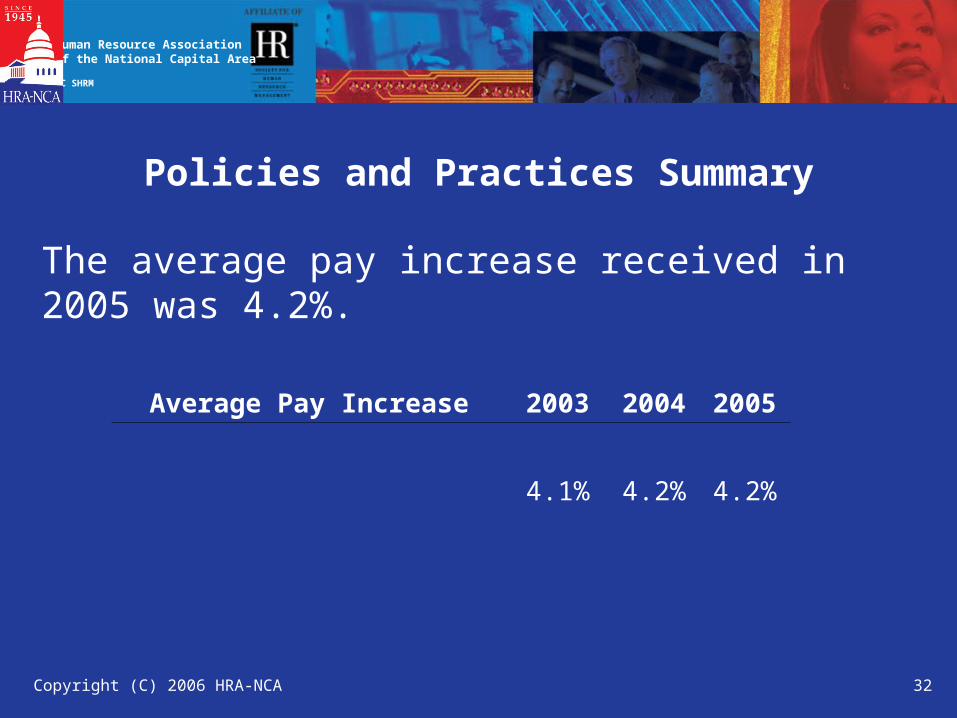
Policies and Practices Summary
The average pay increase received in 2005 was 4.2%.
Average Pay Increase 2003 2004 2005
4.1% 4.2% 4.2%
Human Resource AssociationOf the National Capital Area
DC SHRM
Copyright (C) 2006 HRA-NCA 33
Human Resource AssociationOf the National Capital Area
DC SHRM
Human Resource AssociationOf the National Capital Area
DC SHRM
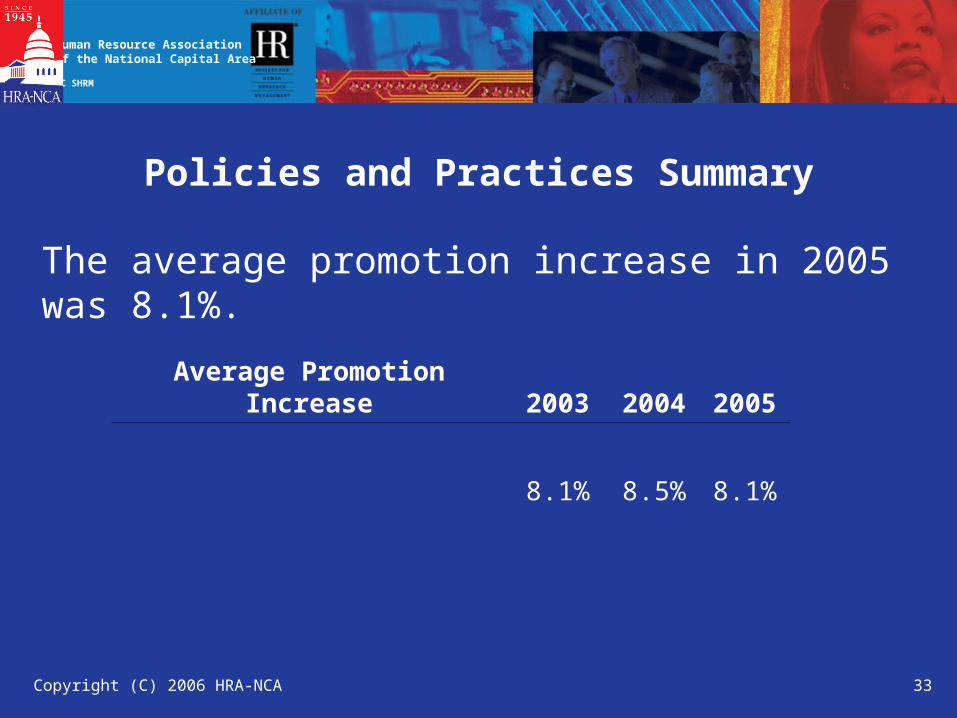
Policies and Practices Summary
The average promotion increase in 2005 was 8.1%.
Average Promotion Increase 2003 2004 2005
8.1% 8.5% 8.1%
Human Resource AssociationOf the National Capital Area
DC SHRM
Copyright (C) 2006 HRA-NCA 34
Human Resource AssociationOf the National Capital Area
DC SHRM
Human Resource AssociationOf the National Capital Area
DC SHRM
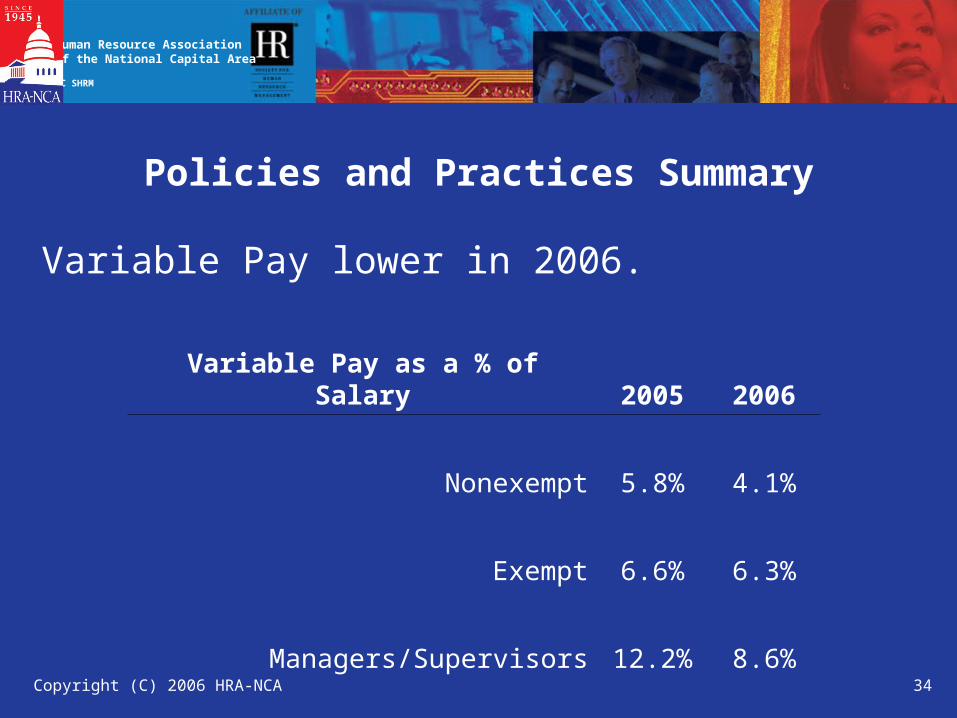
Policies and Practices Summary
Variable Pay lower in 2006.
Variable Pay as a % of Salary 2005 2006
Nonexempt 5.8% 4.1%
Exempt 6.6% 6.3%
Managers/Supervisors 12.2% 8.6%
Human Resource AssociationOf the National Capital Area
DC SHRM
Copyright (C) 2006 HRA-NCA 35
Human Resource AssociationOf the National Capital Area
DC SHRM
Human Resource AssociationOf the National Capital Area
DC SHRM
Policies and Practices Summary
The average signing bonus was almost $5,000.
This represents about 7% of the individual’s pay.
Human Resource AssociationOf the National Capital Area
DC SHRM
Copyright (C) 2006 HRA-NCA 36
Human Resource AssociationOf the National Capital Area
DC SHRM
Human Resource AssociationOf the National Capital Area
DC SHRM
Policies and Practices Summary
Two-thirds of employers offer a referral bonus. In 2005, these range from $500 to $2,000 depending on level of job.
Usually the employer requires the new employee to meet a service requirement before paying the bonus.
Human Resource AssociationOf the National Capital Area
DC SHRM

Copyright (C) 2006 HRA-NCA 37
Human Resource AssociationOf the National Capital Area
DC SHRM
Human Resource AssociationOf the National Capital Area
DC SHRM
Policies and Practices Summary
Twenty percent of employers offered retention or completion bonuses in 2005, up from 16% in 2004.
Average bonus was $4,776 in 2005, up from $3,281 in 2004.
Length of time the employee was obligated to the employer was 11 months in 2005, up from 9 months in 2004.
Human Resource AssociationOf the National Capital Area
DC SHRM
Copyright (C) 2006 HRA-NCA 38
HRA-NCA/PSC PARTNERING The 2006 Government Contractors
Compensation Survey
Alan Chvotkin
Senior Vice President and Counsel
Professional Services Counsel
September 7, 2006
Human Resource AssociationOf the National Capital Area
DC SHRM

Copyright (C) 2006 HRA-NCA 39
2006 GOVERNMENT CONTRACTORS COMPENSATION SURVEY OVERVIEW
• Definition: 50% or more of firm’s revenue derived from government contracts
• 90 organizations reported• 280 jobs reported• 21,705 employee salaries reported• Voluntary responses, but best that exists• Aggregated trends; year-over-year comparisons
Human Resource AssociationOf the National Capital Area
DC SHRM

Copyright (C) 2006 HRA-NCA 40
2006 GOVERNMENT CONTRACTORS COMPENSATION SURVEY TRENDS 2005-2006 Year-over-year changes in median
• 3.3% weighted average increase for all employees • 3.1% weighted average increase for federal govt. pay• 2.5% weighted average increase for govt. contractor pay. • 59 job categories declined in pay; only 169 went up • 0.6% overall pay differential for federal employees ABOVE
government contractor employees; • Government Contractor “EXECUTIVE” pay levels on average
61.3% higher than federal employee counterparts
Human Resource AssociationOf the National Capital Area
DC SHRM

Copyright (C) 2006 HRA-NCA 41
2006 GOVERNMENT CONTRACTORS COMPENSATION SURVEY TRENDS
• Salary changes reflect greater private sector competition for positions tied to federal services spending
• Salary changes reflect expanding contractor workforce at increasingly sophisticated levels to support increasingly sophisticated government customers
• Salary changes may be attributable to greater contractor reliance on technology and less on internal manpower skills for support functions
• Federal salaries reflect changing demographics of their workforce
Human Resource AssociationOf the National Capital Area
DC SHRM
Copyright (C) 2006 HRA-NCA 42
2006 GOVERNMENT CONTRACTORS Security Clearances
• Security Clearance policies surveyed at the organizational level.– 42% provide additional compensation to cleared
personnel– 13% - 22% differential in base pay reported through all
clearance levels (Secret through TS/Poly), in Policies and Practices section.
– As new data is added year after year, more precise breakdowns will be possible.
Human Resource AssociationOf the National Capital Area
DC SHRM
Copyright (C) 2006 HRA-NCA 43
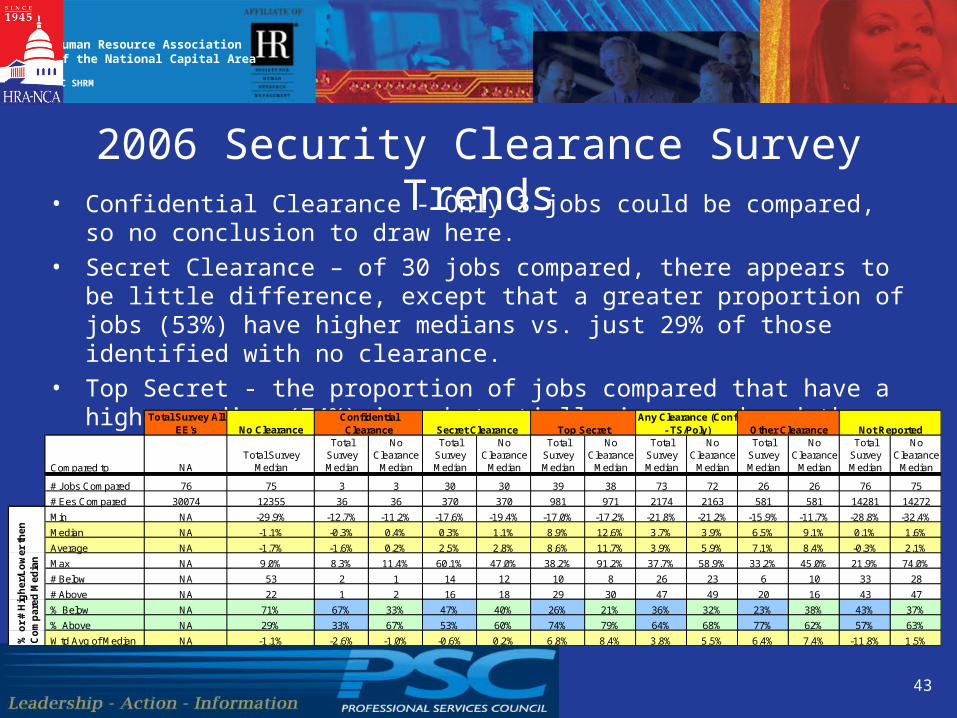
• Confidential Clearance - Only 3 jobs could be compared, so no conclusion to draw here.
• Secret Clearance – of 30 jobs compared, there appears to be little difference, except that a greater proportion of jobs (53%) have higher medians vs. just 29% of those identified with no clearance.
• Top Secret - the proportion of jobs compared that have a higher median (74%) is substantially increased and the implied premium is between 7-12%
2006 Security Clearance Survey Trends
Total Survey All EE's No Clearance
Compared to NATotal Survey
Median
Total Survey Median
No Clearance
Median
Total Survey Median
No Clearance
Median
Total Survey Median
No Clearance
Median
Total Survey Median
No Clearance
Median
Total Survey Median
No Clearance
Median
Total Survey Median
No Clearance
Median
# Jobs Compared 76 75 3 3 30 30 39 38 73 72 26 26 76 75
# Ees Compared 30074 12355 36 36 370 370 981 971 2174 2163 581 581 14281 14272
Min NA -29.9% -12.7% -11.2% -17.6% -19.4% -17.0% -17.2% -21.8% -21.2% -15.9% -11.7% -28.8% -32.4%
Median NA -1.1% -0.3% 0.4% 0.3% 1.1% 8.9% 12.6% 3.7% 3.9% 6.5% 9.1% 0.1% 1.6%
Average NA -1.7% -1.6% 0.2% 2.5% 2.8% 8.6% 11.7% 3.9% 5.9% 7.1% 8.4% -0.3% 2.1%
Max NA 9.0% 8.3% 11.4% 60.1% 47.0% 38.2% 91.2% 37.7% 58.9% 33.2% 45.0% 21.9% 74.0%
# Below NA 53 2 1 14 12 10 8 26 23 6 10 33 28
# Above NA 22 1 2 16 18 29 30 47 49 20 16 43 47
% Below NA 71% 67% 33% 47% 40% 26% 21% 36% 32% 23% 38% 43% 37%
% Above NA 29% 33% 67% 53% 60% 74% 79% 64% 68% 77% 62% 57% 63%
Wtd Avg of Median NA -1.1% -2.6% -1.0% -0.6% 0.2% 6.8% 8.4% 3.8% 5.5% 6.4% 7.4% -11.8% 1.5%
Not ReportedSecret Clearance Top SecretAny Clearance (Conf
- TS/Poly) Other ClearanceConfidential Clearance
% o
r #
Hig
her
/Lo
wer
th
en
C
om
par
ed M
edia
nHuman Resource AssociationOf the National Capital Area
DC SHRM

Copyright (C) 2006 HRA-NCA 44
• Any Clearance (Confidential – TS/Poly) – There is an implied premium of approximately 3.7-6%
• Other Clearance – This is an interesting category as we do not know what kind of clearances are represented. But notice that a high proportion of jobs compared had higher median salaries and the implied premium of 6.4-9%
• Not Reported – Incumbent salaries for which we don’t know clearance status were either somewhat lower or demonstrate no significant difference from the total survey
2006 Security Clearance Survey Trends
Total Survey All EE's No Clearance
Compared to NATotal Survey
Median
Total Survey Median
No Clearance
Median
Total Survey Median
No Clearance
Median
Total Survey Median
No Clearance
Median
Total Survey Median
No Clearance
Median
Total Survey Median
No Clearance
Median
Total Survey Median
No Clearance
Median
# Jobs Compared 76 75 3 3 30 30 39 38 73 72 26 26 76 75
# Ees Compared 30074 12355 36 36 370 370 981 971 2174 2163 581 581 14281 14272
Min NA -29.9% -12.7% -11.2% -17.6% -19.4% -17.0% -17.2% -21.8% -21.2% -15.9% -11.7% -28.8% -32.4%
Median NA -1.1% -0.3% 0.4% 0.3% 1.1% 8.9% 12.6% 3.7% 3.9% 6.5% 9.1% 0.1% 1.6%
Average NA -1.7% -1.6% 0.2% 2.5% 2.8% 8.6% 11.7% 3.9% 5.9% 7.1% 8.4% -0.3% 2.1%
Max NA 9.0% 8.3% 11.4% 60.1% 47.0% 38.2% 91.2% 37.7% 58.9% 33.2% 45.0% 21.9% 74.0%
# Below NA 53 2 1 14 12 10 8 26 23 6 10 33 28
# Above NA 22 1 2 16 18 29 30 47 49 20 16 43 47
% Below NA 71% 67% 33% 47% 40% 26% 21% 36% 32% 23% 38% 43% 37%
% Above NA 29% 33% 67% 53% 60% 74% 79% 64% 68% 77% 62% 57% 63%
Wtd Avg of Median NA -1.1% -2.6% -1.0% -0.6% 0.2% 6.8% 8.4% 3.8% 5.5% 6.4% 7.4% -11.8% 1.5%
Not ReportedSecret Clearance Top SecretAny Clearance (Conf
- TS/Poly) Other ClearanceConfidential Clearance
% o
r #
Hig
her
/Lo
wer
th
en
C
om
par
ed M
edia
nHuman Resource AssociationOf the National Capital Area
DC SHRM

Copyright (C) 2006 HRA-NCA 45
Human Resource AssociationOf the National Capital Area
DC SHRM
2006 Security Clearance Survey Trends
• Further analysis shows that some jobs with security clearances consistently have higher pay rates than others, when looking at a number of parameters:– Number of respondents– Number of employees– Level of clearance– Type and level of job
• Trends – Higher pay is evident in:– Highest levels in job family (Senior-level jobs)– Highest security levels (TS vs. Confidential or Secret)

Copyright (C) 2006 HRA-NCA 46
124 Analyst/Developer V
151 Senior PC/Network Support Specialist
220 Senior Budget Analyst
236 Contracts Director
323 Senior HR Generalist/HR Manager
355 Security Officer
436 Security Guard I (Unarmed)
502 Receptionist
512 Administrative Assistant/Secretary II
513 Administrative Assistant/Secretary III
613 Senior Technical Writer/Editor
1062 Senior Network Systems Engineer
1601 Program/Project Manager
Human Resource AssociationOf the National Capital Area
DC SHRM
2006 Security Clearance Survey Trends
List on the right shows the jobs with the strongest differential

Copyright (C) 2006 HRA-NCA 47
FUTURE INITIATIVES
• 2007 survey, further study of pay differential for government security clearances
• Implications of BRAC for both federal and contractor employees
Human Resource AssociationOf the National Capital Area
DC SHRM
Copyright (C) 2006 HRA-NCA 48
2006 Compensation Survey
Online Survey Query Tool
Angelo KostopoulosAKRON, Inc.
Human Resource AssociationOf the National Capital Area
DC SHRM

Copyright (C) 2006 HRA-NCA 49
Contact Information
Human Resource AssociationOf the National Capital Area
DC SHRM
Doug LwinCompensation, Benefits, and HR SystemsFriedman Billings & [email protected](703) 469-1314
Cara CarterCompensation ConsultantWatson [email protected](703) 258-8127
Alan Chvotkin, Esq.Senior Vice President and CounselProfessional Services Counsel(703) [email protected]
Brian W. JacksonAmerican Diabetes Association(703) [email protected]
Angelo KostopoulosAKRON, Inc.(202) [email protected]