copyright by dong hyun kim 2019
TRANSCRIPT

Copyright
by
Dong Hyun Kim
2019

The Thesis Committee for Dong Hyun Kim Certifies that this is the approved version of the following Thesis:
Economic Analysis and Risk Management for the South Sumatra
Natural Gas Pipeline Project in Indonesia
APPROVED BY
SUPERVISING COMMITTEE:
David J. Eaton, Supervisor
Richard J. Chuchla
Patrick L. Brockett
Economic Analysis and Risk Management for the South Sumatra
Natural Gas Pipeline Project in Indonesia
by
Dong Hyun Kim
Thesis
Presented to the Faculty of the Graduate School of
The University of Texas at Austin
in Partial Fulfillment
of the Requirements
for the Degree of
Master of Science in Energy and Earth Resources
The University of Texas at Austin
May 2019

Dedication
To my devoted wife, Ji Young Kim,
and lovely sons, Jeong Yoon Kim and Chae Yoon Kim.

v
Acknowledgements
I would like to express my gratefulness to the members of my thesis committee:
David Eaton, for his excellent observations and encouragement that enabled me to
complete my research; Richard Chuchla for his in-depth knowledge and experience in
energy industry; and Patrick Brockett for the incredible time in spite of his busy schedule.
My heartfelt thanks go as well to Korea Gas Corporation for giving me a great
opportunity to study in the University of Texas at Austin and to the Mount Fuji Cell in
Evergreen Church for devoting themselves to my family with love and prayers.
I am deeply indebted to my lovely wife for her entirely devotion that enabled me
to concentrate on the master program for two years and to my sons who made me happy
and positive in any circumstances. I also thank my parents, parents-in-law, my younger
sister, and all my family for their prayers and unconditional love.
Above all, I am thankful to God for His guidance and help for me to finish the
master program in the University of Texas at Austin by providing several helpers and
wisdom in any circumstances.

vi
Abstract
Economic Analysis and Risk Management for the South Sumatra
Natural Gas Pipeline Project in Indonesia
Dong Hyun Kim, M.S.E.E.R.
The University of Texas at Austin, 2019
Supervisor: David J. Eaton
The objective of this thesis is to analyze economic and risk factors for the South
Sumatra Natural Gas Pipeline Project in Indonesia. The economic analysis aims to
support Korea Gas Corporation (KOGAS)’s decision regarding next steps, such as a
feasibility study or front end engineering design for the project. In scenario analysis,
WACC ought to be less than 9 percent and the growth rate of gas demand is larger than 3
percent to meet KOGAS’s requirements for an investment. Monte Carlo simulation
showed that the project has a project NPV of 90 million USD and project IRR of 11
percent on Scenario 1 which is the least profitable scenario. It means that this project
could be a viable project for KOGAS, but there is a 36 percent probability that the project
IRR would be less than KOGAS’ investment threshold. A sensitivity analysis indicates
that a toll fee has the greatest impact on the project IRR among six variables. This thesis
establishes mitigation strategies against the South Sumatra Natural Gas Pipeline Project’s
significant risks.

vii
Table of Contents
List of Tables ..................................................................................................................... ix
List of Figures .................................................................................................................... xi
Chapter 1: Introduction ........................................................................................................1
1.1 Background ...........................................................................................................1
1.2 Objectives of Thesis..............................................................................................2
Chapter 2: Natural Gas Industry and Regulations for Transportation Business ..................5
Chapter 3: The Introduction of the South Sumatra Natural Gas Pipeline Project .............10
3.1 Background of the Project ..................................................................................10
3.2 Revenues through Transportation Business ........................................................14
3.3 Roles of KOGAS for the Project ........................................................................15
Chapter 4: Gas Demand and Supply Analysis ...................................................................17
4.1 Gas Demand for Tanjung Api-Api (TAA) Special Economic Zone (SEZ) .......17
4.1.1 Maximum Gas Demand for Electricity ................................................17
4.1.2 Maximum Gas Demand for Industrial as a Feedstock .........................20
4.1.3 Gas Pipeline Capacity Analysis ...........................................................22
4.1.4 Adjustment of Gas Demands ...............................................................25
4.2 Supply Analysis ..................................................................................................28
4.2.1 Corridor Block PSC .............................................................................28
4.2.2 Jambi Merang Block ............................................................................30
4.2.3 Available Gas Resource for the South Sumatra Natural Gas
Pipeline Project ....................................................................................30

viii
Chapter 5: Economic Analysis...........................................................................................33
5.1 Discount Rate ......................................................................................................33
5.2 Revenues .............................................................................................................36
5.3 Project Costs .......................................................................................................37
5.4 Discounted Cash Flow Valuation .......................................................................46
5.5 Monte Carlo Simulation......................................................................................49
5.6 Sensitivity Analysis ............................................................................................55
Chapter 6: Risk Management.............................................................................................57
6.1 Risk in Infrastructure Projects ............................................................................57
6.1.1 Risk Management ................................................................................57
6.1.2 Public-Private Partnership ...................................................................58
6.1.3 General Risks in Infrastructure Projects ..............................................59
6.1.4 Project Risks in Infrastructure Projects................................................60
6.2 Risk Management of the South Sumatra Natural Gas Pipeline Project ..............62
6.2.1 General Risks and Mitigation Strategies..............................................62
6.2.2 Project Risks and Mitigation Strategies ...............................................65
Chapter 7: Conclusion........................................................................................................71
Bibliography ......................................................................................................................73
ix
List of Tables
Table 1: Stages of Analysis..................................................................................................3
Table 2: Target of Energy Resource Mix ............................................................................5
Table 3: Investment Opportunity in Tanjung Api-Api ......................................................11
Table 4: Estimated TAA SEZ Electricity Demand ............................................................18
Table 5: Variables for the Natural Gas Volume ................................................................19
Table 6: The Expected Production .....................................................................................20
Table 7: The Maximum Gas Demands for Industries in the TAA SEZ ............................22
Table 8: Variables for the Outlet Pressure (P2) of the Grissik-Pusri Pipeline .................24
Table 9: Variables for the Flow Rate (Qb) of the KOGAS-PDPDE Pipeline ..................24
Table 10: The Adjusted Maximum Gas Demand to Meet Flow Rate ...............................26
Table 11: Scenarios for Total Gas Demands for 30 Years ................................................26
Table 12: Production of the Corridor PSC from 2018 to 2023 ..........................................29
Table 13: Production of the Corridor PSC since 2023 ......................................................30
Table 14: The Result of the Supply Analysis ....................................................................31
Table 15: U.S. Natural Gas Pipeline Onshore Construction Costs for 10 years ................40
Table 16: U.S. per Inch-Meter Unit Pipeline Cost for 10 Years........................................41
Table 17: Mean Unit Cost of Each Component by Shares ................................................42
Table 18: Estimation of a Multiplier for the Labor Cost ...................................................42
Table 19: Ratio of the Import to Total Consumption of Steel in 2017 ..............................43
Table 20: Estimation of a Multiplier for the Material Cost ...............................................44
Table 21: Estimation of a Multiplier for the Miscellaneous Cost ......................................44
Table 22: Mean Unit Cost of the South Sumatra Pipeline Project ....................................45
Table 23: Factors for the Calculation of NPV and IRR .....................................................47
x
Table 24: Result of NPV and IRR from Cash Flows .........................................................48
Table 25: Estimation of Project NPV and Project IRR......................................................49
Table 26: Value Drivers Using a Probability Distribution for a Monte Carlo
Simulation .........................................................................................................51
Table 27: Project Risks and Mitigation Strategies in Development Phase ........................67
Table 28: Project Risks and Mitigation Strategies in Construction Phase .........................69
Table 29: Project Risks and Mitigation Strategies in Operation Phase .............................70

xi
List of Figures
Figure 1: Natural Gas Infrastructure Map of Indonesia .......................................................6
Figure 2: Indonesia’s Gas Supply-Demand Gap .................................................................7
Figure 3: Special Economic Zones in Indonesia................................................................10
Figure 4: Maps of the South Sumatra Natural Gas Pipeline Project ..................................13
Figure 5: Gas Business System in Indonesia .....................................................................14
Figure 6: Anticipated Roles of Participants .......................................................................15
Figure 7: The Annual Gas Demand by Scenarios ..............................................................27
Figure 8: The Annual Revenue by Scenarios ....................................................................37
Figure 9: Simulation Output for the Mean Value of Project NPV ....................................52
Figure 10: Simulation Output for the Probability of Project NPV ....................................53
Figure 11: Simulation Output for the Mean Value of Project IRR ....................................54
Figure 12: Simulation Output for the Probability of Project IRR ......................................54
Figure 13: Result of the Sensitivity Analysis of the Project IRR ......................................55
Figure 14: UN Global Compact Management Model ........................................................64

1
Chapter 1: Introduction
1.1 BACKGROUND
The world economy is expected to almost double over the next 20 years, which
will increase the need for energy, even if the extent of the added demand will be
mitigated by a decrease in energy intensity [1]. One estimate is that world energy
consumption could increase from 575 quadrillion British thermal units (BTU) in 2015 to
736 quadrillion BTU by 2040, or a 28 percent increase [2]. Natural gas, the world’s
fastest growing fossil fuel, has increased by 1.4 percent per annum (p.a.), compared with
petroleum’s 0.7 percent p.a. growth and virtually no growth in coal use [2]. Increased
natural gas demand could create energy business opportunities.
As the world’s eighth-largest energy consumer in 2017, South Korea relies on
imports to meet about 98 percent of its fossil fuel consumption due to insufficient
domestic resources [3]. To secure Korean energy resources, the Korea Gas Corporation
(KOGAS), a state-owned company, participates in upstream to downstream natural gas
and oil business through potential projects in promising countries. KOGAS’ participation
in diverse projects not only enables Korean private companies to join such projects for
shared growth, but also strengthens capabilities to implement many types of energy
projects.
Indonesia represents a promising nation for KOGAS, as it already is one of the
world’s large LNG exporters. Indonesia has been experiencing dramatic changes due to
an abrupt increase in natural gas consumption with its rapid economic growth [4]. The
consumption of natural gas in Indonesia may reach 54.37 billion cubic meters (BCM) in
2035, a 66 percent increase compared with the 2018 consumption of 32.69 BCM [5].

2
This large additional gas demand will require additional gas infrastructures such as LNG
plants and gas transportation facilities. Indonesia welcomes international company
investments in those facilities [4]. To attract foreign investment, the Indonesian
government is reforming its energy sector to address regulatory burdens and lack of legal
transparency [6].
KOGAS has participated in the Senoro-Tolli production and the Donggi Senoro
LNG (DSLNG) liquefaction projects in Indonesia since 2011. KOGAS has been
discussing the development of a South Sumatra Natural Gas Pipeline Project with a local
Indonesian company. According to the State of South Sumatra, the rapid urbanization and
industrial growth in South Sumatra could create significant energy demand, especially in
Tanjung Api-Api (TAA), which has been designated as a Special Economic Zone (SEZ)
by the Government Regulation number 51 of 2014 (No. 51/2014) [7]. Prior to further
steps, which would include a feasibility study (FS) or front end engineering design
(FEED), KOGAS intends to research a proposed South Sumatra Natural Gas Pipeline
Project.
1.2 OBJECTIVES OF THESIS
During the visit of Indonesian President Joko Widodo to Korea in 2016, KOGAS
signed a memorandum of understanding (MOU) with an Indonesian company for the
South Sumatra Natural Gas Pipeline Project. In this MOU, KOGAS agreed to conduct a
feasibility study to decide whether or not to proceed further.
According to KOGAS’s administrative guidelines, a feasibility study prior to
FEED needs the approval of an internal committee. Before a feasibility study, KOGAS
prefers undertake a prefeasibility study to analyze the economic viability of the project,

3
assess risks which might occur during the project period, and establish a strategy to
execute the pipeline project successfully. This thesis performs such an economic analysis,
based on an anticipated natural gas demand and estimated project cost including capital
expenditures (CAPEX) and operating expenses (OPEX). This thesis also calculates a net
present value (NPV) and internal rate of return (IRR) to evaluate whether the project can
meet a minimum 10 percent IRR required by KOGAS for an investment. As indicated in
Table 1, it identifies significant risks and establishes mitigation strategies (see Table 1).
Table 1: Stages of Analysis
No Stages
1 Estimation of natural gas demands from electricity and industry needs in gas supply points
2 Analysis of the gas pipeline capacity for the gas flow
3 Analysis of the availability of natural gas sourcing from gas fields based on estimated gas demands
4 Calculation of the expected revenues with an assumed toll fee and estimated gas demands
5 Calculation of the CAPEX and OPEX by using historical data and literature review
6 Economic analysis to calculate NPV and IRR from a future cash flow using @Risk software
7 Sensitivity analysis to find the most risky variables
8 Identification of significant risks and establish mitigation strategies
(Source: developed by Kim, D.H.)

4
Chapter 2 accounts for natural gas industry of Indonesia and regulations for a
transportation business of South Sumatra Natural Gas Pipeline Project. Chapter 3 is an
overview of the project, including an introduction of a Special Economic Zone in
Tanjung Api-Api and an explanation about how to create revenues in a transportation
business. Chapter 4 develops a method to forecast gas demands and assess the availability
of gas supply from gas fields. Chapter 5 estimates project’s economic viability by
calculating the net present value and internal rate of return based on its discounted future
cash flow. Chapter 6 discusses a risk management to minimize risks and maintain a stable
operation of the project. The risk management identifies project’s significant risks and
establishes mitigation strategies. Chapter 7 summarizes the result of the economic
analysis and risk assessment, and it also suggests recommendations for KOGAS’ further
steps.

5
Chapter 2: Natural Gas Industry and Regulations for Transportation Business
After its economic recession in 1998, Indonesia has increased the consumption of
natural gas at an annual growth rate of 7 percent [8]. Among available energy resources
(oil, natural gas, coal, biomass, or other renewable sources), oil consumption has
accounted for the highest portion of Indonesia’s recent energy mix at 38 percent in 2013
[6]. The reliance on oil creates a challenge to the Indonesian economy because it has
become an importer rather than exporter of energy.
The Indonesian government planned to reduce by 2025 its oil consumption
portfolio to a 25 percent maximum share, while raising the coal and natural gas portions
to at least 30 percent and 22 percent, respectively, under its 2014 Energy Law [6] (see
Table 2). The goal for natural gas use is for it to increase by at least 24 percent by 2050.
Table 2 lists the target based on the National Energy Policy goals for a more sustainable
energy resources mix by 2025 and 2050 target dates [9].
Table 2: Target of Energy Resource Mix
Energy Source 2025 2050
New and renewable energy minimum 23% minimum 31%
Crude oil less than 25% less than 20%
Coal minimum 30% minimum 25%
Natural gas minimum 22% minimum 24% (Source: Table in page 28 from [9])
As demand for domestic gas has grown since 2013, the amount of natural gas
available for export has fallen [4]. In 2005, Indonesia was the world’s largest exporter of
LNG. By 2016, Indonesia fell to the world’s fifth largest exporter [9]. Although

6
Indonesia is ranked tenth in terms of global gas production with proven reserves
(estimated in 2016) of 102 trillion cubic feet (TCF), insufficient investment and the lack
of gas infrastructure inhibit the natural gas sector from reaching its full potential [9].
One of the barriers to increasing domestic gas use and exports is Indonesia’s
limited gas pipeline network. Indonesia has a combined pipeline transmission and
distribution network of a total length of approximately 8,363 kilometers (km), including
4,336 km of transmission networks [4]. Indonesia’s natural gas pipeline network consists
of a number of fragmented point-to-point grid systems [10] (see Fig. 1). Domestic
distribution infrastructure is almost non-existent outside of west Java and south Sumatra.
Gas reserves are far from populations that need gas. Moving gas is complex because
Indonesia consists of more than 17,000 islands. For natural gas to be useful as a fuel for a
sustainable national economy, a pipeline network ought to be developed widely [4].
Figure 1: Natural Gas Infrastructure Map of Indonesia
(Source: based on the figure in page 22 from [10])

7
PT Peruahaan Gas Negara (PGN), an Indonesian national gas company, estimated
Indonesia’s gas demand and supply to 2025 in accordance with GDP growth using two
alternative scenarios, a 5.6 percent GDP growth and a 7 percent GDP growth rate [4].
PGN concluded that the gas supply will not be able to meet the gas demands in either
scenario (see Fig. 2).
Figure 2: Indonesia’s Gas Supply-Demand Gap
(a) Scenario of 5.6 % GDP growth
(a) Scenario of 7 % GDP growth
(Source: Figure 10 from [4])

8
Even in the scenario of 5.6 percent GDP growth, total gas demand is not satisfied
with the sum of contracted, planned, and potential supplies. Indonesia will require gas
imports of approximately 4,000 million standard cubic feet per day (MMSCFD) in 2025,
which would be equivalent to 48 percent of Indonesia’s total gas demand [4]. In the
scenario of 7 percent GDP growth, the gap between supply and gas demand is larger than
the scenario of 5.6 percent GDP growth.
Indonesia could reduce the gap between gas supply and demand by accelerating
local new gas field development and expanding its gas infrastructure including natural
gas pipelines and LNG plants. One option for enhancing natural gas supply is the so-
called the South Sumatra Nature Gas Pipeline Project. KOGAS and PDPDE (hereafter
referred to as a KOGAS-PDPDE), an Indonesian incorporated entity, are seeking to
generate revenues through gas transportation, which is classified as a downstream activity
under Indonesia’s regulation of Energy Law. Indonesia’s oil and gas sector is governed
by Law No.22 of 2001 that differentiates upstream business activities from downstream
activities. Controlled by SKK MIGAS (Special Task Force for Upstream Oil and Gas
Business Activities), upstream business activities include exploration and exploitation.
Downstream activities, such as processing, transmission, distribution, storage, and
trading, fall under Government Regulation No.36/2004 as last amended by No.30/2009
[11].
The Downstream Oil and Gas Regulatory Agency, BPH MIGAS, is responsible
for regulating, developing and supervising downstream activities. Downstream
businesses are required to operate through an Indonesian incorporated entity, which must
acquire a business license issued by the Ministry of Energy and Mineral Resource
(MEMR) with an advice from BPH MIGAS [9]. Therefore, to operate KOGAS-PDPDE
entity must acquire a transportation license that will be issued via two stages [9]. There is

9
a temporary license for a maximum period of five years during which an Indonesian
incorporated entity prepares the facilities and infrastructure of the business. A permanent
operating license can be granted, once an Indonesian incorporated entity is ready for
operation. KOGAS-PDPDE must also obtain Special Rights from MEMR in order to
transport gas by pipeline within the stipulated transmission and distribution routes [12].
The transportation business license must comply with a national gas transmission
and distribution network master plan. It also has to provide an opportunity for other
parties to share pipelines and other facilities used for gas transportation known as the
open access policy [9]. The Indonesian government has adopted an open access policy for
storage and distribution facilities of oil based fuels and natural gas to increase domestic
demand of natural gas, increase usage of natural gas transportation facilities, and
guarantee a fair opportunity to all gas traders [13]. The open access policy, based on the
Oil and Gas Law No.22/2001 and Government Regulation No.36/2004, might affect the
South Sumatra Natural Gas Pipeline Project, as it can be connected with an existing gas
pipeline in south Palembang, and third parties can tie gas pipelines to the KOGAS-
PDPDE pipelines. Under Indonesian law, BPH MIGAS is also responsible for
determination of natural gas pipeline transmission and prices, so KOGAS-PDPDE is
required to negotiate transmission tariffs and prices with BPH MIGAS [9].
Next chapter accounts for the introduction and importance of the South Sumatra
Natural Gas Pipeline Project to contribute to enhance Indonesia natural gas supply under
the open access policy. It also describes how to create revenues from a transportation
business under the supervision of BPH MIGAS.

10
Chapter 3: The Introduction of the South Sumatra Natural Gas Pipeline Project
3.1 BACKGROUND OF THE PROJECT
In 2014, the President of the Republic of Indonesia designated Tanjung Api-Api
(TAA) as a Special Economic Zone (SEZ) in accordance with the Government
Regulation of No. 51/2014 [14]. It is one of eleven SEZs in Indonesia and the only one in
South Sumatra. An Indonesia SEZ is a region within a province that has a special
authority to access global markets. The SEZs are open to foreign investment and offer
investors access to preferential regulatory infrastructure and taxation in an attempt to
channel investment into specific locations [15].
The SEZs seek to increase the economic potential of industrial activities as well
as material export and import. Tanjung Api-Api SEZ is located in Bayuasin district,
which is 80 km from the city of Palembang of South Sumatra (see Fig. 3).
Figure 3: Special Economic Zones in Indonesia
(Source: based on the figure in page 24 from [16])

11
Sudirman, Indonesia’s Minister of Energy and Mineral Resources, has described
the TAA as follows: “Tanjung Api-Api will have an integrated energy industry from
upstream to downstream sector including coal gasification, coal liquefaction, power
plant, fertilizer factory, cement factory, tire factory, CPO processing facility, oil refinery,
and petrochemical downstream industry [17].” Table 3 lists some of the TAA SEZ
investment opportunities.
Table 3: Investment Opportunity in Tanjung Api-Api
Logistics Zone Industrial Zone Energy Zone
Warehousing Palm Oil Industry Petrochemicals
Trade Center Rubber Industry Oil Refinery
Open Storage Yard Pulp and Paper Industry Coal Fuel Station Wood and Cork Industry Power Plants
Clean Water Treatment Plant Food Processing Industry
Waste Water Treatment Plant Cement Industry
Public Transport Station Fertilizer Industry
Small and Medium Industry (Source: Republic of Indonesia National Council for Special Economic Zone, 2018, Investment Opportunity in Tanjung Api-Api, http://kek.go.id/tanjung-api-api, examined 25 Jul. 2018)
The expected growth in urbanization and industrialization that Sudirman predicts
would create significant energy demand within the TAA SEZ. To meet the regional
energy demand market, KOGAS and Perusahaan Daerah Pertambangan dan Energi
(PDPDE), a South Sumatra-owned company, signed a memorandum of understanding
(MOU) in 2016 to conduct a feasibility study and to assign participant’s roles for
implementing the South Sumatra Natural Gas Pipeline Project [18].

12
The project plans to build a 74 km long gas pipeline with a diameter of 20 inches
from PT Pupuk Sriwidjaja Palembang (Pusri) plant in Palembang city to TAA SEZ (see
Fig. 4). The pipeline will tap into an existing natural gas pipeline, which has a diameter
of 20 inches and stretches 176 km from the ConocoPhillips’ gas plant in Grissik to a
Pusri plant in Palembang City to supply gas for energy and raw materials. As a national
fertilizer producer, Pusri has engaged its business operation with the main purpose to
perform and support the government’s policies and programs in the economic and
national development sector in fertilizer and agriculture industries.
As of 2018, however, the South Sumatra Natural Gas Pipeline Project is pending
due to an uncertain gas demand, the delay of development of TAA SEZ, and the current
master plan which includes a coal-fired power plant. If BPH MIGAS does not change its
master plan to a natural gas-fired power plant from coal-fired power plant, KOGAS will
lose the opportunity to participate in the South Sumatra Natural Gas Pipeline Project. It is
a crucial risk and major obstacle to investments for a feasibility study and FEED.
A gas-fired power plant might be more beneficial than coal in the long-term.
Natural gas is a cleaner-burning hydrocarbon, producing around half the greenhouse gas
emissions and less than one-tenth of the air pollutants that coal does when burned to
produce electricity, and it reduces carbon dioxide emissions over the long-term [19]. A
natural gas-fired power plant may have reduced capital costs and fuel costs with
favorable heat rates [20]. A coal-fired power plant might have a lower levelized cost of
electricity (LCOE) in the short-term. But, building a gas-fired power plant would fit into
a global effort to reduce long-term carbon dioxide emissions. KOGAS could capitalize on
existing infrastructure to mitigate costs, as a gas pipeline will tap into an existing natural
gas pipeline. In 2018, PT Pertamina gas (Pertagas), the owner of the existing gas pipeline,
has begun to supply natural gas [21]. The prospect of cooperation between KOGAS and

13
PDPDE might persuade the State of South Sumatra and central government of Indonesia
to change their master plan.
Figure 4: Maps of the South Sumatra Natural Gas Pipeline Project
(Source: developed by Kim, D.H.)

14
3.2 REVENUES THROUGH TRANSPORTATION BUSINESS
According to unbundling system under the Oil and Gas Law No.22/2001,
upstream entities are prohibited from engaging in downstream activities such as
transportation and gas trading, and vice versa [9]. The unbundling system prevents a
holder of a transportation business license to simultaneously engage in gas trading
through pipelines in downstream activities [22]. Affiliated entity may establish a related
trading operation based on a separate trading business license [22].
KOGAS has planned to engage only in gas transmission, which will bring
revenues from transportation activities by transmitting natural gas via their pipelines (see
Fig. 5). Any potential end users, including retailers and power plants, would sign Gas
Sales and Supply Agreements (GSA) with gas trading companies that have GSA as well
with gas producers to secure gas supplies. The trading companies would sign Gas
Transportation Agreements (GTA) with the KOGAS-PDPDE to supply contractual end
users.
Figure 5: Gas Business System in Indonesia
(Source: developed by Kim, D.H.)
15
As mentioned in Chapter 2, BPH MIGAS has the authority to decide and
supervise tariffs for natural gas pipeline transmission. The pipeline operator, KOGAS-
PDPDE, has to submit a proposed tariff to BPH MIGAS, which will evaluate the
proposed tariffs by discussing with the related parties before determining the tariff [12].
Parties would have to agree on the terms of the GTAs, subject to BPH MIGAS’ authority
to set tariffs for natural gas pipeline transmission [12].
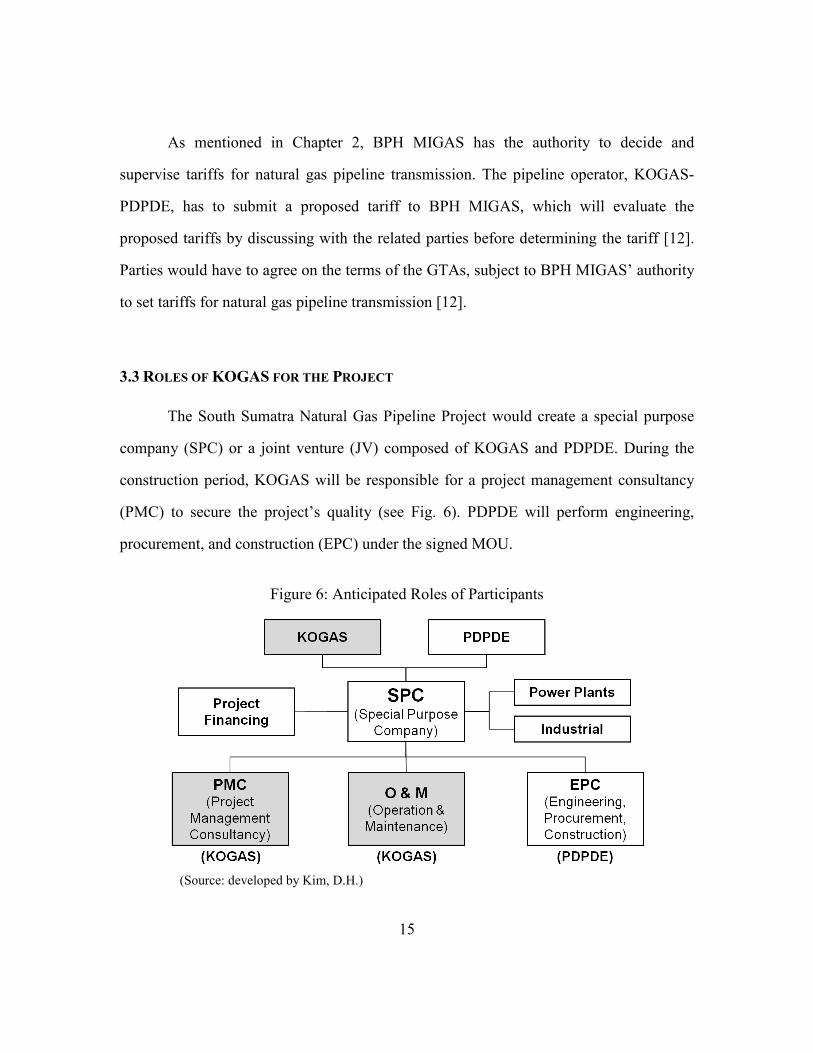
3.3 ROLES OF KOGAS FOR THE PROJECT
The South Sumatra Natural Gas Pipeline Project would create a special purpose
company (SPC) or a joint venture (JV) composed of KOGAS and PDPDE. During the
construction period, KOGAS will be responsible for a project management consultancy
(PMC) to secure the project’s quality (see Fig. 6). PDPDE will perform engineering,
procurement, and construction (EPC) under the signed MOU.
Figure 6: Anticipated Roles of Participants
(Source: developed by Kim, D.H.)

16
KOGAS has a competitive advantage in operation and maintenance fields of gas
pipeline network. For 35 years, KOGAS has constructed and operated a Korean
nationwide natural gas pipeline network, with 4,790 km (2,980 mile) transmission
pipeline and related facilities. To strengthen the safety, KOGAS implemented in 1997 a
proprietary Environment, Health, Safety and Quality (EHSQ) management system for
integrated and efficient management. This EHSQ system has contributed to stable and
safe operation since 1997 [23]. The stable and safe operations should be reflected in the
PMC during construction.
An assignment of participant’s roles during construction and operation periods is
an important factor for the successful project according to the signed MOU. However,
this research might pay attention to an economic viability because the volume of gas
demand provides a reason for a feasibility study and FEED. Chapter 4 estimates the
potential gas demand and analyzes a sustainability of thirty-year operation from gas fields
to secure a viability of the South Sumatra Natural Gas Pipeline Project.

17
Chapter 4: Gas Demand and Supply Analysis
This chapter develops a method to forecast gas demands and assess the
availability of gas supply for electricity generation and industrial feedstock. Maximum
gas demand may be limited by the South Sumatra Natural Gas Pipeline transmission
capacity relative to the existing Grissik-Pusri pipeline. The supply analysis relates to the
sustainability of thirty-year operation from gas fields.
4.1 GAS DEMAND FOR TANJUNG API-API (TAA) SPECIAL ECONOMIC ZONE (SEZ)
4.1.1 Maximum Gas Demand for Electricity
Indonesia has designated Tanjung Api Api (TAA) as a Special Economic Zone
(SEZ) to integrate its energy industry, power plants, fertilizer and cement factories, as
well as oil and petrochemical industry under the Government Regulation of No. 51/2014
[14]. According to TAA SEZ master plan, maximum TAA SEZ electricity demand will
be 753,878 kilo-volt-amperes (KVA), roughly 603 megawatt (MW) as shown in Table 4
[24]. The industry might need approximately 73 percent of total electricity demand.
According to the master plan of TAA SEZ, the State of South Sumatra applied a 12
percent loss factor and 0.85 utilization factor to calculate the amount of electricity (State
of South Sumatra, 2012). The loss factor is a decrease of electrical potential along the
path of a current flowing in an electrical circuit. The utilization factor is the ratio of the
time that equipment is in use to the total time.

18
Table 4: Estimated TAA SEZ Electricity Demand
No Type Volume Standard
electricity requirement
Electricity demand (KVA) Amount Unit
1 Industry 70% of large
region Ha 0.2 MVA/HA 566,243
2 Housing 56,800 Unit 0.45 KVA/Unit 25,560
3 Facilities 1,040.87 Ha 160 KVA/HA 166,538
4 Green Open Space 407.43 40 KVA/HA 16,297
5 Lighting Road (PJU)
10% of household
needs 2,556
Sub total 777,194
Loss factor 12% of the total sub 93,263
Utilization factor 85% of the total sub 660,615
Total Electricity Needs 753,878
(Source: Table 3.9 from [24])
If the electricity load is fueled by natural gas, the gas volume to meet the
electricity demand 603 MW can be computed by Equation 4-1. The equation divides a
required energy unit of electricity by heat content. Heat content is an amount of energy
released as heat when a volume of natural gas is burned.
Natural gas volume = electricity demand × 24 hours × Heat rate × Capacity factorHeat content
(Eq. 4-1)
One measure of power plant efficiency is the rate that a fuel can be converted into
heat and electricity. A heat rate is an amount of energy used by an electrical generator or
power plant to generate one kilowatt hour (KWH) of electricity. Two distinct types of

19
technologies, combined cycle and simple cycle, can convert natural gas into electricity. A
combined cycle system converting 7,340 BTU per KWH at an average heat rate is more
efficient than a simple cycle with a heat rate of 9,788 BTU per KWH [25]. Equation 4-1
assumes a combined cycle system and uses a heat rate of 7,340 BTU per KWH to
calculate a volume of the required natural gas.
The heat content is the amount of energy released when a volume of natural gas is
burned. The heat content of the natural gas for the South Sumatra Gas Natural Pipeline
Project has been estimated as 1,020 BTU per cubic feet (CF) [26].
A capacity factor is how intensively a fleet of generator could run [27]. If a fleet’s
actual generation compared to its maximum potential generation is near 100 percent, it
means that a fleet is operating nearly all of the time [27]. Indonesia’s average capacity
factor was 66 percent, with an average operational time of 5,800 hours a year in 2010
from all energy resources [28]. According to the report, natural gas had a highest capacity
factor with 76 percent, followed by coal, oil, hydro, and geothermal.
Table 5 lists variables to calculate the natural gas volume to meet an electricity
demand of 603 MW. From Equation 4-1, the required gas volume to meet the maximum
electricity demand is 79.1 million standard cubic feet per day (MMSCFD) (see Equation
4-2).
Table 5: Variables for the Natural Gas Volume
Factors Values Factors Values Electricity demand 603 (MW) Heat content 1,020 (BTU/CF)
Heat rate 7,340 (BTU/KWH) Capacity factor 0.76 (Source: developed by Kim, D.H.)
Natural gas volume = 603(MW) × 24(hr) × 7,340(BTU/KWH) × 0.761,020 (BTU/CF)
= 79.1 MMSCFD (Eq. 4-2)

20
4.1.2 Maximum Gas Demand for Industrial as a Feedstock
TAA SEZ fertilizer, cement, paper, and rubber industries can also use natural gas
as a feedstock and fuel. Table 6 lists the amount of expected production by industry
types. These amounts of production can be converted into natural gas demand using a
rate of energy efficiency, which represents the energy requirement to produce one metric
ton (1,000 kilograms) of fertilizer, cement, paper, and rubber finished products.
Table 6: The Expected Production
Industry type Maximum production
Fertilizer Industry 2,260,000 tonne/year
Cement Industry 10,000,000 tonne/year
Pulp/Paper Industry 2,000,000 tonne/year
(Source: Table 4.12 from [29])
Natural gas is a preferred feedstock for fertilizer production due to its high
hydrogen to carbon ratio (CH4). Hydrogen is used for production of ammonia, and
thereafter, urea is manufactured with the reaction of ammonia (Parikh et al., 2009). On
the assumption that all the urea production units will be operating on natural gas
feedstock only, an average energy efficiency of natural gas would be 23.73 gigajoule per
tonne (GJ/tonne) of urea [30]. This thesis assumes 23.73 GJ/tonne to estimate the
required volume of natural gas as a fertilizer feedstock.
Conventional fossil fuels, such as bituminous coal and lignite, are commonly used
in cement production. These fuels produce relatively high volumes of carbon dioxide
(CO2) emissions [31]. One way to somewhat reduce CO2 emissions is to substitute solid
fuels with other fuels with a lower rate of emissions [31]. The best option is natural gas.
A cement making process consists of raw material preparation (limestone and fuels),

21
clinker making (fuel use and electricity use), additives preparation, and cement grinding
[32]. While the raw material is mostly limestone, natural gas can be utilized for the
process of clinker making. Clinker production requires both electricity to run the
machinery (as much as 22.5 KWH/tonne) and fuels for drying (as much as 2.85 GJ/tonne)
[32]. This thesis assumes 2.85 GJ/tonne to estimate a required natural gas as a feedstock
of cement industry for clinker making.
The pulp and paper industry converts fibrous raw materials, mainly woods, into
pulp, paper, and paperboard [32]. The papermaking process includes raw material
preparation, pulping (chemical, semi-chemical, mechanical, or waste paper), bleaching,
chemical recovery, pulp drying, and papermaking. Pulping and drying are the most
energy-consuming processes [32]. Most processes use steam and electricity. Kraft
recovery, which describes the inorganic pulping chemicals being recovered for reuse,
uses fuel [32]. Natural gas could be used to provide the 1.2 giga joule per a dry tonne
(GJ/ADT) of heat in the Kraft recovery process [33].
Equation 4-3 calculates maximum gas demand using anticipated maximum
productions and energy efficiency of each industry type.
Max. gas demand (MMSCFD) =Max. production �tonne
year � × Energy efficiency � GJtonne� × 913 �CF
GJ�
365 � dayyear� × 106
(Eq. 4-3)
From Equation 4-3, the maximum natural gas demand for industries in the TAA
SEZ would be 211.7 MMSCFD, based on annual maximum production and energy
efficiency for each industry (see Table 7).

22
Table 7: The Maximum Gas Demands for Industries in the TAA SEZ
Industry type Energy efficiency Maximum gas demand (per day)
Fertilizer Industry 23.73 GJ/tonne 134.3 MMSCFD
Cement Industry 2.85 GJ/tonne 71.4 MMSCFD
Pulp/Paper Industry 1.20 GJ/tonne 6.0 MMSCFD
SUM 211.7 MMSCFD
(Source: developed by Kim, D.H.)
4.1.3 Gas Pipeline Capacity Analysis
As estimated above, the maximum gas demand for electricity and industrial use
are 79.1 MMSCFD (Eq. 4-2) and 211.7 MMSCFD (Table 7), respectively, with a total
maximum gas of 290.8 MMSCFD. One initial question is whether the KOGAS-PDPDE
pipeline could deliver 290.8 MMSCFD. The KOGAS-PDPDE pipeline will connect with
Grissik-Pusri pipeline with a diameter of 20 inches and 176 km. Pressure to deliver
natural gas from gas fields and the end point of Grissik-Pusri could affect KOGAS-
PDPDE’s pipeline flow rate capacity.
Under Indonesian law, a pipeline operator is not required to expand its capacity to
accommodate new customers, even though facility sharing is obligated by Government
Regulation No.36/2004 [12]. Sharing can occur if a facility has sufficient capacity to
avoid damages to the facility’s owner [12], so an assessment of the capacity of the flow
rate for KOGAS-PDPDE’s pipeline ought to analyze the outlet pressure of the Grissik-
Pusri pipeline. The outlet pressure or gas flow rate can be calculated by Equation 4-4, the
Panhandle B equation, a widely used equation for long-line transmission pipeline [34].
The Panhandle B equation is as follows [35].

23
Qb = 737 × (TbPb
)1.020 × D2.53 × E × �P12−P22−
(0.0375×G×(h2−h1)×Pavg2
Tavg×Zavg
G0.961×L×Tavg×Zavg� 0.51 (Eq. 4-4)
where Qb is flow rate measured in standard cubic feet per day (SCFD); Pb is base
pressure measured in pounds per square inch (PSI); Tb is base temperature measured
in °R; Tavg is average gas temperature measured in °R; P1 is inlet pressure measured
in PSI; P2 is outlet pressure measured in PSI; G is gas specific gravity (air = 1.0); L is
line length measured in miles; Z is average gas compressibility; D is pipe inside
diameter measured in inch; h2 is elevation at terminus of line measured in ft; h1is
elevation at origin of line measured in ft; Pavg is average line pressure measured in PSI;
and E is efficiency factor.
A Grissik-Pusri pipeline outlet pressure using known flow rate and assumed inlet
pressure from gas fields via Equation 4-4 yields approximately 830 PSI, using variables
listed in Table 8. The flow rate used 70 MMSCFD according to Pertagas’ announcement.
Grissik-Pusri’s volume of gas supply is 30 MMSCFD in the first stage, which can be
gradually increased to 70 MMSCFD in the pipeline between Grissik to Pusri [21]. This
thesis assumes that h2, the elevation at terminus of line, is the same as h1, the elevation
at origin of line.

24
Table 8: Variables for the Outlet Pressure (P2) of the Grissik-Pusri Pipeline
Variable Value Variable Value
Q 70 MMSCFD G 0.6
P1 868 psi L 109 miles
Pb 14.69 psi Z 0.971
Tb 518.67 °R D 20 inch
Tavg 518.67 °R E 0.92
(Source: developed by Kim, D.H.)
A second step is to calculate the flow rate of the KOGAS-PDPED pipeline using
the estimated outlet pressure of Grissik-Pusri pipeline in the first step. Using Equation 4-
4, the estimated flow rate of the KOGAS-PDPDE pipeline would be 257 MMSCFD.
Table 9 lists variables used in Equation 4-4. An inlet pressure of KOGAS-PDPDE
Pipeline, P1, is 830 psi calculated in the first step. The thesis assumed that an outlet
pressure might be 583 pounds per square inch absolute (PSI), which is the average value
between 20 Bar and 60 Bar because gas-fired gas turbines need a fuel gas pressure of 20
bar (= 290 PSI) to 60 bar (= 870 PSI) in Indonesia [36]. This thesis assumes that h2, the
elevation at terminus of line, is the same as h1, the elevation at origin of line.
Table 9: Variables for the Flow Rate (Qb) of the KOGAS-PDPDE Pipeline
Variable Value Variable Value
P1 830 psi G 0.6
P2 583 psi L 46 miles
Pb 14.69 psi Z 0.971
Tb 518.67 °R D 20 inch
Tavg 518.67 °R E 0.92
(Source: developed by Kim, D.H.)

25
KOGAS-PDPDE’s pipeline is capable of transmitting natural gas at a maximum
rate of 257 MMSCFD, which does not meet the maximum gas demands of electricity and
industrial usages (290.8 MMSCFD). To meet maximum gas demand, the installation of a
compressor might be an option. A compressor functions to increase the gas flow pressure.
However, this thesis does not consider the installation of a compressor due to questions
of the economic return on investment and the challenge of land acquisition for
compressor facilities. According to a growth rate of gas demand in the future, KOGAS-
PDPDE could consider installing a compressor. Without a compressor, the maximum gas
demand 290.8 MMSCFD would need to be adjusted to less than 257 MMSCFD, due to
the limited flow capacity of the pipeline.
4.1.4 Adjustment of Gas Demands
One way to adjust gas demand due to lack of gas pipeline capacity would be to
modify industrial use rather than electricity gas demand. The reason is that the electricity
gas demand already considered a capacity factor to estimate the maximum electricity gas
demand in Equation 4-1. If this thesis assumes an 80 percent industrial operation rate, the
maximum gas demand for industrials can be adjusted to be 169.4 MMSCFD from 211.7
MMSCFD (see Table 10). Electricity usage still stands at 79.1 MMSCFD. The adjusted
maximum gas demand represents 248.5 MMSCFD.

26
Table 10: The Adjusted Maximum Gas Demand to Meet Flow Rate
(Original) maximum gas demand (Adjusted) maximum gas demand
Electricity 79.1 MMSCFD Electricity 79.1 MMSCFD
Industrials 211.7 MMSCFD Industrials 169.4 MMSCFD
Sum 290.8 MMSCFD Sum 248.5 MMSCFD
(Source: developed by Kim, D.H.)
One way to estimate the volume of gas to meet a total gas demand for thirty years
is to assume three options for gas supply from 2022 to 2051 based on different demand
growth rates (see Table 11). Scenario 1 applies 5.1 percent growth rate, which is the same
rate as Indonesia’s GDP growth in 2017 [37]. All three scenarios have the same initial
gas demand which is 10 percent of maximum gas demands. The initial gas demand of
electricity and industrials stands at 8.0 MMSCFD and 21.1 MMSCFD, respectively.
Table 11: Scenarios for Total Gas Demands for 30 Years
No.
Electricity (MMSCFD) Industrials (MMSCFD) Accumulated total
demand (30 years)
Initial demand (2022)
Peak demand (year)
Growth rate
Initial demand (2022)
Peak demand (year)
Growth rate
Scenario 1 8.0 33.9 (2051) 5.1% 21.1 89.3
(2051) 5.1% 718 BCF
Scenario 2 8.0 79.1 (2046) 10.2% 21.1 169.4
(2044) 10.2% 1,498 BCF
Scenario 3 8.0 79.1 (2035) 20.4% 21.1 169.4
(2034) 20.4% 2,062 BCF
(Source: developed by Kim, D.H.)

27
With respect to the growth rate and initial gas demand, Figure 7 illustrates the
annual gas demand of each scenario. While the peak demand in Scenario 2 and Scenario
3 occurs around 2044 and 2034 respectively, a peak demand in scenario 1 reaches only
approximately 50 percent of the maximum gas demand even in 2051. For example, in
2040, scenario 3 reaches a peak with 248.5 MMSCFD while Scenario 1 and Scenario 2
account for 71.2 MMSCFD and 167.2 MMSCFD, respectively. The total gas demands for
30 years of Scenario 1, 2, and 3 represent 718 billion cubic feet (BCF), 1498 BCF, and
2062 BCF, respectively.
Figure 7: The Annual Gas Demand by Scenarios
(Source: developed by Kim, D.H.)

28
4.2 SUPPLY ANALYSIS
Supply analysis can evaluate the availability of gas from gas fields to assure
sufficient reserve for gas transmission if KOGAS-PDPDE would sign long-term supply
contracts. Even though KOGAS-PDPDE will not be responsible for gas sales agreements
(GSA) between gas producer and end users, ensuring sufficient gas volume is an
important factor in the transportation business, which creates revenues per unit of gas
transported as US dollars per million British thermal unit (USD/MMBTU) from
transportation activities by transmitting natural gas via pipelines.
The natural gas for the South Sumatra Pipeline Project can be provided by two
gas fields including those in the Corridor Block PSC operated by ConocoPhillips and
Jambi Merang operated by Pertamina hulu energi. The KOGAS-PDPDE gas pipeline can
connect with Grissik-Pusri gas pipeline with an entry point of the Corridor PSC in
Grissik. The Jambi Merang gas field could connect a pipeline to the Grissik entry point.
4.2.1 Corridor Block PSC
Located in South Sumatra, the Corridor PSC has been supplying gas from the
Grissik and Suban processing plants to the Duri Steamflood project in Central Sumatra
and markets in Java and Batam islands as well as Singapore [26]. The Corridor PSC
started gas sales in 1998 and will expire in 2023. Its terms for license extension remain
uncertain [26]. ConocoPhillips has shown interest in renewing their production sharing
contract (PSC) in the Corridor Block, but has not yet submitted a formal proposal [38].
Sales gas production from the Corridor PSC peaked at 945 MMSCFD in 2014 and
has been gradually decreasing since 2014 [26]. Table 12 lists an amount of natural gas
production from the Corridor PSC according to long-term supply contracts from 2018 to

29
2023. The production is decreasing from 854 MMSCFD in 2018 to 699 MMSCFD in
2023. As of 2018, the total production for gas sales until 2023 will represent 4,721
MMSCFD, which is equivalent to 1,723 BCF.
Table 12: Production of the Corridor PSC from 2018 to 2023
Year 2018 2019 2020 2021 2022 2023 Sum
CPI 149 131 113 119 103 93 708 Java 405 367 347 345 342 342 2,148
Singapore 203 213 201 164 149 114 1,044 Batam 65 9 - - - - 74
Other Sumatra 29 52 52 52 52 50 287 Pusri - 18 45 45 45 45 198
Dumai 4 40 55 55 55 55 264 Sum 854 830 813 780 745 699 4,721
* Unit: MMSCFD (Source: based on the table in page 14 from [26])
In addition to 4,721 MMSCFD, an available gas reserve from the Corridor PSC
might consider potential gas supply contracts since 2023. Either ConocoPhillips or a new
owner might sign gas supply contracts for post-2023. Wood Mackenzie anticipates a
potential production profile since 2023 [26] (see Table 13). The total production for
potential gas sales from 2024 to 2033 represents 2,185 MMSCFD, which is 798 BCF.
Therefore, the total gas sales represent 2,521 BCF from the sum of 1,723 BCF and 798
BCF.

30
Table 13: Production of the Corridor PSC since 2023
Year 2024 2025 2026 2027 2028 2029 2030 2031 2032 2033 Sum
Sales gas 483 398 319 249 199 163 127 99 81 67 2,185 * Unit: MMSCFD (Source: based on the table in page 15 from [26])
4.2.2 Jambi Merang Block
Jambi Merang Block is an onshore block located in South Sumatra that has
produced gas since 1998. The current Jambi Merang joint operating agreement (JOA)
will expire in 2019 [39]. Additional gas resources exist in the block and the operator is
evaluating further expansion plans. Due to the potential expiration of a JOA, further gas
development or sales would require a license extension [39].
The annual sales gas production from the Jambi Merang Block peaked at 118
MMSCFD in 2013 and has been decreasing gradually since 2014 [39]. As of 2018, the
total production for gas sales until the expiry represents 103 MMSCFD, which equivalent
to 37 BCF [39].
4.2.3 Available Gas Resource for the South Sumatra Natural Gas Pipeline Project
The available gas resource for the South Sumatra Natural Gas Pipeline Project can
be estimated by deducting signed or anticipated sales gas from current gas reserves. Table
14 represents remaining gas reserves and gas production for sales from Corridor PSC and
Jambi Merang Block. According to the Ministry of Energy and Mineral Resources of
Indonesia, in 2014, the remaining 1P gas reserves for Jambi Merang Block represent 590
BCF and the Corridor PSC amounts to 4,785 BCF, which totals 5,375 BCF [40]. This gas
31
supply analysis considers only proved gas reserves, otherwise known as 1P gas reserves,
which means that the reserve can be extracted with 90 percent certainty.
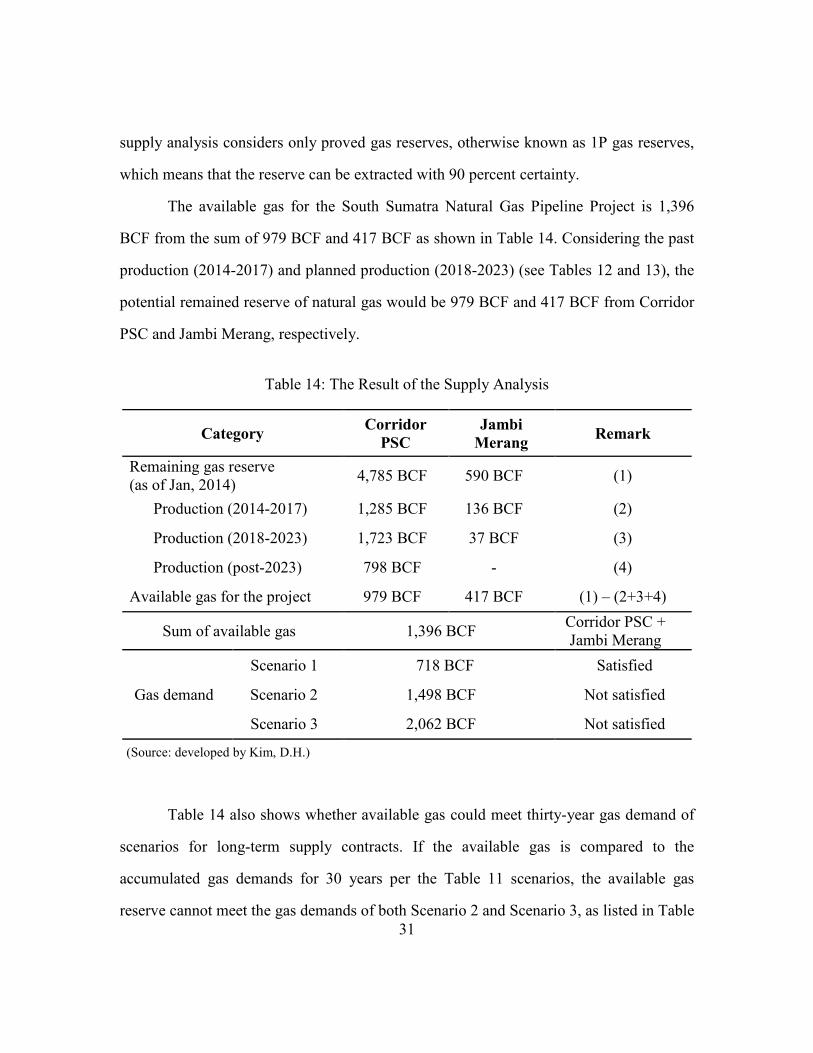
The available gas for the South Sumatra Natural Gas Pipeline Project is 1,396
BCF from the sum of 979 BCF and 417 BCF as shown in Table 14. Considering the past
production (2014-2017) and planned production (2018-2023) (see Tables 12 and 13), the
potential remained reserve of natural gas would be 979 BCF and 417 BCF from Corridor
PSC and Jambi Merang, respectively.
Table 14: The Result of the Supply Analysis
Category Corridor PSC
Jambi Merang Remark
Remaining gas reserve (as of Jan, 2014) 4,785 BCF 590 BCF (1)
Production (2014-2017) 1,285 BCF 136 BCF (2)
Production (2018-2023) 1,723 BCF 37 BCF (3)
Production (post-2023) 798 BCF - (4)
Available gas for the project 979 BCF 417 BCF (1) – (2+3+4)
Sum of available gas 1,396 BCF Corridor PSC + Jambi Merang
Gas demand
Scenario 1 718 BCF Satisfied
Scenario 2 1,498 BCF Not satisfied
Scenario 3 2,062 BCF Not satisfied
(Source: developed by Kim, D.H.)
Table 14 also shows whether available gas could meet thirty-year gas demand of
scenarios for long-term supply contracts. If the available gas is compared to the
accumulated gas demands for 30 years per the Table 11 scenarios, the available gas
reserve cannot meet the gas demands of both Scenario 2 and Scenario 3, as listed in Table
32
14. Scenario 2 might require additional 102 BCF gas. Scenario 3 might need extra 666
BCF gas. Insufficient supply of gas and decreasing long-term gas reserves represents a
significant risk. If KOGAS cannot secure guaranteed gas reserves for thirty-year supply
from other gas fields, the projects might not meet their financial expectations. Prior to
taking further steps, KOGAS needs to discuss additional gas-field development plans
with PDPDE and the State of South Sumatra. This supply risk will be discussed in
Chapter 6, along with other project risks.
The thirty-year potential gas demands including electricity and feedstock estimate
revenues based on an assumed toll-fee from a discounted future cash flow. In the next
chapter, this thesis performs an economic analysis, which computes the net present value
and internal rate of return to evaluate an economic viability of the South Sumatra Natural
Gas Pipeline Project.

33
Chapter 5: Economic Analysis
This chapter estimates the net present value (NPV) and internal rate of return
(IRR) for the South Sumatra Natural Gas Pipeline Project to assess its economic viability
based on its discounted future cash flow. KOGAS would use these NPV and IRR results
to evaluate whether to pursue the South Sumatra Natural Gas Pipeline Project.
A first step is to derive a discount rate to estimate how much the project’s future
cash flows would be worth in the present. The NPV analysis will discount the future cash
flows at the project’s weighted average cost of capital (WACC). A second step is to
estimate revenues from the potential gas demands, as calculated in chapter 4.1.4 using an
assumed toll-fee. A third step is to estimate project costs, including capital expenditures
(CAPEX) and operating expenses (OPEX). A fourth step is to perform an economic
analysis to calculate the NPV and IRR. A final step is to perform a sensitivity analysis to
evaluate risk factors.
5.1 DISCOUNT RATE
An appropriate discount rate is a first step for estimating the NPV and IRR from
cash flow. KOGAS uses the weighted average cost of capital (WACC) as their discount
rate to determine the present value. The WACC is the weighted average of the costs of a
firm’s choice of financing sources, with each cost weighted according to its source’s
proportion of total financing as indicated in Equation 5-1. The WACC that will discount
the future cash flow of the South Sumatra Natural Gas Pipeline Project is
WACC = kewe + kd(1 − T)wd (5-1)

34
The cost of equity (ke) is the rate of return that shareholder requires for investing
equity into a business. The cost of debt (kd) is the interest rate that a company pays on its
borrowing. The value of wd is the weight attached to debt, and we is the weight
attached to common equity. The cost of debt financing is the rate of return required by
the firm’s creditor’s, kd, adjusted downward by a factor equal to 1 minus the corporate
tax rate (1-T) to reflect the fact that the firm’s interest expense is tax-deductible. Thus,
the creditors receive a return equal to kd, but the firm experiences a net cost of only
kd(1 − T).
The cost of equity (ke) indicated in Equation 5-1 can be estimated by Equation 5-
2. The cost of equity generally consists of a risk free rate of return and a market premium
assumed for operating a business, but KOGAS also adds a country risk premium.
KOGAS’ cost of equity is
ke = Rf + βe ∙ RPm + RPc (5-2)
The risk free rate (Rf) should not take into account any risk factors and should
only include time value of money and inflation [41]. Beta (βe) measures how the returns
of a certain company behave in relation to the returns of the relevant market benchmark.
For example, if a beta is smaller than 1.0, it means the share price of a company is less
volatile than general market [41]. The market risk premium (RPm) is the average return
that investors require over the risk-free rate for accepting the higher variability in returns
that are common for equity investments [41]. The country risk premium (RPc) is an
additional risk associated with investing in an international company, rather than the
domestic market.

35
Financing a gas pipeline project typically would involve a high ratio of debt. An
owner might prefer to limit its equity investment in a project to avoid commercial risks.
For the South Sumatra Natural Gas Pipeline Project, KOGAS considers a 60 percent of
debt ratio for the project, meaning that the value of we and wd account for 0.4 and 0.6,
respectively. As of 2018, Indonesia’s corporate tax rate is 25 percent [42], meaning that
the T value is 0.25. The United States government bonds are generally used as reference
for a risk-free rate. According to U.S. Department of the Treasury, a current 30 year
treasury yield as of January 14, 2019 is 3.06 percent, which is the risk-free rate, Rf [43].
βe represents the sensitivity of the equity returns to variations in the rates of return on
the overall market portfolio [44]. KOGAS have used the beta coefficient at 0.5772
referred to a midstream gas business, including a gas pipeline transportation business.
The market risk premium applies a value, which is 5.5 percent as of June 30 in 2018, as
recommended by KPMG [41]. NYU Stern estimated Indonesia’s country risk premium at
2.64 percent as of January 2019 [45]. Therefore, using Equation 5-2, the cost of equity
(ke) is estimated to be 8.87 percent.
The cost of debt is the return that a company provides to its debt holders and
creditors. These capital providers expect to be compensated for any risk exposure that
comes with lending to a company. The approach to estimate the cost of debt (kd) is using
KOGAS’ financial statement through dividing the annual interest by total debt that
KOGAS is carrying as indicated in Equation 5-3.
kd = Total interest of KOGAS
Total debt of KOGAS= 736,980 million KRW
28,519,097 million KRW= 2.58 % (5-3)

36
On the KOGAS’ balance sheet of 2018, total amount of debt was 28,519,097
million Korean won (KRW) [46]. The total interest KOGAS paid in 2018 was 736,980
million KRW on the income statement of 2018 [47]. The cost of debt (kd) is 2.58
percent.
A WACC value is equal to 4.71 percent in Equation 5-1. This WACC value will
be used as the discount rate to calculate the NPV in the cash flow analysis.
5.2 REVENUES
The South Sumatra Natural Gas Pipeline Project transmits natural gas via their
pipelines to create revenues measured in USD/MMBTU. BPH MIGAS has controlled gas
transportation businesses under Government Regulation No.36/2004 and MEMR
Regulation No.19/2009 [11]. BPH MIGAS have determined a gas pipeline toll-fee (tariff)
under Regulation No.16/2008 as last amended by No.8/2013 [9].
According to the BPH MIGAS’ regulation (2013), there are three kinds of toll-fee
systems: (a) one toll rate at any delivery point of the pipeline, regardless of a distance; (b)
different toll-fees, depending on the transmitting distance; and (c) entry-exit system
which charges a toll-fee at entry point or exit point as shippers are different at the both
points [48]. The South Sumatra Natural Gas Pipeline Project assumes to set the toll-fee at
1.00 (USD/MMBTU) throughout the entire thirty years of project duration for the
economic analysis [18].
Based on the potential demand of Table 11, Fig.8 illustrates expected future
revenues. The revenue trend for scenarios is the same as the potential gas volume trend of
Fig. 7 because the applied toll-fee is 1.00 USD/MMBTU. For example, in 2040, which is
19th-operation year, Scenario 3 reaches a peak with 92 million USD while Scenario 1

37
and Scenario 2 represent 26 million USD and 62 million USD, respectively. Accumulated
total revenues of each scenario for thirty-year operation account for 732 million USD at
Scenario 1; 1,528 million USD at Scenario 2; and 2,103 million USD at Scenario 3.
Figure 8: The Annual Revenue by Scenarios
(Source: developed by Kim, D.H.)
5.3 PROJECT COSTS
Costs for the South Sumatra Natural Gas Pipeline Project include both capital
expenditures (CAPEX) and operating expenses (OPEX). CAPEX accounts for all initial
costs required to construct all facilities such as planning, feasibility studies, engineering
design, land acquisition, construction, and inspection and testing before an operation.
OPEX refers to operation and maintenance costs over the project life cycle.

38
Pipeline project costs are influenced by a location, terrain, labor cost, or market
price of components such as steel. Safety issues, environmental issues, legal and political
arguments, and the installation process for a pipeline installation also affect total project
cost [49]. Due to many factors, it is difficult to anticipate all project costs or be able to
create a global average unit cost for a pipeline project. Front end engineering design
(FEED) after a conceptual design or feasibility study can estimate approximate
investment costs, even with substantial risks and uncertainties. One way to estimate the
South Sumatra Pipeline Project cost is to consider historical gas pipeline projects in
Indonesia or obtain cost estimates or bids from several Indonesian EPC companies.
However, there are limited historical data references. Any cost estimates might be
unreliable without FEED. Another way to anticipate the project cost is to analyze recent
tenders from BPH MIGAS to compare unit costs. It is complicated to derive unit cost for
an on-shore pipeline because most recent tenders are associated with off-shore pipeline
projects.
To estimate CAPEX for the South Sumatra Natural Gas Pipeline Project, this
thesis analyzes historical pipeline projects in the United States (U.S.) to estimate a unit
cost per inch-meter. A first step is to categorize unit cost into four components: materials
cost; labor cost; miscellaneous cost; and right of way (ROW) cost. A second step is to
estimate multipliers for converting an U.S. unit cost to an Indonesian unit cost for all
components to derive a unit cost per inch-meter for the South Sumatra Natural Gas
Pipeline Project.
From 1993 to 2007 in the U.S., costs for building natural gas pipeline
infrastructure varied between 30,000 USD and 100,000 USD per inch-mile [50]. The
large variation between the two values may be due in part to steel prices and regional
variations [51]. INGAA have recently applied pipeline cost multipliers to estimate the

39
average pipeline cost of the U.S. in six regions: Southwest, 0.68; Central, 0.69; Midwest,
0.85, Southeast, 1.09; Western, 1.14; and Northeast, 1.46 [51]. In 2012, the average
pipeline cost increased drastically to 155,000 USD per inch-mile. This value indicates
that historical data before 2007 may not be accurate as a basis of estimating average
pipeline CAPEX costs in the U.S. This thesis utilized the recent ten-year historical data
provided by Federal Energy Regulatory Commission (FERC). Table 15 lists 10 years of
unit onshore CAPEX for natural gas pipeline with diameters ranging from 8 to 36 inches
[52]. It lists average cost per mile for any given diameter. Costs fluctuate year to year as
project costs are affected by geographic location, terrain, population density, or other
factors [52]. For example, an average construction cost of a 12 inch pipeline increased
from 1,548,033 USD per mile in 2013 to 10,535,221 USD per mile in 2014. This value,
in turn, decreased to 3,951,424 USD per mile in 2015.

40
Table 15: U.S. Natural Gas Pipeline Onshore Construction Costs for 10 years
(Source: Table 3 from [52])
For the past ten years, the unit pipeline costs have ranged between 80 USD and
237 USD per inch-meter (3.0 million USD and 9.6 million USD per mile), with a mean
value of 159 USD per inch-meter, based on Table 15 (see Table 16). The mean value of
159 USD per inch-meter will be used to estimate average pipeline CAPEX costs.

41
Table 16: U.S. per Inch-Meter Unit Pipeline Cost for 10 Years
Cost Range (per mile) Range (per inch-meter) Low High Low High
Unit cost 3,018,695 USD 9,654,228 USD 80 USD 237 USD Mean unit cost 6,336,462 USD 159 USD
(Source: based on Table 3 from [52])
Information on total unit cost components would be available to derive a
reasonable unit cost for construction of the South Sumatra Natural Gas Pipeline Project.
The unit cost for natural gas pipelines generally consists of four categories: materials,
labor, miscellaneous, and right of way (ROW) [52]. Materials costs include pipe, pipe
coating, and cathodic protection. Miscellaneous costs are associated with surveying,
engineering, supervision, interest, administration, overhead, contingencies, regulatory
fees and allowances for funds used during construction [49].
From historical cost data of 412 pipelines recorded from 1992 to 2008 in the
United States, labor cost has the highest share of 40 percent of total cost [53] (see Table
17). Table 17 lists the shares of each components and corresponding total costs. Materials
have contributed 30 percent of total cost. Miscellaneous and ROW costs have contributed
23 percent and 7 percent, respectively. The sum of labor and materials cost accounts for
up to 70 percent of total cost. These costs can be modified by estimating multipliers from
comparisons between the United States and Indonesia.

42
Table 17: Mean Unit Cost of Each Component by Shares
Mean unit cost (from Table 17)
Components of total cost Share Cost by share
159 USD (per inch-meter)
Labor 40% 63.44 USD Materials 30% 47.58 USD
Miscellaneous 23% 36.48 USD ROW 7% 11.10 USD
(Source: developed by Kim, D.H.)
Building a pipeline in developing countries can be less expensive than in
developed countries due to wage differences [49]. To estimate a labor cost multiplier for
the South Sumatra Natural Gas Pipeline Project, this thesis compared a nominal wage of
the United States and Indonesia. Table 18 shows an average annual salary of construction
labor workers of the United States and Indonesia: 41,361 USD in the U.S. versus 70
million Indonesia Rupiah (IDR) in Indonesia [54]. The estimated multiplier for the labor
cost of the South Sumatra Natural Gas Pipeline Project accounts for 0.12 of the US labor
cost.
Table 18: Estimation of a Multiplier for the Labor Cost
Country Average salary (2019)
Currency exchange Ratio Multiplier
United States 41,361 USD 41,361 USD 100% 1 Indonesia 70,000,000 IDR 4,945 USD 12% 0.12
* 1 USD = 14,285 IDR (as of Jan 24, 2019) (Source: developed by Kim, D.H.)
The material cost index has a similar trend with the producer price index (PPI) for
iron and steel [49]. The material cost index is dependent on steel price because steel

43
represents a majority of the materials cost for a natural gas pipeline project. This thesis
estimates the material cost multiplier by analyzing a potential market price of steel in the
United States and Indonesia. The analysis builds from the current market price of steel,
with a ratio between production and import of steel.
As the world’s largest steel importer, the U.S. imported 34.6 million metric tons
(MMT) of steel in 2017 [55], and produced 81.6 MMT of steel [56]. Indonesia, the
world’s tenth-largest steel importer, imported 11.4 MMT of steel in 2017 [57], and
produced 7.8 MMT of steel [58]. Table 19 accounts for the ratio of the import to total
consumption of steel in the United States and Indonesia. The ratio of steel import is 30
percent and 59 percent, respectively.
Table 19: Ratio of the Import to Total Consumption of Steel in 2017
Country Production Import Sum Ratio of import
United States 81.6 MMT 34.6 MMT 116.2 MMT 30% Indonesia 7.8 MMT 11.4 MMT 19.2 MMT 59%
(Source: developed by Kim, D.H.)
By applying the import ratio to a current market price of steel, this thesis
estimates a multiplier for the material cost for the South Sumatra Natural Gas Pipeline
Project (see Table 20). As of January 16, 2019, the steel price is 806 USD per metric ton
(MT) in the US market; 503 USD in world export markets; and 461 USD in the China
market [59]. As there is no information on Indonesia steel market, this thesis applies the
China market price. The estimated multiplier for the material cost of the South Sumatra
Natural Gas Pipeline Project is 0.68.

44
Table 20: Estimation of a Multiplier for the Material Cost
Country Source Share Steel Price (per metric ton)
Weighted Sum Multiplier
United States
United States 70% 806 USD 716 USD 1
Import 30% 503 USD
Indonesia Indonesia 41% 461 USD
486 USD 0.68 Import 59% 503 USD
* Multiplier (0.68) = 486 USD / 716 USD (Source: developed by Kim, D.H.)
This thesis assumes that the miscellaneous cost can be related to the consumer
price index in the United States [49]. The consumer price index (CPI) is a measure of an
average change over time in the prices paid by urban consumers for a market basket of
consumer goods and services. Because the direct comparison of CPI between the United
States and Indonesia might have nothing to do with estimating the miscellaneous index,
this thesis instead uses a cost of living index. A cost of living index is not a
straightforward alternative to CPI, but CPI is sometimes termed a conditional cost of
living index [60]. In 2019, the cost of living indices for the U.S. and Indonesia are 69.91
and 36.24, respectively [61]. Table 21 illustrates that the estimated multiplier for the
miscellaneous cost of the South Sumatra Natural Gas Pipeline Project is 0.52.
Table 21: Estimation of a Multiplier for the Miscellaneous Cost
Country Cost of living index Multiplier
United States 69.91 1
Indonesia 36.24 0.52
* Multiplier (0.52) = 36.24 / 69.91 (Source: developed by Kim, D.H.)

45
Right of way (ROW) costs depends on land prices, which include fees set by local
government, legal costs, and permit prices [49]. According to research about 412
pipelines in the U.S., the share of ROW cost remains at 7 percent of total cost, regardless
of the length or diameter of pipeline [53]. This thesis assumes for a share of ROW cost
for the South Sumatra Natural Gas Pipeline Project to be 7 percent of the total cost,
which is the same rate as the United States. It means that the higher total CAPEX, the
higher ROW cost with a fixed rate of 7 percent.
The unit cost per inch-meter for the South Sumatra Natural Gas Pipeline Project
can be estimated to be 63.22 USD per inch-meter by applying estimated multipliers for
each component (see Table 22). Labor cost, material cost, miscellaneous, and ROW of
unit pipeline CAPEX cost in Indonesia account for 7.58 USD, 32.30 USD, 18.91 USD,
and 4.43 USD, respectively. Using the estimated unit cost, 63.22 USD, the total CAPEX
for the South Sumatra Natural Gas Pipeline Project with 20 inches and 74 km can be
estimated to be 93,560,000 USD.
Table 22: Mean Unit Cost of the South Sumatra Pipeline Project
Components
United States
Multiplier
Indonesia
Unit cost (USD) Share
Component cost
(USD)
Component cost
(USD)
Unit cost
(USD) Labor
159
40% 63.44 0.12 7.58
63.22 Materials 30% 47.58 0.68 32.30
Miscellaneous 23% 36.48 0.52 18.91
ROW 7% 11.10 0.40 4.43
* CAPEX : 63.22 (USD/inch-meter) * 20 (inch) * 74,000 (m) = 93,560,000 USD (Source: developed by Kim, D.H.)

46
Operating expenses (OPEX) will vary in part with the number of compressor
stations requiring fuels [62]. Compressor fuels represent a majority of operating costs.
The analysis assumes that the South Sumatra Natural Gas Pipeline Project will not use a
compressor, as mentioned earlier. Thus, the OPEX for the operation and maintenance
might depend on the amount of gas supply. This thesis assumes that the unit cost might
be 0.2 USD/MMBTU for the OPEX [18]. The annual OPEX might gradually increase as
the growth rate of gas demand increases by scenarios.
5.4 DISCOUNTED CASH FLOW VALUATION
The use of discounted cash flow analysis is common to evaluate long-term
investments [44]. This discounted cash flow analysis can include the calculation of the
net present value (NPV) and internal rate of return (IRR) as well as Monte Carlo
simulation and sensitivity analysis.
Using values estimated above such as the discount rate, revenues, CAPEX, and
OPEX, it is possible to calculate the net present value (NPV) and internal rate of return
(IRR) for the South Sumatra Natural Gas Pipeline Project from cash flows. Table 23 lists
factors to calculate NPV and IRR by scenarios. Except the growth rate of gas demand by
scenarios of Table 11, other factors are common regardless of scenarios. It assumed that
depreciation period is 10 years computed with straight line depreciation, and other factors
are from previous chapters as mentioned in remarks.

47
Table 23: Factors for the Calculation of NPV and IRR
Factors Values Remarks
Toll fee 1.00 (USD/MMBTU) Chapter 5.2
Initial gas demand (Power Plant & Industrial) 29.1 (MMSCFD) Chapter 4.1.4
Growth rate of gas demand 5.1 (%) Chapter 4.1.4
CAPEX 93,560,000 (USD) Chapter 5.3
OPEX 0.20 USD/MMBTU Chapter 5.3
Depreciable life 10 (years) Assumption
Depreciation method Straight line Assumption
WACC 4.71 (%) Chapter 5.1
Cost of equity 8.87 (%) Chapter 5.1
Cost of debt 2.58 (%) Chapter 5.1
Duration of gas supply 30 (years) Chapter 5.2
Tax rate 25 (%) Chapter 5.1
(Source: developed by Kim, D.H.)
Table 24 shows the result of estimated NPV and IRR from cash flows by
scenarios. All scenarios have a positive NPV and a project IRR that exceeds 10 percent
which is a KOGAS’ minimum IRR for an investment. The project IRR means that no
debt is necessary for the project. The equity IRR accounts for using debt for the project.
The result indicates that the higher the growth rates, the higher IRR and NPV. According
to KOGAS’s administrative guidelines for an investment, the project IRR must exceed 10
percent to advance to a feasibility study or front end engineering design (FEED). Based

48
on the result in Table 24, KOGAS may advance to a next step for the South Sumatra
Natural Gas Pipeline Project.
Table 24: Result of NPV and IRR from Cash Flows
Scenarios IRR NPV (Unit: USD)
Project IRR Equity IRR Project NPV Equity NPV
Scenario 1 11% 15% 114,299,000 43,887,000
Scenario 2 16% 21% 286,290,000 121,274,000
Scenario 3 21% 28% 462,692,000 224,140,000
(Source: developed by Kim, D.H.)
For a further analysis of scenarios, this thesis builds a two-dimensional data table
between a growth rate of gas demand and WACC. The growth rate varies from 2 percent
to 11 percent, and WACC varies from 4 percent to 15 percent (see Table 25). Table 25
shows that the project NPV increases as growth rate of gas demand increases and WACC
decreases. While the project NPV is affected by both variables, the project IRR is
influenced only by the growth rate of gas demand. Regardless of variations of WACC,
the project IRR increases as the growth rate increases. To meet a KOGAS’ minimum rate
for an investment and have a positive NPV, WACC ought to be less than 9 percent and
the growth rate of gas demand is larger than 3 percent as indicated in Table 25.

49
Table 25: Estimation of Project NPV and Project IRR
(Source: developed by Kim, D.H.)
5.5 MONTE CARLO SIMULATION
Table 24 and Table 25 results have limitations because this analysis considers
only one or two value drivers, such as the growth rate or WACC, at a time, with other
factors held constant. The analysis does not provide information about probabilities
associated with exceeding or dropping below the breakeven value drivers. To address
these shortcomings, this thesis performs a Monte Carlo simulation by using @RISK
software. Monte Carlo simulation provides a tool that can help an analyst evaluate what
2% 3% 4% 5% 6% 7% 8% 9% 10% 11%
4% $64,824 $84,117 $107,139 $134,686 $167,737 $207,481 $255,375 $313,196 $383,113 $467,774
5% $46,187 $62,012 $80,806 $103,194 $129,939 $161,968 $200,417 $246,664 $302,393 $369,655
6% $30,818 $43,884 $59,327 $77,639 $99,417 $125,389 $156,440 $193,647 $238,322 $292,059
7% $18,056 $28,915 $41,687 $56,760 $74,606 $95,795 $121,024 $151,136 $187,156 $230,328
8% $7,387 $16,470 $27,101 $39,588 $54,303 $71,698 $92,320 $116,834 $146,044 $180,926
9% ($1,589) $6,056 $14,961 $25,371 $37,580 $51,948 $68,907 $88,983 $112,809 $141,152
10% ($9,191) ($2,714) $4,792 $13,523 $23,716 $35,657 $49,688 $66,227 $85,774 $108,937
11% ($15,667) ($10,146) ($3,780) $3,588 $12,151 $22,134 $33,813 $47,518 $63,649 $82,687
12% ($21,215) ($16,482) ($11,050) ($4,793) $2,441 $10,839 $20,617 $32,042 $45,432 $61,169
13% ($25,995) ($21,914) ($17,252) ($11,908) ($5,757) $1,347 $9,583 $19,163 $30,341 $43,425
14% ($30,135) ($26,596) ($22,573) ($17,981) ($12,722) ($6,676) $301 $8,380 $17,766 $28,705
15% ($33,739) ($30,652) ($27,161) ($23,194) ($18,672) ($13,497) ($7,552) ($699) $7,226 $16,424
2% 3% 4% 5% 6% 7% 8% 9% 10% 11%
4% 9% 10% 11% 11% 12% 13% 14% 15% 16% 17%
5% 9% 10% 11% 11% 12% 13% 14% 15% 16% 17%
6% 9% 10% 11% 11% 12% 13% 14% 15% 16% 17%
7% 9% 10% 11% 11% 12% 13% 14% 15% 16% 17%
8% 9% 10% 11% 11% 12% 13% 14% 15% 16% 17%
9% 9% 10% 11% 11% 12% 13% 14% 15% 16% 17%
10% 9% 10% 11% 11% 12% 13% 14% 15% 16% 17%
11% 9% 10% 11% 11% 12% 13% 14% 15% 16% 17%
12% 9% 10% 11% 11% 12% 13% 14% 15% 16% 17%
13% 9% 10% 11% 11% 12% 13% 14% 15% 16% 17%
14% 9% 10% 11% 11% 12% 13% 14% 15% 16% 17%
15% 9% 10% 11% 11% 12% 13% 14% 15% 16% 17%
WACC
ProjectNPV
ProjectIRR
WACC
Growth rate of gas demand
(Unit : Thousand dollars)
Growth rate of gas demand

50
can happen to an investment’s future cash flows and summarize the possibilities in a
probability distribution [44].
This thesis performs a Monte Carlo simulation of Scenario 1 because Scenario 1
stays around the KOGAS’ hurdle rate of 10 percent. The first step for the Monte Carlo
simulation in Scenario 1 is to define a set of hypothetical assumptions for the probability
distributions used to describe key value drivers. The analysis defines seven value drivers
that underlie the uncertainty in the investment outcome: (1) toll fee; (2) initial gas
demand; (3) growth rate of gas demand; (4) CAPEX; (5) OPEX; (6) cost of debt; and (7)
tax rate (see Table 26). This thesis uses two alternate distributions, a uniform or a
triangular distribution, to value drivers, except for tax rate which applies a discrete
distribution. The uniform and triangular distributions are common distributions used to
model the uncertainty inherent in an investment [44]. Toll fee and initial gas demand
have a uniform distribution with 20 percent ranges from a mean value. Growth rate of gas
demand has a triangular distribution which ranges from 2.5 percent to 7.7 percent. Cost
of debt ranges between 2.58 percent and 6 percent, which has been suggested from a
bank in Korea. Tax rate has a discrete distribution with 25 percent and 30 percent.
Indonesia’s corporate tax rate has remained at 25 percent since 2010; it had been 30
percent before 2010 [63].

51
Table 26: Value Drivers Using a Probability Distribution for a Monte Carlo Simulation
Value drivers Unit Expected value Distribution Range (min/max)
Toll fee USD/ MMBTU 1.0 Uniform
Initial gas demand (Power Plant & Industrial)
MMSCFD 29.10 Uniform
Growth rate of gas demand % 5.1 Triangular
CAPEX USD 93,560,000 Triangular
OPEX USD/ MMBTU 0.20 Triangular
Cost of debt % 2.58 Triangular
Tax rate % 25 Discrete
(Source: developed by Kim, D.H.)
Monte Carlo simulations by using @Risk software have been solved for 10,000
iterations, based on defined value drivers and constructed cash flow. Output variables
include project NPV, project IRR, equity NPV, and equity IRR. This thesis discusses
below only the result of project NPV and project IRR in which KOGAS might interest.
Fig. 9 shows the result of Monte Carlo simulation of the project IRR. The mean
value of project NPV is approximately 90 million USD and standard deviation is about
43 million dollars. The maximum value is 307 million USD while the minimum value is
about -13 million USD. The probability that the project NPV has a negative value only
accounts for 0.3 percent of the simulated distribution (Fig. 10). It means that there is a

52
99.7 percent chance that the investment would generate cash flows making a positive
NPV. Based on the result of project NPV by Monte Carlo simulation, the South Sumatra
Natural Gas Pipeline Project might be good option for KOGAS. Therefore, KOGAS
might advance to a feasibility study or FEED.
Figure 9: Simulation Output for the Mean Value of Project NPV
(Source: developed by Kim, D.H.)

53
Figure 10: Simulation Output for the Probability of Project NPV
(Source: developed by Kim, D.H.)
Even if project NPV yields a positive NPV, KOGAS’ regulation requires a higher
project IRR than 10 percent. Fig. 11 shows the simulation result of the project IRR. The
mean value of project IRR accounts for 10.8 percent, and the standard deviation is 2.1
percent. It can be interpreted that a mean of the project IRR falls between 7.37 percent
and 14.42 percent with a 90 percent confidence. However, as shown in Fig. 12, there is a
35.7 percent chance that the project IRR will be less than 10 percent, which is a lower
limit of return that KOGAS can accept for an investment. It demonstrates that the South
Sumatra Natural Gas Pipeline Project might have some risks in spite of 99.7 percent
possibility of positive NPV. If KOGAS decides to further advance, KOGAS might need
an additional study about which value drivers could affect the project. A more detailed
sensitivity analysis could develop useful information.

54
Figure 11: Simulation Output for the Mean Value of Project IRR
(Source: developed by Kim, D.H.)
Figure 12: Simulation Output for the Probability of Project IRR
(Source: developed by Kim, D.H.)

55
5.6 SENSITIVITY ANALYSIS
Sensitivity analysis provides a systematic way to analyze how changes in an
investment’s value driver can affect the project IRR or project NPV. This thesis performs
a sensitivity analysis by using @Risk software. The results can be illustrated as a tornado
diagram with a result of output variables.
Figure 13 illustrates the result of the sensitivity analysis with regard to the project
IRR. The cost of debt is removed from seven value drivers because the cost of debt has
nothing to do with project IRR. Figure 13 indicates that toll fee has the greatest impact on
project IRR as indicated at the top of the diagram. Each of the other factors has a
successively smaller effect on the project IRR down the figure, creating a funnel-shaped
diagram. By a variation of toll fee, the project IRR ranges from 8.7 percent to 12.9
percent. In the same way, the variation of the growth rate of gas demands makes the
project IRR range from 9.2 percent to 12.4 percent.
Figure 13: Result of the Sensitivity Analysis of the Project IRR
(Source: developed by Kim, D.H.)

56
Figure 13 illustrates that value drivers involving revenues, which includes toll fee,
growth rate, and initial gas demand, have a larger impact on project IRR than expense’s
side such as CAPEX, OPEX, and tax rate. It means that KOGAS may have to better
understand initial gas demand and a growth rate. The result also could motivate KOGAS
and PDPDE to obtain a higher toll fee from the negotiation with BPH MIGAS under the
existing regulations.
From Chapter 4 and Chapter 5, this thesis identified the supply risk from
insufficient gas reserves and sensitive value drivers to affect an economic viability of the
project. To minimize these risks and maintain an economic viability of the South Sumatra
Natural Gas Pipeline Project, KOGAS ought to manage identified risks through risk
management as discussed in Chapter 6.

57
Chapter 6: Risk Management
This chapter discusses risk management to identify significant risks and establish
mitigation strategies of the South Sumatra Natural Gas Pipeline Project. Among Asian
privatized infrastructure projects, only approximately 30 percent of projects have resulted
in satisfactory outcomes [64]. It means the importance of a risk management which could
play an important role to minimize risks and maintain a required project IRR of KOGAS.
6.1 RISK IN INFRASTRUCTURE PROJECTS
To meet growing public service demands, some governments might solicit private
investments for public infrastructure through privatization or joint public/private
investments (JPPI). JPPI can help a developing country expand infrastructure by
diversifying sources for capital investment [65]. A typical approach would be of a
government to grant the private sector the right to finance, design, and construct a
specific infrastructure and operate it for a concession period [66]. Private participation in
infrastructure projects can transfer project risks, financial risks, or administrative burden
form the public to the private sector [66]. One key element is for the private sector to
identify the risks associated with projects and to formulate appropriate risks management
strategies to deal with them [66].
6.1.1 Risk Management
Risk management is the process of identifying and assessing different risks,
planning risk mitigation, implementing a risk mitigation plan, and controlling risks [67].

58
The objective of project risk management is to decrease the probabilities and impacts of
events adverse to project purposes [67].
The first step of risk management is risk identification or determining the source
of risks that may affect a project, through methods such as benchmarking, brainstorming,
Delphi techniques, interviews, historical data from similar projects, questionnaires, risk
breakdown structure, or workshops [67]. Among those tools, data and knowledge from
prior similar projects might be useful in identifying risks relative to infrastructure
projects. For example, the section below discusses risks of the South Sumatra Natural
Gas Pipeline Project as a build-own-operate (BOO) project, one of various public-private
partnership (PPP) models.
6.1.2 Public-Private Partnership
A public-private partnership (PPP) is an agreement between a host government
and a private entity. The private sector supplies infrastructure assets and services
traditionally provided by a government [68]. If the private partner pays for the
infrastructure constructions, the PPP approach can relieve a government of budgetary
pressure for infrastructure construction. There are different forms of PPP, according to
the extent of private involvement in public projects [68]. The South Sumatra Natural Gas
Pipeline Project might be classified as a case of build-own-operate.
Under Indonesia’s Government Regulation No.36/2004, downstream businesses
that operate through an Indonesian incorporated entity must acquire a business license
issued by the MEMR (Ministry of Energy and Mineral Resource) with advice from BPH
MIGAS [9]. KOGAS-PDPDE must also obtain Special Rights from MEMR in order to
transmit gas via pipeline within the stipulated transmission and distribution routes [12].

59
In the BOO model, the government grants the right to design, build, finance,
operate, and maintain a project to a private entity in a manner similar to a build-operate-
transfer (BOT) model [69]. BOO or BOT project can be a complex and risky undertaking
due to many uncertainties: delays in completion, cost overruns, technical and financial
failure, expropriation, poor management, and legislative or regulatory changes [66].
Risks vary according to the country and project. PPP project risks can be divided into two
categories: general risks and project risks [70], as discussed below.
6.1.3 General Risks in Infrastructure Projects
General risks reflect macro-environmental factors of the host country, such as the
political environment, economic conditions, the legal system, taxation, or fluctuations in
the currency exchange rate [66]. These can be subdivided into political risks, financial
risks, and legal risks.
Political risks involve issues or concerns associated with the local, regional,
national political situation, and the regulatory situation of the host country [71]. Not only
do governments play an important role in infrastructure project, but they also represent a
constant risk source by interfering with projects. Among the political risks, sovereign
risks include an expropriation of assets by the government, restriction of operating
freedom, financial penalties, and constraints of repatriation. Instability risks are
associated with a cancellation or revision of contracts and damage to property from
terrorism or riot [66]. The public can be a political risk if a project owner is a foreign
entity or if the project is located in an urban setting with no perceived value-added
benefit [68]. To hire local contractors might be a possible solution to mitigate risks from
the public due to their direct participation in the project.
60
Financial risks are associated with the host country’s economic environment,
which includes currency devaluation, foreign exchange fluctuations, fluctuations in
interest rate, and inflation [66]. The fluctuations of interest rate occur due to the
investment through long-term loans, which might affect the cost of debt and projected
revenue. Foreign exchange rate changes can affect revenue. Because net revenue of the
project is often denominated in a foreign currency, a project company is exposed to
exchange rate risk, as the foreign currency may depreciate against the domestic currency
of the project company [68].
Legal risks result from changes in laws or regulations and legal systems which
may adversely affect a project [66]. Some changes in tax rate, local content rate,
corporate and environmental regulations, the terms of a project, and rejection of permit
extension might disrupt a project’s cash flow.
6.1.4 Project Risks in Infrastructure Projects
Project risks directly relate to project phases: development, construction, and
operation.
In the development phase, all pipeline projects begin with an idea or a concept
that might fill a specific need, within a specific time, and at a specific location [71].
Primary participants would discuss their roles and expectations. They may specify a
project concept through feasibility to financing. For some infrastructure projects,
participants are responsible for the arrangement of project finance. In developing
countries, some projects may be financed by a government borrowing from the
international banking market, development-finance institutions such as the World Bank,
or through export credits [72]. Introduction of private finance through public-private

61
partnerships can transfer a share of the financing burden to the private sector. A delay or
failure of a financial closing can affect the development phase. Development-phase risks
include defects in the request for proposal, planning and approval delays, errors in
economic and technological assessment, or rejection of the proposal by the granting
authority [66].
Construction-phase risks reflect whether a project can be completed on time, on
budget, and to the required specification [72]. Some construction-phase risks include site
acquisition and access, site condition, permits, risks relating to the construction
contractor, cost overruns, delay in project completion, third-party risks, inadequate
performance on project completion [72]. Among these construction phase risks, cost
overruns and delay in project completion may be most important factors. Cost overruns
can affect the profitability of the project by increasing construction and financing costs
[66]. It is difficult to foresee the overall cost due to inherent construction uncertainty. In
spite of a feasibility study or front end engineering design (FEED) in a development
phase, the project cannot eliminate cost-overrun risk. In some projects, the application of
advanced technology can complicate the construction phase. For example, unexpected
underground conditions can be a source of risks. Right of way (ROW) issues also cause
both cost overruns and delay as pipelines pass through local population centers. ROW
acquisition is both an economic issue and a socially sensitive issue involving matters of
public need and property owner rights [73]. Completion delays may have several
consequences [72]: financing costs will be higher because the construction debt is
outstanding for a longer period; revenues from operating the project will be deferred; and
penalties may be imposed by the off-takers or suppliers.
Operation-phase risks mainly relate to insufficient revenue and an increased cost
of operation and maintenance (O&M) [66]. Insufficient revenue is associated with an off-
62
take risk, which involves any reduction in or failure of the use of the services provided by
the facility [74]. The main cause of the off-take risk might be a reduced demand for the
off-take, inability of the off-taker to pay for the off-take, technical or practical difficulties
with delivering the off-take, and public reaction which result in a boycott against the off-
take [74]. Insufficient revenue also relates to the level of penalty or abatement for under
performance or the index linked payment period [70]. The project must meet given
performance levels to earn revenues to pay operating costs, repay debt, and achieve the
levers of profit. Efficiency reductions during operating phase, caused by equipment
malfunction or damage to facilities, can increase O&M cost and disrupt a project’s
revenue streams.
6.2 RISK MANAGEMENT OF THE SOUTH SUMATRA NATURAL GAS PIPELINE PROJECT
The South Sumatra Natural Gas Pipeline Project, categorized as a BOO, may face
many of the risks discussed above. Because KOGAS has not completed a feasibility
study or FEED yet, it will incur costs further studies. Development phase risks could
affect KOGAS’ capacity to execute the project, which should be thoroughly reviewed
prior to an investment through the feasibility study, commercial and technical
evaluations, and legal reviews. Sub-sections below identify general and project risks and
also suggest mitigation strategies.
6.2.1 General Risks and Mitigation Strategies
Indonesia has climbed in the World Bank’s Doing Business ranking from 114th in
2014 to 72nd in 2017 under the leadership of Indonesian President Joko Widodo [75].

63
This positive development is related to the Indonesian government’s effort to implement
reforms to improve its business and investment climate [75]. The Indonesian government
continues to announce policy reforms intended to reduce red-tape, strengthen the
country’s investment climate, and enable economic growth. President Widodo has
undertaken several important efforts such as moving many government services online.
Investors have welcomed policy reforms, which include opening sectors for investors and
reducing high logistics costs [37].
AMBest reports that Indonesia has political risks due to the president’s preference
for domestic firms and resource nationalization [76]. Indonesian contract enforcement
can be inefficient. Corruption in the legal system is reported to be relatively widespread
[76]. The Corruption Perception Index ranks Indonesia 96 out of 180 countries in 2017
[77]. KOGAS or other participants may consider using the UN Global Compact
Management Model in fighting corruption and implementing the 10th Principle (see Fig.
14). Business should work against corruption in all its forms, including extortion and
bribery [78]. The UN recommends companies follow six steps: committing, assessing,
defining, implementing, measuring, and communicating a corporate sustainability
strategy based on the global compact against corruption [78]. However, it is not easy for
companies such as KOGAS and PDPDE to break customs. KOGAS has a challenge to
obtain a host government’s guarantee of transparency in legal procedures as well as
purchase appropriate insurance as preventative measures against political risks.

64
Figure 14: UN Global Compact Management Model
(Source: Figure in page 9 from [78])
AMBest reports that Indonesia has moderate levels of economic and financial
system risk [76]. The Indonesia’s economy has grown steadily and robustly over the past
few years; for example, it expanded 5.1 percent in 2017. Inflation in Indonesia, which has
been relatively stable in recent years, is projected to return to 3.5 percent in 2018 [76].
Moody’s upgraded Indonesia’s credit rating to BAA2 with stable outlook on April 2018
[79]. Standard & Poor’s and Fitch ratings in 2017 stand at BBB- and BBB with stable
outlook, respectively [80]. These grades correspond to a “low” investment grade rating. It
may be “satisfactory”, but an investor ought to monitor its risks [81]. In order to protect

65
their investments, most investors restrict their investments to the minimum rated
investment grade, which corresponds to BBB (Standard & Poor’s) and BAA2 (Moody’s)
[81]. Credit ratings affect the cost of borrowing, meaning that the higher credit ratings,
the lower interest rates, which will bring a positive effect on the cash flow.
Fluctuation in foreign exchange rates remains a key financial risk. If KOGAS
cannot make a profit in U.S dollars, the company may hedge foreign exchange risks.
Indonesia’s central bank recently urged businesses to hedge their foreign exchange needs
beyond minimum requirements, as policymakers seek to mitigate risks of further capital
outflows following the rupiah’s slump [82].
One way to mitigate risks is to use Indonesia’s infrastructure guarantee program,
as launched in 2006 as Ministry of Finance Regulation No. 38/PMK/2006 [83]. This
regulation prescribes procedures for submitting proposals to seek government guarantees
against political, project performance, and demand risks. Political risks include
expropriation, change in legislation, and inconvertibility/transferability of foreign
exchange. Project performance risks encompass land acquisition risk, tariff risk, and
changes in output specification. Demand risks are to protect the project sponsor from up
and downside demand [83]. Although this program has been applied only to BOT
projects, KOGAS might attempt to adopt it for the South Sumatra Natural Gas Pipeline
Project by negotiating with the Indonesian government.
6.2.2 Project Risks and Mitigation Strategies
The South Sumatra Natural Gas Pipeline Project may include several project risks
according to its project phases; development, construction, and operation.

66
In the development phase, the most significant risks are the revision of the master
plan, the actual volume of gas reserves, and uncertain gas demands (see Table 27). The
current master plan for the development of TAA SEZ considers a coal-fired power plant.
If BPH MIGAS does not change its master plan (from a coal-fired power plant to a
natural gas-fired power plant), KOGAS could have to delay or cancel its participation in
the project. Insufficient supply of gas and decreasing long-term gas reserves could create
gas shortage for off-takers and subsequently interrupt project cash flow, as mentioned in
Chapter 4.2.3. The anticipated available gas volume for the South Sumatra Natural Gas
Pipeline Project might be only 1,396 billion cubic feet (BCF) at a maximum rate. This
reserve is not sufficient for potential gas demands for power generation and industrials in
Scenario 2 or Scenario 3. If KOGAS cannot secure guaranteed gas reserves for a thirty-
year supply from other gas fields, it could delay or cancel the project. Uncertain gas
demand could be a key risk for the project. The stagnant growth in the TAA SEZ and
growth rate of gas demands could affect project sustainability. Securing a long-term gas
transportation agreement (GTA), including the provision of take-or-pay (TOP) with gas
trading companies, might mitigate the risk related to uncertain gas demand. TOP
provision requires purchasers to pay for a pre-specified minimum quantity of natural gas
whether or not they take the gas, and producers require delivering this quantity of gas
[84]. As GTAs might discourage off-takers to switch to alternative fuels, KOGAS might
assure the stable cash flow during contracted period. Any delay or difficulty in project
finance could delay project initiation. KOGAS has planned to use project finance to
minimize the equity under an investment regulation of the Korean government and for
the risk mitigation. However, the process of project finance is not simple due to the due
diligence and the lender’s requirements. Therefore, the support of the State of South
Sumatra and active collaboration of KOGAS and PDPDE might be helpful for the

67
efficient and fast due diligence by mitigating remained risks. Table 27 lists some of the
key risks and risk mitigation strategies.
Table 27: Project Risks and Mitigation Strategies in Development Phase
Identified risks Mitigation strategies Revision of the master plan from coal-fired power plant to gas-fired power plant
Persuade the government to change their plan, or delay/cancel the project
Insufficient gas reserve
Conduct a supply study to accurately figure out the amount of available gas for the project If the gas reserve is not enough to secure an appropriate NPV/IRR, delay/cancel the project
Uncertain gas demand
Examine demand projections and information on the willingness of trading companies to pay tariff Secure long-term gas transportation agreement (GTA) including the provision of take-or-pay (TOP) before an investment to discourage them to switch to alternative fuels If the gas demand is not enough to secure an appropriate NPV/IRR, delay/cancel the project
Delays in necessary approvals (license and permits for the transportation business)
Obtain consistency in the policy through all levels of government agencies Assistance of the South Sumatra government and local company (PDPDE)
Errors in feasibility studies Employ independent consultants for careful feasibility studies
Difficulty in project finance Support of the State of South Sumatra Support of KOGAS-PDPDE for smooth due-diligence
Partners Verify the participants’ financial conditions
(Source: developed by Kim, D.H.)
68
In the construction phase, the identified risks are cost overruns, completion
delays, the issue of right of way (ROW), and technical issues to connect KOGAS-
PDPDE pipelines with existing PUSRI pipelines (see Table 28). An estimated cost prior
to FEED includes high risks related to cost overruns. To mitigate KOGAS risks, lump-
sum construction contracts might be one way to transfer the risk to contractors. Under the
lump-sum method, a pre-agreed sum, regardless of actual cost incurred, is paid by the
employer. Works actually done are not measured but paid against the payment schedule
[85]. Through the lump-sum contracts, KOGAS might transfer the financial risk to
contractors. KOGAS still has a challenge to assure contractor quality, so as to maximize
the profit within fixed cost. In this case, binding contractors to project equity sharing
might be a mitigation strategy to avoid cost overruns and poor quality. By participating in
equity sharing, the contractor will be concerned with the return on equity during
operation period. Completion delay might result in higher financing cost, deferred
revenue, and penalties by gas suppliers or off-takers, as discussed above. KOGAS can
diminish the risk related to the delay in completion through a contractor performance
bond. A performance bond can secure the risk that the contractor may breach its duty to
complete the works [85]. Acquiring ROW for gas pipeline projects can be costly and time
consuming. Because delay in the ROW acquisition process can lead to major delays in
construction, dealing with ROW in a timely manner would help begin project
construction on an approved schedule [73]. The assistance of PDPDE or the State of
South Sumatra might be helpful in resolving ROW issue with local populations. KOGAS
may have to install gas pipeline under public land alongside existing traffic roads.
KOGAS may also seek to transfer the responsibility of the ROW to EPC contractors.
According to the open access policy under Law No.36/2004 of Indonesia, KOGAS-
PDPDE pipeline might connect with the existing Grissik-Pusri pipeline. KOGAS-PDPDE

69
needs to resolve technical issues related to the connection of pipelines and discuss about
the appropriate schedule to connect pipelines to avoid any disruption to supply gas to the
Pusri plant. Table 28 lists project risks and risk mitigation strategies for the construction
phase.
Table 28: Project Risks and Mitigation Strategies in Construction Phase
Identified risks Mitigation strategies
Cost overruns
Lump-sum construction contracts Bind contractors to participate in project equity sharing Obtain standby credit as contingency Secure an appropriate contingency in estimating CAPEX
Completion delays
Request performance bond Add specific provisions for early completion incentives and liquidated damages to contract Efficient construction management by KOGAS
Subsurface condition to install pipelines
Ensure the technical study to survey geotechnical condition and propose appropriate mitigation plans
Right-of-way
Risk transfer to a contractor Guarantee of assistance of the State of South Sumatra and PDPDE Make all administrative procedures transparent
Connection between KOGAS-PDPDE pipeline and PUSRI pipeline
Check the specification required to connect pipelines and negotiate a tapping schedule with the owner of Pusri pipeline
(Source: developed by Kim, D.H.)
In the operation phase, the risks such as insufficient gas supply, capacity of the
flow rate, revenue, rejection of permit extension, and force majeure exist in the South
Sumatra Natural Gas Pipeline Project (see Table 29). The most significant risk may be a

70
revenue risk as discussed previously. KOGAS-PDPDE generates revenues through
transportation activities by transmitting natural gas via their pipeline, so KOGAS-PDPDE
ought to monitor the growth rate of TAA SEZ. They may also monitor an appropriateness
of current tariffs and projections of off-takers’ attitudes toward paying increased tariffs.
Another risk is the extension of the transportation license and Special right, so that
KOGAS-PDPDE can operate for thirty years. KOGAS may seek a guarantee of the State
of South Sumatra or central government for the permit extension. To mitigate force
majeure for the operation phase, KOGAS could obtain standby credit as a contingency
and purchase proper insurance policies. Table 29 lists project risks and risk mitigation
strategies for the operation phase.
Table 29: Project Risks and Mitigation Strategies in Operation Phase
Identified risks Mitigation strategies
Capacity of the flow rate via KOGAS-PDPDE pipeline
Work closely to the owner of PUSRI pipeline to correspond to the variation of their gas flow and pressure
Revenue risk
Monitor prospects for the growth rate of gas demand, appropriateness of current tariffs, and projections of consumer attitudes toward paying increased tariffs Secure a long-term gas transportation agreement (GTA) including the provision of take-or-pay (TOP) with new off-takers to discourage them to switch to alternative fuels
Rejection of permit extension
Obtain the host government’s guarantee of the permit extension, or prepare the alternative way to deal with KOGAS-PDPDE pipeline
Proactively engage the government agencies
Force majeure Obtain standby credit as contingency
Purchase proper insurance (Source: developed by Kim, D.H.)

71
Chapter 7: Conclusion
This thesis performed an economic analysis of the South Sumatra Natural Gas
Pipeline Project to assess its economic viability based on its discounted future cash flow.
For producing revenues, this study assessed the potential gas demand for electricity
generation of 79.1 MMSCFD and industrial feedstock of 211.7 MMSCFD. The estimated
maximum gas demand was adjusted by calculating the capacity of the flow rate to be
248.5 MMSCFD. This research also analyzed the availability of gas source from gas
fields to ensure KOGAS-PDPDE’s transmission, which demonstrated a substantial risk in
sustainability of thirty-year operation depending on the growth rate. The result of supply
analysis showed that KOGAS may need additional gas reserves to secure thirty-year
supply contracts. To estimate project costs, this study analyzed historical pipeline
projects in the U.S. and estimated unit project CAPEX (USD/inch-mile) including labor,
materials, ROW, and miscellaneous costs. This study developed multipliers for each costs
component from comparisons between the United States and Indonesia. Compared to a
unit cost of 159 USD per inch-meter in the U.S., the unit cost for the South Sumatra
Natural Gas Pipeline Project was estimated to be 63.22 USD per inch-meter.
From the discounted future cash flow, this thesis calculated NPV and IRR with
regard to three scenarios, based on different growth rates. All scenarios have a positive
NPV and a project IRR that exceeds 10 percent, which is a KOGAS’ investment
threshold. Two dimensional data analysis between WACC and the growth rate of gas
demand showed that WACC ought to be less than 9 percent and the growth rate of gas
demand is larger than 3 percent, with other factors held constant. This study performed a
Monte Carlo simulation by using @Risk software to evaluate a probability for the project
IRR to be less than the KOGAS’ investment threshold. The simulation showed that there

72
is a 35.7 percent probability that the project IRR will be less than 10 percents in Scenario
1. This probability would encourage KOGAS to perform a risk management to maintain
an economic viability of the South Sumatra Natural Gas Pipeline Project. Sensitivity
analysis identified substantial risk factors, such as toll fee, growth rate, and initial gas
demand.
In addition, this paper analyzed primary risks and mitigation strategies to
successfully implement the South Sumatra Gas Pipeline Project in Indonesia. Both
general risks and project risks were analyzed. The general risks discussed include
political risks, financial risks, and legal risks. The project risks were analyzed according
to project phase such as development phase, construction phase, and operation phase.
Natural catastrophes, such as earthquakes or tsunamis, or human-made catastrophes,
including terrorism or gas piping damage, are beyond the scope of this thesis, although
KOGAS might wish to evaluate their challenge.
Based on the economic analysis in this research, this project could be a viable
project for KOGAS. However, this result of economic analysis and identified risks ought
to be thoroughly reviewed through a feasibility study, commercial and technical review,
and legal reviews prior to an investment. In addition, collaborative working relationships
between KOGAS, Indonesian government, and numerous contractors might play an
important role to achieve the economic viability of the South Sumatra Gas Pipeline
Project. The effective management of the South Sumatra Natural Gas Pipeline Project
should strengthen KOGAS’ capability for overseas business and also enhance Indonesia’s
economic development.

73
Bibliography
[1] British Petroleum, 2017, Energy Outlook 2017,
https://www.bp.com/content/dam/bp/pdf/energy-economics/energy-outlook-
2017/bp-energy-outlook-2017.pdf (examined 30 Jul. 2018).
[2] EIA, 2017, International Energy Outlook 2017,
https://www.eia.gov/outlooks/ieo/pdf/0484(2017).pdf
(examined 28 Jul. 2018).
[3] EIA, 2018, Country Analysis Brief: South Korea,
https://www.eia.gov/beta/international/analysis_includes/countries_long/Korea_S
outh/south_korea.pdf (examined 21 Sep. 2018).
[4] Puwanto, W.W., Muharam, Y., Pratama, Y.W., Hartono, D., Soedirman, H., and
Anindhito, R., 2016, Status and Outlook of Natural Gas Industry Development in
Indonesia, Journal of Natural Gas Science and Engineering, v. 29, p. 55-65.
[5] Wood Mackenzie, 2018, Global Gas Markets Long-term Outlook,
https://my.woodmac.com/reports/gas-markets-global-gas-markets-long-
term-outlook-asia-gas-and-lng-h1-2018-
56489969?contentId=56489969#56489990 (examined 5 Sep. 2018).
[6] EIA, 2015, Indonesia Country Analysis Brief,
https://www.eia.gov/beta/international/analysis_includes/.../Indonesia/indonesia.
pdf (examined 25 Jul. 2018).
[7] KOGAS, and PDPDE, 2016, Memorandum of Understanding-Infrastructure Projects
in South Sumatra, Indonesia.
[8] Hasan, M.H, Mahlia, T.M.I., and Nur, H., 2012, A review on energy scenario and
sustainable energy in Indonesia, Journal of Renewable and Sustainable Energy
Reviews, v. 16, p. 2316-2328.

74
[9] PWC, 2018, Oil and gas in Indonesia – Investment and Taxation Guide,
https://www.pwc.com/id/en/energy-utilities-mining/assets/oil-and-gas/oil-and-
gas-guide-2018.pdf (examined 5 Sep. 2018).
[10] IEA, 2014, Energy Supply Security of Indonesia 2014,
https://www.iea.org/publications/freepublications/publication/ESS_Indonesia_
2014.pdf (examined 19 Sep. 2018).
[11] ICLG, 2018, Oil & Gas Regulation 2018. International Comperative Legal Guides,
https://iclg.com/practice-areas/oil-and-gas-laws-and-regulations/Indonesia
(examined 20 Sep. 2018).
[12] GBG Indonesia, 2017, Oil and Gas Transportation and Infrastructure in Indonesia,
Global Business Guide Indonesia,
http://www.gbgindonesia.com/en/main/legal_updates/oil_and_gas_transportation
_and_infrastructure_in_indonesia.php (examined 10 Sep. 2018).
[13] BPH MIGAS, 2014, Open Access Policy by BPH MIGAS,
http://indonesiangassociety.com/wp-content/uploads/2016/06/Keynote-2-Andy-
N.-Sommeng.pdf (examined 21 Sep. 2018).
[14] Republic of Indonesia National Council for Special Economic Zone, 2018, Tanjung
Api-Api, http://kek.go.id/kawasan/Tanjung-Api-Api (examined 25 Jul. 2018).
[15] ASEAN briefing, 2018, Indonesia’s Growing Special Economic Zones-
Opportunities and Challenges,
https://www.aseanbriefing.com/news/2018/08/24/indonesias-
growing-special-economic-zones-opportunities-and-challenges.html
(examined 11 Nov. 2018).
[16] BKPM, 2017, Opportunities for Foreign Direct Investment in Indonesia,
http://www.boi.go.th/upload/BKPM_Updated_84830.pdf
(examined 20 Sep. 2018).
[17] Nusantara Maritime News, 2016, Tanjung Api-Api to be Energy Industrial Area,
https://maritimenews.id/03/jxjkljLLx/ (examined 5 Sep. 2018).

75
[18] KOGAS, and PDPDE, 2016, Minute of Meeting.
[19] Shell, 2017, Shell LNG Outlook 2017,
http://www.shell.com/energy-and-innovation/natural-gas/liquefied-natural-gas-
lng/lng-outlook/_jcr_content/par/textimage_1374226056.stream/1488553856456
/88c077c844a609e05eae56198aa1f92d35b6a33cc624cf8e4650a0a6b93c9dfb/shell
lng-outlook-2017-overview.pdf (examined 28 Oct. 2017).
[20] EIA, 2017, International Energy Outlook 2017,
https://www.eia.gov/outlooks/ieo/pdf/0484(2017).pdf (examined 28 Jul. 2018).
[21] Pertamina Gas, 2017, Petagas to Team up with Rekind for the Construction of
Grissik-Pusri Gas Pipeline, http://www.pertagas.pertamina.com/pertagas-to-team-
up-with-rekind-for-the-construction-of-grissik-pusri-gas-pipeline
(examined 5 Sep. 2018).
[22] Hogan Lovells, 2013, Doing Business in Indonesia,
http://www.hoganlovells.com/files/upload/doing%20business%20in%20indonesia
_reduced.pdf (examined 11 Sep. 2018).
[23] KOGAS, 2018, KOGAS Brochure 2018.
[24] State of South Sumatra, 2012, Master Plan of Tanjung Api-Api Special Economic
Zone (SEZ).
[25] EIA, 2017, Power Plant Operations Report,
https://www.eia.gov/todayinenergy/detail.php?id=32572 (examined 3 Oct. 2018).
[26] Wood Mackenzie, 2018, Corridor-Asset Report,
https://www.woodmac.com/reports/upstream-oil-and-gas-corridor-556541
(examined 28 Oct. 2018).
[27] EIA, 2014, Electric Power Monthly,
https://www.eia.gov/todayinenergy/detail.php?id=14611 (examined 3 Oct. 2018).
[28] Differ, 2012, The Indonesian Electricity System-a Brief Overview,
http://www.differgroup.com/Portals/53/images/Indonesia_overall_FINAL.pdf
(examined 3 Oct. 2018).

76
[29] State of South Sumatra, 2013, Site Plan of Tanjung Api-Api Special Economic Zone
(SEZ).
[30] Parikh, J., Biswas, D., Singh, C., and Singh, V., 2009, Natural Gas Requirement by
Fertilizer Sector in India, Energy, v. 34, p. 954-961.
[31] IETD, 2018, Industrial Efficiency Technology Database,
http://ietd.iipnetwork.org/content/use-alternative-fuels (examined 9 Oct. 2018).
[32] Worrell, E., Price, L., Neelis, M., Galitsky, C., and Nan, Z., 2008, World Best
Practice Energy Intensity Values for Selected Industrial Sectors,
https://eaei.lbl.gov/sites/default/files/industrial_best_practice_en.pdf (examined 9
Oct. 2018).
[33] Francis, D.W., Towers, M.T., and Browne, T.C., 2002, Energy cost reduction in the
pulp and paper industry,
https://www.nrcan.gc.ca/sites/www.nrcan.gc.ca/files/oee/pdf/publications/infosou
rce/pub/cipec/pulp-paper-industry/pdf/pulp-paper-industry.pdf
(examined 7 Oct. 2018).
[34] Wilfred, O.C., and Bourdelon, M.U., 2017, Comparative Analysis of Multiphase
Pressure Drop equations, International Journal of Engineering and Modern
Technology, Vol 3(4), p. 1-17.
[35] McAllister, E.W., 2009, Pipeline Rules of Thumb Handbook: A Manual of Quick,
Accurate Solutions to Everyday Pipeline Engineering Problems, Elsvier Inc., p.
368.
[36] National Energy Council, 2017, Technology Data for the Indonesian Power Sector,
http://www.ea-nergianalyse.dk/reports/1724_technology_data_indonesian_power
_sector_dec2017.pdf (examined 7 Oct. 2018).
[37] World Bank, 2018, Indonesia’s Overview,
https://www.worldbank.org/en/country/indonesia/overview
(examined 30 Oct. 2018).

77
[38] Kallanish Energy, 2018, ConocoPhillips Mulls Extension to Indonesia’s Corridor
Pact, http://www.kallanishenergy.com/2018/09/04/conocophillips-mulls-
extension-to-indonesias-corridor-pact/ (examined 15 Oct. 2018).
[39] Wood Mackenzie, 2017, Jambi Merang-Asset Report,
https://www.woodmac.com/reports/upstream-oil-and-gas-jambi-merang-556576
(examined 28 Oct. 2017).
[40] MEMR, Ministry of Energy and Mineral Resources, 2016, Provision of Raw
Materials for Construction of Gas-based Industries,
http://rocana.kemenperin.go.id/phocadownload/Raker_2016/11.%20bahan%20dj
migas%20-%20rapat%20kerja%20kementerian%20perindustrian%202016.pdf
(examined 19 Oct. 2018).
[41] KPMG, 2018, Equity Market Risk Premium – Research summary,
https://assets.kpmg/content/dam/kpmg/nl/pdf/2018/advisory/equity-market-risk-
premium-july-2018.pdf (examined 14 Jan. 2019).
[42] Deloitte, 2018, International Tax – Indonesia Highlights 2018,
https://www2.deloitte.com/content/dam/Deloitte/global/Documents/Tax/dttl-tax-
indonesiahighlights-2018.pdf (examined 14 Jan. 2019).
[43] U.S. Department of the Treasury, 2019, Daily Treasury Yield Curve Rates,
https://www.treasury.gov/resource-center/data-chart-center/interest-
rates/pages/textview.aspx?data=yield (examined 14 Jan. 2019).
[44] Titman, S., and Martin, J.D., 2015, Valuation: The Art and Science of Corporate
Investment Decisions, Pearson.
[45] NYU Stern, 2019, Country Risk Premium,
http://pages.stern.nyu.edu/~adamodar/New_Home_Page/datafile/ctryprem.html
(examined 14 Jan. 2019).
[46] KOGAS, 2018, Balance Sheet
http://www.alio.go.kr/popReportTerm.do?apbaId=C0147&reportFormRootNo=3
120 (examined 16 Jan. 2019).

78
[47] KOGAS, 2018, Income Statement
http://www.alio.go.kr/popReportTerm.do?apbaId=C0147&reportFormRootNo=3
130 (examined 16 Jan. 2019).
[48] BPH MIGAS, 2013, Regulatory Agency of Oil and Gas Downstream Number 8
Year 2013 about Determination of Transport Rates through Gas Pipes Head of the
Governing Downstream of Oil and Gas.
[49] Schoots, K., Rivera-Tinoco, R., Verbong, G., an Zwaan, B., 2011, Historical
Variation in the Capital Costs of Natural Gas, Carbon Dioxide and Hydrogen
Pipelines and Implications for Future Infrastructure, International Journal of
Greenhouse Gas Control, 5(6): 1614-1623.
[50] INGAA, the Interstate Natural Gas Association of America, 2009, Natural Gas
Pipeline and Storage Infrastructure Projections through 2030,
https://www.ingaa.org/file.aspx?id=10509 (examined 21 Jan. 2019).
[51] INGAA, Interstate Natural Gas Association of America, 2014, North America
Midstream Infrastructure through 2035: Capitalizing on our Energy Abundance,
https://www.ingaa.org/File.aspx?id=21527&v=6be6e34a
(examined 21 Jan. 2019).
[52] Oil & Gas Journal, 2016, Natural Gas Pipeline Profits, Construction Both Up,
https://www.ogj.com/articles/print/volume-114/issue-9/special-report-pipeline-
economics/natural-gas-pipeline-profits-construction-both-up.html (examined 21
Jan. 2019).
[53] Rui, Z., Metz, P.A., Reynolds, D.B., Chen, G., and Zhou, X., 2011, Historical
Pipeline Construction Cost Analysis, International Journal of Oil Gas and Coal
Technology, 4(3): 244-263.
[54] Average Salary Survey, Construction & Labor workers (Indonesia),
https://www.averagesalarysurvey.com/construction-labor-workers/indonesia
(examined 23Jan. 2019).

79
[55] U.S.DOC, the United States Department of Commerce, 2018, Steel Imports Report:
United States, https://www.trade.gov/steel/countries/pdfs/2017/annual/imports-
us.pdf (examined 23Jan. 2019).
[56] World Steel Association, 2018, World Crude Steel Output Increase by 5.3% in 2017,
https://www.worldsteel.org/internet-2017/media-centre/press-
releases/2018/World-crude-steel-output-increases-by-5.3--in-2017.html
(examined 23Jan. 2019).
[57] U.S.DOC, the United States Department of Commerce, 2018, Steel Imports Report:
Indonesia, https://www.trade.gov/steel/countries/pdfs/imports-indonesia.pdf
(examined 23Jan. 2019).
[58] SEAISI, South East Asia Iron and Steel Institute, 2017, Performance of the
ASEAN Iron and Steel Industry in 2017 and Outlook,
http://seaisi.org/file/Performance%20of%20the%20ASEAN%20Iron%20and%20
Steel%20Industry%20in%202017%20and%20Outlook_2018.pdf
(examined 23Jan. 2019).
[59] Steel Benchmarker, 2019, Steel Benchmarker Prices,
http://steelbenchmarker.com/files/history.pdf (examined 23Jan. 2019).
[60] U.S.DOL, the United States Department of Labor, 2019,
https://www.bls.gov/cpi/questions-and-answers.htm (examined 23Jan. 2019).
[61] NUMBEO, 2019, Cost of Living Index for Country 2019,
https://www.numbeo.com/cost-of-living/rankings_by_country.jsp
(examined 23Jan. 2019).
[62] WGC, World Gas Conference, 2003, The Challenges of Further Cost Reductions for
New Supply Options (Pipeline, LNG, GTL),
http://pages.hmc.edu/evans/PipelinesTokyo.pdf (examined 23Jan. 2019).
[63] Trading Economics, 2019, Indonesia Corporate Tax Rate,
https://tradingeconomics.com/indonesia/corporate-tax-rate
(examined 5 Jan. 2019).

80
[64] Kwak, Y.H., 2002, Analyzing Asian Infrastructure Development Privatization
Market, Journal of Construction Engineering and Management, 128(2): 110-116.
[65] Boudet, H.S., Jayasundera, D.C., and Davis, J., 2011, Drivers of Conflict in
Developing Country Infrastructure Projects: Experience from the Water and
Pipeline Sectors, Journal of Construction Engineering and Management, 137(7):
498-511.
[66] Lee, N. and Schaufelberger, J.E., 2014, Risk Management Strategies for Privatized
Infrastructure Projects: Study of the Build-Operate-Transfer Approach in East
Asia and the Pacific, Journal of Management in Engineering, 30(3): 05014001.
[67] Rumane, A.R., 2016, Handbook of Construction Management: Scope, Schedule,
and Cost Control. CRC Press.
[68] Rebeiz, K.S., 2012, Public-Private Partnership Risk Factors in Emerging Countries:
BOOT Illustrative Case Study, Journal of Management in Engineering, 28(4):
421-428.
[69] Pratap, K. V., and Charkrabarti, R., 2017, Public-Private Partnerships in
Infrastructure: Managing the Challenges. Springer.
[70] Ng, A., and Loosemore, M., 2007, Risk Allocation in the Private Provision of Public
Infrastructure, International Journal of Project Management, 25(1): 66-76.
[71] Nielsen, K.R., 2006, Risk Management: Lessons from Six Continents, Journal of
Management in Engineering, 22(2): 61-67.
[72] Yescomb, E.R., 2014, Principles of Project Finance. Elsevier.
[73] Aleithawe, I., 2017, Right-of-way Acuquisition Workflow Model to Reduce
Acquisition Duration, Journal of Legal Affairs and Dispute Resolution in
Engineering and Constructon, vol. 9(3): 05017001.
[74] Delmon, J., 2017, Public-Private Partnership Projects in Infrastructure. Cambridge
University Press.

81
[75] Indonesia Investements, 2017, World Bank’s Doing Business 2018: Indonesia
Climbs in Ranking, https://www.indonesia-investments.com/business/business-
columns/world-bank-s-doing-business-2018-indonesia-climbs-in-
ranking/item8360? (examined 30 Oct. 2018).
[76] AMBest, 2018, Best’s Country Risk Report: Indonesia,
http://www3.ambest.com/ratings/cr/reports/indonesia.pdf
(examined 31 Oct. 2018).
[77] Transparency International, 2017,
https://www.transparency.org/news/feature/corruption_perceptions_index_2017
(examined 30 Oct. 2018).
[78] UN, United Nation, 2011, Business against Corruption: A Framework for Action,
https://www.unglobalcompact.org/docs/news_events/8.1/bac_fin.pdf (examined
29 Oct. 2018).
[79] Moody’s, 2018, Rating Symbols and Definitions,
https://www.moodys.com/researchdocumentcontentpage.aspx?docid=PBC_79004
(examined 16 Jan. 2019).
[80] Trading Economics, 2018, Indonesia: Credit Rating,
https://tradingeconomics.com/indonesia/rating (examined 30 Oct. 2018).
[81] AAII, American Association of Individual Investors, 2018, How Credit Ratings
Affect Bond Valuations, https://www.aaii.com/journal/article/how-credit-ratings-
affect-bond-valuations.touch (examined 30 Oct. 2018).
[82] Reuters, 2018, Indonesia Urges Firms to Bolster Hedging as Rupiah Risks Grow,
https://www.reuters.com/article/indonesia-rupiah/update-3-indonesia-urges-firms-
to-bolster-hedging-as-rupiah-risks-grow-idUSL3N1S215P (examined 25 Oct.
2018).
[83] Wibowo, A. and Kochendoerfer, B., 2011, Selecting BOT/PPP Infrastructure
Projects for Government Guarantee Portfolio under Conditions of Budget and
Risk in the Indonesian Context, Journal of Construction Engineering and
Management, 137(7): 512-522.

82
[84] Crocker, K.J, and Masten, S.E., 1991, Prices and Process in Long Term Contracts,
Journal of Law and Economics, vol. 34(1), p. 69-99.
[85] Klee, L., 2018, International Construction Contract Law. John Wiley & Sons Ltd.