copyright © 2011 pearson education, inc. samples and surveys chapter 13
TRANSCRIPT
Copyright © 2011 Pearson Education, Inc.
Samples and Surveys
Chapter 13
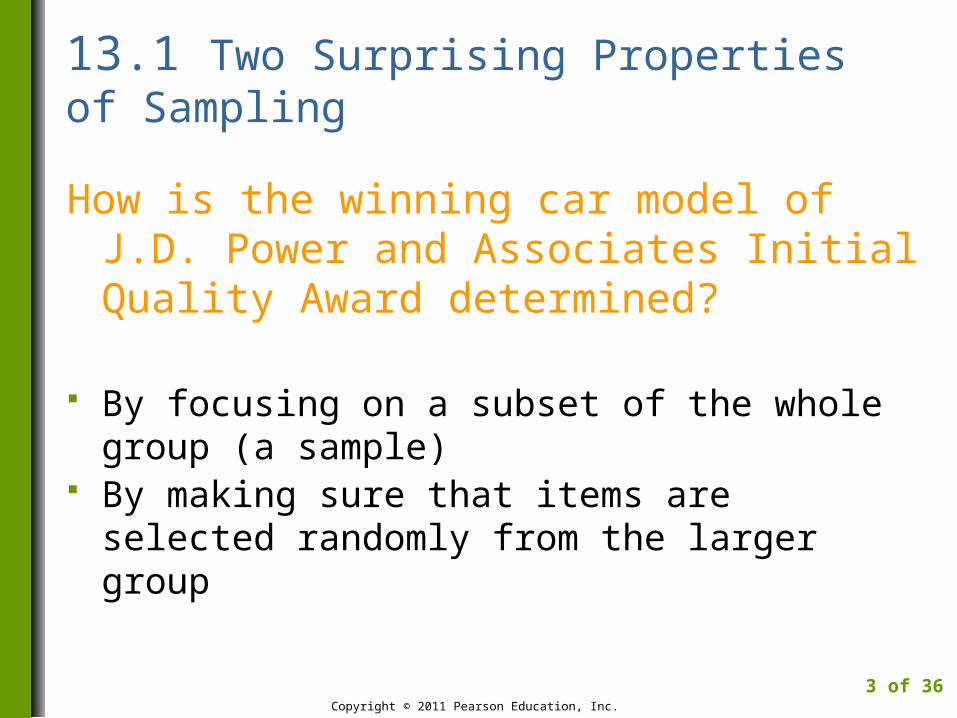
13.1 Two Surprising Properties of Sampling
How is the winning car model of J.D. Power and Associates Initial Quality Award determined?
By focusing on a subset of the whole group (a sample)
By making sure that items are selected randomly from the larger group
Copyright © 2011 Pearson Education, Inc.
3 of 36
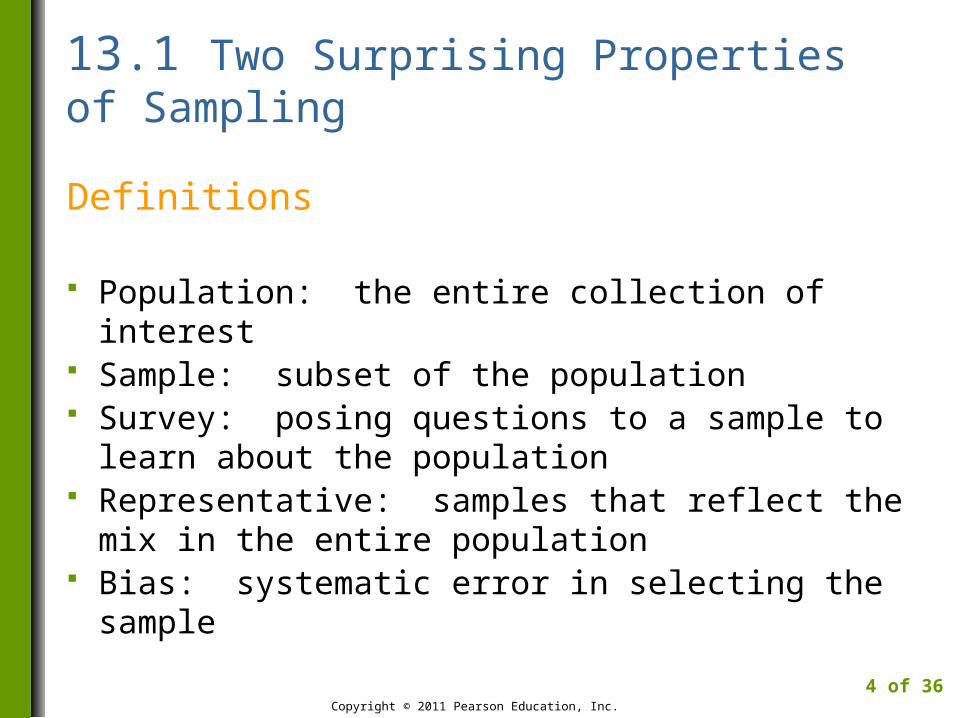
13.1 Two Surprising Properties of Sampling
Definitions
Population: the entire collection of interest Sample: subset of the population Survey: posing questions to a sample to learn
about the population Representative: samples that reflect the mix in
the entire population Bias: systematic error in selecting the sample
Copyright © 2011 Pearson Education, Inc.
4 of 36
13.1 Two Surprising Properties of Sampling
The two surprises are:
The best way to get a representative sample is to pick members of the population at random.
Larger populations do not require larger samples.
Copyright © 2011 Pearson Education, Inc.
5 of 36
13.1 Two Surprising Properties of Sampling
Randomization
A randomly selected sample is representative of the whole population.
Randomization ensures that on average a sample mimics the population.
Copyright © 2011 Pearson Education, Inc.
6 of 36

13.1 Two Surprising Properties of Sampling
Comparison of Two Random Samples from a Population of 3.5 Million Customers.
Copyright © 2011 Pearson Education, Inc.
7 of 36
13.1 Two Surprising Properties of Sampling
Randomization
Produces samples whose averages resemble those in the population (avoids bias).
Enables us to infer characteristics of the population from a sample.
Copyright © 2011 Pearson Education, Inc.
8 of 36

13.1 Two Surprising Properties of Sampling
Infamous Case: The Literary Digest
The Literary Digest predicted defeat for Franklin D. Roosevelt in the 1936 presidential election. They selected their sample from a list of telephone numbers (telephones were a luxury during the Great Depression). Roosevelt’s supporters tended to be poor and were underrepresented in the sample.
Copyright © 2011 Pearson Education, Inc.
9 of 36

13.1 Two Surprising Properties of Sampling
This sample size is an almost infinitesimal portion of the population, yet the survey reveals attitudes of the entire population to within ± 3%
Copyright © 2011 Pearson Education, Inc.
10 of 36
13.1 Two Surprising Properties of Sampling
Simple Random Sample (SRS)
A sample of n items chosen by a method that has an equal chance of picking any sample of size n from the population.
Is the standard to which all other sampling methods are compared.
Copyright © 2011 Pearson Education, Inc.
11 of 36
13.1 Two Surprising Properties of Sampling
Simple Random Sample (SRS)
Sampling Frame: a list of items from which to select a random sample.
Systematic Sampling: method for selecting items from a sampling frame that follows a regular pattern (e.g., every 10th item).
Copyright © 2011 Pearson Education, Inc.
12 of 36
13.1 Two Surprising Properties of Sampling
Identifying the Sampling Frame
If there is no fixed population of outcomes, no sampling frame exists (e.g., output from a production process).
The list available may differ from the list desired (e.g., voter registration lists identify people who can vote, not those who will).
Copyright © 2011 Pearson Education, Inc.
13 of 36

13.2 VARIATION
Estimating Parameters
Parameter: a characteristic of the population (e.g., µ)
Statistic: an observed characteristic of a sample (e.g., )
Estimate: using a statistic to approximate a parameter
Copyright © 2011 Pearson Education, Inc.
14 of 36
y
13.2 VARIATION
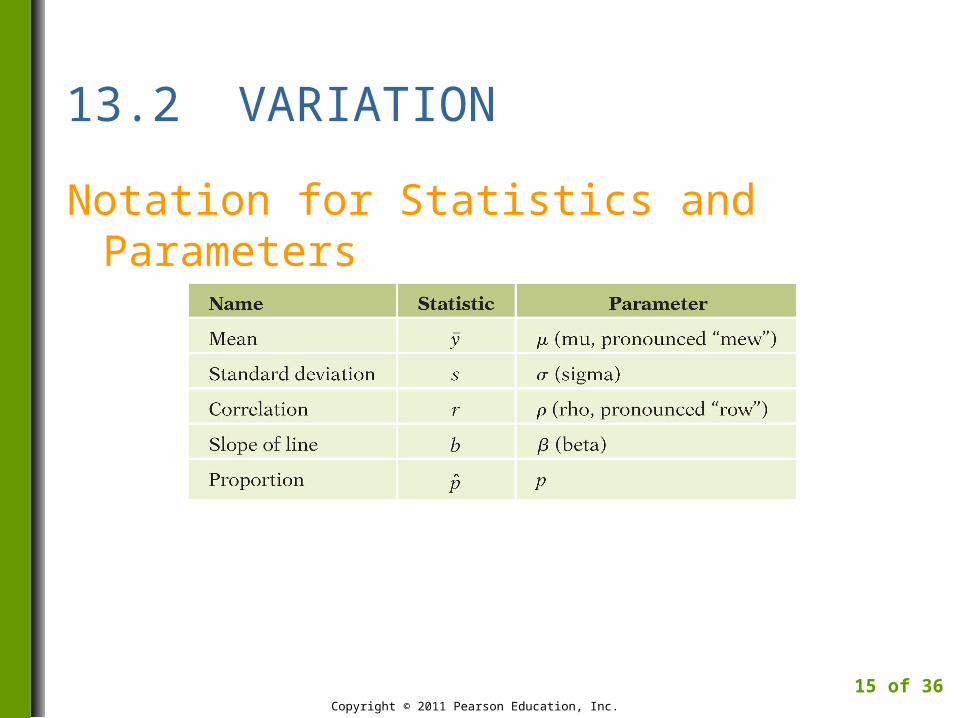
Notation for Statistics and Parameters
Copyright © 2011 Pearson Education, Inc.
15 of 36
13.2 VARIATION
Sampling Variation
Is the variability in the value of a statistic from sample to sample.
The price we pay for working with a sample rather than the population.
Copyright © 2011 Pearson Education, Inc.
16 of 36

13.2 VARIATION
Sampling Variation in Sample Means
Copyright © 2011 Pearson Education, Inc.
17 of 36
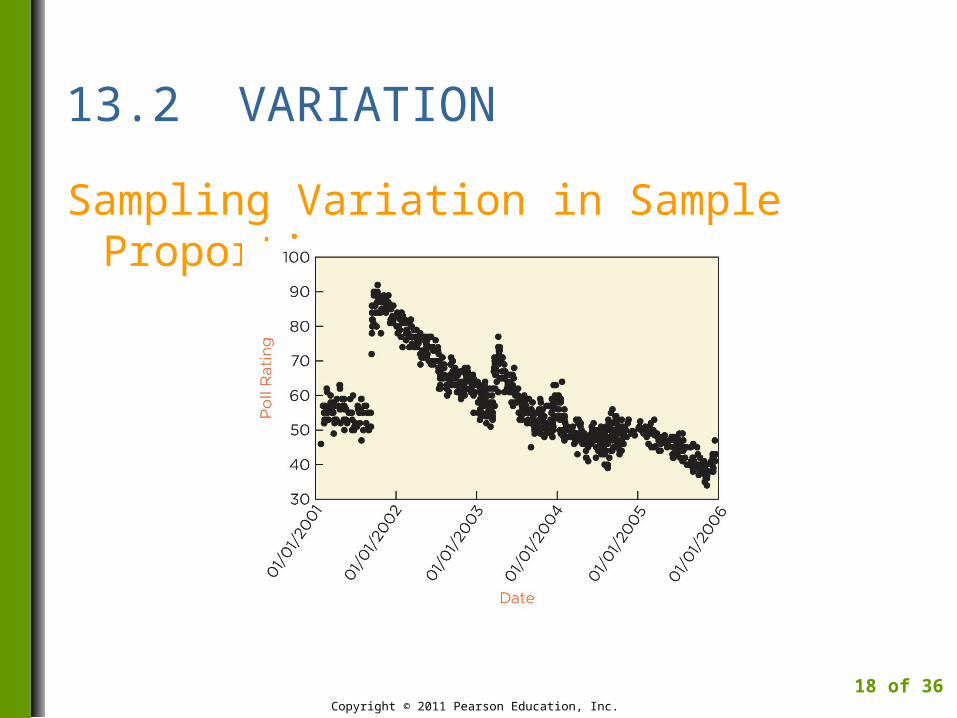
13.2 VARIATION
Sampling Variation in Sample Proportions
Copyright © 2011 Pearson Education, Inc.
18 of 36

4M Example 13.1: EXIT SURVEYS
Motivation
Why do customers leave a busy clothing store in the mall without making a purchase?
Copyright © 2011 Pearson Education, Inc.
19 of 36
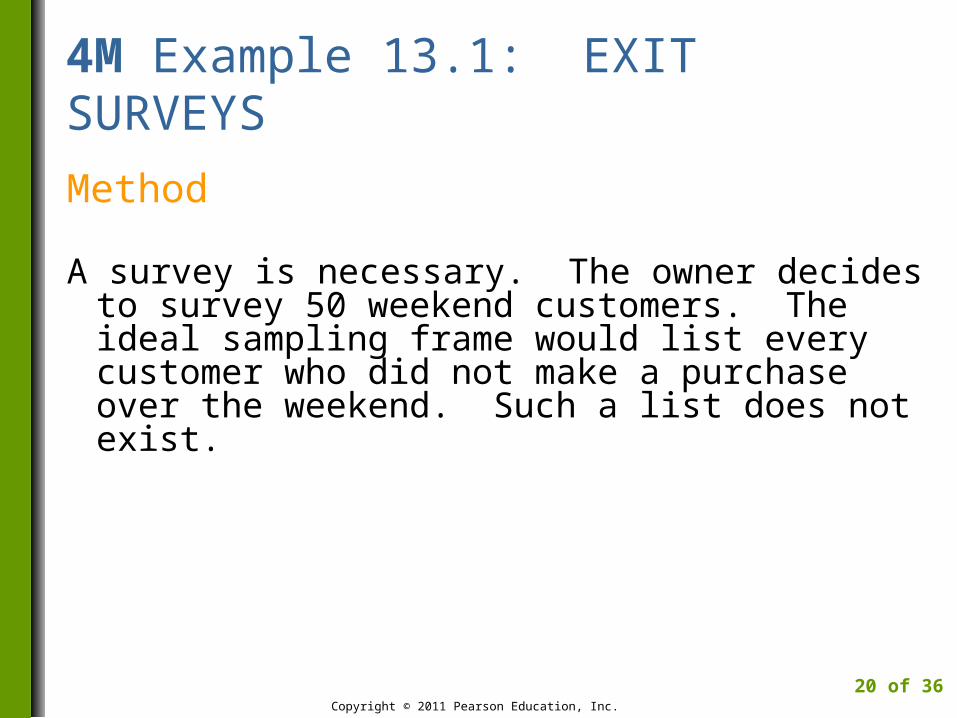
4M Example 13.1: EXIT SURVEYS
Method
A survey is necessary. The owner decides to survey 50 weekend customers. The ideal sampling frame would list every customer who did not make a purchase over the weekend. Such a list does not exist.
Copyright © 2011 Pearson Education, Inc.
20 of 36
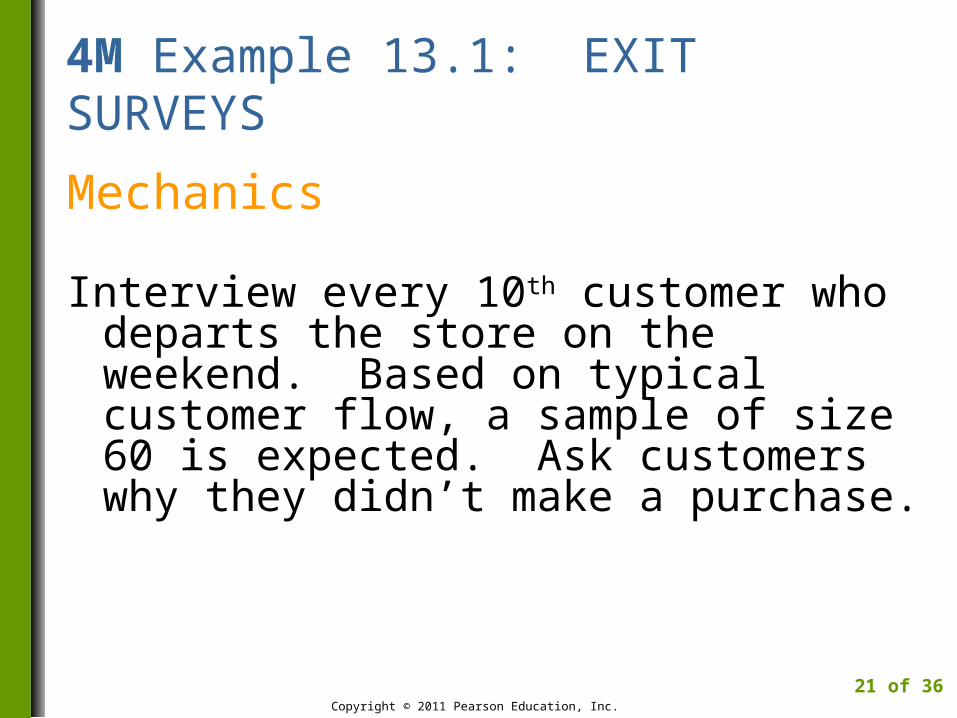
4M Example 13.1: EXIT SURVEYS
Mechanics
Interview every 10th customer who departs the store on the weekend. Based on typical customer flow, a sample of size 60 is expected. Ask customers why they didn’t make a purchase.
Copyright © 2011 Pearson Education, Inc.
21 of 36
4M Example 13.1: EXIT SURVEYS
Message
On the basis of the survey, the owner will be able to find out why shoppers are leaving without buying.
Copyright © 2011 Pearson Education, Inc.
22 of 36
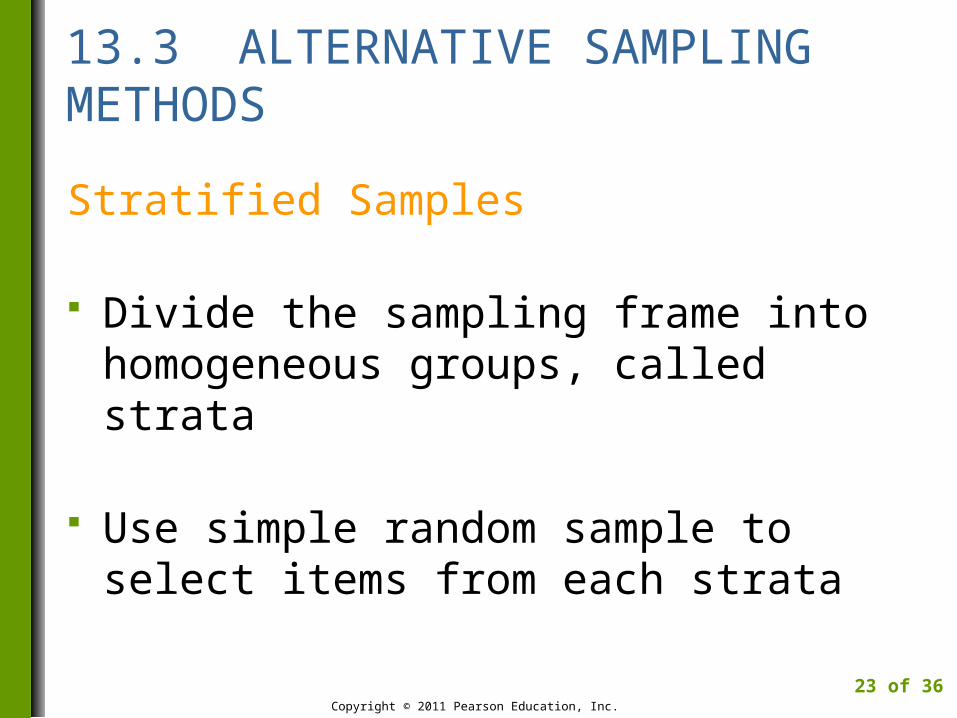
13.3 ALTERNATIVE SAMPLING METHODS
Stratified Samples
Divide the sampling frame into homogeneous groups, called strata
Use simple random sample to select items from each strata
Copyright © 2011 Pearson Education, Inc.
23 of 36
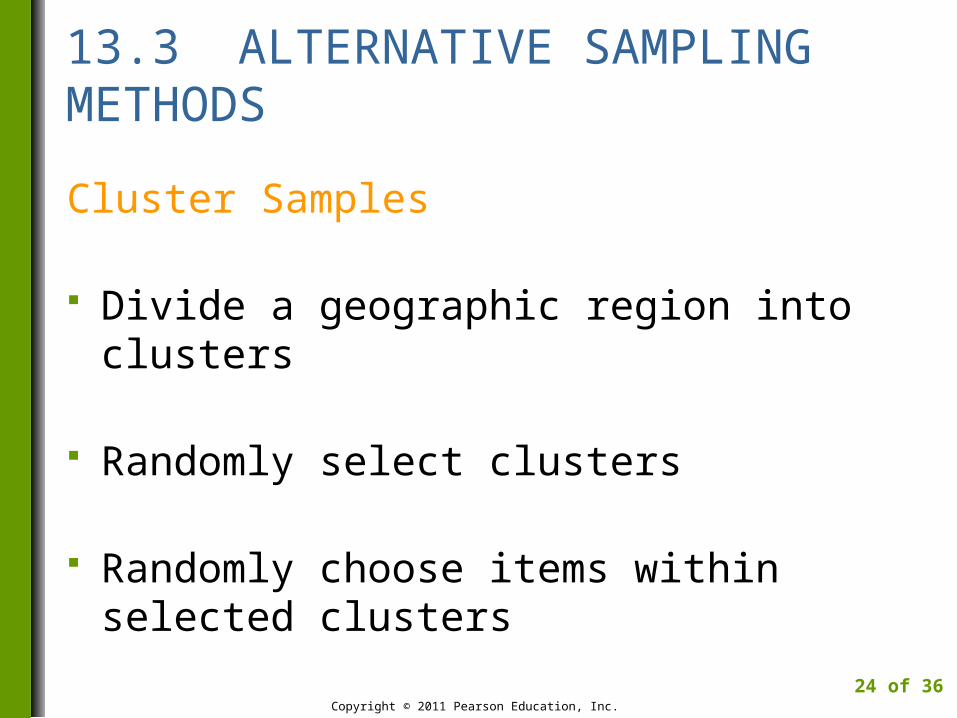
13.3 ALTERNATIVE SAMPLING METHODS
Cluster Samples
Divide a geographic region into clusters
Randomly select clusters
Randomly choose items within selected clusters
Copyright © 2011 Pearson Education, Inc.
24 of 36
4M Example 13.2: ESTIMATING THE RISE OF PRICES
Motivation
What goes into determining the consumer price index (CPI), the official measure of inflation?
Copyright © 2011 Pearson Education, Inc.
25 of 36

4M Example 13.2: ESTIMATING THE RISE OF PRICES
Method
The Bureau of Labor Statistics (BLS) uses a survey to estimate inflation. The target population consists of the costs of every consumer transaction in urban areas during a specific month.
Copyright © 2011 Pearson Education, Inc.
26 of 36
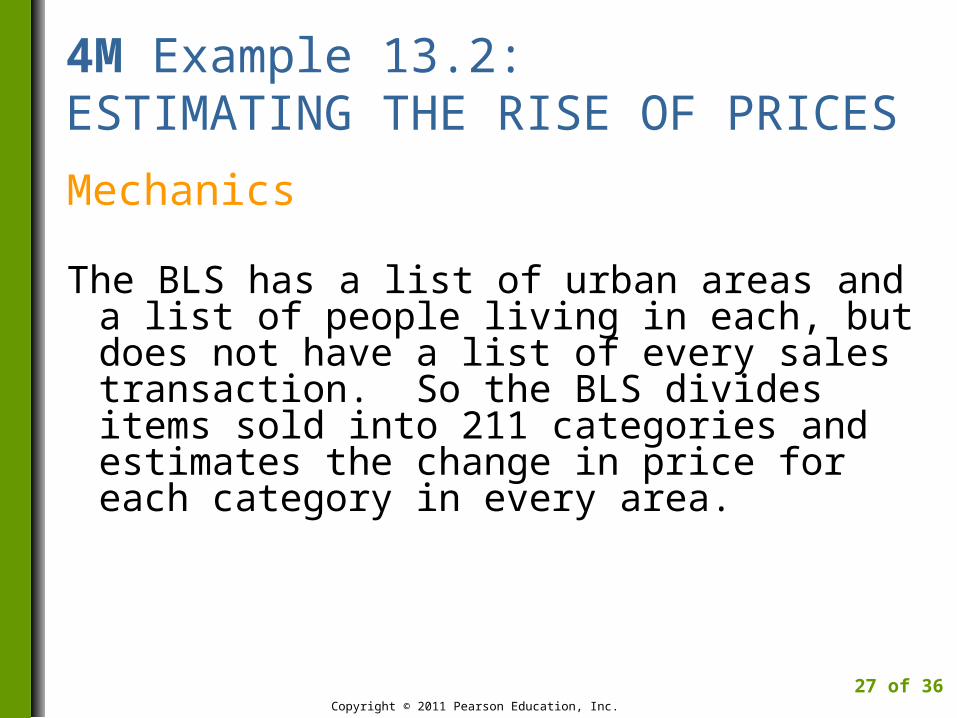
4M Example 13.2: ESTIMATING THE RISE OF PRICES
Mechanics
The BLS has a list of urban areas and a list of people living in each, but does not have a list of every sales transaction. So the BLS divides items sold into 211 categories and estimates the change in price for each category in every area.
Copyright © 2011 Pearson Education, Inc.
27 of 36

4M Example 13.2: ESTIMATING THE RISE OF PRICES
Message
The urban consumer price index is an estimate of inflation base on a complex, clustered sample in selected metropolitan areas.
Copyright © 2011 Pearson Education, Inc.
28 of 36

13.3 ALTERNATIVE SAMPLING METHODS
Census
A comprehensive survey of the entire population.
Cost and time constraints generally prohibit carrying out a census; in some cases a census is not feasible.
Copyright © 2011 Pearson Education, Inc.
29 of 36

13.3 ALTERNATIVE SAMPLING METHODS
Voluntary Response
A sample consisting of individuals who volunteer when given the opportunity to participate in a survey.
These samples are biased toward those with strong opinions.
Copyright © 2011 Pearson Education, Inc.
30 of 36
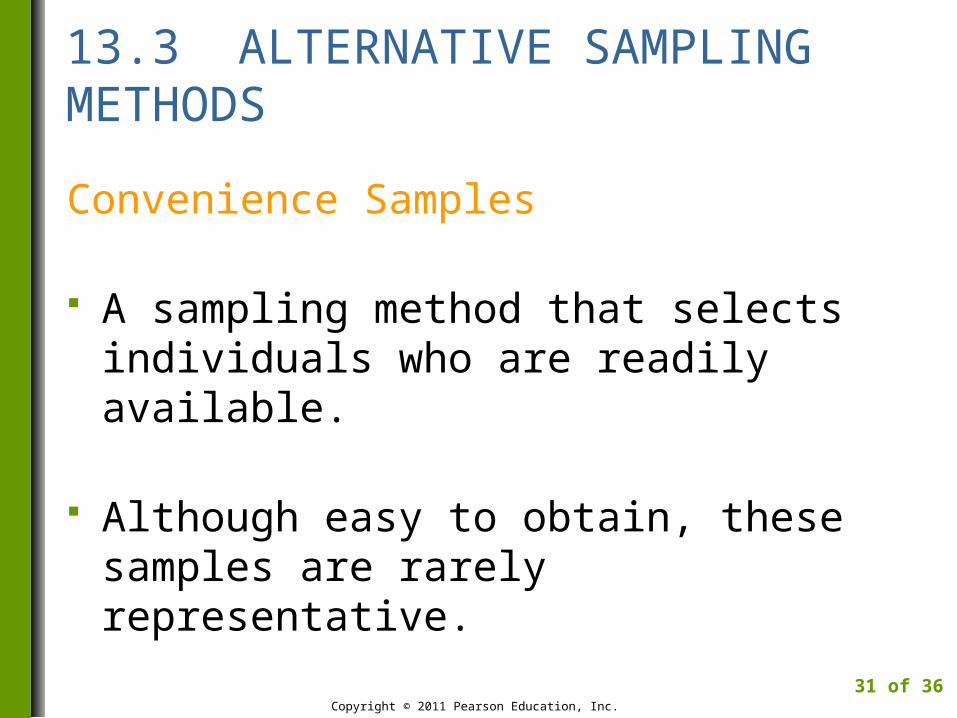
13.3 ALTERNATIVE SAMPLING METHODS
Convenience Samples
A sampling method that selects individuals who are readily available.
Although easy to obtain, these samples are rarely representative.
Copyright © 2011 Pearson Education, Inc.
31 of 36

13.4 CHECKLIST FOR SURVEYS
Questions to Consider
What was the sampling frame? Is the sample a simple random sample? What is the rate of nonresponse? How was the question worded? Did the interviewer affect the results? Does survivor bias affect the survey?
Copyright © 2011 Pearson Education, Inc.
32 of 36
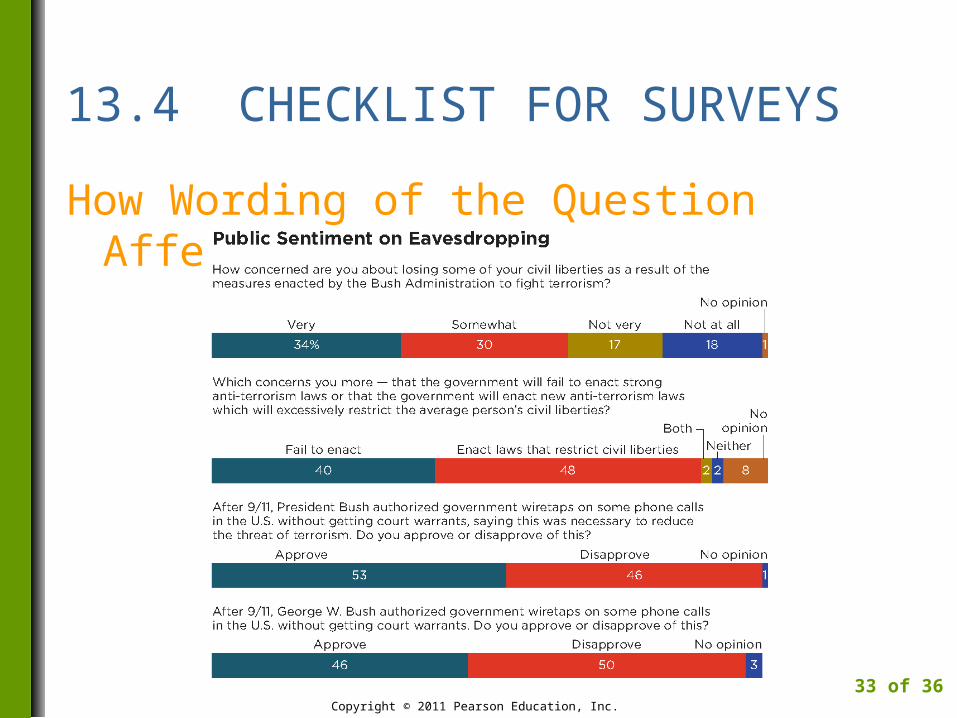
13.4 CHECKLIST FOR SURVEYS
How Wording of the Question Affects Results
Copyright © 2011 Pearson Education, Inc.
33 of 36

Best Practices
Randomize.
Plan carefully.
Match the sampling frame to the target population.
Copyright © 2011 Pearson Education, Inc.
34 of 36
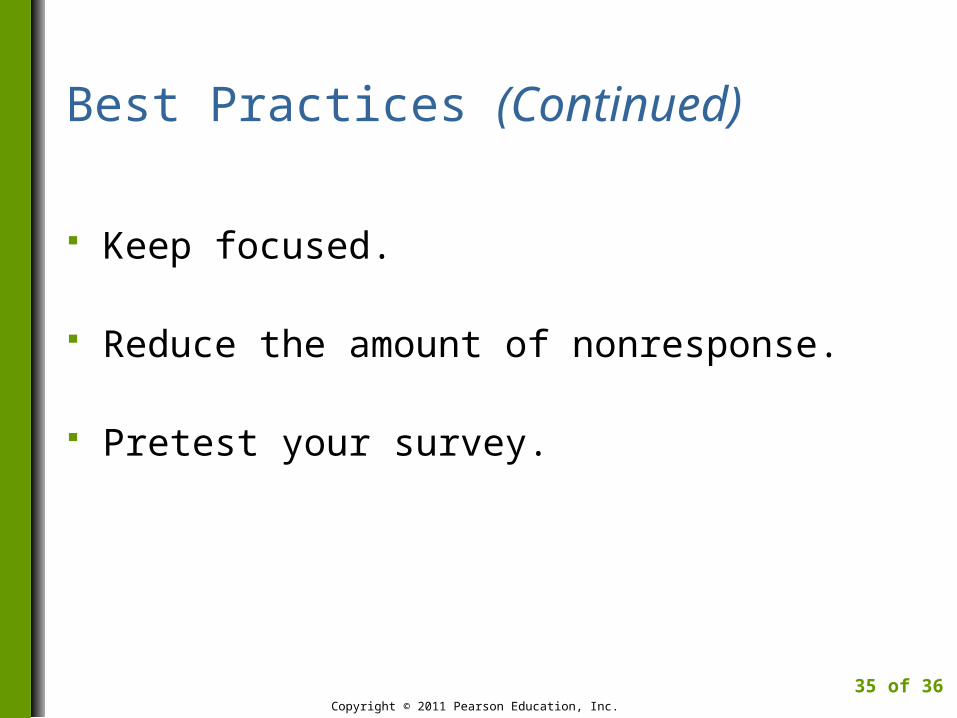
Best Practices (Continued)
Keep focused.
Reduce the amount of nonresponse.
Pretest your survey.
Copyright © 2011 Pearson Education, Inc.
35 of 36
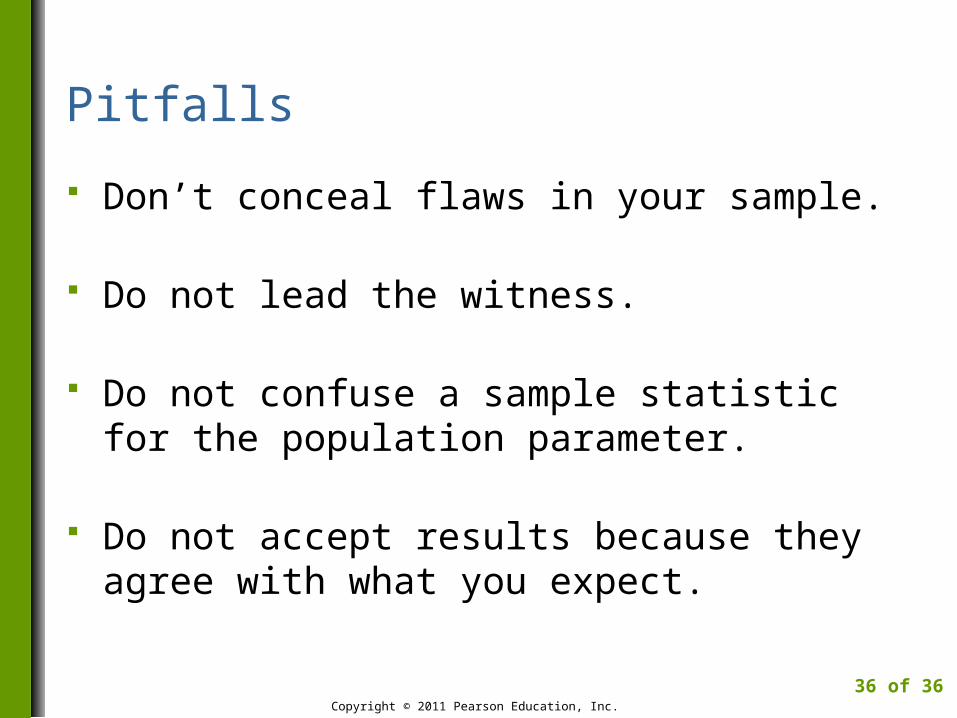
Pitfalls
Don’t conceal flaws in your sample.
Do not lead the witness.
Do not confuse a sample statistic for the population parameter.
Do not accept results because they agree with what you expect.
Copyright © 2011 Pearson Education, Inc.
36 of 36