copyright ©2010 pearson education, inc. publishing as prentice hall 9- 1 basic marketing research:...
Post on 19-Dec-2015
213 views
TRANSCRIPT

Copyright ©2010 Pearson Education, Inc. publishing as Prentice Hall 9- 1
Basic Marketing Research: Using Microsoft Excel Data Analysis, 3rd edition
Alvin C. Burns Louisiana State UniversityRonald F. Bush University of West Florida

Copyright ©2010 Pearson Education, Inc. publishing as Prentice Hall
Generalizing a Sample’s Findings
• Generalizing is using the known sample error, that is the +/- value, so as to determine an interval for the average or percentage.
• The researcher is then confident that this interval includes the true population average or percentage.
12- 2

Copyright ©2010 Pearson Education, Inc. publishing as Prentice Hall
Generalizing a Sample’s Findings, Continued...
• We refer to a sample finding whenever a percent or average or some other analysis value is computed with a sample’s data.
• However, because of the sample error involved, the sample finding must be considered an approximation of the population fact, defined as the true value when a census of the population is taken and the value is determined using all members of the population.
12- 3

Copyright ©2010 Pearson Education, Inc. publishing as Prentice Hall
Generalizing a Sample’s Findings, Continued...
• When a researcher follows proper sampling procedures and ensures that the sample is a good representation of the target population, the sample findings are, indeed, best estimates of their representative population facts- but they will always be estimates that are hindered by the sample error.
12- 4

Copyright ©2010 Pearson Education, Inc. publishing as Prentice Hall
Generalizing a Sample’s Findings, Continued...
• Generalization is the act of estimating a population fact from a sample finding.
• Generalization is a form of logic in which you make an inference about an entire group based on some evidence about that group.
• There are just two types of evidence:• The variability (less is more evidence)• The sample size (more is more evidence)
12- 5

Copyright ©2010 Pearson Education, Inc. publishing as Prentice Hall
Generalizing a Sample’s Findings, Continued...
• Table 12.1 illustrates how we would generalize our sample findings to the population of all Chevrolet buyers in the case of a sample size of 100 vs. a sample size of 1,000.
• Notice how much wider (imprecise) the interval is for the smaller sample size!
12- 6

Copyright ©2010 Pearson Education, Inc. publishing as Prentice Hall
Generalizing a Sample’s Findings, Continued...
12- 7

Copyright ©2010 Pearson Education, Inc. publishing as Prentice Hall
Estimating the Population Value
• Estimation of population values is often referred to as parameter estimation because the proper name for the population value is the parameter, or the actual population value being estimated.• Population parameters are designated by Greek
letters such as π (percent) or µ (mean or average), while sample findings are relegated to lowercase Roman letters such as p (percent) or (average or mean).
12- 8
X

Copyright ©2010 Pearson Education, Inc. publishing as Prentice Hall
How to Estimate a Population Percentage (Categorical Data)
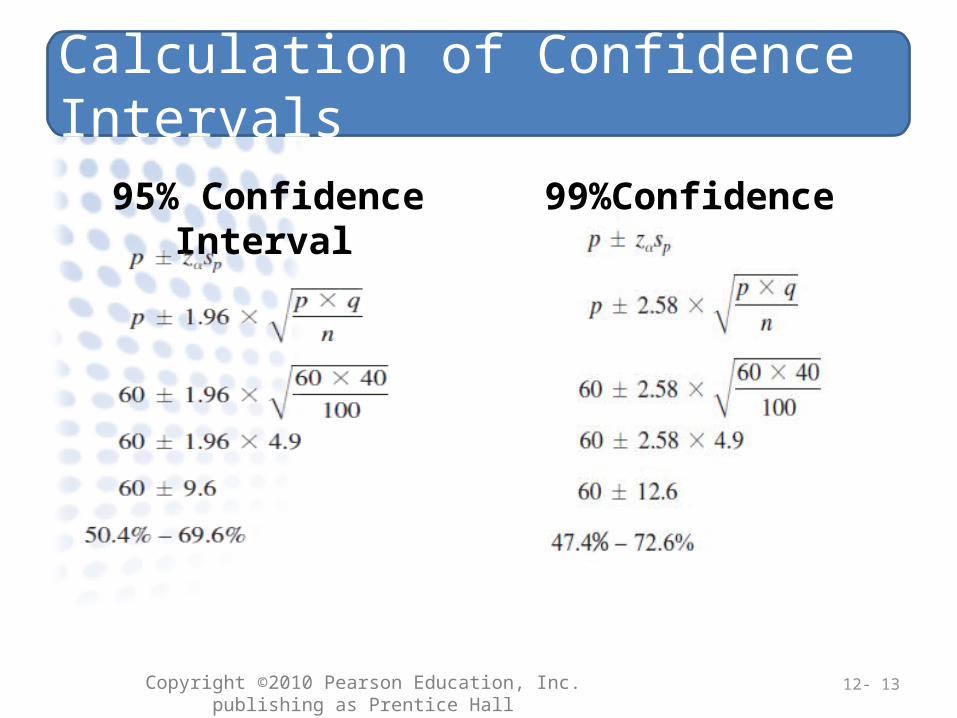
• A confidence interval is a range (lower and upper boundary) into which the researcher believes the population parameter falls with an associated degree of confidence (typically 95% or 99%).
12- 9

Copyright ©2010 Pearson Education, Inc. publishing as Prentice Hall
Formula for a Population Percentage Estimation
12- 10

Copyright ©2010 Pearson Education, Inc. publishing as Prentice Hall
How to Estimate the Population Value for a Percentage
12- 11

Copyright ©2010 Pearson Education, Inc. publishing as Prentice Hall
How to Estimate the Population Value for a Percentage, Continued...
12- 12
Copyright ©2010 Pearson Education, Inc. publishing as Prentice Hall
Calculation of Confidence Intervals
95% Confidence Interval
99%Confidence Interval
12- 13

Copyright ©2010 Pearson Education, Inc. publishing as Prentice Hall
Interpreting a 95% Confidence Interval for a Percentage
• If you theoretically took multiple samples and plotted the sample percentage, p, for all these samples as a frequency distribution, it would approximate a bell-shaped curve called the sampling distribution.
• The standard error is a measure of the variability in the sampling distribution based on what is theoretically believed to occur were we take a multitude of independent samples from the same population.
12- 14

Copyright ©2010 Pearson Education, Inc. publishing as Prentice Hall
The Variability Affects the Sampling Distribution
How Variability Affects the 95% Confidence Interval for a Percentage
12- 15

Copyright ©2010 Pearson Education, Inc. publishing as Prentice Hall
Using XL Data Analyst to Obtain a 95% Confidence Interval for a Percentage
• The menu sequence to direct the XL Data Analyst to compute a confidence interval for a percentage is Generalize-Confidence Interval-Percentage …
12- 16

Copyright ©2010 Pearson Education, Inc. publishing as Prentice Hall
Using XL Data Analyst to Obtain a 95% Confidence Interval for a Percentage
12- 17

Copyright ©2010 Pearson Education, Inc. publishing as Prentice Hall
Using XL Data Analyst to Obtain a 95% Confidence Interval for a Percentage
12- 18

Copyright ©2010 Pearson Education, Inc. publishing as Prentice Hall
How to Estimate a Population Average (Metric Data)
12- 19

Copyright ©2010 Pearson Education, Inc. publishing as Prentice Hall
How to Estimate the Population Value for an Average
12- 20

Copyright ©2010 Pearson Education, Inc. publishing as Prentice Hall
How to Estimate the Population Value for an Average, Continued...
12- 21

Copyright ©2010 Pearson Education, Inc. publishing as Prentice Hall
Calculation of a 99% Confidence Interval for an Average
12- 22

Copyright ©2010 Pearson Education, Inc. publishing as Prentice Hall
Interpreting a Confidence Interval for an Average
• If you repeated your survey multiple times and plotted your average number of minutes reading New York Times for each sample on a frequency distribution, it would look like a bell-shaped curve, and 95% of your sample averages would fall in the confidence interval defined by the population percentage +/- 1.96 times the standard error of the average.
• You can be 95% confident that the population average falls in the range of 41.1 to 48.9 minutes.
12- 23

Copyright ©2010 Pearson Education, Inc. publishing as Prentice Hall
Obtaining a 95% Confidence Interval for an Average with XL Data Analyst
• Generalize-Confidence Interval-Average
12- 24

Copyright ©2010 Pearson Education, Inc. publishing as Prentice Hall
Obtaining a 95% Confidence Interval for an Average with XL Data Analyst, Continued...
12- 25

Copyright ©2010 Pearson Education, Inc. publishing as Prentice Hall
Testing Hypotheses About Percents or Averages
• Someone makes a prediction about the population value based on prior knowledge, assumptions, or intuition. This statement, called a hypothesis, commonly takes the form of an exact specification of the population parameter.
12- 26

Copyright ©2010 Pearson Education, Inc. publishing as Prentice Hall
Testing Hypotheses About Percents or Averages, Continued...
• Hypothesis testing is a statistical procedure used to “support” (accept) or “not support” (reject) the hypothesis based on sample information.
• Intuitive hypothesis testing (as opposed to statistical hypothesis testing) is when someone uses something he or she has observed to see if it agrees with or refutes his or her belief about that topic. Everyone uses intuitive hypothesis testing. We rely on it constantly.
12- 27

Copyright ©2010 Pearson Education, Inc. publishing as Prentice Hall
Testing a Hypothesis About a Percentage
12- 28

Copyright ©2010 Pearson Education, Inc. publishing as Prentice Hall
How to Test a Hypothesis for a Percentage
12- 29

Copyright ©2010 Pearson Education, Inc. publishing as Prentice Hall
How to Test a Hypothesis for a Percentage, Continued...
12- 30

Copyright ©2010 Pearson Education, Inc. publishing as Prentice Hall
The Logic of Hypothesis Testing
• If we assume our hypothesis is correct, there is a greater probability of finding a sample result close to the hypothesized mean, for example, than of finding one that is far away.
• So, if our sample turns out to be within +/- 1.96 standard errors of the hypothesized mean, it supports the hypothesis maker at the 95% level of confidence because it falls within 95% of the area under the curve.
12- 31

Copyright ©2010 Pearson Education, Inc. publishing as Prentice Hall
The Logic of Hypothesis Testing
• Recall that we assumed our hypothesis is correct! If that is true we would expect our sample’s z score to fall within +/- 1.96z. If it does, then that is strong evidence to support our hypothesis.
• If our hypothesis is correct, there is only a 5% chance we will get a z score that falls outside of +/- 1.96z.
12- 32

Copyright ©2010 Pearson Education, Inc. publishing as Prentice Hall
The Logic of Hypothesis Testing, Continued...
12- 33

Copyright ©2010 Pearson Education, Inc. publishing as Prentice Hall
The Logic of Hypothesis Testing, Continued...
• The hypothesis test rule is simple: • If the z value falls in the acceptance region, there
is support for the hypothesis, and if the z value falls in the rejection region, there is no support for the hypothesis.
12- 34
Copyright ©2010 Pearson Education, Inc. publishing as Prentice Hall
Example of a Hypothesis Test
• What percent of U.S. college students own a major credit card?
• Let’s say that you think three of every four college students (75%) own a Mastercard, Visa, or some other major credit card.
• A recent survey of 1,200 students on U.S. college campuses found that 84% have a major credit card.
12- 35

Copyright ©2010 Pearson Education, Inc. publishing as Prentice Hall
Example of a Hypothesis Test, Continued...
• Your hypothesis is not supported here, because the computed z value exceeds the critical value of ±1.96
…= - 8.2 If the hypothesis were
true, there is a 95% chance that the computed z would be within ±1.96. Since it is -8.2, we reject the hypothesis!
12- 36

Copyright ©2010 Pearson Education, Inc. publishing as Prentice Hall
Why Use the 95% Significance Level?
• By a very large majority, researchers prefer to use the 95% significance level with its associated critical z value of +/- 1.96.
• You may find a researcher who prefers to use the 99% significance level and its critical z value of +/- 2.58.
12- 37

Copyright ©2010 Pearson Education, Inc. publishing as Prentice Hall
Testing a Directional Hypothesis
• A directional hypothesis is one that indicates the direction in which you believe the population parameter falls relative to some hypothesized average or percentage.
• If you are testing a directional (“greater than” or “less than”) hypothesis, the critical z value is adjusted downward to 1.64 and 2.33 for the 95% and 99% levels of confidence, respectively.
12- 38

Copyright ©2010 Pearson Education, Inc. publishing as Prentice Hall
Testing a Directional Hypothesis, Continued...
• It is only the critical value of z that has changed when you are testing a directional hypothesis.
• This adjustment is because only one side of the bell-shaped curve is involved in what is known as a “one-tailed” test.
12- 39

Copyright ©2010 Pearson Education, Inc. publishing as Prentice Hall
How to Test a Hypothesis About a Percentage with XL Data Analyst
• The menu sequence to direct XL Data Analyst to accomplish this is Generalize-Hypothesis Test-Percentage…
12- 40

Copyright ©2010 Pearson Education, Inc. publishing as Prentice Hall
How to Test a Hypothesis About a Percentage with XL Data Analyst, Continued...
12- 41

Copyright ©2010 Pearson Education, Inc. publishing as Prentice Hall
How to Test a Hypothesis About a Percentage with XL Data Analyst, Continued...
12- 42

Copyright ©2010 Pearson Education, Inc. publishing as Prentice Hall
Is it t or z?
• If you inspect the statistical values in XL Data Analyst output, there is reference to a “t” value and no reference to a “z” value.
• You should treat the “t” values as the equivalent to the “z” values.
12- 43

Copyright ©2010 Pearson Education, Inc. publishing as Prentice Hall
Testing a Hypothesis About an Average
12- 44

Copyright ©2010 Pearson Education, Inc. publishing as Prentice Hall
Testing a Hypothesis About an Average, Continued...
12- 45

Copyright ©2010 Pearson Education, Inc. publishing as Prentice Hall
Testing a Hypothesis About an Average, Continued...
12- 46

Copyright ©2010 Pearson Education, Inc. publishing as Prentice Hall
How to Test a Hypothesis About an Average with XL Data Analyst
12- 47

Copyright ©2010 Pearson Education, Inc. publishing as Prentice Hall
How to Test a Hypothesis About an Average with XL Data Analyst
12- 48

Copyright ©2010 Pearson Education, Inc. publishing as Prentice Hall
Interpreting Your Hypothesis Test
• If the hypothesis is about the population parameter is correct or true, then a high percentage of sample findings must fall close to this hypothesized value.
• If the hypothesis is true, then 95% of the sample results will fall between +/- 1.96 standard errors of the hypothesized mean.
• If the hypothesis is incorrect, there is a strong likelihood that the sample findings will fall outside of +/- 1.96 standard errors.
12- 49

Copyright ©2010 Pearson Education, Inc. publishing as Prentice Hall
Copyright Protected
9- 50