copyright © 2008 prentice hall all rights reserved 7-1 cost-volume-profit analysis chapter 7
TRANSCRIPT
Copyright © 2008 Prentice Hall All rights reserved
7-1
Cost-Volume-Profit Analysis
Chapter 7

Copyright © 2008 Prentice Hall All rights reserved
7-2
Objective 1
Calculate the unit contribution margin and the contribution
margin ratio

Copyright © 2008 Prentice Hall All rights reserved
7-3
Components of CVP Analysis
• Sales price per unit
• Volume sold
• Variable costs per unit
• Fixed costs
• Operating income

Copyright © 2008 Prentice Hall All rights reserved
7-4
CVP Assumptions
1. Change in volume is only factor that affects costs
2. Managers can classify each cost as either variable or fixed• These costs are linear throughout relevant range
3. Revenues are linear throughout relevant range
4. Inventory levels will not change
5. The sales mix of products will not change

Copyright © 2008 Prentice Hall All rights reserved
7-5
Unit Contribution Margin
Sales price per unit
- Variable costs per unit
Contribution margin per unit
Example:
Sales Price per Poster $35
Less: Variable Cost per poster (21)
Contribution Margin per poster $14
Copyright © 2008 Prentice Hall All rights reserved
7-6
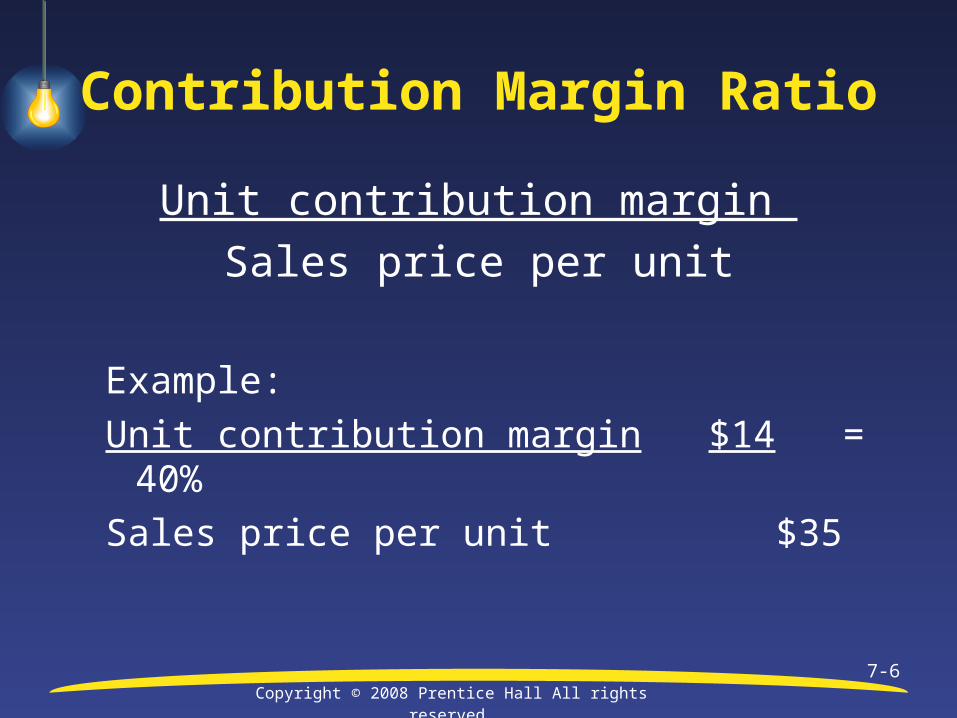
Contribution Margin Ratio
Unit contribution margin
Sales price per unit
Example:
Unit contribution margin $14 = 40%
Sales price per unit $35
Copyright © 2008 Prentice Hall All rights reserved
7-7
Objective 2
Use CVP analysis to find breakeven points and target profit
volumes

Copyright © 2008 Prentice Hall All rights reserved
7-8
Breakeven Point
• Sales level at which operating income is zero
• Sales above breakeven result in a profit
• Sales below breakeven result in a loss

Copyright © 2008 Prentice Hall All rights reserved
7-9
Income Statement Approach
Contribution Margin Income Statement
Sales
- Variable Costs
Contribution Margin
- Fixed Costs
Operating Income

Copyright © 2008 Prentice Hall All rights reserved
7-10
Short-Cut Approach Using the Unit Contribution Margin
Fixed expenses + Operating income Contribution margin per unit
Units sold =

Copyright © 2008 Prentice Hall All rights reserved
7-11
Short-Cut Approach Using the Unit Contribution Margin Ratio
Fixed expenses + Operating income Contribution margin ratio
Sales in $ =
Copyright © 2008 Prentice Hall All rights reserved
7-12
E7-15 1.
Contribution margin ratio =
Contribution margin ÷ Sales =
$187,500 ÷ $312,500 = 60%

Copyright © 2008 Prentice Hall All rights reserved
7-13
E7-15 1.
Aussie TravelContribution Margin Income Statements
Sales revenue $250,000 $360,000Variable expenses (40%) 100,000 144,000Contribution margin $? $?Fixed expenses 170,00 170,000Operating income (loss) $ (20,000) $46,000
Hint: Contribution margin income statements are
produced by using the different volume levels and the
calculated variable expenses.

Copyright © 2008 Prentice Hall All rights reserved
7-14
E7-15 2.
Fixed expenses + Operating income Contribution margin ratio
Sales in $ =
$170,000 + $060%
Sales in $ = = $283,333

Copyright © 2008 Prentice Hall All rights reserved
7-15
E7-17 1.
Contribution margin = Sales–Variable costs
= $1.70 - $0.85
= $0.85
Contribution margin ratio:Contribution margin per unit $0.85
Sales price per unit $1.70= = 50%

Copyright © 2008 Prentice Hall All rights reserved
7-16
E7-17 2.
Breakeven sales in units:
Fixed costs + Operating income
?
($85,000 + $0) / ? = 100,000 units
Copyright © 2008 Prentice Hall All rights reserved
7-17
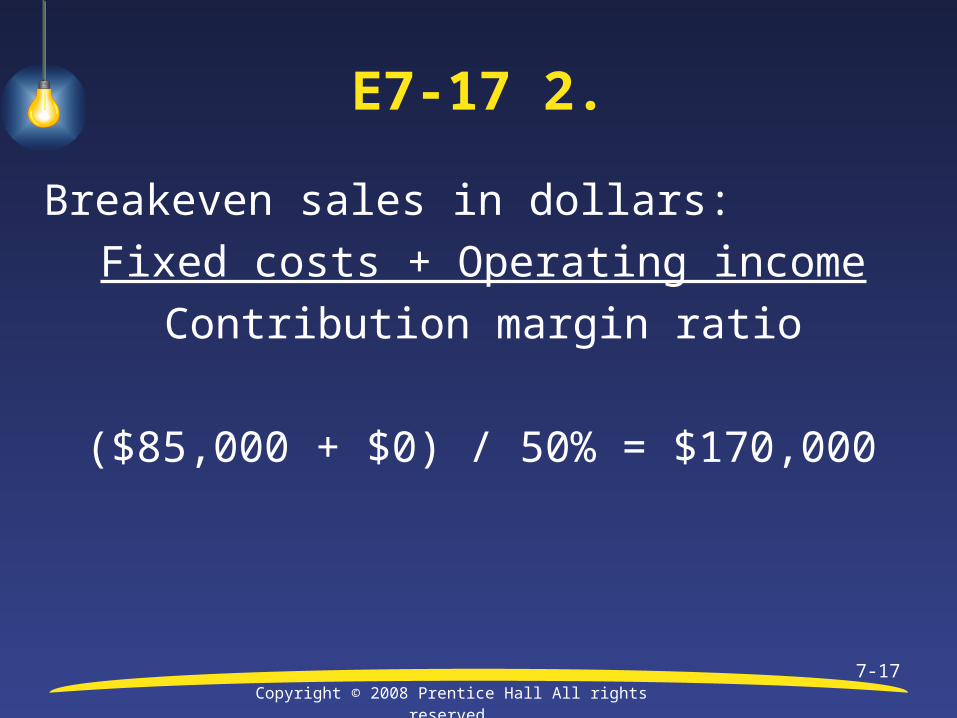
E7-17 2.
Breakeven sales in dollars:
Fixed costs + Operating income
Contribution margin ratio
($85,000 + $0) / 50% = $170,000
Copyright © 2008 Prentice Hall All rights reserved
7-18
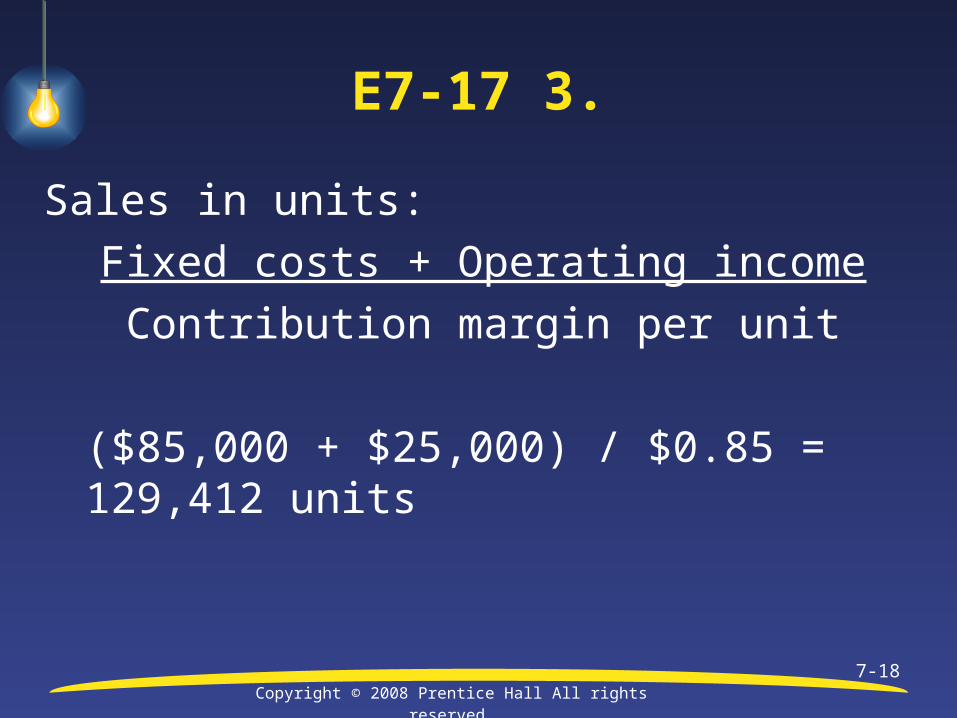
E7-17 3.
Sales in units:
Fixed costs + Operating income
Contribution margin per unit
($85,000 + $25,000) / $0.85 = 129,412 units

Copyright © 2008 Prentice Hall All rights reserved
7-19
Graphing the CVP Relationships
Step 1: Choose a sales volume Plot point for total sales revenue Draw sales revenue line from origin through
the plotted point

Copyright © 2008 Prentice Hall All rights reserved
7-20
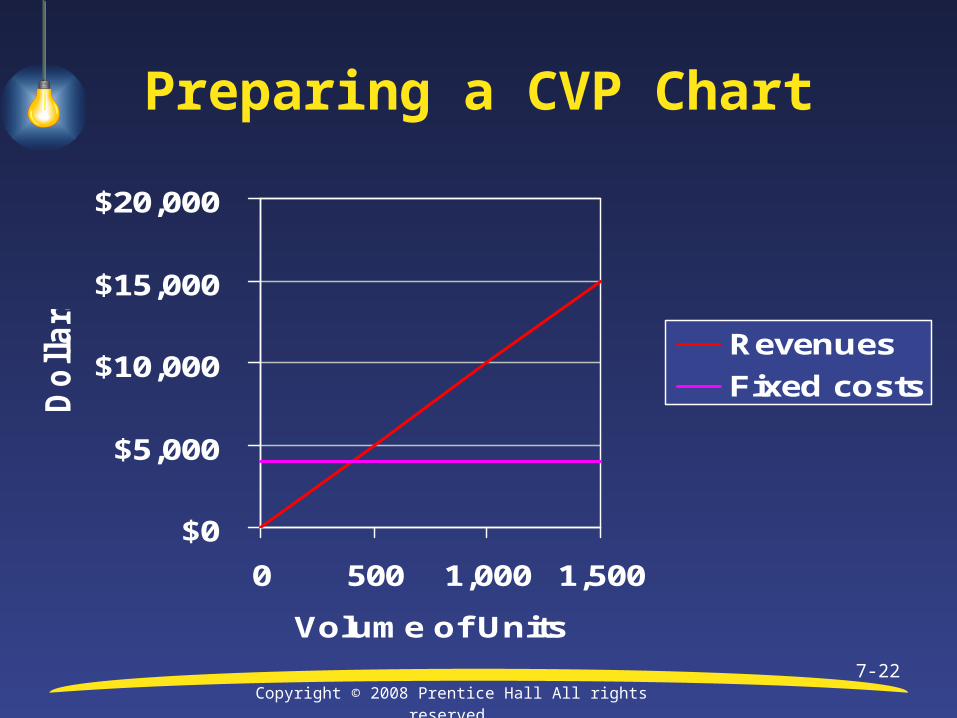
Preparing a CVP Chart
$0
$5,000
$10,000
$15,000
$20,000
0 500 1,000 1,500
Volume of Units
Do
llars
Revenues•

Copyright © 2008 Prentice Hall All rights reserved
7-21
Preparing a CVP Chart
Step 2: Draw the fixed cost line
Copyright © 2008 Prentice Hall All rights reserved
7-22
Preparing a CVP Chart
$0
$5,000
$10,000
$15,000
$20,000
0 500 1,000 1,500
Volume of Units
Do
llars
Revenues
Fixed costs

Copyright © 2008 Prentice Hall All rights reserved
7-23
Preparing a CVP Chart
Step 3: Draw the total cost line
Hint: What are the two factors that comprise the Total Cost of operations?

Copyright © 2008 Prentice Hall All rights reserved
7-24
Preparing a CVP Chart
$0
$5,000
$10,000
$15,000
$20,000
0 500 1,000 1,500
Volume of Units
Do
llars Revenues
Fixed costs
Total cost

Copyright © 2008 Prentice Hall All rights reserved
7-25
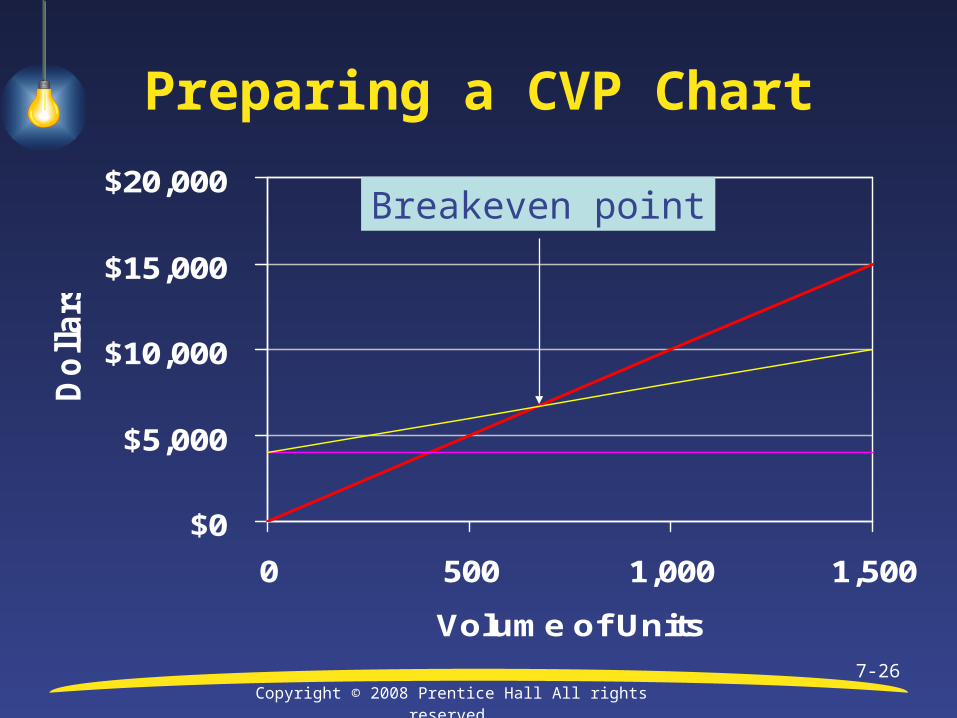
Preparing a CVP Chart
Step 4: Identify the breakeven point and the areas of
operating income and loss
Hint: When does a
company “break even”?
When the neither make money or lose
money….
Copyright © 2008 Prentice Hall All rights reserved
7-26
Preparing a CVP Chart
$0
$5,000
$10,000
$15,000
$20,000
0 500 1,000 1,500
Volume of Units
Do
llars
Breakeven point

Copyright © 2008 Prentice Hall All rights reserved
7-27
Preparing a CVP Chart
Step 5: Mark operating income and operating loss
areas on graph
Copyright © 2008 Prentice Hall All rights reserved
7-28
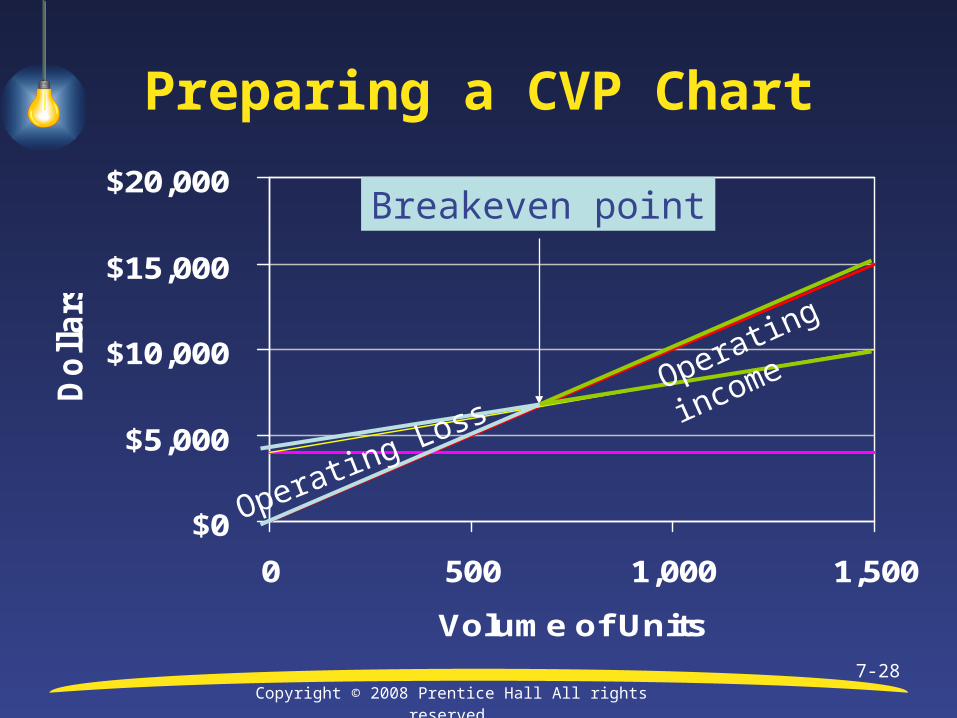
Preparing a CVP Chart
$0
$5,000
$10,000
$15,000
$20,000
0 500 1,000 1,500
Volume of Units
Do
llars
Breakeven point
Operating income
Operating Loss

Copyright © 2008 Prentice Hall All rights reserved
7-29
E7-24
$-
$10,000
$20,000
$30,000
$40,000
$50,000
$60,000
$70,000
0 600 1,200 1,800 2,400
Tickets (in thousands)
Do
llars
(in
th
ou
san
ds)
Revenues

Copyright © 2008 Prentice Hall All rights reserved
7-30
E7-24
$-
$10,000
$20,000
$30,000
$40,000
$50,000
$60,000
$70,000
0 600 1,200 1,800 2,400
Tickets (in thousands)
Do
llars
(in
th
ou
san
ds)
Fixed Costs
Revenues

Copyright © 2008 Prentice Hall All rights reserved
7-31
$-
$10,000
$20,000
$30,000
$40,000
$50,000
$60,000
$70,000
0 600 1,200 1,800 2,400
Tickets (in thousands)
Do
llars
(in
th
ou
san
ds)
E7-24
Breakeven point
Total CostsFixed Costs
Revenues

Copyright © 2008 Prentice Hall All rights reserved
7-32
$-
$10,000
$20,000
$30,000
$40,000
$50,000
$60,000
$70,000
0 600 1,200 1,800 2,400
Tickets (in thousands)
Do
llars
(in
th
ou
san
ds)
Operating
Loss
Operating
income
E7-24
Total Costs
Revenues

Copyright © 2008 Prentice Hall All rights reserved
7-33
E7-24
($24 x units sold)-($4 x units sold)-$24,000,000 = $0
($20 x units sold) = $0 + $24,000,000
Units sold = $24,000,000 ÷ $20 = 1,200,000 tickets
1,200,000 x $24 per ticket = $28,800,000

Copyright © 2008 Prentice Hall All rights reserved
7-34
Objective 3
Perform sensitivity analysis in response to changing business
conditions

Copyright © 2008 Prentice Hall All rights reserved
7-35
Sensitivity Analysis
• “What if” analysis
• What if the sales price changes?
• What if costs change?
• What if the sales mix changes?

Copyright © 2008 Prentice Hall All rights reserved
7-36
E7-25
Sales needed to Breakeven =
Fixed Costs ÷ Contribution Margin Ratio
$500,000 = Fixed Costs ÷ .40
$500,000 × .40 = Fixed Costs
$200,000 = Fixed Costs
New fixed costs = $240,000

Copyright © 2008 Prentice Hall All rights reserved
7-37
E7-25
Sales needed to Breakeven =
Fixed Costs ÷ Contribution Margin Ratio
$240,000 ÷ .40 = $600,000

Copyright © 2008 Prentice Hall All rights reserved
7-38
E7-26
Sale price per scarf $16
Contribution margin ratio x.625
Contribution margin per unit $10
Scarves needed to pay for extra entrance fee cost of $150 ($1,000 x 15%):
$150 ÷ $10 = 15 scarves

Copyright © 2008 Prentice Hall All rights reserved
7-39
Objective 4
Find breakeven and target profit volumes for multiproduct
companies

Copyright © 2008 Prentice Hall All rights reserved
7-40
Multiple Product Break-Even Point – E7-28
Step 1: Calculate weighted-average contribution marginStandard Chrome Total
Sale price per unit $54 $78
Variable costs per unit 36 50
Contribution margin per unit $18 $28
Sales mix in units x 3 x 2
Contribution margin $54 $56 $110
Weighted average contribution
Margin per unit ($110 / 5) $22

Copyright © 2008 Prentice Hall All rights reserved
7-41
Multiple Product Break-Even Point – E7-28
Step 2: Calculate the breakeven point in units
Fixed costs + Operating income
Weighted average contribution margin per unit
(? + ?) ÷ ? = 440 composite units

Copyright © 2008 Prentice Hall All rights reserved
7-42
Multiple Product Break-Even Point – E7-28
Step 3: Calculate the breakeven point in units for each product line
Standard: 440 units x 3/5 = 264 units
Chrome: 440 units x 2/5 = 176 units
Copyright © 2008 Prentice Hall All rights reserved
7-43
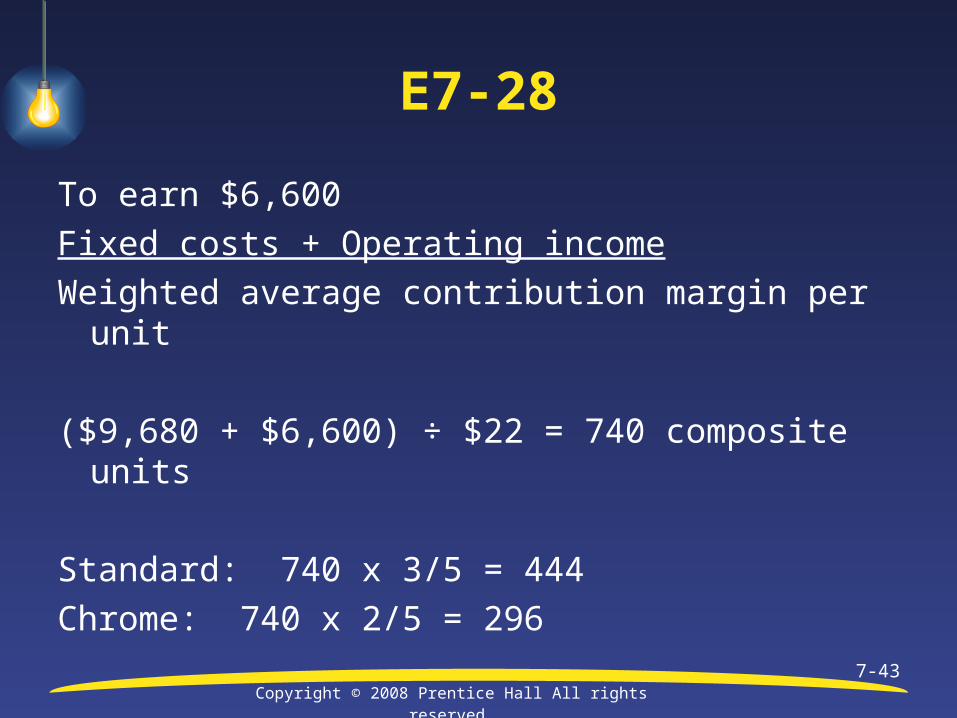
E7-28
To earn $6,600
Fixed costs + Operating income
Weighted average contribution margin per unit
($9,680 + $6,600) ÷ $22 = 740 composite units
Standard: 740 x 3/5 = 444
Chrome: 740 x 2/5 = 296
Copyright © 2008 Prentice Hall All rights reserved
7-44
Objective 5
Determine a firm’s margin of safety and operating leverage

Copyright © 2008 Prentice Hall All rights reserved
7-45
Margin of Safety
• Excess of expected sales over breakeven sales
• Drop in sales that the company can absorb before incurring a loss
• Used to evaluate the risk of current operations as well as the risk of new plans

Copyright © 2008 Prentice Hall All rights reserved
7-46
Margin of Safety
Margin of Safety in Units =Expected sales in units – Breakeven sales in units
Margin of Safety in Dollars =Margin of safety in units x Sale price per unit

Copyright © 2008 Prentice Hall All rights reserved
7-47
Margin of Safety
Margin on safety as a percentage is the same whether units or dollars are used
Margin of safety in units ÷ Expected sales in units
Margin of safety in dollars ÷ Expected sales in $
Copyright © 2008 Prentice Hall All rights reserved
7-48
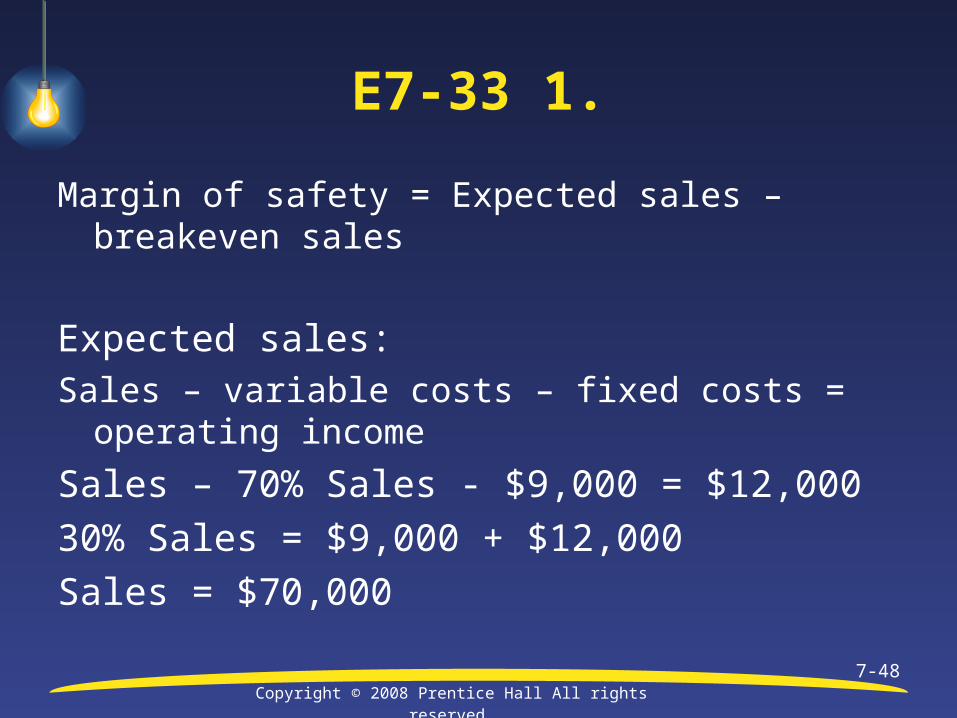
E7-33 1.
Margin of safety = Expected sales – breakeven sales
Expected sales: Sales – variable costs – fixed costs = operating income
Sales – 70% Sales - $9,000 = $12,000
30% Sales = $9,000 + $12,000
Sales = $70,000

Copyright © 2008 Prentice Hall All rights reserved
7-49
E7-33 1.
Margin of safety = Expected sales – breakeven sales
Breakeven sales: Sales – variable costs – fixed costs = operating
incomeSales - 70% x Sales - $9,000 = $030% Sales = $9,000Sales = $30,000

Copyright © 2008 Prentice Hall All rights reserved
7-50
E7-33 1.
Margin of safety = Expected sales – breakeven sales
= $70,000 - $30,000
= $40,000

Copyright © 2008 Prentice Hall All rights reserved
7-51
E7-33 2.
Margin of safety as a % of target sales =
$40,000 ÷ $70,000 = 57%

Copyright © 2008 Prentice Hall All rights reserved
7-52
Operating Leverage
• Relative amount of fixed and variable costs that make up total costs
• Operating leverage factor:
Contribution margin
Operating income
Indicates percentage change in operating income that will occur from a 1% change in volume

Copyright © 2008 Prentice Hall All rights reserved
7-53
Characteristics of High Operating Leverage Firms
• High operating leverage companies have:– Higher levels of fixed costs and lower levels of variable costs
– Higher contribution margin ratios
• For high operating leverage companies, changes in volume significantly affect operating income, so they also face:
– Higher risk
– Higher potential for reward
• Examples include: golf courses, hotels, rental car agencies, theme parks, airlines, cruise lines

Copyright © 2008 Prentice Hall All rights reserved
7-54
Characteristics of Low Operating Leverage companies
• Low operating leverage companies have:– Higher levels of variable costs, and lower levels of fixed costs
– Lower contribution margin ratios
• For low operating leverage companies, changes in volume do NOT have as significant an affect on operating income, so they face:
– Lower risk
– Lower potential for reward
• Examples include: merchandising companies
Copyright © 2008 Prentice Hall All rights reserved
7-55
Operating Leverage Factor
Contribution margin
Operating income
As a general rule, the operating leverage factor, at a given level of sales, indicates
the percentage change in operating income that will occur from a 1% change
in volume

Copyright © 2008 Prentice Hall All rights reserved
7-56
E7-33 3.
Sales $70,000
Variable costs (70%) 49,000
Contribution margin $21,000
Operating leverage:
Contribution margin ÷ Operating income
$21,000 ÷ $12,000 = 1.75

Copyright © 2008 Prentice Hall All rights reserved
7-57
E7-33 4.
If volume decreases 10%, income will decrease: 10% x 1.75 = 17.5%

Copyright © 2008 Prentice Hall All rights reserved
7-58
End of Chapter 7