!copy ava[ to p!1 k r g .it~1 fb'lr( l .la:,e r,,,t, t · dtnsrdc issues three types of...
TRANSCRIPT

DAVID W. TAYLOR NIW SHIPRESEARCH AND DEVELOPMENT CENTER
tlkhv MfL 20064
0 EXPERIMENTAL INVESTIGATION OF THE EFFECT OF PROPELLER
t" BLADE PITCH ON PROPELLER-PRODUCED UNSTEADYU .) BEARING FORCES AND MOMENTS
us23i by-, D.T. Valentine and R.D. Kad.r
0~C
A. C&L LL
occU 4 APPROVED FOR PUBLIC RELEASE: DISTRIBUTION UNLIMITED
ILw
!COPY AVA[ TO P!1 [S K rU.-
00Mg .iT~1 Fb'Lr( L .LA:,E r,,,t, T .D D C
Z> RESEARCH AND DEVELOPMENT REPORT FEB 18 197Tz V
w
- Zeb i
LuwDeeme 196Reot7603

MAJOR DTNSRDC ORGANIZATIONAL COMPONENTS
DTN=RDC
COMMANDER
TECHNICAL DIRECTOR01
FIC-N. HARGE OFFICER-IN-CHARGECARDER CK 05ANNAPOLIS
0
SYSTEMSDEVELOPMENTDEPARTMENT
11
SHIP PERFORMANCE AVIATION AND
DEPARTMENT SURFACE EFFECTS15 DEPARTMENT 16
STRUCTURES [ COMPUTATIONDEPRTUENT AND MATHEMATICS
17 DEPARTMENT 18
SHIP ACOUSTICS PROPULSION ANDDEPARTMENT AUXILIARY SYSTEMS
, 19 DEPARTMENT 27
MATERIALS CENTRALDEPARTMENT INSTRUMENTATION
28 DEPARTMENT
GCo 9os.e~e NDW-I)TNSRI" 3960/43h (Rev. 11-75)
DTNSRDC ISSUES THREE TYPES OF REPORTS
(1) DTNSRDC REPORTS, A FORMAL SERIES PUBLISHING INFORMATION OFPERMANENT TECHNICAL VALUE, DESIGNATED BY A SERIAL REPORT NUMBER.
(2) DEPARTMENTAL REPORTS, A SEMIFORMAL SERIES, RECORDINt INFORMA.TION OF A PRELIMINARY OR TEMPORARY NATURE, OR OF LIMITED INTEREST ORSIGNIFICANCE, CARRYING A DEPARTMENTAL ALPHANUMERIC IDENTIFICATION.
(3) TECHNICAL MEMORANDA, AN INFORMAL SERIES, USUALLY INTERNALWORKING PAPERS OR DIRECT REPORTS TO SPONSORS, NUMBERED AS TM SERIESREPORTS; NOT FOR GENERAL DISTRIBUTION.
I

UN1CLAS~S IFIEDSECURITY CLASSIFICATION. O'* YnIS PAGE (Sb., Des. Entered)
READ INSTRUCTIONSREPOR DOCUMENTATION PAGE BEFORE COMPLETING FORM2GOVT ACCESSION NO. 3 RECIPENT'S CATALOG NUMBER
( ITLE (~iA1RdN6Ms& - S TYPE OF REPORT 6 PEmON3 COVERED
.YMPERIMMNAL.JNVESTIGATION OF THE 4IFFECT OF
aWENS 6 PERFORMING ORG REPORT NUMBER
7 AuTH~es)S CONTF4ACT OR GRANT NUMSER(.)
/DLLValentine ~Rd . aeD. _ _ _ _ _ __ _ _ _ _ _ R "der
IPERPORMING ORGANIZATION NAME AND ADDRESS Io PROGRAM ELEMEN.POW TASK
David W. Taylor Naval Ship ResearchARA&WKUNT561"Sand Development Center (e ees ieBethesda, Maryland 20084 (e ees ie
ICONTROLLING OFFICE NAME ANO ADDRESS .12 FRTDENaval Sea Systems Command 'De T c 7Ship Silencing Division (037) 13 NUMBER OF PAGESWashington, D.C. 20362 60
14 MONLTORING AG91NCY iME.hItfdifferent froem Controllin~g Officee) IS SECURITY CLASS. (of this report)
SCHEDULE
.4,-___APROVED FOR PUBLIC RELEASE: DISTRIBUTION UNLIMITED
17 DISTRIBUTION STATEMENT (of the abstract entered In St ef, 20, If different froem Repoey
IS SUPPLEMENTARY NOTES
*19 KEY WORDS (Conitinu, art reverse side If necessary end Identify by block number)I
Pitch effectsVibratory forces
20 T DG ACT (Continue on revere dda It ncoeemy nd identify by block number)
0 Experinental results are presented to show the effect of pitch-diameterratio on propeller-produced unsteady loads. Eight three-bladed propellerswith changes of equal increments of pitch resulting in pitch-diameter ratiosfron 0.58 to 1.75 were tested in three-cycle and four-cycle wake screens.The data indicated that, in general, for the sane thrust loading coefficientC Th the unsteady thrust and bending moments tend to decrease with increasing /
(Continued on reverse side)
DD I A 1473 EDITION OF I NOV 6SIS OBSOLETE UNCLASSIFIEDSN lI2*l4AOISECURITY CLASSIFICATION OF THIS PAE(When Data Entered)

UNCIASSIFIED-. Wtj41TY CLASSIICATIOft OF TNIIS PACEfUS..m DaEftEE ___________________
(Block 10)62754NSF 43 452 702160791-1544-259
(Block 20 continued)----Ppitch whereas the torque increases and the side forces change negligibly.
However, it is impracticable to reduce unsteady thrust by altering pitch.For low thrust loading coefficients, e.g., CTh 0.51, optimia propeller
efficiencies were obtained with the higher pitch-diameter ratios. For highthrust loading coefficients, e.g., Ch - 1.53, the optimm propellerefficiencies were obtained at the lower pitch ratios. However, the alter-nating forces did not vary much for the high as for the low Ch designs
and the optimum efficiency pitch ratio was near the optimum unsteadyloading pitch ratio. Consequently, propeller designs for optimum effi-ciencies are the most appropriate selections with regards to pitch-diameterratio.
Results are presented for the six components of unstepy loadingdivided by the appropriate steady loading. As an example, the thrust andtorque variations were as follows. For a thrust loading coefficient of0.51 and a change in pitch-diameter ratio from 0.58 to 1.75, the alter-
nating thrust ratio 0 / T) changed from 0.74 to 0.40, and the alternating
torque ratio ( / 9) changed from 0.40 to 0.31. For a thrust loading
coefficient of 1.53 and the same change in pitch-diameter ratio, /
changed from 0.26 to 0.2 and there was only a negligible change in / Q.
? ,v ,mlme
........................
-,::.,,,,,,,.D D C V
DW
UNCLASSIFIED .,SECURITY CLASSIFICATION OF THIS PAGE(When Dit Enoted)
TABLE OF CONITWTS
PageABSTRACT . . . . . . . . . . . . . . .
ADHtNISTRATIVE ITFORMATION ..................... I
INTRODUCTION . . . . . . . . . . . . . . . . . . . . . . . . . . . . 2
METHOD AND PROCEDURE . . . . . . . . . . . . . . . . . . . . . . . . 4
PROPELLER MODELS . . . . . . . . . . . . . . . . . . . . . . . . 4
TEST FACILITY AND EQUIPMENT .................. 5
EXPERIMENTAL DETERMINATION OF UNSTEADY LOADINC . . . . . . . . . 8
INSTPUMENTATION AND DATA ANALYSIS . . . . . .. .. .. . .. . 8
RESULTS .. 44.4..4.4 4 4 4 4 4 4 4 4. . 4 .. .... 12
DISCUSSION .. .. .. .. .. .. .. .. .. .... ... 13
SUMMARY AND CONCLUSIONS. ..... .......... ... 9.. 16
REFERENCES . . . . . . . . . . . . . . . . . . . . 48
LIST OF FIGURES
I - Typical Shape of the Propeller Series ............. 18
2 - Open-Water Characteristics of the PitchSeries Propellers ....................... 19
3 -Three-Cycle Wake Screen .................... 21
4 -Four-Cycle Wake Screen 21
5 - Harmonic Content of Three-Cycle Wake . . . .......... 22
6 - Harmonic Content of Four-Cycle Wake . . ............ 22
7 - Typical Signals in Three-Cycle Wake . . ........ ... 23
8 - Typical Signals in Four-Cycle Wake ............... 24
9 - Forces and Moments Acting on Propeller ............. 25
1O - Details of the Instrumentation . . . 25
ti

Page
11 - Unsteady Thrust . . . . . . . . . . . . . . . . . . . . . . .. 26
12 - Unsteady Torque . . . 27
13 - Unsteady Thrust Phase Angles .. ................ 28
14 - Unsteady Torque Phase Angles ........ . ..... 29
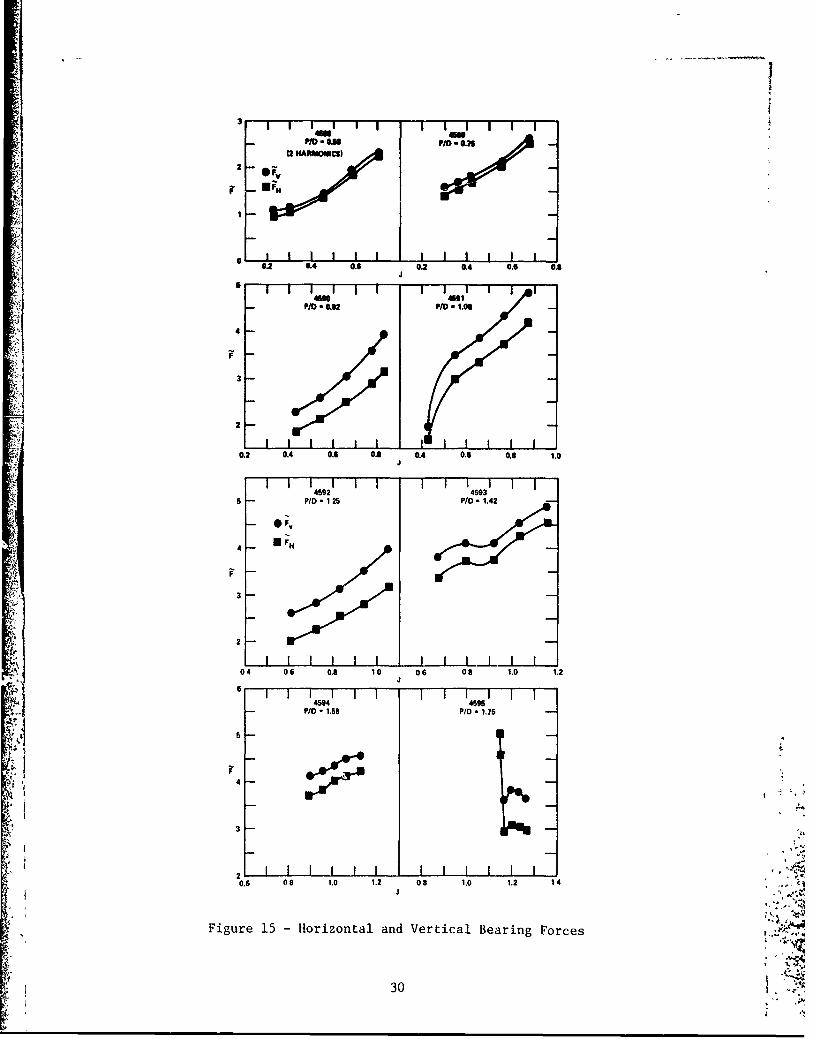
15- Horizontal and Vertical Bearing Forces . .. . . . . . . . . . . 30
16 - Horizontal and Vertical Pending Moments ............ 31
17 - Horizontal and Vettical Searing Force Phase Angles . o o . o .. 32
18 - Horizontal and Vertical Rending Moment Phase Angles . o . . . . 33
19 - Changes in Efficiency, Shaft Speed, Blade Freouency,Thrust, and Torque with Change in Pitch-to-DiameterRatio for Constant Thrust Coefficient ............. 34
20 - Effect of Pitch Ratio on the IJnsteav. ThrustDivided by Steady Thrust . . . o . . . . .. ..o. . . . . . .. 36
21 - Effect of Pitch Ratio on the Unsteady Thrust2Divided by J2 . ..... . . 37
22 - Effect of Pitch Ratio on the Unsteady TorqueDivided by J 38
23 - Eff.ct of Pitch Ratio on the Unsteady Torque Dividedby Steady Torque . . . . . . . . . . . . . . . ......... 39
24 - Effect of Pitch Ratio on the Side Forces Divided by J . 40
25 - Effect of Pitch Ratio on the Side Forces Dividedby Steady Thrust ........ . .. . . .. 41
26 - Effect of Pitch Ratio on the Rending Moment
Divided by 2 . . . . . . . . . . . . . . . . . . . . . 42
27 - Effect of Pitch Ratio on the Rending MomentDivided by Steady Torque . . . . . ..... . 43
28 - Velocity Diagram ...... . . ......................... . 44
iv

it LIST OF TABLES
Page
1 -Geometric Characteristics of Stock Propellers 4588, 4589,4590, 4591, 4592, 4593, 4594, and 4595 ... ....... 45
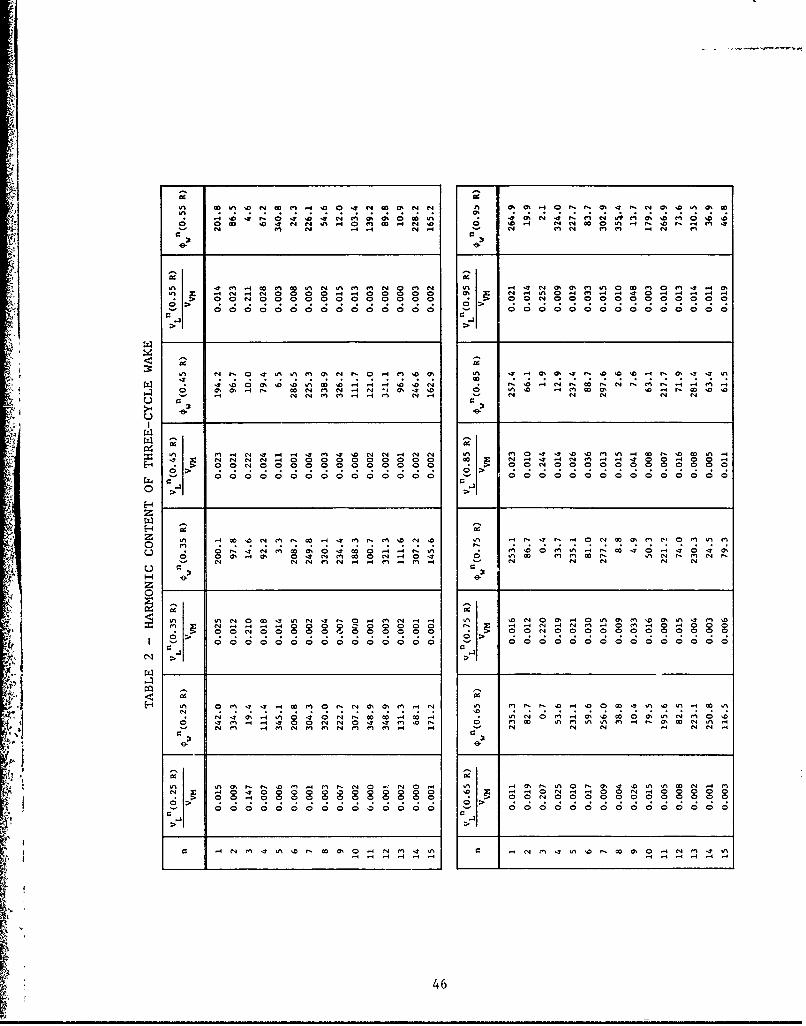
2 - Harmonic Content of Three-Cycle Wake .. .. .. .9...... 46
3 - Harmonic Content of Four-Cycle Wake . . . . .. .. .. . . 47
ij F
T

NOTATION
a Fourier cosine coefficients of longitudinal wake velocityn
b Fourier sine coeffitients of longitudinal wake velocityn
c(r) Chord length
CTh T / (1/2#wVA2 R2) Thrust loading coefficient
D Propeller diameter
EAR Expanded area ratio, expanded blade area divided by disk A.rea
F Amplitude of harmonic of horizontal side force *
H
F Amplitude of harmonic of vertical side forceV
FI Amplitude of harmonic of lagging component of side force.1 rotating with propeller
F Amplitude of harmonic of leading component of side forcerotating with propeller
J V /nD, advance coefficientA
2 4K FP/Pn D , force coefficient based upon amplitude ofharmonic of force
K IMR/on2D , moment coefficient based upon amplitude ofharmonic of moment
V2 5
KQ Q/n2D , torque coefficient based upon steady componentQ of torque [
KQ Q/pn2 D5 , torque coefficient based upon amplitude of 4harmonic of torque
2 4KT' T/nr , thrust coefficient based upon steady component C1
of thrust

of th r thrust coefficient based upon amplitude of harmoicof thrust +
k Order of blade harmonic
L(r) Unsteady lift on a blade element
Amplitude of harmonic of horizontal bending moment
Amplitude of harmonic of vertical bending moment
H Amplitude of harmonic of leading component of bending moment ro-tating with propeller
M2 Amplitude of harmonic of lagging component of bending momentrotating with propeller
n Order of shaft harmonic
n 2wQ, in revolutions per second
n Normal to helicoidal surface at loading point
Normal to helicoidal surface at control point
P Propeller pitch
p Perturbation pressure
f,- Steady component of torque
Q,&
i Harmonic amplitude of torque
SR Radius of propeller
Re[] Real part off
Rn Reynolds number for propeller; Co7
vii

r Radial coordinate of control point
rh Radius of hub
TT Steady component of thrmst
PAplitude of harmrete of thrust
t Time
V(r,*) Local inflow velocity to propeller plane
VA Speed of advance
V L(r,*) Local longitudinal inflow velocity to propeller plane
VNn(r) Fourier coefficients of wake velocity normal to the blade
V vM Volume mean velocity into propeller disk
x Longitudinal coordinate of control-point
x~r,$ Cylindrical coordinate system of control point
Z Number of blades
B Advance angle of a propeller blade section
n 0Efficiency of propeller in open water
0 Angular coordinate of loading point; angular coordinate inpropeller disc, positive clockwise looking forward
b Propeller angular position relative to position where tI =MV
0 Propeller geometry pitch angle
0 Mass density of fluid
I Angular velocity of propeller in radians per second
viii

ABSTRACT
-Experimental results are presented to show the effect of'pitch-diameter ratio on propeller-produced unsteady loads.Eight three-bladed propellers with changes of equal Incrementsof pitch resulting in pitch-diameter ratios from 0.58 to 1.15were tested in three-cycle and four-cycle wake bcreens. Thedata indicated that, in general, for the same thrust loadingcoefficient Ch, the unsteady thrust and bending moments tend
to decrease with increasing pitch whereas the torque increasesand the side forces change negligibly. However, it is Imprac-ticable to reduce unsteady thrust by altering pitch. For lowthrust loading coefficients, e.g., CTh - 0.51, optimum pro-
peller efficiencies were obtained with the higher pitch-diameterratios. For high thrust loading coefficients, e.g., Ch = 1.53,
the optimum propeller efficiencies were obtained at the lowerpitch ratios. However, the alternating forces did not vary muchfor the high as for the low CTh designs and the optimum effi-
ciency pitch ratio was near the optimum unsteady loading pitchratio. Consequently, propeller designs for optimum efficienciesare the most appropriate selections with regards to pitch-diameter ratio.
Results are presented for the six components of unsteadyloading divided by the appropriate steady loading. As anexample, the thrust and torque variations were as follows. Fora thrust loading coefficient of 0.51 and a change in pitch-
diameter ratio 6.58 to 1.75, the alternating thrust ratio (T / T)
changed from 0.74 to 0.40, and the alternating torque ratio
(Q I Q) changed from 0.40 to 0.31. For a thrust loading co-efficient of 1.53 and the same change in pitch-diameter ratio,
(T / changed from 0.26 to 0.2 and there was only a negligible
change in (Q / Q).
ADMINISTRATIVE INFORMATION
This project was sponsored by the Ship Silencing Division (037) of the
Naval Sea Systems Command under Program Element 62754N, and Task SF 43 452
702. The work was performed at the David W. Taylor Naval Ship Research and
Oevelopment Center (DTNSRDC) under Task 16079, Work Unit 1-1544-259.

INTRODUCTION
The unsteady forces and moments produced by o*peration of a propeller
in the wake of a ship are of fundamental importance in the analysis of
machinery and hull vibration. The circumf-rentially nonuniform inflow into
the propeller subjects eich blade section to periodic variations in its
inflow velocity and-angle of attack, resulting in undesirable fluciuations
in the propeller loading. These propeller-produced fluctuating forces and
moments (unsteady bearing forces and moments) are transmitted from the pro-
peller through its shaft and bearings to the machinery and other parts of
the hull structure. (Propeller-generated pressure fluctuations are also
transmitted through the water to the ship hull and can cause the hull to
vibrate; however, that type of ,ibration is not considered in this report.)
Severe vibration problems can result if the alternating forces are large.
In addition, since vibration problems increase with increasing speed and
power and since the trend of advancing ship technology is toward increased
speed and power, the unsteady forces produced by the propeller are of con-
siderable interest to the designers of ships and propellers. Therefore,
it has become increasingly important to design propellers with blade
shapes selected to reduce the alternating forces. This requires information
on how the various geometric parameters of a propeller influence the magni-
tude of the alternating forces and moments.
The present investigation was conducted as part of a continuing effort
at the David W. Taylor Naval Ship Research and Development Center (DTNSRDC)
to evaluate the effects of various parameters, e.g., wake velocity dis-
tribution, propeller blade skew, blade warp, blade width, pitch-ratio, etc.,
on the propeller-generated unsteady bearing forces and moments. The ob-
jective of this investigation was to determine experimentally the effect of
pitch-diameter ratio on the alternating forces produced by a propeller
operating in a wake. The results indicate that, in general, the higher the
pitch in a given desiga problem, the lower the blade frequency thrust and
the higher the blade frequency torque. In addition, the propeller side

-"
forces tend to increase slightly and the bending moments decrease with an
Incruse in pitch. The blade frequency torque results disagree with
analytical calculations by Boswell and Miller I of the effect of pitch on
propeller-produced unsteady thrust and torque. In their parametric in-
vestgation of various propeller geometrical parameters, they considered the
effect of pitch analytically. Their calculations were made with an
early version of a propeller unsteady forces prediction computer program
developed at the Stevens Institute of Technology (SIT) and reported by
Tsakonas, Breslin, and Miller. 2 No comparisons with analytical predictions
based on this program, other than the Boswell and Miller results, are pre-
sented herein. The numerical analysis procedure has been superseded by a
more exact approach, also developed at SIT, as reported by Teskonas, Jacobs,
and All. 3 The continuing development of the analytical procedures has
created an obvious need for experimental data for comparison purposes. It
is in this spirit that the results of the present investigation are
reported.
Eight 1-ft (0.305-m)-diameter, three-bladed propellers with expanded
area ratios of 0.54 and pitch-diameter (P/D) ratios varying from 0.58 to
1.75 were tested in three-cycle and four-cycle wake screens. The six
components of the alternating propeller forces and moments were measured in
the closed-jet test section of the 24-in. variable-pressure water tunnel at
DTNSRDC. The unsteady thrust decreased and the unsteady torque increased
by factors of 1.9 and 1.4, respectively, for a thrust loading coefficient
1Boswell, R.J. and M.L. Hiller, "Unsteady Propeller Loading - Measure-ment, Correlation with Theory, and Parametric Study," NSRDC Report 2625(Oct 1968). A complete listing of references is given on page 48.
2 Tsakonas, S. et al., "Correlation and Application of an Unsteady FlowTheory for Propeller Forces," Transactions of the Society of NavalArchitects and Marine Engineers, Vol. 75, pp. 158-193 (1967).
3Tsakonas, S. et al., "An Exact Linear Lifting-Surface Theory for aMarine Propeller in a Nonuniform Flow Field," Stevens Institute of
Technology DL Report 1509 (Feb 1972).
3

C Th 0.51 and a change in P/0 ratio from 0.58 to 1.75. The unsteady t:rust
decreased and the unsteady torque increased by factors of J.8 and 1.9, re-
spectively, for a thrust loading coefficient CTh - 1.53 and a change in -
P/D ratio from 0.58 to 1.75. The optimum P/D ratios for the thrust loading
coefficients CTh - 0.51 and 1.53 were approximately equal to 1.45 and 1.1,
respectLvely. The observed trends are of interest in the design problem.
For instance, varying the P/D ratio as a means of reducing alternating
thrust is not practicable because (1) designs selected on the basis of
optimum propeller efficiency are near optimum with regard to the pitch that
affects the alternating forces production; (2) the alternating torque tends
to increase with pitch; and (3) it has been demonstrated that other bladeshp hags gse1,4 "5 adar6shape changes, e.g., skew and warp cause greater changes in the
alternating forces produced by the propeller than the changes attributable
to pitch and measured in this experiment.
ETHOD AND PROCEDURE
PROPELLER MODELS
The present investigation required a fairly large number of propellers.
Eight commercially available models, designated the M-P design series by
the manufacturer, were purchased from rtichigan Wheel. The only change in
the catalog specifications was an increase in the diameter of the stock hub
as necessary to fit the existing dynamometer mount. The adequacy of
4Cumning, R.A., et al., "Highly Skewed Propellers," Transactions of the
Society of Naval Architects and flarine Engineers, Vol. 80, pp. 98-135(1972).
5Valentine, D.T. and F.J. Dashnaw, "Highly Skewed Propellers for SanClemente Class Ore/Bulk/Oil Carrier Design Considerations, Model and Full-Scale Evaluation," Proceedings of the First Ship Technology and Research(STAR) Symposium, Washington, D.C. (Aug 1Q75).
6N1elka. J.J., "Experimental Evaluation of a Series of Skewed Propellerswith Forward Rake: Open-Water Performance, Cavitation Performance, Field-Point Pressures, and Unsteady Propeller Loading," DTNSRDC Report 4113(Jul 1974).
4

commercially available propellers for the present investigation was verified
by comparing the present results with those of tosweil"and Miller, I as
discussed later.
All eight propellers had a diameter of I ft (30.5 cm), a blade area
ratio of 0.54, three blades, and zero skew. Thus the propellers differed
only In pitch (17.78, 22.86, 27.94, 33.02, 38.1, 43.18, 48.26, and 53.34
cm). This range of P/D ratios (from 0.58 to 1.75) was selected because most
practical designs fall within it. Table I summarizes the geometrical
particulars of the propellers, Figure I illustrates the typical shape of
the series, and Figure 2 shows their open-water characteristics.*
TEST FACILITY AND EQUIPMENT
The present experiments were performed in the ".NSRDC 24-in. variable-
pressure water tunnel, a recirculating tunnel with provisions for mounting
wake simulation grids into its 27-in. (68.6-cm)-diameter closed-jet test
section.** Three-bladed propellers had been selected for the investigation
because of the availability of wake screens for inducing three-cycle and
four-cycle wakes. The wire mesh screens had been constructed I by using a
base screen of 0.009-in. (0.023-cm)-diameter wire (16 per inch or 6.3 per
centimeter) and a single overlay screen of 0.015-in. (0.038-cm)-diameter
wire (18 per inch or 7.1 per centimeter) in the high-wake region. The
overlay screen was oriented so that its wires intersected those of the base
screen at 45 deg (0.785 rad). Since each model was located 2 1/2 propeller
Code 1524 at DTNSRDC used the deep-water basin and standardizedmethods to determine the first-quadrant open-water characteristics of theeight propellers. A gravity dynamometer installed in the propeller boatwas utilized to measure thrust and torque. The propellers were run at sever-
al shaft speeds and speeds of advance VA which resulted in Reynolds numbers
on the order of 5 x 10⁵ throughout the range of design interest. The shaftspeed and speed of advance were measured to within ±0.01 rps (±0.06rad/s) and ±0.001 fps (±0.003 m/s), respectively. The thrust and torquefor a given advance coefficient were reproducible to better than 2 percentin repetitive experiments.
- **The facility is termed the 24-in. tunnel because of the 24-in. diameter
of the nozzle exit for the open-jet test section.
5

diameters downstrem, it ts believed ti-ht its presence did not alter the-
flow over the wires. Moreover, there was only negligible unsteady
interaction hetween the walls of wc.' cest section and each propeller.,
The three-cycle wake screen proaced a nonuniform inflow with a
dominant third harmonic and caused the propellers to develop large blade
frequency thrust and torque. The four-cycle wake screen produced a non-
u,ziform inflow with a dominant fourth harmonic and caused the propellers
to develop large blade frequency side forces and bending moments. These
wake-producing screens were oriented in the tunnel ahead of the propellers;
see Figures 3 and 4. The velocity field into the propeller plane pro-
duced by the screens had previously been measured with a pitot rake; see1
Miller and Boswell. Their results were as follows. The circumferential
variations in the longitudinal velocity can be expressed as
a
VL(r,)- VL(r) + Z VLn(r) sin(nO + * n) (I)
n-1
where
V (rO) = local longitudinal inflow velocity to the propeller planeL
VLn(r) = Fourier coefficient of the nth harmonic of the circum-ferential variation in the longitudinal wake velocity
0 = angular coordinate about the shaft axis, positive clockwiselooking upstream (0 - 0 for vertical upward)
n- phase angle of the nth harmonic of the wake
6
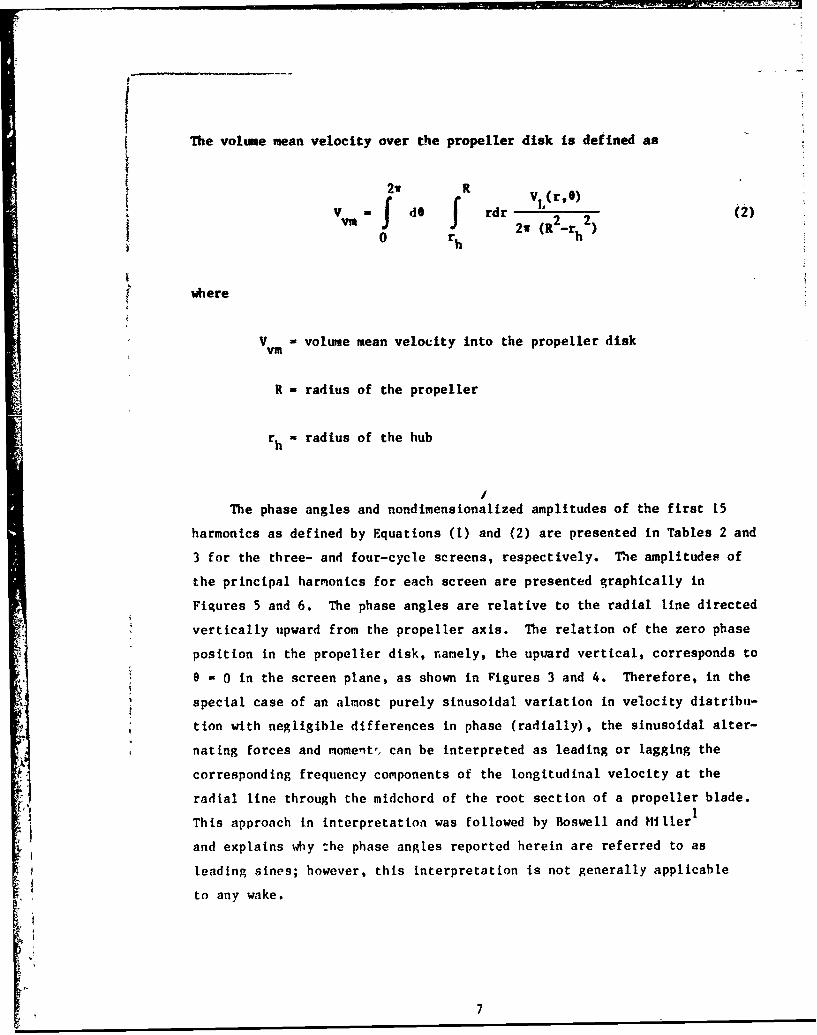
The volume mean velocity over the propeller disk is defined as
2w V
V- 1 dO rdr 2 (2)VI f" 2o' (R r_ 2-
0 2 -h
w here
V - volume mean velocity into the propeller disk
R - radius of the propeller
rh = radius of the hub
/
The phase angles and nondimensionalized amplitudes of the first 15
harmonics as defined by Equations (1) and (2) are presented in Tables 2 and
3 for the three- and four-cycle screens, respectively. The amplitudes of
the principal harmonics for each screen are presented graphically in
Figures 5 and 6. The phase angles are relative to the radial line directed
vertically upward from the propeller axis. The relation of the zero phase
position in the propeller disk, namely, the upward vertical, corresponds to
e - 0 in the screen plane, as shown in Figures 3 and 4. Therefore, in the
special case of an almost purely sinusoidal variation in velocity distribu-
tion with negligible differences in phase (radially), the sinusoidal alter-
nating forces and moment', can be interpreted as leading or lagging the
corresponding frequency components of the longitudinal velocity at the
lradial line through the midchord of the root section of a propeller blade.
This approach in interpretation was followed by Boswell and Miller
and explains why the phase angles reported herein are referred to as
leading sines; however, this interpretation is not generally applicable
to any wake.
7

EXPERIHENTAL DETERHIATION OF UNSTFADY LOADING
The propeller series was run in both the three- and four-cycle wake
patterns. Since the mean tunnel speed could not be measured directly, a
thrust identity to open-water results was used to determine the advance
coefficients. This assumes that the advance coefficient was the same as that
which would have resulted for the same thrust coefficient in the open-water
experiments. The shaft speed was set to 12 or 15 rev/s (75.4 or 94.2 rad/s,
respectively), depcnding on the pitch of the propeller and the desired test
condition. This provided Reynolds numbers varying from 1.332 to 1.426 x 10⁶
for Propellers 4588 to 4591 (0.58 < P/D < 1.08) and from 1.10 to
1.221 x 10⁶ for Propellers 4592 to 4595 (1.25 < P/D < 61.75).
Figure 7 presents typical signals from the six-component balance in
the three-cycle wake and Figure 8 typical signals in the four-cycle wake.
One propeller revolution constituted the distance between the pulses in the
upper trace as generated by the single-tooth gear. These signals were
recorded on magnetic tape for subsequint computer analysis, and the major
harmonic components of each signal were read from the on-the-spot analysis
system. All six components of force presented in this report were ob-
tained from computer analysis. The experimentally determined amplitudes
of the blade frequency harmonic of all six loading components were
accurate within ±5 percent.7
INSTRUMENTATION AND DATA ANALYSIS
The six components of unsteady loading were measured by a six-component
dynamometer, and a sting-mounted balance with semiconductor strain gages
was utilized for the sensing elements. The dynamometer assembly electrical
arrangement and the experinental procedure are described in Miller.
The strain gage balance was mounted on a stiff sting attached to a flywheel
and the whole assembly ran on soft-mounted bearings and was driven through
7Miller, K.L., "Experimental Determination of Unsteady PropellerForces," Seventh ONR Symposium on Naval Hydrodynamics, DR-148, pp.255-289 (Aug 1968).
8

a soft coupling. This type of mounting was selected to Isolete the system
from the vibrations of the tunnel; it was 9umr11 enough to cause little
disturbance of the tunnel flow. The totally submerged 4*nauometer was
driven by a 10-hp, d-c motor through an external slipri q:, shaft, and
amplifier housing. The hollow connecting shaft carried the signal cables
and passed through a stuffing tube as it entered the tunnel. Before being
taken from the shafting, the a-c signals were amplified with solid-state
preamplifiers to improve the signal-to-noise ratio.
In order to be useful over the range of test conditions, the dyne-
mometer should have a flat frequency response extending from the lowest
shaft frequency of around 10 Hz to several times the highest propeller
blade frequency of 400 Hz. The system was cepresented by lumped para-
meters, and two principal resonances were determined for each component by
means of a vibration analysis. The lover resonance appeared at around 6 Hz
and was caused by vibration of sting and balance assembly as a rigid mass
on the soft bearing supports. The second resonance at about 450 Hz was the
first bending mode due to the mass of the propeller and the spring of the
measuring elements.
The balance was calibrated both statically and dynamically. The static
calibrations were performed for the balance alone outside the tunnel; the
sensitivity of each transducer to the forces applied in axial, torsional,
transverse, and bending modes was determined in increments over the Input
force range. The results indicated only two significant interactions:
(1) a small 61fect of torque on the thrust readings and (2) some effect
of bending moment on the output o' che side-force gages in the same plane.
The dynamic calibration was performed after assembly in the tunnel and con-
sisted of exciting the measuring system with a known force in increments of
driving frequency over a broad frequency range. This procedure was carried
out to establish the sensitivity in the dynamic response of each transducer
over the desired range of measuring frequency.
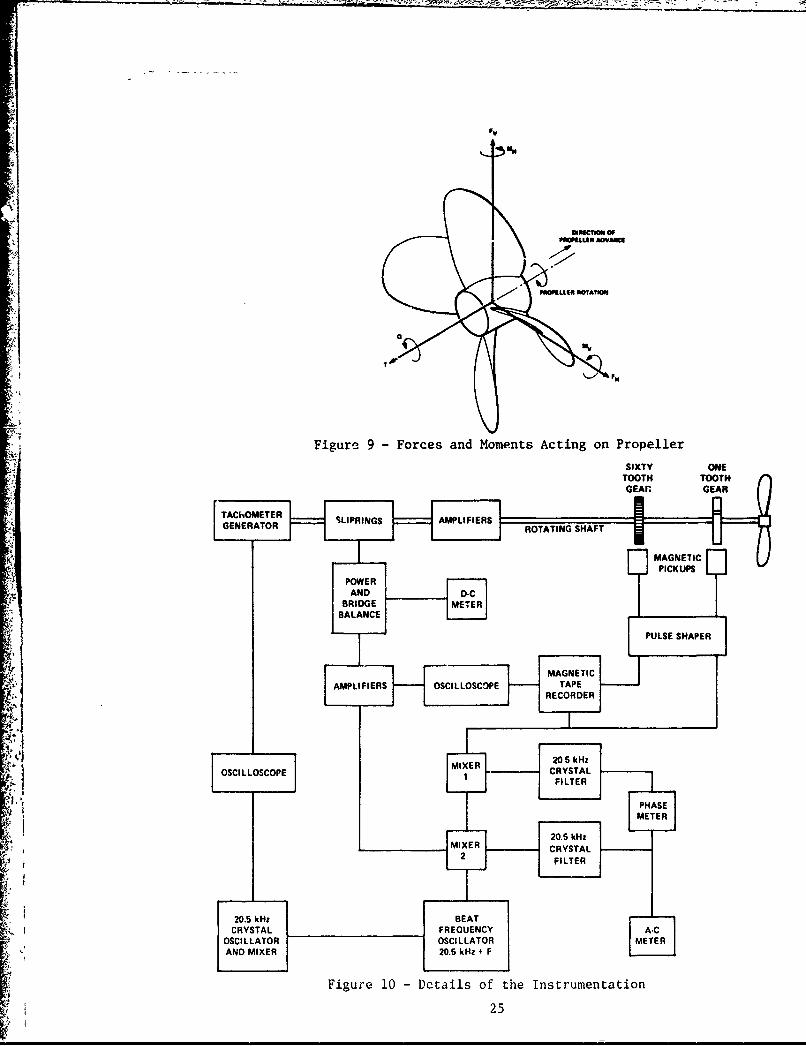
The sign convention in this report was the same as used by Miller7 and
is presented in Figure 9. The balance was designed to measure force and
9

moment slong a pair of orthogonal axes by means of sensors which rotated
with the propeller and allowed the related transverse force and bending-
moment vectors to be measured. At any propeller angle 0*b the forces arid
moments vith respect to the fixed axes are:
t- MI cos 3 b + 12 $in b
H -"I s'n eb + M2 cos Ob
V FI cos 0b - F2 sin 0b
F -H FI sin 0b + F 2Cos
where I 2' fl, and 1L are the moments and forces with respect to the
rotating coordinate system.
Figure 10 is a block diagram of the instrumentation used with the dyna-
mometer. Power was supplied to the strain-gage bridges for thrust, torque,
side force, and bending moment by four separately adjustable power supplies.
The a-c output signals were separated from the steady signals and amplified
before leaving the rotating shaft through the sliprings and brushes. Out-
side the shaft, the a-c signals were sent through another set of amplifiers
and a set of attenuators to adjust the signals to the proper level for the
tape recording and analyses. The signals were constantly monitored by an
oscilicqcope, and photographic records were made of the waveforms when the
signal was :ecorded on tape. A one pulse per revolution was also recorded
on tape for phase reference along with 60 pulses per revolution to control
the analog-to-digital conversion. A digital time code was also recorded
.2 on the tape to identify the data and permit the use of an automatic tape-
search unit during digitalization. The d-c signals representing the steady
components wert read on a direct-current electronic voltmeter.
10

On-the-spot analysis of the signal was carried out by utiliziag a two-
channel, constant-bandwidth, wave analyzer consisting of a common local
oscillator, two mixers, and two crystal filters matched for frequency and
phase. The single-tooth pulse was fed into one channel as a phase refer-
ence. This pulse contained strong harmonics of the shaft frequency in
phase-withbeach other because the pulse was narrow and symmetrical. An
oscilloscope enabled the analyzer to be tuned to a desired harnonic of
any one of the unsteady signals and the reference signal which had a fixed
relationship to the angular position of the propeller. The amplitude
of the unsteady signal ws measured by a voltmeter, and the phase angle was
measured by sending the two signals through a phase meter. All six
components were measured by switching the analyzer and multipling by the
calibration matrix with side forces and bending moments resolved into
vertical and horizontal components by hand calculation.
The magnetic pickup used to sense the position of the single-tooth
gear was located in the upward vertical position. The single-tooth gear
%.,s so mounted on the shaft that it was in line with the midchord of the
reference blade root section. Therefore, the single-tooth signal tndi-
cated when the reference blade was in the O-deg, upward vertical position,
i.e., the reference position for the sinusoidal variations in the six
components of the propeller unsteady forces is the upward vertical.
The digital analysis was performed by using an Interdata minicomputer
to average the signals over an entire run and to multiply the averaged
signals by a 6x6 calibration matrix to obtain values of thrust, torque,
side forces, and bending moments in pounds and pound-feet. The computer
then resolved the rotating side force and bending moment vectors into
vertical and horizonal components and harmonically analyzed the signal
to provide the steady and higher harmonic amplitudes and the phase angles
relative to the propeller position at vhich the iRngle-tooth pulse was
generated.
J1

RESULTS
As already shown in Figure 2. the results of open-water experiments
indicated that the pitch for some of the propellers was not precisely cor-
rect because the open-water curves were not equally spaced with respect to aline perpendicular to the slope. The observed differences were attributed
to allowable commercial tolerances during the commercial manufacturing
process. It is felt that such deviations among the propellers in the series
did not 3ignificantly alter the trends observed in the water-tunnel experi-
mpnts, as indicated by the fluctuation forces and moments presented next.
Figures 11-18 give the unsteady loading data for the series of propellers
selected to investigate the effect of pitch on propeller-produced unsteady
loading. Figures It and 12 respectively show the nondimensionalized un-
steady thrust and torque for the three-cycle wake experiments. The trends
indicated that the unsteady thrust and torque increase with increasing
advance coefficient. This increase is mainly due to the increase in the
circumferential velocity variation which is proportional to the mean
velocity. Figures 13 and 14 present the corresponding phase angles for
the unsteady thrust and torque. The phase angles given in the figures are
defined as follows. Let $, be the phase angle given by
F- IFI sin (no + #F)
where F represents any of the six components of the unsteady loading and
*F is the phase angte of the blade-rate harmonic of the propeller loading.
The phase angles correspondivg to the orientation of the screen in
the tunnel are defincd by Equation (1) and have already been given. The
phase angles of the blade-rate component of thrust and torque are measured
with respect to the upward vertical in the propeller disk and the reference
line of the propeller blade. Similarly, the phase angles for the four-cycle
wake and the side forces and bending moments are related to the upward
vertical.
Figure 15 indicates the I.rizontal and vertical bearing forces for the
eight propellers, Figure 16 shows the horizontal and vertical bending
12

!I
moments, and Figures 17 and 18 re3pectiveiy present the corresponding phMe
angles for the bearing forces and bending moments. These angles are
defined in the same manner as described previnusly, keeping in mind that
z + I is used as the order of harmonic instead of blade-rate (z - number
of blades).
DISCUSSION
a As pointed out in the introduction, the main purpose of this tvesti-
gation was to determine the effect of pitch on the fluctuating forces and
moments produced by a propeller while operating in a spatially nonuniform
wake field. Since the problem of determining the effects of changes in
propeller geometry on the propeller vibratory forces concerns designers *f
marine propellers, a correlation of the experinental data is presented in
terms of propeller design concepts. First, however, the present results are
compared with the measured data of Boswell and Miller.1
The one Boswell-Miller case which permits comparison is their experi-
ment with Propeller 4118 (P/D - 1.077; A E/A - 0.6). The nondluensionalized
unsteady thrust and torque (nondimensionalized by using the steady design
thrust and torque, respectively) for this model at a design advance coef-
ficient JA equal to 0.83 were 0.45 and 0.36, respectively. The steady
design thrust coefficient 1T was 0.15. The corresponding results for Pro-
peller 4591 (P/D - 1.08; AE/A - 0.54) for XT - 0.15 were approximately
0.48 and 0.37 for the nondinensional thrust and torque, respectively. The
corresponding advance coefficient for this case was J - 0.77, and the average
torque coefficient, 10 K Q, was equal to 0.29. Since the comparison indi-
cates that the unsteady thrust and torque coefficients for the two pro-
pellers were nearly the same, it is concluded that the selection of com-
mercially available propellers was indeed adequate for this investigation.
From the standpoint of designers of marine propellers, let us naw
examine the present experimental data for trends in the amplitude of theiA
various unsteady forces and moments for a rangi of typical ship propulsion
conditions.
13

A marine screw propeller is usually desiGned for a particular ship. The
basic data which characterizes the ship are the wake survey in the pro-
peller plane and the resistance of the hull, including an estimate of the
interaction coefficients (thrust deduction and wake fraction). The
resistance data, thrust deduction, and wake fraction can be represented as
a thrust lopding coe-ficient which usually varies only slightly with ship
speed. For a given speed or operating point, the thrust loading coefficient
ri8 KT 8 /T(3)c TThi 2m 0V 2
J P VA D
is a constant. Equation (3) y. ds a quadratic relationship between KT and
J which can be plotted on a graph along with the propeller open-water charac-
teristics. The intersection gives the operating point. This concept of the.
ship operating point was used to evaluate the effect of changing pitch on the
design of a propeller in terms of the unsteady propeller forces produced
when the propeller operates in a wake.
The four values of thrust loading coefficient considered were selected
to cover the range of typical ship operating conditions, namely, 0.51, 1.02,
1.53, and 2.04. These yield v /J2 values equal to 0.2, 0.4, 0.6, and 0.8,'T
respectively. In addition to showing the open-water characteristics of the
propellers evaluated in this investigation, Figure 2 contains plots of the
four constant-thrust coefficients, or ship operating characteristic curves.
For a given CTh, the intersections with propeller characteristics indicateI
a change in J versus pitch. Since CTh is usually given at a particular speed,
the change in J with pitch indicates the change in shaft speed. Obviously,
the higher the pitch, the lower the shaft speed and, conseq ently, the higher
the 1. From the 1 for a given C and a particular propeller (and, in thisTh
case, a particular pitch) the corresponding unsteady forces can be read from
Figures 11-18. These data and those for steady thrust and torque were used
to develop Figures 19-27. Figure 19 illustrates the effects of the changes
14

in pitch on propeller performance, and the other curves d eOnstrate the
effect of pitch on the six components or the unsteady propeller forces.
It appears, somewhat intuitively, from the velocity diagram in
Figure 28 that as the pitch is increased, the unsteady thrust should
decrease while the unsteady torque should increase with increasing pitch.
Figures 19-23 confirm this intuition. Note that as the pitch increases
KT , K-, and J increase. These changes result in changes in propellerefficiency, as illustrated in Figure 19 for KT/J equal to 0.2 and 0.6.
Therefore, tradeoffs with efficiency r-3 potential improvement in alter-
nating thrust by way of increasing pitch must be evaluated in a design
problem. Fortunately, in the case of pitch variation, the higher effi-
ciencies were obtained with the higher pitched propel.rs for the low
values of the steady thrust loading coefficient. Moreover, the effect of
pitch on the alternating forces was not as large for the higher valuen
of the steady thrust loading coefficient and, consequently, the higher
efficiency designs at the lower pitch ratios constitute the proper design
selections.
Figures 22 and 23 present the unsteady torque results. The coeffi-
cient used in Figure 22 (Kn/J2) was selected both because it did not con-
tain the shaft speed and because it was the coefficient considered by1
3oswell and Miller. The data in Figure 22 show that for a given ship
speed or thrust loading coefficient (KT/J2), the unsteady torque increased
with pitch ratio. This result contradicts the Boswell-Miller analytical
predictions which were computed by using an eprly version of the SIT2
program. However, the result is consistent with what was indicated by
tho simple study of the velocity diagram given above. Figure 23 shows that
the ratio of the unsteady torque divided by the steadl torque tended to
decrease slightly with increasing pitch-diameter ratio at a constant thrust
coefficient.
The alternating side forces did not show significant changes with
pitch, as illustrated in Figures 24 and 25. The bending moments decreased
with increasing pitch, as shown in Figures 26 and 27.
15

7 74- 77 '7' 7
These data indicate that in general, the higher the pitch in a given
design problem, the greater the improvement that can be realized in alter-
nating propeller thrust. However, such decreases are not significant from
the design viewpoint because as far as efficiency is concerned the optimum
design will yield a near-optimum pitch with respect to alternating force
production. Moreover, changes in the unsteady forces contributed by skew
and/or warp distributions are much more significant than the changes dis-
cussed herein.14 ,6
SIUtARY AND CONCLUSIONS
The six components of unsteady loading were measured experimentally for
a series of three-bladed stock propellers that d.ffered only in pitch. The
unsteady forces and moments were produced by operating the propellers behind
three- and four-cycle wake screens. The results lead to the following
conclusions:
1. The unsteady thrust decreased with increasing pitch at a constant
thrust loading coefficient.
2. The unsteady torque as described by the coefficient K Q/J in-
creased with increase in pitch at a constant thrust loading coefficient.
However, the ratio of unsteady-to-steady torque tended to decrease slightly
with increasing pitch-diameter ratio at a constant thrust loading
coefficient.
3. The side forces nondimensionalized by the steady thrust did not
vary significantly for the various pitch ratios at a constant thrust
loading coefficient.
4. The bending moments decreased with increasing pitch at a constant
thrust loading coefficient.
5. In general, the results indicate that the higher the pitch in a
given design problem, the greater the decrease in alternating propeller
thrust that can be realized. However, it is not a practicable alternative
to adjust P/D ratio as a means of decreasing alternating thrust for three
reasons:
I16

(a) as far as wfliic icueueo~1i ein ill yield near-
optimum pitch rat-iosi jith regard to alternating thrust production; (b) the
unsteady torque increases ith pith; and (c) other changes in geometry,
e.g., skev and/or wrp, have been found to result in such greater changes
in the alternating forces produced by propellers than were measured in
this investigation.
17

-~ r.~.. ~ r~% #~ ~ !C~< ~ .~irr
I
I-J
Sr
IT
%Lit
4
I,Figure I-Typical Shape of the Propeller Series
(Illustrated by Propeller 4592, PID 1.25)
LI 18

f-I
0
0
c; t!
o2
0 Lmw
9.44
m>
4E-
U,4 44.4
w .4
C- a
JJc
19

I III I I1.6 OPEN-WATER CHARACTERISTICS
PROPELLERS P/D
JI 0.531.4 4 0.75
[rq 4590 0.924691 1.08
45692 1.251.2 4693 1.42
4594 1.584695 1.75
1.0
o 0.8 ?
0.6
0.4
0.2 0
01
0 0.2 0.4 0.6 0.8 1.0 1.2 1.4 1.6 1.8
ADVANCE COEFFICIENT J
Figure 2b - Torque Coefficient 10 K
20k II.

14
-t
0v)
(30
14
A2

Ipm -.
o _ _ _ _ _ _ 0oe N
I0 Od0
*~ 0~I'I -aI I -a4I Il 4
0 0 i0 C:re5 ;A 0
01 0
d z 0 Z .
I cq
C4 N 0O 0 0
o _ _ _ _ _ _ _ 0
a C!
*ccl l c
II 001
.1
z z0w 0
coo 'o
IN :j6000 0 0
0 0 0im ,4AI13 A NV3W~ 3wnifOA/3INOWiIIVH 4u 31 DNV 3SVHdr:JO03(iflfldNV
22

ITHRUST TORQUE
BENDING MOMENT I BENDING MOMENT 2
SIEFRE1SD OC
Fiue7 TpclSgal nTreCceWk
~~23

- - -V ~Al -N- -~~~
-,THRUST TORQUE
BENDING MOMENT 1 BENDING MOMENT 2
SIDE FORCE 1 SIDE FORCE 2
Figure 8 -Typical Signals in Four-Cycle Wake4
24 4
I--,
Figure 9 -Forces and Moments Acting on Propeller
SIXTY ONETOOTH TOOTHGEAfl GEAR
TAC6OMETER SLIPRINGS AMPLIFIERS
GENEATORROTATING SHAFT
MAGNETICPICKUPSPOE
ANFIGE10-Dt so th Istuetio
BALAN2E

P/D SMltl PID WSLGAII04 0 I- C
0.02 I I0 I ,
.4 0 0 0.8 0.4 .4i 0.8o
0.12 I I i I I I I I I I
P/D - 1.25 P/D - 1.01
0.10
Kj-
0.06
0.6 0.06 1.0 0.6 0.6 1.0 1.2
0.12 I I I II I I I I4594 4595P/D - 1.56
PID - 1.7.
OLO
K - 0.10 1"T _
0.06
0.06 - I I I I I I I I I I I I
o 06 0. 0 1. 0 0. 8 1.0 1.2
J
Figure 01 Unsteady Thrust
26

ll--
Wag emdam-
II- /
l~
l lI I l I I
N - II IP . i.
S -
1
all1 -
I M PIP
00 01 i 01 10 012
Figure 12 - Unsteady Torque
27

i I I I I I 1 I I I
~~PID = 0.58= .7300P/D O-WPID -0.75
I I I1 I .L . IW J W L W I0.2 0.4 0.6 02 0.4 0.6 0.8
i ' I I I I4590 4591
300 =PD 0.92 P/D 1.0P
200! I IW L J I , I I i
0,2 0.4 0.6 0.8 0.4 0.6 0.8 1.0J
4592 4593300 P/D =1.25 P/D = 1.42
200 -
I I . I I I .. I I t
0.4 0.6 0.8 1.0 0.6 0.8 1.0 1.2
4594 4595300 - P/D = 1.58 P/D 1.75
.I . .I .. L.I. I I ! I j I0.6 0.8 1.0 0.8 1.0 1.2
Figure 13 - Unsteady Thrust Phase Angles
28

I I I I I I I i I I I4588 4589
300 - P/D =0.58 P/D 6 0.75
. 06 __ _ ___i i
200 w
- I I I I I L ,0.2 0.4 0.6 0.2 0.4 0.6 0.8
J
4590 4591
300 - P/D = 0.92 P/D = 1.08
200--
0.2 0.4 0.6 0.8 0.4 0.6 0.8 1.0
4592 4593
300 - P/D = 1.25 P/D = 1.42
200p-
0.4 0.6 0.8 1.0 0.6 0.8 1.0 1.2J
. 1i I I I I I ~ T i I It I4594 4595
300 PID = 1.58 P/D = 1.75
200
S!I I I I I I I I I I I I
0.6 0.8 1.0 0.8 1.0 1.2
Figure 14 - Unsteady Torque Phase Angles
29
3I- I
2 O.uA . _____
0.2 0.4 0. 0.2 4 0.6 0.3
4 P/D - 0.92 P/D 1.01
4'4
3
20.2 0.4 0.6 0.A 04 0.6 0.8 1.0
J
I I I I I I I I I I I I4592 4593
P/D91025 P/0!91.42 -
0Fy4
3
2
S I I I I I I I I04 06 08 10 06 08 1.0 1.2
+ 1111 II III4594 4595
- P/DO 1 .58 P/D - 1.75
:iJii6
44
3
0.6 08 1.0 1.2 08 1.0 1.2 14
;* ' +.,-
Figure 15- Horizontal and Vertical Bearing Forces .1
30

456
P/ -0.56 P/D - 0.75
3 -,.v
2
1111 /11111
0.2 0.4 0.6 0.2 0.4 0.6 01
4590 4591P/D - 0.92 P/D - 1.06
4
t3
2
0.2 0.4 0.6 0.8 0.4 0.6 0.8 1.0
4 I I I II I I I I4592 4593
P/D - 1.25 P/D ' 1.42
3
MV
11 i1 I1 I I I I I I I I0.4 0.6 0.8 1.0 06 0.8 1.0 1.2
4 4594 I I I I4594 459S
P/D - 1.58 P/D 1 75
2
11 08 1101 1. 0.8 1.0 1.2 1.4
Figure 16 - Horizontal and Vertical Bending Morments
, 3 1

300 - I I I i I ! I I4588 4589
P/D = 0.58 P/D = 0.75
~OFV
O FH
-OFHm_ IiIilOO II' - -IrI I
100 0.2 0.4 0.6 0.2 0.4 0.6 0.8
J
4590 4591P/D = 0.92 P/D = 1.08
OFV 200 , , ,,OtFH 20 -
0.2 0.4 0.6 0.8 0.4 0.6 0.8 1.0
300 I '4592' I I ' 4593' I IP/D = 1.25 P/D = 1.42
OFH 200
,ooI iIi I I I I I I0.4 0.6 0.8 1.0 0.6 0.8 1.0 1.2
i300 - '45 94' I I 4I ' 595 ' I IP/D = 1.58 P/D 1.75
,FV
200
100- 11111I I II II I0.6 0.8 1.0 1.2 0.8 1.0 1.2 1.4
Figure 17 - Horizontal and Vertical Bearing Force Phase Angles
32

2004588 4589j P/D = 0.58 P/D =0.75
OMH 100 MU.
Om
00.2 0.4 0.6 0.2 0.4 0.6 0.8J
200 1 4590 4591
P/D = 0.92 P/D = 1.08
OMH
10
0.2 0.4 0.6 0.8 0.4 0.6 0.8 1.0
'4592 I
P/D = 1.25 * * *
CMH 100OMV P/D = 1.42
0 I i iS. I I I I I I0.4 0.6 0.8 1.0 0.6 0.8 1.0 1.2
J
200 i I 1 I 1 1 1 1114594 4595
-P/D= 1.58 P/= 1.75
I, OMH 100~MV
0 I I I I II I I I I I1 0
"
0.6 0.8 0.1 1.2 0.8 1.0 1.2 1.4J
* Figure 18 - Horizontal and Vertical Bending Moment Phase Angles
33

Figure 19- Changes in Efficiency, Shaft Speed, Blade Frequency,Thrust, and Torque with Change in 2itch-to-Diameter Ratio
for Constant Thrust Coefficient
P /D = 1.13.0 II .CONSTANT V AND D ASSUMED
1.0 10
1.0.
.0 .5 0x 0
0.00
.00.0.1.1.20
cc34

P1/D =1.1
3.0 I I.1 15
CONSTANT V AND D ASSUMED
LU >w 2.0 1.0a
z U.
-jW usw w
01.0 - 0.5 0a . ,.
w cc
n/n 1
0.0 1 0.0
1.0
T/T1
-0.5
z 0
a
0.0 0.4 0.8 1.2 1.6 2.0
PITCH-TO-DIAMETER RATIO
Figure 19b -For Ch= 1.53
35

mJ
04*
Nf
Coc I "I ' 4r-- :z co.'
1, M
I~I N
o E-
0 *
adi
N IA
~~~36 -,:

NN
o 0o
Nv N
*0
44
1-
0 Cl)
0.4
U 0)LCl
LD0c;
37N

Ci
Z-2-
I--,
Cdq
r14
Il 0 9
Cd 0-A,
000
z 4J o
38-

N0
CIO
I- cc
~ 04E-4
I- 40
4. -H
044
Co "
44
00
C4
C5 0)
14
- 0
.439

00
00L
Z 0
u V0I4 - H
I U
I 0*I- 4-4
CC
to
7c;
400

N-r
4,-
0
'Coo
444'
0 (0
414

I-
Ima
0 ~ I
fl 0
II 0
K I 0
N N
0
41
m 04
42.

C4
ic- -t
00
N 00
-H
0
00
441
'4
N/ w
43-

{.V~ Opr)(r
op W
* $ 44

TABLE 1 - GEOMETRIC CHARACTERISTICS* OF STOCK PROPELLERS 4588, 4589, 4590,
4591, 4592, 4593, 4594, AND 4595(Data are the Average Heasureamdnts for the Eight Michigan M-P Series)
Diameter (D) mm 305
Number of Blades Z 3
Expanded Area Ratio A E/A0 0.54
Blade Thickness Fraction BTF 0.36
Hub Diameter Ratio (cylindrical hub) 0.2
Rake 0
Skew 0
P/D = 0.58, 0.75, 0.92, 1.OR, 1.25, 1.42, 1.58, 1.75
r/R c/D*
0.2 0.272
0.3 0.317
0.4 0.365
0.5 0.406
0.6 0.437
0.7 0.434
0.8 0.403
0.9 0.325
1.0 0.0
j*The data is an average of measurements of the
eight propellers.
45
C!4 O* 0: i C
o 00 . N N n4 o o N " q ' NNooooooooooooo M 44 ........ .. ..N ..
2 2
Nn IM m m w V% m m N -n N N N Nn N
o 3 o ooooooooooooooooo
.
k
0 -3
n m- olN - o n%
O M4 _. 4 4'.mr-. -4 a NM m0 04 0 14 4 -4 r.. v4 lo Mn '00 m w% m 0 0 0N N N4 MN Hq H 4 N4 N N4 N4 N
!0
1-4
5r
2 46
.4 c.4 NO 'I 'D fj N. 44 H N H, H of '0 'I 'D HO en 0% M D 'D0 co. M _4" " 0 0 0 0 0 00 0 a* 4 00 N 000000000000
o 0 0oooooooooooa ooaooooo> 8 ;8686
NM Hn W MN MM N MM M H N N N HD(7 N NHI
0; 00 4O 40 mo nm
'0-
In 0 OH 0 0 0 0 0 0 0 000 C4 m 00 N 0 0 0 0 0 0 0 0 0 0 00m o I c I
2 2
H ~ ~ ~ ~ ~ ~ ~ l N M .3 o1 '0 o. o o%0 . 3 14 0 H N M . f 0 7. 0 0 4 N M -3 1
46

o~~~' m'4 CM N. N M N 0 M'O a4 ~ .t 48 8 8 8M 8 8N m -M N4 8. N .4 8
o aa;c;C
>44
C co
C.) N N 00M N N 8 8 8 NN 88 C N 14 4 N1 8N 8 8 8 N
m ~ e! 9e
E-4
.Ln aOD O4 ON N Sfl 10N' 0 n 4 N % .~ .~ O~2~~88N NN N 4 3N
o0 0
InO OO O OO O .- .O.O.O O O CCO"1 1 m V
an aC-J
C.) 14 a'N MU N4 ' N C N -N NN IeC C4C M OC a NN M4N
ITN-10IN 8880N 8'~O 8 ~ N 8 8 0' 0N O ' N r a'ONN
a 0 0 0 O NN0a' 0 0A aA 0 N O N0-' N' M' N0
* ~ ~~~~~~~ NH M N N N m 4A M
U~A0 O N N O .4M H A I44M I"
~ 47

REFERENCES
1. Bosuell, R.J. and 1.L. Miller, "Unsteady Propeller Loading-
!1easurement, Correlation with Theory, and Parametric Study," NSRDC
Report 2625 (Oct 1968).
2. Tsakonas, S.,et at., "Correlation and Application of an Unsteady
Flow Theory for Propeller Forces," Transactions of the Society of Naval
Architects and Marine Engineers, Vol. 75, np. 158-193 (1967).
3. Tsakonas, S.,et al., "An %xact Linear Lifting-Surface Theory for
a .Marine Propeller in a Nonuniform Flow Field," Stevens Institute of
Technology DL Report 1509 (Feb 1972).
4. Cumming, R.A., et al., "Highly Skewed Propellers," Transactions of
the Society of Naval Architects and Marine Engineers," Vol. 80, pp. 98-135
(1972).
5. Valentine, f.T. and F.J. Dashnaw, "Highly Skewed Propellers for
San Clemente Class Ore/Bulk/Oil Carrier Design Considerations, Model and
Full-Scale Evaluation," Proceedings of the First Ship Technology and
Research (STAR) Symposium, Washington, D.C. (Aug 1975).
6. Nelka, J.J., "Experimental Evaluation of a Series of Skewed Pro-
pellers with Forward Rake: Open-Water Performance, Cavitation Performance,
Field-Point Pressures, and Unsteady Propeller Loading," DTNSRDC Report
4113 (Jul 1974).
7. Miller, M.L., "Experimental Determination of Unsteady Propeller
Forces," Seventh ONR Symposium on Naval Hydromechanics, DR-148, pp. 255-289
(Aug 1968).
Ij2
!! 48
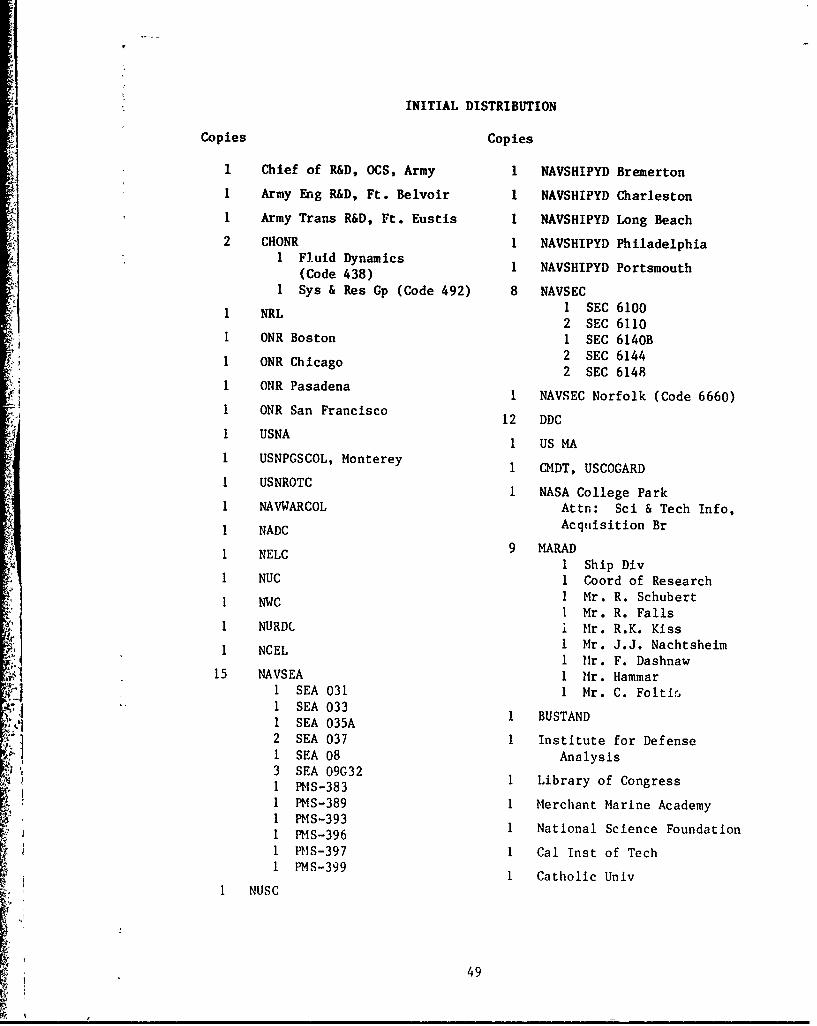
INITIAL DISTRIBUTION
Copies Copies
1 Chief of R&D, OCS, Army 1 NAVSHIPYD Bremerton
1 Army Eng R&D, Ft. Belvoir 1 NAVSHIPYD Charleston1 Army Trans R&D, Ft. Eustis I NAVSHIPYD Long Beach
2 CHONR 1 NAVSHIPYD PhiladelphiaI Fluid Dynamics
(Code 438) 1 NAVSHIPYD Portsmouth
1 Sys & Res Gp (Code 492) 8 NAVSEC1 SEC 6100NRL 2 SEC 6110
I ONR Boston I SEC 6140BI ONR Chicago 2 SEC 6144
2 SEC 61481 ONR Chago2SEC6141 ONR Pasadena 1 NAVSEC Norfolk (Code 6660)
I ONR San Francisco 12 DDC
1 USNA I US A
1 USNPGSCOL, Monterey I CMDT, USCOGARD
1 USNROTC 1 NASA College ParkI NAVWARCOL Attn: Sci & Tech Info,1 NADC Acquisition Br
I NEW MARAD1 Ship Div
1 NUC 1 Coord of Research
I NWC 1 Mr. R. Schubert1 Mr. R. Falls
1 NURDC i Mr. R.K. Kiss1 NCEL 1 Mr. J.J. Nachtsheim
1 Hr. F. Dashnaw15 NAVSEA 1 Mr. Hammar
1 SEA 031 1 Mr. C. Foltir,1 SEA 0331 SEA 035A 1 BUSTAND2 SEA 037 1 Institute for Defense1 SEA 08 Analysis3 SEA 09G321 PMS-383 I Library of Congress
1 PMS-389 I Merchant Marine AcademyI PMS-3931 PMS-396 1 National Science Foundation
1 PMS-397 I Cal Inst of Tech1 PMS-399 I Catholic Univ
I NUSC
49
1*

Copies Copies
I Colorado State Univ 3 Stevens Institute of
Attn: Prof It. Albertson Technology, Davidson Lab1 Dr. J.P. Breslin
I Cornell Univ 1 Dr. S. Tsakonas
1 11arvard Univ I Lib
Attn: Prof . Birkhoff Webb Institute of NavalDept of Mathematics Architecture
2 JHU, Baltimore I Prof E.V. LewI
I Dept of Mechanics 1 Prof C. Ridgely-Nevitt
I Inst of Cooperative 1 Lib
Research 1 Woods Hole Oceanographic
1 Kansas State Univ InstituteAttn: Prof D.A. Nesmith Attn: Reference Room
I Lehigh Univ I Worcester Polytechnic
Attn: 7-itz Lab Lib InstituteAttn: Director
7 HITDept of Ocean Engineering 3 Univ of Calif, Berkeley
I Prof P. Mandel Naval Architecture Dept
1 Prof J.E. Kerwin I Lib
1 Prof P. Leehey 1 Prof J.V. Wehausen
1 Prof M. Abkowitz 1 Prof J.R. Paulling
I Dr. J.N. Newman I Univ of Connecticut
I Prof M. Landahl Attn: Prof V. ScottronI Prof S. Widnall
1 Univ of Illinois, CollegeNew York Univ of Engr
Courant Institute Attn: Dr. J.M. Robertson1 Prof A.S. Peters
1 Prof J.J. Stoker I Univ of Iowa
1 Prof K.O. Frederick Attn: Dr. Hunter Rouse
1 Penn State U, ARL 2 Univ of IowaI Dr. L. Landweber
2 Southwest Research Institute 1 Dr. J. KennedyI Dr. H. Abramson1 Applied Mechanics Review 2 Univ of Michigan
Dept of Naval Architecture2 Stanford Univ & Marine Engr
I Prof M. Van Dyke 1 Dr. T.F. Ogilvie1 Prof H. Ashley I Lib
1 Stanford Research InstituteAttn:Lib I Univ of Minnesota
SAttn: bib St. Anthony Falls
1 State Univ of New York Hydraulic Lab
Maritime College 1 DirectorI Engineering Dept 1 Univ of Notre Dame
Dept of Mech Engr
i 50
Jo

Copies Copies
I Univ of Washington 1 Newport News Shipbldg &Applied Physics Lab DO Co.
Attn: Director Attn: Technical Lib Dept
1 AVCO, Lyconing Div., I Puget Sound Bridge &
Washington Drydock Co., Seattle
1 Baker Mfg, Evansville I George G. Sharp, Inc.
J Bethelehem Steel Corp. 1 Sperry-Gyro Co.
Sparrows Point Yard Attn: Mr. D. Shapiro
Attn: Mr. A. Haff, Tech Mgr (Mail Sta G2)
1 Boeing Aircraft 1 SNAME
AMS Div. Seattle 1 Sun Shipbldg & DD Co.
1 Bolt Beranek & Newan, Inc. 1 Tectra Tech, Inc.
Attn: Dr. N. Brown
I United Aircraft1 Cambridge Acoustcal Hamilton Standard Div.
Associates, Inc.Attn: Mr. M.C. Junger I Rutgers Unliv
1 Esso International Mechanical and Aerospace
Attn: Mr. R.J. Taylor Engineering
Manager, R&D Tanker Dept. Attn: Dr. 1.1. Page
1 General Dynamics,
Electric Boat CENTER DISTRIBUTIONAttn: 1r. V. Boatwright, Jr.
2 Gibbs & Cox, Inc. Copies Code
1 Tech Lib 1 1124
1 Mr. Frank Butler
1 Grumman, Bethpage 1 1500
Attn: Mr. U. Carl 1 1502
2 Hydronautics, Inc. 1 1504
I ITEK Corp, Vidya Div. 1 1505
Palo Alto
1 Lockheed Missiles and Space 1 1506
Sunnyvale 1 1520I Dept 5701,2 1521
1 Martin Co., Baltimore 2 1524
1 McDonnell-DcuglasAircraft Corp. 2 1528
1 Mr. John Hess 1 1532
1 National Steel & 1 1540Shipbldg Co. 1 1542
51

Copies
15 1544
1 1552
1 1560
1 1568
2 1720.611 1850
1 194
1 1962
1 272
1 274
30 5214.1 Reports Distribution
1 5221 Library (C)
1 5222 Library (A)
C 52