copula mixture model for dependency-seeking clustering - arxiv
TRANSCRIPT
Copula Mixture Model for Dependency-seeking Clustering
Melanie Rey [email protected] Roth [email protected]
Department of Mathematics and Computer Science, University of Basel, Basel, Switzerland
Abstract
We introduce a copula mixture model to per-form dependency-seeking clustering when co-occurring samples from different data sourcesare available. The model takes advantageof the great flexibility offered by the copu-las framework to extend mixtures of Canoni-cal Correlation Analysis to multivariate datawith arbitrary continuous marginal densities.We formulate our model as a non-parametricBayesian mixture, while providing efficientMCMC inference. Experiments on syntheticand real data demonstrate that the increasedflexibility of the copula mixture significantlyimproves the clustering and the interpretabil-ity of the results.
1. Introduction
When different types of measurements concerning asame underlying phenomenon are available, often ap-pearing in the form of co-occurring samples, combiningthem is more informative than analysing them sepa-rately. First, if we assume that these different mea-surements, also referred to as the different views, aregenerated by several data sources with independentnoise, analysing them jointly can increase the signalto noise ratio. Second, only a combined analysis cantake into consideration the dependencies existing be-tween the different types of measurements. As pointedout in Klami & Kaski (2007), possible dependenciesbetween the views often contain some of the most rel-evant information about the data. Dependency mod-elling captures what is common between the views, i.e.the shared underlying signal, and in many applicationswhere several experiments are designed to measure thesame object this shared aspect is the focus of interest.
Appearing in Proceedings of the 29 th International Confer-ence on Machine Learning, Edinburgh, Scotland, UK, 2012.Copyright 2012 by the author(s)/owner(s).
The task of detecting dependencies has traditionallybeen solved by Canonical Correlation Analysis (CCA).This method can however detect only global linear de-pendency. When the data express not only one globaldependency but different local dependencies, a mix-ture formulation is more adequate. Fern et al. (2005)introduces a mixture of local CCA model which groupspairs of points expressing together a particular lineardependency between the two views. This model isadapted to cases where the data express several dif-ferent local correlations, but it still focuses exclusivelyon linear dependencies since it assumes that withineach cluster the two views are linearly correlated.
Dependency-seeking clustering goes one step further inthe generalisation process by assuming that the viewsbecome independent when conditioned on the clusterstructure. The aim is to perform clustering in the jointspace of the multiple views, while focussing explicitlyon inter-view dependencies 1. In the case of two views,the objective is then to group the co-occurring pairsof datapoints according to their inter-view dependencypattern such that when the cluster assignments areknown these views become independent. As a conse-quence, the group structure now has a semantic inter-pretation in terms of dependency with the partitioncapturing the dependencies.
The starting point of existing dependency-seekingmethods is the probabilistic interpretation of CCAgiven in Bach & Jordan (2005). In Klami &Kaski (2007) a Dirichlet prior Gaussian mixture fordependency-seeking clustering is introduced. How-ever, as pointed out in Klami et al. (2010), when thedata are not normally distributed, this method cansuffer from a severe model mismatch problem. On ap-plication to non-normally distributed data these mod-els have to increase the number of clusters to achievea reasonable fit. Additional clusters are used to com-
1The term inter-view dependencies refers to the depen-dence structure between the different views, whereas intra-view dependencies refers to the dependence structure be-tween the different dimensions of one view.

Copula Mixture Model for Dependency-seeking Clustering
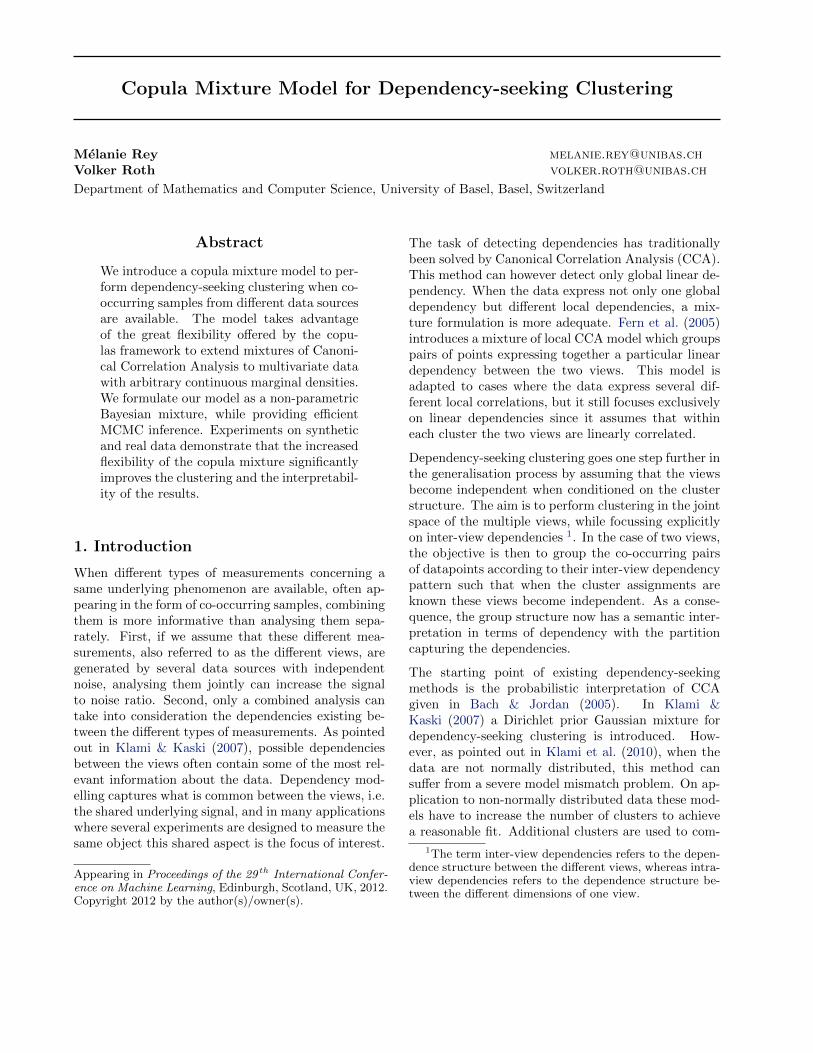
pensate for the inadequate Gaussian assumption. Thecomponents of these mixtures will not only be usedto reflect differences in dependence structures but willalso be used to approximate a non-Gaussian distri-bution. As a result some points expressing a simi-lar inter-view dependence can be assigned to differentgroups and the interpretation of the clusters in termsof dependencies is lost. Moreover, the model needsto find a compromise between the cluster homogene-ity and the approximation of a non-Gaussian mixture,so that non-homogenous clusters might emerge. Fig-ure 1 illustrates how several Gaussian components canbe used to approximate a beta density. An exponen-tial family dependency-seeking method is proposed inKlami et al. (2010) to overcome this problem. Thismodel can however be too restrictive when the viewsare multidimensional. Although the 1-dimensional ex-ponential family covers many interesting distributions,only a few of them have convenient multivariate forms.In particular their dependence structure between di-mensions is often very restrictive. Another restrictionof that model is that all the dimensions in all the viewsmust have the same univariate distribution whereas inpractice different data sources are likely to producedifferently distributed data.
0.0 0.2 0.4 0.6 0.8 1.0
01
23
45
Beta densityGaussian densitiesSum of the Gaussian densities
Figure 1. Gaussian components approximating a beta den-sity.
To overcome these limitations we take advantage ofthe copulas framework to build a dependency-seekingclustering method suitable for data with any type ofcontinuous densities. We use Gaussian copulas to con-struct Dirichlet prior mixtures of multivariate distri-butions with arbitrary continuous margins, the onlyrestriction being that a density must exist. The modelcombines the adaptability of Bayesian non-parametricmixtures with the flexibility of copula-based distribu-tions. Our approach focusses on Gaussian copulas fortwo main reasons. Firstly, their parametrisation using
a correlation matrix covers many different dependencepatterns ranging from independence to comonotonic-ity (perfect dependence). Secondly, the model can bereformulated using multivariate Gaussian latent vari-ables which enables efficient MCMC inference.
2. Dependency-seeking clustering
Consider a p-dimensional random vector (rv) X anda q-dimensional rv Y which constitute two differentsources of information about an object of interest.For example, several corporal measurements of a pa-tient and the levels of different drugs administratedcan serve as two sources of information about a med-ical treatment. We assume that X and Y have co-occurring samples (x1, . . . , xn) and (y1, . . . , yn) withxi ∈ Rp and yi ∈ Rq, i = 1, . . . , n. The probabilisticinterpretation of CCA given by Bach & Jordan (2005)uses the following latent variable formulation:
Z ∼ Nd (0, Id) ,
(X,Y ) |Z ∼ Np+q (WZ + µ,Ψ) ,
where µ = (µx, µy) ∈ Rp+q, W =
(Wx
Wy
)∈ R(p+q)×d,
1 ≤ d ≤ min (p, q) and the covariance matrix Ψ has ablock diagonal form:
Ψ =
(Ψx 00 Ψy
). (1)
They showed that the maximum likelihood estimate ofW is connected to the canonical directions and corre-lations:
Wx = ΣxUxMx, Wy = ΣyUyMy,
where Σx, Σy are the sample covariance matrices, andUx and Uy are the first d canonical directions. Mx
and My are matrices such that MxMTy = Pd where Pd
is the diagonal matrix containing the first d canonicalcorrelations. Based on the above formulation, the fol-lowing dependency-seeking clustering model is derivedin Klami & Kaski (2008) :
Z ∼ Mult (θ) , (2)
(X,Y ) |Z ∼ Np+q (µz,Ψz) , (3)
where Ψz has a block structure as in (1):
Ψz =
(Ψzx 0
0 Ψzy
). (4)
and µz is a mean vector depending on Z. The latentvariable Z now represents the clustering assignment.A key property of this model is the block diagonal

Copula Mixture Model for Dependency-seeking Clustering
structure of the covariance matrix Ψz. This specialform implies that given the cluster assignment the twoviews are independent, thereby enforcing the clusterstructure to capture all the dependencies. This modelhowever explicitly makes a conditional Gaussian as-sumption and can perform badly when data withina cluster are non-normally distributed as mentionedin section 1. To relax this normality assumption, wepresent a dependency-seeking clustering model con-structed using Gaussian copulas which can be appliedto almost any type of continuous data.
3. Copulas and Gaussian copulas
A multivariate distribution is constituted of univariaterandom variables related to each other by a depen-dence mechanism. Copulas provide a framework toseparate the dependence structure from the marginaldistributions. Formally, a d-dimensional copula is amultivariate distribution function C : [0, 1]d → [0, 1]with standard uniform margins. The following theo-rem Sklar (1959) states the relationship between cop-ulas and multivariate distributions.
Theorem 1. (Sklar) Let F be a joint distributionfunction with margins F 1, . . . , F d. Then there existsa copula C : [0, 1]d → [0, 1] such that
F(x1, . . . , xd
)= C
(F 1(x1), . . . , F d
(xd)). (5)
Moreover, if the margins are continuous, then thiscopula is unique. Conversely, if C is a copula andF 1, . . . , F d are univariate distribution functions, thenF defined as in (5) is a multivariate distribution func-tion with margins F 1, . . . , F d.
Gaussian copulas constitute an important class of cop-ulas. If F is a Gaussian distribution Nd (µ,Σ) thenthe corresponding C fulfilling equation (5) is a Gaus-sian copula. Since Gaussian copulas are invariantto strictly increasing transformations, the copula ofNd (µ,Σ) is the same as the copula of Nd (0, P ) asmentioned in McNeil et al. (2005), where P is the cor-relation matrix corresponding to the covariance matrixΣ. Thus a Gaussian copula is uniquely determined bya correlation matrix P and we denote a Gaussian cop-ula by CP . Using theorem 1 with CP , we can constructmultivariate distributions with arbitrary margins anda Gaussian dependence structure. These distributions,called meta-Gaussian distributions, provide a naturalway to extend models based on a multivariate normal-ity assumption.
When using a Gaussian copula we do not attemptto directly model the correlation of the original vari-ables, but instead we first apply the transformation
Φ−1(F j( . )
)to every margin to obtain normally dis-
tributed variables Φ−1(F j(Xj)
)∼ N1 (0, 1) , where Φ
is the standard Gaussian cumulative distribution func-tion, and then use P to describe their correlation. Wefinally note that zero values in P encode independencebetween the corresponding marginal variables. There-fore, if P has a block diagonal structure as in (1), theconditional independence of X|Z and Y |Z, which wasa key property of equation (3), will be preserved in ameta-Gaussian model.
Multivariate distributions constructed using Theorem1 do not necessarily possess a density function. Whena density exist it can be written as:
f(x1, . . . , xd) = c(F 1(x1), . . . , F d(xd)
) d∏j=1
f j(xj),
(6)
where
c(u1, . . . , ud) =∂C(u1, . . . , ud)
∂u1 . . . ∂ud, (7)
is the copula density of C. For cases where c has asimple closed form we can obtain an analytical expres-sion for f using (6). This is true for the multivariatenormal case and equation (6) becomes:
f(x) = |P |− 12 exp
{−1
2xT (P−1 − I)x
} d∏j=1
f j(xj),
(8)where xj = Φ−1
(F j(xj)
), x = (x1, . . . , xd), x =
(x1, . . . , xd). We denote this density by M(θ, P ),where θ is the vector containing all parameters of themarginal distributions.
4. Multi-view clustering withmeta-Gaussian distributions
4.1. Model specification
Consider the two rv X =(X1, . . . , Xp
)and Y =(
Y 1, . . . , Y q). We assume their joint distribution is a
Dirichlet prior mixture (DPM) given by:
f(X,Y )(x, y) =
∫ ∫f(X,Y )|θ,P (x, y)dµθ,PdµG(λ,G0),
where µG is the distribution of a Dirichlet process (Fer-guson, 1973) with base distribution G0 and concentra-tion parameter λ. The novelty here is the choice off(X,Y )|θ,P . We model the marginal distributions andthe dependence structure separately to allow for morefreedom:

Copula Mixture Model for Dependency-seeking Clustering
1. The margins can be arbitrary continuous distribu-tions (providing the corresponding density exists):
Xj |θ = Xj |θjx ∼ FjX|θ, j = 1, . . . , p,
Y j |θ = Y j |θjy ∼ FjY |θ, j = 1, . . . , q,
where θ =(θ1x, . . . , θ
px, θ
1y, . . . , θ
qy
). Note here that
F jX|θ can be different types of distributions for the
multiple dimensions j.
2. The dependence structure is then specified by aGaussian copula CP with correlation matrix Phaving a block diagonal structure as in (1).
3. Finally the constructed multivariate distributionwill have the form:
F(X,Y )|θ,P (x, y) = CP
(F 1X|θ(x1), . . . , F qY |θ (xq)
).
(9)
4.2. Bayesian inference
Separating the modelling task between specification ofthe margins and specification of the dependence struc-ture simplifies the choice of the prior distributions. Ifwe assume a priori independence for θ and P we canspecify prior distributions for the margins and sepa-rately choose a prior for the parameters of the copulaCP . We specify independent prior distributions for the
blocks Px and Py, where P =
(Px 00 Py
). For Px
and Py we choose the marginally uniform prior given inBarnard et al. (2000). This prior is a multivariate dis-tribution on the space of correlation matrices with uni-form margins, i.e. Pij is a uniform variable for i 6= j,and is connected to the inverse-Wishart distribution:if a covariance matrix Ψ ∈ Rd×d is standard inverse-Wishart distributed with parameter Id and d + 1 de-grees of freedom, then the corresponding correlationmatrix R follows the marginally uniform prior distri-bution.
Figure 2. Graphical representation of the infinite copulamixture model with base measure G0 and concentrationλ. Left side: the original model, right side: the model aug-mented for sampling, where C denotes cluster assignment.
Inference can be done using MCMC sampling meth-ods for Dirichlet process mixture models. We use a
sampling scheme for models with non-conjugate priorgiven in Neal (2011). The method, detailed in Al-gorithm 1, is composed of three steps: a modifiedMetropolis-Hastings step, partial Gibbs sampling up-dates and an update of the parameters θ, P. In thethird step we need to update the parameters of everycluster according to their posterior distribution. Sincewe cannot sample directly from this conditional pos-terior we developed a sampling scheme similar to thealgorithm proposed in Hoff (2007). The main idea is tooverparametrize the model by introducing a normallydistributed latent vector (X, Y ). The variables in thecomplete model are then given by:
(X, Y ) ∼ Np+q(0,Σ),
(X,Y ) ∼M(θ, P ),
C ∼ CRP(λ),
where Σ is a covariance matrix with corresponding cor-relation matrix P and C denotes the cluster assign-ments following a Chinese restaurant process distribu-tion. Figure 2 gives a representation of the completemodel. In the MCMC scheme we can easily sampleΣ conditioned on (X,Y ), (X, Y ) and θ, since we canuse the conjugacy property of prior and conditionallikelihood. A sample of the correlation matrix can beotained as P(X), the correlation matrix of the randomvector X. The posterior updates of the parameters aredetailed in Algorithm 2. The notations θ?j ,P(X)?j
are used to emphasize that the corresponding vectoror matrix is considered as a function of θj , Xj and pa-rameters for the other dimensions are treated as con-stants.
5. Experiments
5.1. Simulated data
We simulate two different 2-dimensional multi-viewdata sets with Gaussian intra-view dependence struc-ture. The marginal distributions are Gaussian in thefirst view, and beta or exponential in the second. Eachdata set is composed of two clusters which can be iden-tified only by considering the inter-view dependencies.We first simulated data points with a single clusterstructure in each view but a strong positive depen-dence between the first dimensions of the views, i.e.between X1 and Y 1. In a second step we separatedthe data in two groups of unequal size and randomlypermuted their order within groups to suppress anyinter-view dependency within these groups. Figure 3(bottom left panel) shows the resulting cluster struc-ture in the joint space of the two views recovered bythe copula mixture model. Parameters used for thesimulations can be found in Table 1.

Copula Mixture Model for Dependency-seeking Clustering
Algorithm 1 Markov Chain Sampling
C1, . . . , Cn are the latent variables of the cluster as-signments.θCi and PCi are the parameters for cluster Ci.n−i,c is the number of datapoints in cluster c ex-cluding observation i.C−i = {C1, . . . , Ci−1, Ci+1, . . . , Cn}.repeat
for i = 1, . . . , n doif there exists k such that Ck = Ci then
Create a new cluster C∗i with parameters θ∗
and P ∗ drawn from G0;Change Ci to C∗i with probability
min
(1, λ
n−1f(X,Y )|θ∗,P∗ (x,y)
f(X,Y )|θCi ,PCi (x,y)
);
elseDraw C∗i from C−i with P(C∗i = c) =n−i,c/(n− 1). Change Ci to C∗i with proba-
bility min
(1, n−1λ
f(X,Y )|θ∗,P∗ (x,y)
f(X,Y )|θCi ,PCi (x,y)
);
end ifend forfor i = 1, . . . , n do
if there exists k such that Ck = Ci thenChoose a new value for Ci with P(C∗i = c) ∝n−i,c(n−1)f(X,Y )|θc,P c(x, y);
end ifend forfor c ∈ {C1, . . . , Cn} do
Update the parameters θc and P c as describedin Algorithm 2.
end foruntil stopping criterion
Algorithm 2 Posterior updates of (θ, P ) | (X,Y )
For clarity we omit the cluster index c.
1.Sample θ|Σ, (X, Y ), (X,Y )for j = 1, . . . , p do
Draw θj using Metropolis-Hastings;θj ∼ f(θj |θ−j , X,X) ∝M(θ?j ,P(X))π(θj)
end forApply the same procedure for Y ;
2. Sample (X, Y )|θ,Σ, (X,Y )for j = 1, . . . , p do
Draw Xj using Metropolis-Hastings;Xj ∼ f(Xj |X−j , θ,Σ, X) ∝M(θ,P(X)?j)N (0,Σ)
end forApply the same procedure for Y ;
3. Sample Σ|(X, Y ), θ, (X,Y ):Draw Σx ∼ N (0,Σx)IW(p+ 1, Ip)
∼ IW(Ip +∑ni=1 XiX
Ti , p+ 1 + n);
Apply the same procedure to obtain Σy.
Table 1. Parameters used for the simulations.Simulation 1
view 1: Normal µ (0, 0)σ2 (1, 1)(Px)12 0.9
view 2: Beta α (3, 1)β (1, 10)(Py)12 −0.5
Simulation 2view 1: Normal µ (0, 0)
σ2 (1, 1)(Px)12 0.9
view 2: Exponential λ (2.5, 2.5)(Py)12 0.9
We compared the copula mixture (CM) with threeother methods: a Dirichlet prior Gaussian mixturefor dependency-seeking clustering (GM) as derivedin Klami & Kaski (2007), a non-Bayesian mixtureof canonical correlation models (CCM) (Vrac, 2010)(Fern et al., 2005) and a variational Bayesian mixtureof robust CCA models (RCCA) (Viinikanoja et al.,2010). CCM and RCCA both assume that the numberof clusters is known or can be determined as explainedin (Viinikanoja et al., 2010). In our comparison ex-periments we gave as input for both methods the cor-rect number of clusters, giving them the advantage ofthis extra knowledge. Results presented in Figure 4show that CM applied with the correct marginal dis-tributions’ form produces a better classification. GMdoes not perform well on those data sets because thenumber of clusters is overestimated; the model com-pensates for the inadequate Gaussian assumption bymultiplying the number of components and additionalclusters are created to approximate non-Gaussian dis-tributions. Since the number of clusters in a Dirichletprior Gaussian mixture can be reduced by imposinga too-strong prior on the variances, we modified theprior information to enforce artificially high variancesin the second view until the mixture is forced to createno more than two clusters. We report both results ob-tained with less (GM1) and more (GM2) informativepriors. As can be seen in Figure 3, when strong priorinformation is used to artificially reduce the number ofclusters, the GM cannot recover the true cluster struc-ture. CCM and RCCA used with the correct numberof clusters as input perform comparatively, or betterthan the GM but clearly worse than CM for those datasets having non-linear inter-view dependencies.
5.2. Real data
We perform a combined analysis of two data sets pro-viding information about the regulation of gene ex-pression in yeast under heat shock; each data set be-ing treated as one view. The first data set (pub-lished in Gasch et al. (2000)) provides genes expres-sion values measured at 4 time points. The second

Copula Mixture Model for Dependency-seeking Clustering
CM, view 1
X1
X2
GM1, view 1
X1
X2
GM2, view 1
X1
X2
CM, view 2
Y1
Y2
GM1, view 2
Y1
Y2
GM2, view 2
Y1
Y2
CM, joint space
myd
ata.
c[(N
+ 1
):(2
* N
), 1
]
normal scores for X1
norm
al s
core
s fo
r Y
1
GM1, joint space
myd
ata.
gm[(
N +
1):
(2 *
N),
1]
normal scores for X1
norm
al s
core
s fo
r Y
1
GM2, joint space
myd
ata.
g2[(
N +
1):
(2 *
N),
1]
normal scores for X1
norm
al s
core
s fo
r Y
1
Figure 3. Scatterplot of the simulated data in the Gaussianview (first view, top panel), in the beta view (second view,middle panel) and in the joint space of the normal scores forthe two views where the two clusters can be clearly identi-fied (bottom panel). The clustering results are shown forthe copula mixture (CM) and the Gaussian mixture withtwo different priors (GM1 and GM2). CM perfectly recov-ers the true cluster structure, whereas a model mismatchproblem prevents GM to find the correct clustering.
●●●●
●
●
●●
●●
●
●
●●
●
●●●
●
●
●
●
●
●
0.0
0.2
0.4
0.6
0.8
1.0
Gaussian−Beta data
Adj
uste
d ra
nd in
dex
CM GM1 GM2 CCM RCCA
●0.0
0.2
0.4
0.6
0.8
1.0
Gaussian−Exponential data
Adj
uste
d ra
nd in
dex
CM GM1 GM2 CCM RCCA
Figure 4. Boxplot of the adjusted rand index over 100(Gaussian-beta data on the left panel) and 50 (Gaussian-exponential data on the right panel) simulations for thecopula mixture (CM), the Gaussian mixture with two dif-ferent priors (CM1 and CM2), the non-Bayesian mixtureof CCA (CCM), and the robust CCA mixture (RCCA).Friedman’s test with post-hoc analysis rejected, for bothexperiments, the null hypothesis of equal medians betweenCM and every other method (P-value < 0.005).
data set (given in Harbison et al. (2004)) containsbinding affinity scores for interactions between thesegenes and 6 different binding factors. Similar datahave already been analysed in Klami & Kaski (2007).5360 genes present in both views are clustered using aGaussian dependency-seeking clustering model (GM)and using the copula mixture (CM). CM uses Gaus-sian marginals in the first view and beta marginalsin the second view. Here the choice of the beta dis-tribution is motivated by the fact that observationsin the second view are restricted to the [0, 1] interval.For the univariate Gaussian margins we choose nor-mal and inverse-gamma priors for mean and variancerespectively, whereas for the beta margins both shapeparameters have gamma priors. GM uses the standardconjugate prior 2.
For different values of the concentration parameterλ ∈ {0.01, 0.1, 1, 5, 10}, CM consistently estimates 8clusters whereas GM estimated between 13 and 15clusters. In this section we report the results ob-tained with λ = 1. As we observed with the simulateddata more clusters need to be created by the Gaus-sian mixture to compensate for the model mismatch.This phenomenon is illustrated in Figure 5. The in-terpretation of the clustering then becomes very ar-duous since these additional clusters cannot be distin-guished from those capturing the dependencies. An-other interpretation problem clearly arises in the Gaus-sian model when we look at the estimated intra-viewcorrelations. Two negative effects accumulate here;first correlation can be an inadequate dependence mea-sure for non-normally distributed data, and second theadditional split in many components can change thecluster-specific intra-view dependence as illustrated inFigure 6.
To understand what information one could gain bydependency-clustering, we perform three additionalclustering of the same data: first we cluster the data-points on each view separately, then we cluster themin the complete product space of the joint views, i.e.without imposing the constraint of a block structureon the correlation matrix. Priors and hyperparam-eters are kept constant over experiments. CM findsfour clusters in the first view as well as in the sec-ond view. Clustering in the product space with fullcorrelation matrix again leads to four groups. Fig-ure 7 illustrates how the three main clusters found inthe complete product space are further separated bydependency-seeking clustering, showing dependenciesbetween the two views.
2The use of conjugate prior does not, in general, in-crease the number of clusters as shown in Rasmussen &Gorur (2010).

Copula Mixture Model for Dependency-seeking Clustering
CM, view 2, GAT1
Y
Den
sity
0.0 0.2 0.4 0.6 0.8 1.0
0.0
0.2
0.4
0.6
0.8
1.0
1.2
1.4
CM, view 2, YAP1
Y
Den
sity
0.0 0.2 0.4 0.6 0.8 1.0
0.0
0.2
0.4
0.6
0.8
1.0
1.2
GM, view 2, GAT1
Y
Den
sity
0.0 0.2 0.4 0.6 0.8 1.0
0.0
0.2
0.4
0.6
0.8
1.0
1.2
1.4
GM, view 2, YAP1
Y
Den
sity
0.0 0.2 0.4 0.6 0.8 1.0
0.0
0.2
0.4
0.6
0.8
1.0
1.2
Figure 5. Histogram of the binding affinity scores for thebinding factors GAT1 and YAP1. The estimated densitiesof the 8 clusters discovered by CM are represented as col-ored lines in the top panel. Estimated densities of the 14clusters found by GM are shown in the bottom panel. Theblack dashed lines represent the total density resulting ofthe mixture.
2 4 6 8 10 14
−1.
0−
0.5
0.0
0.5
1.0
Gaussian mixture
Cluster index
HS
F1
Cor
rela
tion
YAP1SKN7ADR1MSN2GAT1
1 2 3 4 5 6 7 8
−1.
0−
0.5
0.0
0.5
1.0
Copula mixture
Cluster index
HS
F1
Cor
rela
tion
of n
orm
al s
core
s
Figure 6. Correlations estimated with GM (left panel) andcorrelations of the normal scores estimated by CM (rightpanel) between HSF1 and the five other binding factors.In the Gaussian model the correlation between HSF1 andYAP1 seems to vary drastically with the clusters. In CMthis correlation has stable positive values for all clusterswith the exception of the last cluster. Since the binding fac-tors HSF1 and YAP1 are both activated by the substancemenadione as explained in Hohmann & Mager (2003), wecan expect that their binding affinities are positively cor-related and independent of the cluster.
Figure 7. The bottom panel represents in different colorsthe cluster indices for all genes (reordered by cluster as-signment) as obtained using dependency-seeking clusteringwith CM. The top panel shows the cluster indices obtainedwhen clustering in the complete product space, i.e usingCM with a full correlation matrix instead of a restrictedblock diagonal matrix. This illustrates how existing groupsare further separated into smaller clusters expressing inter-view dependencies.
As mentioned in section 1, GM cannot exclusively fo-cus on compact clusters because it needs to find acompromise between the cluster homogeneity and theapproximation of a non-Gaussian mixture. As a re-sult, non-homogenous clusters might emerge which areneeded to fit the margins despite model mismatch. Totest if this phenomenon is present here, we perform agene ontology enrichment analysis (GOEA) using GO-rilla (Eden et al., 2009). GOEA is used to test if someof the biological processes associated with the genesare over-represented in the clusters, thereby provid-ing a quality measure for the clustering. The analysisshows that 3 out of 14 clusters (these 3 clusters rep-resenting together 17,3% of the data points) found byGM do not express any significant enrichment. By con-trast, all 8 clusters produced by CM express a highlysignificant enrichment and every cluster can be associ-ated with a specific biological processes, e.g. the twolargest clusters can be interpreted as groups of genesinvolved in organelle organization and meiosis respec-tively. The clear difference in the enrichment analysisresults between GM and CM demonstrates that thequality of the clustering is indeed impaired when amodel with inadequate margins is used.
6. Conclusion
A fundamental aspect in dependency-seeking cluster-ing is that the partition possesses a semantic interpre-tation in terms of dependency: the dependencies are

Copula Mixture Model for Dependency-seeking Clustering
captured by the cluster structure. This interpretationis however only valid when the model is rich enough toproperly fit each view, which can be particularly dif-ficult to achieve for non-Gaussian data with existingmodels. This task becomes even more arduous whenthe dimensions of the views increase since the modelthen needs to adequately fit every margin while allow-ing for a sufficiently rich intra-view dependence struc-ture. The copula mixture model offers enough flexibil-ity to cover both aspects: the margins can be specifiedseparately for each dimension and the Gaussian copulaallows for a wide range of intra-view dependencies. Us-ing a Gaussian copula also facilitates the inference andwe provide an efficient MCMC scheme. Experimentson simulated data show that the copula mixture modelsignificantly improves the clustering results. In a large-scale real-world clustering problem of genes expres-sion data and genes binding affinities, the dependency-seeking copula mixture model produces a clusteringsolution that significantly differs from those obtainedon the single views or on the product space, and fromthat obtained by the standard Gaussian model whichclearly suffered from model-mismatch problems. De-tailed analysis of the functional annotation of the genesin the clusters discovered by dependency-seeking CMshows that the induced cluster structure allows a plau-sible biological interpretation in that the groups areclearly enriched by genes involved in distinct biologi-cal processes.
References
Bach, F.R. and Jordan, M.I. A probabilistic interpre-tation of canonical correlation analysis. Technicalreport 688, Department of Statistics, University ofCalifornia, Berkeley, 2005.
Barnard, J., McCulloch, R., and Meng, X. Modelingcovariance matrices in terms of standard deviationsand correlations, with application to shrinkage. Sta-tistica Sinica, 10:1281–1311, 2000.
Eden, E., Navon, R., Steinfeld, I., Lipson, D., andYakhini, Z. GOrilla: a tool for discovery and visu-alization of enriched go terms in ranked gene lists.BMC Bioinformatics, 2009.
Ferguson, T. A Bayesian analysis of some nonpara-metric problems. Annals of Statistics, 1(2):209–230,1973.
Fern, X.Z., Brodley, C.E., and Friedl, M.A. Correla-tion clustering for learning mixture of canonical cor-relation models. Accepted for SIAM InternationalConference on Data Mining, 2005.
Gasch, A.P., Spellman, P.T., and C.M. Kao, et al. Ge-nomic expression programs in the response of yeastcells to environmental changes. Molecular Biologyof the Cell, 11:4241–4257, 2000.
Harbison, C.T., Gordon, D.B., and T.I. Lee, et al.Transcriptional regulatory code of a eukaryoticgenome. Nature, 431:99–104, 2004.
Hoff, Peter D. Extending the rank likelihood for semi-parametric copula estimation. Annals of AppliedStatistics, 1(1):273, 2007.
Hohmann, S. and Mager, W. H. Yeast Stress Re-sponses. Topics in Current Genetics, Vol. 1.Springer, 2003.
Klami, A. and Kaski, S. Local dependent components.Proceedings of the 24th International Conference onMachine Learning, 2007.
Klami, A. and Kaski, S. Probabilistic approach todetecting dependencies between data sets. Neuro-computing, (72):39–46, 2008.
Klami, A., Virtanen, S., and Kaski, S. Bayesian expo-nential family projections for coupled data sources.Uncertainty in Artificial Intelligence, 2010.
McNeil, A. J., Frey, R., and Embrechts, P. Quantita-tive Risk Management. Princeton Series in Finance.Princeton University Press, 2005.
Neal, R.M. Markov chain sampling methods forDirichlet process mixture models. Technical re-port 9815, Department of Statistics, University ofToronto, 2011.
Rasmussen, C. E. and Gorur, D. Dirichlet processGaussian mixture models: Choice of the base distri-bution. Journal of Computer Science and Technol-ogy, 25(4):615–626, 2010.
Sklar, A. Fonctions de repartition a n dimensions etleurs marges. Publications de l’Institut de Statistiquede l’Universite de Paris, 8:229–231, 1959.
Viinikanoja, J., Klami, A., and Kaski, S. VariationalBayesian mixture of robust CCA models. Principlesof Data Mining and Knowledge Discovery, pp. 370–385, 2010.
Vrac, Mathieu. CCMtools: Clustering through ”Cor-relation Clustering Model” (CCM) and cluster anal-ysis tools., 2010. URL http://CRAN.R-project.
org/package=CCMtools. R package version 1.0.