copper(ii) complexes of bis(amino amide) ligands: effect of changes in the amino acid residue
TRANSCRIPT
DaltonTransactions
Dynamic Article Links
Cite this: Dalton Trans., 2012, 41, 6764
www.rsc.org/dalton PAPER
Copper(II) complexes of bis(amino amide) ligands: effect of changes in theamino acid residue†
Inés Martí, Armando Ferrer,‡ Jorge Escorihuela, M. Isabel Burguete and Santiago V. Luis*
Received 20th December 2011, Accepted 23rd March 2012DOI: 10.1039/c2dt12459a
A family of ligands derived from bis(amino amides) containing aliphatic spacers has been prepared, andtheir protonation and stability constants for the formation of Cu2+ complexes have been determinedpotentiometrically. Important differences are associated to both the length of the aliphatic spacer and thenature of the side chains derived from the amino acid. In general, ligands containing aliphatic side chainsdisplay higher basicities as well as stability constants with Cu2+. In the same way, basicities and stabilityconstants tend to increase when decreasing the steric hindrance caused by the corresponding side-chain.FT-IR, UV-vis and ESI-MS were used for analyzing the complex species detected in the speciationdiagram. UV-vis studies showed the presence of different coordination environments for the copper(II)complexes. Complexes with different stoichiometries can be formed in some instances. This was clearlyhighlighted with the help of ESI-MS experiments.
Introduction
The coordination of metal cations with tetradentate ligandscontaining four nitrogen electron donors is common to manycoenzymes and catalytic models.1 Metalloenzymes usually containmetal ions bound to an amino group of a specific amino acidresidue of a peptide or directly to the amide group – carbonyl ornitrogen – offering different coordination environments.2 Thus, aproper design of small molecules with suitable structural andfunctional characteristics could be important for future catalytic,biomimetic and recognition studies. In this regard, the designand synthesis of ligands functionalized to achieve metal com-plexation in a biomimetic approach is a challenge of currentinterest.3 The inclusion of amino acid residues in the structure isone of the most obvious strategies to provide coordinationenvironments of the metal ions similar to those found in metallo-proteins.4 On the other hand, the presence of chirality derivedfrom the amino acid subunits allows the potential application ofthose derivatives in enantioselective catalysis to be considered.5
In this context, C2 symmetric bis(amino amide) ligandsappear as promising ligands for several reasons: (i) they can be
easily prepared by standard and simple synthetic protocols; (ii)they contain two kinds of nitrogen atoms, with different coordi-nation capabilities, connected through a chiral backbone; (iii)their properties can be easily tuned by the selection of the appro-priate R-carbon substituents (R, Chart 1) and the spacer and (iv)they can form robust metal complexes with transition metals. Bis(amino amides) have been used as building blocks for the con-struction of macrocyclic structures whose macrocyclization pro-cesses have been based on the preorganization induced byconformational elements,6 configurational factors,7 or throughthe use of anionic templates.8 Some of those systems are able todisplay interesting features, behaving as organogelators,9 actingas ‘in vivo’ fluorescent pH probes,10 as selective receptors forsubstrates of biological relevance,11 as minimalistic molecularmachines,12 as ligands for the preparation of enantioselective cat-alysts or as chiral solvating agents.13 On the other hand, the self-assembly of this kind of compound in the solid state has alsoallowed the observation of some remarkable crystalline structuresand nano-assembled morphologies with relevance for the
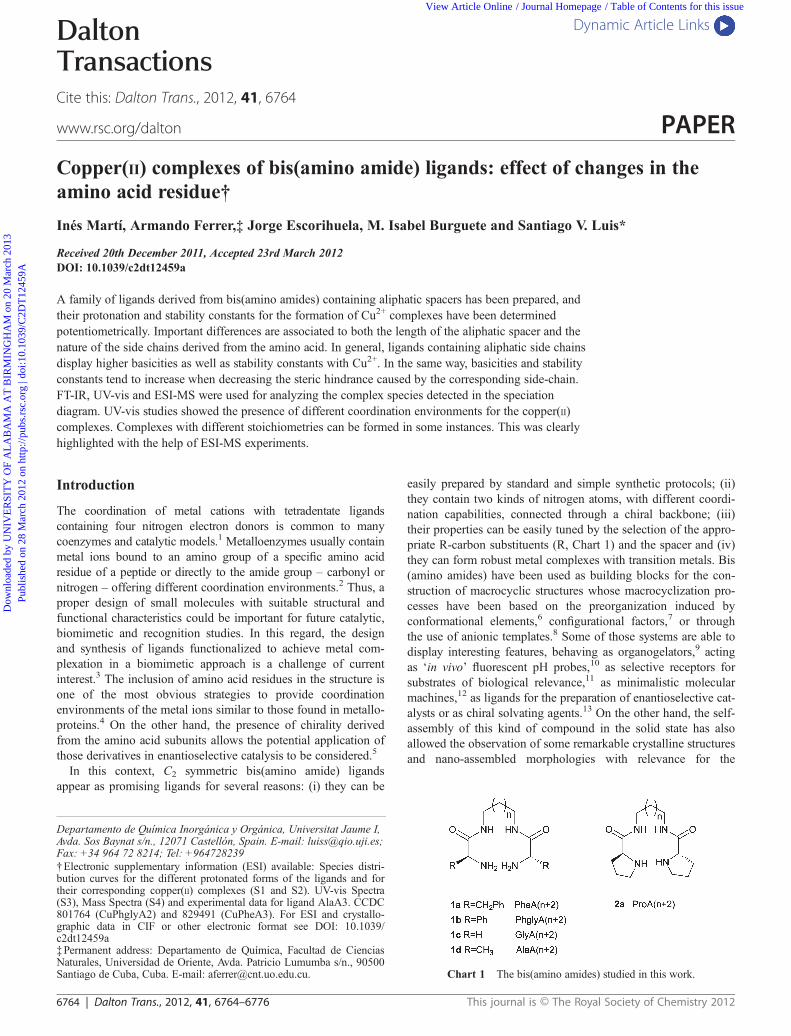
Chart 1 The bis(amino amides) studied in this work.
†Electronic supplementary information (ESI) available: Species distri-bution curves for the different protonated forms of the ligands and fortheir corresponding copper(II) complexes (S1 and S2). UV-vis Spectra(S3), Mass Spectra (S4) and experimental data for ligand AlaA3. CCDC801764 (CuPhglyA2) and 829491 (CuPheA3). For ESI and crystallo-graphic data in CIF or other electronic format see DOI: 10.1039/c2dt12459a‡Permanent address: Departamento de Química, Facultad de CienciasNaturales, Universidad de Oriente, Avda. Patricio Lumumba s/n., 90500Santiago de Cuba, Cuba. E-mail: [email protected].
Departamento de Química Inorgánica y Orgánica, Universitat Jaume I,Avda. Sos Baynat s/n., 12071 Castellón, Spain. E-mail: [email protected];Fax: +34 964 72 8214; Tel: +964728239
6764 | Dalton Trans., 2012, 41, 6764–6776 This journal is © The Royal Society of Chemistry 2012
Dow
nloa
ded
by U
NIV
ER
SIT
Y O
F A
LA
BA
MA
AT
BIR
MIN
GH
AM
on
20 M
arch
201
3Pu
blis
hed
on 2
8 M
arch
201
2 on
http
://pu
bs.r
sc.o
rg |
doi:1
0.10
39/C
2DT
1245
9AView Article Online / Journal Homepage / Table of Contents for this issue
understanding of structural parameters in proteins and relatedpeptidic systems.14
Recently, we have studied the coordination ability of some C2
symmetrical bis(amino amides) derived from valine towardsCu(II) and Zn(II) ions.15 Here, we present the study of the acid–base properties of some related bis(amino amide) ligands derivedfrom other amino acids, as well as the analysis of their bindingability towards a cation playing a key role in bioinorganic chem-istry such as Cu2+. The main structural variation considered,besides the length of the spacer, has been the selection ofthe starting amino acids, in order to analyze the effect of thechanges in the side chain on the coordination capabilities ofthe corresponding bis(amino amides). Thus, compounds derivedfrom glycine, alanine, proline, phenylalanine and the non-naturalphenylglicine amino acids have been studied.
Results and discussion
The general structure of the ligands considered is displayed inChart 1. Open-chain bis(amino amides) derived from aminoacids can be easily prepared starting from the correspondingN-Cbz protected amino acid through the initial formation of theiractivated N-hydroxysuccinimide esters, coupling with a varietyof diamines and final N-deprotection, following previouslyreported procedures.6b
For the naming of the compounds in Chart 1, the acronymaaAN has been used for the sake of simplicity. In it, aa refers tothe constituent amino acid (i.e. PheAN for phenylalanine deriva-tives), while AN indicates the length of the aliphatic centralspacer, with N = (n + 2) (i.e.: PheA6 for a phenyl alanine deriva-tive with a central spacer having six methylene groups).
Acid–base properties
The study of the acid–base properties of the ligands is essentialfor a proper understanding of the coordination ability of nitroge-nated compounds.4 Initially, bis(amino amide) ligands derivedfrom phenylalanine with spacers from 2 to 6 carbon atoms wereselected to study their acid–base properties by the use of pH-metric titrations.16 This allowed the effect of the length of themethylenic spacer between the two amino amide subunits to beinvestigated. All the titrations were carried out as has been fullydescribed in the experimental section, at 298.1 ± 0.1 K using0.1 M NaCl to maintain a constant ionic strength. The stepwisebasicity constants for the protonation of ligands derived fromphenylalanine obtained in this way are presented in Table 1.
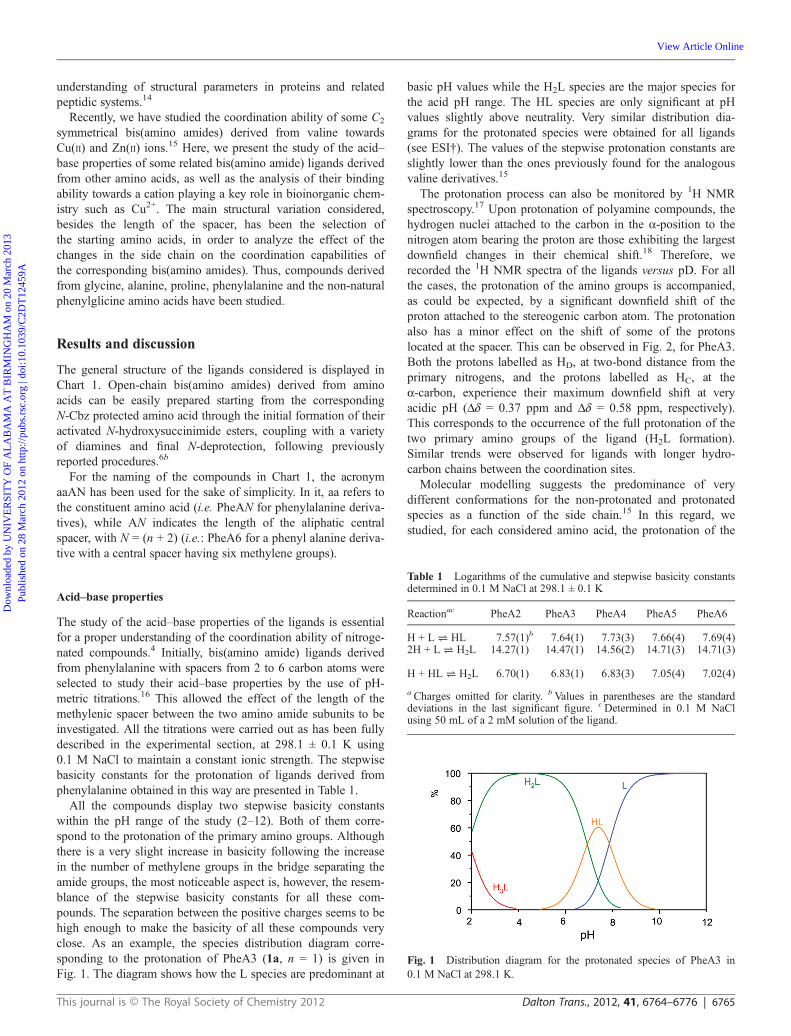
All the compounds display two stepwise basicity constantswithin the pH range of the study (2–12). Both of them corre-spond to the protonation of the primary amino groups. Althoughthere is a very slight increase in basicity following the increasein the number of methylene groups in the bridge separating theamide groups, the most noticeable aspect is, however, the resem-blance of the stepwise basicity constants for all these com-pounds. The separation between the positive charges seems to behigh enough to make the basicity of all these compounds veryclose. As an example, the species distribution diagram corre-sponding to the protonation of PheA3 (1a, n = 1) is given inFig. 1. The diagram shows how the L species are predominant at
basic pH values while the H2L species are the major species forthe acid pH range. The HL species are only significant at pHvalues slightly above neutrality. Very similar distribution dia-grams for the protonated species were obtained for all ligands(see ESI†). The values of the stepwise protonation constants areslightly lower than the ones previously found for the analogousvaline derivatives.15
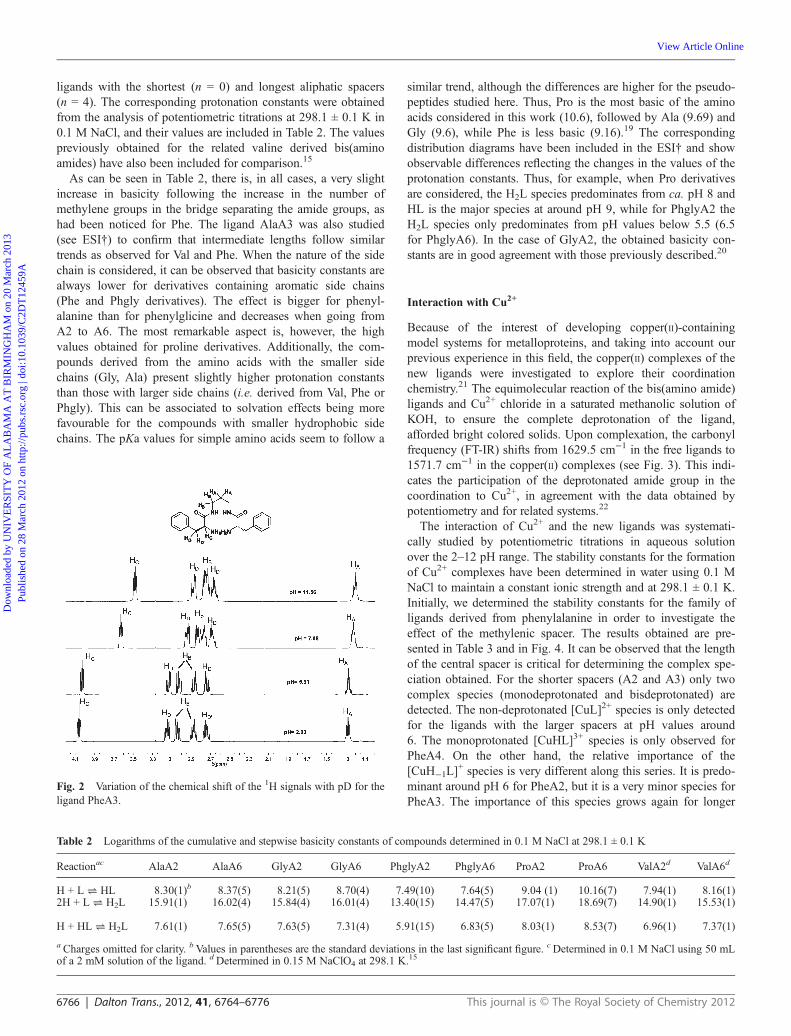
The protonation process can also be monitored by 1H NMRspectroscopy.17 Upon protonation of polyamine compounds, thehydrogen nuclei attached to the carbon in the α-position to thenitrogen atom bearing the proton are those exhibiting the largestdownfield changes in their chemical shift.18 Therefore, werecorded the 1H NMR spectra of the ligands versus pD. For allthe cases, the protonation of the amino groups is accompanied,as could be expected, by a significant downfield shift of theproton attached to the stereogenic carbon atom. The protonationalso has a minor effect on the shift of some of the protonslocated at the spacer. This can be observed in Fig. 2, for PheA3.Both the protons labelled as HD, at two-bond distance from theprimary nitrogens, and the protons labelled as HC, at theα-carbon, experience their maximum downfield shift at veryacidic pH (Δδ = 0.37 ppm and Δδ = 0.58 ppm, respectively).This corresponds to the occurrence of the full protonation of thetwo primary amino groups of the ligand (H2L formation).Similar trends were observed for ligands with longer hydro-carbon chains between the coordination sites.
Molecular modelling suggests the predominance of verydifferent conformations for the non-protonated and protonatedspecies as a function of the side chain.15 In this regard, westudied, for each considered amino acid, the protonation of the
Table 1 Logarithms of the cumulative and stepwise basicity constantsdetermined in 0.1 M NaCl at 298.1 ± 0.1 K
Reactionac PheA2 PheA3 PheA4 PheA5 PheA6
H + L ⇌ HL 7.57(1)b 7.64(1) 7.73(3) 7.66(4) 7.69(4)2H + L ⇌ H2L 14.27(1) 14.47(1) 14.56(2) 14.71(3) 14.71(3)
H + HL ⇌ H2L 6.70(1) 6.83(1) 6.83(3) 7.05(4) 7.02(4)
aCharges omitted for clarity. bValues in parentheses are the standarddeviations in the last significant figure. cDetermined in 0.1 M NaClusing 50 mL of a 2 mM solution of the ligand.
Fig. 1 Distribution diagram for the protonated species of PheA3 in0.1 M NaCl at 298.1 K.
This journal is © The Royal Society of Chemistry 2012 Dalton Trans., 2012, 41, 6764–6776 | 6765
Dow
nloa
ded
by U
NIV
ER
SIT
Y O
F A
LA
BA
MA
AT
BIR
MIN
GH
AM
on
20 M
arch
201
3Pu
blis
hed
on 2
8 M
arch
201
2 on
http
://pu
bs.r
sc.o
rg |
doi:1
0.10
39/C
2DT
1245
9A
View Article Online
ligands with the shortest (n = 0) and longest aliphatic spacers(n = 4). The corresponding protonation constants were obtainedfrom the analysis of potentiometric titrations at 298.1 ± 0.1 K in0.1 M NaCl, and their values are included in Table 2. The valuespreviously obtained for the related valine derived bis(aminoamides) have also been included for comparison.15
As can be seen in Table 2, there is, in all cases, a very slightincrease in basicity following the increase in the number ofmethylene groups in the bridge separating the amide groups, ashad been noticed for Phe. The ligand AlaA3 was also studied(see ESI†) to confirm that intermediate lengths follow similartrends as observed for Val and Phe. When the nature of the sidechain is considered, it can be observed that basicity constants arealways lower for derivatives containing aromatic side chains(Phe and Phgly derivatives). The effect is bigger for phenyl-alanine than for phenylglicine and decreases when going fromA2 to A6. The most remarkable aspect is, however, the highvalues obtained for proline derivatives. Additionally, the com-pounds derived from the amino acids with the smaller sidechains (Gly, Ala) present slightly higher protonation constantsthan those with larger side chains (i.e. derived from Val, Phe orPhgly). This can be associated to solvation effects being morefavourable for the compounds with smaller hydrophobic sidechains. The pKa values for simple amino acids seem to follow a
similar trend, although the differences are higher for the pseudo-peptides studied here. Thus, Pro is the most basic of the aminoacids considered in this work (10.6), followed by Ala (9.69) andGly (9.6), while Phe is less basic (9.16).19 The correspondingdistribution diagrams have been included in the ESI† and showobservable differences reflecting the changes in the values of theprotonation constants. Thus, for example, when Pro derivativesare considered, the H2L species predominates from ca. pH 8 andHL is the major species at around pH 9, while for PhglyA2 theH2L species only predominates from pH values below 5.5 (6.5for PhglyA6). In the case of GlyA2, the obtained basicity con-stants are in good agreement with those previously described.20
Interaction with Cu2+
Because of the interest of developing copper(II)-containingmodel systems for metalloproteins, and taking into account ourprevious experience in this field, the copper(II) complexes of thenew ligands were investigated to explore their coordinationchemistry.21 The equimolecular reaction of the bis(amino amide)ligands and Cu2+ chloride in a saturated methanolic solution ofKOH, to ensure the complete deprotonation of the ligand,afforded bright colored solids. Upon complexation, the carbonylfrequency (FT-IR) shifts from 1629.5 cm−1 in the free ligands to1571.7 cm−1 in the copper(II) complexes (see Fig. 3). This indi-cates the participation of the deprotonated amide group in thecoordination to Cu2+, in agreement with the data obtained bypotentiometry and for related systems.22
The interaction of Cu2+ and the new ligands was systemati-cally studied by potentiometric titrations in aqueous solutionover the 2–12 pH range. The stability constants for the formationof Cu2+ complexes have been determined in water using 0.1 MNaCl to maintain a constant ionic strength and at 298.1 ± 0.1 K.Initially, we determined the stability constants for the family ofligands derived from phenylalanine in order to investigate theeffect of the methylenic spacer. The results obtained are pre-sented in Table 3 and in Fig. 4. It can be observed that the lengthof the central spacer is critical for determining the complex spe-ciation obtained. For the shorter spacers (A2 and A3) only twocomplex species (monodeprotonated and bisdeprotonated) aredetected. The non-deprotonated [CuL]2+ species is only detectedfor the ligands with the larger spacers at pH values around6. The monoprotonated [CuHL]3+ species is only observed forPheA4. On the other hand, the relative importance of the[CuH−1L]
+ species is very different along this series. It is predo-minant around pH 6 for PheA2, but it is a very minor species forPheA3. The importance of this species grows again for longer
Table 2 Logarithms of the cumulative and stepwise basicity constants of compounds determined in 0.1 M NaCl at 298.1 ± 0.1 K
Reactionac AlaA2 AlaA6 GlyA2 GlyA6 PhglyA2 PhglyA6 ProA2 ProA6 ValA2d ValA6d
H + L ⇌ HL 8.30(1)b 8.37(5) 8.21(5) 8.70(4) 7.49(10) 7.64(5) 9.04 (1) 10.16(7) 7.94(1) 8.16(1)2H + L ⇌ H2L 15.91(1) 16.02(4) 15.84(4) 16.01(4) 13.40(15) 14.47(5) 17.07(1) 18.69(7) 14.90(1) 15.53(1)
H + HL ⇌ H2L 7.61(1) 7.65(5) 7.63(5) 7.31(4) 5.91(15) 6.83(5) 8.03(1) 8.53(7) 6.96(1) 7.37(1)
aCharges omitted for clarity. bValues in parentheses are the standard deviations in the last significant figure. cDetermined in 0.1 M NaCl using 50 mLof a 2 mM solution of the ligand. dDetermined in 0.15 M NaClO4 at 298.1 K.15
Fig. 2 Variation of the chemical shift of the 1H signals with pD for theligand PheA3.
6766 | Dalton Trans., 2012, 41, 6764–6776 This journal is © The Royal Society of Chemistry 2012
Dow
nloa
ded
by U
NIV
ER
SIT
Y O
F A
LA
BA
MA
AT
BIR
MIN
GH
AM
on
20 M
arch
201
3Pu
blis
hed
on 2
8 M
arch
201
2 on
http
://pu
bs.r
sc.o
rg |
doi:1
0.10
39/C
2DT
1245
9A
View Article Online
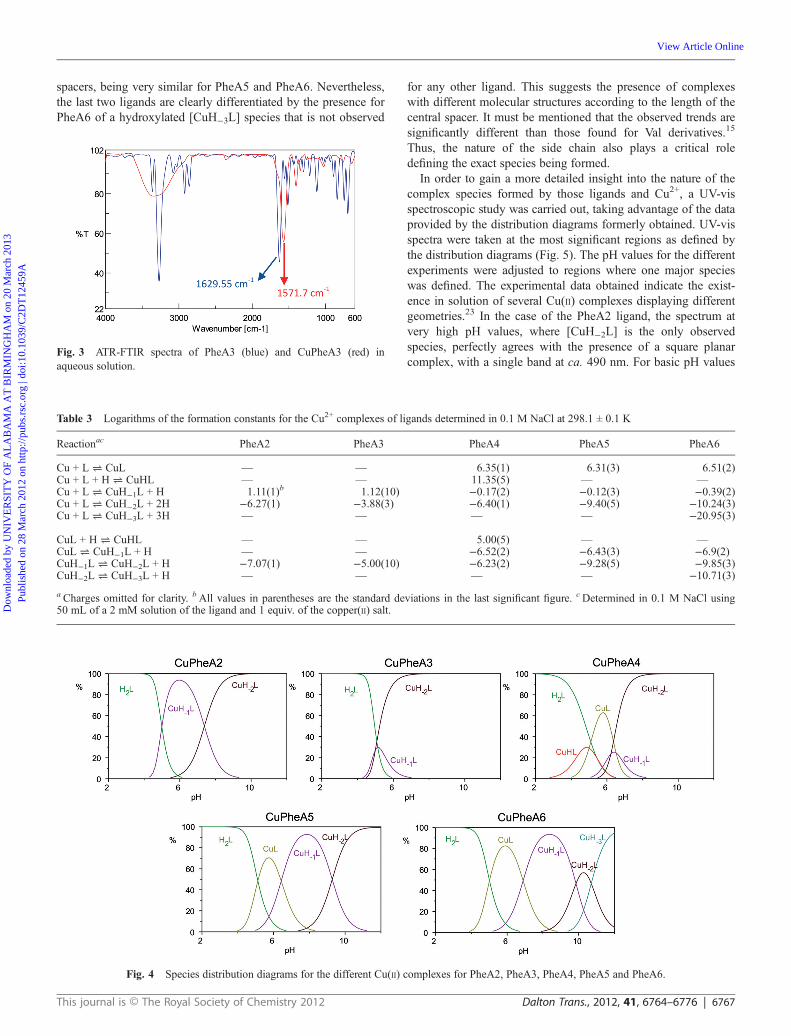
spacers, being very similar for PheA5 and PheA6. Nevertheless,the last two ligands are clearly differentiated by the presence forPheA6 of a hydroxylated [CuH−3L] species that is not observed
for any other ligand. This suggests the presence of complexeswith different molecular structures according to the length of thecentral spacer. It must be mentioned that the observed trends aresignificantly different than those found for Val derivatives.15
Thus, the nature of the side chain also plays a critical roledefining the exact species being formed.
In order to gain a more detailed insight into the nature of thecomplex species formed by those ligands and Cu2+, a UV-visspectroscopic study was carried out, taking advantage of the dataprovided by the distribution diagrams formerly obtained. UV-visspectra were taken at the most significant regions as defined bythe distribution diagrams (Fig. 5). The pH values for the differentexperiments were adjusted to regions where one major specieswas defined. The experimental data obtained indicate the exist-ence in solution of several Cu(II) complexes displaying differentgeometries.23 In the case of the PheA2 ligand, the spectrum atvery high pH values, where [CuH−2L] is the only observedspecies, perfectly agrees with the presence of a square planarcomplex, with a single band at ca. 490 nm. For basic pH values
Fig. 3 ATR-FTIR spectra of PheA3 (blue) and CuPheA3 (red) inaqueous solution.
Fig. 4 Species distribution diagrams for the different Cu(II) complexes for PheA2, PheA3, PheA4, PheA5 and PheA6.
Table 3 Logarithms of the formation constants for the Cu2+ complexes of ligands determined in 0.1 M NaCl at 298.1 ± 0.1 K
Reactionac PheA2 PheA3 PheA4 PheA5 PheA6
Cu + L ⇌ CuL — — 6.35(1) 6.31(3) 6.51(2)Cu + L + H ⇌ CuHL — — 11.35(5) — —Cu + L ⇌ CuH−1L + H 1.11(1)b 1.12(10) −0.17(2) −0.12(3) −0.39(2)Cu + L ⇌ CuH−2L + 2H −6.27(1) −3.88(3) −6.40(1) −9.40(5) −10.24(3)Cu + L ⇌ CuH−3L + 3H — — — — −20.95(3)
CuL + H ⇌ CuHL — — 5.00(5) — —CuL ⇌ CuH−1L + H — — −6.52(2) −6.43(3) −6.9(2)CuH−1L ⇌ CuH−2L + H −7.07(1) −5.00(10) −6.23(2) −9.28(5) −9.85(3)CuH−2L ⇌ CuH−3L + H — — — — −10.71(3)aCharges omitted for clarity. bAll values in parentheses are the standard deviations in the last significant figure. cDetermined in 0.1 M NaCl using50 mL of a 2 mM solution of the ligand and 1 equiv. of the copper(II) salt.
This journal is © The Royal Society of Chemistry 2012 Dalton Trans., 2012, 41, 6764–6776 | 6767
Dow
nloa
ded
by U
NIV
ER
SIT
Y O
F A
LA
BA
MA
AT
BIR
MIN
GH
AM
on
20 M
arch
201
3Pu
blis
hed
on 2
8 M
arch
201
2 on
http
://pu
bs.r
sc.o
rg |
doi:1
0.10
39/C
2DT
1245
9A
View Article Online
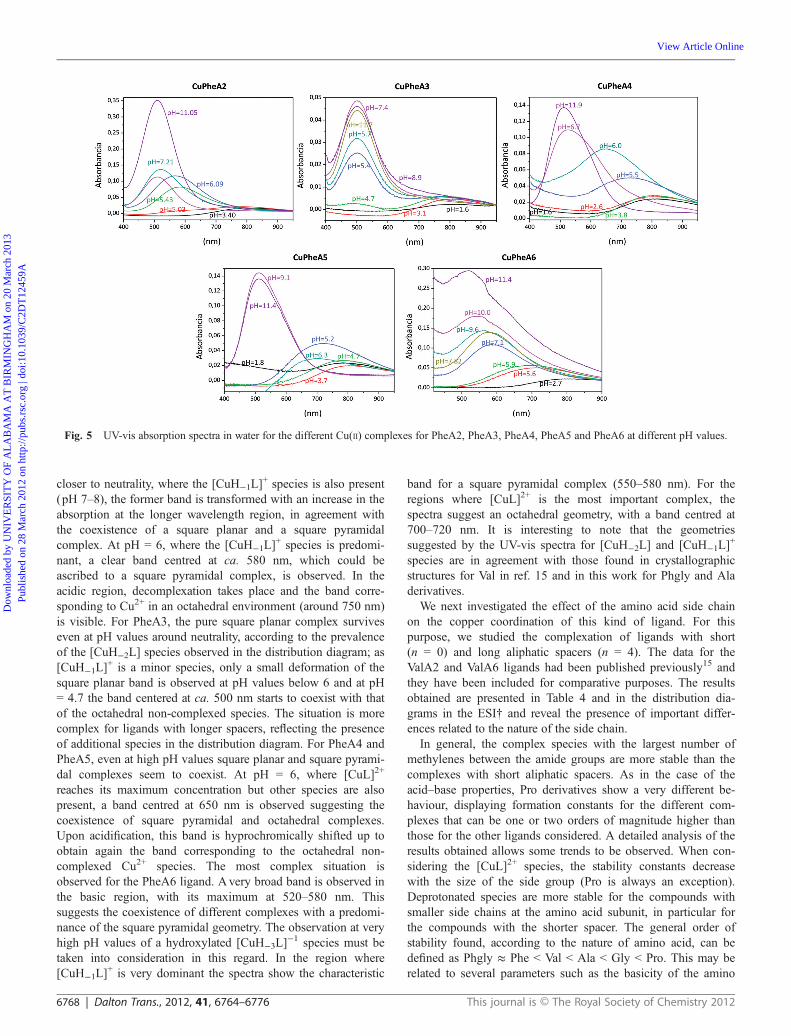
closer to neutrality, where the [CuH−1L]+ species is also present
(pH 7–8), the former band is transformed with an increase in theabsorption at the longer wavelength region, in agreement withthe coexistence of a square planar and a square pyramidalcomplex. At pH = 6, where the [CuH−1L]
+ species is predomi-nant, a clear band centred at ca. 580 nm, which could beascribed to a square pyramidal complex, is observed. In theacidic region, decomplexation takes place and the band corre-sponding to Cu2+ in an octahedral environment (around 750 nm)is visible. For PheA3, the pure square planar complex surviveseven at pH values around neutrality, according to the prevalenceof the [CuH−2L] species observed in the distribution diagram; as[CuH−1L]
+ is a minor species, only a small deformation of thesquare planar band is observed at pH values below 6 and at pH= 4.7 the band centered at ca. 500 nm starts to coexist with thatof the octahedral non-complexed species. The situation is morecomplex for ligands with longer spacers, reflecting the presenceof additional species in the distribution diagram. For PheA4 andPheA5, even at high pH values square planar and square pyrami-dal complexes seem to coexist. At pH = 6, where [CuL]2+
reaches its maximum concentration but other species are alsopresent, a band centred at 650 nm is observed suggesting thecoexistence of square pyramidal and octahedral complexes.Upon acidification, this band is hyprochromically shifted up toobtain again the band corresponding to the octahedral non-complexed Cu2+ species. The most complex situation isobserved for the PheA6 ligand. Avery broad band is observed inthe basic region, with its maximum at 520–580 nm. Thissuggests the coexistence of different complexes with a predomi-nance of the square pyramidal geometry. The observation at veryhigh pH values of a hydroxylated [CuH−3L]
−1 species must betaken into consideration in this regard. In the region where[CuH−1L]
+ is very dominant the spectra show the characteristic
band for a square pyramidal complex (550–580 nm). For theregions where [CuL]2+ is the most important complex, thespectra suggest an octahedral geometry, with a band centred at700–720 nm. It is interesting to note that the geometriessuggested by the UV-vis spectra for [CuH−2L] and [CuH−1L]
+
species are in agreement with those found in crystallographicstructures for Val in ref. 15 and in this work for Phgly and Aladerivatives.
We next investigated the effect of the amino acid side chainon the copper coordination of this kind of ligand. For thispurpose, we studied the complexation of ligands with short(n = 0) and long aliphatic spacers (n = 4). The data for theValA2 and ValA6 ligands had been published previously15 andthey have been included for comparative purposes. The resultsobtained are presented in Table 4 and in the distribution dia-grams in the ESI† and reveal the presence of important differ-ences related to the nature of the side chain.
In general, the complex species with the largest number ofmethylenes between the amide groups are more stable than thecomplexes with short aliphatic spacers. As in the case of theacid–base properties, Pro derivatives show a very different be-haviour, displaying formation constants for the different com-plexes that can be one or two orders of magnitude higher thanthose for the other ligands considered. A detailed analysis of theresults obtained allows some trends to be observed. When con-sidering the [CuL]2+ species, the stability constants decreasewith the size of the side group (Pro is always an exception).Deprotonated species are more stable for the compounds withsmaller side chains at the amino acid subunit, in particular forthe compounds with the shorter spacer. The general order ofstability found, according to the nature of amino acid, can bedefined as Phgly ≈ Phe < Val < Ala < Gly < Pro. This may berelated to several parameters such as the basicity of the amino
Fig. 5 UV-vis absorption spectra in water for the different Cu(II) complexes for PheA2, PheA3, PheA4, PheA5 and PheA6 at different pH values.
6768 | Dalton Trans., 2012, 41, 6764–6776 This journal is © The Royal Society of Chemistry 2012
Dow
nloa
ded
by U
NIV
ER
SIT
Y O
F A
LA
BA
MA
AT
BIR
MIN
GH
AM
on
20 M
arch
201
3Pu
blis
hed
on 2
8 M
arch
201
2 on
http
://pu
bs.r
sc.o
rg |
doi:1
0.10
39/C
2DT
1245
9A
View Article Online
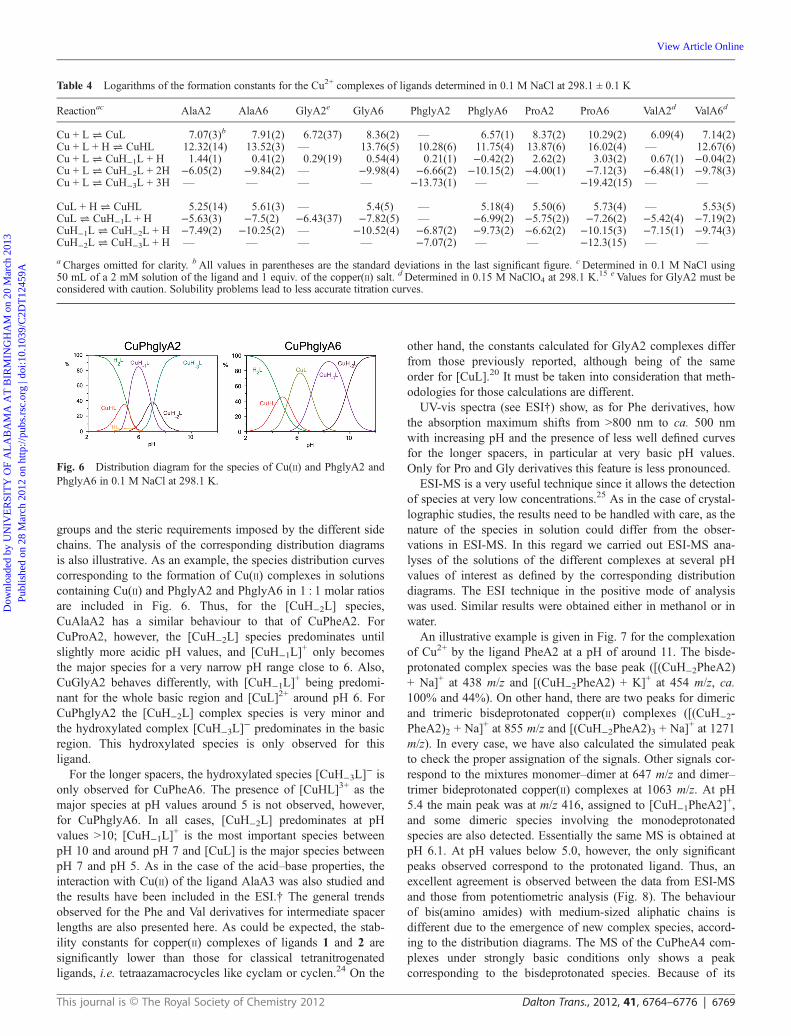
groups and the steric requirements imposed by the different sidechains. The analysis of the corresponding distribution diagramsis also illustrative. As an example, the species distribution curvescorresponding to the formation of Cu(II) complexes in solutionscontaining Cu(II) and PhglyA2 and PhglyA6 in 1 : 1 molar ratiosare included in Fig. 6. Thus, for the [CuH−2L] species,CuAlaA2 has a similar behaviour to that of CuPheA2. ForCuProA2, however, the [CuH−2L] species predominates untilslightly more acidic pH values, and [CuH−1L]
+ only becomesthe major species for a very narrow pH range close to 6. Also,CuGlyA2 behaves differently, with [CuH−1L]
+ being predomi-nant for the whole basic region and [CuL]2+ around pH 6. ForCuPhglyA2 the [CuH−2L] complex species is very minor andthe hydroxylated complex [CuH−3L]
− predominates in the basicregion. This hydroxylated species is only observed for thisligand.
For the longer spacers, the hydroxylated species [CuH−3L]− is
only observed for CuPheA6. The presence of [CuHL]3+ as themajor species at pH values around 5 is not observed, however,for CuPhglyA6. In all cases, [CuH−2L] predominates at pHvalues >10; [CuH−1L]
+ is the most important species betweenpH 10 and around pH 7 and [CuL] is the major species betweenpH 7 and pH 5. As in the case of the acid–base properties, theinteraction with Cu(II) of the ligand AlaA3 was also studied andthe results have been included in the ESI.† The general trendsobserved for the Phe and Val derivatives for intermediate spacerlengths are also presented here. As could be expected, the stab-ility constants for copper(II) complexes of ligands 1 and 2 aresignificantly lower than those for classical tetranitrogenatedligands, i.e. tetraazamacrocycles like cyclam or cyclen.24 On the
other hand, the constants calculated for GlyA2 complexes differfrom those previously reported, although being of the sameorder for [CuL].20 It must be taken into consideration that meth-odologies for those calculations are different.
UV-vis spectra (see ESI†) show, as for Phe derivatives, howthe absorption maximum shifts from >800 nm to ca. 500 nmwith increasing pH and the presence of less well defined curvesfor the longer spacers, in particular at very basic pH values.Only for Pro and Gly derivatives this feature is less pronounced.
ESI-MS is a very useful technique since it allows the detectionof species at very low concentrations.25 As in the case of crystal-lographic studies, the results need to be handled with care, as thenature of the species in solution could differ from the obser-vations in ESI-MS. In this regard we carried out ESI-MS ana-lyses of the solutions of the different complexes at several pHvalues of interest as defined by the corresponding distributiondiagrams. The ESI technique in the positive mode of analysiswas used. Similar results were obtained either in methanol or inwater.
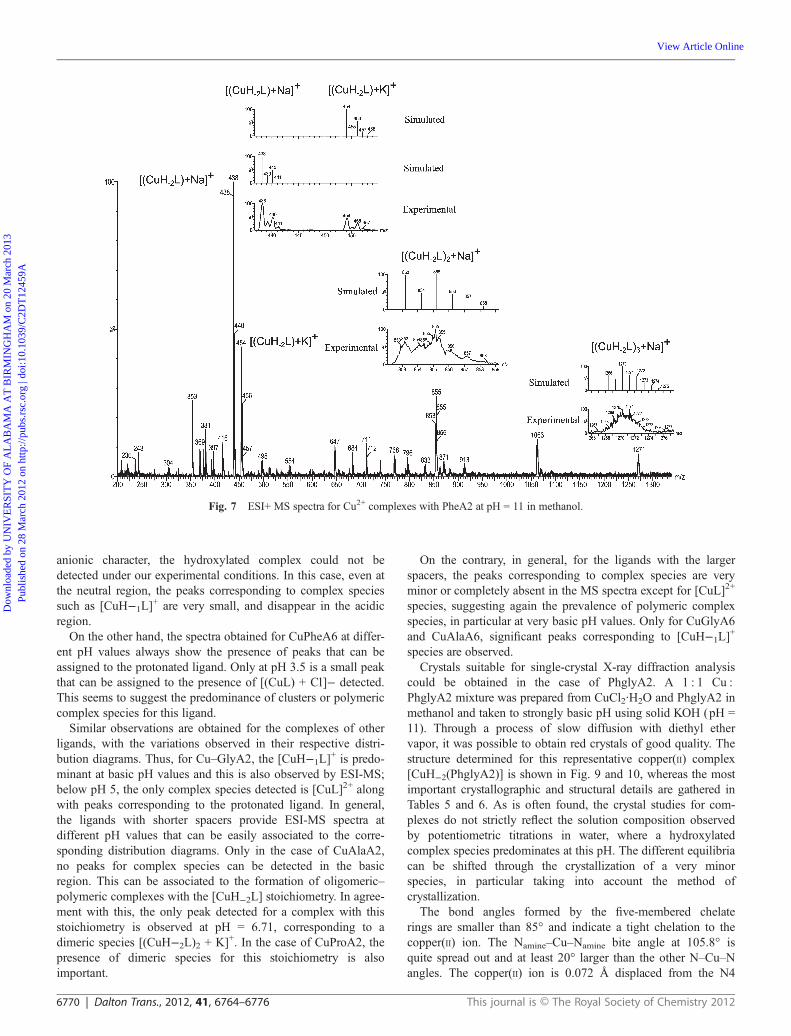
An illustrative example is given in Fig. 7 for the complexationof Cu2+ by the ligand PheA2 at a pH of around 11. The bisde-protonated complex species was the base peak ([(CuH−2PheA2)+ Na]+ at 438 m/z and [(CuH−2PheA2) + K]+ at 454 m/z, ca.100% and 44%). On other hand, there are two peaks for dimericand trimeric bisdeprotonated copper(II) complexes ([(CuH−2-PheA2)2 + Na]+ at 855 m/z and [(CuH−2PheA2)3 + Na]+ at 1271m/z). In every case, we have also calculated the simulated peakto check the proper assignation of the signals. Other signals cor-respond to the mixtures monomer–dimer at 647 m/z and dimer–trimer bideprotonated copper(II) complexes at 1063 m/z. At pH5.4 the main peak was at m/z 416, assigned to [CuH−1PheA2]
+,and some dimeric species involving the monodeprotonatedspecies are also detected. Essentially the same MS is obtained atpH 6.1. At pH values below 5.0, however, the only significantpeaks observed correspond to the protonated ligand. Thus, anexcellent agreement is observed between the data from ESI-MSand those from potentiometric analysis (Fig. 8). The behaviourof bis(amino amides) with medium-sized aliphatic chains isdifferent due to the emergence of new complex species, accord-ing to the distribution diagrams. The MS of the CuPheA4 com-plexes under strongly basic conditions only shows a peakcorresponding to the bisdeprotonated species. Because of its
Table 4 Logarithms of the formation constants for the Cu2+ complexes of ligands determined in 0.1 M NaCl at 298.1 ± 0.1 K
Reactionac AlaA2 AlaA6 GlyA2e GlyA6 PhglyA2 PhglyA6 ProA2 ProA6 ValA2d ValA6d
Cu + L ⇌ CuL 7.07(3)b 7.91(2) 6.72(37) 8.36(2) — 6.57(1) 8.37(2) 10.29(2) 6.09(4) 7.14(2)Cu + L + H ⇌ CuHL 12.32(14) 13.52(3) — 13.76(5) 10.28(6) 11.75(4) 13.87(6) 16.02(4) — 12.67(6)Cu + L ⇌ CuH−1L + H 1.44(1) 0.41(2) 0.29(19) 0.54(4) 0.21(1) −0.42(2) 2.62(2) 3.03(2) 0.67(1) −0.04(2)Cu + L ⇌ CuH−2L + 2H −6.05(2) −9.84(2) — −9.98(4) −6.66(2) −10.15(2) −4.00(1) −7.12(3) −6.48(1) −9.78(3)Cu + L ⇌ CuH−3L + 3H — — — — −13.73(1) — — −19.42(15) — —
CuL + H ⇌ CuHL 5.25(14) 5.61(3) — 5.4(5) — 5.18(4) 5.50(6) 5.73(4) — 5.53(5)CuL ⇌ CuH−1L + H −5.63(3) −7.5(2) −6.43(37) −7.82(5) — −6.99(2) −5.75(2)) −7.26(2) −5.42(4) −7.19(2)CuH−1L ⇌ CuH−2L + H −7.49(2) −10.25(2) — −10.52(4) −6.87(2) −9.73(2) −6.62(2) −10.15(3) −7.15(1) −9.74(3)CuH−2L ⇌ CuH−3L + H — — — — −7.07(2) — — −12.3(15) — —
aCharges omitted for clarity. bAll values in parentheses are the standard deviations in the last significant figure. cDetermined in 0.1 M NaCl using50 mL of a 2 mM solution of the ligand and 1 equiv. of the copper(II) salt. dDetermined in 0.15 M NaClO4 at 298.1 K.15 eValues for GlyA2 must beconsidered with caution. Solubility problems lead to less accurate titration curves.
Fig. 6 Distribution diagram for the species of Cu(II) and PhglyA2 andPhglyA6 in 0.1 M NaCl at 298.1 K.
This journal is © The Royal Society of Chemistry 2012 Dalton Trans., 2012, 41, 6764–6776 | 6769
Dow
nloa
ded
by U
NIV
ER
SIT
Y O
F A
LA
BA
MA
AT
BIR
MIN
GH
AM
on
20 M
arch
201
3Pu
blis
hed
on 2
8 M
arch
201
2 on
http
://pu
bs.r
sc.o
rg |
doi:1
0.10
39/C
2DT
1245
9A
View Article Online
anionic character, the hydroxylated complex could not bedetected under our experimental conditions. In this case, even atthe neutral region, the peaks corresponding to complex speciessuch as [CuH−1L]
+ are very small, and disappear in the acidicregion.
On the other hand, the spectra obtained for CuPheA6 at differ-ent pH values always show the presence of peaks that can beassigned to the protonated ligand. Only at pH 3.5 is a small peakthat can be assigned to the presence of [(CuL) + Cl]− detected.This seems to suggest the predominance of clusters or polymericcomplex species for this ligand.
Similar observations are obtained for the complexes of otherligands, with the variations observed in their respective distri-bution diagrams. Thus, for Cu–GlyA2, the [CuH−1L]
+ is predo-minant at basic pH values and this is also observed by ESI-MS;below pH 5, the only complex species detected is [CuL]2+ alongwith peaks corresponding to the protonated ligand. In general,the ligands with shorter spacers provide ESI-MS spectra atdifferent pH values that can be easily associated to the corre-sponding distribution diagrams. Only in the case of CuAlaA2,no peaks for complex species can be detected in the basicregion. This can be associated to the formation of oligomeric–polymeric complexes with the [CuH−2L] stoichiometry. In agree-ment with this, the only peak detected for a complex with thisstoichiometry is observed at pH = 6.71, corresponding to adimeric species [(CuH−2L)2 + K]+. In the case of CuProA2, thepresence of dimeric species for this stoichiometry is alsoimportant.
On the contrary, in general, for the ligands with the largerspacers, the peaks corresponding to complex species are veryminor or completely absent in the MS spectra except for [CuL]2+
species, suggesting again the prevalence of polymeric complexspecies, in particular at very basic pH values. Only for CuGlyA6and CuAlaA6, significant peaks corresponding to [CuH−1L]
+
species are observed.Crystals suitable for single-crystal X-ray diffraction analysis
could be obtained in the case of PhglyA2. A 1 : 1 Cu :PhglyA2 mixture was prepared from CuCl2·H2O and PhglyA2 inmethanol and taken to strongly basic pH using solid KOH (pH =11). Through a process of slow diffusion with diethyl ethervapor, it was possible to obtain red crystals of good quality. Thestructure determined for this representative copper(II) complex[CuH−2(PhglyA2)] is shown in Fig. 9 and 10, whereas the mostimportant crystallographic and structural details are gathered inTables 5 and 6. As is often found, the crystal studies for com-plexes do not strictly reflect the solution composition observedby potentiometric titrations in water, where a hydroxylatedcomplex species predominates at this pH. The different equilibriacan be shifted through the crystallization of a very minorspecies, in particular taking into account the method ofcrystallization.
The bond angles formed by the five-membered chelaterings are smaller than 85° and indicate a tight chelation to thecopper(II) ion. The Namine–Cu–Namine bite angle at 105.8° isquite spread out and at least 20° larger than the other N–Cu–Nangles. The copper(II) ion is 0.072 Å displaced from the N4
Fig. 7 ESI+ MS spectra for Cu2+ complexes with PheA2 at pH = 11 in methanol.
6770 | Dalton Trans., 2012, 41, 6764–6776 This journal is © The Royal Society of Chemistry 2012
Dow
nloa
ded
by U
NIV
ER
SIT
Y O
F A
LA
BA
MA
AT
BIR
MIN
GH
AM
on
20 M
arch
201
3Pu
blis
hed
on 2
8 M
arch
201
2 on
http
://pu
bs.r
sc.o
rg |
doi:1
0.10
39/C
2DT
1245
9A
View Article Online

basal plane (defined by N1, N2, N3 and N4). The two lateralfive-membered chelate planes define an angle of ca. 15° witheach other, and an angle of 6–11° with the central five-memberedchelate ring involving the two Namide groups. The C1 and C7carbon atoms (see Fig. 9 for the numbering used for the X-raystructure) are significantly out of their respective chelate planesas seen by the N4–C1–C5–N3 and N2–C7–C2–N1 dihedralangles, respectively (Tables 5 and 6). The crystal structurerevealed the formation of a mononuclear neutral complex with a
1 : 1 metal : ligand stoichiometry. The copper(II) cation is coordi-nated by two amine groups and two deprotonated amide groups,in a square planar geometry, as predicted by UV-vis spectroscopyfor [CuH−2L] species. For this complex, the average Cu–Namide
distance of 1.842(2) Å is 0.144 Å shorter than the average Cu–Namine distance of 1.986(2) Å. This difference may be attributedto the anionic coordination from the deprotonated Namide donorsinstead of the neutral donation from the Namine groups.
Bifurcated hydrogen bonds are formed between the carbonyloxygen atom O1 of one of the molecules and an hydrogen of theamine nitrogen atoms N2 and N4 of a second molecule (O1–N22.93 Å, O1–N4 2.91 Å). The other carbonyl oxygen atom of thefirst molecule (O2) is also hydrogen bonded, in the same way, toa third molecule (O2–N2 2.86 Å, O2–N4 3.04 Å). Fig. 10depicts the hydrogen bond network formed.
Suitable crystals of Cu–PheA3 were grown by slow evapor-ation of a solution of CuCl2·H2O and PheA3 in methanol, in theabsence of any base. As can be seen in the distribution diagramsfor Cu–PheA3, the [CuH−2L] species predominate up to pHvalues above 6. So, in this case, the obtained crystallographicstructure corresponds to the predominant complex predicted atthat pH value from the distribution diagram. The copper(II) ion isagain coordinated by two deprotonated Namide atoms and twoneutral Namine centres in a square-planar geometry with anaverage Cu–Namide distance of 1.930(9) Å and Cu–Namine dis-tance of 2.011(5) Å (see Fig. 11). As in the other case, the N–Cudistances are similar to the ones observed in other Cu(II) com-plexes with related ligands.26 In general, structural parameters
Fig. 8 Matching mass spectra with the species distribution diagram forcopper(II) and the ligand PheA2.
Fig. 9 Molecular structure for the Cu–PhGlyA2 complex obtained atthe basic pH region. Thermal ellipsoids are drawn at 30% probabilitylevel. Hydrogen atoms are omitted for clarity.
Fig. 10 Schematic representation of the hydrogen bond network forthe complex Cu–PhGlyA2 obtained at the basic pH region.
This journal is © The Royal Society of Chemistry 2012 Dalton Trans., 2012, 41, 6764–6776 | 6771
Dow
nloa
ded
by U
NIV
ER
SIT
Y O
F A
LA
BA
MA
AT
BIR
MIN
GH
AM
on
20 M
arch
201
3Pu
blis
hed
on 2
8 M
arch
201
2 on
http
://pu
bs.r
sc.o
rg |
doi:1
0.10
39/C
2DT
1245
9A
View Article Online

for this structure are very much like those found for the Cu–PhglyA2 system under basic conditions, although angles and dis-tances are slightly higher for the Phe derivative (Table 7).
As mentioned above, the angles and interatomic distancesobserved in both crystalline structures are in good agreementwith those found in related systems. As an example, Table 7shows some selected interatomic distances for the two crystalstructures and their comparison with those in a free ligand and inthe Cu(II) complex of a macrocyclic bis(amino amide) ligandrecently described.26
DFT studies were carried out to obtain some additional infor-mation about the nature of the species formed. The calculationswere done by optimizing the geometries both in the gas phaseand in solution (CPCM model) to obtain a better approximationto the experimental conditions. However, the geometries derivedmust be taken with care not only because of the limitationsimplicit in the calculations but also because additional factors ashydrogen bonding with solvent molecules were not included inthe model. A simple Ala derivative (AlaA3) was selected for thisstudy in order to reduce the number of atoms involved. The
structures of the square planar, square pyramidal and octahedralcomplexes (with water as the additional ligand) for the deproto-naded bis(amino amide) were optimized and are presented inFig. 12.
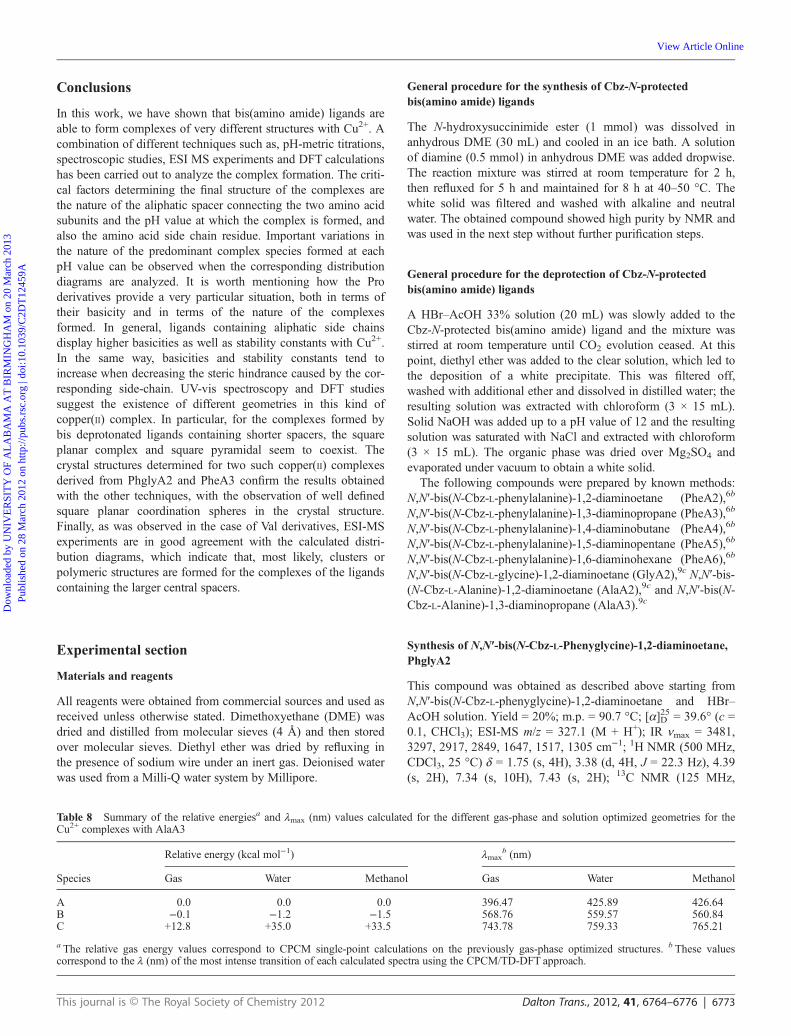
Once the optimized geometries were obtained, the correspond-ing calculated spectra were obtained using the CPCM/TD-DFTapproach, and the values for the λ (nm) of the most intense tran-sition of each one are presented in Table 8. Thus, DFT calcu-lations provide a reasonable explanation to the experimentalobservation of the UV-vis spectra. From the results presented inTable 8, it seems reasonable to assume that the experimentalabsorption band centered at 500 nm can correspond to a mixtureof two different geometries involving a square planar tetradentatecomplex and a square pyramidal complex, in which the fifthcoordination site is occupied by a water molecule. The energyvalues in Table 8 show that the square pyramidal complex isslightly lower in energy than the square planar one and, thus, thepotential coexistence of these two species with different geome-tries, in an aqueous environment, is reasonable. The resultsshown in the ESI† for AlaA3 are also in good agreement withthis analysis.
Table 5 Selected bond lengths [Å] and angles [°] for Cu–PhglyA2 andCu–PheA3 crystal structures
Distance or angle CuPhglyA2 CuPheA3
Cu–N1 1.895(4) 2.006(7)Cu–N2 1.987(4) 1.940(8)Cu–N3 1.877(5) 1.919(7)Cu–N4 1.990(4) 2.016(8)N2–Cu–N3 169.55(18) 96.6(3)N3–Cu–N4 84.68(19) 173.3(3)N2–Cu–N4 105.76(18) 98.4(3)N1–Cu–N3 84.80(2) 171.8(3)N1–Cu–N2 84.82(18) 83.0(3)N1–Cu–N4 167.6(2) 98.4(3)
Table 6 Crystallographic data for Cu–PhGlyA2 and Cu–PheA3 crystalstructures
CuPhglyA2 CuPheA3
Empirical formula C18 H20 Cu N4 O2 C23 H34 Cu N4 O4Formula mass 387.92 494.08T [K] 298 298Crystal system Orthorhombic OrthorhombicSpace group P212121 P212121Color RedCrystal size mm 0.28 × 0.28 × 0.18 0.46 × 0.31 × 0.22a [Å] 10.4048(11) 9.5315(2)b [Å] 11.3542(13) 12.0135(3)c [Å] 14.9983(18) 20.7584(4)α [°] 90 90β [°] 90 90γ [°] 90 90V [Å3] 1771.9(3) 2376.98(9)Z 4 4Dcalcd [g cm−3] 1.454 1.381Absorption coefficient[mm−1]
1.251 0.955
Ra 0.0500 0.0257Rwb 0.1040 0.0648GOF on F2 1.017 1.012
a R = ∑||Fo| − |Fc||/∑|Fo|b Rw = {[∑(|Fo|
2|Fc|2)2]}1/2.
Fig. 11 Molecular structure obtained for the complex Cu–PheA3 inthe absence of added base, pH = 6. Thermal ellipsoids are drawn at 30%probability level. Hydrogen atoms are omitted for clarity.
Table 7 Interatomic distances in the amide N–C–O moiety and for theamino group
CvO C–Namina C–Namida
PheA2 1.239 1.469 1.337CuPheA3 1.271 1.474 1.310CuPhglyA2 1.251 1.497 1.312Cu-macrocycle26 1.262 1.473 1.305
Fig. 12 Optimized geometries for the square planar complex (A), thesquare pyramidal complex (B) and the octahedral complex (C) used as amodel starting from the deprotonated AlaA3 ligand.
6772 | Dalton Trans., 2012, 41, 6764–6776 This journal is © The Royal Society of Chemistry 2012
Dow
nloa
ded
by U
NIV
ER
SIT
Y O
F A
LA
BA
MA
AT
BIR
MIN
GH
AM
on
20 M
arch
201
3Pu
blis
hed
on 2
8 M
arch
201
2 on
http
://pu
bs.r
sc.o
rg |
doi:1
0.10
39/C
2DT
1245
9A
View Article Online
Conclusions
In this work, we have shown that bis(amino amide) ligands areable to form complexes of very different structures with Cu2+. Acombination of different techniques such as, pH-metric titrations,spectroscopic studies, ESI MS experiments and DFT calculationshas been carried out to analyze the complex formation. The criti-cal factors determining the final structure of the complexes arethe nature of the aliphatic spacer connecting the two amino acidsubunits and the pH value at which the complex is formed, andalso the amino acid side chain residue. Important variations inthe nature of the predominant complex species formed at eachpH value can be observed when the corresponding distributiondiagrams are analyzed. It is worth mentioning how the Proderivatives provide a very particular situation, both in terms oftheir basicity and in terms of the nature of the complexesformed. In general, ligands containing aliphatic side chainsdisplay higher basicities as well as stability constants with Cu2+.In the same way, basicities and stability constants tend toincrease when decreasing the steric hindrance caused by the cor-responding side-chain. UV-vis spectroscopy and DFT studiessuggest the existence of different geometries in this kind ofcopper(II) complex. In particular, for the complexes formed bybis deprotonated ligands containing shorter spacers, the squareplanar complex and square pyramidal seem to coexist. Thecrystal structures determined for two such copper(II) complexesderived from PhglyA2 and PheA3 confirm the results obtainedwith the other techniques, with the observation of well definedsquare planar coordination spheres in the crystal structure.Finally, as was observed in the case of Val derivatives, ESI-MSexperiments are in good agreement with the calculated distri-bution diagrams, which indicate that, most likely, clusters orpolymeric structures are formed for the complexes of the ligandscontaining the larger central spacers.
Experimental section
Materials and reagents
All reagents were obtained from commercial sources and used asreceived unless otherwise stated. Dimethoxyethane (DME) wasdried and distilled from molecular sieves (4 Å) and then storedover molecular sieves. Diethyl ether was dried by refluxing inthe presence of sodium wire under an inert gas. Deionised waterwas used from a Milli-Q water system by Millipore.
General procedure for the synthesis of Cbz-N-protectedbis(amino amide) ligands
The N-hydroxysuccinimide ester (1 mmol) was dissolved inanhydrous DME (30 mL) and cooled in an ice bath. A solutionof diamine (0.5 mmol) in anhydrous DME was added dropwise.The reaction mixture was stirred at room temperature for 2 h,then refluxed for 5 h and maintained for 8 h at 40–50 °C. Thewhite solid was filtered and washed with alkaline and neutralwater. The obtained compound showed high purity by NMR andwas used in the next step without further purification steps.
General procedure for the deprotection of Cbz-N-protectedbis(amino amide) ligands
A HBr–AcOH 33% solution (20 mL) was slowly added to theCbz-N-protected bis(amino amide) ligand and the mixture wasstirred at room temperature until CO2 evolution ceased. At thispoint, diethyl ether was added to the clear solution, which led tothe deposition of a white precipitate. This was filtered off,washed with additional ether and dissolved in distilled water; theresulting solution was extracted with chloroform (3 × 15 mL).Solid NaOH was added up to a pH value of 12 and the resultingsolution was saturated with NaCl and extracted with chloroform(3 × 15 mL). The organic phase was dried over Mg2SO4 andevaporated under vacuum to obtain a white solid.
The following compounds were prepared by known methods:N,N′-bis(N-Cbz-L-phenylalanine)-1,2-diaminoetane (PheA2),6b
N,N′-bis(N-Cbz-L-phenylalanine)-1,3-diaminopropane (PheA3),6b
N,N′-bis(N-Cbz-L-phenylalanine)-1,4-diaminobutane (PheA4),6b
N,N′-bis(N-Cbz-L-phenylalanine)-1,5-diaminopentane (PheA5),6b
N,N′-bis(N-Cbz-L-phenylalanine)-1,6-diaminohexane (PheA6),6b
N,N′-bis(N-Cbz-L-glycine)-1,2-diaminoetane (GlyA2),9c N,N′-bis-(N-Cbz-L-Alanine)-1,2-diaminoetane (AlaA2),9c and N,N′-bis(N-Cbz-L-Alanine)-1,3-diaminopropane (AlaA3).9c
Synthesis of N,N′-bis(N-Cbz-L-Phenyglycine)-1,2-diaminoetane,PhglyA2
This compound was obtained as described above starting fromN,N′-bis(N-Cbz-L-phenyglycine)-1,2-diaminoetane and HBr–AcOH solution. Yield = 20%; m.p. = 90.7 °C; [α]25D = 39.6° (c =0.1, CHCl3); ESI-MS m/z = 327.1 (M + H+); IR νmax = 3481,3297, 2917, 2849, 1647, 1517, 1305 cm−1; 1H NMR (500 MHz,CDCl3, 25 °C) δ = 1.75 (s, 4H), 3.38 (d, 4H, J = 22.3 Hz), 4.39(s, 2H), 7.34 (s, 10H), 7.43 (s, 2H); 13C NMR (125 MHz,
Table 8 Summary of the relative energiesa and λmax (nm) values calculated for the different gas-phase and solution optimized geometries for theCu2+ complexes with AlaA3
Species
Relative energy (kcal mol−1) λmaxb (nm)
Gas Water Methanol Gas Water Methanol
A 0.0 0.0 0.0 396.47 425.89 426.64B −0.1 −1.2 −1.5 568.76 559.57 560.84C +12.8 +35.0 +33.5 743.78 759.33 765.21
a The relative gas energy values correspond to CPCM single-point calculations on the previously gas-phase optimized structures. b These valuescorrespond to the λ (nm) of the most intense transition of each calculated spectra using the CPCM/TD-DFT approach.
This journal is © The Royal Society of Chemistry 2012 Dalton Trans., 2012, 41, 6764–6776 | 6773
Dow
nloa
ded
by U
NIV
ER
SIT
Y O
F A
LA
BA
MA
AT
BIR
MIN
GH
AM
on
20 M
arch
201
3Pu
blis
hed
on 2
8 M
arch
201
2 on
http
://pu
bs.r
sc.o
rg |
doi:1
0.10
39/C
2DT
1245
9A
View Article Online
CDCl3, 25 °C) δ = 38.8, 59.6, 127.1, 127.3, 127.5, 128.4, 128.6,143.1, 174.0; Elemental analysis calcd (%) for C18H22N4O2: C,66.24; H, 6.79; N, 17.17. Found: C, 66.685; H, 7.137; N,16.804.
Synthesis of N,N′-bis(N-Cbz-L-Phenyglycine)-1,6-diaminohexane, PhglyA6
This compound was obtained as described above starting fromN,N′-bis(N-Cbz-L-phenyglycine)-1,6-diaminohexane andHBr–AcOH solution. Yield = 78%; m.p. = 106 °C; [α]25D =37.26° (c = 0.1, CHCl3); ESI-MS m/z = 383.24 (M + H+); IRνmax = 3375, 3306, 2923, 2852, 1634, 1539, 1310 cm−1; 1HNMR (500 MHz, CDCl3, 25 °C) δ = 0.37 (d, 4H, J = 10.6 Hz),0.54 (d, 4H, J = 6.4 Hz), 1.69 (d, 4H, J = 1.1 Hz), 2.12–2.30(m, 4H), 3.62 (s, 2H), 6.14–6.40 (m, 3H), 6.40–6.47 (m, 3H),6.54 (d, 4H, J = 7.7 Hz), 6.90–7.00 (m, 2H); 13C NMR(125 MHz, CDCl3, 25 °C) δ = 25.9, 29.3, 38.7, 59.9, 126.8,127.9, 128.8, 141.2, 172.9; Elemental analysis calcd (%) forC22H30N4O2: C, 69.08; H, 7.91; N, 14.65. Found: C, 69.678; H,7.027; N, 13.526.
Synthesis of N,N′-bis(N-Cbz-L-Proline)-1,2-diaminoetane, ProA2
This compound was obtained as described above starting fromN,N′-bis(N-Cbz-L-proline)-1,2-diaminoetane and HBr–AcOHsolution.Yield = 76%; m.p. = 113.1 °C; [α]25D = −86.7° (c = 0.1,CHCl3); ESI-MS m/z = 255.17 (M + H+); IR νmax = 3277, 3085,2950, 2853, 1641, 1548, 1241 cm−1; 1H NMR (500 MHz,CDCl3, 25 °C) δ = 1.21 (s, 2H), 1.57–1.75 (m, 4H), 1.79–1.88(m, 2H), 2.02–2.15 (m, 2H), 2.81–2.91 (m, 2H), 2.93–3.01(m, 2H), 3.26–3.40 (m, 4H), 3.69 (dd, 2H, J = 5.4, 9.0 Hz), 7.88(s, 2H); 13C NMR (125 MHz, CDCl3, 25 °C) δ = 26.0, 30.7,39.0, 47.1, 60.5, 175.7; Elemental analysis calcd (%) forC12H22N4O2: C, 56.07; H, 8.72; N, 22.03 Found: C, 57.946;H, 8.033; N, 20.524.
Synthesis of N,N′-bis(N-Cbz-L-Proline)-1,6-diaminohexane,ProA6
This compound was obtained as described above starting fromN,N′-bis(N-Cbz-L-proline)-1,6-diaminohexane and HBr–AcOHsolution. Yield = 64%; m.p. = 53 °C; [α]25D = −2.14° (c = 0.1,CHCl3); ESI-MS m/z = 297.22 (M + H+); IR νmax = 3286, 2928,2859, 1630, 1526 cm−1; 1H NMR (500 MHz, CDCl3, 25 °C)δ = 1.30 (d, 4H, J = 1.9 Hz), 1.42–1.50 (m, 4H), 1.60–1.72 (m,4H), 1.85 (dd, 2H, J = 6.8, 12.8 Hz), 2.02–2.12 (m, 4H),2.79–2.90 (m, 2H), 2.91–3.01 (m, 2H), 3.17 (dt, 4H, J = 3.8,7.3 Hz), 3.61–3.71 (m, 2H), 7.58 (s, 2Hs); 13C NMR (125 MHz,CDCl3, 25 °C) δ = 26.1, 26.4, 29.5, 30.7, 38.6, 47.2, 60.6,175.0. Elemental analysis calcd (%) for C16H30N4O2: C, 61.90;H, 9.74; N, 18.05 Found: 61.704; H, 8.569; N, 17.278.
Synthesis of N,N′-bis(N-Cbz-L-Alanine)-1,6-diaminohexane,AlaA6
This compound was obtained as described above starting fromN,N′-bis(N-Cbz-L-alanine)-1,6-diaminohexane and HBr–AcOH
solution. Yield = 78%; m.p. = 53 °C; [α]25D = −7.0° (c = 0.1,CHCl3); ESI-MS m/z = 259.2 (M + H+), 281.2 (M + Na+);IR νmax = 3316, 3285, 2918, 2850, 1635, 1534, 1231 cm−1;1H NMR (500 MHz, CDCl3, 25 °C) δ = 1.22–1.24 (d, 6H, J =6.9 Hz), 1.26–1.28 (m, 4H), 1.41–1.45 (m, 4H), 2.83 (s br, 2H),3.11–3.17 (m, 4H), 3.34–3.41 (d, 2H, J = 6.9 Hz); 13C NMR(125 MHz, CDCl3, 25 °C) δ = 17.2, 26.1, 29.1, 38.7, 50.4,169.9. Elemental analysis calcd (%) for C12H26N4O2: C, 55.79;H, 10.14; N, 21.69. Found: C, 55.557; H, 8.274; N, 20.936.
Synthesis of N,N′-bis(N-Cbz-L-Glycine)-1,6-diaminohexane,GlyA6
This compound was obtained as described above starting fromN,N′-bis(N-Cbz-L-glycine)-1,6-diaminohexane and HBr–AcOHsolution. Yield = 10%; m.p. = 111–113 °C; ESI-MS m/z =230.17 (M + H+); IR νmax = 3275, 3228, 1646, 1569,1536 cm−1; 1H NMR (500 MHz, DMSO) δ = 1.23 (dd, J = 8.5,5.3 Hz, 2H), 1.41–1.34 (m, 2H), 2.52–2.45 (m, 2H), 3.04 (dd,J = 13.0, 6.5 Hz, 4H), 7.72 (s, 1H), 13C NMR (126 MHz,DMSO) δ = 26.54, 29.62, 38.60, 45.20, 173.10; Elementalanalysis calcd for (%) C10H22N4O2: C, 52.15; H, 9.63; N, 24.33.Found: C, 51.587; H, 9.154; N, 22.325.
Electromotive force measurements
The potentiometric titrations were carried out at 298.1 ± 0.1 Kusing NaCl 0.1 M as supporting electrolyte. The experimentalprocedure (burette, potentiometer, cell, stirrer, microcomputer,etc.) has been fully described elsewhere.27 The acquisition of theemf data was performed with the computer program CrisonCap-ture. The reference electrode was an Ag–AgCl electrode in satu-rated KCl solution. The glass electrode was calibrated as ahydrogen-ion concentration probe by titration of previously stan-dardized amounts of HCl with CO2-free NaOH solutions and theequiv. point determined by the Grańs method, which gives thestandard potential, E°′, and the ionic product of water [pKw =13.78(1)]. The computer program HYPERQUAD28 was used tocalculate the protonation and stability constants, and the HySS29
program was used to obtain the distribution diagrams. The pHrange investigated was 2.0–12.0 and the concentration of themetal ions and of the ligands ranged from 1 × 10⁻³ to 5 × 10⁻³
M with Cu2+ : L molar ratios as 1 : 1. The different titrationcurves for each system (at least two) were treated either as asingle set or as separated curves without significant variations inthe values of the stability constants. Finally, the sets of data weremerged together and treated simultaneously to give the final stab-ility constants.
NMR measurements
The 1H spectra were recorded on a Varian INOVA 500 spectro-meter (500 and 125 MHz for 1H and 13C NMR, respectively).The solvent signal was used as a reference standard. Adjustmentsto the desired pH were made using drops of DCl or NaOD solu-tions. The pD was calculated from the measured pH values usingthe correlation, pH = pD − 0.4.30
6774 | Dalton Trans., 2012, 41, 6764–6776 This journal is © The Royal Society of Chemistry 2012
Dow
nloa
ded
by U
NIV
ER
SIT
Y O
F A
LA
BA
MA
AT
BIR
MIN
GH
AM
on
20 M
arch
201
3Pu
blis
hed
on 2
8 M
arch
201
2 on
http
://pu
bs.r
sc.o
rg |
doi:1
0.10
39/C
2DT
1245
9A
View Article Online

Mass spectrometry
Mass spectra were recorded on a hybrid QTOF I (quadrupole-hexapole-TOF) mass spectrometer with an orthogonal Z-spray-electrospray interface (Micromass, Manchester, UK) either byelectrospray positive mode (ES+) or by electrospray negativemode (ES−). The desolvation gas as well as nebulizing gas wasnitrogen at a flow of 700 L h−1 and 20 L h−1, respectively. Thetemperature of the source block was set to 120 °C and the de-solvation temperature to 150 °C. A capillary voltage of 3.5 and3.3 kV was used in the positive and negative scan mode, respect-ively. The cone voltage was typically set to 20 V to control theextent of fragmentation of the identified ions. Sample solutionswere infused via syringe pump directly connected to the ESIsource at a flow rate of 10 mL min−1. The observed isotopicpattern of each intermediate perfectly matched the theoreticalisotope pattern calculated from their elemental compositionusing the MassLynx 4.0 program.
UV-vis spectroscopy
UV-vis absorption spectra were recorded in MeOH, in aHewlett-Packard 8453 apparatus, using solutions (1 × 10⁻³ M) atdifferent pH values containing 1 : 1 ligand to metal molar ratios.Additional experiments were carried out in NaCl 0.1 M solu-tions. Only minimal differences were observed in this case.
IR spectroscopy
FTIR spectra were acquired on a JASCO 6200 equipment with aMIRacle single-reflection ATR diamond/ZnSe accessory. Theraw IR spectral data were processed with the JASCO spectralmanager software. Solutions (2 × 10⁻³ M) at different pH valuescontaining 1 : 1 ligand to metal molar ratios were used for thoseexperiments.
DFT calculations
All DFT calculations were carried out with the Gaussian 03 soft-ware package using the B3LYP level. All structures were com-puted using the density functional theory using the non-localhybrid Becke’s three-parameter exchange functional (denoted asB3LYP) with effective core LanL2DZ pseudopotential and theassociated basis set for Cu(II) and the 6-31G (d) basis set for therest of ligand atoms (C, N, O, H). All geometry optimizationswere performed without any symmetry constraints both in gasphase and in solvent, and efforts were made to find the lowestenergy conformations by comparing the structures optimizedfrom different starting geometries. Aqueous-phase calculations(ε 78.39) were performed through the use of the conductor-likepolarizable continuum model (CPCM) as implemented in Gaus-sian 03. In order to take into account the non-specific watereffect in the gas-phase geometry optimizations, the energy of thespecies obtained in the gas phase is given in the text as the resultof single-point CPCM calculations. Vibrational calculations wereperformed to confirm that the calculated structures were trueminima. The electronic absorption spectra of the previously opti-mized species were calculated using the time-dependent DFT
(TD-DFT) formalism, and 50 singlet-excited-state energies werecalculated, respectively. The non-specific solvent effect was con-sidered in the TD-DFT calculations via the non-equilibriumversion of the CPCM algorithm.
Crystallography
The crystals are air stable and were mounted on the tip of a glassfiber with the use of epoxi cement. X-Ray diffraction exper-iments were carried out on a Bruker SMART CCD diffracto-meter using Mo-Kα radiation (λ = 0.71073 Å) at roomtemperature. The data were collected with a frame width of 0.3°in ω and a counting time of 40 s per frame at a crystal to detectordistance of 4 cm. The diffraction frames were integrated usingthe SAINT package and corrected for absorption withSADABS.31 The structures were solved by direct methods andrefined by the full-matrix method based on F2 using theSHELXTL software package.32 All non-hydrogen atoms wererefined anisotropically and hydrogen atoms were generated geo-metrically, assigned isotropic thermal parameters and allowedto ride on their respective parent carbon atoms.33 IntermolecularC–H⋯N and C–H⋯O contacts were examined with theDIAMOND 2.0 package.34 Cambridge Crystallographic DataCentre CCDC 801764 (CuPhglyA2) and CCDC 829491(CuPheA3) contain the supplementary crystallographic data forthis paper.†
Acknowledgements
Financial support from Ministerio de Ciencia e Innovación(MCIN, CTQ2009-14366-C02-01) and Bancaja-UJI (P1-1B-2009-59) is gratefully acknowledged. I. M. thanks MCINNfor a predoctoral fellowship. A. F. thanks Universitat Jaume I forthe financial support under the program “Pla de promoció de lainvestigació”. The authors are grateful to the SCIC of the Univer-sitat Jaume I for the spectroscopic facilities.
Notes and references
1 (a) F. Meyer and H. Kozlowski, Comprehensive Coordination ChemistryII: From Biology to Nanotechnology, ed. J. A. McCleverty andT. J. Meyer, Elsevier, Oxford, 2004, vol. 6, p. 247; (b) G. A. Lawrance,Introduction to Coordination Chemistry, John Wiley & Sons Ltd, Chiche-ster, 2010, pp. 233–245.
2 (a) A. E. Martell and R. J. Motekaitis, Coord. Chem. Rev., 1990, 100,323; (b) A. E. Martell and R. D. Hancock, Metal Complexes in AqueousSolutions, Plenum Press, New York, 1995; (c) J. Gao, J. H. Reibenspies,R. A. Zingaro, F. R. Woolley, A. E. Martell and A. Clearfield, Inorg.Chem., 2005, 44, 232.
3 (a) J.-M. Lehn, Angew. Chem., Int. Ed., 1988, 27, 89; (b) F.P. Schmidtchen, Top. Curr. Chem., 1986, 132, 101; (c) M. E. Huston, E.U. Akkaya and A. W. Czarnik, J. Am. Chem. Soc., 1989, 111, 8735;(d) B. Dietrich, Pure Appl. Chem., 1993, 65, 1457–1464; (e) J.-M. Lehn,Supramolecular Chemistry. Concepts and Perspective, VCH, Weinheim,Germany, 1995; (f ) A. Bianchi, K. Bowman-James and E. Garcia-España, Supramolecular Chemistry of Anions, Wiley-VCH, New York,1997; (g) P. D. Beer, Acc. Chem. Res., 1998, 31, 71; (h) A. Bencini,A. Bianchi, E. García-España, M. Micheloni and J. A. Ramírez, Coord.Chem. Rev., 1999, 188, 97; (i) P. D. Beer and P. A. Gale, Angew. Chem.,Int. Ed., 2001, 40, 486; ( j) P. A. Gale, Coord. Chem. Rev., 2001, 213, 79.
4 (a) S. K. Burke, Y. Xu and D. W. Margerum, Inorg. Chem., 2003, 42,5807; (b) B. J. Green, T. M. Tesfai and D. W. Margerum, Inorg. Chem.,2004, 43, 1463; (c) B. J. Green, T. M. Tesfai and D. W. Margerum,
This journal is © The Royal Society of Chemistry 2012 Dalton Trans., 2012, 41, 6764–6776 | 6775
Dow
nloa
ded
by U
NIV
ER
SIT
Y O
F A
LA
BA
MA
AT
BIR
MIN
GH
AM
on
20 M
arch
201
3Pu
blis
hed
on 2
8 M
arch
201
2 on
http
://pu
bs.r
sc.o
rg |
doi:1
0.10
39/C
2DT
1245
9A
View Article Online
Dalton Trans., 2004, 3508; (d) T. M. Tesfai, B. J. Green andD. W. Margerum, Inorg. Chem., 2004, 43, 6726; (e) J.-C. Kizirian,Chem. Rev., 2008, 108, 140; (f ) J. S. Prell, T. G. Flick, J. Oomens,G. Berden and E. R. Williams, J. Phys. Chem. A., 2010, 114, 854; (g) S.K. Sharma, G. Hundal and R. Gupta, Eur. J. Inorg. Chem., 2010, 621.
5 M. I. Burguete, M. Collado, J. Escorihuela and S. V. Luis, Angew. Chem.,Int. Ed., 2007, 46, 47, 9005; M. I. Burguete, J. Escorihuela, S. V. Luis,A. Lledós and G. Ujaque, Tetrahedron, 2008, 64, 41, 9724.
6 (a) F. Adrián, M. I. Burguete, S. V. Luis, J. F. Miravet, M. Querol andE. García-España, Tetrahedron Lett., 1999, 40, 1039; (b) J. Becerril,M. Bolte, M. I. Burguete, F. Galindo, E. García-España, S. V. Luis andJ. F. Miravet, J. Am. Chem. Soc., 2003, 125, 6677.
7 (a) M. Bru, I. Alfonso, M. I. Burguete and S. V. Luis, Tetrahedron Lett.,2005, 46, 7781; (b) I. Alfonso, M. Bolte, M. Bru, M. I. Burguete and S.V. Luis, Chem.–Eur. J., 2008, 14, 8879.
8 (a) M. Bru, I. Alfonso, M. I. Burguete and S. V. Luis, Angew. Chem., Int.Ed., 2006, 45, 6155; (b) I. Alfonso, M. Bolte, M. Bru, M. I. Burguete,S. V. Luis and J. Rubio, J. Am. Chem. Soc., 2008, 130, 6137.
9 (a) B. Escuder, J. F. Miravet, R. Gavara and S. V. Luis, Eur. J. Org.Chem., 2005, 481; (b) J. Becerril, M. I. Burguete, B. Escuder, S. V. Luis,J. F. Miravet and M. Querol, Chem. Commun., 2002, 738; (c) J. Becerril,M. I. Burguete, B. Escuder, F. Galindo, R. Gavara, J. F. Miravet,S. V. Luis and G. Peris, Chem.–Eur. J., 2004, 10, 3879;(d) M. I. Burguete, F. Galindo, R. Gavara, M. A. Izquierdo, J. C. Lima,S. V. Luis, A. J. Parola and F. Pina, Langmuir, 2008, 24, 9795;(e) M. I. Burguete, M. A. Izquierdo, F. Galindo and S. V. Luis, Chem.Phys. Lett., 2008, 460, 503.
10 F. Galindo, M. I. Burguete, L. Vigara, S. V. Luis, N. Kabir, J. Gavrilovicand D. A. Russell, Angew. Chem., Int. Ed., 2005, 44, 6504.
11 (a) M. I. Burguete, F. Galindo, M. A. Izquierdo, S. V. Luis and L. Vigara,Tetrahedron, 2007, 63, 9493; (b) I. Alfonso, M. I. Burguete, F. Galindo,S. V. Luis and L. Vigara, J. Org. Chem., 2009, 74, 6130;(c) M. I. Burguete, F. Galindo, S. V. Luis and L. Vigara, J. Photochem.Photobiol., A, 2010, 209, 61.
12 (a) I. Alfonso, M. I. Burguete and S. V. Luis, J. Org. Chem., 2006, 71,2242; (b) I. Alfonso, M. I. Burguete, F. Galindo, S. V. Luis andL. Vigara, J. Org. Chem., 2007, 72, 7947.
13 (a) F. Adrián, M. I. Burguete, J. M. Fraile, J. I. García, E. García-España, S. V. Luis, J. A. Mayoral, A. J. Royo and M. C. Sánchez,Eur. J. Inorg. Chem., 1999, 2347; (b) B. Altava, M. I. Burguete,N. Carbó, J. Escorihuela and S. V. Luis, Tetrahedron: Asymmetry,2010, 21, 982.
14 (a) I. Alfonso, M. Bolte, M. Bru, M. I. Burguete and S. V. Luis,CrystEngComm, 2009, 11, 735; (b) I. Alfonso, M. Bru, M. I. Burguete,E. García-Verdugo and S. V. Luis, Chem.–Eur. J., 2010, 16, 1246.
15 S. Blasco, M. I. Burguete, M. P. Clares, E. García-España, J. Escorihuelaand S. V. Luis, Inorg. Chem., 2010, 490, 7841.
16 (a) A. Andrés, C. Bazzicalupi, A. Bianchi, E. García-España,S. V. Luis, J. F. Miravet and J. A. Ramírez, J. Chem. Soc. DaltonTrans., 1994, 2995; (b) M. Chadim, M. Budesinsky, J. Hodacova andJ. Zavada, Collect. Czech. Chem. Commun., 2000, 65, 99;(c) M. Chadim, P. Díaz, E. García-España, J. Hodacova, P. C. Junk,J. Latorre, J. M. Llinares, C. Soriano and J. Zavada, New J. Chem.,2003, 27, 1132.
17 A. Bianchi, B. Escuder, E. García-España, S. V. Luis, V. Marcelino,J. F. Miravet and J. A. Ramirez, J. Chem. Soc., Perkin Trans. 2, 1994, 2,1253; J. A. Aguilar, E. García-España, J. A. Guerrero, S. V. Luis,J. M. Llinares, J. F. Miravet, J. A. Ramírez and C. Soriano, Inorg. Chim.Acta, 1996, 246, 287; M. A. Bernardo, J. A. Guerrero, E. García-España,S. V. Luis, J. M. Llinares, F. Pina, J. A. Ramirez and C. Soriano,
J. Chem. Soc., Perkin Trans 2, 1996, 2335; V. J. Arán, M. Kumar,J. Molina, L. Lamarque, P. Navarro, E. García-España, J. A. Ramírez, S.V. Luis and B. Escuder, J. Org. Chem., 1999, 64, 6135.
18 (a) S. P. Dagnall, D. N. Hague and M. E. J. McAdam, J. Chem. Soc.,Perkin Trans 2, 1984, 435; (b) L. Alderighi, A. Bianchi, L. Biondi,L. Calabi, M. De Miranda, P. Gans, S. Ghelli, P. Losi, L. Paleari,A. Sabatini and A. J. Vacca, J. Chem. Soc., Perkin Trans. 2, 1999, 2741;(c) A. Bencini, A. Bianchi, E. García-España, M. Micheloni andJ. A. Ramírez, Coord. Chem. Rev., 1999, 188, 97; (d) J. Aguilar, P. Díaz,F. Escartí, E. García-España, L. Gil, C. Soriano and B. Verdejo, Inorg.Chim. Acta, 2002, 39, 307; (e) M. T. Albelda, J. C. Frias and E. García-España, Encycl. Supramol. Chem., 2007, 1:1, 1–37.
19 R. M. C. Dawson, et al., Data for Biochemical Research, ClarendonPress, Oxford, 1959.
20 K. Sun Bai and A. E. Martell, J. Am. Chem. Soc., 1969, 91, 4412.21 J. C. Stephens, M. A. Khan and R. P. Houser, Inorg. Chem., 2001, 40,
5064.22 (a) T. R. Wagler, Y. Fang and C. J. Burrows, J. Org. Chem., 1989, 54,
1584; (b) B. Dangel, M. Clarke, J. Haley, D. Sames and R. Polt, J. Am.Chem. Soc., 1997, 119, 10865; (c) C. L. Weeks, P. Turner, R. R. Fentonand P. A. Lay, J. Chem. Soc., Dalton Trans., 2002, 931;(d) M. I. Burguete, F. Galindo, S. V. Luis and L. Vigara, Dalton Trans.,2007, 4027; (e) S. K. Sharma, S. Upreti and R. Gupta, Eur. J. Inorg.Chem., 2007, 3247; (f ) J. Singh, G. Hundal and R. Gupta, Eur. J. Inorg.Chem., 2008, 2052; (g) R. Shakya, A. Jozwiuk, D. R. Powell and R.P. Houser, Inorg. Chem., 2009, 48, 4083.
23 (a) R. Polt, B. D. Kelly, B. D. Dangel, U. B. Tadikonda, R. E. Ross,A. M. Raitsimring and A. V. Astashkin, Inorg. Chem., 2003, 42, 566;(b) S. Autzen, H.-G. Korth, R. Boese, H. De Groot and R. Sustmann,Eur. J. Inorg. Chem., 2003, 1401–1410; (c) A. G. Algarra,M. G. Basallote, C. E. Castillo, M. P. Clares, A. Ferrer, E. García-España,J. M. Llinares, M. A. Máñez and C. Soriano, Inorg. Chem., 2009, 48,902.
24 (a) M. Kodama and E. J. Kimura, J. Chem Soc., Dalton Trans., 1980, 17,839; (b) R. J. Motekaitis, B. E. Rogers, D. E. Reichert, A. E. Martell andM. J. Welch, Inorg. Chem., 1996, 35, 3821.
25 (a) K. Schug, P. Fryčák, N. M. Maier and W. Lindner, Anal. Chem.,2005, 77, 3660; (b) A. Di Tullio, S. Reale and F. J. De Angelis, MassSpectrom., 2005, 40, 845; (c) B. Baytekin, H. T. Baytekin andT. C. A. Schalley, Org. Biomol. Chem., 2006, 4, 2825.
26 M. Munjal, S. Kumar, S. K. Sharma and R. Gupta, Inorg. Chim. Acta,2011, 377, 144.
27 (a) E. García-España, M.-J. Ballester, F. Lloret, J. M. Moratal, J. Fausand A. Bianchi, J. Chem. Soc., Dalton Trans., 1988, 101; (b) M.I. Burguete, E. García-España, L. López-Diago, S. V. Luis, J. F. Miravetand D. Sroczynski, Org. Biomol. Chem., 2007, 5, 1935.
28 P. Gans, A. Sabatini and A. Vacca, Talanta, 1996, 43, 1739.29 L. Alderighi, P. Gans, A. Ienco, D. Peters, A. Sabatini and A. Vacca,
Coord. Chem. Rev., 1999, 184, 311.30 (a) P. K. Glasoe and F. A. Long, J. Phys. Chem., 1960, 64, 188; (b) A.
K. Covington, M. Paabo, R. A. Robinson and R. G. Bates, Anal. Chem.,1968, 40, 700.
31 SAINT, 5.0 ed, Bruker Analytical X-Ray Systems, Madison, WI, 1996.32 G. M. Sheldrick, SHELXTL; 5.1 ed, Bruker Analytical X-Ray Systems,
Madison, WI, 1997.33 L. J. Farrugia, WinGX version 1.64, An Integrated System of Windows
Programs for the Solution, Refinement and Analysis of Single-Crystal X-ray Diffraction Data, Department of Chemistry, University of Glasgow,2003.
34 DIAMOND version 2.1c, Crystal Impact GbR, Bonn, Germany, 1999.
6776 | Dalton Trans., 2012, 41, 6764–6776 This journal is © The Royal Society of Chemistry 2012
Dow
nloa
ded
by U
NIV
ER
SIT
Y O
F A
LA
BA
MA
AT
BIR
MIN
GH
AM
on
20 M
arch
201
3Pu
blis
hed
on 2
8 M
arch
201
2 on
http
://pu
bs.r
sc.o
rg |
doi:1
0.10
39/C
2DT
1245
9A
View Article Online