coping with market power: dairy farmers’ interest in...
TRANSCRIPT

Coping with market power: dairy farmers’ interest in Producers’
Organizations and contracts
Koen Monderlaers1, Myriam Baecke2, Ludwig Lauwers1,2
1 Institute for Agricultural and Fisheries Research (ILVO), Burg. Van Gansberghelaan 115,
9820 Merelbeke, Belgium, [email protected]
2 Ghent University, Coupure Links 653, 9000 Gent, Belgium
Paper prepared for presentation at the EAAE 2014 Congress
‘Agri-Food and Rural Innovations for Healthier Societies’
August 26 to 29, 2014
Ljubljana, Slovenia
Copyright 2014 by Mondelaers, K., Baecke, M. and Lauwers, L. All rights reserved. Readers
may make verbatim copies of this document for non-commercial purposes by any means,
provided that this copyright notice appears on all such copies.

1
Keywords
Dairy farming; market power; producers’ organizations; contracts
Abstract
In 2015 the quota in the dairy sector will no longer be prolonged, as one of the measures to
further liberalize the dairy market. To support farmers in this more volatile market and to
increase their negotiation power, the EU has proposed several measures in a Dairy Package,
amongst which the possibility to form producers’ organizations (POs) and to negotiate
contracts. This paper investigates whether dairy farmers are interested in these POs and
contracts and which elements are to be considered. We focus on the case study Flanders as an
example of an intensive dairy producing and processing region. A mixed method design,
combining qualitative research and choice experiments, was followed. The paper indicates that
there is generally a lack of awareness amongst dairy farmers concerning both the concept of
POs and contracts. Dairy farmers are in favor of POs to negotiate market access, as processors
are against price negotiations. This contradicts the EU objective of empowering the dairy
farmers. Dairy farmers are less interested in contracts and prefer long term relationships with
their buyers.
1 Introduction
The dairy farming sector faces a time of considerable challenges. In 2015, the quota system,
installed since 1984, will no longer be prolonged. Together with other market measures, these
quota resulted in reasonably stable milk prices and milk production volumes until 2006. The
abolishment creates uncertainty concerning the future milk price and future contractual
arrangements. The expected milk surplus could result into further decreasing milk prices. The
further liberalization of the dairy market might also increase the milk price volatility (Van
Winsen et al., 2011). In the past, and most recently in 2009, anxious dairy farmers protested
against low prices and negative profitability. Main issue was their lack of negotiation power in
the dairy chain. By drafting a new Dairy Policy, the EC acknowledged the need of farmers to
have a stronger position in the chain and to have additional market support. A diverse set of
supporting measures is proposed in the Dairy Package.
This Dairy Package amongst other measures offers dairy farmers the possibility to create
producers’ organizations (PO), unions of producers’ organizations (UPO) and branch
organizations (BO). Until recently, this was only possible in certain sectors such as the fruit and
vegetable sector. The general idea is that dairy farmers in group can negotiate the terms of
delivery with buyers, in order to gain more negotiation power. Additionally, until 2020 an
exemption on the Competitive Trading Act is made for the dairy sector, which enables POs to
negotiate the milk price and other terms of delivery without being owner of the product. New
to producers and milk processors is also the possibility to negotiate contracts, on an individual
basis or in group. Many questions raise on how the measures within the Dairy Package will be
implemented in practice and especially, which role dairy farmers have to play. It remains
unclear whether dairy farmers are interested and motivated to cooperate within POs. If so, the
question rises how the functioning of a PO can be organized. Also the interest in and modalities
of contracts in the dairy sector remains unclear.
The objective of this paper is to investigate the potential interest of the dairy sector in the
formation of POs and contracts and to investigate the most desirable PO organizational and

2
contractual arrangements. To do so, we use a mixed method design, combining qualitative and
quantitative research methods. We focus on the case study of Flanders, exemplifying a region
with high concentration of dairy farming and processing activities.
The paper is organized as follows. In a first contextual section we further elaborate the
changes actually occurring in the dairy sector and the dairy policy. The mixed method research
methodology is explained in the subsequent section, followed by a results section. We end with
a discussion and conclusion.
2 Context
2.1 Milk production, today and after 2015
With a production value of 14,2% of the total agricultural and horticultural production, the
dairy sector is an important sector in Flanders (Platteau et al., 2012). The total production in
Flanders accounts for 2% of the European production (Vilt, 2013a). 22% of Flemish farms have
a dairy activity. Since the introduction of the quota system in 1984, the total number of dairy
cows has reduced with 50%, due to both the introduction of the quota system and the increased
productivity per cow. The number of dairy cows per dairy farmer has however increased
dramatically, from 19 to 45. Between 2001 and 2011, the number of dairy farms has reduced
by half, from around 10.000 to 5.000. In 2011 the average milk production per dairy farmer
amounted to 360.400 liter, which means a doubling since 2001. Main reasons are the increase
in number of cows and the increase in productivity per cow on the remaining farms.
It remains unclear to what extend the quota abolishment will induce an increase in milk
production. At the European level, estimates diverge. A study of Campens et al. (2007), indicate
an increase in production ranging between 0,9 and 9%, while the OECD-FAO (2011) projects
an increase of only 0,67%. A study of IPTS (2009) on its turn projects an increase of 4,4%, with
diverging numbers for different regions. The EC (2012) indicates a growth number of 5%
between 2012 and 2022. A large scale questionnaire organized by the Flemish government (Van
der Straeten et al., 2013) on farmers’ expectations after 2015 indicates an average expected
increase in production of 30% for the remaining farmers.
2.2 Milk processing, today and after 2015
In Flanders, the milk processing sector consists of approximately 100 firms, with a small
number of large players and many smaller players. Cooperative milk delivery is the
predominant model, accounting for 60% of the total milk volume (Van der Straeten et al., 2013),
which is comparable with the European number (Bijman et al., 2012). Cooperatives are farmer
driven initiatives to jointly market the milk. The most well-known internationally active
Flemish cooperative is Milcobel. According to Bijman et al. (2012), marketing cooperatives
improve the bargaining power of their members, enable members to benefit from economies of
scale, reduce market risks and transaction costs, provide access to resources, and strengthen
their competitive position through product innovation and guaranteeing food quality and safety.
A large number of cooperatives have expanded their activities in downstream stages of the food
chain, thus strengthening their customer and consumer orientation. The milk processing sector
can be considered as an oligopolistic market, as changes in the buying policy of a single player
induce changes of the other players (De Clercq, 2006). The study of Bijman et al. (2012)
indicates the importance of cooperatives in an oligopolistic market. A higher share of
cooperatives increases the competitiveness in the market and results in a higher dairy milk price

3
for farmers. The study also made clear that private milk processors generally pay more
compared to cooperatives. Cooperatives collect all produced milk of a member, in return for
the farmer’s loyalty, resulting in temporarily surpluses which then need to be diverted to less
profitable markets (such as milk powder for the global market). Private processors will use
contracts or other means to avoid surpluses en can better plan their milk supply.
When the projections of a considerable increase in production after 2015 hold
(Vanderstraeten et al., 2013), the milk processing sector will have to be prepared to process and
market the additional milk. The EC (2012) on its turn projects profitable times for the milk
processing sector as the general demand for milk and dairy products is expected to increase
considerably towards 2022.
2.3 Evolution in milk price formation
As is the case in many other agricultural markets, dairy farmers are price takers. Up to
recently a Ministerial Decree outlined how milk payment is to be organized. A milk processor
has to pay the same basic price for each liter of milk supplied. This basic price follows the
market price and refers to standard milk (fat content of 38g/l and protein content of 33,5 g/l).
Deviations from this basic price can occur, due to a premium system based on fat and protein
content, milk quality or other parameters. In Belgium, the basic price paid by the different milk
processors follows the same trend, but individual differences can be large.
Since 2007, the volatility of the milk price has increased dramatically. One of the main
reasons is the decomposition of the intervention mechanism in the dairy sector after the 2003
Luxembourg Reform (BCZ - CBL, 2012). European milk prices before 2007 surmounted world
market prices and were less volatile. Since 2007, both European and Belgian dairy prices
closely follow world market prices (EC, 2012a). The increased volatility results into a risk
profile of the dairy farms comparable with that of other sectors (Van Winsen et al., 2012).
2.4 Recent evolution in European dairy policy
Due to the considerable price fall in 2008/2009, the market position of dairy farmers
became problematic in 2009. In October, 2009 a High Level Group Milk (HLGM), with
representatives of the different member states, was organized to discuss measures to increase
the farmers’ market power. The participants noted large differences amongst member states
with respect to sector organization, notably concerning the prevalence of contracts and
cooperatives. Despite these differences, their report (EC, 2010) contains a number of general
recommendations to improve the dairy market functioning. The first recommendation relates to
the use of contractual arrangements to better fit demand and supply. Essential elements to be
contained in these arrangements are the price or price formula, the amount of supply, the
delivery time schedule and the contract duration. A second recommendation focuses on the
negotiation power of the primary producers. The HLGM recommended to the EC to investigate
the possibility for farmers to jointly negotiate prices. The volume for which joint negotiation
can be organized is also discussed. The other recommendations are less relevant for this paper.
As a result, the EC launched the Dairy Package in 2012 (EU Nr 261/2012). With respect
to contractual arrangements, the Dairy Package offers the possibility to member states to make
contractual arrangements compulsory between sellers and buyers. A number of basic elements,
described in EU Nr 261/2012, need to be present, but the exact content is freely negotiable. The
contract needs to be drafted prior to the transaction, needs to be written, and contains amongst
others the price, the amount of raw milk and the contract duration. The Dairy Package also
4
states that producers’ organizations (POs) can be formed to jointly negotiate contractual
arrangements. There are a number of additional rules formulated. One is that the group size
may not distort proper market functioning. An important exemption compared to other sectors
is that the PO does not need to own the milk for which it is negotiating. National governments
subsequently translated this Dairy Package into national legislation.
2.5 Prevalence and benefit of POs
Although mainstream in other sectors, POs in dairy sector are still marginal in Flanders.
Currently, two are accepted and one is being negotiated. Milcobel, Belgian’s largest dairy
cooperative, is one of the accepted POs and cannot be considered representative for the private
market.
Lambrechts (2013) identifies the increased negotiation power as the main benefit of PO
membership. Conversely, disadvantages are the investment in organizing the PO, the slow
negotiation process in a PO, the membership cost and diverging member stakes due to size,
quality, geographical or other differences.
As the context description indicates, there are still a lot of uncertainties relating to the
usefulness of POs and contracts for farmers. The exact PO and contractual arrangements
preferred by dairy farmers also remains a question which we investigate further in this paper.
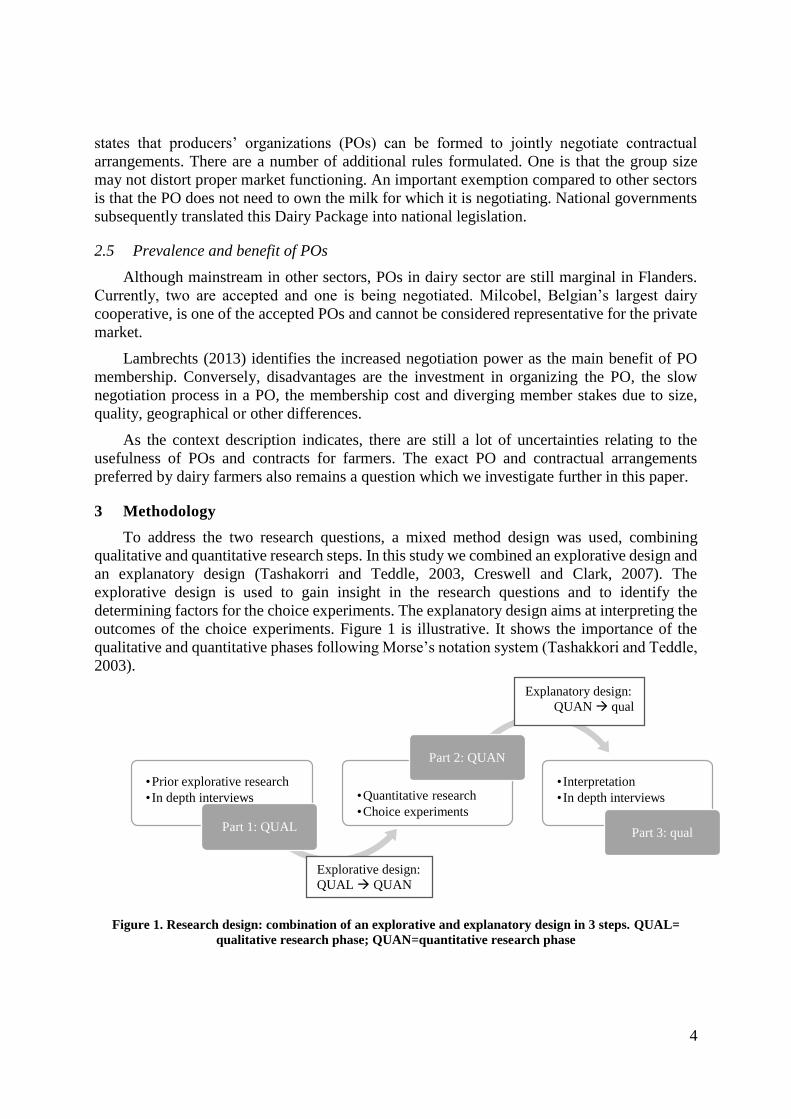
3 Methodology
To address the two research questions, a mixed method design was used, combining
qualitative and quantitative research steps. In this study we combined an explorative design and
an explanatory design (Tashakorri and Teddle, 2003, Creswell and Clark, 2007). The
explorative design is used to gain insight in the research questions and to identify the
determining factors for the choice experiments. The explanatory design aims at interpreting the
outcomes of the choice experiments. Figure 1 is illustrative. It shows the importance of the
qualitative and quantitative phases following Morse’s notation system (Tashakkori and Teddle,
2003).
Figure 1. Research design: combination of an explorative and explanatory design in 3 steps. QUAL=
qualitative research phase; QUAN=quantitative research phase
•Prior explorative research
• In depth interviews
Part 1: QUAL
•Quantitative research
•Choice experiments
Part 2: QUAN
• Interpretation
• In depth interviews
Part 3: qual
Explanatory design:
QUAN qual
Explorative design:
QUAL QUAN

5
3.1 Part 1: explorative research
The explorative research phase aims at understanding the main factors driving the
dynamics in the dairy market and the legislative state of the art. The attributes for the choice
experiments were also identified during these interviews. To identify interviewees with
knowledge concerning the recent changes in the dairy market industrial and legislative
organization, snow ball sampling was used. Both private and cooperative dairy farmers were
questioned, to understand the current dynamics in the market and to identify the choice set
attributes. Policy makers at Flemish and European level were questioned to understand the
current changes in legislation and to get a grip of possible future changes. Stakeholders from
the processing industry helped to understand the types of cooperation and contractual
arrangements that are currently in use and under construction.
3.2 Part 2: choice experiments
The choice experiments, part of a questionnaire, aimed at indicating the preference of dairy
farming for contract attributes and PO membership attributes.
In a stated choice experiment farmers are placed within a hypothetic choice setting
environment in which they are asked to choose from a predefined set of alternatives their most
preferred alternative. The stated choice preference technique allows an ex ante assessment of
both the use and non-use value of the main characteristics of a good or service. To model choice
behaviour by a decision maker, the principles of the Random Utility Theory (McFadden, 1974)
and the Characteristics Theory of Value (Lancaster, 1966) are combined. The latter states that
individuals derive utility from the characteristics (attributes) of the goods rather than directly
from the goods themselves. The random utility hypothesis states that individual agents choose
among the available alternatives the one that maximizes their utility and that the distribution of
choices made in a population is a reflection of the distribution of individual preferences.
Therefore, the probability (Pin) that a farmer n chooses alternative i (which has an attribute
vector Xin) from a choice set of J alternatives (in our research limited to three) can be
represented into:
𝑃𝑖𝑛 = 𝑃(𝑈𝑖𝑛) > 𝑃(𝑈𝑗𝑛)𝑓𝑜𝑟 𝑎𝑙𝑙 𝑗 ≠ 𝑖 (1)
This formula indicates that a farmer will choose alternative i in the choice set only when
this alternative has the highest utility for the farmer, compared to the other alternatives in the
choice set. The utility function U can be further decomposed into a deterministic part (V),
function of the observed factors (the product quality traits incorporated in the experiment), and
a stochastic part (εin). The latter rises from unobservable factors which affect choice,
unobservable taste variations, measurement errors in the explanatory variables in function V
and model specification errors. Because the researcher has no knowledge about εin, these terms
are treated as random, as well as the utility for each alternative. As introduced by McFadden
(1974), the indirect utility function is assumed to be linear in the parameters, and as such, takes
the following form for an individual n facing choice i:
𝑈𝑖𝑛 = 𝛼𝑖𝑛 + 𝛽𝑛′ 𝑥𝑖𝑛 + 𝜀𝑖𝑛 (2)
The deterministic part can be further decomposed into αin, which is the individual n’s
intrinsic preference for choice i, xin the vector of attributes of alternative i in the choice set faced
by n and βn the vector of choice parameters, which are the weights associated with the attributes
xin. Depending on the assumptions about the error term, different models can be derived. The

6
most general (and restrictive) model, the multinomial logit model, assumes an identical and
independently distributed (iid) Gumbel distributed error term (Train, 2003 in Liljenstolpe,
2003), with the following choice probability:
𝑃𝑖𝑛 =𝑒𝛼𝑖𝑛+𝛽𝑛
′ 𝑥𝑖𝑛
∑ 𝑒𝛼𝑗𝑛+𝛽𝑛
′ 𝑥𝑗𝑛𝑗
(3)
As described by Liljenstolpe et al. (2003), the conditional multinomial logit probability
takes a closed form between 0 and 1, and the unconditional multinomial logit probability is
derived by summing over all respondents and choices:
𝐿𝐿(𝛼𝑖𝑛, 𝛽𝑛) = ∑ ∑ 𝑦𝑖𝑛𝐼𝑖=1
𝑁𝑛=1 ln 𝑃𝑖𝑛 (4)
The dummy variable yin takes value 1 for the chosen alternative and 0 for the non-chosen
alternatives. From the first order condition of the log-likelihood function, the model coefficients
can be estimated.
The choice experiment attributes are presented in the results section, together with the
simulation results. For both experiments, an orthogonal main effects plan was generated with a
blocking design. The experiment on PO attributes is generic, while the experiment on
contractual arrangements is alternative specific, with different types of contracts as alternatives.
Both experiments consisted of 18 choice sets blocked into 6 choice sets per respondent. Each
choice set contained 3 alternatives with an additional opt-out choice.
66 dairy farmers completed a valid questionnaire. The sample characteristics largely reflect
the population, but due to the small sample size results are to be considered indicative. The
sample contains both private (58%) and cooperative suppliers (42%), in line with the population
percentages. The choice experiments were pretested with 3 dairy farmers.
3.3 Part 3: explanatory research
Additional in-depth interviews with several farmers, an industry representative and a policy
maker were conducted to validate the interpretation of the choice experiment outcomes and to
discuss current dynamics in market and policy.
4 Results
4.1 Part 1: Explorative research
Interviewed dairy farmers indicate that they are expanding or preparing to expand their
production, albeit at a conservative rate, as they are uncertain how the price volatility and buyer
policy will evolve post 2015. They furthermore indicate that the perceived 30% increase in
production (Vanderstraeten et al., 2013) is a strong overstatement, due to practical limitations
such as obtaining loans, manure deposition legislation and lack of space. Milk processors in
general also indicate that they are drafting plans to expand their processing volume. This is also
indicated by the current record amount of investments in the sector (Vilt, 2013f).
They are generally aware of the term PO, which they encountered during reunions or in
professional magazines. How they could benefit from PO participation however, was largely
unclear. They currently take an awaiting stance and do not seek additional information.
Interestingly, they indicated that the dairy farmers will not take the initiative to form POs. Main
reasons mentioned are lack of time and expertise, the loss of independence and the problems
with conflicting stakes. These latter are also reasons why private suppliers are not member of a

7
cooperative. The interviewees also do not expect that the PO can negotiate higher prices, as
they believe that the processor will still set the price.
Dairy processors on their turn believe that POs can reduce transaction costs as they do not
have to negotiate with each farmer. A better farmer price is however not expected as the
processors are also dependent on the remainder of chain partners. Some processors advocate
full transparency of farm accountancy data, to determine a suitable price for the farmers.
The interviewed dairy farmers link contracts with the spot market. The negative experience
of fellow producers with this spot market and the difficulties to restore the relationship with
their processor afterwards, exemplify why they prefer a stable relationship with their processor.
They believe that the use of contracts with processors is mainly interesting for farmers with
high investment costs and low reserves. They however also indicate interest in how these
contracts could look like. The contradiction that a dairy farmer prefers contracts in a period of
low prices while he would better negotiate a contract during high prices was also mentioned.
Dairy processors are, contrary to cooperatives, not opposed to the use of contracts. They were
however not keen on sharing their specific plans.
4.2 Part 2: Choice experiments
The first choice experiment focuses on which PO-attributes are preferred by the dairy
farmers. The following attributes were retained after the exploratory research phase and the
pretesting (Table 1):
Table 1. Attributes and levels for choice experiment on POs
Attribute Attribute levels
Type of PO 1 PO per processor / > 1 PO per processor / 1 PO for several processors
Membership of PO depends on Region / Volume / No restriction
Membership contribution € 0 / € 300 / € 600 per year
PO can negotiate about Price / price and volume / all delivery terms
Contracts offered by PO 1 / 2 / 3
Mandatory supply through PO A famer’s total volume / A fixed volume per farmer / Free choice for the
farmer
The second alternative specific choice experiment focuses on the farmers’ preferred
contractual arrangements. Table 2 summarizes the alternatives, the attributes and attribute
levels. In this experiment, attribute 1 did not occur for the ‘variable price’-alternative, while
attribute 2 did not occur for the ‘fixed price’-alternative.
Table 2. Attributes and levels for choice experiment on contractual arrangements
Alternatives Attribute Attribute levels
Fixed price Basic price1 0,32€/l / 0,33€/l / 0,34€/l
Variable price Monthly variable price
based on2
world market prices / resource prices / combination
Semi-variable price Volume based on production planning / unlimited / historical quota
Contract duration 6 months / 12 months
Negotiated By PO / farmer / free choice 1: this attribute did not occur for alternative Variable price 2: this attribute did not occur for alternative Fixed price
We first highlight some findings from the questionnaire before switching to the choice
experiments. Of the sample, 64,6% indicates to plan to expand the milk production, which
confirms the 70% indicated in Vanderstraeten et al. (2013). The majority of farmers (64%)
wants to remain loyal to their current buyer. When focusing on the private suppliers, nearly
50% wants to continue the current arrangement with their supplier. 23% wants to switch to

8
contracts negotiated by POs while a minority (9%) wants individual contracts with their
supplier. The remainder either want to deliver to cooperatives or switch between suppliers. The
added value of a PO remains a question, with 64% indicating ‘maybe’ or ‘insufficiently
informed’. Large dairy farm owners are also more sceptic compared to their smaller
counterparts.
For the first choice experiment, the attributes ‘membership contribution’ and ‘number of
contracts’ are assumed linear. The model also does not assume interaction effects. The
LogLikelihood is -514,9.
Table 3. Estimation of coefficients for Choice Experiment 1 on POs
Attribute Coefficient Standard-
error
p-value 95 % confidence interval
Type of PO
1 PO per processor 0.29271*** 0.09061 0.0012 0.11511 0.47031
> 1 PO per processor -0.24846** 0.09993 0.0129 -0.44432 0.05260
1 PO for several
processors
-0.04425 0.10244 0.6658 -0.24503 0.15653
Membership of PO depends on
Region -0.03765 0.10731 0.7257 -0.24796 0.17267
Volume 0.07972 0.12116 0.5106 -0.15775 0.31718
No restriction -0.04207 0.10393 0.6856 -0.24576 0.16162
Membership contribution
Yearly contribution -0.00126*** 0.00030 0.0000 -0.00185 -0.00067
PO can negotiate about
Price -0.33801*** 0.11097 0.0023 -0.55551 -0.12052
Price and volume 0.08302 0.10994 0.4502 -0.13246 0.29850
All delivery terms 0.25500*** 0.09437 0.0069 0.07003 0.43996
Number of contracts offered by PO
Number of contracts 0.14394* 0.08524 0.0913 -0.02313 0.31102
Mandatory supply through PO
A farmer’s total volume 0.05731 0.10884 0.5985 -0.15601 0.27063
Fixed volume -0.18852* 0.09814 0.0547 -0.38088 0.00383
Free choice for farmer 0.13121 0.11999 0.2742 -0.10397 0.36639
Non Choice -0.17755 0.22731 0.4348 -0.62306 0.26797
*,**,*** indicate significances at the 10%,5% and 1% level
The non-choice is insignificant, indicating that the dairy farmers were not diverted to this
choice option. This confirms the prior statement that dairy farmers are not yet certain whether
they will or will not join POs should these be formed in their vicinity.
The dairy farmers generally prefer a single PO per processor, which is also in line what is
currently proposed in the sector. They are opposed to more than 1 PO per processor, as this
would probably mean that the PO’s would become competitors, reducing the added value of
horizontal cooperation.
The respondents are seemingly indifferent whether the membership of a PO is based on
similar amounts of traded volumes, being located in the same region or no additional criteria.
Given the small sample size, there is a slight indication that membership based on volume is
preferred compared to the other. Milk processors give price premiums depending on the
volume. The more homogenous the members are, the easier it is for the PO to negotiate delivery
terms which are supported by its different members.

9
As could be expected, the preference for a yearly contribution is negative and significant.
Farmers indicated to prefer a system in which the functioning of the PO is subsidized by the
government or the milk processor.
The respondents clearly favor a PO that can negotiate all delivery terms, as opposed to a
PO that can only negotiate the price. It is indeed the combination of all the delivery terms that
determines whether a negotiation turns out favorable or not for the farmers.
According to the respondents, a PO should negotiate different contracts with the processor.
As such, one of the disadvantages of negotiations through POs, the conflicting member stakes,
could better be accommodated.
The farmers are generally opposed to a fixed part of the total volume to be marketed
through the PO. This is understandable, as this would mean that they still have to negotiate for
the remainder part, which would again increase their vulnerability, hence opposing to the idea
behind PO formation.
The second model focuses on the preference of dairy farmers for alternative contractual
arrangements. The first alternative is a contract with a fixed price, the second a contract with a
variable price and the third a contract with a semi-variable price, i.e. part of the price is fixed
and part of the price variable. The latter reflects the current option discussed in the market to
work with A-prices for the negotiated volume and B-prices for the surplus volumes. Attributes
‘basic price’ and ‘contract duration’ are assumed linear and continuous. The LogLikelihood of
the model is -505,4.
Table 4. Estimation of coefficients for Choice Experiment 2 on contractual arrangements
Attribute Coefficient Standard-
error
p-value 95 % confidence interval
Alternatives
Fixed price contract -9.43037** 3.79600 0.0130 -16.87038 -1.99035
Variable price contract -0.83367*** 0.30055 0.0055 -1.42272 -0.24461
Semi variable price contract -8.53361** 3.78151 0.0240 -15.94522 -1.12199
Basic price
Basic price 0.26144** 0.11323 0.0209 .03951 0.48338
Monthly variable price based on
Resource prices -0.08689 0.11995 0.4688 -0.32200 0.14821
World market prices 0.13801 0.12776 0.2801 -0.11240 0.38841
Combination -0.05111 0.12230 0.6760 -0.29082 0.18860
Volume based on
Unlimited 0.50897*** 0.09767 0.0000 0.31753 0.70040
Historical quota -0.51913*** 0.11516 0.0000 -0.74483 -0.29342
Production planning 0.01016 0.10034 0.9193 -0.18650 0.20682
Contract duration
Contract duration 0.02362 0.02454 0.3359 -0.02449 0.07173
Contract negotiated by
PO 0.21892* 0.11399 0.0548 -0.00449 0.44233
Farmer -0.18736* 0.10508 0.0746 -0.39332 0.01860
Free choice -0.03156 0.11792 0.7890 -0.26268 0.19956
*,**,*** indicate significances at the 10%,5% and 1% level
The ‘non-choice’ is more popular in this model (27% of choices). When analyzing the
alternative specific constants, negative and significant values are obtained for the three
alternatives, compared to the non-choice. Dairy farmers already indicated in the exploratory
phase and questionnaire that they prefer not to work with contracts. They thus prefer a system

10
in which the individual or PO can negotiate with the processor, albeit not with contracts but on
a monthly basis, as in the current system. When comparing the 3 alternatives, there seems a
preference for the variable price contract compared to the fixed or semi-variable contract. The
reason can be twofold. Either the prices in the experiment are an underestimation of the prices
farmers expect, or the farmers are not risk averse and prefer a market situation in which they
can strategically manage periods with high and low prices.
With respect to the contract attributes, as can be expected, the farmers prefer a higher basic
price. The ‘variable price’-attribute levels are not significant, probably indicating that farmers
also want to consider other elements to determine the variable price. With respect to volume,
the farmers want to be able to supply all their production to the processor, and strongly oppose
against volumes based on the historical quota. The farmers also indicate a slight preference for
contracts negotiated by POs as opposed to individually negotiated contracts.
Other types of models, such as latent class or nested models, were also tested but do not
add to the general understanding.
The questionnaire ended with questions on whether farmers would consider joining a PO
when formed in their vicinity, now that they completed the survey. More than 50% of the private
dairy farmers indicated affirmative, while 43% indicted to be inconclusive. Only 6% opposed
to the idea. On the question whether they would consider contracts, we see a shift compared to
the question posed prior to the choice experiments, in favor of considering contracts. 30% still
opposed to the idea, while 40% of the respondents now indicated to consider the option. The
remainder indicated to be in favor of contracts. These responses seem to confirm the idea that
dairy farmers are generally unaware of both the concept of POs and contracts and that additional
information can help to better consider their choice options.
4.3 Part 3: Explanatory phase
In this qualitative phase, we first explored why the dairy farmers seem to sometimes
contradict their own statements. The interviewed farmers indicated that for most of the dairy
farmers, POs and contracts are still a vague concept not yet relevant for their farm. There is also
a general lack of understanding of the concepts, with biased information depending on the
information source, making it difficult for the farmer to assess the added value. It is also clear
that cooperative farmers are less aware of the possibilities of POs and contracts as this is less
relevant compared to private farmers.
The interviews also confirmed that during the period of the questionnaire, the milk price
was considerably higher (the highest in 5 years, between 37 and 42 cents/l) than the price in the
experiment, which was based on the average 2012/2013 price, which might be an explanation
for the farmers’ averseness for a fixed price contract.
With respect to the process of PO-formation, an interprofessional agreement was achieved
that per processor only a single PO would be formed, which is in line with the outcome in our
experiment.
Interestingly, the main actors in the process of PO-formation are not the farmers, but the
farmers’ unions and especially the processors. This seems to contradict the European objective
to further empower the famers. Farmers also raise questions with respect to the governance of
POs, the democratic process and the necessary time investment.

11
5 Discussion and conclusion
The different research phases clearly indicate that dairy farmers still lack knowledge
concerning the concept of POs and contracts. The research also indicates that, the more the
dairy farmers are acquainted with the concepts, the higher their willingness to apply them.
Willingness to cooperate between farmers is also an important factor for successful PO
formation. While 40% already cooperate in cooperatives, the group of private dairy farmers is
divided. Joining a PO means making a trade-off between losing independency and increasing
negotiation power. For some farmers, remaining independent is primordial, hence it is not be
expected that the dairy landscape will only contain POs and cooperatives. For POs to be
successful, it is important that sufficient dairy farmers are willing to join. Our research seems
to indicate that amongst the private farmers, there is enough interest to achieve this.
The Dairy Package has brought producers, producer unions and milk processors together
around the negotiation table, which is new. Farmers experience this as positive, so it can be
considered as a first merit of the new Package. The research made clear that both producers and
processor favor sustainable relationships, which is logic given their interdependence. Less
favorable is that the interviews made clear that processors are not keen on letting POs codecide
on the dairy price. This means that the objective of the Dairy Package, to further empower the
dairy farmers, will not be met. Producers also indicate that they first of all want that processors
guarantee that all milk will be accepted, also after 2015. They thus favor market access above
price negotiation. The fact that POs are not initiated by farmers, but farmers’ unions and
processors, is also indicative, especially given that the unions and the processing industry first
had interprofessional negotiations. The processors also indicate that they want to be involved
in the process of PO formation.
With respect to contracts, farmers predominantly fear the involved transaction costs
(negotiating the contract, renewing the contract etc) which divert them from their core business.
They prefer a long term relationship with temporarily renegotiable delivery terms to create a
stable investment environment.
6 References
BCZ – CBL. (2013). Jaarverslag 2013 Werkingsjaar 2012. 58 p.
Bijman, J., Gijselinckx, C., Hagedorn, K., Hanisch, M., Hendrikse, G.W.J., Ilipoulos, C., Külh,
R., Ollila, P., Poppe, K.J., Pyykkönen, P., & Van Der Sangen, G. (2012). Support for Farmers’
Cooperatives. European Commission, 127 p.
Campens, V., Gavilan, J., & Carels, K. (2007). Een verkenning van de Vlaamse melksector na
2015. Vlaamse Overheid, Beleidsdomein Landbouw en Visserij, Afdeling Monitoring en Studie
(AMS), 60 p.
De Clercq, M. (2006). Economie toegelicht. Antwerpen – Apeldoorn, Garant, 721 p.
EC (2010). Evolution of the market situation and the consequent conditions for smoothly
phasing out the milk quota system. Report from the European Commission to the European
Parliament and the Council. Brussels. 17 p.
EC (2012). Prospects for Agricultural Markets and Income in the EU 2012-2022. European
Commission, 117p.
OECD-FAO (2011). Agricultural Outlook 2011-2020. Chapter 9, Dairy. 157-173.

12
IPTS. (2009). Economic Impact of the Abolition of the Milk Quota Regime. – Regional
Analysis of the Milk Production in the EU -. Prepared by IPTS with the collaboration of
EuroCARE GmbH, Bonn. Seville, Institute for Prospective Technological Studies, European
Commission. 110 p.
High Level Group on Milk. (2010). Report of the High Level Group on Milk. 52 p.
Lambrechts, G. (2013). Coöperaties en producentenorganisaties. Een Doorlichting.
Beleidsdomein Landbouw en Visserij, Vlaamse Overheid. 118 p.
Lancaster , K.J. (1966). A new approach to consumer theory. Journal of Political Economy, 74,
132 – 157.
Liljenstolpe, C. (2005). Valuing animal welfare with choice experiments: An application to
Swedish pig production. Paper prepared for presentation at the 99th seminar of the EAAE, KVL
Copenhagen, Denmark, August 24-27, 2005.
McFadden, D. (1973). Conditional logit analysis of qualitative choice behavior. In P. Zarembka
(Ed.), Frontiers of econometrics (pp. 105–142). New York: Academic Press.
Platteau, J., Van Gijseghem, D., Van Bogaert, T. & Maertens E. (2013). Landbouwrapport
2012. Brussel, Vlaamse Overheid, Departement Landbouw en Visserij. 441 p.
Tashakkori, A. & Teddlie, C. (2003). Handbook of mixed methods in social & behavioral
research. California, SAGE Publications, Inc. 771 p.
Van Der Straeten B., Deuninck J. & Van Gijseghem D. (2012). De melkproductie in Vlaanderen
na 2015. Vlaamse Overheid, Beleidsdomein Landbouw en Visserij, afdeling Monitoring en
Studie, Brussel, 96 p.
VILT. (2013a). Veranderende zuivelmarkt vraagt aanpassing industrie.
http://www.vilt.be/Veranderende_zuivelmarkt_vraagt_aanpassing_industrie. Gelezen op 20
maart 2013.
VILT. (2013b). Zuivelindustrie investeerde als nooit tevoren.
http://www.vilt.be/Zuivelindustrie_investeerde_als_nooit_tevoren. Gelezen op 25 09 2013.
Van Winsen, F., De Mey, Y., Wauters, E., Lauwers, L., Van Passel, S., & Vancauteren, M.
(2011). Een volatiele melkprijs: Het effect op het risicoprofiel van melkveebedrijven. Vlaamse
Overheid, ILVO. 35 p.