cop7 clean energy
DESCRIPTION
Clean EnergyTRANSCRIPT
Clean Energy for Development and Economic Growth: Biomass and Other Renewable Energy Options to Meet Energy and
Development Needs in Poor Nations
Daniel M. Kammen1,2,3, Robert Bailis1,2 and Antonia V. Herzog1,2
1Renewable and Appropriate Energy Laboratory (RAEL)2Energy and Resources Group
3Goldman School of Public PolicyUniversity of California, Berkeley USA
Policy Discussion Paper for the Environmentally Sustainable Development Group(ESDG) of the United Nations Development Programme (UNDP), and the
Climate Change Clean Development Mechanism (CDM)for
Distribution at the Seventh Conference of the Parties/15th session of the Subsidiary Bodies to the Parties to the UNFCCC,
29 October - 9 November 2001, Marrakech, Morocco
Address Correspondence to:Professor Daniel M. KammenDirector, Renewable and Appropriate Energy Laboratory, Energy and Resources GroupUniversity of California, Berkeley, CA 94720-3050 USA.Tel: +1-510-642-1640Fax: +1-510-642-1085Email: [email protected]: http://socrates.berkeley.edu/~rael & http://socrates.berkeley.edu/~dkammen

Table of contents
Acknowledgements........................................................................................................................5
Notes on authors……………………………………………………………………………………
Abbreviations used in the text......................................................................................................5
Executive summary.......................................................................................................................5
Introduction: Renewable energy, global warming and sustainable development.................11
1 Energy and the poor.............................................................................................................14
1.1 Rural-urban energy linkages............................................................................................16
1.1.1 Urbanization and increased pressure on the rural resource base..............................16
1.1.2 Urbanization and changing energy demands............................................................17
1.1.3 The social costs of urbanization................................................................................17
1.2 The energy mix in urban and rural areas.........................................................................18
1.3 The 'energy ladder' and household fuel switching..........................................................18
1.4 Energy services for the poor............................................................................................19
1.4.1 Traditional energy supplies.......................................................................................20
1.4.2 Commercial energy supplies.....................................................................................21
1.4.3 Energy service companies (ESCOs).........................................................................22
1.4.4 Reaching the poorest with RESCOs.........................................................................24
1.5 Energy and the poor: Conclusions...................................................................................24
2 Biomass (Energy) for household use: Resources and impacts..........................................26
2.1 Sources of household biomass........................................................................................26
2.2 Impacts of household biomass use in LDCs...................................................................26
2.2.1 Biomass and society: Gender, fuel and resource control..........................................27
2.2.2 Environmental impacts of household biomass use...................................................28
2.2.3 Health impacts of household biomass combustion...................................................30
2.3 Household use of biomass: Conclusions.........................................................................32
Address Correspondence to:Professor Daniel M. KammenDirector, Renewable and Appropriate Energy Laboratory, Energy and Resources GroupUniversity of California, Berkeley, CA 94720-3050 USA.Tel: +1-510-642-1640Fax: +1-510-642-1085Email: [email protected]: http://socrates.berkeley.edu/~rael & http://socrates.berkeley.edu/~dkammen
Kammen, Bailis & Herzog: Clean Energy for Development - October 17,, 2001
3 Biomass energy beyond the household: Scaling up........................................................34
3.1 Small and medium commercial businesses and institutions...........................................34
3.2 Potential to transform commercial and institutional biomass-based energy systems.....36
3.2.1 Liquid fuels from biomass: the case of ethanol........................................................37
3.2.3 Energy from woody biomass – an example from California....................................38
3.2.3 Supply of biomass for commercial and industrial use in LDCs...............................39
3.2.4 Jobs in the commercial biomass sector.....................................................................40
3.2.5 Environmental impacts of medium and large-scale biomass utilization...................40
3.3 Scaling up: Conclusion....................................................................................................42
4 Biomass energy conversion technologies.........................................................................43
4.1 Combustion.....................................................................................................................43
4.2 Gasification.....................................................................................................................44
4.3 Anaerobic digestion........................................................................................................45
4.4 Liquid biofuels................................................................................................................46
4.5 Bioenergy conversion technologies: Conclusions..........................................................47
5 Renewable energy technologies: Markets and costs..........................................................48
5.1 Recent progress in renewable energy system cost and performance.............................48
5.2 Lessons learned in developing countries........................................................................50
5.3 Levelling the playing field.............................................................................................51
5.3.1 Public and private sector investment issues.............................................................51
5.3.2 Market transformations............................................................................................51
5.4 RET markets and costs: Conclusions.............................................................................53
6 Biomass, bioenergy and climate change mitigation........................................................55
6.1 CDM: explicit link between climate change mitigation & sustainable development....56
6.2 Energy projects in the CDM: The critical issues............................................................58
6.2.1 Additionality and baselines......................................................................................58
6.2.2 Leakage and permanence.........................................................................................59
6.2.3 Social and environmental impacts...........................................................................59
6.3 Public participation in project development and implementation..................................62
6.4 Project management.......................................................................................................63
6.5 Equity.............................................................................................................................63
6.6 Technology transfer and capacity building....................................................................64
Conclusion....................................................................................................................................66
04/21/23 Page 3 of 121

Kammen, Bailis & Herzog: Clean Energy for Development - October 17,, 2001
References.....................................................................................................................................67
Case Study 1: Modular biopower for community-scale enterprise development..................99
Case Study 2: Scaling-up biogas technology in Nepal............................................................102
Case Study 3: Commercial production of charcoal briquettes from waste.........................105
Case Study 4: Ethanol in Brazil...............................................................................................108
Case Study 5: Carbon from urban woodfuels in the West African Sahel............................113
Case Study 6: Sustainable fuelwood use through efficient cookstoves in rural Mexico.....116
04/21/23 Page 4 of 121
Acknowledgments
The authors would like to thank our colleagues at the University of California at Berkeley: Barbara Haya, John-O Niles, Tracey Osborne, and Sergio Pacca of the Energy and Resources Group, Sumi Mehta and David Pennise of the School of Public Health and Laura Kueppers of the Department of Environmental Science Policy and Management for useful discussions and contributions. We also thank each of the case study authors for the quality and the speed with which they were able to assemble their material. In addition, Sivan Kartha and Rick Duke both provided an invaluable set of observations and recommendations. Finally, we thank Richard Hosier, Arun Kashyap and other members of the Environmentally Sustainable Development Group of the United Nations Development Programme (UNDP), who provided useful comments on earlier drafts. Needless to say, any errors and omissions are the sole responsibility of the authors.
Page 5 of 121
Notes on the authors
Daniel M. Kammen is a Professor in the Energy and Resources Group, in the Goldman School of Public Policy, and in the Department of Nuclear Engineering at the University of California, Berkeley. He is the Founding Director of the Renewable and Appropriate Energy Laboratory (http://socrates.berkeley.edu/~rael). Dr. Kammen received his Ph.D. in physics from Harvard University, and has been on the faculty of the Woodrow Wilson School of Public and International Affairs at Princeton University where he chaired the Science, Technology and Environmental Policy Program. His research ranges widely over many aspects of energy use, impacts and development, in both developed and developing nations. Email: [email protected]
Robert Bailis is a doctoral student in the Energy and Resources Group. His research is focused on biomass energy resources and community empowerment in Africa. He has undergraduate and masters degrees in physics and spent two years as a Peace Corps Volunteer teaching Math and Physics at a small rural secondary school in northwestern Kenya. Email: [email protected]
Antonia V. Herzog received her Ph.D. in physics from the University of California, San Diego, in 1996. She then worked in Washington, DC, on energy and environmental policy and was awarded the 1998-1999 American Physical Society Congressional Science Fellowship. She is currently a 2000-2002 University of California President's Postdoctoral Fellow in the Renewable and Appropriate Energy Laboratory (RAEL) and the Energy and Resources Group at the University of California, Berkeley. Her work is focused on energy and development issues, federal and international energy policy, and the politics of global warming. Email: [email protected]
Case Study Authors:
1. Art Lilley, Community Power Corporation [email protected]. Bikash Pandey, Winrock International, Kathmandu, Nepal [email protected]. Elsen Karstad and Matthew Owen, Chardust Inc., Nairobi, Kenya [email protected]. Robert Bailis, Energy and Resources Group, UC Berkeley [email protected]. Jesse Ribot, World Resources Institute, Washington, DC [email protected] 6. Omar Masera Cerutti [email protected]
Page 6 of 121
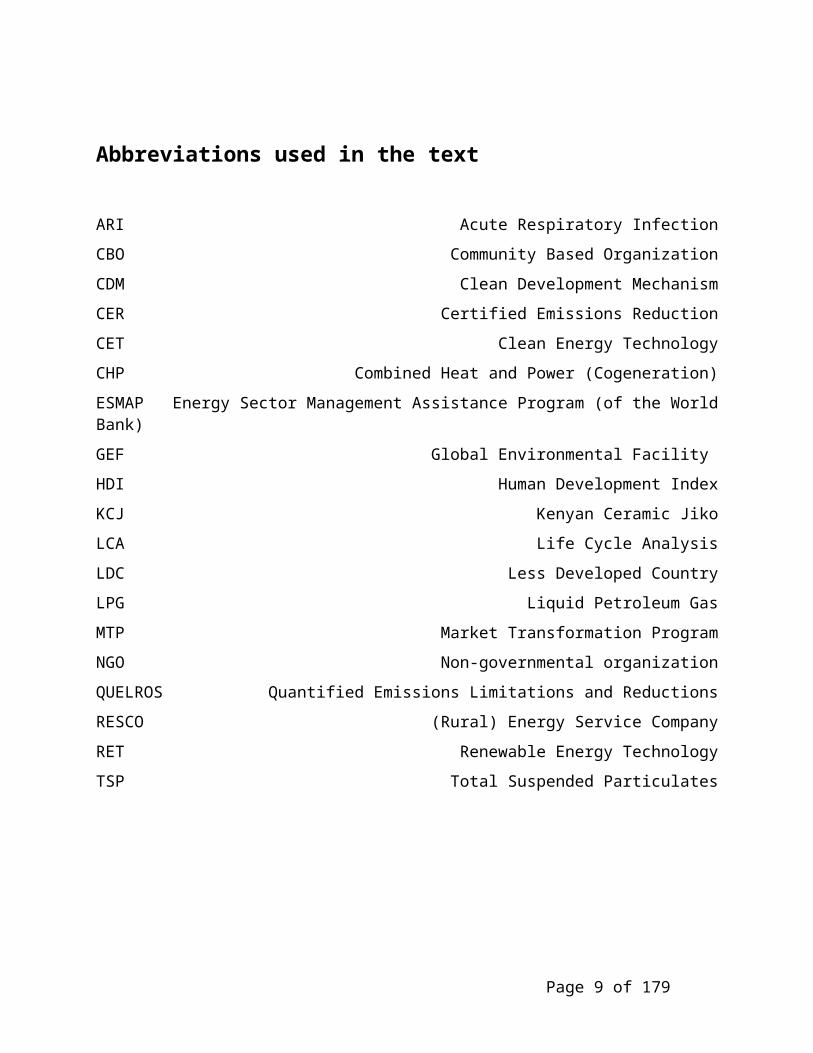
Abbreviations used in the text
ARI Acute Respiratory Infection
CBO Community Based Organization
CDM Clean Development Mechanism
CER Certified Emissions Reduction
CET Clean Energy Technology
CHP Combined Heat and Power (Cogeneration)
ESMAP Energy Sector Management Assistance Program (of the World Bank)
GEF Global Environmental Facility
HDI Human Development Index
KCJ Kenyan Ceramic Jiko
LCA Life Cycle Analysis
LDC Less Developed Country
LPG Liquid Petroleum Gas
MTP Market Transformation Program
NGO Non-governmental organization
QUELROS Quantified Emissions Limitations and Reductions
RESCO (Rural) Energy Service Company
RET Renewable Energy Technology
TSP Total Suspended Particulates
UNDP United Nations Development Programme
Page 7 of 121

Executive summary
This paper explores the linkages between renewable energy, poverty alleviation, sustainable development, and climate change in developing countries. While our discussion includes all types of renewable energy technology, we place special emphasis on biomass-based energy systems. Biomass energy has a number of unique attributes that make it particularly suitable to climate change mitigation and community development applications. In many developing countries, the lack of access to convenient and efficient energy services is a major barrier to achieving meaningful and long-lasting solutions to poverty. Of course, providing quality energy services will not, in itself, eliminate poverty. Nevertheless, when poor people and communities obtain access to convenient and efficient energy services, one major barrier to poverty reduction can be lowered or removed. Biomass is the dominant form of energy in many nations, and estimates of the potential for large-scale use of biomass range from one quarter the total global supply to well over half of that in the poorer, industrializing nations. Coupled with other sectoral transformations – for example, increased access to credit, technical training, health services, and fair markets –, access to modern energy services can enable the poor to expand their productive capacities and enjoy a better quality of life.
Energy service provision is not without problems. Energy generation can be costly in both economic and environmental terms. To date, most developing countries have financed their energy sectors with loans from bilateral and multilateral lending institutions. For various reasons, these institutions have heavily favoured fossil fuel and large hydroelectric power, which have left developing countries with large burdens of debt and taken a significant toll on the local and global environment, while providing only a small fraction of people with adequate energy services. Recent technical advances in renewable energy-based power generation, accompanied by rapid growth in production and dramatic reductions in costs, place renewable energy technologies, including biomass, in a favorable position over conventional fossil fuel systems in an ever-expanding variety of applications. However, there still remain numerous technical, social, and market barriers on local as well as global levels, preventing wider deployment of renewable energy systems. Such barriers must be understood and dismantled in order to take advantage of the social and environmental benefits of a shift from conventional to renewable technologies.
This is especially relevant today, when we are faced with undeniable evidence of climate change due to the build-up of anthropogenic greenhouse gases. Nearly every nation has recognized climate change as a crucial problem which calls for immediate action. However, many are reluctant to take action out of fear that economic disadvantage might result, particularly if competing nations do not act simultaneously to reduce greenhouse gas (GHG) emissions. Currently, three fourths of the net flux of greenhouse gases to the atmosphere are the result of fossil fuel combustion – the equivalent of over 6 billion tons of carbon in the form of CO2. Over two thirds of those emissions come from industrialized countries, but greenhouse gas emissions are increasing in developing countries much faster than in industrialized countries as a result of growth in both population and national economies. If developing countries follow the path taken
Page 8 of 121
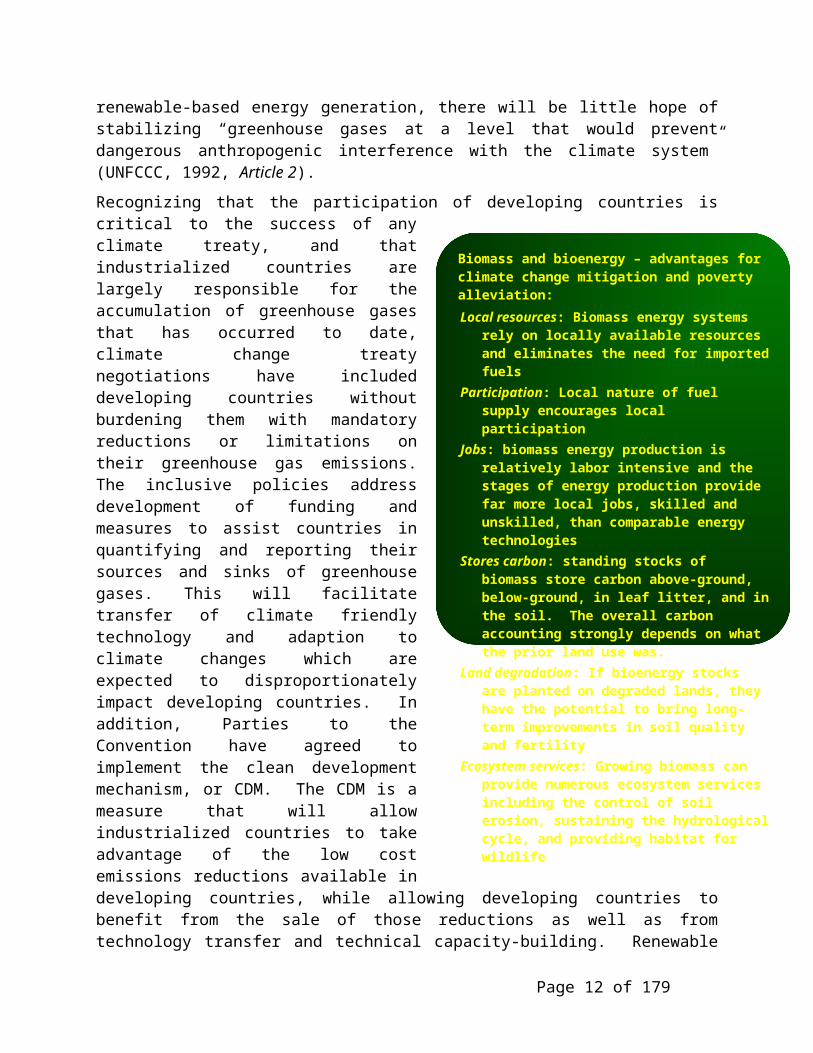
Biomass and bioenergy – advantages for climate change mitigation and poverty alleviation:
Local resources: Biomass energy systems rely on locally available resources and eliminates the need for imported fuels
Participation: Local nature of fuel supply encourages local participation
Jobs: biomass energy production is relatively labor intensive and the stages of energy production provide far more local jobs, skilled and unskilled, than comparable energy technologies
Stores carbon: standing stocks of biomass store carbon above-ground, below-ground, in leaf litter, and in the soil. The overall carbon accounting strongly depends on what the prior land use was.
Land degradation: If bioenergy stocks are planted on degraded lands, they have the potential to bring long-term improvements in soil quality and fertility
Ecosystem services: Growing biomass can provide numerous ecosystem services including the control of soil erosion, sustaining the hydrological cycle, and providing habitat for wildlife
by industrialized countries in building energy generation infrastructure, they will likely exceed industrialized countries in net greenhouse gas emissions within one or two generations. And if that path continues without a significant shift toward renewable-based energy generation, there will be little hope of stabilizing “greenhouse gases at a level that would prevent dangerous anthropogenic interference with the climate system” (UNFCCC, 1992, Article 2).
Recognizing that the participation of developing countries is critical to the success of any climate treaty, and that industrialized countries are largely responsible for the accumulation of greenhouse gases that has occurred to date, climate change treaty negotiations have included developing countries without burdening them with mandatory reductions or limitations on their greenhouse gas emissions. The inclusive policies address development of funding and measures to assist countries in quantifying and reporting their sources and sinks of greenhouse gases. This will facilitate transfer of climate friendly technology and adaption to climate changes which are expected to disproportionately impact developing countries. In addition, Parties to the Convention have agreed to implement the clean development mechanism, or CDM. The CDM is a measure that will allow industrialized countries to take advantage of the low cost emissions reductions available in developing countries, while allowing developing countries to benefit from the sale of those reductions as well as from technology transfer and technical capacity-building. Renewable energy sources provide a critical bridge in this debate. Electricity generated from biomass energy is now cost-competitive with fossil fuels in some areas, and nearly so in others. Biomass is used in power generation and vehicle fuels in both developed and developing nations. Both markets are expanding, and can be mutually supportive.
Climate change mitigation measures in developing countries will likely focus on the energy or land-use sectors. While other sectors, such as industry, transportation, and waste treatment, provide potential emissions reductions, they are unlikely to make effective strides toward poverty alleviation, and will not be addressed here. This paper focuses more on energy than on land use, though by placing emphasis on bioenergy, we have brought land use issues directly to the fore. All types of renewable energy technologies provide opportunities to reduce greenhouse gas emissions, but bioenergy, which is tied into nature’s own carbon cycle, involves land use in the most direct way. Unlike a barrel of oil or an array of solar panels, which are only sources of energy, a stand of trees represents a carbon-neutral fuel source. If the trees are left standing rather than burned, they are a reservoir of sequestered carbon. In truth, a stand of trees has many uses, some of which are potentially conflicting. In addition to a fuel supply and a
Page 9 of 121
potential carbon reservoir, the stand of trees can be a potential source of non-timber forest products, a reservoir of biodiversity and traditional medicines, a soil protector and soil quality manager, a windbreak and a shade provider, a water processor on a grand scale – the list continues. And critically, it performs all of these functions, at little or no cost, for the world’s poorest communities. (See Box, at right, for a description of some of the benefits that biomass and bioenergy provide to communities.)
Between two and three billion people – one third to half of the world’s population – rely on biomass to satisfy their primary energy needs and provide other essential goods and services. For this portion of the world’s population, biomass energy differs significantly from clean and efficient energy. It is generally used in open hearths or simple stoves that are inefficient and quite polluting. The emissions from small-scale stoves are often vented directly into the household, and have a significant impact on human health. In addition, many of the same compounds are potent greenhouse gases that are not recycled or absorbed during the growth of the next generation of biomass. Biomass regrowth absorbs CO2 from the atmosphere, but not other combustion emissions.
By promoting biomass energy to provide clean and efficient “modern” energy services in the form of solid, liquid, and gaseous fuels as well as electricity, the governments of developing countries and Parties to the CDM can address many of the negative aspects of small-scale household and commercial biomass consumption. This can also help developing countries diversify their resources for low-carbon energy production. Moreover, taking that step now does not require devoting large amounts of land to bioenergy crop production, which can potentially conflict with other land uses, particularly food-crop cultivation. Underutilized agricultural, agro-industrial, and timber wastes can be exploited in a variety of ways: bagasse from sugarcane processing, sawdust and offcuts from the timber industry, fruit pits and prunings from orchards, coffee husks, rice husks, coconut shells – the list goes on. Using these resources for energy generation would allow countries to gain valuable experience through learning-by-doing while continuing with basic research in energy crop production.
However, research and learning will need to extend beyond technical energy supply and conversion challenges. For biomass and bioenergy to contribute meaningfully not only to climate change mitigation, but to sustainable development and poverty alleviation, non-technical factors at the community level must be addressed. Providing energy services to poor communities as well as to middle and upper class urban dwellers, and to rural commercial enterprises as well as to urban industries, requires policies and incentives that account for, and that can adapt to, circumstances that are quite different to urban consumers. Key issues include the consumer’s willingness to pay for energy services; the consumer’s access to credit is critical. Experience has shown that credit is a deciding factor in allowing poor consumers to overcome high initial costs. Credit also makes the modern energy technology, which is often cheaper in terms of energy delivered over the lifetime of the product, more competitive with more traditional forms of energy by spreading the payments over time.
Experiences like these are important and need to be documented and shared to ensure the success of CDM projects. If lessons are not widely disseminated and best-practices developed to ensure that those social and environmental factors can be meaningfully addressed without prohibitive cost, CDM projects that truly contribute to poverty alleviation and sustainable development will lose out to projects that simply seek to maximize certified emissions reductions at the expense of social and/or local environmental factors. We hope that this report, along with the related case
Page 10 of 121
studies contributed by numerous practitioners working on a variety of biomass and bioenergy related projects in developing countries around the world, can contribute to promoting biomass-based CDM projects that maximize emissions reductions in concert with socially and environmentally positive outcomes.
Page 11 of 121
Introduction: Renewable energy, global warming and sustainable development
Conventional energy sources based on oil, coal, and natural gas have proven to be both highly effective drivers of economic progress, and damaging to the environment and to human health. Traditional fossil fuel-based energy sources are facing increasing pressure from many sides. Many countries are looking inward, at domestic resources, in order to decrease reliance on imported forms of energy as a matter of national security. Furthermore, environmental issues, principally global climate change, have become serious drivers for a transformation in the global energy arena. Perhaps the gravest challenge confronting energy use in all nations is the need to reduce greenhouse gas (GHG) emissions. It is now clear that any effort to maintain atmospheric levels of CO2 below even 550 ppm, a doubling of pre-the industrial atmospheric concentration, cannot be based fundamentally on an oil and coal-powered global economy, without using radical carbon sequestration efforts (Kinzig and Kammen, 1998; Baer, et al., 2000).
The potential role of renewable energy technologies (RETs) in transforming global energy use is enormous. Energy sources such as biomass, wind, solar, hydropower, and geothermal can provide sustainable energy services, based on a mix of readily available, indigenous resources that result in almost no net emissions of GHGs. A transition to renewables-based energy systems is increasingly likely as the costs of solar and wind power systems have dropped substantially in the past 30 years, and continue to decline, while the price of oil and gas continue to fluctuate. In fact, fossil fuel and renewable energy prices, as well as social and environmental costs are heading in opposite directions. Furthermore, the economic and policy mechanisms that support the widespread dissemination and sustainable markets for renewable energy systems have also rapidly evolved. Future growth in the energy sector will be primarily in the new regime of renewable, and to some extent natural gas-based systems, rather than in conventional oil and coal-based sources. Financial markets are awakening to the future growth potential of renewable and other new energy technologies, and this is a likely harbinger of the economic reality of truly competitive renewable energy systems.
Furthermore, renewable energy systems are usually implemented in a small-scale, decentralized model that is inherently conducive to, rather than at odds with, many electricity distribution, cogeneration (combined heat and power), environmental, and capital cost issues. As an alternative to custom, onsite construction of centralized power plants, renewable systems based on PV arrays, windmills, biomass or small hydropower, can be mass-produced ‘energy appliances’. These can be manufactured at low cost and tailored to meet specific energy loads and service conditions. These systems can have dramatically reduced and widely dispersed environmental impacts, rather than larger, more centralized impacts that in some cases have contributed to serious ambient air pollution, acid rain, and global climate change.
While the developments in RETs described above apply mainly to industrialized countries, the issues concerning conventional fossil fuel-based energy systems are equally, if not more, important, for less developed countries (LDCs). In addition to the environmental and public
Page 12 of 121
health issues raised above, heavy reliance on imported fossil fuels places a huge burden on the financial resources of developing countries. Supply constraints and exchange rate fluctuations affect reliability in the energy sector, which inhibits investment and retards economic growth. Energy sector development in LDCs, with few exceptions, has focused on large hydro systems and fossil fuels, despite the fact that LDCs are generally rich in indigenous renewable resources. These LDCs have a huge potential to develop biomass, wind, solar, and smaller, less environmentally and socially disruptive hydro resources in order to power their economies and improve living standards.
Renewable energy sources currently supply somewhere between 15 per cent and 20 per cent of world’s total energy demand. The supply is dominated by traditional biomass, mostly fuelwood used for household energy needs in LDCs. A major contribution is also obtained from the use of large hydropower, with nearly 20 per cent of the global electricity supply being provided by this source. New renewable energy sources (solar energy, wind energy, modern bio-energy, geothermal energy, and small hydropower) currently contribute about two per cent of the global energy mix. A number of future energy scenario studies of the potential contribution of RETs to global energy supplies indicate that, in the second half of the twenty first century, their contribution might range from the present figure of nearly 20 per cent to more than 50 per cent with the right policies in place. That transition, important as it is for local economic and environmental sustainability and the global environment, will only occur if energy projects and policies are evaluated and implemented based on their overall social, economic, and environmental merits. Bioenergy resources and technologies, projects, and markets are critical in supplying energy services while also building local capacity to meet energy needs, at the level of the household, community, and nation. In poorer nations, they also provide unmatched employment and development opportunities.
This document provides a resource guide, six case studies, and a set of recommendations for the international energy and climate policy communities, national governments and non-governmental groups, as well as local communities. Section I of this report describes some of the linkages between poverty, poverty alleviation and energy in developing countries. It compares and contrasts the different options and constraints faced by poor people living in rural and urban areas. The closing discussion asks what energy services are currently available to poor people, and how those services can be transformed in the future to provide cleaner, more efficient, and more equitable energy services.
Section II looks in detail at energy use in poor households. Domestic energy is the largest sector of energy consumption in many developing countries. This portion of the report examines the interactions between household energy use, local environmental change, GHG emissions, and public health.
Section III looks at the use of biomass-based energy systems beyond the household. Small rural industries, commercial businesses and institutions have great potential to scale up different forms of bioenergy production. In examining this potential, the section considers both the technical options available and the barriers to an expansion of modern bioenergy systems in poor areas of developing countries.
Section IV considers the technical options in greater detail. It addresses some of the underlying economic issues critical to the large-scale transformation biomass-based energy systems, with special attention to lessons from developing countries. It examines policies and measures that
Page 13 of 121

can be implemented to make renewable energy systems, including biomass, more competitive with energy services derived from fossil fuel.
Section V considers the role of energy projects, particularly renewable and bioenergy, in climate change mitigation and, more specifically, in the emerging clean development mechanism of the Kyoto Protocol. The section reviews key action points, discussing some of the issues that were resolved in the Bonn Agreement of July 2001, as well as some of the issues that are still outstanding.
Section VI brings the report to its conclusion with several policy recommendations. Six accompanying six case studies illustrate a wide variety of field experiences with biomass and bioenergy based systems in six different countries in Africa, Latin America and Asia. The case studies offer valuable lessons because they each reflect quite different approaches to meeting environmental and social goals across a wide range of phenomena.
Page 14 of 121
1 Energy and the poor
The majority of the world’s poor families rely on wood, crop residues, and dung to satisfy most or all of their household energy needs (UNDP, 1997). In addition, a large portion of the energy they require for small commercial activity and income generation originates from the same type of resources. These fuels, known collectively as biomass, represent the largest potentially renewable source of energy in use in the world today. Estimates of the quantity of biomass energy that is used annually range from 40 to 55 EJ (Hall and Rosillo-Calle, 1992; IEA, 1998). In comparison, hydroelectricity, the largest commercial source of renewable energy in use today, generates only one fourth of the energy derived from biomass (WEA, 2000)1,2. While biomass resources are, in theory, renewable, people often use them in unsustainable and inefficient ways due to lack of access to information, financial resources, and technology. Moreover, poor people often find the resource base they rely on for their basic needs coming under increasing pressure from actors outside the community, forcing them to adopt survival strategies that are unsustainable in the long-term. In effect, poor people often have no alternative way to meet their most basic needs.
Cooking, for example, represents the largest end-use of biomass energy in many developing countries (Dutt and Ravindranath, 1993; Kammen, 1995a, 1995b). For many years, wood collection for cooking was thought to be a direct cause of deforestation and desertification, particularly in Africa. Household energy provision was a logical suspect in environmental degradation because of a simple geographical correlation: fuelwood demand is generally high in areas where deforestation and desertification processes occur (UNDP, 2000). However, research has largely failed to find direct links between household fuel consumption and degradation, except in localized cases where commercial charcoal production is a dominant household energy supply strategy. While this fuelwood-deforestation link has been largely discredited (Leach and Mearns, 1988), deforestation caused by timber sales, expanding cultivation, and charcoal or fuelwood production, does place extreme pressure on rural biomass resources and reduces the pool of biomass that poor people are able to use for their own household energy needs. A UNDP report (2000) concludes that rather than fuelwood demand and subsequent scarcity causing deforestation, fuelwood scarcity is often a result of deforestation that has been caused by other forces.
Poor households often lack the ability to optimize their consumption through improved technologies. Cooking, the principle use of household energy in LDCs, provides a good example. The simplest and most common method of cooking throughout rural areas of the developing world is the open hearth or three-stone fire, which typically transfers only 5-15 per cent of the fuel’s energy into the cooking pot. For many years development agencies in a number of countries have promoted improved cookstoves in an effort to raise their efficiencies. Ironically, many ‘improved’ stoves failed to raise efficiency in actual field use, and some
1 Global hydroelectric production is roughly 2600 TWh, which is less than 10 EJ - per year (WEA, 2000). 1 EJ is 1018
Joules and 1 TWh = 109 kilowatt-hours, which is equivalent to 3.6 x 10¹⁵ Joules.
2 Biomass is not necessarily a renewable form of energy. It is only a renewable form of energy if the local rate of biomass consumption does not exceed the local rate of regrowth. Similarly, hydroelectricity is not an infinitely renewable resource because power production can diminish or cease over time due to siltation and/or reduced hydrological flows.
Page 15 of 121

actually resulted in lower efficiencies compared to a well-managed open fire. Still, there have been successes, such as the Kenyan ceramic jiko (KCJ) (Kammen, 1995). In addition, improving combustion efficiency can provide secondary benefits like reducing harmful emissions (see the discussion on biomass energy and health below). Further, most improved stoves are designed to utilize local materials, and their mass production creates local employment. These improved stoves have been successfully disseminated in several countries in addition to Kenya, but in others, technical, social, and market barriers have prevented their wide-spread adoption. Thus, despite years of effort and localized successes, most of the world’s poor people continue to cook on unimproved stoves (Kammen, 1995a, 1995b; Barnes, 1994; Smith et al., 1993; UNDP, 1997).
With few alternatives for energy services, poor people relying on biomass resources are often trapped in a cycle of poverty. Poor households generally spend more money buying, or more time collecting, each unit of energy they consume compared to wealthier households (Dutt and Ravindranath, 1993). Energy is a necessary input to improve the quality of life beyond the basic needs of household members, either by reducing the time and manual labour required to perform menial tasks or by enabling income-generating activities. Poor households are limited in their ability to utilize energy for anything more than satisfying basic needs because value-adding activities require, among other things, energy inputs that are simply not available through simple combustion of solid fuels: electricity, shaft power, and controlled process heating are some examples. With few alternatives for energy services, poor people relying on biomass resourcesare often trapped in a cycle of poverty. Poor households generally spend more money buying, ormore time collecting, each unit of energy they consume compared to wealthier households (Duttand Ravindranath, 1993). Energy is a necessary input to improve the quality of life beyond thebasic needs of household members, either by reducing the time and manual labour required toperform menial tasks or by enabling income-generating activities. Poor households are limitedin their ability to utilize energy for anything more than satisfying basic needs because value-adding activities require, among other things, energy inputs that are simply not available throughsimple combustion of solid fuels: electricity, shaft power, and controlled process heating aresome examples. With few alternatives for energy services, poor people relying on biomassresources are often trapped in a cycle of poverty. Poor households generally spend more moneybuying, or more time collecting, each unit of energy they consume compared to wealthierhouseholds (Dutt and Ravindranath, 1993). Energy is a necessary input to improve the quality oflife beyond the basic needs of household members, either by reducing the time and manuallabour required to perform menial tasks or by enabling income-generating activities. Poorhouseholds are limited in their ability to utilize energy for anything more than satisfying basicneeds because value-adding activities require, among other things, energy inputs that are simplynot available through simple combustion of solid fuels: electricity, shaft power, and controlledprocess heating are some examples. With few alternatives for energy services, poor peoplerelying on biomass resources are often trapped in a cycle of poverty. Poor households generallyspend more money buying, or more time collecting, each unit of energy they consume comparedto wealthier households (Dutt and Ravindranath, 1993). Energy is a necessary input to improvethe quality of life beyond the basic needs of household members, either by reducing the time andmanual labour required to perform menial tasks or by enabling income-generating activities. Poor households are limited in their ability to utilize energy for anything more than satisfyingbasic needs because value-adding activities require, among other things, energy inputs that aresimply not available through simple combustion of solid fuels: electricity, shaft power, andcontrolled process heating are some examples. With few alternatives for energy services, poor
Page 16 of 121
people relying on biomass resources are often trapped in a cycle of poverty. Poor householdsgenerally spend more money buying, or more time collecting, each unit of energy they consumecompared to wealthier households (Dutt and Ravindranath, 1993). Energy is a necessary input toimprove the quality of life beyond the basic needs of household members, either by reducing thetime and manual labour required to perform menial tasks or by enabling income-generatingactivities. Poor households are limited in their ability to utilize energy for anything more thansatisfying basic needs because value-adding activities require, among other things, energy inputsthat are simply not available through simple combustion of solid fuels: electricity, shaft power,and controlled process heating are some examples. shows a list of services that can be providedby non-traditional energy sources, and the income-generating activities that households c showsa list of services that can be provided by non-traditional energy sources, and the income-generating activities that households c shows a list of services that can be provided by non-traditional energy sources, and the income-generating activities that households c shows a list ofservices that can be provided by non-traditional energy sources, and the income-generatingactivities that households c shows a list of services that can be provided by non-traditional energy sources, and the income-generating activities that households can perform with these services.
The heavy reliance on biomass energy in poor urban and rural communities of the developing world is unlikely to change in the near future. Fuel switching away from biomass does occur, but it is principally in urban areas where alternative fuels are available. This switching does little to reduce demand for biomass fuel, which continues to increase with population growth. And while fossil fuel consumption is increases in many LDCs, it is not the result of fuel switching by the poor majority of people living in rural areas. A large-scale rural energy transformation to fossil-fuels is unlikely for economic reasons and undesirable from the perspective of GHG emissions (see below). This is not to say that poor communities in LDCs are forever condemned to cooking and heating over smoky fires fed by solid biofuels. There are alternative ways to utilize biomass energy that are cleaner, more efficient, and more convenient. A transformation in the use of biomass energy at the household, community, and industrial level can bring multiple benefits for LDCs, including reducing poverty, supporting sustainable livelihoods, and reducing the detrimental public health and environmental impacts of traditional biofuel consumption. In the coming pages we discuss the nature of biomass utilization and energy service provision for poor people in LDCs. After offering some background, we will examine the potential for innovative uses of biomass resources to transform energy services for the poor. Increasing the access to, and quality of, energy services for poor households in LDCs is a necessary, though not sufficient, stride toward correcting long-standing imbalances in the development of these regions.
The character of energy use in poor households throughout the developing world varies, in terms of both source and end use, depending on local conditions.
1.1 Rural-urban energy linkagesAn important distinction in terms of energy use in developing countries is between urban and rural households. Urban areas, though more productive in terms of economic output, tend to be far more energy intensive than rural areas. Food, fuel, and raw materials for construction and manufacturing must be brought from rural areas or imported from foreign countries. As cities grow, the radius from which they extract resources grows with them.
Page 17 of 121

Nearly every developing country has a rate of urban growth that outstrips the base rate of population growth (World Bank, 2000). Consequently, not only are cities growing in size, but they are growing faster than the populations in the rural areas that provide the raw materials necessary for growth. Sub-Saharan Africa is perhaps the most extreme example of rapid urbanization. In sub-Saharan Africa, the rate of urban population growth is the highest in the world – with a regional average of nearly 5 per cent per year over the 10 years between 1988 and 1998 (World Bank, 2000). At that rate of growth, the number of people living in African cities doubles every 14 years. Ironically, one of the underlying causes of rural-urban migration is disparate development priorities favoring urban centers, which leads to acute poverty in rural areas, including, but not limited to, lack of access to adequate energy services. Lack of access to clean and convenient energy sources limits economic opportunities in rural areas and drives households, or more frequently male household members, to seek opportunities in towns and cities. This process also has an element of positive feedback built into it. As urban populations increase, they gain more power to influence national development priorities because urban populations have greater access to information and greater ability to organize politically. In channeling scarce development resources toward urban areas, rural areas are further marginalized, which encourages more people to migrate to the cities (Lipton, 1976)
1.1.1 Urbanization and increased pressure on the rural resource baseThe growing urban population can lead to an increased demand on biomass resources areas. For example in Kenya, the total population grew by roughly 7 million in the ten years between 1988 and 1998, but the urban population grew by roughly 4 million in the same time period. Charcoal is the preferred urban cooking fuel - roughly 30 per cent of urban households use charcoal as their primary fuel and many more use it in combination with kerosene, LPG, and/or electricity to satisfy some cooking needs (World Bank 2000). Most charcoal in Kenya is produced in earthen kilns that typically yield about 1 kg of charcoal for every 6 kg of wood that is used as feedstock (FAO, 1998). To reach Nairobi, Kenya’s largest urban center, charcoal is frequently brought from 200-300 km away. In one year, an urban household cooking exclusively with charcoal uses between 240 and 600 kg of charcoal. This amount of charcoal requires between 1.5 and 3.5 tons of wood to produce. The charcoal sold in Nairobi usually originates from arid and semi-arid regions where tree cover is sparse and household fuelwood consumption is relatively low - between one and two tons per household per year. Thus, one urban household that uses charcoal requires the same amount of wood annually as up to 3 rural households living in the charcoal producing area.3
Despite the inefficiency of its production, charcoal remains an affordable fuel for Kenya’s urban consumers, in part because the national government owns, but does little to control access to the forests where charcoal production takes place. Charcoal producers pay no stumpage fees, so their urban customers need pay only for labour, transportation, and handling of the charcoal, plus the mark-ups charged by numerous middlemen. They need not pay for the feedstock itself. The replacement costs of the feedstock, or the detrimental effects caused by loss of tree cover, are borne by whatever rural population lives in the vicinity of the harvested stands of trees.
3 These calculations are based on numbers from Kituyi et al., (2001a and b) and the World Bank (2000). According to these sources, the average charcoal consumption in urban areas of Kenya is 103 43 kg cap-1 yr-1 and the average urban household size in Kenya is ~4 people. Charcoal is generally produced in arid areas of Kenya, where Kituyi et al. (2001a) report the average annual wood consumption is ~300 kg cap -1 year-1 and the World Bank reports that the average household size is between 5 - 6 people.
Page 18 of 121

There is little question that charcoal production contributes to deforestation in Kenya and other countries in sub-Saharan Africa. However, charcoal is a popular urban fuel and a huge revenue generator. Prohibition of charcoal production would be extremely unpopular and would likely fail. An alternative to government control, that would likely lead to more sustainable charcoal production, is local community control of forest resources. This would channel charcoal revenues into local communities and promote sustainable land management practices rather than the resource mining that is currently taking place in Kenya and elsewhere. Hosier (1993b) provides a good example of successful local control, where communities practice selective harvesting and post-harvest management techniques, leading to recovery of many woodlands after charcoal production.
A more recent example of local control and stewardship is Mali. Over 60 per cent of households in Mali’s capital, Bamako, use charcoal – roughly 80,000 tons annually. An extremely rapid transition from wood to charcoal put significant pressure on charcoal producing areas. A government-led initiative, funded by the World Bank and the Dutch Government, set out to identify high potential charcoal production zones, and with the support of national legislation, transfer control of forest resource management and trade of wood-based energy products to ‘local collectivities’. The legislation, enacted in the mid-1990s, coincided with a drive to implement a variety of goals: modernize the charcoal sector, train producers to use improved Casamance-style kilns, and develop rural supply zones for seven different urban areas – all under local control. The programme is fairly young, and its results are not yet publicized, but it should be followed closely.4
1.1.2 Urbanization and changing energy demandsIn addition to straining rural resources through increased exploitation, growing urban populations can also alter the character of national energy demand by intensifying the demand for fossil fuels and electricity. Few developing countries have indigenous fossil fuel reserves, so increases in fossil fuel demand must be satisfied by additional imports. Similarly, increased demand for electricity is often satisfied by importing power from neighboring countries with excess installed capacity. This increased demand for imported energy places a strain on the country’s balance of trade and costs dearly in foreign exchange.
1.1.3 The social costs of urbanizationIn addition to the various costs and benefits associated with supplying energy for a growing urban population, there are also multiple social effects of the demographic shift toward higher urbanization. These include increasing numbers of female led households and increasing demands on women’s and children’s time and labour. Rapid urbanization also creates a demand for more intensive agricultural production, which involves costly and energy intensive inputs, favouring wealthier farmers or big agri-businesses. This trend can disempower small-scale and subsistence agricultural producers. Smallholders may also be encouraged to rent or sell their land to large-scale farmers for short-term economic gain, which can, in the long-run, lead to further rural-urban migration. Disempowerment and dispossession of rural smallholders exacerbates environmental degradation and fuelwood scarcity, which further entrenches rural energy poverty.
4 This description is based on a presentation given at the Village Power 2000 Conference, held at the World Bank in December 2000. A review of the presentation is in the conference proceedings (Toure, 2000), available on CD-ROM or on-line at www.nrel.gov/village power/vpconference/vp2000/vp2000_conference/fuel_ismael_toure.pdf
Page 19 of 121
1.2 The energy mix in urban and rural areas
Poor urban households often rely on a wideranging mix of commercial energy sources, including fuelwood, charcoal, kerosene, LPG and, in some cases, a limited quantity of electricity. Energy end uses range from subsistence needs like cooking, space heating, and lighting to income generating activities and entertainment. The mix of sources and quantity of energy that urban households use can change from day to day and year to year depending on, inter alia, domestic and international fuel markets, fluctuating household incomes, and seasonal conditions that effect labour markets and fuel availability.
In contrast, poor rural households usually have fewer energy options than their urban counterparts. It is true that the energy end-uses for rural households fall into the same categories of cooking, space heating, lighting, income generation, and entertainment. However, the higher cost of, and lack of access to, commercial forms of energy, and the lower incomes characteristic of rural populations, compel rural households to rely more heavily on traditional fuels, as well as limit the diversity of possible end-uses. Non-traditional forms of energy that poor rural households have access to are usually limited to dry cell or lead-acid batteries, which are highly specialized in the applications and extremely costly in terms of price per unit of delivered energy.
1.3 The ‘energy ladder’ and household fuel switching
Given the array of energy options that are potentially available to people in LDCs and the various constraints they face in meeting their energy needs, analysts use a simple model, the ‘energy ladder’ (Smith, 1987; Leach and Mearns, 1988; Leach, 1992; Masera et al., 2000), to explain the evolution of energy choices, primarily at the household level. The model’s basic premise is that different energy options can be characterized by traits such as cost, energy efficiency, cleanliness, and convenience, which all correlate to one another to some degree. Figure 1 shows a graph representing the rough correlation between stove cost and efficiency for some generic stoves commonly used in LDCs.
Insert Figure 1 here
Fuels which are available for free or for very low cost, such as fuelwood, dung, and crop residues are the dirtiest and the least convenient to use; they require more labour to gather fuel, are difficult to light and extinguish, and do not allow for easy control of heat output. Cleaner, more convenient fuels tend to transfer heat more efficiently, are easily controlled over a range of heat outputs, and are much costlier; they may require large lump payments for the fuel as with LPG, and large up-front expenditure for the stove, as with gas and electric cookers. Table 2 shows some typical household fuels, their relative positions on the ‘energy ladder’, and some general barriers to their adaptation.
Table 2 goes here
The problem with the energy ladder model is not with its original qualitative formulation, but with the simplified way that the model is applied to policy-making, and the mistaken conclusion that fuel choice is determined by purely economic factors. Household fuel switching is not a linear or unidirectional process, and economic factors are not the only variables that determine fuel choice. Complete switching, where one fuel totally substitutes for another, is rare. Different fuels are not perfect substitutes, and cultural preferences may cause a household to retain a fuel/stove combination to cook certain foods or to use on special occasions. Moreover, an
Page 20 of 121
increase in household income will not necessarily be spent on cookstoves or fuel. Rather than representing a step along a predetermined path that would lower or raise fuelwood consumption or combustion emissions in a predictable way, additional household income translates to additional freedom to choose a fuel or array of fuels. What the household actually does with an extra hundred pesos, kwacha, or rupees will be decided by individual household members influenced by differentiated gender-based priorities as well as cultural factors. Ultimately, analysts will only be informed of those household decisions by direct observation, surveys, or interviews, and not through the application of a model, particularly a model applied across different geographical regions and cultures. Finally, access and consistent availability are also important: for example, households that are willing and able to pay, simply will not make the switch from charcoal to LPG if the gas, stove, and gas bottles are not consistently available in a convenient location.
A study by Masera et al. (2000) provides a good example of the complexities of fuel switching in rural households. The authors found that increasing wealth in Mexican households led to “an accumulation of energy options” rather than a linear progression from one fuel to the next. They also found that only one out of five locations studied showed a statistically significant difference in household fuelwood consumption between households cooking solely with fuelwood and households cooking with a mix of LPG and fuelwood. They conclude that “household fuels, rather than pertaining to a ladder of preferences with one fuel clearly better than the other, possess both desirable and undesirable characteristics, which need to be understood within a specific historical and cultural context” (Masera, et al., 2000, p. 2083-5).
A second study, from Morocco, corroborates the findings from Mexico described above. In doing research on the degradation of the argan tree species in Morocco, it was found that while wealthier households enjoy additional energy options, they do not necessarily adopt completely non-traditional sources of energy. In the region of Wadi Nun, poorer households used fuelwood and charcoal, while wealthier ones used a combination of charcoal, gas and electricity. In both types of households, charcoal from the argan tree remained widely in use, particularly for cooking (Najib, 1993). In such communities, argan-derived charcoal carries a very strong socio-cultural value. It is not only a practical necessity but also holds an important traditional and cultural significance.
1.4 Energy services for the poor
In the industrialized world, most people are well removed from the source and distribution of their energy supply. Energy is typically delivered at the flick of a switch or the turn of a knob, and is valued only for the services it provides: lighting, heating, mechanical power, and entertainment. Consumers’ thoughts only turn to energy distribution and supply when there is an interruption in service or a technical fault, and such anomalies are treated with the seriousness and urgency usually reserved for national disasters like earthquakes and train wrecks. In developing countries, where the majority of the population still resides in rural areas, and where many urban residents do not receive reliable energy services, the situation is quite different: energy supply is a matter of daily routine and daily survival.
To understand energy sources and services that are, or can be made, available to the poor, it is best to divide the discussion into those sources of energy that are supplied through formal energy markets, which we shall call commercial energy and those that are supplied through informal markets, collected by household members or otherwise obtained independent of any financial
Page 21 of 121

transactions, which we shall call traditional energy. We shall see however, that the distinction is not applicable in all cases, and the lines between traditional and commercial blur as populations shift and markets evolve.
1.4.1 Traditional energy suppliesTraditional energy supplies consist of biomass resources that are collected and consumed locally. One author found it useful to divide traditional fuel use into three consumption categories: rural domestic, rural industry, and urban (Kaale, 1990). However, the urban energy category uncomfortably straddles the traditional-commercial divide. In many cases, urban fuelwood and charcoal markets are highly organized, with varying degrees of vertical integration by producers and suppliers and varied attempts at regulation by the state (Leach and Mearns, 1988; Hosier, 1993a; Boberg, 1993). This encroachment of traditional fuels into commercial activity will increase as urban areas grow in size and influence, and rural resources become increasingly commercialized.
A common theme across all categories of traditional fuels is the high degree of uncertainty and variability in the nature of fuel consumption. Even in the best conditions, household data is difficult to acquire and unreliable. In 1988, Leach and Mearns, in their pivotal work on woodfuel in Africa, decried the state of available data. Among other prescriptions, they called for an improvement of “almost every type of data on energy demand, supply, prices, markets, and resources…since the database for understanding and diagnosing woodfuel and related energy problems – especially with regard to their dynamics over time – is with very few exceptions, appallingly weak.” (p. 196)
Unfortunately, over a decade later, the situation no better, though with the additional concerns of national GHG inventories and climate change mitigation, the need for accurate data is arguably greater than it was in the past. While some countries in transition, particularly China and India, have devoted substantial resources to documenting energy consumption practices in all sectors including the household level, most countries have not done so for a variety of reasons. Some nations have included questions about household energy practices in national census data, but this data is collected infrequently and is very limited in its range of broadcast. In many cases, the reliability of this data is not clear. Data published by multilateral institutions is equally dubious, at times conflicting directly with the national census data. Often, the same 10- to 15-year-old statistics are cited in multiple publications year after year, with little effort to update the data or capture any of the dynamic variation that is inherent in household practices. While there is little doubt that 2-3 billion people in developing countries use traditional biomass fuels to satisfy their basic needs, there is a great deal of uncertainty surrounding the dynamic nature and evolution of their consumption and its effects on personal health, and local and global environments.
1.4.2 Commercial energy suppliesCommercial energy includes grid-based electricity and fossil fuels, which are often controlled by state entities in developing countries. As discussed above, commercial forms of energy can also include biomass fuels like wood and charcoal. These fuels are collected, processed, transported, and marketed by firms, small businesses or individuals, usually for sale in urban or peri-urban areas. Commercial biomass markets may be formal markets, where some or all aspects of the supply chain are regulated, but formally regulated markets often have little or no monitoring or enforcement. For example, in Senegal’s charcoal market throughout the 1980s, regulators fixed prices and set production quotas artificially low, while simultaneously promoting LPG as an alternative urban cooking fuel option. LPG consumption did increase drastically, but not
Page 22 of 121

generally among charcoal users. Ultimately, the programme did little to stem charcoal demand. A few influential merchants were able to meet the demand, which exceeded the charcoal supplied under the quotas, by colluding with state officials and circumventing the quota system (Leach, 1992; Ribot, 1993).
An often overlooked category of commercial energy used by all strata of society in developing countries, including poor households in rural areas, is battery power for limited electrical applications. Disposable dry cell batteries allow people to use handheld flashlights and play transistor radios. Larger lead-acid batteries, the type used in the ignition systems of cars and trucks, provide much more electrical capacity than dry cells, and can be recharged repeatedly. Though the energy output of dry cells and car batteries is negligible compared to energy required for household cooking, they are, for many people, the only non-traditional form of energy available. They also constitute, for those who can afford it, a significant expenditure. This fact is often used by policy-makers to assert that poor rural consumers are willing to pay high prices for modern energy services. In addition to the high cost of a unit of energy delivered, the disposal of both dry cell and car batteries represents a serious and largely undocumented environmental threat. Box 1 offers a discussion of battery consumption for household energy applications in Zimbabwe.
Insert Box 1 here
Commercial energy service options for the poor also include off-grid electric power technologies for households or commercial applications that have penetrated markets in some developing countries. These are typically petrol or diesel powered generators, commonly known as gen-sets. Gen-sets have a long history of use, and are served by well-developed networks of spare parts stores and technicians, in many developing countries. A second, decentralized option is photovoltaic (PV) panels, which are becoming increasingly common as costs come down and markets develop. Kenya is often held up as an example of a PV market success story. Over 100,000 PV solar home systems have been installed in rural households, far outpacing the rate of the government’s grid-based rural service provision (Acker and Kammen, 1996; Duke et al., 2000). Further, an IFC-sponsored ‘Market Transformation Initiative’ for Kenya’s PV market (PVMTI) will infuse the country with relatively large amounts of capital. It will be interesting to see how this top-down effort affects the market, which has evolved thus far without intervention.
Less common off-grid renewable options include small (micro) hydroelectricity systems, wind turbines, and biomass-powered electric systems. Like diesel and petrol gen-sets, these technologies operate at scales more appropriate for community power rather than individual households or businesses. To be viable, they require institutional arrangements that may not have existed previously in the community. Some of these technologies have been installed in communities by donor organizations and NGOs, but they often fall into disrepair because project lifetimes are generally shorter than equipment lifetimes and there is little local capacity to maintain or repair the equipment after the donor has left.
1.4.3 Energy service companies (ESCOs)A relatively new concept in energy provision for the poor, which can utilize one or many distributed generation (DG) technologies like micro-hydro, wind turbines, PV panels, or diesel, petrol, or bio-powered gen-sets, is the Energy Service Company (ESCO). Usually, when DG technologies are introduced in rural areas, the hardware is bought by the end-user(s) with cash up-front or through financing. Since the buyer assumes the risk of ownership and is responsible
Page 23 of 121

for operating and maintaining the hardware throughout its useful lifetime, access becomes limited to rural consumers who are willing and able to assume that risk. In the ESCO model (or RESCO for Rural Energy Service Company), a private company enters into a contractual agreement with community members to provide them either with hardware or services, depending on the specific business model they follow (see below). In many of these models, the risk is transferred to the business, which is in a better financial position to absorb it, making the service more accessible to poor consumers. RESCOs are not yet common in most developing countries. However, as national governments struggle to deregulate their public utilities, RESCOs may emerge as a possible mode of rural energy service provision. In some countries, they are already established and operating with success.5
There are many variations to the RESCO model. The company itself may be entirely private, or it may have support from the government or the national utility company. It may be a non-governmental organization (NGO), community based organization (CBO), or a private entity with ties to one or more of those organizations. It may be privately financed, or established with the assistance of the government and/or an outside donor. In addition to the organizational set-up, there are variations in choice of technology, business model, and regulatory framework. We will discuss each of these briefly.
Technology: The choice of technology for a RESCO depends on several factors, including the community’s demand profile, physical location, and ability to pay for energy services. Also affecting the choice of technology is be the local capacity to operate and maintain the equipment. There are many non-local factors that influence technology choice. At the national level, the government may have made policy decisions that favour or exclude certain technologies through taxes or import tariffs. Some technologies may be locally made, while others may only be available through imports. These factors create strong linkages between technology choice and regulatory framework. Finally, there are socio-cultural factors that are often overlooked but that should strongly influence the choice of technology if it is to be successfully integrated into the community. Broad community wide norms and values have a role to play in technical decision making. Equally important, heterogeneities among the targeted end-users must also be considered. Both household energy and expenditure have very specific gender and age-based roles assigned to them. Moreover, communities are stratified by wealth, landholdings, and labour relations. Targeting a ‘community’ for energy service provision often means targeting the wealthy and powerful minority. If the RESCO aims to provide equitable service for all, then considerable effort must be made to ensure full participation across age, gender, and class divisions in choosing an appropriate technology, and designing an appropriate business model (see below).
Business Models: RESCOs can take a number of approaches to provide energy services to rural communities. The most basic approach is simply selling energy generation hardware like PV panels, car batteries and diesel gen-sets. Another approach, that provides access to poorer households that generally cannot afford the high up-front costs associated with technical hardware, is to offer financing so that the up-front cost of the hardware is spread over a longer
5 For example, in the Dominican Republic and Honduras, Enersol, a US-based NGO, and Soluz, a private RESCO, have been operating for a number of years. See http://www.enersol.org/ and http://www.soluz.net/. Also, in South Africa, both Shell Renewables and BP have set up joint ventures with ESKOM, the South African utility company, to provide rural households with PV systems. In each case, service provision will devolve to a local RESCO in charge of system installation, maintenance, and fee collection. Each program is targeting 50,000 households and will be followed by additional joint ventures between ESKOM and other partners (Duke, personal communication, September 2001).
Page 24 of 121

time period. Such financing could be established by the RESCO itself, though many businesses do not have access to sufficient capital or the capacity to undertake that level of financial risk. Financing can also take the form of a revolving fund with seed money provided by the government or an outside donor. Formal banks, microcredit organizations, and rural cooperative organizations can also provide the necessary financing.
A second set of business models does not involve transferring ownership of hardware to the customer. It provides energy services for a set fee, which is paid periodically by the consumer. Such fee-for-service models resemble the provision of energy services from conventional utilities, though, in this case, the power generation hardware is located within the household or community and the RESCO retains ownership. The RESCO installs and maintains the PV panel, wind turbine, or generator, and the consumer pays for the energy services provided by the company. Payment may be for services already used, as with conventional public utilities, or it may be up-front, using pre-pay metering similar to telephone cards that are used in many countries. Pre-paid meters have been developed in a number of countries specifically for this application, and significantly reduce the risk for the service provider by insuring that payment is made in advance.
Regulatory Framework: RESCOs, like all businesses in developing countries, must operate within a specific regulatory framework. But RESCOs are unique, because they exist to provide services that have traditionally been provided by the state. Many governments in developing countries have rural electrification as a stated policy goal, regardless of their level of real activity in achieving that goal. For example, until recently, most African countries had large state-run utilities controlling power generation, distribution, and sales. Under pressure from bilateral and/or multilateral institutions, many countries are currently in the process of restructuring their power sector, regulating some components of the sector and privatizing others.6 Deregulation or privatization of the generating sector can contain specific provisions allowing for so-called Independent Power Producers (IPPs) to produce electricity for sale to the national grid, as well as allowances for RESCOs to produce and distribute power on smaller scales using stand-alone systems like PV or mini-grid systems based on micro-hydro, wind, diesel, petrol, or biofuel gen-sets, or hybrid systems.
Regulations specifically directed at rural electrification also affect RESCO operations. Access to the national grid is a highly political matter that is often used to influence a particular rural constituency. Promises of imminent grid-connection may dissuade a community from investing in an off-grid electricity option, making it impossible for the RESCO to function in that community when, in reality, the community may still be years or decades from grid connection. Transparency in national energy policies is critical for the viability of RESCOs.
1.4.4 Reaching the poorest with RESCOsWhile the RESCO concept was introduced here specifically as an electricity provider, it can also be applied to the provision of additional energy services and essential hardware like cooking fuels and stoves, lighting equipment, and essential services like clean water and health services. Integrated service providers are a potentially efficient way to bring equitable basic services to
6 Electricity utilities are generally divided into four sectors: generation, transmission, distribution, and supply. The transmission sector , which controls the physical infrastructure by which electricity is sent from the point of production to the point of end-use, is considered a “natural monopoly” and is generally left in public hands. Under deregulation, remaining sectors are open to some degree of competition, which will theoretically bring about greater efficiency, lower real prices, and more reliable service.
Page 25 of 121

rural communities in developing countries, but a strictly laissez faire approach is unlikely to reach very poor or remote areas. In addition, the business model must be adaptable to local needs. While offering bundled services may be appropriate for better-off rural consumers, the poorest segments of the population may have a specific priority they hope to satisfy with their limited resources. In much the same way that Green Revolution technology packages were unbundled and adapted by small farmers to take advantage of what was most useful to them, the services offered by RESCOs should be adaptable so that consumers can unbundle them and take advantage of those portions that they prioritize most.7 Finally, to bring such services to poverty-stricken communities requires assistance from the government or NGO sector in a cross-section of areas, including targeted subsidies for certain goods and/or services, reduced tariffs on specific imported hardware, government-defined and enforceable minimum quality standards, and, perhaps most important, sufficient training and local capacity building to ensure that all efforts are sustainable in the long run.
1.5 Energy and the poor: Conclusions
In this section, we have discussed the energy services that are available to poor people and the lack of modern energy services that they face. The lack of access to modern energy services is but one component of the poverty that affects so much of the world’s population. Energy poverty is inextricably linked to the lack of other needs: shelter, food, health care, education, secure land tenure, access to agricultural inputs, credit, information, political power – the list continues. The answer to poverty alleviation does not lie with one, two, or three of these. Indeed, some critical mass of needs must be reached in order for a family or community to be ‘not poor’, but every situation is different. The roots of poverty are inherently local and must be understood in their local and historical context in order to be properly addressed. This is not to say that we can draw no conclusions from this section. Among this list of basic and not-so-basic needs, energy is unique and worth dwelling on because, like food, it is a limiting factor in access to many other basic needs. Without sufficient food (or energy), survival (or progression) is in jeopardy, and very little can be done until that pressing need is met. With more food in one’s belly, or more energy – animate, electrical, chemical, or mechanical – at one’s command, one can build a better home, plant better crops, access more information and, perhaps less directly, gain more political power. Access to energy is a necessary, but not sufficient ingredient in poverty alleviation.
In most LDCs, the conventional approaches to energy service provision – state-run utilities and the extension of the national electrical grid – have not proven successful. In contrast, a combination of policies that bring access to information, credit, and jobs, implemented in tandem with small-scale decentralized energy systems, have the potential to succeed where ‘conventional’ approaches have failed. Renewable energy technologies (RETs), which rely largely on local resources, are particularly suited to this approach. Many models of delivery are available, from subsidized public sector programmes currently under way in South Africa to private charitable donations scattered throughout the developing world. Recent trends in the multilateral donor community favor a shift toward the private provision of basic services such as water, health, and energy, which were previously the domain of the state, though the state often failed to deliver. This shift mirrors the situation in industrialized countries, where many public 7 The authors thank Dick Hosier for pointing out the analogy to Green Revolution technology packages. Of course, in
the Green Revolution context, the technology was not meant to be unbundled, but local farmers did so regardless of the intentions of those who introduced the technology. RESCOs and other proponents of energy technology for rural transformation must learn from that experience and build adaptability into their business models.
Page 26 of 121

utilities are in various stages of deregulation, regulated privatization, or complete free market bliss.
Several critical questions ought to be raised in every country where basic services are being privatized. For example:
Key questions remain about whether or not poor communities can attract viable business ventures. Will the private sector succeed, where the state has not, in providing energy services and other basic needs for the poor?
Alternatively, will an increased emphasis on the private sector ‘let the state off the hook’ in providing basic services, but leave marginalized communities as bad or worse off than they were under public service provision?
What incentives exist for private for-profit operators to enter poor, remote, rural markets or potentially dangerous, overcrowded, and risky urban markets?
What role, if any, can subsidies play in a privatized energy service market?
Answers to some of these questions can be found by addressing the potential role of the national governments and the donor community, like the UNDP, the World Bank, and other lending agencies in the new world of ‘private utilities’. In many cases, providing energy services to poor communities is more expensive than providing it to better-off communities because of geographical remoteness, high risk, poor payback, or low base demand. However, energy service provision also involves positive externalities like increased rural productivity, reduced rural-urban migration, and a potential decrease in pressure on rural energy resources with associated environmental benefits. Additional benefits arise if we consider that, by employing new renewable energy technology for rural energy service provision, we are moving along an experience curve that can bring costs down and make the technology more competitive with fossil fuels in future applications. These benefits could outweigh the incremental costs of energy provision, and fully justify some subsidies from an outside party (the government or a donor), in order to level the costs of service provision and make it an attractive investment for the private sector.
Page 27 of 121
I 2 Biomass and bioenergy for household use: Resources and impacts
This section will focus on biomass resources and the impacts of biomass utilization by individuals and families. Domestic use is by far the largest sector of biomass consumption in LDCs. However, biomass is used by households in developing countries for more than energy provision. In summarizing these varied and potentially conflicting uses, Leach proposes the “six F’s”: food, fuel, fodder, fibre, feedstock, and fertilizer (1992, note 7). Given this variety of biomass resource consumption, it is not surprising that for many people in rural areas of LDCs, biomass resources constitute their entire market basket of goods and services. For many others, biomass resources are the only input available to create a livelihood. Policy decisions or interventions aimed at enhancing or modifying biomass energy options for a single community, or for the entire nation, will inevitably affect other areas of biomass utilization and thus impact people’s livelihoods in unpredictable and potentially harmful ways. In designing policy, it is crucial to assess the potential impacts of the policies on all possible users, as well as on all possible uses, of biomass resources. This section will discuss the various resources that people exploit to satisfy their household energy needs, and the impacts of the exploitation.
Below, we will review the ways in which households acquire different types of biomass resources, and discuss alternative strategies that households can adopt to gain access to cleaner and more efficient fuels for household use.
2.1 Sources of household biomass
Biomass for household use is gathered from roadsides, natural woodlands, or communal woodlots. It can be grown on the homestead in private woodlots, intermingled with food crops, pruned from fruit trees or windbreaks, collected from fallow fields and grazing areas, or ‘poached’ from restricted state forests and nature preserves, which are often situated in areas of historical community access. Once collected, it may be transported to homestead on the heads and backs of women and children, strapped to a mule or the back of a bicycle, or piled in a wheelbarrow, scotch-cart, or rusty pickup truck.
Household energy supply strategies vary from country to country and from village to village. Strategies also vary with the seasons and the economic fortunes of household members. Moreover, when the primary household fuel is biomass, energy supply strategies are inseparable from land management strategies, and thus dependent on political and socioeconomic issues like land tenure and tree tenure, markets for land and labour, norms governing property and land use, and rules of inheritance. Where land management is concerned, national governments and/or non-governmental organizations often get involved as well.
2.2 Impacts of household biomass use in LDCs
Household energy in LDCs became a topic of interest for researchers, development workers, and donors in the 1970s and early 1980s, when petroleum price shocks focused global attention on energy as a resource and, to a lesser degree, on the rapid depletion of forest resources in developing countries. We have already shown that a direct link between household energy provision and deforestation is, in most cases, a mistaken one, but we bring it up again to tell a different story. One of the strategies adopted to initially combat deforestation in LDCs was to
Page 28 of 121

optimize biomass consumption at the household level by improving the technical performance of cookstoves, and encouraging families to move ‘up the energy ladder’ by switching to alternate fuels. By improving stoves, project designers aimed to transfer more of the fuels’ energy into the cooking pot through designing a ‘better’ stove, and reducing fuel consumption. While engineers were able to design very efficient stoves, the dissemination of novel technology at the household level across radically different cultures called for non-technical solutions. Many programmes failed, though some, in a variety of different contexts, succeeded (Smith, et al., 1993; Barnes, et al., 1994; Kammen, 1995; UNDP, 1997). One important lesson learned is that improved stoves tend to achieve greater market penetration in areas where fuels are purchased rather than collected. This is because the fuel savings are realized in direct monetary terms, rather than time saved.8 During the intervening years, it was discovered that, though improved stoves have only a small effect on the clearance of forests and woodlands (which are cleared for reasons independent of household cooking needs), there are other benefits that make stove development and dissemination well worth pursuing.
These benefits include reduced fuel consumption, which reduces household expenditure where fuel is purchased, and cuts the time and effort required to collect fuel where it is available for free. Another critical benefit is the potential health impacts of a shift to cleaner and more efficient biomass combustion. Cooking practices differ from country to country and village to village, but in communities that traditionally cook indoors using biomass fuel in an open hearth or three-stone fire, which is common across Africa and Asia, the indoor air can have pollution concentrations that exceed the pollutants in the outdoor air of a dirty industrial city by a factor of 10 or more. Box 1 offers a more detailed discussion of the pollution levels found indoors in rural households and outdoors in towns and cities of LDCs.
Box 1 goes here
The World Energy Assessment (2000) of the United Nations Development Programme (UNDP) divides the chief environmental impacts of household biomass use into two broad categories: impacts resulting from biomass harvesting and impacts resulting from biomass combustion. Harvesting of fuels has a direct impact on the physical environment, while combustion results in emissions that can simultaneously place a burden on human health and on the atmosphere in the form of GHGs. Impacts on the physical environment include immediately observable phenomena such as decreased tree cover or dramatic erosion events like slope failure, as well as long term impacts that may go unobserved for decades like slow loss of top soil, decreased soil fertility, loss of soil moisture, and loss of biodiversity.
2.2.1 Biomass and society: Gender, fuel and resource control
The largest impact of changes in biomass usage patterns at the household level will certainly be on women and children, who expend the greatest effort in the acquisition of woodfuels and other biomass resources. It is critical to recognize that changes, notably increases, in the demand for biomass will almost certainly increase the monetary value of biomass, making it less available to both the poorest families, and to women. And even where recognized (cf. Kammen, 1995b), projects in the past have not been overly successful in addressing this issue. An effort to move small-scale biomass projects to prominence in, for example, the Clean Development Mechanism (CDM), can have two contradictory impacts. On the one hand, increasing the prominence of 8 Again, the authors thank Dick Hosier for contributing this point.
Page 29 of 121

biomass energy and employment efforts can benefit households and communities through increased access to income. At the same time, however, increased prominence will likely attract entrepreneurs and business persons to the field, and in most nations those individuals are largely men. In a number of settings, this process drives women to more marginal roles, and reduces their employment and economic opportunities (e.g., Agarwal, 1994, 249-315). While the means to address this are often complex, a simple rule is that multiple stake-holders, even those often silent or silenced, need to be explicitly engaged and included in plans to develop any given resource sector. The urgency grows when we see that sharp divisions along gender and ethnic lines occur in both the informal, cash-poor sector and the formal, capital-rich sector of economy and society.
2.2.2 Environmental impacts of household biomass useConsidering the strong linkages between biomass consumption for fuel and biomass utilization for other end-uses, it is impossible to implicate household energy demand as a direct cause of environmental degradation. Any attempt to do so would be a gross oversimplification of what is, in reality, a web of complex interactions. This section will discuss some of the relationships between environmental degradation and biomass utilization in rural areas of developing countries. We will examine how the utilization of biomass resources for multiple end-uses by individuals and communities can impact their environment in multiple ways. We will demonstrate how specific policies and practices of biomass utilization can be used to reverse the course of environmental degradation where it is a serious problem, or maintain land that would otherwise be under threat of degradation.
The link between environmental degradation and biomass utilization is most commonly drawn through deforestation and the consequences of the loss of forest cover: erosion, decreased biodiversity, desertification, decreased soil moisture and nutrient loss, and change in surface roughness and albedo, which changes the radiative balance of the affected landscape. As we have already mentioned, deforestation is more often the cause of fuelwood scarcity, rather than the effect of too much household fuel consumption. Nonetheless, once forest land is degraded or lost entirely, fuelwood consumption and scarcity can act as a feedback process that prevents the recovery of the forest, or leads to further degradation.
For example, population pressure is often cited as an underlying cause of degradation. If a stand of mature trees is cleared to open space for additional cultivation or grazing, the fallen trees are often burned in situ or processed into charcoal for sale in a distant town. Households that formerly relied on fallen limbs and dead wood from that stand of trees now must travel farther to meet their fuelwood needs. If no mature stands with a sufficient stock of deadwood remain within a reasonable distance, they may begin to cut smaller trees, which leads to a further loss of tree cover. If smaller trees are not an option, or prove insufficient to meet demand, then some households may turn to agricultural residues or animal manure. This shift has consequences that extend beyond the use of lower quality and more polluting fuels. Crop residues are often used as fodder, and using traditional fodder as fuel can lower the value of a family’s livestock or lower the quality of the animals’ manure. When not used as fodder, crop residues are often left in the field as ground cover to protect top soil between growing seasons. They may be plowed back into the soil or burned on top of it before the next crop is planted, thereby returning nutrients to the soil. Using these residues for fuel can leave top soil unprotected between the harvest of one crop and the sowing of the next, leading to soil erosion and a loss of nutrients. Similarly, animal manure has significant opportunity costs. Using it as fuel takes away a valuable fertilizer, leading
Page 30 of 121
to lower yields or compelling the family to rely on expensive inorganic fertilizers. 9 To satisfy household energy needs, both tree cover and soil quality may be sacrificed, leaving rural households impoverished and often driving household members to seek wage employment in towns.
We should state, however, that the loss of natural forest cover does not necessarily lead to the scenario described above. As we mentioned earlier, one way to safeguard against this type of degradation is to vest control of forest resources in local communities. While this is not a guarantee of benign environmental stewardship, experience has shown that locally controlled forests and woodlands, with clearly delineated policies of land and/or tree tenure, are more viable and equitable than state-controlled resources.
Further, if natural forests do succumb to population pressure, communities or individual households may adopt alternate strategies to ensure a reliable supply of fuelwood. Contrary to the belief that population pressure inevitably leads to reduced forest cover and land degradation, several studies have shown the opposite to be true: in some cases, increased population has led to increases in tree cover and reduced rates of soil erosion (Fairhead and Leach, 1996; Tiffen et al., 1994; Binns, 1995). In addition, natural changes in the land are difficult to divorce from anthropogenic changes. Understanding changes in the land, whether naturally occurring, anthropogenic, or a combination of the two, is not simply a technical matter. Land degradation is the result of social as well as physical processes, which must be considered in their local and historical context in order to identify, understand, and mitigate environmental problems (Blackie and Brookfield, 1987; Peluso, 1999).
Planting trees within the household compound, interspersing trees among cultivated land, and other agroforestry practices, can make up for loss of tree cover in natural woodlands. Trees within the household compound or interspersed with crops or grazing land carry multiple benefits including, but not limited to, fuelwood, fruit, fodder, building material, shade, wind-breaks, and natural fencing. Some leguminous tree species can be interplanted with crops or on fallow fields to fix nitrogen and restore soil fertility. All trees, including trees planted in agroforestry systems, can be used to sequester carbon, though, as with all carbon-sinks, permanence is not guaranteed and must be addressed (see below for more discussion).
We have argued that biomass-based energy systems are uniquely suited to bring modern energy services to LDCs, particularly in rural areas. However, intensifying biomass utilization to provide those services to rural households can have multiple impacts on the environment. We have discussed some of the potential impacts of using woodfuels, crop residues, and dung as traditional energy sources. Similar issues arise on a larger scale when biomass is used to provide modern household energy services. But the benefits could far outweigh the costs if the bioenergy production is done in a sustainable way that targets degraded lands, with minimal chemical inputs, and does not compete with other land use critical to local people. More environmental issues relating to modern bioenergy production will be discussed later.
Environmental effects of household biomass combustion also extend to the global arena. Household biomass combustion results in GHG emissions. In addition to CO2, which is neutralized if biomass is harvested sustainably, there are other compounds, like carbon monoxide
9 However, when dung is used as feedstock in biogas digesters, the output is a high quality clean burning fuel and a valuable by-product in the form of a colorless and odorless non-toxic slurry that has greater value as a fertilizer than the original manure feedstock (Woods and Hall, 1994). See Case Study 2: Scaling-up Biogas Technology in Nepal, for a detailed description of a particular program of biogas dissemination.
Page 31 of 121

(CO), methane (CH4), volatile hydrocarbons, and particulate matter, which are pollutants. In addition to their warming effects, these pollutants have adverse impacts on human health (Smith, 1993). There is a close association between combustion emissions that are harmful to human health and GHG emissions from household cookstoves, and the resulting health impacts of biomass use appear across the board, from the household to the global commons. Therefore, the GHG emissions from household biomass combustion will be discussed in the next section, which covers the health impacts of household biomass use.
2.2.3 Health impacts of household biomass combustionIn contrast to many types of coal and petroleum-based fuels, raw biomass fuels contain few toxic compounds. Technically, it is possible to convert biomass into nearly pure and non-toxic hydrocarbon combustion products: water vapor and CO2. In practice, however, complete combustion is hard to attain, particularly in small-scale household combustion devices. As a result, products of incomplete combustion (PICs) are released into the household and into the atmosphere.
Because of the high concentrations of indoor air pollution (IAP) resulting from biomass combustion (see Box 1) and the large number of people affected, rural areas of developing countries suffer the greatest exposure globally to particulate matter and other combustion emissions (Smith, 1993).
Wood smoke contains hundreds of different compounds, including aldehydes, benzene, and polycyclic aromatic hydrocarbons like benzo()pyrene, all of which are carcinogenic. In addition, small scale biomass combustion emits large amounts of particulate matter, including fine particles less than 2 microns in diameter. These particles penetrate deeply in the lungs and are thought to cause more health damage than larger particles (Raiyani et al., 1993; Bruce, et al., 2000). The effects of high levels of exposure to these chemical compounds and particulate matter fall into five categories (Smith, 1993):
Acute respiratory infections (ARI): ARI, primarily occurring in young children, has a very strong association with biomass combustion. See the discussion on ARI below.
Tuberculosis: An analysis of data from 200,000 cases of pulmonary tuberculosis in Indian adults found an association between self-reported cases of the disease and exposure to wood smoke. Increased risk of infection from exposure to wood smoke most likely occurs through reduced resistance to lung infection, similar to the effect of chronic exposure to tobacco smoke (Bruce, et al., 2000).
Page 32 of 121

Adverse pregnancy outcomes: Women exposed to solid fuel combustion emissions during pregnancy experience higher rates of stillbirth and low birth weight than unexposed populations. In Guatemala, for example, children born in households using woodfuels tend to weigh less than children born in households cooking with gas or electricity after adjusting for socioeconomic and maternal factors.10 Again, this result is similar to observed effects of exposure to primary and secondary tobacco smoke (Bruce et al., 2000).
Chronic obstructive lung disease (COLD) and associated heart disease in adults: In LDCs, this disease is thought to be almost entirely due to solid fuel combustion. COLD is a condition that develops after many years of exposure. Smith (2000) estimates that 20-30000 women in India under the age of 45 suffer from it.
Cancer:
Lung Cancer - This has not yet been directly linked to biomass combustion despite the presence of carcinogenic compounds in wood smoke. However, an association is suspected because, while smoking is the principal cause of lung cancer in industrialized countries, in LDCs, “non-smokers, frequently women, form a much larger proportion of patients with lung cancer” (Bruce et al., 2000, p. 1083). In addition, lung cancer plays a significant role in the burden of disease linked to household energy use in regions where coal is a common household fuel. Lung cancer is strongly associated with indoor coal combustion, which is widespread in China and common, though less widespread, in South Africa, some neighboring countries in Southern Africa11 and Mozambique, and India.
Nasopharyngeal and laryngeal cancer - Biomass smoke has been implicated, though not consistently, in these types of cancers (Bruce et al., 2000).
Acute Respiratory Infection (ARI)Of these outcomes, the strongest evidence of causal linkage between biomass combustion emissions and ill health is with ARI in children (Smith, et al., 2000a; Ezzati and Kammen, 2001; Bruce et al., 2000). ARI is the primary cause of morbidity and mortality in children under five, causing more deaths and ill health than either malnutrition, diarrhoea, or childhood diseases like measles and mumps. The WHO (1995) estimates that over 4 million ARI-related deaths occurred in 1993 among children under five, which is about 25 per cent of all deaths in that age group. Children of this age group are affected to this degree because they spend a large amount of time indoors, close to the women of the household who do most of the cooking.
As a direct result of these health concerns, interventions targeting the reduction of emissions from biomass combustion have been incorporated into the improved cookstove agenda.
10 Bruce et al. (2000) cite a study by Boy et al. (2000) who observed an average difference in birth weights of 63 grams (P < 0.049) between babies whose mothers have been exposed to wood smoke during pregnancy and those who have not.
11 For example, in its 1996 census, South Africa reported more than 320,000 households (about 3.5%) cook primarily with coal (Government of RSA, 2000). Botswana, in its 1991 census, reported only 283 households (~0.1%) cook primarily with coal, and Zimbabwe, in its 1992 census, reported roughly 9,000 households (~0.4%) cook primarily with coal (Government of Botswana, 1991; Government of Zimbabwe, 1992). In addition, Ellegard (1993) reports on coal use in Maputo, Mozambique, though only 200-250 households were reported using coal and no national consumption levels were given. Much of the data reported here is out of date and is included to illustrate that coal has been used, and is quite likely still being used, in urban areas of Southern Africa. Corrected or updated reports of coal use in this region are welcomed by the authors.
Page 33 of 121

Emissions generally decrease and efficiency improves as cooking devices move along the ‘energy ladder’ discussed above. Accordingly, policy interventions have targeted both improving biomass stoves and encouraging the use of alternative fuels. The most common alternative fuels are non-renewable fossil fuels like kerosene, natural gas, and LPG. Renewable alternatives like biogas will be discussed in detail below. Figure 2 shows a comparison of the particulate emissions and efficiencies of different stove technologies from China and India, with the emissions and efficiencies of two types of wood burned in a three-stone fire and the efficiencies of two improved Kenyan charcoal stoves included for comparison (Zhang et al., 2000; Smith, et al., 2000c; Kammen, 1995b). Note the a rough negative correlation between stove efficiency and particulate emissions.
Figure 2 goes here
Within these interventions, there is a tension between the desire to move away from traditional biomass combustion and the desire to avoid increasing reliance on fossil fuels. Fossil fuels are costly, rely on imported resources, and require expensive stoves, which are often imported as well. It is also argued that a switch to fossil fuels results in an increase in GHG emissions. While this may seem a valid intuitive assumption where the biomass is harvested sustainably, recent work has shown that this may not be the case, even when every kilogram of combusted biomass is replaced by newly grown plant matter (Smith et al., 2000c). Figure 3 shows a diagram of energy and carbon flows from one kg of fuelwood burned in a traditional mud woodstove in India. See for a more detailed discussion of the results of this study.
Insert Figure 3 here
Improved biomass stoves can reduce emissions considerably, though not in all cases. Compare, for example, the emissions from ‘improved’ vented woodstoves to those from the traditional three-stone fires (Figure 2). Note also the large degree of variability in some measurements, represented by the error bars. Stove performance is highly variable, depending strongly on user behavior, fuel characteristics, and household microenvironment. Even when ‘improved’ solid fuel stoves do offer real improvement, they rarely reduce harmful emissions to the level of ‘clean’ liquid and gaseous cooking fuels. The resulting pollutant levels from improved stoves like the Kenyan Ceramic Jiko (KCJ) and the Maendaleo stove still result in ambient indoor concentrations of pollution that are well above standards set for outdoor air in industrialized countries (Ezzati, Mbinda and Kammen, 2000).
Insert here
2.3 Household use of biomass: Conclusions
More research and policy discussion is needed to determine the threshold of exposure below which morbidity and mortality from biomass combustion emissions fall to acceptable levels, and to determine the most appropriate stove/fuel combinations, technically and socially, to reach that level of emissions. Such research is particularly difficult because there are many confounding factors affecting the health of the target population, and epidemiological data is difficult to get for poor rural populations. In addition, monitoring exposure to pollutants in remote rural households is expensive, time consuming and potentially invasive for the monitored subjects.
While difficulties exist in pursuing a course of research, the alternative, to do nothing, is unacceptable. Biomass fuels will likely remain the primary energy source for most poor people in Africa, South and Southeast Asia, and, with coal, for people in China as well. A rapid switch
Page 34 of 121
to cleaner burning fossil fuels, on the scale of two to three billion people, is an extremely unlikely outcome. It is also an outcome that may not be desirable because of the GHG emissions and unfavorable balance of trade that may result. However, a gradual transformation of biomass utilization, away from burning raw biomass in smoky open hearths and simple metal stoves to cleaner, more efficient biomass energy conversion devices and/or fuels derived from biomass feedstock, is both more likely, and arguably more desirable (Ezzati and Kammen, 2001). There will be multiple benefits for short-term public health, by reducing IAP, as well as long-term environmental health, by reducing or eliminating GHG emissions. In addition, managing biomass resources for energy production can bring ancillary benefits to rural populations, including the restoration of degraded lands and creation of rural livelihoods by through jobs and income generating opportunities. This could indirectly result in improvements in public and environmental health as well. Needless to say, such positive outcomes are not guaranteed. One necessary, though not sufficient, criterion for successful biomass/bioenergy transformation is clearly defined land and tree tenure rights. Local communities must be confident that any improvements they initiate will not be taken over by state or corporate interests, and that they will be justly compensated if and when the resources under their control are used by outsiders. In addition to well-defined rules of tenure, programmes for biomass utilization and modernization will need to be flexible and adaptable to local needs, include the full participation of target populations, and have support from both the national government and the international community.
Page 35 of 121
3 Biomass energy beyond the household: Scaling up
3.1 Small and medium commercial businesses and institutions
Biomass energy is used for many commercial and small industrial applications in rural and peri-urban areas of developing countries. It is the principal source of energy for institutions like schools, health clinics, and prisons in LDCs, and it is an important input in larger energy intensive agro-industries like sugar refineries, sawmills, and pulp and paper manufacturers. At the small rural level, commercial applications of bioenergy are usually limited to providing process heat for productive value-adding activities like tobacco curing, tea drying, beer brewing, fish smoking, and brick firing. While these may seem like negligible activities, taken in aggregate they represent a significant amount of woodfuel consumption as well as an important source of rural employment.
For example, in Malawi, where tobacco is a major export crop, roughly 100 kg of wood are required to cure 6 kg of tobacco. It is estimated that as much as 24 per cent of the nation’s harvested fuelwood is used annually in the tobacco industry (Kaale, 1990). In Zimbabwe, households surveyed in one study reported a remarkable range of fuelwood consumption, between 20 and 1500 kilograms of fuelwood per year, to brew traditional beer (Campbell et al., 2000). Presumably, households that consume wood at the upper end of that range regularly brew beer for sale, while those at the lower end of the range brew beer strictly for household consumption. The same study in Zimbabwe estimated the net institutional demand for fuelwood (schools, prisons, health clinics and hospitals) was nearly 90,000 tons per year. Kituyi et al. (2001) estimate institutional fuelwood consumption in Kenya to be over 500,000 tons per year.12
The latter figure is disproportionately higher than Campbell’s estimation for Zimbabwe and hints at the uncertainty involved in these estimations as well as the possibility that consumption does not simply scale across national borders. Both local and national context is important in governing patterns of consumption.
Small institutions and commercial businesses may gather their fuelwood in a manner similar to households in rural areas. In regions where fuelwood is scarce, or where fuelwood markets have developed, they may purchase it in varying quantities. Larger institutions often enter long-term contracts with suppliers to bring agreed-upon quantities of wood at regular intervals.
Fuelwood traders procure their stock from different sources. In many cases, fuelwood is harvested from natural woodlands that are owned and, in theory, maintained by the state. State-owned forest resources are often undervalued, with little or no fees for access. If harvesters pay little or no stumpage fees, the supply-price of woodfuel can be artificially low because replacement costs are not internalized (Boberg, 1993; Ribot, 1998). However, the harvesters may be only the first step in a long supply chain; prices per unit of energy delivered to the end-user are often still higher than fossil fuels. Alternatively, fuel for small and medium commercial and institutional consumers can be supplied from land cleared from cultivation, from larger commercial farms, or from woodlots or plantations that were established specifically to supply woodfuel. Larger agro-processing industries often maintain their own fuelwood plantations,
12 The figure from Kenya includes charcoal consumption expressed as nearly 140,000 tons of round wood equivalent units, which is an estimate of the mass of fuelwood that was needed in order to produce the charcoal that was actually consumed by Kenyan institutions.
Page 36 of 121
usually in the form of fast-growing tree species like eucalyptus. Passing the Nyayo tea zones outside of Kericho in Kenya, one can see dozens of hectares of gum trees interspersed among a seemingly endless sea of tea shrubs.
Biomass not only drives commercial activity in LDCs. It also generates quite a lot of business activity on its own, specifically for the provision of fuel to urban and peri-urban consumers. It was mentioned above that fuelwood and charcoal markets have been in existence for quite a long time. They exist in a variety of forms, from highly organized vertically integrated markets to unorganized piecemeal operations. Some are tightly regulated by the state while others are completely laissez faire markets. These variations have been explored in detail by a number of authors (Leach and Mearns, 1988; Hosier, 1993a; Ribot, 1998), though their dynamic nature in the context of constantly growing urban populations and volatile fossil fuel markets deserves constant observation in order to inform sound policy decisions.
Also worth continued observation are the development of improved stoves and alternative fuels to serve the urban market. Woodfuel scarcity and high commercial fuel prices create a desire to optimize fuel consumption, and motivate the quest for alternate energy sources within the donor community as well as in urban households and small businesses. The commercialization and market development of improved stoves have been discussed at length in other fora (Smith et al., 1993; Kammen, 1995; Barnes et al., 1994; UNDP, 1997) and will not be discussed in detail here. On the other hand, alternative fuels for households and small businesses have long been discussed by energy development analysts, but have seen very little commercialization, especially in the African continent. Recent crises in Zimbabwe, mentioned earlier, have led to occasional brown-outs in the cities and have made kerosene, the preferred fuel in poor urban households, difficult to find and costly to purchase. This has had multiple effects. Primarily, it has put extreme pressure on woodlands around Harare and other major towns. Also, an alternate cooking fuel has entered the market. At some markets, gas stations, and hardware stores, one can now buy an ethanol-based gel fuel, made from sugar cane and starch, and small metal stoves designed especially for the fuel. The fuel and the stove each cost about double the price of kerosene and a new kerosene wick-stove respectively. The level of sales is unknown, although it is an interesting innovation worth following closely.
A second alternate fuel available in some African urban markets stems from an old idea: briquetting or pelletizing. Compacting loose, fibrous, or granular combustible material in order to make a uniform high quality fuel has many advantages. Dissagregated biomass, like sawdust, bagasse, and nut shells, generally has very low energy density and very poor combustion characteristics. Making compressed briquettes raises the energy density so that the fuel may be transported economically. Compression creates a fuel with uniform size and moisture content, which burns much more efficiently. To date, most attempts to commercialize biomass waste briquettes have failed because they cannot compete with charcoal or fuelwood. However, there are some notable exceptions. Case Study 3 illustrates the example of a private company in Kenya that is briquetting charcoal dust gathered from vending and distribution sites throughout Nairobi. At first glance, this may seem like a poor resource on which to base a business, but this company currently produces an impressive amount per day: nearly 8 tons of charcoal dust briquettes. Remarkably, most of this is waste that has accumulated over many years. The business barely takes advantage of the new dust arriving with each day’s charcoal shipments. Nairobi’s charcoal venders sell about 500 tons of charcoal every day. About 10 per cent of every sack of charcoal that arrives in the city, or 50 tons per day, is ground to unmarketable pieces and
Page 37 of 121
dust, either during the long journey from the production site 200 to 300 km away or when the 30 kg sack is divided for sale into 3 or 5 kg tins (the most common size for a household consumer to purchase). Given the size and number of charcoal markets in sub-Saharan Africa, not to mention the vast quantities of loose, dissagregate biomass wastes and residues that could be carbonized and briquetted in a similar process, the prospects for the expansion of this and related businesses are virtually limitless.
3.2 Potential to transform commercial and institutional biomass-based energy systems
The discussion of commercial and institutional bioenergy use in LDCs has so far concentrated on fuelwood for cooking and/or generating heat for value-adding processes. Like households, most small and medium commercial businesses and institutions in LDCs consume solid biomass fuels in simple combustion devices with low efficiencies and high emissions. In some places there have been considerable efforts to develop and disseminate improved institutional stoves, as with the Bellerive Stove and its offshoots in Kenya. However, there has been little effort thus far to modernize the use of biomass energy in this sector, to move beyond simple combustion of biomass for cooking and agro-processing into the production of high value energy carriers like liquid and gaseous fuels or electricity.
Rural businesses and institutions provide an untapped opportunity for transforming bioenergy consumption in LDCs. Demand for electricity in the domestic sector is small and intermittent, and any capital-intensive modern energy installation will likely have low capacity utilization if it targets household consumers alone. Small businesses and industries like grinding mills, carpentry shops and food processors, as well as institutions like schools and health clinics, have larger energy demands that are more predictable and consistent. Therefore, they represent a potential base-load that would make a modern energy installation economically viable. They are also able to mobilize capital better than individual households, and hold lower risk for the prospective energy service provider. Currently, there are technologies under development, or nearing the commercial stage, that are designed specifically for small and medium scale energy applications. In the past, small-scale options were limited to diesel generation, but now, wind generators, micro-hydro systems, and small modular biomass-based systems are technically feasible as well as increasingly affordable. For two concrete examples of different technologies that are currently filtering into rural applications, see: Case Study 1: Modular Biopower forCommunity-scale Enterprise Development, and Case Study 2: Scaling-up Biogas Technology in Nepal.
In addition, large industries that rely on biomass for raw material inputs also represent a largely untapped opportunity. Some industries, principally sugar refineries, pulp and paper manufacturers, and sawmills, use their biomass wastes to produce process-heat and/or electricity. But many of them operate inefficiently, and have little incentive to optimize their energy production or sell to excess power to other consumers.
For example, sugar cane processors in developing countries traditionally burn bagasse – the fibrous material remaining after cane juice is extracted – to raise steam, which is used as process heat and to provide shaft power for mechanical or electrical turbines. Processing sugar cane produces more bagasse, in energy terms, than the plant requires to produce sugar. When sugar refineries were built, the industry could have used the excess bagasse to produce electricity for sale. But there was no incentive to sell excess power, either to the national utility or to private consumers. As a result of this regulatory vacuum, the industry traditionally built its power
Page 38 of 121
generation equipment only to satisfy plant needs. Boilers were used as much to raise steam for cogeneration as to incinerate excess bagasse. Sugar refineries now typically produce roughly 10 kWh of electricity per ton of cane processed. Mature and commercially available condensing extraction steam turbine (CEST) technology can increase that power output per unit cane input by a factor of 5 to 10, and biomass integrated gas turbines with combined cycle steam injection (BIGCC), though not yet fully commercial, can raise it to ~200 kWh per ton of cane input. Figure 4 shows some characteristic conversion efficiencies for a range of available technical options.
Figure 4 goes here
Although many large sugar refineries throughout the world generate their own power, very few developing countries currently exploit sugarcane or other biomass-based power generation for public sale. One exception is Mauritius, where roughly 30 per cent of the island’s installed generation capacity is at sugar refineries. In 1998, the Mauritian sugar industry exported 195 GWh of excess electricity to the national grid – roughly 14 per cent of the national power production (Beeharry, 2001; Government of Mauritius, 2001). Most factories export power only during the harvest season, but three large companies have dual-fuel boilers that can provide power to the national grid throughout the year by burning bagasse during the harvest season and burning coal off-season. Woods and Hall (1994) report that one such factory produces roughly half of its power from bagasse and the other half from coal. In addition, Mauritius received a GEF grant to develop and test technical options to expand power generation by existing sugar mills, paying special attention to the feasibility of using the cane tops and leaves traditionally burnt off in the field before harvest. During the course of the project, which ended in 1997, average power conversion efficiency increased from 12.5 to 16.2 kWh per ton of cane. While this is a 30 per cent improvement, it is still well below efficiencies that can be achieved with readily available commercial technologies, as depicted in the intermediate entries of Figure 4 (GEF, 2000; Turn, 1999).
3.2.1 Liquid fuels from biomass: The case of ethanolA discussion of energy from sugar cane would not be complete without briefly touching on the production of liquid fuels, specifically ethanol or ethyl alcohol (C2H5OH). Ethanol is one of a suite of liquid fuels that can be derived from biomass feedstock.13 It is produced by fermentation of sugars, most frequently from maize or sugarcane. The net energy balance from a maize-ethanol system is marginally favorable or negative, depending on the assumptions that are made, but for sugarcane-based ethanol production it is quite positive.14 Ethanol can also be produced from woody biomass, though this is not a fully mature technology yet.
Sugarcane is the most photosynthetically efficient agronomic crop (Woods and Hall, 1994). It is associated with a large number of value-added by-products, including electricity, as described above. Ethanol produced from sugarcane in LDCs has been used primarily as a transportation fuel, though it also may be used as an industrial input and sold for export. Brazil has been a world leader in ethanol production, though several countries in Africa have also had experience
13 For a full description of the range of fuels that can be derived from biomass and the technology to derive them, see the discussion on liquid biofuels, page 48.
14 It is beyond the scope of this paper to discuss the range of opinions on the highly politicized issue of ethanol production from maize in the United States. For a view that contends the energy balance from maize-based ethanol production is positive, see Shapouri et al., 1995. For an argument concluding that it has a negative energy balance, see Pimentel, 1991.
Page 39 of 121
producing ethanol. Ethanol from sugarcane is attractive for many reasons, including the following:
It can replace a fraction of imported fossil fuels with a locally grown renewable energy source and improve a nation’s balance of trade.
It can assist with rural job creation.
It can reduce pollution emissions. Specifically, lead can be reduced or eliminated because ethanol can replace leaded compounds as an oxygenating agent. Ethanol can also reduce sulphur emissions as well as aromatics like benzene, though they do raise the emissions of some aldehyde compounds. Overall, the balance of harmful emissions should favor ethanol or ethanol-gasoline blends over gasoline alone (Moreira and Goldemberg, 1999; Rosillo-Calle and Cortez, 1998).
The Brazilian ethanol experience has been characterized as largely positive, though it has had its share of setbacks. See Case Study 4: Ethanol in Brazil, for a more detailed discussion.
Kenya, Zimbabwe, and Malawi have also produced ethanol from sugarcane, with mixed results. In Kenya, ethanol never received adequate or consistent support from the government and soon failed (Eriksen, 1995). The Malawi experience was more encouraging. In the early 1990s, production averaged 13 million litres per year, and ethanol was blended with gasoline in a ratio of 15:85. Unfortunately, these levels have not been maintained. Low oil prices, and tensions between the single national ethanol producer and the nation’s oil industry over marketing and pricing policies, have combined to keep ethanol production at sub-optimal levels (Karekezi and Ranja, 1997). In addition, Malawi’s experience has not been well documented, and the current status of the industry is unclear. Zimbabwe’s ethanol programme has had a moderate level of success. Scurlock et al. (1991) estimate that the blending of ethanol with gasoline reduced demand for the latter by 40 million litres per year through the early 1990s. However, as with Malawi, the low oil prices of the late 1990s, along with a domestic economic crisis, made ethanol much more valuable as an export commodity. To our knowledge, ethanol is no longer blended with petrol.
3.2.2 Energy from woody biomass – an example from CaliforniaIn addition to the sugar industry’s massive potential to generate power, woodwaste and agricultural residues throughout the developing world also offer an immense and untapped source of power. An example from an industrialized country, the United States, suggests one strategy to develop this resource. In the state of California in the year 2000, there were 29 operating woodwaste burning power plants, ranging in capacity from less than 5 MW to over 50 MW and contributing a total of 600 MW to California’s energy mix. California had an aggressive policy of favorable tax breaks and subsidies for RETs, based on kilowatt hours generated, throughout the latter half of the 1980s and early 1990s. Admittedly, 600 MW is small compared to California’s net demand: it is just over one per cent of the state’s installed capacity. However, 600 MW is close to, if not greater than, the national generating capacity of many African states. The point of using California as an example is not to compare the size of the state’s generating capacity with countries in Africa. Rather, it is to illustrate that favorable policies combined with readily available, well-tested technologies can have substantial results in establishing a large amount of renewable and sustainable generating capacity. Since California’s ‘biomass boom’ of 1984-1994, power sector deregulation and low petroleum prices have largely taken the incentives out of building new biomass capacity. Very few plants have been
Page 40 of 121

commissioned since 1996, when deregulation began to take effect, though the recent power crisis and GHG considerations may reverse that trend (Morris, 2000).15
Most of California’s biomass plants are 10-15 years old, and all of them use on fully mature technology commercially available technology. They rely entirely on woodwaste: sawmill residues, agricultural pruning and thinning, forest residues, and urban woodwaste. The disposal of this waste under optimized combustion conditions has led to a significant reduction in conventional air pollution and GHG emissions. In the absence of controlled combustion for power generation, which is low in conventional pollutants and largely free of GHG emissions other than CO2, the biomass fuel would have been burned openly, landfilled, or composted. Each of these alternative disposal techniques is higher than controlled combustion in one or more category of pollutant. Figure 5 shows some emissions factors for controlled combustion of biomass for energy production and alternative biomass disposal techniques. The figure suggests that multiple benefits can be gained from medium to large-scale biomass-waste based power production. Combustion processes are easily controllable and emissions can be cleaned downstream, reducing NOx and particulates.
Insert Figure 5 here
3.2.3 Supply of biomass for commercial and industrial use in LDCsResidues are a particularly important potential biomass energy source in densely populated regions, where much of the land is used for food production. In fact, biomass residues play important roles here precisely because the regions produce so much food: crop production can generate large quantities of byproduct residues. For example, in 1996, China generated crop residues in the field (mostly corn stover, rice straw, and wheat straw) plus agricultural processing residues (mostly rice husks, corn cobs, and bagasse) totalling about 790 million tonnes, with a corresponding energy content of about 11 EJ. This means that, if half of this resource were to be used for generating electricity at an efficiency of 25 per cent (achievable at small scales today), the resulting electricity generation would be about half of the total electricity generated from coal in China in 1996. Of course, most of China’s residue consumption is in traditional combustion devices. Residues yield about 35 per cent of the rural population’s total household energy consumption and 20 per cent of the national total (China Agricultural Statistical Yearbook, 1996 and China Energy Statistical Yearbook, 1996).
There is also a significant potential for providing biomass for energy by growing crops specifically for that purpose. The IPCC's biomass intensive future energy supply scenario discussed previously includes 385 million hectares of biomass energy plantations globally in 2050 (equivalent to about one quarter of present planted agricultural area), with three quarters of this area established in developing countries. Such levels of land use for bioenergy raises the issue of intensified competition with other important land uses, especially food production. Competition between land use for agriculture and for energy production can be minimized if degraded land and surplus agricultural land are targeted for energy crops. Though these lands have a lower productivity, there can be secondary benefits from targeting them for bioenergy plantations, including restoration of degraded land and carbon sequestration. In developing countries in aggregate, about 2 billion hectares of land have been classified as degraded, though this land is certainly not entirely unoccupied. While there are many challenges (technical, socioeconomic, political and so on) to successfully growing energy crops on degraded lands, we 15 See also the California Energy Commission’s website for the installed capacity and annual power generation from
biomass power plants in California: www.energy.ca.gov
Page 41 of 121

know that such challenges have been overcome. Successful plantations have already been established on degraded lands in many developing countries.
Two approaches to producing energy crops are: devoting an area exclusively to production of such crops, and co-mingling the production of energy and non-energy crops either on the same piece of land (agro-forestry) or on adjacent pieces of land (farm forestry). Since energy crops typically require several years to grow before the first harvest, the second approach has the benefit of providing the energy crop farmer with revenue from the land between harvests of energy crops. In Sweden, productive heat power generation from willow plantations has been successful; experiences in small-scale fuelwood production also are found in India, China, and elsewhere.
3.2.4 Jobs in the commercial biomass sector: Biomass-based industries are also a significant source of jobs in rural areas, where the high unemployment that often drives people to towns and cities for employment divides families and, in the process, exacerbates problems of urban decay. In comparison to other fossil and renewable energy production, biomass is relatively labour intensive, even in industrialized countries with highly mechanized industries. Traditional bioenergy provision also creates a significant source of employment. Kituyi et al. (2001) report that 33 per cent of randomly selected respondents in one charcoal-producing area claimed charcoal production as a source of income. However, it should not be assumed that all rural areas in LDCs are characterized by surplus unskilled labour, and therefore automatically provide a pool of workers for labour-intensive bioenergy projects. Employment in rural areas is primarily agricultural and hence highly seasonal. It also moves in longer cycles, coinciding with good and bad harvests, that can have ripple effects extending into the formal economy. For example, one study has shown that charcoal prices through the 1970s and 1980s in Sudan’s highly organized market were driven largely by the availability of labour (DeWees,1987, cited in Mearns, 1995). Real prices varied by a factor of two or more in a 10-year span, as charcoal production wages were driven up by high agricultural wages during years of good harvest, and back down again during years of drought.
There is also a significantly gendered aspect to labour. In many regions, men of the household leave to seek formal employment in towns and cities, which then places greater demands on women’s labour in the home and on the farm. Planners must be aware of competing claims on rural labour before initiating a project, to ensure that labour requirements fit local availability and that unreasonable demands are not placed on women, whose labour often goes unrecognized and unrewarded. Table 3 shows employment rates reported in various published sources for some selected biomass-based activities.
Insert Table 3 here.
3.2.5 Environmental impacts of medium and large-scale biomass utilization Environmental impacts of biomass production must be viewed in comparison to the likely alternative impacts (local, regional, and global) without the bioenergy system in place. At the local or regional level, for example, the relative impacts of producing bioenergy feedstocks will depend not only on how the biomass is produced, but also on what might have happened otherwise. Some life cycle analyses (LCAs) have shown that, where biomass displaces fossil fuel energy systems, as when a bagasse-fired boiler replacing coal or oil to drive a steam turbine, there will be a reduction in overall greenhouse gas emissions. For other types of emissions (i.e.,
Page 42 of 121
NOx, SO2, N2O) the picture is less clear. In these cases, whether an LCA results in an increase or decrease in emissions of these criteria pollutants depends on a number of assumptions that the analysts make, including assumptions about the type of biomass and the alternative use(s) of the land on which it is produced, as well as the technical details of the conversion process and the fossil fuel that is being displaced.
In contrast to agricultural food and cash crops, which are subject to restrictive demands on quality in terms of taste, nutritional content, and appearance, many bioenergy systems offer flexibility in choice of feedstock as well as the manner in which it is produced. This flexibility makes it easier to meet the simultaneous challenges of producing biomass energy feedstock and meeting environmental objectives. For example, bioenergy crops can be used to revegetate barren land, reclaim water logged or saline soils, and stabilize erosion-prone land, most of which would be unsuitable for cash or food crops. Biomass energy feedstock, when properly managed, can both provide habitat and improve biodiversity on previously degraded land.
Erosion and removal of soil nutrients are problems related to the cultivation of annual crops in many regions of the world. Energy crops could be fast-growing trees that require harvest only every couple of years and are replanted every 15-20 years, or perennial grasses that are harvested every year and replanted every ten years – compared to annual planting and harvesting of conventional crops, these practices reduce the disturbance of the soil. In addition, where natural forests are being infringed upon, the use of buffer zones or shelter belts is critical in preserving a core of undisturbed forest to act as a reservoir of biodiversity and a source of non-timber forest products (NTFPs). Well-managed buffer zones are ideal bioenergy production zones. The establishment of such zones adjacent to core centers of natural forest can result in benefits flowing both from buffer zone to core and from core to buffer zone: the result of multiple social and ecological synergies (Niles and Schwarze, 1999).
Possibly the biggest concern, and perhaps the most limiting factor to the spread of bioenergy crops, is the demand on available water supplies, particularly in (semi-) arid regions. The choice of a certain energy crop can have a considerable effect on its water-use efficiency. Certain Eucalyptus species, for example, have very good water-use efficiency when the amount of water needed per ton of biomass produced is considered. But a Eucalyptus plantation on a large area could increase the local demand for ground water and affect groundwater level. On the other hand, energy crops on previously degraded land will improve land cover, which generally has positive effects on water retention and micro-climate conditions. As with soils, the impacts on local hydrology always need to be evaluated on a case-by-case basis.
Biodiversity and landscape is also a concern. Biomass plantations are frequently criticized because the range of biological species they support is much narrower than natural ecosystems. While generally true, this is not always the best measure of a project’s impact. True, there would be a detrimental impact if a virgin forest were to be replaced by a biomass plantation. But when a plantation is established on degraded lands or on excess agricultural lands, the restored lands are very likely to support a more diverse ecology. The restoration of such land is generally desirable for purposes of water retention, erosion prevention and (micro-) climate control. This issue needs more research with specific local conditions, species, and cultural aspects taken into account.
In addition to the environmental concerns of land and water quality from biomass production there are also strict air quality standards that must be met during biomass to energy conversion processes. Generally, large-scale combustion emissions can be controlled with well-understood
Page 43 of 121

and commercially available technology, as has been developed and implemented in the fossil fuels industry. Unfortunately, it is often expensive to implement. For example, although the technology to meet strict emission standards is available for small (less than 1 MW) conversion systems, it still can have a serious impact on the investment and operational costs of these systems.
Lastly, a major environmental concern is, of course, the potential for bioenergy systems to mitigate climate change by the direct displacement of fossil fuels. It is also possible that biomass, either naturally regrown, or managed in plantations, woodlots, or agroforestry systems, can be used as a carbon sink to offset emissions (IPCC, 2000b). While we do not offer a full treatment of this technically complex and socially contentious issue, we will return to it briefly in our discussion of biomass and its role in climate change mitigation in Section VI below.
3.3 Scaling up: Conclusion
Utilization of biomass wastes and residues to produce commercial energy services is an initial step toward transforming bioenergy from a predominantly traditional energy source into a renewable source of high-quality fuels and electricity. Rural industries that rely on large amounts of biomass inputs are particularly well placed to initiate this transformation, though it will not proceed without an enabling policy environment, and adequate public and private sector investment.
Scaling-up and modernizing biomass energy requires a significant shift in the way people think about biomass and ‘modern’ energy services. In addition to technical challenges, there are many institutional and commercial barriers. Progress can occur only in stages, with different pilot projects focused on overcoming different barriers, rather than with each individual project being obliged to overcome all of the barriers on its own and at one time. A good example of this strategy comes from the United States Department of Energy’s National Renewable Energy Laboratory (NREL) Small Modular Biomass Project (SMB). The SMB project is proceeding in three stages, with each stage acting as a selection process to choose the candidates most likely to succeed, and moving the participants closer to full commercialization. See Bain (2000) for a review of the project as it entered its second stage. See Case Study 1: Modular Biopower forCommunity-scale Enterprise Development, which relates the experiences of one company that was a successful participant in the SMB programme.
Another example of the step-by-step learning we recommend is the aggressive utilization of agro-industrial wastes and residues. This would permit government and private industrial actors to progress along the learning curve of bioenergy production, while allowing them to avoid potentially serious environmental problems associated with intensive bioenergy crop production, as well as socioeconomic barriers like competition with food and cash crop systems. These environmental and socioeconomic barriers can be addressed in due time, after the technical and policy hurdles have been overcome using low or negative cost feedstock like biomass wastes and residues.
Thus far, we have avoided detailed discussion of the various technologies available to convert biomass into modern forms of energy. In the next section, we will briefly review some of the technological options currently available, or in development, for bioenergy production.
Page 44 of 121
4 Biomass energy conversion technologies
Biomass for bioenergy comes either directly from the land, in the form of dedicated energy crops, or from residues generated in processing foodcrops and other products, such as pulp and paper from the wood industry. Another important contribution is from post-consumer residue streams such as construction and demolition wood, pallets used in transportation, and the clean fraction of municipal solid waste (MSW). The biomass-to-bioenergy system can be viewed as the management of flow of solar-generated materials, food, and fibre in our society. These inter-relationships are shown in Figure 6, which presents the various resource types and applications, showing the flow of their harvest and residues to bioenergy applications. Not all biomass is directly used to produce energy; rather, it can be converted into intermediate energy carriers such as charcoal, ethanol, or producer-gas.
Insert Figure 6 here
Biomass typically accounts for 3 or 4 per cent of total energy use in industrialized countries, Where policies supportive of biomass use are in place, as in Austria, Sweden, or Finland, the biomass contribution is higher: 12, 18, and 23 per cent respectively. Most biomass in industrialized countries is converted into electricity and process heat in cogeneration systems (combined heat and power production) at industrial sites or municipal district heating facilities. In this manner, a greater variety and number of energy services are derived from the biomass. These services are cleaner, and use the available biomass resources more efficiently, than is typical in developing countries.
Biomass energy has the potential to be ‘modernized’ worldwide, that is, produced and converted efficiently and cost-competitively into more convenient forms such as gases, liquids, and electricity. A variety of technologies can convert solid biomass into clean, convenient energy carriers over a range of scales from household/village to large industrial. Some of these technologies are commercially available today, while others are still in the development and demonstration stages. If widely implemented, such technologies can enable biomass energy to play a far more significant role in the future than it does today, especially in developing countries.16 In addition, modernized biomass energy is projected to play a major role in the future global energy supply. While future energy scenarios are beyond the scope of this paper, we include a short discussion of the role of biomass in some of these scenarios. See Box 3 for some projections of the contribution of biomass to future global energy production.
4.1 CombustionDirect combustion remains the most common technique for deriving energy from biomass for both heat and electricity. In colder climates, biomass-fired domestic heaters are common, and recent developments have led to the application of automated systems which use standardized fuel such as wood-waste pellets. The efficiency benefit compared to open fireplaces is considerable; advanced domestic heaters obtain efficiencies of over 70 per cent with greatly reduced atmospheric emissions. In addition, biomass-fired district heating is common in the Scandinavian countries, Austria, Germany and several Eastern European countries.
16 Much has been written about the role of ‘modern’ biomass in the energy futures of developing countries. For some of the more recent publications see Larson (ed. 2000); Kartha and Larson (2000); Kartha and Leach (2001).
Page 45 of 121
The predominant technology in the world today for electricity generation from biomass, at scales above one megawatt, is direct combustion of biomass in a boiler to raise steam, which is then expanded through a turbine. The typical capacity of existing biomass power plants ranges from 1 to 50 MWe with an average around 20 MWe. Steam cycle plants are often located at industrial sites, where the waste heat from the steam turbine can be recovered and used in industrial processing. Such combined heat and power (CHP) systems provide higher efficiencies than systems that only generate power. By utilizing waste heat combined efficiencies of 80 per cent are possible. Compared to the steam power generating capacity installed in OECD countries, there is relatively little capacity installed in developing countries. The most significant installation of such capacity is most common in sugar refining using bagasse, the fibre residue that remains after juice extraction from sugarcane, as a fuel (see the discussion above).
The costs of biomass steam power generating systems vary widely, depending on technical factors. An important characteristic of steam turbines and boilers is that their capital costs are scale-sensitive. This, together with the fact that biomass steam systems are constrained to relatively small scales due to fuel transport costs, typically creates systems that are designed to reduce capital costs at the expense of efficiency. For example, biomass-fired systems are typically designed with much more modest steam pressure and temperature than is technically feasible, which allows lower grade steels to be used in boiler tubes: a cheaper but less energetically efficient outcome.
An alternative to direct-fired biomass combustion technologies described above, and considered the nearest term low-cost option, is biomass co-combustion with fossil fuels in existing boilers. Successful demonstrations using biomass as a supplementary energy source in large high efficiency boilers show that effective biomass fuel substitution can be made in the range of 10-15 per cent of the total energy input with minimal plant modifications and no impact on the plant efficiency and operation. This strategy is economical when the biomass fuels are lower cost than the fossil fuels used. For fossil fuel plant capacities greater than 100 MWe, this can mean a substantial amount of displaced fossil fuel, which results in substantial emissions reductions, particularly for coal-fired plants.
4.2 GasificationCombustible gas can be produced from biomass through a high temperature thermochemical process. The term gasification commonly refers to this conversion, and involves burning biomass without sufficient air for full combustion, but with enough air to convert the solid biomass into a gaseous fuel (Reed and Gaur, 2000). The intended use of the gas and the characteristics of the particular biomass (size, texture, moisture content, etc.) determine the design and operating characteristics of the gasifier and associated equipment. After appropriate treatment, the resulting gases can be burned directly for cooking or heat supply, or used in secondary conversion devices, such as internal combustion engines or gas turbines, for producing electricity or shaft power. The systems range from small-scale (5-100 kW), suitable for the cooking or lighting needs of a single family or community, up to large grid connected power or CHP facilities consuming several hundred kilograms of woody biomass per hour and producing 10-100 MW of electricity. Biomass gasification is not yet fully commercialized, though many projects of different scales have been attempted and have yielded valuable lessons.17 R&D could help initiate pilot scale projects that would facilitate commercialization of the technology.
17 See Larson (ed. 2000) for a recent review of experiences in India and Brazil, and Reed and Gaur (2000) for a review of small and medium gasification research, development, and commercialization around the world.
Page 46 of 121

At the intermediate scale, producer-gas from biomass gasification can be used in modified internal combustion diesel or gasoline engines, where it can replace 70-80 per cent of the diesel or 100 per cent of the gasoline required by the engine. These smaller scale biomass gasifiers, coupled to diesel/gas internal combustion engines, operate in the 10-200 kWe range with efficiencies on the order of 15-25 per cent, and have been made available commercially. However, they have had limited operational success due to gas cleaning, relatively high costs and the required careful operation, which has so far blocked application in large numbers. In addition, a reliable and technically appropriate fuel supply is a critical issue that requires careful planning, particularly for remote rural applications.
Generally, these smaller gasification/engine systems target isolated areas where grid-connections are either unavailable or unreliable so they can be cost competitive in generating electricity. Efforts to make these systems more workable are under way. In particular, the United States National Renewable Energy Laboratory (NREL) is funding a small modular biopower project to develop biomass systems that are fuel flexible, efficient, simple to operate, have minimum negative impacts on the environment, and provide power in the 5 kW-5 MW range (Bain, 2000). There is particularly strong interest in the quality-of-life improvements that can be derived from implementing such gasifier/engine technology for electricity generation at the village scale in developing countries.
4.3 Anaerobic digestionCombustible gas can also be produced from biomass through the biological processes of anaerobic digestion. Biogas is the common name for the gas produced either in specifically designed anaerobic digesters or from decomposing municipal waste in landfills. Almost any biomass can be converted to biogas, though woody biomass presents a technical problem because lignin, a major component of wood, is not digestible by bacteria. Animal and human wastes, sewage sludge, crop residues, carbon-laden industrial byproducts, and landfill material have all been used.
Biogas can be burned to provide energy for cooking and space heating, or to generate electricity. Digestion has a low overall electrical efficiency (roughly 10-15 per cent, strongly dependent on the feedstock) and is particularly suited for wet biomass materials. Direct non-energy benefits are especially significant in this process. The effluent sludge from the digester is a concentrated nitrogen fertilizer, with the pathogens in the original feedstock largely eliminated by the warm temperatures in the digester tank.
Anaerobic digestion of biomass has been demonstrated and applied commercially with success in many situations and countries, particularly developing countries. In India, biogas production from manure and wastes is applied widely in many villages and is used for cooking and power generation. Small-scale digesters have been used most extensively in India and China. Over 1.85 million cattle-dung digesters were installed in India by the mid-1990s, but about one-third of these are not operating for a variety of reasons, primarily insufficient dung supply and difficulties with the organization of dung deliveries. A mass popularization effort in China in the 1970s led to some 7 million household-scale digesters being installed, using pig manure and human waste as feed material. Many failed to work, however, due to insufficient or improper feed characteristics, or poor construction and repair techniques. Estimates were that some 3 to 4.5 million digesters were operating in the early 1980s. Since then, research, development, and dissemination activities have paid greater attention on proper construction, operation, and
Page 47 of 121

maintenance of digesters. According to one estimate, there were some 5 million household digesters in working condition in China as of the mid-1990s.
Several thousand biogas digesters are also operating in other developing countries, most notably South Korea, Brazil, Thailand and Nepal. In addition, there are an estimated 5,000 digesters installed in industrialized countries, primarily at large livestock processing facilities (stockyards) and municipal sewage treatment plants. An increasing number of digesters are located at food processing plants and other industrial facilities. Most industrial and municipal digesters are used predominantly for the environmental benefits they provide, rather than for fuel production. See Case Study 2: Scaling-up Biogas Technology in Nepal, for a discussion concerning recent biogas dissemination in Nepal.
4.4 Liquid biofuelsBiofuels are produced in processes that convert biomass into more useful intermediate forms of energy. There is specific interest in converting solid biomass into liquids, which have the potential to replace petroleum-based fuels used in the transportation sector. However, adapting liquid biofuels to our present day fuel infrastructure and engine technology has proven to be difficult. Only oil producing plants, using soybeans, palm oil trees and oilseeds like rapeseed, can produce compounds similar to hydrocarbon petroleum products, and have been used to replace small amounts of diesel. This ‘biodiesel’ has been marketed in Europe and to a lesser extent in the United States, but it requires substantial subsidies to compete with conventional diesel fuel.
Another family of petroleum-like liquid fuels is a class of synthesized hydrocarbons called Fischer-Tropsch (F-T) liquids. These are produced from a gaseous feedstock, potentially gasified biomass, though more commonly coal-gas or natural gas would be used. F-T liquids can be used as a sulphur-free diesel or blended with existing diesel to reduce emissions, which is an environmental advantage. F-T liquids have yet to be produced economically on a large scale, but R&D efforts continue.18
Other alternatives to petroleum-based fuels are alcohols produced from biomass, which can replace gasoline or kerosene. The most widely produced today is ethanol, from the fermentation of biomass. In industrialized countries, ethanol is most commonly produced from food crops like corn, while in the developing world it is produced from sugarcane. Its most prevalent use is as a gasoline fuel additive to boost octane levels or to reduce dependence on imported fossil fuels. In the United States and Europe, the cost of ethanol production is not competitive compared to gasoline and diesel prices, and the overall energy balance of such systems is only marginally favourable (see footnote Error: Reference source not found).
The Brazilian Proalcool ethanol programme, initiated in 1975, has been successful due to the high productivity of sugarcane, and subsidies. Although ethanol was subsidized for many years, these subsidies have recently been phased out and it will be very interesting to see how the market responds (UNDP, 2000). See Case Study 4: Ethanol in Brazil for a more detailed discussion of the Brazilian ethanol experience. Two other potential transportation biofuels are methanol and hydrogen. They are both produced from biomass feedstock and may be used in either internal combustion engines or in fuel cells, but neither is close to commercialization.
18 See Larson and Jin, 1999a and 1999b, for an assessment of the energy balance and a financial analysis of biomass-based F-T systems in China, including comparisons to F-T systems using coal and natural gas feedstock.
Page 48 of 121
Ethanol production from maize and sugarcane has become widespread and, in some cases, quite successful. However, the supply of feedstock can suffer from commodity price fluctuations. This was seen in Brazil, with the price of sugar relative to ethanol on the global market affecting cane supply for ethanol production. See Moreira and Cortez (1999) for a more detailed discussion. Moreover, the economics of ethanol as a transportation fuel are always dependent on the international price of petroleum. Consequently, the production of ethanol from woody biomass is being given serious attention, but cheap and efficient processes are still under development and some fundamental technical issues need to be resolved.
4.5 Bioenergy conversion technologies: Conclusions
Biomass is one of the renewable energy sources that can make a large contribution to the developing world’s future energy supply. Latin America, Africa, Asia and, to a lesser extent, Eastern Europe, represent a large potential for biomass production. The forms in which biomass can be used for energy are diverse, Optimal resources, technologies and entire systems will be shaped by local conditions, both physical and socio-economic in nature.
Though we have mentioned it numerous times, it bears repeating that the majority of people in developing countries will continue using biomass as their primary energy source well into the next century. A critical issue for policy-makers concerned with public health, local environmental degradation, and global environmental change is that biomass-based energy truly can be modernized, and that such a transformation can yield multiple socioeconomic and environmental benefits. Conversion of biomass to energy carriers like electricity and transportation fuels will give biomass a commercial value, and potentially provide income for local rural economies. It will also reduce national dependence on imported fuels, and reduce the environmental and public health impacts of fossil fuel combustion. To make progress, biomass markets and necessary infrastructure must be developed with the realization that the large-scale commoditization of biomass resources can have negative impacts of poor households that rely on biomass for their basic needs. Hence, measures must be taken to ensure that the poor have an opportunity to participate in, and benefit from, the development of biomass markets.
In addition, high efficiency conversion technologies and advanced fuel production systems for methanol, ethanol and hydrogen must be demonstrated and commercialized, and experiences in industrialized and developing countries shared openly. Further, projects must not be concentrated in one country or region. Biomass is obviously a resource that intimately depends on local environmental factors, and experiences gained in Brazil will not wholly apply in, say, Bangladesh or Burkina Faso. The benefits of modernized bioenergy systems will only be enjoyed globally if efforts are made to gain experience in a wide variety of ecological and socioeconomic venues.
Page 49 of 121

5 Renewable energy technologies: Markets and costs
Since oil supplanted coal as the dominant energy source in industrialized countries, the development of renewable energy technologies (RETs) has been driven by the vagaries of fossil fuel markets. Oil ‘price shocks’ of the 1970s and 1980s led to surges of interest in advancing non-fossil fuel energy options. However, with the exception of certain geographic or technological niches, interest in and funding for RET R&D waned as oil crises subsided, leaving RETs less economically competitive than fossil fuel-based energy systems.
More recently, rather than facing price shocks, we have been presented with a quite different situation. Fossil fuel prices have been sustained at relatively low levels for over a decade but, simultaneously, there has been a growing awareness of the high external costs of fossil fuel consumption (primarily global climate change and adverse impacts on human and environmental health). This situation is compounded by the lack of universal consensus on the severity and extent of the external costs, and what measures, if any, are be taken to mitigate them. Moreover, the external costs are not distributed equitably in space or time. People enjoying the benefits of fossil fuel energy consumption are not necessarily the same people who will incur the costs of climate change.
Despite these unprecedented challenges, the majority of industrialized nations, countries in transition, and to a lesser extent, developing countries, have agreed to take steps to reduce their emission of GHGs. While most of the GHG emissions from the energy sector currently occur in industrialized countries, this is projected to change by 2035, when industrial GHG emissions from LDCs are expected to surpass those of industrialized nations (UNDP, 2000). One of the principal ways to reduce GHG emissions is to make a transition away from conventional fossil fuel-based energy systems. In so doing, countries will come to rely increasingly on RETs. More research in, and production of, RETs should bring costs down to a level that is more competitive with fossil fuel-based energy systems.
Technical advances and cost reductions in RETs in the near term will directly affect the future energy path of developing countries, thanks to mechanisms like the CDM, which have been put in place to enable efficient climate change mitigation while promoting technology transfer and achieving sustainable development goals in LDCs (IPCC, 2000). In this section, we discuss the economics of RET development and dissemination, looking first at recent trends and then at forecasts for future costs of RET power generation. We also address lessons applicable to developing countries, and ways to implement policies that enable and encourage the development and use of RETs over fossil fuel-based energy systems.
5.1 Recent progress in renewable energy system cost and performance
Both wind and solar power have made great strides since their initial push following the first oil ‘price shock’ of the 1970s. The installed capital costs of wind energy systems have declined from about $2,500 per kW in the mid-1980s, to about $1,000 per kW in the mid-1990s (Chapman et al., 1998). The American Wind Energy Association (AWEA) estimates that the current levelized costs of wind energy systems range from 4.0 to 6.0 cents per kWh, and that the costs are falling by about 15% with each doubling of installed capacity. Installed capacity has doubled three times during the 1990s and wind energy now costs about one-fifth as much as it did in the mid-1980s (AWEA, 2000). Design and manufacturing advances, along with further
Page 50 of 121
economies of scale, are expected to bring the levelized costs of wind power down to 2.5 to 3.5 cents per kWh over the next ten years (U.S. DOE, 1997; Chapman et al., 1998). Wind turbine performance has also increased, and is expected to improve. The United States Department of Energy (DOE) is forecasting a 25-32 per cent improvement in net energy produced per area swept by 2010, from a 1996 baseline, rising to 29-37 per cent in 2020, and 31-40 per cent in 2030 (U.S. DOE, 1997).
Solar energy technologies have also been declining significantly in cost. In Japan, solar photovoltaic (PV) module prices have declined from 26,120 yen per watt in 1974, when the ‘Sunshine Project’ was started, to 1,200 yen per watt in 1985, and 670 yen per watt in 1995 (in constant Year 1985 yen) (Watanabe, 2000). DOE reports that from 1976 to 1994, PV modules have experienced an 18 per cent reduction in cost with each doubling of production, with costs falling from over $30 per watt in 1976 to well under $10 per watt by 1994 (U.S. DOE, 1997). Meanwhile, thin film PV cells tested in laboratories are showing efficiencies of over 17 per cent, compared with about 13 per cent in 1990 and 10 per cent in 1980 (U.S. DOE, 1997).
In addition to the progress in cost reduction made by wind and PV systems, other renewable energy systems based on biomass, geothermal, and solar thermal technologies are also experiencing cost reductions which are forecast to continue. Figure 1 presents forecasts made by the U.S. DOE for the capital costs of these technologies, from 1997 to 2030.
Insert Figure 7 here:
Of course, capital costs are only one component of the total cost of generating electricity, which also includes fuel costs, and operation and maintenance costs. In general, renewable energy systems are characterized by low or no fuel costs, although operation and maintenance (O&M) costs can be considerable. Note, however, that O&M costs for all new technologies are generally high, and can fall rapidly with increasing familiarity and operational experience. Renewable energy systems such as photovoltaics contain far fewer mechanically active parts than comparable fossil fuel combustion systems, and therefore are likely to be less costly to maintain in the long term. Figure 8 presents U.S. DOE projections for the levelized costs of electricity production from these same renewable energy technologies, from 1997 to 2030.
Insert Figure 8 here:
Given these likely capital and levelized system cost reductions, recent analyses have shown that additional generating capacity from wind and solar energy can be added at low incremental costs relative to additions of fossil fuel-based generation. These incremental costs would be further offset by environmental and human health benefits. Furthermore, a United States National Renewable Energy Laboratory (NREL) analysis shows that geothermal and wind energy could actually become more economic than coal in the next 15 years (Swezey and Wan, 1996).
Another analysis conducted by the Renewable Energy Policy Project (REPP) shows that adding 3,050 MW of wind energy production in Texas, over a ten-year period, would entail only modest additional costs to residential customers. REPP estimates these additional costs to be about US$0.75 per month for a household using 1,000 kWh per month, or about US$9 annually (Chapman et al., 1998).
The economic picture for renewables looks even better when environmental costs are considered along with capital and operating costs. As shown in Figure 9, geothermal and wind can be competitive with modern combined-cycle power plants. And geothermal, wind, and biomass all
Page 51 of 121

have lower total costs than advanced coal-fired plants, once approximate environmental costs are also included.
Insert Figure 9 here
Shell Petroleum has made one of the highest profile projections of future renewables growth. As shown in Figure 10, Shell projects that renewables could constitute about 15 per cent of the OECD’s energy production by 2020, and that renewables and natural gas combined could account for about 50 per cent of total production (Shell, 2000).
Insert Figure 10 here
Some of the implications of these cost reductions in RETs for developing countries will be explored in the next section.
5.2 Lessons learned in developing countries
In developing nations, renewable energy technologies are increasingly used to address energy shortages and to expand the range of services in both rural and urban areas. In Kenya, over 80,000 small (20-100 Wp) solar PV systems have been commercially financed and installed in homes, battery charging stations, and other small enterprises (Kammen, 1999; Duke and Kammen, 1999; Duke et al., 2000). Meanwhile, a government programme in Mexico has disseminated over 40,000 such systems. In the Inner Mongolian autonomous region of China, over 130,000 portable windmills provide electricity to about one-third of the non-grid-connected households in this region (IPCC, 2000a).
These case studies demonstrate that the combination of sound national and international policies and genuinely competitive markets, the so-called ‘level playing field’, can be used to generate sustainable markets for clean energy systems. They also show that renewable energy systems can penetrate markets in the developing world, even where resources are scarce, and that growth in the renewables sector need not be limited to applications in the developed world. Just as some developing countries are bypassing construction of telephone wires by leaping directly to cellular-based systems, so too might they avoid building large, centralized power plants and instead develop decentralized systems. In addition, to help mitigate the environmental costs of electrification, this strategy can also reduce the need for construction of large power grids.
Despite their recent limited success, renewable energy sources have historically had a difficult time breaking into markets that have been dominated by traditional, large-scale, fossil fuel-based systems. In part, this is because renewable and other new energy technologies are only now being mass produced, and have previously had high capital costs relative to more conventional systems. This is also partly because coal, oil, and gas-powered systems have benefited from a range of subtle subsidies over the years. These include military expenditures to protect oil exploration and production interests overseas, the costs of railway construction that have enabled economical delivery of coal to power plants, and a wide range of smaller subsidies.
However, another limitation has been the intermittent nature of some renewable energy sources, such as wind and solar. One solution to this last problem is to develop diversified systems that maximize the contribution of renewable energy sources, but that also use clean natural gas and/or biomass-based power generation to provide base-load power when the sun is not shining and the wind is not blowing.
Page 52 of 121
In essence, however, renewable energy technologies face the same situation confronting any new technology that attempts to dislodge an entrenched technology. For many years, industrialized countries have been ‘locked into’ a suite of fossil fuel and nuclear-based technologies, and many secondary systems and networks have been designed and constructed accordingly. Just as electric-drive vehicles face an uphill battle to dislodge gasoline-fueled, internal combustion engine vehicles, so, too, do solar, wind, and biomass technologies face obstacles to replace modern coal, oil, and natural gas power plants. See Box 4 for a description of technological ‘lock-in’, and some historical examples of the commercialization of new technologies in the energy sector.
Insert Box 4 here
5.3 Levelling the playing field
As shown in Figure 9, renewable energy technologies tend to be characterized by relatively low environmental costs. In an ideal world, this would help them compete with conventional technologies but, of course, many of these environmental costs are ‘externalities’ that are not priced in the market. Only in certain areas, and for certain pollutants, do these environmental costs enter the picture, and, clearly, further internalizing these costs would benefit the spread of renewables. The international effort to limit the growth of greenhouse emissions through the Kyoto Protocol may lead to some form of carbon-based tax, and this could prove to be an enormous boon to renewable energy industries. More likely, concern about particulate matter emission and formation from fossil-fuel power plants will lead to expensive mitigation efforts, and this may tip the balance toward cleaner renewable systems.
5.3.1 Public and Private Sector Investment IssuesA fundamental problem with any new technology is that, by definition, it does not have the track record of performance that exists for older, more established systems. Proponents of existing technologies often cite this fact to support their mistaken arguments against technological change. New technologies and operational procedures do carry greater risks, but at the same time offer greater opportunities for innovation and profit. A comparison of current costs for fossil-fuel and renewable energy systems in Figure 11 illustrates the greater range of costs for newer technologies.
Insert Figure 11 here
Emerging energy systems were long seen as an area of risky investments; the history of renewable energy systems was used as illustration. It has been argued that this pattern is not only illusory, but a largely self-fulfilling prophecy (Kammen and Margolis, 1999). Larger gains, both to individual companies and to society, typically stem from carefully targeted and consistently pursued avenues of research, innovation, and implementation. Renewable energy systems offer this same combination of increased uncertainty, great promise, and the potential for significant innovations and profits.
5.3.2 Market transformationsThere are two principal rationales for government support of research and development (R&D) to develop renewables and other clean energy technologies. First, conventional energy prices generally do not reflect the social cost of pollution. This provides the rationale, based on a well-accepted economic argument, to subsidize R&D as alternatives to polluting fossil fuels. Second, private firms are generally unable to appropriate all the benefits of their R&D investments.
Page 53 of 121
Consequently, the social rate of return for R&D exceeds available private returns, and firms therefore do not invest enough in R&D to maximize social welfare (Kammen and Margolis, 1999). Thus, innovation ‘spillover’ among clean energy firms is a form of positive externality that justifies public R&D investment. These provide compelling arguments for public funding of market transformation programmes (MTPs) that subsidize demand for some clean energy technologies in order to help commercialize them.
The conventional wisdom is that government should restrict its support to R&D and let the private sector commercialize new technologies. Failed clean energy technologies (CET) commercialization subsidies bolster this view. Nonetheless, there are compelling arguments for public funding of MTPs that subsidize demand for some CETs to help commercialize them. Further, the argument that it may not be worthwhile for firms to invest in new technologies because of the ‘spillover’ effects is generally false as well. Early investment in new technologies in promising market sectors has proven to be the best strategy for firms interested in long-term rather than short-term profitability (Spence, 1981).
A key motivation for considering MTPs is inherent in the production process itself. When a new technology is first introduced, it is invariably more expensive than established substitutes. There is, however, a clear tendency for the unit cost of manufactured goods to fall as a function of cumulative production experience. Cost reductions are typically very rapid at first, but taper off as the industry matures. This relationship is called an ‘experience curve’ when it accounts for all production costs, and can be described by a progress ratio (PR) where unit costs fall by a certain per cent with every doubling of cumulative production. Typical PR values range from 0.7 to 0.9 and are widely applicable to technologies such as toasters, microwave ovens, solar panels, windmills and, in essence, any good that can be manufactured in quantity. Figure 12a presents PRs for photovoltaics, windmills, and gas turbines. All three have initial PRs of approximately 0.8, which is a typical value observed for many products. Note, after 1963 the gas turbine PR increased substantially, indicating that the reduction in price with cumulative production continued, but at a decreased rate, caused by a slowing of experience effects. Figure 12b shows an estimate for the capital cost reductions expected in biomass gasification systems, as production proceeds from a pilot stage to full commercialization, and as plant capacity increases. Note, this is not the same as an experience curve shown in Figure 12a.
Insert Figure 12 here
If firms retain the benefits of their own production experience, they have an incentive to consider experience effects when deciding how much to produce. Consequently, they will ‘forward-price’, producing at a loss initially to bring down their costs and thereby maximize profit over the entire production period. In practice, however, the benefits of production experience often spill over to competitor firms, causing private firms to under-invest in bringing new products down the experience curve. Among other channels, experience spillovers could result from hiring away competitors’ employees, reverse engineering rivals’ products, informal contacts among employees of rival firms, or even industrial espionage. Strong experience effects imply that output is less than the socially efficient level. MTPs can improve social welfare by correcting the output shortfall associated with these experience effects (Duke and Kammen, 1999).
Moreover, as with R&D, MTPs also help to promote the use of CETs as alternatives to polluting fossil fuel technologies, thereby reducing the social costs of pollution. When politically possible, the first-best policy is to fully internalize pollution costs (e.g., through pollution taxes set at the
Page 54 of 121

marginal social cost of the pollution externality, or tradable emissions permits set at the socially optimal pollution level). However, governments chronically fail to achieve this, thereby providing another clear rationale to support MTPs.
When evaluating MTPs, it is essential to account for positive feedback between the demand response and experience effects. An MTP increases the quantity produced in the first year and, due to experience effects, year 2 unit costs are lower than they would have been without the additional production from the MTP. These lower costs, in turn, imply that the quantity demanded in year 2 is higher. This ‘indirect demand effect’, in turn, adds to cumulative production experience and further lowers unit costs in future years. This process continues indefinitely, though it gradually dissipates once the MTP is discontinued.
This suggests a role for MTPs in national and international technology policies. However, the costs of poor programme design, inefficient implementation, or simply choosing the ‘wrong’ technologies can easily outweigh cost reduction benefits. Therefore, MTPs should be limited to emergent CETs with a steep industry experience curve, a high probability of major long-term market penetration once subsidies are removed, and a price elasticity of demand of approximately unity or greater. The condition that they be clean technologies mitigates the risk of poor MTP performance by adding the value of displaced environmental externalities. Recent technical and economic advances in a range of renewables make them ideal candidates for support through market transformation programmes. Finally, as with energy R&D policy (PCAST, 1997), public agencies should invest in a portfolio of new clean energy technologies to reduce overall MTP programme performance risk through diversification.
5.4 RET markets and costs: Conclusions
The promise of renewable energy has now become a reality. Both solar photovoltaics and wind energy are experiencing rapid sales growth, declining capital costs and costs of electricity generated, and continued performance increases. Because of these developments, market opportunity now exists to both innovate and to take advantage of emerging markets, with the additional encouragement of governmental and popular sentiment. The development and use of these sources can enhance diversity in energy supply markets, contribute to securing long term sustainable energy supplies, reduce of local and global atmospheric emissions, provide commercially attractive options to meet specific needs for energy services (particularly in developing countries and rural areas), and create new employment opportunities.
While fossil fuels will remain in the fuel mix for the foreseeable future, current high petroleum costs, transient or not, illustrate the degree of social and political ill-will that energy insecurity can generate (e.g., European gas shortages and protests). Integration of renewable energy supplies and technologies into the mix can temper the cyclical nature of fossil fuel markets, and give renewables a foothold from which they can continue to grow and compete. There are many opportunities for creative integration of renewables into energy production systems. These include combined fossil and biomass-fueled turbines, and combinations of intermittent renewable systems and base-load conventional systems with complementary capacity profiles. Strategies such as these, in conjunction with development of off-grid renewable systems in remote areas, are likely to provide continued sales growth for renewable and other clean energy technologies for many years to come.
At present, however, the rates and levels of investment in innovation for renewable and other clean energy technologies are too low. This is because market imperfection undervalues the
Page 55 of 121

social costs of energy production, firms cannot typically appropriate the full value of their R&D investments in innovation, and new technologies are always characterized by uncertain performance and thus greater risk compared to their more well-developed rivals. These issues suggest a role for public sector involvement in developing markets for renewable energy technologies through various forms of market transformation programmes.
Finally, we conclude that current energy producers are in the best position to capture new renewable energy markets. These producers have the capital needed to make forays into these markets, and the most to lose if they do not invest and renewable energy technologies continue to flourish. We believe that artful introduction and integration of renewable energy technologies into energy production systems, along with encouragement from the public sector where appropriate, can create a path that eventually leads to heavy reliance on renewable energy systems in the future. This future would be more environmentally and socially sustainable than one of following a more ‘conservative’ path based on continued reliance on fossil fuels. This latter path in many ways implies higher risks to human and ecological health and welfare over time, and is increasingly difficult to justify based on the performance that renewables have achieved.
Page 56 of 121

6 Biomass, bioenergy and climate change mitigation
In the introduction to this text, we discussed reasons why renewable energy technologies (RETs) are particularly well suited to climate change mitigation. We then discussed the ways in which biomass, a potentially renewable energy source, is currently used in traditional and ‘modern’ applications. We showed how biomass-based energy systems are particularly appropriate for applications in developing countries, where climate change may not be given high priority, but where there is an acute need for equitable and efficient provision of modern energy services. In this final section, we shall briefly revisit some of these arguments in order to explore the mechanisms by which biomass and bioenergy related activities may be employed in developing countries, as strategies to both mitigate climate change, and promote equitable and sustainable development by providing access to improved energy services, creating rural employment, and enabling improved land management practices.
We stated above that developing countries may not prioritize climate change mitigation as a national policy. We should add that this lack of prioritizing climate change mitigation is not out of apathy or lack of understanding of the associated issues and problems. On the contrary, policy makers and scientists in LDCs are quite aware of the need to reduce GHG emissions and to take steps to adapt to a changing global climate, but these nations lack adequate resources to do either. Moreover, while the consequences of climate change will affect poor countries with disproportionate severity, the world’s poorest countries are unable to provide their populations with basic services like clean water, education, health care, and, as we have stressed in this document, energy. Other nations, partially industrialized or ‘in transition’, argue that taking measures to reduce emissions now would disrupt the course of national development. They also hold that industrialized countries of ‘the West’ have been emitting long-lived GHGs for well over a century, and so should bear the brunt of the costs of climate change mitigation.
These circumstances have led to a climate change treaty that requires industrialized countries, dubbed “Annex I” in the language of the treaty, to reduce their net GHG emissions by an average of five per cent during the first commitment period (2008-2012), while LDCs, or “Non-Annex I” countries have no GHG emissions limitations of reduction requirements during the first commitment period.19 Despite the lack of limits or reduction requirements, it is critical that LDCs be engaged in the international effort to mitigate climate change. Moreover, it is recognized, both in the 1992 Convention and in the 1997 Kyoto Protocol, that neither their involvement in mitigation processes, nor the consequences of climate change itself, should thwart the ability of LDCs to achieve their national development goals.20 The following section will discuss the clean development mechanism (CDM), which is the principal means to foster broad engagement of developing countries in climate change mitigation. Thereafter, we will explore the various ways that the CDM can be implemented to ensure that all of the requisite
19 Annex I is the classification given to all industrialized countries that are signatories to the UN Framework Convention on Climate Change (UNFCCC) and that have been assigned emissions limitations or reduction commitments by the Kyoto Protocol. Developing countries, which can be classified as non-Annex I countries, have no emissions limitations or reduction commitments during the first commitment period.
20 See, for example, UNFCCC (1992) articles 3.5, 4.4, 4.5, 4.7, 4.8 and 4.9 and UNFCCC (1997) article 3.14, article 11.2, and article 12.
Page 57 of 121
conditions are met (see below), and that important concerns regarding equity and public participation in projects can also be satisfied.
6.1 The CDM – an explicit link between climate change mitigation and sustainable development
Much has been written about the CDM, and many policy recommendations made concerning the ways in which CDM projects should or should not be implemented.21 While we recognize the importance of these policy recommendations, this text will not add or make further reference to them except in areas directly concerning the development and implementation of small and medium-scale RET projects, and socioeconomic issues linking such projects to equity and poverty alleviation.
Article 12 of the Kyoto Protocol introduces the Clean Development Mechanism, the purpose of which is to promote investment in projects that both reduce greenhouse gas emissions and foster sustainable development in developing countries.22 Given the dual role of the CDM, to facilitate climate change mitigation for Annex I countries, and promote sustainable development in countries hosting the mitigating activity, it is likely that a number of CDM projects will target the energy sector. The energy sector is simultaneously a major source of GHG emissions, and an area that is critical for the socioeconomic development of all nations, sustainable or not. It is also quite likely that many CDM projects will target land-use and forestry activities. (As we understand it, it is thought that these actually may predominate the agenda.) Like the CDM, the issue of Land Use, Land Use Change, and Forestry (LULUCF) has been analyzed in detail elsewhere (see for example Sathaye and Ravindranath, 1998; IPCC 2000b; Niles et al., 2001). It is crucial to recognize that LULUCF activities are intimately linked to the themes of biomass, bioenergy, and poverty alleviation in developing countries. Biomass and bioenergy projects can mitigate climate change through two mechanisms. Like all RETs, bioenergy systems reduce GHG emissions through the displacement of fossil fuels, but unlike other renewable energy systems biomass growth also removes carbon from the atmosphere, so that any land dedicated to the production of biofuels also acts as a carbon sink, though the sink may be a temporary one (Kartha, 2001). While this section will focus on the themes of bioenergy and poverty alleviation in the context of climate change and CDM activities, we will also discuss LULUCF activities. For some background information on biomass sinks and their potential role in the CDM.
21 See, for example, the Climate Notes series of papers from the World Resources Institute (WRI), available on-line at www.wri.org/climate/publications.html. In addition, the Stockholm Environmental Institute (SEI) has drafted several papers on the subject, which are available on-line at: www.sei.se/dload/index.htm
22 The text of the Kyoto Protocol specifically states :“The purpose of the clean development mechanism shall be to assist Parties not included in Annex I in achieving sustainable development and in contributing to the ultimate objective of the Convention, and to assist Parties included in Annex I in achieving compliance with their quantified emission limitation and reduction commitments under article 3.” (paragraph 12.2) The text of the protocol is available at www.unfccc.org
Page 58 of 121

Insert Box 6 here
The CDM flexibility mechanism is the only section of the Kyoto Protocol that has a goal other than carbon emission reductions or limitations. Consequently, the CDM rules become doubly crucial to the communities that will be directly affected. In the Bonn agreement, steps were taken to shape the institutional design and project implementation of the CDM, but many of the technical details for implementation still need to be determined. The list below outlines some of the issues addressed in the Bonn Agreement:23
Agreed that two per cent of the proceeds from certified emissions reductions (CERs) realized under CDM project activities should be directed to a fund to assist particularly vulnerable developing country Parties to the Convention.
Affirmed that the hosting country will be the sole agent deciding if a proposed CDM activity assists it in achieving sustainable development.
Agreed that all mechanisms, including the CDM, should be “supplemental to domestic action.” Hence the Parties agree that the quantified emissions limitations and reductions (QUELROs) for Annex I countries should arise primarily through steps taken within each country’s borders, but that no hard limits have been placed on net QUELROs from the CDM and other mechanisms, and the wording has been left quite vague.
Emphasized that public funding for CDM project activities should not result in the diversion of official development assistance (ODA) and should be separate from other financial obligations of Annex I parties.
Agreed to the composition of a ten-member Executive Board to oversee CDM project activities and to invite nominations prior to COP7 so that election of board members can occur at that meeting.24
Made recommendations for project activities that qualify as “small-scale” and are therefore eligible for streamlined implementation and agreed that simplified modalities and procedures to streamlining should be developed and recommendations made to Parties at COP8.25
Agreed that parties are to refrain from using nuclear facilities as CDM projects. (what you wrote is not strictly accurate, though I believe the language may be this strong in the French version from what I have heard)
Agreed that afforestation and reforestation shall be the only LULUCF activities eligible for CDM projects, specifically excluding forest conservation for at least the first commitment period. It also agreed that questions and uncertainties associated
23 The details of these points are available in FCCC/CP/2001/L.7.
24 On 01 October, 2001 the UNFCCC Secretariat released a message to Parties announcing the opening of nominations for the CDM Executive Board. See reference ICA/PART/COP7/03.
25 By small projects, we refer to the definition specifically agreed to in the Bonn Agreement (FCCC/CP/2001/L.7), in which small projects are defined as follows:
Renewable energy generation projects that have a maximum generating capacity of no more than 15 MW Energy Efficiency projects that reduce consumption by no more than 15 GWh year-1
Other activities that both reduce anthropogenic GHG emissions and result in the emission of no more than 15 kton (C) per year
Page 59 of 121

with LULUCF projects such as permanence, additionality, leakage, scale, and social/environmental impacts shall be developed and addressed at COP8.
Agreed that the total of eligible LULUCF activities claimed as CERs under the CDM for an Annex I party should not exceed 5% of a Party’s base year emissions.
Finally, that a decision about LULUCF projects under CDM for future commitment periods will not be decided until the second negotiation period.
However, there are still outstanding issues yet to be decided in the CDM. These include, inter alia:
Agreement on a means to ensure an equitable distribution of CDM projects across non-Annex I Parties in different geographic regions and at different stages of development.
Agreement on the determination of baselines and verification of additionality for CDM projects (see below).
Agreement on eligibility for Annex I Parties to participate in the CDM contingent on that party’s acceptance of mechanisms and procedures on compliance under the Kyoto Protocol (FCCC/CP/2001/CRP.11 paragraph 30.b).
Agreement on the full responsibilities of the Executive Board and on the validation of CERs.
The COP7 meeting, and any follow-up discussions, represent important opportunities to shape and direct the CDM and other institutions in order to best support a range of locally controlled and sustainable energy and development initiatives. CDM projects should be spread across a range of technologies as well as a diverse number of host countries. An area of particular importance and sensitivity is the recognition that biomass projects are likely to involve a diverse set of impacted parties, and a number of issues in land-use management. As a result, planning that recognizes energy and employment, as well as land-tenure and conservation issues and goals, will need to be employed.
6.2 Energy projects in the CDM: The critical issues
For Annex I countries, climate change mitigation in the energy sector can take many forms. From demand side management (DSM) and improvements in energy efficiency to the retrofit of existing generating facilities or the replacement of such facilities with low-carbon or renewable energy generation, the requirement is “simply” that the activity reduces GHG emissions (IPCC, 2001a). Energy projects implemented under the CDM must meet several conditions and overcome various barriers that do not arise in clean energy projects implemented within Annex I countries. Some of these issues are discussed below.
6.2.1 Additionality and baselinesIn order to qualify for CERs, CDM projects must satisfy an additionality requirement, meaning that any GHG emissions reductions by anthropogenic sources “are reduced below those that would have occurred in the absence of the registered CDM project activity” (FCCC/CP/2001/CRP.11 paragraph 41). In order to determine additionality, a baseline needs to be defined. This is a counterfactual situation, i.e., the baseline effectively defines what would have happened if the project were not undertaken. The choice of a baseline and, by association, the additionality of a project, is therefore not a well-defined notion, but rather is open to multiple interpretations. Further, the amount of CERs that may be obtained from any given project can be
Page 60 of 121
quite sensitive to the choice of the baseline. There are many alternative methodologies for determining a baseline, which we will not review here (see IPCC, 2001b; Lazarus et al., 2000).
Any biomass projects in the CDM will fall close to, if not within the range of, small projects defined in footnote Error: Reference source not foundError: Reference source not found. Many will therefore be eligible for streamlined accreditation. It has been proposed that small projects be allowed to choose a standardized baseline based on a regional average or a particular technological package.26 While we generally consider this a positive outcome, particularly for projects that utilize biomass wastes and residues, we would voice caution in streamlining bioenergy projects that rely on the establishment of new bioenergy plantations. Experience with this type of project is minimal, particularly in sub-Saharan Africa. Bioenergy plantations are extremely land-intensive and even a ‘small’ 15 megawatt project would require a large amount of land with potentially large ecological and social impacts. We strongly recommend that these types of projects undergo full reviews until sufficient experience is gained to justify streamlining.
6.2.2 Leakage and permanenceLeakage is the term used to describe any unintended consequence of project implementation. It is more commonly applied to LULUCF activity. For example, preserving a parcel of tropical forest in one country or region will not address the demand for timber, and extraction could simply shift to another location, so that, on a global scale, no carbon is actually sequestered. Similarly, permanence is also a term more closely associated with LULUCF activities. Any forest or plantation is subject to various natural and manmade hazards that could lead to loss of some or all of the carbon it has accumulated over time. While the parcel of land may eventually regain that stock of carbon, a large disturbance, a human induced change, or climate change itself, could permanently alter the land’s carbon storage capacity, leading to an irretrievable loss of carbon.
In the context of an energy project, or more specifically, a bioenergy project, both leakage and permanence are less of an issue than in LULUCF projects (Kartha, 2001). If fossil fuel consumption is displaced by a biofuel, whether it is an actual displacement or a counterfactual baseline situation, then emissions are avoided without question. Moreover, even a temporary substitution of biofuels for fossil fuels results in permanent emissions reductions for a specific quantity of carbon – for example, running a diesel generator on biogas for one year permanently prevents that year’s diesel exhaust from entering the atmosphere, even if the user switches back to diesel in subsequent years. Leakage cannot be entirely ignored in bioenergy projects. It is possible that displacing fossil fuels on a large scale will reduce demand for those fuels, thereby driving down the global price and leading to increased consumption in other locations. For most bioenergy projects that we envision in LDCs, the scale and the level of fuel displacement is so small that this effect is insignificant (Kartha, 2001).
6.3.3 Social and environmental impactsUnlike the issues addressed above, the social and environmental impacts of energy projects in the CDM are not subject to the scrutiny of the Executive Board or the Parties to the Convention. In the Bonn Agreement, the Parties agreed that the decision of whether or not a project meets the
26 For example, WRI proposes automatic additionality as a standardized baseline for all “small” projects. See “Making Small Projects Competitive in the Clean Development Mechanism,” available on-line at www.wri.org/climate/publications.html
Page 61 of 121
hosting country’s goals for, and definition of, sustainable development, is solely the decision of the host country (FCCC/CP/2001/L.7 section 3.1). Hence, for any proposed CDM project, the only mandatory environmental criteria that the project must meet is the requirement that project activities result in a reduction of GHG emissions below some established baseline. Other, more local, environmental impacts and all conceivable social impacts presumably determine both the sustainability and the desirability of the project. The acceptable level of such impacts is therefore up to the discretion of decision-makers in the host country.27 Biomass energy projects, as they have been presented in this report, can be associated with numerous positive environmental and social impacts, specifically the improvement of degraded lands, the creation of employment opportunities, and the associated realization of quality of life improvements for poor communities. However, positive impacts like these are not a guaranteed outcome. It is easy to imagine scenarios where CERs accrue (for example, a large and sterile monoculture tree plantation that displaces 30 rural agrarian households from 300 hectares of slightly degraded smallholder crop and grassland mosaic), but negative social and environmental impacts are high. While this is an extreme case, host governments could argue that such an activity, or something slightly less extreme, meets their criteria for sustainable development. Further, even projects that generate CERs and have net positive local environmental and social benefits, will have no rules, a priori, determining where, and to whom, those local benefits are channeled. And while a broad definition of sustainable development should include poverty alleviation as a guiding principle, thereby mandating that some or all project benefits are channeled to poor people living in the effective ‘basin’ of project activity, there are no rules implicit in the CDM that make this a required outcome.
The decision of the Bonn Agreement to permit host country governments to decide if CDM activities meet national criteria of sustainable development avoids difficult and potentially heated negotiations that would have accompanied any attempt to define international standards of sustainable development. It also eliminates potentially high transaction costs associated with meeting those standards, and it effectively places the assessment of local environmental and social impacts entirely in the hands of national governments. From the point of view of national sovereignty, this is a positive outcome, as it empowers LDC governments to define a development path for themselves. This is particularly relevant after a decade of structural adjustment programmes that heavily influenced the decision-making power of many LDC governments. However in many LDCs, national governments do not have a history of supporting local environmental and social justice in poor urban or rural constituencies.
This is particularly worrying because, depending on how other mechanisms and domestic mitigation measures evolve for Annex I countries, the CDM may not be a popular route to emissions reductions, and LDCs may be competing for a limited number of projects in order to earn CER revenues. In the drive to keep project costs down, countries may be tempted to cut corners in ways that maximize CERs at the expense of local environmental or social factors. Minimum international standards of transparency and public disclosure of information, as well as mandatory environmental and social impact assessments, could ensure that local environmental and social impacts are minimized.
27 In the event that CDM investments are subject to treaties governing international trade and investment, additional factors might affect which projects are chosen, and impact their sustainability in ways that constrain the choices of host country governments. See Werksman et al., (2001) for a detailed discussion of the potential conflicts between international investment rules and the CDM.
Page 62 of 121
Given the difficulty of defining international standards of sustainable development agreeable to all Parties, some potential host and investor countries developed lists of national sustainable development criteria. Such lists were introduced during the Actions Implemented Jointly (AIJ) pilot phase and included criteria listed (Werksman and Baumert, 2001).
Insert Box 7 here.
Even if national or international standards are not adopted, there are two current trends that may act effectively in their place. First, in some countries, active movements in civil society have, in the recent past, mobilized for social and environmental justice at the grass roots. Where these movements have been effective in the past, there is good reason to think that they will continue to operate effectively, policing projects and using the national and international media to mobilize sympathy and support in the event that projects are associated with unacceptable costs. Unfortunately, not all governments tolerate dissent, and there are places where social movements like these have not developed or have been actively, and sometimes violently, suppressed.
The second trend is the tendency for some industries, in response to market demands for socially and environmentally benign or even positive product, to police themselves through voluntary regulation or certification. One example is the international timber industry.28 An optimistic viewer might say that no private company with an international reputation would wish to be associated with a CDM project that has negative social and environmental impacts. This presupposes full disclosure of project impacts and transparency in project implementation. Clearly this has not been the case with many development projects in the past. Moreover, with no international standards for CDM projects, it is likely that some bad projects will slip through, despite well-intentioned investors and project implementation staff.
Through the Bonn Agreement, the responsibility of determining sustainability of CDM projects lies on host country governments. They should therefore look to minimize negative impacts of CDM projects, and there are numerous steps they can take to do so. In the following sections, we will discuss some measures that hosting governments can take to ensure projects have minimal negative environmental and social impacts or, in an ideal scenario, that projects have impacts that are positive and that those benefits are channeled to poor people who need them most urgently.
The effects of biomass-based projects, whether for energy production, carbon-sequestration, or a combination of mitigation measures and alternate uses, can be extremely complex. In addition, decision-making with regard to those projects can be a time-consuming and contentious process, making transaction costs prohibitive and endangering the viability of all but the simplest CDM projects – particularly in countries that do not have a lot of experience in project implementation. Indeed, this is one of the motivating factors behind the effort to develop fast-track evaluation measures for small projects. One method has been proposed, an Activities Decision Matrix, to facilitate the process of project assessment by simultaneously considering most, if not all, of the variables that may affect the outcome of the project. This process also assists in post-
28 See, for example, the Forest Stewardship Council’s (FSC) website, at http://www.fscoax.org
Page 63 of 121
implementation monitoring and evaluation. See Box 8 (2001) for a more detailed description and an example of a decision matrix.
Insert Box 8 here
6.3 Public participation in project development and implementation
In keeping with the twin goals of climate protection and sustainable development, the CDM should be reserved for locally appropriate projects that involve demonstrated clean-energy technologies with a strong emphasis on energy efficiency and renewable energy projects, including sustainable bioenergy projects, while excluding large-scale hydro and coal projects. Furthermore, if CDM projects are to have environmental and social integrity, then the CDM Executive Board must allow public access to project information, meaningful public participation in decision-making, and access to justice including redress and remedy for poor project implementation. Projects must be guided by public participation and local benefit-sharing policies that are mandatory, credible, and allow for informed input. They must ensure that the views of directly-affected communities and the general public are incorporated into project-related decisions. The CDM Executive Board needs to establish rules that allow directly affected local communities and the general public to have significant input into project design, implementation, and crediting. To ensure project accountability and transparency and, at a minimum, adherence to standards of practice already set forth in international treaties relating to the environmental and human rights as well as standards of practice employed by international lending institutions in their project implementation, the following measures provide an important set of guidelines:
Require environmental and social impact assessments as part of project approval, where the assessment process notifies and includes consultations with directly affected communities.
Require accessible public notice of proposed projects in the appropriate language(s) and encourage public comment on projects prior to project registration and certification, with particular consideration given to local communities that will be directly impacted.
Establish project standards and criteria that will encompass technical, social, and environmental standards in agreement with the host country’s goals for sustainable development.
Require monitoring and reporting of environmental, social, and cultural impacts and make all non-confidential project documents easily accessible to the public, utilizing appropriate local language(s).
Establish a review and appeals panel to the Executive Board whose responsibility it is to hear appeals from the public and Parties regarding project decisions during project execution process, including project registration, certification, emission crediting, and implementation.
Following these guidelines should help ensure successful CDM project implementation. It is important to realize that although thorough measures ensuring public participation could raise transaction costs of projects and make them less attractive to investors, the failures of several
Page 64 of 121

projects in the past attests to the importance of meaningful participation. One role for the donor community like the UNDP and the World Bank could be to direct financial resources, possibly drawn from the adaptation and/or least developed country funds agreed to under the Kyoto Protocol and recently confirmed in Bonn, to cover the incremental costs of meaningful participation. This would facilitate the participation process and reduce the risk of ‘bad’ projects that sacrifice social or local environmental values in favor of cheap CERs. This is particularly important for the early stages of CDM project implementation, while Parties are still learning the most equitable and efficient ways to operate.
6.4 Project management
A registry of well-managed projects is needed to better direct approval of strong CDM projects. This is particularly lacking for bioenergy projects that include best practice land-use management techniques. In addition, projects must be examined holistically, as there can be both positive and negative synergies arising from a group of projects carried out in the same region. CDM projects should be consistent with the biodiversity and desertification conventions as well as with other relevant UN Conventions covering the environment, development, human rights, and international labour organization agreements. They should also be in accordance with national policies and priorities of the host countries to ensure their long-term sustainability. Independent third party monitoring and verification of emission reduction credits with the results available to the public, and investor liability, is essential for project success, Any group that repeatedly fails to comply with CDM rules and procedures, or the Parties that support them, should be barred from participating in the CDM.
6.5 Equity
In order to achieve a better regional equity, multilateral agencies engaged in CDM projects and the Executive Board of the CDM should take steps to ensure widespread distribution of projects with the benefits of such projects equally shared between the sponsors and host countries. It was an important first step that the Bonn agreement included mention of the need to reduce emissions in a “manner conducive to narrowing per capita differences between developed and developing country Parties.” But these words need to now be supported by strong domestic actions and CDM rules and procedures that ensure successful technology transfer and capacity building in host countries.
A number of steps can be taken to ensure that development objectives, and thereby the immediate needs of many poor communities and nations, are not made secondary to carbon issues. First, clear commitments by industrialized nations to invest in biomass energy projects domestically will help to grow the institutional and human capacity for biomass projects, while both building the market and providing important training opportunities for groups and individuals from developing nations. Building domestic industries would also help the international community to encourage industrialized nations not to ‘cherry pick’, i.e., to use their resources to acquire rights to the least expensive biomass projects around the world in terms of cost per unit of carbon emissions avoided or sequestered. Opting only for the least-cost projects would favor specific countries and hinder the flow of information and technology to least developed countries that arguably need it the most. In contrast, a thriving biomass industry spread evenly throughout the developed nations would provide important opportunities to reduce the cost of new technologies and methods through the learning-by-doing process (Spence 1984;
Page 65 of 121

Duke and Kammen, 1999). This, in concert with CDM initiatives, would foster the transfer of biomass and bioenergy technologies.
Second, the CDM can institute clear guidelines that recognize and require multi-disciplinary project teams and review procedures so that the many competing uses of land areas supporting biomass projects are considered. These would include the rights and livelihoods of indigenous and the most marginalized communities, ethnic groups, and women, nature itself, and small-scale as well as larger-scale enterprises. This process would work across socio-economic levels to promote intra-national and international equity.
Third, projects need to be developed that reward the preservation and sound management of existing forests, as well as new bioenergy-focused tracts of land. It is important that, even for mature forests, conservation be rewarded, though in potentially different ways than afforestation or reforestation projects, as defined by the IPCC (definition reference here this needs to be filled in or deleted). There are many reasons to preserve existing forests, particularly in less developed countries. Reasons are too numerous to mention here in any detail, but obviously range from conserving biodiversity to protecting the rights of marginalized groups and indigenous peoples, in addition to the need to reduce GHG emissions that result from the unsustainable harvest of natural forest. Lastly, there is the need to preserve these ecosystems because our understanding of them is so limited. Mature forests provide laboratories to increase our understanding of biomass systems, including methods to use forests for multiple uses and mature forests contain key biodiversity resources, needed for overall functioning of regional ecosystems and the biosphere. Finally, biomass systems provide the basis for arguably the most critical resource for poor individuals and communities: land and the prospect of land tenure reform. Global equity (e.g. Kinzig and Kammen, 1998; Baer et al., 2000) in terms of equal rights and responsibilities to the atmosphere and the climate system requires that household and community resources are respected and preserved. Forest systems represent a critical resource for the poorest people and nations of the plant, and sound management is an invaluable resource for local self-determination.
6.6 Technology transfer and capacity building
A key component of any expanded biomass energy and land-use programme is access to not only the physical resources, but also, critically, to the knowledge base for sound and profitable biomass and bioenergy management. To accomplish this, a clear and collaborative partnership between researchers, governments and industry in developed and developing nations is needed. The recent UNFCCC (2000) report on technology transfer provides a preliminary roadmap for this process. It is critical in the forestry and bioenergy sector to provide access to training and technology while it is under development, and not simply as a finished ‘product’ for developing nations. The opportunities to develop (often as components of CDM, World Bank, UNDP or other development agency sponsored projects) innovative mixed-use methods, more accurate carbon accounting and more effective carbon sequestration and energy generation, as well as projects specifically focused on the needs of the poorest households and nations, remains the greatest need in the bioenergy field. Lessons can and must be drawn from the UNDP and World Bank’s joint effort in climate-change mitigation GEF projects. See for example, Hosier and Sharma (2000), which gives a valuable review of the lessons learned from the GEF’s biomass-based energy projects.
Page 66 of 121
Unfortunately, there are few examples of successful and sustainable biomass-based land management or energy generation projects, particularly projects effective in addressing poverty alleviation. A database of projects, including successes and failures, should be developed and disseminated in order to facilitate the exchange of information and ideas so critical to the success of innovative projects. The case studies included in the final part of this document provide a preliminary model for such a database. This initiative will maintain the greatest focus on the poor by direct, significant involvement of the intended beneficiaries.
Page 67 of 121

Conclusion
Renewable energy sources, particularly biomass, provide a critical resource for not only clean energy, but also secure energy resources for both developing and developed nations. Biomass, in particular, is an abundant resource, and could provide a significant fraction of total global energy supplies. The expansion of biomass energy capacity represents a crucial opportunity to develop locally sustainable energy resources, and value and support efforts to conserve natural and cultural resources around the world. Renewable energy technologies, and particularly biomass energy, further provide a means to build partnerships between research institutions, the public sector and the private sector, that are of value to both industrialized and developing nations. Biomass energy, in particular, is a resource that can be developed as an indigenous industry in many developing nations; it will not lead to technical or economic dependence on imported technologies or knowledge systems. To build this energy independence and security, mechanisms such as the CDM have a critical role to play. Opportunities exist around the world to build biomass energy industries that also provide income and the means for local control over natural resources. This paper explores a number of technical, social, economic and environmental opportunities that the international community and individual nations and communities can adopt and adapt to build a clean energy future.
Page 68 of 121
References
Acker, R. and D. Kammen (1996). “The Quiet (Energy) Revolution: Analysing the dissemination of photovoltaic power systems in Kenya.” Energy Policy 24(1): 81-111.
Agarwal, B. (1994). A Field of One’s Own: Gender and land rights in South India. Cambridge, UK, Cambridge University Press.
American Wind Energy Association (2000). “Wind Energy Fact Sheet: Comparative costs of wind and other fuels.” URL: http://www.awea.org
Baer, P., Harte, J., Herzog, A., Holdren, J., Hultman, N., Kammen, D. M., Kresch, B., Norgaard, R., and Raymond, L. (2000). “Equal Per Capita Emission Rights: The key to a viable climate change policy.” Science 289, 2287.
Bain, R. (2000). Small Modular Biopower Initiative Phase I: Feasibility studies and executive summaries. Golden, CO, National Renewable Energy Laboratory.
Barnes, D., F., K. Openshaw, et al. (1994). What Makes People Cook with Improved Biomass Stoves? A comparative international review of stove programmes. Washington, D.C., World Bank.
Beeharry, R. P. (2001). “Carbon balance of sugarcane bioenergy systems.” Biomass and Bioenergy 20: 361-370.
Beeharry, R. P. (2001). “Strategies for augmenting sugarcane biomass availability for power production in Mauritius.” Biomass and Bioenergy 20: 421-429.
Binns, T., Ed. (1995). People and Environment in Africa. New York, John Wiley and Sons.
Blackie, P. and H. Brookfield (1987). Land Degradation and Society. Suffolk, Richard Clay Ltd.
Boberg, J. (1993). “Competition in Tanzanian woodfuel markets.” Energy Policy 21(5): 474-490.
Bruce, N., R. Perez-Pedilla, et al. (2000). “Indoor Air Pollution in Developing Countries: A major environmental and public health challenge.” Bulletin of the World Health Organization 78(9): 1078-1092.
Campbell, B., P. Gondo, et al. (2000). Use of biomass energy in rural and urban areas of Zimbabwe. Harare, Zimbabwe, Institute of Environmental Studies, University of Zimbabwe.
Chapman J., Wiese S., DeMeo, E., and Serchuk, A. (1998). “Expanding Wind Power: Can Americans afford it?” Renewable Energy Policy Project Report No. 6, November.
Cornland, D. W., F. X. Johnson, et al. (2001). Sugarcane Resources for Sustainable Development: A case study in Luena, Zambia. Stockholm, Sweden, Stockholm Environmental Institute: 87.
Cowan, R. and Kline, D. (1996). “The implications of potential "lock-in" in markets for renewable energy.” International Symposium on Energy and Environmental Management, Newport Beach, California.
DeWees, P. A. (1987). Consultants’ Report on Charcoal and Gum Arabic Markets and Market Dynamics in Sudan. Washington, D.C., ESMAP.
Page 69 of 121

Duke, R.D., and Kammen, D.M. (1999). “The economics of energy market transformation initiatives.” The Energy Journal, 20 (4): 15 – 64.
Duke, R.D., Graham, S., Hankins, M., Jacobson, A., Kammen, D.M., Khisa, D., Kithokoi, D., Ochieng, F., Osawa, B., Pulver, S. and Walther. E. (2000). Field Performance Evaluation of Amorphous Silicon (a-Si) Photovoltaic Systems in Kenya: Methods and Measurements in Support of a Sustainable Commercial Solar Energy Industry. Washington, D.C., World Bank, ESMAP.
Dutt, G., S. and N. H. Ravindranath (1993). Bioenergy: Direct Applications in Cooking. Renewable Energy: Sources for Fuels and Electricity, T. B. Johansson, H. Kelly, A. K. N. Reddy and R. H. Williams. Washington, D. C., Island Press: 653-697.
Ellegard, A. (1993). “The Maputo Coal Stove Project: Environmental Assessment of a New Household Fuel.” Energy Policy 21(5): 498-614.
Eriksen, S. H. (1995). Transport and GHG Emissions. A Climate for Development: Climate Change Policy Options for Africa. H. W. O. Okoth-Ogendo and J. B. Ojwang. Nairobi, ACTS Press: 199-236.
ESMAP (2000). Zimbabwe Rural Electrification Study. Washington, D.C., The World Bank.
Evans, J. (1992). Plantation Forestry in the Tropics. Oxford, UK, The Clarendon Press.
Ezzati, M. and Kammen, D. (2000). “Indoor Air Pollution from Biomass Combustion and Acute Respiratory Infections in Kenya: An exposure-response study.” The Lancet, 358, 619-624.
Ezzati, M., Mbinda, B. M., and Kammen, D. M. (2000). “Comparison of emissions and residential exposure from traditional and improved cookstoves in Kenya.” Environmental Science & Technology (ES&T), 34 (2), 578-583.
Fairhead, J. and M. Leach (1996). Misreading the African Landscape: Society and ecology in a forest-savanna Mosaic. Cambridge and New York, Cambridge University Press.
FAO (1998). FAO Yearbook of forest products. Rome, UN Food and Agriculture Organization.
Freitas and Rosa (1996). “Strategies for Reducing Carbon Emissions on the Tropical Rain Forest: The case of the Brazilian Amazon.” Energy conservation Management 37(6-8): 757-762.
GEF (2001). GEF Projects Website, Global Environmental Facility.
Government of Botswana (1991). Population and Housing Census. Gabarone, Botswana, Central Statistical Office.
Government of the Republic of South Africa (2000). 1996 Census.
Government of Zimbabwe (1992). Census: Zimbabwe National Report. Harare, Zimbabwe, Central Statistical Office.
Grubler, A., Nakicenovic, N. and Victor, D.G. (1999) “Dynamics of energy technologies and global change.” Energy Policy 27: 247-280.
Hosier, R. (1993a). Energy Policy. Special Issue: Urban Energy and Environment in Africa. 21: 435-639.
Page 70 of 121

Hosier, R. and M. Sharma (2001). “Global Environment Facility Support for Modernized Biomass Energy: Experiences from the UNDP and the World Bank.” Energy for Sustainable Development 4(3): 83-90.
Hosier, R. H. (1993b). “Charcoal Production and Environmental Degradation: Environmental history, selective harvesting, and post-harvest management.” Energy Policy 21(5): 491-509.
IIASA/WEC (1995). Global Energy Perspectives to 2050 and Beyond. Laxenburg, Austria and London, UK).
International Energy Agency (IEA) (1998). World Energy Outlook. Paris, IEA Publications.
International Energy Agency (IEA) (2001). “Answers to ten frequently asked questions about bioenergy, carbon sinks and their role in global climate change.” Paris, International Energy Association: Task 38:8. Also available at http://www.joanneum.ac.at/iea-bioenergy-task38/pub.
IPCC (2000a). Methodological and Technological Issues in Technology Transfer. Cambridge, UK, and New York, Cambridge University Press.
IPCC (2000b). Special Report on Land-Use, Land-Use Change, and Forestry. New York and Cambridge, UK, Cambridge University Press.
IPCC (2001a). “Summary for Policy Makers - Climate Change 2001: Mitigation.” New York and Cambridge, UK, Working Group III of the Intergovernmental Panel on Climate Change (IPCC): 13.
IPCC (2001b). “Technical Summary - Climate Change 2001: Mitigation.” New York and Cambridge, UK, Working Group III of the Intergovernmental Panel on Climate Change (IPCC): 71.
Islas, J. (1997). "Getting Round the Lock-In in Electricity Generating Systems: The example of the gas turbine." Research Policy 26: 49-66.
Kaale, B. K. (1990). Traditional Fuels. Bioenergy and the Environment. J. Pasztor and L. Kristoferson. San Fransisco, Westview Press: 29-47.
Kammen, D. (1995a). “Cookstoves for the Developing World.” Scientific American 273: 72-75.
Kammen, D. M. (1995b). "From Energy Efficiency to Social Utility: Improved cookstoves and the Small is Beautiful model of development," in Energy as an Instrument for Socio-Economic Development, Goldemberg, J. and Johansson, T. B. (eds.). New York, United Nations Development Programme: 50-62.
Kammen, D. M. (2000a). “Case Study #1: Research, development, and commercialization of the Kenya Ceramic Jiko (KCJ),” in Methodological and Technological Issues in Technology Transfer. New York and Cambridge, UK, Cambridge University Press: 383-384.
Kammen, D. M. (2000b). “Case Study #5: The Commercial Dissemination of Photovoltaic Systems in Kenya,” in Methodological and Technological Issues in Technology Transfer. New York and Cambridge, UK, Cambridge University Press: 391-392.
Kammen, D. M. (2001). Testimony for the ‘Hearing on the Role of Tax Incentives in Energy Policy’ for the United States Senate Committee on Finance, July 11 (United States Senate: Committee on Finance). URL: http://www.senate.gov/~finance/071101dktest.pdf
Page 71 of 121

Kammen, D.M. (1999). “Bringing Power to the People: Promoting appropriate energy technologies in the developing world.” Environment, 41 (5): 10-15, 34-41.
Kammen, D.M. and Margolis, R.M. (1999). “Evidence of under-investment in energy R&D policy in the United States and the impact of federal policy.” Energy Policy, 27 pages 575-584.
Karekezi, S. and T. Ranja (1997). Renewable Energy Technologies in Africa. London, Zed Books.
Kartha (2001). “Biomass Sinks and Biomass Energy: Key issues in using biomass to protect the global climate.” Energy for Sustainable Development 5(1): 10-16.
Kartha, S. and G. Leach (2001). Using Modern Bioenergy to Reduce Rural Poverty. Stockholm, Sweden, Stockholm Environmental Institute: 36.
Kartha, S. and Larson, E. D. (1999). A Bioenergy Primer: Roles for modernized biomass energy systems in promoting sustainable development. New York, United Nations Development Programme.
Kinzig, A. P. and Kammen, D. M. (1998). “National Trajectories of Carbon Emissions: Analysis of proposals to foster the transition to low-carbon economies.” Global Environmental Change, 8 (3), 183 - 208.
Kituyi, E., L. Marufu, et al. (2001a). “Biofuel availability and domestic fuel use patterns in Kenya.” Biomass and Bioenergy 20: 71-82.
Kituyi, E., L. Marufu, et al. (2001b). “Biofuel consumption rates and patterns in Kenya.” Biomass and Bioenergy 20: 83-99.
Kueppers, L.M., P. Baer, J. Harte, B. Haya, L. Koteen, T. Osborne, and M. Smith (2001), in preparation, “A decision matrix approach to evaluating the impacts of land use activities to mitigate climate change.”
Lal, M. and R. Singh (2000). Sustainable Forestry as a Source of Bio-energy for Fossil Fuel Substitution. Biomass Burning and its Inter-Relationships with the Climate System. J. L. Innes, M. Beniston and M. M. Verstraete. Dordrecht, Kluwer Academic Publishers. 3: 281-298.
Larson, E. (2000). Energy for Sustainable Development: Special Issue on modernized biomass energy. 4: 92.
Larson, E. D. and H. Jin (1999a). Biomass Conversion to Fischer-Tropsch Liquids: Preliminary energy balances. Fourth Biomass Conference of the Americas, Oakland, CA, Pergamon.
Larson, E. D. and H. Jin (1999b). A Preliminary assessment of Biomass Conversion to Fischer-Tropsch cooking fuels for rural China. Fourth Biomass Conference of the Americas, Oakland, CA, Pergamon.
Leach, G. (1992). “The Energy Transition.” Energy Policy 20(2): 116-123.
Leach, G. and R. Mearns (1988). Beyond the Woodfuel Crises: People, land, and trees in Africa. London, UK, Earthscan.
Lipton, M. (1976). Why Poor People Stay Poor: A study of urban bias in world development. Cambridge, MA, Harvard University Press.
Page 72 of 121
Margolis, R. M. and Kammen, D. M. (2001) “Energy R&D and Innovation: Challenges and opportunities,” in Schneider, S., A. Rosencranz, and J. Niles (eds.), A Reader in Climate Change Policy. Washington, D.C., Island Press.
Marrison, C. I. and E. D. Larson (1996). “A preliminary analysis of the biomass energy production potential in Africa in 2025 considering projected land needs for food production.” Biomass and Bioenergy 10(5/6): 337-351.
Masera, O., Saatkamp, B. D., and Kammen, D. M. (2000). “From Fuel Switching to Multiple Cooking Fuels: A critique of the energy ladder model in rural households.” World Development, 28 (12), 2083 - 2103.
Mearns, R. (1995). “Institutions and Natural Resource Management: Access to and control over woodfuel in East Africa,” in People and Environment in Africa, T. Binns. New York, Wiley: 103-114.
Moreira, J. R. and J. Goldemberg (1999). “The alcohol program.” Biomass and Bioenergy 27: 229-245.
Morris, G. (2000). Biomass Energy Production in California: The Case for a Biomass Policy Initiative. Final Report. Berkeley, CA, National Renewable Energy Laboratory: 92.
Najib, Ali B. (1993). Household Energy Consumption Behavior in a Pre-Saharan Small Town in Morocco. Research Report No. 2 from EPOS, Research Programme on Environmental Policy and Society, Department of Social and Economic Geography, Uppsala University: Uppsala, Sweden.
Niles, J. O. and R. Schwarze (1999). Long-term Forest Sector Emission Reductions and Article 12. Bioenergy for Mitigation of CO2 Emissions: the power, transportation, and industrial sectors, Gatlinberg, TN, IEA Bioenergy Task 25.
Niles, J. O. and R. Schwarze (2001). “The value of careful carbon accounting in wood products.” Climatic Change 49: 371-376.
Niles, J. O., S. Brown, et al. (2001). Potential Carbon Mitigation and Income in Developing Countries from Changes in Use and Management of Agricultural and Forest Lands. Essex, Centre for Environment and Society, University of Essex: 18.
Okoth-Ogendo, H. W. O. and J. B. Ojwang, eds. (1995). A Climate for Development: Climate change policy options for Africa. Nairobi, ACTS Press.
OTA, (1991). Energy in Developing Countries. Washington DC, US Government Printing Office: 137.
Ottinger, R.L., et al. (1991). Environmental Costs of Electricity. New York, Oceana Publications.
Pasztor, J. and L. Kristoferson, Eds. (1990). Bioenergy and the Environment. Westview Special Studies in Natural Resources and Energy Management. San Francisco, Westview Press.
PCAST Energy R&D Panel (1997). Federal Energy Research and Development for the Challenges of the Twenty-First Century. Report of the Energy Research and Development Panel of the President’s Committee of Advisors on Science and Technology, November.
Peluso, N. (1999). “The role of forests in sustaining smallholders,” in Forests to Fight Poverty, R. Schmidt, J. K. Berry and J. C. Gordon. New Haven, Yale University Press: 38-64.
Page 73 of 121

Pimentel, D. (1991). “Ethanol Fuels: Energy security, economics, and the environment.” Journal of Agricultural and Environmental Ethics 4: 1-13.
Raiyani, C., S. Shah, et al. (1993). “Characterization and problems of indoor pollution due to cooking stove smoke.” Atmospheric Environment 27A(11): 1643-1655.
Reed, T. B. and S. Gaur (2000). A Survey of Biomass Gasification 2000: Gasifier Projects and Manufacturers Around the World. Golden, CO, The National Renewable Energy Laboratory (NREL) and the Biomass Energy Foundation (BEF): 180.
Ribot, J. C. (1993). “Forestry policy and charcoal production in Senegal.” Energy Policy 21(5): 559-585.
Ribot, J. C. (1998). “Theorizing Access: Forest profits along Senegal's charcoal commodity chain.” Development and Change 29: 307-341.
Rosillo-Calle, F. and D. Hall (1992). “Biomass energy, forests, and global warming .” Energy Policy 20(2): 124-136.
Rosillo-Calle, F. and L. Cortez (1998). “Towards PROALCOOL II: A review of the Brazilian Bioethanol Programme.” Biomass and Bioenergy 14(2): 115-124.
Sathaye, J. and N. H. Ravindranath (1998). “Climate change mitigation in the energy and forestry sectors of developing countries.” Annual Review of Energy and the Environment 23: 387-437.
Senelwa, K. and D. O. Hall (1993). “A biomass energy flowchart for Kenya.” Biomass and Bioenergy 4(1): 35-48.
Shapouri, H., J. A. Duffield, et al. (1995). Estimating the Net Energy Balance of Corn Ethanol, US Department of Agriculture.
Shell Petroleum (2000). “Global Scenarios: 1998-2020.” Summary Brochure.
Smith, K. (1993). “Fuel Combustion, Air Pollution, and Health: The situation in developing countries.” Annual Review of Energy and the Environment 18, 529-566.
Smith, K. (2000). “National burden of disease in India from indoor air pollution.” Proceedings of the National Academy of Sciences 1997.
Smith, K. R. (1987). Biofuels, Air Pollution, and Health: A Global Review. New York, Plenum Press.
Smith, K. R., G. Shuhua, et al. (1993). “One Hundred Million Improved Cookstoves in China: How was it done?” World Development 21(6): 941-961.
Smith, K., J. Samet, et al. (2000a). “Indoor air pollution in developing countries and acute respiratory infections in children.” Thorax 55, 518-532.
Smith, K., R. Uma, et al. (2000b). “Greenhouse Implications of Household Stoves: An analysis from India.” Annual Review of Energy and the Environment 25: 741-763.
Smith, K., R. Uma, et al. (2000c). Greenhouse Gases From Small-Scale Combustion Devices In Developing Countries - Phase IIa: Household Stoves in India. Research Triangle Park, NC, US Environmental Protection Agency: 98.
Page 74 of 121
Spears, J. (1999). “Creating country-specific strategies,” in Forests to Fight Poverty, R. Schmidt, J. Berry, and J. Gordon, eds. New Haven, CT, Yale University Press: 146-167.
Spence, M. (1981). “The learning curve and competition.” Bell Journal of Economics 12: 49-70.
Swezey, B.G. and Wan, Y-h (1996). “The True Cost of Renewables: An analytic response to the coal industry’s attack on renewable energy,” National Renewable Energy Laboratory, U.S. Department of Energy, NREL/TP-462-20032.
Tiffen, M., M. Mortimore, et al. (1994). More People, Less Erosion: Environmental recovery in Kenya. New York, John Wiley and Sons.
Toure, I. O. (2000). Village Driven Forest Management: The case of Mali. Village Power 2000, Washington DC, The World Bank and The National Renewable Energy Laboratory.
Turn, S. Q. (1999). “Biomass Integrated Gasifier Combined Cycle Technology: Application in the cane sugar industry.” International Sugar Journal 101(1205-7): 267-272, 316-322, 369-374.
U.S. Department of Energy (1997). Renewable Energy Technology Characterizations. Topical Report Prepared by U.S. DOE Office of Utility Technologies and EPRI, TR-109496, December.
U.S. Department of Energy (2000). Annual Energy Outlook 2000. DOE/EIA-0383(00), Energy Information Administration, Washington, D. C., December.
UNDP (1997). Energy After Rio: Prospects and Challenges. New York, United Nations Publications.
UNDP (2000). World Energy Assessment: Energy and the Challenge of Sustainability. New York, United Nations Development Programme.
Watanabe, C. (2000). “Industrial Dynamism and the Creation of a ‘Virtuous Cycle’ between R&D, Market Growth and Price Reduction: The case of photovoltaic power generation (PV) development in Japan. Proceedings of the IEA International Workshop on Experience Curves for Policy Making – The Case of Energy Technologies, Stuttgart, Germany, May 10-11, 1999, Wene, C-O., A. Voss, and T. Fried, eds., April, pp. 7-32.
Werksman, J., K. A. Baumert, et al. (2001). “Will international investment rules obstruct climate protection policies?” World Resources Institute, 20pp. Available on-line at http://www.wri.org/cdm/investrules.html
WHO (1995). World Health Report. Geneva, World Health Organization.
Woods, J. and D. O. Hall (1994). Bioenergy for Development: Technical and Environmental Dimensions. Rome, UNFAO.
World Bank (2000). Africa Development Indicators: 2000. Washington, D.C., World Bank.
World Resources Institute (2000). http://www.wri.org/facts
Page 75 of 121
Figure 1
This graph shows a representation of the energy ladder hypothesis, which characterizes the general movement towards increased stove and fuel cost associated with increasing affluence. Adapted from Masera et al., (2000) and originally published in OTA (1991).
Page 76 of 121
Figure 2
Page 77 of 121
Figure 3
Page 78 of 121
This diagram depicts the carbon and energy balance that results from the combustion of 1 kg of wood in a traditional Indian mud cookstove (the most common woodfuel cooking device in the country). Note the mass of carbon for each combustion product is given in terms of absolute mass and not CO2-equivalent units, so that the global warming potential of the stove’s emissions is fully apparent from this diagram.
From Smith, et al., 2000b
Figure 4
Page 79 of 121

Figure 5
Figure 5 is adapted from Morris (2000) and shows emissions factors for pollutants from biomass combustion for energy production and alternate disposal methods. Note the scale on the left, measuring each individual pollutant, is logarithmic and measures kg (pollutant) per thousand bone-dry-ton (bdt). The scale on the right, showing an aggregate carbon equivalent measure of GHG emissions, is linear and measures tons (C) per thousand bdt. However, the pollution reduction benefits from biomass energy production are not quite as straightforward as the graph suggests, particularly regarding GHG emissions, because emissions from different disposal methods occur on quite different time scales. Refer to Morris’ text for a full discussion of this complication, as well as the assumptions that went into his analysis.
Page 80 of 121

Figure 6: Biomass and bioenergy flow chart (Source: R.P. Overend, NREL, 2000)
Page 81 of 121
Figure 7: Capital cost forecasts for renewable energy technologies (Source: U.S. DOE, 1997)
Page 82 of 121
Figure 8: Levelized cost of electricity forecast for renewable energy technologies (Source: U.S. DOE, 1997)
Page 83 of 121

Figure 9: Actual electricity costs 2000 (Sources: Ottinger, 1991; U.S. DOE, 1997; U.S. DOE, 2000)
Page 84 of 121
Figure 10: OECD electricity mix (Source: Shell Petroleum, 2000)
Page 85 of 121

Figure 11: Cost Comparisons of Mature and Emerging Energy Generation Technologies (Source: Grubler et al., 1999)
Page 86 of 121
Figure 12
==============================
Figure 12a: Progress ratios for photovoltaics, windmills, and gas turbines (Source: IIASA/WEC, 1995)
Figure 12b: Capital cost estimates for BIGCC power generation
Page 87 of 121
This graph shows capital cost estimates for different types of Biomass Integrated Gasifier/Combined-Cycle (BIGCC) power plants from six different research groups, each giving estimates for the first and the “n th” plant produced. The nth plant refers to the cost of a power plant produced after the technology is fully mature. The data are bracketed by two curves showing that the various estimates roughly follow an 80% cost reduction curve. – i.e. costs are projected to decrease by ~20% for every doubling in plant capacity. Note, this is not the same concept as an experience curve, or progress ratio, described in Figure 12a, which describes a cost reduction based on cumulative installed capacity. BIGCC is not a mature technology hence it is not yet possible to define an progress ratio.
Table 1
Energy services Income-generating value to rural households and enterprises
Irrigation Better yields, higher value crops, greater reliability, growing during periods when market prices are higher
Light Reading, many types of manual production, etc. during evening hours
Grinding, milling, husking, etc. Create value-added product from raw agricultural commodity
Drying, smoking, etc. (preserving with process heat)
Create value-added product. Preserve produce to enable selling to higher-value markets
Refrigeration, ice-making, etc. (preserving with electricity)
Preserve produce to enable selling to higher-value markets
Expelling Produce refined oils from oil seeds, etc.
Transport Reaching markets
TV, radio, computer, internet, etc. Education, access to market news, coordination with suppliers and distributors, weather information, etc.
Battery charging Wide range of services for end-user
From Kartha and Leach, 2001; reproduced with permission from the author (S.K.)
Page 88 of 121
Table 2: Household fuel preferences and constraints
Barriers to “climbing the ladder”
Ladder of “preference” Equipment costs
Nature of payments
Nature of Access
Electricity Very high Lumpy Restricted
Bottled gas (LPG, butane, Natural Gas)
High Lumpy Often restricted, bulky to transport
Kerosene Medium Small Often restricted in low income areas
Charcoal Low Small Good, dispersed markets and reliable supplies though prices and supplies can vary seasonally
Fuelwood Low or Zero Small, zero if gathered
Good, dispersed markets and reliable supplies though prices and supplies can vary seasonally
Crop residues, animal dung
Low or Zero Small, zero if gathered
Variable: depends on local crops and livestock holding. High opportunity where residues are used as fodder and/or dung is used as fertilizer
Adapted from Leach, 1992
Page 89 of 121

Table 3: Employment rates reported for various biomass and bioenergy production
Type of operation or industry Labor rate Comment Reference
Establishment of biomass plantations: Evans, 1992
Afforestation of grassland 70 person-days ha-1 All of these figures assume a tropical developing countryPlanting of moist forest site 200 person-days ha-1
Planting of steep terrain 400 person-days ha-1
Agroforestry system* 300 family-days ha-1
Management of established plantations: Evans, 1992
Savanna/grassland plantation 9 person-days ha-1
Plantation on rain forest site 11 person-days ha-1
Plantation on steep terrain 13 person-days ha-1
Agroforestry system ??
Charcoal Dust Briquetting in Nairobi, Kenya
23 semi-skilled employees produce ~7 tons of briquettes per day
This level of employment translates to roughly 3.3 person-days per ton of briquettes or about 1 person-day per 10 GJ energy output (assuming a heating value of ~25 GJ per ton)
Karsted and Owen: Case Study 3 (in this document)
Short rotation silviculture on degraded lands in Brazil
~20 jobs/1000 ha managed Carbon is sequestered at about 40 t (C) per hectare during each rotation. Freitas and Rosa, 1996
Biomass electricity production in California
4.9 jobs per MW of generating capacity
“Support jobs” are created at a ratio of 2:1 compared to direct plant employment
Morris, 2000
Sugarcane plantation and ethanol production in Brazil
700000 jobs nationwide The entire industry produced 13.9 billion liters of ethanol in 1996, employing 700000 people in the process. In energy terms, this is between 2 and 1.1 person-days per GJ of ethanol produced or ~84 jobs per MW, though MWs are a misleading measure of output for liquid fuel.
Moreira and Goldemberg, 1999
Typical ethanol plant producing 120000 liter day-1
450-1770 jobs per year (depending on the climatic region)
Capital investment per job created in ethanol production is relatively low: US$ 12000-22000 per job compared to a national average of US$ 40000 per job across a range of industries.
Proposed Sugar refinery and Ethanol distillery in Zambia that produces electricity with CEST technology and exports excess power to the national grid
> 4000 jobs, dissaggregated into job grade and sub-sector below. The proposed plant processes ~300 tons of cane hr-1, producing 90 tons/hr of steam and 40 MW of electricity, 32 MW of which is exported to the national grid. Production is flexible varying from 115 kg sugar per ton of cane in a sugar-only regime to 76 liters of ethanol per ton of cane in an ethanol-only regime.
Cornland, et al. 2001
AgriculturalIndustrialManagerial
Total
Executive59519
Skilled15924531435
Unskilled100060
1060
Seasonal2500
2500
Total3664314364014
* In the original source, Evans (1992) refers to this as a Taungya or Shamba system.

Box 1: Use of Dry Cell and Lead-Acid Batteries in Rural Zimbabwe
An ESMAP study published in 2000 revealed that 44 % of rural Zimbabwean households use dry cell batteries. The domestic industry produces 80 million dry cell batteries each year for domestic consumption. Retail costs of dry cell batteries range from Z$ 8 (US$ 0.23) for a standard 1.5V flashlight/torch battery to Z$ 108 (US$ 3.00) for more specialized 9V alkaline dry cells.
In addition to dry cell batteries, 14% of rural households and 8% of urban households use lead-acid car batteries to provide a small amount of electricity. This amounts to 300,000 lead-acid batteries in use in Zimbabwe. Over half of these households bought their car batteries second-hand. These batteries last an average of 12 months, while new batteries, last about 2.5 years. Battery lifetime depends strongly on the consumer behavior – batteries that are maintained properly will last far longer than batteries that are not cared for properly. The study did not give much information on end uses, though it did report that 70% of households with car batteries use them to power televisions. In addition, the average distance traveled for recharging is 7-10 km. Costs of the batteries are summarized in the table below:
Prices for new and used lead-acid batteries in November 1998
Type of battery Voltage and capacity Retail price
(In 1998, 35 Z$ = 1 US$)
Car battery: new (Z$) (US$)
Light vehicle 12 V, 36 Ahr 1048 30
Medium light 12 V, 90 Ahr 2054 59
Lorry 12 V, 118 Ahr 2435 70
Heavy truck 12 V, 158 Ahr 4053 116
Car battery: used
Light vehicle 12 V, 36 Ahr 450 13
Medium light 12 V, 90 Ahr 500 – 1000 14-28
Lorry 12 V, 118 Ahr 600 – 1200 17-34
Heavy truck 12 V, 158 Ahr 1600 46
Deep cycle (solar) batteries 12 V, 40 Ahr 1250 36
Leisure battery 12 V, 100 Ahr 2330 67
From ESMAP/Zimbabwe DoE Study reported in ESMAP Report 228/00
The ESMAP report estimates monthly expenditures for households with car batteries range from US$ 5 to 15, depending on the size of the battery, the frequency of charging, and the distance to the charging station. They estimate the full life cycle costs, including the price of the battery, to range from US$ 1.40 to 2.10 kWh -1, though it appears as if this calculation did not incorporate any discount rate which would lower the life-cycle cost considerably. For comparison, a second ESMAP report based on research in Kenya (Duke et al., 2000) gives life cycle costs per kWh of energy delivered for a car battery by itself and two types of PV home systems: an amorphous panel and a crystalline panel. This second ESMAP report gives a range of costs that vary as a function of household discount rate, which ranges from 0% to 50%. The ESMAP study on Zimbabwe only considers the extreme case of no household discount rate (0%). Duke et al. find the 20 year life-cycle costs for a 50 Amp-hr battery system with no PV panel varies from US$ 3.50 kWh-1 to just over US$ 0.50 kWh-1. The PV panel systems, with higher upfront costs, are cheaper at low discount rates, but get more costly with higher discount rates. Specifically, the study reports that the life-cycle cost for the Kenyan PV systems varies from about US$2.00 kWh -1 for both systems at 0% discount rate to about US$0.70 kWh-1 for the crystalline panel and about US$0.50 kWh-1 for the cheaper amorphous panel at a discount rate of 50%.
These numbers, while based on many assumptions, are useful in showing how different approaches to energy provision compare under different circumstances and help in explaining why people make the choices that they make. Finally, to compare both studies with Zimbabwe’s grid based electricity - in 1998 lifeline charges for the lowest tier of domestic customers were roughly US$ 0.03 kWh -1, which is less than 3% of the cost of energy from a car battery, though it does not account for connection charges, which must be paid up-front. Sources: Duke et al., 2000; ESMAP, 2000
Box 1
Box 2: Pollution levels found indoors in rural households and outdoors in towns and cities of LDCs
Smith (1993) reports that annually averaged concentrations of Total Suspended Particulates (TSP) in urban areas of LDCs range from 110 g m-3 for countries with a high Human Development Index (HDI) to 300 g m-3 for countries with lower HDI ratings. In the same paper, Smith lists the range of results reported in the majority of studies on rural IAP published at the time. The studies reported time-averaged concentrations of either TSP or respirable particles, which are particles less than 2 m in diameter. Times of observation varied, with some studies looking at a 24 hour period and others considering only active cooking times, naturally with higher observed levels of pollution. Some of the results are shown in the table below.
Country Year(s) Sample Characteristics Range of pollution levels (TSP measured in g/m3 unless otherwise noted)
Kenya
1971/2 Overnight - highlands 2700 - 7900
Overnight - lowlands 300 – 1500
1988 24 hour average - thatched roof house 1300 (respirable particles only)
24 hour average - iron roof house 1500
1999 Measurements are day – long averages, divided into burning and non-burning periods
3-stone wood fire – burning period 3764
3-stone wood fire – non-burning period 1346
Improved ceramic woodstove – burning period 1942
Improved ceramic woodstove – non-burning period 312
Metal charcoal stove – burning period 823
Metal charcoal stove – non-burning period 388
Improved ceramic charcoal stove (KCJ) – burning period
316
Improved ceramic charcoal stove (KCJ) – non-burning period
50
India
1982 Cooking - 15 minutes - wood 15800
- dung 18300
- charcoal 5500
1988 Cooking - 0.7 m to ceiling 4000 – 21000
China
1987 All day - wood 2600 (respirable particles only)
Zimbabwe
1990 Cooking – 2 hours 1300 (respirable particles only)
Guatamala
1993 24 hours - traditional stove 1200
- modern stove 530
All data are from Smith (1993), except Kenya 1999 data, which are from Ezzati et al., 2000, supporting information, p. 12-13.

Box 2: Greenhouse gas emissions from household cookstoves in IndiaA recent study (Smith et al., 2000c) performed on 23 popular stove-fuel combinations in India revealed that despite relying on potentially renewable biomass feedstock, biomass cookstoves emit a substantial amount of greenhouse gases. The startling conclusion drawn by the study is that most of the biomass stoves in use in India today have higher emissions per unit of useful energy than typical stoves that burn fossil fuels like LPG and kerosene. The only non-fossil fuel that came out significantly ahead of the commercial fossil fuels is biogas. This result holds even if the biomass is used renewably i.e. the pool of biomass used as feedstock does not decline or degrade in the long-run. The reason for this counterintuitive outcome is that household stoves generally burn biomass fuel very poorly. Solid biomass fuels burned in small scale combustion devices do not adequately mix with air, thus they give off many products of incomplete combustion (PICs). Many of these PICs are potent GHGs with a greater warming effect than a molar equivalent amount of CO2. PICs include methane (CH4), which falls under the Kyoto Protocol regime, as well as other GHGs like carbon monoxide (CO), and total non-methane organic compounds (TNMOCs), which are not included in the Kyoto Protocol because their impact is less certain and less significant than other GHGs, but which still have a radiative forcing effect (IPCC, 1995).
Smith et al. calculated a global warming commitment (GWC), defined as the sum of each stoves’ GHG emissions weighted by the appropriate GWP for each stove/fuel combination and found that GWC increases more or less along the “energy ladder” as shown in the diagrams, reproduced from Smith et al, and shown below.
Gaseous fuels
Liquid fuels
Wood fuels
Roots
Crop residues
Dung
ENERGY
LADDER
Gaseous fuels
Liquid fuels
Wood fuels
Roots
Crop residues
Dung
ENERGY
LADDER
b
Box 3a: The Future Role of Biomass
Modernized biomass energy is projected to play a major role in the future global energy supply. This is being driven not so much by the depletion of fossil fuels, which has ceased to be a defining issue with the discovery of new oil and gas reserves and the large existing coal resources, but rather by the recognized threat of global climate change, caused largely by the burning of fossil fuels. Its potential carbon neutrality and its relatively even geographical distribution coupled with the expected growth in energy demand in developing countries, where affordable alternatives are not often available, make it a promising energy source in many regions of the world for the 21st century.
Estimates of the technical potential of biomass energy are much larger than the present world energy consumption. If agriculture is modernized up to reasonable standards in various regions of the world, several billions of hectares may be available for biomass energy production well into this century. This land would comprise degraded and unproductive lands or excess cropland, and preserve the world’s nature areas and quality cropland. The table below gives a summary of the potential contribution of biomass to the worlds energy supply according to a number of studies by influential organizations. Although the percentile contribution of biomass varies considerably, depending on the expected future energy demand, the absolute potential contributions of biomass in the long term is high, from about 100 to 300 EJ per year.
Role of biomass in future global energy use according to 5 studies (Source: Hall, 1998; UNDP, 2000)
SourceTime frame
(Year)
Projected global energy demand
(EJ/year)
Contribution of biomass to energy demand,
EJ/year (% of total)Remarks
IPCC (1996)2050
2100
560
710
180 (32%)
325 (46 %)Biomass intensive energy system development
Shell (1994) 20601500
900
220 (15%)
200 (22%)
- Sustained growth*
- Dematerialization+
WEC (1994)2050
2100
671-1057
895-1880
94 - 157 (14 -15 %)
132 - 215 (15-11 %)Range given reflects the outcome of three scenarios
Greenpeace (1993)2050
2100
610
986
114 (19 %)
181 (18 %)Fossil fuels are phased out during the 21st century
Johansson et al. (1993)
2025
2050
395
561
145 (37 %)
206 (37 %)RIGES model calculation
* Business-as-usual scenario; + Energy conservation scenario
Box 4b: Intergovernmental Panel on Climate Change (IPCC)
An Intergovernmental Panel on Climate Change (IPCC) study has explored five energy supply scenarios for satisfying the world’s demand for energy while limiting cumulative CO2 emissions between 1990 and 2100 to fewer than 500 Gton (C). In all scenarios, a substantial contribution from carbon-neutral biomass energy as a fossil fuel substitute is included to help meet the emissions targets. The figure below shows the results for the IPCC’s most biomass-intensive scenario where biomass energy contributes 180 EJ/year to global energy supply by 2050, nearly three times its current contribution. Roughly two-thirds of the global biomass supply in 2050 is assumed to be produced on high-yield energy plantations covering nearly 400 million hectares, or an area equivalent to one-quarter of present planted agricultural area. The other one-third comes from residues produced by agricultural and industrial activities.
Such large contributions of biomass to the energy supply might help address the global environmental threat of climate change, but also raises concerns about local and regional environmental and socio-economic impacts, including the: depletion of soil nutrients from crop land due to the removal of agricultural residues; leaching of chemicals applied to intensively-cultivated biomass energy crops; loss of biodiversity associated with land conversion to energy crops; diversion to energy uses of biomass resources traditionally used for non-energy purposes, or conversion of land from food to energy production. Bioenergy systems, more so than most other types of energy systems, are inextricably linked to their local environmental and socio-economic contexts.
Box 4
Box 5: Technology Lock-In
“Technological lock-in” has several important implications for the energy sector. First, various types of feedstock and fuel delivery infrastructure have been developed over the years to support conventional energy sources, and in some cases these would require modifications to support renewable energy technologies. This would entail additional cost, tipping the table away from the new challengers. Second, the characteristics of conventional energy systems have come to define how we believe these systems should perform, and new renewable energy technologies that offer performance differences compared to conventional technologies (such as intermittent operation) may raise doubts among potential system purchasers. Third, to the extent that new technologies are adopted, early adoptions will lead to improvements and cost reductions in the technologies that will benefit later users, but there is no market mechanism for early adopters to be compensated for their experimentation that later provides benefits to others. Since there is no compensatory mechanism, few are likely to be willing to gamble on producing and purchasing new technologies, and the market is likely to under-supply experimentation as a result (Cowan and Kline, 1996).
Hence, in the absence of policy intervention, we may remain locked-in to existing technologies, even if the benefits of technology switching overwhelm the costs. There are numerous examples, however, of an entrenched or locked-in technology being first challenged and ultimately replaced by a competing technology. This process is generally enabled by a new wave of technology, and it is sometimes achieved through a process of hybridization of the old and the new. Technological "leapfrogging" is another possibility, but this may occur relatively rarely. A prime example of the hybridization concept is in the case of the competition between gas and steam powered generators, which dates back to the beginning of the century. From about 1910 to 1980, the success of steam turbines led to a case of technological lock-in, and to the virtual abandonment of gas turbine research and development. However, partly with the aid of "spillover" effects from the use of gas turbines in aviation, the gas turbine was able to escape the lock-in to steam turbine technology. First, gas turbines were used as auxiliary devices to improve steam turbine performance, and then they slowly became the main component of a hybridized, "combined-cycle" system. In recent years, orders for thermal power stations based primarily on gas turbines have increased to more than 50 per cent of the world market, up from just 15-18 per cent in 1985 (Islas, 1997).
Furthermore, increasing returns to adoption, or “positive feedbacks,” can be critical to determining the outcomes of technological competitions in situations where increasing returns occur. These increasing returns can take various forms, including the following: industrial learning (e.g., learning-by-doing in manufacturing, along with economies of scale, leads to production cost declines); network related externalities (e.g., networks of complementary products, once developed, encourage future users); returns on information (e.g. information about product quality and reliability decreases uncertainty and reduces risk to future adopters); and/or better compatibility with other technologically interdependent systems. Where increasing returns are important, as in most technology markets, the success with which a challenger technology can capture these effects and enter the virtuous cycle of positive feedbacks may, in conjunction with chance historical events, determine whether or not the technology is ultimately successful.
Thus, just as the hybridization between gas and steam turbines gave gas turbines a new foothold in the market, so might hybridization between gas and biomass-fueled power plants allow biomass to eventually become a more prominent energy source. Hybridization of intermittent solar and wind power with other clean “baseload” systems could help to allow solar and wind technologies to proliferate, and perhaps with advances in energy storage systems they could ultimately become dominant. Once they are able to enter the market, through whatever means, these technologies can reap the benefits of the virtuous cycle brought on by increasing returns to adoption, and this is already beginning to happen with several new types of renewable energy technologies.

Box 5

A word about biomass sinks and the CDM
The life-cycle of plant matter is tied intimately to the flow of carbon between the biosphere and the atmosphere. Far more carbon flows into and out of the world’s biota than is released by the burning of fossil fuels. This massive carbon cycling, on the order of 120 billion tons per year, makes biomass attractive as a means of storing carbon in order to sequester it from the atmosphere. On one level storing carbon in the biosphere is not dissimilar from reducing carbon emissions from burning fossil fuels - a ton of CO2 removed from the atmosphere through photosynthesis is no different than a ton of CO2 not emitted because a particular fossil fuel was not burned (Kartha, 2001). There are however, practical differences between sinks and fuel switching, as well as critical differences in the . Currently, the only sink projects allowed in the CDM are afforestation, reforestation, cropland and grazing land management, and revegetation.* Carbon sink projects are subject to leakage and are arguably impermanent. In addition, measuring carbon stored by sinks, including above and below ground biomass, leaf litter, and in various soil pools, is quite uncertain, which makes verification problematic. Finally, sinks have a finite capacity to store carbon, while fuel substitution can extend indefinitely. Figures 1 and 2 below, adopted from IEA, 2001, show the biomass carbon stocks in a natural stand of trees, and a plantation cut on a 50 year rotation.
Despite the inherent uncertainty, land use applications have received a great deal of attention in formulating mitigation mechanisms, including the CDM, and it is quite probable that carbon sinks will constitute a significant fraction of CDM activity. If that is indeed the case, then measures ought to be taken to ensure that in addition to secure long-term carbon sequestration, sinks have net positive environmental and socioeconomic impacts, particularly for communities living in areas adjacent to land under carbon storage. Rather than targeting a piece of land purely for carbon storage, programs should aim for multiple land uses, to take advantage of synergies that exist between forest ecosystems and socioeconomic systems. Niles and Schwarze (2001) expressed this sentiment quite well in an editorial to the journal Climatic Change:
Projects that employ single-track strategies such as outright land protection, or a particular type of plantation, are less likely to succeed than projects that view forestry holistically. Forestry projects that are holistic, carefully accounted and monitored, locally developed and based on emission reductions should be encouraged. Indeed, any climate change agreement should foster projects that bundle bio-energy, durable wood product industries, native forest conservation and sequestration, not just one component or another (p. 374).
From IEA (2001): Answers to ten frequently asked questions about bioenergy, carbon sinks and their role in global climate change: available at http://www.joanneum.ac.at/iea-bioenergy-task38/pub
*See FCCC/CP/2001/L.7
Figure 1. Carbon accumulation in a newly created stand of trees managed as a carbon sink. This example is based on an average stand of Sitka spruce in Britain, assumed to be planted on bare ground.) The stand undergoes four phases of carbon accumulation: (a): establishment phase; (b): full-vigor phase; (c): mature phase;, and (d): long-term equilibrium phase. Looking over several decades it is evident that, following an increase in carbon stocks on the ground due to the initial establishment of the stand, carbon stocks neither increase nor decrease because accumulation of carbon in growing trees is balanced by losses due to natural disturbances and oxidization of dead wood on site. Two examples of carbon dynamics with low (dotted line) and high (dashed line) long-term equilibrium carbon stocks are illustrated. Carbon dynamics in soil, litter and coarse woody debris are ignored.
Figure 2. Carbon accumulation in a newly created commercial forest stand managed on a 50 year rotation. Every 50 years, at the vertical arrows on the graph, the stand of trees is cut to provide wood products or bioenergy, and the ground is replanted with a new stand, which grows in place of the old one. Over several rotations, carbon stocks in living biomass neither increase nor decrease because accumulation of carbon in growing trees is balanced by removals due to harvesting of products.
In actuality, a large plantation consists of many stands like the one here, all established and harvested at different times, so for a large plantation, the accumulation of carbon stocks is more likely to resemble the time-averaged horizontal line. Carbon dynamics in soil, litter, woody debris and wood products are ignored. Impacts outside the forest (wood products and bioenergy) are also excluded.

Box 6
04/21/23 Page 98 of 121
Indicative List of National Sustainability Criteria ensure that AIJ/CDM projects:
The list is taken from Werksman, et al., 2001, who adapted it from UNFCCC, National Programs for activities implemented jointly under the pilot phase. The latter is available on-line at www.unfccc.de/program/aij/aij_np.html.
limit activities to priority sectors, such as renewable energy or energy efficiency;
deliver local environmental benefits;
directly or indirectly enhance local employment
transfer advanced technology or modern production processes;
protect biological diversity;
contribute to training and enhancing local capacity;
purchase local goods and services;
do not increase the host country’s debt burden.
Box 7
04/21/23 Page 99 of 121
The Land Use Activity Project Decision Matrix
The land use activity decision matrix enables simultaneous evaluation of a whole suite of potential project impacts. Most simply, the matrix is a set of potential project impacts separated into three impact categories—local environmental and socioeconomic impacts, and global climate impacts. The list reflects (see Table for an example list) the sustainable development objectives and potential direct or indirect effects of any project. Project evaluators then assign numerical values to each impact indicating the level of expected positive or negative effect of the project. The impact levels are assigned based on a standard measuring system initially created by stakeholders in the CDM process, including representatives from industrialized and developing country governments, industry groups, and social, environmental and indigenous peoples NGOs. Values can be combined within each impact category and weighted by their importance to give an overall estimate of the expected benefits and liabilities of any project.
The matrix can be used to identify and approve only those projects with expected net benefits in each of the three impact categories. It can also be used to promote "fast track" approval for those projects with many expected co-benefits, as revealed through high scores in the three impact categories. In addition, the matrix can be used as an enforcement tool during the emissions credit certification stage, whereby implemented projects that do not live up to promised benefits will be required to mitigate their negative impacts before certified emissions credits can be granted.
Of central importance in the theoretical framework for this kind of multi-criteria evaluation is that the whole range of potential project impacts—even those that may not translate easily into global warming potentials or dollars—can be scored. This structured approach to project impacts evaluation is also a way of explicitly and transparently decomposing project impacts and their relative social value. The method formalizes “common sense for decision problems that are too complex for informal use of common sense”2. In other words, “common sense” decisions can differ considerably from those made under more explicit decision structures when a multitude of variables contribute to overall preference. As a result, the matrix approach to project evaluation should yield a more flexible and accurate evaluation than a priori “positive lists” of pre-approved project types than lone standards and criteria. Furthermore, a multi-impact evaluation phase in land use project approval such as that proposed above, will make it much easier to achieve the twin objectives of climate change mitigation and sustainable development through the CDM.
One possible format for a Land-Use Activity Decision Matrix is included below.
______________________________________________
Kueppers, L.M., P. Baer, J. Harte, B. Haya, L. Koteen, T. Osborne, and M. Smith, in preparation, “A decision matrix approach to evaluating the impacts of land use activities to mitigate climate change.” We thank the authors for the use of this material.

The Land Use Activities Decision Matrix - Potential impacts of land use activity projects* Global Climate Impacts Environmental Impacts Socio-economic Impacts
Greenhouse gas fluxes
Short-term (1-5 years)
CO2
Net above-ground carbon flux
Net below-ground carbon flux
Fossil fuel use
Net methane flux
N2O production
Soot/particulate
Production of other aerosols†
Long-term (5-50 years)
CO2
Net above-ground carbon flux
Net below-ground carbon flux
Fossil fuel use
Net methane flux
N2O production
Soot/particulate production
Production of other aerosols†
Land surface parameters
Latent heat flux (evapotranspiration)
Sensible heat flux (air circulation)
Radiant heat flux (albedo)
Local climate
Maintain/restore historic hydrologic regime
Ground surface temperature†
Air quality
Carbon monoxide
NOx
SOx
Volatile organic compounds
Water quality
Dissolved oxygen levels
Salinity†
pH†
Sediment load
Soil condition
Erosion
Nutrient capital
Desertification
Salinity
Compaction
Water and soil contamination
Agricultural and forestry
N, P, K
Pesticides
Herbicides
Industrial
Metals
Petro-chemicals
Phosphates
Human and animal waste
Bacteria
N
Biological diversity
Preservation of endangered/ threatened/rare species
Native plant diversity
Genetic diversity
Introduction of alien invasive species
Use of genetically modified organisms (GMOs)
Habitat
Terrestrial
Aquatic
Wetlands
Resistance/resilience to stress
Fire
Pests/pathogens
Hurricanes or storms
Floods
Climate change
Local revenue from market commodities
Timber
Agriculture
Livestock
Non-timber forest products
Non-market commodities
Food
Fiber
Fuel
Water
Net job opportunities
Short-term (1-5 years)
Long-term (5-50 years)
Economic equality
Community involvement
Local capacity building
Use of local talent
Use of goods from local resources
Involvement of women/ minority groups
Local culture
Protection of religious/spiritual/historical significance of project area
Recreational importance of project area
Migration into project area †
Human health and safety
Ambient exposure
Chemicals
Particulate matter
Risk of disease
Risk of occupational injury/illness in existing or newly created jobs
Adapted from Kueppers, L.M., et al., in preparation, “A decision matrix approach to evaluating the impacts of land use activities to mitigate climate change.”
04/21/23 Page 100 of 121

Case Study 1: Modular Biopower for Community-scale Enterprise
Development
Art Lilley
Community Power Corporation
Keywords:Modular, Biopower, Village Power, Productive Use, Community, Philippines, Enterprise, Sustainable
SummaryConversion of underutilized biomass to high quality heat and power can help the rural poor generate income and reduce the emissions of green house gases.
Small modular biopower systems hold great promise for community-scale application in countries having large numbers of rural, agricultural communities with access to underutilized biomass resources.
A first-of-a-kind small modular biopower system has been developed specifically to meet the needs of off-grid communities.
A 15 kWe system, called the BioMax 15, was developed by Community Power Corporation (CPC) and demonstrated in the Philippines where it met the electrical energy needs of home owners as well as a small productive use facility. Waste heat was used to dry copra to marketable dryness.
BackgroundPhotovoltaic solar home systems have made great inroads in bringing the benefits of electricity to rural people. However, the main impact has been to provide lighting and entertainment to individual home owners. For significant income generation activities, or village-wide central power, the rural poor need access to high quality AC power. For income generation, they also need access to thermal energy. Diesel generators have been the technology of choice when high levels of power have been needed.
In 1998, CPC performed a market assessment for the US Department of Energy that showed that many off-grid communities have ready access to sustainable quantities of biomass residues from either agricultural or forest sources. In fact, most of the residues are underutilized, being left to rot, and generating significant quantities of methane, an aggressive greenhouse gas.
It was also shown that there was a significant lack of commercially available small biopower equipment that one could purchase for village power and productive use applications. Systems that did exist were too large, were not modular, and did not meet World Bank environmental standards.
In 1999, CPC was selected by US DOE to develop a Small Modular Biopower system for the village power market. The first system was to be demonstrated in the Philippines using coconut shells as the fuel.
The system was to demonstrate the ability to provide grid quality power to a community and to provide both heat and power to a productive use operation located in the community.
ApproachWith funding support of the US DOE, Shell Renewables and the Sustainable Energy Programme, CPC invested $2 million to develop and demonstrate a modular biopower system for community-scale applications in rural, agricultural areas.
Based on CPC’s prior experience with central AC hybrid power systems, the company adopted many of the operating principles it had previously used, including: fully automated operation, small footprint, mobile, easy to install and relocate, and high quality AC power.
The modular biopower system was designed to be competitive against diesel power
04/21/23 Page 101 of 121

systems and PV/ wind hybrids generating 24-hour power. Unlike PV and wind hybrids that require the importation of PV modules and wind turbines, the modular biopower system was designed to be manufactured using locally available components in most developing countries.
The downdraft gasifier biopower system was designed to have a dry cooling and cleaning system to eliminate the need for scrubbers and effluent streams.
Coconut shells were selected as the initial biomass resource, because they are plentiful, and an excellent fuel. They have low ash, low moisture, and flow well when crushed into small pieces. The BioMax has subsequently been qualified using wood pellets.
While demonstrating the ability to provide power to a village was of interest, the highest priority objective was to provide power to a productive enterprise. To further this goal, a new NGO, named Sustainable Rural Enterprise was formed to work with the community cooperative, to develop new coconut-based products, provide marketing assistance, and develop new productive uses of renewable energy.
ImpactsThe system was installed in the village of Alaminos, Aklan Province, Philippines in April 2001 where it underwent successful commissioning. In July the system was handed over to CPC’s partner Shell Renewable Philippines Corporation, the Renewable Energy Service Company for the village of Alaminos.
Villagers know the system by its trade name, the BioMax. (see Figure 1)
Figure 1: 15 kWe BioMax power system fueled by locally available coconut shells
With funding from the Sustainable Energy Programme of the Shell Foundation, a small coconut processing enterprise was developed in the village that would use biopower to make coconut-related products such as geotextiles and horticultural plant media. (see figure 2)
Figure 2: Manufacture of geotextiles from coconut husk fibre
About 100 people from the village of Alaminos will be employed in the manufacture of these products.
Lessons LearnedIn 1998, CPC had little understanding of biopower technology; however, we
04/21/23 Page 102 of 121

understood the village power market and the needs of our customers extremely well. Armed with this knowledge, we were able to specify the requirements for a new generation of small modular biopower system, and secure the technical expertise needed to develop the system.
Community Power Corporation benefited greatly from the biopower expertise of its collaboration partner, Shell Renewables. Shell’s ability to specify key operational and environmental requirements, as well as design a demanding endurance test, resulted in CPC’s ability to develop a first-of-a-kind unit that was able to meet all of its field operational objectives.
The interest level from the public and private sectors in the biopower system is substantially greater than any village power systems that CPC had been involved in previously. The main reason for this interest is that this system is focused on poverty alleviation and local wealth creation. The ability to integrate the biopower system with an enterprise that generates biomass fuel as a waste stream helps to assure sustainability of the fuel supply.
The laboratory and the field are two entirely different environments. Passing a rigorous factory test does not necessarily mean that field-testing will go without a hitch. Although CPC had imported 10 tonnes of coconut shells to the US for testing, the shells had been secured from an operation in Manila. Unlike the imported shells, the ones used in Alaminos have a fibrous outer layer that prevents them from breaking apart. Improvements had to be made to the shell grinder to resolve this issue.
The current system is a proof-of-principle demonstration system. While it has performed well, a number of improvements have been identified for incorporation in future generations of equipment primarily to make the system easier to operate, easier to
maintain, and lower in cost. Productive use replication projects are being sought to implement these improvements.
Contacts:Art LilleyCommunity Power Corporation306 McChain RdFinleyville, PA 15332USATel 724-348-6386Fax 724-348-8923Email: [email protected]: www.gocpc.com
Perla ManapolSustainable Rural Enterprise467 N. Roldan St Kalibo, Aklan, PhilippinesTel 63-36-262-4846Fax 63-36-268-4765Email: [email protected]: www.gosre.org
04/21/23 Page 103 of 121

Case Study 2: Scaling-up Biogas Technology in Nepal
Bikash PandeyWinrock International
Kathmandu, Nepal
Keywords: Nepal, biogas, firewood substitution
SummarySome 80,000 families in Nepal are using methane from biogas digesters for cooking, with around a quarter of the users also using it for lighting. An additional 24,000 families are expected to purchase digesters in the coming year. Plant sizes are in the range of 4m3 to 10m3. The most popular size is 6m3
and costs US$300. Of this, around $100 comes as subsidy support from the Government of Nepal plus German and Dutch bilateral aid. The users themselves invest the rest together with bank loans. Some 48 private companies are certified to construct plants. The plants have high reliability, with almost 98% of them working well after three years of operation. Biogas is the only renewable energy technology that can realistically substitute for burning of firewood and other solid biomass for cooking in rural areas. In addition to substantial benefits to the users from reduced indoor air pollution and reduction in firewood collection and cooking times and to the local environment through reduced pressure on forests, biogas can also provide significant global climate benefits through lowered emissions of Greenhouse Gases. It may be possible to substitute a large part of the government subsidy by selling the GHG benefits from biogas plants in the developing global carbon market.
BackgroundWhile most of the renewable energy community has concentrated its focus on electricity provision, the vast majority of rural communities in the Global South will
continue to derive the bulk of their energy needs from biomass sources for the foreseeable future. The continued use of firewood, agricultural residue, and animal waste for cooking by ever-increasing rural populations, in many parts of Asia, Africa, and Latin America, has resulted in deforestation as well as reduced organic fertilizer available for the fields. A high level of indoor pollution from burning of solid biomass fuels in poorly ventilated rooms results in serious respiratory infections and is a leading killer of children under five. Biogas, largely methane and carbon dioxide, is produced by the anaerobic digestion of animal waste and other biomass. While the technology is well understood and widely used, particularly in South and South East Asia and China, few programmes have been able to achieve the rates of growth of high quality plants as seen in the last decade in Nepal. The technology has been available in Nepal since the mid 70’s. However, it was not until the early 1990’s that the number of installations was substantially scaled up by the Biogas Support Programme (BSP).
ApproachNepal’s Biogas Support Programme can be described as subsidy-led while at the same time being demand-driven and market-oriented. A simple, transparent, and sustained subsidy policy has been instrumental in increasing the adoption of biogas plants substantially. Subsidy has been justified to make up for the difference between higher social benefits (maintenance of forest cover, prevention of land degradation, and reduction in emissions of greenhouse gases) and more modest private benefits (reduction in expenditure for firewood and kerosene, savings in time for cooking, cleaning, and firewood collection, increase in availability of fertilizer, and reduction in expenditure to treat respiratory diseases) accruing to users. A progressive
04/21/23 Page 104 of 121

structure, which provides lower subsidy amounts to larger plants, has encouraged smaller plants that are affordable to poorer households. BSP has been able to leverage quality standards in installations through effective use of subsidy. All participating biogas companies have to be certified by BSP and must build plants to one fixed design according to approved standards. Quality control is enforced by carrying out detailed quality checks on randomly selected plants built in the last three years. The number of units checked corresponds to at least 5% of the plants built in the most recent year. Companies found in breach of strict guidelines can receive anything from a warning to fines to being barred from participation in the programme depending on the seriousness of the infringement. Ratings, from A to E, are revised each year to encourage companies to improve their performance. This focus on high quality has increased the confidence in the programme among users, banks, supplier companies and donors. Despite the availability of subsidy, users themselves must invest a substantial amount in cash and labour. Companies must thus market themselves aggressively to generate demand for plants. BSP encouraged the number of participating companies to grow from a single government-related entity in 1991 to 48 separate companies today. The reduction in real prices of installations by 30% in the last ten years demonstrates that there is fierce market competition on the supply side. The subsidy itself has remained constant in nominal Rupee amounts since the beginning of the programme, even decreasing for the larger plants.
ImpactsBiogas plants in Nepal have had positive impacts on a number of fronts. Reduction in indoor air pollution in beneficiary households has lowered respiratory infection, particularly among children.
Firewood collection time has been reduced, as has the time to cook and clean pots. Women have saved an average of 3 hours per day on these chores. Houses using the produced gas for lighting are saving on kerosene bills. Increased stall-feeding of animals has made more organic fertilizer available to farmers. Almost 45% of the owners of biogas plants have also attached new toilets to them leading to improved sanitation and hygiene. There is anecdotal evidence of regeneration of forests in areas where there is high penetration of biogas plants, although the exact extent of this has not been documented. The first attempts are being made to quantify the anticipated climate benefits from biogas plants. Preliminary calculations show that a typical family biogas plant in Nepal saves between 5 and 10 tons of Carbon equivalent over its 20-year life, depending on whether all greenhouse gases are included or only those within the Kyoto Protocol. The price per ton of carbon would need to be $10 to $20 to cover the subsidy presently provided to biogas plants in Nepal.
The production of biogas plants up to the end of July 2001 is presented in the graph below:
Lessons Learned The Nepal biogas experience gives a very good example of how a national programme can, through a subsidy mechanism, bring commercial companies to the table and with their participation leverage high quality installations. Free market conditions, particularly when regulations are weak and when the customer does not have full information regarding the product, often result in competition between suppliers based on price alone, at the expense of product quality. For a programme like BSP to succeed, a major prerequisite is that the national programme must be independent and free from political interference. A second lesson is that freezing technology to
04/21/23 Page 105 of 121

one approved design makes it easier to control quality while at the same time lowering barriers of entry to allow in a large number of competing companies all working to the same standards. Although such a strategy may not be suitable for a fast changing sector such as solar PV, this has turned out to be quite effective for biogas, a much more established technology. BSP will, however, need to develop ways to introduce technological innovation into the sector in the long run.
ReferencesBiogas Support Programme, 2000: Annual Report 2000. Kathmandu.
Smith, K.R., R. Uma, et al., 2000: Greenhouse Implications of Household Stoves: An Analysis for India. Annual Review Energy Environment 25:741-63.
Mendis, M. and W.J. van Ness, 1999: The Nepal Biogas Support Program: Elements for Success in Rural Household Energy Supply. The Hague.
Silwal, B.B. 1999: A Review of Biogas Programme in Nepal. Winrock International, Kathmandu.
Contacts:Sundar Bajgain Programme Manager: Biogas Support ProgrammeJhamsikhel, Lalitpur PO Box 1966 Kathmandu , NEPALTel: +977-1-521742/534035Fax: + 977-1-524755Email: [email protected]
Case Study 3: Commercial Production of Charcoal Briquettes from Waste
Elsen Karstad and Matthew OwenChardust Ltd., Nairobi, Kenya
KeywordsCharcoal; Briquettes; Biomass Waste Charcoal Substitution; Kenya; Africa
SummarySoaring prices of lumpwood charcoal and regional deforestation associated with traditional charcoal production prompted Chardust Ltd. of Nairobi, Kenya to investigate the production of charcoal substitutes from waste biomass.
04/21/23 Page 106 of 121

Chardust’s leading product is made from dust and fines salvaged from charcoal wholesaling sites in Nairobi. In less than a year, sales of the company’s “Vendors’ Waste Briquettes” have gone from a few bags a week to over 7 tons per day, displacing an equivalent amount of lumpwood charcoal and effectively sparing over 80 tons of indigenous wood per day. The briquetted fuel is cheaper than regular charcoal and burns for much longer. Chardust’s customer base is broad, including institutions such as hotels, lodges and schools through to farmers (for space heating) and domestic consumers.
Chardust is also exploring the use of agro-industrial wastes to produce additional types of charcoal briquette. A recent feasibility study concluded that sawdust, bagasse and coffee husk have practical and commercial potential as raw materials for premium charcoal products.
Briquetting projects in Africa have a poor track record due to an over-emphasis on processing technology or environmental conservation at the expense of market factors. Chardust came to the problem from a new perspective, focussing directly on pricing and performance to under-cut lumpwood charcoal with cheaper and better-performing products.
BackgroundOver 500,000 tons of charcoal are consumed in Kenya every year with a retail value in excess of US$40 million. The charcoal trade is a major contributor to environmental degradation, operates largely outside the law and pays no tax.
Demand for charcoal is expected to increase at over 4% per annum for the foreseeable future in East Africa, leading to an intensification of the ongoing process of environmental destruction. For every ton of charcoal consumed, at least 10 tons of standing wood are being felled. Charcoal
quality is in decline as the quality of available raw material declines.
Figure 1
Aerial photo showing the impact of charcoal production in Mt. Kenya forest
Government efforts at substitution with kerosene or liquid propane gas have proven financially unworkable. Such fossil fuel alternatives in any case have their own drawbacks associated with unsustainability and foreign exchange dependency. Initiatives to bring charcoal producers and traders under systems of formal management have fallen foul of corruption and influential charcoal ‘mafias’.
On the production side, improved kiln technologies that could increase wood-charcoal conversion efficiencies have not been adopted due to the quasi-legal and mobile nature of producers who would rather maintain a low profile than install more efficient fixed equipment.
The promotion of fuel-saving stoves is an area where positive impacts have been realized on overall efficiency in the sector, but with adoption of such stoves by consumers now virtually ubiquitous, little that can be done to further improve efficiencies at the point of use.
In short, many of the means by which charcoal demand might be reduced, efficiencies improved or substitution encouraged have been tried. They have
04/21/23 Page 107 of 121
either failed or have reached the apparent limit of their potential.
Chardust’s Approach: Commercial CompetitionOne opportunity for reducing charcoal demand that has not yet been systematically investigated in Kenya is direct substitution - not with fossil fuels but with nearly identical affordable and environmentally acceptable alternatives that can be produced in-country. Chardust is an alternative energies company that has grasped this opportunity.
Chardust pursues two parallel approaches. The first is to salvage waste dust and fines from charcoal wholesalers in the city of Nairobi and use this to fabricate fuel briquettes. The waste is typically 30 years old or more but remains undegraded and is readily salvaged at centralized sites. Chardust pays for the material at source, and at its factory sieves, mills and extrudes using locally-made machinery to produce cylindrical briquettes 3.2 cm in diameter and 5 cm. in length. These briquettes produce no smoke, sparks or smell when burned. They have a higher ash content than lumpwood charcoal and hence an extended burn. Chardust prices its Vendors’ Waste Briquettes (VWB) 30% below regular charcoal in Nairobi and currently sells in excess of 7 tons per day. The operation has also created employment for 23 semi-skilled workers.
Figure 2
An extruder in operation at Chardust’s plant
Chardust’s second focus is on waste recovery in the agricultural, agro-processing and timber industries. Large amounts of biomass go to waste in this sector but could be converted to charcoal briquettes at an affordable price. Market research and initial production trials on a range of agro-industrial by-products indicate that an injection of lumpwood charcoal substitutes into the urban Kenyan marketplace is currently viable.
Chardust has looked into more than 20 different wastes in Kenya and concluded that sawdust, bagasse and coffee husk may have commercial potential due to their bulk availability at centralized locations, few (if any) alternative uses and conduciveness to carbonization and conversion to charcoal briquettes. In conjunction with sawmills, sugar factories and coffee mills, Chardust now intends to produce a range of premium low-ash charcoal products to complement its VWB.
Figure 3
Waste bagasse at a Kenyan sugar factory
04/21/23 Page 108 of 121
Lessons LearnedWith the rapidly rising price of lumpwood charcoal in Kenya’s urban centers, Chardust saw that there was a market opportunity to be exploited if it could offer cheaper or better-performing substitutes. This approach is what distinguishes Chardust’s operation from that of previous briquetting ventures in Africa, which typically set out to provide technology-driven income-generating opportunities for community groups, salvage urban waste, protect the environment or simply test a recently developed piece of machinery. These top-down approaches tend to be unsustainable as they are not always based on sound commercial sense.
Chardust has built its business around market niches that value price and performance. The company’s R&D efforts, which respond directly to market forces, have prompted the invention of customized screw extruders, a particulate biomass carbonization system and several types of domestic and institutional water heaters.
Partnership PotentialsChardust Ltd. is prepared to enter into partnership with suitable businesses or organizations that have similar interests. The company currently re-invests all profits into expansion, so R&D progress is slow (but steady) and governed by available funds. Chardust is currently poised to commercially prove its waste-conversion technology at much larger scales and, by doing so, make a truly significant impact within East Africa.
Figure 4
Dried coffee husks (right) and carbonized coffee husk briquettes (left) produced by Chardust Inc. during a feasibility study of multiple waste-based resources.
Contacts:Elsen Karstad or Matthew OwenChardust Ltd.P.O. Box 24371Nairobi, KENYATel: +254 2 884436/7Email: briquettes:@chardust.comWeb: www.chardust.com
04/21/23 Page 109 of 121

Case Study 4: Ethanol in Brazil
Robert BailisEnergy and Resources Group
University of California, Berkeley, USA
Keywords:Ethanol; Sugarcane; Biofuels; Brazil
Summary:Brazil launched its ethanol programme, ProAlcool, in the mid 1970’s partially in response to the first oil crisis, but also in an attempt to stabilize sugar prices in the face of a volatile international market. Since its inception, Brazil’s production of sugarcane has expanded five-fold to over 300 million tons during the 1998/9 growing season (UNDP, 2000). Roughly 65 per cent of this cane is dedicated to the production of ethanol. The industry currently produces nearly 14 billion litres of ethanol per year, which is used either as a blending agent and octane enhancer in gasoline in a 22:78 mixture called gasohol or in neat, ethanol-only, engines. In total, ethanol displaces roughly 50 per cent of the total demand for gasoline in the country, equivalent to 220000 barrels per day of gasoline, making Brazil the largest producer and consumer of alternate transportation fuels in the world, and off-setting as much as 13 million tons of carbon emissions while employing hundreds of thousands of people and stimulating the rural economy.
Despite the impressive figures in terms of local employment, gasoline displacement, and associated pollution reductions and avoided GHG emissions, Brazil’s ethanol programme is not entirely environmentally benign. Moreover, the future of the ethanol programme is by no means clear. It faces considerable uncertainty for a combination of reasons including the lack of a coherent national energy policy, high sugar prices in the international market favoring sugar production for export over domestic ethanol
production, and, of course, lack of incentive to invest in ethanol production as a result of low international oil prices and a failure to fully account for the costs of oil production and consumption.
BackgroundBrazil began producing ethanol and blending it with gasoline nearly a century ago, but it wasn’t until the 1930s that it was mixed in all petrol by federal decree. As a fuel, ethanol can be used in two ways. It can be mixed with gasoline in concentrations that typically range from 10-25 per cent. Ethanol that is mixed in this way must be anhydrous, i.e. all of the water is removed, which requires a double distillation process yielding 99.6 per cent pure ethyl alcohol
(0.4 per cent water by volume). The second way that ethanol can be used as a fuel is without mixing. So-called neat engines may be used with hydrated ethanol ~4.5 per cent water by volume, which is obtained through a single distillation process.
At the height of Brazil’s “ethanolization”, in the mid 1980’s, 95 per cent of new light vehicle sales were neat ethanol-only
04/21/23 Page 110 of 121
automobiles.29 Sales of ethanol-only vehicles soon declined, partly because of sustained low petroleum prices and increasing world sugar prices, which put more incentive into sugar production rather than ethanol production. Neat vehicle sales fell to only 1 per cent of total new vehicle sales in by 1996, but ethanol consumption has continued a slow increase because of booming sales in conventional cars, which still use a 22 per cent ethanol blend. See figure 1.
ApproachThe first decade of the programme was characterized by strong government intervention. Initially the Brazilian government used existing sugar mills to produce anhydrous ethanol, eventually moving into autonomous distilleries, which produced hydrous ethanol.
To ensure the programme’s success, a deal was struck between the government and domestic automobile industry to develop and market vehicles with the proper engine modifications so that the ethanol could be used. This met some resistance from manufacturers, but government assisted with R&D support.
Scaling up sugarcane production was eventually guaranteed because the government secured a commitment from Petrobrás, the state-owned oil company, to purchase a fixed amount of ethanol to blend with their petrol. To meet the projected demand for ethanol the state offered nearly US$ 2 billion (nominal) in low interest loans and initially established a cross-subsidy with petrol so that they could sell ethanol at only 59 per cent of the pump-price of the gasoline, which was set by the government.
This scaling up took place without conflict over land use. Cultivation of sugarcane 29 Most heavy trucks are diesel-powered.
Efforts to develop a diesel-ethanol blend never got past the R&D stage.
occurs principally in the south-east and northeast parts of the country. The total area occupied by sugarcane cultivation is about 7.5 per cent of all cultivated land in Brazil, or 0.4 per cent of Brazil’s total land area. This is smaller than the land devoted to any one of the major food crops: maize, soybeans, beans, or rice. Despite providing half of the national transportation fuel requirements there has been no significant conflict between ethanol cane, food, or export crops (Moreira and Goldemberg, 1999). One reason for this is that aggressive R&D in both cultivation and processing led to rapid gains in productivity that were sustained at over 4 per cent per year since
the inception of the project that so ethanol productivity effectively doubled in twenty years from ~2600 litres per cultivated hectare of sugarcane in 1977 to 5100 litres per hectare in 1996.
In addition, in roughly the same period of time, the cost of producing a unit volume of ethanol dropped by more than half. Figure 2 shows the experience curve for Brazil’s ethanol industry.
Despite the cost reductions, which extended into the 1990’s, Brazilian ethanol was not able to compete directly with gasoline. To support the industry the government continued the cross-subsidy, taxing gasoline
04/21/23 Page 111 of 121
Figure 2: from Moreira and Goldemberg, 1999
so that for much of the 1990’s the pump price of gasoline remained doubled. This policy ensured that ethanol producers were paid enough to cover their costs per litre of production and consumers were able to purchase ethanol at 80 to 85 pe rcent of the pump-price of petrol.
Since the late 1990s there has been a global shift in attitudes toward market-distorting policies and this has played itself out in the Brazilian ethanol programme as well. In some locations, specifically the southeast of Brazil, where the majority of the nation’s ethanol is produced, subsidies were reduced, then in 1999 removed altogether (UNDP, 2000). The long-term effect of this remain to be seen, although the decrease in the number of neat ethanol vehicles has not led to a decrease in ethanol consumption because there has been rapid growth of vehicles using gasohol and in some locations the fraction of ethanol is as high as 26 per cent (UNDP, 2000).
Figure 1 shows the growth and decline in sales of neat ethanol vehicles. It also shows the price of gasoline on the international market for the same time period. Note that the turning point marking the decline in neat ethanol vehicle sales lags slightly behind the global decline in petroleum prices.
ImpactsThe Brazilian ethanol programme has passed its 25th year, and there are simply too many impacts to list in a brief case-study. Below are some of the more dramatic impacts relating to employment, the environment, and fossil-fuel avoided which were three areas that the national government was most concerned about in initiating the programme.
Jobs The entire sugarcane sector directly employs between 0.8 and 1.0 million people. This is the largest in the agro-industry sector in terms of formal jobs, with 95 per cent of
workers legally employed with a minimum wage 30 per cent greater than the national minimum wage. Ethanol production also has a relatively low index of seasonal work contributing to stable employment in sugarcane growing areas (Moreira and Goldemberg, 1999).
The ethanol industry also has relatively low investment rates per job created: between US$ 12000 and $22000, compared with US$220000 in the oil sector, US$91000 in the automobile industry and US$419400 in the metallurgical industry. (Rosillo-calle and Cortez, 1998).
EnvironmentOne of the principal negative impacts of large-scale ethanol production is the disposal of stillage, a liquid by-product of the fermentation process. This is a major environmental problem because of its large pollution potential. There have been attempts to use stillage as a fertilizer, Stillage can also have negative effects, particularly in regions with a high water table.
Air pollution is another environmental issue that is directly impacted by sugarcane and ethanol production. Cane harvesting is often preceded the in-field burning of cane leaves and tops, which facilitates the harvest, particularly helping manual harvesters to avoid injuries. This occurs in both ethanol and sugar production. The smoke that results can have direct ill-health effects if an exposed population is nearby, and most certainly results in GHG emissions because of incomplete combustion. Though it is not common, there has been research into harvesting tops and leaves of cane for energy production (Beeharry, 2001) which would incur additional harvesting costs but would likely yield a net gain in energy production, and potentially create additional employment
04/21/23 Page 112 of 121
In addition to air pollution caused by burning cane trash, by reducing consumption of gasoline the ethanol programme has reduced car pollution levels. Pollutants such as CO and hydrocarbons are reduced by about 20 per cent, while NOx emissions are comparable with gasoline.
Fossil fuels avoided (and GHG reductions)Ethanol accounts for half of the light-vehicle fuel consumption in Brazil. Since its inception, the ethanol programme has displaced the consumption of over 140 million m3 of gasoline and saved the country nearly US$ 40 billion in hard currency that would have been spent on importing the fuel.
Sugarcane ethanol also mitigates global warming. When one crop is converted to alcohol and burned, the carbon released is sequestered in the subsequent crop. There is a small emission of GHG in the production process, which uses a small amount of fossil fuel for farm machinery, but bagasse provides nearly all of the required thermal, mechanical, and electrical energy needed for production. The production and use of 1 litre of ethanol to replace an energetically equivalent amount of gasoline avoids the emission of about a half a kilogram of carbon as carbon dioxide, which is a 90% reduction over gasoline (Rosillo-Calle and Cortez, 1998). In total, ethanol yields a net savings in CO2 emissions of about 13 Mt carbon per year, corresponding to about 20 per cent of the CO2 emissions from fossil fuels in Brazil (UNDP, 2000).
Lessons LearnedIn the words of one author:
The ProAlcool has gone from a highly innovative period to almost technical stagnation. The high governmental intervention of the early years has been replaced by a more conservative attitude towards subsidies and by a lack of clear
direction with regard to energy policy. (Rosillo-Calle and Cortez, 1998, p. 124)
The same authors contend that the positive environmental aspects of ProAlcool far outweigh its potential damage. An economic analysis would indicate that as well. Consumers pay roughly US$ 2 billion per year on the cross-subsidy while annual saving for the country in avoided imports is nearly US$ 5 billion (Moreira and Goldemberg, 1999).
We have seen that targeted subsidies and support for R&D yielded huge gains were made in productivity and substantial cost reductions also were realized. In addition, setbacks arose and continue to persist because of the low price of petroleum, which is due in part to the failure to fully account for the environmental and social costs of its production and use. Nevertheless, the project has been able to bring about substantial financial savings, pollution reduction and avoided carbon emissions as a result of the programme, while creating jobs and stimulating the rural economy.
Future trends toward greater mechanization will bring about further cost reductions and possibly higher productivity, however this must be balanced with the social costs in terms of lost employment.
References
Beeharry, R. P. (2001). “Strategies for Augmenting Sugarcane Biomass Availability for Power Production in Mauritius.” Biomass and Bioenergy 20: 421-429.
Moreira and Goldemberg, (1999) “The alcohol program”, Energy Policy, 27: 229-245.
Rosillo-Calle and Cortez, (1998) “Towards PROALCOOL II - A Review of the
04/21/23 Page 113 of 121

Brazilian Bioethanol Programme”, Biomass and Bioenergy, 14 (2): 115-124.
UNDP (2000). World Energy Assessment: Energy and the Challenge of Sustainability (New York, United Nations Development Program).
Contact:
Robert Bailis
Energy and Resources Group
University of California
Berkeley, CA 94720-3050, USA
Email: [email protected]
04/21/23 Page 114 of 121
Case Study 5: Carbon from Urban Woodfuels in the West African Sahel
Jesse RibotInstitutions and Governance Program
World Resources InstituteEmail: [email protected]
Keywords:Woodfuel markets: Urban energy; West Africa
Summary:This programme explores emerging tensions between urban household well-being and potential to reduce carbon emissions as decentralization opens urban markets to a wider range of rural producers. The objective is to identify solutions in the reconfiguring of rural-urban markets and the opening of transport oligopolies.
Wood is still, by far, the main source of urban and rural household fuel in Africa. As African cities grow through births and in-migration, the demand for commercially harvested woodfuels grows even faster. Wood use increases disproportionately because urban dwellers consume charcoal produced inefficiently from wood while the rural population cooks directly on firewood. Urban woodfuel prices have risen due to greater competition for the resource, greater transport distances and transport oligopolies, reducing urban disposable income and increasing insecurity as fuel shortages become more frequent. Growing urban woodfuel demand is also affecting on surrounding forests with broad implications for the rural environment, economy and livelihoods. Woodfuel use also accounts for 10 to 30 per cent of energy based carbon emissions in the Sahel, 20 to 40 per cent coming from urban areas.
Background: Regulation of urban woodfuel production has been the single most-important function of forestry departments in the Sahel since at least 1916. Both supply and demand-side
measures have been taken to reduce the consequences of this still-growing sector. Although efficiency gains from improved cookstoves (designs taken from Kenya) have been largely realized, wood demand is still growing faster than population. Substitution has been complicated by the high up-front costs of new equipment, cultural preferences for charcoal, and intermittent shortages of substitutes due to foreign exchange constraints. Projects and legal reforms have been targeted at reducing and better managing the harvest.
For carbon cycles two factors are at play. First, substitution with petroleum fuels increases carbon contributions. This has had little effect, however, due to the slow rates of substitution. Unsustainable wood harvest is also a source. Sustainable harvesting, however, should sequester as much carbon as is released. But, there is still little understanding of the balance between patterns of wood cutting and regeneration. A third, but insignificant, factor is carbon from peat burning—this has been pursued in Senegal. Peat from Dakar’s agriculturally rich market-gardening zone (les Nyes) has recently been mined to make charcoal briquettes. This option may become economic later, but is still too expensive to compete with wood charcoal. Peat burning increases carbon since there is no regeneration. Further, this option is undermining (no pun intended) the richest urban agricultural lands in West Africa.
Approach:Decentralizations across the region are now changing the wood-harvesting patterns throughout the region by broadening rural access to urban markets and therefore diffusing production over a larger geographical area. As more local communities become engaged in wood-cutting their production is less intensive than that of commercial merchants. Further, community based production regulations
04/21/23 Page 115 of 121
also require more measures to insure regeneration. This new pattern is increasing the potential for regeneration and for sustainable harvest in ways that appear to reduce the urban woodfuel trade’s net carbon contribution to the atmosphere. But, older more intensive techniques continue to dominate due to urban demand pressures and powerful transport oligopolies. Fear of urban discontent over rising prices has led politicians to pressure forest services to continue business-as-usual centralized forms of woodfuel harvesting and transport. This project aims to find solutions to this rural-urban tension.
We propose a four-phase programme to examine and to reshape policy around this set of issues. Phase I will involve Constituting the Research Team within an independent environmental policy research institution in Senegal. Phase II involves an updated Assessment and mapping of the charcoal filière (commodity chain). Phase III is the Policy Analysis period. Phase IV is the Outreach and Advocacy period, designed to assure that recommendations are systematically integrated into the policy process. The programme has two distinct objectives: 1) influencing of policy to improve forest management for urban woodfuel use and to improve rural and urban wellbeing; 2) support for the emergence of a new generation of policy researchers and analysts and institutions focused on environmental governance issues.
Phase I, Constituting the Research Team, will involve identifying the best policy research institution in which to locate such a programme and the best young policy researchers. This will involve first identifying an institution with proven social science and policy research capacities (in Senegal, candidates include ENDA—Programme Energie, CODESRIA and the Gorée Institute). Once an institution is
identified, we will work with that institution to identify and attract candidates to work and learn with us in the programme. These candidates will be asked to write research proposals in response to a concept paper developed jointly between WRI and our local partner institution. Three or four candidates will then be selected through a rigorous review process. These researchers will then constitute a team under the direct guidance of a senior policy analyst and the WRI contact person (Dr. Jesse Ribot). This period will also be used to set up a national policy advisory group to provide additional guidance for the programme.
Phase II, Assessment, will first involve an analysis of the full range of policies (from constitutional framing, electoral laws, tax codes, and justice codes to forestry codes). This is followed by grounded field research along Senegal’s charcoal commodity chain, following the structure of regulation, the market and market relations from the forest villages where wood is cut and converted to charcoal by surga, to the ‘Diallo kerñ’ venders points in Dakar and one secondary city. The analysis will be aimed at understanding the way the filière functions and the effects of the existing policy framework on production, transport, exchange and final sale. This research will explore the rural and urban price effects of current policy structures as well as the spatial distribution of production—with its ecological and social implications—that the policies and other social and economic relations within the filière encourage. The analysis includes an assessment of the effects of charcoal production and marketing on forest cover change and on carbon emissions. The final product of such the assessment phase will be a thorough mapping of the relations between current policy and the dynamics of production and marketing.
04/21/23 Page 116 of 121

Phase III, Policy Analysis, is a period of preparation for outreach and advocacy. This period is used to analyze the data collected, identify opportunities for change and intervention, formulate policy recommendations and strategies, and to discuss these policy ideas with policy makers and organizations and individuals interested in the range of issues—from environmental management to social justice—that this programme aims to influence. This is a period during which the researchers draw a number of parties into discussions that will then form the basis of a productive set of more-public policy dialogues in Phase IV. During this period the research team will write up a series of papers from their research and will boil this material down into focused policy briefs. In the policy analysis phase the researchers will analyze how policies and market relations shape ecological, economic and social outcomes. From the analysis, a number of alternative policies—ranging from minimum environmental standards approaches to deregulation and changes in decentralization or fiscal policy—will be considered.
Phase IV, Outreach and Advocacy, will be used to organize a series of national policy dialogues. These dialogues can range from open meetings with all stakeholders to smaller seminars in which findings and policy recommendations are discussed with particular interest groups such as the charcoal magnates, the national forest ‘exploiters’ union, some marabouts who have interests in the charcoal trade, the forest service, the ministry for environment, the Institute for Environmental Science (ISE) at the University, associations of forest villagers, particular villages within the charcoal production regions, members of the national assembly, etc. This phase will also involve following up on any bills ‘projets de loi’ being drafted that have implications for
the market and encouraging legislators to propose changes where necessary.
Lessons Learned:This programme is to be executed over a two to three year period. The charcoal market is most important in Senegal where we propose to base the programme. Ideally, however, we would also conduct comparative research of this nature in other countries in the region (The Gambia, Mali and Burkina Faso) where similar issues are emerging as urban woodfuel demand grows.
Reference:Ribot, J. C. (1993). “Forestry Policy and
Charcoal Production in Senegal.” Energy Policy 21(5): 559-585.
Contact:Jesse RibotInstitutions and Governance ProgramWorld Resources InstituteEmail: [email protected]
04/21/23 Page 117 of 121

Case Study 6: Sustainable Fuelwood Use through Efficient Cookstoves in Rural
Mexico
Omar Masera and Rodolfo Díaz, Instituto de Ecología, UNAM and Grupo
Interdisciplinario de Tecnología Rural Apropiada (GIRA A.C.), Patzcuaro, Mexico
Keywords: Firewood, México, cookstoves, women.
SummaryApproximately three quarters of total wood use in Mexico is devoted to fuelwood (Masera, 1996). Currently, 27.5 million people cook with fuelwood in the country (Díaz-Jiménez, 2000). Despite increased access to LPG in the last decades, Mexican rural and peri-urban inhabitants continue relying on fuelwood in a pattern of “multiple-fuel cooking”. Efficient wood-based cookstoves are being disseminated in the Patzcuaro Region of rural Mexico. The stoves are part of an integrated programme that exploits the synergies between health-environment and energy benefits . It builds on the local knowledge of indigenous women and community organizations, to provide better living conditions at the household level and improved management of forest resources. The programme also provides a link between research institutions –NGOs and local communities in a cycle of technology implementation and innovation.
Currently more than 1,000 Lorena-type stoves have been disseminated within the region. A subsidy of $ 10 US is provided to users in the form of tubes for the chimney and part of construction materials. Users provide their own labour as well as the rest of materials. Total stove costs are estimated in US$ 15. Scaling-up of the programme has been initiated as local municipalities are now providing funds to enlarge the programme. In addition to substantial benefits to the users from reduced indoor air pollution and reduction in firewood
collection and cooking times and to the local environment through reduced pressure on forests, efficient cookstoves can also provide significant global climate benefits through lowered carbon dioxide emissions.
Background The vast majority of rural communities in developing countries will continue to depend on biomass energy sources for the foreseeable future. Even in countries like Mexico, where LPG has started penetrating the highest-income rural households, fuelwood is still used in a highly resilient pattern of “multiple fuel” cooking, which results in little reduction of fuelwood consumption despite fuel switching “up the energy ladder” in some households. The continued and, in many cases, increasing use of fuelwood, and other biofuels for cooking by the rural populations of Asia, Africa, and Latin America has resulted in increased pressure on local forests. A high level of indoor pollution (IAP) from burning of biomass fuels in poorly ventilated rooms results in serious respiratory infections. The Patzcuaro Region case study illustrates a new generation of wood-based efficient cookstove dissemination programmes that have been launched in different parts of the world with high success rates. Key to their success is a shift from narrow technology-centered approaches to more integrated approaches, centered on understanding local women’s priorities and providing capacity building as well as multiple health, environmental, and financial benefits. Efficient cookstoves have been shown to provide reductions of more than 30% in IAP, a cleaner cooking environment, reductions of 30% in fuelwood consumption and a similar reduction in fuelwood gathering time or fuel purchases.
04/21/23 Page 118 of 121

ApproachThe Sustainable Fuelwood-Use Program in the Patzcuaro Region is based on an integrated and participative strategy that tries to find synergies between environmental and local socio-economic benefits. It departs from local indigenous knowledge and traditions, and searches to strengthen the abilities and capabilities of local women. To do so, socio-economic and environmental problems associated with fuelwood use are first identified and possible solutions developed by local women themselves. The programme initiated 15 years ago as a collaborative effort between the National University of Mexico (UNAM)-two local NGOs (GIRA and ORCA) and local communities. Stoves are disseminated in village clusters. Within each village, women are trained by local promoters through two workshops, where the linkages between fuelwood use, health and the environment are emphasized. Users actively participate in their own stove construction and they also help in the construction of other stoves within the village. A strict stove monitoring programme provides user feedback and assures the acceptance and adequate performance of the stoves already built. A subsidy policy, in the form of the stove chimney, and specific building materials, implemented three years ago, has been instrumental in increasing the adoption of cookstoves substantially. The subsidy is justified to make up for the difference between higher social benefits (prevention of forest degradation, and reduction in emissions of greenhouse gases) and lower private benefits (reduction in expenditure for fuelwood, savings cooking time, cleaning, and firewood collection, and reduction in respiratory illnesses) accruing to users.
The user-centered approach has resulted in dramatic programme benefits: stove adoption rates are above 85%; stove
construction time has decreased from 2 weeks to 4 hours, and stove duration is 4.8 yrs on average.
*****
Figure 1. Efficient Lorena-type cookstove shown during tortilla-making. Users’ adaptations are almost the rule, in these case a cover has been added to the
stove to increase durability and cleanliness.ImpactsThe programme has had positive socio-economic and environmental impacts. Measured fuelwood consumption and IAP reduction reach more than 30% in comparison to traditional devices. Firewood collection time has been reduced, as has the time to cook and clean pots.
Participating women and their respective families are increasingly involved in forest restoration and management programmes within their own villages. The forestry options promoted by the NGOs, range from the promotion of agroforestry systems in private lands to the support of common property forest management, and are
04/21/23 Page 119 of 121
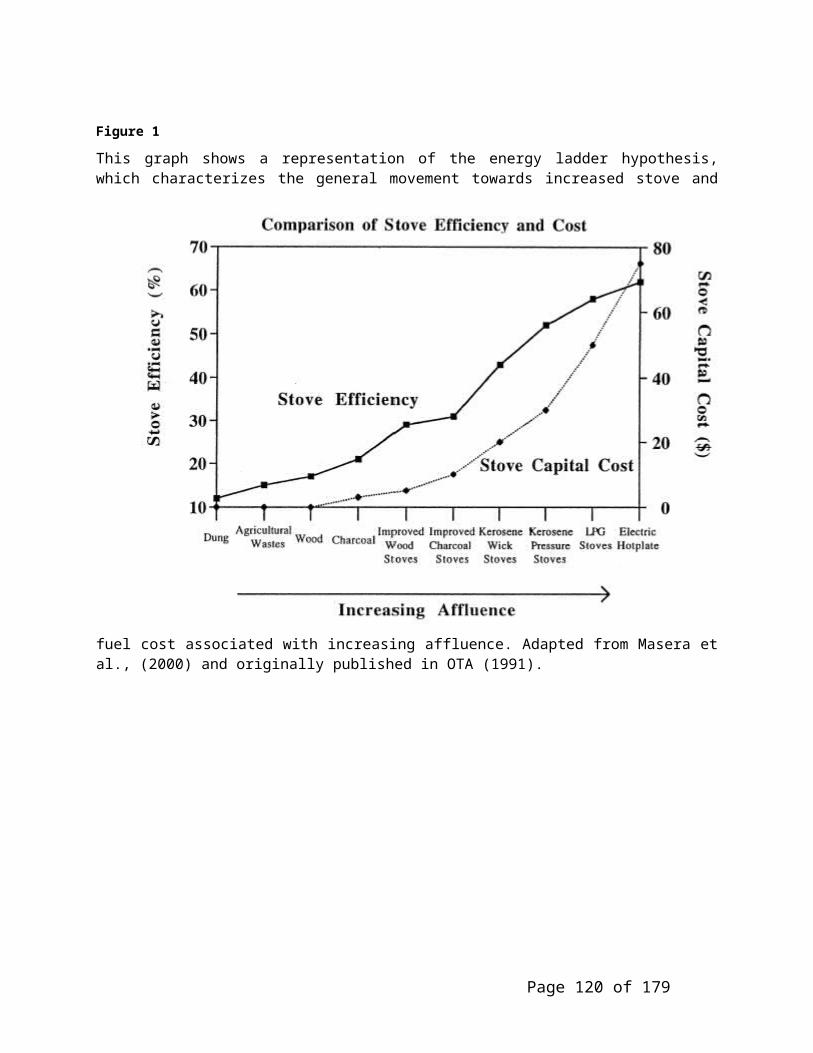
proving effective to increase the sustainability of fuelwood resources.
These small impacts have led to a multiplier effect, both within the region and at the national level. Locally, the region’s municipalities have started to fund the programme using the same subsidy incentive and one hundred people, mostly women, have been trained in stove construction and dissemination. In several villages, demand for stoves now surpasses the programme’s current supply possibilities. One hundred promoters from all over Mexico have been trained by the programme, and at least three other regions have started similar programmes.
Carbon benefits from the use of stoves have been preliminary estimated at 0.5 tC per stove-yr from fuelwood savings, which, for the average duration of the stove means 2.4 tC/stove. Thus, a price of $6.3/tC would cover the present subsidy provided to stoves.
Figure 2. Stove promoter and users chat over an efficient cookstove during tortilla-making.
Lessons LearnedThe Sustainable Fuelwood Use Program in Rural Mexico shows how a user-based and integrated approach for efficient cookstove dissemination can result in substantial environmental and socioeconomic benefits. Actively involving local women and relying on their own priorities and traditional knowledge has proven essential for stove adoption. Also essential has been adopting a flexible stove design, based on basic
principles and critical dimensions, rather than on a fixed design. The active collaboration between research institutions-local NGO’s and users have provided a nurturing field for technology innovation and adaptation. The small in-kind subsidy is essential to get users initially involved in the programme, and to speed the dissemination process. Linking fuelwood demand with environmental issues has been important to get users more aware and actively involved in programmes to increase the sustainability of fuelwood resources. Government involvement, through this clear and transparent financial support and through a decentralized approach, is essential for project success.
ReferencesMasera, O and J. Navia (1997). Fuel switching or multiple cooking fuels? Understanding inter-fuel substitution patterns in rural Mexican households, Biomass and Bioenergy, (12):5,347-361.
Masera, O.R., B.D. Saatkamp y D.M. Kammen 2000. “From Linear Fuel Switching to Multiple Cooking Strategies: A Critique and Alternative to the Energy Ladder Model for Rural Households”. World Development 28: 12, pp. 2083-2103.
ContactsRodolfo Díaz
Program Manager-GIRA AC: Sustainable Use of Biomass Resources
P.O. BOX 152, Patzcuaro 61609
Michoacan, MEXICO
Tel and FAX: (52)- 434- 23216
Email: [email protected]
04/21/23 Page 120 of 121

04/21/23 Page 121 of 121