coordinated clustering algorithms to support charging
TRANSCRIPT

Coordinated Clustering Algorithms to SupportCharging Infrastructure Design for Electric Vehicles
Marjan Momtazpour1, Patrick Butler1, M. Shahriar Hossain1,Mohammad C. Bozchalui2, Naren Ramakrishnan1, Ratnesh Sharma2
1Department of Computer Science, Virginia Tech, VA, 24060, USA2NEC Laboratories America, Inc., CA, 95014, USA
{marjan, pabutler, msh}@cs.vt.edu,[email protected], [email protected], [email protected]
ABSTRACTThe confluence of several developments has created an op-portune moment for energy system modernization. In thepast decade, smart grids have attracted many research ac-tivities in different domains. To realize the next generationof smart grids, we must have a comprehensive understandingof interdependent networks and processes. Next-generationenergy systems networks cannot be effectively designed, an-alyzed, and controlled in isolation from the social, economic,sensing, and control contexts in which they operate. In thispaper, we develop coordinated clustering techniques to workwith network models of urban environments to aid in place-ment of charging stations for an electrical vehicle deploy-ment scenario. We demonstrate the multiple factors thatcan be simultaneously leveraged in our framework in orderto achieve practical urban deployment. Our ultimate goalis to help realize sustainable energy system management inurban electrical infrastructure by modeling and analyzingnetworks of interactions between electric systems and urbanpopulations.
Categories and Subject DescriptorsH.2.8 [Database Management]: [Database Applications- Data mining - Spatial databases and GIS]; I.5.3 [PatternRecognition]: [Clustering]; I.2.6 [Artificial Intelligence]:[Learning]
General TermsExperimentation, Algorithms, Design, Measurement
KeywordsData mining, clustering, coordinated clustering, smart grids,electric vehicles, synthetic populations.
1. INTRODUCTIONThe impending decline of fossil fuels is rapidly usher-
ing an emphasis from traditional methods of energy pro-
Permission to make digital or hard copies of all or part of this work forpersonal or classroom use is granted without fee provided that copies arenot made or distributed for profit or commercial advantage and that copiesbear this notice and the full citation on the first page. To copy otherwise, torepublish, to post on servers or to redistribute to lists, requires prior specificpermission and/or a fee.ACM UrbComp ’12, August 12, 2012. Beijing, ChinaCopyright c© 2012 ACM ISBN 978-1-4503-1542-5/12/08 ...$15.00.
duction, distribution, and consumption to sustainable ap-proaches [11]. The advent of electric vehicles (EVs) is onesuch promising shift but to prepare for a world laden withEVs we must revisit smart grid design and operation.
One of the key issues in ushering in EVs is the design andplacement of charging infrastructure to support their opera-tion. Issues to be taken into account include [11]: (i) predic-tion of EV charging needs based on their owners’ activities;(ii) prediction of EV charging demands at different locationsin the city, and available charge of EV batteries; (iii) designof distributed mechanisms that manage the movements ofEVs to different charging stations; and (iv) optimizing thecharging cycles of EVs to satisfy users’ requirements, whilemaximizing vehicle-to-grid profits.
In this paper, we address the charging infrastructure de-sign problem by adopting an urban computing approach.Urban computing, [8], is an emerging area which aims tofoster human life in urban environments through the meth-ods of computational science. It is focused on understandingthe concepts behind events and phenomena spanning urbanareas using available data sources, such as people movementsand traffic flows.
Organizing relevant data sources to solve compelling ur-ban computing scenarios is itself an important research is-sue. Here, we use network datasets organized from syn-thetic population studies, originally designed for epidemio-logical scenarios, to explore the EV charging station place-ment problem. The dataset was organized for the SIAMData Mining 2006 Workshop on Pandemic Preparedness [3]and models activities of an urban population in the cityof Portland, Oregon. The supplied dataset [1] tracks a setof synthetic individuals in Portland and, for each of them,provides a small number of demographic attributes (age, in-come, work status, household structure) and daily activi-ties representing a normative day (including places visitedand times). The city itself is modeled as a set of aggre-gated activity locations, two per roadway link. A collec-tion of interoperable simulations—modeling urban infras-tructure, people activities, route plans, traffic, and popu-lation dynamics—mimic the time-dependent interactions ofevery individual in a regional area. This form of ‘individ-ual modeling’ provides a bottom-up approach mirroring thecontact structure of individuals and is naturally suited forformulating and studying the effect of intervention policiesand considering ‘what-if’ scenarios.
In more detail, we characterize this dataset with a viewtoward understanding the behavior of EV owners and todetermine which locations are most appropriate to installcharging stations. We develop a coordinated clustering for-mulation to identify a set of locations that can be considered

(a) Discovering location functionalities and characterizing electricity loads.
Coordinated
Clustering
Clusters of people
Clusters of locations
Clusters of
charging stations
EV owner characterization
Route travel
patternsElectricity load
patterns
(b) Coordinated clustering of people, locations, and charging stations.
Figure 1: Overview of our methodology.
as the best candidates for charging stations.
2. RELATED WORKWe survey related work in two categories: mining GPS
datasets and smart grid analytics. GPS datasets have emergedas a popular source for modeling and mining in urban com-puting contexts. They have been used to extract informationabout roads, traffic, buildings, and people behaviors [20],[21], [9]. The range of applications is quite varied as well,from anomaly detection [9] to taxi recommender systems[21] that aim to maximize taxi-driver profits and minimizepassengers’ waiting times. The notion of location-aware rec-ommender systems is a key topic enabled by the increasingavailability of GPS data, e.g., recommending points of inter-est to tourists [22]. We survey these works in greater detailnext.
In [20] Yuan et al. proposed a framework to discover re-gions of different functionalities based on people movements.They adapt algorithms from the topic modeling literature,by mapping a region as a document and a function as a topicso that human movements become ‘words’ in this model.The focus of [21] and [19] is different: here, GPS data isused to mine the fastest driving routes for taxi drivers. In[21], Yuan et al. mined smart driving direction from GPStrajectory of taxis, and in [19] they consider driver behaviorusing other metrics such as driving strategies and weatherconditions.
Clusters of moving objects in a noisy stadium environ-
ment are detected using the DBSCAN algorithm [5] in [12].This task supports monitoring a stadium for groups of indi-viduals that exhibit concerted behavior. In [14], the authorsestimate distributions of travel-time from GPS data for usein routing and route-recommendation.
Our work here is different from the above works in thatwe use a synthetic population dataset and routes are basedon people’s travel habits that are mapped using geograph-ical coordinates and road infrastructures. We are also notper se interested in mining the routes but to use the routeinformation to better support charging infrastructure place-ment.
Smart grid analytics has emerged as a promising approachto usher in the promise of smart grid benefits. Researchershave begun to explore the problems concomitant with EVpenetration in urban areas, especially unacceptable increasesin electricity consumption [11]. A promising way to ap-proach this problem is to understand the interactions be-tween grid infrastructure and urban populations. Whilesmart grids and EVs have been studied previously from tech-nical and AI point of views, there is a limited number of re-search on smart grids from an urban computing perspective.
In this space, agent-based systems have been proposed tosimulate city behavior in terms of agents with a view to-ward designing decentralized systems and maximizing gridprofits as well as individuals’ profit [11]. In [2] informationfrom smart meters is used for forecasting energy consump-tion patterns in a university campus micro-grid, whose re-

sults can be used for future energy planning. In our work,we directly study the problem of charging station placementusing coordinated clustering algorithms.
3. METHODOLOGYOur overall methodology is given in Figure 1. We de-
scribe each of the steps in our approach next. At a basiclevel, we integrate two basic types of data to formulate ourdata mining scenario. The first data, as described earlier, isa synthetic population of people and activities representingthe city of Portland and the second data set is electricityconsumption profile of each location. Notice that the pro-posed methodology is a generic approach and can be appliedto real-world data and the fact that we use synthetic datahere is only due to our lack of access to real-world data totest our proposed methodology.
The synthetic dataset contains 243,423 locations of which1,779 are selected as belonging to the downtown area andof further interest for our purposes. Each location is repre-sented by geographical [x,y] coordinate adopting the univer-sal transverse mercator coordinate system (UTM) [1]. Thereare a total of 1,615,860 people in the entire city. Informationabout them is organized into households, and for each house-hold we have the details of number of people in the house-hold, and the ages, genders, and incomes of each householdmember. Each person has a unique ID.
We have some information about each person includingage, gender, income, and his/her house ID. The typicalmovement patterns of people in a typical day (27 hour pe-riod) are also available. A total of 8,922,359 movements areprovided. In addition to starting and ending locations forpeople’s movements, this dataset also provides the purpose ofthe movement, categorized into nine types: {Home, Work,Shop, Visit, Social/Recreational, Serve Passenger, School,College, and Other}. A given person moves from one lo-cation to another location at a specific time for a specificpurpose (from the nine mentioned above) and stays in thatlocation for a specified period of time. These movementtypes can thus be utilized for further detailed studies. Wealso have the ability to map the locations using Google Mapsand calculate distances of traveling between locations.
To this dataset, we augment information about electricityconsumption of each location and simulate the effects of EVson its electricity demand profile. Since actual electricityconsumption data for each location is not available until allthe consumers have smart meters installed and in operationfor some time, we approximate electricity load profile usingthe existing data (organized by NEC Labs, America).
It is clear that the electricity load of each location greatlydepends on the functionality of that location and hence ourfirst approach is to utilize an information bottleneck type ap-proach [17] to characterize locations. Our aim is to clusterlocations based on geographical proximity but such that theresulting clusters are highly informative of location function.This is thus our first application of a coordinated clusteringformulation, and falls in the scope of clustering with sideinformation. Next, we integrate the electricity load infor-mation to characterize usage patterns across clusters with aview toward helping identifying locations to place charginginfrastructure.
Our next step is to more accurately characterize usagepatterns of likely EV owners. A specific set of clusters fromthe previous pipeline is used and characterized using high-income attributes as the likely owners of EVs. We thenbring in additional factors of locations that influence EVcharger placement, e.g., residentiality ratio, load on the lo-
cation, charging needs, and typical duration of stay in thelocation. Some of these factors (such as distance traveled)are in turn determined by mapping the home-to-work andwork-to-home trajectories of EV owners and their stop loca-tions. We use a coordinated clustering formulation to simul-taneously cluster three datasets in a relational setting. Ourcoordinated clustering framework builds upon our previouswork [7] which generalizes relational clustering between twonon-homogeneous datasets. This problem is a bit non-trivialsince one of the relations is a many-to-many relation and an-other is a one-to-one relation. The final set of coordinatedclusters are then used as interpretation and as a guide tocharger placement.
After locating the homes of EV owners, we can determinetheir trajectories and their stop locations. Then, based onthis data, we can estimate their travel distances. This helpsus to estimate charging requirements of EVs, during a day.With the help of the distribution of electricity load in thecity and charging needs of EVs, we determine proper loca-tions for installing charging stations in city with respect tospecific parameters.
4. ALGORITHMSAs described above, our methodology comprises the fol-
lowing four major steps to determine candidate locations forcharging stations: (i) discovering locations’ functionalitiesusing an information bottleneck method; (ii) electricity loadestimation and integrating with results of (i); (iii) studyingthe behavior of EV owners and calculating specific param-eters relevant to their usage patterns; and (iv) candidateselection for charging stations using coordinated clusteringtechniques. Each of these steps are detailed next.
4.1 Discovering Location FunctionalitiesWe use information bottleneck methods to characterize
locations with a view toward defining the specific purposeof the location. The idea of information bottleneck methodsis to cluster data points in a space (here, geography) suchthat the resulting clusters are highly informative of anotherrandom variable (here, function). We focus on 1779 loca-tions in the downtown Portland area whose geographies aredefined by (x,y) coordinates and whose functions are givenby a 9-length profile vector P = [p1, p2, ..., p9], where pi isthe number of travels incident on that location for the ith
purpose (recall the different purposes introduced in the pre-vious section).
Figure 2 (a) describes the results of a clustering based oneuclidean metrics between locations whose results are ag-gregated in Figure 2 (b) into a revised clustering that alsopreserves information about activities of people at these lo-cations. The population distribution of these clusters overtime is shown in Figure 2 (c) which reveals characteristicchanges of crowds around peak hours and lunch times. Onefinal analysis that will be useful is to evaluate each of thediscovered clusters with respect to what we term as the res-identiality ratio. The residentiality ratio for a location isthe percentage of people who use that location as a homew.r.t. all people who visit that location (in downtown Port-land, many locations have combined home-work profiles, andhence the calculation of residentiality ratio becomes rele-vant). Figure 2 (d) reveals one cluster with relatively highresidentiality ratio among three others.
4.2 Electricity Load EstimationIn order to uncover patterns in electricity load distribu-
tions, we now characterize each of the discovered clusters us-

5.24 5.245 5.25 5.255 5.26
x 105
5.039
5.0395
5.04
5.0405
5.041
5.0415
5.042x 10
6 Clustering Results by Geography (60 clusters)
X
Y
5.24 5.245 5.25 5.255 5.26
x 105
5.039
5.0395
5.04
5.0405
5.041
5.0415
5.042x 10
6 Clustering Results by comparision among behavior of people
X
Y
Area 1
Area 2
Area 3
Area 4
0 5 10 15 20 250
0.5
1
1.5
2
2.5
3
3.5
4
4.5
5x 10
4
Time
Popula
tion
Population of 4 different areas over time
Area 1
Area 2
Area 3
Area 4
5.24 5.245 5.25 5.255 5.26
x 105
5.039
5.0395
5.04
5.0405
5.041
5.0415
5.042x 10
6
X
Y
0.0469
0.0489
0.0666
0.2867
(a) (b) (c) (d)Figure 2: (a) Clustering downtown locations based on geographic coordinates. (b) Clustering over theprevious clustering with people’s activities as side-information. (c) Dynamic population of the four discoveredclusters over a typical day. (d) Computed residentiality ratio revealing one primary residential cluster.
0 5 10 15 20 25
0.8
1
1.2
1.4
1.6
1.8
2
2.2
2.4
2.6
Time
Ele
ctr
icity L
oad
College − each curve represents a day
Holiday, breaks, Summer
Weekdays
Weekends
(a) (b) (c) (d)Figure 3: (a) Electricity usage in residential areas. (b) Electricity usage in small office areas. (c) Electricityusage in large office areas. (d) Electricity usage in college areas.
ing typical profiles gathered from public data sources such asthe California End User Survey (CEUS) and other sources ofusage information. Figure 3 presents daily electricity con-sumption profile across large offices, small offices, residentialbuildings, and colleges for one year. By clustering this dataacross the year, we can discern important patterns associ-ated with different types of consumption during the year.For instance, in the college setting, we can discern threetypes of consumption patterns: holiday breaks (includingsummer), weekdays, and weekends.
Our next step is to compute the electricity load leveragingthe above patterns but w.r.t. our network model of the ur-ban environment. Recall that our network model is based onpopulation dynamics but typical electricity load sources arebased on square footage calculations. We map these factorsusing well-accepted measures, i.e., by considering the aver-age square footage occupied by one person in a residentialarea as 600sft [4], small office as 200sft [18], large office as200sft [18], college as 50sft [15], retail area as 50sft [15], andother classes as 200. Further, the minimum population foran office to be considered as a large office is set to 300.
Based on some exploratory data analysis, we selected aweekday in the past year (specifically, 18th March, 2011)and used the electricity load data of this day to map to thenetwork model. Consider that in a specific hour, N peoplego to location l in which ni of them come for the purposeof pi while
∑9i=1 ni = N . Then the electricity load for that
location is computed as
El =
9∑i=1
niApiEpi1000
, (1)
where A is the average square footage per person and Epis electricity consumption of building type p. Observe thata single location can serve multiple purposes and the aboveequation marginalizes across all uses. For example, if thereare 360 people in one location, and 10 of them are in thebuilding for the purpose of home and 350 are for the purpose
5 10 15 200
0.5
1
1.5
2
2.5
3x 10
4
load
(kW
)
hours
Electricity load for All areas
Figure 4: Electricity loads for four characterized lo-cation clusters.
of office, the total electricity consumption of building wouldbe calculated as (10 × 600 × Ephome/1000) + (350 × 200 ×Epoffice/1000) where 600 and 200 are average square footageper person for the different categories, as mentioned earlier.The above methodology enables us to characterize electricityloads in terms of the four location clusters characterized inthe previous step (see Figure 4).
4.3 Characterizing EV usersCurrently only a small percentage of people use EVs, and
this figure is correlated with high income. Based on [10]and [13], only 6 percent of people in the US have incomemore than 170,000 USD. In our synthetic dataset, 329,218people make an income greater than 60,000 USD. To explorea hypothetical scenario, we posed the question:
What if 6.31% of 329,218 people from Portlandbought EVs? What charging infrastructure isnecessary to support this scenario?
Based on our modeling of these people’s movements andpatterns, we aim to identify the best locations for chargingstations.

Figure 5 (a) gives the distribution of EV users in ourpotential scenario. We can notice several clusters aroundhigh-income neighborhoods. With the aid of Google Maps,we can estimate the amount of time an EV owner drives andhow far he/she travels on a regular week day. Figure 5 (b)gives the distribution of distances traveled by these users.
Assuming EV owners charge their cars at their respectivehomes, our goal is now to identify candidate charging lo-cations during other times. Let us assume that the EV ofa person P consumes ECP KWh energy per 100 Km. Also,assume that the battery of this vehicle can save ESP KWh.Then the estimated total distance that P can travel with hisvehicle before he needs to charge its battery is
∆P =100ESPECP
, (2)
As an example, for the Chevrolet Volt [6], with ESP = 16KWh and ECP = 22.4 KWh per 100 Km, the EV can travel71.43 Km before it needs to be recharged.
If the total traveling distance of P in a day is DP thenthe number of times that P needs to charge his vehicle isNP and is determined as follows:
NP =
⌊DP∆P
⌋, (3)
As an example, if we assume that an EV’s battery can save16 KWh energy [6], an electric car can go for 71.43 Kmbefore it needs to be charged [16].
Due to the long duration of charging process, we have aconstraint to install charging stations only in destinationsthat people visit. Assume that VL is the set of EV ownerswho visited location L during the day. Then |VL| is the totalnumber of EV owners who have visited location L. However,there is a greater chance for a location to be a chargingstation if people with higher charge needs visit that location.Hence, the charge needs of location L is determined basedon equation 4.
WL =∑P∈VL
NP , (4)
Figure 5 (c) depicts the histogram of how many times an EVneeds to be charged. Also, Figure 5 (d) depicts the chargeneeds of downtown locations.
On the other hand, each person visit a location for a spe-cific period of time which here we call it duration of stay.In order to put a charging station in one location, we forcepeople to stay for a specific period of time because chargingan electric car will take couple of hours. Hence, in locationswhere people stay longer such as working locations have po-tential to be charging stations compared to those locationsthat people stay in them for example half an hour. We useaverage duration of stay of people in each location as a fea-ture for that location.
It should be noted that the right choice of EV chargingstations depends on regular electricity load of each area, theamount of time that each person spends on this location,and number of times that EV owners need to charge theirvehicles. Hence, based on EV owners traveling route dur-ing peak and off-peak hours, we can come up with a set ofcandidate regions for charging stations.
4.4 Charging Station Placement using Coor-dinated Clustering
Since charging EVs is not an instantaneous process, it ishelpful to place charging stations at those locations where
people visit for an extended period of time. The averageduration of stay of people in each location is an importantfeature in this regard. The right choice of EV charging sta-tions thus depends on the regular electricity load of the area,the amount of time that people spend in the location, andthe number of times that EV owners need to charge their ve-hicles. Hence, based on EV owners’ traveling routes duringpeak and off-peak hours, we can arrive at a set of candidateregions for charging stations.
Let X be the income dataset and Y be the locationsdatasets. X = {xs}, s = 1, . . . , nx is the set of vectorsin dataset X , where each vector is of dimension lx, i.e.,xs ∈ Rlx . Currently, our income dataset contains onlyone dimension. Similarly, locations dataset Y = {yt}, t =1, . . . , ny,yt ∈ Rly . Locations are denoted by two dimen-sions (latitude and longitude) in our current database. Themany-to-many relationships between X and Y are repre-sented by a nx × ny binary matrix B, where B(s, t) = 1 ifxs is related to yt, else B(s, t) = 0. Let C(x) and C(y) bethe cluster indices, i.e., indicator random variables, corre-sponding to the income dataset X and location dataset Yand let kx and ky be the corresponding number of clusters.Thus, C(x) takes values in {1, . . . , kx} and C(y) takes valuesin {1, . . . , ky}.
Let mi,X be the prototype vector for cluster i in incomedataset X (similarly mj,Y ). These are the variables we wish
to estimate/optimize for. Let v(xs)i (likewise v
(yt)j ) be the
cluster membership indicator variables, i.e., the probabilitythat income data sample xs is assigned to cluster i in the
income dataset X (resp). Thus,∑rx
i=1 v(xs)i =
∑ry
j=1 v(yt)j =
1. The traditional k-means hard assignment is given by:
v(xs)i =
{1 if ||xs −mi,X || ≤ ||xs −mi′,X ||, i′ = 1 . . . kx,0 otherwise.
(Likewise for v(yt)j .) Ideally, we would like a continuous
function that tracks these hard assignments to a high degreeof accuracy. Such a continuous function for the the clustermembership can be defined as follows.
v(xs)i =
exp(− ρD||xs −mi,X ||2)∑kx
i′=1 exp(− ρD||xs −mi′,X ||2)
(5)
where ρ is a user-settable parameter and D is the pointsetdiameter which depends on the data.
An analogous equation holds for v(yt)j .
We prepare a kx×ky contingency table to capture the re-lationships between entries in clusters across income datasetX and locations dataset Y. To construct this contingencytable, we simply iterate over every combination of data enti-ties from X and Y, determine whether they have a relation-ship, and suitably increment the appropriate entry in thecontingency table:
wij =
nx∑s=1
ny∑t=1
B(s, t)v(xs)i v
(yt)j . (6)
We also define
wi. =
ky∑j=1
wij , w.j =
kx∑i=1
wij ,
where wi. and w.j are the row-wise (income cluster-wise)and column-wise (locations cluster-wise) counts of the cellsof the contingency table respectively.
We also define the row-wise random variables αi, i = 1, . . . , kxand column-wise random variables βj , j = 1, . . . , ky with

0 0.5 1 1.5 2 2.5 3 3.5 4 4.5
x 105
0
2000
4000
6000
8000
10000
12000
14000Distribution of Distance of Traveling
DistanceN
um
be
r o
f P
eo
ple
1 2 3 4 5 6 70
2000
4000
6000
8000
10000
12000
14000
16000
Num
ber
of P
eople
Histogram of the number of times EV owner needs to charge his car
Number of charging
5.24 5.245 5.25 5.255 5.26
x 105
5.039
5.0395
5.04
5.0405
5.041
5.0415
5.042x 10
6
X
Y
Number of Charging Needs for Each Location
2
4
6
8
10
12
14
16
18
20
22
(a) (b) (c) (d)
Figure 5: (a) EV household locations. (b) Distribution of distances people travel in their EVs. (c) Chargingneeds for EVs. (d) Number of charging needs (more than zero) per location.
Figure 6: Coordinated clustering schema.
probability distributions as follows
p(αi = j) = p(C(y) = j|C(x) = i) =wijwi.
. (7)
p(βj = i) = p(C(x) = i|C(y) = j) =wijw.j
. (8)
The row-wise distributions represent the conditional distri-butions of the clusters in dataset in X given the clusters inY; the column-wise distributions are also interpreted analo-gously.
After we construct the contingency table, we must evalu-ate it to see if it reflects a coordinated clustering. In coordi-nated clustering, we expect that the contingency table willbe nonuniform. We can expect that the contingency tablewill be an identity matrix when kx = ky. To keep the formu-lation and the implementation generic for different numberof clusters in two dataset, we need to optimize the variables(cluster prototypes) in such a way that the contingency tableis far from its uniform case. For this purpose, we comparethe income cluster (row-wise) and locations cluster (column-wise) distributions from the contingency table entries to theuniform distribution.
We use KL-divergences to define our unified objectivefunction:
F =1
kx
kx∑i=1
DKL
(αi||U
(1
ky
))+
1
ky
ky∑j=1
DKL
(βj ||U
(1
kx
)),
(9)
where DKL is the KL-divergence between two distributionsand U indicates the uniform distribution over a row or acolumn.
Note that the row-wise distributions take values over thecolumns 1, . . . , ky and the column-wise distributions takevalues over the rows 1, . . . , kx. Hence the reference distribu-tion for row-wise variables is over the columns, and vice
versa. Also, observe that the row-wise and column-wiseKL-divergences are averaged to form F . This is to miti-gate the effect of lopsided contingency tables (kx � ky orky � kx) wherein it is possible to optimize F by focusingon the “longer” dimension without really ensuring that theother dimension’s projections are close to uniform.
Maximizing F leads to rows (income clusters) and columns(locations clusters) in the contingency table that are far fromthe uniform distribution as required by the coordinated clus-ters. It is equivalent to minimizing −F .
The coordinated clustering formulation presented thus farcan have some degenerate solutions where large number ofdata points in both datasets are assigned to the same clusterleading to a huge overlap of relationships. To mitigate this,we add two more terms with the objective function.
FR = −F +DKL
(p (α) ||U
(1
kx
))+DKL
(p (β) ||U
(1
ky
)).
(10)
It should be noted that function FR is expected to beminimized. This is the reason why −F is used in the formulafor FR.
Finally, we describe how to integrate three datasets: in-come, location, and station properties. Let X , Y, and Z bethese three datasets, respectively. There are two sets of re-lationships, existing between X , Y, and Y, Z. The objectivefunction for these three datasets and two sets of relationshipsis defined as follows.
FXYZ = FR (X ,Y) + FR (Y,Z) . (11)
Here FR (X ,Y) refers to the objective function described inEq. 10 with the income dataset X , and locations dataset Y.FR (Y,Z) refers to the same objective function but inputdatasets are locations Y, and station property Z. In all
5.24 5.245 5.25 5.255 5.26
x 105
5.039
5.0395
5.04
5.0405
5.041
5.0415
5.042x 10
6
X
Y
Categorization of Locations based on People Income
Rich
Middle
Poor
5.24 5.245 5.25 5.255 5.26
x 105
5.039
5.0395
5.04
5.0405
5.041
5.0415
5.042x 10
6
X
Y
Clustering Result on Geographical Coordination of Locations (x,y)
Center
North
South
5.24 5.245 5.25 5.255 5.26
x 105
5.039
5.0395
5.04
5.0405
5.041
5.0415
5.042x 10
6
X
Y
Geographical Locations of Clustering Results of Third Table
Cluster 1
Cluster 2
Cluster 3
(a) (b) (c)
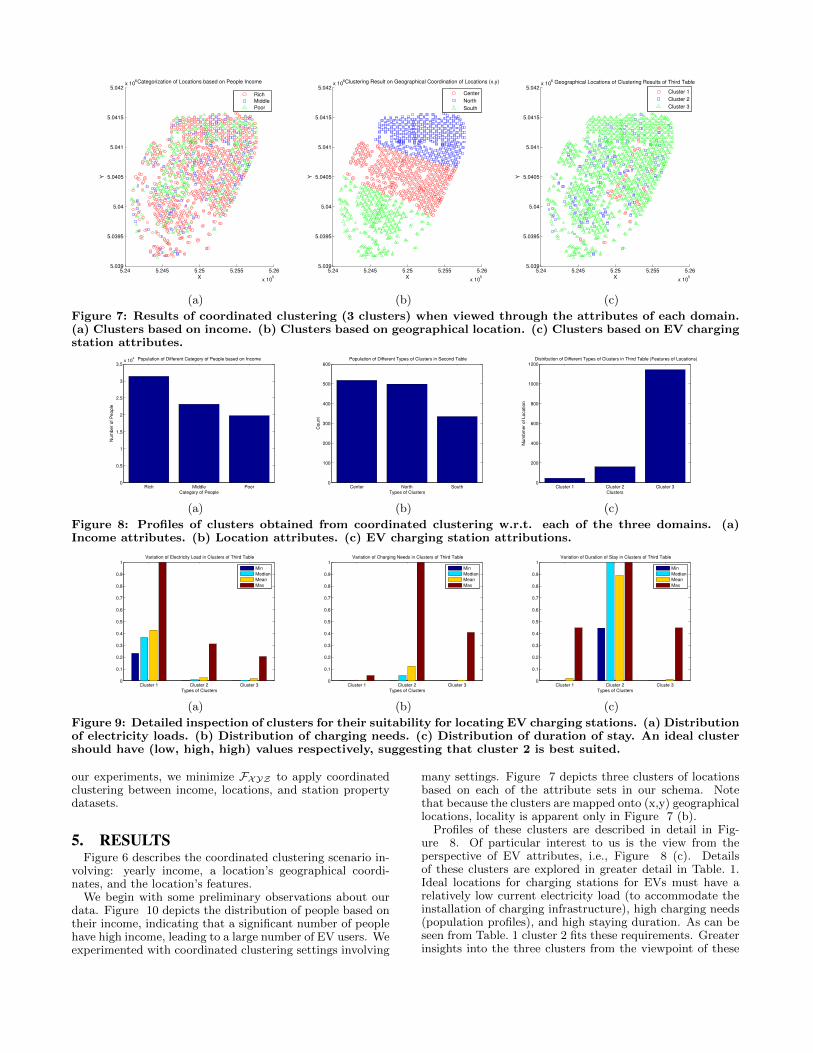
Figure 7: Results of coordinated clustering (3 clusters) when viewed through the attributes of each domain.(a) Clusters based on income. (b) Clusters based on geographical location. (c) Clusters based on EV chargingstation attributes.
Rich Middle Poor0
0.5
1
1.5
2
2.5
3
3.5x 10
4
Nu
mb
er
of
Pe
op
le
Category of People
Population of Different Category of People based on Income
Center North South0
100
200
300
400
500
600
Co
un
t
Types of Clusters
Population of Different Types of Clusters in Second Table
Cluster 1 Cluster 2 Cluster 30
200
400
600
800
1000
1200
Nu
mb
me
r o
f L
oca
tio
n
Clusters
Distribution of Different Types of Clusters in Third Table (Features of Locations)
(a) (b) (c)
Figure 8: Profiles of clusters obtained from coordinated clustering w.r.t. each of the three domains. (a)Income attributes. (b) Location attributes. (c) EV charging station attributions.
Cluster 1 Cluster 2 Cluster 30
0.1
0.2
0.3
0.4
0.5
0.6
0.7
0.8
0.9
1
Types of Clusters
Variation of Electricity Load in Clusters of Third Table
Min
Median
Mean
Max
Cluster 1 Cluster 2 Cluster 30
0.1
0.2
0.3
0.4
0.5
0.6
0.7
0.8
0.9
1
Types of Clusters
Variation of Charging Needs in Clusters of Third Table
Min
Median
Mean
Max
Cluster 1 Cluster 2 Cluste 30
0.1
0.2
0.3
0.4
0.5
0.6
0.7
0.8
0.9
1
Types of Clusters
Variation of Duration of Stay in Clusters of Third Table
Min
Median
Mean
Max
(a) (b) (c)
Figure 9: Detailed inspection of clusters for their suitability for locating EV charging stations. (a) Distributionof electricity loads. (b) Distribution of charging needs. (c) Distribution of duration of stay. An ideal clustershould have (low, high, high) values respectively, suggesting that cluster 2 is best suited.
our experiments, we minimize FXYZ to apply coordinatedclustering between income, locations, and station propertydatasets.
5. RESULTSFigure 6 describes the coordinated clustering scenario in-
volving: yearly income, a location’s geographical coordi-nates, and the location’s features.
We begin with some preliminary observations about ourdata. Figure 10 depicts the distribution of people based ontheir income, indicating that a significant number of peoplehave high income, leading to a large number of EV users. Weexperimented with coordinated clustering settings involving
many settings. Figure 7 depicts three clusters of locationsbased on each of the attribute sets in our schema. Notethat because the clusters are mapped onto (x,y) geographicallocations, locality is apparent only in Figure 7 (b).
Profiles of these clusters are described in detail in Fig-ure 8. Of particular interest to us is the view from theperspective of EV attributes, i.e., Figure 8 (c). Detailsof these clusters are explored in greater detail in Table. 1.Ideal locations for charging stations for EVs must have arelatively low current electricity load (to accommodate theinstallation of charging infrastructure), high charging needs(population profiles), and high staying duration. As can beseen from Table. 1 cluster 2 fits these requirements. Greaterinsights into the three clusters from the viewpoint of these

<0 0 − 5k 5−10k 10−15k 15−20k 20−25k 25−30k 30−35k 35−40k 40−45k 45−50k 50−55k 55−60k >60k0
0.2
0.4
0.6
0.8
1
1.2
1.4
1.6
1.8
2x 10
4N
um
ber
of P
eople
Income
Histogram of People Income
Figure 10: Distribution of income.
Table 1: Characteristics of Clusters in Third Table(Location’s Features)
Cluster Elec. Load Charging Need Stay Duration1 High Low Low2 Low High High3 Low Low Low
three attributes is shown in Figure 9 supporting the choiceof locations in cluster 2 as the right candidates for locatingcharging stations.
6. DISCUSSIONElectrical vehicles are only going to become more popular
in the near future. We have demonstrated a systematic datamining methodology that can be used to identify locationsfor placing charging infrastructure as EV needs grow. Theresults presented here can be generalized to a temporal sce-nario where we accommodate a growing EV population andto design charging infrastructure to accommodate additionalscenarios of smart grid usage and design.
The methodology presented in this paper only incorpo-rates demand data from the electricity infrastructure and fu-ture work would incorporate information from the electricitysupply side too. Information such loading level of electric-ity feeders and remaining excess capacity of feeders for EVcharging stations can be integrated in presented method-ology to improve the placement of EV charging stations.Moreover, this methodology can be used to identify loca-tions of interest for deployment of stationary energy storagesto more efficiently utilize existing electricity infrastructurerather than building new expensive transmission capacity tomeet the demand of EV charging stations.
7. REFERENCES[1] Synthetic Data Products for Societal Infrastructures
and Proto-Populations: Data Set 1.0. TechnicalReport NDSSL-TR-06-006, Network Dynamics andSimulation Science Laboratory, Virginia Tech,Blacksburg, VA, 2006.
[2] S. Aman, Y. Simmhan, and V. K. Prasanna.Improving Energy Use Forecast for CampusMicro-grids using Indirect Indicators. In IEEEWorkshop on Domain Driven Data Mining, 2011.
[3] C. Bailey-Kellogg, N. Ramakrishnan, and M. Marathe.Spatial data mining to support pandemicpreparedness. SIGKDD Explor. Newsl., 8(1):80–82,Jun 2006.
[4] K. S. Blake, R. L. Kellerson, and A. Simic. MeasuringOvercrowding in Housing, September 2007.
[5] M. Ester, H. Kriegel, J. Sander, and X. Xu. ADensity-based Algorithm for Discovering Clusters inLarge Spatial Databases with Noise. In KDD ’96,pages 226–231, 1996.
[6] GM-Volt. Chevrolet Volt Specifications. Last accessedMay 16 2012http://Gm-volt.com/full-specification.
[7] M. S. Hossain, S. Tadepalli, L. T. Watson,I. Davidson, R. F. Helm, and N. Ramakrishnan.Unifying Dependent Clustering and DisparateClustering for Non-homogeneous Data. In KDD ’10,pages 593–602, 2010.
[8] T. Kindberg, M. Chalmers, and E. Paulos. UrbanComputing. IEEE Pervasive Computing, pages 18–20,July-September 2007.
[9] W. Liu, Y. Zheng, S. Chawla, J. Yuan, and X. Xie.Discovering Spatio-Temporal Causal Interactions inTraffic Data Streams. In KDD ’11, August 2011.
[10] N. Munro. Obama Hikes Subsidy to Wealthy ElectricCar Buyers. Last accessed May 16 2012http://dailycaller.com/2012/02/13/obama-hikes-subsidy-to-wealthy-electric-car-buyers/.
[11] S. D. Ramchurn, P. Vytelingum, A. Rogers, and N. R.Jennings. Putting the ’Smarts’ into the Smart Grid: AGrand Challenge for Artificial Intelligence.Communications of the ACM, 55(4):86–97, April 2012.
[12] J. Rosswog and K. Ghose. Detecting and TrackingCoordinated Groups in Dense, Systematically Moving,Crowds. In SDM ’12, pages 1–11, 2012.
[13] Simply Hired, Inc. Portland Jobs. Last accessed May16 2012 http://www.simplyhired.com/a/local-jobs/city/l-Portland,+OR.
[14] R. Takahashi, T. Osogami, and T. Morimura.Large-Scale Nonparametric Estimation of VehicleTravel Time Distributions. In SDM ’12, pages 12–23,April 2012.
[15] The Engineering ToolBox. Common Area per Personin Buildings. Last accessed: May 16 2012http://www.engineeringtoolbox.com/number-persons-buildings-d_118.html.
[16] The official U.S. Government Source for Fuel EconomyInformation. Fuel Economy. Last accessed May 162012 http://www.fueleconomy.gov/feg/,.
[17] N. Tishby, F. C. Pereira, and W. Bialek. TheInformation Bottleneck Method. In 37th AnnualAllerton Conference on Communication, Control andComputing, pages 368–377, 1999.
[18] U.S. General Services Administration. Office SpaceUse Review, Current Practices and Emerging Trends,September 1997.
[19] J. Yuan, Y. Zheng, and et al. Driving with Knowledgefrom the Physical World. In KDD ’11, 2011.
[20] J. Yuan, Y. Zheng, and X. Xie. Discovering Region ofDifferent Functions in a City Using Human Mobilityand POI. In KDD ’12, 2012.
[21] J. Yuan, Y. Zheng, C. Zhang, W. Xie, X. Xie, andY. Huang. T-Drive: Driving Directions Based on TaxiTrajectories. In ACM SIGSPATIAL GIS 2010, 2010.
[22] Y. Zheng, L. Zhang, X. Xie, and W. Ma. MiningCorrelation between Locations Using Human LocationHistory. In ACM SIGSPATIAL GIS 2009, 2009.