cool factor: greenest city action plan - pembina.org · cool factor: greenest city action plan the...
TRANSCRIPT

Sust
aina
ble
Ener
gy S
olut
ions
Canada’s Coolest Cities looked at the question: “What are Canada’s large cities doing to encourage low-carbon choices for personal transportation?”Vancouver striving to be the World’s Greenest CityThe City of Vancouver wants to be the Greenest City in the World and has developed a team and an action plan to get there. In 2009, the City announced ten specific goals Van-couver needs to achieve by 2020 to become the global leader in progress toward an environmentally sustainable future. These specific goals — on green economy, green communities and human health — will provide direction for policies and a means to evaluate the progress. The City of Vancouver has al-ready demonstrated its success at setting goals, taking action and evaluating progress with its targets to reduce greenhouse gas emissions. The City set greenhouse gas reduction targets in 2003, developed an action plan in 2005 and has presented progress reports every two years following. As of 2008, greenhouse gas emissions for the City have returned to 1990 levels, and the Greenest City Action Plan provides motivation to continue action on reductions.
Other indicators also showed strong progress for the City of Vancouver. In 2006, the City had the largest percentage of commuters travelling by walking or cycling (16%) of the six cities we studied. However, a smaller percentage of people in Vancouver use public transit than in Toronto or Montreal, where the subway systems are more established. Overall, a similar fraction of people in Vancouver use low-carbon modes of transportation as in Toronto and Montreal.
COOLEST CITIESCANADA’S
Vancouver & CMACool Factor: Greenest City Action Plan
TheVancouverCMAwastheonlyCMAtoseeadecreaseinaveragecommutedistance.
TheVancouverCMAexperiencedthelargestpopulationgrowthinneighbourhoodswithhighresidentialdensityofthesixlargestCMAsinCanada.
In2006,theCityofVancouverhadthelargestpercentageofcommuterstravellingbywalkingorcyclingofthesixcitiesinthisstudy.
TheVancouverCMAshowedthelargestimprovementincommuterstravellingbybus,walkingandcycling.
RESULTS SUMMARY — VANCOUVER
The City of Vancouver planning department reported that greenhouse gas emissions are implicitly being considered as part of its land use and transportation plans, although they are not explicitly incorporated into every decision. All these actions likely helped to limit the growth in greenhouse gas emissions. The City’s greenhouse gas emissions from light-duty vehicles increased by 16% between 1990 and 2008.
Challenges remainThe Vancouver Census Metropolitan Area (CMA; see definition on page 6) covers a much larger geographical area than the city and has not achieved the same success. The CMA includes 22 cities that are strongly connected by economic and transportation ties. Transportation and urban form solutions need to consider this wider region since the activities of residents tend to routinely cross the municipal borders. Additionally, the population of the CMA is growing more quickly than the population of the city. The Vancouver CMA has a much lower overall population density than the City of Vancouver and has a much smaller percentage of commuters using transit, bikes or walking.
However, compared to other CMAs, the Vancouver CMA is showing great improvement. The Vancouver CMA increased the fraction of people living in high-density neighbourhoods; as well, transit trips increased by 28% from 2002 to 2006, far exceeding the population growth.
FOR MORE INFORMATION
communities.pembina.orgHere you will find the complete Coolest Cities technical report, plus all six Case Studies:
• Vancouver• Calgary• Edmonton
• Toronto• Ottawa• Montreal
City of Vancouver’s greenhouse gas reduction targets1. Reduce the City of Vancouver’s greenhouse gas emissions
to:• 6% below 1990 levels by 2012• 33% below 2007 levels by 2020 • 80% below 2007 levels by 2050
2. By 2020, all new construction will be carbon neutral, and Vancouver will improve the efficiency of existing buildings by 20%.
3. By 2020, the majority (greater than 50%) of transportation trips will be made on foot, bicycle and transit.
CANADA’S COOLEST CITIES — Case Study
City of Vancouver
City of Vancouver’s strategy for climate action and transportationThe City of Vancouver has been taking action to reduce greenhouse gas emissions since the early ’90s. As of 2008, greenhouse gas emissions for the City have returned to 1990 levels, even though the population has grown by 27%. Vancouver’s Greenest City initiative includes the targets for greenhouse gas reductions noted above.
The City’s Transportation Plan was released in 1997. While it did not explicitly define greenhouse gas targets, it did set targets for reducing vehicle use. According to City staff, the plan also stated the principle of not increasing the capacity of Vancouver’s roads for personal vehicles. Vancouver re-cently launched the EcoDensity charter, which commits the City to consider environmental sustainability, affordability and livability in all land use decision-making.
TheGreenestCityinitiativeincludestenspecifictargetsfor2020:1. Create20,000newgreenjobs.2. Reducegreenhousegasemissions33%from2007levels.3. Allnewconstructiontobecarbonneutral;improveefficiencyof
existingbuildingsby20%.4. Makethemajorityoftripsonfoot,bicycleandpublictransit.5. Reducepercapitasolidwastegoingtolandfill/incinerator40%.6. Everypersonliveswithinafive-minutewalkofapark,beach,
greenwayorothernaturalspace;plant150,000additionaltrees.7. Reducepercapitaecologicalfootprintby33%.8. AlwaysmeetorbeatthestrongestofB.C.,CanadaandWorld
HealthOrganizationdrinkingwaterstandards;reducepercapitawaterconsumptionby33%.
9. AlwaysmeetorbeatWorldHealthOrganizationairqualityguidelines,whicharestrongerthanCanadianguidelines.
10.Reducethecarbonfootprintofourfoodby33%.
COOL FACTOR: World’s Greenest City
CITY OF VANCOUVER CHALLENGES CITY OF VANCOUVER SUCCESSES
• ReducinggreenhousegasesisanacknowledgedpriorityfortheCityofVancouver.
• GreenestCityinitiativeincludestenspecifictargetsincludingtransportation.
• Asof2008,theCity’stotalgreenhousegasemissionshavereturnedto1990levels.
• Provincialleadershipisencouragingspecificactiontoreducegreenhousegasemissions.
CITY STATS (2006 CENSUS)
Population:578,041
Land Area: 114.71km2
Density:5,039residentsperkm2
• Landuseandtransportationdecisionsareslowtoincorporategreenhousegases.
• Thereisagapbetweenthehigh-levelgoalsandtheactionscurrentlybeingtaken.
• Greenhousegasesemissionsfromlight-dutyvehiclesgrewby16%from1990to2008.
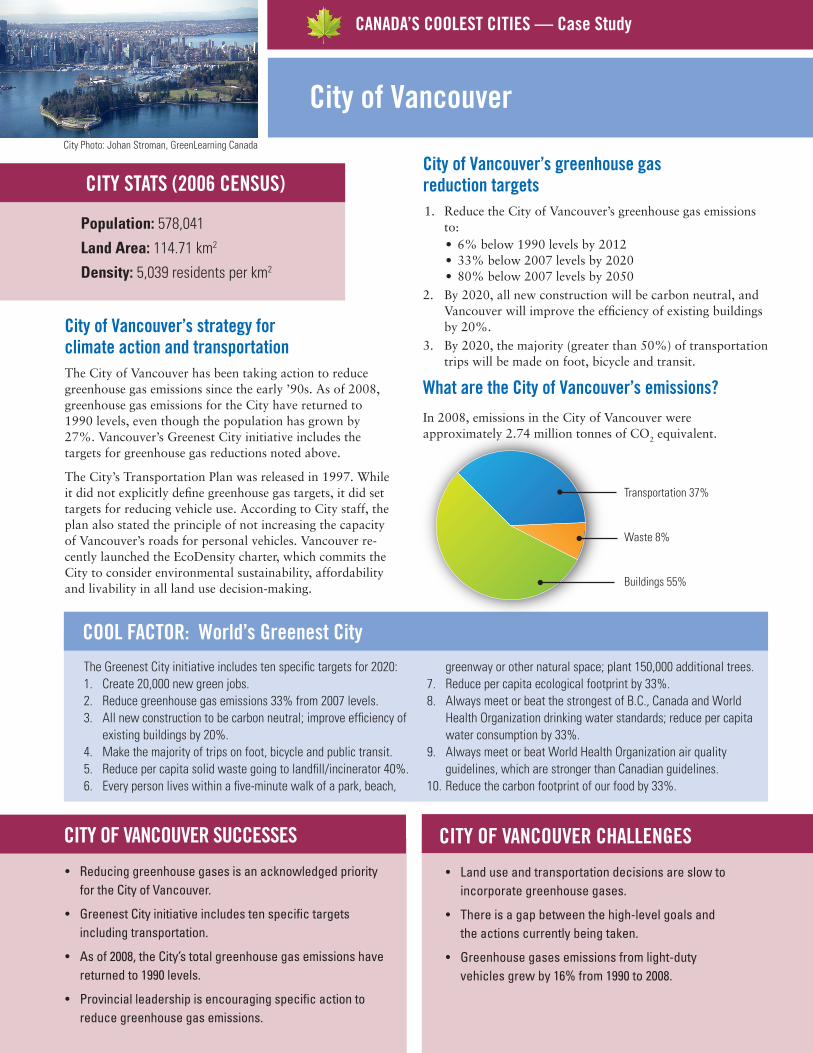
What are the City of Vancouver’s emissions?In 2008, emissions in the City of Vancouver were approximately 2.74 million tonnes of CO2 equivalent.
Transportation37%
Waste8%
Buildings55%
CityPhoto:JohanStroman,GreenLearningCanada
City of Vancouver
CANADA’S COOLEST CITIES — Case Study
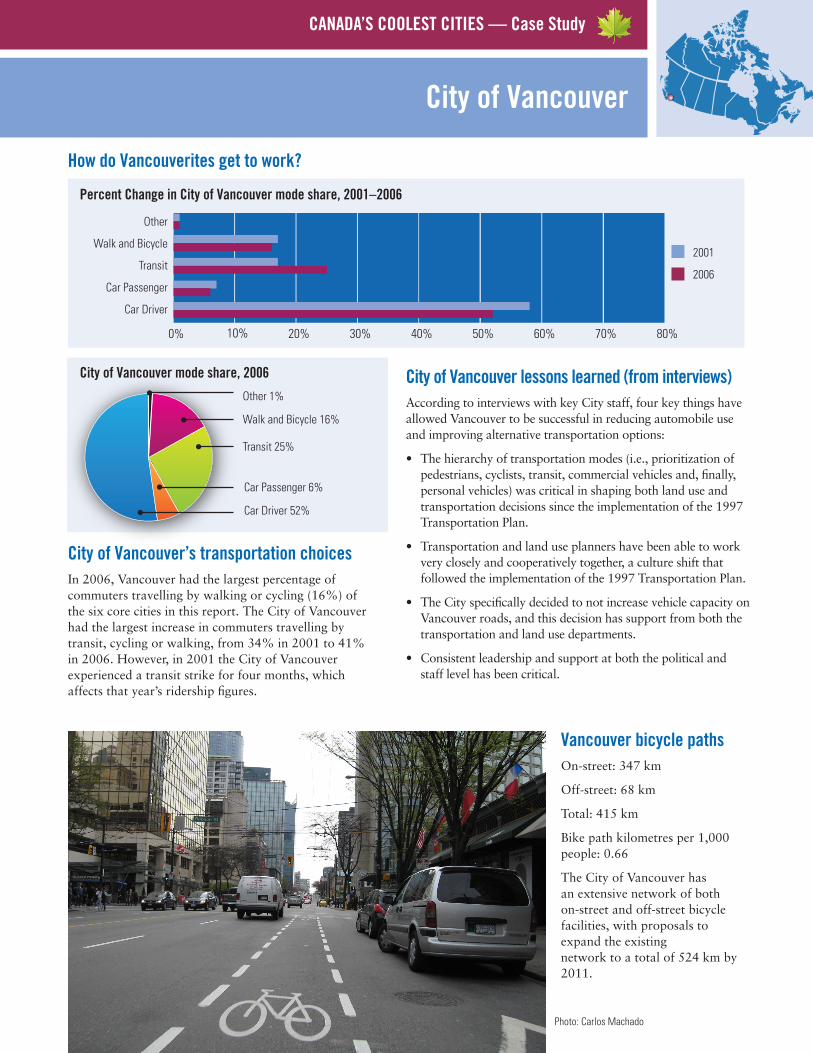
City of Vancouver’s transportation choices In 2006, Vancouver had the largest percentage of commuters travelling by walking or cycling (16%) of the six core cities in this report. The City of Vancouver had the largest increase in commuters travelling by transit, cycling or walking, from 34% in 2001 to 41% in 2006. However, in 2001 the City of Vancouver experienced a transit strike for four months, which affects that year’s ridership figures.
City of Vancouver lessons learned (from interviews)According to interviews with key City staff, four key things have allowed Vancouver to be successful in reducing automobile use and improving alternative transportation options:
• The hierarchy of transportation modes (i.e., prioritization of pedestrians, cyclists, transit, commercial vehicles and, finally, personal vehicles) was critical in shaping both land use and transportation decisions since the implementation of the 1997 Transportation Plan.
• Transportation and land use planners have been able to work very closely and cooperatively together, a culture shift that followed the implementation of the 1997 Transportation Plan.
• The City specifically decided to not increase vehicle capacity on Vancouver roads, and this decision has support from both the transportation and land use departments.
• Consistent leadership and support at both the political and staff level has been critical.
Vancouver bicycle pathsOn-street: 347 km
Off-street: 68 km
Total: 415 km
Bike path kilometres per 1,000 people: 0.66
The City of Vancouver has an extensive network of both on-street and off-street bicycle facilities, with proposals to expand the existing network to a total of 524 km by 2011.
City of Vancouver mode share, 2006
Other1%
WalkandBicycle16%
Transit25%
CarPassenger6%
CarDriver52%
How do Vancouverites get to work?
Percent Change in City of Vancouver mode share, 2001–2006
Other
WalkandBicycle
Transit
CarPassenger
CarDriver
0% 10% 20% 30% 40% 50% 60% 70% 80%
2001
2006
Photo:CarlosMachado
Where are residents of the Vancouver CMA choosing to live?
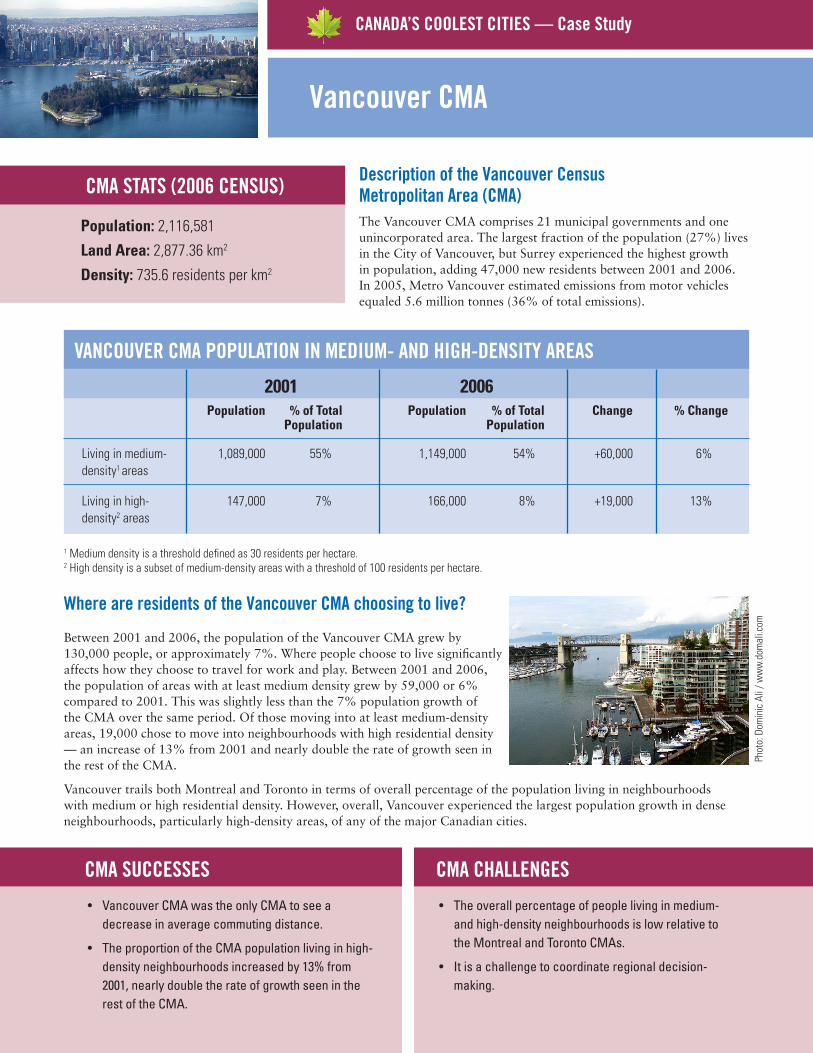
Between 2001 and 2006, the population of the Vancouver CMA grew by 130,000 people, or approximately 7%. Where people choose to live significantly affects how they choose to travel for work and play. Between 2001 and 2006, the population of areas with at least medium density grew by 59,000 or 6% compared to 2001. This was slightly less than the 7% population growth of the CMA over the same period. Of those moving into at least medium-density areas, 19,000 chose to move into neighbourhoods with high residential density — an increase of 13% from 2001 and nearly double the rate of growth seen in the rest of the CMA.
Vancouver trails both Montreal and Toronto in terms of overall percentage of the population living in neighbourhoods with medium or high residential density. However, overall, Vancouver experienced the largest population growth in dense neighbourhoods, particularly high-density areas, of any of the major Canadian cities.
CANADA’S COOLEST CITIES — Case Study
Vancouver CMA
CMA STATS (2006 CENSUS)
Population:2,116,581
Land Area: 2,877.36km2
Density:735.6residentsperkm2
Description of the Vancouver Census Metropolitan Area (CMA)The Vancouver CMA comprises 21 municipal governments and one unincorporated area. The largest fraction of the population (27%) lives in the City of Vancouver, but Surrey experienced the highest growth in population, adding 47,000 new residents between 2001 and 2006. In 2005, Metro Vancouver estimated emissions from motor vehicles equaled 5.6 million tonnes (36% of total emissions).
2001 2006 Population % of Total Population % of Total Change % Change Population Population
Livinginmedium- 1,089,000 55% 1,149,000 54% +60,000 6%density1areas
Livinginhigh- 147,000 7% 166,000 8% +19,000 13%density2areas
VANCOUVER CMA POPULATION IN MEDIUM- AND HIGH-DENSITY AREAS
1Mediumdensityisathresholddefinedas30residentsperhectare.2Highdensityisasubsetofmedium-densityareaswithathresholdof100residentsperhectare.
CMA SUCCESSES CMA CHALLENGES
• VancouverCMAwastheonlyCMAtoseeadecreaseinaveragecommutingdistance.
• TheproportionoftheCMApopulationlivinginhigh-densityneighbourhoodsincreasedby13%from2001,nearlydoubletherateofgrowthseenintherestoftheCMA.
• Theoverallpercentageofpeoplelivinginmedium-andhigh-densityneighbourhoodsislowrelativetotheMontrealandTorontoCMAs.
• Itisachallengetocoordinateregionaldecision-making.
Phot
o:D
omin
icA
li/w
ww
.dom
ali.c
om

How do people in the Vancouver CMA get to work?
In 2006, 25% of commuters chose to walk, bike or take transit in the Vancouver CMA. However, the vast majority of commuters travelled either as vehicle drivers or passengers.
The Vancouver CMA falls fourth behind Montreal, Toronto and Ottawa-Gatineau in terms of the fraction of commuters who walk, cycle or take transit to work. The City of Vancouver’s success at encouraging low-carbon modes of transportation has not yet transferred to the wider CMA.
How far are residents of the Vancouver CMA commuting?
Between 2001 and 2006 the Vancouver CMA saw the average commute distance decrease by 3%, from 7.6 km to 7.4 km. Vancouver was the only CMA to see a decrease in the commute distance during this time period.
Vancouver CMA
CANADA’S COOLEST CITIES — Case Study
Vancouver CMA mode share, 2006
Other1%
WalkandBicycle8%
Transit17%
CarPassenger7%
CarDriver67%
Average commute distance in Vancouver CMA
Percent Change in Vancouver CMA mode share, 2001–2006
Other
WalkandBicycle
Transit
CarPassenger
CarDriver
0% 10% 20% 30% 40% 50% 60% 70% 80%
2001
2006
2001
2006
km
0.0 2.0 4.0 6.0 8.0 10.0
Regular passenger transit trips in Vancouver CMA
Vancouver CMA transit servicesTransit trips in the Vancouver CMA1 increased by 28% from 20022 to 2006, far exceeding the population growth of 6%. The CMA improved transit service but not in pace with growth in transit trips — transit service hours increased by 18% and transit vehicle kilometres increased by 17%.1TransitdataforVancouverarereportedforanurbanareasimilartotheCMAboundaries.22002wasusedasthebaseyearforthisindicator,duetoatransitstrikein2001whichwouldbiasresults.
200
180
160
140
120
100
80
60
40
20
02001 2002 2003 2004 2005 2006
Phot
o:D
omin
icA
li/w
ww
.dom
ali.c
om
Canada’s six largest urban areas provide homes and jobs for almost 15 million people, nearly half of our population. Transporting these citizens to and from work, school, health care, shopping and other destinations consumes energy, which in turn contributes to environmental problems, in particular climate change. Municipal and other local governments have the opportunity and responsibility to take action on reducing greenhouse gas emissions, especially those from transportation in their boundaries.
The amount of energy consumed for personal transportation in cities depends on urban design — the locations of homes, jobs and services, plus the options for travelling among these locations. Urban design and transportation policies can help decrease energy consumption, save money, limit environmental impacts and make communities more livable.
The information in this case study was developed by analyzing numeric data from both the core city and the wider census metropolitan area (CMA), and by interviewing staff at the core city. The numeric data provide a picture of current transportation and urban design choices, as influenced by past policies and decisions. The interviews allowed us to explore potential future directions based on current policies.
The study consists of six case studies, one for each of Canada’s largest urban areas (Toronto, Montreal, Vancouver, Ottawa, Edmonton and Calgary), and a technical report. The technical report covers the research approach, findings across the different urban areas and recommendations. The other case studies and the technical report are available at http://communities.pembina.org.
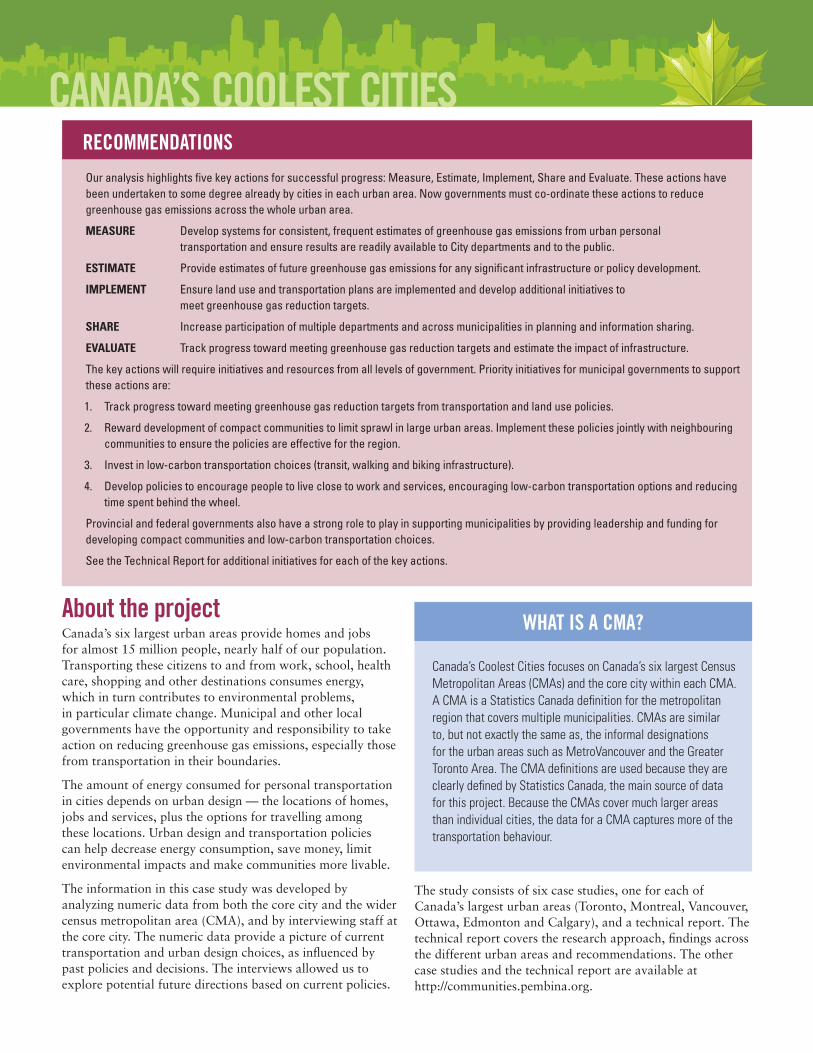
RECOMMENDATIONS
Ouranalysishighlightsfivekeyactionsforsuccessfulprogress:Measure,Estimate,Implement,ShareandEvaluate.Theseactionshavebeenundertakentosomedegreealreadybycitiesineachurbanarea.Nowgovernmentsmustco-ordinatetheseactionstoreducegreenhousegasemissionsacrossthewholeurbanarea.
MEASURE Developsystemsforconsistent,frequentestimatesofgreenhousegasemissionsfromurbanpersonal transportationandensureresultsarereadilyavailabletoCitydepartmentsandtothepublic.
ESTIMATE Provideestimatesoffuturegreenhousegasemissionsforanysignificantinfrastructureorpolicydevelopment.
IMPLEMENT Ensurelanduseandtransportationplansareimplementedanddevelopadditionalinitiativesto meetgreenhousegasreductiontargets.
SHARE Increaseparticipationofmultipledepartmentsandacrossmunicipalitiesinplanningandinformationsharing.
EVALUATE Trackprogresstowardmeetinggreenhousegasreductiontargetsandestimatetheimpactofinfrastructure.
Thekeyactionswillrequireinitiativesandresourcesfromalllevelsofgovernment.Priorityinitiativesformunicipalgovernmentstosupporttheseactionsare:
1. Trackprogresstowardmeetinggreenhousegasreductiontargetsfromtransportationandlandusepolicies.
2. Rewarddevelopmentofcompactcommunitiestolimitsprawlinlargeurbanareas.Implementthesepoliciesjointlywithneighbouringcommunitiestoensurethepoliciesareeffectivefortheregion.
3. Investinlow-carbontransportationchoices(transit,walkingandbikinginfrastructure).
4. Developpoliciestoencouragepeopletoliveclosetoworkandservices,encouraginglow-carbontransportationoptionsandreducingtimespentbehindthewheel.
Provincialandfederalgovernmentsalsohaveastrongroletoplayinsupportingmunicipalitiesbyprovidingleadershipandfundingfordevelopingcompactcommunitiesandlow-carbontransportationchoices.
SeetheTechnicalReportforadditionalinitiativesforeachofthekeyactions.
CANADA’S COOLEST CITIES
About the project
Canada’sCoolestCitiesfocusesonCanada’ssixlargestCensusMetropolitanAreas(CMAs)andthecorecitywithineachCMA.ACMAisaStatisticsCanadadefinitionforthemetropolitanregionthatcoversmultiplemunicipalities.CMAsaresimilarto,butnotexactlythesameas,theinformaldesignationsfortheurbanareassuchasMetroVancouverandtheGreaterTorontoArea.TheCMAdefinitionsareusedbecausetheyareclearlydefinedbyStatisticsCanada,themainsourceofdataforthisproject.BecausetheCMAscovermuchlargerareasthanindividualcities,thedataforaCMAcapturesmoreofthetransportationbehaviour.
WHAT IS A CMA?