conversion of sugarcane bagasse to ethanol by the use of ...63… · of zymomonas mobilis and...
TRANSCRIPT

Conversion of sugarcane bagasse to
ethanol by the use of Zym om onas m obilis
and Pichia st ipit is
by
Nan Fu
Bachelor of Engineering (Biology), Shaanxi University of Science and Technology, China
Master of Applied Science (Biotechnology), University of Western Sydney, Australia
A thesis submitted in fulfillment of the requirements for the degree of
Master of Science (Honours)
School of Natural Sciences
University of Western Sydney
Sydney, Australia
Dec 2008

Declarat ion
I hereby declare that this submission is my own work and to the best of my
knowledge it contains no materials previously published or written by another person,
nor material which to a substantial extent has been accepted for the award of any
other degree or diploma at UWS or any other educational institution, except where
due acknowledgement is made in the thesis. Any contribution made to the research
by others, with whom I have worked at UWS or elsewhere, is explicitly
acknowledged in the thesis.
I also declare that the intellectual content of this thesis is the product of my own
work, except to the extent that assistance from others in the project’s design and
conception or in style, presentation and linguistic expression is acknowledged.
Nan Fu

Dedicated to my parents,
Kangping, Fu & Xiaolan, Wang

Acknow ledgem ents
The year 2008 will stand out as a very special year in my life. Looking back
sometimes I wonder how I finally made it. This thesis is a result of all the
encouragement and support from those people mentioned below. I wish to express
my sincere gratitude to my three supervisors. Dr. Paul Peiris who gave me invaluable
suggestions on both the experimental work and the report; the academic attitude and
research skills I have learned from him will be life-time treasures for me. Professor
John Bavor who made me the first sieve plate; his insightful advice and kind help got
me through many difficulties. I specially appreciate the scientific experimental
design Ms. Julie Markham taught me; her careful logic and details showed me the
value of being a good scientist.
My special thanks to all the staff members in the School of Natural Sciences, and all
others who helped me with my research. Especially the technical staff; without
whose help my project would not have reached the current level. Thanks to Jenny
Smith, who helped with the second sieve plate and improved on it; Carol Adkins,
whose knowledge on microbial cultures and fermentation processes always helped
me immensely; and Julie Svanberg, who revived both the HPLC and GC systems,
and patiently optimized them for me.
I also wish to thank my parents, for giving me life, raising me up and teaching me
“no matter what happened, to keep going forward”. To my friends and relatives,
thank you all for being so great. Finally, for all my contacts from the Internet, I want
you to know that you supported me through one of the darkest shadows of my life.
I am grateful for everything.
i
Abstract
The rapid development of the bioethanol industry globally demonstrates the
importance of bioethanol as an alternate energy source to the depleting fossil fuels.
To decrease costs and avoid undue pressure on the global food supply, the renewable
lignocelluloses appear to be a better substrate for bioethanol production compared to
others being investigated. This study investigated the conversion of lignocellulosic
material, sugarcane bagasse, to ethanol by the use of Zymomonas mobilis and Pichia
stipitis.
The investigation of fermentation characteristics of the two strains revealed that their
performance on the ethanol production was closely related to the viable cell
concentration in the medium. The increase of inoculum size to five fold resulted in
an increase in the system co-efficiency to 2.2 fold and 5.2 fold respectively for Z.
mobilis and P. stipitis. A theoretical value de (the cell instantaneous ethanol
production rate) was introduced to describe the ethanol productivity based on
biomass. System co-efficiency proved to be only affected by the viable cell
concentration (xC) and de, regardless of ethanol re-assimilation.
Immobilized culture of Z. mobilis and P. stipitis showed distinct differences in their
characteristics. The bacterium acclimatized to the interior of gel beads; the biomass
concentration within the beads increased greater than 10 fold during the reuse of the
beads, resulting in an improved fermentation performance. The immobilized P.
stipitis gave a similar system co-efficiency level of approximately 0.5 g/l/h under
different culture conditions; cell growth in the medium was considerably more
vigorous compared to that within the beads.
P. stipitis sole-culture on the glucose/xylose medium with a high inoculum size
showed a comparable fermentation efficiency with the best result of the co-culture
processes. Fermentation of 50.0 g/l of sugar mixture (30.0 g/l glucose and 20.0 g/l

ii
xylose) was completed in 20 h with an ethanol yield of 0.44 g/g. No catabolite
repression due to glucose was observed for the xylose assimilation.
Co-culture of immobilized Z. mobilis and free cells of P. stipitis proved to be the best
fermentation scheme on the glucose/xylose sugar mixture co-fermentation. The
removal of Z. mobilis after the utilization of glucose improved the stability of the
performance. The best result showed that 50.0 g/l sugars were fully converted to
ethanol within 19 h, giving an ethanol yield of 0.49 g/g, which is 96% of the
theoretical rate. When co-cultured, viable cells of Z. mobilis inhibited the cell
activity of P. stipitis, and were capable of growing to high concentration levels
without an appropriate carbon source.
Acid and enzymatic hydrolysates of sugarcane bagasse showed similar
fermentability, but the hydrolysate without overliming significantly inhibited both
cell growth and ethanol production of P. stipitis. The co-culture process on the
hydrolysate medium successfully utilized 53.56 g/l sugars (32.14 g/l glucose and
21.42 g/l xylose) in 26 h with a yield of 0.43 g/g; this value further increased to 0.49
g/g when ethanol peaked at 40 h.
A high cell density proved to be an effective method to improve the system
co-efficiency for ethanol production. For the fermentation processes on the sugar
medium, results achieved in this study, 10.54 g/l/h for Z. mobilis free cell culture on
glucose, 0.755 g/l/h for P. stipitis free cell culture on xylose, 1.092 g/l/h for P. stipitis
free cell culture on the glucose/xylose mixture and 1.277 g/l/h for glucose/xylose
co-fermentation using co-culture, are higher than the best values reported in the
literature in batch culture. In the fermentation of the hydrolysate, the system
co-efficiency of 0.879 g/l/h achieved with co-culture is comparable to the best values
reported for the fermentation of lignocellulosic hydrolysates.

iii
Publicat ions
Manuscripts
Fu, N., Peiris, P., Markham, J., and Bavor, J., (2008) “Improving ethanol productivity
of Zymomonas mobilis and Pichia stipitis using a high cell density system”.
In preparation for publication in Applied Microbiology and Biotechnology.
Fu, N., Peiris, P., Markham, J., and Bavor, J., (2008) “Co-culture of Zymomonas
mobilis and Pichia stipitis on glucose/xylose sugar medium and bagasse
hydrolysate”. In preparation for publication in Biotechnology and
Bioengineering.
Conferences
Fu, N., Peiris, P., Markham, J., and Bavor, J., (2008) “Conversion of Sugarcane
Bagasse to Ethanol by Co-culture of Zymomonas mobilis and Pichia stipitis”,
Proceeding of the Research Futures Postgraduate Conference 2008,
University of Western Sydney, Sydney, N.S.W., Australia, 3rd
– 5th, June.
Fu, N., Peiris, P., Markham, J., and Bavor, J., (2007) “Conversion of Sugarcane
Bagasse to Ethanol by Strain Co-cultivation of Zymomonas mobilis and
Pichia stipitis”, Proceeding of the Research Futurse Postgraduate
Conference 2007, University of Western Sydney, Sydney, N.S.W., Australia,
5th – 7
th, June.

iv
Contents
Declaration
Dedication
Acknowledgements
Abstract i
Publications iii
Contents iv
List of Figures x
List of Tables xiv
Nomenclature xvii
1 Introduction……………………………………………………………………......1
1.1 Bioethanol production……………………………………………………......1
1.2 Lignocellulosic fuel…………………………………………………………..3
1.3 Aim and objectives…………………………………………………………...4
2 Literature review………………………………………………………………….5
2.1 Lignocellulose for ethanol production……………………………………….5
2.2 Glucose fermentation by Z. mobilis...………………………………………..7
2.2.1 Biochemistry of ethanol production by Z. mobilis……………………....7
2.2.2 Culture of Z. mobilis on glucose…………………………………….......9
2.2.3 Immobilized Z. mobilis………………………………………………....11
2.3 Xylose fermentation………………………………………………………...12

v
2.3.1 Biochemistry of ethanol production from xylose………………………12
2.3.2 Fermentation of xylose to ethanol……………………………………...14
2.4 Co-fermentation of glucose/xylose sugar mixture………………………….18
2.4.1 Co-culture process involving Z. mobilis……………………………….18
2.4.2 Employment of a glucose fermenter and a xylose fermenter………….19
2.4.3 Justification for the strain combination of Z. mobilis and P. stipitis…...23
2.5 Hydrolysis of lignocellulose………………………………………………...24
2.5.1 Physicochemical methods of hydrolysis……………………………….24
2.5.2 Enzymatic hydrolysis…………………………………………………..27
2.5.3 Fermentation of hydrolysate.…………………………………………...28
2.6 Conversion of lignocellulose using other fermentation schemes…………...30
2.6.1 Simultaneous saccharification and fermentation……………………….30
2.6.2 Application of genetically modified microorganisms………………….32
3 Material and methods……………………………………………………………34
3.1 Overview of experimental design…………………………………………...34
3.2 General Procedures………………………………………………………….34
3.3 Microorganisms……………………………………………………………..38
3.4 Media………………………………………………………………………..38
3.5 Inoculum preparation…………………………………………………….....39
3.6 Whole cell immobilization………………………………………………….41
3.7 Fermentations……………………………………………………………….42
3.7.1 Shake flask fermentations……………………………………………...43
3.7.2 Glucose fermentation with Z. mobilis………………………………….43
3.7.3 Xylose fermentation with P. stipitis……………………………………43
3.7.4 Co-fermentations……………………………………………………….43
3.7.4.1 Sequential culture………………………………………………..44
3.7.4.2 Co-culture with free cells………………………………………..44
3.7.4.3 The use of immobilized Z. mobilis in the co-culture…………….45
3.7.4.4 Co-culture processes in a modified fermentor…………………...45
3.7.4.5 Culture of P. stipitis on glucose/xylose mixture…………………45
3.8 Sampling techniques………………………………………………………...46
3.9 Hydrolysis of sugarcane bagasse……………………………………………47
3.9.1 Acid hydrolysis………………………………………………………...47

vi
3.9.2 Enzymatic hydrolysis…………………………………………………..48
3.9.3 Preparation of hydrolysate for fermentation…………………………...48
3.9.4 Strain adaptation to the hydrolysate……………………………………49
3.10 Analytical methods………………………………………………………….49
3.10.1 Determination of sugar concentration……………………………….49
3.10.1.1 Reducing sugar assay…………………………………………...49
3.10.1.2 Glucose oxidase assay………………………………………….51
3.10.1.3 HPLC…………………………………………………………...53
3.10.2 Determination of biomass growth…………………………………...53
3.10.2.1 Viable cell concentration………………………………………..53
3.10.2.2 Dry biomass weight…………………………………………….54
3.10.3 Determination of ethanol……………………………………………55
3.11 Calculation of kinetic parameters…………………………………………...55
4 Free cell culture of Z. mobilis and P. stipitis on sugar medium………………..57
4.1 Effect of inoculum size on the performance of Z. mobilis…………….........58
4.2 Optimization of ethanol production by P. stipitis from xylose……………...60
4.2.1 Effect of medium composition on the performance of P. stipitis………61
4.2.2 Time courses with 10% inoculum size…………………………………63
4.2.3 Time courses with 50% inoculum size…………………………………65
4.2.4 Time courses with 100% inoculum size………………………………..67
4.2.5 Comparison of best performance on each inoculum level……………..69
4.2.6 Correlation between the biomass concentration and ethanol production
for P. stipitis……………………………………………………………71
4.3 Discussion…………………………………………………………………..73
4.3.1 The correlation between the amount of biomass and ethanol production
for Z. mobilis culture on glucose……………………………………….73
4.3.2 The correlation between the amount of biomass and ethanol production
for P. stipitis culture on xylose…………………………………………77
4.3.3 The role of oxygenation in the xylose fermentation…………………...78
4.3.4 Significance and application of the cell instantaneous ethanol production
rate [de]………………………………………………………………...80
4.3.5 Improvement of ethanol production by Z. mobilis and P. stipitis……...81

vii
5 Immobilized cultures of Z. mobilis and P. stipitis………………………………85
5.1 Fermentations employing immobilized Z. mobilis………………………….85
5.1.1 Effect of immobilization on the fermentation performance of Z.
mobilis………………………………………………………………….85
5.1.2 Effect of recycling of the immobilized Z. mobilis beads………………87
5.1.3 Effect on glucose fermentation of a sieve plate in the modified
bioreactor…………………………………………………………….....89
5.1.4 Biomass accumulation of immobilized Z. mobilis during the
reconditioning process………………………………………………….91
5.2 Fermentations employing immobilized P. stipitis…………………………..93
5.2.1 Fermentation characteristics of immobilized P. stipitis culture………..94
5.2.2 Immobilized P. stipitis culture under different oxygenation levels…….97
5.2.3 Immobilized P. stipitis culture with different initial sugar
concentrations………………………………………………………….98
5.3 Discussion…………………………………………………………………..99
5.3.1 Immobilized Z. mobilis culture………………………………………...99
5.3.1.1 Fermentation characteristics of immobilized Z. mobilis................99
5.3.1.2 Biomass accumulation within the beads………………………..100
5.3.1.3 Reconditioning of the beads…………………............................100
5.3.2 Immobilized P. stipitis culture………………………………………..102
5.3.2.1 Differences between the immobilized P. stipitis and immobilized Z.
mobilis…………………………………………………………..103
5.3.2.2 Effects of oxygenation level on the immobilized P. stipitis
culture…………………………………………………………..105
5.3.2.3 Effects of initial xylose concentration on the immobilized P. stipitis
culture..........................................................................................107
6 Co-fermentation of glucose/xylose mixture to ethanol……………………….110
6.1 Comparison of four fermentation schemes involving both Z. mobilis and P.
stipitis………………………………………………………………………111
6.1.1 Time course with sequential culture…………………………………..111
6.1.2 Time courses with co-culture of free cells…………………………….112
6.1.3 Time courses with co-culture involving immobilized Z. mobilis……..116
6.1.4 Time courses with co-culture in a modified bioreactor……………….119

viii
6.1.5 Comparison of three co-culture processes with different fermentation
schemes……………………………………………………………….124
6.2 Effect of increased initial sugar level in the co-culture process…………..127
6.3 Cell interaction between Z. mobilis and P. stipitis in the co-culture
process……………………………………………………………………..130
6.3.1 Effect of Z. mobilis cells on the P. stipitis fermentation on the Xylose
Medium……………………………………………………………….131
6.3.2 Effect of Z. mobilis cells on the P. stipitis fermentation on the
Co-fermentation Medium……………………………………………..133
6.4 Sole culture of P. stipitis on glucose/xylose sugar mixture medium………136
6.4.1 Investigation of fermentation performance in shake flasks……..........136
6.4.2 Co-fermentation of glucose/xylose sugar mixture by sole culture of P.
stipitis in a 1 l bioreactor…………………...........................................139
6.5 Discussion…………………………………………………………………142
6.5.1 Comparison of co-fermentations with four fermentation schemes
employing two strains………………………………………………...142
6.5.1.1 Sequential culture………………………………………………142
6.5.1.2 Co-culture process of free cells………………………………...143
6.5.1.3 Co-culture process with immobilized Z. mobilis and free cells of P.
stipitis…………………………………………………………...144
6.5.1.4 The removal of Z. mobilis cells from the co-culture process after
the completion of glucose fermentation………………………...145
6.5.2 Possible interactions between Z. mobilis and P. stipitis in a co-culture
process………………………………………………………………...147
6.5.3 Process considerations for the co-culture process…………………….149
6.5.3.1 Effects of initial sugar level…………………………………….149
6.5.3.2 Inoculum size and economic considerations…………………...151
6.5.4 The potential of P. stipitis sole culture for the glucose/xylose
co-fermentation……………………………………………………….152
6.5.4.1 Fermentation characteristics of P. stipitis sole culture on the
glucose/xylose mixture medium………………………………..152
6.5.4.2 Comparison between P. stipitis sole culture and co-culture for
glucose/xylose co-fermentation………………………………...154

ix
7 Conversion of sugarcane bagasse hydrolysate to ethanol……………………156
7.1 Optimization of conditions for bagasse hydrolysis…………......................156
7.1.1 Acid hydrolysis……………………………………………………….156
7.1.2 Enzymatic hydrolysis…………………………………………………158
7.2 Preparation of hydrolysate medium for fermentation……………………..161
7.3 Fermentation of bagasse hydrolysate……………………………………...164
7.3.1 Time course on the enzymatic hydrolysate…………………………...165
7.3.2 Time course on the acid hydrolysate………………………………….168
7.3.3 Time course on the hydrolysate without pretreatment and
detoxification………………………………………………………….169
7.3.4 Kinetic parameters of three time courses on the hydrolysate
medium………………………………………………………………..171
7.4 Discussion…………………………………………………………………172
7.4.1 Hydrolysis process……………………………………………………172
7.4.2 Fermentation processes using the hydrolysates………………………174
7.4.2.1 Process considerations for the co-culture and the P. stipitis sole
culture on the hydrolysate medium……………………………..174
7.4.2.2 General discussion……………………………………………...177
8 Conclusions and recommendations for future work…………………………179
8.1 General conclusions……………………………………………………….179
8.1.1 The correlation between viable cell concentration and system
co-efficiency…………………………………………………………..179
8.1.2 Fermentation characteristics of sole strain culture……………………181
8.1.3 Co-culture of Z. mobilis and P. stipitis………………………………..182
8.1.4 Fermentation of bagasse hydrolysate…………………………………182
8.2 Recommendations for future work………………………………………...183
Reference…………………………………………………………………………….186
Appendix……………………………………………………………………………..199
A. Optimization of the Glucose oxidase method………………………………...199

x
List of Figures
Figure 2.1: Main pathway of glucose metabolism to ethanol by Zymomonas
mobilis: (a) Entner-Doudoroff pathway, (b) Ethanol production as
fermentation products 9
Figure 2.2: Main pathway of xylose metabolism to ethanol in yeasts 13
Figure 3.1: Schematic diagram of the overall experimental design in this study 35
Figure 3.2: A 1 l bioreactor used in this study 37
Figure 3.3: Inoculum preparation for large inoculum sizes 40
Figure 3.4: Outline for the preparation of immobilized cells 42
Figure 3.5: Modified bioreactor with the added sieve plate 46
Figure 3.6: Sampling procedure in this study 46
Figure 3.7: Procedure of acid hydrolysis 47
Figure 3.8: Standard curves of glucose and xylose for reducing sugar assay 51
Figure 3.9: Glucose Agar plate showing colonies of P. stipitis (big) and Z.
mobilis (small) 54
Figure 4.1: Comparison of the biomass concentration in time courses with
different inoculum size for Z. mobilis: (a) viable cell concentration,
(b) dry cell weight 58
Figure 4.2: Comparison of kinetic parameters of time courses with different
inoculum size of Z. mobilis 59

xi
Figure 4.3: Comparison of biomass growth of P. stipitis on three media during
three subcultures 62
Figure 4.4: Comparison of sugar consumption and ethanol production of P.
stipitis on three media after three subcultures: (a) reducing sugar,
(b) ethanol 63
Figure 4.5: Viable cell concentration for xylose fermentations with an
inoculum size of 10% 64
Figure 4.6: Viable cell concentration for xylose fermentations with an
inoculum size of 50% 66
Figure 4.7: Biomass concentration for xylose fermentations with an inoculum
size of 100%: (a) viable cell count, (b) dry cell weight 67
Figure 4.8: Comparison of kinetic parameters of fermentations with best
results from three inoculum levels for P. stipitis culture 70
Figure 4.9: Results of shake flask experiments of P. stipitis on Xylose Medium:
(a) dry cell weight, (b) reducing sugars, (c) ethanol production 72
Figure 4.10: The relationship of fermentation time and volumetric productivity
to biomass concentration for Z. mobilis culture on glucose 74
Figure 5.1: Comparison of sugar utilization and ethanol production between a
free cell Z. mobilis culture and an immobilized culture 86
Figure 5.2: Comparison of sugar utilization and ethanol production between
immobilized Z. mobilis cultures with and without the sieve plate:
(a) different batches with similar biomass; (b) same batch
repeatedly cultured 90
Figure 5.3: Cell growth in the fermentation medium of immobilized P. stipitis
culture 96
Figure 6.1: Co-fermentation process employing a sequential culture of Z.
mobilis and P. stipitis 111
Figure 6.2: Viable cell results of two time courses with free cell co-culture: (a)
P. stipitis, (b) Z. mobilis 115

xii
Figure 6.3: Viable cell results of three time courses co-culturing immobilized
Z. mobilis and free cells of P. stipitis: (a) P. stipitis, (b) Z. mobilis in
the medium 118
Figure 6.4: Modified bioreactor showing the removal of immobilized Z.
mobilis beads by the sieve plate: (a) immobilized Z. mobilis
co-cultured with free cells of P. stipitis in the bioreactor; (b) & (c)
sieve plate was raised, separating the immobilized beads containing
Z. mobilis and xylose fermentation continuing with the beads away
from the fermentation medium. 121
Figure 6.5: Viable cell results of three time courses with co-culture in modified
bioreactor: (a) P. stipitis, (b) Z. mobilis in the medium 124
Figure 6.6: Comparison of co-culture processes in different fermentation
scheme: (a) glucose, (b) reducing sugar, (c) ethanol 126
Figure 6.7: Viable cell results of two time courses with co-culture on 45 g/l
glucose and 30 g/l xylose: (a) P. stipitis, (b) Z. mobilis in the
medium 129
Figure 6.8: Strain interactions between Z. mobilis and P. stipitis – Xylose
Medium: (a) viable cells of P. stipitis, (b) viable cells of Z. mobilis,
(c) overall ethanol production
132
Figure 6.9: Strain interactions between Z. mobilis and P. stipitis –
Co-fermentation Medium: (a) viable cells of P. stipitis, (b) viable
cells of Z. mobilis, (c) overall ethanol production
134
Figure 6.10: Results of shake flask experiments of P. stipitis on the
Co-fermentation Medium 136
Figure 6.11: Comparison of biomass growth of P. stipitis on the
Co-fermentation Medium and the Xylose Medium 137
Figure 6.12: Viable cell results of three time courses culturing P. stipitis on
Co-fermentation Medium 141
Figure 6.13: Co-fermentation process employing P. stipitis sole culture with an

xiii
inoculum size of 100% and an air flow level of 300 rpm 141
Figure 7.1: Comparison of sugar yields under various acid hydrolysis
conditions 157
Figure 7.2: Sugar yields with different enzyme combination after 96 h
incubation 159
Figure 7.3: Sugar yields with sequential enzyme addition and increased
enzyme loading 160
Figure 7.4: Comparison of sugar yields between hydrolysates after
centrifugation and after manual-squeezing 161
Figure 7.5: Preparation of acid hydrolysate and enzymatic hydrolysate of
bagasse for fermentation 162
Figure 7.6: Time course using enzymatic hydrolysate of bagasse as substrate:
(a) sugar utilization and ethanol production; (b) biomass growth 165
Figure 7.7: Time course using acid hydrolysate of bagasse as substrate: (a)
sugar utilization and ethanol production; (b) biomass growth 169
Figure 7.8: Time course using hydrolysate without pretreatment and
detoxification as substrate 170
Figure A.1: Effects of reaction parameters on the Glucose oxidase method: (a)
wavelength, (b) amount of chromogen 202
Figure A.2: Effects of stopping reagent on the Glucose oxidase method: (a) 2
ml of concentrated sulfuric acid, (b) 5 ml of 25% sulfuric acid, (c)
2 ml of 25% sulfuric acid, (d) 2 ml of pre-chilled distilled water 203

xiv
List of Tables
Table 3.1: Solid media composition 38
Table 3.2: Liquid media composition 39
Table 3.3: Comparison of some features between inoculation modes 41
Table 3.4: Common aeration levels used in this study 43
Table 3.5: Enzymes used for hydrolysis 48
Table 3.6: Composition of supplements added to bagasse hydrolysate 48
Table 3.7: Reagents added in the RS assay 50
Table 4.1: Composition of the three media for P. stipitis culture on xylose 61
Table 4.2: Kinetic parameters for xylose fermentation with an inoculum size of
10% 64
Table 4.3: Kinetic parameters for xylose fermentation with an inoculum size of
50% 66
Table 4.4: Kinetic parameters for xylose fermentation with an inoculum size of
100% 68
Table 4.5: Fermentations with best results from three inoculum levels for P.
stipitis culture on xylose 70
Table 5.1: Kinetic parameters of immobilized Z. mobilis on repeated culture 88
Table 5.2: The effect of CaCl2 on the biomass of immobilized Z. mobilis during
reconditioning
92

xv
Table 5.3: The effect of glucose concentration on the biomass growth of
immobilized Z. mobilis during reconditioning
92
Table 5.4: Comparison of kinetic parameters between a free cell P. stipitis
culture and an immobilized culture 94
Table 5.5: Kinetic parameters of immobilized P. stipitis in repeated culture 95
Table 5.6: Biomass concentration within the immobilized P. stipitis beads during
two time courses 95
Table 5.7: Kinetic parameters of immobilized P. stipitis culture under different
oxygenation levels 97
Table 5.8: Kinetic parameters of immobilized P. stipitis culture with different
initial xylose concentrations 98
Table 6.1: Kinetic parameters of the time course employing a sequential culture 112
Table 6.2: Kinetic parameters of four time courses using free cell co-culture 113
Table 6.3: Kinetic parameters of three time courses employing co-culture with
immobilized Z. mobilis 116
Table 6.4: Three inoculum levels used for co-culture processes in modified
bioreactor 120
Table 6.5: Kinetic parameters of time courses with co-culture in modified
bioreactor 122
Table 6.6: Kinetic parameters of two time courses with co-culture on 45 g/l
glucose and 30 g/l xylose 128
Table 6.7: Five inoculum levels employed for the investigation of the
interactions between P. stipitis and Z. mobilis 130
Table 6.8: Comparison of two co-fermentation processes: P. stipitis sole culture
in the shake flask and two strains co-culture in the bioreactor 138
Table 6.9: Process conditions and kinetic parameters for P. stipitis sole culture
on the Co-fermentation Medium 139
Table 7.1: Conditions for acid hydrolysis of the three batches of bagasse 157

xvi
Table 7.2: Enzyme combinations used for three batches of bagasse in the first
enzymatic hydrolysis experiment 158
Table 7.3: Sugar yields in the hydrolysates prepared for fermentation 163
Table 7.4: Comparison of hydrolysis efficiency of enzymatic hydrolysis with
and without prior acid treatment 164
Table 7.5: Conditions for three fermentation processes using bagasse
hydrolysate 164
Table 7.6: Kinetic parameters of three time courses on the hydrolysate medium 171

xvii
Nom enclature
Definitions
Co-fermentation: Used to describe a fermentation process involving two sugars,
which are converted to ethanol in a single process. It can be achieved by either the
co-culture of two strains or the utilization of one strain only, as far as it works on
the simultaneous conversion of mixed sugar substrate.
Co-culture: Used only when two microorganisms are cultured together and
simultaneously existing in the medium; it is in different from “sequential culture”,
where microorganisms are cultured successively.
General Abbreviations
oC Degree Celsius
μg/mcg microgram
atm atmosphere
ATP adenosine triphosphate
cfu colonies forming unit
cm centimeter
DNS dinitrosalicylic acid
ED Entner-Doudoroff pathway
EMP Embden-Meyerhof Pathway

xviii
FS fermentation scheme
g gram
GC gas chromatography
GMO genetically modified organisms
GO glucose oxidase
h hour
HPLC High Performance Liquid Chromatography
l litre
M molar (moles/l)
mg milligram
min minute
ml millilitre
mmol millimole
OTR oxygen transfer rate
PPP Pentose Phosphate Pathway
RD respiratory deficient
rpm revolutions per volume
RS reducing sugar
sec second
SHF separate hydrolysis and fermentation
SSCF simultaneous saccharification and co-fermentation
SSF simultaneous saccharification and fermentation
TC time course
u unit of enzyme activity
v/v volume of inoculum medium per volume of fermentation medium
v/w volume of enzyme per dry weight of substrate biomass
vvm airflow rate (volume per min) per working volume of bioreactor
w/v weight of solute per volume of solution

xix
w/w Weight per weight
XR xylose reductase
XDH xylitol dehydrogenase
YEIS solution only containing yeast extract and inorganic salts
Subscripts
0 initial value
f final value
1 start of time period
2 end of time period
yie yield
con consumed
p time of product reaching peak
t value at a specific time
Kinetic Symbols
P: the absolute amount of ethanol (g)
N: the total number of biomass (cells)
p: product (ethanol) concentration (g/l)
s: substrate concentration (g/l)
v: volume (l)
t: time (h)
Qp: system co-efficiency / volumetric ethanol productivity (g/l/h)
Qs: sugar uptake rate (g/l/h)
Yp/s: ethanol yield / product conversion rate per substrate (g/g)
qp: specific ethanol productivity (g/g/h)

xx
de: cell instantaneous ethanol production rate (g/cells/h).
xA: Biomass concentration – average dry weight (g/l)
xC: Biomass concentration – viable cell concentration (cfu/ml)

Chapter 1. Introduction
1
Chapter 1
I nt roduct ion
1.1. Bioethanol production
Bioethanol production from renewable resources continues to attract considerable
interest as an alternative to fossil fuel (Rortrup-Nielsen, 2005; van Maris et al., 2006;
Lynd et al., 2008). The research and exploitation of bioenergy, such as bioethanol and
biodiesel, are not recent topics. In order to cope with the predicted depletion of fossil
fuel in the near future, a number of countries have taken steps to reduce their
dependence on gas and oil imports, by developing and industrializing new energy
forms (de Vries et al., 2007; Groom et al., 2007). Potential energy forms include
nuclear energy and some renewable and clean forms, such as solar, hydro, biomass
and wind. Amongst these, ethanol production from biomass is of particular interest
due to following advantages: (1) low emission levels of carbon dioxide, and therefore
contributing less to green house effects (Ignaciuk et al., 2006); (2) readiness to be
blended with gasoline and used in the transportation industry without much
modification to the vehicles (Katz, 2008); (3) mature production techniques. Ethanol
has been produced from fruit or starch crops for alcoholic beverages for over
thousands of years. Considering these advantages, the potential of fuel ethanol has
been thoroughly explored for further development and industrialization.
The research and application of bioethanol for energy purposes were pioneered by
the United States and Brazil. In the United States, bioethanol is produced mainly

Chapter 1. Introduction
2
from traditional starch crops such as corn (Katz, 2008); whereas in Brazil, bioethanol
production is derived from and is closely related to the sugarcane industry, where
both sugarcane and waste material from the sugar manufacture process serve as
substrates for ethanol production (Goldemberg, 2007). Both countries have brought
out a series of strategies to promote and popularize the utilization of ethanol for fuel
purposes, e.g. the price reduction of ethanol-blended gasoline. Other strategies
adopted in the United States include the enticement for growing plants for ethanol
production and the additional duty levied for imported ethanol to encourage the
domestic ethanol production industry (Katz, 2008). As a result, corn plantations have
been greatly extended in the United States, replacing other crops such as soy for
greater profit, e.g. 15.5% increase in acreage in 2007 (Kennedy, 2007; Katz, 2008).
Even the harvested corn in the market has been increasingly diverted to ethanol
production instead of being used as a traditional agricultural commodity. The biofuel
industry consumed 25% of overall crops produced in 2007 in the United States and is
projected to consume more than 30% in 2008 (Robertson et al., 2008; Tenenbaum,
2008). Due to all these measures, the bioethanol industry has rapidly developed and
prospered. The production of renewable fuels in the United States is projected to
achieve 36 billion gallons by 2022, which will mostly include ethanol from corn and
cellulose (Potera, 2008). Cars and other vehicles driven by ethanol (either 100% or
blended gasoline with ethanol up to 25%) are being commonly used in Brazil
(Goldemberg, 2007). In Australia a program entitled Ethanol Production Grants was
set up as early as in 2002 to encourage the use of biofuels for vehicles.
At the beginning of 2008, a global food crisis was observed worldwide. As pointed
out by numerous reports, bioethanol production was considered one of the major
factors responsible for this crisis (Kennedy, 2007; Runge and Senauer, 2007; Katz,
2008; Tenenbaum, 2008). Corn and other starch crops are basic food and feed
material; the mass production of ethanol from these substrates in the United States
substantially decreases the proportion of products used for food consumption,
reduces the plantation area of other edible crops, and indirectly causes the shortage of
both primary products and livestock. Bioethanol, however, remains a promising
alternative to fossil fuels; its rapid development and spread in Brazil confirms this
viewpoint. The utilization of ethanol is one of the safest methods to counteract the
depletion of non-renewable resources. In order to retain bioethanol for fuel purpose

Chapter 1. Introduction
3
as well as to avoid the unnecessary pressure on the food supply, new substrates for
ethanol production need to be set up, ensuring that all the starch crops are returned
back to the agricultural commodity market. The sugarcane program in Brazil is
considered acceptable because unlike starch, the sucrose is not a necessary food
material. Nevertheless, for long term consideration, material which cannot be
consumed by humans should be the ultimate choice for bioethanol production, e.g.
lignocellulose.
Lignocellulose is basically the woody part of plants, constituting the most abundant
raw material in nature (Kuhad and Singh, 1993; Chandrakant and Bisaria, 1998;
Zhang, 2008). Each year approximately 200 billion tons of lignocellulosic waste is
produced from agriculture and industry worldwide. These mainly include various
agricultural residues, deciduous and coniferous woods, municipal solid wastes, pulp
and paper industrial waste, and herbaceous energy crops (Saha, 2003; Das and Singh,
2004). Ethanol production from this kind of substrate can serve as a waste treatment
and convert this apparently useless material into value-added products. Because the
carbohydrate in the lignocellulose is originally produced by photosynthesis, the
oxidation of these carbon atoms does not increase the level of carbon dioxide in the
atmosphere, only simply recycles them (Zaldivar et al., 2001; Zhang, 2008).
Consequently, lignocellulose is an ideal substrate for ethanol production, on account
of its cheap cost and clean energy yield.
1.2. Lignocellulosic fuel
The concept of the conversion of lignocellulose to ethanol dates back as early as
1917 (Brooks and Ingram, 1995). However, currently ethanol production from
lignocellulose substrates remains at a laboratory stage, while ethanol production from
sugarcane and corn has already been commercialized. The major drawback in the
utilization of lignocellulose is its natural structure. This will be discussed in detail in
Chapter 2. Briefly, the intimate association of several macromolecules in the
lignocellulose makes it recalcitrant to breakdown to single fermentable sugars. Even
after the breakdown, the fact that it comprises a variety of monosugars makes the
ethanol production process considerably difficult. The conversion efficiency of
lignocellulose to ethanol is thus greatly limited.

Chapter 1. Introduction
4
As a potential fuel, the final price of ethanol products needs to be moderate and
acceptable compared to the market price of traditional gasoline. On the other hand, it
should bring in profit to the organization producing it. Both factors affect the
commercial feasibility of producing ethanol from lignocellulose. A standard
proposed in earlier research (du Preez, 1994) requires an ethanol-producing
capability of 50-60 g/l within 36 h, with a yield no less than 0.40 g/g. Research on
the lignocellulosic fuel production has continuously worked on the improvement of
efficiency of both the hydrolysis process to depolymerize the macromolecular
complex to fermentable sugars and the microbial fermentation process to convert the
sugar mixture to ethanol.
The current research was therefore undertaken with the aim of assisting the
bioenergy industry. Sugarcane bagasse was selected as the lignocellulosic substrate
for the conversion to ethanol using two microbial strains.
1.3. Aim and objectives
Aim:
Maximization of ethanol production from sugarcane bagasse hydrolysate by the use
of Zymomonas mobilis and Pichia stipitis.
Objectives:
� Determination of fermentation characteristics of Z. mobilis and P. stipitis on
glucose and xylose medium respectively.
� Determination of effects of immobilization on the fermentation characteristics of
Z. mobilis and P. stipitis.
� Evaluation of co-fermentation processes of glucose/xylose sugar mixture with
different fermentation schemes, employing Z. mobilis and P. stipitis.
� Optimization of the hydrolysis of sugarcane bagasse to maximize fermentable
sugars.
� Conversion of the sugarcane bagasse hydrolysate to ethanol by the use of Z.
mobilis and P. stipitis.

Chapter 2. Literature review
5
Chapter 2
Literature Review
2.1. Lignocellulose for ethanol production
The conversion process from lignocellulose to ethanol usually involves four stages
(Lee, 1997; Chandrakant and Bisaria, 1998). Starting with lignocellulosic raw
material, firstly a pretreatment is carried out to remove the lignin portion and make
the hemicellulose and cellulose structure more vulnerable to breakdown in the
second hydrolysis stage. The released monosaccharides from saccharified
carbohydrate polymers can be directly assimilated by microorganisms and converted
to ethanol through metabolic processes. Finally the produced ethanol needs to be
extracted from fermentation broth and purified into final products, which usually
requires further energy input. Each step has its own difficulties; however, the major
challenges are the hydrolysis process and the conversion of sugar mixture to ethanol
as mentioned in Section 1.2.
Lignocellulosic biomass has a complicated structure; the composition of three basic
components, lignin, hemicellulose and cellulose, is different from plant to plant
(Kuhad and Singh, 1993; Das and Singh, 2004). The tight structural combination
between three compounds in association with the crystalloid structure of cellulose all
add up to the difficulties of hydrolysis (Martin et al., 2007b). Consequently, the
hydrolysis of lignocellulose is difficult to achieve, requires a long time and expensive
enzyme systems, and sometimes yields inhibitors of the microbial fermentation.

Chapter 2. Literature review
6
The cellulose portion in lignocellulose can be hydrolyzed to glucose, while the xylan
in the hemicellulose can be hydrolyzed to xylose; the simultaneous fermentation of
both sugars represents another technical difficulty (Chandrakant and Bisaria, 1998).
Though glucose fermentation to ethanol can be efficiently accomplished by a number
of microorganisms, including the yeast genus Saccharomyces and bacterium
Zymomonas mobilis, the xylose fermentation is considerably more difficult. It is even
harder when both sugars are required to be converted simultaneously. Nevertheless,
for economical considerations, the conversion of xylose, which constitutes 15~30%
of total sugars in the hydrolysate (Lee, 1997; Lawford and Rousseau, 2003), is
crucial to achieve maximum ethanol production from lignocellulose.
Research has extensively focused on the hydrolysis and fermentation processes to
optimize the overall process for the conversion of lignocellulose to ethanol. This can
be achieved by both process engineering and microbial improvement, including the
development of new processing schemes, optimization of environmental parameters,
as well as the construction of desirable microorganisms through either mutation or
recombinant DNA technology.
When it comes to the process considerations, it should be pointed out that though the
four stages mentioned above constitute a complete process for the lignocellulosic
ethanol production, in practice they are not strictly separated. There are a number of
schemes combining steps. For example, in a simultaneous saccharification and
fermentation (SSF) process (Ballesteros et al., 2004; Panagiotou et al., 2005), the
pretreated lignocellulosic substrate is hydrolyzed to monosaccharides and then
directly converted to ethanol in the same vessel while the saccharification is still in
process. An advanced version of SSF process is called simultaneous saccharification
and co-fermentation (SSCF) (Patel et al., 2005). In addition to the common SSF
process, there are at least two different kinds of monosaccharides continuously
released from carbohydrate polymers, and both are immediately converted to ethanol
in this single process. Lynd’s group proposed a concept named the “Consolidated
Process”, integrating all together four biotransformation processes into one (Lynd et
al., 2005; van Zyl et al., 2007). Besides those three involved in the SSCF, they
suggested that the production of cellulase enzymes should also be included in order

Chapter 2. Literature review
7
to minimize the cost of the enzyme system required for saccharification. Such a
process would consist of the production of cellulolytic enzymes, the hydrolysis of
lignocellulose and the co-fermentation of glucose and xylose, which make up four
biotransformation steps.
In comparison with these integrated fermentation schemes, the separate hydrolysis
and fermentation (SHF) process is more commonly adopted, since it allows the
maximum optimization of each process individually. Because saccharification and
fermentation usually require different optimal conditions for highest efficiency, the
simultaneous process tends to result in inferior system performance.
In summary, SHF provides a higher efficiency in each stage respectively, but the
integrated process has the potential to increase the whole system efficiency by
combining more stages into a single step. The establishment of an optimized system
thus depends on the evaluation and consideration of each factor that affects the
efficiency. This literature review commences with basic stages involved in the
conversion of lignocellulose to ethanol the respective fermentation of glucose and
xylose, and then moves to the co-fermentation and the hydrolysis. Finally some
typical studies involving the SSF process and genetically modified microorganisms
(GMO) are briefly reviewed.
2.2. Glucose fermentation by Z. mobilis
Zymomonas mobilis is highly recognized for its performance in ethanol production
from glucose, fructose and sucrose. It is reported to show higher ethanol productivity
and tolerance compared to Saccharomyces cerevisiae (Davis et al., 2006; Kalnenieks,
2006). However, for the co-fermentation process of a glucose/xylose mixture, S.
cerevisiae is preferably used for the co-culture with another xylose fermenting strain
[See Section 2.4.2]. In order to understand its metabolic mechanism and evaluate the
possibility of Z. mobilis for co-culture, Section 2.2 reviews literature relating to the
glucose fermentation by Z. mobilis.
2.2.1. Biochemistry of ethanol production by Z. mobilis
Zymomonas is Gram-negative and consists of large rods. Phylogenetically it belongs

Chapter 2. Literature review
8
to the class of Alphaproteobacteria and is affiliated to the pseudomonads, though the
pseudomonads usually show respiratory metabolism whereas Zymomonas is strictly
fermentative (Madigan and Martinko, 2006b). A similar trait of Pseudomonas and
Zymomonas in the metabolism is that they are both able to carry out the
Entner-Doudoroff (ED) pathway.
The ED pathway is different from the Embden-Meyerhof Pathway (EMP) the
glycolysis pathway, in that it only takes four steps to produce the first pyruvate and
no ATP is produced during these four steps. As illustrated in Figure 2.1, the second
pyruvate comes from the glyceraldehyde-3-phosphate and 2 ATP are yielded during
the reactions. The pyruvates are decarboxylated into acetaldehyde, which is further
reduced to ethanol as the end product. In other words, the ED pathway is not as
energy efficient as the EMP pathway, since only half amount of ATP is produced [2
ATP in ED and 4 ATP in EMP].
Zymomonas is capable of carrying out glucose fermentation more rapidly than yeast
with the EMP pathway probably because of the use of the ED pathway. Firstly, the
ED pathway requires less reaction steps to convert glucose to ethanol; secondly, a
larger amount of ethanol needs to be produced to match the ATP requirements of the
bacterium. As pointed out by Kalnenieks (2006), the fast glucose catabolism rate of Z.
mobilis decidedly exceeds the needs for its cellular biosynthesis, which is thus named
as the “uncoupled growth” phenomenon. Nevertheless, the high ethanol productivity
is beneficial to the industrialization of commercial ethanol production. Based on the
stoichiometric reactions shown in Figure 2.1, the maximum ethanol yield of Z.
mobilis from glucose follows the overall equation below (Madigan and Martinko,
2006a):
Glucose (C6H12O6) = 2 ethanol (C2H5OH) + 2 CO2 (1)
A full conversion of 1.0 mole glucose yields 2.0 moles of ethanol, rendering a
theoretical ethanol yield of 0.51 g/g glucose.

Chapter 2. Literature review
9
Figure 2.1: Main pathway of glucose metabolism to ethanol by Zymomonas
mobilis: (a) Entner-Doudoroff pathway, (b) Ethanol production as
fermentation product (Source: Prescott et al., 2005).
2.2.2. Culture of Z. mobilis on glucose
Amongst studies investigating the fermentation characteristics of Z. mobilis on
glucose, early reports tended to suggest that it only gave best ethanol yield under
strict anaerobic conditions, achieved by a continuous flush of nitrogen to the
fermentation medium (Laplace et al., 1991a). Also, its high performance of the
ethanol production was not affected by the increase in the initial glucose
concentration; both ethanol yield and productivity of Z. mobilis were reported to be

Chapter 2. Literature review
10
superior to that of S. cerevisiae (Laplace et al., 1991b). Similar observations were
made by Davis et al. (2006), who compared the ethanol production efficiency of the
two strains on a hydrolyzed waste starch substrate. With an initial glucose
concentration up to 80-110 g/l, Z. mobilis gave higher performance on both ethanol
productivity and substrate consumption.
Moreover, the ethanol-producing ability of Z. mobilis can be further improved
through the optimization of the fermentation scheme and environmental conditions.
An ethanol production rate of 0.47-0.48 g/l/h was reported in a continuous culture of
Z. mobilis using high cell density system (Laplace et al., 1993c). It was also found
that Z. mobilis gives steady performance even in the presence of xylose or acetic acid,
an inhibitor, in the medium; a conversion efficiency of 96% was achieved from
glucose by a wild type strain of Z. mobilis cultured in a glucose/xylose medium
(Lawford and Rousseau, 2003). Ethanol production models of Z. mobilis were
established by Lee and Huang (2000) on both glucose and fructose substrates. The
specific growth rate of the bacterium was claimed to correlate to the dependence of
assimilated carbon fraction in both batch and continuous culture environments.
Fermentation processes employing wild type Z. mobilis on lignocellulosic
hydrolysate have also been studied; however, sometimes results were comparably
poor. The biomass growth rate in such a medium was low, consequently limiting the
ethanol production rate (Delgenes et al., 1996b; Yu and Zhang, 2002). Z. mobilis is
believed to be sensitive to some toxic components formed during the hydrolysis
process, e.g. hydroxybenzaldehyde. Therefore detoxification of the hydrolysate is
essential, and adaptation of the strain in the hydrolysate would also be helpful for
eliminating the inhibition. A study culturing Z. mobilis on a hardwood derived
cellulosic hydrolysate reported an ethanol yield of 0.35 g/g sugars (Delgenes et al.,
1996a). The value is relatively low compared to a result of 0.50 g/g when the
bacterium was cultured on the hydrolyzed starch medium (Davis et al., 2006). Other
substrates used for Z. mobilis culture included agricultural wastes of a grain and oil
seed mixture (Dey, 2001). Ethanol production of 205 g was obtained from 600 g of
waste seeds using a two stage semi-continuous fluidized bed bioreactor, which
equalled a conversion rate of 0.34 g/g.
Chapter 2. Literature review
11
In general, Z. mobilis shows excellent ethanol-producing performance on the sugar
media. To further investigate its fermentation characteristics, immobilized cultures
have been studied.
2.2.3. Immobilized Z. mobilis
Immobilization is a commonly used technique in biotechnology for fermentation and
enzymatic studies. It has several advantages in comparison with free cells: (1) ability
to concentrate a large amount of cells into a small volume, (2) easier management of
cells, (3) possibility to provide semi-different environmental parameters within the
immobilizing material (Grootjen et al., 1991b). Some studies involving immobilized
Z. mobilis are discussed below.
Rebros et al. (2005) reported a remarkably high volumetric ethanol productivity of
43.6 g/l/h on glucose, by entrapping Z. mobilis in commercially available
polyvinylalcohol beads Lentikats® . The result was achieved in batch culture with
complete fermentation of 150 g/l glucose within 2 hours after repeated culture of the
same batch of beads 72 times. The effects of bioreactor were also investigated for
immobilized Z. mobilis (Kesava and Panda, 1996; Kesava et al., 1996). Gel beads
cultured in an expanded bed bioreactor achieved higher kinetic parameters compared
to those cultured in a regular mechanically stirred tank bioreactor; peak value of
volumetric ethanol productivity was 21 g/l/h attained in a continuous culture. Bajpai
and Margatitis (1985) studied the influence of initial glucose concentration on the
ethanol productivity of immobilized Z. mobilis entrapped in calcium alginate gels. It
was found that the yield coefficient was almost unaffected by the increase of
substrate concentration. With a cell concentration of 58 g dry weight/l of bead
volume, ethanol yield was more than 95% of the theoretical. Continuous culture for
more than 72 days with the immobilized Z. mobilis was also reported with a
volumetric ethanol productivity of 63 g/l/h in a vertical rotating immobilized cell
reactor (Amin and Doelle, 1990).
It can be thus concluded that immobilization is an effective method for improving the
performance of ethanol production by Z. mobilis. In addition, the co-immobilization
system of Z. mobilis with other microorganisms or enzymes has also been set up to

Chapter 2. Literature review
12
extend the substrate utilization range of Z. mobilis. The relevant literature will be
discussed together with other co-culture processes in Section 2.4.1.
2.3. Xylose fermentation
In contrast to the well-established glucose fermentation process, xylose fermentation
has a much shorter history. Strains able to assimilate xylose were reported only from
the early 1980s (Jeffries and Kurtzman, 1994). Since then extensive studies have
been carried out on strain screening and selection to obtain the best
ethanol-fermenting microorganisms on xylose (Roberto et al., 1991; Jeffries and
Kurtzman, 1994). More than 40 kinds of yeasts are considered to be capable of
converting xylose to ethanol (du Preez, 1994). Xylose-utilizing bacteria and molds
have been reported; however, yeasts are of most interest because of their relatively
high ethanol yield. In this section, three common xylose fermenting yeasts are
discussed, and literature involving their fermentation studies is reviewed.
2.3.1 Biochemistry of ethanol production from xylose
There are three strains that have shown significant ethanol-producing capability from
xylose, viz. Pichia stipitis, Candida shehatae and Pachysolen tannophilus. Among
these three, Pichia stipitis is the most efficient xylose fermenter with the highest
ethanol productivity (Chandrakant and Bisaria, 1998), but the average ethanol yields
of all three are similar (Sanchez et al., 2002).
The metabolic pathways from xylose to ethanol are still being studied by some
researchers. Figure 2.2 shows a general route that is most widely accepted. After
assimilation, xylose is firstly converted to xylulose, by either the catalysis of xylose
isomerase or the dehydrogenation of xylitol. Then xylulose enters the Pentose
Phosphate Pathway (PPP) and transforms to glyceraldehyde-3-phosphate through a
series of enzyme-mediated reactions. From here it connects to the glycolytic pathway,
converting the glyceraldehyde-3-phosphate to pyruvate and then reducing the
pyruvate to ethanol. Thus, the conversion of xylose to ethanol requires many more
steps than that of glucose, resulting in a decreased efficiency of ethanol production.
Moreover, some of the carbon atoms from xylose can be distributed to biomass
synthesis via the PPP pathway, which further reduces the potential ethanol yield. As a

Chapter 2. Literature review
13
result, it is not surprising that ethanol production from xylose is less efficient and
more time-consuming compared to that from glucose by Z. mobilis.
Figure 2.2: Main pathway of xylose metabolism to ethanol in yeasts (Adapted
from Chandrakant and Bisaria, 1998; Kruse and Schugerl, 1996).
For the calculation of the theoretical ethanol yield from xylose, it is assumed that all
the xylose is converted to xylulose followed by a complete conversion of xylulose to
ethanol without the formation of byproducts and consumption of carbon atoms by
biosynthesis. Then the conversion process can be expressed by the equation below

Chapter 2. Literature review
14
(Chandrakant and Bisaria, 1998):
3 Xylose (C5H10O5) = 5 ethanol (C2H5OH) + 5 CO2 (2)
Overall, 1.67 moles of ethanol is produced from 1.0 mole xylose, which is less than
the molar conversion rate of ethanol from glucose [2.0 mole/mole]; however, the
mass conversion rate is the same, 0.51 g/g xylose.
A different interpretation, however, is proposed by other groups. In the whole process
from xylose to ethanol, the first rate-limiting step is the conversion of xylose to
xylulose, which can be achieved in two different ways. In the bacterial cells which
metabolize xylose but not produce ethanol, e.g. Escherichia coli, xylulose is directly
produced under the catalysis of xylose isomerase. By contrast, for all three yeasts,
xylitol is firstly formed and then oxidized to xylulose. As shown in Figure 2.2, the
reaction from xylose to xylitol is catalyzed by xylose reductase (XR); and then
xylitol dehydrogenase (XDH) functions to oxidize xylitol to xylulose. Both steps
need the participation of certain enzyme cofactors, which are different from yeast to
yeast. In some cases the cofactors are reduced or oxidized in large amount and
cannot be re-oxidized or re-reduced again, e.g. in Candida utilis. This directly causes
a redox imbalance and therefore ceases further reactions, leading to xylitol excretion
instead. Oxygen as an electron accepter can relieve this redox imbalance, but
consumes some carbon atoms from the original xylose. In this case, the overall
reaction from xylose to ethanol follows another stoichiometric equation (Jin and
Jeffries, 2004):
Xylose (C5H10O5) + 0.5 O2 = 1.5 ethanol (C2H5OH) + 2 CO2 (3)
Only 1.5 moles of ethanol are produced from 1.0 mole of xylose, equalling a mass
conversion rate of 0.46 g/g xylose. This value is less than that achieved under
anaerobic conditions, where 0.51 g ethanol/g xylose is produced theoretically.
2.3.2. Fermentation of xylose to ethanol
Since the discovery of strains that are able to produce ethanol from xylose, there
have been many efforts to investigate fermentation characteristics of these
microorganisms. Some of these studies are discussed below.
� Medium effects
Watson et al. (1984) studied the factors inhibiting ethanol production from xylose by

Chapter 2. Literature review
15
P. tannophilus. The study pointed out that ethanol itself was a kind of inhibitor and
other possible factors included iron, chromium, copper, nickel, acetic acid and
furfural. Most of these could be produced from the pretreatment and saccharification
process of lignocellulose. The effects of fructose in the medium were also
investigated (Bicho et al., 1989). Xylose metabolism of P. tannophilus was repressed
by the presence of fructose in the medium, which was indicated as a repression in the
induction of XR and XDH. By contrast, the presence of fructose did not affect the
xylose utilization of P. stipitis.
Initial xylose concentration was another important factor accounting for ethanol
productivity. Laplace et al. (1991b) suggested that sugar concentrations higher than
25 g/l tended to inhibit the cell growth of both P. stipitis and C. shehatae. Similar
results were obtained by other research groups (Kruse and Schugerl, 1996, Bravo et
al., 1995). According to Bravo et al. (1995), the optimum medium composition was
25 g/l xylose and 4 g/l yeast extract together with other inorganic salts. Culture of
xylose fermenting yeasts on the glucose/xylose medium resulted in a sequential
consumption of two sugars, firstly glucose and then xylose (Sanchez et al., 2002).
Glucose metabolism apparently inhibited the assimilation of xylose and this was
observed for all three yeast strains, viz. P. stipitis (Taniguchi et al., 1997b), C.
shehatae and P. tannophilus (Sanchez et al., 1999).
� Temperature effects
Barbosa et al. (1990) reported that ethanol production from xylose by P. tannophilus
remained on a similar level when the temperature increased from 30oC to 37
oC,
though in the meantime xylitol yield decreased and CO2 production increased.
Converti et al. (2001) claimed that there were three metabolic pathways for the
assimilated xylose in P. tannophilus. At a low temperature of 20oC respiration was
the main process; between 25-30oC a large amount of xylitol was accumulated, and
ethanol fermentation occurred only at higher temperatures such as 40oC. Other
research, however, suggested that optimum temperature for ethanol production by P.
tannophilus was 30oC, though the fastest cell growth was observed at 33
oC (Sanchez
et al., 2004).

Chapter 2. Literature review
16
� Oxygenation effects
In contrast to S. cerevisiae whose metabolism is predominantly respiro-fermentative,
the metabolism of xylose utilizing yeasts is considered to be fully respirative (Fiaux
et al., 2003). However, this characteristic negatively affects the ethanol accumulation.
The major disadvantages are: (1) difficulties in controlling the oxygenation at
optimum values during fermentation, (2) ethanol re-assimilation under aerobic
conditions, and (3) more complex techniques required for industrialization in
comparison with anaerobic fermentation processes.
Currently it is accepted that the conversion of xylose to ethanol by yeasts requires
strict micro-aerobic conditions. The optimum value of oxygenation, however, varies
amongst reports. Kruse and Schugerl (1996) investigated the fermentative
performance of Pachysolen tannophilus under different environmental conditions.
Ethanol production only occurred in micro-aerobic conditions with an air flow of
0.009 vvm (volume/volume/minute). Under fully aerobic conditions the cells grew
vigorously with rare ethanol accumulation, and under anaerobic conditions the cell
growth was almost totally inhibited. Furlan et al. (1994) studied the effect of
oxygenation on all three xylose-fermenters, viz. P. stipitis, C. shehatae and P.
tannophilus. It was reported that for all three strains ethanol productivity
significantly relied on oxygenation and the highest ethanol production was obtained
under an air flow of 0.08 vvm and a stirring speed of 250 rpm. The optimum aeration
level reported by Laplace et al. (1991a) was between 0.005 vvm and 0.001 vvm with
a stirring speed of 800 rpm for both P. stipitis and C. shehatae. Other oxygenation
levels used for ethanol production from xylose include an air flow level of 0.1 vvm
with a stirring speed of 160 rpm (Taniguchi et al., 1997b), 400ml medium in a 500
ml conical flask on a rotary shaker at 150 rpm (Laplace et al., 1991b) and 100 ml
medium in a 150 ml conical flask with 100 rpm shaking speed (Yu and Zhang, 2002).
Skoog and Hahn-Hagerdal (1990) reported an ethanol yield up to 0.48 g/g by P.
stipitis under an oxygen transfer rate (OTR) below 1 mmol/l/h.
The effect of oxygenation on the yeast cell activity was also demonstrated by the
investigation on the enzyme XR (VanCauwenberge et al., 1989). It was found that
under aerobic and anaerobic conditions there were two different enzyme forms in the
P. tannophilus cells.
Chapter 2. Literature review
17
To summarize, research on both fermentation performance and metabolic
mechanisms demonstrated that the oxygen plays a crucial part for the ethanol
production from xylose by the three xylose fermenting yeasts. In order to achieve a
maximum ethanol yield, oxygenation should be carefully controlled at an optimum
level during the fermentation. Since the oxygenation level is affected not only by the
air flow and stirring speed but also by the cell concentration and medium viscosity,
the different values applied in the literature are confusing. The optimum aeration
condition is best determined practically as done in the current study.
� Ethanol tolerance and re-assimilation
Ethanol is a typical primary metabolite and is involved in energy metabolism;
consequently, it is reasonable to presume that the ethanol produced by
microorganisms could be re-assimilated under certain circumstances. On the other
hand, ethanol is also an inhibitor of cell growth. The produced ethanol and external
ethanol are suggested to have different toxicity to the microbial cells (du Preez,
1994). Thus, the effects of ethanol also need to be considered for the establishment of
a successful fermentation process.
In contrast to traditional ethanol-producing strains, viz. S. cerevisiae and Z. mobilis,
xylose fermenting yeasts tend to have low tolerance to ethanol (Lee, 1997). An
increased ethanol concentration is inhibitory to both cell growth and ethanol
production, but cell growth was inhibited at lower ethanol concentration compared to
the ethanol production (du Preez et al., 1989). Ethanol tolerance of these yeasts was
not improved by culturing on the glucose substrate, suggesting that their low ethanol
tolerance was not a result of xylose catabolism. The ethanol re-assimilation rate of P.
stipitis was found to be greater than that of C. shehatae (du Preez et al., 1989). The
phenomenon of ethanol re-assimilation was observed in a number of studies
(Maleszka and Schneider, 1982; Passoth et al., 2003; Gorgens et al., 2005). It
occurred even in the presence of residual sugars in the medium, with a higher rate on
xylose than on glucose. Skoog et al. (1992) reported that the increased oxygenation
helped with the re-assimilation of ethanol by P. tannophilus; as a consequence,
acetate formed and the production of CO2 decreased.

Chapter 2. Literature review
18
Overall, the conversion of xylose to ethanol is considerably less efficient compared
to the conversion of glucose to ethanol by Z. mobilis. It requires strict control on the
environmental parameters to achieve satisfactory ethanol production, and an
optimized oxygenation level is extremely crucial. Consequently, these yeasts appear
to be incapable of individually carrying out the conversion of sugar mixture to
ethanol.
2.4. Co-fermentation of glucose/xylose sugar mixture
The employment of two microorganisms in a single process, particularly the
co-culture of strains simultaneously, is very different from processes with pure
cultures. Strains may have different interactions with each other, e.g. killing effects,
synergy effects, or no effects. In this study, two strains were employed for the
production of ethanol from a mixed substrate; it was thus important to provide
optimum environmental conditions for both strains in order to achieve the maximum
product yield. In the case of P. stipitis and Z. mobilis, they both grow vigorously at
30oC (Laplace et al., 1991a), and are acclimatized to a pH range of 4 to 7
(Chandrakant and Bisaria, 1998). In general, the only conflict in the growing
conditions of these two strains is the oxygen requirement. P. stipitis needs a strictly
controlled micro-aerobic condition to ferment xylose to ethanol, while in earlier
reports Z. mobilis has been reported to give maximum ethanol production only under
absolute anaerobic conditions (Laplace et al., 1991a). This might account for the fact
that Z. mobilis was rarely employed for co-culture processes with a xylose
fermenting yeast. However, in other fermentation systems the bacterium has been
widely used for the co-culture with other strains or with enzymes to extend its
substrate utilization range. In this section, co-culture systems involving Z. mobilis are
briefly reviewed at first, followed by the studies relating to the co-fermentation of
glucose/xylose sugar mixtures with two strains. Finally the selection of Z. mobilis
and P. stipitis for the co-fermentation will be justified.
2.4.1. Co-culture process involving Z. mobilis
Co-culture of two microorganisms is commonly used in fermentations with
unfavorable substrates. One of the microorganisms degrades the substrate and
converts it to a favorable material for the fermentation by the other microorganism,

Chapter 2. Literature review
19
e.g. converting starch to glucose, which can be directly utilized by Z. mobilis. Lee et
al. (1993) co-immobilized Z. mobilis with both Aspergillus awamori and Rhizopus
japonicus on raw starch material; an ethanol yield of 96% of the theoretical was
achieved under anaerobic conditions. Gunasekaran and Kamini (1991) used the
combination of Kluyveromyces fragilis and Z. mobilis on a lactose medium.
Compared to fermentation schemes including free cells of both strains and
immobilized K. fragilis with free cells of Z. mobilis, the co-immobilized system gave
higher ethanol production.
The immobilization of enzyme directly with Z. mobilis instead of an
enzyme-producing microorganism also proved to be an effective system on starch.
Bandaru et al. (2006) investigated optimum conditions for the co-immobilization of
amyloglucosidase and Z. mobilis cells on sago starch. Kannan et al. (1998)
successfully prevented the formation of byproducts and improved ethanol yield on
sucrose with the use of a sucrase deficient mutant of Z. mobilis co-cultured with the
invertase. A co-immobilization system of Saccharomyces diastaticus and
Zymomonas mobilis reported an improved ethanol production in comparison with
both systems involving only the sole S. diastaticus and involving free cell co-culture
of S. diastaticus and Z. mobilis (Amutha and Gunasekaran, 2001).
In conclusion, though Z. mobilis has rarely been used for co-culture with a xylose
fermenting strain, it shows excellent performance when co-cultured with other
microorganisms or even enzymes. The current study using Z. mobilis and P. stipitis to
co-ferment the glucose/xylose mixture therefore represents a new challenge for Z.
mobilis studies.
2.4.2. Employment of a glucose fermenter and a xylose fermenter
Extensive research has been carried out on the co-employment of a glucose
fermenting strain and a xylose fermenting strain, for its potential to significantly
improve the fermentation efficiency on the sugar mixture substrate. Based on
different combinations of strain selection, fermentation mode and inoculation
sequence, numerous fermentation schemes can be created. This section discusses the
previously reported fermentation processes to exemplify the application and effect of
each factor, followed by the evaluation of some successful fermentation schemes.

Chapter 2. Literature review
20
The first factor to be considered is the strains used to carry out the respective glucose
and xylose fermentations. Common strains for glucose fermentation are either S.
cerevisiae or Z. mobilis. Though Z. mobilis have rarely been employed in such
co-culture processes, a number of Saccharomyces strains and their mutants have been
studied. For xylose fermenters, all three yeasts, viz. P. stipitis, C. shehatae and P.
tannophilus, have been attempted in order to set up an optimized strain combination.
Reported combinations include S. cerevisiae and P. stipitis (Grootjen et al., 1991a;
Taniguchi et al., 1997a), S. cerevisiae and C. shehatae (Lebeau et al., 1997), S.
cerevisiae and P. tannophilus (Qian et al., 2006), a respiratory deficient (RD) mutant
of S. cerevisiae and Pichia stipitis (Laplace et al., 1993a; Taniguchi et al., 1997b),
and a RD mutant of S. cerevisiae with a mutant of P. stipitis showing restricted
glucose catabolite repression (Kordowska-Wiater and Targonski, 2002).
Saccharomyces diastaticus and its RD mutants have also been studied (Laplace et al.,
1993b; Delgenes et al., 1996a). The glucose fermenter has shown significant effects
on xylose fermentation in a co-culture process. Therefore an appropriate selection of
a strain combination is the first decisive factor for a successful co-fermentation
process.
The next factor affecting the system performance is the culture mode. There are
options of immobilized culture (Grootjen et al., 1991b; de Bari et al., 2004) and free
cell culture (Taniguchi et al., 1997b; Qian et al., 2006), as well as batch culture
(Taniguchi et al., 1997b) and continuous culture (Laplace et al., 1993c). Continuous
culture consists of a prolonged exponential phase of cell growth (Stanbury et al.,
2000) and therefore allows a continuous ethanol production at maximum rate. Whole
cell immobilization has also been applied in various ways. Firstly, it is able to
provide a modified environment within the immobilizing material which is different
from the medium environment, and thus is particularly suitable for culturing
microorganisms with different environmental requirements (Grootjen et al., 1991b).
On other occasions, the co-immobilization of cell mixture was suggested to be an
effective method to control the cell number of two strains at a certain ratio (de Bari et
al., 2004).
The inoculation sequence of the two microorganisms also has a significant effect on

Chapter 2. Literature review
21
the fermentation scheme, by affecting the potential interactions of the two strains and
the fermentation sequence of the sugar mixture. When two strains are inoculated at
the same time, they both exist in the fermentation medium, and hence the strain
interaction needs to be considered. In the case of a glucose fermenter and a xylose
fermenter, the direct exposure to each other often resulted in low ethanol yield and
low productivity. The major interferences were either the oxygen competition
between two strains, which led to the poor growth of xylose fermenter (Laplace et al.,
1993a; Taniguchi et al., 1997b), or the repressed xylose metabolism resulting from
the glucose catabolism (Kordowska-Wiater and Targonski, 2002).
When two strains are inoculated successively, the progress of fermentation generally
depends on which strain is first inoculated. This scheme has the advantage of
providing each microorganism an optimum environment individually. However, if
inoculated second, the low ethanol tolerance of the xylose fermenter is a problem on
account of the ethanol produced by the first-inoculated glucose fermenter. If the
xylose fermenter is inoculated first, it tends to consume glucose before xylose in the
mixture (Kruse and Schugerl, 1996; Sanchez et al., 2002), which often leads to a
decreased system performance due to its low efficiency of glucose fermentation.
Moreover, after the completion of the first substrate, the corresponding
microorganism can be either kept in the medium (Taniguchi et al., 1997b) or
inactivated (Fu and Peiris, 2008). The inoculation manner therefore significantly
affects the fermentation process and needs to be carefully selected along with the
strain combination and the culture mode, in order to establish a rational fermentation
scheme.
A commonly reported problem in the co-culture process is the conflict on the oxygen
requirement. Laplace et al. (1993a) co-cultured S. cerevisiae and C. shehatae on the
sugar mixture medium. Though the micro-aerobic condition was provided, ethanol
was only produced from glucose and C. shehatae showed a slow cell growth rate and
poor fermentation performance. The cause was considered to be the entire
consumption of oxygen by S. cerevisiae. In order to eliminate the oxygen
competition, a RD mutant of Saccharomyces diastaticus was applied for the
co-culture with P. stipitis in another study in continuous fermentation (Laplace et al.,
1993b). Again xylose could not be fully consumed except for an initial concentration

Chapter 2. Literature review
22
of 50 g/l and a dilution rate no more than 0.006 h-1
. Similar results were obtained by
other research groups. The strain combination of P. stipitis and S. cerevisiae was
attempted either through immobilization (Grootjen et al., 1991b) or in two sequential
bioreactors (Grootjen et al., 1991a). In both processes the xylose uptake was
relatively slow, resulting from the insufficient oxygen supply within the gel beads
and the oxygen competition respectively.
Repression of xylose assimilation by glucose catabolism was observed in a
co-culture process of C. shehatae and a RD mutant of S. cerevisiae (Lebeau et al.,
1997). A mutant of P. stipitis showing restricted glucose catabolism was used to
counteract this problem (Kordowska-Wiater and Targonski, 2002); however, xylose
fermentation was not improved.
Currently only three co-fermentation processes employing two strains have reported
impressive results. Taniguchi et al. (1997b) co-cultured a RD mutant of S. cerevisiae
together with P. stipitis on 50 g/l glucose and 25 g/l xylose, achieving an ethanol
yield of 0.50 g/g sugars in 40 h. de Bari et al. (2004) co-immobilized S. cerevisiae
and P. stipitis using different biomass proportions to convert 42 g/l glucose and 12 g/l
xylose. Under optimum conditions both sugars were utilized by 24 h, but the ethanol
only peaked at 40 h, giving a yield of 0.38 g/g sugars. Qian et al. (2006) introduced a
recombinant E. coli strain and co-cultured it with S. cerevisiae on a softwood
hydrolysate. The medium contained 37.5 g/l sugar mixture, of which 75% was
glucose. An ethanol yield of 0.45 g/g was reached within 24 h with the full
consumption of sugars. The ethanol yield was even higher, up to 0.49 g/g, when P.
tannophilus was used to replace the recombinant E. coli; however, a longer time of
48 h was required in this instance.
It is notable that amongst these three reports, two of them employed an engineered
strain for the co-culture process [a RD mutant of S. cerevisiae, and a recombinant
strain of E. coli], and the other one adopted the whole cell immobilization technique.
This implies that it is difficult to achieve high levels of ethanol production by a basic
co-culture process, where free cells of the two strains are simply inoculated into the
same bioreactor. Consequently, a successful co-fermentation of sugar mixture needs
a careful design of fermentation scheme and suitable engineering of the bioprocess

Chapter 2. Literature review
23
and/or the strains. Another significant feature observed in these three reports is the
high glucose proportion in the sugar mixture [67%, 78% and 75% of the total sugars
respectively]. The fermentation of xylose is the actual bottleneck in the
co-fermentation, and thus a high content of glucose makes the process easier and
helps to increase the overall kinetic parameters.
In general, co-culture processes in earlier years gave poorer results compared to the
pure culture fermentation. This resulted from a number of difficulties in the process,
e.g. oxygen competition and catabolism repression due to glucose. Recently some
efficient conversion processes have been reported, by optimizing environmental
parameters and exploring novel fermentation schemes. For the establishment of an
efficient co-fermentation process of the glucose/xylose sugar mixture, critically
analyzing the previous study, selecting reasonable fermentation schemes and further
optimizing them will be the most rational approach. In next section, the justification
of using Z. mobilis as a glucose fermenter and P. stipitis as a xylose fermenter will be
discussed.
2.4.3. Justification for the strain combination of Z. mobilis and P. stipitis
As mentioned above, previous studies generally employed Saccharomyces and its
mutants as the glucose fermenting strain in co-culture; processes involving Z. mobilis
was rarely reported. However, although the ability of S. cerevisiae to grow under
both aerobic and anaerobic conditions seemed to be superior to Z. mobilis, the
resultant oxygen competition between S. cerevisiae and the xylose fermenter only led
to reduced fermentation performance (Laplace et al., 1993a; Taniguchi et al., 1997b).
Therefore, in later research the RD mutant of Saccharomyces has been widely
employed. On the other hand, recently Z. mobilis has been reported to tolerate
limited oxygen (Kalnenieks, 2006; Madigan and Martinko, 2006b). Its fermentation
performance under semi-anaerobic conditions is substantially high and steady,
achieved under conditions without airflow rather than a continuous flush of nitrogen
(Davis et al., 2006). Considering that best results for Saccharomyces in co-culture
were obtained with RD mutants, Z. mobilis as an anaerobic strain with limited
oxygen tolerance has the potential to give high ethanol productivity. The
fermentation efficiency could even be improved, since Z. mobilis is known to show
better performance on the ethanol production from glucose. Consequently, the

Chapter 2. Literature review
24
co-culture process employing Z. mobilis has a need to be investigated.
In a previous study, sequentially culturing Z. mobilis and Pachysolen tannophilus on
the glucose/xylose sugar mixture indicated that the efficiency of the co-fermentation
can be further optimized with an improved performance of the xylose fermentation
(Fu and Peiris, 2008). One approach to achieve this is to use a better xylose fermenter.
Amongst the three xylose fermenting strains reported, P. stipitis gave the highest
ethanol productivity and the least byproducts when cultured on xylose (Sanchez et al.,
2002). Therefore P. stipitis was selected for this study together with Z. mobilis.
The composition of the sugar mixture selected for this study was a glucose to xylose
ratio of 60:40 to simulate the composition of these two sugars in the sugarcane
bagasse (Chandrakant and Bisaria, 1998). It was recognized that the high
concentration of xylose represented a challenge; accordingly, a number of
fermentation schemes were designed to overcome this difficulty.
2.5. Hydrolysis of lignocellulose
The aim of the current research is to convert the lignocellulosic material to ethanol.
Sugarcane bagasse as a typical lignocellulose was chosen as a starting material.
Bagasse, an industrial waste from the sugar industry, is the residual fibrous material
after juice has been extracted from the sugarcane. Typically bagasse contains
approximately 50% cellulose, 24% hemicellulose, and the rest is lignin (Chandrakant
and Bisaria, 1998; Marton et al., 2006). In nature, there is no single wild type
microorganism that can efficiently convert raw bagasse directly to ethanol.
Pretreatment and saccharification processes need to be carried out to hydrolyze the
bagasse to its component sugars prior to fermentation. To be commercially viable,
this process should be fast, with a high yield of sugars and low levels of inhibitors.
2.5.1. Physicochemical methods of hydrolysis
Physicochemical methods of hydrolysis are relatively cheaper and quicker in contrast
to enzymatic hydrolysis. However, they require harsh conditions and yield less sugar
and higher concentration of inhibitors. Common techniques include steam explosion
(Kaar et al., 1998; Martin et al., 2001), acid hydrolysis (Gong et al., 1993; Aguilar et

Chapter 2. Literature review
25
al., 2002; Carvalho et al., 2004; Fogel et al., 2005; Silva et al., 2005) and other
hydrolysis methods such as alkaline hydrolysis (Qu et al., 2007) and organic solvent
processes (Rossell et al., 2006). Among these, acid hydrolysis is the most widely
used treatment for a single hydrolysis process, whereas steam explosion is often
employed as a pretreatment method for enzymatic hydrolysis.
Acid hydrolysis in general is to treat the lignocellulosic material with dilute acid at a
temperature ranging from 80oC to 250
oC for a period of time, after which the
depolymerized sugars are harvested in the liquid phase. The monosaccharides
released into the medium are usually from the hemicellulose part of the
lignocellulose. Since the crystalloid structure of cellulose is relatively hard to
degrade by dilute acid, the glucose yield is comparably low. Consequently, acid
hydrolysis usually yields xylose-rich hydrolysates.
There are various kinds of acid that have been used, including sulfuric acid,
hydrochloric acid, phosphoric acid and other uncommon acids. Amongst these, dilute
sulfuric acid hydrolysis has been investigated most. Gong et al. (1993) used 3% (w/v)
sulfuric acid to hydrolyze the sugarcane bagasse, which resulted in a hydrolysate
with 11% fermentable sugars containing xylose as the dominant sugar. When this
hydrolysate was used as the substrate for ethanol production, prior detoxification was
necessary to alleviate the inhibition of cell growth caused by inhibitors in the
hydrolysate. Silva et al. (2005) investigated the effect of sulfuric acid loading and
residence time on the bagasse hydrolysis. It was reported that at a temperature of
121oC and bagasse loading of 10% (w/v), a sulfuric acid loading of 130 mg/g for 30
min resulted in the maximum xylose concentration. Other research groups
investigating the optimum conditions for sulfuric acid hydrolysis reported a high
xylose concentration up to 57.25 g/l from bagasse, achieved with a solid-liquid ratio
of 1:4, a sulfuric acid loading of 2%, at 1.0 atm for 40 min in an autoclave (Fogel et
al., 2005). This is the highest xylose concentration reported. However, the low
solid-liquid ratio greatly increased the difficulty of separating the liquid phase out of
the bagasse fiber. Moreover, more raw material bagasse is required for producing a
given volume of hydrolysate.
Lavarack et al. (2002) evaluated the kinetic models of acid hydrolysis of bagasse and

Chapter 2. Literature review
26
suggested that sulfuric acid was more efficient and yielded higher xylose
concentrations in comparison with hydrochloric acid. Another investigation on the
kinetic models of acid hydrolysis with sulfuric acid reported the following optimum
conditions, i.e. 2% sulfuric acid at 122oC for 24 min, which resulted in a xylose
concentration of 21.6 g/l in the hydrolysate (Aguilar et al., 2002). A notable trend
observed in studies investigating the conversion of bagasse into value-added
products, including both ethanol and xylitol, was that the produced acid hydrolysate
needed to be concentrated to increase the xylose concentration to a fermentable level
(Roberto et al., 1991; Sene et al., 1998; Sene, 2001; Baudel et al., 2005a; Santos et
al., 2005).
For acid hydrolysis processes carried out with phosphoric acid, a longer reaction time
is usually required to achieve a similar level of sugar in comparison with processes
carried out with sulfuric acid (Carvalho et al., 2004; Gamez et al., 2004; Gamez et al.,
2006). Others investigating nitric acid hydrolysis claimed that it was the most
efficient catalyst amongst a variety of acids (Rodriguez-Chong et al., 2004).
However, the reported concentration of xylose in the hydrolysate [18.6 g/l] was
lower than that achieved with sulfuric acid as discussed above.
Some physicochemical hydrolysis processes comprised two stages, pretreatment and
saccharification. Yu et al. (2002) investigated the hydrolysis of waste cotton cellulose
pretreated by pyrolysis. For both acid and alkaline hydrolysis, removal of inhibitors
was reported to be crucial in achieving a high ethanol yield. Other methods of
pretreatment prior to acid hydrolysis included -irradiation (Pereira and Lancas, 1996)
and the Organosolv Process (Rossell et al., 2006). The latter has been attempted on a
pilot scale up to 5000 l/day, using an ethanol-water mixture as solvent for
pretreatment and dilute sulfuric acid as catalyst for acid hydrolysis.
In summary, amongst various physicochemical hydrolysis approaches, dilute sulfuric
acid method is most commonly used for lignocellulose hydrolysis. Its major
disadvantages include the low sugar yields and the requirement of harsh conditions,
i.e. temperature up to 220oC and low pH. Consequently, techniques based on
enzymatic hydrolysis have been developed.
Chapter 2. Literature review
27
2.5.2. Enzymatic hydrolysis
Disadvantages associated with enzymatic hydrolysis are the cost of the enzyme
system and the comparatively low efficiency of these enzymes (Chandrakant and
Bisaria, 1998). As a result, the reaction is often carried out with a prior
physicochemical treatment to remove the lignin part and loosen the cellulose
structure, making it more accessible to cellulolytic enzymes (Martin et al., 2002). A
number of pretreatment methods have been reported. Martin et al. (2001) studied the
enzymatic hydrolysis of sugarcane bagasse pretreated by steam explosion at a
temperature range between 205oC and 210
oC. The obtained hydrolysate contained
approximately 22 g/l of glucose and 9.0 g/l of xylose, with the use of enzyme
combination of Celluclast 1.5 L and Novozyme 188. In other studies sugarcane
bagasse was exposed to a hydrothermal pretreatment at 200oC (Walch et al., 1992);
the resulting hydrolysate showed improved sugar yields during the subsequent
enzymatic saccharification.
Dilute acid treatment has also been attempted as a pretreatment for the enzymatic
saccharification. Using wheat straw pretreated by sulfuric acid as substrate, Saha et
al. (2005) reported a yield of monomeric sugars of 565 mg/g after the enzymatic
hydrolysis and a maximum ethanol yield of 0.24 g/g dry solid during the
fermentation. Palmarola-Adrados et al. (2005) achieved a sugar yield of 80% of the
theoretical on the wheat bran; enzymatic hydrolysis with prior treatment by a small
amount of acid was suggested to give higher sugar yields compared to that without
the pretreatment. Other pretreatment approaches included peracetic acid treatment
(Teixeira et al., 1999) and microwave treatment (Kitchaiya et al., 2003); both studies
claimed that the pretreatment increased the sugar yield during the enzymatic
hydrolysis.
Adsul et al. (2005) evaluated enzymatic hydrolysis with different delignified
bagasses; a maximum hydrolysis rate of 95% was reported. Jeffries and Schartman
(1999) working with different hydrolysis schemes reported a highest saccharification
rate of 65%, with the use of 5 FPU/g of cellulase plus 10 IU/g glucosidase.
Sequential addition of enzymes was reported to give a better yield compared to the
addition of both enzymes as a single dose.

Chapter 2. Literature review
28
In general, enzymatic hydrolysis is considered to be an efficient method of obtaining
high sugar content from lignocellulosic material. On account of the compact
structure of cellulose, a prior pretreatment process helps to improve the sugar yield.
Though the cellulolytic enzyme systems are costly, enzymatic hydrolysis is a
promising method to obtain hydrolysate with higher sugar levels. However, for a
commercial ethanol production process, the production of cellulolytic enzymes must
be taken into consideration in the overall cost.
2.5.3. Fermentation of hydrolysate
Although enzymatic hydrolysis produces sufficiently high sugar levels for direct
fermentation, there are other factors limiting the fermentability of the lignocellulosic
hydrolysate, i.e. the presence of inhibitors in the hydrolysate. These inhibitors are
usually byproducts formed during the acid hydrolysis, including acetic acid, phenolic
compounds, furfural, 5-hydroxymethylfurfural, etc (Takahashi et al., 2000). They are
capable of inhibiting cell growth and metabolism of the microorganism responsible
for ethanol production (Watson et al., 1984; du Preez, 1994; Klinke et al., 2004).
Martin (2007a) summarized three major approaches to eliminate the effect of these
inhibitors on the fermentation process:
(1) Minimizing the inhibitor formation during the hydrolysis,
(2) Detoxifying the hydrolysate and removing inhibitors prior to fermentation,
(3) Selecting and adapting the fermenting strains to the hydrolysate.
Harsh conditions in the physicochemical hydrolysis are reported to promote the
formation of undesirable compounds (Delgenes et al., 1996b). Enzymatic hydrolysis
with milder conditions along with an appropriate pretreatment method can effectively
limit the inhibitor formation. Steam explosion and wet oxidation, which is an
advanced method derived from steam explosion, are widely accepted as the best
pretreatment methods for this purpose (Kaar et al., 1998; Martin et al., 2006a; Martin
et al., 2007b). Both methods subject the bagasse raw material to a high temperature
of 170-220oC under humid conditions to delignify, and then expose the delignified
slurry to cellulolytic enzymes.
Detoxification is the most commonly used method of improving the fermentability of
the hydrolysate, due to its effectiveness on the inhibitors removal. There are various

Chapter 2. Literature review
29
detoxification methods, including overliming (Amartey and Jeffries, 1996), pH
neutralization (Yu and Zhang, 2002), ion exchange (Watson et al., 1984; Qu et al.,
2007), alkaline extraction (Baudel et al., 2005b), activated charcoal adsorption
(Marton et al., 2006; Qu et al., 2007) and solvent extraction (Griffin and Shu, 2004).
Amongst these, overliming as a simple process without specific equipment
requirements has often been employed as a general detoxification method (Sene et al.,
1998; Takahashi et al., 2000). By adjusting the pH of the hydrolysate to 10-10.5 with
either CaO or Ca(OH)2, followed by neutralization back to 7, a majority of
undesirable components, such as acid, phenolic components and furfural, can be
precipitated and easily removed by centrifugation (Amartey and Jeffries, 1996;
Olsson and Hahn-Hagerdal, 1996). It was reported that the overliming of sugarcane
bagasse hydrolysate doubled the ethanol productivity compared to the hydrolysate
without treatment (Martin et al., 2002).
For strain selection and adaptation, most research chose to repeatedly culture the
same batch of cells in the renewed hydrolysate medium, which permitted a natural
adaptation of cells to the hydrolysate environment (Parekh et al., 1986; Yu et al.,
1987; Kwon et al., 2006). Yu et al. (1987) collected cells of Candida shehatae from
the fermentation process by centrifugation and used them as the inoculum for the
next fermentation process. The resultant strain was capable of completely fermenting
the substrate of spent sulphite liquor at pH 1. Parekh et al. (1986) recycled Candida
shehatae 72 times and Pichia stipitis 12 times; both strains showed improved ethanol
productivity and ethanol tolerance. However, sometimes it is difficult to distinguish
whether the improvement of kinetic parameters was a consequence of the strain
adaptation or only due to the increase of biomass from the recycling. For instance,
Kwon et al. (2006) cultured Candida tropicalis in a fermentor with a membrane filter
system; the accumulation of viable cells in the medium would dramatically increase
the whole system efficiency. Other studies forced the strain to adapt to the
hydrolysate by a series of subcultures to media containing increased substrate
concentrations (Amartey and Jeffries, 1996; Sene et al., 1998; Sene, 2001). This
principle was also applied to the adaptation of the microorganism to an increased
inhibitor concentration (Martin et al., 2007a).
The hydrolysis process produces the fermentable sugars for ethanol production, and
Chapter 2. Literature review
30
its fermentability directly determines the overall efficiency of the conversion of
lignocellulose to ethanol. The improvement on the convertibility of hydrolysate
greatly benefits the subsequent fermentation. In order to obtain a hydrolysate with a
high sugar yield and lower inhibitor concentration, the hydrolysis process of
sugarcane bagasse should comprise three stages: (1) the pretreatment of bagasse raw
material to delignify and increase the accessibility of the cellulose, (2) enzymatic
saccharification of the pretreated bagasse to achieve a high level of sugar
concentration which could be directly fermented by microorganisms, (3)
detoxification to minimize the inhibitory components in the hydrolysate.
2.6. Conversion of lignocellulose using other fermentation schemes
For the conversion of lignocellulose to ethanol, besides the separate hydrolysis and
fermentation (SHF) processes, there are other fermentation schemes that combine
two or more processes together into an integrated process. An ultimate fermentation
scheme should include a genetically constructed microorganism which is able to
produce cellulolytic enzymes, hydrolyze the lignocellulose to sugars and co-ferment
the sugar mixture to ethanol in a single step reaction. However, at present this
scheme remains conceptual; preliminary research focuses on either the simultaneous
saccharification and fermentation (SSF) process or the use of genetically modified
organisms (GMO) to co-ferment glucose/xylose sugar mixture. Some typical studies
regarding these two aspects are reviewed below.
2.6.1. Simultaneous saccharification and fermentation
SSF processes can be further divided into two sub-categories. The first one employs
only a single strain, either a wild type or genetically modified, to directly produce
ethanol from macromolecular carbohydrates such as cellulose. The other process
co-cultures a common ethanol producing strain with strains or enzymes that can
degrade those macromolecular carbohydrates into single sugars. A major advantage
of SSF process is that, by continuous removal of the released monosugars, SSF can
break the equilibrium of enzymatic reactions and propel the reaction towards the
production of sugars, consequently improving the efficiency of saccharification
(Chandrakant and Bisaria, 1998).

Chapter 2. Literature review
31
Kadar et al. (2004) used a glucose-fermenting yeast co-cultured with enzymes,
achieving an ethanol yield up to 17 g/g on both substrates of old corrugated
cardboard and paper sludge. Two glucose-fermenters, S. cerevisiae and
Kluyveromyces marxianus, showed comparable ethanol productivity. Similar ethanol
yields were obtained by Ballesteros et al. (2004) culturing K. marxianus on a number
of lignocellulosic substrates. Within 160 h, maximum ethanol production was around
16-19 g/l, which was 50-72% of the theoretical. Golias et al. (2002) investigated SSF
processes carried out by three strains. The highest ethanol productivity was achieved
with a recombinant strain of Klebsiella oxytoca P2, but both strains of K. marxianus
and Z. mobilis gave higher ethanol yield than K. oxytoca P2. The application of
recombinant Z. mobilis with xylose fermenting ability on the pretreated hardwood
substrate resulted in an ethanol yield over 23 g/l (McMillan et al., 1999); however,
the sugar conversion rate was considerably low [54% in 7 days]. Latif and Rajoka
(2001) attempted an SSF process with two microorganisms, Saccharomyces
cerevisiae and Candida tropicalis, either individually or co-cultured on the substrate
of dry corn cobs. The highest product yield was obtained by S. cerevisiae for ethanol
and C. tropicalis for xylitol; the co-culture of two microorganisms with cellulase
enzymes showed hardly any advantage.
For the co-culture of a cellulolytic strain and an ethanol producing strain, the
combination of Trichoderma viride and Pachysolen tannophilus has been studied on
the natural untreated straw (Zayed and Meyer, 1996). T. viride was inoculated at first,
inactivated after the completion of the saccharification process, and then P.
tannophilus was inoculated to the same medium to convert the released sugars to
ethanol. Shama (1991) carried out the co-culture process with Bacillus
stearothermophilus and Clostridium thermocellum. With the use of a lactate
dehydrogenase deficient mutant of B. stearothermophilus, the process produced 50%
more ethanol in comparison with C. thermocellum sole culture. Direct fermentation
of cellulose to ethanol was studied by Balusu et al. (2005). Using response surface
methodology, ethanol production up to 0.41 g/g was reported with optimized medium
components. In other studies, Panagiotou et al. (2005) achieved an ethanol yield of
0.35 g/g by employing Fusarium oxysporum to directly produce ethanol from
cellulose.

Chapter 2. Literature review
32
Though the SSF process has the potential to achieve higher system efficiency,
currently there are no reports of SSF giving competitive results to the SHF processes.
The low saccharification efficiency and the consequently slow ethanol production
greatly limit the performance of SSF. An SSF process for the commercial application
still needs more studies.
2.6.2. Application of genetically modified microorganisms
Genetic engineering makes the construction of strains with all desirable
characteristics theoretically possible. With time and the development of new
techniques, it may be possible to construct a recombinant strain that is able to carry
out all the reactions from lignocellulose to ethanol. Up to date some GMO with
excellent performance on the glucose/xylose co-fermentation have already been
reported. These artificially engineered strains are often referred as “biocatalysts”, for
they are only produced to transform certain substrates into desirable products (Fujita
et al., 2004; Ishige et al., 2005). In terms of co-fermentation of glucose/xylose sugar
mixture, recombinant biocatalysts are usually constructed in three ways: (1)
extending the substrate utilization range of traditional ethanol producing strains, such
as S. cerevisiae or Z. mobilis, (2) modifying the metabolic system of strains with
wide substrate-assimilating range to make them produce ethanol, typically E. coli; (3)
improving the ethanol productivity of the common xylose fermenting strains, e.g. P.
stipitis, by inserting gene fractions from S. cerevisiae or Z. mobilis.
One of first successful reports on the genetic modification of glucose fermenters
were achieved by Zhang et al. (1995). They modified the genome of Z. mobilis to
produce a pentose metabolism pathway using genes derived from Xanthomonas
campestris or Klebsiella oxytoca. Davis et al. (2005) cultured a xylose-utilizing strain
of Z. mobilis on a wheat stillage hydrolysate. However, the xylose fermentation was
considerably less efficient than the glucose fermentation. Hahn-Hageradal et al.
(1994) pointed out that the low performance of recombinant glucose fermenters on
xylose fermentation was mainly because of the unfavorable kinetic properties and an
inadequate pentose phosphate pathway in the cells. To solve this problem and
improve the xylose conversion rate, Jin and Jeffries (2003) manipulated the
expression of P. stipitis genes coding for XR and XDH in the S. cerevisiae cells, and
reported an increased enzymatic activity. An efficient conversion of glucose/xylose

Chapter 2. Literature review
33
sugar mixture was achieved by Krishnan et al. (2000) using a recombinant Z. mobilis
CP4 (pZB5). An ethanol concentration up to 44.3 g/l was produced from 76/l glucose
and 33.8 g/l xylose within 24 h, with a xylose consumption more than 80%.
E. coli, which is one of the most studied and best understood strains, has been widely
used for genetic modification work, for it can efficiently metabolize a number of
sugars including both glucose and xylose. Takahashi et al. (2000) investigated the
ethanol production performance of a recombinant strain of E. coli with the ethanol
pathway genes from Z. mobilis on the glucose/xylose sugar mixture. The research
compared the fermentation efficiency of E. coli KO11 in the synthetic medium and
hemicellulosic hydrolysate, and reported a maximum ethanol yield of 96.4% of the
theoretical from the synthetic medium. Continuous culture employing a recombinant
E. coli has also been attempted (Martin et al., 2006b). With a 26 day culture, a stable
ethanol yield of 80-85% of the theoretical rate was achieved. The plasmid retention
rate was 96-97% without the addition of antibiotics. Qureshi et al. (2006) reported a
salt tolerance up to 10 g/l and an initial xylose tolerance up to 250 g/l of a
recombinant strain of E. coli. Maximum ethanol yield of 0.50 g/g was achieved,
which was 98 % of the theoretical value.
The yeast P. stipitis has also been used for genetic engineering as the most promising
xylose fermenter in nature. A recombinant P. stipitis strain carrying genes from S.
cerevisiae was constructed as early as in 1994 (Yang et al., 1994). Another study
investigating a P. stipitis strain bearing a URA1 gene from S. cerevisiae reported an
ethanol yield of 0.41 g/g from glucose (Shi and Jeffries, 1998). The recombinant
strain proved to be viable under anaerobic conditions on glucose medium but failed
to grow on xylose medium.
In conclusion, some GMO have been reported to give comparably high ethanol
productivity on the co-fermentation of glucose/xylose sugar mixture, and new strains
carrying better fermentative characteristics will be continually constructed. However,
Kim et al. (2007) suggested that recombinant organisms are still not very favorable
for a large scale production in industry. Therefore, the research on the fermentation
engineering to solve the problems on the glucose/xylose co-fermentation remains
necessary.

Chapter 3. Materials and Methods
34
Chapter 3
Materia ls and Methods
3.1. Overview of experimental design
The experimental design of the current study is presented in Figure 3.1.
3.2. General Procedures
Chemicals and reagents were obtained from Sigma-Aldrich Inc. (U.S.A.), Oxoid Ltd.
(U.K.) and Alfa Aesar (U.K.). The enzymes were kindly provided by Novozymes
Australia Pty. Ltd. Distilled water was used in all solutions and media preparations
unless otherwise stated.
Accurate weight measurements for chemical compounds and dry cell pellets were
made using a Sartorius BP110S analytical balance (four decimal accuracy)
[Selby-Biolab, Germany]. Measurements with less precision requirements were
made on an A&D electronic balance FX-3200 [A&D company Ltd., Japan].
The pH of solutions was determined using a WTW pH meter [pH 315i/SET, WTW,
Germany]. All pH probes were calibrated using color-coded buffers for pH 7 and pH
4 [Labchem, APS Finechem, Australia]. Solutions used for pH adjustment will be
stated wherever relevant.

Chapter 3. Materials and Methods
35
Figure 3.1: Schematic diagram of the overall experimental design in this study

Chapter 3. Materials and Methods
36
Thorough mixing of substances was achieved by Chiltern MT19 auto vortex mixer
[Selby, Australia], or a Gallenkamp magnetic stirrer [A. Gallenkamp & Co. Ltd.,
U.K., Catalogue No. SWT 310 010 U]. The magnets used were approximately 3 cm
in length by 0.5 cm in diameter.
A bench top Jouan B3.11 centrifuge [Thermoline Scientific Equipment Pty. Ltd.,
Australia] was used for routine centrifugation. Larger volumes of liquid were
centrifuged using a refrigerated Sorvall RC 5B Plus centrifuge [Sorvall Products L.P.,
U.S.A.].
Spectrophotometric measurements were carried out with a Jenway 6300
Spectrophotometer [Barloworld Scientific Ltd., U.K.]. Cuvettes used were 2.5 ml
with a path length of 1 cm [Greiner Bio-one, Germany, Catalogue No. Bestell-Nr.
614101].
Immobilization and other operations requiring a strict aseptic environment were
carried out in a Class 2 Biological Safety Cabinet BH120 [Gelman Sciences, U.S.A.].
Operations involving volatile chemicals were carried out in a Clyde-Apac LFC series
fume cabinet [Clyde-Apac, Australia].
Sterilization of glassware, media and equipment was effected by autoclaving at
121oC for 15 min by either a pressure cooker [Namco, Australia], or an Atherton
110A series sterilizer [Atherton Pty. Ltd., Australia]. Fermentors were sterilized
under the same conditions using an Atherton GEC612 sterilizer [Atherton Pty. Ltd.,
Australia]. Malt Extract Agar (Oxoid CM0059) was prepared following the company
instruction and sterilized at 115oC for 10 min. Heat labile solutions were filter
sterilized using vacuum filtration with a 0.45 m membrane filter. Where appropriate,
equipment was dried in a 60oC oven.
Julabo SW22 Water bath [Julabo Labortechnik GMBH, Germany] was used for
enzyme assays.
Shaking incubation was carried out in orbital shakers. Based on the number and the

Chapter 3. Materials and Methods
37
size of flasks, three shakers were employed: the Orbital Shaking Refrigerated
Incubator TFSIR-383-1, TLM 2-590 and the Orbital Shaking Incubator TU-400, all
from Thermoline Scientific Equipment Pty. Ltd. (Australia).
Bioreactors used in this study were a continuous stirred tank bioreactor with 1 l
working volume [Biostat B, B. Braun Biotech International, Germany]. The pH
probe used for the bioreactor was from Mettler Toledo GMBH [Switzerland,
Catalogue No. 59904068].
Figure 3.2: A 1 l bioreactor used in this study

Chapter 3. Materials and Methods
38
3.3. Microorganisms
Zymomonas mobilis UWS HAWK 203 was obtained from the Microbiology Culture
Collection in the School of Natural Sciences, University of Western Sydney, Sydney,
Australia; originally from the American Type Culture Collection (ATCC) No. 10988.
Pichia stipitis WM 810 was kindly provided by the Westmead Clinical School,
University of Sydney, Sydney, Australia; originally from Centraalbureau voor
Schimmelcultures (CBS) No. 5773.
Both strains were cultured on agar plates at 30oC, Z. mobilis on Glucose Agar and P.
stipitis on Xylose Agar; the medium composition of the two media is listed in
Section 3.4. Culture plates were stored in a 4oC refrigerator and subcultured to fresh
media once every fortnight.
3.4. Media
Unless otherwise stated, the composition of solid and liquid media used in this study
is as shown in Tables 3.1 and 3.2.
Table 3.1: Solid media composition
Solid media Composition
Glucose Agar 20.0 g/l glucose, 10.0 g/l yeast extract, 15.0 g/l technical agar and 2.0
g/l KH2PO4
Xylose Agar 20.0 g/l xylose, 4.0 g/l yeast extract, 1.0 g/l MgCl2, 5.0 g/l (NH4)2SO4,
3.0 g/l KH2PO4 and 15.0 g/l technical agar
Malt Extract Agar
(Oxoid, CM0059)
30.0 g/l malt extract, 5.0 g/l mycological peptone and 15.0 g/l agar

Chapter 3. Materials and Methods
39
Table 3.2: Liquid media composition
Liquid media Composition
Glucose Medium 50.0 g/l glucose, 10.0 g/l yeast extract, 1.0 g/l MgCl2, 1.0 g/l
(NH4)2SO4 and 1.0 g/l KH2PO4.
Xylose Medium 50.0 g/l xylose, 10.0 g/l yeast extract, 1.0 g/l MgCl2, 1.0 g/l
(NH4)2SO4 and 1.0 g/l KH2PO4.
Co-fermentation
Medium
30.0 g/l glucose, 20.0 g/l xylose, 10.0 g/l yeast extract, 1.0 g/l MgCl2,
1.0 g/l (NH4)2SO4 and 1.0 g/l KH2PO4.
Glucose Storage
Medium
10.0 g/l glucose, 2.5 g/l yeast extract and 5.55 g/l CaCl2
Xylose Storage
Medium
10.0 g/l xylose, 5.0 g/l yeast extract and 5.55 g/l CaCl2
3.5. Inoculum preparation
All inocula were prepared in 250 ml conical flasks with 50 ml medium at 30oC. Z.
mobilis inocula were cultured on Glucose Medium in a stationary incubator for 24 h,
and P. stipitis inocula were cultured on Xylose Medium in an orbital shaker with 150
rpm shaking speed for 36-48 h.
In this study, three levels of inoculum size were commonly used, viz. 10%, 50% and
100% (vcells/vferm). For the inoculum size of 10%, the traditional volume to volume
inoculum was used, i.e. inoculum medium with a volume that is 10% of volume of
the fermentation medium was transferred directly into the fermentation medium. For
the inoculum size of 50% and any size larger than this, cells from the corresponding
volume of inoculum medium were firstly concentrated and then inoculated into the
fermentation medium; the procedure is shown in Figure 3.3.

Chapter 3. Materials and Methods
40
Figure 3.3: Inoculum preparation for large inoculum sizes.
In order to attain the desirable volume of inoculum, multiple flasks containing 50 ml
inoculum medium were simultaneously incubated. Subculture up to three times was
carried out to ensure that cells in all flasks were initially from the same colony on the
culture maintenance agar plate. For example, for 800 ml fermentation medium with
an inoculum size of 100%, all together 800 ml inoculum medium was required,
equalling 16 inoculum flasks. To prepare 16 flasks of inoculum, firstly a single
inoculum flask was inoculated by transferring a single colony from the culture
maintenance plate; after incubation, 5 ml of culture was transferred into another two
inoculum flasks containing fresh medium, and then these two flasks were used to
inoculate 16 inoculum flasks, ensuring that each flask had the identical culture.
A comparison between the traditional volume to volume inoculation and the
concentrated cell inoculation is shown in Table 3.3.

Chapter 3. Materials and Methods
41
Table 3.3: Comparison of some features between two inoculation modes
Conventional (v/v) Concentrated cells
Introduce inoculum medium to fermentation Yes No
Permit high initial cell concentration No Yes
Dilute the initial sugar concentration in
fermentation medium
Yes No
3.6. Whole cell immobilization
Calcium alginate gel encapsulation was used to immobilize both Z. mobilis and P.
stipitis cells (Becerra et al., 2001). An outline of the procedure is shown in Figure
3.4.
The harvested beads had a final concentration of 2% alginate. Z. mobilis beads were
approximately 2-3 mm in diameter, with an off white color; the original beads
contained cells from 400 ml culture concentrated into 100 ml of beads. P. stipitis
beads were approximately 3-4 mm in diameter, with a creamy/yellow color; cells
from 1000 ml culture were concentrated into 250 ml of beads.
For beads that were used after storage, a reconditioning process was carried out prior
to fermentation, by incubating beads in a small volume of fermentation medium to
restore the biomass level inside the beads. The reconditioning of Z. mobilis was
carried out with 100 ml Glucose Medium in 250 ml conical flasks, cultured
stationary for 4-10 h based on the beads condition. The reconditioning of P. stipitis
was performed by separating the 250 ml beads into 2 flasks each containing 100 ml
Xylose Medium, and incubating in an orbital shaker with 100 rpm shaking speed for
12 h.
The biomass concentration within the beads was determined by dissolving 5 beads in
10 ml of 1% sodium citrate solution. Incubation was carried out in a 30oC shaker
with 150 rpm shaking speed, for approximately 30 min to 1 h, till all the beads
completely dissolved. Then 1 ml of cell suspension was used for plating to determine
the viable cell number, and the remaining 9 ml was centrifuged and dried in a 104oC
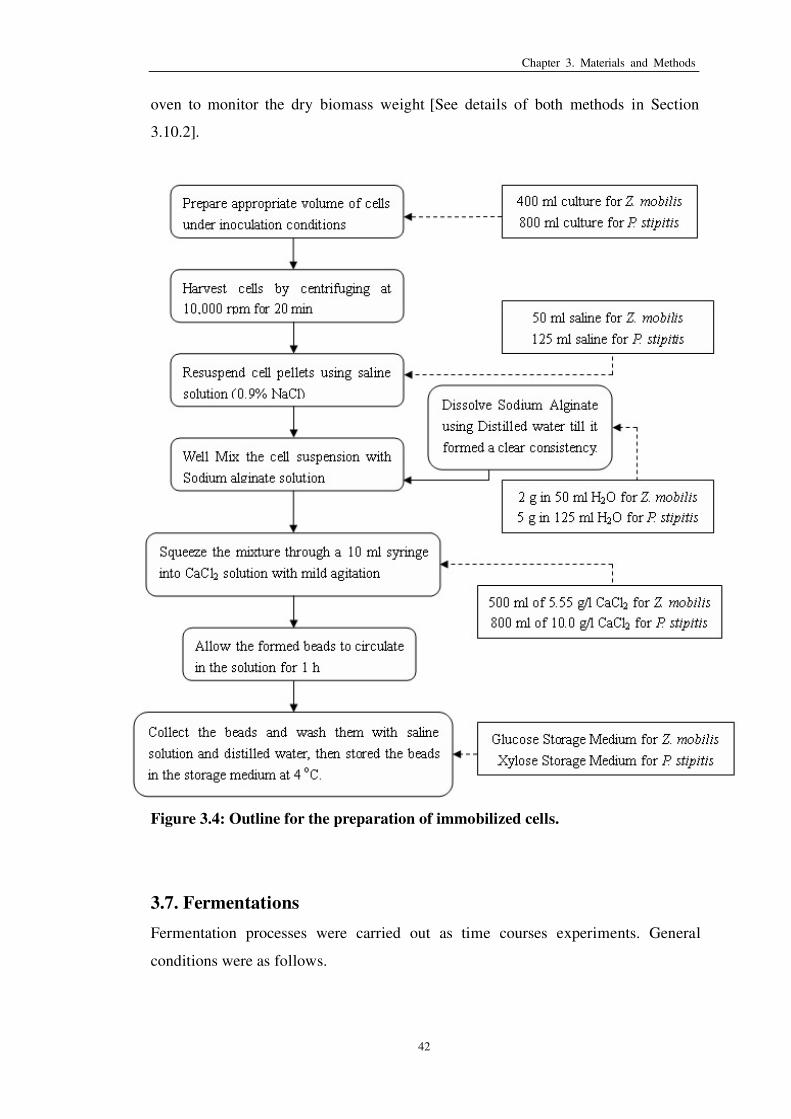
Chapter 3. Materials and Methods
42
oven to monitor the dry biomass weight [See details of both methods in Section
3.10.2].
Figure 3.4: Outline for the preparation of immobilized cells.
3.7. Fermentations
Fermentation processes were carried out as time courses experiments. General
conditions were as follows.

Chapter 3. Materials and Methods
43
3.7.1. Shake flask fermentations
All time courses with shake flasks were carried out in 250 ml conical flasks in a 30oC
orbital shaker. Two levels of fermentation medium volume were used for different
experiments. For experiments with 50 ml medium in each flask, the shaking speed of
100 rpm was employed and the inoculum size was 10% (v/v). For experiments with
100 ml medium in each flask, various shaking speeds and inoculum sizes were used,
which will be stated wherever relevant.
3.7.2. Glucose fermentation with Z. mobilis
For both free cell culture and immobilized culture, the fermentations were carried out
in a 1 l bioreactor with 800 ml Glucose Medium. For immobilized culture, no CaCl2
was added to the medium. The temperature was controlled at 30oC and the stirring
speed was 100 rpm. No aeration was provided during the fermentation and pH was
uncontrolled.
3.7.3. Xylose fermentation with P. stipitis
Similar to Z. mobilis, fermentations with both free cell and immobilized P. stipitis
were carried out in a 1 l bioreactor, at 30oC with 100 rpm stirring speed. The
fermentation medium was 800 ml of Xylose Medium, with no CaCl2 addition to the
immobilized culture. Various aeration levels were used for different fermentation
time courses, and pH was uncontrolled. Some commonly used aeration levels and the
corresponding oxygen transfer rates are listed in Table 3.4.
Table 3.4: Common aeration levels used in this study
Air flow (cm3/min) None 20 50 80 100 150
OTR (mmol/l/h) 0 66.96 167.41 267.86 334.82 502.23
3.7.4. Co-fermentations
Co-fermentation processes were carried out with 800 ml Co-fermentation Medium in
a 1 l bioreactor. The temperature was 30oC and the stirring speed was 100 rpm, with
uncontrolled pH. Unless otherwise stated, in all co-fermentation experiments, the
inoculum size was 50% for both strains.

Chapter 3. Materials and Methods
44
In all processes of glucose/xylose co-fermentation, the glucose fermentation by Z.
mobilis was much more efficient compared to the xylose fermentation by P. stipitis.
The completion of glucose fermentation was determined by observing the pH change.
Both glucose and xylose fermentations produce carbon dioxide during the ethanol
fermentation process. The produced CO2 enters the fermentation medium and forms
carbonic acid, which decreases the pH of the medium (Fu and Peiris, 2008). During
the glucose fermentation, the decrease of pH was considerably rapid; then it would
remain constant for a period of time, which indicated the complete utilization of
glucose. After that, the pH would again decrease slowly, indicating the utilization of
xylose.
3.7.4.1. Sequential culture
Sequential culture of Z. mobilis and P. stipitis was achieved by inoculating Z. mobilis
at first to convert all the glucose in the medium. After glucose was utilized, the
bioreactor was autoclaved at 115oC for 5 min to inactivate all the bacteria in the
medium. P. stipitis was then inoculated to the medium after the temperature of
bioreactor decreased to room temperature, which usually took 12 h. For inoculation,
the harvested P. stipitis cell pellet after centrifugation was re-suspended in 200 ml of
20 g/l xylose and inoculated to the bioreactor. The addition of the xylose in the
inoculum also compensated for the loss of xylose in the fermentation medium due to
the sampling during the glucose fermentation. The resulting fermentation medium
after the inoculation of P. stipitis contained 20 g/l xylose and had a volume of
approximate 800 ml. No aeration was provided for the glucose fermentation, while
during the xylose fermentation the air flow was controlled at 80 cm3/min.
3.7.4.2. Co-culture with free cells
Both strains were simultaneously inoculated into the bioreactor to start the
fermentation. After the completion of glucose fermentation, xylose fermentation
continued under the same condition without any adjustment. Fermentation ended
when the pH of the medium remained constant. Various aeration levels and inoculum
sizes were tested in order to optimize the system.

Chapter 3. Materials and Methods
45
3.7.4.3. The use of immobilized Z. mobilis in the co-culture
This fermentation scheme co-cultured the immobilized Z. mobilis and free cells of P.
stipitis simultaneously on the glucose/xylose medium. Again after the glucose
fermentation was completed, no adjustment to conditions was made; the beads
remained in the fermentation medium till the end of the process. Time courses were
repeated with same batch of Z. mobilis beads in order to examine the effect of the
reuse of the immobilized cells. In all the time courses, air flow was controlled at 80
cm3/min.
3.7.4.4. Co-culture processes in a modified fermentor
This fermentation scheme was an improved version of the previous one with
immobilized Z. mobilis. A specially designed sieve plate was introduced to the
bioreactor, together with a movable device to lift the sieve plate up and down [see
Figure 3.5]. When both immobilized Z. mobilis and free cells of P. stipitis were
inoculated, the sieve plate would prevent the immobilized beads from passing
through and permit the yeast cells to pass. Then after all the glucose was used up, the
immobilized beads could be conveniently removed from the fermentation medium,
simply by lifting the sieve plate up to the upper part of the bioreactor where they had
no contact with the medium. Therefore this scheme enabled the removal of the
majority of Z. mobilis cells from the medium without disturbing the ongoing xylose
fermentation, consequently minimizing the potential effects of Z. mobilis on the
xylose fermentation by P. stipitis. Furthermore, this would also prevent undue
damage to the gel beads from the prolonged exposure to the fermentation medium.
For this fermentation scheme, time courses with different inoculum levels were
carried out to investigate the effect when different ratios of two strains were
employed as inoculum. All experiments were carried out in duplicate. Air flow was
controlled at 80 cm3/min for all time courses.
3.7.4.5. Culture of P. stipitis on glucose/xylose mixture
Experimental conditions were similar to those described for sole xylose fermentation
in Section 3.7.3, except 30 g/l glucose and 20 g/l xylose were used as carbon sources
instead of 50 g/l xylose. Time courses were carried out with several aeration levels
and inoculum sizes in order to achieve an optimized performance.

Chapter 3. Materials and Methods
46
Figure 3.5: Modified bioreactor with the added sieve plate.
3.8. Sampling techniques
In order to ensure consistency, the sampling procedure used in this study is as shown
in Figure 3.6.
Figure 3.6: Sampling procedure used in this study.

Chapter 3. Materials and Methods
47
3.9. Hydrolysis of sugarcane bagasse
In order to investigate the effect of hydrolysis conditions on the hydrolysate, three
batches of sugarcane bagasse were prepared and simultaneously subjected to the
treatments of acid hydrolysis and enzymatic hydrolysis under different conditions.
Parameters including acid concentration, enzyme loading and recovery method were
examined to set up an optimal hydrolysis process.
3.9.1. Acid hydrolysis
Acid hydrolysis process generally followed the description of Takahashi et al. (2000).
The basic procedure is shown in Figure 3.7.
Figure 3.7: Procedure of acid hydrolysis.

Chapter 3. Materials and Methods
48
3.9.2. Enzymatic hydrolysis
Enzymatic hydrolysis was carried out as described by Martin et al. (2006a) and
Davis et al. (2005). Basically, the bagasse material was mixed with 0.04 M acetate
buffer at pH 5.0 [prepared by dissolving 3.28 g sodium acetate anhydrous in 1 l
distilled water and adjusting the pH to 5.0 using acetate acid glacial]. Enzymes were
added at several loadings with different enzyme combinations; the hydrolysis was
carried out in an orbital shaker at 60oC, 200 rpm. The details of enzymes employed
in this study are shown in Table 3.5.
Table 3.5: Enzymes used for hydrolysis
Enzyme name Class Activity
Cellclast 1.5 L Cellulase 700 EGU/g
Viscozyme L -glucanase (endo-1,3(4)-) 100 FBG/g
Novozyme 188 -glucosidase 250 CBU/g
Shearzyme 500 L Xylanase (endo-1,4-) 500 FXU-S/g
Biofeed Wheat L Xylanase (endo-1,4-) 650 FXUW/ml
3.9.3. Preparation of hydrolysates for fermentation
Hydrolysate was supplemented with sugars and other components to increase the
initial sugar level and improve the fermentability. The composition of Concentrated
Sugar solution and Concentrated YEIS (yeast extract and inorganic salts) solution is
listed in Table 3.6.
Table 3.6: Composition of supplements added to bagasse hydrolysate
Supplement Composition
Concentrated Sugars 200.0 g/l glucose and 120.0 g/l xylose
Concentrated YEIS 80.0 g/l yeast extract, 8.0 g/l MgCl2, 8.0 g/l (NH4)2SO4 and 8.0
g/l KH2PO4.
For the preparation of adaptation medium, 80 ml filter-sterilized hydrolysate was

Chapter 3. Materials and Methods
49
mixed with 10 ml Concentrated Sugar and 10 ml Concentrated YEIS solution, made
up to 100 ml for each adaptation flask. The fermentation medium comprised 600 ml
of hydrolysate medium together with 100 ml of Concentrated Sugars and 100 ml
Concentrated YEIS solution, totaling 800 ml.
3.9.4. Strain adaptation to the hydrolysate
Both strains were adapted to the hydrolysate medium prior to fermentation. For
immobilized Z. mobilis, beads were firstly reconditioned as described in 3.5, and
then transferred into a 250 ml conical flask containing 100 ml supplemented
hydrolysate medium. Incubation was carried out for 8-12 h in a 30oC stationary
incubator. P. stipitis cells were firstly harvested from 400 ml Xylose Medium as
described in Section 3.5. After centrifugation, cells were re-suspended into 4 conical
flasks, each containing 100 ml supplemented hydrolysate medium. Incubation lasted
for 24 h in a 30oC orbital shaker with a shaking speed of 200 rpm.
Inoculation and fermentation conditions were identical to those reported for
glucose/xylose co-fermentation in the previous section. Fermentations were carried
out with the co-culture in a modified fermentor and also with P. stipitis sole culture
[see fermentation conditions in Sections 3.7.4.4 and 3.7.4.5 respectively].
3.10. Analytical methods
3.10.1. Determination of sugar concentration
Three methods were employed for the assay of sugar concentration, viz. Reducing
sugar (RS) assay, Glucose oxidase (GO) assay, and HPLC. RS assay was generally
used for all sugar media to estimate the reducing sugar content. GO assay was used
to measure the glucose concentration in the glucose/xylose mixture. HPLC was
employed to determine the glucose and xylose concentration in the sugarcane
bagasse hydrolysate.
3.10.1.1. Reducing sugar assay
Both glucose and xylose are reducing sugars and can be assayed by the
Dinitrosalicylic Acid (DNS) method (Miller et al., 1960) using the corresponding
sugar standards.

Chapter 3. Materials and Methods
50
For samples from time courses using only glucose or xylose as the sole carbon
source, sugar concentration was determined as follows. The supernatant of the
centrifuged sample was diluted 1 in 10, 1 in 50 and 1 in 100. Then standard sugar
solutions were prepared using either glucose or xylose at concentration levels of 200,
400, 600, 800 and 1000 g/ml. For the assay, reagents were added into test tubes as
shown in Table 3.7.
Table 3.7: Reagents added in the RS assay
Standard solution Test sample Distilled water DNS reagent *
Blank 3 ml 2 ml
Standards 1 ml 2 ml 2 ml
Test samples 1 ml 2 ml 2 ml
* DNS reagent comprised 10.0 g/l 3, 5 dinitrosalicylic acid, 182.0 g/l Rochele salt
(potassium sodium tartarate), 10.0 g/l sodium hydroxide, 2.0 g/l phenol and 0.5 g/l
sodium bisulphite, made up in distilled water.
The tubes were then vortexed and capped, placed in a boiling water bath for exactly
ten minutes. All samples and standards were boiled at the same time. Tubes taken
from the water bath were cooled to room temperature for approximately 1 h. The
absorbances were measured at 640 nm. Reducing sugar content was determined from
the standard curve with correction made for dilution.
For co-fermentations with glucose/xylose mixture, RS content in the samples was
determined as xylose equivalents using the xylose standard. This was because in a
co-fermentation process, two sugars were consumed at a different rate; hence it was
impossible to give an accurate estimation for the glucose: xylose ratio in each sample.
In this case, the use of xylose standard had two advantages: (1) after all the glucose
was used up, the residual xylose could be accurately measured using xylose standard;
(2) compared to a sugar mixture standard curve with random ratio of two sugars, the
error caused by xylose standard was predictable and consequently could be
minimized.

Chapter 3. Materials and Methods
51
As shown in Figure 3.8, with the same concentration, the xylose standard always
gives higher absorbance readings compared to the glucose standard. In this case,
when a glucose/xylose sugar mixture was expressed as xylose equivalent, the
resulting value would be smaller than the actual sugar concentration. This would
affect the RS results for all the samples in the earlier stage of a co-fermentation,
when there was still glucose in the medium. Nevertheless, the use of xylose standard
still gave an accurate measurement after all the glucose had been completely
consumed. Moreover, it could still reflect the actual trend of sugar uptake, even
though the values were slightly lower. In association with the GO method, which was
used exclusively to assay the glucose concentration, the combination of two methods
enabled a reliable monitor for the sugar uptake trend in the co-fermentation process.
0
0. 1
0. 2
0. 3
0. 4
0. 5
0 200 400 600 800 1000 1200sugar concent r at i on ( mcg/ ml ) )
Abso
rban
ce
xyl ose gl uocse
Figure 3.8: Standard curves of glucose and xylose for reducing sugar assay
3.10.1.2. Glucose oxidase assay
Glucose oxidase assay was used to determine the glucose concentration from the
sugar mixture. The procedure used in this study was a modified method based on
both methods of AOAC Official Method 969.39 (AOAC-International, 2006) and
Glucose Oxidase Method described in the “Methods of Enzymatic Analysis” (Kunst
et al., 1984). The principle of this method is as follows.

Chapter 3. Materials and Methods
52
Glucose oxidase
(1). Glucose + O2 + H2O———————→ gluconic acid + H2O2
Peroxidase
(2). H2O2 + o-Dianisidine·2HCl ————→ orange color
Glucose is oxidized under the catalysis of glucose oxidase, generating H2O2 which
can react with the chromogen o-Dianisidine·2HCl under the catalysis of peroxidase
and result in the formation of orange color. The color intensity is directly
proportional to the amount of H2O2 and therefore directly proportional to the glucose
concentration in the sample. By quantifying the color intensity with a
spectrophotometer, the glucose concentration could be estimated from suitable
glucose standards.
For the assay, reagents were firstly prepared following the quantities below, and
stored at 4oC refrigerator.
Reagents:
(1). Acetate buffer: 0.1 M, pH 5.5. Dissolved 13.608 g sodium acetate in 1 l distilled
H2O, added 2.7 ml acetate acid, adjusted pH using sodium acetate or acetate acid
glacial when necessary.
(2). Peroxidase solution: 7,748 units/l. Dissolved 1.3 mg peroxidase (Sigma P-8375,
Type VI from Horseradish, 298 units/mg) in 50 ml acetate buffer.
(3). Glucose oxidase solution: 60,995 units/l. Dissolved 9.8 mg glucose oxidase
(Sigma G7141, Type X-S from Aspergillus niger, 155,600 units/g) in 25 ml
acetate buffer.
(4). Chromogen solution: 0.5 mmol/l. Dissolved 46.40 mg o-Dianisidine·2HCl
(Sigma D3252) into 250 ml buffer.
Reaction mixture was prepared freshly for every assay by taking 1 ml of Solution (2),
1 ml of Solution (3), 4 ml of Solution (4) and 4 ml of distilled H2O to make up 10 ml.
Glucose standards were prepared at concentration levels of 50, 100, 150, 200 and
250 μg/ml. Samples were diluted 1 in 10, 1 in 50 and 1 in 250 respectively. Tubes
were added with 0.1 ml of samples and standards, and 0.1 ml of distilled H2O for the
blank. The prepared reaction mixture and all tubes containing reaction substrate were

Chapter 3. Materials and Methods
53
incubated separately in a 30oC water bath for 5 min before commencing the assay.
The assay commenced with the addition of 1.0 ml of reaction mixture to each of the
tubes. The addition was processed at 30 sec interval so that each tube could be
incubated for exactly 30 min. The reaction was stopped by the addition of 2 ml
prechilled distilled H2O. The absorbance of each tube was read immediately against
the blank at 525 nm. The glucose concentration of each sample was determined from
the standard curve with correction for dilution.
The method described above was optimized. It is accurate for glucose concentration
up to 60 g/l and sensitive to 0.05 g/l [see the Appendix section for the details of
method optimization].
3.10.1.3. HPLC
HLPC used in this study was a software-based Perkin Elmer system for carbohydrate
assay [Perkin Elmer Ltd, U.K.]. Turbochrom 4 workstation was used for system
control and data integration. The detector was a Series 200 Refractive Index detector
and the column was a Biorad Aminex HPX-87P column [Biorad, U.S.A.]. The
mobile phase was milli-Q water [Milli-RO 12plus, Millipore, Australia] filtered with
0.45 m filter and degassed with Helium. The column temperature was 85oC and the
flow rate was 0.6 ml/min.
3.10.2. Determination of biomass growth
3.10.2.1. Viable cell concentration
The samples were serially diluted up to 10-7
in 5% (w/v) peptone solutions. 0.1 ml
was spread plated onto the appropriate agar medium and incubated for 48 h. Plates
containing 25 250 colonies were used to calculate the amount of viable cells (cfu)
per ml.
Glucose Agar plates were used for Z. mobilis, while Malt Extract Agar plates were
used for P. stipitis. For the co-culture process involving both strains, Glucose Agar
was used. The colonies of the yeast and bacterium can be easily distinguished from
each other after 48 h incubation. As shown in Figure 3.9, P. stipitis colonies were
larger and more opaque, whereas Z. mobilis colonies were smaller with a slightly

Chapter 3. Materials and Methods
54
translucent edge.
This method only worked when the viable cell concentration of P. stipitis and Z.
mobilis in the medium was approximately on a similar level. If the difference in the
cell concentration between two strains was greater than 100 times, e.g. in a
co-culture process of immobilized Z. mobilis and free cells of P. stipitis, the large
amount of yeast colonies would obscure the few colonies of bacteria. Under this
circumstance, the viable cell concentration of Z. mobilis was reported as 1x10⁵
cfu/ml, referring to “undetectable on the plate of 104 dilution”.
Figure 3.9: Glucose Agar plate showing colonies of P. stipitis (big) and Z. mobilis
(small).
3.9.2.2. Dry biomass weight
Dry weight assay is commonly employed to monitor the biomass growth and
calculate kinetic parameters for a fermentation process. To estimate the dry weight
concentration of cells, an aliquot of culture was centrifuged and washed by distilled
water. The obtained cell pellet was dried in a 104oC oven for approximately 24 h till
Chapter 3. Materials and Methods
55
the weight was constant. The dry weight value was determined by measuring the
weight difference of the empty centrifuge tubes and tubes with dry cell pellets in
them.
3.10.3. Determination of ethanol
Ethanol concentration was measured by a gas chromatography (GC) system
[GC-3BT, Shimadzu, Seisakusho Ltd, Japan], except for the co-fermentation
processes carried out in the modified fermentor, with P. stipitis sole culture, and the
fermentation of bagasse hydrolysates. The column was a packed Poropak-Q column,
approximately 176 cm in length by 0.5 mm in diameter. The oven temperature was
165oC and a thermal conductivity detector was used. The carrier gas was Hydrogen.
The internal standard used for this GC system was 2-propanol.
For those co-fermentation processes mentioned above, another GC system with a
flame ionization detector [Hewlett Packard 5890A, Hewlett Packard, U.S.A.] was
used. It consisted of a capillary HP column, approximately 125 cm in length by 0.2
mm in diameter. The injector temperature was 190oC and the oven temperature was
40oC. The carrier gas was Hydrogen with internal standard 1-propanol.
3.11. Calculation of kinetic parameters
Theoretical conversion rates for ethanol yield were as follows: 0.51 g/g from glucose,
0.51 g/g from xylose, and thus 0.51 g/g from sugar mixture [60% of glucose and
40% of xylose].
Kinetic parameters are calculated as follows. The general nomenclature and
definitions of terms below are given in the Nomenclature section.
� Ethanol yield (Yp/s, g/g): highest ethanol concentration (pf, g/l) / sugar
consumed ( s, g/l). Expressed by equation:
)/(0
/ ggss
pY
f
fsp
−= (4)
where the s was determined by the initial sugar concentration (s0, g/l) minus the
residual sugar concentration in the fermentation medium (sf, g/l).

Chapter 3. Materials and Methods
56
� Volumetric ethanol productivity/Overall system co-efficiency (Qp, g/l/h):
highest ethanol concentration (pf, g/l) / time used to achieve (tp, h). Expressed by
equation:
)//( hlgt
pQ
p
fp = (5)
� Specific ethanol productivity (qp, g/g/h): highest ethanol concentration (pf, g/l)
/ average dry cell concentration (xA, g/l) / time used to achieve the highest
ethanol (tp, h). Expressed by equation:
)//(1
hggt
p
xq
p
f
A
p = (6)
where the xA was the average of dry biomass weight up to Time tp.
� Sugar uptake rate (QS, g/l/h): sugar consumed ( s, g/l) / time (tf, h). Expressed
by equation:
)//(0
hlgt
ssQ
f
fs
−= (7)
where the tf was the time when all sugar was used up. In a process where the
sugar utilization was finished at the same time when ethanol reached peak, tf was
equal to tp; in a process where sugar consumption was not complete, tf referred to the
overall fermentation time.

Chapter 4. Free cell culture of Z. mobilis and P. stipitis on sugar medium
57
Chapter 4
Free cell culture of Z. m obilis and
P. st ipit is on sugar m edium
In order to investigate fermentation characteristics of Z. mobilis and P. stipitis and
establish optimum environmental conditions for co-culture experiments, the two
microorganisms were cultured on the corresponding sugar media respectively. Both Z.
mobilis and P. stipitis have been extensively studied for their fermentative capability,
optimum culture conditions, and their effects on other strains in a co-culture process.
There are a number of studies reporting an increased ethanol productivity in an
immobilized culture (Amin and Doelle, 1990; Rebros et al., 2005) or through a cell
recycling process (Parekh et al., 1986; Yu et al., 1987). Both processes caused cell
accumulation and consequently increased the level of viable cells. However, there is
little information directly describing the relationship between the viable cell
concentration and the ethanol production. In a previous study it has been shown that
the ethanol production rate by Z. mobilis increased with an increase in viable cell
concentration (Fu and Peiris, 2008). To confirm this relationship and obtain more
detailed information, experiments investigating the fermentation performance with
different inoculum sizes were carried out for both Z. mobilis and P. stipitis. For P.
stipitis, the effect of oxygenation was also examined.

Chapter 4. Free cell culture of Z. mobilis and P. stipitis on sugar medium
58
4.1. Effect of inoculum size on the performance of Z. mobilis
In this experiment, three time courses culturing Z. mobilis on glucose were carried
out under conditions described in Section 3.7.2. Inoculum sizes of 10%, 50% and
100% were used for each time course respectively. The resulting biomass levels of
the three time courses are shown in Figure 4.1, and the kinetic parameters are
compared in Figure 4.2.
( a)
1. E+06
1. E+07
1. E+08
1. E+09
1. E+10
0 2 4 6 8 10 12 14Ti me ( h)
Viab
le c
ell
conc
entr
atio
n (c
fu/m
l)
10% 50% 100%
( b)
0
0. 5
1
1. 5
2
2. 5
3
0 2 4 6 8 10 12 14Ti me ( h)
Dry
cell
wei
ght
(g/l
)
10% 50% 100%
Figure 4.1: Comparison of the biomass concentration in time courses with
different inoculum sizes for Z. mobilis: (a) viable cell concentration,
(b) dry cell weight.

Chapter 4. Free cell culture of Z. mobilis and P. stipitis on sugar medium
59
As shown in Figure 4.1, the increase of inoculum size directly increased the level of
biomass. Results for viable cell concentration and dry weight showed a similar trend.
The highest biomass level was achieved in the time course with the largest inoculum
size [100%]. The initial viable cell level [1.2x10⁸ cfu/ml] in time course with 100%
inoculum size was approximately 2 fold and 10 fold higher than the one with 50%
[6.1x10⁷ cfu/ml] and 10% [1.7x10
7 cfu/ml] respectively, which was consistent with
the increase in the inoculum size. In all three time courses, the biomass concentration
showed a steady increase and peaked when all the glucose was used up [2.5 h for
time course with 100% inoculum size, 4 h for the one with 50% and 8 h for the one
with 10%; see Figure 4.2]. The peak values of viable cell concentration in all three
time courses were at a similar level [~1.5x10⁹ cfu/ml]; however, highest dry weight
value was achieved in the time course with largest inoculum size 100% [2.95 g/l].
Because of the lower levels of initial biomass amount, the peak dry weight values in
both time courses with smaller inoculum size were lower. The lowest dry weight
peak was in the time course with lowest inoculum size, 10% [1.63 g/l compared to
2.54 g/l in the time course with 50% inoculum size].
8
2. 93 3. 26
0. 5
4
6. 39
4
0. 51
2. 5
10. 54
5. 02
0. 51
0
2
4
6
8
10
12
Fer ment at i ont i me ( h)
Syst em co-ef f i ci ency
( g/ l / h)
Speci f i cpr oduct i vi t y
( g/ g/ h)
Et hanol yi el d( g/ g)
10% 50% 100%
Figure 4.2: Comparison of kinetic parameters of time courses with different
inoculum sizes of Z. mobilis.
In association with the different levels of biomass concentration achieved in three

Chapter 4. Free cell culture of Z. mobilis and P. stipitis on sugar medium
60
time courses, the kinetic parameters also showed some significant differences. In all
three time courses, ethanol concentration reached a peak when all the glucose was
completely utilized. The ethanol peak time [tf] decreased significantly from 8 h to 4 h
to 2.5 h along with an increase in the inoculum size from 10% to 50% to 100 %. The
decrease on the fermentation time led to a corresponding increase in the system
co-efficiency [Qp], from 2.93 g/l/h to 6.39 g/l/h to10.54 g/l/h. This was
approximately a linear correlation to the inoculum size. When the amount of
inoculated cells increased by 40-50% of the medium volume [4~5 fold increase
based on the traditional 10% inoculum size], the system co-efficiency doubled, and
the fermentation time halved. Both values had the potential to be further improved if
a higher inoculum size was provided.
Apart from the system co-efficiency [Qp], an increase was also observed in the
specific ethanol productivity [qp], which measures the ethanol production capability
based on biomass. With the increase in the inoculum size from 10% to 50% to 100%,
the value increased from 3.26 g/g/l to 4.00 g/g/l to 5.02 g/g/l. Ethanol yields in all
three time courses were similar, around 0.50-0.51 g/g, which was more than 98% of
the theoretical yield.
In summary, the increase in the viable cell concentration in the fermentation medium
significantly contributed to the improvement of the overall performance of Z. mobilis
on the ethanol production from glucose.
4.2. Optimization of ethanol production by P. stipitis from xylose
As discussed in Section 2.3, although a large number of studies have been conducted
on the xylose fermentation, the reported optimum conditions were sometimes
inconsistent. Hence there was a need to experimentally determine and establish
optimal conditions of P. stipitis culture on xylose. Firstly, the effect of medium
composition was investigated; then experiments were carried out to decide the
optimum oxygenation level when different inoculum sizes were employed. Similar to
the glucose fermentation by Z. mobilis, three levels of inoculum size, 10%, 50% and
100% were investigated.

Chapter 4. Free cell culture of Z. mobilis and P. stipitis on sugar medium
61
4.2.1. Effect of medium composition on the performance of P. stipitis
This experiment was carried out in shake flasks, with conditions as described in
Section 3.7.1. All together three different medium compositions were investigated;
the details are shown in Table 4.1.
Table 4.1: Composition of the three media for P. stipitis culture on xylose
Compositions Sources
Medium 1 50.0 g/l xylose, 10.0 g/l yeast extract, 1.0 g/l MgCl2,
1.0 g/l (NH4)2SO4, 1.0 g/l KH2PO4. (Yu and Zhang, 2002)
Medium 2 50.0 g/l xylose, 4.0 g/l yeast extract, 3.6 g/l peptone,
1.0 g/l MgSO4, 3.0 g/l (NH4)2SO4, 2.0 g/l KH2PO4. (Sanchez et al., 2004)
Medium 3 50.0 g/l xylose, 3.0 g/l yeast extract, 5.0 g/l peptone,
3.0 g/l malt extract. (Parekh et al., 1986)
For each medium, three culture flasks were prepared, with 50 ml medium in 250 ml
conical flasks. The experiment commenced by inoculating the first flask of each
medium with a single colony from P. stipitis culture maintenance plate respectively,
and then serially subcultured to the other two flasks after 24 h incubation. Samples
were taken at 24 h for the first two subculture flasks for viable cell assay, while for
the third subculture flask, samples were taken at both 24 h and 48 h and assayed for
sugar consumption and ethanol production as well.
Figure 4.3 presents the result for biomass growth on the three media. P. stipitis
showed best growth in Medium 3 during all three subcultures. However, after two
subculture processes and 48 h incubation, the difference in the values of viable cell
concentration between the three media markedly decreased in the third subculture.
The vigorous growth of P. stipitis on Medium 3 was considered to be a result of the
abundant nutrition supply. As shown in Table 4.1, Medium 3 was more nutritive
compared to the other two, containing higher levels of rich components such as yeast
extract, peptone and malt extract.

Chapter 4. Free cell culture of Z. mobilis and P. stipitis on sugar medium
62
1. E+07
1. E+08
1. E+09
1stsubcul t ur e
2ndsubcul t ur e
24 h 48 h
3r d subcul t ur e
Viab
le c
ell
conc
entr
atio
n(c
fu/m
l)
Medi um 1 Medi um 2 Medi um 3
Figure 4.3: Comparison of biomass growth of P. stipitis on three media during
three subcultures.
The sugar consumption and ethanol production of the third subculture are shown in
Figure 4.4. Again Medium 3 proved to be the best for the conversion of xylose to
ethanol by P. stipitis. Resulting from the high level of viable cell concentration, the
xylose in Medium 3 was consumed much more rapidly compared to the other two. It
was the only medium that used up all the xylose in 48 h. For the ethanol production,
at 24 h the ethanol concentration in Medium 3 reached a level of 11.89 g/l, whereas
for the other two media the ethanol concentration remained too low to be detected by
GC. Nevertheless, both Medium 1 and Medium 2 showed an increased sugar
utilizing rate after 24 h, leading to a rapid accumulation of ethanol.
In summary, Medium 3 showed superior performance for both biomass growth and
ethanol production when P. stipitis was cultured on xylose. This could again be
attributed to the abundant rich components in Medium 3. However, the high cost
associated with these rich components makes it economically unviable to be used on
a large scale industrial production. In order to decrease the dependence of P. stipitis
on rich media components, further study was undertaken with Medium 1, which gave
better results on ethanol production compared to Medium 2. Medium 1 is referred as
the Xylose Medium in Table 3.2 [see Section 3.4].

Chapter 4. Free cell culture of Z. mobilis and P. stipitis on sugar medium
63
( a)
0
10
20
30
40
50
60
0 20 40 60Ti me ( h)
Redu
cing
Sug
ars
(g/l
)
Medi um 1 Medi um 2 Medi um 3
( b)
0
3
6
9
12
15
18
0 20 40 60Ti me ( h)
Etha
nol
(g/l
)
Medi um 1 Medi um 2 Medi um 3
Figure 4.4: Comparison of sugar consumption and ethanol production of P.
stipitis on three media after three subcultures: (a) reducing sugar, (b)
ethanol.
4.2.2. Time courses with 10% inoculum size
According to reported literature, oxygenation is of great importance for the
conversion of xylose to ethanol [see section 2.3.2]. Therefore, the effect of
oxygenation was investigated on three inoculum sizes respectively. The
fermentations were carried out in a 1 l bioreactor, with conditions as described in
Section 3.7.3. For the inoculum size of 10%, three time courses were carried out, at
air flow levels of 0, 20 and 100 cm3/min respectively, corresponding to an OTR of 0,
66.96 and 167.41 mmol/l/h. The kinetic parameters of three time courses are shown

Chapter 4. Free cell culture of Z. mobilis and P. stipitis on sugar medium
64
in Table 4.2, and the trends in biomass growth are shown in Figure 4.5.
Table 4.2: Kinetic parameters for xylose fermentation with an inoculum size of
10%
Air flow level (cm3/min)
Kinetic parameters 0 20 100
Fermentation time (h) 86 140 144
Time when ethanol peaked (h) N/A 130 120
Sugar consumption (%) * 17% 92% 100%
Ethanol yield (g/g) 0 0.43 0.34
System co-efficiency (g/l/h) 0 0.142 0.125
Specific ethanol productivity (g/g/h) 0 0.074 0.042
* Sugar consumption (%) refers to the percentage of the consumed sugar out of the
total initial sugar in the medium.
1. E+07
1. E+08
1. E+09
0 19 34 48 70 84 96 116 131
Ti me ( h)
Viab
le c
ell
conc
entr
atio
n(c
fu/m
l)
0 ml / mi n 20 ml / mi n 100 ml / mi n
Figure 4.5: Viable cell concentration for xylose fermentations with an inoculum
size of 10%
The fermentation process carried out without an air flow, which provided the yeast a
semi-anaerobic condition, showed a considerably low rate of sugar uptake [only 17%
of xylose was consumed in 86 h]. This was associated with a low level of biomass

Chapter 4. Free cell culture of Z. mobilis and P. stipitis on sugar medium
65
concentration in the fermentation medium [~107 cfu/ml]; no significant cell growth
was observed during the whole process. The fermentation with an air flow level of 20
cm3/min gave the highest ethanol yield of 0.43 g/g; however, up to 8% of sugar was
un-utilized by the end of the fermentation at 140 h. Ethanol peaked at 130 h with a
concentration of 18.52 g/l and decreased slightly to 18.19 g/l at 140 h, indicating
possible ethanol re-assimilation even when there was still xylose available in the
medium. When the air flow increased to 100 cm3/min, all xylose was fully utilized at
140 h, but ethanol peaked at 120 h. The decreased ethanol concentration after the
peak again demonstrated possible ethanol re-assimilation. The peak ethanol
concentration in this time course was 14.98 g/l, giving an ethanol yield of 0.34 g/g,
20% lower compared to the value achieved with 20 cm3/min aeration [0.43 g/g].
Therefore, for the inoculum size of 10%, an air flow of 20 cm3/min gave the best
fermentation performance, although the overall system co-efficiency remained low at
0.142 g/l/h.
4.2.3. Time courses with 50% inoculum size
When the inoculum size was increased to 50%, the increased cell density affected the
oxygenation level in the medium; consequently, the optimum OTR value would be
different to that using a 10% inoculum size. In this experiment, four aeration levels
of 20, 50, 80 and 100 cm3/min were investigated respectively, which was equivalent
to an OTR of 66.96, 167.41, 267.86 and 334.82 mmol/l/h. Kinetic parameters and the
biomass growth trends are shown in Table 4.3 and Figure 4.6 respectively.
As a result of the increased inoculum size, in all four time courses the xylose was
used up within 50 h. The fermentation time [tp] decreased from 48 h to 28 h when the
air flow increased from 20 to 100 cm3/min, and the system co-efficiency [Qp]
increased from 0.533 g/l/h to 0.734 g/l/h accordingly. As expected, with the increase
in the inoculum size from 10% to 50%, the optimum air flow also increased in order
to meet the oxygenation requirement for the increased cell number [20 cm3/min for
inoculum size of 10% and 100 cm3/min for the size 50%]. The highest system
co-efficiency of 0.734 g/l/h achieved with 100 cm3/min was 5.2 fold as high as the
best achieved using the 10% inoculum size [0.142 g/l/h]. The highest ethanol yield
[Yp/s] and the highest specific ethanol productivity [qp], however, were attained in the
time course with slightly lower air flow level at 80 cm3/min [0.45 g/g and of 0.247

Chapter 4. Free cell culture of Z. mobilis and P. stipitis on sugar medium
66
g/g/h respectively]. It is possible that the increased aeration at 100 cm3/min
accelerated the ethanol re-assimilation and led to a slightly reduced ethanol yield
[0.44 g/g]. A similar observation was made for the time courses with an inoculum
size of 10%. Biomass concentration in all four time courses was at a similar level.
There was a slight drop of viable cell concentration at the later stage of all processes,
which could result from the foaming caused by the air flow.
Table 4.3: Kinetic parameters for xylose fermentation with an inoculum size of
50%
Air flow level (cm3/min)
Kinetic parameters 20 50 80 100
Ethanol peak time (h) 48 36 32 28
Sugar consumption (%) 100% 100% 100% 100%
Ethanol yield (g/g) 0.41 0.43 0.45 0.44
System co-efficiency (g/l/h) 0.533 0.560 0.665 0.734
Specific ethanol productivity (g/g/h) 0.194 0.176 0.247 0.218
1. E+07
1. E+08
1. E+09
0 10 20 30 40 50 60
Ti me ( h)
Viab
le c
ell
conc
entr
atio
n(c
fu/m
l)
20 ml / mi n 50 ml / mi n 80 ml / mi n 100 ml / mi n
Figure 4.6: Viable cell concentration for xylose fermentations with an inoculum
size of 50%

Chapter 4. Free cell culture of Z. mobilis and P. stipitis on sugar medium
67
4.2.4. Time courses with 100% inoculum size
When the inoculum size was increased to 100%, foaming became a major problem
affecting the overall fermentation performance. Amongst the four air flow levels
tested in this experiment, viz. 0, 50, 100 and 150 cm3/min, serious foaming occurred
on both levels of 100 and 150 cm3/min. As an illustration, the biomass results of the
four time courses are shown in Figure 4.7.
( a)
1. E+07
1. E+08
1. E+09
1. E+10
0 20 40 60 80Ti me ( h)
Viab
le c
ell
conc
entr
atio
n(c
fu/m
l)
0 ml / mi n 50 ml / mi n 100 ml / mi n 150 ml / mi n
( b)
0
2
4
6
8
10
0 20 40 60 80Ti me ( h)
Dry
cell
wei
ght
(g/l
)
0 ml / mi n 50 ml / mi n 100 ml / mi n 150 ml / mi n
Figure 4.7: Biomass concentration for xylose fermentations with an inoculum
size of 100%: (a) viable cell concentration, (b) dry cell weight.
As shown in Figure 4.7, though the same inoculum level was employed for these

Chapter 4. Free cell culture of Z. mobilis and P. stipitis on sugar medium
68
four time courses, the biomass concentration showed a big variation. Time course
with 50 cm3/min gave the highest cell concentration overall, although a gradual
decrease of dry biomass weight was observed after 12 h. Under semi-anaerobic
conditions without airflow, the biomass concentration showed a slight increase
during the 66 h fermentation time. By contrast, in the time courses with higher
aeration levels, viz. 100 and 150 cm3/min, the cell concentration showed a dramatic
decrease. The viable cells in the medium dropped to approximately 1/5 of the peak
value, whereas the dry weight of cells started with a level around 4.5 g/l and fell to
0.4~0.5 g/l at the lowest. In both processes, the foaming caused by the high levels of
cell concentration and aeration could not be suppressed by the manual addition of
antifoam. The foam forced the cells out of the medium and made them stick to the
wall of the vessel, consequently causing a significant loss of viable cells. As a result,
the high level of initial cell concentration was maintained throughout the
fermentation only in the two time courses with lower aeration levels.
Table 4.4: Kinetic parameters for xylose fermentation with an inoculum size of
100%
Air flow level (cm3/min)
Kinetic parameters 0 50 100 150
Ethanol peak time (h) 66 28 49 41
Sugar consumption (%) 93% 100% 100% 79%
Ethanol yield (g/g) 0.42 0.45 0.37 0.30
System co-efficiency (g/l/h) 0.270 0.755 0.359 0.268
Specific ethanol productivity (g/g/h) 0.043 0.122 0.156 0.157
Table 4.4 summarizes the kinetic parameters for these four time courses. Resulting
from the erratic biomass concentrations, the fermentation performance also showed
significant variations. Both the highest system co-efficiency of 0.755 g/l/h and the
highest ethanol yield of 0.45 g/g were achieved in the time course with an air flow
level of 50 cm3/min. For the time course without aeration, despite the high level of
yeast concentration, the xylose failed to be used up within 66 h [7% sugar
un-utilized]. In other two time courses showing significant cell loss, the system

Chapter 4. Free cell culture of Z. mobilis and P. stipitis on sugar medium
69
performance was also poor. A sugar residue up to 21% was observed for the one with
an air flow of 150 cm3/min. Though the time course with an air flow of 100 cm
3/min
completely utilized all the xylose in 49 h, the system co-efficiency was only 1/2 of
that achieved with air flow of 50 cm3/min [0.359 compared to 0.755 g/l/h].
In summary, it was difficult to control the fermentation conditions at an optimum
level for the P. stipitis culture with an inoculum size of 100%. The foaming that
occurred under high aeration levels significantly reduced the biomass concentration
and resulted in decreased fermentation performance. The time course without
aeration failed to achieve high ethanol productivity either. It was thus confirmed that
oxygen supply was essential for an efficient xylose fermentation.
4.2.5. Comparison of best performance on each inoculum level
In order to establish the correlation between the amount of biomass and ethanol
production for P. stipitis culture on xylose, the time courses with best results from
each inoculum level are compared and discussed. The three selected time courses are:
inoculum size 10% with air flow level of 20 cm3/min, inoculum size 50% with air
flow level of 100 cm3/min, and inoculum size 100% with air flow level of 50
cm3/min. The ethanol peak time [tf] and average dry cell weight [xA] of these time
courses are shown in Table 4.5, and the kinetic parameters are presented in Figure
4.8.
As shown in Table 4.5, an increase in the inoculum size from 10% to 50% resulted in
an increase in the biomass from an average of 1.94 g/l to 3.36 g/l. The fermentation
time decreased from 130 h to 28 h, and the system co-efficiency increased from
0.142 g/l/h to 0.734 g/l/h, which is the highest reported value for free cells of P.
stipitis in batch culture. In the fermentation with an inoculum size of 100%, the
average dry weight further increased to 6.21 g/l; however, the system co-efficiency
remained at a similar level to the one with 50% inoculum size [0.755 g/l/h compared
to 0.734 g /l/h]. Both fermentations with an increased inoculum size needed 28 h to
completely utilize the sugar, but the specific ethanol productivity [qp] with 100%
inoculum level was only half of that of the 50% inoculum level [0.122 g/g/h
compared to 0.218 g/g/h].

Chapter 4. Free cell culture of Z. mobilis and P. stipitis on sugar medium
70
Table 4.5: Fermentations with best results from three inoculum levels for P.
stipitis culture on xylose
Inoculum size Air flow
(cm3/min)
Ethanol peak
time (h)
Average dry cell
weight (g/l)
10% 20 130 1.94
50% 100 28 3.36 Fermentations
with best results 100% 50 28 6.21
0. 1420. 074
0. 43
0. 734
0. 218
0. 44
0. 755
0. 122
0. 45
0
0. 1
0. 2
0. 3
0. 4
0. 5
0. 6
0. 7
0. 8
0. 9
Syst em co-ef f i ci ency ( g/ l / h)
Speci f i cpr oduct i vi t y
( g/ g/ h)
Et hanol yi el d ( g/ g)
10% i nocul um si ze 50% i nocul um si ze 100% i nocul um si ze
Figure 4.8: Comparison of kinetic parameters of fermentations with best results
from three inoculum levels for P. stipitis culture.
The reason for the decreased specific ethanol productivity was considered to be the
oxygenation level. It can seen in Table 4.5 that, although the amount of biomass in
the time course with the 100% inoculum size was approximately twice as high as that
in the time course with 50% [6.21 g/l compared to 3.36 g/l], the air flow level was
only half [50 cm3/min compared to 100 cm
3/min]. This mismatch of the cell
concentration and air flow level could lead to insufficient redox activity and therefore
limit the efficiency of the xylose metabolism by P. stipitis. It was thus expected that

Chapter 4. Free cell culture of Z. mobilis and P. stipitis on sugar medium
71
with an increase in the air flow level, the system co-efficiency of time course with
100% inoculum size could be further improved. Due to the severe foaming it was not
possible to carry out this experiment in a 1 l bioreactor. Therefore, a shake flask
experiment was resorted to.
4.2.6. Correlation between the biomass concentration and ethanol production
for P. stipitis
This experiment was carried out using shake flasks under conditions described in
Section 3.7.1. Six flasks of xylose medium were prepared, each containing 100 ml of
Xylose Medium. Three were cultured on an orbital shaker with a shaking speed of
100 rpm, whereas the other three were cultured at 200 rpm to test the effect of
oxygenation. For each oxygenation level, three flasks were inoculated with cells
from 50 ml, 100 ml and 200 ml of a 48 h P. stipitis culture respectively, giving an
inoculum size of 50%, 100% and 200% for each flask. Inoculation was carried out by
centrifuging to harvest the cells and then re-suspending them with the fermentation
medium. The results of the six flasks are shown in Figure 4.9.
As shown in Figure 4.9 (a), the biomass concentration of P. stipitis on xylose
increased with the increase in the inoculum size as well as the aeration level. Since
the first sample was taken at 12 h, the initial biomass concentration was not
determined. However, flasks with same inoculum size were expected to have the
same amount of cells initially. During 36 h culture, for the inoculum size of 50% and
100%, both flasks cultured under 200 rpm gave higher biomass concentrations
compared to those under 100 rpm. For flasks with 200% inoculum size, no more cell
accumulation beyond 10.5 g/l was observed, which could be a limitation for the P.
stipitis cell growth on the xylose medium in the shake flask environment.
Nevertheless, at 12 h before cell concentration started to decrease, the biomass in the
flask at 200 rpm was on a higher level than that at 100 rpm. It can be thus said that at
a higher air flow level, the biomass growth improved.

Chapter 4. Free cell culture of Z. mobilis and P. stipitis on sugar medium
72
0
2
4
6
8
10
12
Dry
cell
wei
ght
(g/l
)
50% 100% 200% 50% 100% 200% 50% 100% 200%
12 h 24 h 36 h
( a)
100 r pm 200 r pm
0
5
10
15
20
25
30
35
40
Redu
cing
sug
ar (
g/l)
50% 100% 200% 50% 100% 200% 50% 100% 200%
12 h 24 h 36 h
( b)
100 r pm 200 r pm
( c)
9. 37
6. 59
14. 0412. 38 12. 02
15. 2316. 43
13. 12
17. 48
0
5
10
15
20
25
36 h 24 h 36 h
100 r pm 200 r pm
Etha
nol
prod
ucti
on (
g/l)
50% 100% 200%
Figure 4.9: Results of shake flask experiments of P. stipitis on Xylose Medium: (a)
dry cell weight, (b) reducing sugar, (c) ethanol production.
Chapter 4. Free cell culture of Z. mobilis and P. stipitis on sugar medium
73
In accordance with the trend for biomass, in Figure 4.9 (b), it can be seen that flasks
with higher biomass concentration showed faster sugar utilization. As for the effect
of oxygenation, all three flasks cultured under 200 rpm gave lower level of residual
xylose concentration at 36 h in comparison with those cultured under 100 rpm with
the same inoculum size. On the other hand, when aeration level stayed the same,
higher sugar utilization was always achieved in the flasks with higher biomass
concentration [200%>100%>50%]. Furthermore, an interesting observation was that,
in the flask with less biomass but higher aeration level [50% inoculum with 200 rpm],
the sugar was consumed at a higher efficiency compared to the flask with higher
biomass concentration but lower aeration level [100% inoculum with 100 rpm]; the
residual xylose concentration of these two flasks at 36 h was 9.68 g/l and 12.86 g/l
respectively. This further demonstrated that both aeration level and the biomass
concentration significantly affected the xylose fermentation process, though the
effect of oxygenation appeared to be more crucial.
Results for ethanol production are shown in Figure 4.9 (c). At 100 rpm, the ethanol
production increased with the increase in the inoculum size; three inoculum sizes of
50%, 100% and 200% respectively produced ethanol of 9.37 g/l, 12.38 g/l and 16.43
g/l at 36 h. However, these values were lower than those obtained at 200 rpm [14.04
g/l, 15.23 g/l and 17.48 g/l respectively]. The three flasks cultured at 200 rpm
showed an increase in ethanol concentration from 24 h to 36 h, and the higher
ethanol concentration was always obtained with higher levels of biomass.
This experiment proved that both increase in the biomass concentration and
oxygenation level benefited the ethanol production by P. stipitis on xylose. The
significance of this phenomenon will be discussed in later sections.
4.3. Discussion
4.3.1. The correlation between the amount of biomass and ethanol production
for Z. mobilis culture on glucose
Previous literature has reported a range of values for the volumetric ethanol
productivity [system co-efficiency] of Z. mobilis culture on glucose. For free cell

Chapter 4. Free cell culture of Z. mobilis and P. stipitis on sugar medium
74
culture, values of 1.19 g/l/h [23.9 g/l of ethanol in 20 h] and 4.33 g/l/h [36 g/l of
ethanol in 9 h] have been reported from 50 g/l glucose medium (Laplace et al., 1991b)
and 80 g/l of glucose in the starch hydrolysate medium (Davis et al., 2006)
respectively. For immobilized Z. mobilis culture, values ranging from 2.44 g/l/h [39
g/l of ethanol in 16 h] (Kesava et al., 1996) to 43.6 g/l/h (Rebros et al., 2005) have
been reported. Although the system co-efficiency is definitely affected by the
medium environment and the initial sugar level, these two factors are insufficient to
account for such a wide variation. It is also observed that a high system co-efficiency
[> 30 g/l/h] is usually associated with a high cell concentration (Amin and Doelle,
1990; Rebros et al., 2005). In a previous study by us, ethanol production was
suggested to be closely related to the viable cell concentration in the medium (Fu and
Peiris, 2008). From all these trends an inference could be made that the ethanol
production of Z. mobilis on glucose is directly proportional to the total amount of
biomass in the medium.
The findings in this study support the above stated deduction. Figure 4.10 presents
the relationship of fermentation time [tf] and system co-efficiency [Qp] to the average
biomass concentration [xA] in three time courses with different inoculum sizes.
Associated with an increase in biomass from 0.899 to 1.597 to 2.099 g/l, the
fermentation time significantly reduced from 8 h to 4 h to 2.5 h, resulting in a
corresponding increase in the system co-efficiency.
0
2
4
6
8
10
12
0 0. 5 1 1. 5 2 2. 5
Aver age dr y wei ght ( g/ l )
Ferm
enta
tion
tim
e (h
) &
syst
em c
o-ef
fici
ency
(g/l
/h)
Fer ment at i on t i me ( h) Syst em co- ef f i ci ency ( g/ l / h)
Figure 4.10: The relationship of fermentation time and volumetric productivity
to biomass concentration for Z. mobilis culture on glucose

Chapter 4. Free cell culture of Z. mobilis and P. stipitis on sugar medium
75
It has been pointed out by a number of researchers that a sufficient level of biomass
in the medium is a prerequisite for an efficient fermentation process. Underwood et
al. (2004) stated that limited cell growth directly resulted in a low system
co-efficiency for the ethanol production process. The use of a large inoculum is a
common method employed by the dairy industry to ensure a sufficient biomass level
for the dairy fermentation (Montville and Matthews, 2008). In contrast to the specific
ethanol productivity [qp] which represents the ethanol production rate based on
biomass, system co-efficiency [Qp] represents the ethanol production rate based on
the substrate. Assuming that cells in the medium do not assimilate the substrate for
its own growth, but only convert all of the substrate [glucose] to ethanol through
enzymatic reactions in metabolism, the whole process of the conversion of glucose to
ethanol can be treated as a large, complicated reaction. The overall reaction can be
shown by Formula (1) in Section 2.2.1. Ignoring the intermediate reactions, each cell
of Z. mobilis could be treated as a reaction unit, a biocatalyst to carry out the reaction
from glucose to ethanol. Each cell has a certain production efficiency, i.e. a single
cell can only process a certain amount of substrate within a certain time.
Consequently, with more cells in the medium, more such reactions will be
simultaneously carried out, resulting in an increase of the overall ethanol production
rate.
The concept of “whole cell biocatalyst” has been widely accepted in the field of
bioenergy (Aristidou and Penttila, 2000; Fujita et al., 2004; Kim et al., 2007).
Microorganisms involved in the biotransformation process, either saccharification or
fermentation, are considered as catalysts, which means that in an ideal state, the
microorganisms should not participate in the reactions and not utilize the substrate
for its own growth, but only transform the substrate into the desirable products. Z.
mobilis thus has the quality of an ideal biocatalyst for ethanol production. It converts
the substrate to product efficiently and consumes negligible amount of glucose for its
own growth [the overall ethanol yield was more than 98% of the theoretical]. At
present no study has been reported for tracing the substance transfer during the cell
division of Z. mobilis. However, Kalnenieks (2006) has suggested that the amount of
ATP produced through the ED pathway far exceeds the requirement of the
cell-biomass synthesis of the bacterium. It is claimed that there are futile extraneous

Chapter 4. Free cell culture of Z. mobilis and P. stipitis on sugar medium
76
metabolic reactions consuming ATP, resulting in the high requirement of ATP
production by Z. mobilis. An inference could thus be made that the biomass synthesis
needed by cell growth of Z. mobilis is greatly dependent on the ATP produced during
the ED pathway; there is little need for consumption of the carbon atoms from the
glucose substrate, especially in a process with a large inoculum size which gives less
cell growth. In other words, it could be expected that all glucose is theoretically used
for ethanol production under optimal conditions.
Therefore, it can be proposed that: “in a given volume of medium (/l), the amount of
ethanol produced (g) within a given time (/h) is only related to the total amount of
biomass (cells) in the medium under optimal conditions”. In other words, “under
optimal conditions, the system co-efficiency [Qp, g/l/h] is only related to the viable
cell concentration [xC, cells/l] in the medium”. Conceptually, the amount of ethanol
produced [Pyie, g] within a given time period [t1 to t2] equals the integral of the
ethanol produced by each cell within this time period; this could be expressed by a
formula as follows:
)(2
1
gdeNPt
tyie ∫ ×= (8)
where N represents the biomass – number of viable cells in the medium (cells), and
de is defined as cell instantaneous ethanol production rate (g/h/cells). Consequently:
))(( 12 gttdeNP yie −××= (8.1)
When the medium volume [v, l] is known, both Pyie and N can be converted to their
corresponding concentration in the medium:
)/( lgv
Pp
yief = ; )/( lcells
v
NxC =
where pf represents the final ethanol concentration, and xC represents the viable cell
concentration. In this case, Formula (8.1) can be expressed as:
)/)(( 12 lgttdexp Cf −××= (8.2)
)//(12
hlgdexttp
Cf ×=
− (8.3)
As shown by Formula (5) in Section 3.11, the system co-efficiency [Qp] can be
expressed as:
Chapter 4. Free cell culture of Z. mobilis and P. stipitis on sugar medium
77
)//(12
hlgttp
t
pQ
f
p
fp
−== (5.1)
Integrating Formulae (8.2) and (5.1):
)//( hlgdev
NdexQ Cp ×=×= (9)
Therefore, under optimal conditions, when the value of de stays the same, the overall
system co-efficiency [Qp] is only determined by the viable cell concentration [xC].
4.3.2. The correlation between the amount of biomass and ethanol production
for P. stipitis culture on xylose
Irrespective of strains and substrates, an ethanol production process could be
described by the three formulae in general, viz. Formulae (5), (8) and (9). For ethanol
production from xylose by P. stipitis, wherever a high system co-efficiency has been
reported in literature, a high biomass concentration was always associated. This was
achieved by either the recycling of cells (Parekh et al., 1986; Yu et al., 1987), or the
utilization of a large inoculum size (Nigam, 2001a; b; Agbogbo et al., 2007). In
contrast, when low cell concentrations were observed, the system co-efficiency
remained low (Sanchez et al., 2002; Sanchez et al., 2004; Agbogbo et al., 2006).
A similar trend was observed in this study. In the experiment testing the effect of
medium composition [see Section 4.2.1], the efficient conversion of xylose to ethanol
on Medium 3 was associated with the highest biomass concentration among three
tested media. For Medium 1 and Medium 2, the ethanol production rate between 24 h
and 48 h also showed a significant increase in comparison with that between 12 h
and 24 h, resulting from the increased number of cells due to the multiplication of the
yeast.
When three levels of inoculum size were used for the xylose fermentation [see
Section 4.2.5], the increase in the average biomass concentration [xA] from 1.94 g/l to
3.36 g/l resulted in a 5.2 fold increase in the system co-efficiency [0.142 compared to
0.755 g/l/h]. This relationship was further demonstrated by the shake flask
experiments with different inoculum sizes under two oxygenation levels [see Section
4.2.6]. On each level of oxygenation, higher cell concentrations always gave more
Chapter 4. Free cell culture of Z. mobilis and P. stipitis on sugar medium
78
efficient ethanol production.
All of the above results support the viewpoint that the system co-efficiency [Qp] is
directly proportional to the viable cell concentration in the medium [xC] for P. stipitis
culture on xylose. The only exception occurred in the fermentation with the inoculum
size of 100% [see Section 4.2.4]. Amongst the four time courses carried out, the best
one was obtained under an air flow level of 50 cm3/min, giving a system
co-efficiency of 0.755 g/l/h, which was almost at a similar level to that achieved with
the inoculum size of 50% [0.734 g/l/h]. In order to explain this discrepancy and
further clarify the relationship between viable cell concentration and system
co-efficiency, the effect of oxygenation needs to be considered.
4.3.3. The role of oxygenation in the xylose fermentation
As discussed in Section 2.3.2, oxygenation is considered to be one of the most
crucial factors affecting the efficiency of ethanol production from xylose. Overly
high oxygenation levels help ethanol re-assimilation and thus decrease the ethanol
yield (Passoth et al., 2003; Gorgens et al., 2005). Overly low oxygenation levels
inhibit the cell growth and also result in low efficiency of ethanol production (du
Preez, 1994; Fiaux et al., 2003; Agbogbo and Coward-Kelly, 2008). The latter trend
was confirmed by the two time courses carried out under semi-anaerobic conditions
in this study: one with an inoculum size of 10%, and the other one with an inoculum
size of 100% [see Sections 4.2.2 and 4.2.4 respectively]. In the first time course, the
lack of oxygenation and the low cell concentration led to an extremely low sugar
consumption rate; in the second instance, though high cell concentration was
maintained through the whole process [xA: 6.28 g/l], the sugars failed to be utilized
within 66 h of fermentation.
The reduced efficiency of ethanol production was further proved by the shake flask
experiment in Section 4.2.6. In all three flasks with lower aeration level of 100 rpm,
the ethanol production was considerably less compared to the corresponding flasks
cultured at 200 rpm [9.37 compared to 14.04 g/l, 12.38 g/l compared to 15.23 g/l and
16.43 g/l compared to 17.48 g/l]. It can be thus deduced that when the actual
oxygenation level was below the optimum, a further reduction of oxygenation level
led to a decreased system co-efficiency.

Chapter 4. Free cell culture of Z. mobilis and P. stipitis on sugar medium
79
Based on this deduction, the system co-efficiency achieved in the time course with an
inoculum size of 100% can be explained. The air flow level used in this time course
was 50 cm3/min, only half of the level used for the time course with 50% inoculum
size [air flow 100 cm3/min]. An increased biomass concentration accompanied with a
reduced air flow resulted in the insufficient oxygenation for each cell, and the overall
ethanol production efficiency decreased as a consequence.
Relating this trend to Formula (9),
)//( hlgdexQ Cp ×= (9)
obviously the oxygenation level affects the overall system co-efficiency [Qp] by
altering the cell instantaneous ethanol production rate [de]. Consequently, the
statement proposed for the glucose fermentation by Z. mobilis, which states that
“under optimal conditions, the system co-efficiency [Qp, g/l/h] is only related to the
viable cell concentration [xC, cells/l] in the medium”, could be further extended as
follows: “in an ethanol production process, when the value of de is constant, system
co-efficiency [Qp] is only related to the viable cell concentration [xC] in the medium;
likewise, when viable cell concentration [xC] is constant, system co-efficiency [Qp] is
only related to the value of de.” Therefore, when the viable cell concentration in the
medium remains constant, the optimization of oxygenation level could always
improve the overall system co-efficiency. The results of the shake flask experiment in
Section 4.2.6 support this statement.
Apart from the effect of decreasing the fermentation efficiency when its level is
overly low, oxygenation also affects the ethanol production by promoting the ethanol
re-assimilation when it is overly high. The increase of oxygenation enables the
microorganisms to further oxidize the produced ethanol, thus causing the reduction
of ethanol yield. In this study, this was demonstrated by several fermentation time
courses. Firstly, at the inoculum level of 10%, the time course with 100 cm3/min air
flow gave an ethanol yield 20% lower than the one with 20 cm3/min [0.34 g/g
compared to 0.43 g/g]. Secondly, at the inoculum level of 50%, the ethanol yield in
the time course with 80 cm3/min [0.45 g/g] was slightly higher than that with 100
cm3/min which gave the highest system co-efficiency [0.44 g/g]. Thirdly, at the

Chapter 4. Free cell culture of Z. mobilis and P. stipitis on sugar medium
80
inoculum level of 100%, with the increase in the air flow from 50 to 100 to 150
cm3/min, the ethanol yield decreased from 0.45 to 0.37 to 0.30 g/g respectively.
The final level of ethanol concentration [pf] achieved in the fermentation medium can
be expressed as follows:
)/( lgv
PPp
conyief
−= (10)
where Pyie and Pcon respectively represent the total ethanol produced and consumed
by the microorganism, and v is the volume of the fermentation medium. Based on
Formula (8):
)(2
1
gdeNPt
tyie ∫ ×= (8)
the oxygenation affects the final ethanol concentration for both values of Pcon and de.
Therefore, an optimized oxygenation value would be essential to achieve a maximum
ethanol production from xylose by P. stipitis.
4.3.4. Significance and application of the cell instantaneous ethanol production
rate [de]
As far as de, the cell instantaneous ethanol production rate, is concerned, it is only a
theoretical value and cannot be experimentally determined. However, based on
Formula (9), de can be expressed as:
)//(11
hcellsgt
p
xQ
xde
p
f
C
p
C
== (9.1)
According to Formula (6) in Section 3.11, the specific ethanol productivity [qp]
equals:
)//(1
hggt
p
xq
p
f
A
p = (6)
Comparing Formula (9.1) and Formula (6), both values of de and qp represent the
ethanol productivity based on biomass. For de, it evaluates the fermentation
capability of each cell [Qp divided by viable cell concentration xC], whereas qp is a
commonly used kinetic parameter to evaluate the efficiency of a fermentation
process [Qp divided by average dry biomass xA]. However, as viable cell

Chapter 4. Free cell culture of Z. mobilis and P. stipitis on sugar medium
81
concentration [xC] and average dry biomass [xA] are both used to describe the
biomass concentration in the medium, the value of de can be partly reflected by the
value of qp in the fermentation process. For instance, the xylose fermentation with
100% inoculum size at 50 cm3/min air flow gave similar system co-efficiency to that
with 50% inoculum size at 100 cm3/min air flow. In Section 4.3.3, it was suggested
that this was due to the reduced level of de under insufficient oxygenation conditions.
As an evidence, the specific ethanol productivity [qp] in the time course with larger
inoculum size was only half of that in the time course with smaller inoculum size but
higher oxygenation level [0.122 g/l/h compared to 0.218 g/l/h; see Figure 4.8]. Thus,
the value of qp could be used to examine the value of de for the same strain cultured
under different conditions.
In Section 4.3.3, oxygenation was used as an example for demonstration of its effects
on the value of de; there are however a number of other factors that may affect de
and thus alter the fermentation performance. These include the medium composition,
temperature and other environmental parameters. Furthermore, de as a value to
describe the fermentation capability could also be used to describe the different
fermentation efficiency between processes, or even between strains. It is an absolute
value for the ethanol amount produced by a single cell within a given time; therefore
it eliminates the potential error in the value of qp, which is caused by the weight
difference of a single cell from different species.
For instance, supposing both Z. mobilis and P. stipitis are cultured under optimum
conditions on glucose and xylose respectively and there are exactly the same number
of viable cells for each strain, after a given culture time, the ethanol production of Z.
mobilis will be substantially higher than that of P. stipitis. This is because the glucose
metabolism in the cells of Z. mobilis is much simpler and more efficient than the
xylose metabolism in the cells of P. stipitis. Therefore, even though both strains are
cultured under optimum conditions, the de of Z. mobilis is higher than that of P.
stipitis, resulting in better performance of ethanol production.
4.3.5. Improvement of ethanol production by Z. mobilis and P. stipitis
In this chapter, Z. mobilis and P. stipitis were cultured on the glucose and xylose
medium respectively to investigate their fermentation characteristics for the

Chapter 4. Free cell culture of Z. mobilis and P. stipitis on sugar medium
82
co-fermentation. Viable cell concentration proved to a key factor to improve the
ethanol productivity for both strains, though in the case of P. stipitis, the oxygenation
also played a crucial part.
The best result of Z. mobilis was achieved with an inoculum size of 100%, giving a
system co-efficiency of 10.54 g/l/h and a specific ethanol productivity of 5.02 g/l/h.
Both values are highest reported in the literature for Z. mobilis free cell in batch
culture using a low initial sugar level of 50 g/l. Compared to the traditional 10%
volume to volume inoculum, using a large inoculum size prepared as described in
Section 3.5 significantly improved the system co-efficiency by 3.6 fold, and specific
ethanol productivity by 1.5 fold. The system co-efficiency could be further improved
if more cells were provided or a higher initial sugar concentration was used. Higher
values of system co-efficiency have been reported in the literature using immobilized
culture (Rebros et al., 2005) or continuous culture (Amin and Doelle, 1990).
The improvement of the specific ethanol productivity, however, was unexpected. The
increased inoculum size was expected to increase the efficiency of ethanol
production by increasing the viable cell concentration [xC], but have no effects on the
de, because it did not alter any environmental parameters. However, a 1.5 fold
increase in the specific ethanol productivity was observed. It was suggested that the
sufficient initial cells in the medium enabled a significant ethanol accumulation as
soon as the fermentation commenced; therefore, the time required for cells to reach
this concentration level by multiplication was reduced. The ethanol production
capability based on biomass was thus improved.
For P. stipitis, the highest volumetric productivity of 0.755 g/l/h was achieved with
an inoculum size of 100% at an air flow level of 50 cm3/min; however, when an
inoculum size of 50% was supplied with an air flow level of 100 cm3/min, a similar
volumetric productivity was obtained [0.734 g/l/h], and the specific ethanol
productivity was double that of the former [0.218 g/g/h compared to 0.122 g/g/h].
This demonstrated that the time course with inoculum size of 50% would be
economically more viable as it achieved a similar system co-efficiency using a
considerably lower number of cells.
Chapter 4. Free cell culture of Z. mobilis and P. stipitis on sugar medium
83
Both values of 0.734 g/l/h and 0.755 g/l/h were the highest system co-efficiency
known for xylose fermentation in free cell batch culture. For fermentation with 50%
inoculum size, it improved the system co-efficiency 5.2 fold and the specific ethanol
productivity 2.9 fold compared to the best result obtained with a traditional inoculum
size of 10% [0.142 g/l/h and 0.074 g/g/h respectively]. By providing cells an
optimum oxygenation level, the system co-efficiency in the time course with 100%
inoculum size had the potential to be further improved. For instance, if the specific
ethanol productivity could be increased to a similar level to the time course with 50%
inoculum size, the system co-efficiency would increase proportionally. However, this
would require an increased aeration level for the high cell concentration in the
medium. In order to find a solution for the concomitant foaming problem, other
fermentation schemes could be tried out.
There was another reason for using the large inoculum size for P. stipitis culture on
xylose. In this study for all fermentation processes culturing P. stipitis in a 1 l
bioreactor with both inoculum sizes of 10% and 50%, it was observed that the
efficiency of biomass growth was relatively low [see Figures 4.5 and 4.6]. Highest
biomass accumulation occurred in the time course with 10% inoculum size at 100
cm3/min air flow; cell concentration started with 2.2x10
7 cfu/ml and increased to
6.0x10⁸ cfu/ml in 120 h. This rate of growth was comparatively low for
xylose-utilizing yeast. In a previous study by us, Pachysolen tannophilus was able to
achieve a cell concentration of 2.0x10⁹ cfu/ml within 48 h using a traditional 10%
inoculum size (data unpublished). In addition, considering the cell loss caused by the
foaming problem, the only strategy to ensure a sufficient cell level of P. stipitis
during the fermentation process was to inoculate a large amount of cells at the
beginning.
The effect of oxygenation on the xylose fermentation observed in this study was in
accordance with previous reports (Kruse and Schugerl, 1996; Taniguchi et al., 1997b;
Chandrakant and Bisaria, 1998). Under anaerobic conditions, when the inoculum size
was low, neither ethanol accumulation nor cell reproduction was observed. Even with
a high inoculum size [see Table 4.4], the increased viable cell concentration in the
medium could not compensate for the extremely low de value [qp: 0.043 g/g/h]; the
overall system co-efficiency remained low [0.270 g/l/h]. Ethanol re-assimilation

Chapter 4. Free cell culture of Z. mobilis and P. stipitis on sugar medium
84
occurred in almost every time course. The trend was intensified when higher
oxygenation levels were used. Ethanol loss up to 10% of the peak value was
observed in the time course with 50% inoculum size and 100 cm3/min air flow [20.56
g/l at 28 h to18.15 g/l at 48 h].
For the co-fermentation process, inoculum size of 50% was chosen as a standard for
both Z. mobilis and P. stipitis. Amongst the three inoculum levels investigated, size
of 50% was the most moderate, giving a reasonably high performance of ethanol
production. The inoculum size of 100% was unfavorable for the co-fermentation
mainly for two reasons: (1) the overly high cell concentration made it considerably
more difficult to control, especially in the case of P. stipitis; (2) the preparation of
large inoculum requires additional inputs, e.g. time, media and equipment; compared
to the 100% inoculum size, the 50% gave a better balance between production
outcome and cost effectiveness.

Chapter 5. Immobilized cultures of Z. mobilis and P. stipitis
85
Chapter 5
I m m obilized cultures of Z. m obilis
and P. st ipit is
Immobilized culture of Z. mobilis and P. stipitis was investigated on glucose and
xylose respectively for their feasibility to be employed in a co-fermentation process.
In previous literature, gel encapsulation of Z. mobilis whole cells was reported to
give a high ethanol productivity up to 43.6 g/l/h (Rebros et al., 2005). Immobilized P.
stipitis was developed for the xylose fermentation with the objective of carrying out
the process with a high cell density under aerobic conditions, eliminating the
interference due to foaming.
5.1. Fermentations employing immobilized Z. mobilis
The techniques used for whole cell immobilization were described in Section 3.6.
Cells from 400 ml inoculum medium were concentrated into 100 ml calcium alginate
beads. This batch of beads was repeatedly cultured for all time course experiments
with immobilized Z. mobilis culture till the beads were damaged. Then another batch
of beads was made for further use.
5.1.1. Effect of immobilization on the fermentation performance of Z. mobilis
Experiments were carried out for immobilized Z. mobilis using the same conditions
as for free cell culture to determine the effect of immobilization on fermentation

Chapter 5. Immobilized cultures of Z. mobilis and P. stipitis
86
performance. Beads used for this time course were freshly made, without a prior
reconditioning process to allow cell accumulation. Thus the inoculum size of this
time course was at a similar level to that of time courses with 50% inoculum size
[also using cells from 400 ml inoculum medium to inoculate]. The fermentation
conditions are as described in Section 3.7.2.
Figure 5.1 presents the results of sugar utilization and ethanol production of two time
courses, employing free cells of Z. mobilis and immobilized Z. mobilis respectively.
Both time courses showed similar trends on the substrate consumption and ethanol
yield; however, results of immobilized culture were slightly inferior. It took an
additional hour for immobilized Z. mobilis to use up all the sugars in the medium [5
h compared to 4 h in the free cell culture]. Ethanol production in the free cell culture
peaked at the same time when all the glucose was completely consumed [4h]. By
contrast, for immobilized culture, a perceptible increase in the ethanol concentration
was observed after the full consumption of sugars at 5 h [22.92 g/l at 5 h and 23.53
g/l at 6 h]. Moreover, it was also observed that the peak value of ethanol
concentration in the immobilized culture was slightly less than that in the free cell
culture [23.53 g/l compared to 25.28 g/l].
0
10
20
30
40
50
60
0 2 4 6 8 10
Ti me ( h)
Redu
cing
sug
ar &
etha
nol
(g/l
)
RS - f r ee cel l s ( g/ l ) RS - i mmobi l i zed ( g/ l )
Et hanol - f r ee cel l s ( g/ l ) Et hanol - i mmobi l i zed ( g/ l )
Figure 5.1: Comparison of sugar utilization and ethanol production between a
free cell Z. mobilis culture and an immobilized culture.

Chapter 5. Immobilized cultures of Z. mobilis and P. stipitis
87
Biomass of the immobilized culture was carried out both within the beads and in the
fermentation medium. Dry weight biomass inside the beads showed a relative
increase up to 6 fold during the fermentation process [0.8 mg before and 4.8 mg after
the time course]. On the other hand, cell growth in the fermentation medium was
considerably low. The medium remained clear during 11 h culture time. Cell growth
in the culture fluid was undetectable by the current method of dry weight assay;
viable cells in the medium slowly increased from an initial level of 104 cfu/ml to 10
6
cfu/ml at the end. The value was only 1/1000 of the highest viable cell concentration
achieved in the free cell culture [~1.5x10⁹ cfu/ml].
5.1.2. Effect of recycling of the immobilized Z. mobilis beads
During the above culture process of the immobilized Z. mobilis, the biomass
accumulation within the beads was notably significant. According to the discussion
for the free cell culture in Chapter 4, the performance of Z. mobilis was definitively
affected by the viable cell concentration in the medium. It was therefore considered
important to determine the effect of the increased biomass within the beads on the
fermentation performance. For this purpose, a batch of Z. mobilis beads was
repeatedly cultured under the same conditions. For this experiment only,
fermentation medium of 1000 ml was used for two processes, instead of the usually
employed 800 ml.
Table 5.1 summarizes the kinetic parameters of the two time courses using repeatedly
cultured immobilized Z. mobilis beads. The fermentation performance in the second
time course was largely improved through the recycling of the beads. In association
with an increase of the biomass within the beads from 6.8 to 11.5 mg, the
fermentation time decreased from 7 h to 4 h, resulting in an increase in the system
co-efficiency from 3.42 to 5.93 g/l/h. In both processes, ethanol yield was steady at
0.49 g/g, which was approximately 96% of the theoretical value, slightly lower than
those obtained in the free cell culture with a large inoculum size [0.50~0.51 g/g].
Given that the biomass dry weight inside the beads was only 0.8 mg when the beads
were initially made, the biomass level of 11.5 mg demonstrated a significant increase
in the biomass concentration within the beads. However, after reusing the same batch

Chapter 5. Immobilized cultures of Z. mobilis and P. stipitis
88
of beads for three time courses [including the one reported in Section 5.1.1] and two
reconditioning processes prior to fermentation, the beads were severely damaged. At
this stage, most of the beads split into half, resulting from the carbon dioxide
produced during the ethanol producing process. Furthermore, due to the enormous
cell propagation within, the physical characteristics of beads altered. The gel surface
became increasingly rough and adherent to the glassware, which greatly increased
the difficulty of inoculating these beads into the bioreactor. Concomitant with the
destruction of beads, more cell leakage occurred during the fermentation process. In
the time course reported in Section 5.1.1, it took 8 h for free cell concentration in the
fermentation medium to reach a level of 1x10⁶ cfu/ml. When the same beads were
cultured again in the 1000 ml of fermentation medium, by 6 h the free cell
concentration in the medium increased to a level of 1x10⁶ cfu/ml; the repetition of
this time course further reduced this time to 2 h.
Table 5.1: Kinetic parameters of immobilized Z. mobilis on repeated culture
Fermentation
time (h)
Biomass in the
beads (mg) *
System
co-efficiency (g/l/h)
Ethanol
yield (g/g)
1st time course 7 6.8 3.42 0.49
2nd
time course 4 11.5 5.93 0.49
* Biomass concentration within the beads was assayed before and after each time
course finished, using the method described in Section 3.6. Data was expressed as
the absolute value from the dry weight assay by dissolving five beads in 10 ml of
sodium citrate solution.
Another observation during the repeated culture process concerned the increased
volume of fermentation medium. In the experiment reported in Section 5.1.1, it took
5 h for the beads to utilize 800 ml of Glucose Medium; however, with the same batch
of beads and the same initial glucose concentration, another extra 2 h was required to
use up all the glucose in the 1000 ml medium.
To summarize, the recycling of the same batch of beads greatly increased the
fermentation performance of Z. mobilis culture on glucose. However, the calcium
Chapter 5. Immobilized cultures of Z. mobilis and P. stipitis
89
alginate gel beads tended to be damaged easily during repeated usage.
5.1.3. Effect on glucose fermentation of a sieve plate in the modified bioreactor
As described in Section 3.7.4.4, one of the fermentation schemes used for the
co-fermentation process employed a modified bioreactor, which is an innovative
design in this study [see Figures 3.5 and 6.4]. Through the addition of a sieve plate to
the bioreactor, this fermentation scheme enabled an easy removal of all immobilized
beads from the fermentation medium, without altering other conditions within the
bioreactor. However, under this circumstance Z. mobilis beads were not able to pass
through the sieve plate and therefore were only exposed to the fermentation medium
above the sieve plate. The distribution of material in the medium only relied on the
continuous stirring by the stirrer underneath the sieve plate. Furthermore, the
addition of the sieve plate also changed the medium rheology. Therefore, it was
necessary to identify the potential changes of fermentation characteristics when the
glucose fermentation was restricted to above the sieve plate.
Two experiments were carried out for this purpose. In the first experiment,
immobilized Z. mobilis beads that was freshly made was cultured in the bioreactor
with the sieve plate under standard conditions, and the obtained results are compared
to those reported in Section 5.1.1. In the second experiment, the same batch of beads
was repeatedly cultured with and without the sieve plate.
Figure 5.2 displays the results of sugar utilization and ethanol production for time
courses carried out in a normal bioreactor and in a modified bioreactor. In Figure 5.2
(a), both time courses employed Z. mobilis beads that were freshly made from two
batches; as an identical procedure was used, the biomass concentration for the two
batches were similar. Because of this similarity in biomass, both trends of sugar
utilization and ethanol consumption in these two time courses were remarkably
similar. The sugar consumption in the time course with the sieve plate was slightly
slower [complete at 6 h, with 1.92 g/l left at 5 h]. However, the ethanol production in
both time courses peaked at 6 h, giving a similar level of peak ethanol concentration
[23.40 g/l compared to 23.11 g/l].

Chapter 5. Immobilized cultures of Z. mobilis and P. stipitis
90
( a)
0
10
20
30
40
50
60
0 2 4 6 8 10
Ti me ( h)Re
duci
ng s
ugar
&et
hano
l (g
/l)
RS - nor mal ( g/ l ) RS - si eve pl at e ( g/ l )Et hanol - nor mal ( g/ l ) Et hanol - si eve pl at e ( g/ l )
( b)
0
10
20
30
40
50
0 2 4 6 8 10Ti me ( h)
Redu
cing
sug
ar &
etha
nol
(g/l
)
RS - nor mal ( g/ l ) RS - si eve pl at e ( g/ l )Et hanol - nor mal ( g/ l ) Et hanol - si eve pl at e ( g/ l )
Figure 5.2: Comparison of sugar utilization and ethanol production between
immobilized Z. mobilis cultures with and without the sieve plate: (a)
different batches with similar biomass; (b) same batch repeatedly
cultured.
In Figure 5.2 (b), again similar results were obtained for time courses with and
without the sieve plate. However, since this time the same batch of Z. mobilis beads
was repeatedly used, the time course with the sieve plate gave a higher performance
compared to that without the sieve plate. Ethanol peaked at 5 h together with a
complete utilization of all the glucose, which was 1 h earlier than the one without the
sieve plate. Nevertheless, the final ethanol concentration of two time courses was at a

Chapter 5. Immobilized cultures of Z. mobilis and P. stipitis
91
similar level [22.99 g/l and 22.77 g/l respectively].
It can be thus concluded that the addition of the sieve plate had little effect on the
performance of glucose fermentation by Z. mobilis. The addition of the sieve plate
could have decreased the liquid fluidity of the fermentation medium; however, this
disadvantage is relatively minor and could be easily compensated by the vigorous
metabolism of the bacterium resulting from the high density of viable cells within the
beads.
5.1.4. Biomass accumulation of immobilized Z. mobilis during the reconditioning
process
It was shown that the biomass concentration within the beads had a significant
impact on the fermentation characteristics. As the reconditioning process of the
immobilized beads was used to ensure a sufficient biomass level for the fermentation
process, studies were carried out to determine the best conditions for the
reconditioning process. The effect of the following three factors was investigated, viz.
the reconditioning times, the addition of CaCl2, and the glucose concentration in the
reconditioning medium.
For the first experiment, six reconditioning processes were carried out on a batch of
freshly-made beads. Incubation was carried out in 250 ml conical flasks with 100 ml
Glucose Medium. In the first three flasks, CaCl2 was added at a concentration of 5.55
g/l (50 mM), a level used for the Glucose Storage Medium [see Table 3.2]; the other
three flasks were free of CaCl2. In the second experiment, another batch of
freshly-made beads was reconditioned three times, in the Glucose Medium with
increased glucose concentration of 20g/l, 50 g/l and 80 g/l respectively. Both batches
of beads were then subjected to the fermentation time course after reconditioning.
The results of biomass growth during the reconditioning experiments are shown in
Table 5.2 and Table 5.3.

Chapter 5. Immobilized cultures of Z. mobilis and P. stipitis
92
Table 5.2: The effect of CaCl2 on the biomass of immobilized Z. mobilis during
reconditioning
1st batch of Z. mobilis beads Dry biomass weight of 5 beads (mg)
Original beads Freshly-made beads 0.9
After 1st culture 1.0
After 2nd
culture 1.6
With CaCl2
After 3rd
culture 2.2
After 4th culture 3.3
After 5th culture 5.1
Without CaCl2
After 6th culture 4.8
Time course After Time course 9.2
Table 5.3: The effect of glucose concentration on the biomass growth of
immobilized Z. mobilis during reconditioning
2nd
batch of Z. mobilis beads Dry biomass weight of 5 beads (mg)
Original beads Freshly-made beads 0.8
20 g/l glucose 1.4
50 g/l glucose 2.4
Reconditioning
80 g/l glucose 4.3
Time course After Time course 7.8
As shown in both tables, the dry cell weight of both batches of beads showed a
steady increase with serial reconditioning. Biomass accumulation in the
reconditioning processes with CaCl2 supplement was inferior compared to that
achieved in the processes without CaCl2. Biomass increase in the three processes
with CaCl2 was respectively 0.1 [original to 1st reconditioning], 0.6 [1
st to 2
nd] and
0.6 mg [2nd
to 3rd
]. In other processes, much higher increase was achieved [1.1 mg
from 3rd
to 4th and 1.8 mg from 4
th to 5
th for the 1
st batch of beads, and 0.6, 1.0 and
1.9 mg respectively in the three reconditioning processes for the 2nd
batch]. Therefore
it appears that the addition of CaCl2 into the medium was not beneficial to the
biomass growth within the beads.

Chapter 5. Immobilized cultures of Z. mobilis and P. stipitis
93
In the reconditioning processes for the first batch of beads, despite the steady
biomass increase during the first five times, the biomass concentration slightly
decreased at the sixth process [5.1 to 4.8 mg], but again showed dramatic increase
after the beads were cultured in the fermentation time course [4.8 mg into 9.2 mg]. A
similar trend was observed for the reconditioning processes of the second batch of
beads. As can be seen from Table 5.3, after increasing gradually during the three
reconditioning processes, the biomass within the beads showed a large rise after the
beads were used for fermentation time course [4.3 mg to 7.8 mg]. In addition, though
both batches of beads had been reconditioned several times under various conditions
prior to the time course experiments, their performance was at a similar level to the
batch that had not been reconditioned but directly employed for fermentation [results
reported in Section 5.1.1]. Consequently, no matter what the medium composition,
reconditioning times, or initial sugar level was used, the reconditioning processes did
not improve the biomass concentration within the beads to a very significant level,
especially in comparison with the fermentation time courses.
Physical bead damage was observed for both batches of beads during the repeated
usage in the reconditioning process. It started with the split of the beads and occurred
even with the lowest glucose concentration of 20 g/l. The damage became
increasingly severe with the progress of the experiment. This suggested that the bead
damage was mainly attributed to the metabolic activity of the cells within the beads.
The continuously stirring impeller in the bioreactor was not a significant factor
compared to that.
5.2. Fermentations employing immobilized P. stipitis
As described in Section 3.6, a batch of P. stipitis beads concentrated P. stipitis cells
from 1000 ml inoculum medium into 250 ml beads. Consequently, when the full
batch was inoculated into 800 ml fermentation medium, the inoculum size was 125%
[cells from 1000 ml inoculum medium into 800 ml fermentation medium]. The
utilization of a large amount of yeast cells was mainly to ensure a high biomass
concentration for the xylose fermentation.

Chapter 5. Immobilized cultures of Z. mobilis and P. stipitis
94
5.2.1. Fermentation characteristics of immobilized P. stipitis culture
In order to investigate the fermentation characteristics of immobilized P. stipitis
culture, the first two time courses were carried out under standard xylose
fermentation conditions as described in Section 3.7.2. The air flow of these two time
courses was controlled at 80 cm3/min, which was a level higher than the best air flow
of 50 cm3/min for the free cell culture with 100% inoculum size. The result of the
first time course employing the freshly prepared beads of immobilized P. stipitis was
compared to that of the free cell culture with the most efficient fermentation, i.e. the
time course with 50% inoculum size and 100 cm3/min air flow. The immobilized
culture had an inoculum size 2.5 fold higher than the free cell culture. The
comparison of the kinetic parameters is made in Table 5.4. As the majority of
biomass in the immobilized culture was entrapped in the calcium alginate beads, the
specific ethanol productivity was not calculated. Despite a much higher inoculum
size, the immobilized P. stipitis gave considerably lower kinetic parameters. Both
time courses achieved an ethanol yield of 0.44 g/g; however, it took immobilized
yeast 36 h to utilize all the xylose in the medium, 8 h longer than the free cell culture
[28 h]. This led to an inferior system co-efficiency of 0.553 g/l/h, in contrast to the
0.734 g/l/h in the free cell culture.
Table 5.4: Comparison of kinetic parameters between a free cell P. stipitis
culture and an immobilized culture
Time courses Kinetic Parameters
Inoculum
size (%)
Air flow
(cm3/min)
Ethanol peak
time (h)
System co-
efficiency (g/l/h)
Ethanol
yield (g/g)
Free cell 50% 100 28 0.734 0.44
Immobilized 125% 80 36 0.553 0.44
The second time course employing immobilized P. stipitis was a repeat of the first
time course, in order to investigate the fermentation characteristics when the same
batch of P. stipitis beads was reused. As shown in Table 5.5, the kinetic parameters of
these two time courses were almost identical to each other, except that in the second
culture process, ethanol peaked 2 h earlier [34 h compared to 36 h in the first

Chapter 5. Immobilized cultures of Z. mobilis and P. stipitis
95
process], resulting in a slightly higher system co-efficiency [0.581 compared to 0.553
g/l/h].
Table 5.5: Kinetic parameters of immobilized P. stipitis in repeated culture
Time courses Kinetic Parameters
Inoculum
Size (%)
Air flow
(cm3/min)
Ethanol peak
time (h)
System co-
efficiency (g/l/h)
Ethanol
yield (g/g)
1st
TC * 125% 80 36 0.553 0.44
2nd
TC* 125% 80 34 0.581 0.44
* TC: time course
During the repeated culture of immobilized P. stipitis, there was little biomass
increase within the beads. Table 5.6 summarizes the results of the biomass assay for
the two time courses employing immobilized P. stipitis. It can be seen that the
increase of dry weight was relatively low [3.0 mg after the 1st culture, and 2.5 mg
after the 2nd
culture] and the viable cell concentration even showed a slight decrease
[1.8x10⁸ to 9.8x10
7 to 8.4x10
7 cfu/ml].
Table 5.6: Biomass concentration within the immobilized P. stipitis beads during
two time courses
5 beads in 10 ml sodium citrate solution Sampling time
dry weight (mg/9 ml) viable cells (cfu/ml)
Fresh beads 9.1 1.8x10⁸
After 1st time course 12.1 9.8x10
7
After 2nd
time course 14.6 8.4x10⁷
It was also found that cell leakage was significant for the immobilized P. stipitis
beads. During the culture processes, vigorous cell growth was observed in the
fermentation medium, making the initially clear medium turbid and cloudy as cells
multiplied. Along with the increased cell concentration in the medium, foaming
occurred and it was necessary to add antifoam to control the foaming at the later

Chapter 5. Immobilized cultures of Z. mobilis and P. stipitis
96
stage of the fermentation. The trends of biomass concentration in the fermentation
medium in these two time courses are shown in Figure 5.3. Viable cells in both time
courses started at approximately 1x10⁶ cfu/ml, gradually increased to a level of 1x10
8
cfu/ml by 20 h and then leveled out.
1. E+05
1. E+06
1. E+07
1. E+08
1. E+09
0 10 20 30 40 50
Ti me ( h)
Viab
le c
ell
conc
entr
atio
n (c
fu/m
l)
1st t i me cour se 2nd t i me cour se
Figure 5.3: Cell growth in the fermentation medium of immobilized P. stipitis
culture
Bead damage for immobilized P. stipitis was not as severe as that for immobilized Z.
mobilis. Though both beads of P. stipitis and Z. mobilis were made following the
same procedure, most P. stipitis beads remained intact after two fermentation time
courses.
Results so far indicated that the fermentation characteristics of immobilized P. stipitis
were not promising. The overall system co-efficiency was lower compared to free
cell cultures, although the biomass concentration in the immobilized culture was
considerably higher. In addition, biomass accumulation within the beads was
relatively low, and yeast cells tended to reproduce in the fermentation medium rather
than within the beads. All these factors were considered unfavorable for a co-culture
process on the glucose/xylose sugar mixture. The beads were then cultured under
different environmental conditions to determine whether the fermentation
performance could be improved by optimizing the conditions.

Chapter 5. Immobilized cultures of Z. mobilis and P. stipitis
97
5.2.2. Immobilized P. stipitis culture under different oxygenation levels
The two time courses reported in the previous section employing immobilized P.
stipitis were carried out with an air flow of 80 cm3/min. As shown in the experiments
with free cell culture, the oxygenation level was extremely crucial for xylose
fermentation by P. stipitis. With an increased biomass level in the medium, an
increased level of oxygenation needed to be provided to meet the oxygen
requirement of each cell [see Sections 4.2.2 and 4.2.3]. Given that the biomass
entrapped in the immobilized P. stipitis was exceptionally high [cells from 1000 ml
into 250 ml beads], time courses with increased aeration level were carried out as an
effort to improve the overall system co-efficiency.
Table 5.7: Kinetic parameters of immobilized P. stipitis culture under different
oxygenation levels
Time courses Kinetic Parameters
Air flow
(cm3/min)
Ethanol peak
time (h)
System co-
efficiency (g/l/h)
Ethanol yield
(g/g)
80 34 0.581 0.44
100 32 0.577 0.41
150 30 0.524 0.36
Table 5.7 summarizes kinetic parameters of two time courses with increased air flow
levels for immobilized P. stipitis, and compares them with the time course reported in
Section 5.2.1. With an increase of air flow from 80 to 100 to 150 cm3/min, the
fermentation time required for a complete consumption of the xylose in the medium
decreased from 34 h to 32 to 30 h respectively. However, this was associated with a
decrease in the ethanol yield, from 0.44 g/g to 0.41 to 0.36 g/g. As a result, the
system co-efficiency did not increase along with the increase in the air flow. On the
contrary, it decreased slightly, from 0.581 g/l/h to 0.577 to 0.524 g/l/h for the time
courses with air flow levels of 80, 100 and 150 cm3/min respectively. The decrease in
the ethanol yield was probably due to the accelerated ethanol re-assimilation under
higher oxygenation conditions. It could hence be said that for the immobilized P.

Chapter 5. Immobilized cultures of Z. mobilis and P. stipitis
98
stipitis, the increase of oxygenation level was not advantageous for the improvement
of fermentation performance.
5.2.3. Immobilized P. stipitis culture with different initial sugar concentrations
The immobilized P. stipitis culture was also employed to investigate the effect of
initial sugar concentration on xylose fermentation. The immobilized culture was
employed for this experiment because the foaming problems in the free cell culture
made it difficult to maintain the high cell concentration for a prolonged period of
fermentation time. In this experiment, two time courses were carried out, with an
initial xylose concentration of 20 g/l and 80 g/l respectively. Results of these two
time courses are shown in Table 5.8, with the results from time course of 50 g/l
xylose as a comparison.
Table 5.8: Kinetic parameters of immobilized P. stipitis culture with different
initial xylose concentrations
Time courses Kinetic Parameters
Initial xylose
concentration (g/l)
Air flow
(cm3/min)
Ethanol peak
time (h)
System co-
efficiency (g/l/h)
Ethanol yield
(g/g)
20 80 15 0.536 0.43
50 80 34 0.581 0.44
80 150 52 0.489 0.37
As shown in Table 5.8, along with the increased sugar concentration, the time used to
finish all the sugars increased from 15 h to 34 h to 52 h. Time courses carried out
with 20 and 50 g/l xylose showed similar results on the system co-efficiency [0.536
and 0.581 g/l/h] and ethanol yield [0.43 and 0.44 g/g]. Though the time course with
80 g/l gave slightly inferior system co-efficiency of 0.489 g/l/h, it could be mainly a
result of the reduced ethanol yield of 0.37 g/g, which indicated an increased ethanol
re-assimilation in this time course due to the increased air level [150 cm3/min
compared to 80 cm3/min in other two time courses]. Considering this fact, the
different initial sugar levels used in these three time courses appeared to have little
effect on the fermentation performance of the immobilized P. stipitis.

Chapter 5. Immobilized cultures of Z. mobilis and P. stipitis
99
5.3. Discussion
5.3.1. Immobilized Z. mobilis culture
5.3.1.1. Fermentation characteristics of immobilized Z. mobilis
Based on the results reported in Section 5.1.1, when the amount of biomass in the
fermentation medium was at a similar level, the immobilized culture tended to show
slightly inferior results compared to the free cell culture. This was further confirmed
by all time course experiments carried out with freshly prepared Z. mobilis beads,
which contained similar amount of cells to the inoculum size of 50% [see Sections
5.1.3 and 5.1.4]. It is considered that the time required for material to diffuse in and
out of the beads could account for the extended time for ethanol to peak and the slow
sugar utilization. This problem, however, had only minimal effect on the
fermentation performance.
Another problem observed for the immobilized Z. mobilis was the decreased peak
ethanol concentration. As reported in Section 5.1.2, ethanol yield in both time
courses was 0.49 g/g, which was slightly less than those obtained in the free cell
culture [0.50~0.51 g/g]. Again this could be attributed to the diffusion; some ethanol
produced could be retained within the beads and slowly released to the medium. The
second cause might be the undesirable dilution of the initial sugar concentration from
the inoculation of immobilized Z. mobilis. Gel beads could carry over some liquid
from their previous environment into the bioreactor, and the diluted initial sugar
concentration could result in a reduced final ethanol concentration.
In spite of these problems, the whole cell immobilization has some distinct
advantages in the fermentation process. Firstly, it can be conveniently recycled and
reused, therefore lowering the costs involved. This is of particular significance when
a large inoculum size is required. Secondly, the biomass within the beads would
continuously accumulate during the culture processes when recycled, and the
increased biomass concentration greatly benefits the ethanol production [see Section
4.3.1].

Chapter 5. Immobilized cultures of Z. mobilis and P. stipitis
100
5.3.1.2. Biomass accumulation within the beads
As reported in Section 5.1.2, when the same batch of beads was repeatedly cultured,
the fermentation time significantly decreased from 7 h to 4 h. This was associated
with a one fold increase of biomass within the beads [6.8 mg after 1st time course,
and 11.5 mg after 2nd
time course]. Considering that the dry biomass weight was only
0.8 mg when originally made [see Section 5.1.1], the cell concentration increased
more than 10 fold for the immobilized Z. mobilis after only a few fermentation
processes. The efficient biomass accumulation further indicated that Z. mobilis cells
were acclimatized to the gel environment and grew well inside the beads.
The increased cell amount within the beads also led to the improvement of system
co-efficiency [3.42 g/l/h to 5.93 g/l/h]. This trend was in accordance with that
observed for the free cell culture [see Section 4.1]. An advantage of immobilized Z.
mobilis culture is that through a number of repeated culture processes, the biomass
within the beads could naturally accumulate to an extremely high level, and result in
exceptionally high system co-efficiency. According to the report by Rebros et al.
(2005), a system co-efficiency of 43.5 g/l/h was achieved after 72 times recycling of
the same batch of immobilized Z. mobilis.
5.3.1.3. Reconditioning of the beads
Results reported in Section 5.1.4 showed that the biomass accumulation in the
reconditioning was of relatively low efficiency compared to that in a fermentation
time course. Therefore, the reconditioning process was considered as an inefficient
way for improving the biomass concentration within the beads, especially when high
initial cell concentration was entrapped inside [cells from 400 ml medium into 100
ml beads]. Nevertheless, it remained an effective method to revive the metabolic
activity of the cells and allow cells to adapt to the medium when beads were returned
from storage. Furthermore, these experiments provided important information
regarding the fermentation characteristics of immobilized Z. mobilis.
As far as the effect of the CaCl2 added into medium is concerned, the purpose of
adding Ca2+
was to reduce the potential bead damage caused by the dissolution of
calcium alginate gel. However, as shown in Section 5.1.4, the addition of CaCl2
appeared to be a disadvantage for the cell growth. Moreover, the actual presence of

Chapter 5. Immobilized cultures of Z. mobilis and P. stipitis
101
Ca2+
in the medium is uncertain. During the media preparation, a small amount of a
white precipitate was formed after the addition of CaCl2, which could be CaSO4
formation resulting from the reaction between CaCl2 and (NH4)2SO4. Therefore,
there was no positive outcome by the addition of CaCl2 and it was no longer added
for experiments that followed.
It is, however, necessary to minimize bead damage, since it considerably reduces the
number of times that the beads could be recycled and increases the costs involved.
During the reconditioning processes [see Section 5.1.4], it was observed that the bead
damage occurred even in media with glucose concentration as low as 20 g/l. To
overcome this problem and increase the beads durability, new immobilization
material able to withstand multiple recycling should be developed.
The amount of glucose in the medium is considered a major reason for the inability
of the reconditioning process to significantly improve the biomass concentration
within the beads. As shown in Tables 5.2 and 5.3, the biomass level within the beads
did show some increase after reconditioning, but it was too slight to have any notable
effect on the fermentation performance. Significant cell accumulation occurred only
in the time course experiment with 800 ml fermentation medium. Beads that were
repeatedly cultured in the time courses showed markedly improved fermentation
performance, while those that had been reconditioned six times made hardly any
difference to the ethanol productivity [see Sections 5.1.2 and 5.1.4 respectively]. This
indicated that the amount of glucose in the medium was crucial in cell accumulation.
The reconditioning medium and fermentation medium contained 5 g and 40 g
glucose respectively [50 g/l with respective volume of 100 ml and 800 ml]. As Z.
mobilis cells need the released ATP from the glucose metabolism process for cell
growth, the increased amount of glucose could provide the bacterium more ATP for
reproduction, leading to a higher level of cell number.
A similar trend was also observed for the fermentation time required to convert an
increased volume of fermentation medium. As reported in Sections 5.1.1 and 5.1.2,
when the fermentation medium increased from 800 ml to 1000 ml, an extra two
hours were required to convert all the glucose to ethanol by Z. mobilis. Both
observations indicated that for a glucose fermentation process by Z. mobilis, the total

Chapter 5. Immobilized cultures of Z. mobilis and P. stipitis
102
amount of substrate available is the most decisive factor in terms of both biomass
growth and fermentation performance, rather than the concentration of the substrate
in the medium. When the same amount of cells was employed, in the medium with a
larger volume which contained a larger amount of substrate, cell growth could
achieve a higher level which was unattainable with less substrate; likewise, longer
fermentation time would be required to transform the larger amount of substrate.
Specific to the fermentation performance, it is suggested that the fermentation time is
only determined by the ratio of substrate to the biomass, which could further affect
the system co-efficiency and other kinetic parameters. According to Formula (8.1) in
Section 4.3.1,
))(( 12 gttdeNP yie −××= (8.1)
the fermentation time can be expressed as:
)(1
12 hN
P
dett
yie=− (8.4)
Consequently, in a fermentation process where de stays constant, the fermentation
time required to utilize all the substrate is only determined by the absolute amount of
the produced ethanol [Pyie] and the number of viable cells [N] in the medium. Since
the amount of ethanol produced is directly proportional to the amount of substrate in
the medium, it is the ratio of the substrate to the biomass that determines the
fermentation time and the corresponding process efficiency. This explains why in a
scaled-up process, with a large volume of medium, a large inoculum is always
required to ensure a reasonable fermentation efficiency.
To summarize, significant characteristics shown by immobilized Z. mobilis include
the efficient conversion of glucose to ethanol, ability to be easily recycled, low cell
leakage during the fermentation process and the potential to accumulate cells to a
high concentration within the beads. All these characteristics made the immobilized
Z. mobilis an ideal form to be used in the co-culture process.
5.3.2. Immobilized P. stipitis culture
As mentioned at the beginning of Chapter 5, the primary motive of immobilizing P.
stipitis was to control the foaming problem occurred during the free cell culture.

Chapter 5. Immobilized cultures of Z. mobilis and P. stipitis
103
Moreover, immobilization was also a good method in terms of the employment of a
large inoculum size and the repeated use of the same batch of beads. During the
experiments, P. stipitis showed several unique characteristics when immobilized;
these were neither similar to the immobilized Z. mobilis, nor like the free cell culture
of P. stipitis.
5.3.2.1. Differences between the immobilized P. stipitis and immobilized Z.
mobilis
Major differences between immobilized P. stipitis and immobilized Z. mobilis are as
follows.
� No improvement in the fermentation efficiency when repeatedly cultured
When same batch of P. stipitis beads was repeatedly used in two time courses, similar
results was obtained [See Table 5.5; Section 5.2.1]. This observation was very
dissimilar to the immobilized Z. mobilis culture, where the fermentation performance
significantly improved during the repeated use of the same batch of beads [see
Sections 5.1.2 and 5.1.3].
� Insignificant increase in biomass within the beads
The repeated culture of the same batch of immobilized P. stipitis beads had no effect
on the improvement of the fermentation efficiency; neither could it increase the
biomass concentration within the beads. For immobilized Z. mobilis, an increase
greater than 10 fold [0.8 mg to 11.5 mg] in biomass was observed after three time
course experiments [see Section 5.3.1.2]. In contrast, the increase in biomass for
immobilized P. stipitis was only 60% [9.1 mg to 14.6 mg] after two time course
experiments [see Section 5.2.1].
� Cell leakage during the fermentation process
Time courses employing immobilized Z. mobilis showed a low level of free cells
[maximum level 1x10⁶ cfu/ml] in the fermentation medium [see Sections 5.1.1 and
5.1.2]. However, in the time courses with immobilized P. stipitis, cell multiplication
in the medium was vigorous; the free cell concentration increased from a level of
1x10⁶ cfu/ml to 1x10
8 cfu/ml within 20 h. This number of viable cells was significant
for P. stipitis culture on xylose; it was almost half the value of the average viable cell

Chapter 5. Immobilized cultures of Z. mobilis and P. stipitis
104
concentration [~ 2.3x10⁸ cfu/ml] in a time course with a regular inoculum size of
10% [see Figure 4.5; Section 4.2.2], and even higher than the lowest value of viable
cell concentration [~ 8.0x10⁷ cfu/ml] in the time course with 100% inoculum size
after cell loss [See Figure 4.7; Section 4.2.4].
There are probably two reasons contributing to this difference in the cell leakage
between immobilized Z. mobilis and P. stipitis cultures. Firstly, Z. mobilis is an
anaerobic bacterium with little oxygen tolerance; it is able to grow well under
anaerobic conditions and therefore prefers to reproduce within the beads. In contrast,
P. stipitis is an aerobic yeast. Reported literature indicated that the yeast hardly grows
under anaerobic conditions. Therefore a medium environment with limited oxygen
supply is more favorable for the cell growth compared to the interior of gel beads.
This also explains its inability to multiply significantly within the beads.
Secondly, the different fermentation time to utilize all the sugars could also lead to
the different final levels of free cell concentration in the medium. Fermentations
using immobilized P. stipitis usually took more than 30 h to consume all the xylose,
which gave cells sufficient time to reproduce and reach a high cell concentration. By
contrast, all sugars in glucose fermentation with immobilized Z. mobilis usually
could be completely consumed within 8 h.
� Low level of bead damage
In contrast to the easily damaged Z. mobilis beads, immobilized P. stipitis beads were
considerably more durable, able to withstand six fermentation time courses, while
most beads remained intact and maintained their shape. The damage caused to Z.
mobilis beads was considered to result from the large amount of carbon dioxide
produced during the metabolism process of ethanol production; consequently, the
low level of bead damage in the immobilized P. stipitis only indicated that the carbon
dioxide production within the beads was at such a slow rate that was unable to cause
any damage to the beads. It can be thus inferred that the simultaneous ethanol
production was also at a low efficiency.
All these characteristics suggested that P. stipitis cells within the gel beads had a low
activity. Because of the low cell activity, the efficiency of both biomass growth and

Chapter 5. Immobilized cultures of Z. mobilis and P. stipitis
105
cell metabolism was low. This conclusion is also supported by the relatively low
system co-efficiency [~0.5 g/l/h] achieved with the large amount of cells entrapped in
the beads [equal to an inoculum size of 125%]. As shown in Table 5.6 [see Section
5.2.1], although the biomass within the beads did not show a significant increase, a
stable level of viable cells was maintained during the culture processes. In
association with the high level of free cells in the fermentation medium [see Section
5.2.1], the overall amount of biomass in the time courses with immobilized P. stipitis
was at a substantially high level. In Section 4.3.3 it is suggested that the system
co-efficiency of xylose fermentation by P. stipitis only relates to two values, viz.
viable cell concentration [xC] and the cell instantaneous ethanol production rate [de].
In this instance, the value of xC was sufficiently high; thus the only factor that could
cause the low system co-efficiency was the de. According to Table 5.4 [see Section
5.2.1], comparing the kinetic parameters between a free cell P. stipitis culture and an
immobilized culture, the immobilized culture with a much higher inoculum size gave
an inferior system co-efficiency [0.553 g/l/h compared to 0.734 g/l/h in free cell
culture]. This indicated that the value of de of P. stipitis cells entrapped in the beads
was exceptionally low, which further supports the low cell activity.
Major factors affecting the value of de include the intrinsic fermentation capability of
the fermenting strain and the environmental conditions. The decreased de value in
the immobilized P. stipitis culture suggested that the environment within the gel
beads was unfavorable for the yeast cells. The aeration level inside the gel beads was
significantly limited. In addition with the large amount of cells entrapped inside, it
can be treated as a semi-anaerobic condition within the beads. The insufficient
oxygen level benefits the cell activity of Z. mobilis, but was inhibitory to the
metabolic system of P. stipitis. The cell activity was consequently limited. Previous
literature studying the immobilized P. stipitis culture also reported a poor
fermentation performance on xylose (Grootjen et al., 1991b).
5.3.2.2. Effects of oxygenation level on the immobilized P. stipitis culture
Time courses with increased aeration levels were carried out for the immobilized P.
stipitis culture [see Section 5.2.2]. With a higher air flow provided, it was expected
that this would increase the cell activity within the beads and therefore improve the
overall fermentation performance. However, as shown in Table 5.7 [see Section
Chapter 5. Immobilized cultures of Z. mobilis and P. stipitis
106
5.2.2], the increased oxygenation only reduced the ethanol yield, having no positive
effect on the system co-efficiency.
According to the discussion in Section 4.3.3, oxygenation affects the xylose
fermentation on two counts: (1) accelerating ethanol re-assimilation, (2) affecting the
value of de. Under the conditions of these time courses, the ethanol re-assimilation
was accelerated by the increased aeration, but the de hardly improved. It is
considered that the increased air flow to the bioreactor hardly changed the aeration
levels inside the gel beads; but the excessive oxygen definitely helped the further
oxidation of the excreted ethanol in the fermentation medium, and thus decreased the
final ethanol yield.
The reason for the unimproved aeration within the beads might be the compactness
of the gel beads, which made it difficult for air to diffuse into the centre of beads. As
the biomass concentration in the immobilized P. stipitis beads tended to remain at a
constant level and the aeration within the beads was hardly affected by the conditions
outside, both values of xC and de remained approximately the same. Therefore,
according to Formula (9) [see Section 4.3.1], during the repeated culture of the same
batch of P. stipitis beads, the system co-efficiencies of all these fermentation
processes were expected to be similar. Experimental results support this theory. All
together six time courses were carried out using immobilized P. stipitis. Two were
carried out to investigate the fermentation characteristics [see Section 5.2.1]; two
were carried out at different aeration levels [see Section 5.2.2], and two were carried
out with different initial xylose concentrations [see Section 5.2.3]. Similar system
co-efficiencies were obtained in all six time courses [0.553, 0.581, 0.577, 0.524,
0.536 and 0.489 g/l/h respectively]. This evidence further confirms the viewpoint that
the system co-efficiency only relates to the viable cell concentration [xC] and cell
instantaneous ethanol production rate [de].
The similar system co-efficiencies also indicated that in contrast to free cell culture
of P. stipitis, the system co-efficiency of immobilized culture was hardly affected by
external environmental conditions. It is more an intrinsic characteristic for each batch
of immobilized beads, determined by the original biomass entrapped within, and the
diameter and compactness of the gel beads. Consequently, the system co-efficiency

Chapter 5. Immobilized cultures of Z. mobilis and P. stipitis
107
reported here [~0.5 g/l/h] was only a characteristic of the beads used in this study; the
variation of the value was mainly from the different ethanol yield caused by ethanol
re-assimilation.
5.3.2.3. Effects of initial xylose concentration on the immobilized P. stipitis
culture
According to Formula (9) [see Section 4.3.1], the initial sugar concentration does not
have a direct effect on the system co-efficiency [Qp]. However, higher initial sugar
concentration is always desirable for an industrial production process, because it
leads to a higher final ethanol concentration, which will decrease the equipment cost
and make the subsequent distillation process more cost efficient. In some early
studies investigating the optimum initial sugar concentration for xylose fermentation
(Laplace et al., 1991b; Bravo et al., 1995; Kruse and Schugerl, 1996), 25 g/l was
reported as the optimum value; any higher level of xylose including 50 g/l was
claimed to inhibit the fermentation.
The results obtained in this study were contrary to these reports. In the free cell
culture of P. stipitis on xylose, efficient ethanol production was achieved with 50 g/l
initial xylose [system co-efficiency of 0.755 g/l/h with ethanol yield of 0.45 g/g]. In
the immobilized culture with an increased xylose concentration of 80 g/l, inferior
system co-efficiency was achieved [0.489 g/l/h], but it was mainly due to the reduced
ethanol yield [0.37 g/g]. Moreover, the value of 0.489 g/l/h still compared favorably
with other recent studies [0.44 g/l/h as reported by Nigma’s (2001a) and 0.20 g/l/h as
reported by Agbogbo et al. (2006)]. The increased initial xylose level did not show
inhibitory effects on the xylose metabolism by P. stipitis in this study.
Another interesting feature from the experiment involving different initial sugar
levels was the increased fermentation time associated with the increased xylose
concentration. The fermentation time for time courses with 20 g/l, 50 g/l and 80 g/l
initial xylose was 15 h, 34 h and 52 h respectively [see Section 5.2.3]. As discussed
in Section 5.3.2.2, for the immobilized P. stipitis culture, the viable cell concentration
[xC] within the beads and the cell production efficiency [de] were generally at a
similar level when the same batch of beads was recycled. Therefore with larger
amount of sugars in the medium, longer fermentation time was required to utilize all
Chapter 5. Immobilized cultures of Z. mobilis and P. stipitis
108
the sugars. The situation was similar to that discussed for the immobilized Z. mobilis
culture using Formula (8.4) in Section 5.3.1.3.
)(1
12 hN
P
dett
yie=− (8.4)
The fermentation time is determined by the total amount of ethanol produced, which
is a result of the total sugar amount. The only difference in this instance is that the
increase in sugar was from the increase of initial sugar concentration, rather than the
increase of medium volume.
At the beginning of this section, it was said that the system co-efficiency [Qp] was
not directly determined by the initial sugar concentration; this was also explained by
Formula (8.4). By definition,
)//( hlgt
pQ
p
fp = (5)
where the final ethanol concentration [pf] is directly related to the initial sugar
concentration. However, as shown by Formula (8.4), if both values of N and de
remain constant, the increase of initial sugar concentration only results in an increase
of fermentation time [tp], which would counter the increase in pf, and the system
co-efficiency [Qp] would remain at the same level.
In this case, obviously an effective method to increase the system co-efficiency is to
decrease the ratio of substrate [Pyie] to biomass [N]. With a small amount of sugar in
the medium and a relatively high biomass level, an efficient conversion could be
easily achieved. For instance, a number of previous studies reporting a high Qp value
were achieved in shake flasks with small volumes of fermentation medium (Parekh
et al., 1986; Qian et al., 2006).
In conclusion, immobilized P. stipitis showed some significant differences in the
fermentation characteristics in comparison with the immobilized Z. mobilis. The
yeast preferred to grow in the fermentation medium rather than inside the beads, with
significant cell leakage occurring in all time courses. The low rate of biomass
accumulation within the beads and the similar fermentation performance when
recycled suggested that the yeast cells had a low activity inside the beads. The

Chapter 5. Immobilized cultures of Z. mobilis and P. stipitis
109
system co-efficiency of immobilized P. stipitis culture was hardly affected by the
different aeration levels and different initial xylose levels in the fermentation process.
Therefore it could be said that the system co-efficiency is more of an intrinsic
characteristic for each batch of P. stipitis beads, determined by the amount of
biomass inside the beads and the properties of the gel material. Given all of the
above factors, P. stipitis was not considered suitable for the micro-encapsulation.
Fermentation schemes involving immobilized P. stipitis were therefore considered to
be inappropriate for the co-fermentation process of a glucose/xylose sugar mixture.

Chapter 6. Co-fermentation of glucose/xylose mixture to ethanol
110
Chapter 6
Co- ferm entat ion of
glucose/ xylose m ixture to ethanol
Prior to the fermentation of the bagasse hydrolysate to ethanol, a simulated sugar
mixture was fermented using Z. mobilis and P. stipitis to establish an optimized
fermentation scheme. The process design of the sugar mixture co-fermentation was
based on the results from Chapters 4 and 5. Four fermentation schemes were
investigated, viz. sequential culture, free cell co-culture, co-culture involving
immobilized Z. mobilis and co-culture in a modified bioreactor. Conditions for each
fermentation scheme were as described in Section 3.7.4. In all co-fermentation
processes, unless otherwise stated, the inoculum size used for the two strains was
50% respectively, and the air flow level was controlled at 80 cm3/min. According to
results of these experiments, the potential interactions between Z. mobilis and P.
stipitis during a co-culture process were discussed and validated using shake flask
experiments. Finally, P. stipitis was also individually cultured on the glucose/xylose
sugar mixture, as a contrast to the co-culture process.
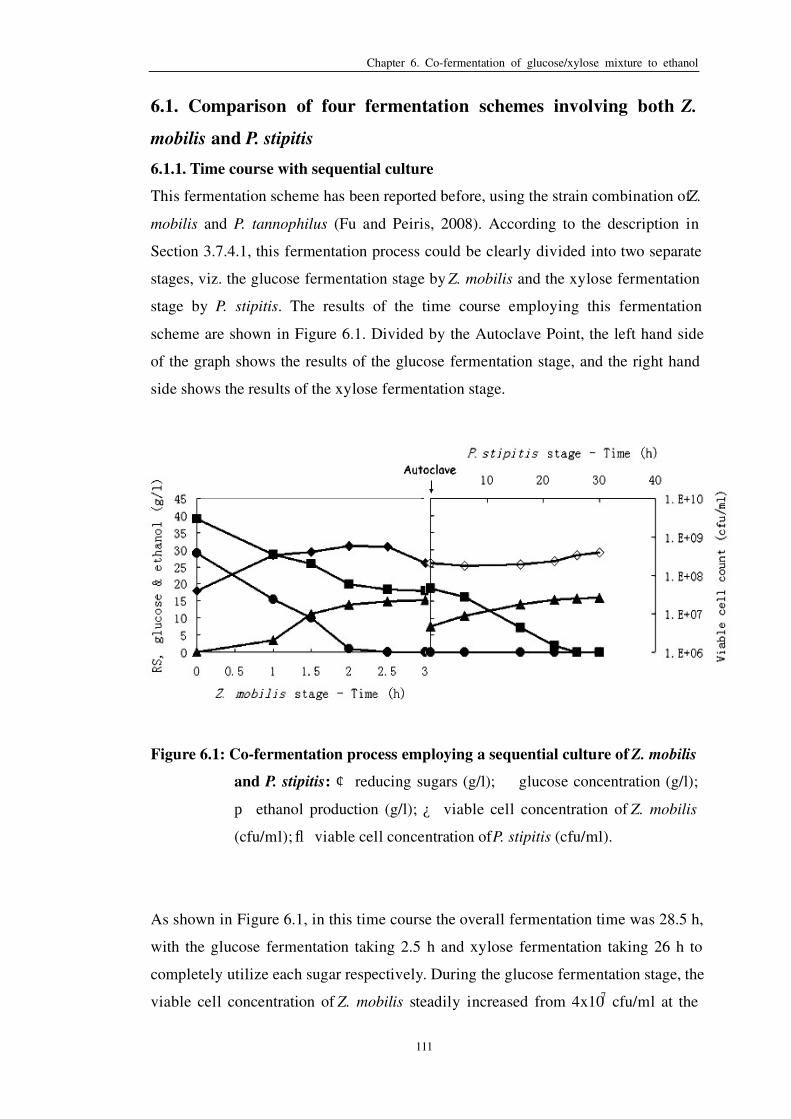
Chapter 6. Co-fermentation of glucose/xylose mixture to ethanol
111
6.1. Comparison of four fermentation schemes involving both Z.
mobilis and P. stipitis
6.1.1. Time course with sequential culture
This fermentation scheme has been reported before, using the strain combination of Z.
mobilis and P. tannophilus (Fu and Peiris, 2008). According to the description in
Section 3.7.4.1, this fermentation process could be clearly divided into two separate
stages, viz. the glucose fermentation stage by Z. mobilis and the xylose fermentation
stage by P. stipitis. The results of the time course employing this fermentation
scheme are shown in Figure 6.1. Divided by the Autoclave Point, the left hand side
of the graph shows the results of the glucose fermentation stage, and the right hand
side shows the results of the xylose fermentation stage.
Figure 6.1: Co-fermentation process employing a sequential culture of Z. mobilis
and P. stipitis: ¢ reducing sugars (g/l); � glucose concentration (g/l);
p ethanol production (g/l); ¿ viable cell concentration of Z. mobilis
(cfu/ml); fl viable cell concentration of P. stipitis (cfu/ml).
As shown in Figure 6.1, in this time course the overall fermentation time was 28.5 h,
with the glucose fermentation taking 2.5 h and xylose fermentation taking 26 h to
completely utilize each sugar respectively. During the glucose fermentation stage, the
viable cell concentration of Z. mobilis steadily increased from 4x10⁷ cfu/ml at the
Chapter 6. Co-fermentation of glucose/xylose mixture to ethanol
112
beginning to 5.9x10⁸ cfu/l in 2 h, giving an ethanol yield of approximately 0.51 g/g
[15.31 g/l ethanol from 30 g/l glucose]. The concentration of ethanol however
decreased to 7.61 g/l because of the evaporation at the autoclaving stage, and then
re-increased to 16.04 g/l at the end of the xylose fermentation process. During the 30
h of P. stipitis culture, only a two fold increase in the viable cell concentration was
observed [from 2.1x10⁸ cfu/ml to 4.0x10
8 cfu/ml].
Table 6.1: Kinetic parameters of the time course employing a sequential culture
Fermentation process
Glucose stage Xylose stage Overall
Ethanol peak time (h) 2.5 26 28.5
System co-efficiency (g/l/h) 6.13 0.32 0.83
Ethanol yield (g/g) 0.51 0.42 0.47
Table 6.1 summarizes the kinetic parameters of the sequential culture process. The
overall fermentation performance was high, achieving a system co-efficiency of 0.83
g/l/h and an ethanol yield of 0.47 g/g. Glucose fermentation by Z. mobilis kept its
usual high efficiency even in the presence of 20 g/l xylose in the medium; the system
co-efficiency was 6.13 g/l/h, similar to that achieved in other sole glucose
fermentation processes using an inoculum size of 50% [6.39 g/l/h; see Section 4.1].
The system co-efficiency of the xylose fermentation stage [0.32 g/l/h] showed an
inferior result compared to the sole xylose fermentation [0.734 g/l/h] reported in
Section 4.2.3. However, the low efficiency of the xylose fermentation stage was
compensated by the efficient conversion of glucose. The overall system efficiency of
the sequential culture [0.83 g/l/h] remained higher than the best result obtained in the
sole xylose fermentation [0.755 g/l/h].
6.1.2. Time courses with co-culture of free cells
Theoretically the simultaneous culture of Z. mobilis and P. stipitis was expected to
result in the simultaneous utilization of glucose and xylose, and consequently reduce
the total fermentation time in comparison with the sequential culture. However,
previous studies (Taniguchi et al., 1997b; Sanchez et al., 2002) pointed out that the

Chapter 6. Co-fermentation of glucose/xylose mixture to ethanol
113
xylose assimilation of P. stipitis was significantly affected by catabolite repression
due to glucose. Furthermore, interactions between the two co-cultured strains could
also affect the fermentation process. For the purpose of maximizing the ethanol
production, four time courses were carried out employing the co-culture of free cells
of Z. mobilis and P. stipitis under various conditions. As shown in Table 6.2, three of
them employed an inoculum size of 50% for both strains with different aeration
levels, and the last one increased the inoculum size of P. stipitis to 100%, with Z.
mobilis inoculum staying at 50% and air flow level controlled at 80 cm3/min.
Table 6.2: Kinetic parameters of four time courses using free cell co-culture
Co-culture processes with free cells
Air flow level (cm3/min) P. stipitis inoculum Kinetic parameters
50 80 100 100%
Fermentation time (h) 47 35 46 44
Sugar consumption (%) 87% 86% 91% 91%
Sugar uptake rate (g/l/h) 0.92 1.23 0.99 1.04
Ethanol yield (g/g) 0.38 0.43 0.40 0.42
System co-efficiency (g/l/h) 0.349 0.518 0.385 0.424
Table 6.2 presents the kinetic parameters of four time courses employing the free cell
co-culture of Z. mobilis and P. stipitis. Although different environmental conditions
were used, in all four processes the sugars could not be completely utilized by the
end of the fermentation. In general the four time courses gave a similar performance.
Highest system co-efficiency [0.518 g/l/h] was obtained in the process with the
standard inoculum size at 80 cm3/min air flow; however, this was mainly due to the
shorter fermentation time in this time course [35 h compared to 44-47 h in other time
courses]. Though not shown in the table, glucose fermentation in all time courses
was efficient and not affected by the presence of the xylose substrate and yeast cells.
All the glucose was completely converted into ethanol within 3 h after the
fermentation began. By contrast, the efficiency of the xylose fermentation was
considerably low. A sole xylose fermentation process with an initial concentration of

Chapter 6. Co-fermentation of glucose/xylose mixture to ethanol
114
20 g/l [carried out with immobilized P. stipitis culture; see Section 5.2.3] could
successfully convert all the xylose to ethanol within 15 h. However, with the same
concentration of xylose in the co-culture, all four processes failed to use up the
xylose by the end of the time course [35-47 h]. The xylose fermentation after 20 h
was almost stagnant. The adjustment of both aeration level and viable cell
concentration of P. stipitis had hardly any effect on the improvement of xylose
fermentation efficiency.
Biomass growth in these four time courses, however, showed some unusual trends.
The trends in the three time courses employing the 50% inoculum size for P. stipitis
were comparatively similar. The results of viable cell concentration in two time
courses using different inoculum sizes of P. stipitis, viz. 100% inoculum size and
50% inoculum size with 50 cm3/min, are shown in Figure 6.2. As can be seen from
Figure 6.2 (a), in both time courses there was no biomass growth observed for the
yeast cells. Time course with an inoculum size of 100% for P. stipitis had a higher
level of viable cells compared to the one with 50 % inoculum size [3~4x10⁸ cfu/ml
compared to 1~2x10⁸ cfu/ml]; but the cell concentration did not show any significant
increase in either process.
On the other hand, the Z. mobilis cell concentration showed a steady decrease in both
time courses after the glucose was completely utilized [~3 h], which was a rational
trend considering that glucose was the only carbon source for the bacterium in the
medium. However, a large increase of Z. mobilis viable cells occurred in both time
courses around 11 h, when there was no glucose but only xylose left in the
fermentation medium. This observation of re-increase of Z. mobilis during the xylose
fermentation stage was also observed for the time course employing 50% inoculum
size of P. stipitis at 80 cm3/min. In the time course with 100% inoculum size, it even
occurred twice [11 h & 33 h]; each time the bacterial cells showed a more than 10
fold increase [~1x10⁷ cfu/ml to ~3x10
8 cfu/ml]. In this study, it has been proved that
Z. mobilis is unable to utilize xylose for it is unable to grow on the Xylose Agar plate.
Therefore, this re-increase of bacterial cells in an environment lacking necessary
carbon sources is very unusual. It indicates some interactions between P. stipitis and
Z. mobilis cells which have the potential to stimulate the bacterial cell growth.

Chapter 6. Co-fermentation of glucose/xylose mixture to ethanol
115
In general, all four time courses co-culturing the free cells of P. stipitis and Z. mobilis
gave a poor fermentation performance. The low efficiency of the xylose fermentation
suggested that this fermentation scheme is not suitable for the co-fermentation of
glucose/xylose sugar mixture. In order to improve the fermentation performance of
co-culture as well as to investigate the potential interactions between the two strains,
immobilized Z. mobilis was used to replace the free cells for the co-culture with P.
stipitis.
( a) P. st i pi t i s
1. E+08
1. E+09
0 10 20 30 40 50Ti me ( h)
Viab
le c
ell
conc
entr
atio
n (c
fu/m
l)
50 ml / mi n 100%
( b) Z. mobi l i s
1. E+05
1. E+06
1. E+07
1. E+08
1. E+09
0 10 20 30 40 50Ti me ( h)
Viab
le c
ell
conc
entr
atio
n(c
fu/m
l)
50 ml / mi n 100%
Figure 6.2: Viable cell results of two time courses with free cell co-culture: (a) P.
stipitis, (b) Z. mobilis.

Chapter 6. Co-fermentation of glucose/xylose mixture to ethanol
116
6.1.3. Time courses with co-culture involving immobilized Z. mobilis
This fermentation scheme co-cultured immobilized Z. mobilis in gel beads together
with free cells of P. stipitis. For all three time courses carried out, the inoculum size
for Z. mobilis culture was a full batch of beads, which was originally made of cells
from 400 ml medium into 100 ml beads; for P. stipitis, the inoculum size of 50% was
used. Similar to the experiments carried out for both immobilized Z. mobilis and
immobilized P. stipitis culture, the same batch of beads were repeatedly cultured to
investigate the effect of recycling the beads on the fermentation performance. All
three time courses were carried out under same environmental conditions with an air
flow level of 80 cm3/min.
Table 6.3: Kinetic parameters of three time courses employing co-culture with
immobilized Z. mobilis
Repeated culture of Z. mobilis beads
Kinetic parameters
1st TC 2
nd TC 3
rd TC
Fermentation time (h) 24 29 37
Sugar consumption (%) 100% 100% 91%
Ethanol yield (g/g) 0.44 0.42 0.43
System co-efficiency (g/l/h) 0.868 0.687 0.501
Table 6.3 presents the kinetic parameters of three time courses repeatedly culturing
the same batch of Z. mobilis beads together with free cells of P. stipitis on the
glucose/xylose sugar mixture medium. Although environmental parameters
employed for the three time courses were identical, the fermentation performance
showed some significant differences with the repeated usage of the same beads. In
the first time course, all sugars [30 g/l glucose & 20 g/l xylose] were completely
consumed within 24 h, resulting in a system co-efficiency of 0.868 g/l/h and an
ethanol yield of 0.44 g/g. This system co-efficiency was higher than that achieved
with sequential culture [0.83 g/l/h], which provided an optimized fermentation
environment for each strain respectively. However, with the repeated usage of the

Chapter 6. Co-fermentation of glucose/xylose mixture to ethanol
117
same batch of immobilized beads, the performance deteriorated. Fermentation time
increased to 29 h to consume all the sugars, and the system co-efficiency and ethanol
yield decreased to 0.687 g/l/h and 0.42 g/g respectively. In the third time course with
the second reuse of the beads, sugars failed to be consumed within 37 h, and the
system co-efficiency further decreased to 0.501 g/l/h.
The lowered fermentation performance during the bead recycling process was
unexpected, given that the same process led to an increase of fermentation
performance for the sole glucose fermentation [see Section 5.1.2]. It was also
observed that the bead damage became increasingly severe while recycling. The
trends of viable cell growth in the fermentation medium of these three processes are
shown in Figure 6.3.
Similar to the free cell co-culture processes [see Section 6.1.2], no increase in the
viable cell concentration was observed for P. stipitis, suggesting a poor biomass
growth. In the first two time courses, the yeast cells leveled off at a level of 4~5x10⁸
cfu/ml through the whole process. In the third time course, viable cells of P. stipitis in
the medium decreased gradually from 1.8x10⁸ cfu/ml to 7.0x10
7 cfu/ml during the
fermentation. The low cell concentration could result in the low efficiency of xylose
fermentation in this process.
For all three time courses, the free cell concentration of Z. mobilis in the
fermentation medium was generally at a low level [maximum 3.5x10⁷ cfu/ml], as a
result of the immobilization. Viable cell concentration of the bacterial cells in the
medium increased during the first 4 h of the fermentation, when there was still
glucose left in the medium. The highest level was achieved in the third time course
[3.5x10⁷ cfu/ml], which gave the poorest fermentation performance. By contrast, the
first time course showing the highest ethanol production efficiency had the lowest
cell leakage between 0 h and 4 h [free cell concentration: 1~3x10⁶ cfu/ml]. During
the later xylose fermentation, the concentration of viable Z. mobilis cells was low,
but still detectable by the viable cell assay [3~7x10⁶ cfu/ml]. The large re-increase of
Z. mobilis cells during the xylose fermentation which occurred in the free cell
co-culture was not observed in any of the three time courses.

Chapter 6. Co-fermentation of glucose/xylose mixture to ethanol
118
( a) P. st i pi t i s
1. E+07
1. E+08
1. E+09
0 10 20 30 40 50Ti me ( h)
Viab
le c
ell
conc
entr
atio
n (c
fu/m
l)
1st Ti me cour se 2nd Ti me cour se 3r d Ti me cour se
( b) Z. mobi l i s
1. E+05
1. E+06
1. E+07
1. E+08
0 10 20 30 40 50Ti me ( h)
Viab
le c
ell
conc
entr
atio
n (c
fu/m
l)
1st Ti me cour se 2nd Ti me cour se 3r d Ti me cour se
Figure 6.3: Viable cell results of three time courses co-culturing immobilized Z.
mobilis and free cells of P. stipitis: (a) P. stipitis, (b) Z. mobilis in the
medium.
As for the reduced fermentation performance associated with the repeated culture, it
was suggested that the reuse of the same batch of Z. mobilis beads resulted in
increasing bead damage, which released more free cells of Z. mobilis to the
fermentation medium and the xylose fermentation by P. stipitis was thus affected.
This difference in the viable cell concentration of Z. mobilis could hardly be seen
from Figure 6.3 (b), because the high concentration of P. stipitis cells greatly

Chapter 6. Co-fermentation of glucose/xylose mixture to ethanol
119
interfered with the plate reading of Z. mobilis colonies when there was a 100 fold
difference in the cell concentration of the two strains. However, the bead damage
could be observed visually. The fermentation process of a co-culture usually lasted
for approximately 30 h, while the glucose fermentation stage generally finished
within 4 h. After that, all the immobilized Z. mobilis beads remained in the
fermentation medium, playing no part in the ethanol production but interfering with
the xylose fermentation. The exposure for a long time to the fermentation medium at
pH around 4 with a rotor and impellor significantly decreased the bead life. As a
consequence, with recycling of the beads in the co-culture time courses, the bead
damage became increasingly severe.
In summary, the efficiency of xylose fermentation in the sugar mixture decreased
with the continuous bead damage during the recycling of the beads and the
subsequent increased cell leakage of Z. mobilis. In addition with the results obtained
from the free cell co-culture processes, where all four processes failed to fully utilize
the xylose [see Section 6.1.2], it appears that the existence of Z. mobilis cells in the
fermentation medium inhibited the xylose fermentation by P. stipitis. The bead
damage of immobilized Z. mobilis due to the prolonged exposure to the fermentation
medium also affected the bead life and increased the cost. For both reasons, a
fermentation scheme employing a modified bioreactor was developed to remove all
the immobilized beads after the completion of glucose fermentation.
6.1.4. Time courses with co-culture in a modified bioreactor
As described in Section 3.7.4.4, this fermentation scheme was a novel design used in
this study. It enabled the removal of immobilized Z. mobilis from the fermentation
medium during a co-fermentation process without disturbing the ongoing xylose
fermentation. The use of the modified fermentor in a time course is shown in Figure
6.4. As can be seen in Figure 6.4 (a), the added sieve plate in the modified bioreactor
had a mesh size that was smaller than the diameter of the gel beads; therefore after
inoculation, the immobilized Z. mobilis beads could only stay on top of the sieve
plate, while the free cells of P. stipitis were distributed throughout the medium,
making the medium turbid and cloudy because of the high cell concentration. Stirring
of the fermentation medium was carried out with the rotor underneath the sieve plate.
The results reported in Section 5.1.3 showed that the efficiency of the glucose

Chapter 6. Co-fermentation of glucose/xylose mixture to ethanol
120
fermentation was not much affected in this system. After the glucose fermentation
was completed, the sieve plate was moved up by a movable device [see Figure 3.5].
As shown in Figures 6.4 (b) and 6.4 (c), the immobilized beads were consequently
separated from the fermentation medium. Xylose fermentation continued without
being interrupted by the removal process. Furthermore, the potential interactions
between Z. mobilis and P. stipitis were minimized.
In this experiment, three inoculum levels with different ratios of the two strains were
investigated for the effect on the fermentation characteristics, with duplicate time
courses at each level. The details are shown in Table 6.4. Same batch of immobilized
Z. mobilis beads were repeatedly used and replaced with fresh beads when the
damage was severe. In each time course, the sieve plate was moved up to remove all
the immobilized Z. mobilis after glucose fermentation was completed.
Table 6.4: Three inoculum levels used for co-culture processes in modified
bioreactor
Immobilized Z. mobilis Free cells of P. stipitis
Level 1 Full batch * 50%
Level 2 1/4 batch 50%
Level 3 1/4 batch 100%
* For the immobilized Z. mobilis inoculum, “full batch” refers to the use of all beads
made from 400 ml Z. mobilis cells into 100 ml gel beads, while “1/4 beads” refers to
the use of 1/4 beads (w/w) out of a full batch.

Chapter 6. Co-fermentation of glucose/xylose mixture to ethanol
121
(a) (b) (c)
Figure 6.4: Modified bioreactor showing the removal of immobilized Z. mobilis beads by the sieve plate: (a) immobilized Z.
mobilis co-cultured with free cells of P. stipitis in the bioreactor; (b) & (c) sieve plate was raised, separating the
immobilized beads containing Z. mobilis and xylose fermentation continuing with the beads away from the fermentation
medium.

Chapter 6. Co-fermentation of glucose/xylose mixture to ethanol
122
Kinetic parameters of time courses with different inoculum levels are reported in
Table 6.5. With the addition of the sieve plate, the results of co-fermentation
processes were remarkably more stable compared to that achieved without a sieve
plate [see Section 6.1.3]. All six time courses [duplicate of three inoculum levels]
gave steady and comparable fermentation efficiencies. For time courses with
inoculum level 1, the inoculum size was similar to that employed for the co-culture
process without a sieve plate [full batch of Z. mobilis beads and 50% of P. stipitis],
and a similar result was obtained. The fermentation took 25 h to utilize both sugars in
the medium; the overall system efficiency was 0.868 g/l/h and the ethanol yield was
0.45 g/g. The fermentation performance was further improved for time courses using
the level 2 inoculum. With a decrease of Z. mobilis inoculum size to 1/4 of the
inoculum level 1, the fermentation was completed within 22 h, giving an
exceptionally high ethanol yield of 0.50 g/g, which was 98% of the theoretical
conversion rate. The system co-efficiency reached 1.126 g/l/h, which was the highest
value achieved in a co-fermentation process so far. The inoculum level 3 employing a
100% inoculum size of P. stipitis was an attempt to further increase the efficiency of
the xylose conversion. It was expected that the double inoculum size of P. stipitis
could improve the system co-efficiency proportionally; however, the result was not
as high as expected. Fermentation time decreased to 19 h, together with an increase
in the system co-efficiency to 1.277 g/l/h and an ethanol yield of 0.49 g/g.
Table 6.5: Kinetic parameters of time courses with co-culture in modified
bioreactor
Co-culture in modified bioreactor
Inoculum level * Kinetic parameters
Level 1 Level 2 Level 3
Fermentation time (h) 25 22 19
Ethanol yield (g/g) 0.45 0.50 0.49
System co-efficiency (g/l/h) 0.867 1.126 1.277
* See details in Table 6.4.

Chapter 6. Co-fermentation of glucose/xylose mixture to ethanol
123
Viable cell results of three time courses at each inoculum level are presented in
Figure 6.5. The trends of biomass in these time courses were steady as expected,
which consequently ensured a stable fermentation efficiency. P. stipitis cell
concentration in time courses using an inoculum size of 50% generally leveled off at
4~5x10⁸ cfu/ml, with a slight decrease observed while the fermentation was
progressing. In the time courses with higher inoculum size of 100%, a higher level of
yeast cell concentration was attained [7~9x10⁸ cfu/ml]. On the other hand, the free
cell concentration of Z. mobilis was controlled at a minimum level as a result of the
removal of immobilized Z. mobilis beads after the completion of glucose
fermentation. As stated in Section 3.10.2.1, in Figure 6.5 (b) all values of 1x10⁵
cfu/ml indicate that at this sampling point no Z. mobilis cells could be discerned on
the plates of viable cell assay. It can be clearly seen that in all the time courses the
free cell concentration of Z. mobilis was generally low, indicating a low level of cell
leakage from the immobilized beads. Even in the time courses with inoculum level 2,
where higher bacterial cell levels were observed, the maximum value remained lower
than 1x10⁸ cfu/ml.
In summary, the results of this experiment suggested that the fermentation scheme
with the sieve plate gave a much more stable fermentation performance compared to
the one without the sieve plate. When the same inoculum size was used for two time
courses with and without sieve plate, similar results were obtained. A decrease of
inoculum size for immobilized Z. mobilis beads resulted in significant increases in
both the system co-efficiency and ethanol yield. A conversion rate of 96-98% of the
theoretical was achieved. Further increase of inoculum size of P. stipitis also helped
to improve the fermentation performance. The optimized ethanol production
resulting from the increased ratio of P. stipitis cells to Z. mobilis cells further
suggests that the Z. mobilis cells might have some inhibitory effects on the xylose
fermentation by P. stipitis.

Chapter 6. Co-fermentation of glucose/xylose mixture to ethanol
124
( a) P. st i pi t i s
1. E+08
1. E+09
1. E+10
0 5 10 15 20 25 30 35Ti me ( h)
Viab
le c
ell
conc
entr
atio
n (c
fu/m
l)
I nocul um l evel 1 I nocul um l evel 2 I nocul um l evel 3
( b) Z. mobi l i s
1. E+05
1. E+06
1. E+07
1. E+08
1. E+09
0 5 10 15 20 25 30 35Ti me ( h)
Viab
le c
ell
conc
entr
atio
n (c
fu/m
l)
I nocul um l evel 1 I nocul um l evel 2 I nocul um l evel 3
Figure 6.5: Viable cell results of three time courses with co-culture in modified
bioreactor: (a) P. stipitis, (b) Z. mobilis in the medium.
6.1.5. Comparison of three co-culture processes with different fermentation
schemes
Amongst the four fermentation schemes involving both Z. mobilis and P. stipitis for
the co-fermentation of glucose/xylose mixture in this study, three of them were
co-culture processes simultaneously inoculating two strains to start the fermentation
process, viz. the co-culture with free cells, the co-culture with immobilized Z.
mobilis, and the co-culture carried out in the modified bioreactor. A comparison is

Chapter 6. Co-fermentation of glucose/xylose mixture to ethanol
125
made here on the sugar utilization and ethanol production of three time courses from
each fermentation scheme. The time courses selected are: free cell co-culture with an
air flow level of 80 cm3/min, the first time course employing the co-culture with
immobilized Z. mobilis, and a time course carried out in the modified bioreactor at
inoculum level 2. The selection was based on the inoculum size of P. stipitis; all three
time courses employed an inoculum size of 50%. Therefore, the contribution of P.
stipitis on the fermentation performance is presumably the same; the effects of the
fermentation scheme and the inoculum size of Z. mobilis are the major factors to be
compared. For convenience of identification, these three fermentations are named as
“FS 1”, “FS 2” and “FS 3” (FS: fermentation scheme) in this section.
The results of sugar utilization and ethanol production of these three time courses are
shown in Figure 6.6. As can be seen in Figure 6.6 (a), glucose in the fermentation
medium was consumed efficiently in all three time courses. Both Time course FS 1
employing an inoculum size of 50% for Z. mobilis and Time course FS 2 employing
a full batch of immobilized Z. mobilis beads completely consumed all the glucose
[30 g/l] within 3 h, whereas Time course FS 3 with only 1/4 batch of immobilized Z.
mobilis beads took 6 h to complete the glucose fermentation.
In all three time courses, xylose was hardly consumed when glucose was used up
[remained at a level of 20 g/l]. It can be seen from Figure 6.6 (b) that the trends of
reducing sugar utilization in both time courses of FS 1 and FS 2 could be clearly
distinguished as the glucose fermentation stage and the xylose fermentation stage.
Between 0 h and 3 h, i.e. the glucose fermentation stage, the reducing sugar
concentration showed a steep decrease; after that, the sugar utilization rate markedly
slowed down. By contrast, the reducing sugar curve of time course FS 3 is much
smoother. Though the glucose utilization in this time course was not as efficient as
that in the other two, the xylose consumption was faster, demonstrating the best
balanced glucose and xylose fermentation amongst the three time courses.

Chapter 6. Co-fermentation of glucose/xylose mixture to ethanol
126
( a) Gl ucose
0
5
10
15
20
25
30
35
0 5 10 15 20 25 30 35Ti me ( h)
Gluc
ose
(g/l
)
FS 1 FS 2 FS 3
( b) Reduci ng sugar
05
1015202530354045
0 5 10 15 20 25 30 35Ti me ( h)
Redu
cing
sug
ar(g
/l)
FS 1 FS 2 FS 3
( c) Et hanol
0
5
10
15
20
25
30
0 5 10 15 20 25 30 35Ti me ( h)
Etha
nol
(g/l
)
FS 1 FS 2 FS 3
Figure 6.6: Comparison of co-culture processes in different fermentation
schemes: (a) glucose, (b) reducing sugar, (c) ethanol (FS 1: free cell
co-culture; FS 2: co-culture with immobilized Z. mobilis and free cells
of P. stipitis; FS 3: co-culture in a modified bioreactor).

Chapter 6. Co-fermentation of glucose/xylose mixture to ethanol
127
The trends of ethanol production in the three time courses were in accordance with
the trends of sugar utilization. As shown in Figure 6.6 (c), in time course FS 1 and FS
2, the ethanol production increased steeply during the first 3 h of glucose
fermentation, indicating a high efficiency of ethanol production by Z. mobilis from
glucose. This rate significantly slowed down on the commencement of the xylose
fermentation, which corresponded to the slow sugar utilization rate in Figure 6.6 (b).
In contrast, the ethanol production in FS 3 was less steep in the first 3 h, but
increased steadily during the xylose fermentation stage, and finally peaked at 22 h.
The corresponding trends between sugar utilization and ethanol production indicate
that the ethanol production is directly related to the sugar consumption. For time
courses with free cell co-culture and co-culture with immobilized Z. mobilis, the
fermentation process can be clearly divided into the glucose fermentation stage and
xylose fermentation stage, based on the different rate of sugar uptake and ethanol
yield. The efficient conversion of glucose to ethanol was completed within 3 h
because of the large inoculum size used for Z. mobilis; however, the efficiency of
xylose fermentation was low. In contrast, the time course carried out in the modified
bioreactor showed a lower efficiency of the glucose fermentation as a result of the
reduced inoculum size of Z. mobilis. However, the subsequent xylose fermentation
gave a comparably high performance, resulting in the most balanced glucose and
xylose fermentation and the best results for the glucose/xylose co-fermentation
amongst the three fermentation schemes.
6.2. Effect of increased initial sugar level in the co-culture process
As pointed out in Section 5.3.2.3, for industrial ethanol production it is always
desirable to ferment with a high initial sugar level for economic viability. This
experiment investigated the co-culture process with increased sugar levels. The
initial sugar concentration was increased to 45 g/l glucose and 30 g/l xylose, which
was 1.5 fold of the standard medium. The other medium components were as listed
in Table 3.2. The experiment employed the fermentation scheme with the best results
for the glucose/xylose co-fermentation, i.e. the co-culture carried out in a modified
bioreactor. The inoculum sizes used for two time courses were a full batch and a 1/2

Chapter 6. Co-fermentation of glucose/xylose mixture to ethanol
128
batch of immobilized Z. mobilis beads respectively, co-cultured with 50% P. stipitis.
Table 6.6 presents the kinetic parameters of these two time courses. It took 45 h and
42 h for two time courses to completely utilize the sugars respectively. The resulting
system co-efficiency was 0.679 g/l/h and 0.878 g/l/h, which was lower than that
achieved in the time courses with standard initial sugar level of 50 g/l [0.867, 1.126
and 1.277 g/l/h for each inoculum level; see Table 6.5]. The time course with a
decreased inoculum size of Z. mobilis gave a relatively higher system co-efficiency
[0.878 g/l/h]. However, the ethanol concentration reached a peak [31.61 g/l] at 36 h
when there was 3.14 g/l xylose left in the medium, and then decreased to 27.22 g/l at
42 h when all sugar was completely utilized.
Table 6.6: Kinetic parameters of two time courses with co-culture on 45 g/l
glucose and 30 g/l xylose
Inoculum size
Kinetic parameters 1 batch Z. mobilis &
50% P. stipitis
1/2 batch Z. mobilis &
50% P. stipitis
Fermentation time (h) 45 42
Time when ethanol peaked (h) 45 36
Ethanol yield (g/g) 0.42 0.46
System co-efficiency (g/l/h) 0.679 0.878
Comparing the fermentation performance of the two time courses carried out with 75
g/l initial sugar, the one with the larger inoculum size of Z. mobilis [a full batch
compared to 1/2 batch of beads] showed an inferior fermentation performance; both
the system co-efficiency [0.679 g/l/h] and ethanol yield [0.42 g/g] was lower than
those in the time course with fewer cells of Z. mobilis [0.878 g/l/h and 0.46 g/g
respectively]. This trend was in accordance with that observed for fermentation
processes with lower initial sugar level of 50 g/l reported in previous sections. The
efficiency of xylose fermentation improved when there were fewer free cells of Z.
mobilis released into the fermentation medium from the immobilized beads.

Chapter 6. Co-fermentation of glucose/xylose mixture to ethanol
129
The viable cell results of these two time courses supported this observation. Figure
6.7 shows the biomass growth of P. stipitis and Z. mobilis in the fermentation
medium. The cell concentration of P. stipitis in two time courses was at a similar
level because of the same inoculum size employed; it leveled out at 4~6x10⁸ cfu/ml
with slight decrease towards the end. By contrast, the free cell level of Z. mobilis was
considerably different in the two processes. During the whole process of the time
course with a full batch of Z. mobilis, the bacterial cells in the medium were
generally around 106-10
7 cfu/ml, while for the one with lower inoculum level, the
viable cells of Z. mobilis were barely detectable for most of the fermentation process.
( a) P. st i pi t i s
1. E+07
1. E+08
1. E+09
0 10 20 30 40 50Ti me ( h)
Viab
le c
ell
conc
entr
atio
n (c
fu/m
l)
TC wi t h f ul l bat ch Z. mobi l i s TC wi t h 1/ 2 bat ch Z. mobi l i s
( b) Z. mobi l i s
1. E+05
1. E+06
1. E+07
1. E+08
0 10 20 30 40 50Ti me ( h)
Viab
le c
ell
conc
entr
atio
n (c
fu/m
l)
TC wi t h f ul l bat ch Z. mobi l i s TC wi t h 1/ 2 bat ch Z. mobi l i s
Figure 6.7: Viable cell results of the two time courses with co-culture on 45 g/l
glucose and 30 g/l xylose: (a) P. stipitis, (b) Z. mobilis in the medium.
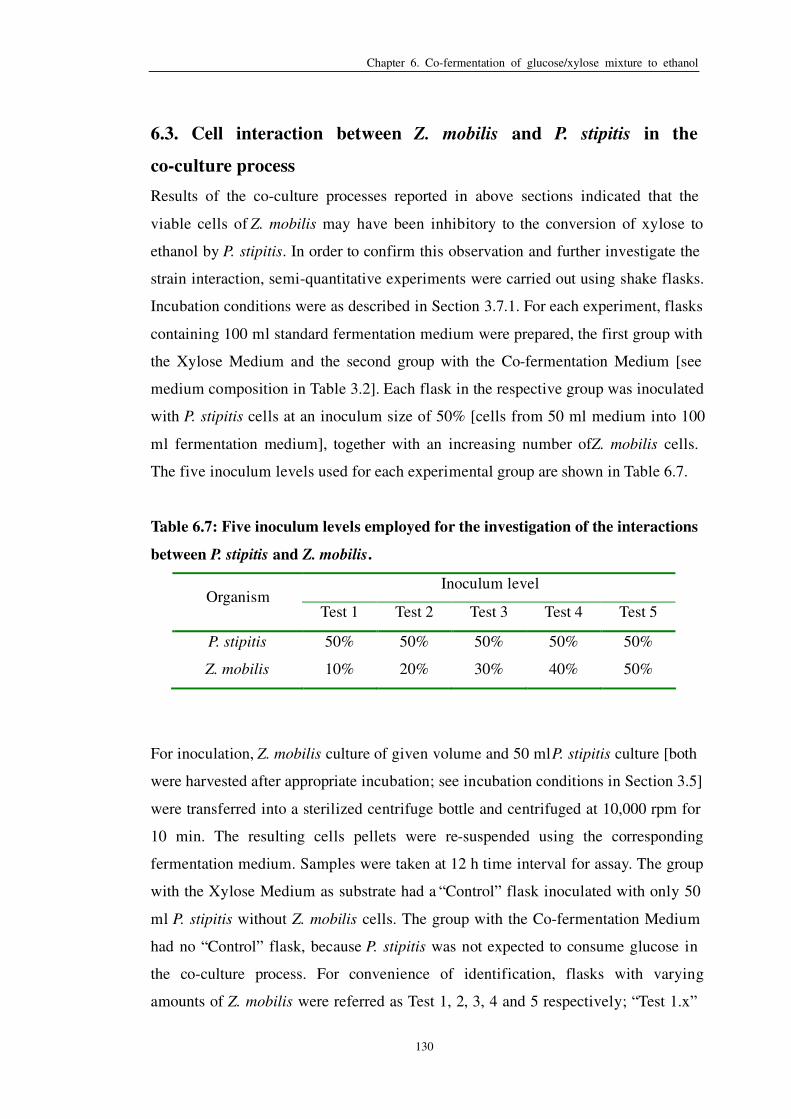
Chapter 6. Co-fermentation of glucose/xylose mixture to ethanol
130
6.3. Cell interaction between Z. mobilis and P. stipitis in the
co-culture process
Results of the co-culture processes reported in above sections indicated that the
viable cells of Z. mobilis may have been inhibitory to the conversion of xylose to
ethanol by P. stipitis. In order to confirm this observation and further investigate the
strain interaction, semi-quantitative experiments were carried out using shake flasks.
Incubation conditions were as described in Section 3.7.1. For each experiment, flasks
containing 100 ml standard fermentation medium were prepared, the first group with
the Xylose Medium and the second group with the Co-fermentation Medium [see
medium composition in Table 3.2]. Each flask in the respective group was inoculated
with P. stipitis cells at an inoculum size of 50% [cells from 50 ml medium into 100
ml fermentation medium], together with an increasing number of Z. mobilis cells.
The five inoculum levels used for each experimental group are shown in Table 6.7.
Table 6.7: Five inoculum levels employed for the investigation of the interactions
between P. stipitis and Z. mobilis.
Inoculum level Organism
Test 1 Test 2 Test 3 Test 4 Test 5
P. stipitis 50% 50% 50% 50% 50%
Z. mobilis 10% 20% 30% 40% 50%
For inoculation, Z. mobilis culture of given volume and 50 ml P. stipitis culture [both
were harvested after appropriate incubation; see incubation conditions in Section 3.5]
were transferred into a sterilized centrifuge bottle and centrifuged at 10,000 rpm for
10 min. The resulting cells pellets were re-suspended using the corresponding
fermentation medium. Samples were taken at 12 h time interval for assay. The group
with the Xylose Medium as substrate had a “Control” flask inoculated with only 50
ml P. stipitis without Z. mobilis cells. The group with the Co-fermentation Medium
had no “Control” flask, because P. stipitis was not expected to consume glucose in
the co-culture process. For convenience of identification, flasks with varying
amounts of Z. mobilis were referred as Test 1, 2, 3, 4 and 5 respectively; “Test 1.x”

Chapter 6. Co-fermentation of glucose/xylose mixture to ethanol
131
referred to those with the Xylose Medium, and “Test 2.x” referred to those with the
Co-fermentation Medium.
6.3.1. Effect of Z. mobilis cells on the P. stipitis fermentation on the Xylose
Medium
Samples were taken at 12 h, 24 h and 36 h; results of biomass concentration of P.
stipitis and Z. mobilis and ethanol production in each flask are shown in Figure 6.8.
The viable cell concentration of P. stipitis was not significantly affected by the
presence of Z. mobilis cells in the medium. In all five “Test” flasks, P. stipitis
maintained a substantial biomass level between 108 and 10
9 cfu/ml, due to the same
inoculum size used for each flask. However, after 36 h culture, the biomass
concentration in all “Test” flasks was generally less than that in the “Control” flask,
implying less cell growth of P. stipitis in the presence of Z. mobilis cells.
The biomass growth of Z. mobilis in these five flasks showed some unusual trends.
As the Xylose Medium was used as substrate for the two strains, there was no
available carbon source for Z. mobilis because of its inability to assimilate xylose. As
a consequence, the bacterium in all five “Test” flasks managed to survive the first 12
h, and decreased to a level that was undetectable on all plates in the viable cell assay
at 24 h. However, a re-increase of bacterial cells occurred in all five “Test” flasks at
36 h; viable cells of Z. mobilis generally increased to approximately 107~10
8 cfu/ml,
with higher concentrations observed in the flask with higher inoculum size.
The overall ethanol production at 36 h of these flasks is shown in Figure 6.8 (c). It
can be clearly seen that, compared to the “Control” flask without Z. mobilis, all five
“Test” flasks containing bacterial cells gave much less ethanol production [only 1/2 –
2/3 of the concentration in the “Control” flask]. Moreover, the ethanol concentration
tended to decrease along with the increase of Z. mobilis cell concentration in the
medium [Flask “Test 1.5” gave the lowest ethanol yield of all, 4.48 g/l].

Chapter 6. Co-fermentation of glucose/xylose mixture to ethanol
132
1. E+08
1. E+09
Viab
le c
ell
coun
t(c
fu/m
l)
Cont r ol Test 1. 1 Test 1. 2 Test 1. 3 Test 1. 4 Test 1. 5
( a) P. st i pi t i s concent r at i on
12 h 24 h 36 h
1. 00E+05
1. 00E+06
1. 00E+07
1. 00E+08
1. 00E+09
Viab
le c
ell
coun
t(c
fu/m
l)
Cont r ol Test 1. 1 Test 1. 2 Test 1. 3 Test 1. 4 Test 1. 5
( b) Z. mobi l i s concent r at i on
12 h 24 h 36 h
( c) Et hanol pr oduct i on at 36 h9. 37
6. 096. 83 6. 69
5. 51
4. 48
0
2
4
6
8
10
Cont r ol Test 1. 1 Test 1. 2 Test 1. 3 Test 1. 4 Test 1. 5
Etha
nol
(g/l
)
Figure 6.8: Strain interactions between Z. mobilis and P. stipitis – Xylose
Medium: (a) viable cells of P. stipitis, (b) viable cells of Z. mobilis, (c)
overall ethanol production.

Chapter 6. Co-fermentation of glucose/xylose mixture to ethanol
133
6.3.2. Effect of Z. mobilis cells on the P. stipitis fermentation on the
Co-fermentation Medium
For the experiment carried out on the Co-fermentation Medium, samples were taken
at 12 h and 24 h and assayed for sugar utilization, biomass and ethanol production.
Figure 6.9 presents the results of P. stipitis growth, Z. mobilis growth and the ethanol
yield. Results obtained in this experiment on the Co-fermentation Medium were
considerably different to those obtained on the Xylose Medium. Although the
inoculum size of P. stipitis was the same for all flasks, the viable cell concentrations
of P. stipitis achieved in this experimental group [2~4x10⁸ cfu/ml] were generally
lower than those achieved in the first experimental group [4~5x10⁸ cfu/ml]. A
notable trend was that at 12 h, when the glucose fermentation by Z. mobilis in each
flask was just completed, the flasks with a higher initial number of Z. mobilis clearly
showed fewer P. stipitis cells. However, with the progress of the fermentation and the
exhaustion of glucose, this difference was reduced. P. stipitis cells at 24 h in all five
flasks were at a similar level, which was still less than those achieved in the five
flasks reported above without glucose as a substrate.
By contrast, the biomass growth of Z. mobilis in these five flasks was remarkably
vigorous. Though different inoculum levels were employed, at 12 h all five flasks
gave a similar cell concentration of the bacterium around 1.0x10⁹ cfu/ml. From 12 h
to 24 h, although its only carbon source, glucose, had been completely utilized, in the
first three flasks Z. mobilis managed to maintain this high level of viable cells. In
“Test 2.4” & “Test 2.5” which were inoculated with higher amount of bacterial cells,
the cell concentration decreased slightly. This trend could explain the difference in
growth of P. stipitis in these five flasks. As shown in Figure 6.9 (a), between 12 h and
24 h, in “Test 2.1” & “Test 2.2” where Z. mobilis concentration stayed constant, the
viable cell concentration of P. stipitis decreased, whereas in “Test 2.4” & “Test 2.5”
where Z. mobilis concentration decreased, the viable cell concentration of P. stipitis
increased.

Chapter 6. Co-fermentation of glucose/xylose mixture to ethanol
134
1. E+08
1. E+09
Viab
le c
ell
coun
t(c
fu/m
l)
Test 2. 1 Test 2. 2 Test 2. 3 Test 2. 4 Test 2. 5
( a) P. st i pi t i s concent r at i on
12 h 24 h
1. 00E+06
1. 00E+07
1. 00E+08
1. 00E+09
1. 00E+10
Viab
le c
ell
coun
t(c
fu/m
l)
Test 2. 1 Test 2. 2 Test 2. 3 Test 2. 4 Test 2. 5
( b) Z. mobi l i s concent r at i on
12 h 24 h
( c) Et hanol pr oduct i on
16. 617. 06 16. 99 17. 09 17. 23
18. 3417. 78
17. 1217. 42
16. 86
15
16
17
18
19
20
Test 2. 1 Test 2. 2 Test 2. 3 Test 2. 4 Test 2. 5
Etha
nol
(g/l
)
12 h 24 h
Figure 6.9: Strain interactions between Z. mobilis and P. stipitis –
Co-fermentation Medium: (a) viable cells of P. stipitis, (b) viable cells
of Z. mobilis, (c) overall ethanol production.

Chapter 6. Co-fermentation of glucose/xylose mixture to ethanol
135
Ethanol production in these five flasks containing a glucose/xylose sugar mixture
showed some significant differences. It can be seen from Figure 6.9 (c) that, at 12 h
all five flasks yielded a high ethanol concentration, as a result of the complete
glucose fermentation by Z. mobilis. Flasks containing higher initial levels of Z.
mobilis cells tended to give slightly higher ethanol concentration [ethanol
concentration in “Test 4.4” & “Test 4.5” was slightly higher compared to that in other
flasks], because the earlier the glucose fermentation was completed, the sooner the
xylose fermentation commenced. However, from 12 h to 24 h, the situation changed.
There was little ethanol production in all five flasks during these 12 h, even when P.
stipitis cells and the residual xylose in the medium were both at a high concentration.
The highest ethanol accumulation occurred in “Test 2.1” which was inoculated with
the lowest amount of Z. mobilis cells; however, the increase in the ethanol production
was only 1.74 g/l between 12 h and 24 h [16.60 g/l to 18.34 g/l]. The lowest overall
ethanol production by the end of the time course was in the flask containing the
highest initial concentration of Z. mobilis cells [“Test 2.5”]; ethanol concentration
showed a decrease from 17.23 g/l to 16.86 g/l between 12 h and 24 h. The addition of
glucose to the medium, which resulted in an increased level of Z. mobilis cells, was
accompanied by a poor performance of xylose fermentation by P. stipitis. The xylose
fermentation efficiency in this experimental group was considerably lower compared
to that in the group using only xylose as carbon source.
Based on these results, the interactions between Z. mobilis and P. stipitis in a
co-culture process could be as follows. The presence of Z. mobilis cells in the
medium, whether with or without glucose, affected the xylose fermentation by P.
stipitis in an adverse manner. Firstly, flasks containing a higher initial level of Z.
mobilis cells gave a lower ethanol production; secondly, the efficiency of xylose
fermentation considerably decreased when P. stipitis was co-cultured with Z. mobilis
in the Co-fermentation Medium, where the bacterium was able to grow to a high cell
concentration. The second interaction is that Z. mobilis appeared to be able to grow
on the xylose metabolic process of P. stipitis. This enabled Z. mobilis to multiply to a
high cell concentration even in a medium completely devoid of an appropriate
external carbon source.

Chapter 6. Co-fermentation of glucose/xylose mixture to ethanol
136
6.4. Sole culture of P. stipitis on glucose/xylose sugar mixture medium
All three xylose fermenters, viz. P. stipitis, C. shehatae and P. tannophilus, are
capable of assimilating both glucose and xylose, and producing ethanol under
suitable conditions (Kruse and Schugerl, 1996; Taniguchi et al., 1997b; Sanchez et al.,
1999; Sanchez et al., 2002; Agbogbo et al., 2006). The reported fermentation
efficiencies were low, due to the yeast’s low fermentation capability of glucose and
the catabolite repression caused by the glucose on the xylose fermentation. These
results were, however, achieved with the normal inoculum size. In this study it was
proved that an increased inoculum size of P. stipitis significantly improves its
fermentation performance; consequently there was a need to investigate the effect of
increased inoculum size of P. stipitis on the glucose/xylose co-fermentation. The
experiment was first carried out in shake flasks and then scaled up into a 1 l
bioreactor.
6.4.1. Investigation of fermentation performance in shake flasks
Experimental conditions were as described in Section 3.7.1. Flasks with 100 ml
Co-fermentation Medium were inoculated with P. stipitis cells at an inoculum size of
100%. Incubation was carried out at both 100 and 200 rpm shaking speeds, and
samples were taken at 12 h and 24 h for sugar, biomass and ethanol assays.
0
5
10
15
20
25
12 h 24 h 12 h 24 h
Reduci ng sugar ( g/ l ) Et hanol ( g/ l )
100 r pm 200 r pm
Figure 6.10: Results of shake flask experiments of P. stipitis on the
Co-fermentation Medium.

Chapter 6. Co-fermentation of glucose/xylose mixture to ethanol
137
Results for reducing sugar and ethanol are shown in Figure 6.10. The sugar
utilization at both shaking speeds was considerably efficient. At 12 h there was only
11.68 g/l and 7.63 g/l residual sugar at 100 and 200 rpm respectively, and at 24 h all
the sugars was completely utilized. An ethanol yield of 0.49 g/g was achieved within
24 h in both flasks [24.1 g/l for Flask “100 rpm” and 24.47 g/l for Flask “200 rpm”].
The flask with the higher shaking speed [200 rpm] performed the fermentation
process more efficiently, giving faster sugar utilization and ethanol production. This
again indicated that with higher biomass concentration, a higher aeration level was
required to match the oxygen requirement for each cell. The increased efficiency of
ethanol production in the flask cultured at 200 rpm was associated with a higher
biomass concentration in the medium. As can be seen in Figure 6.11, at both 12 h and
24 h, the viable cell concentration of P. stipitis in the Flask “200 rpm” was
approximately 30% higher than that in the Flask “100 rpm” [~2.0x10⁹ cfu/ml
compared to ~1.5x10⁹ cfu/ml].
1. E+08
1. E+09
1. E+10
Viab
le c
ell
numb
ers
(cfu
/ml)
12 h 24 h 12 h 24 h 36 h
Co- f er ment at i onMedi um
Xyl ose Medi um
100 r pm 200 r pm
Figure 6.11: Comparison of biomass growth of P. stipitis on the Co-fermentation
Medium and the Xylose Medium
It was also observed that the biomass growth of P. stipitis was much more vigorous
on the glucose/xylose sugar mixture substrate compared to that on the sole xylose
substrate. Figure 6.11 compares the viable cell concentration of P. stipitis cultured on

Chapter 6. Co-fermentation of glucose/xylose mixture to ethanol
138
the Co-fermentation Medium [results of this experiment] and on the Xylose Medium
[see Section 4.2.6]. Under the same culture conditions, the biomass concentration in
the flasks with glucose was generally higher than that in the flasks containing only
xylose.
The sole culture of P. stipitis on the glucose/xylose sugar mixture medium gave a
remarkably high fermentation performance, which was at a similar level to the
co-culture process involving immobilized Z. mobilis and free cells of P. stipitis in a
modified 1 l bioreactor. A comparison of kinetic parameters of the two processes is
made in Table 6.8; the result achieved in the shake flask at 200 rpm shaking speed is
compared to that from the co-culture process in a modified bioreactor using
“inoculum level 3” [see Section 6.1.4]. Both processes employed an inoculum size of
100% for P. stipitis. Since the sample point at “24 h” may not be the ethanol peak
time for the shake flask experiment, values at “12 h” are compared to those obtained
at “11 h” in the co-culture process for the calculation of kinetic parameters.
Table 6.8: Comparison of two co-fermentation processes: P. stipitis sole culture
in the shake flask and two strains co-culture in the bioreactor
P. stipitis sole culture Co-culture
Fermentation scale 100 ml in 250 ml
flask
800 ml in 1 l
fermentor Process
characteristics Strain that fermented glucose P. stipitis Z. mobilis
Sampling time [t, h] 11 12
Ethanol yield [Yp/st, g/g] 0.49 0.50
Sugar uptake rate [Qst, g/l/h] 3.531 3.594
System co-efficiency [Qpt, g/l/h] 1.752 1.819
Kinetic
parameters
Average viable cell concentration
of P. stipitis [xCt, cfu/ml]
2.0x10⁹ 4.9x10
8
As can be seen in Table 6.8, although these two processes of glucose/xylose
co-fermentation were carried out in different bioreactors with different strains, the
kinetic parameters of two processes were exceptionally similar. This similarity of the

Chapter 6. Co-fermentation of glucose/xylose mixture to ethanol
139
fermentation performance could be directly attributed to the high biomass
concentration of P. stipitis in the flask. The viable cell concentration of P. stipitis in
the flask was four times as high as that in the 1 l fermentor [2.0x10⁹ cfu/ml compared
to 4.9x10⁸ cfu/ml]. This high cell concentration probably compensated for the
inferior glucose fermentation efficiency of P. stipitis compared to that of Z. mobilis,
resulting in a similar overall fermentation performance. These results suggested that
P. stipitis under suitable conditions had the potential to give as good a result as the
co-culture on the glucose/xylose co-fermentation. Therefore, the P. stipitis sole
culture on the sugar mixture medium was scaled up to 1 l bioreactor to further
investigate its fermentation performance.
6.4.2. Co-fermentation of glucose/xylose sugar mixture by sole culture of P.
stipitis in a 1 l bioreactor
This fermentation scheme would be more suitable than a co-culture process for
industrial applications if it could give a better or similar fermentation performance.
The culture process of one strain is simpler, easier and more controllable, without the
need to consider strain interactions when two strains are co-cultured. In order to
investigate further this possibility, three time courses were carried out, culturing P.
stipitis on 800 ml Co-fermentation Medium in a 1 l bioreactor. The main
experimental conditions are as described in Section 3.7.4.5. The inoculum size and
aeration level employed for each time course are shown in Table 6.9, together with
the kinetic parameters achieved in each process.
Table 6.9: Process conditions and kinetic parameters for P. stipitis sole culture
on the Co-fermentation Medium
TC 1 TC 2 TC 3
Inoculum size 50% 100% 100% Process
conditions Air flow (cm3/min) 50 80 300
Fermentation time (h) 22 24 20
Ethanol yield (g/g) 0.42 0.44 0.44
System co-efficiency (g/l/h) 0.952 0.874 1.092 Kinetic
parameters Specific ethanol
productivity (g/g/h)
0.184 0.102 0.124

Chapter 6. Co-fermentation of glucose/xylose mixture to ethanol
140
As shown in Table 6.9, the adopted inoculum and aeration conditions are
significantly different amongst these three time courses. The air flow level of 300
cm3/min employed in Time Course 3 was the highest level used in this study.
However, the fermentation performance of the three processes was found to be
similar. The fermentation time of three time courses was 22 h, 24 h and 20 h,
resulting in a system co-efficiency of 0.952 g/l/h, 0.874 g/l/h and 1.092 g/l/h
respectively. Time Course 3 using a 100% inoculum size of P. stipitis with 300
cm3/min air flow gave the highest fermentation efficiency. The system co-efficiency
of 1.092 g/l/h was comparable to the best results achieved with the co-culture process
in a modified fermentor [1.126~1.277 g/l/h, see Section 6.1.4], but the ethanol yield
was considerably lower [0.44 g/g compared to 0.50 & 0.49 g/g]. Ethanol
re-assimilation could be an explanation of the reduced ethanol yields, which was
observed in all three time courses after the ethanol peaked.
The differences in the kinetic parameters between these three time courses are not so
significant when the different process conditions are taken into consideration. It can
be seen from Figure 6.12, the trends of biomass concentration in these three time
courses were generally similar, although different inoculum sizes and aeration levels
were employed. The viable cell concentration in Time course 1 with 50% inoculum
size increased to a similar level to that in the other two time courses with 100%
inoculum size after only 12 h growth. Moreover, Time courses 2 and 3 had a 3.75
fold difference on the aeration level [80 cm3/min for TC 2 and 300 cm
3/min for TC
3], which could lead to a significant difference in the fermentation performance when
P. stipitis is cultured on xylose [see Section 4.2.4], but it had no apparent effect when
the glucose/xylose sugar mixture was used as substrate.
The fermentation details of Time Course 3 are shown in Figure 6.13. Glucose in the
medium [30 g/l] was completely utilized in 9 h, and xylose [20 g/l] was fully
consumed by 20 h. The reducing sugar curve was smooth during the whole process,
without a clear distinction of the glucose and xylose fermentation stages. Ethanol
production showed a steady increase during the 20 h of fermentation time, and
perceptibly decreased after peak, indicating the ethanol re-assimilation by the yeast
cells. All these trends suggested a sequential utilization of the glucose and xylose;
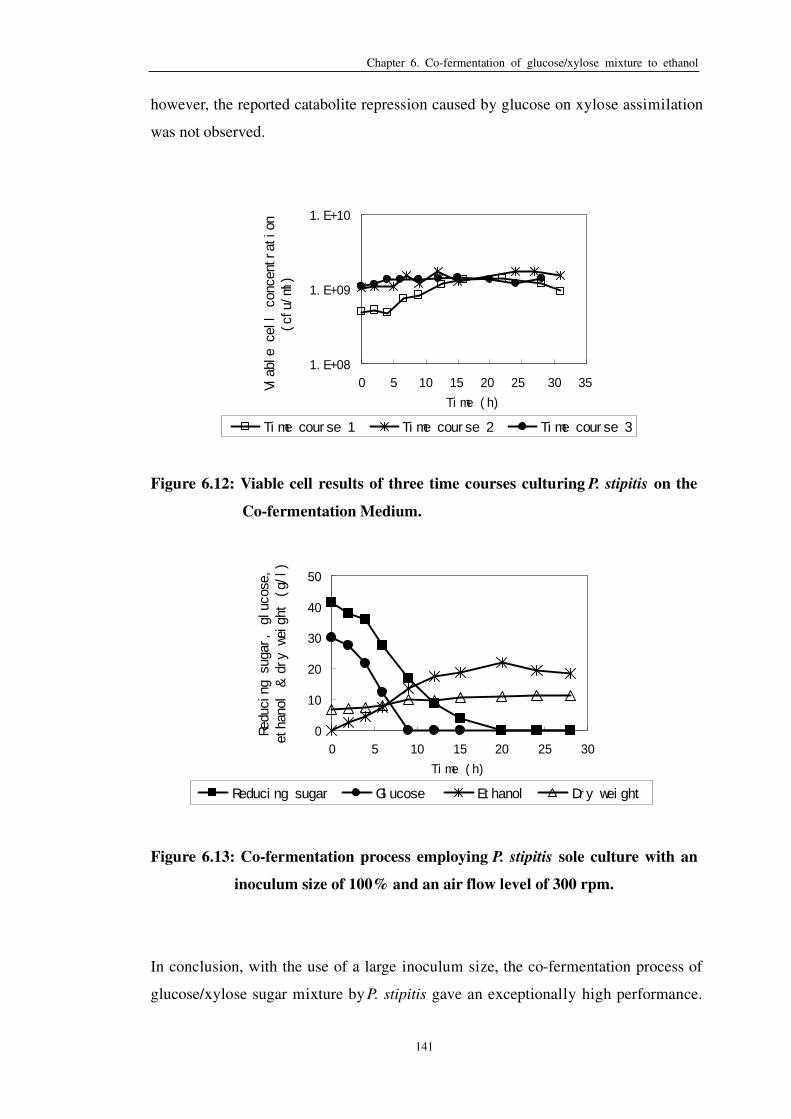
Chapter 6. Co-fermentation of glucose/xylose mixture to ethanol
141
however, the reported catabolite repression caused by glucose on xylose assimilation
was not observed.
1. E+08
1. E+09
1. E+10
0 5 10 15 20 25 30 35
Ti me ( h)
Viab
le c
ell
conc
entr
atio
n(c
fu/m
l)
Ti me cour se 1 Ti me cour se 2 Ti me cour se 3
Figure 6.12: Viable cell results of three time courses culturing P. stipitis on the
Co-fermentation Medium.
0
10
20
30
40
50
0 5 10 15 20 25 30
Ti me ( h)
Redu
cing
sug
ar,
gluc
ose,
etha
nol
& dr
y we
ight
(g/
l)
Reduci ng sugar Gl ucose Et hanol Dr y wei ght
Figure 6.13: Co-fermentation process employing P. stipitis sole culture with an
inoculum size of 100% and an air flow level of 300 rpm.
In conclusion, with the use of a large inoculum size, the co-fermentation process of
glucose/xylose sugar mixture by P. stipitis gave an exceptionally high performance.

Chapter 6. Co-fermentation of glucose/xylose mixture to ethanol
142
The achieved system co-efficiency was similar to the best results from the co-culture
process, but the ethanol yield was lower.
6.5. Discussion
6.5.1. Comparison of co-fermentations with four fermentation schemes
employing two strains
6.5.1.1. Sequential culture
As shown in Table 6.1, the overall system co-efficiency and the ethanol yield
achieved using this scheme were 0.83 g/l/h and 0.47 g/g respectively. Both values
demonstrated a high ethanol production efficiency in comparison with previous
reports (Lebeau et al., 1997; Kordowska-Wiater and Targonski, 2002; de Bari et al.,
2004; Agbogbo et al., 2006). Details of these studies have been reviewed in Section
2.4.2. The main factor ensuring this high fermentation performance was the separate
cultivation processes for two strains respectively. Each strain was provided with
optimum conditions; thus both fermentations of glucose and xylose could be carried
out efficiently.
However, the system co-efficiency of the xylose fermentation stage in the sequential
culture was 0.32 g/l/h, which was only half the value obtained in the optimized sole
xylose fermentation process [0.734 g/l/h; see Section 4.2.3]. The possible causes
could be the initial ethanol concentration from the preceding glucose fermentation
[7.61 g/l left after autoclaving], or the un-optimized oxygenation level during this
stage. Nevertheless, because of the remarkably high efficiency of the glucose
fermentation by Z. mobilis, the overall system co-efficiency remained high [0.83
g/l/h]. This indicated that the separate culture of Z. mobilis and P. stipitis sequentially
was a simple and convenient approach for the glucose/xylose sugar mixture
co-fermentation.
This process overcame several difficulties reported in other processes. Firstly, it
successfully converted the glucose/xylose sugar mixture to ethanol at a high
efficiency. The process is considered difficult, and unsuccessful processes of
glucose/xylose co-fermentation often lead to inferior system co-efficiency compared
to the sole culture processes of two strains individually (Grootjen et al., 1991a).

Chapter 6. Co-fermentation of glucose/xylose mixture to ethanol
143
Previous processes reporting high system co-efficiency were often established at the
expense of incomplete consumption of xylose in the mixture (Laplace et al., 1993a).
Compared to a reported process using the same fermentation scheme, the use of P.
stipitis instead of P. tannophilus improved the overall system co-efficiency 4 fold
[0.83g/l/h compared to 0.23 g/l/h] (Fu and Peiris, 2008). It was also found that the
fermentation performance of Z. mobilis was not affected by the presence of xylose,
which was in accordance with a previous study (Lawford and Rousseau, 2003).
The fermentation scheme of sequential culture, however, had some disadvantages.
The separation of sugar mixture into two parts for fermentation increased the time
required for the utilization of sugars. Furthermore, as Z. mobilis cells needed to be
inactivated by autoclaving, extra energy input was required, resulting in an increase
in costs.
6.5.1.2. Co-culture process of free cells
Simultaneous culture of two strains on the glucose/xylose sugar mixture medium is
expected to combine both fermentations of glucose and xylose into a single stage and
therefore reduce the fermentation time. However, as shown in Table 6.2, in none of
four time courses were all the sugars in the medium completely utilized, regardless
of inoculum size and air flow level. This again proved that the co-fermentation of a
glucose/xylose sugar mixture represents a technical difficulty, due to the interference
of the two fermentation processes. The efficient glucose fermentation in association
with the stagnant xylose fermentation indicated that this simple co-culture of Z.
mobilis and P. stipitis was not a good fermentation scheme for glucose/xylose
co-fermentation. This conclusion was in accordance with the observations in the
literature. All three reports of successful co-culture of a glucose fermenter and a
xylose fermenter needed some engineering to either the strains or the process
(Taniguchi et al., 1997b; de Bari et al., 2004; Qian et al., 2006) [see Section 2.4.2].
A possible reason for the poor fermentation performance of free cell co-culture could
be the unfavorable biomass growth. In Chapters 4 and 5 it was found that the viable
cell concentration is very crucial to the overall fermentation efficiency. An interesting
observation on the biomass growth in the free cell co-culture was that Z. mobilis was
able to multiply to a high cell concentration during the xylose fermentation stage

Chapter 6. Co-fermentation of glucose/xylose mixture to ethanol
144
when there was no external carbon source available [see Figure 6.2]. It would be
interesting to know the source from which the bacterial cells obtained the energy
required for multiplication. The observation of the re-increase of Z. mobilis cells was
made in three time courses out of four, and also occurred in the shake flask
experiment investigating the two strains’ interactions [see Section 6.3.1]. Therefore,
it appears that some factors from P. stipitis metabolism on xylose stimulated the
bacterial growth.
6.5.1.3. Co-culture process with immobilized Z. mobilis and free cells of P. stipitis
The co-culture of immobilized Z. mobilis and free cells of P. stipitis has some
prominent advantages for the conversion of the glucose/xylose sugar mixture to
ethanol. Firstly, it is able to provide each strain with optimum environmental
conditions, i.e. semi-anaerobic conditions for Z. mobilis inside the beads and
optimum level of oxygenation for P. stipitis in the fermentation medium. Secondly,
the simultaneous fermentation of two sugars saves the overall fermentation time
compared to sequential culture. Thirdly, it has all the advantages of the immobilized
culture for Z. mobilis, e.g. the easier recovery and multiple reuses by recycling. In
addition, it also allows the separation of Z. mobilis cells from the fermentation
medium whenever necessary, without disturbing the ongoing xylose fermentation.
As shown in Table 6.3, the utilization of immobilized Z. mobilis instead of free cell Z.
mobilis in the co-culture with P. stipitis resulted in a successful conversion of 30 g/l
glucose and 20 g/l xylose to ethanol within 24 h. This is one of the best results
reported for the glucose/xylose co-fermentation to date. The resulting system
co-efficiency of 0.868 g/l/h was even higher than that of the sequential culture [0.83
g/l/h]. Previous studies on the co-culture process reporting a comparable result to this
included a system co-efficiency of 0.94 g/l/h within 40 h (Taniguchi et al., 1997b),
0.53 g/l/h within 40 h (de Bari et al., 2004), and 0.70 g/l/h within 24 h (Qian et al.,
2006); all of these have been discussed in detail in Section 2.4.2. The result reported
here also compared favorably with some of the best results using recombinant strains,
e.g. system co-efficiency of 0.76 g/l/h within 24 h using a recombinant Z. mobilis
strain (Krishnan et al., 2000), and a system co-efficiency of 0.66 g/l/h within 48 h
using a recombinant E. coli strain (Takahashi et al., 2000). Moreover, in this study a
high xylose proportion up to 40% [60% of glucose and 40% of xylose] was used as

Chapter 6. Co-fermentation of glucose/xylose mixture to ethanol
145
the substrate, which further increased the difficulty of the co-fermentation process. It
is thus demonstrated that the fermentation scheme of immobilized Z. mobilis and free
cells of P. stipitis is an excellent scheme for the co-fermentation of glucose/xylose
sugar mixture.
Compared to the fermentation scheme with free cell co-culture, the result achieved in
this time course indicated that the strain combination of Z. mobilis and P. stipitis is
able to carry out the glucose/xylose co-fermentation efficiently, with the optimum
environmental conditions provided for each strain. With Z. mobilis immobilized
within the gel beads, and P. stipitis exposed to micro-aerobic conditions in the
fermentation medium, both fermentations of glucose and xylose could be processed
without the interference from each other, and the overall fermentation efficiency was
thus improved.
However, when the same batch of beads was repeatedly used, the fermentation
efficiency decreased significantly. In Section 6.1.3, this was suggested to result from
the increased cell leakage of Z. mobilis due to the reuse of beads and the prolonged
exposure of beads to the fermentation medium. It was also suggested that the
released Z. mobilis cells from beads are inhibitory to the xylose fermentation by P.
stipitis. In support of this theory, the removal of the immobilized Z. mobilis beads
from the fermentation medium greatly improved the stability of the fermentation
performance.
6.5.1.4. The removal of Z. mobilis cells from the co-culture process after the
completion of glucose fermentation
The only difference between the co-culture processes carried out in the modified
bioreactor and the co-culture processes involving immobilized Z. mobilis and free
cells of P. stipitis is that it allows the removal of Z. mobilis beads from the
fermentation medium after the completion of glucose fermentation. Through this
procedure, it was possible to decrease the damage to the gel beads and maintain them
in good condition for longer periods. Moreover, the potential effect of Z. mobilis cell
leakage on the xylose fermentation was minimized. Fermentations carried out in the
modified bioreactor demonstrated these advantages. The results of repeated culture
processes were steadier and more reliable, with similar kinetic parameters obtained
Chapter 6. Co-fermentation of glucose/xylose mixture to ethanol
146
for duplicate time courses.
When the same inoculum size was used for the co-culture processes with and without
the sieve plate [full batch of Z. mobilis beads & 50% of P. stipitis], the resulting
fermentation performance was similar. The processes carried out in the modified
bioreactor took 25 h to completely utilize all 50 g/l of the sugar mixture, giving a
system co-efficiency of 0.867 g/l/h, in contrast to 24 h of sugar utilization and 0.868
g/l/h of system co-efficiency for the co-culture process in the unmodified bioreactor.
The slightly longer fermentation time in the modified bioreactor could be attributed
to the addition of the sieve plate, which might increase the difficulty of material
distribution. However, the results achieved in two processes could be considered at a
similar level. This was in accordance with the results reported in Section 5.1.3, which
suggested that the adverse effect of the sieve plate, if any, was negligible. The
improved xylose fermentation performance, which was considerably steadier in the
modified bioreactor, was more significant.
Results also indicated that the free cells of Z. mobilis were inhibitory to the xylose
fermentation process. As shown in Table 6.5, a decreased inoculum size of Z. mobilis
reduced the overall fermentation time from 25 h to 22 h, and significantly improved
the ethanol yield from 0.45 g/g to 0.50 g/g, which was 98% of the theoretical rate.
This was the highest conversion rate achieved in all fermentations involving P.
stipitis in this study. This high ethanol yield remained the same when the inoculum
size of P. stipitis increased to 100% [0.49 g/g], implying that the increased
sugar-ethanol conversion rate was probably from the reduced number of Z. mobilis
cells, rather than any change in the yeast concentration.
This observation is interesting as it relates to how the bacterial cells could possibly
affect the final ethanol yield. While ethanol re-assimilation by P. stipitis has been
reported many times in the literature (Maleszka and Schneider, 1982; Skoog et al.,
1992; Passoth et al., 2003; Gorgens et al., 2005), the same cannot be said for
re-assimilation by Z. mobilis. However, a previous research study by Fu and Peiris
(2008) reported that the ethanol produced by Z. mobilis on glucose was completely
consumed within 36 h under aerobic conditions. Other studies have pointed out that
the wild type Z. mobilis is strictly fermentative, but possesses a complete redox

Chapter 6. Co-fermentation of glucose/xylose mixture to ethanol
147
enzyme system on its cell membrane (Kalnenieks, 2006). Therefore, it might be
possible that the cells of Z. mobilis in the fermentation medium could oxidize the
produced ethanol in a co-culture process. If this is true, then the improved ethanol
yield arising from the reduced inoculum size of Z. mobilis could be explained; the
reduced number of Z. mobilis free cells released to the medium resulted in a lower
ethanol re-assimilation rate during xylose fermentation by P. stipitis. This theory
could also explain the apparent inhibition caused by viable cells of Z. mobilis on the
P. stipitis cell activity. If Z. mobilis oxidizes ethanol under aerobic conditions, then it
would consume oxygen and less oxygen would be available for the P. stipitis
metabolism. Therefore, higher the concentration of Z. mobilis cells in the
fermentation medium, the slower would be the xylose utilization.
Finally, when it comes to the effect of P. stipitis inoculum size, an increase from 50%
to 100% further decreased the overall fermentation time from 22 h to 19 h, giving the
highest system co-efficiency of 1.277 g/l/h amongst all the co-fermentation processes.
However, considering that a double number of P. stipitis cells were in the medium,
the improvement on the fermentation performance was not as high as expected.
Similar to the discussion in Section 4.3.3, this could result from insufficient
oxygenation when the increase in the oxygenation level could not match the increase
in the viable cell concentration.
Given the high levels of both system co-efficiency and ethanol yield as well as the
steady performance during repeated culture, this fermentation scheme of co-culturing
immobilized Z. mobilis and free cells of P. stipitis is considered to be the best
fermentation scheme for the glucose/xylose co-fermentation process using Z. mobilis
as the glucose fermenter and P. stipitis as the xylose fermenter.
6.5.2. Possible interactions between Z. mobilis and P. stipitis in a co-culture
process
Based on the fermentations involving co-culture, there are at least two possible
interactions between Z. mobilis and P. stipitis. Firstly, Z. mobilis viable cells
appeared to inhibit the cell activity of P. stipitis, and consequently both efficiencies
of the yeast cell growth and the xylose fermentation were reduced. Secondly, Z.
mobilis showed an abnormal re-growth during xylose fermentation stage when there

Chapter 6. Co-fermentation of glucose/xylose mixture to ethanol
148
was no appropriate carbon source for utilization. It was also suggested that Z. mobilis
might be able to oxidize the ethanol produced by P. stipitis and further reduce the
overall ethanol yield. This is however more an effect on the fermentation efficiency
rather than an interaction between cells. These observations were confirmed with the
experiments reported in Section 6.3.
As can be seen in both Figures 6.8 and 6.9, the decreased final ethanol concentration
along with the increase in the initial cell number of Z. mobilis indicated the inhibitory
effect of Z. mobilis cells on xylose fermentation by P. stipitis. As discussed in Section
6.5.1.4, this could be caused by either the ethanol re-assimilation, or a reduced
ethanol production resulting from oxygen competition. As far as the biomass growth
of P. stipitis is concerned, in both figures there was a similar trend in that the highest
final concentration of the yeast was achieved in the “Test 3” flask containing an
initial biomass ratio of P. stipitis to Z. mobilis of 5:3, while the lowest concentration
was achieved in the “Test 2” flask containing an initial biomass ratio of 5:2. The
reason responsible for this observation was still unclear. However, comparing the
viable cell levels of P. stipitis between the culture on the Xylose Medium and on the
Co-fermentation Medium, in the Co-fermentation Medium where Z. mobilis
maintained a high cell concentration, P. stipitis cell growth was considerably lower,
and the corresponding xylose fermentation was approximately at a standstill. Both
observations indicate an intense inhibitory effect on the yeast cell activity when there
were more Z. mobilis cells in the medium.
The re-increase of Z. mobilis cells in an environment free of an appropriate carbon
source was shown in Figure 6.8. Both the temporary reduction of cells at 24 h and
the re-increase at 36 h implied that Z. mobilis cells had access to some external
nutrient in the later phase of the process which could stimulate its growth. A
possibility could be that Z. mobilis is able to multiply based on the metabolism
process of xylose by P. stipitis, and this might be achieved by the utilization of some
intermediate metabolites from the xylose metabolism. In Figure 2.2 showing the
metabolism of P. stipitis [see Section 2.3.1], xylose is converted to
glyceraldehydes-3-phosphate through PPP pathway and then enters the glycolytic
pathway, from where the same reactions are used to convert the
glyceraldehydes-3-phosphate to pyruvate and then to ethanol as in the ED pathway

Chapter 6. Co-fermentation of glucose/xylose mixture to ethanol
149
of glucose metabolism in Z. mobilis [see Figure 2.1; Section 2.2.1]. Though the
specific mechanism is still not clear, it is considered to be possible for the bacterium
to utilize some metabolites from P. stipitis for its own growth, since some parts of the
metabolic pathways are the same.
A bolder speculation would be that Z. mobilis directly utilizes the ATP produced
during the glycolytic pathway of xylose metabolism in P. stipitis. This is from the
inference stated in Section 4.3.1 that the cell division of Z. mobilis greatly depends
on the energy supply from ATP. As the metabolism process from
glyceraldehydes-3-phosphate to pyruvate generates 2 ATP in both the glucose
metabolism of Z. mobilis and the xylose metabolism of P. stipitis, it leads to an
interesting question whether it could be possible for the bacterium to directly utilize
the ATP produced by the yeast. Currently there is no literature elaborating the
detailed reproduction mechanism of Z. mobilis. Prior to attempting further
explanations, details of the cell division of Z. mobilis and substance transport
between cells need to be known.
6.5.3. Process considerations for the co-culture process
6.5.3.1. Effects of initial sugar level
A high initial sugar level is a desirable requisite for industrial ethanol production.
However, the co-culture processes with 75 g/l of initial sugars showed inferior results
compared to those with 50 g/l of initial sugars [see Section 6.2]. The reduced
fermentation performance was probably a result of ethanol re-assimilation during the
prolonged fermentation time. As discussed in Section 5.3.2.3, the system
co-efficiency [Qp] is only related to the viable cell concentration [xC] and cell
instantaneous ethanol production rate [de], and the increased initial sugar level has
no direct effect on Qp. In these two fermentation processes with 75 g/l initial sugars,
since the inoculum size and environmental conditions were similar to those processes
containing 50 g/l sugars, both values of xC and de remained constant; consequently a
longer fermentation time was required to utilize the larger amount of sugar in the
medium. During the prolonged fermentation, significant ethanol re-assimilation was
observed for both processes, which directly led to a decreased ethanol yield [0.42 and
0.46 g/g respectively]. The system co-efficiency thus reduced accordingly, on
account of the decreased final ethanol concentration.

Chapter 6. Co-fermentation of glucose/xylose mixture to ethanol
150
Z. mobilis cells in the fermentation medium are considered to be the major reason for
the increased ethanol re-assimilation along with the increased fermentation time.
There were several facts supporting this statement. Firstly, ethanol re-assimilation
was a common phenomenon observed in almost every time course with aeration,
resulting in an ethanol yield around 0.44~0.46 g/g in this study. The further oxidation
of ethanol by P. stipitis was observed and reported in a number of time courses with
sole xylose fermentation [both free cell culture and immobilized culture]. However,
in a co-culture process with oxygen supply, it was difficult to determine which strain
was responsible for ethanol re-assimilation. The only indirect evidence was that in
those time courses achieving high ethanol yields of 0.49~0.50 g/g, it was the reduced
amount of Z. mobilis cells that led to the increased ethanol accumulation [see Section
6.1.4]. Secondly, as Z. mobilis proved to be inhibitory for P. stipitis cell activity, the
yeast’s capability for ethanol re-assimilation under these conditions was doubtful.
Finally, Z. mobilis was able to multiply during the xylose fermentation by P. stipitis.
During a short fermentation time, it is difficult for the bacterium to reproduce to high
levels which could affect the ethanol concentration. However, with longer
fermentation time, the increase of Z. mobilis viable cell concentration to a significant
level is very probable and could cause notable ethanol re-assimilation. The results of
biomass assay for these two processes with 75 g/l sugars provide evidence for this
theory. As shown in Figure 6.7 (b), even after the majority of the bacterial cells were
removed from the fermentation medium at 6 h, the free cells of Z. mobilis in the
fermentation medium showed an increase in the later phase of the fermentation
process.
Though the two fermentation processes with a higher initial sugar level showed a
slightly lower system co-efficiency compared to that with 50 g/l initial sugars, the
inferior results are thought to be mainly from the increased ethanol assimilation
during the longer fermentation time to utilize all the sugars in the medium. Apart
from this trend, there was no apparent inhibitory phenomenon observed for both the
strains’ performance, either by the increased sugar level or by the increased ethanol
level. Consequently, with further process optimization, it is believed that
fermentation with higher initial sugar levels has the potential to achieve a high
performance similar to that with 50 g/l initial sugars.

Chapter 6. Co-fermentation of glucose/xylose mixture to ethanol
151
6.5.3.2. Inoculum size and economic considerations
For an economically feasible process, both the input cost and output benefit need to
be considered. The large inoculum size employed in this study is a cost-increasing
factor, as it requires more medium and a longer time to prepare. Moreover, when P.
stipitis was utilizing xylose as its main carbon source, in both the sole xylose
fermentation process and the co-culture process with Z. mobilis, no significant
biomass growth was observed with an inoculum size larger than 50%. As can be seen
in all figures presenting the biomass trends of the yeast on xylose substrate [see
Figures 4.6 & 4.7 for sole xylose fermentation and 6.2, 6.3 & 6.5 for co-culture],
when the inoculum size was larger than 50%, the overall cell concentration leveled
out, with a slight decrease at the later phase of the process. This biomass loss was
mainly due to the foaming problem, resulting from both the high cell concentration
and the introduced air flow. However, the lack of biomass reproduction indicated a
weak growth capability of P. stipitis on xylose. As reported in Section 4.3.5, the
biomass increase of P. stipitis was considerably lower than that of P. tannophilus
when cultured under similar conditions. Moreover, the yeast’s performance on the
glucose/xylose sugar mixture medium further demonstrated its poor capability of
biomass growth when xylose was the main carbon source. As shown in Figure 6.11
[see Section 6.4.1], with similar inoculum size and incubation conditions, the
achieved biomass concentration of P. stipitis growing on the xylose medium was
only 3/4 of that on the glucose/xylose mixture medium in shake flasks. A similar
trend was also observed in the fermentor [see Figure 6.12, Section 6.4.2]. P. stipitis
showed a steady growth with an inoculum size of 50% when cultured on the
glucose/xylose sugar mixture medium. The peak cell concentration in all three time
courses was around 1.3~1.7x10⁹ cfu/ml, a level that was never achieved by P. stipitis
culture on the xylose medium in this study. Even in the shake flask experiment with
an inoculum size of 200%, the highest biomass concentration was only 1.2~1.4x10⁹
cfu/ml [see Figure 4.9, Section 4.2.6].
All of above data indicate that xylose was not a favorable substrate for P. stipitis cell
reproduction. If this is the case, there are two methods that might be useful to
decrease the cost of a large inoculum size. The first is to use a smaller inoculum size
wherever possible. According to the results for both co-culture process [see Table 6.5,

Chapter 6. Co-fermentation of glucose/xylose mixture to ethanol
152
Section 6.1.4] and P. stipitis sole culture on the xylose medium [see Figure 4.8,
Section 4.2.5], the use of a 100% inoculum size did not increase the fermentation
performance proportionally. The results achieved with a 50% inoculum size were
only slightly inferior. Therefore, unless the fermentation efficiency with a 100%
inoculum size could be further optimized, it is not worth using a larger inoculum size
just for a small gain in performance.
The second approach concerns cell recycling. In the literature review [see Section
2.5.3], it was pointed out that recycling cells was a common method for adapting the
strain to the hydrolysate medium and thus improving fermentation efficiency. It was,
however, hard to determine whether the improvement of performance was as a result
of strain adaptation or simply because of the increased cell concentration during
recycling. Nevertheless, collecting cells from the fermentation process, and reusing
them as an inoculum for the next fermentation process is a very economical method
as it saves on the inoculum cost and improves the cells’ fermentation capability.
There are a number of approaches for achieving this purpose, and each of them has
the potential for industrial application. These include immobilization [not
micro-encapsulation], natural cell sedimentation and membrane recycling system.
The ultimate method of continuously employing the same batch of cells would be
continuous fermentation.
6.5.4. The potential of P. stipitis sole culture for the glucose/xylose
co-fermentation
This experiment was originally carried out as a basic investigation for the
performance of P. stipitis sole culture on the glucose/xylose mixture medium.
However, as pointed out in Section 6.4.1, the results obtained were comparable to the
best results achieved with the co-culture process. The fermentation was consequently
scaled up to a 1 l bioreactor to investigate the fermentation characteristics in detail.
6.5.4.1. Fermentation characteristics of P. stipitis sole culture on the
glucose/xylose mixture medium
Processes carried out in the shake flask experiments and in the 1 l bioreactor [see
Sections 6.4.1 and 6.4.2] gave similar fermentation performance, indicating a
successful scale-up process. In all five processes [two flasks & three time courses in

Chapter 6. Co-fermentation of glucose/xylose mixture to ethanol
153
fermentor], all the sugars in the medium were completely utilized within 24 h, giving
a final ethanol concentration of 24 g/l for the flasks, and 21~22 g/l for the fermentor.
This result was the highest reported in studies investigating the conversion of
glucose/xylose sugar mixture by P. stipitis. The highest system co-efficiency of 1.092
g/l/h was achieved with 100% inoculum size at an air flow of 300 cm3/min [see Table
6.9; Section 6.4.2]. By contrast, it has been reported recently that a system
co-efficiency of 0.19 g/l/h was obtained for P. stipitis on a substrate comprising 75%
glucose and 25 % xylose (Agbogbo et al., 2006).
As analyzed in Sections 6.4.3 and 6.5.3.2, the efficient conversion of sugar mixture
was mainly a result of the vigorous P. stipitis cell growth on the glucose substrate.
The peak viable cell level of P. stipitis in these three time courses was almost twice
as high as that on the sole xylose substrate with an inoculum size of 100%, and 3-4
times as high as that with an inoculum size of 50%. The increased cell concentration
greatly accelerated the fermentation speed, and compensated for the difference on the
glucose fermentation efficiency between Z. mobilis and P. stipitis.
As shown in Figure 6.13, it took 9 h for P. stipitis to consume all 30 g/l glucose in the
medium, whereas for Z. mobilis, this value was only 3 h for a full batch of
immobilized beads and 6 h for a 1/4 batch. However, at 9 h when all the glucose was
used up, the residual xylose in the medium had already decreased to a level between
15~16 g/l, indicating a 3/4 consumption of all the xylose in the medium. This trend
was different from that observed in a co-culture process, where the xylose
consumption hardly occurred during the glucose fermentation by Z. mobilis. In all
three time courses culturing only P. stipitis on the glucose/xylose mixture, glucose
was preferentially consumed; however, xylose utilization also started even when
there was still residual glucose in the medium. Catabolite repression by glucose on
the xylose assimilation was not observed. The change of utilizing the substrate from
glucose to xylose was smooth. This is possibly because of the high cell concentration
used for the fermentation; P. stipitis cells were forced to utilize every possible carbon
source to avoid starvation.
Finally, it was observed that the adjustment of both the aeration level and the viable
cell concentration had little impact on the overall fermentation efficiency. This

Chapter 6. Co-fermentation of glucose/xylose mixture to ethanol
154
indicated that the effect of aeration level on the cell instantaneous ethanol production
rate [de] was not as significant as it was when P. stipitis was cultured on the medium
only containing xylose. A possible reason might be that the metabolism process of P.
stipitis cells on the glucose/xylose mixture substrate was complex, and thus de was
affected by multiple factors rather than simply an aeration level. Nevertheless, the
relationship between system co-efficiency [Qp] and viable cell concentration [xC]
remained true for a co-fermentation process like this, since the high viable cell level
in these three time courses directly led to a high fermentation efficiency comparable
with the co-culture process involving Z. mobilis. However, the optimization of the
value de for P. stipitis culture on glucose/xylose mixture still needs more
experimental investigation.
6.5.4.2. Comparison between P. stipitis sole culture and co-culture for
glucose/xylose co-fermentation
The two processes of P. stipitis sole culture and co-culture gave comparable results
on the glucose/xylose co-fermentation, and each scheme had its own advantages and
disadvantages.
For P. stipitis sole culture, the most notable advantage was the high biomass level
that could be achieved. As shown in Figure 6.12, even with an inoculation size of
50%, the cell concentration in the medium was able to increase and reach a level
similar to that inoculated with 100% cells. This solved a major problem which
occurred in the co-culture process with a large inoculum size that no biomass
reproduction was observed for P. stipitis [see Section 6.5.3.2]. Secondly, the culture
of a single strain is much simpler, especially given the inhibitory effect of Z. mobilis
cells on the P. stipitis cell activity. Finally, yeast is always preferable for an industrial
process, because bacteria can be infected by the bacteriophage and die out quickly,
leading to the termination of the fermentation process (Montville and Matthews,
2008).
On the other hand, the first advantage of the co-culture process is that it employs Z.
mobilis for the glucose fermentation, whose de level is significantly higher than that
of P. stipitis. Even though both fermentation schemes gave a similar performance,
further optimization of the co-culture process has the potential to improve the

Chapter 6. Co-fermentation of glucose/xylose mixture to ethanol
155
fermentation performance. In contrast, for the P. stipitis sole culture, the inferior
ethanol productivity per cell was unlikely to be improved only by process
engineering. Secondly, ethanol re-assimilation remained a problem for the P. stipitis
sole culture [see Section 6.4.2]. It decreased the final ethanol yield and thus the exact
time control of the harvest would be required to obtain a maximum ethanol level.
However, in the co-culture process, this was not a problem; with a reduced amount of
Z. mobilis cells, a high ethanol yield up to 0.49-0.50 g/g was achieved, which was
96-98% of the theoretical value.
Finally, as far as the process control was concerned, both processes showed similar
difficulties, with no apparent advantages over each other. For P. stipitis sole culture,
though the growth and incubation of one strain was much easier, the fermentation of
mixed substrate still needs more work to set up optimized de values for glucose
fermentation and xylose fermentation respectively, as suggested in Section 6.5.4.1. In
contrast, co-culture process of Z. mobilis and P. stipitis gave best fermentation
performance when the xylose fermentation was not interfered by Z. mobilis viable
cells; this can be realized by several simple process engineering techniques, which
will be discussed in “Recommendations for future work” in Chapter 8. Both schemes
of P. stipitis sole culture and co-culture were used for the fermentation of sugarcane
bagasse hydrolysate to further compare their fermentation characteristics.

Chapter 7. Conversion of sugarcane bagasse hydrolysate to ethanol
156
Chapter 7
Conversion of sugarcane bagasse
hydrolysate to ethanol
Sugarcane bagasse has been commonly used as a starting material in research
investigating ethanol production from lignocelluloses. It contains a high proportion
of cellulose and a relatively low content of impurities, both of which are beneficial
for the fermentation process (Marton et al., 2006; Qu et al., 2007). Moreover,
because the bagasse has already been transported to the sugar factory for the purpose
of sugar production, there is no additional transport cost involved, which is another
advantage over other lignocellulosic material, such as wheat straw or corn stalk
(Martin et al., 2006a; Rossell et al., 2006). This study investigated three kinds of
hydrolysates prepared from bagasse raw material, viz. the acid hydrolysate, the
enzymatic hydrolysate, and the enzymatic hydrolysate without pretreatment and
overliming, for the production of ethanol. Each medium was used as substrate for
ethanol production either by co-culture of Z. mobilis and P. stipitis or by sole culture
of P. stipitis.
7.1. Optimization of conditions for bagasse hydrolysis
7.1.1. Acid hydrolysis
Three batches of milled bagasse of particle size 1.0 mm were hydrolyzed following
the acid hydrolysis procedure as described in Section 3.9.1. For each batch, 50 g raw
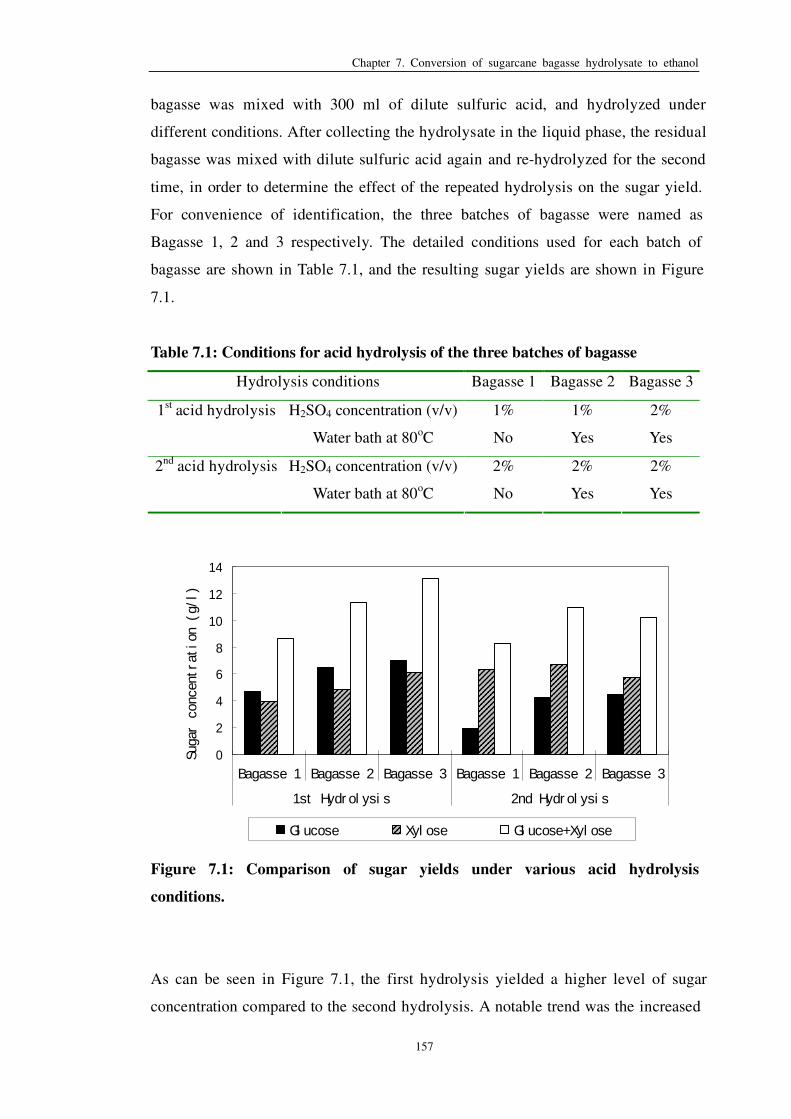
Chapter 7. Conversion of sugarcane bagasse hydrolysate to ethanol
157
bagasse was mixed with 300 ml of dilute sulfuric acid, and hydrolyzed under
different conditions. After collecting the hydrolysate in the liquid phase, the residual
bagasse was mixed with dilute sulfuric acid again and re-hydrolyzed for the second
time, in order to determine the effect of the repeated hydrolysis on the sugar yield.
For convenience of identification, the three batches of bagasse were named as
Bagasse 1, 2 and 3 respectively. The detailed conditions used for each batch of
bagasse are shown in Table 7.1, and the resulting sugar yields are shown in Figure
7.1.
Table 7.1: Conditions for acid hydrolysis of the three batches of bagasse
Hydrolysis conditions Bagasse 1 Bagasse 2 Bagasse 3
H2SO4 concentration (v/v) 1% 1% 2% 1st acid hydrolysis
Water bath at 80oC No Yes Yes
H2SO4 concentration (v/v) 2% 2% 2% 2nd
acid hydrolysis
Water bath at 80oC No Yes Yes
0
2
4
6
8
10
12
14
Bagasse 1 Bagasse 2 Bagasse 3 Bagasse 1 Bagasse 2 Bagasse 3
1st Hydr ol ysi s 2nd Hydr ol ysi s
Suga
r co
ncen
trat
ion
(g/l
)
Gl ucose Xyl ose Gl ucose+Xyl ose
Figure 7.1: Comparison of sugar yields under various acid hydrolysis
conditions.
As can be seen in Figure 7.1, the first hydrolysis yielded a higher level of sugar
concentration compared to the second hydrolysis. A notable trend was the increased

Chapter 7. Conversion of sugarcane bagasse hydrolysate to ethanol
158
xylose concentration with the repetition of the acid hydrolysis process; by contrast,
the glucose yield decreased significantly. This might be related to the increased acid
concentration used for the hydrolysis [2% H2SO4 for all three batches of bagasse in
the second hydrolysis]. The first batch of bagasse gave the lowest sugar yield in both
hydrolysis processes, indicating that subjecting the hydrolysate to 80oC for 30 min
also increased the sugar yield. Besides the reported glucose and xylose, cellobiose
and arabinose were also observed in low concentrations in the hydrolysates. All
hydrolysates were assayed for sugar concentration after the overliming process; there
were no significant impurities detected by HPLC.
7.1.2. Enzymatic hydrolysis
The same three batches of bagasse were then repeatedly employed for the
investigation of the enzymatic hydrolysis. The first experiment was carried out to
investigate the effect of enzyme combination and incubation time. Each batch of
bagasse was mixed with 300 ml acetate buffer, and incubated under conditions as
described in Section 3.9.2. The enzyme combination employed for each batch is
shown in Table 7.2, and details of each enzyme are recorded in Table 3.5 [see Section
3.9.2]. An enzyme loading of 1% (v/w) was used for each enzyme. Incubation
continued for 96 h and samples were taken at 24 h interval.
Table 7.2: Enzyme combinations used for the three batches of bagasse in the
first enzymatic hydrolysis experiment
Batch of bagasse Enzyme combination
Bagasse 1 Cellclast 1.5 L + Shearzyme 500 L + Biofeed Wheat L
Bagasse 2 Cellclast 1.5 L + Novozyme 188
Bagasse 3 Cellclast 1.5 L + Viscozyme L
Results of this experiment are shown in Figure 7.2. Most of the hydrolysis in all three
batches was completed within 24 h; the extended incubation time made little
improvement to the sugar yield. Enzyme combination of “Cellclast 1.5 L +
Shearzyme 500 L + Biofeed Wheat L” used in the first batch of bagasse gave the
lowest yield of glucose, which led to the lowest level of total sugar. In the other two

Chapter 7. Conversion of sugarcane bagasse hydrolysate to ethanol
159
batches the overall sugar yields were at a similar level [10~11 g/l], but the enzyme
combination of “Cellclast 1.5 L + Novozyme 188” yielded a higher glucose
concentration compared to the combination of “Cellclast 1.5 L + Viscozyme L”.
0
2
4
6
8
10
12
14
24 h 48 h 72 h 96 h 24 h 48 h 72 h 96 h 24 h 48 h 72 h 96 h
Bagasse 1 Bagasse 2 Bagasse 3
Suga
r co
ncen
trat
ion
(g/l
)
Gl ucose Xyl ose Gl ucose+Xyl ose
Figure 7.2: Sugar yields with different enzyme combination after 96 h
incubation.
The second experiment of enzymatic hydrolysis investigated the effect of an
increased enzymatic loading and a sequential addition of enzyme combinations. Two
batches of bagasse were employed, viz. Bagasse 1 & 3, and mixed with 300 ml
acetate buffer followed by the addition of a combination of Cellclast 1.5 L and
Novozyme 188 to start hydrolysis. After 24 h incubation, enzyme Shearzyme 500 L
and Biofeed Wheat L were added. All enzymes were used at a loading of 2% (v/w).
The results of this experiment are shown in Figure 7.3. Comparing the sugar yields
between the first and the second experiments, it was found that the increased enzyme
loading increased the final sugar concentration in the hydrolysate. After 24 h, the
sugar concentration in the “Bagasse 1” with an enzyme loading of 2% was 5.92 g/l
glucose and 5.92 g/l xylose respectively, whereas with a loading of 1%, these values
were 2.1 g/l and 4.67 g/l respectively [see Figure 7.2] The overall sugar yields in the
“Bagasse 3” was also higher in this experiment than in the first experiment [11.99 g/l
compared to 10.12 g/l]. The addition of enzyme combination of Shearzyme 500 L

Chapter 7. Conversion of sugarcane bagasse hydrolysate to ethanol
160
and Biofeed Wheat L at 24 h only slightly increased the overall sugar yield in both
batches of bagasses.
0
2
4
6
8
10
12
14
16
24 h 48 h 24 h 48 h
Bagasse 1 Bagasse 3
Suga
r co
ncen
trat
ion
(g/l
)
Gl ucose Xyl ose Gl ucose+Xyl ose
Figure 7.3: Sugar yields with sequential enzyme addition and increased enzyme
loading.
In the third experiment, all these three batches of bagasse were hydrolyzed using the
enzyme combination of Cellclast 1.5 L and Novozyme 188 again at an enzyme
loading of 2% (v/w), with 200 ml of acetate buffer. After centrifuging to collect the
liquid phase, the residual liquid in the bagasse fibre was manually squeezed for
recovery. Sugar was assayed both before and after the squeeze to test the change on
sugar composition. Figure 7.4 shows the results of this experiment. Since all three
batches of hydrolysis were carried out under similar conditions, the resulting sugar
yield was similar. The overall sugar level was around 10~11 g/l, slightly lower
compared to that achieved in the second experiment [11~12 g/l]; this was thought to
be a result of the depleting bagasse material during the repeated experiments.
Squeezing the liquid hydrolysate out of bagasse fibre had no apparent effect on the
sugar concentration; however, the available hydrolysate volume increased
significantly. It was thus kept as the recovery method; together with the enzyme
combination of Cellclast 1.5 L and Novozyme 188, enzyme loading of 2% and
incubation time 24 h, these conditions were chosen as the standard condition for the
enzymatic hydrolysis in this study.

Chapter 7. Conversion of sugarcane bagasse hydrolysate to ethanol
161
0
2
4
6
8
10
12
14
Or i gi nal Squeezed Or i gi nal Squeezed Or i gi nal Squeezed
Bagasse 1 Bagasse 2 Bagasse 3
Suga
r co
ncen
trat
ion
(g/l
)
Gl ucose Xyl ose Gl ucose+Xyl ose
Figure 7.4: Comparison of sugar yields between hydrolysates after
centrifugation and after manual-squeezing.
7.2. Preparation of hydrolysate for fermentation
Based on the results reported above, the procedure of hydrolysis used in this study is
shown in Figure 7.5. For the preparation of fermentation substrate of “Acid
hydrolysate” and “Enzymatic hydrolysate”, 100 g of fresh bagasse material was used.
In addition, residual bagasses from the experiment reported in Section 7.1, “Bagasse
1, 2 &3”, were combined together and subjected to the same procedure, to prepare
the adaptation medium for the microbial strains. The third batch of raw bagasse was
mixed with 600 ml of acetate buffer and directly subjected to the same procedure of
enzymatic hydrolysis, without the prior acid hydrolysis. The resulting liquid, without
overliming for detoxification, was used as the third fermentation substrate. This time,
the adaptation medium was prepared by enzymatically hydrolyzing the solid phase of
bagasse residue in Figure 7.5. A comparison of the sugar yields in the three processes
of hydrolysis, viz. the acid hydrolysis, the enzymatic hydrolysis and the enzymatic
hydrolysis without prior acid treatment, is shown in Table 7.3.

Chapter 7. Conversion of sugarcane bagasse hydrolysate to ethanol
162
Figure 7.5: Preparation of acid and enzymatic hydrolysates of bagasse for
fermentation
As shown in Table 7.3, the final sugar concentration in all six hydrolysate media was
around 8~12 g/l, similar to that achieved in the experiments reported in Sections
7.1.1 and 7.1.2. Comparing the effect of acid hydrolysis and enzymatic hydrolysis,
the overall sugar yield was higher in the enzymatic hydrolysate compared to that in
the acid hydrolysate [12.35 compared to 11.03 g/l for fresh bagasse, and 8.84
compared to 8.10 g/l for residual bagasse]. However, acid hydrolysis in general
yielded higher concentration of xylose [6.16 compared to 3.37 g/l for fresh bagasse,
and 4.96 compared to 3.14 g/l for residual bagasse]. For all three hydrolysates, the

Chapter 7. Conversion of sugarcane bagasse hydrolysate to ethanol
163
sugar yield in the bagasse material that had been repeatedly hydrolyzed was lower
than that in the fresh bagasse material.
Table 7.3: Sugar yields in the hydrolysates prepared for fermentation
Acid hydrolysate Enzymatic
hydrolysate
Hydrolysate without
acid treatment
Fresh Residual a Fresh Residual
a Fresh Residual
b
Glucose (g/l) 4.87 3.14 8.98 5.70 7.63 4.71
Xylose (g/l) 6.16 4.96 3.37 3.14 2.54 2.10
Glucose+Xylose (g/l) 11.03 8.10 12.35 8.84 10.17 6.81
a: Bagasse residue from the experiment in Section 7.1.2.
b: Bagasse residue from the solid phase after enzymatic hydrolysis in Figure 7.5.
Considering the effect of acid treatment on the following enzymatic hydrolysis, both
glucose and xylose yields were slightly lower in the enzymatic hydrolysate without
the acid treatment [7.63 g/l and 2.54 g/l compared to 8.98 g/l and 3.37 g/l]. A further
comparison is shown in Table 7.4. The “Bagasse hydrolysis rate” for the process with
prior acid hydrolysis included the bagasse consumption during the acid hydrolysis;
thus the higher hydrolysis rate of 35.4% did not reflect the actual performance of the
sole enzymatic hydrolysis. However, it indicated a higher overall efficiency of
bagasse conversion when both acid hydrolysis and enzymatic hydrolysis were
involved compared to a single enzymatic hydrolysis process. The higher level of
sugar recovery further confirmed this trend [79.4% compared to 59.4%]. The
enzymatic hydrolysate without prior acid treatment was directly used for the
fermentation time course without overliming and HPLC analysis showed no
significant impurities in its contents.
Overall, the final sugar concentration of 10~12 g/l in all three hydrolysates was too
low to be used in a fermentation process for ethanol production. Therefore both
glucose and xylose were supplemented as described in Section 3.9.3. Moreover,
yeast extract and inorganic salts were also added to the hydrolysate medium to
improve the fermentability.

Chapter 7. Conversion of sugarcane bagasse hydrolysate to ethanol
164
Table 7.4: Comparison of hydrolysis efficiency of enzymatic hydrolysis with and
without prior acid treatment
Sugar level in
hydrolysate (g/l)
Bagasse hydrolysis
rate (%) a
Sugar recovery
efficiency (%) b
With acid treatment 12.35 35.4% c 79.4%
c
Without acid treatment 10.17 17.1% 59.4%
a: Calculated as the consumed dry biomass weight / original weight used for
hydrolysate.
b: Calculated as overall concentration of sugar yield in the hydrolysate / consumed
biomass concentration.
c: Included sugar yield during the acid hydrolysis process.
7.3. Fermentation of bagasse hydrolysate
Table 7.5 shows the conditions used for the three time courses carried out with
bagasse hydrolysate. Three hydrolysate media were randomly selected for the
fermentation processes with different fermentation schemes.
Table 7.5: Conditions for three fermentation processes using bagasse
hydrolysate
Time course 1 Time course 2 Time course 3
Substrate Acid hydrolysate Enzymatic
hydrolysate
Hydrolysate without
acid treatment
Fermentation
scheme
Co-culture in the
modified bioreactor
Co-culture in the
modified bioreactor
P. stipitis sole culture
Inoculum size 1/4 batch of Z. mobilis
& 50% of P. stipitis
1/2 batch of Z. mobilis
& 50% of P. stipitis
50% of P. stipitis
Times of strain
adaptation
Twice for both strains Once for both strains Once
Air flow (cm3/min) 80 80 250

Chapter 7. Conversion of sugarcane bagasse hydrolysate to ethanol
165
7.3.1. Time course on the enzymatic hydrolysate
The adaptation media of Z. mobilis and P. stipitis were analyzed for residual sugars at
the end of each adaptation period. Z. mobilis successfully utilized all the glucose in
the hydrolysate medium, with all the xylose left remained after 12 h of adaptation. P.
stipitis completely utilized both the glucose and xylose within 24 h of adaptation.
The corresponding ethanol accumulation was observed for both strains. The results
of the time course carried out on the enzymatic hydrolysate of bagasse are shown in
Figure 7.6.
( a)
0
5
10
15
20
25
30
35
0 5 10 15 20 25 30 35
Ti me ( h)
Gluc
ose,
xyl
ose
&et
hano
l (g
/l)
Gl ucose Xyl ose Et hanol
( b)
1. E+05
1. E+06
1. E+07
1. E+08
1. E+09
1. E+10
0 5 10 15 20 25 30 35
Ti me ( h)
Viab
le c
ell
conc
entr
atio
n(c
fu/m
l)
P. st i pi t i s Z. mobi l i s
Figure 7.6: Time course using enzymatic hydrolysate of bagasse as substrate: (a)
sugar utilization and ethanol production; (b) biomass growth.

Chapter 7. Conversion of sugarcane bagasse hydrolysate to ethanol
166
This time course, using the co-culture of immobilized Z. mobilis and free cells of P.
stipitis, gave a poor fermentation performance. As can be seen in Figure 7.6 (a), it
took 9.5 h to utilize all the glucose in the medium, and the xylose was consumed at a
low rate. The utilization of xylose terminated at 18.5 h when there still was 7.51 g/l
of xylose left in the medium. Ethanol peaked 6.5 h later [25 h] after the termination
of xylose utilization, at a concentration of 17.59 g/l. After that, ethanol
re-assimilation was observed, i.e. ethanol concentration decreased to 15.31 g/l at 31 h.
The performance was much inferior compared to that of the time course using same
fermentation scheme on the sugar medium. As shown in Figure 6.6, with the same
inoculum size [1/4 batch of Z. mobilis and 50% of P. stipitis], glucose and xylose
were completely utilized at 6 h and 22 h respectively, and the peak ethanol
concentration was 24.78 g/l.
The poor fermentation performance was considered as a result from the unfavorable
biomass growth during the fermentation process. As can be seen from Figure 7.6 (b),
P. stipitis cell concentration decreased steadily throughout the whole time course,
from 1x10⁹ cfu/ml to only 1/5 by the time that xylose utilization terminated [2.3x10
8
cfu/ml at 18.5 h]. This trend continued to the end of the process, giving a final P.
stipitis level of 3.0x10⁷ cfu/ml. The large decrease in the biomass concentration of
the yeast could be the explanation for the low efficiency of the xylose fermentation.
By contrast, though the majority of Z. mobilis cells entrapped in the immobilized
beads was removed from fermentation medium as early as at 6 h, the bacterial cells
in the medium kept a steady increase during the process, reaching a peak level of
2.5x10⁹ cfu/ml at 28.5 h. This abnormal increase of Z. mobilis cells in a medium
lacking an appropriate carbon source was in accordance with the earlier observations
on the sugar medium [see Sections 6.1.2 & 6.3.1].
Some of the unique fermentation characteristics observed for the time course are as
follows. Firstly, the inability of estimating the progress of fermentation by
monitoring the change of pH. The glucose fermentation in this time course was
complete at 9.5 h, but the immobilized Z. mobilis beads were removed from the
fermentation medium at 6 h. The misjudging of the completion of glucose
fermentation was due to the observation of a re-increase of the pH around 6 h. As
described in Section 3.7.4, on the sugar medium this would represent the full

Chapter 7. Conversion of sugarcane bagasse hydrolysate to ethanol
167
consumption of the glucose in the sugar mixture substrate. However, at the time
when the pH of hydrolysate medium showed a slight re-increase, there was still 7.59
g/l of glucose left in the medium. This irregular pH profile was probably because of
the fact that the bagasse hydrolysate was repeatedly treated at extreme pH conditions
[pH 1~2 during the acid hydrolysis and pH 10.5 for overliming] during the
hydrolysis process.
Secondly, the effect of the adaptation process prior to fermentation. After adapting
the immobilized Z. mobilis beads twice in the hydrolysate medium, the surface of gel
beads became rough and sticky. This directly effected the difficulty of inoculating the
beads into the bioreactor because they tended to stick onto the glass funnel used for
inoculation. This change of the bead surface was different to that caused by the
accumulation of bacterial cells inside the beads [see Section 5.1.2]. The texture of gel
surface changed after the adaptation on the hydrolysate. P. stipitis cell growth also
showed some significant trends. After being twice adapted in the hydrolysate
medium, the initial cell concentration of P. stipitis in this time course was around
1.0x10⁹ cfu/ml, which was approximately twice as high as that achieved with a
normal 50% inoculum size [4.0~6.0x10⁸ cfu/ml; see Figures 4.6 and 6.3]. During the
fermentation, the yeast cells showed an unusual flocculant nature. The cells
aggregated into tiny grains and sedimented quickly if not stirred; the appearance
looked very different to the smooth and turbid nature in the sugar medium [see
Figure 6.4]. This could be caused by both the composition in the hydrolysate and the
cell aging during the prolonged incubation time of repeated subculture [48 h in the
sugar medium for the preparation of 50% inoculum size, and 24 h twice in the
adaptation medium]. It is considered that this abnormal nature of P. stipitis cells
could be responsible for the significant cell decrease during the fermentation process.
In general, the main reasons for the poor fermentation performance on the enzymatic
hydrolysate were thought to be the unfavorable biomass levels in the medium. The
early removal of Z. mobilis from the fermentation medium decreased the efficiency
of glucose fermentation, and the reduction in the cell concentration of P. stipitis
resulted in a poor performance on the conversion of xylose to ethanol. Consequently,
in the second time course using the acid hydrolysate, the inoculum size of Z. mobilis
was increased to 1/2 batch, and the adaptation times of both strains on the

Chapter 7. Conversion of sugarcane bagasse hydrolysate to ethanol
168
hydrolysate medium was reduced to a single adaptation.
7.3.2. Time course on the acid hydrolysate
The results of the time course on the acid hydrolysate of bagasse are shown in Figure
7.7. Resulting from the adjustment of the inoculum, the fermentation efficiency was
notably improved. As can be seen in Figure 7.7 (a), the glucose utilization in the first
4 h by Z. mobilis was rapid and efficient, similar to the trend shown in Figure 6.6 (a)
with the sugar medium. The decreased glucose utilization rate observed from 4 h to
13.5 h was mainly from the inappropriate sampling time. The majority of Z. mobilis
was removed from the fermentation medium at 4.5 h; however, the residual glucose
in the medium [3.68 g/l] showed no interference with the xylose fermentation. All
xylose was used up at 26 h, resulting in a fermentation time comparable with those
achieved with the sugar medium [19-25 h]. However, ethanol production only
peaked at 40 h, giving an exceptionally high concentration of 27.98 g/l. The overall
conversion rate was 0.49 g/g sugar mixture, 96% of the theoretical value [0.51 g/g].
Biomass growth in this time course was in accordance with the excellent
fermentation performance. Z. mobilis cells were not observed on any plates of the
viable cell assay, except for a low concentration at 4 h [1.0x10⁶ cfu/ml], which means
that the potential adverse effect of Z. mobilis cells on the xylose fermentation was
minimized [see Section 6.5.2]. P. stipitis with a high level of cell concentration
[5~7x10⁸ cfu/ml] throughout the whole process also guaranteed an efficient
conversion of xylose to ethanol.
Similar to the first time course, the pH again showed abnormal variation and led to
the early removal of the Z. mobilis beads from the fermentation medium before the
completion of glucose fermentation. A freshly-made batch of immobilized Z. mobilis
was employed for this fermentation; however, after adaptation, the texture of bead
surface showed similar changes to earlier observations [see Section 7.3.1].

Chapter 7. Conversion of sugarcane bagasse hydrolysate to ethanol
169
( a)
0
5
10
15
20
25
30
35
0 5 10 15 20 25 30 35 40 45
Ti me ( h)Gl
ucos
e, x
ylos
e &
etha
nol
(g/l
)Gl ucose Xyl ose Et hanol
( b)
1. E+05
1. E+06
1. E+07
1. E+08
1. E+09
1. E+10
0 5 10 15 20 25 30 35 40 45
Ti me ( h)
Viab
le c
ell
conc
entr
atio
n(c
fu/m
l)
P. st i pi t i s Z. mobi l i s
Figure 7.7: Time course using acid hydrolysate of bagasse as substrate: (a) sugar
utilization and ethanol production; (b) biomass growth.
7.3.3. Time course on the hydrolysate without pretreatment and detoxification
In Section 6.4 the sole culture of P. stipitis on the glucose/xylose mixture gave
comparable results with the co-culture; therefore there was a need to investigate the
performance of P. stipitis sole culture on the hydrolysate medium. Figure 7.8
summarizes the results of this time course. A notable trend in this fermentation was
the lag phase of sugar utilization and ethanol production. Although the viable cells of
P. stipitis leveled off at a high concentration level around 5~7x10⁸ cfu/ml, the rapid
glucose utilization and ethanol production only started at 13.5 h, and the overall
fermentation efficiency was low. It took 21.5 h [13.5 h to 35 h] to utilize all the

Chapter 7. Conversion of sugarcane bagasse hydrolysate to ethanol
170
glucose in the medium [32.75 g/l], whereas on the sugar medium, 30 g/l of glucose
could be fully assimilated within 9 h by P. stipitis sole culture [see Figure 6.13,
Section 6.4.2]. Xylose was almost un-consumed during the whole process, except for
a sharp decrease between 35 h to 44 h, which corresponded to a slight decrease in
ethanol concentration in the medium. Ethanol peaked at 35 h, giving a low
concentration of 12.54 g/l. In the processes reported earlier with P. stipitis sole
culture on the glucose/xylose sugar mixture, it was observed that the yeast grew
vigorously on both the sugar medium [see Section 6.4] and the hydrolysate medium
[during the adaptation process; see Section 7.3.1]. However, in this fermentation,
there was no significant cell growth observed.
0
5
10
15
20
25
30
35
0 10 20 30 40 50Ti me ( h)
Gluc
ose,
xyl
ose
&et
hano
l (g
/l)
1. E+07
1. E+08
1. E+09
Viab
le c
ell
conc
entr
atio
n(c
fu/m
l)
Gl ucose Xyl ose Et hanol Vi abl e cel l concent r at i on
Figure 7.8: Time course using hydrolysate without pretreatment and
detoxification as substrate.
This time course employed similar conditions to the third time course reported in
Section 6.4.2 culturing sole P. stipitis on the glucose/xylose mixture. Both the viable
cell concentration and the air flow were at a sufficiently high level [4~7x10⁸ cfu/ml
and 250 cm3/min respectively], which excluded the possibility that the poor
fermentation performance was caused by an unfavorable biomass level. Therefore,
the most possible reason for the long lag phase and the low fermentation efficiency
would be the unfavorable substrate, i.e. the hydrolysate medium of bagasse without
the pretreatment and detoxification process.
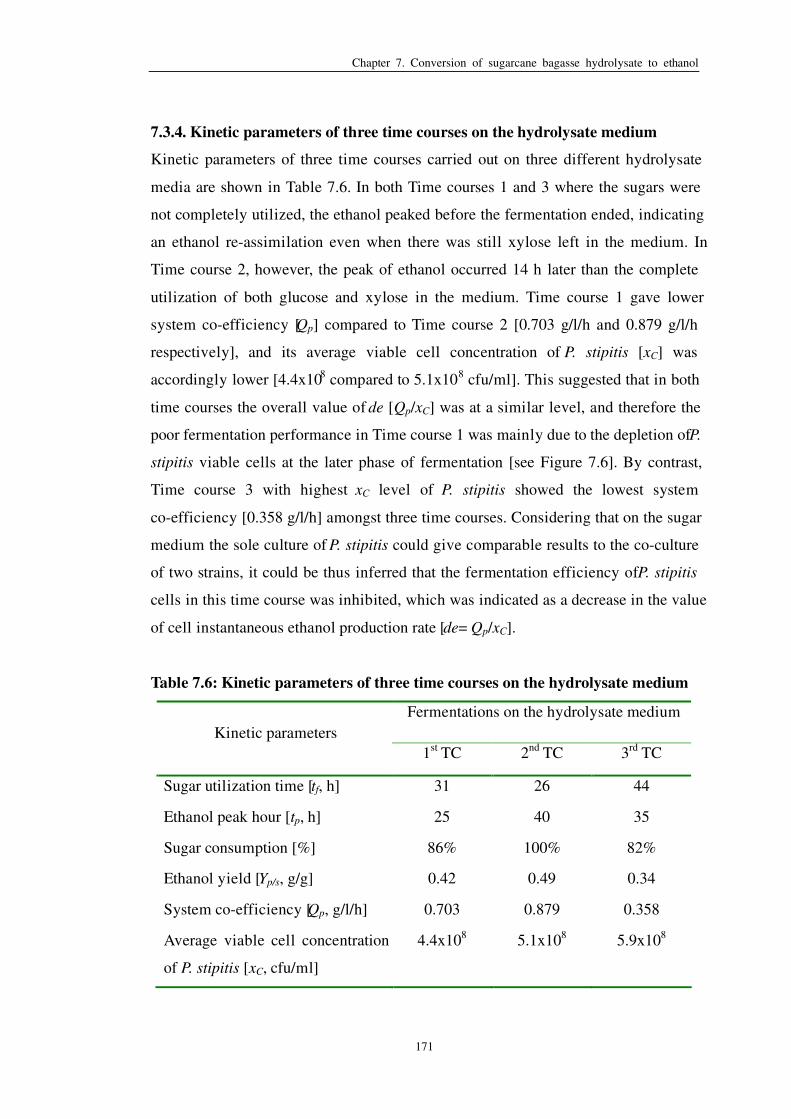
Chapter 7. Conversion of sugarcane bagasse hydrolysate to ethanol
171
7.3.4. Kinetic parameters of three time courses on the hydrolysate medium
Kinetic parameters of three time courses carried out on three different hydrolysate
media are shown in Table 7.6. In both Time courses 1 and 3 where the sugars were
not completely utilized, the ethanol peaked before the fermentation ended, indicating
an ethanol re-assimilation even when there was still xylose left in the medium. In
Time course 2, however, the peak of ethanol occurred 14 h later than the complete
utilization of both glucose and xylose in the medium. Time course 1 gave lower
system co-efficiency [Qp] compared to Time course 2 [0.703 g/l/h and 0.879 g/l/h
respectively], and its average viable cell concentration of P. stipitis [xC] was
accordingly lower [4.4x10⁸ compared to 5.1x10
8 cfu/ml]. This suggested that in both
time courses the overall value of de [Qp/xC] was at a similar level, and therefore the
poor fermentation performance in Time course 1 was mainly due to the depletion of P.
stipitis viable cells at the later phase of fermentation [see Figure 7.6]. By contrast,
Time course 3 with highest xC level of P. stipitis showed the lowest system
co-efficiency [0.358 g/l/h] amongst three time courses. Considering that on the sugar
medium the sole culture of P. stipitis could give comparable results to the co-culture
of two strains, it could be thus inferred that the fermentation efficiency of P. stipitis
cells in this time course was inhibited, which was indicated as a decrease in the value
of cell instantaneous ethanol production rate [de= Qp/xC].
Table 7.6: Kinetic parameters of three time courses on the hydrolysate medium
Fermentations on the hydrolysate medium
Kinetic parameters
1st TC 2
nd TC 3
rd TC
Sugar utilization time [tf, h] 31 26 44
Ethanol peak hour [tp, h] 25 40 35
Sugar consumption [%] 86% 100% 82%
Ethanol yield [Yp/s, g/g] 0.42 0.49 0.34
System co-efficiency [Qp, g/l/h] 0.703 0.879 0.358
Average viable cell concentration
of P. stipitis [xC, cfu/ml]
4.4x10⁸ 5.1x10
8 5.9x10
8

Chapter 7. Conversion of sugarcane bagasse hydrolysate to ethanol
172
7.4. Discussion
7.4.1. Hydrolysis process
Some important observations are as follows.
� Low concentration of sugar yield
In all experiments, the final sugar yields in the hydrolysate from both acid hydrolysis
and enzymatic hydrolysis were below 15 g/l [see Sections 7.1.1 and 7.1.2]. This
result was in accordance with previous reports, in which the acid hydrolysate of
bagasse needed to be concentrated to increase the sugar level and therefore make it
more fermentable (Roberto et al., 1991; Sene et al., 1998; Sene, 2001; Baudel et al.,
2005a; Santos et al., 2005). Takahashi et al. (2000) however reported a total sugar
level up to 68 g/l without any concentration procedure. The acid hydrolysis method
used in this study was adopted from Takahashi et al. (2003), but the achieved sugar
yield level was only 11~12 g/l. Even after multiple experiments of repeating the
procedure with different batches of bagasse under different conditions, the sugar
yield could not be improved. Therefore, enzymatic hydrolysis was resorted to. Other
reports employing similar acid hydrolysis techniques also have achieved higher sugar
levels. For instance, xylose concentrations of 57.25 g/l and 21.6 g/l were reported by
Fogel et al. (2005) and Aguilar et al. (2002) respectively. These suggested that the
acid hydrolysis process carried out in this study has the potential for further
optimization.
Reports on the enzymatic hydrolysis stated that the final sugar concentration in the
medium was low and additional glucose was needed as a supplement to improve the
fermentability of the hydrolysate medium (Davis et al., 2005). In another study,
Martin et al. (2006a) employed a loading ratio of acetate buffer to bagasse at 50:1
(v/w) and also used an SSF process to improve the conversion performance. These
techniques were, however, impractical for the current study. Adsul et al. (2005)
investigating the characteristics of enzymatic hydrolysis used a higher liquid:solid
ratio of 100:1 (v/w). Jeffries and Schartman (1999) suggested that a sequential
addition of cellulase and glucosidase improved the saccharification rate of cellulosic
material, but no values were given for the final sugar concentration. In this study, the

Chapter 7. Conversion of sugarcane bagasse hydrolysate to ethanol
173
sequential addition of enzymes failed to increase the sugar levels significantly. In the
second experiment of enzymatic hydrolysis [see Figure 7.3], the addition of two
xylanases after 24 h of the saccharification process only slightly increased the overall
sugar yield.
� Similar sugar yield in different enzymatic hydrolysis processes
Section 7.1.2 reported enzymatic hydrolysis processes carried out under different
environmental conditions; however, the resulting sugar yields in these processes
were very similar. The enzyme combination of cellulase and xylanase gave an
inferior yield of glucose [~2 g/l]. All other hydrolysates contained approximately
similar levels of total sugars, with the only difference being the proportion of glucose
and xylose. Neither the increase of the enzyme dose nor the supplement of additional
enzymes markedly affected final sugar levels in the hydrolysate. In contrast, when
the same batch of bagasse was repeatedly hydrolyzed, it continued to yield sugars of
an approximately similar level. All these observations showed a possible equilibrium
in the enzymatic catalysis reactions. As suggested by Chandrakant and Bisaria (1998),
the released sugars tended to inhibit the activity of cellulolytic enzymes. Without the
removal of these sugars from the medium, the saccharification process somehow was
suspended, consequently limiting the achievable final sugar level.
� Higher xylose yield from the acid hydrolysis process
The sugar yield pattern was also in accordance with previous reports. As discussed in
Section 2.5.1, a number of reports have pointed out that the hemicellulose in the
lignocellulose was relatively easier to hydrolyze during an acid hydrolysis process
compared to the cellulose, resulting in xylose-rich hydrolysates (Taniguchi et al.,
1997b; Chandrakant and Bisaria, 1998). The results of this study demonstrated this
pattern [see Section 7.2]. During the complete hydrolysis process including both acid
treatment and enzymatic saccharification, the sugar yield in the acid hydrolysate
contained a higher level of xylose. By contrast, the glucose concentration in the
enzymatic hydrolysate was substantially higher, leading to a higher total sugar yield
in the enzymatic hydrolysate than in the acid hydrolysate.
� Improvement of hydrolysate fermentability by overliming
Comparing the fermentations on the hydrolysates, only the time course carried out in

Chapter 7. Conversion of sugarcane bagasse hydrolysate to ethanol
174
the hydrolysate medium without pretreatment and overliming showed a lag phase of
sugar utilization and ethanol production [see Section 7.3.3]. The inhibition of P.
stipitis could be a result from the un-detoxified hydrolysate, although no inhibitors
were detected in any significant levels by the HPLC analysis of the hydrolysate.
Overliming is considered as an effective detoxification method for the lignocellulosic
hydrolysates. It removes inhibitors such as acid, phenolic components and furfural by
precipitating them with calcium cations (Amartey and Jeffries, 1996; Takahashi et al.,
2000). It was reported that Z. mobilis is sensitive to the inhibitors in the hydrolysate
medium (Delgenes et al., 1996b; Yu and Zhang, 2002). The successful glucose
fermentation without a lag phase in the first two time courses suggested that both
media of acid hydrolysate and enzymatic hydrolysate were free of inhibitors, as a
result of the overliming process carried out. In contrast, though no inhibitor was
observed by HPLC analysis, the poor fermentation performance in Time course 3
indicated the low fermentability of the hydrolysate without overliming. A
detoxification process was therefore considered to be a crucial step for an efficient
conversion of lignocellulose to ethanol. Both the acid and enzymatic hydrolysates
with proper detoxification appeared not to have a significant effect on the
fermentation performance, expect for the effect on the gel beads texture. With
appropriate biomass levels and optimum conditions, the hydrolysate could be
expected to show similar results to the sugar medium.
Despite the failure to achieve a high sugar concentration, the major features observed
for the hydrolysis process of sugarcane bagasse in this study were in accordance with
the previous literature. The process still needs extensive research to make it
economically viable on an industrial scale. Future plans for the improvement of
hydrolysis efficiency could include using microorganisms as whole cell catalysts
instead of cellulolytic enzymes. This has the potential to reduce the cost of using
expensive enzymes, and efficient processes could be established with constructed
strains.
7.4.2. Fermentation processes using the hydrolysates
7.4.2.1. Process considerations for the co-culture and the P. stipitis sole culture
on the hydrolysate medium
For co-culture processes in both Time course 1 and 2, the ethanol concentration

Chapter 7. Conversion of sugarcane bagasse hydrolysate to ethanol
175
peaked hours later than the time when xylose was fully consumed or stopped being
utilized. In Time course 1, the sugar consumption terminated at approximately 18.5 h
and ethanol peaked 6.5 h later at 25 h. In Time course 2, it took an additional 14 h for
ethanol to reach the peak [40 h compared to 26 h when xylose was completely
utilized]. A similar trend was reported in previous research. Bari et al. (2004)
co-immobilized S. cerevisiae and P. stipitis to produce ethanol from the aspen
hydrolysate; while both glucose and xylose were fully consumed by 24 h, the ethanol
concentration reached the peak at 40 h. However, in his study this trend was also
observed when a sugar mixture medium was used as the substrate. By contrast, in the
current study, the time of the complete sugar consumption and the time of the ethanol
peaking were approximately the same in the fermentations with the sugar mixture
medium [see Figure 6.6]. The lag in the ethanol peak time on the hydrolysate
medium is considered to result from the time needed to convert all the assimilated
xylose to ethanol in the P. stipitis cells. The increased time difference between the
complete sugar consumption and the ethanol peaking implied a reduction in the P.
stipitis metabolism efficiency. This reduced metabolism efficiency was not reflected
in the sugar uptake rate, since in Time course 2 the 26 h taken for sugar utilization
was approximately the same as the time required in the time courses carried out on
the sugar medium [with an inoculum size of 50% for P. stipitis, the sugar was
completely utilized in 25 h when a full batch was employed, and in 22 h when 1/4
batch of Z. mobilis was employed; see Table 6.5]. However, the delayed ethanol peak
time indicated a requirement for a longer time to convert all of the assimilated xylose
to ethanol.
Considering the interactions between two strains, the cell growth of Z. mobilis
without an appropriate carbon source was observed once again in Time course 1, and
it was associated with a decline of P. stipitis viable cells in the medium. From 25 h to
31 h when Z. mobilis reached a high cell concentration of 2.5x10⁹ cfu/ml and P.
stipitis decreased to less than 1x10⁸ cfu/ml, a reduction of ethanol concentration was
observed, from 17.59 g/l to 15.31 g/l. By contrast, in Time course 2 where the free
cells of Z. mobilis were controlled to a minimum level, such an ethanol decrease was
not observed and the ethanol concentration peaked 14 h after all the xylose had been
consumed. Both observations support the viewpoint that Z. mobilis is able to
re-assimilate ethanol under aerobic conditions.

Chapter 7. Conversion of sugarcane bagasse hydrolysate to ethanol
176
As far as the P. stipitis growth on the hydrolysate medium is concerned, firstly it had
the potential to multiply to a high concentration when cultured in this environment.
As reported in Section 7.3.1, an inoculum size of 50% was employed for P. stipitis in
Time course 1 [cells from 400 ml inoculum medium into 800 ml fermentation
medium]. However, after twice adaptation to the hydrolysate prior to fermentation,
the initial cell concentration of P. stipitis in the fermentation medium reached a level
of 1x10⁹ cfu/ml, which was approximately at a concentration level of the 100%
inoculum size. This indicated that after the adaptation process, yeast cells multiplied
to twice the level of before the adaptation. Given that the initial cells in the 400 ml
adaptation medium were from 400 ml of inoculum medium after 48 h incubation [see
Section 3.9.3], which equalled an inoculum size of 100%, the doubling of the cell
concentration indicated a vigorous cell growth during the adaptation process. This
high level of cell concentration achieved in the adaptation medium was in
accordance with the observation reported in Section 6.4, where it is suggested that P.
stipitis gave higher biomass yield on the glucose/xylose mixture medium than on the
xylose medium.
Moreover, if considering each adaptation flask as a mini fermentation process
inoculated with 100% P. stipitis cells, the yeast showed reasonable performance on
the conversion of both sugars to ethanol in the hydrolysate medium with prior
detoxification. Therefore, the inhibition of both the cell growth and the ethanol
production of P. stipitis in Time course 3 suggested that the yeast was sensitive to
some inhibitors in the hydrolysate, which could be removed by overliming.
Nevertheless, the longer metabolism time needed for converting sugars to ethanol as
discussed earlier would be a disadvantage for the improvement of fermentation
efficiency. Once the mechanism of metabolism responsible for this problem is
unraveled, improvements could be attempted.
The co-culture process also showed some shortcomings when used on the
hydrolysate medium. For example, the pH change could no longer be associated with
the sugar consumption [see Sections 7.3.1 and 7.3.2], which made the determination
of fermentation status more difficult. The removal of Z. mobilis beads from the
medium could be impractical on an industrial scale. Some ideas for overcoming this

Chapter 7. Conversion of sugarcane bagasse hydrolysate to ethanol
177
problem are suggested in Chapter 8.
7.4.2.2. General discussion
Similar to the fermentations on the sugar medium, the biomass proved to be the most
decisive factor for the overall fermentation performance. Low level of biomass only
resulted in reduced fermentation efficiency [see Section 7.3.1]. A sufficient viable
cell level in the medium is a prerequisite for an efficient ethanol production [see
Section 7.3.2], and a vigorous metabolic activity is also very crucial [see Section
7.3.3]. Both strains of Z. mobilis and P. stipitis grew well on the detoxified
hydrolysate, showing comparable fermentation performance to the cultures on the
sugar medium.
In Time course 2, the successful co-culture of immobilized Z. mobilis and free cells
of P. stipitis converted 32.14 g/l glucose and 21.42 g/l xylose to ethanol within 26 h;
the ethanol peaked at 40 h, giving a yield rate of 0.49 g/g. The fermentation
performance compared favorably with previous reports. Qian et al. (2006)
co-cultured a recombinant E. coli with S. cerevisiae on softwood hydrolysates, and a
full conversion was achieved within 24 h with an ethanol yield of 0.45 g/g. Their
study, however, used a low initial sugar level of 37.5 g/l and was carried out in shake
flasks, which would help to improve the fermentation efficiency because of the
smaller ratio of substrate to biomass [see Section 5.3.2.3]. The research of de Bari et
al. (2004) showed a pattern of delayed ethanol peaking similar to this study, but with
a much lower ethanol yield of 0.39 g/g. Other studies (Nigam, 2001b; Saha et al.,
2005) investigating the conversion of wheat straw hydrolysate to ethanol required
considerably longer fermentation times to completely utilize all the sugars in the
medium [around 110~120 h]. Amongst studies with GMO, Krishnan et al. (2000)
reported an ethanol concentration up to 44.3 g/l within 24 h by a recombinant Z.
mobilis; however, only 80% xylose was consumed in this process. Takahashi et al.
(2000) employed a recombinant E. coli strain on the acid hydrolysate of bagasse;
sugars were fully consumed by 48 h, with an ethanol yield of 0.47 g/g.
It can thus be concluded that the fermentation scheme of immobilized Z. mobilis and
free cells of P. stipitis designed in the current study gave an excellent performance on
the conversion of bagasse hydrolysate to ethanol, and has the potential to be

Chapter 7. Conversion of sugarcane bagasse hydrolysate to ethanol
178
employed for industrial production. However, for the establishment of an
economically feasible process for the conversion of lignocellulose to ethanol, the
increase of hydrolysis efficiency and the improvement of hydrolysate convertibility
still need more work.
Chapter 8. Conclusions and recommendations for future work
179
Chapter 8
Conclusions and
recom m endat ions for future w ork
This study investigated fermentation processes for ethanol production from
lignocellulosic material by Z. mobilis and P. stipitis; optimized fermentation schemes
were first established on a sugar mixture medium, and then applied to the
hydrolysate medium. The research covered fermentation process engineering, strain
interactions in the co-culture, microbial metabolism on complex media containing
two carbon sources and the hydrolysis process of sugarcane bagasse.
8.1. General conclusions
8.1.1. The correlation between viable cell concentration and system co-efficiency
It was proved that for both Z. mobilis culture and P. stipitis culture, the system
co-efficiency [Qp] of ethanol production is directly proportional to the viable cell
concentration [xC] in the medium. Based on Formula (8), an empirical formula
describing ethanol production, and Formula (5), the definition of system
co-efficiency, another formula was derived:
)//( hlgdexQ Cp ×= (9)
where de is a theoretical value, defined as the cell instantaneous ethanol production
rate (g/h/cells). Further derivatives of these formulae explained a number of

Chapter 8. Conclusions and recommendations for future work
180
observations during the ethanol production process.
Firstly, for P. stipitis culture, when the viable cell concentration [xC] remains constant,
the oxygenation level directly determines the system co-efficiency. This is because
an optimized oxygenation level improves the metabolism efficiency of xylose in the
P. stipitis cells, and thus the value of the cell instantaneous ethanol production rate
(de) increases.
Secondly, the fermentation time used to convert a certain amount of sugar is only
decided by the ratio of substrate to the biomass.
)(1
12 hN
P
dett
yie=− (8.4)
When the sugar concentration in the medium remains the same, a smaller volume of
medium results in lower amounts of sugars. In association with an increased total
number of biomass [N], the overall fermentation time decreases. This explains the
observation that when a conical flask is used as a bioreactor, the fermentation
efficiency tends to improve.
Finally, the system co-efficiency [Qp] is not determined by the initial sugar
concentration and the corresponding final ethanol concentration. By definition, Qp is
the quotient of peak ethanol concentration divided by the time. However, as shown in
Formula (8.4), when both values of de and N stay constant, the change in the initial
sugar concentration would only lead to the corresponding change in the fermentation
time; as a result, no matter what the sugar concentration is, the system co-efficiency
[Qp] remains unaffected. This accounts for the use of the absolute amount of Pyie and
N in Formula (8.4), rather than their corresponding concentration values.
The cell instantaneous ethanol production rate [de, g/h/cells] is partly reflected by the
specific ethanol productivity [qp, g/g/h] during a fermentation process, since both
values describe the ethanol productivity based on biomass. However, de gives a
better description of the fermentation capability of a strain by eliminating the
potential error attributed to the weight variation of a single cell from different
species.

Chapter 8. Conclusions and recommendations for future work
181
8.1.2. Fermentation characteristics of sole strain culture
Free cell culture of Z. mobilis requires simple techniques and gives an efficient
ethanol production process. Because of the simple metabolism reactions from
glucose to ethanol in Z. mobilis cells, its profile of ethanol production fits best into
Formula (9). When the initial cell concentration was increased to 5 fold and 10 fold,
the system co-efficiency increased to 2.2 fold and 3.6 fold respectively.
Free cell culture of P. stipitis shows more efficient cell growth on a complex medium
than on a simple medium, and on glucose substrate than on xylose substrate. Its
fermentation performance on xylose medium is mainly affected by both viable cell
concentration and oxygenation level, which affects its cell instantaneous ethanol
production rate [de]. The increase of initial cell concentration to 5 fold resulted in a
5.2 fold increase in the system co-efficiency. However, further increase in the
biomass level required a concomitant increase in the oxygenation level.
Sole culture of P. stipitis on the glucose/xylose mixture medium gave comparable
results to the co-culture of Z. mobilis and P. stipitis. Glucose and xylose were
consumed sequentially; however, there was no observation of catabolite repression
due to glucose on the xylose metabolism. It was speculated that the high cell
concentration used for fermentation led to the starvation of cells in an environment
with limited substrate, consequently forcing them to utilize every potential carbon
source.
Z. mobilis showed its acclimatization to the interior of calcium alginate beads during
microbial encapsulation. Biomass inside the beads accumulated to a high
concentration during their repeated usage, resulting in an improved fermentation
performance. The main disadvantage of immobilized Z. mobilis was the bead damage
caused by the intensive carbon dioxide production during the ethanol production
process.
Immobilized P. stipitis showed a constant fermentation efficiency when cultured
under various conditions, which resulted from the steady levels of both biomass
concentration and cell instantaneous ethanol production rate within the beads. The

Chapter 8. Conclusions and recommendations for future work
182
yeast preferred to grow in the medium environment rather than inside the beads.
Both the limited fermentation efficiency achieved with high biomass concentration
entrapped in the beads and the minimal bead damage during repeated culture
indicated a low cell activity in the interior of the gel beads.
8.1.3. Co-culture of Z. mobilis and P. stipitis
The utilization of immobilized Z. mobilis and free cells of P. stipitis achieved
efficient conversion of the glucose/xylose sugar mixture to ethanol by providing each
strain an optimum environment within the beads and in the medium respectively. The
resulting ethanol production performance was approximately 25 g/l ethanol within
19-22 h, with a complete conversion of a high xylose proportion [40% in the sugar
mixture, i.e. 30g/l of glucose and 20 g/l of xylose], giving an ethanol yield of
0.49-0.50 g/g sugar. Except for the low final ethanol concentration, all other values
exceeded the standard suggested by du Preez (1994) for industrial production: 50-60
g/l ethanol within 36 h and an ethanol yield no less than 0.40 g/g.
During the co-culture process, Z. mobilis cells proved to be inhibitory to the cell
activity of P. stipitis. Increased viable cells of Z. mobilis in the medium led to a
significant decrease in both efficiencies of cell growth and xylose fermentation of the
yeast. Moreover, the bacterium appeared to be able to grow on the xylose metabolic
process of P. stipitis; cell reproduction to a level of 1.0x10⁹ cfu/ml occurred in the
medium environment lacking an appropriate carbon source for utilization. Finally, Z.
mobilis tended to assimilate the produced ethanol under aerobic conditions, which
was not a strain interaction, but reduced the overall production efficiency.
Therefore, the removal of the immobilized Z. mobilis from the medium after the
completion of glucose fermentation is recommended to achieve a reasonable
fermentation efficiency. Moreover, this method increases the life of gel beads by
reducing the extended period of exposure to the fermentation medium.
8.1.4. Fermentation of bagasse hydrolysate
The hydrolysis processes of sugar bagasse showed similar trends to previous
literature. The sugar yield of both acid hydrolysis and enzymatic hydrolysis was low.
Through all methods attempted in this study, there was no significant improvement in

Chapter 8. Conclusions and recommendations for future work
183
the sugar yield achieved. With proper overliming, both the acid and enzymatic
hydrolysates showed similar fermentability; the fermentation of both glucose and
xylose proceeded without any apparent inhibition. In contrast, for the enzymatic
hydrolysate without overliming, a lag phase of ethanol production up to 13.5 h was
observed for the sole culture of P. stipitis. The best results achieved with the acid
hydrolysate gave a complete sugar utilization at 26 h, by which time the ethanol yield
was already 0.43 g/g; at 40 h when ethanol peaked, the yield further increased to 0.49
g/g. These results still compare favorably with du Preez’s standard (1994); however,
for further improvement of the overall efficiency from bagasse to ethanol, the
realization of an efficient and complete hydrolysis process could be the major
problem to overcome.
8.2. Recommendations for future work
Based on the current study, the following areas are recommended.
� Strain improvement. As discussed in Section 2.6.2, there are different
possibilities of constructing recombinant strains with desired characteristics, and
some strains have already been constructed and applied in research. However,
here the potential of P. stipitis is specially considered. In this study, P. stipitis
gave comparable results with co-culture on the glucose/xylose sugar medium; it
is also believed that with appropriate optimization, a similar performance could
be achieved on the hydrolysate medium as well. The major shortcoming of P.
stipitis is the relatively slow metabolic efficiency, i.e. the de. The strain should
be improved through mutation or genetic engineering to increase its metabolic
rate, since it shows some unique advantages over other strains. It is a yeast, thus
eliminating the possible attack by bacteriophage; it naturally ferments both
glucose and xylose, without the need to artificially add new genes for the xylose
assimilation. Moreover, recent research on the heterologous xylanase production
by P. stipitis (Gorgens et al., 2005) enables the strain to hydrolyze the xylan
while fermenting. The further exploitation of P. stipitis into a desirable
biocatalyst for an integrated process from lignocellulose to ethanol looks
exciting and worth attempting.

Chapter 8. Conclusions and recommendations for future work
184
� Improvement of the immobilization. The bead damage of immobilized Z. mobilis
during the fermentation reduces the bead life and increases the cost. A new
immobilizing material will be necessary for longer usage and better performance.
Furthermore, when the co-culture of Z. mobilis and P. stipitis is considered, an
ideal immobilization mode should contain Z. mobilis within the immobilization
material [e.g. tiny beads or fine fibres], and P. stipitis on the surface of the
immobilization material for better aeration. In this manner, both strains are
provided with optimum oxygenation conditions and can be easily recycled
during fermentations.
� Continuous culture. Results reported in this study are the highest values achieved
in batch culture for the different processes. However, continuous culture has the
potential to further increase the fermentation efficiency compared to batch
culture, by maintaining a continuous exponential phase for all cells in the
medium. In association with the utilization of high cell density, it is possible to
set up a continuous culture using a column filled with both Z. mobilis and P.
stipitis. With a sufficient amount of biomass and a proper length of column, all
the sugars in the medium flowing through the column would be completely
converted to ethanol before flowing out. For better manipulation, the co-culture
of Z. mobilis and P. stipitis should be preferably immobilized. It can either be a
co-immobilization as described in the earlier paragraph, or a sequential
two-stage fermentation with Z. mobilis first to convert all the glucose and then P.
stipitis later to convert all the xylose.
� Metabolic study for a co-culture of Z. mobilis and P. stipitis. As suggested above,
there were some special interactions between these two strains during the
co-culture. A detailed, step by step investigation of each strain’s metabolic
reactions in this process would contribute to the knowledge of the biochemistry
of interaction between two strains, as well as the nature of how cells from
different genera interact with each other.
� Improvement of hydrolysis and development of an integrated process. This study
mainly focuses on the fermentation stage of the four stages required to convert
the lignocellulose to ethanol, as mentioned in Section 2.1. An efficient

Chapter 8. Conclusions and recommendations for future work
185
fermentation process has been established for the ethanol production from the
glucose/xylose sugar mixture. However, industrial production of ethanol from
lignocellulose also requires an economically feasible process to obtain
fermentable single sugars from carbohydrate macromolecules. A cost-efficient
hydrolysis process still needs to be worked out. Ultimately, an integrated, single
stage process for the conversion of lignocellulose to ethanol would be preferable.
It may be possible to achieve this aim either by the utilization of a genetically
constructed biocatalyst, or simply through process integration and optimization.
These are questions that need to be answered through further research.

186
References
Adsul, M. G., Ghule, J. E., Shaikh, H., Singh, R., Bastawde, K. B., Gokhale, D. V. &
Varma, A. J. (2005) Enzymatic hydrolysis of delignified bagasse
polysaccharides. Carbohydrate Polymers, 62, 6-10.
Agbogbo, F. K. & Coward-Kelly, G. (2008) Cellulosic ethanol production using the
naturally occurring xylose-fermenting yeast, Pichia stipitis. Biotechnology
Letters, 30, 1515-1524.
Agbogbo, F. K., Coward-Kelly, G., Torry-Smith, M., Wenger, K. & Jeffries, T. W.
(2007) The effect of initial cell concentration on xylose fermentation by
Pichia stipitis. Applied Biochemistry and Biotechnology, 136-140, 653-662.
Agbogbo, F. K., Coward-Kelly, G., Torry-Smith, M. & Wenger, K. S. (2006)
Fermentation of glucose/xylose mixtures using Pichia stipitis. Process
Biochemistry, 41, 2333-2336.
Aguilar, R., Ramirez, J. A., Garrote, G. & Vazquez, M. (2002) Kinetic study of the
acid hydrolysis of sugar cane bagasse. Journal of Food Engineering, 55,
309-318.
Amartey, S. & Jeffries, T. (1996) An improvement in Pichia stipitis fermentation of
acid-hydrolyses hemicellulose achieved by overliming (calcium hydroxide
treatment) and strain adaptation. World Journal of Microbiology and
Biotechnology, 12, 281-283.
Amin, G. & Doelle, H. W. (1990) Production of high ethanol concentrations from
glucose using Zymomonas mobilis entrapped in a Vertical Rotating
Immobilized Cell Reactor. Enzyme and Microbial Technology, 12, 443-446.
Amutha, R. & Gunasekaran, P. (2001) Production of ethanol from liquefied cassava
starch using co-immobilized cells of Zymomonas mobilis and Saccharomyces
diastaticus. Journal of Bioscience and Bioengineering, 92, 560-564.
AOAC-International (2006) AOAC Official Method 969.39: Glucose in Corn Syrups
and Dextrose Products. AOAC Official Method.
Aristidou, A. & Penttila, M. (2000) Metabolic engineering applications to renewable

187
resource utilization. Current Opinion in Biotechnology, 11, 187-198.
Bajpai, P. K. & Margaritis, A. (1985) Kinetics of ethanol production by immobilized
cells of Zymomonas mobilis at varying D-glucose concentrations. Enzyme
and Microbial Technology, 7, 462-464.
Ballesteros, M., Oliva, J. M., Negro, M. J., Manzanares, P. & Ballesteros, I. (2004)
Ethanol from lignocellulosic material by a simultaneous saccharification and
fermentation process (SSF) with Kluyveromyces marxianus CECT 10875.
Process Biochemistry, 39, 1843-1848.
Balusu, R., Paduru, R. R., Kuravi, S. K., Seenayya, G. & Reddy, G. (2005)
Optimization of critical medium components using response surface
methodology for ethanol production from cellulosic biomass by Clostridium
thermocellum SS19. Process Biochemistry, 40, 3025-3030.
Bandaru, V. V. R., Somalanka, S. R., Mendu, D. R., Madicherla, N. R. & Chityala, A.
(2006) Optimization of fermentation conditions for the production of ethanol
from sago starch by co-immobilized amyloglucosidase and cells of
Zymomonas mobilis using response surface methodology. Enzyme and
Microbial Technology, 38, 209-214.
Barbosa, M. D. F. S., Lee, H., Schneider, H. & Forsberg, C. W. (1990) Temperature
mediated changes of D-xylose metabolism in the yeast Pachysolen
tannophilus. FEMS Microbiology Letters, 72, 35-40.
Baudel, H. M., de Abreu, C. A. M. & Zaror, C. Z. (2005a) Xylitol production via
catalytic hydrogenation of sugarcane bagasse dissolving pulp liquid effluents
over Ru/C catalyst. Journal of Chemical Technology and Biotechnology, 80,
230-233.
Baudel, H. M., Zaror, C. & de Abreu, C. A. M. (2005b) Improving the value of
sugarcane bagasse wastes via integrated chemical production systems: an
environmentally friendly approach. Industrial Crops and Products, 21,
309-315.
Becerra, M., Baroli, B., Fadda, A. M., Blanco Mendez, J. & Gonzalez Siso, M. I.
(2001) Lactose bioconversion by calcium-alginate immobilization of
Kluyveromyces lactis cells. Enzyme and Microbial Technology, 29, 506-512.
Bicho, P. A., Cunningham, J. D. & Lee, H. (1989) Differential fructose effect in
Pachysolen tannophilus and Pichia stipitis. FEMS Microbiology Letters, 57,
323-328.
Bravo, V., Camacho, F., Sanchez, S. & Castro, E. (1995) Influence of the
concentrations of D-xylose and yeast extract on ethanol production by
Pachysolen tannophilus. Journal of Fermentation and Bioengineering, 79,
566-571.
Brooks, T. A. & Ingram, L. O. (1995) Conversion of mixed waste office paper to
ethanol by genetically engineered Klebsiella oxytoca strain P2. Biotechnology
Progress, 11, 619-625.

188
Carvalho, W., Batista, M. A., Canilha, L., Santos, J. C., Converti, A. & Silva, S. S.
(2004) Sugarcane bagasse hydrolysis with phosphoric and sulfuric acids and
hydrolysate detoxification for xylitol production. Journal of Chemical
Technology and Biotechnology, 79, 1308-1312.
Chandrakant, P. & Bisaria, V. S. (1998) Simultaneous bioconversion of cellulose and
hemicellulose to ethanol. Critical Reviews in Biotechnology, 18, 295-331.
Converti, A., Perego, P., Dominguez, J. M. & Silva, S. S. (2001) Effect of
temperature on the microaerophilic metabolism of Pachysolen tannophilus.
Enzyme and Microbial Technology, 28, 339-345.
Das, H. & Singh, S. K. (2004) Useful byproducts from cellulosic wastes of
agriculture and food industry - a critical appraisal. Critical Reviews in Food
Science and Nutrition, 44, 77-89.
Davis, L., Jeon, Y.-J., Svenson, C., Rogers, P., Pearce, J. & Peiris, P. (2005)
Evaluaiton of wheat stillage for ethanol production by recombinant
Zymomonas mobilis. Biomass and Bioenergy, 29, 49-59.
Davis, L., Rogers, P., Pearce, J. & Peiris, P. (2006) Evaluation of Zymomonas-based
ethanol production from a hydrolysed waste strach stream. Biomass and
Bioenergy, 30, 809-814.
de Bari, I., Cuna, D., Nanna, F. & Braccio, G. (2004) Ethanol production in
immobilized-cell bioreactors from mixed sugar syrups and enzymatic
hydrolysates of steam-exploded biomass. Applied Biochemistry and
Biotechnology, 114, 539-557.
de Vries, B. J. M., van Vuuren, D. P. & Hoogwijk, M. M. (2007) Renewable energy
sources: their global potential for the first-half of the 21st century at a global
level: an integrated approach. Energy Policy, 35, 2590-2610.
Delgenes, J. P., Laplace, J. M., Moletta, R. & Navarro, J. M. (1996a) Comparative
study of seperated fermentations and cofermentation processes to produce
ethanol from hardwood derived hydrolysates. Biomass and Bioenergy, 11,
353-360.
Delgenes, J. P., Moletta, R. & Navarro, J. M. (1996b) Effects of lignocellulose
degradation products on ethanol fermentations of glucose and xylose by
Saccharomyces cerevisiae, Zymomonas mobilis, Pichia stipitis and Candida
shehatae. Enzyme and Microbial Technology, 19, 220-225.
Dey, S. (2001) Semicontinuous production of ethanol from agricultural wastes by
immobilised coculture in a two stage bioreator. Journal of Environmental
Biology, 23, 399-406.
du Preez, J. C. (1994) Process parameters and environmental factors affecting
D-xylose fermentation by yeasts. Enzyme and Microbial Technology, 16,
944-956.
du Preez, J. C., van Driessel, B. & Prior, B. A. (1989) Ethanol tolerance of Pichia

189
stipitis and Candida shehatae strains in fed-batch cultures at controlled low
dissolved oxygen levels. Applied Microbiology and Biotechnology, 30, 53-58.
Fiaux, J., Cakar, Z. P., Sonderegger, M., Wuthrich, K., Szyperski, T. & Sauer, U.
(2003) Metabolic-flux profiling of the yeasts Saccharomyces cerevisiae and
Pichia stipitis. Eukaryotic Cell, 2, 170-180.
Fogel, R., Garcia, R. R., Oliveira, R. D. S., Palacio, D. N. M., Madeira, L. D. S. M.
& Pereira Jr., N. (2005) Optimization of acid hydrolysis of sugarcane bagasse
and investigations on its fermentability for the production of xylitol by
Candida guilliermondii. Applied Biochemistry and Biotechnology, 121-124,
741-752.
Fu, N. & Peiris, P. (2008) Co-fermentation of a mixture of glucose and xylose to
ethanol by Zymomonas mobilis and Pachysolen tannophilus. World Journal
of Microbiology & Biotechnology, 24, 1091-1097.
Fujita, Y., Ito, J., Ueda, M., Fukuda, H. & Kondo, A. (2004) Synergistic
saccharification, and direct fermentation to ethanol, of amorphous cellulose
by use of an engineered yeast strain codisplaying three types of cellulolytic
enzyme. Applied and Environmental Microbiology, 70, 1207-1212.
Furlan, S. A., Bouilloud, P. & Castro, H. F. (1994) Influence of oxygen on ethanol
and xylitol production by xylose fermenting yeasts. Process Biochemistry, 29,
657-662.
Gamez, S., Gonzalez-Cabriales, J. J., Ramirez, J. A., Garrote, G. & Vazquez, M.
(2006) Study of the hydrolysis of sugar cane bagasse using phosphoric acid.
Journal of Food Engineering, 74, 78-88.
Gamez, S., Ramirez, J. A., Garrote, G. & Vazquez, M. (2004) Manufacture of
fermentable sugar solutions from sugar cane bagasse hydrolyzed with
phosphoric acid at atmospheric pressure. Journal of Agricultural and Food
Chemistry, 52, 4172-4177.
Goldemberg, J. (2007) Ethanol for a sustainable energy future. Science, 315,
808-810.
Golias, H., Dumsday, G. J., Stanley, G. A. & Pamment, N. B. (2002) Evaluation of a
recombinant Klebsiella oxytoca strain for ethanol production from cellulose
by simultaneous saccharification fermentation: comparison with native
cellobiose-utilising yeast strains and performance in co-culture with
thermotolerant yeast and Zymomonas mobilis. Journal of Biotechnology, 96,
155-168.
Gong, C. S., Chen, C. S. & Chen, L. F. (1993) Pretreatment of sugar cane bagasse
hemicellulose hydrolyzate for ethanol production by yeast. Applied
Biochemistry and Biotechnology, 39/40, 83-88.
Gorgens, J. F., Passoth, V., van Zyl, W. H., Knoetze, J. H. & Hahn-Hageradal, B.
(2005) Amino acid supplementation, controlled oxygen limitation and
sequential double induction improves heterologous xylanase produciton by

190
Pichia stipitis. FEMS Yeast Research, 5, 677-683.
Griffin, G. J. & Shu, L. (2004) Solvent extraction and purification of sugars from
hemicellulose hydrolysates using boronic acid carriers. Journal of Chemical
Technology and Biotechnology, 79, 505-511.
Groom, M. J., Gray, E. & Townsend, P. A. (2007) Biofuels and biodiversity:
principles for creating better policies for biofuel production. Conservation
Biology, 22, 602-609.
Grootjen, D. R. J., Jansen, M. L., van Der Lans, R. G. J. M. & Luyben, K. C. A. M.
(1991a) Reactors in series for the complete conversion of glucose/xylose
mixtures by Pichia stipitis and Saccharomyces cerevisiae. Enzyme and
Microbial Technology, 13, 828-833.
Grootjen, D. R. J., Meijlink, L. H. H. M., Vleesenbeek, R., van Der Lans, R. G. J. M.
& Luyben, K. C. A. M. (1991b) Cofermentaion of glucose and xylose with
immobilized Pichia stipitis in combination with Saccharomyces cerevisiae.
Enzyme and Microbial Technology, 13, 530-536.
Gunasekaran, P. & Kamini, N. R. (1991) High ethanol productivity from lactose by
immobilized cells of Kluyveromyces fragilis and Zymomonas mobilis. World
Journal of Microbiology and Biotechnology, 7, 551-556.
Hahn-Hageradal, B., Jeppsson, H., Skoog, K. & Prior, B. A. (1994) Biochemistry and
physiology of xylose fermentation by yeasts. Enzyme and Microbial
Technology, 16, 933-943.
Ignaciuk, A., Vohringer, F., Ruijs, A. & van Ierland, E. C. (2006) Competition
between biomass and food production in the presence of energy policies: a
partial equilibrium anlysis. Energy Policy, 34, 1127-1138.
Ishige, T., Honda, K. & Shimize, S. (2005) Whole organism biocatalysis. Current
Opinion in Chemical Biology, 9, 174-180.
Jeffries, T. W. & Kurtzman, C. P. (1994) Strain selection, taxonomy, and genetics of
xylose-fermenting yeasts. Enzyme and Microbial Technology, 16, 922-932.
Jeffries, T. W. & Schartman, R. (1999) Bioconversion of secondary fiber fines to
ethanol using counter-current enzymatic saccharification and co-fermentaion.
Applied Biochemistry and Biotechnology, 77-79, 435-444.
Jin, Y.-S. & Jeffries, T. W. (2003) Changing flux of xylose metabolites by altering
expression of xylose reductase and xylitol dehydrogenase in recombinant
Saccharomyces cerevisiae. Applied Biochemistry and Biotechnology, 105-108,
277-285.
Jin, Y.-S. & Jeffries, T. W. (2004) Stoichiometric network constraints on xylose
metabolism by recombinant Saccharomyces cerevisiae. Metabolic
Engineering, 6, 229-238.
Kaar, W. E., Gutierrez, C. V. & Kinoshita, C. M. (1998) Steam explosion of

191
sugarcane bagasse as a pretreatment for conversion to ethanol. Biomass and
Bioenergy, 14, 277-287.
Kadar, Z., Szengyel, Z. & Reczey, K. (2004) Simultaneous saccharification and
fermentation (SSF) of industrial wastes for the production of ethanol.
Industrial Crops and Products, 20, 103-110.
Kalnenieks, U. (2006) Physiology of Zymomonas mobilis: Some unanswered
questions. Advances in Microbial Physiology, 51, 73-117.
Kannan, T. R., Sangiliyandi, G. & Gunasekaran, P. (1998) Improved ethanol
production from sucrose by a mutant of Zymomonas mobilis lacking sucrases
in immobilized cell fermentation. Enzyme and Microbial Technology, 22,
179-184.
Katz, S. H. (2008) Food to fuel and the world food crisis. Anthropology today, 24,
1-3.
Kennedy, D. (2007) The biofuels conundrum. Science, 316, 515.
Kesava, S. S. & Panda, T. (1996) Ethanol production by immobilized whole cells of
Zymomonas mobilis in a continuous flow expanded bed bioreactor and a
continuous flow stirred tank bioreactor. Journal of Industrial Microbiology,
17, 11-14.
Kesava, S. S., Panda, T. & Rakshit, S. K. (1996) Production of ethanol by
immobilized whole cells of Zymomonas mobilis in an expanded bed
bioreactor. Process Biochemistry, 31, 449-456.
Kim, Y., Ingram, L. O. & Shanmugam, K. T. (2007) Construction of an Escherichia
coli K-12 mutant for homoethanologenic fermentation of glucose or xylose
without foreign genes. Applied and Environmental Microbiology, 73,
1766-1771.
Kitchaiya, P., Intanakul, P. & Krairiksh, M. (2003) Enhancement of enzymatic
hydrolysis of lignocellulosic wastes by microwave pretreatment under
atmospheric pressure. Journal of Wood Chemistry and Technology, 23,
217-225.
Klinke, H. B., Thomsen, A. B. & Ahring, B. K. (2004) Inhibition of
ethanol-producing yeast and bacteria by degradation products produced
during the pre-treatment of biomass. Applied Microbiology and
Biotechnology, 66, 10-26.
Kordowska-Wiater, M. & Targonski, Z. (2002) Ethanol fermentation on
glucose/xylose mixture by co-cultivation of restricted glucose catabolite
repressed mutants of Pichia stipitis with resiratory deficient mutants of
Saccharomyces cerevisiae. Acta Microbiologica Polonica, 51, 345-352.
Krishnan, M. S., Blanco, M., Shattuck, C. K., Nghiem, N. P. & Davison, B. H. (2000)
Ethanol production from glucose and xylose by immobilized Zymomonas
mobilis CP4 (pZB5). Applied Biochemistry and Biotechnology, 84-86,

192
525-541.
Kruse, B. & Schugerl, K. (1996) Investigation of ethanol formation by Pachysolen
tannophilus from xylose and glucose/xylose co-substrates. Process
Biochemistry, 31, 389-407.
Kuhad, R. C. & Singh, A. (1993) Lignocellulose biotechnology: current and future
prospects. Critical Reviews in Biotechnology, 13, 151-172.
Kunst, A., Draeger, B. & Ziegenhorn, J. (1984) Colorimetric Methods with Glucose
Oxidase and Peroxidase. IN BERGMEYER, H. U., BERGMEYER, J. &
GRABL, M. (Eds.) Methods of Enzymatic Analysis. 3rd ed. Weinheim, Verlag
Chemie GmbH., pp. 178-185.
Kwon, S.-G., Park, S.-W. & Oh, D.-K. (2006) Increase of xylitol productivity by
cell-recycle fermentation of Candida tropicalis using submerged membrane
bioreactor. Journal of Bioscience and Bioengineering, 101, 13-18.
Laplace, J. M., Delgenes, J. P., Moletta, R. & Navarro, J. M. (1991a) Alcoholic
fermentation of glucose and xylose by Picha stipitis, Candida shehatae,
Saccharomycse cerevisiae and Zymomonas mobilis: oxygen requirement as a
key factor. Applied Microbiology and Biotechnology, 36, 158-162.
Laplace, J. M., Delgenes, J. P., Moletta, R. & Navarro, J. M. (1991b) Combined
alcoholic fermentation of D-xylose and D-glucose by four selected microbial
strains: process considerations in relation to ethanol tolerance. Biotechnology
Letters, 13, 445-450.
Laplace, J. M., Delgenes, J. P., Moletta, R. & Navarro, J. M. (1993a) Cofermentation
of glucose and xylose to ethanol by a respiratory-deficient mutant of
Saccharomyces cerevisiae co-cultivated with a xylose-fermenting yeast.
Journal of Fermentation and Bioengineering, 75, 207-212.
Laplace, J. M., Delgenes, J. P., Moletta, R. & Navarro, J. M. (1993b) Effects of
culture conditions on the co-fermentation of a glucose and xylose mixture to
ethanol by a mutant of Saccharomyces diastaticus associated with Pichia
stipitis. Applied Microbiology and Biotechnology, 39, 760-763.
Laplace, J. M., Delgenes, J. P., Moletta, R. & Navarro, J. M. (1993c) Ethanol
production from glucose and xylose by seperated and co-culture processes
using high cell density systems. Process Biochemistry, 28, 519-525.
Latif, F. & Rajoka, M. I. (2001) Production of ethanol and xylitol from corn cobs by
yeasts. Bioresource Technology, 77, 57-63.
Lavarack, B. P., Griffin, G. J. & Rodman, D. (2002) The acid hydrolysis of sugarcane
bagasse hemicellulose to produce xylose, arabinose, glucose and other
products. Biomass and Bioenergy, 23, 367-380.
Lawford, H. G. & Rousseau, J. D. (2003) Cellulosic fuel ethanol. Applied
Biochemistry and Biotechnology, 105-108, 457-469.

193
Lebeau, T., Jouenne, T. & Junter, G.-A. (1997) Simultaneous fermentation of glucose
and xylose by pure and mixed cultures of Saccharomyces cerevisiae and
Candida shehatae immobilized in a two-chambered bioreactor. Enzyme and
Microbial Technology, 21, 265-272.
Lee, J. (1997) Biological conversion of lignocellulosic biomass to ethanol. Journal of
Biotechnology, 56, 1-24.
Lee, S.-W., Ebata, T., Liu, Y.-C. & Tanaka, H. (1993) Co-immobilization of three
strains of microorganisms and its application in ethanol production from raw
starch under unsterile conditions. Journal of Fermentation and
Bioengineering 75, 36-42.
Lee, W.-C. & Huang, C.-T. (2000) Modeling of ethanol fermentation using
Zymomonas mobilis ATCC 10988 grown on the media containing glucose and
fructose. Biochemical Engineering Journal, 4, 217-227.
Lynd, L. R., Laser, M. S., Bransby, D., Dale, B. E., Davison, B., Hamilton, R.,
Himmel, M., Keller, M., Mcmillan, J. D., Sheehan, J. & Wyman, C. E. (2008)
How biotech can transform biofuels. Nature Biotechnology, 26, 169-172.
Lynd, L. R., van Zyl, W. H., Mcbride, J. E. & Laser, M. (2005) Consolidated
bioprocessing of cellulosic biomass: an update. Current Opinion in
Biotechnology, 16, 577-583.
Madigan, M. T. & Martinko, J. M. (2006a) Major catabolic pathways, electron
transport, and the proton motive force. IN MADIGAN, M. T. & MARTINKO,
J. M. (Eds.) Brock Biology of Microorganisms. 11 ed. Upper Saddle River,
Pearson Education, Inc., pp. 120.
Madigan, M. T. & Martinko, J. M. (2006b) Prokaryotic diversity: the bacteria. IN
MADIGAN, M. T. & MARTINKO, J. M. (Eds.) Brock Biology of
Microorganisms. 11 ed. Upper Saddle River, Pearson Education, Inc., pp.
347-348.
Maleszka, R. & Schneider, H. (1982) Concurrent production and consumption of
ethanol by cultures of Pachysolen tannophilus growing on D-xylose. Applied
and Environmental Microbiology, 44, 909-912.
Martin, C., Almazan, O., Marcet, M. & Jonsson, L. (2007a) A study of three
strategies for improving the fermentability of sugarcane bagasse hydrolysates
for fuel ethanol production. International Sugar Journal, 109, 33-39.
Martin, C., Galbe, M., Wahlbom, C. F., Hahn-Hagerdal, B. & Jonsson, L. J. (2002)
Ethanol production from enzymatic hydrolysates of sugarcane bagasse using
recombinant xylose-utilising Saccharomyces cerevisiae. Enzyme and
Microbial Technology, 31, 274-282.
Martin, C., Gonzalez, Y., Fernandez, T. & Thomsen, A. B. (2006a) Investigation of
cellulose convertibility and ethanolic fermentation og sugarcane bagasse
pretreated by wet oxidation and steam explosion. Journal of Chemical
Technology and Biotechnology, 81, 1669-1677.

194
Martin, C., Klinke, H. B. & Thomsen, A. B. (2007b) Wet oxidation as a pretreatment
method for enhancing the enzymatic converitibility of sugarcane bagasse.
Enzyme and Microbial Technology, 40, 426-432.
Martin, C., Wahlbom, F., Galbe, M., Jonsson, L. J. & Hahn-Hagerdal, B. (2001)
Preparation of sugarcane bagasse hydrolysates for alcoholic fermentation by
yeasts. IN TEIXEIRA DA SILVA, F., FERRAZ, A. & PAIVA, T. (Eds.)
Proceedings of the Sixth Brazilian Symposium on the Chemisitry of Lignins
and other Wood Components. Lorena, FAENOIL., pp. 361-367.
Martin, G. J. O., Knepper, A., Zhou, B. & Pamment, N. B. (2006b) Performance and
stability of ethanologenic Escherichia coli strain FBR5 during continuous
culture on xylose and glucose. Journal of Industrial Microbiology and
Biotechnology, 33, 834-844.
Marton, J. M., Felipe, M. G. A., Almeida E Silva, J. B. & Pessoa Junior, A. (2006)
Evaluation of the activated charcoals and adsorption conditions used in the
treatment of sugarcane bagasse hydrolysate for xylitol production. Brazilian
Journal of Chemical Engineering, 23, 9-21.
Mcmillan, J. D., Newman, M. M., Templeton, D. W. & Mohagheghi, A. (1999)
Simultaneous saccharification and cofermentation of dilute-acid pretreated
yellow poplar hardwood to ethanol using xylose-fermenting Zymomonas
mobilis. Applied Biochemistry and Biotechnology, 77-79, 649-665.
Miller, G. L., Blum, R., Glennon, W. E. & Burton, A. L. (1960) Measurement of
carboxymethylcellulage activity. Analytical Biochemistry, 2, 127-132.
Montville, T. J. & Matthews, K. R. (2008) Viruses and Prions. IN MONTVILLE, T. J.
& MATTHEWS, K. R. (Eds.) Food Microbiology: An Introduction. 2nd ed.
Washington, DC, ASM Press., pp. 328.
Nigam, J. N. (2001a) Ethanol production from hardwood spent sulfite liquor using an
adapted strain of Pichia stipitis. Journal of Industrial Microbiology &
Biotechnology, 26, 145-150.
Nigam, J. N. (2001b) Ethanol production from wheat straw hemicellulose
hydrolysate by Pichia stipitis. Journal of Biotechnology, 87, 17-27.
Olsson, L. & Hahn-Hagerdal, B. (1996) Fermentation of lignocellulosic hydrolysates
for ethanol production. Enzyme and Microbial Technology, 18, 312-331.
Palmarola-Adrados, B., Choteborska, P., Galbe, M. & Zacchi, G. (2005) Ethanol
production from non-starch carbohydrates of wheat bran. Bioresource
Technology, 96, 843-850.
Panagiotou, G., Christakopoulos, P. & Olsson, L. (2005) Simultaneous
saccharification and fermentation of cellulose by Fusarium oxysporum
F3-growth characteristics and metabolic profiling. Enzyme and Microbial
Technology, 36, 693-699.
Parekh, S. R., Yu, S. & Wayman, M. (1986) Adaptation of Candida shehatae and

195
Pichia stipitis to wood hydrolysates for increased ethanol production. Applied
Microbiology and Biotechnology, 25, 300-304.
Passoth, V., Zimmermann, M. & Klinner, U. (2003) Peculiarities of the regulation of
fermentation and respiration in the crabtree-negative, xylose-fermenting yeast
Pichia stipitis. Applied Biochemistry and Biotechnology, 57/58, 201-212.
Patel, M. A., Ou, M. S., Ingram, L. O. & Shanmugam, K. T. (2005) Simultaneous
saccharification and co-fermentation of crystalline cellulose and sugar cane
bagasse hemicellulose hydrolysate to lactate by a thermotolerant acidophilic
bacillus sp. Biotechnology Progess, 21, 1453-1460.
Pereira, D. M. & Lancas, F. M. (1996) Pre-irradiation effects of -rays on sugar
cane bagasse liquefaction. Journal of Radioanalytical and Nuclear Chemistry
Letters, 213, 175-183.
Potera, C. (2008) Fuels: corn ethanol goal revives dead zone concerns.
Environmental Health Perspectives, 116, A242-A243.
Prescott, L. M., Harley, J. P. & Klein, D. A. (2005) Metabolism: energy release and
conservation. IN PRESCOTT, L. M., HARLEY, J. P. & KLEIN, D. A. (Eds.)
Microbiology. 6 ed. New York, McGraw-Hill Companies, Inc., pp. 174-176.
Qian, M., Tian, S., Li, X., Zhang, J., Pan, Y. & Yang, X. (2006) Ethanol production
from dilute-acid softwood hydrolysate by co-culture. Applied Biochemistry
and Biotechnology, 134, 273-283.
Qu, S., Luo, Y., Xue, F., Huang, C., Zhang, N. & Liu, Z. (2007) Seperation and
purification of ferulic acid in alkaline-hydrolysate from sugarcane bagasse by
activated charcoal adsorption/anion macroporous resin exchange
chromatography. Journal of Food Engineering, 78, 1298-1304.
Qureshi, N., Dien, B. S., Nichols, N. N., Saha, B. C. & Cotta, M. A. (2006)
Genetically engineered Escherichia coli for ethanol production from xylose
substrate and product inhibition and kinetic parameters. Food and
Bioproducts Processing, 84, 114-122.
Rebros, M., Rosenberg, M., Stloukal, R. & Kristofikova, L. (2005) High efficiency
ethanol fermentation by entrapment of Zymomonas mobilis into Lentikats .
Letters in Applied Microbiology, 41, 412-416.
Roberto, I. C., Lacis, L. S., Barbosa, M. F. S. & de Mancilha, I. M. (1991) Utilization
of sugar cane bagasse hemicellulosic hydrolysate by Pichia stipitis for the
production of ethanol. Process Biochemistry, 26, 15-21.
Robertson, G. P., Dale, V. H., Doering, O. C., Hamburg, S. P., Melillo, J. M., Wander,
M. M., Parton, W. J., Adler, P. R., Barney, J. N., Cruse, R. M., Duke, C. S.,
Fearnside, P. M., Follett, R. F., Gibbs, H. K., Goldemberg, J., Mladenooff, D.
J., Ojima, D., Palmer, M. W., Sharpley, A., Wallace, L., Weathers, K. C.,
Wiens, J. A. & Wilhelm, W. W. (2008) Agriculture: sustainable biofuels redux.
Science, 322, 49-50.

196
Rodriguez-Chong, A., Ramirez, J. A., Garrote, G. & Vazquez, M. (2004) Hydrolysis
of sugar cane bagasse using nitric acid: a kinetic assessment. Journal of Food
Engineering, 61, 143-152.
Rortrup-Nielsen, J. R. (2005) Chemistry: making fuels from biomass. Science, 308,
1421-1422.
Rossell, C. E. V., Filho, D. L., Hilst, A. G. P. & Leal, M. R. L. V. (2006)
Saccharification of sugarcane bagasse for ethanol production using the
Organosolv process. Sugar Industry/Zuckerindustrie, 131, 105-109.
Runge, C. F. & Senauer, B. (2007) How biofuels could starve the poor. Foreign
Affairs, 86, 41-54.
Saha, B. C. (2003) Hemicellulose bioconversion. Journal of Industrial Microbiology
and Biotechnology, 30, 279-291.
Saha, B. C., Iten, L. B., Cotta, M. A. & Wu, Y. V. (2005) Dilute acid pretreatment,
enzymatic saccharification and fermentation of wheat straw to ethanol.
Process Biochemistry, 40, 3693-3700.
Sanchez, S., Bravo, V., Castro, E., Moya, A. J. & Camacho, F. (1999) Comparative
study of the fermentation of D-glucose/D-xylose mixtures with Pachysolen
tannophilus and Candida shehatae. Bioprocess Engineering, 21, 525-532.
Sanchez, S., Bravo, V., Castro, E., Moya, A. J. & Camacho, F. (2002) The
fermentation of mixtures of D-glucose and D-xylose by Candida shehatae,
Pichia Stipitis or Pachysolen tannophilus to produce ethanol. Journal of
Chemical Technology and Biotechnology, 77, 641-648.
Sanchez, S., Bravo, V., Moya, A. J., Castro, E. & Camacho, F. (2004) Influence of
temperature on the fermentation of D-xylose by Pachysolen tannophilus to
produce ethanol and xylitol. Process Biochemistry, 39, 673-679.
Santos, J. C., Pinto, I. R. G., Carvalho, W., Mancilha, I. M., Felipe, M. G. A. & Silva,
S. S. (2005) Sugarcane bagasse as raw material and immobilization support
for xylitol production. Applied Biochemistry and Biotechnology, 121-124,
673-684.
Sene, L., Converti, A., Zilli, M., Felipe, M.G.A., Silva, S.S. (2001) Metabolic study
of the adaptation of the yeast Candida guilliermondii to sugarcane bagasse
hydrolysate. Applied Microbiology and Biotechnology, 57, 738-743.
Sene, L., Felipe, M. G. A., Vitolo, M., Silva, S. S. & Mancilha, I. M. (1998)
Adaptation and reutilization of Candida guilliermondii cells for xylitol
production in bagasse hydrolysate. Journal of Basic Microbiology, 38, 61-69.
Shama, G. (1991) Prospects for ethanol production from cellulose with Clostridium
thermocellum-Bacillus stearothermophilus co-cultures. Biotechnology Letters,
13, 761-764.
Shi, X.-Q. & Jeffries, T. W. (1998) Anaerobic growth and improved fermentation of

197
Pichia stipitis bearing a URA1 gene from Saccharomyces cerevisiae. Applied
Microbiology and Biotechnology, 50, 339-345.
Silva, S. S., Matos, Z. R. & Carvalho, W. (2005) Effects of sulfuric acid loading and
residence time on the composition of sugarcane bagasse hydrolysate and its
use as a source of xylose for xylitol bioproduction. Biotechnology Progress,
21, 1449-1452.
Skoog, K. & Hahn-Hagerdal, B. (1990) Effect of oxygenation on xylose fermentation
by Pichia Stipitis. Applied and Environmental Microbiology, 56, 3389-3394.
Skoog, K., Hahn-Hagerdal, B., Degn, H., Jacobsen, J. P. & Jacobsen, H. S. (1992)
Ethanol reassimilation and ethanol tolerance in Pichia stipitis CBS 6054 as
studied by 13
C nuclear magnetic resonance spectroscopy. Applied and
Environmental Microbiology, 58, 2552-2558.
Stanbury, P. F., Whitaker, A. & Hall, S. J. (2000) Microbial growth kinetics. IN
STANBURY, P. F., WHITAKER, A. & HALL, S. J. (Eds.) Principles of
Fermentation Technology. 2nd ed. Melbourne, Butterworth-Heinemann., pp.
16-19.
Takahashi, C. M., Lima, K. G. D. C., Takahashi, D. F. & Alterhum, F. (2000)
Fermentation of sugar cane bagasse hemicellulosic hydrolysate and sugar
mixtures to ethanol by recombinant Escherichia coli KO11. World Journal of
Microbiology and Biotechnology, 16, 829-834.
Taniguchi, M., Itaya, T., Tohma, T. & Fujii, M. (1997a) Ethanol production from a
mixture of glucose and xylose by a novel co-culture system with two
fermentors and two microfiltration modules. Journal of Fermentation and
Bioengineering, 84, 59-64.
Taniguchi, M., Tohma, T., Itaya, T. & Fujii, M. (1997b) Ethanol production from a
mixture of glucose and xylose by co-culture of Pichia stipitis and a
respiratory-deficient mutant of Saccharomyces cerevisiae. Journal of
Fermentation and Bioengineering, 83, 364-370.
Teixeira, L. C., Linden, J. C. & Schroeder, H. A. (1999) Optimizing peracetic acid
pretreatment conditions for improved simultaneous saccharification and
co-fermentation (SSCF) of sugar cane bagasse to ethanol fuel. Renewable
Energy, 16, 1070-1073.
Tenenbaum, D. J. (2008) Food vs. fuel: diversion of crops could cause more hunger.
Environmental Health Perspectives, 116, 254-257.
Underwood, S. A., Buszko, M. L., Shanmugam, K. T. & Ingram, L. O. (2004) Lack
of protective osmolytes limits final cell density and volumetric productivity
of ethanologenic Escherichia coli KO11 during xylose fermentation. Applied
and Environmental Microbiology, 70, 2734-2740.
van Maris, A. J. A., Abbott, D. A., Bellissimi, E., van Den Brink, J., Kuyper, M.,
Luttik, M. A. H., Wisselink, H. W., Scheffers, W. A., van Dijken, J. P. &
Pronk, J. T. (2006) Alcoholic fermentation of carbon sources in biomass

198
hydrolysates by Saccharomyces cerevisiae: current status. Antonie van
Leeuwenhoek, 90, 391-418.
van Zyl, W. H., Lynd, L. R., den Haan, R. & Mcbride, J. E. (2007) Consolidated
bioprocessing for bioethanol production using Saccharomyces cerevisiae.
Advances in Biochemistry Engineering/Biotechnology, 108, 205-235.
Vancauwenberge, J. E., Bolen, P. L., Mccracken, D. A. & Bothast, R. J. (1989) Effect
of growth conditions on cofactor-linked xylose reductase activity in
Pachysolen tannophilus. Enzyme and Microbial Technology, 11, 662-667.
Walch, E., Zemann, A., Schinner, F., Bonn, G. & Bobleter, O. (1992) Enzymatic
saccharification of hemicelluose obtained from hydrothermally pretreated
sugar cane bagasse and beech bark. Bioresource Technology, 39, 173-177.
Watson, N. E., Prior, B. A. & Lategan, P. M. (1984) Factors in acid treated bagasse
inhibiting ethanol production from D-xylose by Pachysolen tannophilus.
Enzyme and Microbial Technology, 6, 451-456.
Yang, V. W., Marks, J. A., Davis, B. P. & Jeffries, T. W. (1994) High-efficiency
transformation of Pichia stipitis based on its URA3 gene and a homologous
autonomous replication sequence, ARS2. Applied and Environmental
Microbiology, 60, 4245-4254.
Yu, S., Wayman, M. & Parekh, S. K. (1987) Fermentation to ethanol of
pentose-containg spent sulphite liquor. Biotechnology and Bioengineering.,
29, 1144-1150.
Yu, Z. & Zhang, H. (2002) Pretreatmens of cellulose pyrolysate for ethanol
production by Saccharomyces cerevisiae, Pichia SP. YZ-1 and Zymomonas
mobilis. Biomass and Bioenergy, 24, 257-262.
Zaldivar, J., Nielsen, J. & Olsson, L. (2001) Fuel ethanol production from
lignocellulose: a challenge for metabolic engineering and process integration.
Applied Microbiology and Biotechnology, 56, 17-34.
Zayed, G. & Meyer, O. (1996) The single-batch bioconversion of wheat straw to
ethanol employing the fungus Trichoderma viride and the yeast Pachysolen
tannophylus. Applied Microbiology and Biotechnology, 45, 551-555.
Zhang, M., Eddy, C., Deanda, K., Finkelstein, M. & Picataggio, S. (1995) Metabolic
engineering of a pentose metabolism pathway in ethanologenic Zymomonas
mobilis. Science, 267, 240-243.
Zhang, Y.-H. P. (2008) Reviving the carbohydrate economy via multi-product
lignocellulose biorefineries. Journal of Industrial Microbiology and
Biotechnology, 35, 367-375.

Appendix A
199
Appendix
A. Optimization of the Glucose oxidase method
In order to optimize the Glucose oxidase method and obtain a linear standard curve, a
number of parameters were examined experimentally. These included the wavelength,
the amount of chromogen and the reagent used to stop the enzymatic reaction.
Results of these experiments are shown in both Figure A.1 and Figure A.2.
( a)
00. 050. 1
0. 150. 2
0. 250. 3
0. 35
0 50 100 150 200 250 300
Gl ucose st andar ds ( mcg/ ml )
Abso
rban
ce
540 nm 525 nm 560 nm 510 nm
( b)
0
0. 1
0. 2
0. 3
0. 4
0. 5
0 50 100 150 200 250 300Gl ucose st andar ds ( mcg/ ml )
Abso
rban
ce -
540
nm
6ml chr omogen 4ml chr omogen
Figure A.1: Effects of reaction parameters on the Glucose oxidase method: (a)
wavelength, (b) amount of chromogen.

Appendix A
200
( a) 2 ml of concent r at ed sul f ur i c aci d
0
0. 1
0. 2
0. 3
0. 4
0. 5
0 50 100 150 200 250 300
Gl ucose st andar ds ( mcg/ ml )
Abso
rban
ce
I mmedi at e r eadi ng Af t er 30 mi n
( b) 5 ml of 25% sul f ur i c aci d
0
0. 02
0. 04
0. 06
0. 08
0. 1
0 50 100 150 200 250 300
Gl ucose st andar ds ( mcg/ ml )
Abso
rban
ce
I mmedi at e r eadi ng Af t er 30 mi n
( c) 2 ml of 25% sul f ur i c aci d
0
0. 05
0. 1
0. 15
0. 2
0. 25
0 50 100 150 200 250 300Gl ucose st andar ds ( mcg/ ml )
Abso
rban
ce
I mmedi at e r eadi ng Af t er 30 mi n
( d) 2 ml of pr e- chi l l ed di st i l l ed wat er
0
0. 1
0. 2
0. 3
0. 4
0 50 100 150 200 250 300Gl ucose st andar ds ( mcg/ ml )
Abso
rban
ce
I mmedi at e r eadi ng Af t er 30 mi n
Figure A.2: Effects of stopping reagent on the Glucose oxidase method: (a) 2 ml of concentrated sulfuric acid, (b) 5 ml of 25% sulfuric acid,
(c) 2 ml of 25% sulfuric acid, (d) 2 ml of pre-chilled distilled water.

Appendix A
201
From Figure A.1 it can be seen that, under all six conditions, the standard curve of
Glucose oxidase method was approximately linear. However, the wavelength of 525
nm gave the highest absorbance readings for all tested glucose concentrations. On the
other hand, when 6 ml of chromogen solution and 2 ml distilled H2O were used for
the reaction mixture, the resulted absorbance readings were considerably higher than
those obtained with 4 ml of chromogen and 4 ml water. Nevertheless, for economic
considerations, the latter combination was chosen, together with 525 nm wavelength,
as the optimal conditions.
In the Figure A.2 testing the effect of stopping reagent, Reagent (a) 2 ml of
concentrated sulfuric acid and Reagent (b) 5 ml of 25% sulfuric acid were
respectively suggested by previous literature (Chow and Landhausser, 2004) and
AOAC Official Method (AOAC-International, 2006). However, as shown in the
Figure A.2, both methods failed to completely stop the reaction; 30 min after the
addition of the stopping reagent, the spectrophotometric reading of each standard
altered significantly. Moreover, when the concentrated sulfuric acid was used,
samples turned the originally orange color into pink, which may indicate some
undesirable side reactions. Reagent (3) with 2 ml 25% sulfuric acid was not able to
stop the reaction either; the divergence of two curves indicated the color change of
the solutions as the enzymatic reaction continued. Finally, with Reagent (4) 2 ml
distilled water prechilled in the ice bath for more than 30 min, superimposed
standard curves were achieved, indicating no change of color during the 30 min after
the addition of the stopping reagent. This suggested that the prechilled distilled water
had stopped the reaction satisfactorily, probably because of the significant decrease
in the temperature. Thus 2 ml of pre-chilled distilled water was selected as the
stopping reagent, which gave repeatable results for the assay.
The Glucose oxidase assay carried out under these conditions provided a reliable
standard curve and a high sensitivity; the resulting medium color stayed stable for 30
min after the assay, thus preventing the potential color change during the time of
absorbance measurement. The procedure described in the Section 3.10.1.2 of this
thesis is recommended as an optimized procedure for the glucose assay in a sugar
mixture.

Appendix A
202
References:
AOAC-International (2006) AOAC Official Method 969.39: Glucose in Corn Syrups
and Dextrose Products. AOAC Official Method.
Chow, P. S. & Landhausser, S. M. (2004) A method for routine measurements of total
sugar and starch content in woody plant tissues. Tree Physiology, 24,
1129-1136.