conversion of bouguer gravity data to depth, dip, and ...rrp.infim.ro/2011_63_1/28-reci.pdf · the...
TRANSCRIPT
Romanian Reports in Physics, Vol. 63, No. 1, P. 302–320, 2011
CONVERSION OF BOUGUER GRAVITY DATA TO DEPTH, DIP, AND DENSITY CONTRAST WITH COMPLEX ATTRIBUTES
ANALYSIS TECHNIQUE, IN THE AREA OF GREECE
H. RECI1, G.N. TSOKAS2, C. PAPAZACHOS2, S. BUSHATI3
1 Institute of Geosciences of Albania, Polytechnic University, Str. Don Bosko, Tirana, Albania 2 Geophysical Laboratory, Aristotle University of Thessaloniki, 54006 Thessaloniki, Greece
3 Academy of Sciences of Albania. Sq. F.S. Noli, Tirana, Albania
Received August 30, 2009
Abstract. The complex attributes analysis is an operator used in the extracting parameters of the buried structures with susceptibility and density contrasts distributions, which lead to the gravity and magnetic anomalies in the region of interest. In this paper is presented the complex attributes analysis of gravity field filtered for wavelengths lower than 50 km in the territory of Greece. The area of Greece has a complex tectonic history and fault system dominated by the subduction of the African plate beneath the Euroasia. A low-pass filter is used on the Bouguer Anomaly to cut off wavelengths lower than 50Km in order to delineate the major faults structures of interests at big depths.
The complex attributes technique aids in interpretation of potential field anomalies, because it can delineate the edges of concealed targets. In obtaining the source parameters from the complex attributes like the local depth, strike and dip, the assumption of sloping contact for the subsurface model is used.
The estimated local parameters are in agreement with results obtained by previous interpretations. They can be used in combination with other method to interpret the anomalous field.
1. INTRODUCTION
Gravity and magnetic data are used commonly to map thin magnetic and gravimetric sheets or contacts such as faults (Smith & Thurston, 1996). A potential field is the superposition of the fields due to all sources in the neighborhood. Thus essentially no information can be extracted from the data in the absence of a model. The simplest model is that of a contact or interface between domains with different susceptibility or density. The ultimate goal of a potential field survey is to estimate the parameters of causative source i.e. its burial depth, depth extent, lateral extent and magnitude of the contrasts of physical properties. In general, inversion offers the means to extract from the signal these quantities which describe the causative

2 Conversion of Bouguer gravity data 303
source. Thus if the source is mapped and the interference from the other sources is suppressed, we obtain the desired result.
A number of techniques can be applied in an automatic mode to yield the spatial distribution of parameters, which describe the source. For example, Werner deconvolution (Hartman et al., 1971), 3-D Euler deconvolution (Reid at al., 1990), multiple source Werner deconvolution (Hansen and Simmonds, 1993) (Tsokas &Hansen, 1997), and the 3-D analytic signal technique (Roest et al., 1992) are advanced and popular automatic interpretation schemes.
The use of analytic signal amplitude (Nabighian 1972; 1974) poses attractive features for any sort of potential field prospecting. Its advantageous geophysical property is that it peaks exactly over the edge of the buried dipping contact that causes the magnetic anomaly (Nabighian, 1972). Also, its amplitude is independent of inclination, declination, remanent magnetization and dip if the sources are 2-D (Blakeley, 1995; Thurston and Smith, 1997). The only disadvantage is that the analytic signal anomalies are relatively much broader than the lateral extent of the buried target.
The present paper deals with the exploitation of the complex attributes of the filtered Bouguer Gravity signal in order to extract properties of the source of the anomalous fields. Of course, the analytic signal comprises the most well known among them. The “Local phase” and “instantaneous wavenumber” technique comprise the other two quantities which lead also to source parameters mapping. This work follows the foundation and terminology of the work of Thurston and Smith (1997). They formed an automatic interpretation scheme for magnetic data, based on the complex attributes which they named “Source Parameter Imaging (SPITM)” method.
The aim is to delineate the edges of the buried bodies, to estimate their extent, to assess strike angles and produce burial depth estimates at once. The complex attributes analysis offers the means to carry this out. It is their applicability and effectiveness in exploring the subsurface using gravity data which is investigated in this work.
The gravity field is a potential field and the analysis used in this work depends on this fact. In particular, the analysis depends both on the fact that the gravity field is a potential field and the fact that, because of two-dimensionality of the contact model already introduced, the field is two-dimensional. This implies that the horizontal and vertical derivatives of the field form a Hilbert transform pair. Derivatives in general play a role in potential field interpretation because they isolate contacts, over which the field can be expected to change rapidly and therefore to have large values for its derivatives. More specifically, in this case the analysis which yields the contact parameters involves both the vertical and the horizontal derivatives (Thurston and Smith, 1997).
The particular combinations of derivatives introduced by Thurston and Smith are the local phase and the local wavenumber. The local phase is the arctangent of
H. Reci et al. 3 304
the ratio of vertical to horizontal derivative of the field. Local frequency and local wavenumber are essentially synonymous; the former is generally used in discussion of time series, the latter is a more appropriate term for spatially distributed data.
The interpretation of the filtered gravity field of Greece is attempted here using complex attribute analysis. The aim is to study the major tectonic features such as fault structures in the crust of the Aegean area.
2. COMPLEX ATTRIBUTES
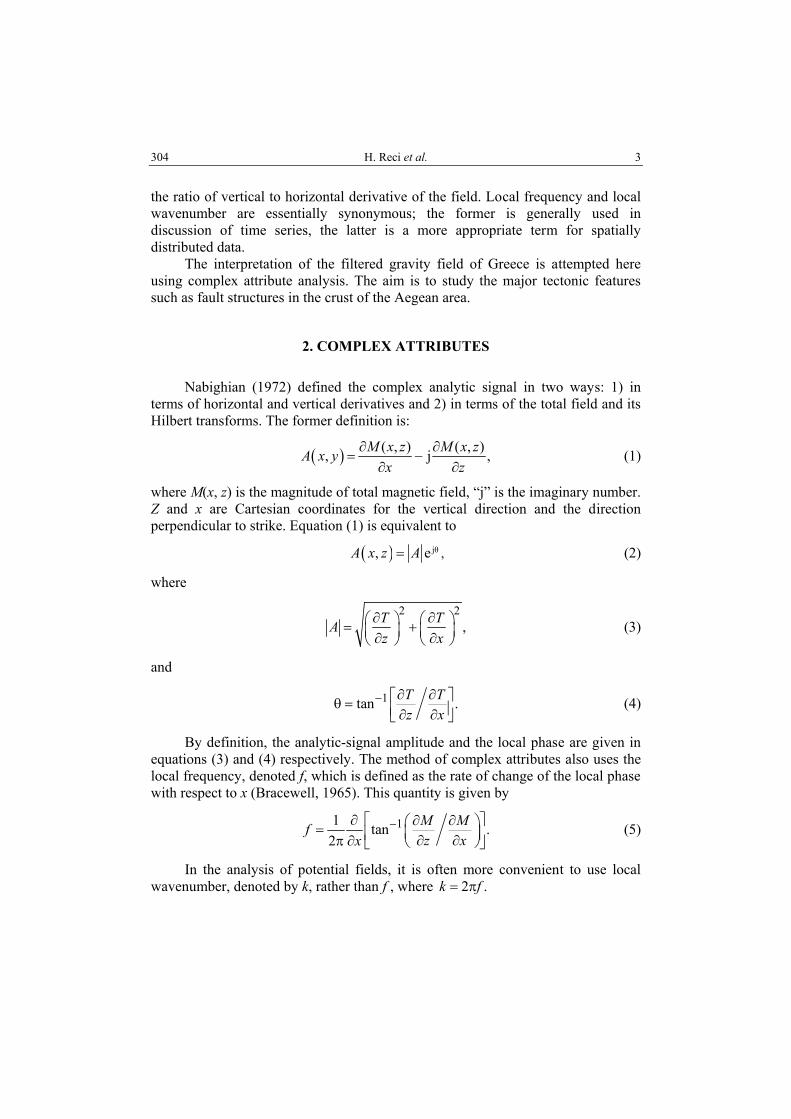
Nabighian (1972) defined the complex analytic signal in two ways: 1) in terms of horizontal and vertical derivatives and 2) in terms of the total field and its Hilbert transforms. The former definition is:
( ) ( , ) ( , ), j ,M x z M x zA x yx z
∂ ∂= −
∂ ∂ (1)
where M(x, z) is the magnitude of total magnetic field, “j” is the imaginary number. Z and x are Cartesian coordinates for the vertical direction and the direction perpendicular to strike. Equation (1) is equivalent to
( ) jθ, eA x z A= , (2)
where
2 2
,T TAz x
∂ ∂ = + ∂ ∂ (3)
and
1tan .T Tz x
− ∂ ∂ θ = ∂ ∂ (4)
By definition, the analytic-signal amplitude and the local phase are given in equations (3) and (4) respectively. The method of complex attributes also uses the local frequency, denoted f, which is defined as the rate of change of the local phase with respect to x (Bracewell, 1965). This quantity is given by
11 tan .2
M Mfz xx
−∂ ∂ ∂ = ∂ ∂π ∂ (5)
In the analysis of potential fields, it is often more convenient to use local wavenumber, denoted by k, rather than f , where 2 .k f= π
4 Conversion of Bouguer gravity data 305
Making this substitution, and using the differentiation rule
( )
1
2(tan ) 1
1x
−∂ ϕ=
∂ + ϕ gives,
2
2 21 .M M M Mk
x z z zxA
∂ ∂ ∂ ∂= − ∂ ∂ ∂ ∂∂
(7)
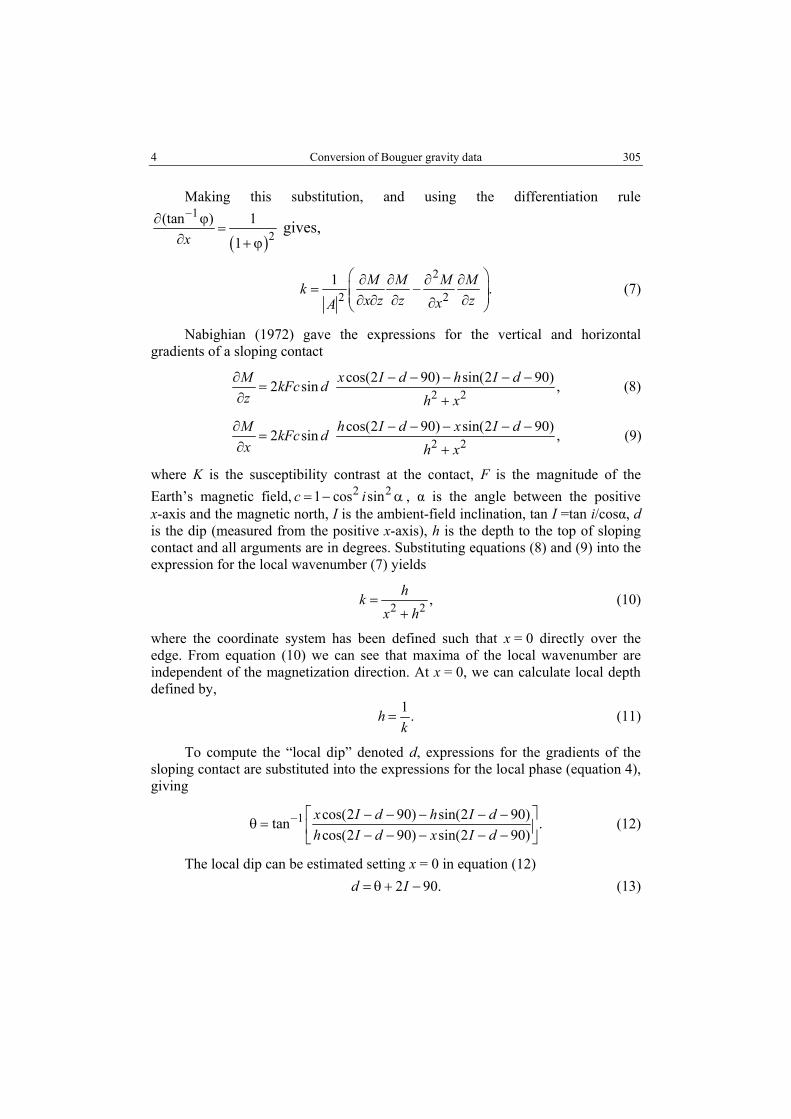
Nabighian (1972) gave the expressions for the vertical and horizontal gradients of a sloping contact
2 2cos(2 90) sin(2 90)2 sin ,M x I d h I dkFc d
z h x∂ − − − − −
=∂ +
(8)
2 2cos(2 90) sin(2 90)2 sin ,M h I d x I dkFc d
x h x∂ − − − − −
=∂ +
(9)
where K is the susceptibility contrast at the contact, F is the magnitude of the Earth’s magnetic field, 2 21 cos sinc i= − α , α is the angle between the positive x-axis and the magnetic north, I is the ambient-field inclination, tan I =tan i/cosα, d is the dip (measured from the positive x-axis), h is the depth to the top of sloping contact and all arguments are in degrees. Substituting equations (8) and (9) into the expression for the local wavenumber (7) yields
2 2 ,hkx h
=+
(10)
where the coordinate system has been defined such that x = 0 directly over the edge. From equation (10) we can see that maxima of the local wavenumber are independent of the magnetization direction. At x = 0, we can calculate local depth defined by,
1 .hk
= (11)
To compute the “local dip” denoted d, expressions for the gradients of the sloping contact are substituted into the expressions for the local phase (equation 4), giving
1 cos(2 90) sin(2 90)tan .cos(2 90) sin(2 90)
x I d h I dh I d x I d
− − − − − −θ = − − − − −
(12)
The local dip can be estimated setting x = 0 in equation (12) 2 90.d I= θ + − (13)
H. Reci et al. 5 306
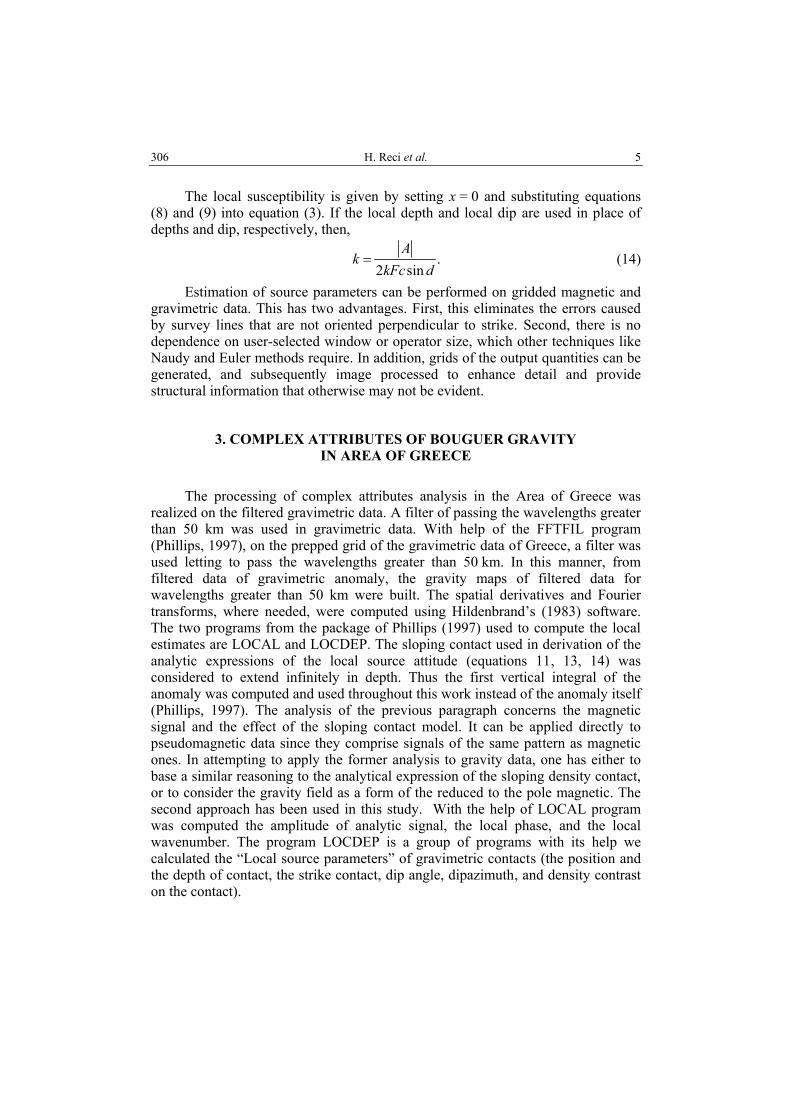
The local susceptibility is given by setting x = 0 and substituting equations (8) and (9) into equation (3). If the local depth and local dip are used in place of depths and dip, respectively, then,
.2 sin
Ak
kFc d= (14)
Estimation of source parameters can be performed on gridded magnetic and gravimetric data. This has two advantages. First, this eliminates the errors caused by survey lines that are not oriented perpendicular to strike. Second, there is no dependence on user-selected window or operator size, which other techniques like Naudy and Euler methods require. In addition, grids of the output quantities can be generated, and subsequently image processed to enhance detail and provide structural information that otherwise may not be evident.
3. COMPLEX ATTRIBUTES OF BOUGUER GRAVITY IN AREA OF GREECE
The processing of complex attributes analysis in the Area of Greece was realized on the filtered gravimetric data. A filter of passing the wavelengths greater than 50 km was used in gravimetric data. With help of the FFTFIL program (Phillips, 1997), on the prepped grid of the gravimetric data of Greece, a filter was used letting to pass the wavelengths greater than 50 km. In this manner, from filtered data of gravimetric anomaly, the gravity maps of filtered data for wavelengths greater than 50 km were built. The spatial derivatives and Fourier transforms, where needed, were computed using Hildenbrand’s (1983) software. The two programs from the package of Phillips (1997) used to compute the local estimates are LOCAL and LOCDEP. The sloping contact used in derivation of the analytic expressions of the local source attitude (equations 11, 13, 14) was considered to extend infinitely in depth. Thus the first vertical integral of the anomaly was computed and used throughout this work instead of the anomaly itself (Phillips, 1997). The analysis of the previous paragraph concerns the magnetic signal and the effect of the sloping contact model. It can be applied directly to pseudomagnetic data since they comprise signals of the same pattern as magnetic ones. In attempting to apply the former analysis to gravity data, one has either to base a similar reasoning to the analytical expression of the sloping density contact, or to consider the gravity field as a form of the reduced to the pole magnetic. The second approach has been used in this study. With the help of LOCAL program was computed the amplitude of analytic signal, the local phase, and the local wavenumber. The program LOCDEP is a group of programs with its help we calculated the “Local source parameters” of gravimetric contacts (the position and the depth of contact, the strike contact, dip angle, dipazimuth, and density contrast on the contact).

6 Conversion of Bouguer gravity data 307
4. DATA USED
The data included in the database came from different interpreting groups. The most of measurements were carried out by IGME (Institute of Geology and Mineral Explorations of Athens). These data were collected for the first time from the Hamburg University (Makris et al., 1983). In the sea, the measurements were made by Morelli et al. (1975a, 1975b).
A total of 22000 gravity stations were measured and used to create a values matrix of Gravity anomaly with a 2×2 km grid. To entire the matrix of gravimetric stations other data were added. On the gravity anomaly map of Albania iso-anomaly lines were digitized and that data were used in the north part of Greek area (Bushati, personal communications, 1991). On the basis of this grid described above the Bouguer gravity anomaly map was build (Fig 1).
5. RESULTS AND DISCUSSION
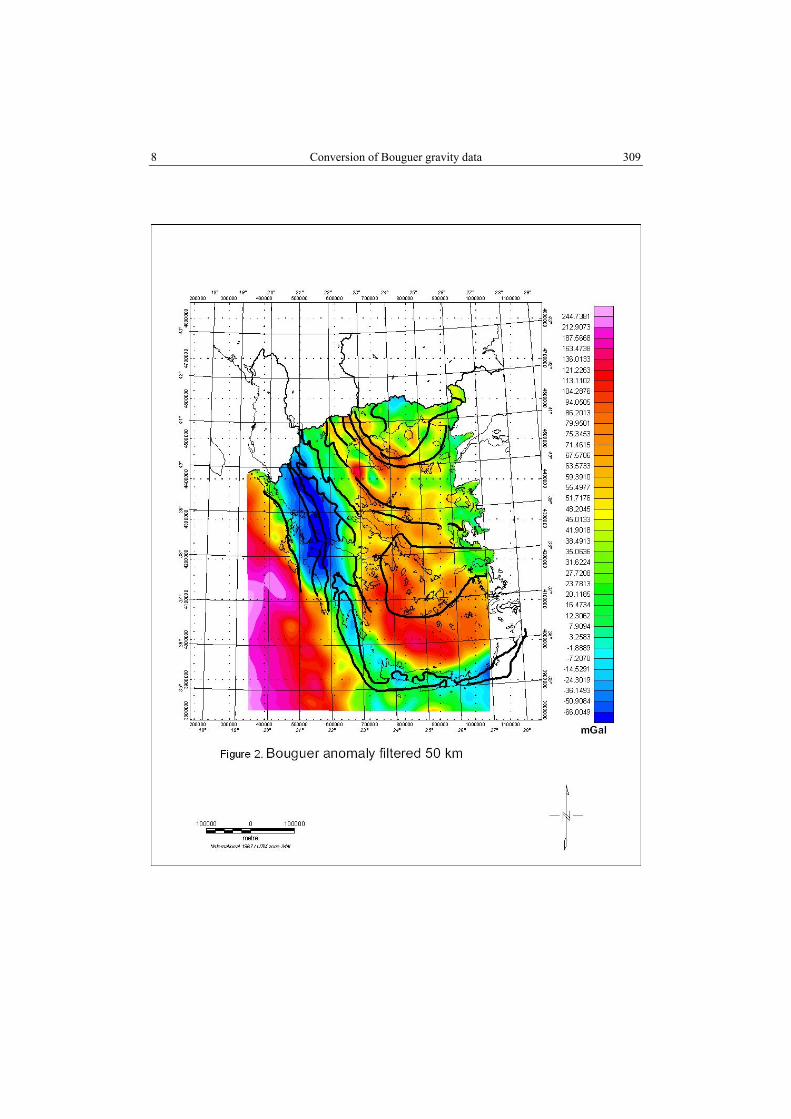
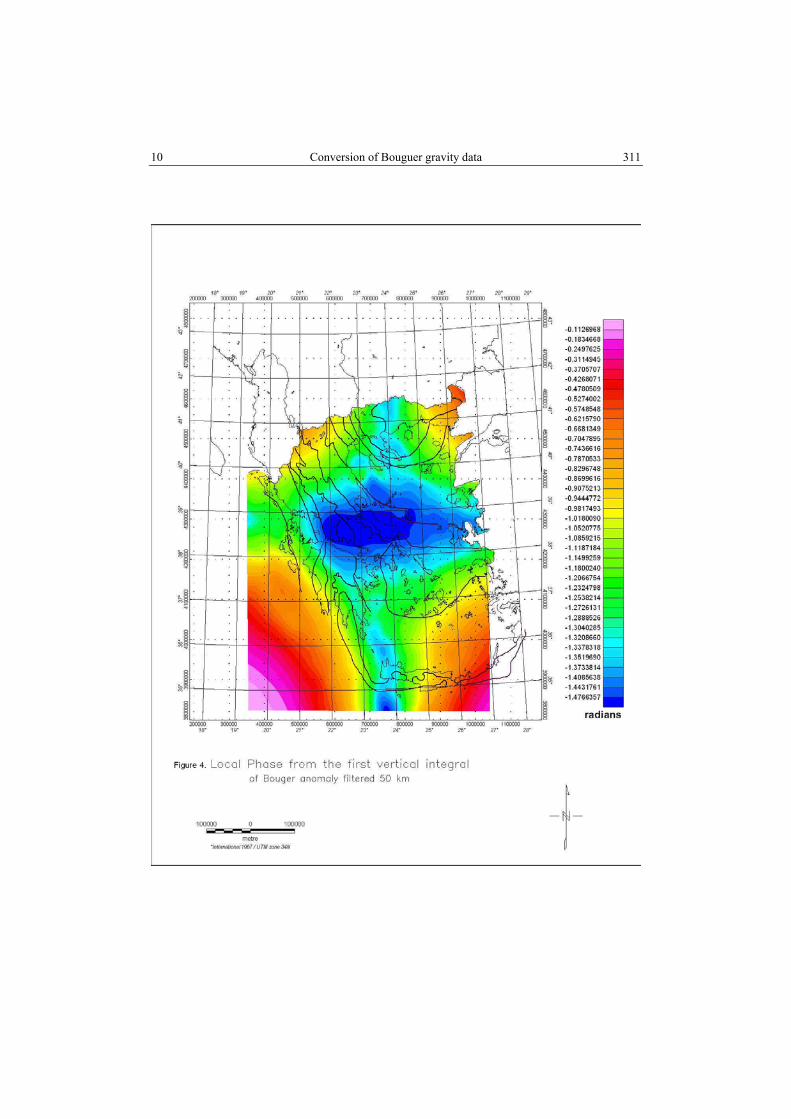
Figure 2 shows the filtered Bouguer anomaly map of Greece area cutting out all wavelengths less than 50 km. Figures 3, 4 and 5 show the complex attributes distribution, the amplitude of analytic signal, the local phase and the local wavenumber respectively, over the area of Greece. The locations of major tectonic features are delineated in the plot of the local wavenumber distribution. The other two attributes can be used in the same context.
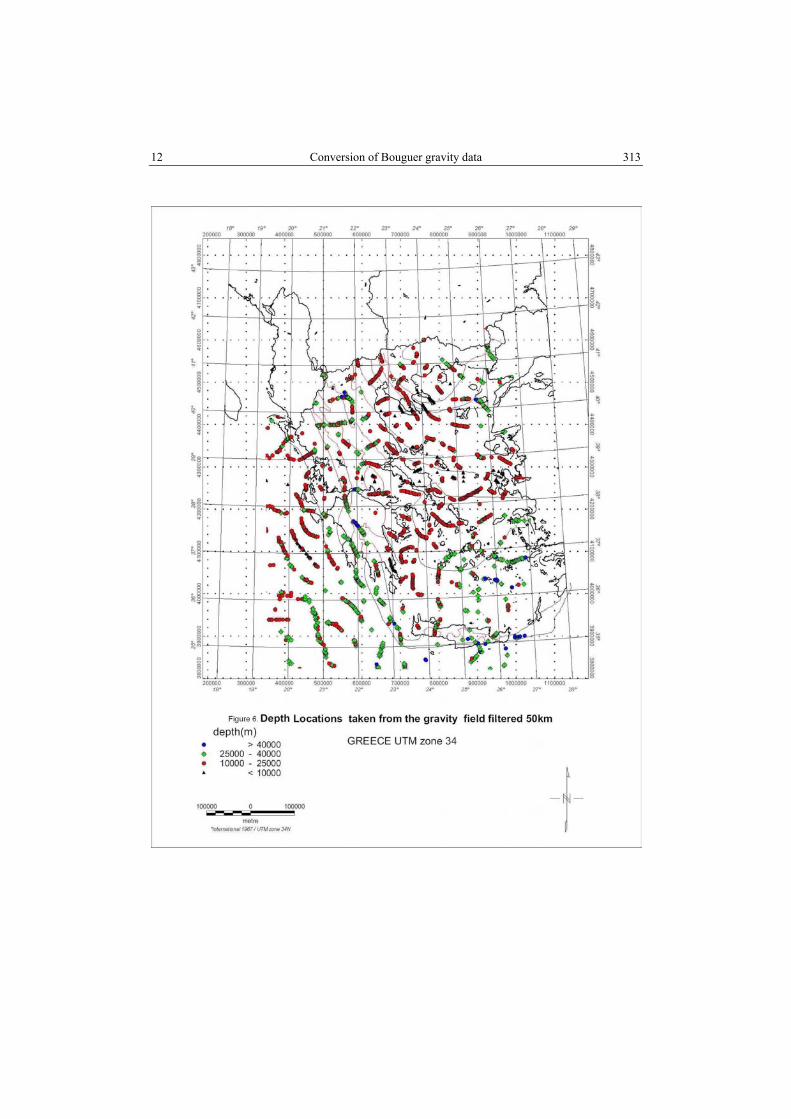
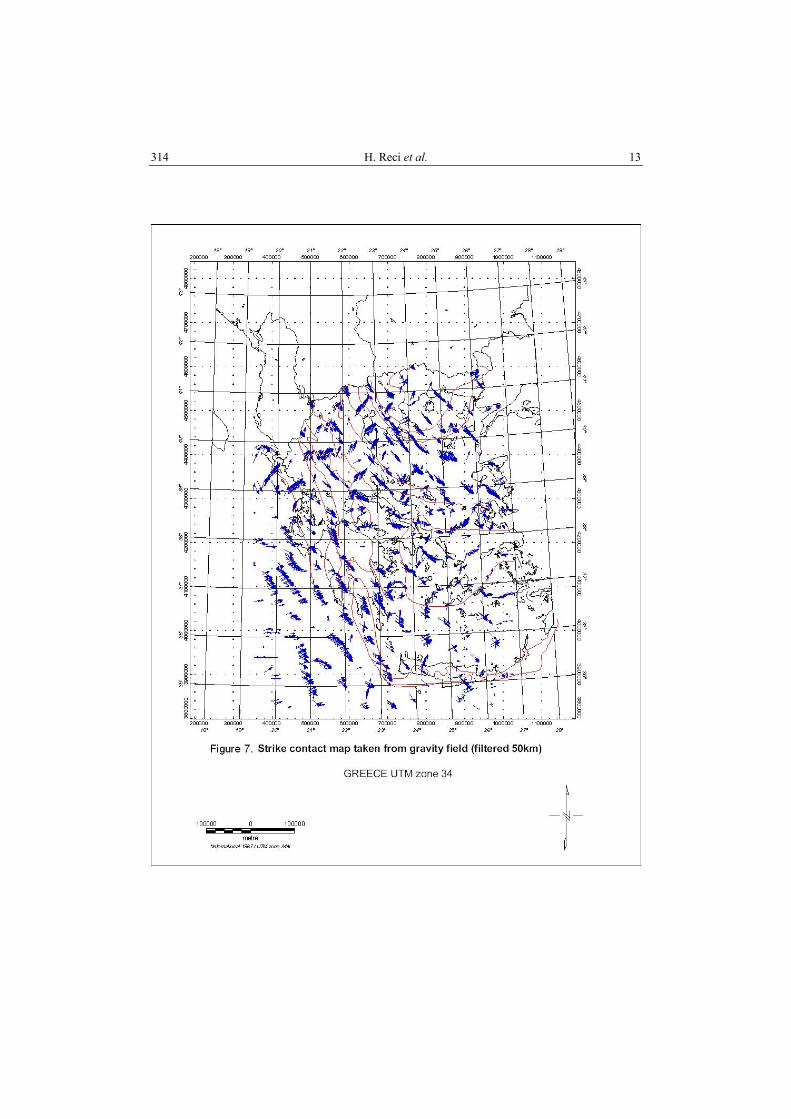
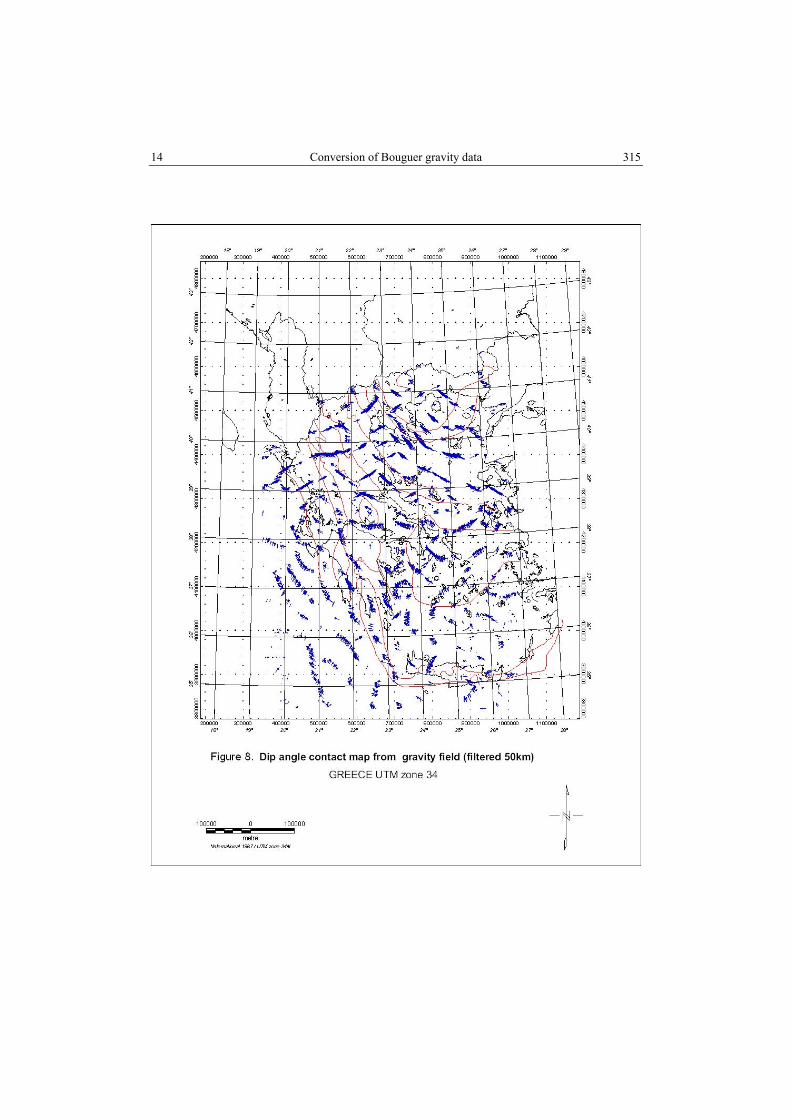
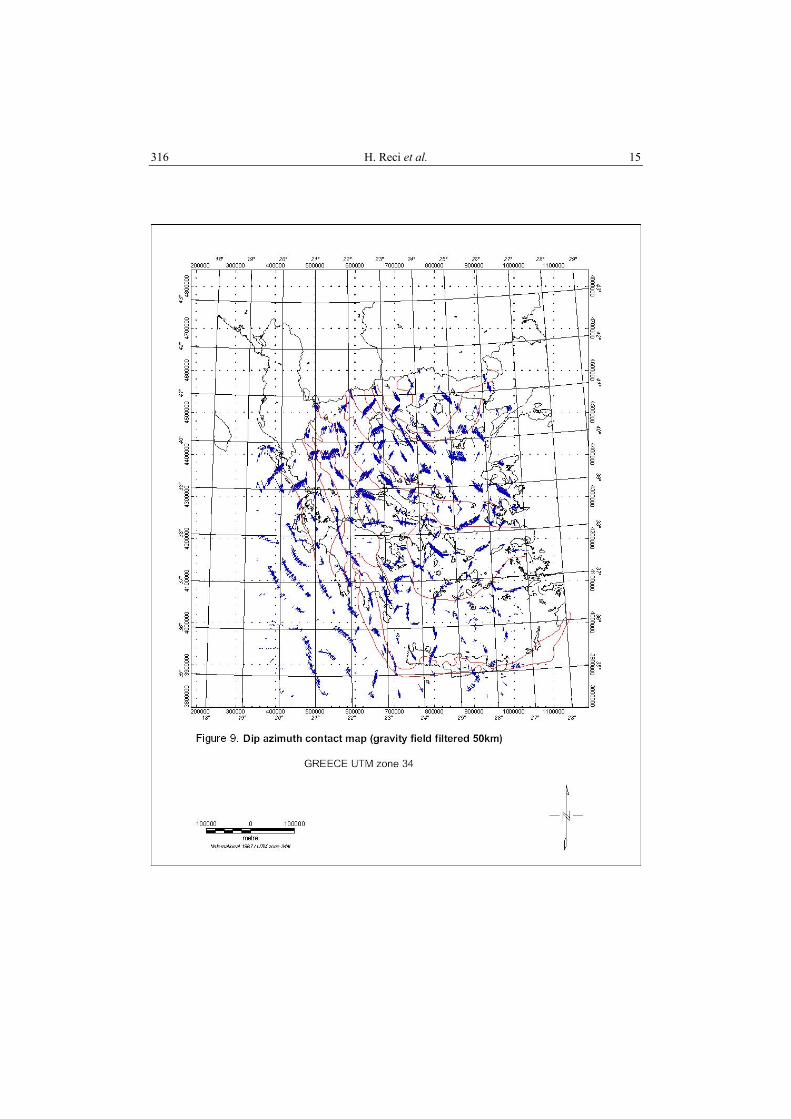
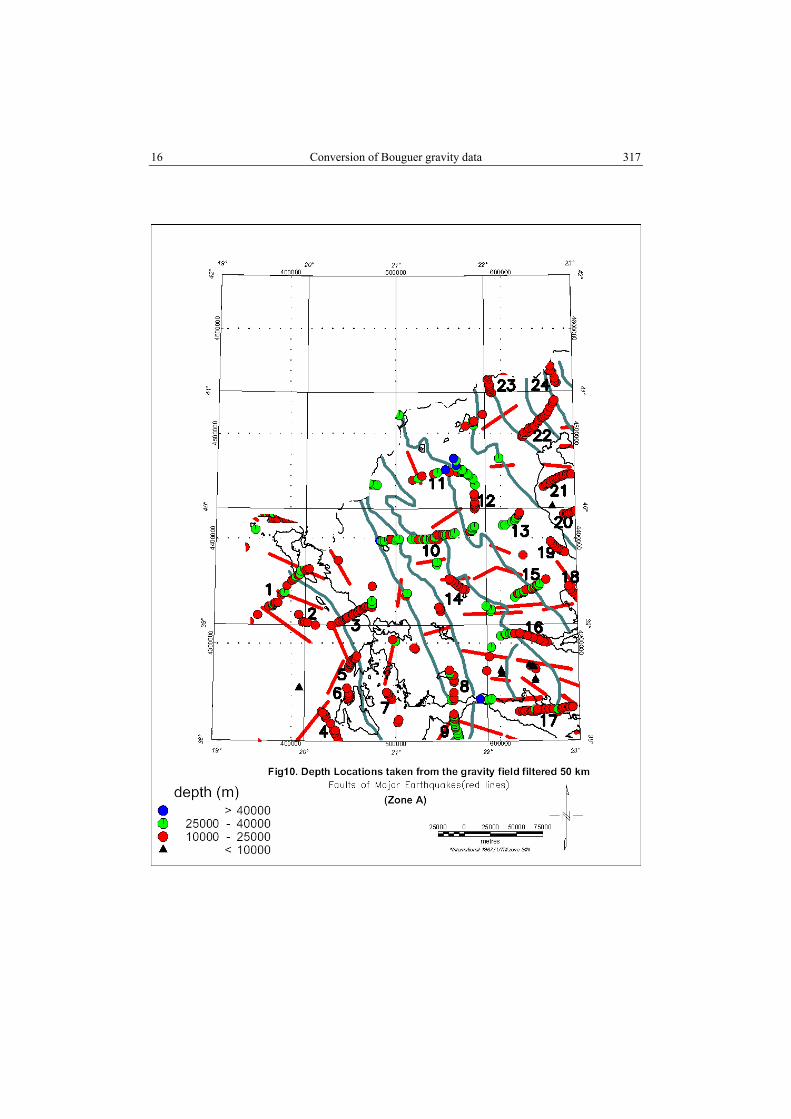
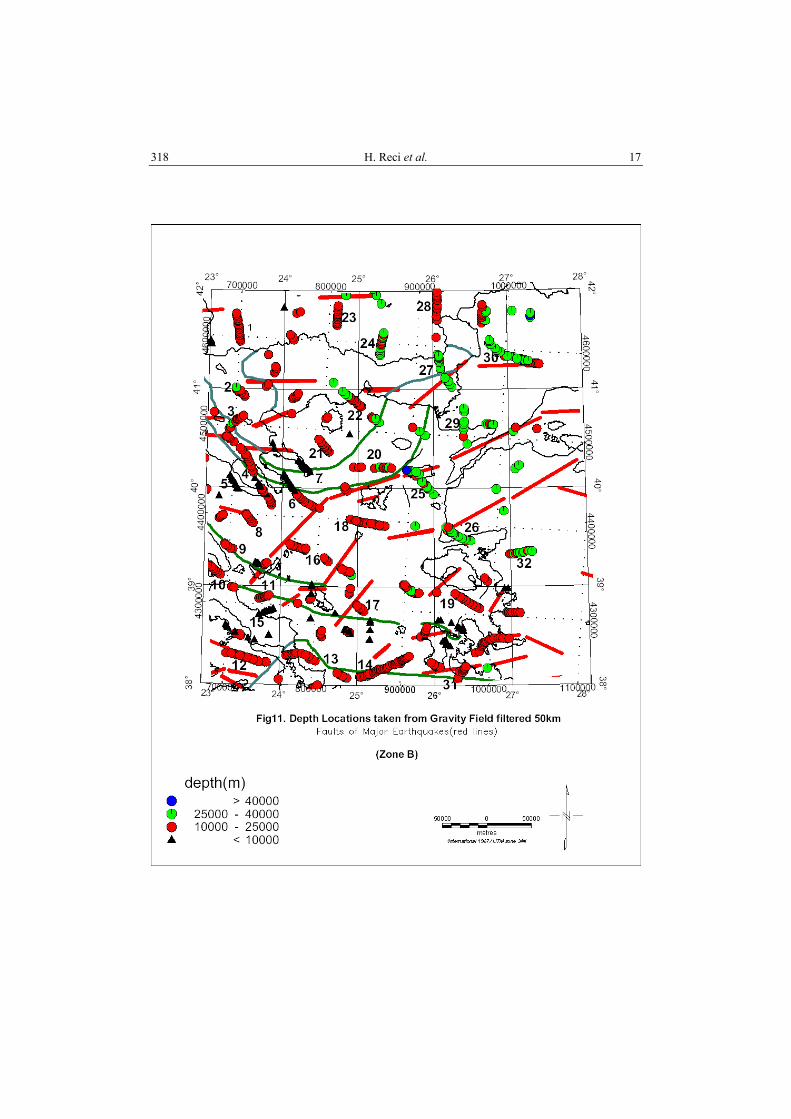
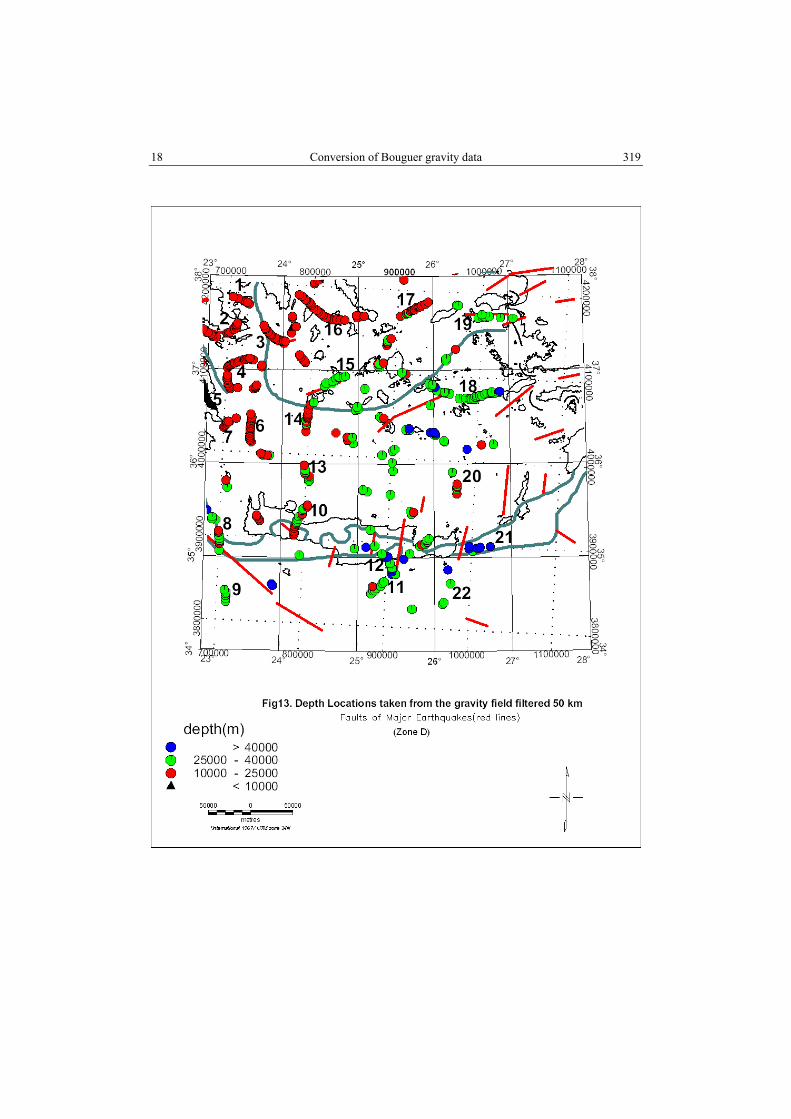
The inferred source parameters following the baselines described in the relevant paragraph, the local depth, strike contact, dipangle and dipazimuth, have been plotted in Figs. 6, 7, 8 and 9 respectively. In the present paper in the maps of local depth together with probable faults (showed by numbers) taken from complex attributes analysis (Figs. 10, 11, 12, 13) are presented with red lines the faults of known major shallow (< 40 km) Earthquakes that have occurred in Greece and surrounding area since 480 B.C (Papazachos, 1996). The local strike, dipangle and dipazimuth estimates have been plotted by vectors. The meaning of plotted vectors is that, the greater the magnitude of the vector, the less the inferred source parameters and vice versa. We plotted the local estimates in this manner to be better understandable by the reader. In order to see the relation of possible faults that we found with the complex attributes technique, with tectonic system at the Area of Greece, we have plotted together with complex attributes estimates the geotectonic setting of Hellenides (black or red lines, Figs. 1–9). We can distinguish that faults at smaller depths (less than 10 km) have in general the direction of tectonic zones of Hellenides.
The distributions of the estimates are certainly arranged along the main features. From the depth contact map (Fig. 6) we can see that the major faults are at intermediate depth (25–40 km).
From the interpretation of complex attributes of filtered Bouguer anomaly we concluded on very interesting results about different possible faults in different depths in Area of Greece. In general, the faults direction is NW-SE in the Ionian

H. Reci et al. 7 308
Sea and in the mainland, which coincides with the general direction of geotectonic zones of Hellenides. In the eastern part of Greek Area and south of the Aegean Sea there are represented faults at different depths with different directions, where the main direction is W–E. The surface faults with depth less than 10 km have a dip angle up to 600 in contrast with possible faults at depths greater than 10 km which have a dip angle greater then 600 (Figs. 8, 9, the greater magnitude of arrows shows smaller dip angle and vice-versa).
8 Conversion of Bouguer gravity data 309

H. Reci et al. 9 310
10 Conversion of Bouguer gravity data 311

H. Reci et al. 11 312
12 Conversion of Bouguer gravity data 313
H. Reci et al. 13 314
14 Conversion of Bouguer gravity data 315
H. Reci et al. 15 316
16 Conversion of Bouguer gravity data 317
H. Reci et al. 17 318
18 Conversion of Bouguer gravity data 319

H. Reci et al. 19 320
REFERENCES
1. Blakely, R. J., Potential Theory in Gravity and Magnetic Applications, Cambridge University Press, Cambridge, 1995.
2. Geosoft, Oasis Montaj Data Processing and Analysis (Dpa) System for Earth Science Applications, Version 4.1 User Guide, Geosoft Inc., 1997, p. 290.
3. Hansen, R.O., and Miyazaki. Y., Continuation of Potential Fields between Arbitrary Surfaces, Geophysics, 49, 787–795 (1984).
4. Hansen, R.O., And Pawlowski, R.S., Reduction to the Pole at Low Latitudes by Wiener Filtering, Geophysics, 54, 1607–13 (1989).
5. Hildenbrand, T.G., Fftfil: A Filtering Program Based on Two-Dimensional Fourier Analysis, U.S.G.S. Open -File Report P. 83–287, 1983.
6. Nabighian, M.N., The Analytic Signal of Two-Dimensional Bodies with Polygonal Cross-Section: Its Properties and Use for Automated Anomaly Interpretation, Geophysics, 37, 507–517 (1972).
7. Nabighian, M.N., Additional Comments on the Analytic Signal of Two-Dimensional Magnetic Bodies with Polygonal Cross Section, Geophysics, 39, 507-517 (1974).
8. Nabighian, M.N., Toward a Three-Dimensional Automatic Interpretation of Potential-Field Data Via Generalized Hilbert Transforms: Fundamental Relations, Geophysics, 49, 780–786 (1984).
9. Papazachos, B.C., Large Seismic Faults In The Hellenic Arc, Ann. Geofis., 39, 892–903 (1996). 10. Papazachos, B.C., Papaioannou, Ch. A., Papazachos, C.B., And Savvaidis, A.A., Rupture Zones in
the Aegean Region, Tectonophysics, 308, 205–221 (1999). 11. Phillips, J.D., Potential-Field Geophysical Software for the PC, Version 2.2. U.S. Geological
Survey Open-File Report 97–725 (1997). 12. Pilkingon, M., 3-D Magnetic Imaging using Conjugate Gradients, Geophysics, 62, 1132–1142
(1997). 13. Reford, M.S., Magnetic Anomalies Over Thin Sheets, Geophysics, 29, 532–536 (1964). 14. Roest, W.R., Verhoef, J. And Pilkington, M., Magnetic Interpretation using the 3-D Analytic
Signal: Geophysics, 57, 1, 116–125 (1992). 15. Skeels, D.C., What is Residual Gravity?, Geophysics, 32, 872–876 (1967). 16. Thurston, J.B., Smith, R.S., Automatic Conversion of Magnetic Data to Depth, Dip, and
Suscepitibility Contrast using SPI ™ Method, Geophysics, 62, 3, 8–7–813 (1997). 17. Tsokas, G.N. And Hansen, R.O., On the use of Complex Attributes and Inferred Source
Parameter Estimates in the Exploration of Archaeological Sites, Archaeological Prospecting, Archaeol. Prospect, 7, 17–30 (2000).
18. Tsokas, G.N., The Bouguer Anomaly of Milos Island Revisited by Means of Complex Attributes Analysis and Inferred Source Parameter Estimates, Journal of Geophysical Balkan Society, 3, 4, 77–86 (2000).
19. Tsokas, G.N., and Hansen, R.O., A Study of the Crustal Thickness and the Subducting Lithoshere in Greece from Gravity Data, Journal of Geophysical Research, 102, 20, 585–597 (1997).