convective transport of very short lived …. liang et al.: convective transport of very short lived...
TRANSCRIPT

Atmos. Chem. Phys., 14, 5781–5792, 2014www.atmos-chem-phys.net/14/5781/2014/doi:10.5194/acp-14-5781-2014© Author(s) 2014. CC Attribution 3.0 License.
Convective transport of very short lived bromocarbonsto the stratosphere
Q. Liang1,2, E. Atlas3, D. Blake4, M. Dorf 5,*, K. Pfeilsticker5, and S. Schauffler6
1NASA Goddard Space Flight Center, Atmospheric Chemistry and Dynamics, Greenbelt, MD, USA2Universities Space Research Association, GESTAR, Columbia, MD, USA3University of Miami, 4600 Rickenbacker Causeway, Miami, FL 33149, USA4University of California, 570 Rowland Hall, Irvine, CA 92697, USA5Institut für Umweltphysik, University of Heidelberg, Heidelberg, Germany6Earth Observing Laboratory, NCAR, Boulder, CO, USA* now at: Max-Planck-Institut für Chemie, Mainz, Germany
Correspondence to:Q. Liang ([email protected])
Received: 26 November 2013 – Published in Atmos. Chem. Phys. Discuss.: 9 January 2014Revised: 2 April 2014 – Accepted: 24 April 2014 – Published: 11 June 2014
Abstract. We use the NASA Goddard Earth ObservingSystem (GEOS) Chemistry Climate Model (GEOSCCM)to quantify the contribution of the two most importantbrominated very short lived substances (VSLSs), bromoform(CHBr3) and dibromomethane (CH2Br2), to stratosphericbromine and its sensitivity to convection strength. Modelsimulations suggest that the most active transport of VSLSsfrom the marine boundary layer through the tropopause oc-curs over the tropical Indian Ocean, the tropical western Pa-cific, and off the Pacific coast of Mexico. Together, con-vective lofting of CHBr3 and CH2Br2 and their degrada-tion products supplies∼8 ppt total bromine to the base ofthe tropical tropopause layer (TTL,∼150 hPa), similar tothe amount of VSLS organic bromine available in the ma-rine boundary layer (∼7.8–8.4 ppt) in the active convectivelofting regions mentioned above. Of the total∼8 ppt VSLSbromine that enters the base of the TTL at∼150 hPa, halfis in the form of organic source gases and half in the formof inorganic product gases. Only a small portion (<10 %) ofthe VSLS-originated bromine is removed via wet scaveng-ing in the TTL before reaching the lower stratosphere. Onaverage, globally, CHBr3 and CH2Br2 together contribute∼7.7 pptv to the present-day inorganic bromine in the strato-sphere. However, varying model deep-convection strengthbetween maximum (strongest) and minimum (weakest) con-vection conditions can introduce a∼2.6 pptv uncertainty inthe contribution of VSLSs to inorganic bromine in the strato-
sphere (BrVSLSy ). Contrary to conventional wisdom, the min-
imum convection condition leads to a larger BrVSLSy as the
reduced scavenging in soluble product gases, and thus a sig-nificant increase in product gas injection (2–3 ppt), greatlyexceeds the relatively minor decrease in source gas injection(a few 10ths ppt).
1 Introduction
Very short lived (VSL) bromocarbons originate mostly fromocean biogenic sources, and when transported into the strato-sphere, they exert a significant impact on the bromine budgetand stratospheric ozone depletion (Kurylo and Rodriguez,1999; Sturges et al., 2000). Recent years have seen significantprogress in modeling efforts to quantify the contribution ofbrominated VSL substances (VSLSs) to stratospheric inor-ganic bromine (BrVSLS
y ) (e.g., Warwick et al., 2006; Liang etal., 2010; Aschmann et al., 2011; Aschmann and Sinnhuber,2013; Hossaini et al., 2012a, 2012b, 2013). These modelingstudies suggest that brominated VSLSs contribute 4.8–7 pptto reactive stratospheric bromine, within the 1–8 ppt estimaterange from satellite and balloon-borne observations (WMO2011; Sinnhuber et al., 2005; Sioris et al., 2006; Dorf et al.,2006a, 2008; Salawitch et al., 2010).
The most important VSLS pathway to the stratosphere isvia convective lofting through the tropical tropopause layer
Published by Copernicus Publications on behalf of the European Geosciences Union.
5782 Q. Liang et al.: Convective transport of very short lived bromocarbons to the stratosphere
(TTL). Atmospheric chemistry and transport of brominatedVSLSs involves the coupling of various complex processes,e.g., highly un-uniform ocean emissions, convective trans-port of source gases and product gases, and wet scavengingof soluble product gases. An accurate modeling representa-tion of these processes remains a challenging task. Modelingof these processes in general requires assumptions and/or pa-rameterizations that have to some extent been simplified andmay differ greatly from one model study to another. Thesedifferences have lead to significant differences in the mod-eled BrVSLS
y estimates. For example, a recent model study
by Hossaini et al. (2013) found that modeled BrVSLSy could
vary by a factor of 2 when using four recently publishedemission inventories (Liang et al., 2010; Pyle et al., 2011;Ordóñez et al., 2012; Ziska et al., 2013). In general, modelstudies agree relatively well on source gas injection (SGI),suggesting that about∼50 % of bromoform (CHBr3) and∼90 % of dibromomethane (CH2Br2) can reach the strato-sphere through SGI (e.g., Dvortsov et al., 1999; Nielsen andDouglass, 2001; Aschmann et al., 2011; Hossaini et al., 2010,2012a). However, modeled contribution on product gas injec-tion (PGI) is highly uncertain depending on how wet scav-enging is implemented. Many early model studies assumea uniform washout lifetime against wet scavenging (e.g.,Dvortsov et al., 1999; Nielsen and Douglass, 2001; Hossainiet al., 2010; Aschmann et al., 2009), which was inadequateand led to an underestimate in modeled BrVSLS
y (Hossaini etal., 2012a; Aschmann et al., 2011). A recent study by As-chmann and Sinnhuber (2013) shows that treating BrVSLS
yas a single soluble tracer (e.g., Liang et al., 2010) can alsolead to an underestimate. They found that BrVSLS
y increasedfrom 3.4 ppt to 5 ppt when switching from an idealized setupwith a single soluble inorganic bromine tracer to a full chem-istry scheme. Thus, an accurate modeling of transport andwet scavenging of PGI seems to be the key in narrowing theuncertainty of model estimate of BrVSLS
y .Understanding how the contribution of VSLSs to strato-
spheric bromine varies with convection strength has signif-icant climate implications. A recent modeling analysis byHossaini et al. (2012b) suggests that VSLS SGI will increasefrom ∼1.7 ppt in 2000 to∼2.0–2.7 ppt in 2100 using the In-tergovernmental Panel on Climate Change (IPCC) represen-tative concentration pathways (RCPs) scenarios, as the futuresimulations feature stronger tropical deep convection trans-port to the lower stratosphere. On the other hand, the over-all response of BrVSLS
y to convection strength is somewhatmurky. Earlier studies deploying a uniform washout lifetimefound different washout rates result in a significant rangein the contribution of CHBr3 to Bry, 0.5–3 ppt in Sinnhuberand Folkins (2006) and 1.6–3 ppt in Aschmann et al., (2011).Liang et al. (2010), which deploys explicit wet scavenging inconvective updrafts, found that convective scavenging onlyaccounts for∼0.2 ppt difference in modeled BrVSLS
y . Similarresults were reported in Aschmann et al. (2011), who showed
that, while SGI is highly correlated with convective activity,the impact on total stratospheric bromine in a full chemistryscheme is nearly insensitive to dehydration, likely due to con-vection dilution and increased scavenging.
In this study, we use a three-dimensional chemistry cli-mate model with fully interactive CHBr3 and CH2Br2, thetwo most important brominated VSLSs, to better understandhow VSLSs and their degradation products enter the strato-sphere. We will also test the uncertainty in modeled BrVSLS
ydue to varying strength in convection and scavenging.
2 Model and simulations
2.1 Model description
We conduct model simulations using the NASA GoddardEarth Observing System (GEOS) Chemistry Climate Model(GEOSCCM) Version 2, which couples the GEOS-5 Gen-eral Circulation Model (GCM) (Reinecker et al., 2008) witha stratospheric chemistry module. Model simulations havea horizontal resolution of 2.5◦ × 2◦ (longitude by latitude)with 72 vertical layers from surface to 0.01 hPa. The GEOS-5 model uses a flux-form semi-Lagrangian dynamical core(Lin, 2004) and the Relaxed Arakawa Schubert (RAS) pa-rameterization for convection (Moorthi and Suarez, 1992).The GEOS-5 moist processes are represented using a con-vective parameterization and prognostic cloud scheme.
The GEOSCCM V2 stratospheric chemistry module in-cludes all important gas phase stratospheric reactions as de-scribed in Douglass and Kawa (1999), and chemical calcula-tions are carried out above the 27th eta layer (approximately350 hPa on average, globally). All chemical kinetics and pho-tolysis rates are calculated following Jet Propulsion Labora-tory (JPL) 2010 (Sander et al., 2011). We modify the standardV2 chemistry scheme to include CHBr3 and CH2Br2; bothare interactive with the full stratospheric chemistry scheme.The two organic source gases are released at the ocean sur-face following the geographically resolved emission distri-bution described in Liang et al. (2010) and are destroyedin the atmosphere via photolysis and reaction with the hy-droxyl radical (OH). OH above∼350 hPa is calculated on-line in the stratospheric chemistry module. OH in the low-est 26 layers (troposphere) is relaxed to monthly mean cli-matological fields documented in Spivakovsky et al. (2000).Global annual mean OH from Spivakovsky et al. (2000) is1.16× 106 molecules cm−3, yielding an atmospheric methylchloroform (CH3CCl3) lifetime of ∼5.5 years. In most ofthe troposphere, only simple bromine chemistry is consid-ered; 80 % of inorganic bromine products are classified asHBr and the remaining 20 % as HOBr – ratios adopted fromYang et al. (2005). Above the 27th eta layer (∼350 hPa),bromine from CHBr3 and CH2Br2 degradation is released asBr and interacts fully with stratospheric chemistry. Comparethis to the idealized case in Liang et al. (2010) that tracks
Atmos. Chem. Phys., 14, 5781–5792, 2014 www.atmos-chem-phys.net/14/5781/2014/

Q. Liang et al.: Convective transport of very short lived bromocarbons to the stratosphere 5783
the atmospheric transport of BrVSLSy in a single highly solu-
ble tracer, in this experiment, we deploy a detailed speciationof BrVSLS
y in both soluble forms (HBr, HOBr, and BrONO2)and insoluble forms (Br, BrO, and BrCl) in the fully interac-tive stratospheric chemistry scheme in the TTL and strato-sphere. Although BrONO2 is not produced in the tropo-sphere in the current simple chemistry scheme, BrONO2 pro-duced in the stratosphere is allowed to transport to loweraltitudes via large-scale descent. A previous detailed tropo-spheric chemistry model study using the Harvard GEOS-Chem model and VSLS emissions from Liang et al. (2010)shows a small fraction of Bry exists as BrO (0.1–0.2 ppt) be-low 10 km in the tropics (Parrella et al., 2012). However, theimpact of the absence of this tropospheric BrO on strato-spheric bromine is likely small. No heterogeneous chemistryfor VSLS is included in our simulations, but results from As-chmann and Sinnhuber (2013) suggest that the impact of het-erogeneous chemistry is minor and that the inclusion of het-erogeneous activation prevents loss in scavenging and can in-crease BrVSLS
y by 10 %. While heterogeneous chemistry canshift Bry partition and increase HBr up to four times between12 and 18 km in the tropics (Aschmann et al., 2011), the ab-sence of heterogeneous chemistry in GEOSCCM is likely tohave only a small impact on BrVSLS
y since the model HBr ispresent in very low quantities during daytime when the ma-jority of convective scavenging takes place (see Sect. 3.1 andFig. 4) and the overall convective scavenging in the TTL israther inefficient (see Sect. 3.2).
The wet scavenging of the soluble inorganic bromine isthe same as that detailed in Liang et al. (2010). It includesscavenging in rainout (in-cloud precipitation) and washout(below-cloud precipitation) in both large-scale precipitation(Giorgi and Chameides, 1986) and deep convective updrafts(Balkanski et al., 1993). We assume high solubility for allthree inorganic bromine reservoir species, HBr, HOBr, andBrONO2. At each time step, we follow the Giorgi andChameides (1986) parameterization to compute the wet scav-enging using the GEOS-5-model-calculated large-scale andconvective precipitation rates and the parameterized fractionof grid square area,F , that actually experiences precipita-tion (Balkanski et al., 1993). Wet scavenging occurs onlywhen air temperature is above 258K, following Giorgi andChameides (1986). Previous studies using the Giorgi andChameides (1986) parameterization showed that, for large-scale precipitation, the global meanF is about 2.5 % for allgrid boxes and the median value is 10 %, with values exceed-ing 40 % in∼10 % of the grid boxes (Balkanski et al., 1993;Liu et al., 2001). The global meanF for convective precip-itation is much smaller, only 0.4 % (Liu et al., 2001). Whenevaporation occurs during large-scale and convective trans-port, the corresponding fraction of the dissolved inorganicbromine is released back to the atmosphere. This wet scav-enging scheme has been applied in many atmospheric mod-eling studies of soluble trace gases and aerosols, e.g.,210Pb,7Be, sulfate, sea salt, and dust, and the simulated concentra-
tions compare well with surface observations at many obser-vation sites around the globe (e.g., Balkanski et al., 1993;Chin et al., 2000; Ginoux et al., 2001; Liu et al., 2001).
In this study, we present results from two 51-year simula-tions between 1960 and 2010, one with brominated VSLSschemistry (RVSLS) and one without (RBASE), to examine tro-posphere to stratosphere transport (TST) of VSLS and theircontribution to stratospheric bromine. It takes a considerablylong time (∼15 years) for the full impact of VSLSs to reachthe upper stratosphere; thus, the first 16 years are consid-ered as spin-up. A full model evaluation and discussion ofthe impact of VSLSs on stratospheric ozone are presented ina separate paper, currently in preparation. For this study, wefocus on model results of the two simulations from the last10 years.
2.2 Convection sensitivity simulations
To quantify the uncertainty in BrVSLSy due to changes in
convection strength, we conduct two sensitivity simula-tions from 1980 to 2010 to represent minimum convection(RMINCNV ) and maximum convection (RMAXCNV ) condi-tions by varying five convective parameters in RAS that im-pact the strength of deep convection, clouds, convective con-densate, and re-evaporation (Ott et al., 2009, 2011). Thesefive convective parameters are RASAL1 and RASAL2 (reg-ulates the strength and vertical profile of the relaxation timescale for deep convection), ACRITFAC (used to compute thecritical value of the cloud work function which determinesthe initiation of convection), BASE_EVAP_FAC (regulatesthe amount of rain evaporated into the environment belowthe cloud base), and AUTOC_CN (used to calculate the au-toconversion of convective condensate). These five are iden-tified as the most strongly influencing parameters out of thetotal of 16 parameters examined using a large number of“Monte Carlo” type simulations and ensemble simulationsin both a single-column model as well as the GEOS-5 GCM(Ott et al., 2011). In the two sensitivity simulations, the fiveparameters are varied to produce the strongest (MAXCNV)and the weakest (MINCNV) representations of convectionconsidered reasonable. In general, compared to the mini-mum convection condition, the maximum convection condi-tion yields significantly large increases in shallow convectionbelow 5 km and∼20–30 % stronger vertical mass flux andmore horizontal divergence between 12.5 and 16.5 km (Ott etal., 2011). The values used for the five convective parametersfor the minimum and maximum conditions have been testedextensively in the previous ensemble analysis. They producereasonable precipitation patterns when compared with datafrom the Global Precipitation Climatology Project (GPCP)that were compiled from satellite and rain gauge observa-tions (Ott et al., 2011). The correlation coefficients of thestandard run, MAXCNV and MINCNV simulations, and theGPCP data sets are 0.65, 0.64, and 0.62, respectively (Ott etal., 2011).
www.atmos-chem-phys.net/14/5781/2014/ Atmos. Chem. Phys., 14, 5781–5792, 2014
5784 Q. Liang et al.: Convective transport of very short lived bromocarbons to the stratosphere
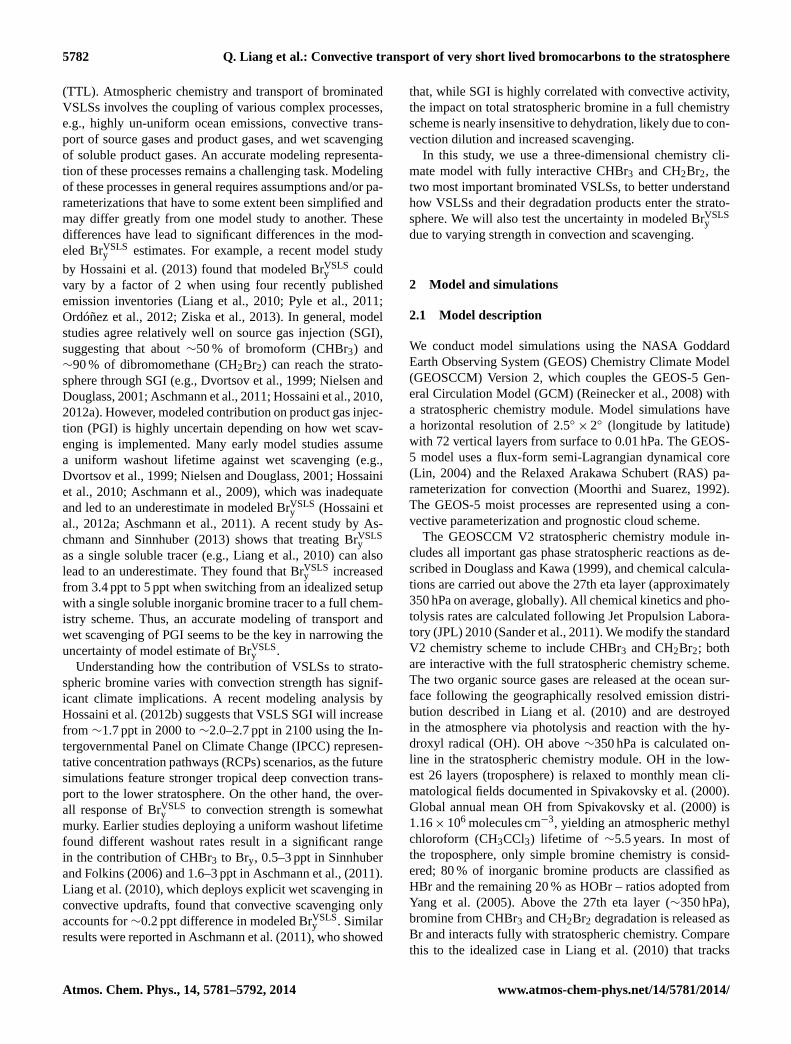
Figure 1. Comparison between the observed (red lines with horizontal bars indicating one standard deviation) and simulated (black lineswith gray shading showing one sigma variability) vertical profiles of CHBr3 in the troposphere. Observations are compiled using whole airsampler canister measurements from eight NASA aircraft missions and are averaged for 30–60◦ S, 30◦ S–30◦ N, 30–60◦ N, and 60–90◦ Nlatitude bands at 1 km vertical intervals. Model is sampled at the same location as the observations in the corresponding month in 2010.
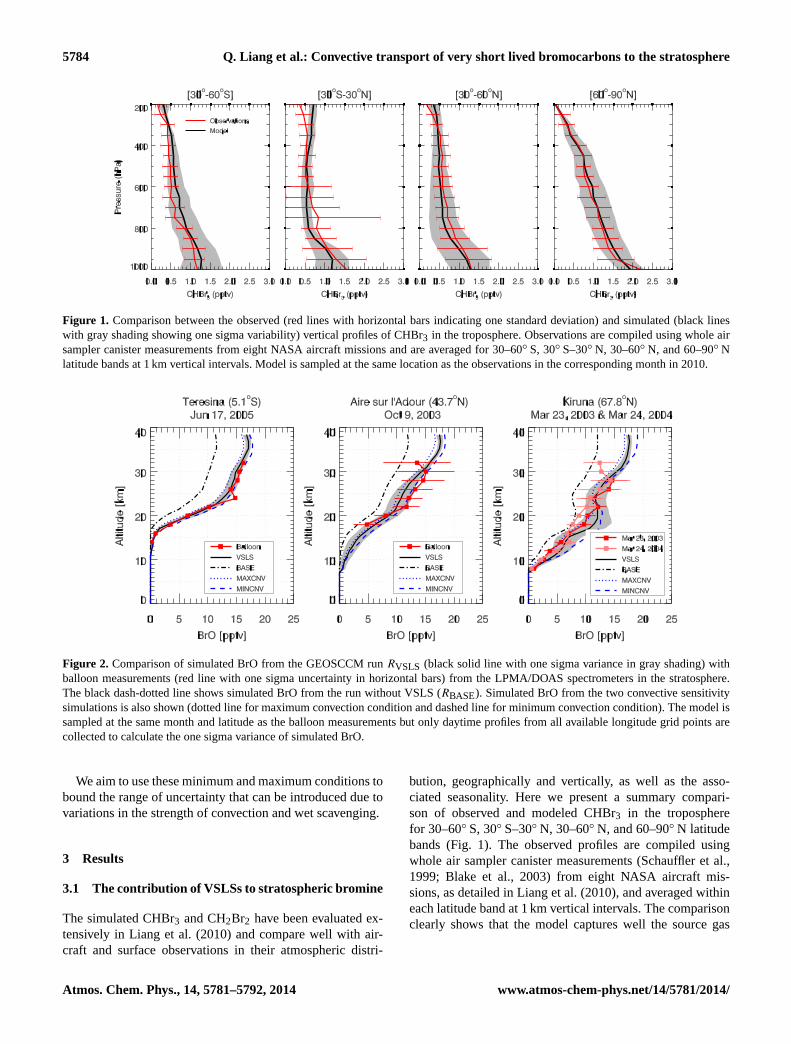
Figure 2. Comparison of simulated BrO from the GEOSCCM runRVSLS (black solid line with one sigma variance in gray shading) withballoon measurements (red line with one sigma uncertainty in horizontal bars) from the LPMA/DOAS spectrometers in the stratosphere.The black dash-dotted line shows simulated BrO from the run without VSLS (RBASE). Simulated BrO from the two convective sensitivitysimulations is also shown (dotted line for maximum convection condition and dashed line for minimum convection condition). The model issampled at the same month and latitude as the balloon measurements but only daytime profiles from all available longitude grid points arecollected to calculate the one sigma variance of simulated BrO.
We aim to use these minimum and maximum conditions tobound the range of uncertainty that can be introduced due tovariations in the strength of convection and wet scavenging.
3 Results
3.1 The contribution of VSLSs to stratospheric bromine
The simulated CHBr3 and CH2Br2 have been evaluated ex-tensively in Liang et al. (2010) and compare well with air-craft and surface observations in their atmospheric distri-
bution, geographically and vertically, as well as the asso-ciated seasonality. Here we present a summary compari-son of observed and modeled CHBr3 in the tropospherefor 30–60◦ S, 30◦ S–30◦ N, 30–60◦ N, and 60–90◦ N latitudebands (Fig. 1). The observed profiles are compiled usingwhole air sampler canister measurements (Schauffler et al.,1999; Blake et al., 2003) from eight NASA aircraft mis-sions, as detailed in Liang et al. (2010), and averaged withineach latitude band at 1 km vertical intervals. The comparisonclearly shows that the model captures well the source gas
Atmos. Chem. Phys., 14, 5781–5792, 2014 www.atmos-chem-phys.net/14/5781/2014/
Q. Liang et al.: Convective transport of very short lived bromocarbons to the stratosphere 5785
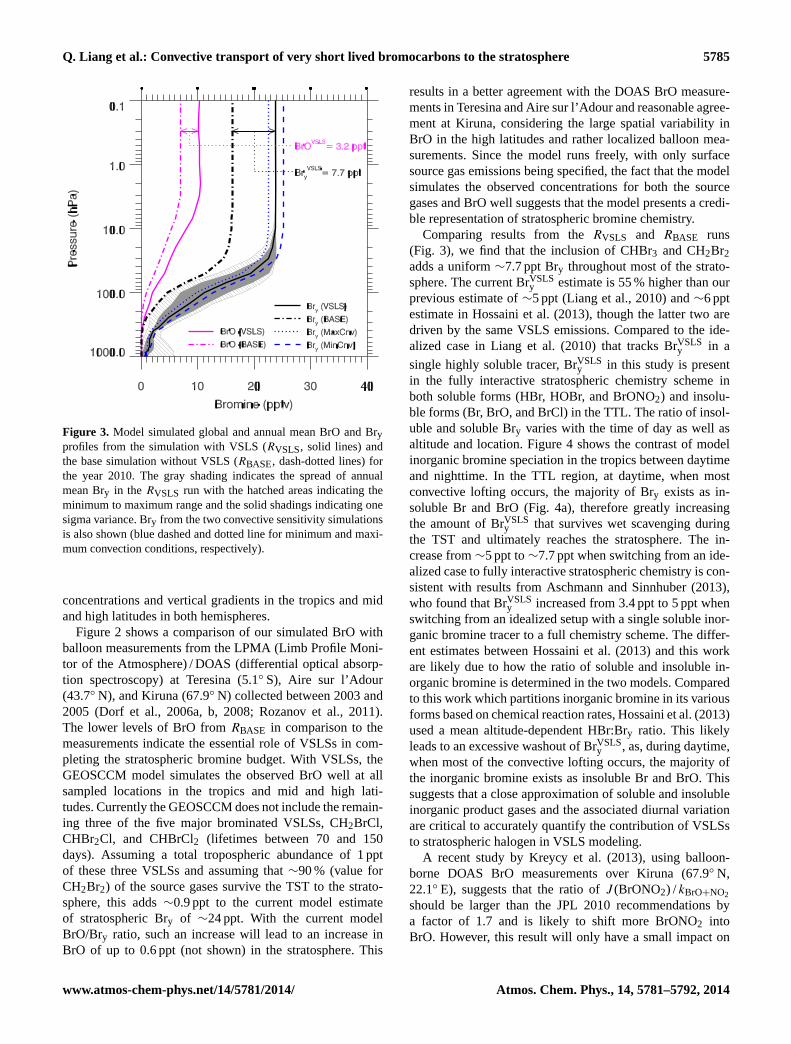
Figure 3. Model simulated global and annual mean BrO and Bryprofiles from the simulation with VSLS (RVSLS, solid lines) andthe base simulation without VSLS (RBASE, dash-dotted lines) forthe year 2010. The gray shading indicates the spread of annualmean Bry in the RVSLS run with the hatched areas indicating theminimum to maximum range and the solid shadings indicating onesigma variance. Bry from the two convective sensitivity simulationsis also shown (blue dashed and dotted line for minimum and maxi-mum convection conditions, respectively).
concentrations and vertical gradients in the tropics and midand high latitudes in both hemispheres.
Figure 2 shows a comparison of our simulated BrO withballoon measurements from the LPMA (Limb Profile Moni-tor of the Atmosphere) / DOAS (differential optical absorp-tion spectroscopy) at Teresina (5.1◦ S), Aire sur l’Adour(43.7◦ N), and Kiruna (67.9◦ N) collected between 2003 and2005 (Dorf et al., 2006a, b, 2008; Rozanov et al., 2011).The lower levels of BrO fromRBASE in comparison to themeasurements indicate the essential role of VSLSs in com-pleting the stratospheric bromine budget. With VSLSs, theGEOSCCM model simulates the observed BrO well at allsampled locations in the tropics and mid and high lati-tudes. Currently the GEOSCCM does not include the remain-ing three of the five major brominated VSLSs, CH2BrCl,CHBr2Cl, and CHBrCl2 (lifetimes between 70 and 150days). Assuming a total tropospheric abundance of 1 pptof these three VSLSs and assuming that∼90 % (value forCH2Br2) of the source gases survive the TST to the strato-sphere, this adds∼0.9 ppt to the current model estimateof stratospheric Bry of ∼24 ppt. With the current modelBrO/Bry ratio, such an increase will lead to an increase inBrO of up to 0.6 ppt (not shown) in the stratosphere. This
results in a better agreement with the DOAS BrO measure-ments in Teresina and Aire sur l’Adour and reasonable agree-ment at Kiruna, considering the large spatial variability inBrO in the high latitudes and rather localized balloon mea-surements. Since the model runs freely, with only surfacesource gas emissions being specified, the fact that the modelsimulates the observed concentrations for both the sourcegases and BrO well suggests that the model presents a credi-ble representation of stratospheric bromine chemistry.
Comparing results from theRVSLS and RBASE runs(Fig. 3), we find that the inclusion of CHBr3 and CH2Br2adds a uniform∼7.7 ppt Bry throughout most of the strato-sphere. The current BrVSLS
y estimate is 55 % higher than ourprevious estimate of∼5 ppt (Liang et al., 2010) and∼6 pptestimate in Hossaini et al. (2013), though the latter two aredriven by the same VSLS emissions. Compared to the ide-alized case in Liang et al. (2010) that tracks BrVSLS
y in a
single highly soluble tracer, BrVSLSy in this study is present
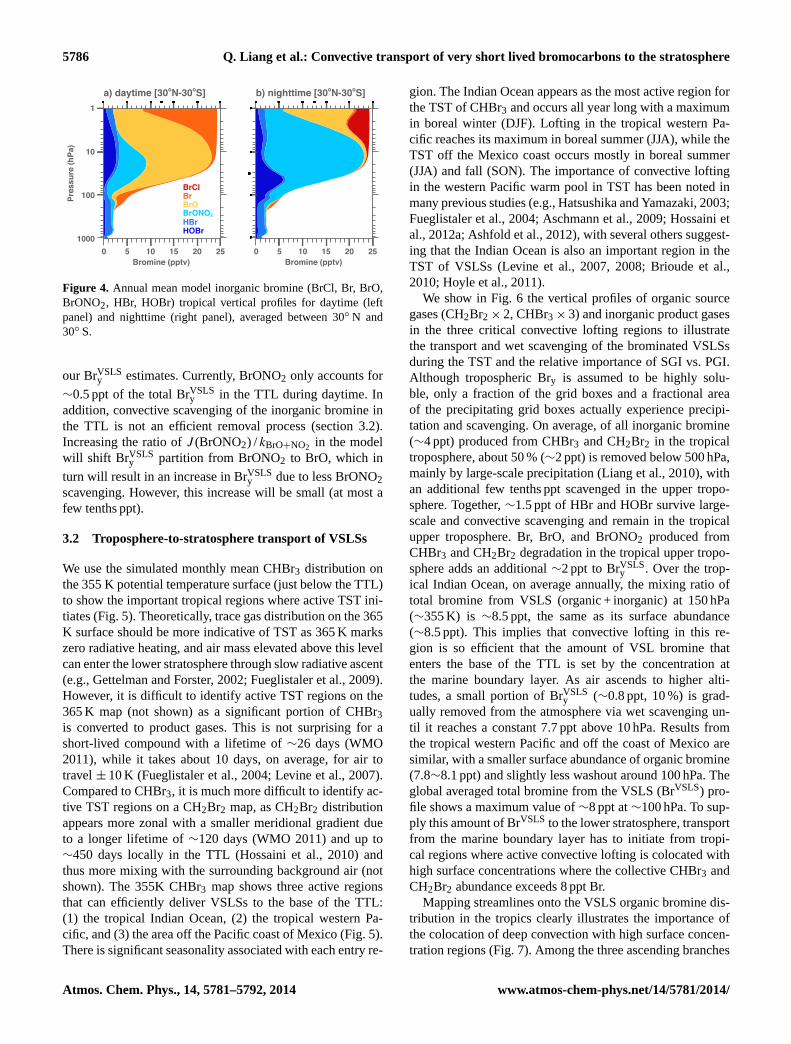
in the fully interactive stratospheric chemistry scheme inboth soluble forms (HBr, HOBr, and BrONO2) and insolu-ble forms (Br, BrO, and BrCl) in the TTL. The ratio of insol-uble and soluble Bry varies with the time of day as well asaltitude and location. Figure 4 shows the contrast of modelinorganic bromine speciation in the tropics between daytimeand nighttime. In the TTL region, at daytime, when mostconvective lofting occurs, the majority of Bry exists as in-soluble Br and BrO (Fig. 4a), therefore greatly increasingthe amount of BrVSLS
y that survives wet scavenging duringthe TST and ultimately reaches the stratosphere. The in-crease from∼5 ppt to∼7.7 ppt when switching from an ide-alized case to fully interactive stratospheric chemistry is con-sistent with results from Aschmann and Sinnhuber (2013),who found that BrVSLS
y increased from 3.4 ppt to 5 ppt whenswitching from an idealized setup with a single soluble inor-ganic bromine tracer to a full chemistry scheme. The differ-ent estimates between Hossaini et al. (2013) and this workare likely due to how the ratio of soluble and insoluble in-organic bromine is determined in the two models. Comparedto this work which partitions inorganic bromine in its variousforms based on chemical reaction rates, Hossaini et al. (2013)used a mean altitude-dependent HBr:Bry ratio. This likelyleads to an excessive washout of BrVSLS
y , as, during daytime,when most of the convective lofting occurs, the majority ofthe inorganic bromine exists as insoluble Br and BrO. Thissuggests that a close approximation of soluble and insolubleinorganic product gases and the associated diurnal variationare critical to accurately quantify the contribution of VSLSsto stratospheric halogen in VSLS modeling.
A recent study by Kreycy et al. (2013), using balloon-borne DOAS BrO measurements over Kiruna (67.9◦ N,22.1◦ E), suggests that the ratio ofJ (BrONO2) / kBrO+NO2
should be larger than the JPL 2010 recommendations bya factor of 1.7 and is likely to shift more BrONO2 intoBrO. However, this result will only have a small impact on
www.atmos-chem-phys.net/14/5781/2014/ Atmos. Chem. Phys., 14, 5781–5792, 2014
5786 Q. Liang et al.: Convective transport of very short lived bromocarbons to the stratosphere
BrClBrBrOBrONO2HBrHOBr
10
100
1000
1
Pres
sure
(hPa
)
0 5 10 15 20Bromine (pptv)
25 0 5 10 15 20Bromine (pptv)
25
a) daytime [30oN-30oS] b) nighttime [30oN-30oS]
Figure 4. Annual mean model inorganic bromine (BrCl, Br, BrO,BrONO2, HBr, HOBr) tropical vertical profiles for daytime (leftpanel) and nighttime (right panel), averaged between 30◦ N and30◦ S.
our BrVSLSy estimates. Currently, BrONO2 only accounts for
∼0.5 ppt of the total BrVSLSy in the TTL during daytime. In
addition, convective scavenging of the inorganic bromine inthe TTL is not an efficient removal process (section 3.2).Increasing the ratio ofJ (BrONO2) / kBrO+NO2 in the modelwill shift BrVSLS
y partition from BrONO2 to BrO, which in
turn will result in an increase in BrVSLSy due to less BrONO2
scavenging. However, this increase will be small (at most afew tenths ppt).
3.2 Troposphere-to-stratosphere transport of VSLSs
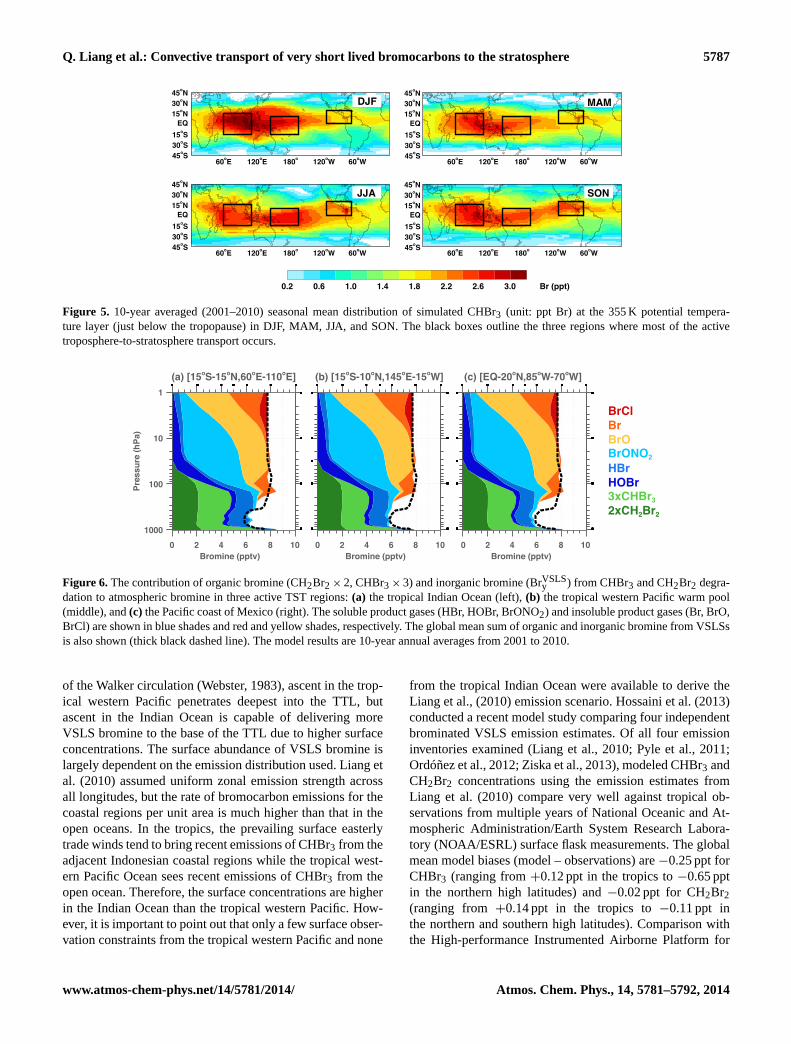
We use the simulated monthly mean CHBr3 distribution onthe 355 K potential temperature surface (just below the TTL)to show the important tropical regions where active TST ini-tiates (Fig. 5). Theoretically, trace gas distribution on the 365K surface should be more indicative of TST as 365 K markszero radiative heating, and air mass elevated above this levelcan enter the lower stratosphere through slow radiative ascent(e.g., Gettelman and Forster, 2002; Fueglistaler et al., 2009).However, it is difficult to identify active TST regions on the365 K map (not shown) as a significant portion of CHBr3is converted to product gases. This is not surprising for ashort-lived compound with a lifetime of∼26 days (WMO2011), while it takes about 10 days, on average, for air totravel± 10 K (Fueglistaler et al., 2004; Levine et al., 2007).Compared to CHBr3, it is much more difficult to identify ac-tive TST regions on a CH2Br2 map, as CH2Br2 distributionappears more zonal with a smaller meridional gradient dueto a longer lifetime of∼120 days (WMO 2011) and up to∼450 days locally in the TTL (Hossaini et al., 2010) andthus more mixing with the surrounding background air (notshown). The 355K CHBr3 map shows three active regionsthat can efficiently deliver VSLSs to the base of the TTL:(1) the tropical Indian Ocean, (2) the tropical western Pa-cific, and (3) the area off the Pacific coast of Mexico (Fig. 5).There is significant seasonality associated with each entry re-
gion. The Indian Ocean appears as the most active region forthe TST of CHBr3 and occurs all year long with a maximumin boreal winter (DJF). Lofting in the tropical western Pa-cific reaches its maximum in boreal summer (JJA), while theTST off the Mexico coast occurs mostly in boreal summer(JJA) and fall (SON). The importance of convective loftingin the western Pacific warm pool in TST has been noted inmany previous studies (e.g., Hatsushika and Yamazaki, 2003;Fueglistaler et al., 2004; Aschmann et al., 2009; Hossaini etal., 2012a; Ashfold et al., 2012), with several others suggest-ing that the Indian Ocean is also an important region in theTST of VSLSs (Levine et al., 2007, 2008; Brioude et al.,2010; Hoyle et al., 2011).
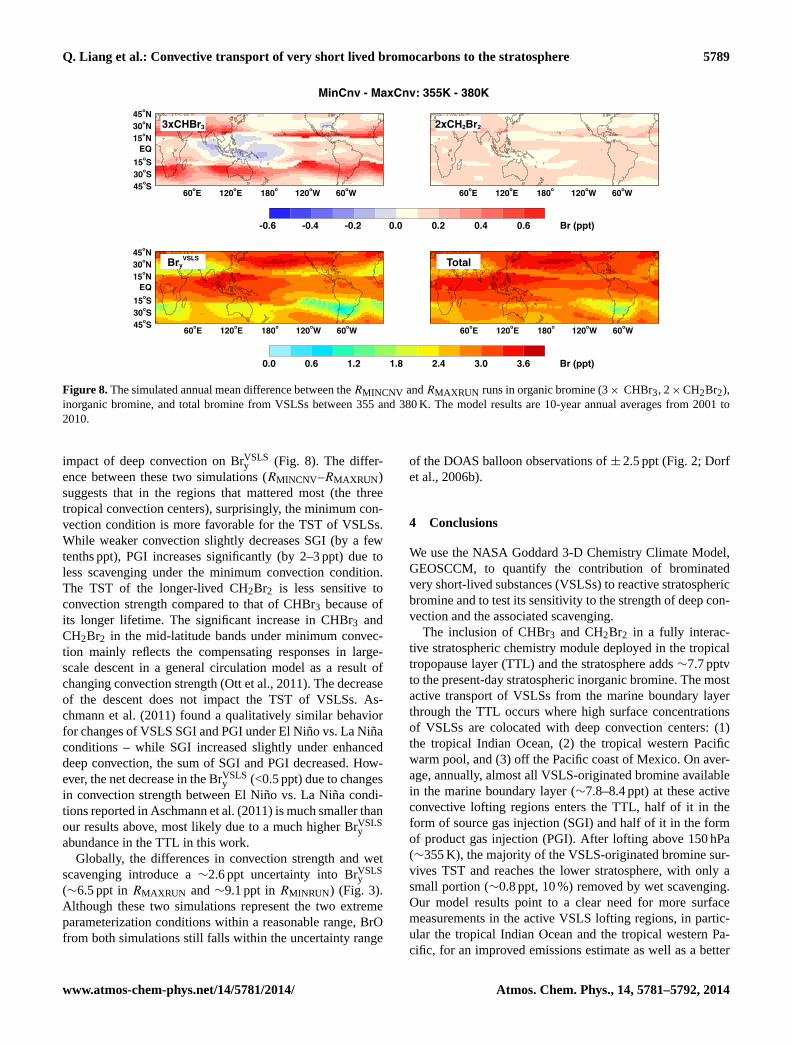
We show in Fig. 6 the vertical profiles of organic sourcegases (CH2Br2 × 2, CHBr3 × 3) and inorganic product gasesin the three critical convective lofting regions to illustratethe transport and wet scavenging of the brominated VSLSsduring the TST and the relative importance of SGI vs. PGI.Although tropospheric Bry is assumed to be highly solu-ble, only a fraction of the grid boxes and a fractional areaof the precipitating grid boxes actually experience precipi-tation and scavenging. On average, of all inorganic bromine(∼4 ppt) produced from CHBr3 and CH2Br2 in the tropicaltroposphere, about 50 % (∼2 ppt) is removed below 500 hPa,mainly by large-scale precipitation (Liang et al., 2010), withan additional few tenths ppt scavenged in the upper tropo-sphere. Together,∼1.5 ppt of HBr and HOBr survive large-scale and convective scavenging and remain in the tropicalupper troposphere. Br, BrO, and BrONO2 produced fromCHBr3 and CH2Br2 degradation in the tropical upper tropo-sphere adds an additional∼2 ppt to BrVSLS
y . Over the trop-ical Indian Ocean, on average annually, the mixing ratio oftotal bromine from VSLS (organic + inorganic) at 150 hPa(∼355 K) is ∼8.5 ppt, the same as its surface abundance(∼8.5 ppt). This implies that convective lofting in this re-gion is so efficient that the amount of VSL bromine thatenters the base of the TTL is set by the concentration atthe marine boundary layer. As air ascends to higher alti-tudes, a small portion of BrVSLS
y (∼0.8 ppt, 10 %) is grad-ually removed from the atmosphere via wet scavenging un-til it reaches a constant 7.7 ppt above 10 hPa. Results fromthe tropical western Pacific and off the coast of Mexico aresimilar, with a smaller surface abundance of organic bromine(7.8∼8.1 ppt) and slightly less washout around 100 hPa. Theglobal averaged total bromine from the VSLS (BrVSLS) pro-file shows a maximum value of∼8 ppt at∼100 hPa. To sup-ply this amount of BrVSLS to the lower stratosphere, transportfrom the marine boundary layer has to initiate from tropi-cal regions where active convective lofting is colocated withhigh surface concentrations where the collective CHBr3 andCH2Br2 abundance exceeds 8 ppt Br.
Mapping streamlines onto the VSLS organic bromine dis-tribution in the tropics clearly illustrates the importance ofthe colocation of deep convection with high surface concen-tration regions (Fig. 7). Among the three ascending branches
Atmos. Chem. Phys., 14, 5781–5792, 2014 www.atmos-chem-phys.net/14/5781/2014/
Q. Liang et al.: Convective transport of very short lived bromocarbons to the stratosphere 5787
45oS30oS15oS
EQ15oN30oN45oN
45oS30oS15oS
EQ15oN30oN45oN
60oE 120oE 180o 120oW 60oW 60oE 120oE 180o 120oW 60oW
60oE 120oE 180o 120oW 60oW 60oE 120oE 180o 120oW 60oW
0.2 0.6 1.0 1.4 2.2 3.01.8 Br (ppt)2.6
DJF MAM
JJA SON
45oS30oS15oS
EQ15oN30oN45oN
45oS30oS15oS
EQ15oN30oN45oN
Figure 5. 10-year averaged (2001–2010) seasonal mean distribution of simulated CHBr3 (unit: ppt Br) at the 355 K potential tempera-ture layer (just below the tropopause) in DJF, MAM, JJA, and SON. The black boxes outline the three regions where most of the activetroposphere-to-stratosphere transport occurs.
(a) [15oS-15oN,60oE-110oE] (b) [15oS-10oN,145oE-15oW] (c) [EQ-20oN,85oW-70oW]
10
100
1000
1
Pres
sure
(hPa
)
0 2 4 6 8 10Bromine (pptv)
0 2 4 6 8 10Bromine (pptv)
0 2 4 6 8 10Bromine (pptv)
BrClBrBrOBrONO2
HBrHOBr3xCHBr32xCH2Br2
Figure 6. The contribution of organic bromine (CH2Br2 × 2, CHBr3 × 3) and inorganic bromine (BrVSLSy ) from CHBr3 and CH2Br2 degra-
dation to atmospheric bromine in three active TST regions:(a) the tropical Indian Ocean (left),(b) the tropical western Pacific warm pool(middle), and(c) the Pacific coast of Mexico (right). The soluble product gases (HBr, HOBr, BrONO2) and insoluble product gases (Br, BrO,BrCl) are shown in blue shades and red and yellow shades, respectively. The global mean sum of organic and inorganic bromine from VSLSsis also shown (thick black dashed line). The model results are 10-year annual averages from 2001 to 2010.
of the Walker circulation (Webster, 1983), ascent in the trop-ical western Pacific penetrates deepest into the TTL, butascent in the Indian Ocean is capable of delivering moreVSLS bromine to the base of the TTL due to higher surfaceconcentrations. The surface abundance of VSLS bromine islargely dependent on the emission distribution used. Liang etal. (2010) assumed uniform zonal emission strength acrossall longitudes, but the rate of bromocarbon emissions for thecoastal regions per unit area is much higher than that in theopen oceans. In the tropics, the prevailing surface easterlytrade winds tend to bring recent emissions of CHBr3 from theadjacent Indonesian coastal regions while the tropical west-ern Pacific Ocean sees recent emissions of CHBr3 from theopen ocean. Therefore, the surface concentrations are higherin the Indian Ocean than the tropical western Pacific. How-ever, it is important to point out that only a few surface obser-vation constraints from the tropical western Pacific and none
from the tropical Indian Ocean were available to derive theLiang et al., (2010) emission scenario. Hossaini et al. (2013)conducted a recent model study comparing four independentbrominated VSLS emission estimates. Of all four emissioninventories examined (Liang et al., 2010; Pyle et al., 2011;Ordóñez et al., 2012; Ziska et al., 2013), modeled CHBr3 andCH2Br2 concentrations using the emission estimates fromLiang et al. (2010) compare very well against tropical ob-servations from multiple years of National Oceanic and At-mospheric Administration/Earth System Research Labora-tory (NOAA/ESRL) surface flask measurements. The globalmean model biases (model – observations) are−0.25 ppt forCHBr3 (ranging from+0.12 ppt in the tropics to−0.65 pptin the northern high latitudes) and−0.02 ppt for CH2Br2(ranging from +0.14 ppt in the tropics to−0.11 ppt inthe northern and southern high latitudes). Comparison withthe High-performance Instrumented Airborne Platform for
www.atmos-chem-phys.net/14/5781/2014/ Atmos. Chem. Phys., 14, 5781–5792, 2014

5788 Q. Liang et al.: Convective transport of very short lived bromocarbons to the stratosphere
0.0
2.5
5.0
7.5
10.0
12.5
15.0
17.5
20.0
Hei
ght (
km)
1000
100
Pres
sure
(hPa
)
0.01.02.03.03.54.04.55.05.56.06.57.08.09.0
Org
anic
Bro
min
e (p
pt)
0 60oE 120oE 180 120oW 60oW 0Longitude
68
1012
Surf
ace
Br (
ppt)
Indian Ocean Tropicalwestern Pacific
Mexico
Figure 7.Longitude-height cross section of modeled total VSL organic bromine (CHBr3 × 3 + CH2Br2 × 2) (color contours) and streamlines(black lines) in the deep tropics. The organic bromine and wind streams are 10-year annual averages (2001–2010) between 10◦ S and 10◦ N.Surface organic bromine abundance is shown as the black solid graph at the bottom panel.
Environmental Research (HIAPER) Pole-to-Pole Observa-tions (HIPPO) measurements between 2009 and 2011 sup-ported by the National Science Foundation (NSF) yieldseven better agreement, with little biases in global meanCHBr3 (1model-obs= +0.04 ppt) and CH2Br2 (1model-obs=
−0.01 ppt). The modeled biases for each latitude bandare also small,−0.16 –+0.30 ppt for CHBr3 and −0.10–+0.12 ppt for CH2Br2. When compared to the aircraft mea-surements collected in the tropical western Pacific during theStratospheric Ozone: Halogen Impacts in a Varying Atmo-sphere (SHIVA) campaign, Liang et al. (2010) yields thebest CH2Br2 (mean bias of+0.2 ppt compared with obser-vations), compared to the other three emissions, but the sim-ulated CHBr3 is, on average,∼+0.76 ppt too high on aver-age. Note that the high bias in modeled CHBr3 in the tropicalwestern Pacific will likely lead to a high bias in the modelBrVSLS
y , although the lofting in the Indian Ocean seems tobe more critical in determining the total amount of VSLSbromine in the lower stratosphere in this study. The model-simulated high concentration of brominated VSLS over theIndian Ocean is yet to be evaluated when more surface obser-vations become available, and the importance of the IndianOcean in delivering higher amounts of VSLS bromine intothe TTL needs to be assessed. The simulated high surfaceconcentrations of CHBr3 and CH2Br2 near tropical CentralAmerica were validated with the NASA Tropical Composi-tion, Clouds, and Climate Coupling (TC4) and Intercontinen-tal Chemical Transport Experiment – Phase B (INTEX-B)measurements (Liang et al., 2010). This region, comparedto the above two, is much less efficient in delivering VSLSbromine into the TTL due to the relatively weaker ascent.However, this ascending branch can be important in particu-
lar seasons and in individual years as the Walker circulationmoves in the east–west direction between different phases ofthe El Niño Southern Oscillation (ENSO). For example, us-ing trajectory calculations, Levine et al. (2008) found a clearshift in the TTL air origin from the tropical western Pacificand Indonesia to those from the eastern Pacific and SouthAmerica in El Niño years.
Of the total VSLS bromine that enters the base of theTTL, about half (∼4 ppt) is in the form of inorganic prod-uct gases (Fig. 6) despite our simple assumption that all in-organic bromine reservoir species are highly soluble and allinorganic bromine produced below 350 hPa is classified asthe soluble forms HBr and HOBr. A commonly adopted ap-proach in many previous modeling studies is to prescribe theVSLS concentration at the base of the TTL with observed or-ganic source gas mixing ratios in the upper troposphere andtrack the subsequent chemistry and transport (e.g., Sinnhu-ber and Folkins, 2006; Aschmann et al., 2011; Aschmann andSinnhuber, 2013). Our result implies that the BrVSLS
y estimatefrom such approach is not complete as it lacks an importantcomponent associated with PGI, which is as large as SGI atthe base of the TTL in our model simulation. A second impli-cation of this result is that, if we were to use measurementsfrom the TTL region to quantify the contribution of VSLSs tostratospheric bromine, it is necessary to make measurementsof both organic and inorganic forms to fully account for theimpact of VSLSs on the atmospheric bromine budget.
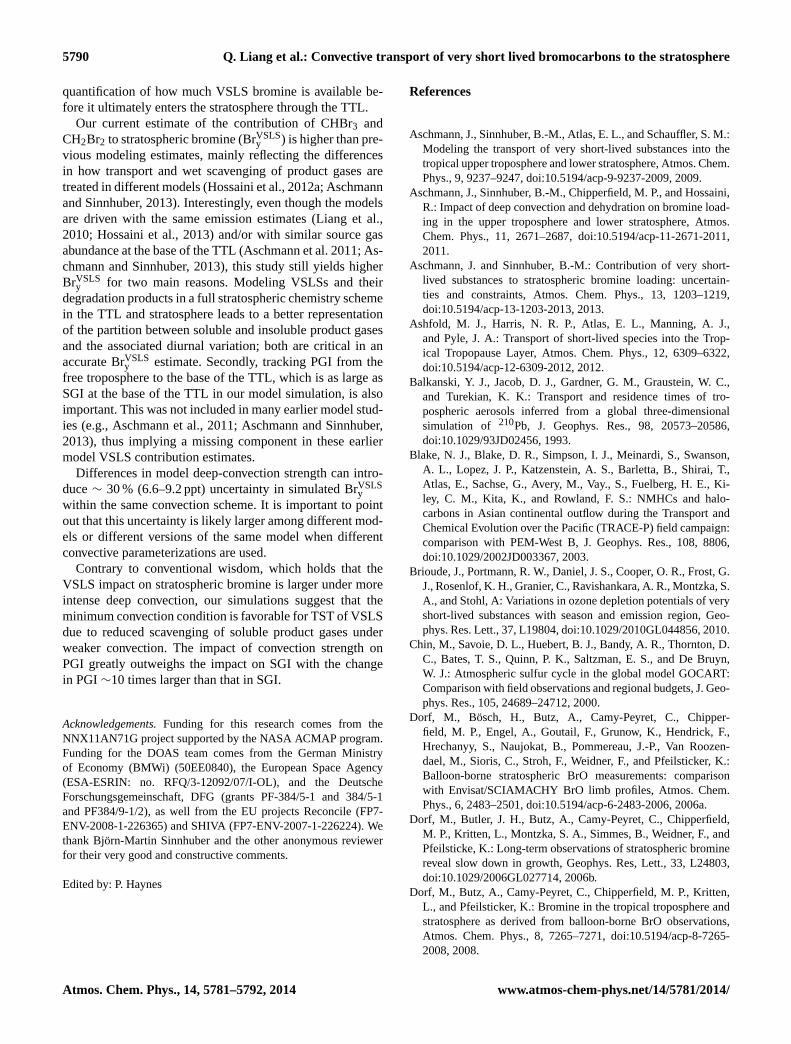
3.3 The Impact of Convection Strength
We examine the difference between the two convection sensi-tivity simulations,RMINCNV andRMAXRUN , to illustrate the
Atmos. Chem. Phys., 14, 5781–5792, 2014 www.atmos-chem-phys.net/14/5781/2014/
Q. Liang et al.: Convective transport of very short lived bromocarbons to the stratosphere 5789
60oE 120oE 180o 120oW 60oW 60oE 120oE 180o 120oW 60oW45oS30oS15oS
EQ15oN30oN45oN
45oS30oS15oS
EQ15oN30oN45oN
60oE 120oE 180o 120oW 60oW 60oE 120oE 180o 120oW 60oW
MinCnv - MaxCnv: 355K - 380K
0.0 0.6 1.2 1.8 2.4 3.0 3.6 Br (ppt)
-0.6 -0.4 -0.2 0.0 0.2 0.4 0.6 Br (ppt)
3xCHBr3 2xCH2Br2
BryVSLS Total
Figure 8.The simulated annual mean difference between theRMINCNV andRMAXRUN runs in organic bromine (3× CHBr3, 2× CH2Br2),inorganic bromine, and total bromine from VSLSs between 355 and 380 K. The model results are 10-year annual averages from 2001 to2010.
impact of deep convection on BrVSLSy (Fig. 8). The differ-
ence between these two simulations (RMINCNV –RMAXRUN )suggests that in the regions that mattered most (the threetropical convection centers), surprisingly, the minimum con-vection condition is more favorable for the TST of VSLSs.While weaker convection slightly decreases SGI (by a fewtenths ppt), PGI increases significantly (by 2–3 ppt) due toless scavenging under the minimum convection condition.The TST of the longer-lived CH2Br2 is less sensitive toconvection strength compared to that of CHBr3 because ofits longer lifetime. The significant increase in CHBr3 andCH2Br2 in the mid-latitude bands under minimum convec-tion mainly reflects the compensating responses in large-scale descent in a general circulation model as a result ofchanging convection strength (Ott et al., 2011). The decreaseof the descent does not impact the TST of VSLSs. As-chmann et al. (2011) found a qualitatively similar behaviorfor changes of VSLS SGI and PGI under El Niño vs. La Niñaconditions – while SGI increased slightly under enhanceddeep convection, the sum of SGI and PGI decreased. How-ever, the net decrease in the BrVSLS
y (<0.5 ppt) due to changesin convection strength between El Niño vs. La Niña condi-tions reported in Aschmann et al. (2011) is much smaller thanour results above, most likely due to a much higher BrVSLS
yabundance in the TTL in this work.
Globally, the differences in convection strength and wetscavenging introduce a∼2.6 ppt uncertainty into BrVSLS
y(∼6.5 ppt inRMAXRUN and∼9.1 ppt inRMINRUN) (Fig. 3).Although these two simulations represent the two extremeparameterization conditions within a reasonable range, BrOfrom both simulations still falls within the uncertainty range
of the DOAS balloon observations of± 2.5 ppt (Fig. 2; Dorfet al., 2006b).
4 Conclusions
We use the NASA Goddard 3-D Chemistry Climate Model,GEOSCCM, to quantify the contribution of brominatedvery short-lived substances (VSLSs) to reactive stratosphericbromine and to test its sensitivity to the strength of deep con-vection and the associated scavenging.
The inclusion of CHBr3 and CH2Br2 in a fully interac-tive stratospheric chemistry module deployed in the tropicaltropopause layer (TTL) and the stratosphere adds∼7.7 pptvto the present-day stratospheric inorganic bromine. The mostactive transport of VSLSs from the marine boundary layerthrough the TTL occurs where high surface concentrationsof VSLSs are colocated with deep convection centers: (1)the tropical Indian Ocean, (2) the tropical western Pacificwarm pool, and (3) off the Pacific coast of Mexico. On aver-age, annually, almost all VSLS-originated bromine availablein the marine boundary layer (∼7.8–8.4 ppt) at these activeconvective lofting regions enters the TTL, half of it in theform of source gas injection (SGI) and half of it in the formof product gas injection (PGI). After lofting above 150 hPa(∼355 K), the majority of the VSLS-originated bromine sur-vives TST and reaches the lower stratosphere, with only asmall portion (∼0.8 ppt, 10 %) removed by wet scavenging.Our model results point to a clear need for more surfacemeasurements in the active VSLS lofting regions, in partic-ular the tropical Indian Ocean and the tropical western Pa-cific, for an improved emissions estimate as well as a better
www.atmos-chem-phys.net/14/5781/2014/ Atmos. Chem. Phys., 14, 5781–5792, 2014
5790 Q. Liang et al.: Convective transport of very short lived bromocarbons to the stratosphere
quantification of how much VSLS bromine is available be-fore it ultimately enters the stratosphere through the TTL.
Our current estimate of the contribution of CHBr3 andCH2Br2 to stratospheric bromine (BrVSLS
y ) is higher than pre-vious modeling estimates, mainly reflecting the differencesin how transport and wet scavenging of product gases aretreated in different models (Hossaini et al., 2012a; Aschmannand Sinnhuber, 2013). Interestingly, even though the modelsare driven with the same emission estimates (Liang et al.,2010; Hossaini et al., 2013) and/or with similar source gasabundance at the base of the TTL (Aschmann et al. 2011; As-chmann and Sinnhuber, 2013), this study still yields higherBrVSLS
y for two main reasons. Modeling VSLSs and theirdegradation products in a full stratospheric chemistry schemein the TTL and stratosphere leads to a better representationof the partition between soluble and insoluble product gasesand the associated diurnal variation; both are critical in anaccurate BrVSLS
y estimate. Secondly, tracking PGI from thefree troposphere to the base of the TTL, which is as large asSGI at the base of the TTL in our model simulation, is alsoimportant. This was not included in many earlier model stud-ies (e.g., Aschmann et al., 2011; Aschmann and Sinnhuber,2013), thus implying a missing component in these earliermodel VSLS contribution estimates.
Differences in model deep-convection strength can intro-duce∼ 30 % (6.6–9.2 ppt) uncertainty in simulated BrVSLS
ywithin the same convection scheme. It is important to pointout that this uncertainty is likely larger among different mod-els or different versions of the same model when differentconvective parameterizations are used.
Contrary to conventional wisdom, which holds that theVSLS impact on stratospheric bromine is larger under moreintense deep convection, our simulations suggest that theminimum convection condition is favorable for TST of VSLSdue to reduced scavenging of soluble product gases underweaker convection. The impact of convection strength onPGI greatly outweighs the impact on SGI with the changein PGI∼10 times larger than that in SGI.
Acknowledgements.Funding for this research comes from theNNX11AN71G project supported by the NASA ACMAP program.Funding for the DOAS team comes from the German Ministryof Economy (BMWi) (50EE0840), the European Space Agency(ESA-ESRIN: no. RFQ/3-12092/07/I-OL), and the DeutscheForschungsgemeinschaft, DFG (grants PF-384/5-1 and 384/5-1and PF384/9-1/2), as well from the EU projects Reconcile (FP7-ENV-2008-1-226365) and SHIVA (FP7-ENV-2007-1-226224). Wethank Björn-Martin Sinnhuber and the other anonymous reviewerfor their very good and constructive comments.
Edited by: P. Haynes
References
Aschmann, J., Sinnhuber, B.-M., Atlas, E. L., and Schauffler, S. M.:Modeling the transport of very short-lived substances into thetropical upper troposphere and lower stratosphere, Atmos. Chem.Phys., 9, 9237–9247, doi:10.5194/acp-9-9237-2009, 2009.
Aschmann, J., Sinnhuber, B.-M., Chipperfield, M. P., and Hossaini,R.: Impact of deep convection and dehydration on bromine load-ing in the upper troposphere and lower stratosphere, Atmos.Chem. Phys., 11, 2671–2687, doi:10.5194/acp-11-2671-2011,2011.
Aschmann, J. and Sinnhuber, B.-M.: Contribution of very short-lived substances to stratospheric bromine loading: uncertain-ties and constraints, Atmos. Chem. Phys., 13, 1203–1219,doi:10.5194/acp-13-1203-2013, 2013.
Ashfold, M. J., Harris, N. R. P., Atlas, E. L., Manning, A. J.,and Pyle, J. A.: Transport of short-lived species into the Trop-ical Tropopause Layer, Atmos. Chem. Phys., 12, 6309–6322,doi:10.5194/acp-12-6309-2012, 2012.
Balkanski, Y. J., Jacob, D. J., Gardner, G. M., Graustein, W. C.,and Turekian, K. K.: Transport and residence times of tro-pospheric aerosols inferred from a global three-dimensionalsimulation of 210Pb, J. Geophys. Res., 98, 20573–20586,doi:10.1029/93JD02456, 1993.
Blake, N. J., Blake, D. R., Simpson, I. J., Meinardi, S., Swanson,A. L., Lopez, J. P., Katzenstein, A. S., Barletta, B., Shirai, T.,Atlas, E., Sachse, G., Avery, M., Vay., S., Fuelberg, H. E., Ki-ley, C. M., Kita, K., and Rowland, F. S.: NMHCs and halo-carbons in Asian continental outflow during the Transport andChemical Evolution over the Pacific (TRACE-P) field campaign:comparison with PEM-West B, J. Geophys. Res., 108, 8806,doi:10.1029/2002JD003367, 2003.
Brioude, J., Portmann, R. W., Daniel, J. S., Cooper, O. R., Frost, G.J., Rosenlof, K. H., Granier, C., Ravishankara, A. R., Montzka, S.A., and Stohl, A: Variations in ozone depletion potentials of veryshort-lived substances with season and emission region, Geo-phys. Res. Lett., 37, L19804, doi:10.1029/2010GL044856, 2010.
Chin, M., Savoie, D. L., Huebert, B. J., Bandy, A. R., Thornton, D.C., Bates, T. S., Quinn, P. K., Saltzman, E. S., and De Bruyn,W. J.: Atmospheric sulfur cycle in the global model GOCART:Comparison with field observations and regional budgets, J. Geo-phys. Res., 105, 24689–24712, 2000.
Dorf, M., Bösch, H., Butz, A., Camy-Peyret, C., Chipper-field, M. P., Engel, A., Goutail, F., Grunow, K., Hendrick, F.,Hrechanyy, S., Naujokat, B., Pommereau, J.-P., Van Roozen-dael, M., Sioris, C., Stroh, F., Weidner, F., and Pfeilsticker, K.:Balloon-borne stratospheric BrO measurements: comparisonwith Envisat/SCIAMACHY BrO limb profiles, Atmos. Chem.Phys., 6, 2483–2501, doi:10.5194/acp-6-2483-2006, 2006a.
Dorf, M., Butler, J. H., Butz, A., Camy-Peyret, C., Chipperfield,M. P., Kritten, L., Montzka, S. A., Simmes, B., Weidner, F., andPfeilsticke, K.: Long-term observations of stratospheric brominereveal slow down in growth, Geophys. Res, Lett., 33, L24803,doi:10.1029/2006GL027714, 2006b.
Dorf, M., Butz, A., Camy-Peyret, C., Chipperfield, M. P., Kritten,L., and Pfeilsticker, K.: Bromine in the tropical troposphere andstratosphere as derived from balloon-borne BrO observations,Atmos. Chem. Phys., 8, 7265–7271, doi:10.5194/acp-8-7265-2008, 2008.
Atmos. Chem. Phys., 14, 5781–5792, 2014 www.atmos-chem-phys.net/14/5781/2014/
Q. Liang et al.: Convective transport of very short lived bromocarbons to the stratosphere 5791
Douglass, A. R. and Kawa, S. R.: Contrast between 1992 and 1997high-latitude spring Halogen Occultation Experiment observa-tions of lower stratospheric HCl, J. Geophys. Res., 104, 18739–18754, doi:10.1029/1999JD900281, 1999.
Dvortsov, V. L., Geller, M. A., Solomon, S., Schauffler, S. M., At-las, E. L., and Blake, D. R.: Rethinking reactive halogen budgetsin the midlatitudes lower stratosphere, Geophys. Res. Lett., 26,1699– 1702, 1999.
Fueglistaler, S., Wernli, J. and Peter, T.: Tropical troposphere-to-stratosphere transport inferred from trajectory calculations, J.Geophys. Res., 109, D03108, doi:10.1029/2003JD04069, 2004.
Fueglistaler, S., Dessler, A. E., Dunkerton, T. J., Folkins, I., Fu, Q.,and Mote, P. W.: Tropical tropopause layer, Rev. Geophys., 47,RG1004, doi:10.1029/2008RG000267, 2009.
Gettelman, A. and Forster, P. M. D. F.: A climatology of the tropicaltropopause layer, J. Meteorol. Soc. Jpn., 80, 911–924, 2002.
Ginoux, P., Chin, M., Tegen, I., Prospero, J., Holben, B., Dubovik,O., and Lin, S.-J.: Sources and distributions of dust aerosols sim-ulated with the GOCART model, J. Geophys. Res., 106, 20225–20273, 2001.
Giorgi, F., and Chameides, W. L.: Rainout lifetimes of highly solu-ble aerosols and gases as inferred from simulations with a generalcirculation model, J. Geophys. Res., 91, 14367–14376, 1986.
Hatsushika, H. and Yamazaki, K.: Stratospheric drain over Indone-sia and dehydration within the tropical tropopause layer diag-nosed by air parcel trajectories, J. Geophys. Res., 108, 4610,doi:10.1029/2002JD002986, 2003.
Hossaini, R., Chipperfield, M. P., Monge-Sanz, B. M., Richards,N. A. D., Atlas, E., and Blake, D. R.: Bromoform and dibro-momethane in the tropics: a 3-D model study of chemistry andtransport, Atmos. Chem. Phys., 10, 719–735, 2010,http://www.atmos-chem-phys.net/10/719/2010/.
Hossaini, R., Chipperfield, M. P., Feng, W., Breider, T. J., Atlas,E., Montzka, S. A., Miller, B. R., Moore, F., and Elkins, J.:The contribution of natural and anthropogenic very short-livedspecies to stratospheric bromine, Atmos. Chem. Phys., 12, 371–380, doi:10.5194/acp-12-371-2012, 2012a.
Hossaini, R., Chipperfield, M. P., Dhomse, S., Ordonez, C.,Saiz-Lopez, A., Abraham, N. L., Archibald, A., Braesicke,P., Telford, P., Warwick, N., Yang, X. and Pyle, J.: Mod-elling future changes to the stratospheric source gas injectionof biogenic bromocarbons, Geophys. Res. Lett., 39, L20813,doi:10.1029/2012GL053401, 2012b.
Hossaini, R., Mantle, H., Chipperfield, M. P., Montzka, S. A.,Hamer, P., Ziska, F., Quack, B., Krüger, K., Tegtmeier, S., At-las, E., Sala, S., Engel, A., Bönisch, H., Keber, T., Oram, D.,Mills, G., Ordóñez, C., Saiz-Lopez, A., Warwick, N., Liang, Q.,Feng, W., Moore, F., Miller, B. R., Marécal, V., Richards, N. A.D., Dorf, M., and Pfeilsticker, K.: Evaluating global emission in-ventories of biogenic bromocarbons, Atmos. Chem. Phys., 13,11819–11838, doi:10.5194/acp-13-11819-2013, 2013.
Hoyle, C. R., Marécal, V., Russo, M. R., Allen, G., Arteta, J.,Chemel, C., Chipperfield, M. P., D’Amato, F., Dessens, O.,Feng, W., Hamilton, J. F., Harris, N. R. P., Hosking, J. S.,Lewis, A. C., Morgenstern, O., Peter, T., Pyle, J. A., Red-dmann, T., Richards, N. A. D., Telford, P. J., Tian, W., Viciani, S.,Volz-Thomas, A., Wild, O., Yang, X., and Zeng, G.: Repre-sentation of tropical deep convection in atmospheric models –
Part 2: Tracer transport, Atmos. Chem. Phys., 11, 8103–8131,doi:10.5194/acp-11-8103-2011, 2011.
Kreycy, S., Camy-Peyret, C., Chipperfield, M. P., Dorf, M.,Feng, W., Hossaini, R., Kritten, L., Werner, B., and Pfeil-sticker, K.: Atmospheric test of theJ (BrONO2)/kBrO+NO2ratio: implications for total stratospheric Bry and bromine-mediated ozone loss, Atmos. Chem. Phys., 13, 6263–6274,doi:10.5194/acp-13-6263-2013, 2013.
Kurylo, M. J., and Rodriguez, J. M.: Short-lived ozone relatedcompounds, in Scientific Assessment of Ozone Depletion: 1998,Global Ozone Res. and Monit. Proj., Rep. 44, chap. 2, WorldMeteorol. Organ., Geneva, Switzerland, 1999.
Levine, J. G., Braesicke, P., Harris, N. R. P., Savage, N. H., and Pyle,J. A.: Pathways and timescales for troposphere-to-stratospheretransport via the tropical tropopause layer and their relevancefor very short lived substances, J. Geophys. Res., 112, D04308,doi:10.1029/2005JD006940, 2007.
Levine, J. G., Braesicke, P., Harris, N. R. P., Pyle, J. A.: Seasonaland inter-annual variations in troposphere-to-stratosphere trans-port from the tropical tropopause layer, Atmos. Chem. Phys. 8,3689–3703, doi:10.5194/acp-8-3689-2008, 2008.
Liang, Q., Stolarski, R. S., Kawa, S. R., Nielsen, J. E., Dou-glass, A. R., Rodriguez, J. M., Blake, D. R., Atlas, E. L., andOtt, L. E.: Finding the missing stratospheric Bry: a global mod-eling study of CHBr3 and CH2Br2, Atmos. Chem. Phys., 10,2269–2286, doi:10.5194/acp-10-2269-2010, 2010.
Lin, S.-J.: A “vertically Lagrangian” finite-volume dynamical corefor global models, Mon. Weather Rev., 132, 2293–2307, 2004.
Liu, H., Jacob, D. J., Bey, I., and Yantosca, R. M.: Constraintsfrom 210Pb and 7Be on wet deposition and transport in aglobal three-dimensional chemical tracer model driven by as-similated meteorological fields, J. Geophys. Res., 106, 12109–12128, doi:10.1029/2000JD900839, 2001.
Moorthi, S. and Suarez, M. J.: Relaxed Arakawa–Schubert: A pa-rameterization of moist convection for general circulation mod-els, Mon. Weather Rev., 120, 978–1002, 1992.
Nielsen, J. E. and Douglass, A. R.: A simulation of bromoform’scontribution to stratospheric bromine, J. Geophys. Res., 106,8089–8100, 2001.
Ordóñez, C., Lamarque, J.-F., Tilmes, S., Kinnison, D. E., At-las, E. L., Blake, D. R., Sousa Santos, G., Brasseur, G., andSaiz-Lopez, A.: Bromine and iodine chemistry in a globalchemistry-climate model: description and evaluation of veryshort-lived oceanic sources, Atmos. Chem. Phys., 12, 1423–1447, doi:10.5194/acp-12-1423-2012, 2012.
Ott, L. E., Bacmeister, J., Pawson, S., Pickering, K., Stenchikov,G., Suarez, M. Huntriester, H., Loewenstein, M., Lopez, J., andXueref-Remy, I.: Analysis of Convective Transport and Parame-ter Sensitivity in a Single Column Version of the Goddard EarthObservation System, Version 5, General Circulation Model, J.Atmos. Sci., 66, 627–646, 2009.
Ott, L. E., Pawson, S., and Bacmeister, J.: An analysis of theimpact of convective parameter sensitivity on simulated globalatmospheric CO distributions, J. Geophys. Res. 116, D21310,doi:10.1029/2011JD016077, 2011.
Parrella, J. P., Jacob, D. J., Liang, Q., Zhang, Y., Mickley, L.J., Miller, B., Evans, M. J., Yang, X., Pyle, J. A., Theys, N.,and Van Roozendael, M., Atmos. Chem. Phys., 12, 6723–6720,doi:10.5194/acp-12-6723-2012, 2012.
www.atmos-chem-phys.net/14/5781/2014/ Atmos. Chem. Phys., 14, 5781–5792, 2014

5792 Q. Liang et al.: Convective transport of very short lived bromocarbons to the stratosphere
Pyle, J. A., Ashfold, M. J., Harris, N. R. P., Robinson, A. D., War-wick, N. J., Carver, G. D., Gostlow, B., O’Brien, L. M., Man-ning, A. J., Phang, S. M., Yong, S. E., Leong, K. P., Ung, E. H.,and Ong, S.: Bromoform in the tropical boundary layer of theMaritime Continent during OP3, Atmos. Chem. Phys., 11, 529–542, doi:10.5194/acp-11-529-2011, 2011.
Randel, W. J. and Jensen, E. J.: Physical processes in the tropicaltropopause layer and their role in a changing climate, NatureGeosci., 6, 169–176, doi:10.1038/ngeo1733, 2013.
Reinecker, M. M, Suarez, M. J., Todling, R., Bacmeister, J., Takacs,L., Liu, H.-C., Gu, W., Sienkiewicz, M., Koster, R. D., Gelaro,R., Stajner, I., and Nielsen, J. E.: The GEOS-5 Data AssimilationSystem-Documentation of Versions 5.0.1, 5.1.0, and 5.2.0, Tech.Rep. 104606 V27, NASA, Greenbelt, MD, 2008.
Rozanov, A., Kühl, S., Doicu, A., McLinden, C., Pukıte, J., Bovens-mann, H., Burrows, J. P., Deutschmann, T., Dorf, M., Goutail, F.,Grunow, K., Hendrick, F., von Hobe, M., Hrechanyy, S., Licht-enberg, G., Pfeilsticker, K., Pommereau, J. P., Van Roozen-dael, M., Stroh, F., and Wagner, T.: BrO vertical distributionsfrom SCIAMACHY limb measurements: comparison of algo-rithms and retrieval results, Atmos. Meas. Tech., 4, 1319–1359,doi:10.5194/amt-4-1319-2011, 2011.
Salawitch, R. J., Canty, T., Kurosu, T., Chance, K., Liang, Q., daSilva, A., Pawson, S., Nielsen, J. E., Rodriguez, J. M., Bhartia,P. K., Liu, X., Huey, L. G., Liao, J., Stickel, R. E., Tanner, D.J., Dibb, J. E., Simpson, W. R., Donohoue, D., Weinheimer, A.,Flocke, F., Knapp, D., Montzka, D., Neuman, J. A., Nowak, J.B., Ryerson, T. B., Oltmans, S., Blake, D. R., Atlas, E. L., Kinni-son, D. E., Tilmes, S., Pan, L. L., Hendrick, F., Van Roozendael,M., Kreher, K., Johnston, P. V., Gao, R. S., Johnson, B., Bui, T.P., Chen, G., Pierce, R. B., Crawford, J. H., and Jacob, D. J.:A new interpretation of total column BrO during Arctic spring,Geophys. Res. Lett., 37, L21805, doi:10.1029/2010GL043798,2010.
Sander, S. P., Abbatt, J. P. D., Barker, J. R., Burkholder, J. B.,Golden, D. M., Kolb, C. E., Kurylo, M. J., Moortgat, G. K., Wine,P. H., Huie, R. E., Orkin, V. L.: Chemical Kinetics and Photo-chemical Data for Use in Atmospheric Studies: Evaluation No.17, JPL Publ. 10-6, Jet Propul. Lab., Pasadena, CA, USA, 2011.
Schauffler, S. M., Atlas, E. L., Blake, D. R., Flocke, F., Lueb, R. A.,Lee-Taylor, J. M., Stroud, V., and Travnicek, W.: Distributionsof brominated organic compounds in the troposphere and lowerstratosphere, J. Geophys. Res., 104, 21513–21535, 1999.
Sinnhuber, B.-M., Rozanov, A., Sheode, N., Afe, O. T., Richter,A., Sinnhuber, M., Wittrock, F., Burrows, J. P., Stiller, G. P.,von Clarmann, T., and Linden, A.: Global observations of strato-spheric bromine monoxide from SCIAMACHY, Geophys. Res.Lett., 32, L20810, doi:10.1029/2005GL023839, 2005.
Sinnhuber, B.-M. and Folkins, I.: Estimating the contribution ofbromoform to stratospheric bromine and its relation to dehy-dration in the tropical tropopause layer, Atmos. Chem. Phys., 6,4755–4761, doi:10.5194/acp-6-4755-2006, 2006.
Sioris, C. E., Kovalenko, L. J., McLinden, Salawitch, R. J., VanRoozendael, M., Goutail, F., Dorf, M., Pfeilsticker, K., Chance,K., von Savigny, C., Liu, X. Kurosu, T. P., Pommereau, J.-P., Bösch, and Frerick, J.: Latitudinal and vertical distributionof bromine monoxide in the lower stratosphere from Scan-ning Imaging Absorption Spectrometer for Atmospheric Char-tography limb scattering measurements, J. Geophys. Res., 111,D14301, doi:10.1029/2005JD006479, 2006.
Spivakovsky, C. M., Logan, J. A., Montzka, S. A., Balkanski, Y. J.,Foreman-Fowler, M., Jones, D. B. A., Horowitz, L. W., Fusco, A.C., Brenninkmeijer, C. A. M., Prather, M. J., Wofsy, S. C., andMcElroy, M. B.: Three-dimensional climatological distributionof tropospheric OH: Update and evaluation, J. Geophys. Res.,105, 8931–8980, 2000.
Sturges, W. T., Oram, D. E., Carpenter, L. J., Penkett, S. A. and En-gel, A.: Bromoform as a source of stratospheric bromine, Geo-phys. Res. Lett., 27, 2081–2084, 2000.
Warwick, N. J., Pyle, J. A., Carver, G. D., Yang, X., Savage,N. H., O’Connor, F. M., and Cox, R. A.: Global modelingof biogenic bromocarbons, J. Geophys. Res., 111, D24305,doi:10.1029/2006JD007264, 2006.
Webster, P. J.: The large scale structure of the tropical atmosphere,General Circulation of the Atmosphere, Academic Press, 235–275, 1983.
WMO (2011), Scientific Assessment of Ozone Depletion: 2010,Global Ozone Research and Monitoring Project-Report No. 52,516 pp., Geneva, Switzerland.
Yang, X., Cox, R. A., Warwick, N. J., Pyle, J. A., Carver, G. D., andO’Connor, F. M.: Tropospheric bromine chemistry and its im-pacts on ozone: A model study, J. Geophys. Res., 110, D23311,doi:10.1029/2005-JD006244, 2005.
Ziska, F., Quack, B., Abrahamsson, K., Archer, S. D., Atlas, E.,Bell, T., Butler, J. H., Carpenter, L. J., Jones, C. E., Har-ris, N. R. P., Hepach, H., Heumann, K. G., Hughes, C.,Kuss, J., Krüger, K., Liss, P., Moore, R. M., Orlikowska, A.,Raimund, S., Reeves, C. E., Reifenhäuser, W., Robinson, A. D.,Schall, C., Tanhua, T., Tegtmeier, S., Turner, S., Wang, L., Wal-lace, D., Williams, J., Yamamoto, H., Yvon-Lewis, S., and Yok-ouchi, Y.: Global sea-to-air flux climatology for bromoform,dibromomethane and methyl iodide, Atmos. Chem. Phys., 13,8915–8934, doi:10.5194/acp-13-8915-2013, 2013.
Atmos. Chem. Phys., 14, 5781–5792, 2014 www.atmos-chem-phys.net/14/5781/2014/