controlling the big bang in uhplc separations! · the big bang! dispersion begins at injection of...
TRANSCRIPT

Controlling the Big Bang in UHPLC Separations!
Agilent Technologies
2013

What Are the Goals of the Separation Improvement?
Speed
Resolution
Increased Sensitivity
A Combination of the Above
Any Improvement in Performance May be Compromised if the
Separation System is not Optimized and Controlled

What Needs to be Controlled in the System?
• Injection
• Column Efficiency
• Detection
• Sample Path Volume

What Is the Sample Path?
.
.
Any Volume the Sample “Sees”
• Injection Volume
• Connecting Tubing
• Column
• Detector

System Volume and Dispersion
• Since the Sample is in Solution ALL Volume Components
Increase Peak Dispersion
• Volume is your enemy in High Performance LC!
• A flow path is necessary to move the sample through the
system so Extra Column Volume (ECV) is necessary
• ECV in the system can be controlled and dispersion effects
minimized

Group/Presentation Title
Agilent Restricted
Month ##, 200X
Column and Extra Column Dispersion
• The Van deemter equation and graph describes dispersion in column during the separation process
• There are other factors that contribute to dispersion:
• σ2in - dispersion in the injector
• σ2 tu - dispersion in the
connecting tubes
• σ2 det - dispersion in the detector
• These are often grouped together under the term
Extra Column Volume (ECV)

The Big Bang!
Dispersion Begins at Injection of the Sample

Page 8
Bonded phase
Bonded phase
• Differential partitioning of the components into the stationary and
mobile phases.
• Separation controlled by chemical interaction of mobile
phase/sample/bonded phase
Mobile phase
The Separation Process
Group/Presentation Title
Agilent Restricted
Month ##, 200X
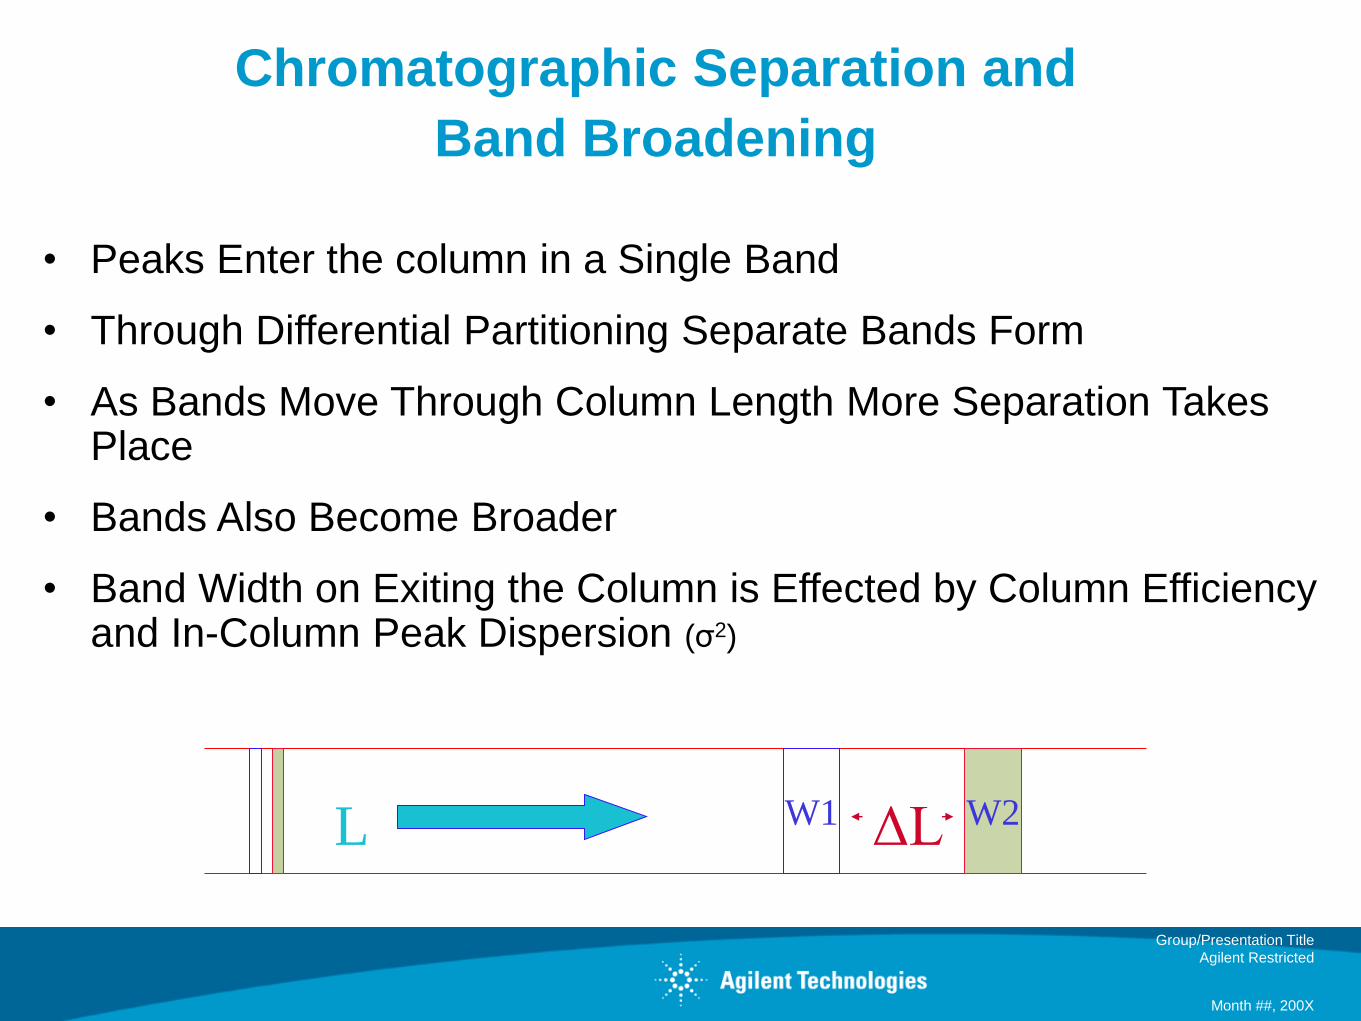
Chromatographic Separation and
Band Broadening
• Peaks Enter the column in a Single Band
• Through Differential Partitioning Separate Bands Form
• As Bands Move Through Column Length More Separation Takes Place
• Bands Also Become Broader
• Band Width on Exiting the Column is Effected by Column Efficiency and In-Column Peak Dispersion (σ2)
W1 W2 ΔL L

Dispersion Within the LC Column
a) Longitudinal Diffusion (dispersion)
b) Radial Diffusion (dispersion)
Direction of Flow

Learn How to Optimize Your Auto Sampler Keep Control of Sample Injection
Delay Volume Reduction and Overlapped Injections
Main Pass Bypass
Simultaneous Speed and CO optimization by
• Simple „one-valve“ flow-though design
• Automatic delay volume reduction (6µl)
• Overlapped injection
• Programmable sample flush-out time
• External needle wash
• MCO by additional valve switches
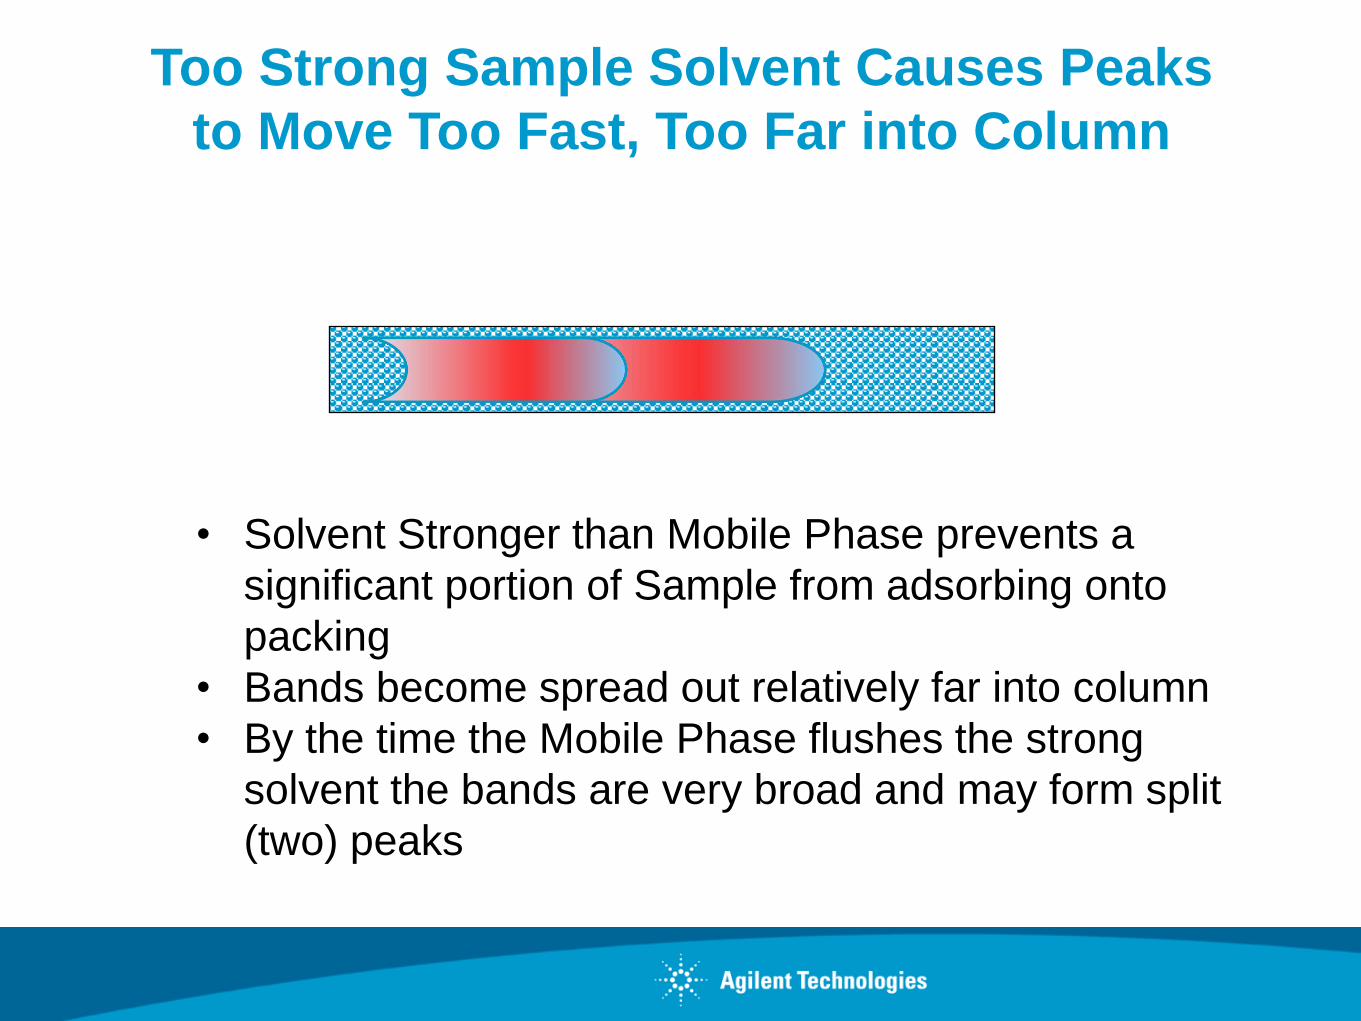
Too Strong Sample Solvent Causes Peaks
to Move Too Fast, Too Far into Column
• Solvent Stronger than Mobile Phase prevents a
significant portion of Sample from adsorbing onto
packing
• Bands become spread out relatively far into column
• By the time the Mobile Phase flushes the strong
solvent the bands are very broad and may form split
(two) peaks

Use Care in Choosing the Sample Solvent Example of Too Strong Sample Solvent
Column: StableBond SB-C8, 4.6 x 150 mm, Mobile Phase: 82% H2O : 18% ACN
Injection Volume: 30 mL Sample: 1. Caffeine 2. Salicylamide
A. Injection Solvent
100% Acetonitrile B. Injection Solvent
Mobile Phase
0 10
Time (min)
0 10
Time (min)
1
2
1
2
• Use Sample Solvent No Stronger than Mobile Phase
• Ideal Solvent is 100% Aqueous in RP LC

Standard Analytical Solvent Saver Narrow Bore
Column
Cross Section
Column Internal
Diameter 4.6 mm 3.0 mm 2.1 mm
Flow Rate/min. 1.00 mL 0.40 mL 0.20 mL
Inj. Vol. Ratio 1 0.4 0.2
Relationship of Column i.d. to
Flow Rate and Injection Volume

Confidentiality Label
July 31, 2013 15
No Change in Flow as Column i.d. Decreases
Leads to Reduced Resolution
0 1 2 3 4 5 6
Rs = 1.32
Rs = 1.65
Time (min)
4.6 x 150 mm
3.0 x 150 mm
2.1 x 150 mm
R s = 0.95
483 psi
1135 psi
2316 psi
Flow Rate: 1.0 mL/min

Confidentiality Label
July 31, 2013 16
Maintaining Linear Velocity on Columns of
Different i.d. Holds Resolution
0 40Time (min)
1
2 3
4
56
0 40
1
23
4
56
0 40
1
23
4
5
6
Time (min)Time (min)
4.6 x 150 mm 3.0 x 150 mm
2.1 x 150 mm
Flow Rate: 1.0 mL/min
Injected: 3 uL
Detector Cell Volume: 8 uL
Flow Rate: 0.4 mL/min
Injected: 2 uL
Detector Cell Volume: 8 uL
Flow Rate: 0.2 mL/min
Injected: 1 uL
Detector Cell Volume: 2 uL
Page 17
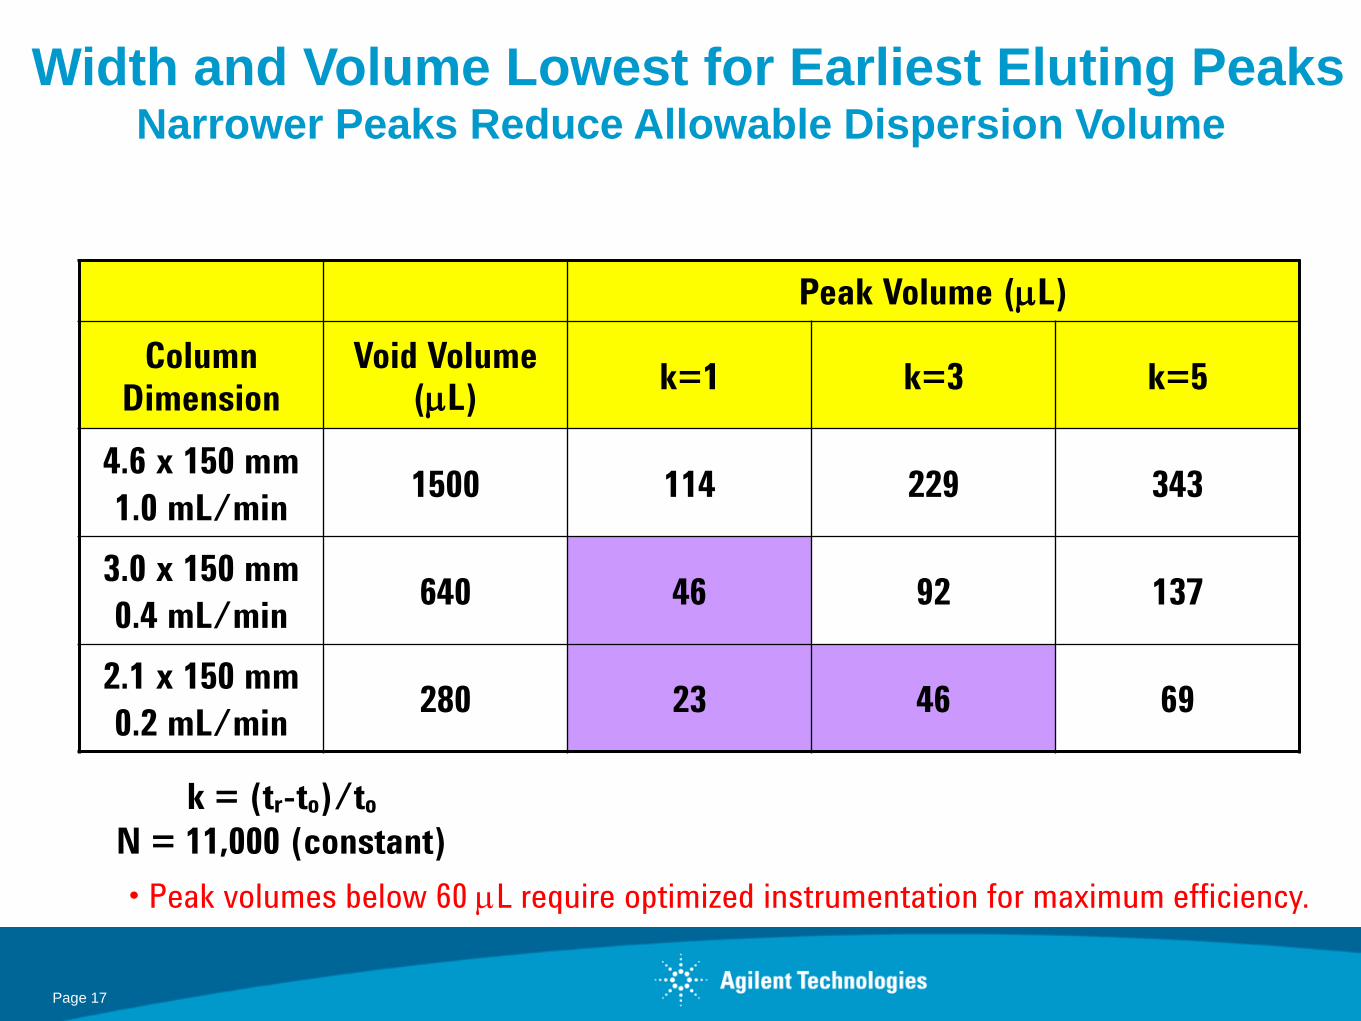
Width and Volume Lowest for Earliest Eluting Peaks Narrower Peaks Reduce Allowable Dispersion Volume
Peak Volume (mL)
Column
Dimension
Void Volume (mL)
k=1 k=3 k=5
4.6 x 150 mm
1.0 mL/min 1500 114 229 343
3.0 x 150 mm
0.4 mL/min 640 46 92 137
2.1 x 150 mm
0.2 mL/min 280 23 46 69
k = (tr-to)/to
N = 11,000 (constant)
• Peak volumes below 60 mL require optimized instrumentation for maximum efficiency.

As Efficiency Increases Peak Width Decreases System Dispersion Becomes More of a Factor
Columns: Eclipse Plus C18, as described below. Mobile Phase: A: water, B: MeOH, (15:85) Injection volume: 6uL
Temperature: 25°C Flow: 1 mL/min. Detection: 310, 4 nm, 0.5 s response time, semi-micro flow cell, Sample: Sunscreens
min 0 2 4 6 8 10 12 14
mAU
0
20
40
60
min 0 2 4 6 8 10 12 14
mAU
0
20
40
60
80
100
min 0 2 4 6 8 10 12 14
mAU
0
50
100
150
4.6 x 100 mm, 3.5 µm
1
2 3
4
Rs3,2= 6.65
Rs3,2= 6.51
Rs3,2= 6.41
4.6 x 50 mm, 1.8 µm
4.6 x 150 mm, 5 µm

Approximate Extra Column Volume Limits
for This 4.6mm i.d. Column Example
5um 3.5um 1.8um
Peak (1) Width in uL 181 136 45
Injection (1/10 P.V.) 18 14 5
Extra Column (1/3 P.V.) 60 45 15
ECV minus Inj. Vol. 42 21 10
ECV Estimate for
2.1mm i.d. Column
8 4 2

Injection and Flow Parameters are Optimized
What Now?
• Weakest Possible Sample Solvent
• Flow Rate/ Linear Velocity Appropriate to Column
Diameter
• Injection Volume Scaled to Peak Width
• Next Step is to optimize ECV

How Does Instrument Design Effect Performance?
• The Flow Path the Sample “Sees” from injection to Detection
Contributes to Dispersion and Peak Broadening
• Limiting excess volume will greatly reduce dispersion impact
on performance
• UHPLCs (Agilent 1290 Infinity) are already optimized for Sub-
2u , Poroshell and HPLC column performance
• What about other instruments?
1290 Infinity UHPLC

Optimizing the LC SYSTEM
• Connecting Tubing
• Proper Connection Technique
• Data Collection Rate for Detectors

Instrument Impact on Column Performance
.
Extracolumn Volume
Data Sampling ( or Acquisition) Rate
.
Number of
Scans or points

0 1 2 3 4 5 6 7 8 9 10 11
Effect of Extra-Column Volume
Extra-
Column
Volume
10 µL
20 µL
Time, min.
2.1 x 150 mm
F = 0.2 mL /
min.
001015P1.PPT
Loss of
Resolution

Group/Presentation Title
Agilent Restricted
Month ##, 200X
Dispersion in the Tubing
Dispersion Calculation
σt2 = π2r6Lu/24Dm
Dispersion in the tubing is proportional to the
• Length of tubing
• 6th power of the tube radius
Shortest tubing lengths possible minimize dispersion
Small changes in tubing i.d. have major effects on
peak width and efficiency

Tubing Volume
Tubing Length 10mm 50mm 100mm 150mm
Tubing i.d. Volume Volume Volume Volume
0.17mm (green) 0.227 uL 1.1uL 2.27 uL 3.3 uL
0.12mm (red) 0.113 uL 0.55uL 1.13 uL 1.65 uL

Conversion for Fast and Ultra-Fast HPLC 1200 through 1260 Series LC Systems
High pressure
Gradient pump
Std or Well
Plate sampler
Diode Array
Detector
Standard assembly
without standard mixer
0.12 x 400 mm capillary
Mass
Spectrometer
0.12 x XX mm PEEK Capillary
High pressure
Gradient pump
Std or Well
Plate sampler
Rapid Resolution
HT Column
Diode Array
detector
Waste
0.17 x 400 mm capillary
0.17 x 150 mm capillary
0.17 x 105 mm capillary
3 mL
heat exchanger
Thermostatted
Column
compartment
Traditional LC Columns Fast LC/UHPLC Columns
Rapid Resolution
HT Column
0.12 x 150 mm capillary
0.12 x 105 mm capillary
3 mL
heat exchanger
Thermostatted
Column
compartment

Optimizing Connecting Tubing Volume
For UHPLC Columns
min 0.5 1 1.5 2 2.5
mAU
0
100
200
350
400
550
600 System Tubing Volume Optimized
0.12mm i.d. tubing
Peak width 0.018 min
Peak width 0.019 min
Resolution 1.902
min 0.5 1 1.5 2 2.5
mAU
0
100
200
300
400
System Tubing Volume Not Optimized
0.17mm i.d. tubing
Peak width 0.038 min
Peak width 0.037 min
Resolution 0.961

Smaller Column i.d. Requires a Lower
Detector Cell Volume
July 31, 2013
Confidentiality Label
29
Black – 14 uL flow cell
3 x 100mm Column
Blue – 5 uL flow cell

Page 30
Agilent Method Translator – Advanced Mode Can be used to model Extra Column Volume Effects on Efficiency

What Happens If a Connection is Poorly Made ?
Page 31
If Dimension X is too long, leaks will occur
Ferrule cannot seat properly
Mixing Chamber
If Dimension X is too short, a dead-volume,
or mixing chamber, will occur
Wrong … too long, but obvious
It Leaks!
Wrong … too short, not so
obvious and Causes Dispersion! X
X

min 0 0.1 0.2 0.3 0.4
mAU
0
20
40
60
80
100
120
140 One bad capillary connection!
min 0 0.1 0.2 0.3 0.4
mAU
0
30
60
90
120
150
180
210 Fixed!
130 mAU
160 mAU
Page 32
Influence of Bad Post-Column Connection

Effect of Data Acquisition Rate (time constant) High definition UHPLC Requires High Definition Chromatogram
min 0.1 0.2 0.3 0.4 0.5 0
80Hz
PW=0.30sec
40Hz
PW = 0.33 sec
20 Hz
PW=0.42sec
10Hz
PW=0.67sec
5Hz PW=1.24sec
• Increased Data Rate
• More Accurate “ Picture”
• Make Sure Rate is Adequate
• Faster Rates Generate More
Noise and Take up More Memory

Solve Apparent Rs Problems with Optimum
Data Collection Rate
min 0 0.1 0.2 0.3 0.4 0.5
mAU
0
20
40
60
80
100
min 0 0.1 0.2 0.3 0.4 0.5
mAU
0
10
20
30
40
50
Peak width = 0.017min at 80Hz
Peak width = 0.021min at 10Hz
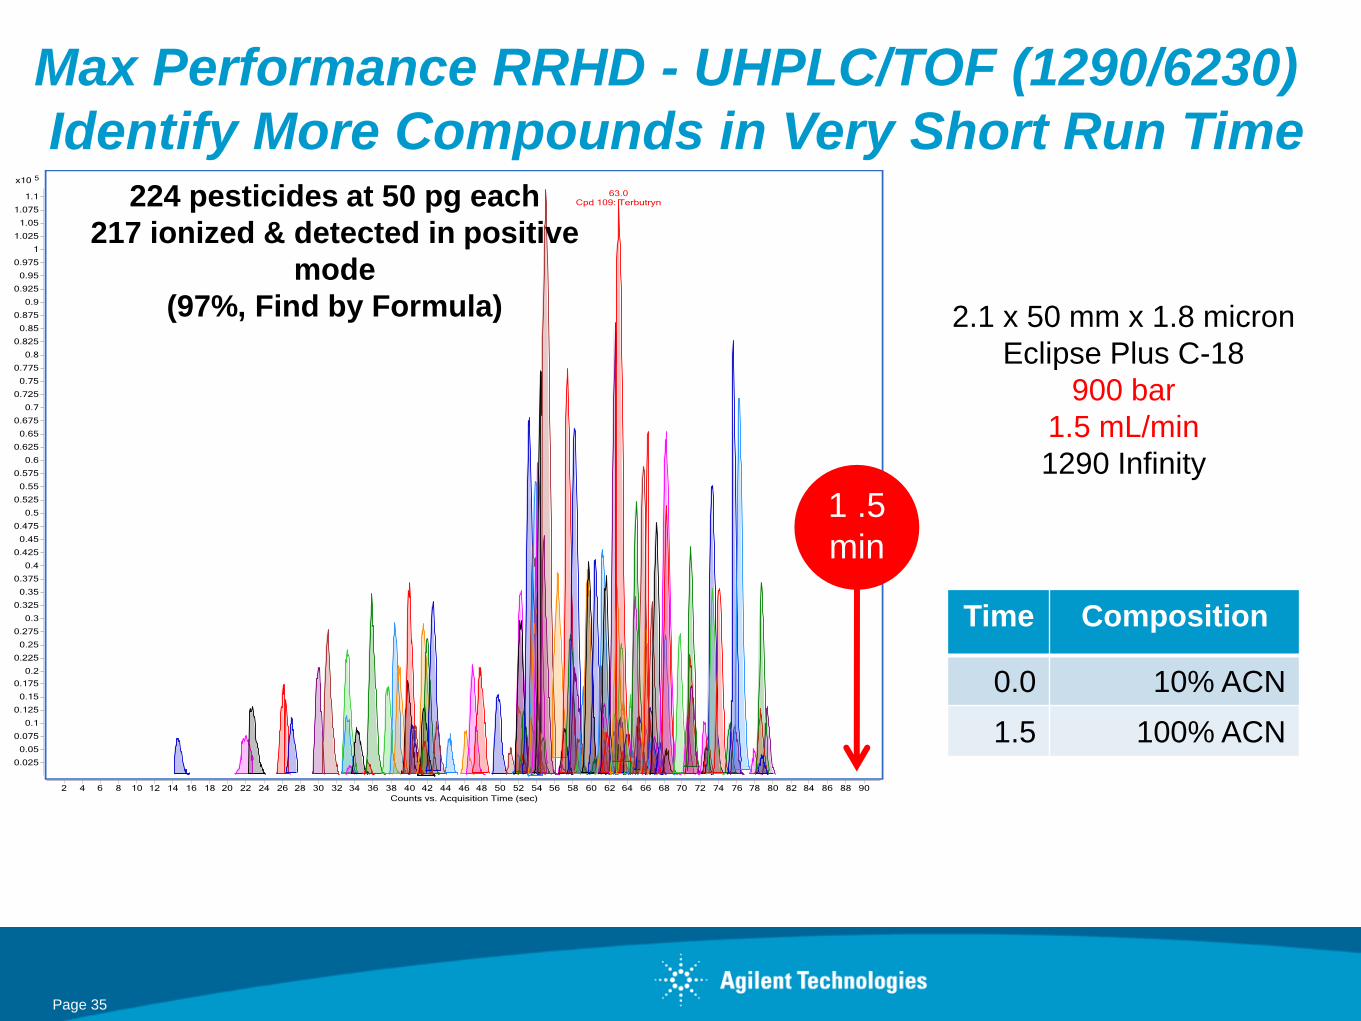
Max Performance RRHD - UHPLC/TOF (1290/6230)
Identify More Compounds in Very Short Run Time
1 .5
min
Time Composition
0.0 10% ACN
1.5 100% ACN
224 pesticides at 50 pg each
217 ionized & detected in positive
mode
(97%, Find by Formula) 2.1 x 50 mm x 1.8 micron
Eclipse Plus C-18
900 bar
1.5 mL/min
1290 Infinity
Page 35

Very Narrow Peaks in MS Require More
Scans/Second –Optimize Scan Speed!
1290 Infinity Applications
Peak Width 0.7 sec

Very Fast Gradients Benefit From Very Fast Scan MS with 40 Cycle/s, 5-90%B Gradient in 0.65min
0.05 0.10 0.15 0.20 0.25 0.30 0.35 0.40 0.45 0.50 0.55
0.60 Time, min
0.0
5.0e4
1.0e5
1.5e5
2.0e5
2.5e5
3.0e5
3.5e5
4.0e5
4.5e5
5.0e5
5.5e5
6.0e5
6.5e5
7.0e5
Inte
nsity
, cps
0.34s
0.36s
0.36s 0.42s
0.36s
Atenolol
Metoprolol
Primidone
Verapamil
Beclomethasone-
dipropionate
H2O/ACN
Flow =1.8ml/min
5-90%B in 0.5min
Stop time =0.65min
80°C, ACR
MS 40Hz
100-1000Da
Peak capacity of >40 in 39 sec in the MS chromatogram

What Does an Optimized System Allow You to Do?
After you have optimized
• Injection Parameters
• Flow Rate/ Linear Velocity
• Extra Column Volume
• Detector Parameters
What is Possible?
• Much Faster Separations
• Much more Resolution
• More Reliable Data
• More Accurate and Precise Answers

Chemical antidiabetic drug substances of the sulfonylurea
class
Glipizide Gliclazide
Glibenclamide Glimepiride
Gliquidone Repaglinide
July 31, 2013 39
Agilent Profile

Converting a Method from HPLC to UHPLC
Reduce analysis time
Maintain linearity
Improve LOD and LOQ with UHPLC
July 31, 2013 40
Agilent Profile

Six consecutive runs of Antidiabetic drug standards Agilent ZORBAX Eclipse Plus C18, 4.6 × 150 mm, 5 μm
min 2.5 5 7.5 10 12.5 15 17.5 20
mAU
0
100
200
300
400
500
1
2
3
4
5
6
July 31, 2013 41
Agilent Profile

Six consecutive runs of Antidiabetic drug standards Agilent ZORBAX RRHD Eclipse Plus C18, 3×50 mm, 1.8μm
min 0 0.2 0.4 0.6 0.8 1 1.2 1.4 1.6 1.8
mAU
0
50
100
150
200
250
1
2
3
4
5
6
July 31, 2013 42
Agilent Profile

Linearity and LOD/LOQ
Comparison between HPLC and UHPLC conditions
July 31, 2013 43
Agilent Profile

Comparison of Chromatographic Conditions
HPLC vs. UHPLC

Summary
• UHPLC columns are more efficient than HPLC columns
• Peaks generated are much narrower and more effected by non-
optimized separation parameters and LC instruments
• 2.1mm i.d. columns are effected more than 3.0 and 4.6 mm i.d.
• Extra Column Volume causes dispersion and needs to be
minimized
• Maximum performance will be realized on new design LCs
• Very complex samples will require UHPLC instruments and
1.8u or Poroshell columns
• Optimized Systems and Columns Allow Faster, Better Data

APPENDIX
Additional Slides

Instrument Impact on Column Performance
Gradient Delay or Dwell Volume .
Extracolumn Volume
Data Sampling ( or Acquistion) Rate
.
Number of
Scans or points

Typical Performance Comparisons of Various
Particles and Column Lengths
Length N
5um
N
3.5um
N
1.8um
Bar
1.8um
N
Poro
120
Bar
Poro
120
150mm 12,500 21,000 32,500 560 ~28,000 280
100mm 8,500 14,000 24,000 420 ~20,000 210
50mm 4,200 7,000 12,000 210 ~10,000 105
• pressure determined with 60:40 MeOH/water, 1ml/min, 4.6mm ID

ABSTRACT
The process of sample introduction in UHPLC seems simple enough-a dissolved sample is transferred into the LC, the sample separates in the ultra-high efficiency column and flows to the detector in record time. Simple. Not really-it is more like controlled chaos. Bang! The sample is met with a fast moving flow of mobile phase that may or may not be compatible with your sample solvent. The sample molecules are chaotically diluted by the mobile phase before it reaches the column. The sample slams into the column inlet and needs to be in a tight band as the separation starts on impact with the column bed. It leaves the column in discrete bands which again suffer dilution effects before it reaches the detector - all in less than 10 minutes. From the moment of injection to the final detection, the volume in the system, and how you control it, has serious effects on the quality of the chromatographic peak and data generated. This presentation deals with these injection and volume effects, what you need to know for better control and making the best use of your UHPLC instrument. You will learn how to properly scale UHPLC conditions, set efficient injection volume and concentration, optimize the injection process, minimize the extra-column volume in the system, and set optimum data collection parameters to produce the best chromatography using the new generation of UHPLC columns.