controlling in the wood products industry - boku · z.b. tanz der vampire 3310512 profit center...
TRANSCRIPT

Controlling in the Wood Products Industry
SS 2016 Albert Sickl
26/2/2016 2
Module 2 Take aways from Module 1
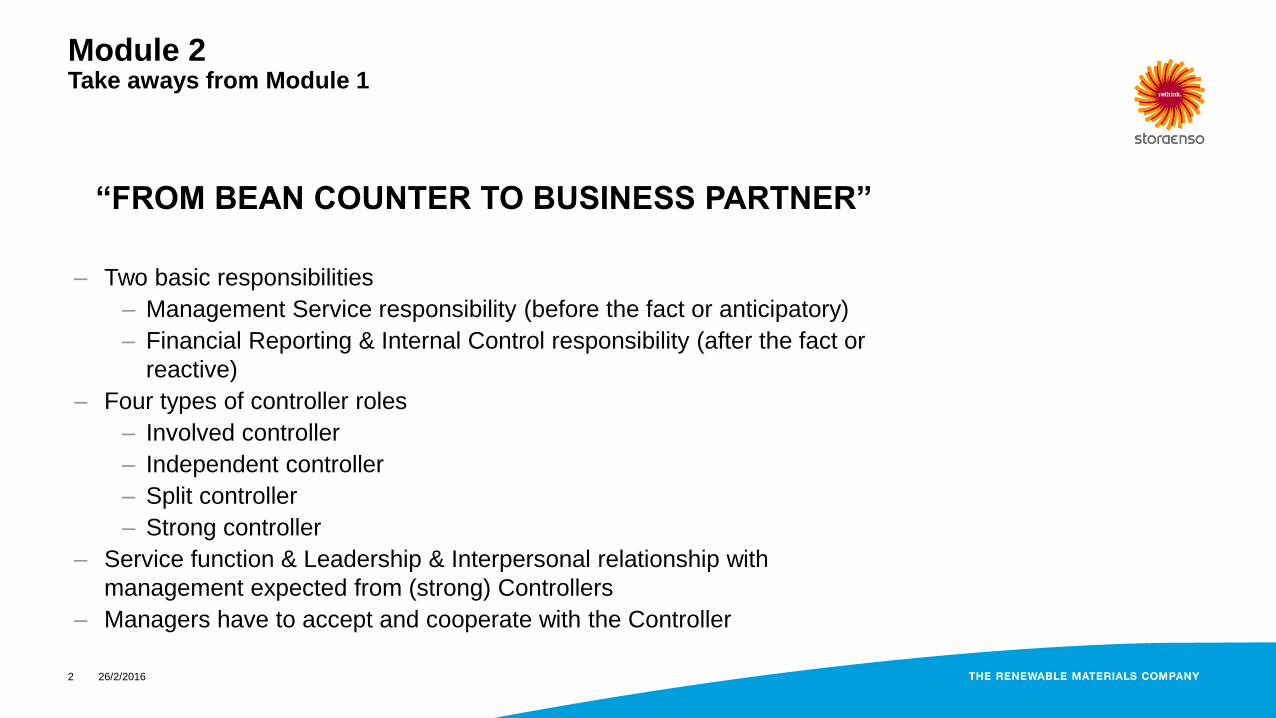
“FROM BEAN COUNTER TO BUSINESS PARTNER”
– Two basic responsibilities
– Management Service responsibility (before the fact or anticipatory)
– Financial Reporting & Internal Control responsibility (after the fact or
reactive)
– Four types of controller roles
– Involved controller
– Independent controller
– Split controller
– Strong controller
– Service function & Leadership & Interpersonal relationship with
management expected from (strong) Controllers
– Managers have to accept and cooperate with the Controller

26/2/2016 3
Module 2 Basic Tools
Financial Concepts:
– Efficiency in value creation (ROCE > WACC)
– Strength to cope with uncertainty (D/E, Equity ratio)
– Ability to reward stakeholders (Cash)
MUST: Ability to cope with all three dimensions

26/2/2016 4
Module 2 Basic Tools
The magic triangle regarding the financial body:
Profit & Loss Statement (…the muscles)
Balance Sheet (…the bones) Cash Flow (…the blood)
KPIs

26/2/2016 5
Module 2 Basic Tools – Income Statement or P&L
– One of the major financial statements beside Balance Sheet and
Cash Flow Statement.
– “Muscles” of the financial body.
– Shows the profitability of a company during a PERIODE of time.
– It does not show cash receipts (money you receive) nor cash
disbursements (money you pay out). The profit-&loss statement
measures profitability, not cash flow!
– Prepared monthly, quarterly and / or annually.
– Two formats:
– Total Expenditure Format (Gesamtkostenverfahren)
– Cost of Sales Format (Umsatzkostenverfahren)
26/2/2016 6
Module 2 Basic Tools – Income Statement or P&L
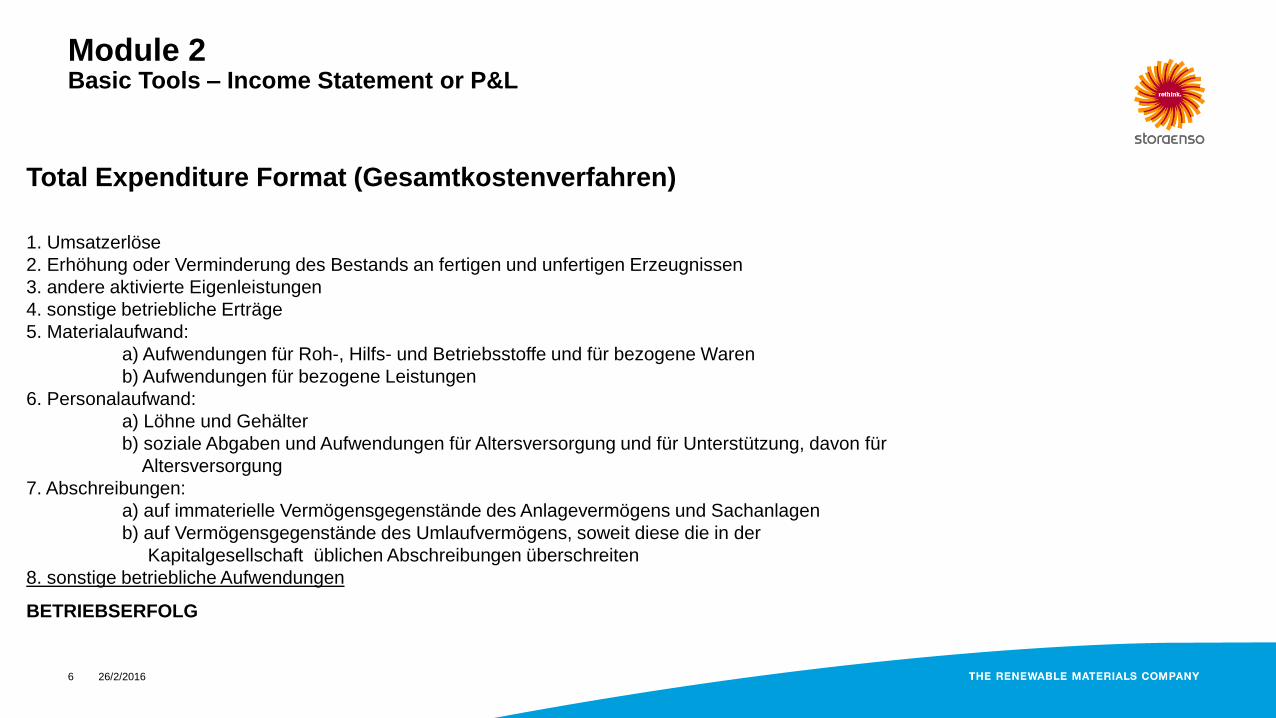
Total Expenditure Format (Gesamtkostenverfahren)
1. Umsatzerlöse
2. Erhöhung oder Verminderung des Bestands an fertigen und unfertigen Erzeugnissen
3. andere aktivierte Eigenleistungen
4. sonstige betriebliche Erträge
5. Materialaufwand:
a) Aufwendungen für Roh-, Hilfs- und Betriebsstoffe und für bezogene Waren
b) Aufwendungen für bezogene Leistungen
6. Personalaufwand:
a) Löhne und Gehälter
b) soziale Abgaben und Aufwendungen für Altersversorgung und für Unterstützung, davon für
Altersversorgung
7. Abschreibungen:
a) auf immaterielle Vermögensgegenstände des Anlagevermögens und Sachanlagen
b) auf Vermögensgegenstände des Umlaufvermögens, soweit diese die in der
Kapitalgesellschaft üblichen Abschreibungen überschreiten
8. sonstige betriebliche Aufwendungen
BETRIEBSERFOLG

26/2/2016 7
Module 2 Basic Tools – Income Statement or P&L
Cost of Sales Format (Umsatzkostenverfahren)
1. Umsatzerlöse
2. Herstellungskosten der zur Erzielung der Umsatzerlöse erbrachten Leistungen
3. Bruttoergebnis vom Umsatz
4. Vertriebskosten
5. allgemeine Verwaltungskosten
6. sonstige betriebliche Erträge
7. sonstige betriebliche Aufwendungen
BETRIEBSERFOLG 8. Erträge aus Beteiligungen,
davon aus verbundenen Unternehmen
9. Erträge aus anderen Wertpapieren und Ausleihungen des Finanzanlagevermögens,
davon aus verbundenen Unternehmen
10. sonstige Zinsen und ähnliche Erträge, davon aus verbundenen Unternehmen
11. Abschreibungen auf Finanzanlagen und auf Wertpapiere des Umlaufvermögens
12. Zinsen und ähnliche Aufwendungen, davon an verbundene Unternehmen
13. Ergebnis der gewöhnlichen Geschäftstätigkeit
14. außerordentliche Erträge
15. außerordentliche Aufwendungen
16. außerordentliches Ergebnis
17. Steuern vom Einkommen und vom Ertrag
18. sonstige Steuern
19. Jahresüberschuß/Jahresfehlbetrag

26/2/2016 8
Module 2 Basic Tools – Income Statement or P&L
Total Expenditure Format (Gesamtkostenverfahren)
• Shows the total performance and all costs for a selected period
with change in inventories
• Expenses are shown according to their origin (material,
personnel, maintenance, etc.)
Cost of Sales Format (Umsatzkostenverfahren)
• Shows the cost of goods sold (COGS) for a selected period
• Expenses are shown according to functions (production,
general & administration, sales)
Regarding 1) Financial result, 2) extraordinary items and 3)
taxes, both methods have the same structure and results.

26/2/2016 9
Module 2 Basic Tools – Income Statement or P&L
– Contribution margin: The contribution margin is the amount that
remains of our sales after deducting all variable costs. It is used to cover
fixed costs and eventually to make profits.
Gross Sales
- Sales deductions (rebates, cash discounts,..)
Net sales
- Freight costs, Commissions,..
- Variable Costs .
Contribution margin
– Can also be expressed as %-age of sales, i.e. a contribution margin of
15% indicates that out of 1Euro sales, 15 cents remain for coverage of
fixed costs
– Contribution margin can also be shown in several steps by allocating fixed
costs to articles, article groups, business areas,…

26/2/2016 10
Module 2 Basic Tools – Income Statement or P&L
Practical Example VBW:
Opern- und Musicalproduktionen in drei Häusern: Theater a.d. Wien (TAW),
Raimund Theater (RAI), Ronacher (RON)
Besucher: RON: 150.000; RAI 250.000; TAW 80.000
Kosten Intendanz: Musical: 600.000€; Oper: 500.000€
Leading Team Kosten: RON: 300T€; RAI: 350T€; TAW: 500T€
Produktionsausstattung:
RON: Bühne (450T€); Ton (50T€); Licht (50T€); Kostüm (200T€)
RAI: Bühne (500T€); Ton (50T€); Licht (50T€); Kostüm (200T€)
TAW: Bühne (600T€); Ton (50T€); Licht (50T€); Kostüm (300T€)
Personalkosten Haustechnik: RON: 25 Personen; RTH: 30 Personen; TAW: 20
Personen (durchschnittliche Kosten: 60.000€ / Person)
Orchester: RON: 10 Personen; RAI: 15 Personen; TAW: 20 Personen
(Durchschnittskosten pro Person: 60.000€)

26/2/2016 11
Module 2 Basic Tools – Income Statement or P&L
Practical Example VBW:
Opern- und Musicalproduktionen in drei Häusern: Theater a.d. Wien (TAW),
Raimund Theater (RAI), Ronacher (RON)
Technik (produktionsbezogene Überstunden): RON: 10.000h; RAI: 12.000h;
TAW: 6.000h (durchschnittliche Kosten: 30€/h)
Marketing (produktionsbezogen): RON: 300T€; RTH: 450T€; TAW: 600T€
Hausbezogener Materialaufwand: RON: 400T€; RTH: 350T€; TAW: 300T€
Durchschnittlicher Ticketpreis: RON: 45€; RAI: 50€; TAW 60€
Personalkosten FM Haus: RON: 25 Personen; RTH: 30 Personen; TAW: 20
Personen (durchschnittliche Kosten: 40.000€ / Person)
Cast: RON: 2.750T€; RAI: 3.125T€; TAW: 2.000T€
Overhead: Sonstiger Aufwand (Material, bezogene Leistungen): 2.500T€;
Zentrale Technik: 1.000T€; Zentrales FM: 700T€; Generaldirektion: 1.500T€

26/2/2016 12
Module 2 Basic Tools – Income Statement or P&L
1000 CUR
Sales, sawngoods Ext
Sales, sawngoods Int Prod unit
Sales, sawngoods Int Sales unit
Sales, distribution Ext
Sales, distribution Int
End Product Sales
Sales, by-products Ext
Sales, by-products Int
Sales, logs Ext
Sales, logs Int
Wood Sales
Energy Sales
FX on Sales and Operative Receivables
Sales of Stora Enso Products
Transportation & Freight Sales
Commission Income
Maintenance Materials & Services Income
Other Sales
FX cashflow hedge derivatives
Sales of Stora Enso Services and other
Sales non Stora Enso products
SALES
Transportation & Freight Costs, sawn
Transportation & Freight Costs, by-products
Transportation & Freight Costs, other
Transportation & Commissions Costs
Commission costs, sawn
Commission costs, other Total
Commission costs
SALES AT MILL PRICE
Change in Finished Goods Inventory & WIP
Change in net value of biological assets
Other Operating Income, other Ext
Other Operating Income, other Int
Wood costs
By-product purchases Total
Energy costs TOT
Supplied sawn goods Total
Other purchases, production Total
Other purchases, distribution Total
End Product Purchases
Chemicals & fillers costs
Packaging material
Other Operating Variable Costs
Total variable costs, CUR
Practical example – Stora Enso:
1) How big is the contribution
margin?
2) How big is the margin %-age?
24.849
1.450
67
0
0
26.366
868
0
0
0
868
0
3
27.237
0
0
0
0
0
0
0
27.237
-9
-24
0
-33
0
0
0
27.205
6
0
48
0
0
0
-357
-14.471
0
0
-14.471
-1.269
-96
0
-16.193

26/2/2016 13
Module 2 Basic Tools – Income Statement or P&L
– Break-Even Analysis: The break-even point defines the sales
volume which is needed to cover all costs, i.e. neither produces a
profit nor a loss.
Break Even Point means:
Profit = 0
Fixed costs = Total contribution margin
Revenues = Total costs
Profitability increase by:
– Increase of Sales
– Improvement of Contribution Margin (price increase, reduction of
variable costs, improved product mix)
– Reduction of Fixed costs
– Capacity Reduction

26/2/2016 14
Module 2 Basic Tools – Income Statement or P&L
– Break-Even Analysis:
Break Even Point (Vol) = Fixed costs / Contribution margin per piece
Break Even Point (Value) = Fixed costs / Contribution margin %-age
Safety margin [value] = (Planned sales-Minimum sales) / Planned sales * 100
Safety margin [volume] = (Planned volume-Minimum volume) / Planned volume * 100
Targeted Turnover = (Fixed costs + Profit) / Contribution margin %-age

26/2/2016 15
Module 2 Basic Tools – Income Statement or P&L
Example 2:
A company has the following planned parameters:
Sales volume: 2.000 bicycle shoes
Production volume: 2.300 shoes
Variable costs/shoe: 120EUR
Net sales / shoe: 180EUR
Fixed costs: 110.000EUR
1) How big is the minimum sales value?
2) How big is the minimum sales volume?
3) What are the safety margins?
4) Return of Sales?
5)The owner's target is a profit of 9TEUR. Which turnover is necessary?
6) How much additional sales are necessary if a new sales rep is employed for 25.000EUR p.a.?
7) The head of sales suggests a 5% price decrease. How many % more sales is the minimum requirement?

26/2/2016 16
Module 2 Basic Tools – Income Statement or P&L
Practical example – Stora Enso:
1) Minimum sales value?
2) Minimum sales volume?
3) Safety margins?
4) ROS?
Wages and Salaries, Production
Wages and Salaries, Maintenance
Wages and Salaries, Admin
Personnel costs
Maintenance Materials Total
Maintenance Services
Maintenance materials & services costs
Other fixed costs, excl. production cost Total
Other fixed costs, incl. in production cost Total
Contractors costs (log/truck/other)
Other fixed costs, admin
Other fixed costs, cost pool
Bad debts and credit losses
Wood proc related fixed
Other fixed costs total
Total fixed costs, CUR
-254
-44
-27
-324
-45
-3
-48
-8
-257
0
-8
-115
-66
0
-454
-826
Total invoicing, m3 6.814
Mill net price Total wo hedging CUR/m3 (ext) 429,38
Total variable costs, CUR -306,69

26/2/2016 17
Module 2 Basic Tools – Income Statement or P&L
Plan P&L Example 3:
A company has the following planned parameters:
Production volume: 8.100 aero-helmets
Sales volume: 8.000 aero-helmets
Net sales / helmet: 240EUR
Production time / helmet: 15min
Production wages / hour: 130EUR
Overhead production costs: 100%
Production materials / helmet: 28EUR
Overhead production materials / helmet: 3EUR
Basis for overhead material costs are production materials and for overhead production
costs the production wages.
Fixed costs: Personnel 150.000EUR
Other fixed costs 100.000EUR
Depreciation 190.000EUR
Interest costs 60.000EUR
1)Establish a plan P&L (Gesamtkostenverfahren)
2)Calculate the ROS

26/2/2016 18
Module 2 Basic Tools – Kostenarten (Cost elements), Kostenstellen (Cost centers), Kostenträger (Cost unit)
Kostenarten (Cost Elements): Kategorisierung nach der Natur der Kosten
Exkurs: Österreichischer Kontenrahmen
Kontenklasse:
0 Anlagevermögen
1 Vorräte und unfertige Aufträge Bestandskonten
2 Sonstiges UV und RAP
3 Verbindlichkeiten, RSt, RAP
4 Betriebliche Erträge
5 Materialaufwand und Aufwand für bez Leistungen
6 Personalaufwand Erfolgskonten
7 Abschreibungen und sonst betr Aufwendungen
8 Finanzkonten, Ao Erträge / Aufwendungen, Steuern
9 Kapitalkonten, Abschlußkonten

26/2/2016 19
Module 2 Basic Tools – Kostenarten (Cost elements), Kostenstellen (Cost centers), Kostenträger (Cost unit)
Kostenstellen (Cost Centers): Wo sind die Kosten angefallen?
6871206 Management
6871211 Construction
6871212 Post & Beam
6871213 Sales office CE
6871214 Light Frame
6871215 Joinery
6871216 Sales SEA
6871217 BL Trading
6871218 Sales administration team
2600 Marketing
2612 Publikationen (Printwerbung)
2613 Aussenwerbung (Plakate)
2614 Medien
2601 Grafik
2604 Kooperationen
2605 Hilfskräfte / Verteiler
2606 Marktforschung

26/2/2016 20
Kostenträger (Cost Units): Wofür sind die Kosten angefallen?
RON
Produktion mit der Endung
12 - bis zur Premiere inkl. Audition
13 - ab (einschließlich) Premiere
51 - Premieren- und Dernièrefeiern
52 - Merchandising
54 - Tonträger
z.B. Tanz der Vampire 3310512
Profit Center Mapping
Stora Enso Wood Products CEU
SAP Company code Profit Center
160 68037 Brand Mill
68038 Brand Post
68237 Ybbs Mill
68238 Ybbs Post
68239 Ybbs CLT
68537 Sollenau Mill
68780 Wood Products Head Office
161 68837 BSL Sawn
68838 BSL CLT
162 68938 SE WP Holzverarb.
Module 2 Basic Tools – Kostenarten (Cost elements), Kostenstellen (Cost centers), Kostenträger (Cost unit)

26/2/2016 21
1)Im Februar 2014 besuchten 32.141 Besucher im Ronacher die Vorstellungen zu "Der Besuch der alten
Dame". Der durchschnittliche Kartenpreis betrug 58,1 €.
2) Im Raimundtheater benötigte der Leiter der Tonabteilung 2.500 € für allgemeines Bühnenmaterial.
3) Für das Ronacher wurde im Jänner Beleuchtungsmaterial i. H. v. 5.000 € angeschafft.
4) Die Versicherung hat für einen Wasserschaden im Theater a.d. Wien 25.000 € überwiesen.
5)Für die Produktion "Der Besuch der alten Dame" wurde in das Bühnenbild investiert (Aufwand: 40.000
€)
6) Die Kostüme der Produktion "Elisabeth" wurden endgereinigt. Kostenpunkt 13.000 €
7)Das Ensemble der Produktion "Der Besuch der alten Dame" bekam im Jänner Probegagen in Höhe von
150.000 € ausbezahlt. (Lohnnebenkosten 30%)
8)Für den Aufbau der Lichtanlage für die neue Opernproduktion im Theater an der Wien wurde
Fremdpersonal benötigt (13.000 €)
9) Im Ronacher wurden neue Saiten für Streichinstrumente angeschafft. 2.500 €
10)Die Versicherung hat die Jahresbeträge für die Feuerversicherung für alle drei Häuser vorgeschrieben
(50.000 € je Haus)
11) Für die Produktion "Der Besuch der alten Dame" mußten 10 Lautsprecher zu je 2.500 € im Februar
angeschafft werden.
12) Die Verpachtung der Kantine brachte 2.100 € ein.
13) Die Wien Energie AG hat dem Raimund Theater eine Stromrechnung übermittelt (10.000 €).
14)Für die Produktion "Der Besuch der alten Dame" mußten 5 weiße Scheinwerfer zu je 5.000 €
angeschafft werden.
15) Im Februar wurden 13.598 Programmhefte (Der Besuch der alten Dame) zu je 6,5 € verkauft.
Module 2 Basic Tools – Kostenarten (Cost elements), Kostenstellen (Cost centers), Kostenträger (Cost unit)
26/2/2016 22
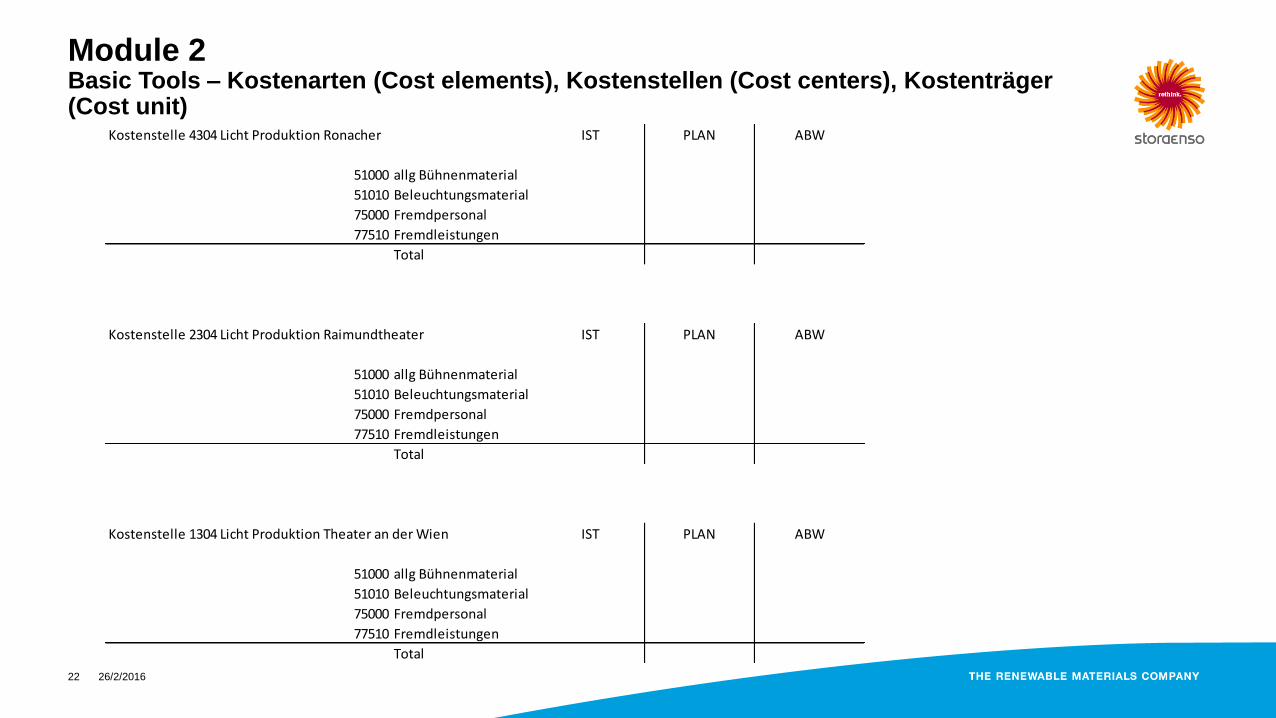
Kostenstelle 4304 Licht Produktion Ronacher IST PLAN ABW
51000 allg Bühnenmaterial
51010 Beleuchtungsmaterial
75000 Fremdpersonal
77510 Fremdleistungen
Total
Kostenstelle 2304 Licht Produktion Raimundtheater IST PLAN ABW
51000 allg Bühnenmaterial
51010 Beleuchtungsmaterial
75000 Fremdpersonal
77510 Fremdleistungen
Total
Kostenstelle 1304 Licht Produktion Theater an der Wien IST PLAN ABW
51000 allg Bühnenmaterial
51010 Beleuchtungsmaterial
75000 Fremdpersonal
77510 Fremdleistungen
Total
Module 2 Basic Tools – Kostenarten (Cost elements), Kostenstellen (Cost centers), Kostenträger (Cost unit)

26/2/2016 23
IST 2014 PLAN 2014 ABW
Erlöse
Kartenerlöse
Sonstige Umsatzerlöse
Total
Ausstattung
Bühne
Ton
Licht
Kostüm
Maske
Total
Musik
Orchester
Musikdirektion
Total
Cast
Solisten / Ensemble
Kinder
Total
Marketing
Marketing
Corporate Communications
Sales Department
Total
Gesamtkosten
Ergebnis
Kostenträger 3313412 Der Besuch der alten Dame
Module 2 Basic Tools – Kostenarten (Cost elements), Kostenstellen (Cost centers), Kostenträger (Cost unit)

26/2/2016 24
Module 2 Basic Tools – Income Statement or P&L – Value Creation and Value Capturing
Perceived Value Costs Value Comp. Profit
benefit created created discount
Quality
Functions/
Reliability
Services
Logs
Personnel
Maintenance
Other
Price
26/2/2016 25
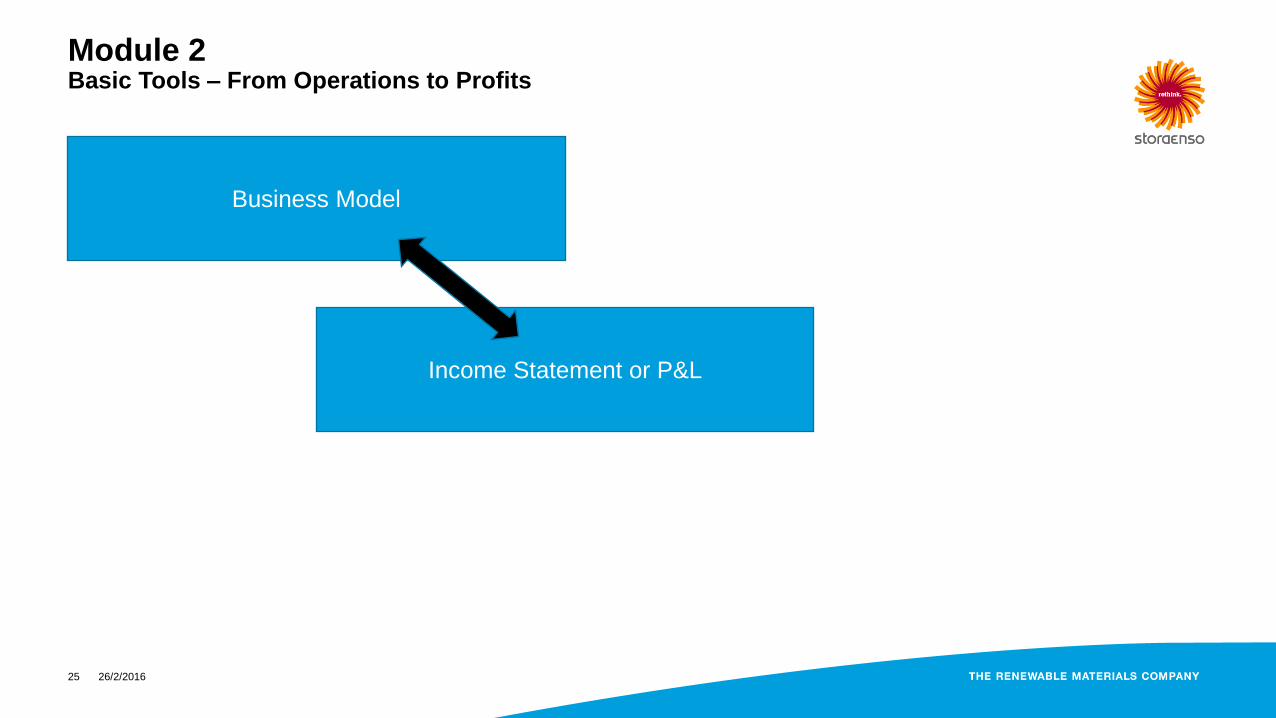
Module 2 Basic Tools – From Operations to Profits
Business Model
Income Statement or P&L
26/2/2016 26
Module 2 Basic Tools – Balance Sheet (B/S)
– One of the major financial statements beside Income Statement
and Cash Flow Statement.
– “Bones” of the financial body.
– Shows the assets and liabilities of a company at a single POINT of
time. “Snapshot of a company's financial condition.”
– Prepared monthly, quarterly and / or annually.
– A standard B/S has three parts:
– Assets
– Liabilities
– Equity

26/2/2016 27
Module 2 Basic Tools – Balance Sheet (B/S)
– ASSETS:
– The left-hand side of a B/S shows how a company uses the
capital given by owners (equity) or external sources (debt). The
assets represent things of value that a company owns and has
in its possession or something that will be received.
– Fixed assets are expected to remain in the use of the
company for a longer period of time (> 1 year).
– Current assets are not expected to remain long in the use
of the company (consumed within 1 year).

26/2/2016 28
Module 2 Basic Tools – Balance Sheet (B/S)

26/2/2016 29
Module 2 Basic Tools – Balance Sheet (B/S)
– EQUITY & LIABILITIES:
– The right-hand side of a B/S shows where the capital of a
company comes from or in other words how the assets are
financed (equity, debt).
– Liabilities are those funds that a company owes to other
external sources. They are used to finance operations and
pay for expansions.
– Equity represents retained earnings and funds contributed
by the company's shareholders.

26/2/2016 30
Module 2 Basic Tools – Balance Sheet (B/S)
26/2/2016 31
Module 2 Basic Tools – Balance Sheet (B/S)
The fundamental B/S equation:
ASSETS = EQUITY + LIABILITIES
– The equation HAS to be always in balance!
– A reasonable mix of equity and liabilities is a must for a financially
healthy company.
Example: Components of the Balance Sheet

26/2/2016 32
Module 2 Basic Tools – Balance Sheet (B/S)
Current
Assets
Invest-
ments
Fixed
Assets
Current
Liabilities
Lt
Liabilities
Equity
How we use our money Where the money comes from
Land
Plant
Equipment
Replacement / Development
Strategic
Accounts receivables
Inventories
Cash
Share Capital
Retained Earnings
Lt Accruals (Pensions,..)
Lt Loans
Accounts payables
St Borrowings

26/2/2016 33
Module 2 Basic Tools – Balance Sheet (B/S)
– Working Capital:
Delta between current assets and current liabilities.
Liquidity indicator: Shows the ability of a company to cover current liabilities
out of its current assets.
– Management approach:
Inventories
+ Accounts receivables
- Accounts payables
Working Capital
Lean working capital management means among others:
decreased costs (inventory space,…)
reduced bad debts
increased cash flow
26/2/2016 34
Module 2 Basic Tools – Balance Sheet (B/S)
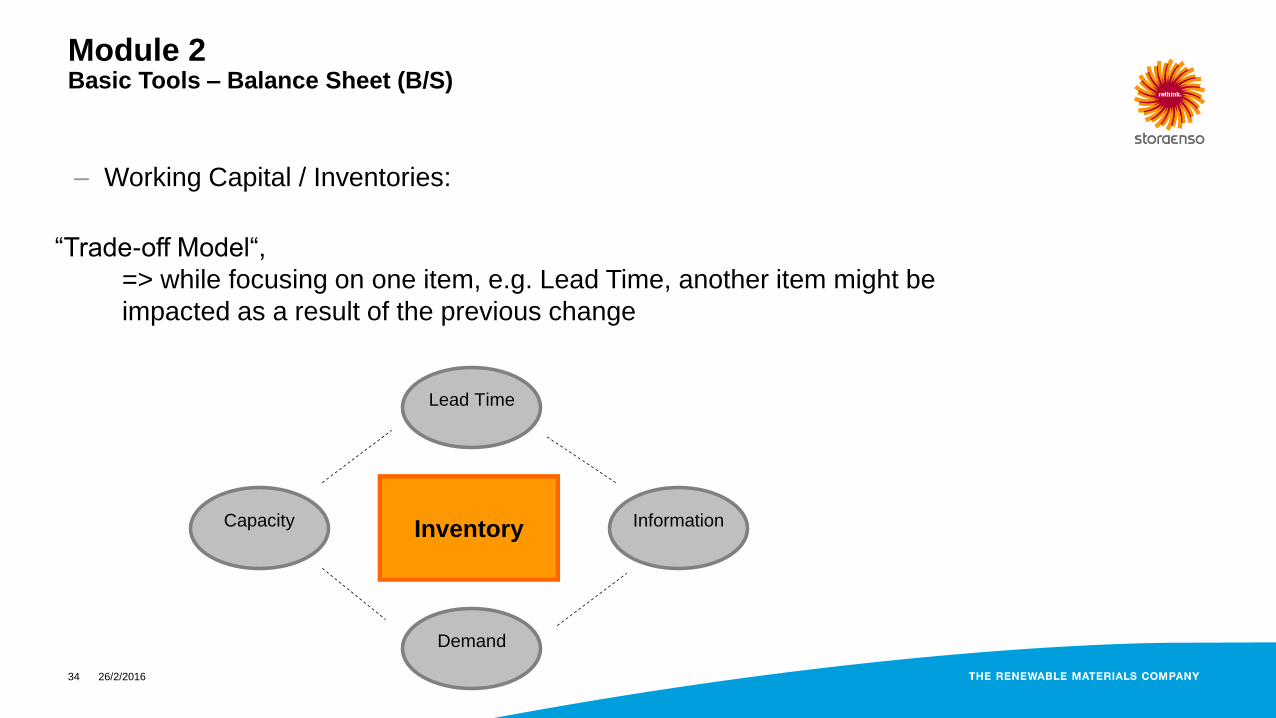
– Working Capital / Inventories:
“Trade-off Model“,
=> while focusing on one item, e.g. Lead Time, another item might be
impacted as a result of the previous change
Inventory InformationCapacity
Lead Time
Demand

26/2/2016 35
Module 2 Basic Tools – Balance Sheet (B/S)
– Working Capital / Inventories:

26/2/2016 36
Module 2 Basic Tools – Balance Sheet (B/S)
– Working Capital / Accounts receivables:
– A tight receivables management is more than ever important to
prevent revenue leakage and bad debts to occur!
– Sales is interested in selling (and not in administration of
outstanding receivables…).
– Payment terms need to be managed efficiently and reviewed
periodically.
– Cash discounts are expensive tools and need to be handled
restrictively. Example:
Effective cash discount rate = Cash discount rate * 360 / (Term for payment – Cash discount period)

26/2/2016 37
Module 2 Basic Tools – Balance Sheet (B/S)
– Working Capital / Accounts receivables:
WP overdues by days31.12.2015 € thousand
Month 1 - 3 4 -14 15 - 30 31 - 60 61 - 90 91 - 120 + 120 Total O/D All rec O/D %Dec 14 3.367 6.332 3.429 1.863 2.187 367 0 17.551 119.778 14,65%
Jan 15 3.137 3.826 3.352 3.882 820 510 0 15.533 118.592 13,10%
Feb 15 2.588 2.467 3.586 1.830 2.843 651 420 14.402 143.567 10,03%
Mar 15 2.974 2.665 2.269 2.937 1.302 2.602 696 15.448 144.817 10,67%
Apr 15 931 2.868 1.138 1.293 1.886 1.100 26 9.244 144.601 6,39%
May 15 4.915 7.105 2.584 846 468 1.785 944 18.645 161.986 11,51%
Jun 15 2.194 2.949 1.498 837 212 8 2.401 10.088 155.490 6,49%
Jul 15 3.288 2.702 1.235 730 306 158 1.239 9.661 135.976 7,10%
Aug 15 3.968 3.902 1.040 1.152 152 20 441 10.678 123.062 8,68%
Sep 15 2.769 2.773 974 1.033 98 6 450 8.104 135.488 5,98%
Oct 15 3.891 2.437 1.181 1.137 241 1 454 9.349 138.390 6,76%
Nov 15 2.846 2.641 1.337 875 148 16 444 8.303 139.249 5,96%
Dec 15 2.713 4.238 1.813 1.191 197 73 115 10.334 108.931 9,49%
AVG 15 3.018 3.381 1.834 1.479 723 578 636 11.649 137.512 8,47%
AVG 14 4.075 4.735 3.563 1.768 917 229 216 15.102 155.478 9,71%
AVG 13 3.847 4.890 2.776 1.758 744 223 482 14.726 163.754 8,99%
26/2/2016 38
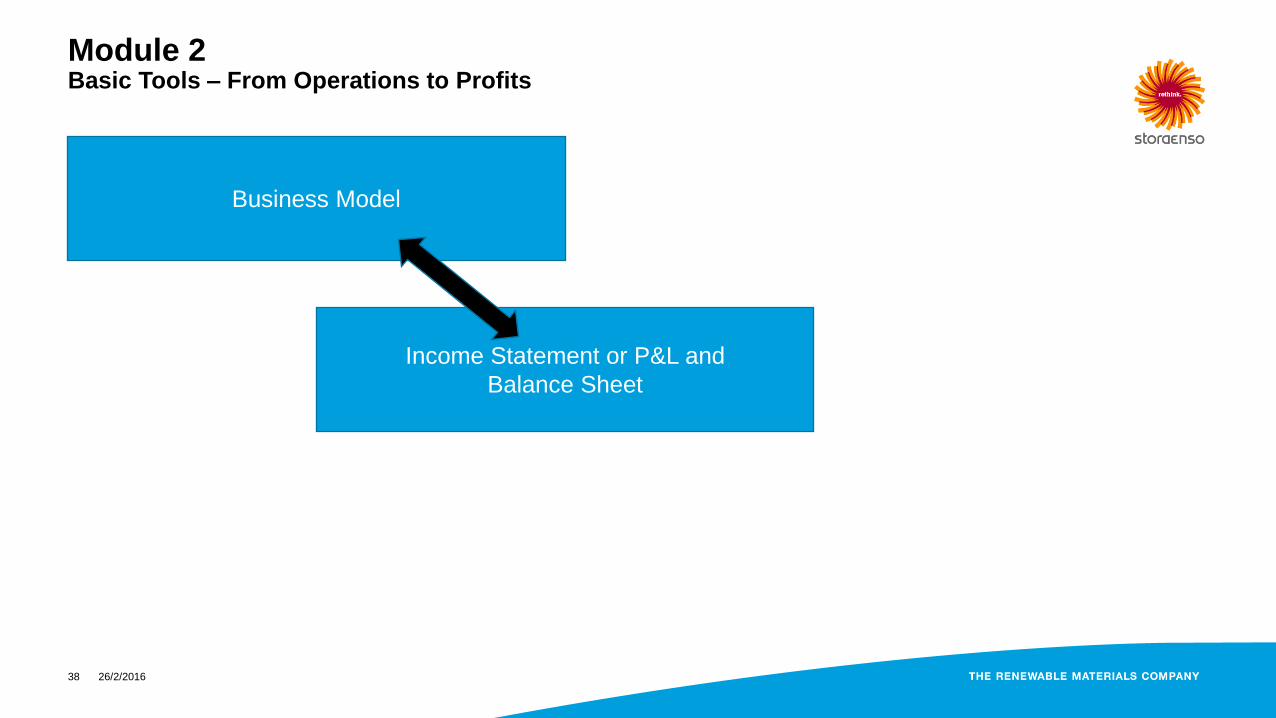
Module 2 Basic Tools – From Operations to Profits
Business Model
Income Statement or P&L and
Balance Sheet

26/2/2016 39
Module 2 Basic Tools – Cash Flow (CF)
– One of the major financial statements beside Income Statement
and Balance Sheet.
– “Blood” of the financial body.
– Shows the flow of cash in and cash out of the business. It reflects
a company's liquidity during a PERIODE of time.
– Prepared monthly, quarterly and / or annually.
– A standard Cash Flow statement has three parts:
– CF from operating activities
– CF from investing activities
– CF from financing activities

26/2/2016 40
Module 2 Basic Tools – Cash Flow (CF)

26/2/2016 41
Module 2 Basic Tools – Cash Flow (CF)
Jahresüberschuss/-fehlbetrag nach Steuern
+ Abschreibungen auf das Anlagevermögen
- Zuschreibungen zum Anlagevermögen
+/- Gewinn (-) / Verlust (+) aus dem Abgang von Anlagevermögen
+/- Zunahme (+) / Abnahme (-) lfr Rückstellungen
= Cash Flow aus dem Ergebnis (cash earnings)
+/- Zunahme (-) / Abnahme (+) der Vorräte
+/- Zunahme (-) / Abnahme (+) der Forderungen LuL
+/- Zunahme (-) / Abnahme (+) sonstiger Aktiva und ARA
+/- Zunahme (+) / Abnahme (-) der kfr Rückstellungen
+/- Zunahme (+) / Abnahme (-) der Verbindlichkeiten LuL
+/- Zunahme (+) / Abnahme (-) sonstiger Passiva und PRA
= Cash Flow Operating Activities
- Investitionen
- Aktivierte Eigenleistungen
+ Buchwert abgegangener Anlagen
+/- Gewinn (+) / Verluste (-) aus dem Abgang von Anlagevermögen
+/- Erhöhung (-) / Verminderung (+) der Finanzdarlehen an verbundene Unternehmen
= Cash Flow Investing Activities
+ Einzahlungen von den Gesellschaftern
- Auszahlungen an die Gesellschafter
+/- Erhöhung (+) / Tilgung (-) von Finanzkrediten und Anleihen
= Cash Flow Financing Activities
Veränderung des Finanzmittelbestandes

26/2/2016 42
Module 2 Basic Tools – Cash Flow (CF)
“Cash is King!”
A lot of capital is usually tied up in receivables and inventory.
Importance to optimize working capital level becomes more evident than
in the past.
Longer term, companies need to create a culture in which everyone takes
responsibility for the balance sheet!
There are six common mistakes that companies make in managing cash:
1. Don't manage to the income statement.
2. Don't reward the sales force for growth alone.
3. Don't overemphasize production quality.
4. Don’t tie receivables to payables.
5. Don’t manage by current and quick ratios.
6. Don’t benchmark competitors.

26/2/2016 43
Module 2 Basic Tools – From Operations to Profits
Business Model
Income Statement or P&L and
Balance Sheet and Cash Flow Statement

26/2/2016 44
Module 2 Basic Tools – Cash Flow (CF)
– A CF-statement is tied to the P&L and B/S via net earnings and
depreciation (P&L) on the one side and via working capital, fixed asset
investments, etc. (B/S) on the other side.
P&L:
Sales
+/- Change in inv
- Variable costs
- Fixed costs
- Depreciation
= Operating Profit
B/S:
Fixed Assets Equity
Inventories Accruals
Trade Receivables Trade payables
CF:
Operating Profit
+ Depreciation
+/- Change in inventories
+/- Change in Receivables
+/- Change in Payables
26/2/2016 45
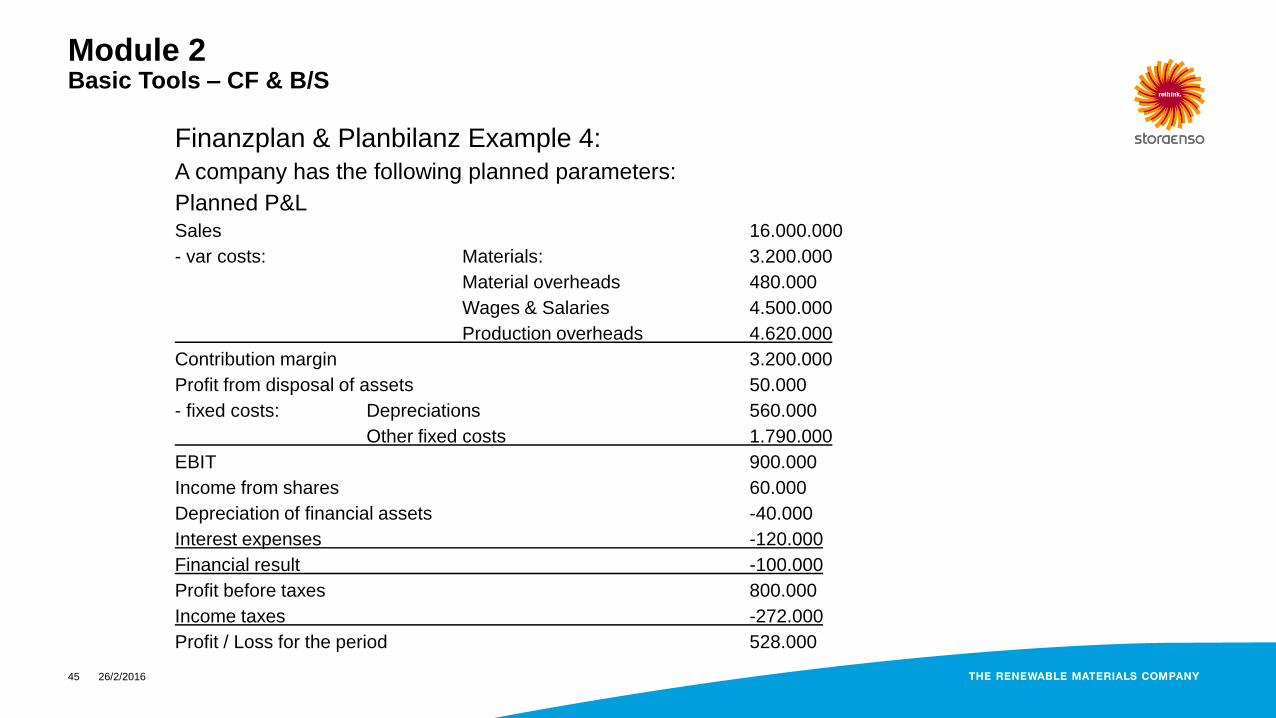
Module 2 Basic Tools – CF & B/S
Finanzplan & Planbilanz Example 4:
A company has the following planned parameters:
Planned P&L Sales 16.000.000
- var costs: Materials: 3.200.000
Material overheads 480.000
Wages & Salaries 4.500.000
Production overheads 4.620.000
Contribution margin 3.200.000
Profit from disposal of assets 50.000
- fixed costs: Depreciations 560.000
Other fixed costs 1.790.000
EBIT 900.000
Income from shares 60.000
Depreciation of financial assets -40.000
Interest expenses -120.000
Financial result -100.000
Profit before taxes 800.000
Income taxes -272.000
Profit / Loss for the period 528.000

26/2/2016 46
Module 2 Basic Tools – CF & B/S
Finanzplan & Planbilanz Example 4: A company has the following planned parameters:
B/S: 31.12. prior year
Fixed Assets 5.750.000 Equity 4.000.000
Inventory
Raw mat
Fin goods
1.200.000
900.000
Retained
earnings
890.000
Accounts
receivables
1.500.000 Profit of the
year
420.000
Cash /
banks
230.000 Accruals 880.000
Accounts
payables
1.200.000
Liab banks LT 2.100.000
Liab banks ST 90.000
Total Assets 9.580.000 Total Liabilities 9.580.000

26/2/2016 47
Module 2 Basic Tools – CF & B/S
Finanzplan & Planbilanz Example 4: A company has the following planned parameters:
•Raw material purchases: 3.100.000
•Trade receivables turnover: 13,33 (including 20% VAT)
•Trade payables are reduced by 150.000EUR
•The plan P&L includes a LT accrual of 80.000EUR (Abfertigung &
Pensionen)
•The B/S includes a tax accrual of 80.000EUR which is used as
planned.
•Tax prepayments (Köstvorauszahlung) are 250.000EUR.
•An investment of a machine (900.000EUR) is planned. 1/3 is financed
by a new loan. Depreciations are included in the plan P&L.
•LT Loans of 130.000EUR have to be paid back in the planning period.
•Retained earning (Gewinnrücklage) of 48.000EUR should be booked.
•A dividend of 400.000EUR is to be paid.
•A positive or negative liquidity should be used to balance ST bank
accounts. LT…long-term
ST…short-term
26/2/2016 48
Module 2 Basic Tools – Key Performance Indicators
Key performance indicators (KPIs) are high-level snapshots of a
business based on specific predefined measures.
KPIs should be:
Specific
Measurable
Acceptable
Realistic
Timely
Should reflect the critical success-factors of a company variations
between different industries possible.

26/2/2016 49
Module 2 Basic Tools – Key Performance Indicators
Key performance indicators (KPIs) in the wood-products industry (example
Stora Enso):
KPIs connected to the P&L:
Return on Sales (ROS) = Operating Profit / Sales *100
Return on Capital Employed (ROCE) = Operating Profit / Operating capital *100
Personnel intensity = Personnel costs / Sales *100
Maintenance intensity = Maintenance costs / Sales *100
Raw material intensity = Raw material costs / Sales * 100

26/2/2016 50
Module 2 Basic Tools – Key Performance Indicators
Key performance indicators (KPIs) in the wood-products industry (example
Stora Enso):
KPIs connected to the B/S:
Inventory turnover ratio = Sales or COGS / (Average) Inventory
Inventory turnover days = 365/ Inventory turnover ratio (also called DIOH)
Receivables turnover ratio = Net Sales / (Average) Accounts receivables
Receivables turnover days = 365 / Receivables turnover ratio (also called DSO)
Payables turnover ratio = Purchases / (Average) Accounts payables
Payables turnover days = 365 / Payables turnover ratio (also called DPO)
Working Capital turnover = Sales / Working Capital
Relationship between the money used to fund operations
and the sales generated from these operations.

26/2/2016 51
Module 2 Basic Tools – Key Performance Indicators
Key performance indicators (KPIs) in the wood-products industry (example
Stora Enso):
KPIs connected to the B/S (continued):
Equity ratio = Owners equity / Total assets (Eigenkapitalquote)
Fixed Assets usage = accumulated depreciation / acquisition costs
(Anlagenabnützungsgrad)
Golden B/S rule: Fixed assets should be financed by equity (narrow) or equity +
long term liabilities (wider) (Goldene Bilanzregel)

26/2/2016 52
Module 2 Basic Tools – Key Performance Indicators
Key performance indicators (KPIs) in the wood-products industry (example
Stora Enso):
KPIs connected to the CF:
Cash Flow margin = Operating Cash Flow / Sales * 100
Gearing ratios:
Debt / Cash Flow
Debt / Equity (also known as debt to equity ratio)
Cash Flow KPIs are currently not used in monthly reporting.

26/2/2016 53
Module 2 Basic Tools – From Operations to Profits to Asset based Profitability
Business Model
Income Statement or P&L and
Balance Sheet and Cash Flow Statement
ROE and ROCE

26/2/2016 54
Module 2 Basic Tools – From Operations to Profits to Asset based Profitability
Return on
Equity
Profit
Margin
Capital
Turnover
Leverage
Ratio
Net income
Equity
Net income
Revenues
Revenues
Assets
Assets
Equity
How good are
we in translating
revenues into
profits?
How many units
of sales can we
squeeze out of
one unit of
assets?
How much debt
(i.e. borrowed
resources) do we
use?

26/2/2016 55
Module 2 Basic Tools – From Operations to Profits to Asset based Profitability
Operational
ROCE
Operating
Profit
Operating
Capital
100 Higher ROCE means more efficient
use of Assets to generate earnings.

26/2/2016 56
Module 2 Basic Tools – Value Creation
Provide Capital
Providers with a
reasonable rate of
return - WACC
Buy Capital
Assets ROCE
For each € Pay WACC Get ROCE
EVA = (ROCE – WACC) * IC

26/2/2016 57
Module 2 Basic Tools – From Operations to Profits to Asset based Profitability
Operating
Profit
Sales
Operating
Profit
Operating
Capital
ROCE
Sales
Operating
Capital
Sales
Assets
Sales
EBIT
Sales
Total Costs
Prices
Volume
Mix
Working
Capital
Fixed
Assets
Cash
Inventories
A/R
A/P
Var Costs
Fixed Costs
Strategic Drivers!!!

26/2/2016 58
Module 2 Basic Tools – From Operations to Profits to Asset based Profitability
Operating
Profit
Sales
Operating
Profit
Operating
Capital
ROCE
Sales
Operating
Capital
Sales
Assets
Sales
EBIT
Sales
Total Costs
Prices
Volume
Mix
Working
Capital
Fixed
Assets
Cash
Inventories
A/R
A/P
Var Costs
Fixed Costs
Increase EBIT
Decrease Capital Employed

26/2/2016 59
Module 2 Basic Tools
Financial Concepts:
– Efficiency in value creation (ROCE > WACC)
– Strength to cope with uncertainty (D/E, Equity ratio)
– Ability to reward stakeholders (Cash)
MUST: Ability to cope with all three dimensions

26/2/2016 60
Module 2 Basic Tools – Key Performance Indicators