control your money. preserve your wealth. build … · a remarkably different wealth management...
TRANSCRIPT

CONTROL YOUR MONEY. PRESERVE YOUR WEALTH. BUILD YOUR FUTURE.
A REMARKABLY DIFFERENT WEALTH MANAGEMENT EXPERIENCE.

EXPAT’S ETF FAMILY: AN INNOVATIVE WAY TO INVEST IN THE CEE REGION
Frankfurt, 10 July 2018
Nicola Yankov, Managing Partner Expat Asset Management
Lachezar Dimov, Chief Investment Officer Expat Asset Management

ABOUT EXPAT ASSET MANAGEMENT
• The largest independent asset management company in Bulgaria• The only ETF provider from the CEE region and one of the 29 ETF
issuers on the Frankfurt Stock Exchange• Managing 11 ETFs tracking the performance of major equity indices
in the CEE region, 700+ individual investment portfolios, 3 mutual funds with global focus, 1 REIT
• A team of professionals with diverse international education and experience
• Optimized cost-effective solutions with first-mover advantage in niche categories
3

EXPAT – THE ETF OPERATOR IN THE CEE REGION
4

EXPAT –THE ETF OPERATOR IN CENTRAL AND EASTERN EUROPE
5

EXPAT – THE ETF OPERATOR IN CEE
Expat Asset Management intends to become the leader in the ETF management industry in the CEE region. We have launched 11 ETFs:
Country Expat fund Index Ticker1 Poland EXPAT POLAND WIG20 UCITS ETF WIG20 on the Warsaw Stock Exchange PLX2 Czech Republic EXPAT CZECH PX UCITS ETF PX on the Prague Stock Exchange CZX3 Slovakia EXPAT SLOVAKIA SAX UCITS ETF SAX on the Bratislava Stock Exchange SK9A4 Hungary EXPAT HUNGARY BUX UCITS ETF BUX on the Budapest Stock Exchange HUBE5 Slovenia EXPAT SLOVENIA SBI TOP UCITS ETF SBI TOP on the Ljubljana Stock Exchange SLQX6 Croatia EXPAT CROATIA CROBEX UCITS ETF CROBEX on the Zagreb Stock Exchange ECDC7 Serbia EXPAT SERBIA BELEX15 UCITS ETF BELEX15 on the Belgrade Stock Exchange ESNB8 Macedonia EXPAT Macedonia MBI10 UCITS ETF MBI10 on the Macedonian Stock Exchange MKK19 Romania EXPAT ROMANIA BET UCITS ETF BET on the Bucharest Stock Exchange ROX
10 Bulgaria EXPAT BULGARIA SOFIX UCITS ETF SOFIX on the Bulgarian Stock exchange BGX11 Greece EXPAT GREECE ASE UCITS ETF ATHEX Composite on the Athens Stock Exchange GRX
6
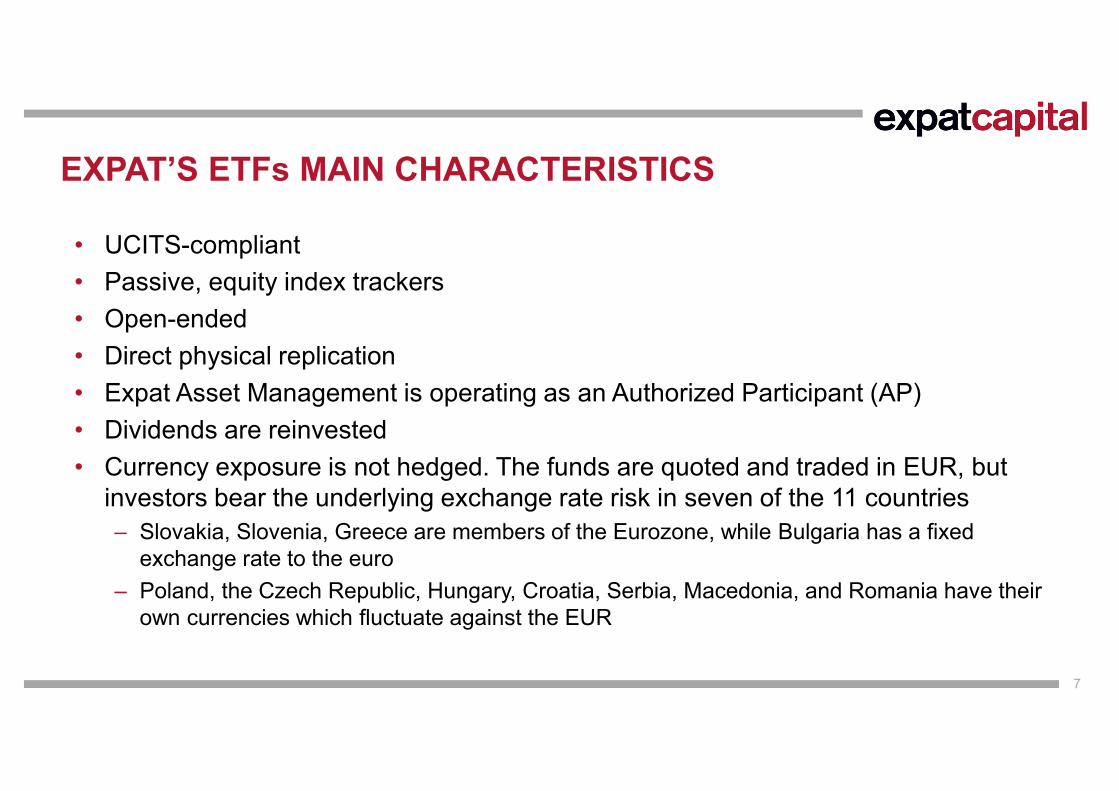
EXPAT’S ETFs MAIN CHARACTERISTICS
• UCITS-compliant• Passive, equity index trackers• Open-ended• Direct physical replication• Expat Asset Management is operating as an Authorized Participant (AP)• Dividends are reinvested• Currency exposure is not hedged. The funds are quoted and traded in EUR, but
investors bear the underlying exchange rate risk in seven of the 11 countries– Slovakia, Slovenia, Greece are members of the Eurozone, while Bulgaria has a fixed
exchange rate to the euro– Poland, the Czech Republic, Hungary, Croatia, Serbia, Macedonia, and Romania have their
own currencies which fluctuate against the EUR
7
TRADING ON SECONDARY MARKET (1)
• Expat Asset Management as an AP – innovation for these relatively illiquid underlying markets
• The market-makers provide quotes on the secondary market and:– No need to hedge via derivatives or complicated strategies using basket of
securities– No need to be set up with a local broker, local depository and hold the underlying
assets which could be difficult, costly and time consuming– No liquidity risk associated with the underlying stocks– No need to hold a large book – for day to day retail trading we suggest a 50’000 to
100’000 shares book will be sufficient– For larger amounts the market-makers could always ask the AP for a quote
8

TRADING ON SECONDARY MARKET (2)
• How is this all done?• The market-makers could hedge/close their position with Expat Asset
Management if they don’t want to bear the market risk until the end of the trading session
• Expat Asset Management provides OTC quotes constantly, even after the trading session
• Amounts have to be comprised of minimum pieces of 100’000 shares• All hedging/closing trades will be cash trades with cash settlement• Expat Asset Management could also accept basket of underlying
securities and create and/or redeem “in-kind”
9

TRADING ON PRIMARY MARKET
• The ETFs are open-ended– Expat Asset Management can issue or redeem any number of shares on a daily
basis– For market-makers/distributors the price of the trades will be NAV per share at end
of the trading day– The market-makers/distributors could add mark-up when they are quoting to their
clients• The primary market is also open to institutional investors
– Minimum lots of 100’000 shares– Negotiable subscription/redemption fees up to 2% to stimulate secondary-market
trades and to stimulate OTC trading with the market-makers
10

HOW A POTENTIAL MARKET-MAKER COULD PROFIT FROM EXPAT’S ETFS• We want to stimulate the secondary-market trading and OTC trading
between international investors and the market-makers/distributors:– Market-makers profit from the traded volume and the bid-ask spread– Market-makers/distributors could add mark-up to the quote from the AP towards
the final investor and profit from trading large amounts on a daily basis– As the ETFs are cross-listed, market-makers could arbitrage between the
exchanges and close their position with the AP (Expat)
• We want to stimulate the distribution via primary market so our funds would grow:– Agency fees when distributing our ETFs and accessing the primary market– When AP is accepting basket of securities for creation and redemption, the market-
makers/distributors could gain brokerage fees from their clients for those trades
11

SHOULD THE SIZE AND THE HISTORICAL LIQUIDITY MATTER?• Expat Asset Management is bearing the market risk behind the trades• We invested our time and efforts to set up our funds with all the major
local depositories and brokers and have a large set of tools and connections to hedge our position and provide liquidity
• Example for Expat Bulgaria SOFIX UCITS ETF:– The market liquidity triples after the launch of our pilot project– The retail investors came back to the market– Local institutional investors became more active– Intraday trading was revived
• The size of the funds (as they are in the seeding capital stage) doesn’t matter, the size of the underlying market does.
12

CEE EQUITIES IN THE GLOBAL PORTFOLIO
THE OPPORTUNITY TO INVEST THROUGH ETFS
13

MACROECONOMIC DATA (1)
14
Source: ©IMF, 2018
2017 2018 Est.
Greece 1.4 2
Bulgaria 3.6 3.8
Romania 7 5.1
Macedonia 0 2.8
Serbia 1.8 3.5
Croatia 2.8 2.8
Slovenia 5 4
Hungary 4 3.8
Slovak Republic 3.4 4
Czech Republic 4.3 3.5
Poland 4.6 4.10 1 2 3 4 5 6 7
Greece
Bulgaria
Romania
Macedonia
Serbia
Croatia
Slovenia
Hungary
Slovak Republic
Czech Republic
Poland
Real GDP Growth YoY % Change 2017 to 2018 Est.
2017 2018

MACROECONOMIC DATA (2)
15
Source: ©IMF, 2018
-25
-20
-15
-10
-5
0
5
10
2008 2010 2012 2014 2016 2018
Current account balance (% of GDP)
Slovenia Bulgaria CroatiaHungary Czech Republic PolandGreece Macedonia Slovak RepublicRomania Serbia
0
20
40
60
80
100
120
140
160
180
200
2008 2010 2012 2014 2016 2018
Government gross debt (% of GDP)
Greece CroatiaSlovenia HungarySerbia PolandSlovak Republic MacedoniaRomania Czech RepublicBulgaria
Source: ©IMF, 2018
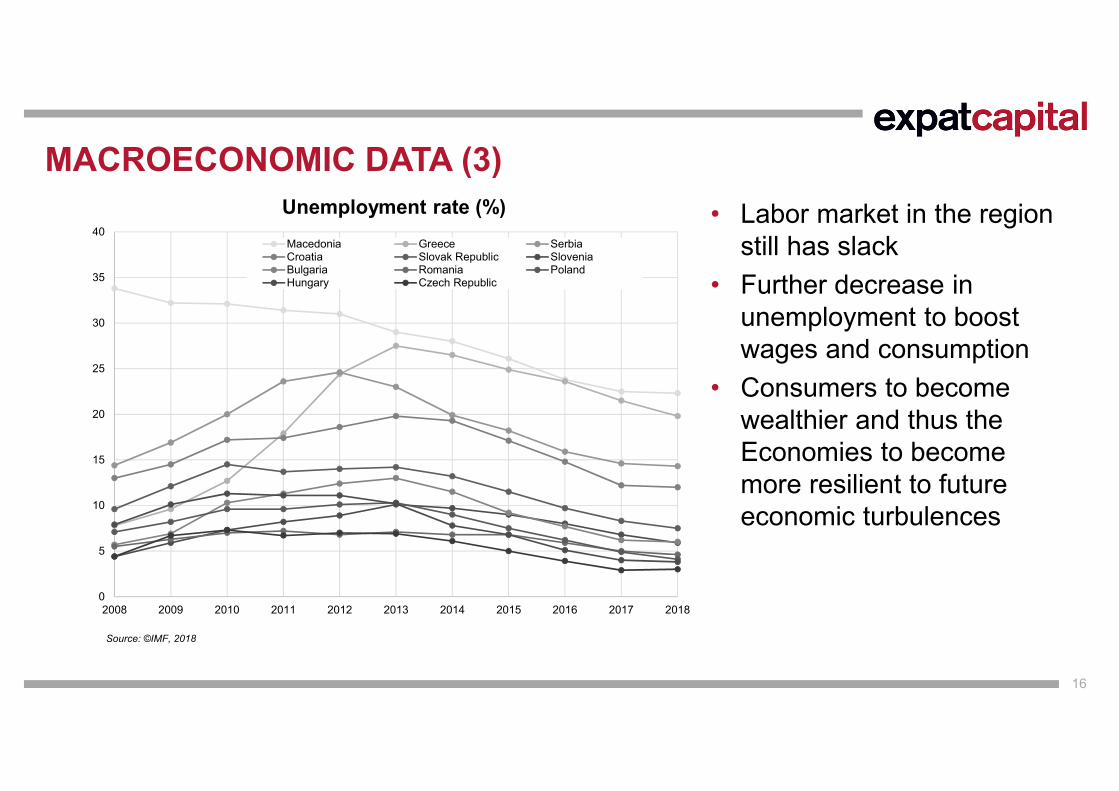
MACROECONOMIC DATA (3)
16
Source: ©IMF, 2018
0
5
10
15
20
25
30
35
40
2008 2009 2010 2011 2012 2013 2014 2015 2016 2017 2018
Unemployment rate (%)Macedonia Greece SerbiaCroatia Slovak Republic SloveniaBulgaria Romania PolandHungary Czech Republic
• Labor market in the region still has slack
• Further decrease in unemployment to boost wages and consumption
• Consumers to become wealthier and thus the Economies to become more resilient to future economic turbulences

FUNDAMENTALS (1)
17
Source: Bloomberg, 2018
Estimated Earnings Growth 2018
Total Debt to Total Assets
Greece N/A 28%
Bulgaria 16% 20%
Romania 3% 15%
Macedonia N/A 5%
Serbia 45% 39%
Croatia 15% 12%
Slovenia 14% 27%
Hungary 13% 6%
Slovak Republic N/A N/A
Czech Republic 12% 38%
Poland 20% 14%
0 50 100 150 200 250 300
Greece
Bulgaria
Romania
Macedonia
Serbia
Croatia
Slovenia
Hungary
Slovak Republic
Czech Republic
Poland
12M Trailing EPS vs Est. EPS 2018
Next Year Estimated EPS 12M Trailing EPS

FUNDAMENTALS (2)
18
• Undiscovered region by international investors
• Higher economic growth to translate potentially in higher earnings
• Low valuations and potential for multiples expansion
Main Index per Country P/E (x) P/B (x) Net Aggregate Dividend Yield
WIG 20 – Poland 11.35 1.18 2.14
PX – Czech Republic 12.81 1.34 5.01
SAX – Slovakia 16.69 2.00 3.64
BUX – Hungary 10.32 1.27 3.03
SBITOP – Slovenia 11.93 0.98 4.92
CROBEX – Croatia 16.21 1.00 2.30
BELEX 15 – Serbia 6.47 0.71 -
MIB 10 – Macedonia 12.67 1.05 3.13
BET – Romania 9.11 0.95 9.16
SOFIX – Bulgaria 12.68 0.64 2.17
Athex Composite – Greece 23.78 0.63 2.57
Source: Bloomberg as of July 2018
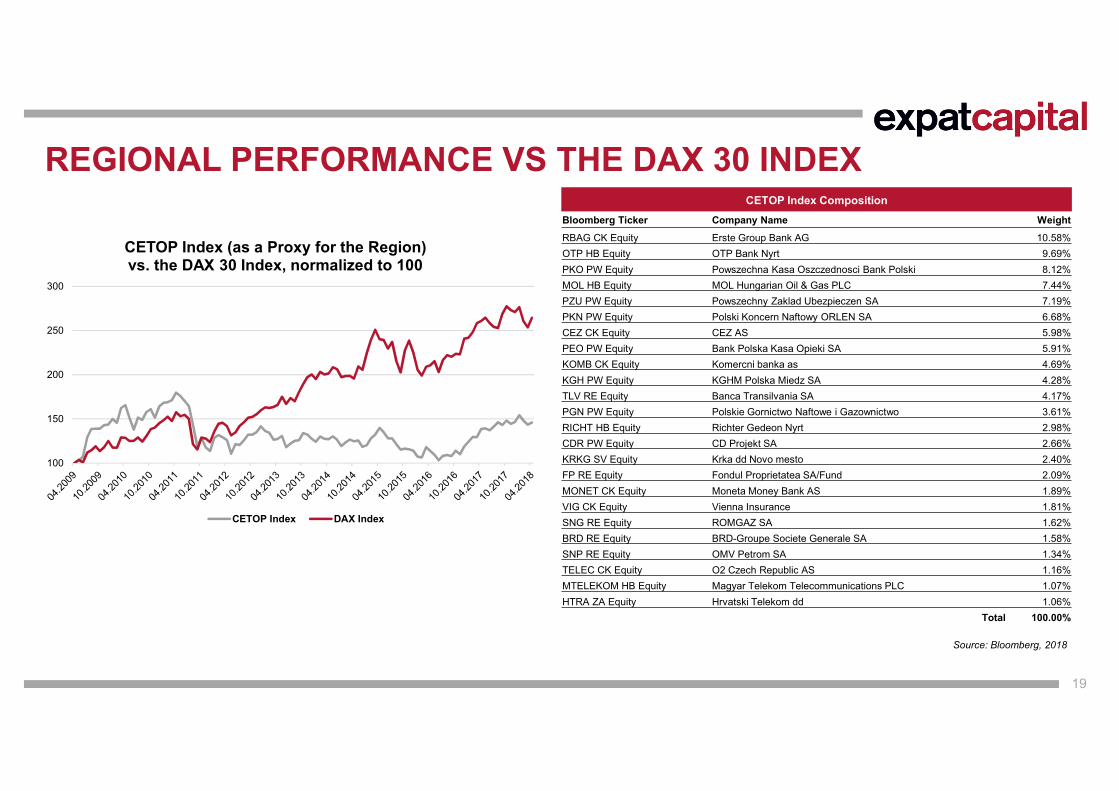
CETOP Index CompositionBloomberg Ticker Company Name WeightRBAG CK Equity Erste Group Bank AG 10.58%OTP HB Equity OTP Bank Nyrt 9.69%PKO PW Equity Powszechna Kasa Oszczednosci Bank Polski 8.12%MOL HB Equity MOL Hungarian Oil & Gas PLC 7.44%PZU PW Equity Powszechny Zaklad Ubezpieczen SA 7.19%PKN PW Equity Polski Koncern Naftowy ORLEN SA 6.68%CEZ CK Equity CEZ AS 5.98%PEO PW Equity Bank Polska Kasa Opieki SA 5.91%KOMB CK Equity Komercni banka as 4.69%KGH PW Equity KGHM Polska Miedz SA 4.28%TLV RE Equity Banca Transilvania SA 4.17%PGN PW Equity Polskie Gornictwo Naftowe i Gazownictwo 3.61%RICHT HB Equity Richter Gedeon Nyrt 2.98%CDR PW Equity CD Projekt SA 2.66%KRKG SV Equity Krka dd Novo mesto 2.40%FP RE Equity Fondul Proprietatea SA/Fund 2.09%MONET CK Equity Moneta Money Bank AS 1.89%VIG CK Equity Vienna Insurance 1.81%SNG RE Equity ROMGAZ SA 1.62%BRD RE Equity BRD-Groupe Societe Generale SA 1.58%SNP RE Equity OMV Petrom SA 1.34%TELEC CK Equity O2 Czech Republic AS 1.16%MTELEKOM HB Equity Magyar Telekom Telecommunications PLC 1.07%HTRA ZA Equity Hrvatski Telekom dd 1.06%
Total 100.00%
REGIONAL PERFORMANCE VS THE DAX 30 INDEX
19
Source: Bloomberg, 2018
100
150
200
250
300
CETOP Index (as a Proxy for the Region)vs. the DAX 30 Index, normalized to 100
CETOP Index DAX Index

CEE MARKETS MAIN INDICES – CHARACTERISTICS
20
No. Country Index Market Cap of the Index, EUR BN
Average Daily Volume, EUR M GDP, EUR BN, 2017
1 Poland WIG20 80.58 152.2 465.7
2 Czech Republic PX 48.76 23.4 191.6
3 Slovakia SAX 2.39 0.017 85.0
4 Hungary BUX 21.58 36.32 123.5
5 Slovenia SBI TOP 5.36 1.33 43.3
6 Croatia CROBEX 7.79 0.66 48.7
7 Serbia BELEX15 2.08 0.30 36.8
8 Macedonia MBI10 1.86 0.24 10.1
9 Romania BET 15.55 7.20 187.4
10 Bulgaria SOFIX 1.72 0.38 50.4
11 Greece ATHEX Composite 47.33 66.26 177.7
TOTAL 235.00 288.30 1,420.2
Source: Bloomberg, July 2018

INVESTING IN CEE EQUITIES
21
• Stock picking is time consuming• Limited knowledge about the region and the individual stocks• Lack of adequate information in foreign languages• Lower transparency• Major cross-border settlement difficulties – high set up costs• High transaction costs• Lack of liquidity without good local brokers / connections• ETFs are the best way to invest in CEE equities by selecting individual countries
and making macro bets• ETFs provide additional primary-market liquidity• ETFs provide tax advantages for many EU-based investors

EXPAT’S ETFs – UNIQUE MARKET PROPOSITIONS
• Unique market propositions providing country-specific exposure in the CEE region to international investors
• Designed to be major highways for capital flows to and from the equity markets of the CEE countries
• Link the local stock exchanges of the CEE countries with Frankfurt• Easy and cost-effective for international investors to take and liquidate an
exposure to the specific countries in the region• Overcome deficiencies such as lack of liquidity, lack of access, cross-
border settlement issues, high execution costs, large spreads, and other technical factors typical for many of the CEE markets
22

EXPAT’S ETFs ADVANTAGES
• A convenient and efficient macro play, easy to follow– No need to devote time and resources to analyze, pick and follow individual
stocks– Portfolios published daily on Expat’s website
• Diversification– Exposure to the largest and most liquid stocks on the relevant market
• Superior liquidity– The existence of both primary and secondary markets ensures superior
liquidity. Any amount can be invested or divested on any given day
23

NEXT STEPS
• ETFs covering the Baltics
• ETFs in niche markets not covered by major providers
24
EXPAT CAPITAL96A Georgi S. Rakovski Str.
1000 Sofia, BulgariaTel.: +359 2 980 1881Fax: +359 2 980 7472
E-mail: [email protected]
CONTACT
25

CONTROL YOUR MONEY. PRESERVE YOUR WEALTH. BUILD YOUR FUTURE.
A REMARKABLY DIFFERENT WEALTH MANAGEMENT EXPERIENCE.