control of movement direction
TRANSCRIPT
Chapter 2
Control of movement direction
The state of the art in biological motor control reflects a long–standing debate concerning,
whether cortical neurons encode parameters of hand path rather than muscle activity, and
whether the central nervous system uses spatial coordinates, rather than joint or muscle
coordinates (Bizzi and Mussa-Ivaldi, 2000; Johnson et al., 2001). This is related to a shift in
the main paradigm of motor control, from correlating primary motor cortical neuronal firing
with movements of isolated muscles (Scott and Kalaska, 1995; Scott, 1997) to correlating
neuronal firing with whole arm movements (Georgopoulos et al., 1984; Schwartz et al., 1988;
Caminiti et al., 1991). Pivotal to this change of framework were the experimental studies of
Georgopoulos and colleagues (1982, 1984), showing that the discharge rate of primary motor
cortex neurons is tuned to the direction of arm movement.
Whether muscles or movements are represented in the motor cortex, is related to the dis-
tinction between planning and execution of movements (Bizzi and Mussa-Ivaldi, 2000). Fur-
thermore, it represents an important aspect for any developmental approach of motor cortex
self–organization. The purpose of this chapter is to provide a biological framework of motor
control for use in our modeling work. Considering the existing controversies in the research
on human motor control, we intend to marshal and evaluate neurophysiological and psy-
chophysical evidence in support of the working hypotheses of the thesis.
Section 1 examines experimental evidence for the hypothesis that motor areas plan move-
ment in spatial coordinates and represent abstract parameters of the hand path. It includes a
discussion of the planning–execution distinction and of the cortical representation of motion
direction and an introduction of the population coding scheme. Section 2 focuses upon the
13
Chapter 2: Control of movement direction
organization of cortical feature maps and introduces the means for the simulation of their
development. One of the most successful approaches to modeling the formation of brain
maps is the self–organizing feature map (Kohonen, 1984). Two adaptations of the original
algorithm are outlined, based on learning in the lateral synapses and spiking neural mod-
els. Section 3 presents a review of a number of recent models that address the issue of
spatial coding of directionality. In the absence of previous modeling work on motor direc-
tional maps formation, inspiration can be drawn from models of visual maps organization
(Farkas and Miikkulainen, 1999) or from simulations which address population coding of
movement (Lukashin and Georgopoulos, 1994).
2.1 Biological motor control
Movement of primates is the result of information processing in a complex hierarchy of
motor centers within the nervous system, which yields three levels of control: the spinal
cord, brain stem, and motor cortex (Kandel et al., 2000). The highest levels of cortical motor
control are often associated with the premotor regions, which are the lateral ventral cortex,
the dorsal premotor cortex and the supplementary motor areas. The lowest cortical level is
occupied by the primary motor cortex.
The premotor cortex has a major role in coordinating and planning complex sequences of
movements. It integrates sensory information from the posterior parietal cortex with exec-
utive inputs from prefrontal lobes. It projects to the primary motor cortex, which directly
controls simple movements of the limbs. Both premotor and primary motor cortex project
to the brain stem and the spinal cord. The spinal cord is the lowest level of the hierarchical
organization that is directly responsible for executing movements (Kandel et al., 2000).
2.1.1 Distinction between planning and execution
The dominant view of how biological motor control takes place is that the brain forms a
neural representation of a movement before its execution, within which it encodes certain
parameters of the movement itself (Schmidt, 1988; Wiesendanger et al., 1992; Kandel et
al., 2000). The concept of motor program has been introduced by Bernstein in 1967 (Kandel
et al., 2000) and elaborated by Schmidt (1988). He argued that people do not learn spe-
cific movements, instead they construct generalized motor programs and produce different
14
Chapter 2: Control of movement direction
movements by varying the parameters (e.g., duration, level of force) that determine the way
in which movements are constructed.
The existence of some abstract plan of action that is actuator–independent and specifies the
important parameters of the movement to be executed has been particularly useful for ex-
plaining the phenomena of motor equivalence. Motor equivalence states that individual mo-
tor actions share important characteristics even when performed in different ways. Hand-
writing is perhaps the most representative example (Kandel et al., 2000).
The motor programming paradigm has been recently challenged by the dynamical view
of behavior, which considers that stable patterns of behavior and the transitions between
them emerge naturally from the dynamics of complex systems and do not exist a priori in
some independent form (Kelso, 1988; Van Gelder, 1995). Further proposals have been made
to suggest that the dynamical and computational view are nevertheless compatible, and
that a dynamical system (e.g., the motor system) can be analyzed in terms of its intrinsic
computational components (see Crutchfield, 1998).
The motor planning paradigm supports the hypothesis that planning (or response selec-
tion) and execution of movement constitute two separate stages of information processing
(Bizzi and Mussa-Ivaldi, 2000). The common view on how these processes take place is that
response selection and implementation are realized through a sequence of transformations
between three major levels of representation: (1) extrinsic kinematics, such as motion of the
hand through space; (2) intrinsic kinematics, such as joint motions; (3) dynamics, such as the
causal forces that produce movement (Kalaska, 1995).
Evidence for the distinction between planning and execution came from two sources:
• Psychophysical experiments showing that movement kinematics, namely the trans-
formation from extrinsic to intrinsic kinematics, are planned independently of the dy-
namics of musculoskeletal system in which movement occurs. Morasso’s experiments
first suggested that motor goals as simple as reaching and pointing are planned by the
brain in terms of extrinsic coordinates representing the motion of the hand in space
(Morasso and Mussa-Ivaldi, 1982; Shadmer and Mussa-Ivaldi, 1994; Bizzi and Mussa-
Ivaldi, 2000).
• Neurophysiological data suggesting that motor cortex plans movement in spatial co-
ordinates (see Section 2.1.2 below).
15
Chapter 2: Control of movement direction
2.1.2 Motor planning in spatial coordinates
In the introduction to this chapter, it was mentioned that a long–standing controversy in
biological motor control is the question about whether muscle dynamics or movement kine-
matics are represented in the motor cortex (Kalaska et al., 1992; Johnson et al., 2001; Flash
and Sejnowski, 2001). The debate is directly related to the issue of which coordinate system
the brain is using to encode movement: the spatial (extrinsic) coordinates frame, which rep-
resents movement in the Cartesian space or the motor (intrinsic) coordinates that represents
motion in terms of the actuator dynamics, such as the joint and muscles coordinates. The
answer to this question is highly relevant to understanding how visual to motor transfor-
mation takes place, and if the brain is directly involved in computing the inverse dynamics
of movement, or only the kinematics transformations (see also discussion in Section 3.1.1).
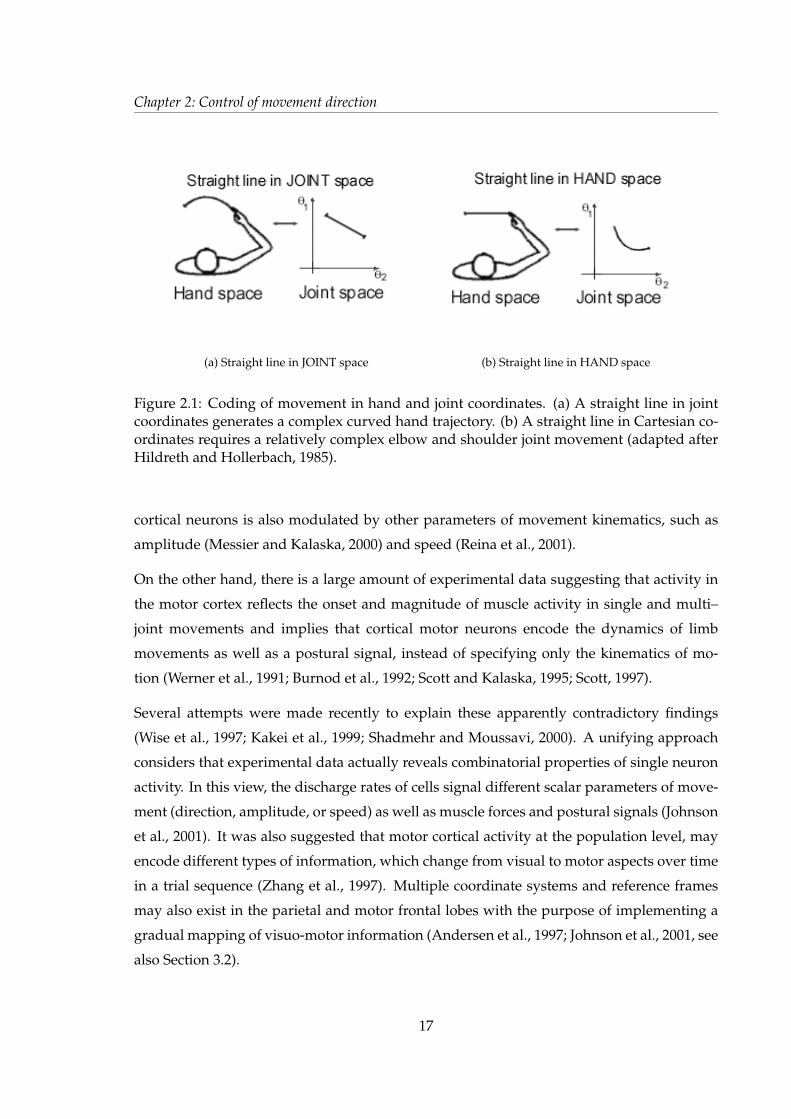
If cortical planning were to take place in motor (joint or muscles) coordinates, it would have
the advantage of taking into account the physical constraints but it may result in movements
that are not adequate in the task space (Hildreth and Hollerbach, 1985). That is, because the
joint–to–spatial coordinates transformation is a nonlinear mapping (see Section 3.1.1) and
programming a straight line in joint coordinates would generate a complex curved end–
effector trajectory (Figure 2.1a). On the other hand, planning in hand coordinates gives rise to
straight hand trajectories, but requires more coordinate transformations and do not incor-
porate the limitations of the joints and muscles (Figure 2.1b).
Evidence for the motor cortex planning movement in spatial coordinates came from numer-
ous neurophysiological experiments concerned with neural coding of the movement scalar
parameters (i.e., direction, speed or amplitude) by recording the activity of single cells in the
cortex (for a review see Georgopoulos et al., 1993; Johnson et al., 2001). The breakthrough
work of Georgopoulos and colleagues (1982, 1984) demonstrates the existence in the motor
cortex of the monkey, of a correlation between the cells’ firing patterns and the direction
of hand movement for reaching in two dimension. Further investigations demonstrate that
directional tuning is a prominent feature of cortical neurons.
Directional selectivity has been described in the dorsal premotor cortex and primary motor
cortex for movements in both 2-D and 3-D space (Schwartz et al., 1988), during manual
tracking of visual targets (Johnson et al., 1999), for coding of finger and wrist movements
(Georgopoulos et al., 1999), for drawing movements (Schwartz, 1994), and during instructed
delay reaching tasks (Crammond and Kalaska, 1994; Johnson et al., 1999). Activity of motor
16
Chapter 2: Control of movement direction
(a) Straight line in JOINT space (b) Straight line in HAND space
Figure 2.1: Coding of movement in hand and joint coordinates. (a) A straight line in jointcoordinates generates a complex curved hand trajectory. (b) A straight line in Cartesian co-ordinates requires a relatively complex elbow and shoulder joint movement (adapted afterHildreth and Hollerbach, 1985).
cortical neurons is also modulated by other parameters of movement kinematics, such as
amplitude (Messier and Kalaska, 2000) and speed (Reina et al., 2001).
On the other hand, there is a large amount of experimental data suggesting that activity in
the motor cortex reflects the onset and magnitude of muscle activity in single and multi–
joint movements and implies that cortical motor neurons encode the dynamics of limb
movements as well as a postural signal, instead of specifying only the kinematics of mo-
tion (Werner et al., 1991; Burnod et al., 1992; Scott and Kalaska, 1995; Scott, 1997).
Several attempts were made recently to explain these apparently contradictory findings
(Wise et al., 1997; Kakei et al., 1999; Shadmehr and Moussavi, 2000). A unifying approach
considers that experimental data actually reveals combinatorial properties of single neuron
activity. In this view, the discharge rates of cells signal different scalar parameters of move-
ment (direction, amplitude, or speed) as well as muscle forces and postural signals (Johnson
et al., 2001). It was also suggested that motor cortical activity at the population level, may
encode different types of information, which change from visual to motor aspects over time
in a trial sequence (Zhang et al., 1997). Multiple coordinate systems and reference frames
may also exist in the parietal and motor frontal lobes with the purpose of implementing a
gradual mapping of visuo-motor information (Andersen et al., 1997; Johnson et al., 2001, see
also Section 3.2).
17
Chapter 2: Control of movement direction
To summarize, there is neurobiological and psychophysical evidence for a distinction at
the cortical level between planning and execution of movement. The dominant view is
that there is a cortical, abstract plan of action, which specifies the important parameters of
movement, such as direction. It is also acknowledged that activity of motor cortical neurons
co–varies with the dynamics of limb movements. However, it is believed that scalar param-
eters are encoded in the firing of a large number of the neurons that are active during the
preparation and onset stages of movement.
2.1.3 Cortical encoding of movement direction
Apparently, the problem of coding the direction of movement has two possible solutions:
the single cell representation or the neural population coding scheme. The simplest method
would be to have single cells sharply tuned to one direction of motion, which would be
activated only when movements in that particular direction are issued (such a model is
implemented in Bullock et al., 1993). Instead, empirical studies of neural response show
that in many brain systems, sensory information is distributed throughout a population of
neurons (for a review see Abbott, 1994). In these ensembles, individual neurons are broadly
tuned to a stimulus, in such a way that the individual firing rate reflects the information
coded, however an accurate estimation of the stimulus can be realized only based on the
spike trains coming from many neurons (Abbott, 1994; Rieke at al., 1997).
A population coding scheme has the advantages of suppressing the fluctuations in the signal
of a single neuron and of being resistant to damage. Various methods have been developed
to describe how spike trains from different cells are combined to reconstruct the properties
of an external event (Abbott, 1994; Gielen, 2001; Gerstner and Kistler, 2002). A popular re-
construction method is the population vector scheme, a method to encode and decode stimuli
in a distributed way by using the joint activities of a number of neurons (Georgopoulos et
al., 1986; Seung and Sompolinsky, 1993).
Preferred directions of neurons and population coding
In their original research, Georgopoulos and his colleagues (1982, 1984) found that neurons
in the premotor and primary motor cortex are selective to the direction of motion. Motor
neurons seem to have a preferred direction, which is signaled by a change in the neural
18

Chapter 2: Control of movement direction
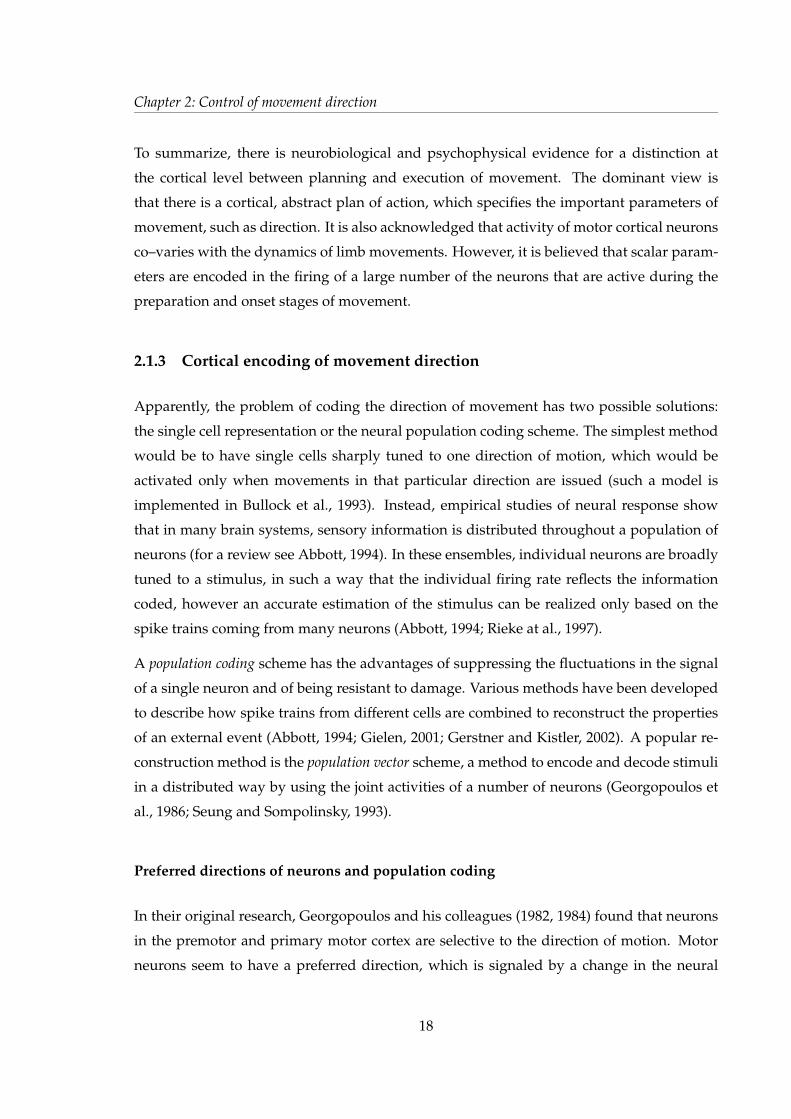
Figure 2.2: Cortical neurons with different preferred directions are active during movementin a particular direction. The eight clusters represent the activity of a population of neurons,during reaching movement in eight different directions. The population vectors (solid ar-rows) closely match the directions of movement of the limb (dashed lines) (adapted fromKandel et al., 2000 based on data from Georgopoulos et al., 1982).
activity with the direction of hand movement. The neurons fire most briskly for movements
in a preferred direction and are almost silent for movements in the opposite direction.
The authors proposed that movement in a particular direction is determined not by the
action of single neurons but by that of a broad population of neurons (Figure 2.2). The
direction of movement at time t is estimated by a population vector P (t) that yields the sum
of each cell i preferred direction Ci, weighted by the cell activity Vi, given by the formula:
P (t) =∑i
Vi(t) Ci. (2.1)
The relation between the discharge rate of the neuron and the direction of motion was de-
scribed by a cosine tuning function given by the formula Vi(M) = bi + ai · cos(θ − θi), where
bi and ai are regression coefficients and θ − θi is the angle formed by the cell’s preferred
direction and the direction of current movement M . More recent studies reveal that cells in
the monkeys arm area can show bimodal tuning functions and that, their optimal tuning is
actually narrower than the cosine function, namely with an average of 56◦ (Amirikian and
Georgopoulos, 2000).
The population vector is a robust measure and a good predictor of motion direction during
the preparatory stages of movement. It was shown that during an instructed delay period,
19
Chapter 2: Control of movement direction
the population vector gives a reliable signal concerning the direction of movement that is
later executed (Georgopoulos et al., 1993). However, several studies recording neural activ-
ity in motor cortex during reaching described a ’rotation’ of the neuron’s preferred direction
with the evolution of movement (Caminiti et al., 1991). At the population level, the average
change was found similar to the change in the shoulder angle, suggesting that postural sig-
nals and muscles dynamics may also be reflected in the motor cells activities (Burnod et al.,
1992). This illustrates that the interpretation of population activity depends on the neurons
considered for averaging and on the proper characterization of neuronal response (Gielen,
2001).
Further studies of the cortical encoding of motion direction suggest that directional informa-
tion can also be contained in the synchronous activity of the motor neurons (Hatsopoulos
et al., 1998). Hatsopoulos and colleagues have shown that significant synchrony between
directionally tuned neurons occurs clustered around the onset of movement (e.g., a time
window of 400 ms) and may encode information distinct from that provided by firing rate
modulations alone. The mechanism, which causes motor neurons to synchronize their ac-
tivities, may depend on common input within the same area or from other areas, or may be
due to network interactions among subsets of neurons coding for similar preferred direc-
tions (see discussion in Section 6.2.5).
With respect to how the central nervous system translates the cortical directional informa-
tion into the desired limb movement, a simple neural networks mechanism was proposed
by Georgopoulos and colleagues (Lukashin et al., 1996). This transformation was imple-
mented with a three-layered feedforward network, which maps impulse activity recorded
in the monkey’s motor cortex into motor actions of a simulated actuator. Activities of units
in the input layer are given by the spike trains recorded from 75 directionally tuned motor
cells. The intermediate layer integrates these inputs by using a sigmoid activation function
and maps them into an output layer that determines the contraction forces on the muscles
by changing the rest lengths. The network connectivity is set so that the mapping from the
output layer to the actuator determines a synergistic activation of muscles to generate the
required motor output. As a result, the actuator responds to the motor cortical commands
with a good fidelity. Another example of how everything can be combined, from plans to
actions, is presented in the final chapter, where we discuss the possible applications of our
work (Section 7.2).
20
Chapter 2: Control of movement direction
2.1.4 Summary
The goal of the previous subsections was to define a theoretical framework for biological
motor control to use in our simulation work. The modeling work described in the remainder
of this thesis rests on three main theoretical assumptions derived from this framework:
• Brain centers form a representation of movement (i.e., plan) before its execution. Our
working concept of motor plan considers the existence in the motor cortex, of a neural
representation of movement, built in advance of its initiation. This concerns initial
objectives of movement, without specifying details of implementation. We consider
this hypothesis as being a weak assumption, completely supported by the existence in
motor areas of preparatory activity that codes movement information prior to its onset
(Johnson et al. 1999; Messier and Kalaska, 2000).
• This initial neural representation codes abstract parameters of hand-path. Based on
experimental data on motor cells directional selectivity, we consider that activity oc-
curring during movement preparation encodes the direction of whole limb movement.
We also consider that neural activity in motor areas is correlated with the direction of
movement immediately after movement onset (i.e., first 400 ms) (Georgopoulos et al.,
1984).
• The direction of movement is coded in spatial coordinates and is represented in the
activity of a large population of motor neurons. The former definition follows from
the previous assumption and it states that the motor direction is represented in hand
coordinates. The later assumption implies that directional information is provided by
the population vector, which is considered an accurate predictor of movement (Geor-
gopoulos et al., 1993).
In the remainder of this chapter, we focus on computational and modeling aspects of cortical
directional selectivity. As such, we introduce in the next section cortical feature maps and
the means to study their formation and development.
2.2 Self–organizing maps
Self–organization refers to spontaneous ordering tendencies observed in both artificial and
natural complex systems that consist of a large number of components that interact simulta-
21
Chapter 2: Control of movement direction
neously (Depew and Weber, 1999). The brain is such a self–organizing system that can learn
by itself, by changing (adding, removing, strengthening) the connections between neurons
(Kohonen, 1984; Kelso, 1995).
Sensory feature maps are an illustrative example of how the brain self–organizes to rep-
resent the external world by undergoing a process of abstraction, similar to the process of
principal component analysis (Haykin, 1994). That is, it suppresses trivial details and maps
the most important features of the input along the dimensions of the cortical map (Kohonen,
1984). A consequence of the tendency to compress the input space is the formation of topo-
graphic maps, in which the most important similarity relationships among the input signals
are converted into spatial relationships among responding neurons (Kohonen, 1984; Ritter
et al., 1992).
2.2.1 Principles of topographical maps organization
The topographic representation of input patterns is a key feature of brain design, for visual,
tactile and auditory data analysis and also for motor control (Kandel et al., 2000). This gen-
eral self–organization property of the cortex is supported by a set of functional and design
principles.
Neural feature detectors. Feature detection is a basic principle of cortical processing. By
the way each neuron is connected with other neurons within a network, it becomes special-
ized in representing certain features from the input space. The dedication of neurons is very
widely distributed in the brain, characterizing the activity of neurons in all sensory (visual,
auditory, somatosensory) and motor areas and employing different levels of the neural pref-
erence (e.g., from visual neurons sharply tuned to one attribute to the broadly tuned motor
neurons) (Kandel et al., 2000).
It is important to note that the optimal tuning width of the cells that take part in the neural
population code derives from trying to improve the quality of the code and to maximize
information content and is influenced by many factors (i.e., noise, dimension of the encoded
variable) (Eurich and Wilke, 2000; Gielen, 2001; Sompolinsky et al., 2001). Furthermore,
the traditional concept of neurons as dedicated processors of a single parameter (i.e., either
movement direction or force) has changed to reflect data showing that motor neurons, as
well as neurons from the parietal and visual cortex, signal a mixture of scalars and vectorial
parameters (Johnson et al., 2001; see Section 2.1.2).
22
Chapter 2: Control of movement direction
Activity-dependent mechanisms. Map formation is an activity–dependent process, demon-
strated by the existence of a critical period of development for the emergence of visual maps
(Hubel and Wiesel, 1970). The mechanisms of plasticity on a medium time scale rely on ac-
tivity dependence within intra–cortical circuits, with Hebbian preference to the most active
inputs and competition between hidden nodes. The activity–dependent means are probably
common to all cortical maps and play a role in normal functioning and the maintenance of
topographic maps. Much support for these computational hypotheses has been brought by
modeling studies simulating the formation and adaptation of sensory maps (for a review
see Miikkulainen et al., 1998).
Organization. Topographical mapping leads to the formation of a map characterized by:
• Nearby cells react to stimuli with similar features.
• Whole input feature space be covered.
• No presence of global order.
Plasticity. For a long time, cortical maps were considered as being static in adult animals.
The breakthrough research of Hubel and Wiesel first demonstrated that visual deprivation
change physiological and anatomical monocular organization of afferents into visual cortex
(Hubel and Wiesel, 1962; Hubel and Wiesel, 1970). Further evidence from studies on so-
matosensory deprivation in young animals (Merzenich et al., 1983) or nerve lesions (Sanes
and Donoghue, 1992) have shown that re-organization is a common feature of adult cortical
sensory maps. The experimental observations have been supported by computer simula-
tions that illustrate how reorganization can take place after sensory deprivation (Ritter et
al., 1992).
2.2.2 Characterization of sensory map layout
The primary visual cortex offers perhaps the clearest instance of feature map organization.
This visual area is organized into narrow columns of cells, which have similar receptive
fields and identical axes of orientation (Figure 2.3). Each orientation column also contains
complex cells that respond to movement in a particular direction across their receptive field.
The mapping of adjacent columns reveals a precise organization with an orderly shift in
axis of orientation from one column to the next. Approximately each three-quarter of a
23

Chapter 2: Control of movement direction
Figure 2.3: Orientation map in the macaque cortex. On the left, cortical areas that are mostactives at the presentation of a particular orientation are indicated by the correspondingorientation color (bars on the right). The map shows features such as: (1) pinwheel centers,around which orientation preference changes through 180◦; (2) linear zones, where orienta-tion changes almost linearly; and (3) fractures, characterized by a discontinuous change oforientation preferences. On the right, the enlargement of a pinwheel-like area is presented(adapted after Kandel et al., 2000, based on data by Blasdel, 1992).
millimeter contains a complete cycle of orientation changes (e.g., pinwheel center). A com-
plete sequence of ocular dominance columns and orientation columns forms a hypercolumn.
This is the basic computational module of the visual cortex, which processes information on
orientation, binocular interaction, color and motion (Kandel et al., 2000).
The visual orientation map in Figure 2.3 illustrates three general principles of cortical de-
sign: local correlation, homogeneity, and isotropy (Niebur and Worgotter, 1992). Within
a hypercolumn, isotropic subregions or linear zones are formed where neurons share the
same orientation preferences (i.e., are locally correlated). The map is homogeneous, because
there are no systematic differences between locations over distances much larger than a hy-
percolumn width.
Formation of visual feature maps has been extensively modeled, mainly by using variants
of the self-organizing feature map (SOM, Kohonen, 1984) with receptive fields and plastic
lateral connections (Obermayer et al., 1990; Sirosh, 1995; Miikkulainen et al., 1998; see also
Sections 2.2.4, 2.3.1). Well-studied examples are also the formation of tonotopic maps in the
auditory cortex of the bat, that is mapping of sound frequencies (Kohonen, 1984; Martinetz
et al., 1988; Kandel et al., 2000) and organization of somatosensory maps for the mapping of
24

Chapter 2: Control of movement direction
touch (Ritter et al., 1992).
2.2.3 Motor map organization
In contrast to the detailed knowledge existent on the functional architecture of sensory cor-
tical areas (visual and auditory), the organizational principles of the frontal motor regions
are much less clear (Sanes and Donoghue, 1992). Without an explicit description of the
architectural and functional principles, modeling of motor cortical computations is more
difficult. Our view is that there are two milestones in modeling motor cortex development:
(1) the characterization of connectivity in motor cortex and (2) understanding the nature of
the training information which drive this process.
The latter requirement lies at the heart of a self–organizing process. That is, organization of
a feature map follows from projecting the similarity relationships between input signals into
spatial relations in the output map units. Whilst these relationships are easily recognized
in the input space of the visual (retinal receptive fields), somatosensory (touch receptors
signals), or auditory (sound frequencies) mapping, in the case of the motor cortex it is less
obvious what sort of data is available for training and which are its characteristics.
With respect to the organization of directional neural maps in the motor cortex, several
points are noteworthy: (1) neurons are broadly tuned to the direction of arm movement,
with a unimodal tuning, close to the cosine-function; (2) cells in a motor cortical column
tend to have similar preferred directions; (3) particular directions are multiply represented
in the motor cortex; and (4) neural preferred directions cover a directional continuum (Geor-
gopoulos et al., 1984; Lukashin and Georgopoulos, 1994). Experimental findings have also
showed that the strength of temporal correlation between the firing of single cells decreases
with inter–electrode distance (Hatsopoulos et al., 1998). This suggests the existence of local,
short–range excitatory synapses. Concerning the functional characteristics of lateral connec-
tions in the motor cortex, Georgopoulos and colleagues (1993) estimated that the strength of
connection between two motor neurons is negatively correlated with the difference between
their preferred directions (see also our results in Section 6.1.5).
To summarize, cortical areas in the brain undergo a process of self–organization that is
driven by activity–dependent mechanisms and consists of a topology preserving mapping.
It leads to the specialization of neurons as feature detectors and the formation of topograph-
ical cortical maps, in both sensory and motor areas. The layout and development of topo-
25
Chapter 2: Control of movement direction
logically ordered maps was best described and modeled in the case of sensory (i.e., visual)
maps, starting decades ago with the seminal work of Hubel and Wiesel (1962).
Nevertheless, it is believed that development of cortical preferences may be based on a few
design principles, which in turn rely on very general developmental mechanisms utilizing
the input structure of the system (Douglas and Martin, 1991; Niebur and Worgotter, 1993).
In this thesis, we adopt the view that developmental principles described for sensory areas
reflect general laws of cortical organization. Accordingly, they form the basis of our motor
cortex modeling work. Up to the present, this assumption was confirmed by most studies
providing evidence on motor cortex connectivity and plasticity (Georgopoulos et al., 1993;
Hess and Donoghue, 1994; Rioult-Pedotti et al., 1998; Xing and Andersen, 2000).
2.2.4 Role of lateral connections
The previous sections described the characteristics of cortical maps with respect to neuron
preferences within a columnar organization. The vertically oriented computational units
(i.e., neural columns) communicate with one another by means of horizontal or lateral con-
nections (Kandel et al., 2000). Until recently, the lateral connections were thought to have a
secondary role in shaping the cortex, with the primary role attributed to plasticity of thala-
mocortical afferents (see Miikkulainen and Sirosh, 1996).
New experimental and modeling studies suggest that lateral interactions might play a much
larger role in modulating and controlling the cortical response, in the representation of in-
formation and development of cortical maps (Douglas and Martin, 1991; Sirosh et al., 1996).
Several computational functions of lateral connections have been hypothesized:
• Recurrent lateral connections may provide a mechanism for activity normalization
(Somers et al., 1996) and mediate competition and synchronization over large dis-
tances of cortex (Usher et al., 1996).
• Lateral connections may form the substrate for encoding memories as attractors in the
cortical network (Taylor and Alavi, 1996).
• They could play a crucial role in the development of cortical columns representing
orientation, ocular dominance and spatial frequency (Sirosh, 1995; Miikkulainen et al.,
1996). The may also mediate reorganization of cortex in response to drastic changes
26
Chapter 2: Control of movement direction
in the input environment, such as retinal lesions and input deprivation (Gilbert and
Wiesel, 1992).
As mentioned before, most of the knowledge about the development and functions of lat-
eral connections has been based on studies of visual areas organization (Gilbert and Wiesel,
1992; Weliky and Katz, 1994; Douglas et al., 1991). Only recently, studies on the functional
topography of the auditory cortex (Read et al., 2001) and on the organization of cortical
maps on motor cortex (Sanes and Donoghue, 1992; Hess and Donoghue, 1994) brought es-
sential information on the spatial arrangements and the functions of horizontal connections
in other, than visual brain areas.
Lateral connections are found to be remarkably ordered. Horizontal connections wire to-
gether cells with similar response properties in different columns. In the visual cortex, hori-
zontal projections link columns with common ocular dominance and orientation selectivity
(Gilbert and Wiesel, 1992), as well as color selective cells with similar responses from differ-
ent blobs (Kandel et al., 2000). In the auditory cortex dorsoventral connections link regions
with matched characteristic frequencies (Read et al., 2001). In the motor cortex lateral con-
nections may link neurons with similar proffered directions (Georgopoulos and Lukashin,
1996). This organization is neither genetically determined nor static. The development of
lateral connections, like that of afferent connections, depends on cortical activity caused by
external input and represents correlation in the input (Hubel and Wiesel, 1962; Hess and
Donoghue, 1994).
Lateral connections are often reciprocal, and contact both inhibitory and excitatory cells.
Roughly 15% to 20% of the neurons in the cortex are GABAergic inhibitory interneurons
(Kandel et al., 2000). The importance of these neurons for controlling the positive feedback
loops between excitatory cortical pyramidal neurons has been revealed, for example, in the
epileptic-like effects of GABA antagonists (Grinvald et al., 1988).
Physiological studies on the cells of cat visual cortex suggest that individual axons inhibit
isotropic nearest–neighbor cortical columns and outside this core region may provide a type
of anisotropic lateral inhibition of cortical columns (Budd and Kisvarday, 2001). Mech-
anisms for long–range inhibition have also been described across the brain, possibly im-
plemented by subcortical mechanisms (i.e., thalamus and basal-ganglia) (Taylor and Alavi,
1996). Long–range competition is an important requirement for self–organization to occur
and, generally, realistic models of the cortex include both excitatory and inhibitory connec-
27
Chapter 2: Control of movement direction
tions, with inhibition being spread further than excitation (Kohonen, 1984; Sirosh, 1995).
To this point, we have briefly described the neurobiology of cortical feature maps, the way
the topology preserving maps form and adapt in the brain. In the remainder of this chap-
ter, we focus upon the modeling of this process in general, and of cortical directional map
development, in particular.
2.2.5 The Kohonen map
The self–organizing feature map (SOFM) was developed by Kohonen (1984) as a means to
explain the formation, in the sensory cortex, of ordered, two-dimensional representations
of multidimensional external world signals. Kohonen defined the self–organization process
running in the cortical maps as a topology–preserving mapping, which translates similarity
relations existent in the input space in topological relations between the projecting images.
Within this adaptive process, nodes in the output map converge to such values that every
unit becomes sensitive to a particular domain of input signals, in a regular order (Kohonen,
1984).
A basic Kohonen map consists of an input layer and an output map (also termed as compet-
itive layer). The input can be a multidimensional pattern represented by a vector, with each
unit coding the values of a dimension from the input pattern. Every unit in the competitive
layer receives a sum of weighted values from the input layer and is connected with a num-
ber of other competitive units, by excitatory and inhibitory lateral synapses (see Figure 6.1
in Section 6.1.1).
Kohonen maps are able to preserve the similarity relations in the input space, while realiz-
ing a dimensionality reduction, usually from a multidimensional input to a two–dimensional
(planar) output. The striped ocular dominance patterns are perhaps the most illustrative ex-
ample of mapping a three dimensional space (e.g., the visual world) into a two dimensional
surface (e.g., the cortex) (Kohonen, 1995).
The core of learning relies on the formation of ’clusters’ or ’bubbles of activity’, which con-
centrate the neural response around some location in the output plane (e.g., around the
maximally responding unit). The location c of the maximum is defined according to a best
match criterion between the input vector x and the weights vector w of each output unit i:
|x− wc| = mini|x− wi|. (2.2)
28
Chapter 2: Control of movement direction
Next, around the maximally responding unit c, a topological neighborhood Nc is defined,
and the weights of all units within this neighborhood are subject of adaptation. The modifi-
cation of the selected weights wi at the time t+ 1 is given by the formula:
wi(t+ 1) = wi(t) + η[x(t)− wi(t)], for i ∈ Nc (2.3)
wi(t+ 1) = w(t), otherwise (2.4)
where η is the learning rate. The topological neighborhood Nc starts fairly wide in the
beginning to allow the initial formation of the correct order and than is shrinked with time
until it comprises only one unit. In a similar manner, the learning rate η is slowly decreased,
such as for the final convergence of the map a low value of it is used (Kohonen, 1995).
The learning process resides in a ’winner-take-all’ strategy, where nodes in the output layer
are competing each other to learn the input vectors. During the presentation of each input,
the maps adapts in two ways. First, the weight vectors become a better approximation of the
input vectors, and second, the neighboring weight vectors become more similar. Kohonen
demonstrated that, combined, these two adaptation processes ensure the ordering of the
output map, so that the afferent weights wij will become an ordered image of the input
vector x. An essential role in the formation of a localized neural response of the network is
played by the lateral feedback system, with short-range excitation and long-inhibition. This
will be referred to, as a Mexican-Hat interaction profile (see Figure 5.8 in Section 5.3.2).
Variants of SOFM have been applied successfully to a huge number of domains, ranging
from monitoring and control in industrial tasks and telecommunications, to medical appli-
cations and robotic-arm control. Currently, the SOFM appears to be the de-facto standard
for biological modeling of cortical features map formation (for a review of self-organizing
feature maps applications see Kohonen, 1995).
Spiking self–organizing feature maps
Simulation of cortical maps formation using competitive Hebbian models was most com-
monly implemented based on the classical model of continuous, rate coding neuron (Ober-
mayer et al., 1992; Sirosh, 1995; Miikkulainen et al., 1998). In the last decade, alternative neu-
ral models, known as spiking neurons, have been developed in computational neuroscience
(Maass, 1997; see also Section 4.2.1). Conversely, the research focus was on exploring the
capacity of these neurons to perform fast computations in terms of single spiking events.
29
Chapter 2: Control of movement direction
Much of the work done in this direction was oriented towards the implementation of spike–
based Hebbian learning algorithms (Song et al., 2000) and less has been done with respect
to computations in spiking Kohonen maps. The few attempts made in this direction (Choe
and Miikkulainen, 1995; Ruf and Schmitt, 1998; Panchev and Wermter, 2001) propose differ-
ent ways of adapting the plastic weights, dependent on where they consider that learning
information is contained.
Choe and Miikkulainen (1995) adapted a well–known model of a laterally interconnected
self–organizing map (LISSOM; Sirosh, 1995) to study the development of orientation selec-
tivity in a network of spiking neurons. Their model owes much to the traditional firing rate
coding scheme, since learning of both afferent and lateral connection strengths is applied
in terms of neural discharge rates, after the network reaches a stable state of firing. The
resulting learning scheme is slow and does not take into account the information possibly
encoded in the timing and order of the spikes. Hence, it generally neglects the advantages
of spiking neural models.
A different approach to self–organization based on the timing of single firing events was
proposed by Ruf and Schmitt (1998). They developed a learning rule for a network of leaky
integrate–and–fire neurons, connected by short–range excitatory synapses and long–range
inhibitory connections. When an input vector sl is applied to the competitive network, each
output node receives a weighted sum of the afferent signals over all input units i,∑i
wij ·sli.
The product w · sl represents a measure of similarity between the two vectors with respect
to the Euclidean distance (Kohonen, 1984). Hence, the earlier an output node fires, the
more similar its weight vector is to the input vector. Therefore, the competitive node whose
weights represent the best match of the input vector, namely the winner, will fire first.
Based on this logic, the authors defined learning of the afferent weights of output nodes in
terms of first spike timings. The weight of the connection wij between the input neuron i
and the competitive neuron j is updated by the rule:
∆wij = ηTout − tjTout
(sli − wij), (2.5)
where tj is the firing time of the j neuron and Tout is a time out limit.
Instead of the classic topological neighborhood, a temporal neighborhood of the winner
is implemented, based on the idea that the firing of a winner neuron drives the firing of
topologically close neurons and postpones the firing of remote neurons (e.g., due to the
Mexican–Hat–like shape of the connectivity pattern). Hence, learning applies only to the
30

Chapter 2: Control of movement direction
neurons which fired until Tout. Moreover, the adaptation of afferent weights is scaled by the
distance between the firing time of the competitive neuron and the firing of the winner. This
learning rule has been tested with one and two-dimensional input patterns, on small scale
networks (10 and 25 neurons), where the lateral weights were slightly decreased during
training (no learning rule was implemented for the lateral synapses) (Ruf and Schmitt, 1998).
A variant of this algorithm was recently presented by Panchev and Wermter (2001), who
applied to afferent weights a variant of spike–dependent learning, based on the relative
timing of the pre- and post-synaptic spikes.
Regarding the biological plausibility of the learning algorithm described above, we can con-
sider the studies on visual information processing by Thorpe et al., (1996). Authors sug-
gested that during visual object recognition, the brain does not have time to evaluate more
than one spike from each neuron per processing step. Accordingly, Thorpe and Gautrais
(1998) proposed a coding scheme based on the time–to–first–spike, where only the first spike
of each neuron counts. This idea was supported by other experimental studies, which have
showed that most of the information about a new stimulus is conveyed during the first 20
or 50 ms after the onset of the neuronal response (Tovee et al., 1993; VanRullen and Thorpe,
2001).
Hebbian learning in the lateral synapses
Section 2.2.4 emphasized the importance of horizontal connections in modulating corti-
cal neural activity and development of brain feature maps. However, the original self–
organizing feature map (Kohonen, 1984) and many of its variants account only for static
lateral feedback. This means a fixed connectivity, which has a role in shaping the network
activity, but is not subject to learning.
Recently, significant efforts have been made in studying the computational role of plastic lat-
eral connections within artificial neural network models of brain cognition (see Miikkulainen
and Sirosh, 1996). Most learning rules for lateral weights are based on the hypothesis of
Hebb, which observed that development in many parts of the brain appears to result due to
correlation–based synaptic adaptation processes. He proposed that
When an axon of cell A is near enough to excite cell B and repeatedly or con-sistently takes part in firing it, some growth process or metabolic change takesplace in one or both cells such that A’s efficiency, as one of the cells firing B, isincreased (Hebb, 1949, page 62).
31

Chapter 2: Control of movement direction
Sirosh (1995), Miikkulainen and Sirosh (1996) were among the first who considered the role
of Hebbian adaptation on the lateral synapses during the simulation of a visual feature map
formation. The LISSOM model (Laterally Interconnected Synergetically Self–Organizing
Map, Sirosh, 1995) applies learning to both afferent and lateral connections. First, excitatory
and inhibitory lateral connections strengthen by the correlated activity of pre- and post-
synaptic neurons, computed as the neural activation after the map has settled in a stable
bubble. Second, normalization is applied, so that the total synaptic strength of the lateral
connections remains constant. Connection death is also allowed, by the fact that synapses
whose weights become very small are pruned.
Their success in modeling the formation of visual feature maps have brought compelling
evidence that lateral connections develop simultaneously with the afferent weights, depend
on cortical activity caused by external input, and represent the input correlation. The role
of learning in lateral synapses has been investigated within models studying the formation
of orientation (Miikkulainen et al., 1998) and directional maps (Farkas and Miikkulainen,
1999), dynamic receptive fields (Sirosh et al., 1996), synchronous oscillations (Wang, 1996).
More recently, experimental neurophysiological investigations have shown that the relative
timing of the pre- and post-synaptic spikes plays an important role in determining whether
a synapse is potentiated or depressed (Markram et al., 1997; Zhang et al., 1998). Newer
formulations of the Hebbian rule have been explored for learning in pulsed neural networks
(Roberts, 1999; Song et al., 2000; see also Section 4.4).
In summary, in this section we introduced the design and developmental principles of corti-
cal feature maps. The self–organizing feature map was presented, as one of the most success-
ful modeling paradigms of cortical map development. The role of lateral feedback system in
the organization process was outlined, with a focus upon the plasticity of these synapses. A
learning procedure for a spiking self-organizing map, in terms of the timing of single spiking
events was described. The modeling work presented in this thesis explores the simulation
of directional motor map formation based on self–organization with spiking neurons and
plastic synapses.
32
Chapter 2: Control of movement direction
2.3 Models of cortical coding of directional selectivity
This final section on biological motor control reviews a number of neural network models
of cortical directional selectivity. Firstly, the simulation of a directional map development
in the visual cortex is presented. It was argued throughout the previous section that the
existence of neural feature detection and topographical maps in the brain might reflect the
manifestation of general design and developmental principles. Consequently, in our work,
the motor cortex modeling will be inspired by both neurobiological data and simulation
results on sensory map development. It is the scope of modeling work to explore which of
these principles and in what context, can they lead to the development of motor directional
maps.
Secondly, in the absence of modeling work on directional selectivity development in motor
cortex, inspiration can be drawn from two sources: simulations which address population
coding of motion trajectory (Lukashin and Georgopoulos, 1994) and arm-reaching studies
that require representation of directional information in the motor network (Bullock et al.,
1993). By reviewing these studies, we hope to ascertain how motor directional selectivity
might be implemented and whether it would be useful to have a model which develops
such a feature by unsupervised means.
2.3.1 Visual directional map formation
Most of the models of visual directional selectivity address the processes by which single
complex cells develop directional preferences due to the spatio-temporal properties of their
receptive field (Maex and Orban, 1996; Blais et al., 2000). With respect to feature map forma-
tion, the development of orientation and ocular dominance columns most frequently stud-
ied was (Sirosh, 1995; Erwin et al., 1995; Miikkulainen et al., 1998). Nevertheless, orientation
and directional maps in the visual cortex are functionally and anatomically related, reflected
by the fact that many of the cells with orientation preferences show orthogonal directional
selectivity (Kandel et al., 2000).
Recently, it was proposed to account for the emergence of directional selectivity in the pri-
mary visual cortex (V1) through self-organization, in a similar way with the development of
orientation or ocular dominance preferences. Farkas and Miikkulainen (1999) built a model
of directional selectivity, based on a self–organizing map of leaky–integrator neurons with
33

Chapter 2: Control of movement direction
Figure 2.4: A fragment from the self–organized direction and orientation map in Farkasand Miikkulainen (1999). Each neuron is marked with a line that identifies its orientationpreference and perpendicular to it is represented the shorter line of directional preference.The length of lines is proportional to the neural selectivity. Note that most of the neuronsbecome directional selective and only few of them show no selectivity.
sigmoid output functions. The input to the map consisted of 16 sequences of moving bars,
whose direction of motion was perpendicular to their orientation. Only afferent weights
were subject of learning, according to the standard Oja’s rule. That is, the weight changes
proportional to the difference between the current input and the back–propagated output
(Oja, 1982).
After training, a neuron’s preferred direction was defined as the direction for which the neu-
ral output was highest. Each neuron in the map is also assigned orientation preference and
selectivity. A fragment of the self–organized directional and orientation map is shown in
Figure 2.4. The trained map shows several major characteristics described in biological di-
rectional maps: (1) most of the orientation–selective neurons are also directional selective;
(2) neurons’ preferred directions are perpendicular to their preferred orientation; and (3)
most of iso–orientation patches contain subregions with opposite direction selectivity.
In terms of the neuron response profiles, the model could not reproduce some aspects of
the behavior of biological directionally tuned cells. Thus, the response of a model neuron to
movement in the direction opposite to its preferred direction was found to be rather higher
34

Chapter 2: Control of movement direction
compared to the response measured in the brain maps. This excessively broad tuning of
neurons might be due to the absence in the model, of the lateral feedback, and particu-
larly of synaptic inhibition, which is known to provide the mechanism by which unwanted
responses are suppressed (Livingstone, 1998). A more recent model of visual directional
map formation has been proposed by Tversky and Miikkulainen (2001). The authors fo-
cus on implementing a delay–adaptation learning rule and explore its effectiveness for the
development of directional selectivity in a laterally connected self–organizing network of
integrate–and–fire neurons.
In a summary, only recently the formation of directional selectivity has been tackled within
the self–organization paradigm, in a similar manner with the development of other neural
response properties. Current models draw inspiration mainly from orientation maps simu-
lation, but much remains to be specified in order to obtain directional maps (visual or motor)
that are consistent with the biological observations.
2.3.2 Models of motor control of directionality
Our review of previous work on motor cortex modeling showed that only a limited num-
ber of simulation studies address issues related to the organization and development of
motor directional selectivity. So far, we are not aware of any simulation work aimed at
modeling self–organization of motor cortex, in a similar way with the models of visual map
formation (see Section 2.3.1). Instead, we will review in the remainder of this chapter two
categories of models with relevance to our goals: (1) neural network models concerned
with cortical coding of movement trajectory in the directionally tuned motor populations
of neurons (Lukashin and Georgopoulos, 1994; Lin et al., 1997); (2) simulation studies of
visually guided reaching, which require processing of directional information by the motor
cells (Bullock et al., 1993; Burnod et al., 1992).
Coding of trajectories by neural population vectors
It was pointed out in Section 2.2 that, compared to the experimental data available on the
visual cortex, much remains to be described with respect to motor maps organization and
functional principles. Recent modeling work by Lukashin and Georgopoulos (1994) pro-
duced compelling evidence that the strength of connection between neurons in a pair is
35

Chapter 2: Control of movement direction
correlated with the similarity of their preferred directions. This neural network simulation
was aimed at studying how different trajectories are encoded by the time series of neuronal
population vectors. At the initialization, each neuron in the network was assigned a pre-
ferred direction of motion. The neural trajectories coded by the network were obtained by
adding together, head–to–tail, the neural population vectors computed at short successive
intervals of time (see Equation 2.1). Next, the network was trained using the simulated
annealing learning to find a set of afferent connection strengths, which minimize the error
between the desired and actual movement trajectory.
After training, the organization of the network led to different trajectories realized by dif-
ferent neuronal subsets. The authors hypothesize that similarly, at the motor cortex level,
trajectories may be encoded by different sets of synaptic weights that permanently store the
information about the essential parts of hand path and do not change during the movement.
Consequently, the realization of a particular trajectory needs only one motor command, that
is a global activation of an appropriate neuronal subset. As already observed, their study
also suggests that neurons with similar preferred directions tend to be mutually excitatory
and those with opposite preferred directions tend to be inhibitory.
Lin et al. (1997) presented another study dealing with coding of directional information in
the firing activities of neurons in motor cortex. Using data collected in the macaque cortex
(Schwartz, 1994) the authors trained a self–organizing feature map to extract the directional
patterns encoded in the discharge rates of neurons. First, the average discharge rates dj
of n = 81 motor neurons were computed during the execution of 20 ms of in-out finger
movements. The inputs to the self–organizing map consisted of the discharge rate vectors
Xj = [d1j , d2j , ..., dnj ] formed from all n individual cells contributions.
After training, the topology–preserving mapping property of the SOM led to the formation
of an output map that represents the similarity relationships between the inputs. Thus, dis-
charge rate vectors coding for similar directions were mapped in neighboring nodes, while
input vectors coding for opposite directions were classified according with their high de-
grees of dissimilarity. The findings of this study have partially inspired the way the training
set of our model on motor cortex self–organization was generated (see Section 6.1).
To conclude, previous work on trajectory coding by population vectors provided important
insights into the organization of network connectivity and on how directional information
can be read out from neurons discharge rates. What is still missing is a developmental model
of how directional selectivity and population coding emerge in the motor cortex.
36
Chapter 2: Control of movement direction
Representation of directional information in models of motor control
An important stream of models which deal with motor directional selectivity are robotics
studies implementing spatial to end–effector direction mapping strategies (Ritter et al., 1989;
Bullock et al., 1993; Fiala, 1995). This approach focuses on solving a transformation from
spatial trajectory to end–effector directions, as opposite to the mapping from spatial trajec-
tory to end–effector positions. There are several computational advantages to spatial–to–
direction mapping systems, such as continuity of trajectories and motor equivalence, ap-
propriateness for tool use and robustness when unexpected events occur in the environment
(Bullock et al., 1993).
The main application of direction mapping networks is for the visual control of arm–reaching.
In the DIRECT model (Bullock et al., 1993), spatial directional information in body–centered
coordinates is transformed into joint–rotations (i.e., directions) commands. For this purpose,
the signals on the current position of the arm and the directional information on the desired
trajectory are combined via a self–organizing position–direction map. Learning is conducted
so that, each cell in the map becomes sensitive to a particular spatial direction in a particular
position of joint space. It results that 10 k units are needed.
The sharp directional tuning of the neural response opposed to the broad tuning of real
cells is motivated as a compromise of the model biological plausibility in favor of system
performances. In accord with the experimental data is the fact that neural activity correlates
with the arm movement direction, but not arm movement end-point and also that activity
level may be primed prior to movement (i.e., preparation of movements).
Another group of researchers who have explored the use of directional information for the
control of visually guided movements is represented by Burnod and colleagues (Burnod et
al., 1992; Caminiti et al., 1992; Baraduc et al., 1999). Burnod et al. (1992) presented a model
which was largely inspired by neurophysiological data on the mechanisms of visuo–motor
transformation (see detailed description in Section 3.3.3). With respect to directional infor-
mation coding, the behavior of the network is in accordance with some of the experimental
results described in the motor cortex (Caminiti et al., 1992): (1) cells in the model are tuned
to a preferred direction depending upon the initial position of the arm; (2) the population
vector predicts the movement direction; and (3) the preferred direction of a single neuron
rotates with the arm within a specific subspace.
More recently, Baraduc et al. (1999) proposed a model of motor cortical command to inves-
37

Chapter 2: Control of movement direction
tigate the population coding of direction during reaching movements. The neural network
architecture consists of three populations of neurons (visual, proprioceptive and motor) with
directional and positional tuning properties that ensure a distributed coding of direction in
both spatial and motor coordinates (see Section 3.3.3). Based on their findings, the authors
suggest that the neural population vector resulted in motor area does not give a faithful
image of cortical processing during arm reaching. However, we point out that motor popu-
lation coding results as an effect of visuomotor mapping learning and occurs in a network
with fixed lateral synapses.
To conclude, there are currently a number of models of visuomotor control that implement
directional selectivity of motor cells. However, they are either based on sharply directionally
tuned neurons (Bullock et al., 1993) or address the motor control of directionality by using
supervised means and only within the process of visuomotor learning (Baraduc et al., 1999).
Our simulation work of motor cortex organization is aimed at developing directional se-
lectivity and population coding by using the spatio–temporal characteristics of information
processing in a pulsed self-organizing feature map (Section 6.1).
38