control of immigration: statistics united kingdom 2004 cm 6690
TRANSCRIPT
Cm 6690£14.75
Control of Immigration:
Statistics
United Kingdom
2004


CONTROL OF IMMIGRATION:
STATISTICS
UNITED KINGDOM
2004
Presented to Parliament by the Secretary of State for the Home Departmentby Command of Her MajestyNovember 2005
HOME OFFICE
Cm 6690 £14.75

© Crown Copyright 2005
The text in this document (excluding the Royal Arms and departmental logos) may be
reproduced free of charge in any format or medium providing that it is reproduced
accurately and not used in a misleading context. The material must be acknowledged as
Crown copyright and the title of the document specified.
Any enquiries relating to the copyright in this document should be addressed to
The Licensing Division, HMSO, St Clements House, 2–16 Colegate, Norwich NR3 1BQ.
Fax: 01603 723000 or e-mail: [email protected]

PREVIOUS ISSUES OF “CONTROL OF IMMIGRATION: STATISTICS, UNITED KINGDOM”
2003 .. .. .. .. .. .. .. Cm 6363
2002 .. .. .. .. .. .. .. Cm 6053
2001 .. .. .. .. .. .. .. Cm 5684
2000 .. .. .. .. .. .. .. Cm 5315
1999 .. .. .. .. .. .. .. Cm 4876
1998 .. .. .. .. .. .. .. Cm 4431
1997 .. .. .. .. .. .. .. Cm 4033
1996 .. .. .. .. .. .. .. Cm 3737
1995 .. .. .. .. .. .. .. Cm 3353
1994 .. .. .. .. .. .. .. Cm 2935
1993 .. .. .. .. .. .. .. Cm 2637
1992 .. .. .. .. .. .. .. Cm 2368
1991 .. .. .. .. .. .. .. Cm 2063
1990 .. .. .. .. .. .. .. Cm 1571
1989 .. .. .. .. .. .. .. Cm 1124
1988 .. .. .. .. .. .. .. Cm 726
1987 .. .. .. .. .. .. .. Cm 415
RESEARCH, DEVELOPMENT AND STATISTICS DIRECTORATE MISSION STATEMENT 2005
RDS is part of the Home Office. The Home Office’s purpose is to build a safe, just and tolerant society in whichthe rights and responsibilities of individuals, families and communities are properly balanced and the protectionand security of the public are maintained.
RDS is also a part of National Statistics (NS). One of the aims of NS is to inform Parliament and the citizen aboutthe state of the nation and provide a window on the work and performance of government, allowing the impact ofgovernment policies and actions to be assessed.
Therefore
The Research, Development and Statistics Directorate exists to improve policy making, decision takingand practice in support of the Home Office purpose and aims, to provide the public and Parliament withinformation necessary for informed debate and to publish information for future use.
1
CONTENTS
PageMain points and commentary
Section 1: SummaryTable1.1 Control of immigration: statistical summary, 1994-2004 .. .. .. .. .. .. ..
Section 2: Entry control at the portsTable2.1 Passenger arrivals and removals, 1994-2004 .. .. .. .. .. .. .. ..2.2 Passengers given leave to enter the United Kingdom by purpose of journey, and passengers
refused entry at port and subsequently removed, by nationality, excluding EEA nationals andSwitzerland, 2004 .. .. .. .. .. .. .. .. .. .. .. .. ..
2.3 Passengers given leave to enter the United Kingdom by purpose of journey, and passengersrefused entry at port and subsequently removed, excluding EEA nationals and Switzerland,1994-2004 .. .. .. .. .. .. .. .. .. .. .. .. .. ..
2.4 Work permit holders and dependants given leave to enter, excluding EEA nationals andSwitzerland, 1994-2004 .. .. .. .. .. .. .. .. .. .. .. ..
2.5 Passengers given limited leave to enter as husbands, wives, children, or for marriage,excluding EEA nationals and Switzerland, 1994-2004 .. .. .. .. .. .. ..
Section 3: AsylumTable3.1 Applications, decisions and other information for those applying for asylum in the United
Kingdom, excluding dependants, 1996-2004 .. .. .. .. .. .. .. ..3.2 Applications received for asylum in the United Kingdom, excluding dependants, by nationality,
1996-2004 .. .. .. .. .. .. .. .. .. .. .. .. .. ..3.3 Initial decisions on applications received for asylum in the United Kingdom, excluding
dependants, by nationality, 2004 .. .. .. .. .. .. .. .. .. ..3.4 Asylum appeals to the immigration adjudicators, tribunal and applications for Judicial Review,
2000-2004 .. .. .. .. .. .. .. .. .. .. .. .. .. ..3.5 Summary of applications for support and other information for those applying to the National
Asylum Support Service (NASS) in the United Kingdom, 2003 and 2004 .. .. ..3.6 Number of asylum seekers (including dependants) in receipt of support from NASS by
government office region of the United Kingdom, as at end of December 2004 .. ..3.7 Asylum seekers, including dependants, supported by NASS, by type of support, 2004 ..
Section 4: After-entry controlTable4.1 Grants and refusals of extensions of leave to remain in the United Kingdom and settlement,
by category and nationality, excluding EEA nationals and Switzerland, 2004 .. .. ..4.2 Decisions on applications for an extension of leave to remain in the United Kingdom and
settlement, by category, excluding EEA nationals and Switzerland, 2001-2004 .. ..4.3 Issue and refusal of residence documentation (excluding Worker Registration Scheme) to
EEA nationals and their family members, by nationality, 2004 .. .. .. .. ..
2
4
26
29
30
36
38
40
42
43
44
45
46
4747
50
56
57

Section 5: Acceptances for settlement PageTable5.1 Grants of settlement, by nationality and category, excluding EEA nationals and Switzerland,
2004 .. .. .. .. .. .. .. .. .. .. .. .. .. .. ..5.2 Grants of settlement on removal of time limit, by broad nationality, gender and age, excluding
EEA nationals and Switzerland, 2004 .. .. .. .. .. .. .. .. .. ..5.3 Grants of settlement by category of grant, excluding EEA nationals and Switzerland,
1994-2004 .. .. .. .. .. .. .. .. .. .. .. .. .. ..5.4 Grants of settlement, by main category and broad nationality, including EEA nationals and
Switzerland, 1994-2004 .. .. .. .. .. .. .. .. .. .. .. ..5.5 Grants of settlement by nationality, excluding EEA nationals and Switzerland, 1994-20045.6 Grants of settlement – Commonwealth citizens and foreign nationals, 1960-2004 .. ..
Section 6: Enforcement of immigration lawTable6.1 Persons removed from the United Kingdom and those subject to enforcement action,
1994-2004 .. .. .. .. .. .. .. .. .. .. .. .. .. ..6.2 Persons removed from the United Kingdom as a result of enforcement action, 1994- 2004 ..6.3 Persons recorded as being in detention in the UK solely under Immigration Act powers as at
25 December 2004, by gender, length of detention and place of detention .. .. ..6.4 Persons recorded as being in detention in the UK solely under Immigration Act powers as at
25 December 2004, by nationality .. .. .. .. .. .. .. .. .. ..6.5 Persons proceeded against for offences under the Immigration Acts 1971 to 1999 in England
and Wales, 2000-2004 .. .. .. .. .. .. .. .. .. .. .. ..
Section 7: Appeals against immigration control decisionsTable7.1 Outcome of appeals to immigration adjudicators, by broad category, 1997-2004 .. ..
Section 8: Net migrationTable8.1 Net international migration to/from the United Kingdom, by nationality, 1995-2004.. ..
Changes affecting statistics of immigration control .. .. .. .. .. .. .. .. ..
Explanatory notes and definitions .. .. .. .. .. .. .. .. .. .. .. ..
3
62
68
69
707275
7778
79
80
81
83
83
85
90

4

1. MAIN POINTS
On-entry control
The number of international arrivals from outside the Common Travel Area rose 7 per cent to 97.2 millionin 2004. 12.0 million were non-EEA nationals, a 1 per cent fall on 2003 (paragraphs 2.1 and 2.2).
The total number of work permit holders and dependants admitted to the UK was 124,000 in 2004, anincrease of 4 per cent (paragraph 2.7).
Passengers refused entry at port and subsequently removed from the UK decreased from 37,825 in 2003to 31,545 in 2004. (paragraph 2.14).
Asylum
Excluding dependants, the number of asylum applications received in 2004 was 33,960, 31 per cent lessthan in 2003 (49,405). The highest numbers of applications were from nationals of Iran, Somalia, China,Zimbabwe, and Pakistan. Including dependants, the number of asylum applications was 40,625 in 2004, 32per cent less than in 2003 (60,045) (paragraphs 3.1, 3.2 and 3.3).
46,020 initial decisions were made on asylum applications in 2004, 29 per cent less than in 2003 butsignificantly higher than applications; hence the number of cases awaiting initial decision fell to 9,700, thelowest level for a decade (paragraph 3.4)
IAA Adjudicators determined 55,975 asylum appeals in 2004 – 19 per cent were allowed and 78 per centdismissed (paragraph 3.13).
Overall, an estimated 24 per cent of the applications in 2004 resulted in grants of asylum (4 per cent) or ofhumanitarian protection or discretionary leave (11 per cent), or in allowed appeals (10 per cent) (paragraph3.16).
Asylum removals (including assisted returns and some voluntary departures) fell by 3 per cent in 2004 to12,585, excluding dependants. Including dependants, 14,905 failed asylum seekers were removed in 2004,17 per cent less than in 2003 (17,895) (paragraphs 3.23 and 3.24).
After-entry control
There was a 21 per cent decrease in the number of after-entry decisions in 2004. The number of decisionson applications to vary conditions of leave fell from 485,860 in 2003 to 384,890 in 2004 (including settlementbut excluding asylum cases and dependants of principal applicants) (paragraph 4.1).
Main categories showing the largest decreases were: students (18 per cent); settlement (33 per cent); workpermit holders (24 per cent) and business (32 per cent) (paragraph 4.1).
Of the total number of decisions in 2004, 75 per cent were grants of an extension, 17 per cent were grantsof settlement, and 8 per cent were refusals. Student cases were the largest group, accounting for 41 percent of the total number of decisions (paragraphs 4.2 and 4.3).
Grants of settlement
Grants of settlement in 2004 totalled 139,260 slightly less than in 2003 (paragraph 5.1).
Of the total number of grants in 2004, by far the greatest proportion was in dependant-related categories.Children account for 29 per cent, wives accounted for 18 per cent of the total, while husbands account for9 per cent. (paragraph 5.5).
28 per cent of grants of settlement in 2004 were from Africa; Europe accounted for 19 per cent, the Indiansub-continent accounted for 17 per cent. The Remainder of Asia accounted for 16 per cent, the Americas10 per cent, Oceania 4 per cent and the Middle East 4 per cent (paragraph 5.4).
5

Removals and Enforcement of immigration law
The total number of persons removed from the UK in 2004 was 56,920, a decrease of 12 per cent on theprevious year. This includes the removal of 12,585 persons who had claimed asylum at some stage asprincipal applicants (paragraphs 6.2 and 6.3).
Of the total number of removals, 58 per cent were removed after having been initially refused at a port, 37per cent were removed as a result of enforcement action and 4 per cent left under Assisted Voluntary ReturnProgrammes (paragraph 6.2).
On 25 December 2004 there were 1,950 persons being detained solely under Immigration Act powers inthe UK. Of these, 78 per cent were recorded as having sought asylum at some stage (paragraph 6.8).
Appeals
Immigration adjudicators dealt with 109,220 appeals in 2004, 1 per cent more than in 2003. 31 per cent ofthese appeals were allowed, 66 per cent were dismissed and 2 per cent were withdrawn (paragraphs 7.1and 7.2).
Net Migration
In 2004 there was an estimated net inward migration of 222,600 persons, almost 50 per cent higher than2003 (paragraph 8.3).
Points to note
On 1 May 2004, Czech Republic, Cyprus, Estonia, Hungary, Latvia, Lithuania, Malta, Poland, Slovakia andSlovenia all joined the EEA. Tables in sections 2, 4 and 5 within this publication have been compiled to includedata on these countries up to 1 May 2004. The Home office bulletin “Control of Immigration: Statistics UnitedKingdom, 2004” published in August 2005 contained a range of figures calculated for 2003 and 2004 whichexcluded these countries to enable easier comparisons. The bulletin can be found on the RDS website athttp://www.homeoffice.gov.uk/rds/immigration1.html
There is currently a National Statistics review of Home Office immigration and asylum publications. The review,details of which can be found on the Home Office Research, Development and Statistics website athttp://www.homeoffice.gov.uk/rds/statsprog1.html, is due to be completed in late 2005.
6

2. ENTRY CONTROL AT PORTS
Passenger admissions and refusals
Total admissions (Tables 2.1 and 2.2)
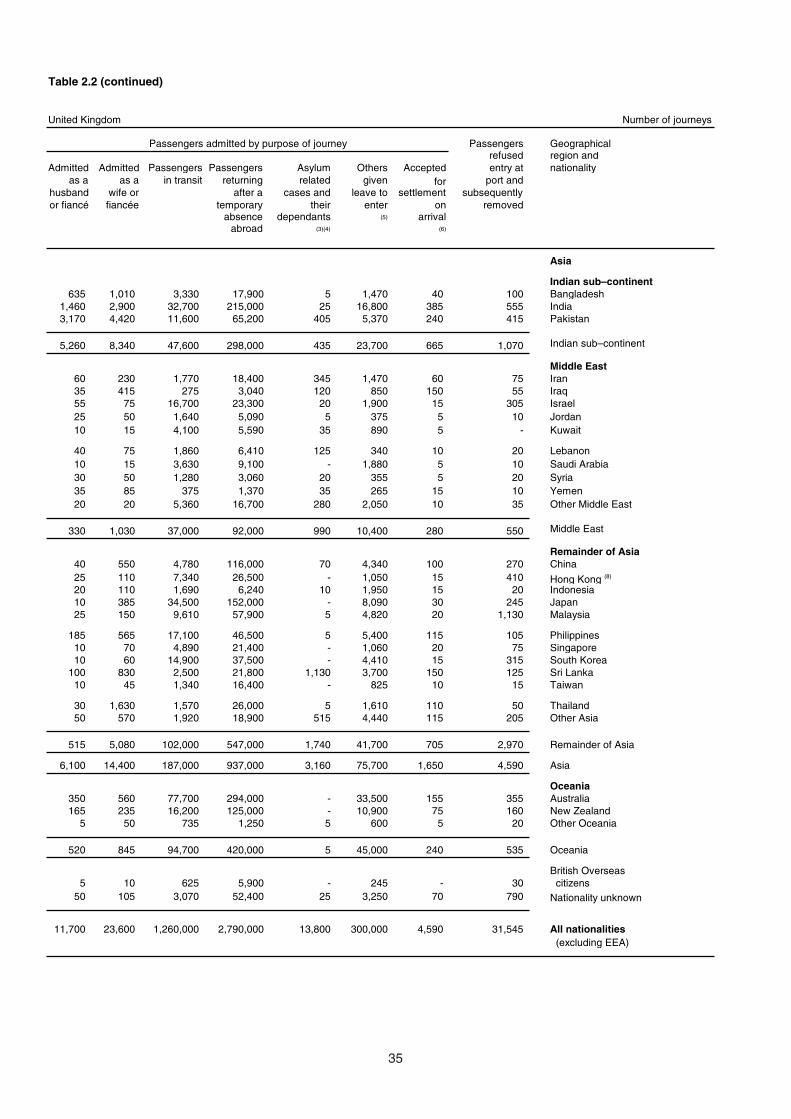
2.1 In 2004, there were 97.2 million international arrivals from outside the Common Travel Area(1), 6.5 million(7 per cent) more than in 2003. The majority were British or EEA nationals, but around 12.0 million were non-EEAnationals, a decrease of 1 per cent on 2003. Figure 1 shows the total non-EEA admissions since 1994, brokendown by broad purpose of journey – 60 per cent of all admissions were visitors (47 per cent ordinary visitors, 13per cent business visitors).
2.2 The decrease in non-EEA admissions in 2004 of 1 per cent has been affected by the change in coveragewhen the accession states(2) joined the EEA on 1 May 2004. The decrease was primarily due to a fall in bothordinary and business visitors, down 4 per cent to 7.2 million. However, the number of other admissions increasedby just over 175,000 (4 per cent) to 4.8 million.
2.3 The 12.0 million non-EEA passengers admitted in 2004 comprised 5.4 million from the Americas, 3.2million from Asia, 1.2 million from both Africa and Oceania, and 1.0 million from Europe. All regions showed anincrease compared with 2003 except Europe(3), which fell 40 per cent. If accession state nationals are removedfrom both the 2003 and 2004 data there is a 1 per cent increase in the arrivals of European nationals. The largestrise in numbers was from the Americas, up 184,000 (4 per cent) from 2003 (see figure 2).
2.4 Citizens of the USA comprised 34 per cent of total non-EEA admissions, the largest single nationality byfar, representing a rise of 2 per cent to 4.0 million in 2004. The next three largest nationalities were Australia (up12 per cent to 917,000), Canada (up 9 per cent to 852,000) and India (up 6 per cent to 616,000). The country withthe largest percentage increase on 2003 was Thailand (up 44 per cent to 75,000); this was followed by Iraq (up40 per cent to 12,000) and Hong Kong(4) (up 25 per cent to 91,300).
7
TOTAL ADMISSIONS (1) 1994 TO 2004
0
2
4
6
8
10
12
14
1994 1995 1996 1997 1998 1999 2000 2001 2002 2003 2004
Visitors OthersMillions of journeys
Figure 1
(1) Excluding EEA nationals.(2) Includes nationals of Czech Republic, Cyprus, Estonia, Hungary, Latvia, Lithuania, Malta, Poland, Slovakia and Slovenia before 1 May 2004, but excludes them from this date.
(2)
(1) The Common Travel Area consists of the United Kingdom, the Channel Islands, the Isle of Man and the Republic of Ireland.(2) Czech Republic, Cyprus, Estonia, Hungary, Latvia, Lithuania, Malta, Poland, Slovakia and Slovenia.(3) Excludes EEA nationals and nationals of accession states (from 1 May 2004).(4) Hong Kong (Special Administrative Region of China) – see Explanatory Notes paragraph 7.

Visitors and students (Tables 2.2 and 2.3)
2.5 7.2 million non-EEA visitors were admitted in 2004 compared with 7.5 million in 2003. The decrease of 4%in 2004 reflected the fall in numbers from Europe3 (down 48 per cent to 0.5 million) as a result of the change incoverage when the accession states2 joined the EEA on 1 May 2004. This was offset by a rise in numbers fromthe Americas (up 1 per cent to 3.7 million), Asia (up 1 per cent to 1.7 million), Oceania (up 16 per cent to 632,000),and Africa (up 5 per cent to 626,000).
2.6 294,000 non-EEA students were admitted in 2004 compared with 319,000 in 2003. The decrease of 8 percent reflected the fall in numbers from Europe3 (down 42 per cent to 37,100), Oceania (down 18 per cent to 2,290)and Asia (down 1 per cent to 136,000). This was offset by a rise in numbers from the Americas (up 4 per cent to92,600), and Africa (up 1 per cent to 24,600).
Work permit holders (Tables 2.2, 2.3 and 2.4)
2.7 124,000 non-EEA nationals were admitted as work permit holders or as their dependants in 2004,compared with 119,000 in 2003, up 4 per cent (EEA nationals do not require a work permit). The number of permitholders coming for 12 months or more decreased by 5 per cent to 42,200 in 2004 while those coming for less than12 months increased by 10 per cent to 40,400.
2.8 There were increases in work permit holders and dependants from the Indian sub-continent (up 40 percent to 35,800), and the Americas (up 1 per cent to 29,400) but decreases from all other regions including a 16per cent fall from Oceania to 5,950 and a 13 per cent fall from Europe3 to 15,500. 48 per cent of the total workpermit holders and dependants in 2004 were from Asia; of these the largest number, 30,100 (24 per cent) werefrom India, 29,400 (24 per cent) were from the Americas (nationals of USA accounted for nearly three-quarters ofthese), 15,500 (12 per cent) from Europe and 13,900 (11 per cent) from Africa.
2.9 The number of dependants of work permit holders increased by 10 per cent to 41,500; they now accountfor 33 per cent of the total numbers of permit holders and dependants, the highest proportion for the last ten years.By region this proportion varies from 47 per cent for African nationals to 13 per cent of those from Europe3.
8
TOTAL ADMISSIONS, EXCLUDING EEA NATIONALS, BY NATIONALITY, 2004(1)
(Total number of journeys 12,000,000)
Middle East and Remainder of Asia
19%
Europe8%
Africa10%Indian sub-continent
7%
Oceania10%
Others1%
Americas45%
Figure 2
(1) Includes nationals of Czech Republic, Cyprus, Estonia, Hungary, Latvia, Lithuania, Malta, Poland, Slovakia and Slovenia before 1 May 2004, but excludes them after this date.

Admissions for a limited period prior to settlement (Tables 2.3 and 2.5)
(i) Spouses, fiancé(e)s and children (Table 2.5)
2.10 Admissions of husbands and male fiancés totalled 11,725 in 2004, 22 per cent more than in 2003. 45 percent (5,265) of the husbands and male fiancés admitted in 2004 were from the Indian sub-continent, compared to48 per cent (4,595) in 2003.
2.11 Admissions of wives and female fiancées totalled 23,615 in 2004, 9 per cent more than in 2003. Thisincrease reflected rises in wives and female fiancées from Africa (up 20 per cent to 3,050) and Asia other thanthe Indian sub-continent (up 17 per cent to 6,105). 61 per cent (14,445) of the wives and female fiancées admittedin 2004 were from Asia.
2.12 The number of children admitted for a probationary year was 4,260 in 2004, 2 per cent more than in 2003.55 per cent (2,325) of the children admitted in 2004 were from Asia.
(ii) Commonwealth citizens with a UK born grandparent (Table 2.3)
2.13 7,700 Commonwealth citizens with a grandparent born in the United Kingdom were admitted in 2004 totake or seek employment, 16 per cent (1,460) less than in 2003. Commonwealth citizens with a UK-borngrandparent are eligible for settlement after a four year qualifying period.
Passengers refused entry and subsequently removed (Table 2.2)
2.14 Some 31,545 non-EEA passengers were refused entry at port and subsequently removed from the UnitedKingdom in 2004. This compared with 37,825 in 2003, a decrease of 17 per cent.
9
NON EEA PASSENGERS REFUSED ENTRY AT PORT AND SUBSEQUENTLY REMOVED FROM THE UNITED KINGDOM,
1994 TO 2004
0
10,000
20,000
30,000
40,000
50,000
60,000
1994 1995 1996 1997 1998 1999 2000 2001 2002 2003 2004
Figure 3
Number of persons

3. ASYLUM
Applications for asylum (Tables 3.1 and 3.2)
3.1 Excluding dependants, the number of asylum applications received in 2004 was 33,960, 31 per cent lessthan in 2003 (49,405). Including dependants, the number of asylum applications was 40,625 in 2004, 32 per centless than in 2003 (60,045).
3.2 The proportion of applications made in-country (that is, by people who had already entered the UK, ratherthan at port) was 78 per cent in 2004, compared with 72 per cent in 2003 and 68 per cent in 2002.
3.3 The nationalities accounting for the most applicants in 2004 were Iran, Somalia, China, Zimbabwe andPakistan. Compared with 2003, applications fell from nationals of Somalia (from 5,090 to 2,585), Iraq (from 4,015to 1,695), Zimbabwe (from 3,295 to 2,065) and Turkey (from 2,390 to 1,230). Applications increased from Iraniannationals (rising from 2,875 to 3,455), and Sudanese nationals (from 930 to 1,305).
Initial decisions on asylum applications (Tables 3.1 and 3.3)
3.4 46,020 initial decisions were made in 2004, 29 per cent less than the 64,940 initial decisions made in 2003but significantly higher than the applications in 2004; hence the number of cases awaiting initial decision fell to9,700, the lowest level for a decade. This reflects the continued efforts by IND to reduce the number of casesawaiting an initial decision.
3.5 Of the initial decisions made in 2004, 1,565 (3 per cent) recognised the applicant as a refugee and grantedasylum, 160 (0.3 per cent) were granted humanitarian protection (HP) and 3,835 (8 per cent) granted discretionaryleave (DL) and 40,465 (88 per cent) were refusals. The proportion granted asylum in 2004 fell from 6 per cent in2003, and the proportion granted HP or DL fell slightly from the 11 per cent granted ELR, HP or DL in 2003.
10
12,44016,590
23,345
29,45525,935 24,865 26,560
13,720
7,550
17,205
15,915
22,670
41,70054,380
46,160
57,570
35,685
26,410
-
10,000
20,000
30,000
40,000
50,000
60,000
70,000
80,000
90,000
1996 1997 1998 1999 2000 2001 2002 2003 2004
Applied in-country
Applied at port
Figure 4 APPLICATIONS FOR ASYLUM IN THE UK,BY LOCATION OF APPLICATION, 1996 TO 2004
(PRINCIPAL APPLICANTS)Number of principal applicants

3.6 In 2004, the number of grants of asylum fell to their lowest level since 1995. This was mainly due to thelower number of initial decisions and falls of 73 per cent in grants of asylum to nationals of Somalia and 75 percent to nationals of Zimbabwe.
3.7 The main nationalities to be granted HP or DL in 2004 were Somalia (12 per cent), Afghanistan (10 percent) and Bangladesh (7 per cent). Unaccompanied children accounted for 63 per cent of total grants of HP andDL; despite only accounting for 7 per cent of initial decisions.
3.8 40,465 cases were refused in 2004, less than the 53,865 refusals in 2003, reflecting a lower level of initialdecisions. A greater proportion of initial decisions in 2004 were refusals (88 per cent in 2004 compared with 83per cent in 2003).
3.9 The top nationalities accounting for the most refusals were Iraq 4,615 refusals (96 per cent of initialdecisions), Iran 3,590 (92 per cent), China 2,525 (96 per cent), Somalia 2,355 (72 per cent) and Zimbabwe 2,310(90 per cent).
Asylum cases outstanding (Table 3.1)
3.10 As at 31 December 2004, approximately 9,700 asylum applications were awaiting an initial decision,compared with 23,900 at the end of December 2003; this was the lowest level for a decade and reflected higherlevels of initial decisions and withdrawals than applications during 2004. Of the 9,700 outstanding cases, 5,600cases were work in progress, i.e. the application had been received within the previous 6 months.
3.11 As at 31 December 2004, there were approximately 5,000 appeals lodged with the Home Office which hadnot been sent to the Immigration Appellate Authority (IAA); a proportion of appeals lodged do not result in appealbundles being sent to the IAA. The total asylum work in progress in the IAA as at 31 December 2004, was 21,600(10,300 at the Adjudicator Tier, 6,200 applications for permission to appeal to the Tribunal, and 5,200 TribunalAppeals).
Asylum appeals (Table 3.4)
3.12 In 2004, a total of 35,110 asylum appeals were received by the Home Office, 24 per cent less than in 2003,reflecting lower levels of initial decisions. During 2004, 47,000 appeals were prepared for hearing by the HomeOffice and passed to the Immigration Appellate Authority (IAA), compared with 70,575 in 2003.
11
INITIAL DECISIONS, 1996 TO 2004 (PRINCIPAL APPLICANTS)
0
20,000
40,000
60,000
80,000
100,000
120,000
140,000
1996 1997 1998 1999 2000 2001 2002 2003 2004
Figure 5Number of principapplicants
Refused under backlog criteria(1)
Refused
Granted leave under backlog criteria(1)
Granted ELR, HP or DL(2)
Granted asylum
(1) Cases decided under pragmatic measures aimed at reducing the pre-96 asylum backlog.(2) Humanitarian Protection and Discretionary Leave replaced Exceptional Leave to Remain from 1 April 2003.
al

3.13 Adjudicators determined 55,975 asylum appeals in 2004, a third (32 per cent) less than in 2003. Of these55,975 appeals, 10,845 (19 per cent) were allowed, 43,760 (78 per cent) were dismissed and the remainder werewithdrawn (includes cases recorded as abandoned). This compares with 20 per cent allowed and 78 per centdismissed in 2003.
3.14 29,265 applications for permission to appeal to the Immigration Appeal Tribunal were submitted in 2004,16 per cent less than 2003 (34,955). The majority of applications for permission are not allowed. The Tribunaldetermined 8,785 appeals in 2004, 7 per cent fewer than in 2003. Excluding cases remitted back to IAAadjudicators for further consideration, the majority (77 per cent) of appeals determined in 2004, brought byappellants were dismissed. Correspondingly 51 per cent of those appeals determined in 2004 that were broughtby the Secretary of State were allowed.
3.15 1,370 applications for permission to apply for Judicial Review in asylum related cases were lodged in2004, 37 per cent lower than 2003 (2,170). Of the 1,130 decisions made in 2004, 130 (11 per cent) were grantedpermission to apply. Of the 45 Judicial Review hearings determined in 2004, 33 per cent were allowed and 65 percent dismissed (the remainder were withdrawn).
Overall proportion of applicants granted asylum, HP or DL at initial decision or appeal allowed
3.16 It is estimated that a nearly a quarter (24 per cent) of applications in 2004 resulted in the granting ofasylum (4 per cent) or of HP or DL (11 per cent) or in appeals that were allowed by the IAA adjudicators (a further10 per cent) (NB. Based on cases where data are available, around 75 per cent of initial refusals of applicationsmade in 2004 resulted in an appeal; and around a fifth of appeals are allowed). This estimate includes allowancefor the outcomes of cases that are reconsidered. This is an estimate because a proportion of applications madein 2004 are still awaiting the outcome of an appeal.
Outcomes of assessments of eligibility for support from the National Asylum Support Service underSection 55
3.17 Interviewing and assessments of eligibility under section 55 were suspended on 21 May 2004 followingthe Court of Appeal’s judgement in the cases of Limbuela, Tesema and Adam. (see Explanatory Notes paragraph34) The effect of the judgement was that National Asylum Support Service (NASS) should not refuse supportunder section 55 to an asylum seeker unless it is positively satisfied that the individual concerned does have somealternative form of support available to him/her. This explains the comparatively low numbers of cases, which weredeemed ineligible for NASS support compared to 2003.
Of the total (10,570) cases referred to NASS for a Section 55 decision in 2004:
● 1,360 were notified that they were ineligible for NASS support on the grounds that their claims werenot made as soon as reasonably practicable;
● 9,215 were deemed eligible for NASS support on the grounds that they were made as soon asreasonably practical, they had dependants aged under 18 or that failure to provide support may leadto a breach of ECHR.
Asylum applicants supported by the National Asylum Support Service (Tables 3.5 to 3.7)
3.18 Applications for NASS support fell in 2004 (32,090), and were 13 per cent lower than 2003 (37,000). Thiswas in line with lower asylum applications. Continuing high levels of terminations (40,660), resulted in the numberssupported at the end of 2004 (66,705) being 26 per cent lower than at the end of 2003 (90,075).
3.19 In 2004, the NASS received 32,090 applications for asylum support from asylum seekers in the UK. Of these,
● 18,030 were applications for accommodation support (either both accommodation and subsistenceor accommodation only);
● 10,400 were for subsistence-only support;
12

● 3,665 were either applications that were deemed invalid(5) or applications where the type of supporthas not been identified.
3.20 The proportion of applications that were deemed invalid, or applications where the type of support has notbeen identified, rose from 8 per cent in 2003 to 11 per cent in 2004.
3.21 As at the end of December 2004, 66,705 asylum seekers (including dependants) were being supportedby NASS(6). 40,750 asylum seekers (including dependants) were being supported in NASS accommodation and20,875 were receiving subsistence-only support and 5,080 were supported in initial accommodation(7)
3.22 Asylum seekers supported in NASS accommodation are dispersed throughout the UK. At the end ofDecember 2004, the top three dispersal regions in England were Yorkshire and the Humber (9,370 asylumseekers, including dependants), the North West (6,430) and the West Midlands (6,310). The top three dispersaltowns in England were Leeds (2,200), Birmingham (1,835) and Sheffield (1,350). Asylum seekers are alsodispersed to Scotland (Glasgow City 5,790) and Wales (2,345) and are accommodated in Northern Ireland if theyapply for asylum in Northern Ireland.
Asylum removals
3.23 12,585 principal asylum applicants were removed from the UK in 2004, (including assisted returns andsome voluntary departures following enforcement action), a fall of 3 per cent on 2003 (13,005). 2,300 principalapplicants left under Assisted Voluntary Return Programmes run by the International Organisation for Migration,an increase of 31 per cent on 2003 (1,755). The nationalities with the largest number of principal applicantsremoved or departing voluntarily in 2004 were Serbia & Montenegro State Union nationals (1,990), Afghan (795),Iraqi (770), Albanian (690) and Romanian (515).
3.24 Including dependants, 14,905 asylum seekers were removed in 2004, 17 per cent less than in 2003(17,895). Data on dependants removed have only been collected since April 2001.
Further information
3.25 Further information on asylum applications and decisions in the years 1996-2004 is published in the latestHome Office Statistical Bulletin, Asylum Statistics United Kingdom 2004 which is obtainable free of charge fromthe address in the Explanatory Notes and Definitions paragraph 49, and from the RDS websitehttp://www.homeoffice.gov.uk/rds/immigration1.html.
13
(5) Invalid applications include those made from individuals previously notified that they were ineligible for NASS support under Section 55 of the NIA Act 2002,which came into force on 8 January 2003.
(6) Excludes unaccompanied asylum seeking children supported by local authorities, estimated at around 6,000 in March 2005.Excludes cases that pre-datethe establishment of NASS in April 2000, administered under arrangements with local authorities, estimated at up to 6,000 cases in March 2005 (the numberof such cases is falling).
(7) Including those in induction centres. See Explanatory note 35.

4. AFTER-ENTRY CONTROL
Decisions on after-entry applications to vary leave (excluding asylum) (Tables 4.1 and 4.2)
4.1 There was a fall in the number of non-asylum after-entry decisions in 2004 to 384,890(8), a decrease of 21per cent on the previous year. This includes applications for settlement but excludes dependants of principalapplicants. There were large decreases in nearly all categories, the most significant of which were:
● students – down 18 per cent to 156,485 decisions;● settlement – down 33 per cent to 71,500 decisions;● work permit holders – down 24 per cent to 60,440 decisions;● business – down 32 per cent to 17,555 decisions.
These decreases were partly offset by increases in the number of decisions in the permit free (up 35 per cent to15,445) and trainee (up 17 per cent to 12,550) categories.
4.2 Of the total decisions in 2004, 287,890 (75 per cent) were grants of an extension, 64,665 (17 per cent)were grants of settlement and 32,335 (8 per cent) were refusals. The overall refusal rate rose from 6.8 per cent to8.4 per cent between 2003 and 2004.
4.3 Figure 6 shows the total number of decisions broken down by category. Student cases were the largestgroup, accounting for 41 per cent of the total. Decisions on settlement cases formed the second largest categoryin 2004, accounting for 19 per cent of the total.
14
Spouses (probationaryyear application)
19,160
Work permit holders60,440
Settlement71,500
Trainees12,550
Students156,485
54,275
Visitors10,480
Figure 6 VARIATION OF LEAVE DECISIONS BY CATEGORY,EXCLUDING EEA NATIONALS AND SWITZERLAND , 2004
(Total number of decisions 384,890)
(1) Excluding the outcome of appeals, withdrawn applications, asylum related-cases and dependents of principal applicants.(2) Includes nationals of Czech Republic, Cyprus, Estonia, Hungary, Latvia, Lithuania, Malta, Poland, Slovakia and Slovenia before 1 May 2004, butexcludes them from this date.
Other limited leave
(2) (1)
(8) Excluding the outcome of appeals, and withdrawn and return of passport cases.

4.4 Figure 7 shows that of the 287,890 persons granted an extension of stay, 86,595 (30 per cent) were fromAsia (excluding the Indian sub-continent), 59,705 (21 per cent) were from Africa, 56,125 (19 per cent) were fromthe Indian sub-continent, 40,675 (14 per cent) were from the Americas, 34,715 (12 per cent) were from Europe(excluding the EEA), and 9,845 (3 per cent) were from Oceania.
4.5 57,655 (39 per cent) of persons granted a student extension were from Asia outside the Indian sub-continent, 34,780 (23 per cent) were from Africa, 25,290 (17 per cent) were from the Americas, 19,695 (13 percent) were from the Indian sub-continent and 11,070 (7 per cent) were from Europe (excluding the EEA). Thenationalities with the most student extensions were China (30,400), India (10,625), Brazil (8,780), Jamaica(6,630), and Pakistan (6,130).
4.6 17,635 (32 per cent) of persons granted an extension of stay as a work permit holder were from the Indiansub-continent, 14,775 (27 per cent) were from the rest of Asia and 11,210 (20 per cent) were from Africa. Oceaniawith 4,215 and the Americas with 4,610 accounted for 8 per cent each and Europe (excluding the EEA) accountedfor 2,705 (5 per cent). The nationalities with the most work permit holder extensions were India (15,310),Philippines (6,885) South Africa (4,290), Australia (2,925) and China (2,520).
4.7 Of the spouses granted a probationary period prior to settlement, the Americas accounted for 4,300 (25per cent), Asia (excluding the Indian sub-continent) accounted for 3,415 (20 per cent), Africa accounted for 3,120(18 per cent), Europe (excluding the EEA) accounted for 2,950 (17 per cent), the India sub-continent accountedfor 2,100 (12 per cent) and 1,275 (7 per cent) were from Oceania. The nationalities with the most extensions inthis category were Jamaica (1,545), USA (1,155), Pakistan (1,110), South Africa (930) and Australia (870).
15
Figure 7 GRANTS OF EXTENSION OF LEAVE (1) BY NATIONALITY ,
EXCLUDING EEA NATIONALS AND SWITZERLAND, 2004(2)
(Total number of grants 287,890)
(2) Includes nationals of Czech Republic, Cyprus, Estonia, Hungary, Latvia, Lithuania, M alta, Poland, Slovakia and Slovenia before 1 May 2004, but excludes them from this date.
(1) Excluding the outcome of appeals, withdrawn applications, asylum related-cases and dependents of principal applicants.
Oceania9,845
Other235
Europe (excluding EEA)34,715
Americas40,675
Africa59,705
Indian sub-continent56,125
Middle East andRemainder of Asia
86,595

5. GRANTS OF SETTLEMENT
Total grants (Tables 5.1 and 5.3)
5.1 The number of persons granted settlement(9) in the United Kingdom in 2004 fell slightly to 139,260. Therewas a 17 per cent increase to 45,625 in grants to those applicants applying in their own right or on a discretionarybasis. There was a decrease of 5 per cent to 89,090 in the number of grants to spouses and dependants. Thesefigures include nationals of accession states(1) granted settlement prior to 1 May 2004.
Grants of settlement by nationality (excluding EEA nationals), category, gender and age (Tables 5.1-5.6)
5.2 In 2004, there were decreases in grants to nationals from the Americas (down 2,335 (14 per cent) to14,130), Africa (down 5,420 (12 per cent) to 39,440), the Indian sub-continent (down 5,250 (18 per cent) to24,240) and Oceania (down 1,435 (20 per cent) to 5,690. There were increases in grants to nationals from Europe(up 11,305 (74 per cent) to 26,600), the Middle East (up 1,025 ( 20 per cent) to 6,045) and the Remainder of Asia(up 2,395 (12 per cent) to 22,830).
5.3 Within Europe, there were substantial rises in grants to nationals of Serbia and Montenegro (up 8,425 (723per cent) to 9,590), Turkey (up 1,695 (39 per cent) to 6,060) and Croatia (up 705 (253 per cent) to 985) due to theFamily ILR Exercise, which allow certain asylum-seeking families who have been in the UK for four or more yearsto obtain settlement – see Changes Affecting Statistics of Immigration Control paragraph 2(xiv).
16
TOTAL GRANTS OF SETTLEMENT, EXCLUDING EEA NATIONALS AND SWITZERLAND, 1994 to 2004(1)
0
10,000
20,000
30,000
40,000
50,000
60,000
70,000
80,000
90,000
100,000
110,000
120,000
130,000
140,000
150,000
1994 1995 1996 1997 1998 1999 2000 2001 2002 2003 2004
Figure 8
Number of persons
(1) Includes nationals of Czech Republic, Cyprus, Estonia, Hungary, Latvia, Lithuania, Malta, Poland, Slovakia and Slovenia before 1 May 2004, but excludes them after this date.
(9) See Explanatory Notes and definitions paragraph 37.

5.4 There was a change in the relative importance of each geographical area. Europe and the Remainder ofAsia increased their respective shares of the total number of grants: Europe from 15,295 (11 per cent) in 2003 to26,600 (19 per cent) in 2004, and the Remainder of Asia from 20,435 (15 per cent) to 22,830 (16 per cent). Theproportion of grants in the Americas, Africa, the Indian sub-continent, and Oceania fell: the Americas from 16,465(12 per cent) in 2003 to 14,130 (10 per cent) in 2004, Africa from 44,860 (32 per cent) to 39,440 (28 per cent),the Indian sub-continent from 29,490 (21 per cent) to 24,240 (17 per cent) and Oceania from 7,125 (5 per cent)to 5,690 (4 per cent). The proportions of grants to nationals from the Middle East remained unchanged at4 per cent.
17
GRANTS OF SETTLEMENT,EXCLUDING EEA NATIONALS AND SWITZERLAND, 1994 to 2004(1)
0
20,000
40,000
60,000
80,000
100,000
120,000
140,000
160,000
1994 1995 1996 1997 1998 1999 2000 2001 2002 2003 2004
Rest of the World
Other Asia
Indian sub-continent
Africa
Figure 9
Number of persons
(1) Includes nationals of Czech Republic, Cyprus, Estonia, Hungary, Latvia, Lithuania, Malta, Poland, Slovakia and Slovenia before 1 May 2004,but excludes them after this date.
GRANTS OF SETTLEMENT BY NATIONALITY, EXCLUDING EEA NATIONALS AND SWITZERLAND,
2003 (Total number of persons 139,280)
Indian sub-continent21%
Middle East4%
Remainder of Asia15%
Oceania5%
Europe (excluding EEA)11%
Africa34%
Other0%
Americas12%
Figure 10GRANTS OF SETTLEMENT BY NATIONALITY,
EXCLUDING EEA NATIONALS AND SWITZERLAND,
2004(1)
(Total number of persons 139,260)
Indian sub-continent21%
Middle East4%
Remainder of Asia14%
Oceania5%
Americas12%
Europe (excluding EEA)11%
Africa32%
Other1%
(1) Includes nationals of Czech Republic, Cyprus, Estonia, Hungary, Latvia, Lithuania, Malta, Poland, Slovakia and Slovenia before 1 May 2004, but excludes them after this date.

5.5 More detailed points of note in the numbers accepted in particular categories and from different regionsof the world, in 2004 compared with 2003, are as follows:
(a) Grants of settlement to all spouses and dependants decreased by 5 per cent to 89,090. Thisaccounted for 64 per cent of all settlement, a similar proportion to 2003. This includes the grants on thebasis of family formation and reunion as well as grants to dependants of persons granted settlement intheir own right (e.g. employment and asylum-related dependants).
(b) Grants of settlement to husbands fell by 34 per cent to 12,645 (this was 9 per cent of allsettlement). 3,505 (28 per cent) of the grants to husbands were to those from the Indian sub-continent,2,995 (24 per cent) from Africa, 2,105 (17 per cent) from Asia outside the Indian sub-continent, 1,980 (16per cent) from the Americas, 1,520 (12 per cent) from Europe, and 520 (4 per cent) from Oceania.
(c) Grants of settlement to wives decreased by 33 per cent to 25,235 (18 per cent of all settlement).6,275 (25 per cent) of the grants to wives were to those from the Indian sub-continent, 5,740 (23 per cent)from Europe, 5,265 (21 per cent) from Asia (excluding the Indian sub-continent), 4,040 (16 per cent) fromAfrica, 2,990 (12 per cent) from the Americas and 885 (4 per cent) from Oceania.
(d) The drop in grants to husbands and wives reflects a change in the qualifying period for spousesgranted settlement on the basis of marriage – see Changes Affecting Statistics of Immigration Controlparagraph 2(xii). This was partly offset by an increase in husbands and wives granted settlement at thesame time as their spouse, partly due to the Family ILR Exercise
(e) Grants of settlement to children increased by 49 per cent to 40,820 (29 per cent of all settlement).This was mainly due to the Family ILR exercise – see Changes Affecting Statistics of Immigration Controlparagraph 2(xiv). 13,195 (32 per cent) of the grants of settlement to children were from Africa, 10,065 (25per cent) from Europe, 7,820 (19 per cent) from Asia (excluding the Indian sub-continent), 5,310 (13 percent) from the Indian sub-continent, 3,800 (9 per cent) from the Americas, and 540 (1 per cent) fromOceania.
(f) In 2004, grants of settlement to elderly parents and grandparents joining children or grandchildrenfell by 36 per cent to 1,985 (1 per cent of all settlement). Around 95 per cent of these were accepted afterentry.
(g) Grants of settlement on completion of four years in employment with a work permit increased by76 per cent to 16,205 (12 per cent of all settlement). Of the total in 2004, the nationalities with the highestnumbers of grants were the Philippines (3,650), India (2,875), South Africa (1,735), USA (1,155) andAustralia (715).
(h) Grants of settlement to asylum seekers (those granted asylum, those previously grantedexceptional leave and grants under the Family ILR exercise), excluding dependants, rose by 56 per centto 19,030, and represented 14 per cent of all settlement. Of the total in 2004, the nationalities with thehighest numbers of grants were Serbia and Montenegro (2,365), Somalia (1,530), Turkey (1,505), SriLanka (1,380) and Pakistan (955).
(i) Other grants on a discretionary basis, which include grants after a long period of continuousresidence in the UK, fell by 62 per cent to 4,080, representing 3 per cent of all settlement.
18

5.6 The gender balance of all acceptances of non-EEA nationals for settlement (excluding those who obtainedsettlement on arrival(10)) in 2004 was 53 per cent to 47 per cent in favour of females. The proportion varied betweennationality groups, with females accounting for 57 per cent from the Remainder of Asia, 54 per cent from theAmericas, 53 percent from Africa and Oceania, 51 per cent from Europe, 50 percent from the Indian Sub-Continent and 45 per cent from the Middle East.
5.7 The majority of those granted settlement in 2004 were relatively young, with 86,100 (71 per cent) under35 years old. Overall, 38,345 (32 per cent) were aged between 25 and 34, 33,205 (27 per cent) were childrenunder 16, 22,720 (19 per cent) were between 35 and 44, 14,550 (12 per cent) were between 16 and 24, 9,480 (8per cent) were between 45 and 59, and 3,005 (2 per cent) were 60 or over. Those from the Europe and Oceaniawere generally younger, with 14,955 and 4,130 respectively (76 per cent) of grants aged under 35 and those fromthe Americas older with 7,765 (64 per cent) aged under 35.
19
GRANTS OF SETTLEMENT BY CATEGORY,
EXCLUDING EEA NATIONALS AND SWITZERLAND, 2004(Total number of persons 139,260)
12,645
25,235
40,82010,395
Employment and other own right
22,515
Other(3) and unknown
8,625
Refugees and exceptional leave (2)
19,030
Figure 11
(1) Includes nationals of Czech Republic, Cyprus, Estonia, Hungary, Latvia, Lithuania, Malta, Poland, Slovakia and Slovenia before 1 May 2004, but excludes them from this date.(2) Includes grants under the Family ILR exercise.(3) Includes claim to right of abode upheld and other grants and other grants on a discretionary basis.
Husbands
Wives
ChildrenOther dependants
(1)
GRANTS OF SETTLEMENT BY CATEGORY,
EXCLUDING EEA NATIONALS AND SWITZERLAND, 2004(Total number of persons 139,260)
(1)
Figure 11
(10) See Explanatory Notes and definitions paragraph 37.

20
GRANTS OF SETTLEMENT(1) BY AGE, EXCLUDING EEA NATIONALS AND SWITZERLAND, 2004(2)
(Total number of persons 121,305)
14,550
33,205
3,005
9,480 22,720
38,345
(1) Excludes 17,610 persons given settlement on arrival, and a further 345 persons for whom an age analysis is not available.(2) Includes nationals of Czech Republic, Cyprus, Estonia, Hungary, Latvia, Lithuania, Malta, Poland, Slovakia and Slovenia before 1 May 2004, but excludes them from this date.
Figure 12
16 to 24
Under 16
35 to 44
25 to 34
60 and over
45 to 59

6. ENFORCEMENT
6.1 Owing to a change in the working practices of IND, all removals of unsuccessful asylum seekers are nowthe result of enforcement action processes or voluntary returns. This reclassification occurred in February 2003and applied to all asylum removals conducted after 1 January 2004 (see Explanatory Notes paragraph 44).
Removals (Table 6.1)
6.2 The number of persons who were removed or departed voluntarily (either as a result of enforcement actionor under Assisted Voluntary Return Programmes) from the United Kingdom in 2004 was 56,920, a decrease of 12per cent on 2003 (64,390). Excluding dependants of failed asylum seekers, 54,600 persons were removed, ofwhom 58 per cent were removed after having been initially refused entry at a port, 37 per cent were removed asa result of enforcement action, and 4 per cent left under Voluntary Assisted Return Programmes run by theInternational Organisation for Migration.
6.3 Within the total number of persons removed in 2004, 12,585 persons had sought asylum at some stageas principal applicants, 3 per cent less than in 2003 (13,005). 2,300 principal applicants left under AssistedVoluntary Return Programmes run by the International Organisation for Migration, 31 per cent more than in 2003(1,755).
6.4 Of the total number of principal asylum applicants removed or known to have departed voluntarily in 2004,45 per cent were from Asia (excluding the Indian Sub-Continent) and 39 per cent were from Europe. Thenationalities with the largest numbers were Serbia and Montenegro (1,990), Afghan (795), Iraqi (770), Albanian(690) and Romanian (515).
6.5 Including dependants, 14,905 asylum seekers were removed in 2004, 17 per cent less than in 2003(17,895).
21
TOTAL PERSONS REMOVED(1) FROM THE UNITED KINGDOM, 1994 TO 2004
0
10,000
20,000
30,000
40,000
50,000
60,000
70,000
1994 1995 1996 1997 1998 1999 2000 2001 2002 2003 2004
Figure 13
Number of persons
(1) Includes persons known to have departed 'voluntarily' after enforcement action had been initiated against them.
Refused entry at port and subsequently removed
Removed as a result of enforcement action
Left under Assisted Voluntary Return Programmes
Dependants of asylum seekers
Data on dependants of asylum seekers have only been collected since April 2001
Enforcement action (Tables 6.1 and 6.2)
6.6 In 2004, a total of 50,780 people had enforcement action initiated against them. Of these, 72 per cent hadillegal entry initiated against them, 25 per cent had administrative removal action initiated against them and 3 percent were served with deportation orders. Principal asylum applicants accounted for 29,320 (58 per cent) ofpeople against whom enforcement action was initiated, and dependants of asylum seekers made up a further5,330 (10 per cent) of cases. The remaining 16,130 (32 per cent) enforcement notices were served against peoplewho had not claimed asylum.
6.7 Nationals from ten EU accession countries accounted for 1,200 of the persons who had enforcementaction initiated against them, 2 per cent of the total. 96 per cent (1,155) of these people had enforcement actioninitiated against them before 1 May 2004, when these countries joined the EU.
Immigration detention (Tables 6.3 and 6.4)
6.8 On 25 December 2004, there were 1,950 persons being detained solely under Immigration Act powers inthe UK. Of these, 1,515 persons (78 per cent) were recorded as having sought asylum at some stage.The majority(85 per cent) of immigration detainees were being held in Immigration Service Removal Centres, with 13 per centbeing held at prison establishments and 2 per cent at Immigration Short Term Holding Facilities.
6.9 The largest nationalities of detainees were Chinese (205 detainees), Jamaican (190), Nigerian (140),Indian (95) and Turkish (90). 89 per cent of all detainees were male. 35 per cent of detainees had been in detentionfor less than two weeks, 22 per cent for between 15 and 29 days, 18 per cent for between one and two months,11 per cent for between two and four months, and 14 per cent for more than four months.
6.10 On 25 December 2004, 25 people who were detained solely under Immigration Act powers were recordedas being under 18 years old. 63 per cent of these persons had been in detention for 14 days or less, 29 per centfor between 15 and 29 days, and 8 per cent between 1 and 2 months. These individuals were all detained as partof families whose detention, as a group was considered necessary, and include those minors detained with theirfamilies under NSA provisions at Oakington Reception Centre.
Court proceedings (Table 6.5)
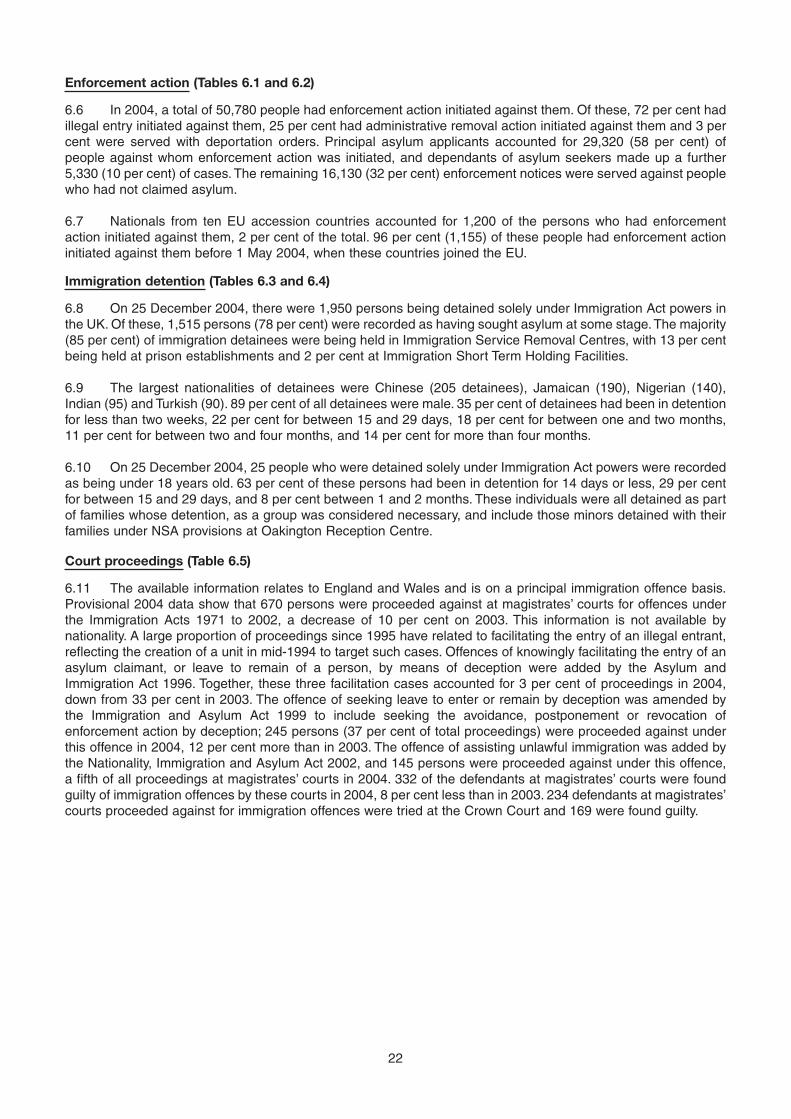
6.11 The available information relates to England and Wales and is on a principal immigration offence basis.Provisional 2004 data show that 670 persons were proceeded against at magistrates’ courts for offences underthe Immigration Acts 1971 to 2002, a decrease of 10 per cent on 2003. This information is not available bynationality. A large proportion of proceedings since 1995 have related to facilitating the entry of an illegal entrant,reflecting the creation of a unit in mid-1994 to target such cases. Offences of knowingly facilitating the entry of anasylum claimant, or leave to remain of a person, by means of deception were added by the Asylum andImmigration Act 1996. Together, these three facilitation cases accounted for 3 per cent of proceedings in 2004,down from 33 per cent in 2003. The offence of seeking leave to enter or remain by deception was amended bythe Immigration and Asylum Act 1999 to include seeking the avoidance, postponement or revocation ofenforcement action by deception; 245 persons (37 per cent of total proceedings) were proceeded against underthis offence in 2004, 12 per cent more than in 2003. The offence of assisting unlawful immigration was added bythe Nationality, Immigration and Asylum Act 2002, and 145 persons were proceeded against under this offence,a fifth of all proceedings at magistrates’ courts in 2004. 332 of the defendants at magistrates’ courts were foundguilty of immigration offences by these courts in 2004, 8 per cent less than in 2003. 234 defendants at magistrates’courts proceeded against for immigration offences were tried at the Crown Court and 169 were found guilty.
22

7. APPEALS
Appeals to Immigration adjudicators (Table 7.1)
7.1 Immigration adjudicators(11) determined a record 109,220 appeals in 2004, slightly (1 per cent) more thanin 2003 (108,350).
7.2 31 per cent of appeals dealt with in 2004 were allowed, 66 per cent were dismissed and 2 per cent werewithdrawn.
7.3 In 2004, the numbers of appeals determined relating to asylum cases fell by 25,750 to 55,975, reflectinglower levels of initial decisions, whilst the numbers of appeals determined on entry clearance and relating to othernon-asylum cases increased. For further details of appeals on asylum cases, see section 3, paragraphs 3.12 to3.16.
7.4 44,375 appeals against refusal of entry clearance were dealt with by immigration adjudicators in 2004, anincrease of 23,330 and more than double the number in 2003 (111 per cent increase). Of these 44,375 appeals,47 per cent were allowed, 51 per cent dismissed and 2 per cent were withdrawn. This compares with 53 per centallowed and 43 per cent dismissed in 2003. For further information on entry control, see section 2.
7.5 There were 8,870 other non-asylum appeals determined by immigration adjudicators in 2004 (relating toafter entry control cases), 59 per cent more than 2003. Of these 8,870 appeals, 29 per cent were allowed, 68 percent were dismissed and 3 per cent were withdrawn. For further information on after-entry control cases, seesection 4.
23
(11) See Explanatory Notes and definitions, paragraph 45.

8. NET MIGRATION
Data from the International Passenger Survey (Table 8.1)
8.1 Estimates of net migration – the balance between inward and outward migration – are produced by theOffice for National Statistics (ONS).These estimates are mainly derived from data on migration intentions obtainedfrom the International Passenger Survey (IPS) – a sample survey of passengers, including British citizens andother EEA nationals, arriving at and leaving ports (air, sea, Channel Tunnel) in the United Kingdom. TheInternational Passenger Survey (IPS) migrant data provides the foundation of the Total International Migrationestimates and is supplemented with the Irish Central Statistics Office (CSO) data on flows to and from the IrishRepublic. The other data sources allow the estimation of adjustments to this data to cover migrants that are notcaptured in these sources. A list of these adjustments and their data sources is given below:
● Home Office data on asylum seekers and their dependants are used to estimate the numbersentering and leaving the UK without being interviewed for the IPS.
● IPS visitor data are used to estimate the number of visitor switchers, people who initially come to orleave the UK for a short period but subsequently stay here or abroad for a year or longer.
● IPS migrant data are used to estimate the number of migrant switchers, people who initially come toor leave the UK for a year or more but subsequently stay here or abroad for less than a year.
Therefore, the data on net migration are subject to sampling and estimation error, and undue weight should notbe given to one year’s data. The methodology used can be found on the National Statistics website:www.statistics.gov.uk/downloads/theme_population/Methodology_for_Revised_International_Migration_Estimates.doc.
8.2 Furthermore the internationally accepted definition used for migration(12) includes temporary migration fora year or longer by, for example, students, workers and asylum seekers. Therefore, inward migration is not thesame as being accepted for settlement, i.e. allowed to stay indefinitely in this country, especially as settlement canoccur several years after entry to the country.
8.3 In 2004 there was an estimated net inward migration of 222,600, almost 50 per cent higher than in 2003.Inward migration has grown from under 100,000 a decade ago to the current levels.
8.4 Over the past decade the UK has experienced a net loss of British citizens and a net gain of non-Britishcitizens. There was a net loss of British citizens of 119,600 people in 2004 and a net gain of non-British citizensof 342,200.
8.5 ONS revised their international migration estimates for 1992 to 2001 in June 2003. Detailed explanationsof how these revised estimates have been produced can be found on the National Statistics website:www.statistics.gov.uk/downloads/theme_population/Methodologyfor_Revised_International_Migration_Estimates.doc
24
(12) See footnote (2) Table 8.1

SECTION 1: Summary
Page
Table 1.1 Control of immigration: statistical summary, 1994-2004 26
25

26
Table 1.1 Control of immigration: statistical summary, 1994-2004United Kingdom
Year/ Passengers Passengers Persons Persons seekingGeographical region given leave refused entry applying for an extension
to enter at port and asylum at of stay - at UK ports subsequently ports or number of
(1) (2) removed in country decisions (3) (2) (3) (4) (5)
1994 9,180,000 17,220 32,830 139,510 1995 9,620,000 19,150 43,960 121,140 1996 10,300,000 21,200 29,640 127,520 1997 10,900,000 24,535 32,500 123,820 1998 11,500,000 27,605 46,015 108,250
1999 12,000,000 31,295 71,160 112,820 2000 13,000,000 38,275 80,315 166,750 2001 12,800,000 37,865 71,025 202,475 2002 12,600,000 50,360 84,130 258,720 2003 12,200,000 38,110 49,405 379,750 (R)
2004 12,000,000 31,930 33,960 (P)
313,390 (P)
Geographical region (10)
2004
Europe 986,000 7,955 3,025 39,275
Americas 5,410,000 11,000 740 44,890
Africa 1,210,000 7,035 14,745 66,915
Indian sub–continent 875,000 1,070 3,625 60,790
Middle East 500,000 550 6,525 7,480
Remainder of Asia 1,780,000 2,970 5,225 83,330
Oceania 1,200,000 535 † 10,440
Other nationalities/ 91,900 815 70 270 countries
(1) Number of journeys rather than number of persons.(2) Excluding EEA nationals from 1994, Swiss nationals from 1 June 2002 and nationals of the Czech Republic, Cyprus, Estonia, Hungary, Latvia, Lithuania, Malta,(2) Poland, Slovakia, and Slovenia from 1 May 2004.
(3) Figures exclude dependants of principal applicants.(4) Excludes asylum related cases.(5) Excludes settlement, the outcome of appeals and withdrawn applications. (6) Excluding EEA nationals from 1999, Swiss nationals from 1 June 2002 and nationals of the Czech Republic, Cyprus, Estonia, Hungary, Latvia, Lithuania, Malta,(6) Poland, Slovakia, and Slovenia from 1 May 2004.
(7) Illegal entrants detected and persons issued with a notice of intention to deport, recommended for deportation or proceeded against under Section 10 of the Immigration and Asylum Act 1999.(8) Includes persons known to have departed 'voluntarily' after enforcement action had been initiated against them.(9) Excludes Assisted Voluntary Returns and 185 accompanying dependants leaving between April 2000 and March 2001.(10) Based on nationality.

27
Table 1.1 (continued)
United Kingdom
Persons Persons Persons Appeals Year/ accepted against whom removed as dealt with by Geographical region
for enforcement a result of immigration settlement action was enforcement adjudicators
(6) initiated action (3)
(7) (8) (9)
55,010 13,310 5,210 28,590 199455,480 16,460 5,080 21,810 199561,730 21,410 5,460 26,990 199658,725 20,000 6,610 34,960 199769,790 21,080 7,320 38,200 1998
97,115 22,950 6,440 28,610 1999125,945 50,570 7,820 27,130 2000108,410 76,110 10,290 56,815 2001115,965 57,735 (R) 14,205 (R) 84,260 2002139,280 (R) .. 19,630 108,350 (R) 2003
139,260 50,780 20,370 (P)
109,220 (P) 2004
Geographical region (10)
2004
26,600 8,220 6,510 .. Europe
14,130 5,035 3,195 .. Americas
39,440 17,980 4,320 .. Africa
24,240 6,255 2,250 .. Indian sub-continent
6,045 7,755 1,745 .. Middle East
22,830 5,330 2,250 .. Remainder of Asia
5,690 50 40 .. Oceania
285 150 65 .. Other nationalities/ countries
SECTION 2: Entry control at the ports
Page
Table 2.1 Passenger arrivals and removals, 1994 to 2004
Table 2.2 Passengers given leave to enter the United Kingdom by purpose of journey, andpassengers refused entry at port and subsequently removed, by nationality, excludingEEA nationals and Switzerland, 2004
Table 2.3 Passengers given leave to enter the United Kingdom by purpose of journey, andpassengers refused entry at port and subsequently removed, excluding EEA nationalsand Switzerland, 1994-2004
Table 2.4 Work permit holders and dependants given leave to enter, excluding EEA nationals andSwitzerland, 1994-2004
Table 2.5 Passengers given limited leave to enter as husbands, wives, children, or for marriage,excluding EEA nationals and Switzerland,1994-2004
Explanatory Notes and Definitions paragraphs 15-19
28
29
30
36
38
40

29
Table 2.1 Passenger arrivals (1)(2) and removals, 1994 to 2004
United Kingdom
YearPassenger arrivals
(number of journeys)
Total Non-EEA British Other EEA Total Of whom, port(2) nationals citizens nationals asylum seekers
(4)(5)(6) (2) and (9) (10)(11)
Switzerland(7)(8)
(millions) (millions) (millions) (millions) (units) (units)
1994 63.0 9.2 41.7 12.1 17,220 1,350
1995 68.1 9.6 44.8 13.7 19,150 1,880
1996 72.5 10.3 46.6 15.6 21,200 2,700
1997 78.6 10.9 51.5 16.2 24,535 4,105
1998 84.4 11.5 57.1 15.8 27,605 3,540
1999 86.4 12.0 58.8 15.6 31,295 4,860
2000(12)89.2 13.0 60.9 15.3 38,275 5,440
2001(12)88.1 12.8 61.1 14.2 37,865 4,175
2002 89.3 12.6 62.1 14.6 50,360 3,730
2003 90.7 12.2 63.4 15.1 38,110 2,980
2004 97.2 12.0 68.2 17.0 31,930 -
(1) International arrivals from outside the Common Travel area (i.e. excluding arrivals from the Irish Republic, Channel Islands and the Isle of Man).(2) Including airside transfer/transit passengers of all nationalities who did not pass through immigration control.(3) Not necessarily in the same year as arrival. (4) Includes people granted leave to enter the UK in the year shown but who may have been temporarily admitted in previous years.(5) Includes Swiss nationals up to quarter 2 2002.(6) Includes nationals of the Czech Republic, Cyprus, Estonia, Hungary, Latvia, Lithuania, Malta, Poland, Slovakia and Slovenia before 1 May 2004, but excludes them from this date.(7) From 1 June 2002 the EEA conferred on Swiss nationals the same rights as those enjoyed by EEA nationals and their family members.(8) Includes nationals of the Czech Republic, Cyprus, Estonia, Hungary, Latvia, Lithuania, Malta, Poland, Slovakia and Slovenia from 1 May 2004.(9) Includes EEA nationals. The totals will therefore differ from those shown in Tables 2.2 and 2.3.(10) Persons who had sought asylum at some point, excluding dependants.(11) Due to a change in the working practices of IND all asylum removals are now classified as enforcement removals - see Explanatory Notes paragraph 44.(12) A change in procedures may have resulted in some under-recording for the fourth quarter of 2000 and the first quarter of 2001.
Persons refused entry at port and
subsequently removed (3)

30
Table 2.2 Passengers given leave to enter the United Kingdom by purpose of journey, and passengers refused Table 3.1 entry at port and subsequently removed, by nationality, excluding EEA nationals and Switzerland, 2004 (1)
United Kingdom Number of journeys
Geographicalregion andnationality Total Visitors Students Au pairs Work permit holders Dependants
admitted of ordinary business Employment Employment work
for for permit 12 months less than holders
or more 12 months(2)
All nationalities (excluding EEA) 12,000,000 5,650,000 1,570,000 294,000 5,640 42,200 40,400 41,500
Europe
Accession States(1)
Cyprus 21,700 9,330 2,800 395 - 15 10 - Czech Republic 52,700 21,000 14,000 1,200 1,060 75 115 15 Estonia 9,040 4,540 2,290 75 60 25 15 5 Hungary 37,700 16,200 10,800 735 455 85 230 20 Latvia 12,100 3,690 1,570 220 60 70 370 10
Lithuania 18,900 6,410 3,330 460 95 80 160 40 Malta 14,700 7,860 2,250 95 † 10 20 5 Poland 126,000 48,800 23,200 3,880 1,120 435 960 115 Slovakia 21,300 7,650 3,090 810 1,030 100 70 †Slovenia 9,280 4,600 2,140 90 30 5 10 †
Accession States 324,000 130,000 65,400 7,960 3,910 900 1,960 210
Remainder of EuropeBulgaria 72,400 10,900 17,800 955 90 1,220 870 460 Croatia 29,800 10,200 8,240 830 105 90 120 10 Romania 66,300 12,700 19,200 1,020 1,070 1,110 665 390 Russia 193,000 78,500 39,300 13,200 645 1,680 330 Serbia and Montenegro 36,200 11,900 6,380 1,320 60 160 40
Turkey 124,000 33,900 30,000 4,580 380 320 240 175 Ukraine 53,300 14,700 6,680 1,800 * 1,250 855 140 Other former USSR 54,700 15,700 9,600 4,680 * 550 735 180 Other former Yugoslavia 13,100 3,660 3,900 320 75 30 25 20 Other Europe 19,300 9,590 1,800 410 † 20 45 20
Remainder of Europe 662,000 202,000 143,000 29,200 1,720 5,290 5,390 1,770
Europe 986,000 332,000 208,000 37,100 5,640 6,190 7,340 1,980
(1) Includes nationals of the Czech Republic, Cyprus, Estonia, Hungary, Latvia, Lithuania, Malta, Poland, Slovakia and Slovenia before 1 May 2004, but excludes them from this date.
(2) Includes the majority of work permit trainees.(3) Refugees, Humanitarian Protection, Discretionary Leave and grants of leave to enter under the Family ILR exercise - see Changes Affecting Statistics of Immigration Control paragraph 2(xiv).(4) Excluding such persons given temporary admission – see Explanatory Notes paragraph 18.(5) See Explanatory Notes paragraph 19 for a list of the categories included. Also includes 74,800 journeys made in 2004 for which the category of admission is unknown.
(6) Excludes asylum-related cases given indefinite leave to enter; these are included in 'Asylum-related cases and their dependants'.
Passengers admitted by purpose of journey
**

31
Table 2.2 (continued)
United Kingdom Number of journeys
Passengers admitted by purpose of journey Passengers Geographical refused region and
Admitted Admitted Passengers Passengers Asylum Others Accepted entry at nationalityas a as a in transit returning related given for port and
husband wife or after a cases and leave to settlement subsequentlyor fiancé fiancée temporary their enter on removed
absence dependants (5) arrivalabroad (3)(4) (6)
All nationalities 11,700 23,600 1,260,000 2,790,000 13,800 300,000 4,590 31,545 (excluding EEA)
Europe
Accession States(1)
5 † 1,290 7,590 75 170 † 25 Cyprus† 25 2,060 12,200 355 555 † 275 Czech Republic - † 815 1,070 35 115 - 60 Estonia† 20 1,740 6,870 - 565 - 125 Hungary- 10 2,570 2,160 90 1,230 - 290 Latvia
10 35 1,630 5,190 255 1,180 † 1,015 Lithuania† † 1,440 2,830 - 225 - 5 Malta5 65 9,830 34,300 610 2,980 5 2,970 Poland- 15 615 7,610 95 180 † 415 Slovakia- - 1,400 935 - 55 - 15 Slovenia
25 175 23,400 80,800 1,510 7,260 10 5,195 Accession States
Remainder of Europe50 155 4,420 31,800 35 3,630 25 175 Bulgaria20 40 2,270 6,700 660 465 † 65 Croatia80 200 4,720 23,000 25 2,150 15 605 Romania40 545 11,100 43,400 50 4,620 40 285 Russia75 115 4,480 9,110 1,840 675 5 115 Serbia and Montenegro
530 525 1,900 46,900 1,840 2,290 105 240 Turkey30 275 4,640 16,700 50 6,200 25 320 Ukraine30 205 3,960 15,700 75 3,310 30 260 Other former USSR15 60 620 4,110 40 260 5 40 Other former Yugoslavia
660 210 445 5,110 475 530 20 270 Other Europe
1,530 2,330 38,500 202,000 5,090 24,130 275 2,380 Remainder of Europe
1,560 2,500 61,900 283,000 6,600 31,400 280 7,575 Europe

32
Table 2.2 Passengers given leave to enter the United Kingdom by purpose of journey, and passengers refusedTable 3.1 entry at port and subsequently removed, by nationality, excluding EEA nationals and Switzerland, 2004 (1) (continued)
United Kingdom Number of journeys
Geographical Passengers admitted by purpose of journeyregion andnationality Total Visitors Students Au pairs Work permit holders Dependants
admitted of ordinary business Employment Employment work
for for permit 12 months less than holders
or more 12 months(2)
AmericasArgentina 40,700 20,400 5,990 855 * 105 555 50 Barbados 12,200 7,010 635 185 * 20 20 15 Brazil 141,000 68,300 15,900 10,900 * 315 495 185 Canada 852,000 481,000 80,900 5,590 * 970 1,570 550 Chile 23,200 11,200 3,620 800 * 50 75 50
Colombia 34,300 12,100 2,470 2,580 * 60 95 60 Guyana 5,400 1,880 260 75 * 150 20 130 Jamaica 19,900 6,000 830 285 * 145 330 120 Mexico 103,000 62,900 7,660 3,870 * 125 140 60 Peru 10,400 3,940 1,380 410 * 30 30 20
Trinidad and Tobago 29,700 12,700 1,480 435 * 85 65 105 USA 4,050,000 2,170,000 636,000 63,600 * 4,540 13,100 4,330 Venezuela 22,200 10,400 2,380 1,130 * 50 55 50 Other Americas 63,200 29,500 7,080 1,860 * 115 325 100
Americas 5,410,000 2,900,000 766,000 92,600 * 6,760 16,900 5,820
AfricaAlgeria 28,900 9,830 4,380 385 * 15 40 10 Angola 5,340 1,980 730 215 * 15 5 15 Congo (Dem. Rep.) (7)
2,200 680 155 25 * 5 5 5 Egypt 42,900 17,200 9,910 1,020 * 120 115 170 Ethiopia 7,900 3,890 715 180 * 10 40 5
Ghana 78,300 35,000 5,430 2,160 * 95 105 595 Kenya 47,600 16,600 4,590 1,150 * 235 155 240 Libya 11,200 4,050 1,410 1,890 * 15 10 80 Mauritius 37,400 19,900 1,730 2,190 * 90 45 130 Morocco 18,700 5,840 3,000 335 * 40 45 10
Nigeria 264,000 149,000 24,800 7,210 * 235 195 1,420 Sierra Leone 13,700 5,240 710 280 * 5 5 20 Somalia 5,330 1,050 85 15 * - † 5 South Africa 451,000 166,000 44,900 875 * 2,720 1,550 1,810 Sudan 11,200 5,050 1,340 525 * 10 10 20
Tanzania 15,000 6,030 1,660 750 * 15 35 35 Tunisia 10,300 2,900 1,940 525 * 20 20 15 Uganda 17,500 5,870 1,670 840 * 20 55 25 Zambia 11,900 3,540 765 520 * 165 25 470 Zimbabwe 51,400 16,000 1,730 830 * 235 190 1,150 Other Africa 74,000 31,300 7,410 2,720 * 320 315 285
Africa 1,210,000 507,000 119,000 24,600 * 4,380 2,950 6,520
(7) The Democratic Republic of the Congo, formerly known as Zaire.

33
Table 2.2 (continued)
United Kingdom Number of journeys
Passengers admitted by purpose of journey Passengers Geographical refused region and
Admitted Admitted Passengers Passengers Asylum Others Accepted entry at nationalityas a as a in transit returning related given for port and
husband wife or after a cases and leave to settlement subsequentlyor fiancé fiancée temporary their enter on removed
absence dependants (5) arrivalabroad (3)(4) (6)
Americas15 50 3,400 8,300 - 905 † 90 Argentina40 15 1,500 2,510 - 290 † 55 Barbados75 270 9,860 31,100 5 3,250 25 5,180 Brazil
105 305 159,000 110,000 - 12,500 65 455 Canada10 35 1,770 5,060 10 525 5 145 Chile
60 135 1,470 13,600 760 1,010 30 105 Colombia20 35 745 1,900 - 180 5 35 Guyana
220 85 1,700 9,420 10 715 25 995 Jamaica30 85 12,000 14,900 - 1,730 5 355 Mexico25 75 575 3,530 15 380 10 75 Peru
35 60 5,080 8,840 - 825 10 245 Trinidad and Tobago420 1,280 590,000 500,000 † 63,100 125 1,485 USA
10 60 2,320 5,300 5 525 † 300 Venezuela155 165 7,290 13,600 910 2,080 20 1,475 Other Americas
1,220 2,650 797,000 728,000 1,710 88,000 325 11,000 Americas
Africa140 175 1,600 10,900 70 1,290 10 270 Algeria
5 † 350 1,640 140 240 5 125 Angola
5 10 65 550 475 160 55 185 Congo (Dem. Rep.) (7)
120 105 3,450 9,430 20 1,180 10 25 Egypt25 70 690 1,590 70 595 25 30 Ethiopia
270 375 3,460 25,500 35 5,090 160 595 Ghana150 170 6,610 16,300 265 975 65 110 Kenya
10 25 455 2,050 20 1,130 15 20 Libya55 125 2,000 10,200 5 945 15 420 Mauritius80 140 965 7,380 5 840 5 150 Morocco
405 440 20,600 55,600 85 4,190 105 1,240 Nigeria40 30 1,930 5,060 30 325 25 80 Sierra Leone
125 220 125 1,790 185 1,150 580 195 Somalia365 555 53,900 150,000 25 28,500 245 1,640 South Africa
15 95 950 2,580 55 500 15 80 Sudan
50 70 1,800 4,040 100 375 35 30 Tanzania110 25 970 3,420 20 300 † 70 Tunisia
10 50 2,150 6,250 60 475 55 75 Uganda20 35 2,160 3,780 5 410 20 20 Zambia85 105 3,620 24,300 160 2,570 410 80 Zimbabwe
200 245 4,790 20,500 455 5,300 175 1,605 Other Africa
2,270 3,050 113,000 363,000 2,280 56,500 2,020 7,035 Africa

34
Table 2.2 Passengers given leave to enter the United Kingdom by purpose of journey, and passengers refusedTable 3.1 entry at port and subsequently removed, by nationality, excluding EEA nationals and Switzerland, 2004 (1) (continued)
United Kingdom Number of journeys
Geographical Passengers admitted by purpose of journeyregion andnationality Total Visitors Students Au pairs Work permit holders Dependants
admitted of ordinary business Employment Employment work
for for permit 12 months less than holders
or more 12 months(2)
Asia
Indian sub–continentBangladesh 47,000 15,300 2,960 2,000 * 1,780 385 220 India 616,000 223,000 76,400 16,600 * 10,200 6,960 13,000 Pakistan 212,000 92,300 13,600 12,600 * 1,200 785 1,280
Indian sub–continent 875,000 331,000 93,000 31,200 * 13,200 8,130 14,500
Middle EastIran 52,900 22,500 6,540 1,340 * 60 60 105 Iraq 12,000 5,580 1,280 190 * 15 10 30 Israel 182,000 102,000 36,200 1,590 * 185 215 230 Jordan 20,800 8,710 3,770 965 * 25 20 80 Kuwait 54,600 40,400 2,580 915 * 10 15 10
Lebanon 22,900 9,370 4,040 415 * 80 95 35 Saudi Arabia 50,000 27,100 4,740 3,250 * 65 25 155 Syria 11,400 4,060 1,790 635 * 15 20 45 Yemen 6,200 3,080 565 350 * † 5 10 Other Middle East 87,000 52,000 6,570 3,930 * 40 35 50
Middle East 500,000 275,000 68,100 13,600 * 495 495 745
Remainder of AsiaChina 261,000 65,800 42,500 24,200 * 1,480 450 1,310
Hong Kong (8) 91,300 39,100 9,530 6,900 * 310 80 355 Indonesia 25,000 9,820 4,130 805 * 110 55 50 Japan 593,000 266,000 104,000 23,600 * 1,570 830 2,040 Malaysia 173,000 78,400 14,500 6,080 * 455 175 355
Philippines 102,000 19,400 3,120 1,610 * 2,670 505 4,830 Singapore 79,900 37,400 12,900 1,740 * 235 100 130 South Korea 216,000 124,000 25,600 8,950 * 260 150 410 Sri Lanka 60,600 24,000 3,790 1,850 * 235 115 370 Taiwan 53,800 17,500 9,810 7,630 * 75 125 80
Thailand 75,000 32,000 6,230 4,790 * 510 140 285 Other Asia 47,800 13,400 3,880 2,930 * 535 160 265
Remainder of Asia 1,780,000 726,000 240,000 91,100 * 8,440 2,880 10,500
Asia 3,150,000 1,330,000 401,000 136,000 * 22,100 11,500 25,700
OceaniaAustralia 917,000 444,000 60,300 1,860 * 2,100 1,290 1,180 New Zealand 280,000 112,000 13,900 365 * 650 390 285 Other Oceania 4,660 1,600 300 65 * 20 5 15
Oceania 1,200,000 557,000 74,500 2,290 * 2,780 1,690 1,480
British Overseas citizens 13,000 4,570 870 730 * 25 5 35 Nationality unknown 78,900 16,700 2,860 260 * 15 50 15
All nationalities 12,000,000 5,650,000 1,570,000 294,000 5,640 42,200 40,400 41,500 (excluding EEA)
(8) Hong Kong (Special Administrative Region of China) - see Explanatory Notes paragraph 7.
35
Table 2.2 (continued)
United Kingdom Number of journeys
Passengers admitted by purpose of journey Passengers Geographical refused region and
Admitted Admitted Passengers Passengers Asylum Others Accepted entry at nationalityas a as a in transit returning related given for port and
husband wife or after a cases and leave to settlement subsequentlyor fiancé fiancée temporary their enter on removed
absence dependants (5) arrivalabroad (3)(4) (6)
Asia
Indian sub–continent635 1,010 3,330 17,900 5 1,470 40 100 Bangladesh
1,460 2,900 32,700 215,000 25 16,800 385 555 India3,170 4,420 11,600 65,200 405 5,370 240 415 Pakistan
5,260 8,340 47,600 298,000 435 23,700 665 1,070 Indian sub–continent
Middle East60 230 1,770 18,400 345 1,470 60 75 Iran35 415 275 3,040 120 850 150 55 Iraq55 75 16,700 23,300 20 1,900 15 305 Israel25 50 1,640 5,090 5 375 5 10 Jordan10 15 4,100 5,590 35 890 5 - Kuwait
40 75 1,860 6,410 125 340 10 20 Lebanon10 15 3,630 9,100 - 1,880 5 10 Saudi Arabia30 50 1,280 3,060 20 355 5 20 Syria35 85 375 1,370 35 265 15 10 Yemen20 20 5,360 16,700 280 2,050 10 35 Other Middle East
330 1,030 37,000 92,000 990 10,400 280 550 Middle East
Remainder of Asia40 550 4,780 116,000 70 4,340 100 270 China25 110 7,340 26,500 - 1,050 15 410 Hong Kong (8)
20 110 1,690 6,240 10 1,950 15 20 Indonesia10 385 34,500 152,000 - 8,090 30 245 Japan25 150 9,610 57,900 5 4,820 20 1,130 Malaysia
185 565 17,100 46,500 5 5,400 115 105 Philippines10 70 4,890 21,400 - 1,060 20 75 Singapore10 60 14,900 37,500 - 4,410 15 315 South Korea
100 830 2,500 21,800 1,130 3,700 150 125 Sri Lanka10 45 1,340 16,400 - 825 10 15 Taiwan
30 1,630 1,570 26,000 5 1,610 110 50 Thailand50 570 1,920 18,900 515 4,440 115 205 Other Asia
515 5,080 102,000 547,000 1,740 41,700 705 2,970 Remainder of Asia
6,100 14,400 187,000 937,000 3,160 75,700 1,650 4,590 Asia
Oceania350 560 77,700 294,000 - 33,500 155 355 Australia165 235 16,200 125,000 - 10,900 75 160 New Zealand
5 50 735 1,250 5 600 5 20 Other Oceania
520 845 94,700 420,000 5 45,000 240 535 Oceania
British Overseas5 10 625 5,900 - 245 - 30 citizens
50 105 3,070 52,400 25 3,250 70 790 Nationality unknown
11,700 23,600 1,260,000 2,790,000 13,800 300,000 4,590 31,545 All nationalities (excluding EEA)
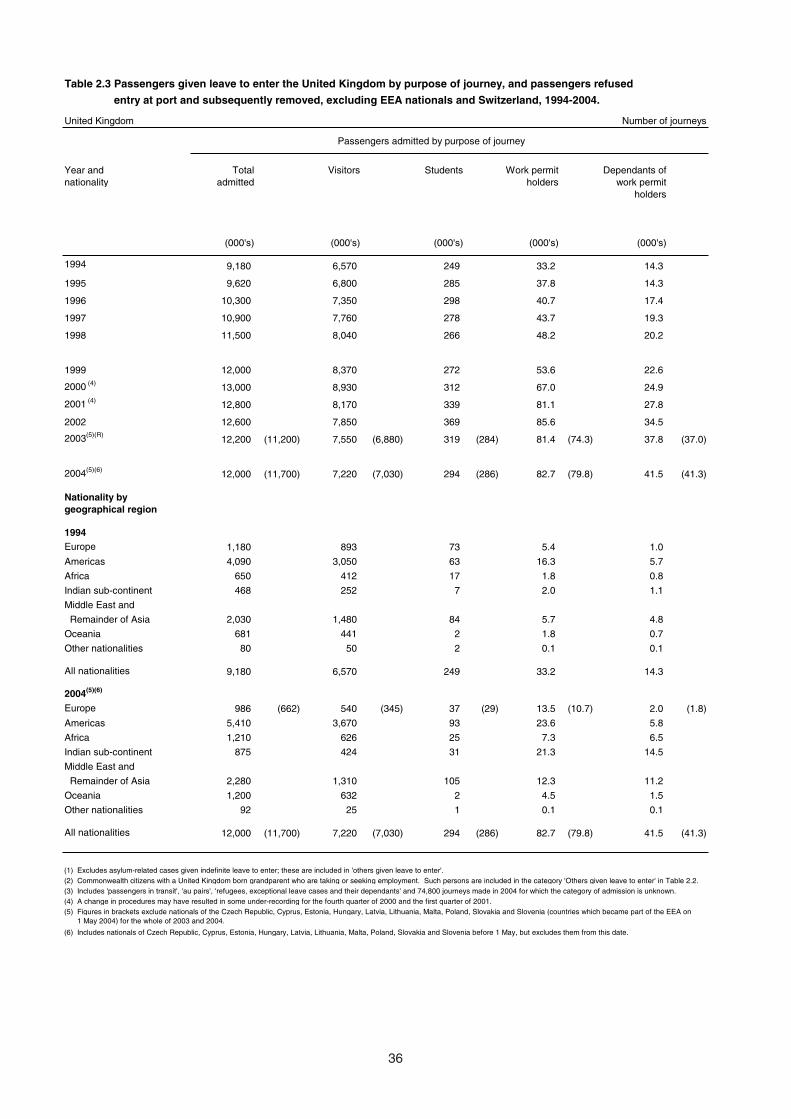
36
Table 2.3 Passengers given leave to enter the United Kingdom by purpose of journey, and passengers refused
Table 3.2 entry at port and subsequently removed, excluding EEA nationals and Switzerland, 1994-2004.
United Kingdom Number of journeys
Passengers admitted by purpose of journey
Year and Total Visitors Students Work permit Dependants ofnationality admitted holders work permit
holders
(000's) (000's) (000's) (000's) (000's)
1994 9,180 6,570 249 33.2 14.3
1995 9,620 6,800 285 37.8 14.3
1996 10,300 7,350 298 40.7 17.4
1997 10,900 7,760 278 43.7 19.3
1998 11,500 8,040 266 48.2 20.2
1999 12,000 8,370 272 53.6 22.6
2000 (4) 13,000 8,930 312 67.0 24.9
2001 (4) 12,800 8,170 339 81.1 27.8
2002 12,600 7,850 369 85.6 34.5
2003(5)(R)12,200 (11,200) 7,550 (6,880) 319 (284) 81.4 (74.3) 37.8 (37.0)
2004(5)(6) 12,000 (11,700) 7,220 (7,030) 294 (286) 82.7 (79.8) 41.5 (41.3)
Nationality bygeographical region
1994Europe 1,180 893 73 5.4 1.0
Americas 4,090 3,050 63 16.3 5.7
Africa 650 412 17 1.8 0.8
Indian sub-continent 468 252 7 2.0 1.1
Middle East and
Remainder of Asia 2,030 1,480 84 5.7 4.8
Oceania 681 441 2 1.8 0.7
Other nationalities 80 50 2 0.1 0.1
All nationalities 9,180 6,570 249 33.2 14.3
2004(5)(6)
Europe 986 (662) 540 (345) 37 (29) 13.5 (10.7) 2.0 (1.8)
Americas 5,410 3,670 93 23.6 5.8
Africa 1,210 626 25 7.3 6.5
Indian sub-continent 875 424 31 21.3 14.5
Middle East and
Remainder of Asia 2,280 1,310 105 12.3 11.2
Oceania 1,200 632 2 4.5 1.5
Other nationalities 92 25 1 0.1 0.1
All nationalities 12,000 (11,700) 7,220 (7,030) 294 (286) 82.7 (79.8) 41.5 (41.3)
(1) Excludes asylum-related cases given indefinite leave to enter; these are included in 'others given leave to enter'.(2) Commonwealth citizens with a United Kingdom born grandparent who are taking or seeking employment. Such persons are included in the category 'Others given leave to enter' in Table 2.2.(3) Includes 'passengers in transit', 'au pairs', 'refugees, exceptional leave cases and their dependants' and 74,800 journeys made in 2004 for which the category of admission is unknown.(4) A change in procedures may have resulted in some under-recording for the fourth quarter of 2000 and the first quarter of 2001.(5) Figures in brackets exclude nationals of the Czech Republic, Cyprus, Estonia, Hungary, Latvia, Lithuania, Malta, Poland, Slovakia and Slovenia (countries which became part of the EEA on(6) 1 May 2004) for the whole of 2003 and 2004.
(6) Includes nationals of Czech Republic, Cyprus, Estonia, Hungary, Latvia, Lithuania, Malta, Poland, Slovakia and Slovenia before 1 May, but excludes them from this date.

37
Table 2.3 (continued)
United Kingdom Number of journeys
Passengers admitted by purpose of journey
Admitted as Accepted for UK Others given People returning Passengersa spouse or settlement ancestry leave to after a refused entry Year and
fiancé(e) on arrival (2) enter temporary at port and nationality(1) (3) absence abroad subsequently
removed
(000's) (000's) (000's) (000's) (000's) (number)
18.8 2.6 5.2 986 1,300 16,960 1994
19.1 2.4 6.6 1,090 1,370 18,955 1995
21.0 2.1 7.4 1,140 1,470 21,190 1996
26.4 2.4 8.4 1,250 1,560 24,325 1997
32.2 2.1 10.2 1,310 1,780 27,425 1998
30.3 2.5 11.9 1,340 1,910 31,005 1999
33.0 2.3 10.9 1,430 2,200 38,150 2000(4)
29.1 2.9 10.7 1,510 2,620 37,815 2001(4)
30.3 2.5 10.4 1,480 2,740 50,260 2002
31.4 (30.4) 2.7 (2.7) 9.2 (9.1) 1,390 (1,300) 2,780 (2,590) 37,825 (23,720) 2003(5)(R)
35.3 (35.1) 4.6 (4.6) 7.7 (7.7) 1,570 (1,530) 2,790 (2,710) 31,545 (26,350) 2004(5)(6)
Nationality bygeographical region
1994
1.4 † † 74 129 .. Europe
3.0 0.3 0.4 511 444 .. Americas
1.9 0.5 0.4 96 119 .. Africa
8.5 0.6 † 71 127 .. Indian sub-continent
Middle East and
2.3 0.4 † 151 303 .. Remainder of Asia
1.5 0.1 4.3 72 158 .. Oceania
0.1 0.7 † 7 20 .. Other nationalities
18.8 2.6 5.2 981 1,300 16,960 All nationalities
2004(5)(6)
4.1 (3.9) 0.3 (0.3) † (†) 106 (69) 283 (202) 7,575 (2,380) Europe
3.9 0.3 0.4 886 728 11,000 Americas
5.3 2.0 2.0 169 363 7,035 Africa
13.6 0.7 † 72 298 1,070 Indian sub-continent
Middle East and
6.9 1.0 † 194 639 3,520 Remainder of Asia
1.4 0.2 5.2 134 420 535 Oceania
0.2 0.1 - 7 58 815 Other nationalities
35.3 (35.1) 4.6 (4.6) 7.7 (7.7) 1,570 (1,530) 2,790 (2,710) 31,545 (26,350) All nationalities

38
Table 2.4 Work permit holders and dependants given leave to enter, excluding EEA nationals and Switzerland, 1994-2004
United Kingdom Number of persons
Year of All nationalities Europeadmission
Total Employment Employment Dependants Total Employment Employment Dependantsfor 12 for less than of work for 12 for less than of work
months or 12 months permit months or 12 months permitmore (1) holders more (1) holders
1994 47,500 10,200 23,000 14,300 6,450 830 4,600 1,030
1995 52,100 11,700 26,100 14,300 7,630 1,000 5,570 1,060
1996 58,200 11,400 29,400 17,400 6,870 970 4,730 1,160
1997 62,980 16,270 27,380 19,320 7,260 1,400 4,550 1,310
1998 68,385 20,160 28,020 20,205 8,330 1,875 4,920 1,535
1999 76,180 25,090 28,445 22,645 9,330 2,195 5,385 1,750
2000 (2) 92,050 36,290 30,785 24,970 9,880 2,815 5,190 1,875
2001 (2) 108,825 50,280 30,785 27,760 10,040 3,725 4,665 1,650
2002 120,115 51,525 34,095 34,495 14,090 5,000 6,970 2,120
2003 119,180 44,480 36,870 37,830 17,785 7,675 7,625 2,485
2004(3) 124,200 42,235 40,420 41,545 15,520 6,190 7,345 1,985
Year of Indian sub-continent Other Asiaadmission
Total Employment Employment Dependants Total Employment Employment Dependantsfor 12 for less than of work for 12 for less than of work
months or 12 months permit months or 12 months permitmore (1) holders more (1) holders
1994 3,160 600 1,430 1,130 10,500 3,030 2,700 4,770
1995 3,700 750 1,820 1,130 10,800 3,340 2,630 4,810
1996 4,640 1,040 2,000 1,590 12,100 2,670 3,850 5,590 1997 6,100 1,460 2,720 1,920 12,620 3,940 2,680 6,000
1998 7,935 2,145 3,210 2,580 12,095 4,270 2,865 4,960
1999 8,715 2,535 2,970 3,210 14,025 5,930 2,710 5,385
2000 (2) 13,915 4,825 4,785 4,310 17,960 9,655 2,765 5,540
2001 (2) 19,750 7,905 5,610 6,235 23,645 14,205 2,620 6,820
2002 22,810 8,875 5,665 8,270 26,030 13,825 2,420 9,785 2003 25,580 8,185 6,440 10,955 24,935 11,245 3,045 10,645
2004 35,755 13,155 8,130 14,475 23,540 8,935 3,380 11,225
(1) Includes the majority of work permit trainees.
(2) A change in procedures may have resulted in some under-recording for the fourth quarter of 2000 and the first quarter of 2001.
(3) Includes nationals of the Czech Republic, Cyprus, Estonia, Hungary, Latvia, Lithuania, Malta, Poland, Slovakia and Slovenia before 1 May 2004, but excludes them from this date.

39
Table 2.4 (continued)
United Kingdom Number of persons
Americas Africa Year ofadmission
Total Employment Employment Dependants Total Employment Employment Dependantsfor 12 for less than of work for 12 for less than of work
months or 12 months permit months or 12 months permitmore (1) holders more (1) holders
22,000 4,450 11,800 5,740 2,690 560 1,280 850 1994
24,200 5,010 13,300 5,850 2,940 640 1,490 800 1995
28,100 5,020 15,900 7,130 3,250 670 1,490 1,100 1996
28,700 6,680 14,340 7,710 4,200 1,220 1,620 1,350 1997
29,570 7,820 13,740 8,010 5,455 1,870 1,795 1,790 1998
30,740 8,535 13,790 8,410 7,425 3,080 1,915 2,430 1999
33,855 10,840 14,100 8,910 9,160 4,340 2,090 2,730 2000 (2)
31,375 11,785 13,030 6,560 14,100 6,870 2,885 4,350 2001 (2)
31,900 11,110 13,855 6,935 15,695 7,255 3,160 5,280 2002
29,250 8,415 14,935 5,900 14,400 5,275 2,965 6,160 2003
29,440 6,755 16,870 5,815 13,855 4,385 2,955 6,515 2004
Oceania Other nationalities Year ofadmission
Total Employment Employment Dependants Total Employment Employment Dependantsfor 12 for less than of work for 12 for less than of work
months or 12 months permit months or 12 months permitmore (1) holders more (1) holders
2,490 740 1,060 690 190 40 100 60 1994
2,720 900 1,170 650 150 30 90 30 1995
3,060 970 1,290 800 180 30 100 50 19963,840 1,540 1,300 1,000 130 30 70 30 1997
4,855 2,120 1,435 1,295 150 55 60 35 1998
5,815 2,765 1,605 1,445 135 55 65 20 1999
7,175 3,770 1,810 1,590 105 45 45 15 2000 (2)
9,785 5,720 1,940 2,125 125 65 30 25 2001 (2)
9,370 5,360 1,960 2,050 220 105 60 55 2002
7,070 3,620 1,805 1,645 160 70 45 45 2003
5,950 2,780 1,690 1,485 145 40 55 50 2004

40
Table 2.5 Passengers given limited leave to enter as husbands, wives, children, or for marriage, excluding EEA
Table 3.4 nationals and Switzerland,1994-2004
United Kingdom Number of persons
Category and 1994 1995 1996 1997 1998 1999 2000 2001 2002 2003 2004nationality (1) (1) (2)
Husbands
Europe 310 380 420 605 620 645 660 495 715 1,085 1,280Americas 880 970 880 975 1,090 1,150 1,000 610 720 825 1,035Africa 740 610 710 1,085 1,490 1,615 1,515 1,310 1,470 1,480 2,140Indian sub-continent 3,070 3,020 3,540 5,865 7,520 4,605 6,240 5,410 4,565 4,445 5,090Other Asia 300 330 340 405 430 460 450 455 495 535 775Oceania 550 560 530 630 730 835 725 560 500 470 460Other nationalities 40 30 30 35 35 25 15 20 35 40 50
All nationalities 5,890 5,900 6,460 9,600 11,910 9,340 10,605 8,855 8,495 8,880 10,830
Male fiancés
Europe 80 90 90 130 105 120 100 60 135 205 275Americas 150 150 160 195 175 145 160 105 185 165 185Africa 100 90 80 105 140 130 100 85 100 110 125Indian sub-continent 150 140 100 185 215 220 240 235 180 150 175Other Asia 60 60 70 70 90 75 55 65 70 70 70Oceania 70 70 80 95 125 100 90 60 55 65 60Other nationalities 10 10 † 5 5 5 5 - 5 5 5
All nationalities 610 610 580 785 855 800 750 610 730 765 895
Wives
Europe 740 900 1,040 1,165 1,410 2,000 1,745 1,345 1,915 2,340 1,920Americas 1,570 1,640 1,670 1,740 1,950 2,525 1,955 1,255 1,750 1,950 2,185Africa 980 940 1,070 1,370 1,895 2,305 2,235 2,165 2,480 2,445 2,935Indian sub-continent 5,050 5,060 5,740 6,645 8,010 6,540 8,700 8,495 7,695 7,260 8,095Other Asia 1,600 1,760 1,880 2,250 2,665 2,990 3,310 3,480 4,055 4,435 5,355Oceania 800 760 790 900 1,100 1,310 1,145 1,060 880 810 765Other nationalities 80 60 50 50 35 50 45 60 95 125 115
All nationalities 10,800 11,100 12,200 14,120 17,070 17,715 19,140 17,860 18,870 19,365 21,370
Female fiancées
Europe 240 310 400 485 560 665 670 445 730 765 580Americas 380 370 400 445 450 490 510 255 390 420 470Africa 100 90 120 105 150 130 130 115 125 110 115Indian sub-continent 260 250 250 200 305 285 310 295 265 195 245Other Asia 380 390 430 520 710 740 725 595 645 785 750Oceania 90 100 110 130 145 140 110 70 70 70 80Other nationalities 10 10 10 5 10 10 10 5 5 10 5
All nationalities 1,460 1,500 1,710 1,880 2,330 2,465 2,475 1,775 2,225 2,355 2,245
Children
Europe 150 160 130 145 190 235 245 265 375 435 345Americas 270 260 210 195 225 315 285 265 345 365 480Africa 390 260 320 205 295 335 500 915 965 895 915Indian sub-continent 910 820 900 965 1,145 825 1,250 1,305 1,345 1,345 1,360Other Asia 230 230 250 225 245 280 430 995 1,080 900 965Oceania 120 200 130 135 150 210 115 240 235 185 175Other nationalities 30 30 20 20 10 5 10 35 40 35 30
All nationalities 2,100 1,970 1,970 1,890 2,260 2,205 2,835 4,015 4,385 4,165 4,260
(1) A change in procedures may have resulted in some under-recording in the fourth quarter of 2000 and the first quarter of 2001.
(2) Includes nationals of the Czech Republic, Cyprus, Estonia, Hungary, Latvia, Lithuania, Malta, Poland, Slovakia and Slovenia before 1 May 2004, but excludes them from this date..

SECTION 3: Asylum
Page
Table 3.1 Applications, decisions and other information for those applying for asylum in the UnitedKingdom, excluding dependants, 1996 to 2004
Table 3.2 Applications received for asylum in the United Kingdom, excluding dependants, bynationality, 1996 to 2004
Table 3.3 Initial decisions on applications received for asylum in the United Kingdom, excludingdependants by nationality, 2004
Table 3.4 Asylum appeals to the immigration adjudicators, tribunal and applications for JudicialReview, 2000 to 2004
Table 3.5 Summary of applications for support and other information for those applying to theNational Asylum Support Service, in the United Kingdom, in 2003 and 2004
Table 3.6 Number of asylum seekers (including dependants) in receipt of support from the NationalAsylum Support Service, by government office region of the United Kingdom as at endDecember 2004
Table 3.7 Asylum seekers, including dependants, supported by the National Asylum SupportService, by type of support, 2004
Explanatory Notes and Definitions paragraphs 20-36.
41
42
43
44
45
46
47
47

42
Table 3.1 Applications, decisions and other information for those applying for asylum in the United Kingdom, excluding dependants, 1996 to 2004
Number of principal applicants1996 1997 1998 1999 2000 2001 2002 2003 2004
(P)
Applications received (1)29,640 32,500 46,015 71,160 80,315 71,025 84,130 49,405 33,960
of which: Applied at port 12,440 16,590 23,345 29,455 25,935 24,865 26,560 13,720 7,550 Applied in-country 17,205 15,915 22,670 41,700 54,380 46,160 57,570 35,685 26,410
Initial decisions in year 38,960 36,045 31,570 33,720 109,205 120,950 83,540 64,940 46,020
Cases reconsidered (year of outcome) (2)• • • • • • • • 1,160 11,260 4,715 3,825 4,520
Decisions (year of outcome) (2)38,960 36,045 31,570 33,720 96,400 124,205 85,575 67,740 50,055
Granted asylum (2) (4)2,240 3,985 5,345 7,815 10,595 13,490 10,255 4,300 1,895
Granted exceptional leave to remain, humanitarian protection or discretionary leave (2) (3)
5,055 3,115 3,910 2,465 11,420 21,600 21,015 7,550 4,170Refused asylum, ELR, HP and DL (2) (4)
31,670 28,945 22,315 11,025 62,720 89,115 54,305 55,890 43,990
Granted asylum % (2) (4) (6) (11) (17) (36) (13) (11) (12) (6) (4)
Granted ELR, HP or DL % (2) (3)(13) (9) (12) (12) (13) (17) (25) (11) (8)
Refused asylum, ELR, HP and DL % (2) (4)(81) (80) (71) (52) (74) (72) (63) (83) (88)
Granted asylum or exceptional leave under
backlog criteria (5)• • • • • • 11,140 10,325 • • • • • • • •
Refused under backlog criteria (5)• • • • • • 1,275 1,335 • • • • • • • •
Applications withdrawn (2)2,925 2,065 1,470 730 1,755 2,720 1,530 1,905 2,435
Adjudicator Appeals
Appeals received by the Home Office 22,985 20,950 14,320 6,615 46,190 74,365 51,695 46,130 35,110Appeals determined by the IAA 13,790 21,090 25,320 19,460 19,395 43,415 64,405 81,725 55,975Of which appeals allowed 515 1,180 2,355 5,280 3,340 8,155 13,875 16,070 10,845
appeals allowed % (4) (6) (9) (27) (17) (19) (22) (20) (19)
Total granted asylum, ELR, HP, DL or appeal
allowed (year of outcome) (2)7,810 8,280 11,610 26,700 35,680 43,245 45,145 27,920 16,910
Removals and voluntary departures (6)4,820 7,165 6,990 7,665 8,980 9,285 10,740 13,005 12,585
Cases awaiting initial decision outcome(At end of year) (7)
57,405 51,795 64,770 125,100 94,500 42,200 41,300 23,900 9,700
Grants of settlement (8)
As recognised refugees 1,115 2,405 4,270 • • • • • • 10,955 4,865 1,695With exceptional leave 3,080 2,425 2,405 • • • • • • 7,280 7,220 8,555Family ILR exercise * * * * * * * * 9,235Total 4,195 4,830 6,680 22,505 25,355 17,965 18,235 12,085 19,490
(1) May exclude some cases lodged at Local Enforcement Offices between January 1999 and March 2000.(2) Includes outcomes of cases reconsidered for which initial decision or withdrawal in 2000, 2001, 2002, 2003 or 2004. Outcomes related to date of reconsideration which may be a later year than year of initial decision (see Explanatory Notes paragraph 23). (3) Humanitarian Protection (HP) and Discretionary Leave (DL) replaced exceptional leave to remain (ELR) from 1 April 2003.(4) Cases considered under normal procedures. Data for 2000 may include some cases decided under the backlog criteria. (5) Cases decided under measures aimed at reducing the pre 1996 asylum application backlog.(6) Includes persons departing 'voluntarily' after enforcement action had been initiated against them, and persons leaving under Assisted Voluntary Return Programmes run by the International Organisation for Migration. Figures for 1999 to 2001 may include a small number of dependants leaving under Assisted Voluntary Return Programmes.(7) Data for 1998 and earlier years are not directly comparable with figures for later years. (8) Data for 2004 include accession countries for the whole year and therefore totals will differ from those in Tables 5.1 and 5.3.

43
Table 3.2 Applications received for asylum in the United Kingdom, excluding dependants, by nationality, 1996 to 2004 United Kingdom Number of principal applicants
Nationality 1996 1997 1998 1999 2000 2001 2002 2003 2004 (1) (1) (P)
EuropeAlbania 105 445 560 1,310 1,490 1,065 1,150 595 295Czech Republic 55 240 515 1,790 1,200 825 1,365 70 20Macedonia 15 20 50 90 65 755 310 60 15Moldova † 20 25 180 235 425 820 380 170Poland 900 565 1,585 1,860 1,015 615 990 95 15Romania 455 605 1,015 1,985 2,160 1,400 1,210 550 295Russia 205 180 185 685 1,000 450 295 280 190Serbia & Montenegro 400 1,865 7,395 11,465 6,070 3,230 2,265 815 290Turkey 1,495 1,445 2,015 2,850 3,990 3,695 2,835 2,390 1,230Ukraine 235 490 370 775 770 445 365 300 120Other Former USSR 960 1,325 2,235 2,460 2,275 895 1,245 625 340Other Former Yugoslavia 620 375 535 2,625 2,200 85 90 50 20Other 1,035 1,575 1,260 200 415 335 300 80 30
Europe 6,475 9,145 17,745 28,280 22,880 14,215 13,235 6,295 3,025
AmericasColombia 1,005 1,330 425 1,000 505 365 420 220 120 Ecuador 435 1,205 280 610 445 255 315 150 35 Jamaica 125 130 105 180 310 525 1,310 965 455 Other 205 165 165 240 155 170 240 230 130
Americas 1,765 2,825 975 2,025 1,420 1,315 2,290 1,560 740
AfricaAlgeria 715 715 1,260 1,385 1,635 1,140 1,060 550 490 Angola 385 195 150 545 800 1,015 1,420 850 400 Burundi 60 85 215 780 620 610 700 650 265 Cameroon 105 175 95 245 355 380 615 505 360 Congo 75 90 150 450 485 540 600 320 150 Dem. Rep. Congo 680 690 660 1,240 1,030 1,370 2,215 1,540 1,475 Eritrea 135 125 345 565 505 620 1,180 950 1,105 Ethiopia 205 145 345 455 415 610 700 640 540 Gambia 245 125 45 30 50 65 130 95 100 Ghana 780 350 225 195 285 190 275 325 355 Ivory Coast 125 70 95 190 445 275 315 390 280 Kenya 1,170 605 885 485 455 305 350 220 145 Liberia 330 205 70 65 55 115 450 740 405 Nigeria 2,900 1,480 1,380 945 835 810 1,125 1,010 1,090 Rwanda 80 90 280 820 760 530 655 260 75 Sierra Leone 395 815 565 1,125 1,330 1,940 1,155 380 230 Somalia 1,780 2,730 4,685 7,495 5,020 6,420 6,540 5,090 2,585 Sudan 280 230 250 280 415 390 655 930 1,305 Tanzania 225 90 80 80 60 80 40 30 20 Uganda 215 220 210 420 740 480 715 705 405 Zimbabwe 130 60 80 230 1,010 2,140 7,655 3,295 2,065 Other 275 220 305 400 615 555 845 895 910
Africa 11,290 9,515 12,380 18,435 17,920 20,590 29,390 20,370 14,745
Middle EastIran 585 585 745 1,320 5,610 3,420 2,630 2,875 3,455 Iraq 965 1,075 1,295 1,800 7,475 6,680 14,570 4,015 1,695 Other 600 675 745 1,045 1,330 1,165 1,115 1,080 1,375
Middle East 2,150 2,335 2,785 4,165 14,415 11,265 18,315 7,970 6,525
Rest of AsiaAfghanistan 675 1,085 2,395 3,975 5,555 8,920 7,205 2,280 1,395 Bangladesh 645 545 460 530 795 510 720 735 510 China 820 1,945 1,925 2,625 4,000 2,390 3,675 3,450 2,365 India 2,220 1,285 1,030 1,365 2,120 1,850 1,865 2,290 1,405 Pakistan 1,915 1,615 1,975 2,615 3,165 2,860 2,405 1,915 1,710 Sri Lanka 1,340 1,830 3,505 5,130 6,395 5,510 3,130 705 330 Vietnam 10 10 35 105 180 400 840 1,125 755 Other 270 255 615 1,120 1,025 1,040 915 655 375
Rest of Asia 7,885 8,570 11,940 17,465 23,230 23,480 20,755 13,155 8,850
Other, and nationality not recorded
80 105 190 785 450 160 145 55 70
All nationalities 29,640 32,500 46,015 71,160 80,315 71,025 84,130 49,405 33,960 (1) May exclude some cases lodged at Local Enforcement Offices between January 1999 and March 2000.
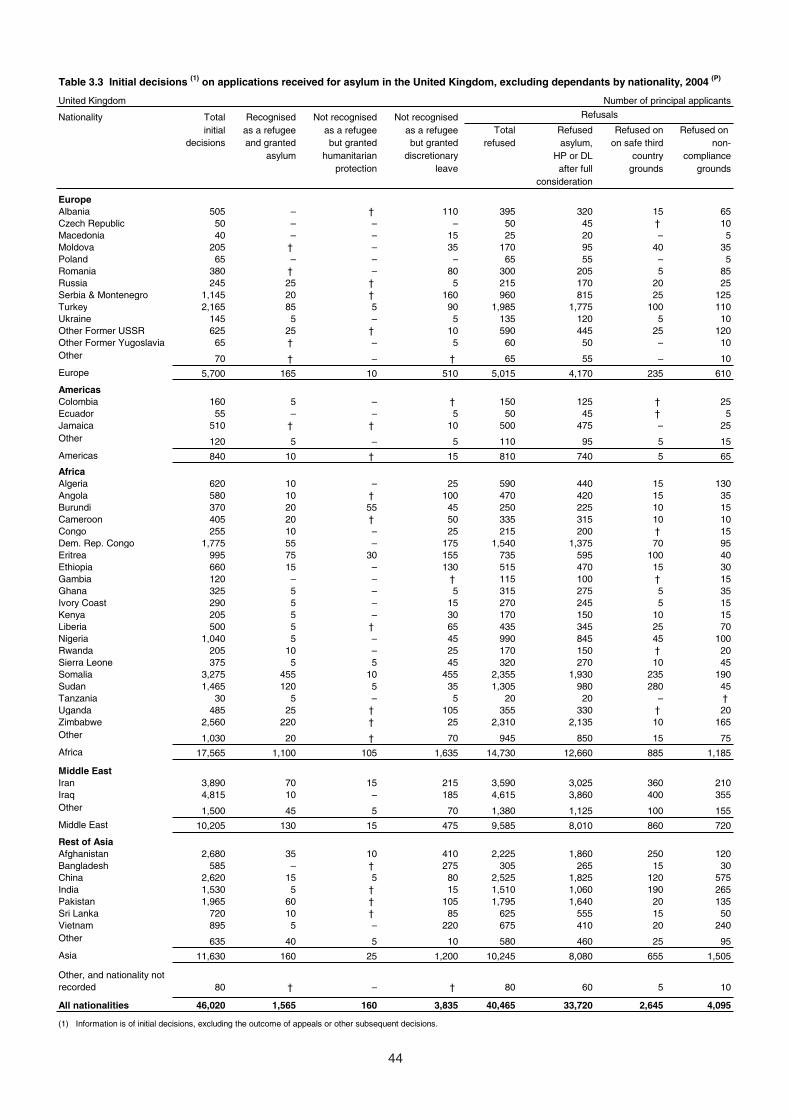
44
Table 3.3 Initial decisions (1) on applications received for asylum in the United Kingdom, excluding dependants by nationality, 2004 (P)
United Kingdom Number of principal applicants
Nationality Total Recognised Not recognised Not recognisedinitial as a refugee as a refugee as a refugee Total Refused Refused on Refused on
decisions and granted but granted but granted refused asylum, on safe third non-asylum humanitarian discretionary HP or DL country compliance
protection leave after full grounds groundsconsideration
EuropeAlbania 505 – † 110 395 320 15 65 Czech Republic 50 – – – 50 45 † 10 Macedonia 40 – – 15 25 20 – 5 Moldova 205 † – 35 170 95 40 35 Poland 65 – – – 65 55 – 5 Romania 380 † – 80 300 205 5 85 Russia 245 25 † 5 215 170 20 25 Serbia & Montenegro 1,145 20 † 160 960 815 25 125 Turkey 2,165 85 5 90 1,985 1,775 100 110 Ukraine 145 5 – 5 135 120 5 10 Other Former USSR 625 25 † 10 590 445 25 120 Other Former Yugoslavia 65 † – 5 60 50 – 10 Other 70 † – † 65 55 – 10
Europe 5,700 165 10 510 5,015 4,170 235 610
AmericasColombia 160 5 – † 150 125 † 25 Ecuador 55 – – 5 50 45 † 5 Jamaica 510 † † 10 500 475 – 25 Other 120 5 – 5 110 95 5 15
Americas 840 10 † 15 810 740 5 65
AfricaAlgeria 620 10 – 25 590 440 15 130 Angola 580 10 † 100 470 420 15 35 Burundi 370 20 55 45 250 225 10 15 Cameroon 405 20 † 50 335 315 10 10 Congo 255 10 – 25 215 200 † 15 Dem. Rep. Congo 1,775 55 – 175 1,540 1,375 70 95 Eritrea 995 75 30 155 735 595 100 40 Ethiopia 660 15 – 130 515 470 15 30 Gambia 120 – – † 115 100 † 15 Ghana 325 5 – 5 315 275 5 35 Ivory Coast 290 5 – 15 270 245 5 15 Kenya 205 5 – 30 170 150 10 15 Liberia 500 5 † 65 435 345 25 70 Nigeria 1,040 5 – 45 990 845 45 100 Rwanda 205 10 – 25 170 150 † 20 Sierra Leone 375 5 5 45 320 270 10 45 Somalia 3,275 455 10 455 2,355 1,930 235 190 Sudan 1,465 120 5 35 1,305 980 280 45 Tanzania 30 5 – 5 20 20 – †Uganda 485 25 † 105 355 330 † 20 Zimbabwe 2,560 220 † 25 2,310 2,135 10 165 Other 1,030 20 † 70 945 850 15 75
Africa 17,565 1,100 105 1,635 14,730 12,660 885 1,185
Middle EastIran 3,890 70 15 215 3,590 3,025 360 210 Iraq 4,815 10 – 185 4,615 3,860 400 355 Other 1,500 45 5 70 1,380 1,125 100 155
Middle East 10,205 130 15 475 9,585 8,010 860 720
Rest of AsiaAfghanistan 2,680 35 10 410 2,225 1,860 250 120 Bangladesh 585 – † 275 305 265 15 30 China 2,620 15 5 80 2,525 1,825 120 575 India 1,530 5 † 15 1,510 1,060 190 265 Pakistan 1,965 60 † 105 1,795 1,640 20 135 Sri Lanka 720 10 † 85 625 555 15 50 Vietnam 895 5 – 220 675 410 20 240 Other 635 40 5 10 580 460 25 95
Asia 11,630 160 25 1,200 10,245 8,080 655 1,505
Other, and nationality not recorded 80 † – † 80 60 5 10
All nationalities 46,020 1,565 160 3,835 40,465 33,720 2,645 4,095
(1) Information is of initial decisions, excluding the outcome of appeals or other subsequent decisions.
Refusals

45
Table 3.4 Asylum appeals to the immigration adjudicators, tribunal and applications for Judicial Review, 2000 to 2004
United Kingdom Number of principal appellants (cases)
2000 2001 2002 2003 2004(P)
Appeals to theimmigration adjudicators
Appeals received by the Home Office (1) 46,190 74,365 51,695 46,130 35,110
Appeals received by the IAA 28,935 47,905 64,125 70,575 47,000
Adjudicator determinations (2) 19,395 43,415 64,405 81,725 55,975of which:
Allowed (3) 3,340 8,155 13,875 16,070 10,845Dismissed (3) 15,580 34,440 48,845 63,810 43,760Withdrawn (3) 475 825 1,685 1,845 1,370
Applications for permission toappeal to theImmigration Appeal Tribunal (2)
Applications 6,020 15,540 25,600 34,955 29,265
Decisions 5,490 13,540 22,825 32,180 30,520
Appeals to theImmigration Appeal Tribunal (2)
Received 1,615 3,860 6,920 11,845 9,465
Determined 2,635 3,190 5,565 9,450 8,785of which:
Allowed (3) 815 475 620 1,490 1,060Dismissed (3) 1,385 1,140 2,015 3,230 2,965Withdrawn (3) 220 150 225 510 840Remitted (3) 215 1,430 2,700 4,220 3,915
Applications for permissions to
apply for Judicial Review
Applications 1,920 (4) 2,210 (4) 3,075 2,170 1,370
Decisions 2,095 (4) 2,300 (4) 2,980 2,240 1,130of which:
granted permission to apply 555 (4) 290 (4) 260 235 130
Outcome of Judicial Review
Hearings
Allowed (5) 365 260 25 30 15Dismissed (6) 300 60 60 55 30
Withdrawn 95 60 5 5 †
(1) Figures for 2000 are based on manual counts of data received in Appeals Support Section of the Home Office.
Figures for 2001 onwards are based on Immigration and Nationality Directorate electronic sources.
(2) Based on information supplied by the Department for Constitutional Affairs. Determinations do not necessarily relate to appeals
received in the same period.
(3) Based on data supplied by the Presenting Officers Unit within the Home Office.
(4) Figures exclude judicial reviews brought in cases relating to asylum support (NASS).
(5) The decision of the respondent (in this case, the Home Office or the Immigration Appeal Tribunal) was quashed. These figures
include consent orders where the JR was conceded by the respondent.
(6) The decision of the respondent was upheld.

46
Table 3.5 Summary of applications for support and other information for those applying to the National Asylum Support Service (NASS), in the United Kingdom, in 2003 and 2004
Applications (excluding dependants) 2003 2004
(P)
Applications for:
Support including accommodation 19,375 18,030Subsistence only support 14,565 10,400Invalid and not yet known support type (1) 3,060 3,665
Total 37,000 32,090
of which: Family cases (2) 7,590 5,660 Single adults 29,410 26,435
Number of cases who have had their support ceased within the year (3) 46,585 40,660
Supported asylum seekers (including dependants) (4)
As at end: As at end: December 2003 December 2004
Asylum seekers supported in NASS accommodation 49,760 40,750Asylum seekers in receipt of subsistence only support 30,360 20,875Asylum seekers supported in initial accommodation(5) 9,955 5,080
(1) If a case is deemed invalid for the receipt of support or the case has not yet been assessed the case will not have a support type.(2) A family, in this context, is defined as any principal applicant with at least one dependant.(3) Number of cases who have had their support ceased in each year, not necessarily on cases applying in that year.(4) Excludes unaccompanied asylum seeking children supported by local authorities, estimated at around 6,000 in March 2005.(4) Excludes cases that pre-date the establishment of NASS in April 2000, administered under arrangements with local (4) authorities, estimated at up to 6,000 cases in March 2005 (the number of such cases is falling).(5) Including those in induction centres.

47
Table 3.6 Number of asylum seekers (including dependants) in receipt of support from the NationalTable 3.6 Asylum Support Service, by government office region of the United Kingdom as at endTable 3.6 December 2004 (1)
Number of Persons
Government Office Region In receipt of subsistence Supported in NASSonly accommodation
(2) (3)
EnglandNorth East 165 3,920 North West 900 6,430 Yorkshire & Humberside 660 9,370 East Midlands 745 2,555 West Midlands 1,195 6,310 East of England 760 590 Greater London 14,505 1,455 South East 1,340 815 South West 280 1,065
Total England 20,550 32,500
Wales 110 2,345 Scotland 205 5,790 Northern Ireland 15 115
Total United Kingdom 20,875 40,750
(1) Excludes those in initial accommodation, 5,080 as at the end of December 2004.
(2) Excludes unaccompanied asylum seeking children supported by local authorities, estimated at around 6,000 in March 2005. Excludes cases that
(2) pre-date the establishment of NASS in April 2000, administered under arrangements with local authorities, estimated at up to 6,000 cases
(2) in March 2005 (the number of such cases is falling).
(3) Includes those supported under accommodation only and accommodation and subsistence applications.
Table 3.7 Asylum seekers, including dependants, supported by NASS, by type of support, 2004 (1)
Number of Persons
As at end of: In receipt of subsistence only Supported in NASS accommodation(2) (3)
March-04 27,635 48,610 June-04 25,465 45,135 September-04 22,935 41,475 December-04 20,875 40,750
(1) Excludes those in initial accommodation, 5,080 as at the end of December 2004.
(2) Excludes unaccompanied asylum seeking children supported by local authorities, estimated at around 6,000 in March 2005. Excludes cases that
(2) pre-date the establishment of NASS in April 2000, administered under arrangements with local authorities, estimated at up to 6,000 cases
(2) in March 2005 (the number of such cases is falling).
(3) Includes those supported under accommodation only and accommodation and subsistence applications.

48
SECTION 4: After-entry control
Page
Table 4.1 Grants and refusals of extensions of leave to remain in the United Kingdom and settlement, by category and nationality, excluding EEA nationals and Switzerland, 2004
Table 4.2 Decisions on applications for an extension of leave to remain in the United Kingdomand settlement, by category, excluding EEA nationals and Switzerland, 2001-2004
Table 4.3 Issue and refusal of residence documentation (excluding Worker Registration Scheme)to EEA nationals and their family members, by nationality, 2004
49
50
56
57

50
Table 4.1 Grants and refusals of extensions of leave to remain(1) in the United Kingdom and settlement(2), by category and nationality, excluding EEA nationals and Switzerland, 2004(3)(P)
United Kingdom Number of decisions
Geographical region Total Category of extensionand nationality grants
of Visitors Working Students Trainees Work Permitextension holiday- permit free
makers holders employment (4)
All nationalities 287,890 9,150 390 149,325 12,455 55,165 14,230
Europe (excluding EEA)
Accession StatesCyprus 75 5 - 40 5 15 -Czech Republic 435 25 * 175 5 60 5Estonia 150 † * 30 † 5 -Hungary 310 10 * 130 5 65 †Latvia 670 5 * 95 † 5 15
Lithuania 4,105 5 * 365 † 20 5Malta 40 - - 5 10 15 5Poland 8,030 15 * 1,770 10 105 10Slovakia 450 20 * 175 † 35 -
Slovenia 20 - * 10 - 5 †
Accession States 14,280 80 - 2,795 40 345 45
Remainder of EuropeBulgaria 3,475 25 * 230 20 575 20Croatia 185 15 * 80 10 25 5Romania 2,635 30 * 185 35 405 45Russia 2,455 30 * 1,210 30 410 125Serbia and Montenegro 610 20 * 140 5 85 15
Turkey 3,960 100 * 2,295 20 260 75Ukraine 2,650 35 * 1,320 25 345 115Other former USSR 3,220 40 * 2,540 15 180 55Other former Yugoslavia 300 20 * 130 5 35 5Other Europe 950 25 * 150 † 40 5
Remainder of Europe 20,435 345 - 8,280 170 2,360 470
Europe (excluding EEA) 34,715 420 - 11,070 210 2,705 515
(1) Excludes dependants of principal applicants, asylum related decisions, the outcome of appeals and withdrawn applications.(2) Excludes "in line" dependants and the outcome of appeals.(3) Includes nationals of the Czech Republic, Cyprus, Estonia, Hungary, Latvia, Lithuania, Malta, Poland, Slovakia and Slovenia before(3) 1 May, but excludes them from this date.(4) Includes writers and artists.(5) Includes investors and innovators. (6) Includes unmarried partners. (7) Includes the au pairs and fiancé(e)s shown separately in Table 4.2.

51
Table 4.1 (continued)
United Kingdom Number of decisions
Category of extension Grants of Total Geographical region settlement refusals and nationality
Independent Spouse Other Category (2) of means (probationary extensions Unknown extension
and period (7) or business(5) applications)(6) settlement
15,330 17,185 9,275 5,385 64,665 32,335 All nationalities
Europe (excluding EEA)
Accession States - 5 - † 35 15 Cyprus
115 30 5 20 105 35 Czech Republic 100 10 5 † 15 10 Estonia65 15 10 10 80 25 Hungary
520 15 5 5 25 95 Latvia
3,675 20 5 15 105 260 Lithuania - † - - 20 5 Malta
5,985 80 25 25 385 870 Poland175 25 5 15 120 35 Slovakia
† - † † 5 † Slovenia
10,635 190 60 90 895 1,355 Accession States
Remainder of Europe2,430 125 20 30 310 800 Bulgaria
- 35 5 10 155 40 Croatia1,615 135 120 60 275 805 Romania
15 475 35 120 835 240 Russia - 190 115 40 740 205 Serbia and Montenegro
470 520 125 100 1,990 555 Turkey5 330 50 420 410 375 Ukraine5 235 30 120 295 400 Other former USSR
† 70 10 20 150 65 Other former Yugoslavia - 650 30 50 390 90 Other Europe
4,545 2,760 54 970 5,550 3,575 Remainder of Europe
15,180 2,950 600 1,065 6,450 4,930 Europe (excluding EEA)

52
Table 4.1 Grants and refusals of extensions of leave to remain(1) in the United Kingdom and settlement(2), by category and nationality, excluding EEA nationals and Switzerland, 2004(3)(P) (continued)
United Kingdom Number of decisions
Geographical region Total Category of extensionand nationality grants
of Visitors Working Students Trainees Work Permitextension holiday- permit free
makers holders employment
(4)
AmericasArgentina 485 10 * 265 † 105 35Barbados 235 5 - 115 30 40 5Brazil 9,690 95 * 8,780 5 175 110Canada 1,960 50 30 435 35 725 140Chile 330 5 * 225 5 25 20
Colombia 2,350 35 * 1,945 10 85 40Guyana 275 20 - 90 5 95 5Jamaica 9,590 125 5 6,630 20 430 50Mexico 1,060 20 * 785 5 105 50Peru 345 5 * 205 † 20 45
Trinidad and Tobago 1,430 25 10 765 80 320 40USA 8,630 145 * 1,630 35 2,300 2,505Venezuela 1,070 15 * 900 5 50 30Other Americas 3,220 70 † 2,520 20 125 60
Americas 40,675 630 50 25,290 255 4,610 3,140
AfricaAlgeria 490 25 * 270 5 30 10Angola 200 20 * 135 - 5 †Congo (Dem. Rep.) (8) 150 10 * 45 † 5 5Egypt 990 75 * 235 220 245 105Ethiopia 200 15 * 90 5 15 30
Ghana 6,175 215 15 4,015 105 830 110Kenya 2,690 65 † 1,510 80 565 110Libya 2,295 85 * 1,840 155 120 30Mauritius 4,425 45 - 3,670 70 470 25Morocco 365 10 * 120 5 35 30
Nigeria 7,510 370 † 4,290 355 1,170 360Sierra Leone 870 35 - 580 5 60 15Somalia 130 † * 5 - 5 -South Africa 11,700 915 60 3,400 215 4,290 535Sudan 590 85 * 185 125 85 45
Tanzania 1,330 35 - 970 20 65 35Tunisia 100 5 * 30 - 15 5Uganda 2,380 50 - 1,920 25 120 30Zambia 1,215 25 † 645 20 330 15Zimbabwe 9,160 160 5 5,450 90 2,340 120Other Africa 6,730 150 † 5,370 45 420 90
Africa 59,705 2,405 85 34,780 1,550 11,210 1,700
(8) The Democratic Republic of the Congo, formerly known as Zaire.

53
Table 4.1 (continued)
United Kingdom Number of decisions
Category of extension Grants of Total Geographical region settlement refusals and nationality
Independent Spouse Other Category (2) of means (probationary extensions Unknown extension
and period (7) or
business(5) applications)(6) settlement
Americas † 55 5 10 65 30 Argentina - 30 5 5 100 35 Barbados † 415 50 60 365 755 Brazil5 325 155 55 900 185 Canada - 25 20 † 45 25 Chile
- 170 40 25 335 195 Colombia - 25 25 10 110 75 Guyana - 1,545 590 195 2,280 2,645 Jamaica - 75 10 10 100 55 Mexico † 60 5 5 70 45 Peru
- 120 45 30 360 180 Trinidad and Tobago25 1,155 670 165 2,485 465 USA - 55 10 5 55 65 Venezuela † 245 130 40 500 425 Other Americas
35 4,300 1,760 605 7,775 5,180 Americas
Africa - 80 55 15 520 190 Algeria - 5 20 10 285 40 Angola - 15 50 20 490 60 Congo (Dem. Rep.) (8)
- 40 30 35 220 115 Egypt - 15 25 10 295 45 Ethiopia
- 330 465 95 1,200 975 Ghana10 165 150 35 945 485 Kenya † 25 30 10 160 140 Libya - 85 25 30 320 430 Mauritius - 95 60 5 260 110 Morocco
5 430 385 145 2,335 1,490 Nigeria - 65 90 20 1,045 280 Sierra Leone - 30 75 10 1,195 80 Somalia5 930 785 560 4,805 1,285 South Africa - 25 5 30 260 60 Sudan
5 75 105 25 210 225 Tanzania † 30 10 5 70 30 Tunisia - 95 120 20 320 400 Uganda - 40 120 20 220 215 Zambia - 265 605 120 1,545 2,015 Zimbabwe5 280 275 95 1,190 980 Other Africa
25 3,120 3,495 1,325 17,890 9,645 Africa

54
Table 4.1 Grants and refusals of extensions of leave to remain(1) in the United Kingdom and settlement(2), by category and nationality, excluding EEA nationals and Switzerland, 2004(3)(P) (continued)United Kingdom Number of decisions
Geographical region Total Category of extensionand nationality grants
of Visitors Working Students Trainees Work Permitextension holiday- permit free
makers holders employment(4)
Asia
Indian sub-continentBangladesh 4,145 180 † 2,940 75 295 190India 39,355 1,560 5 10,625 7,210 15,310 3,080Pakistan 12,630 795 5 6,130 1,275 2,030 630
Indian sub-continent 56,125 2,535 10 19,695 8,555 17,635 3,895
Middle EastIran 2,030 290 * 1,145 125 160 65Iraq 435 120 * 40 45 40 15Israel 790 10 * 435 5 145 75Jordan 515 20 * 265 75 80 30Kuwait 150 70 * 55 10 5 †
Lebanon 365 25 * 155 25 85 25Saudi Arabia 810 30 * 740 5 15 5Syria 870 75 * 445 120 130 30Yemen 290 20 * 180 5 5 5Other Middle East 525 45 * 345 55 35 10
Middle East 6,780 710 * 3,810 460 695 260
Remainder of AsiaChina 34,940 595 * 30,400 15 2,520 420Hong Kong (9) 2,660 40 - 1,835 30 480 35Indonesia 965 35 * 385 15 75 370Japan 5,775 155 * 4,215 20 755 95Malaysia 5,915 130 5 3,280 550 1,445 150
Philippines 9,830 240 * 140 20 6,885 2,035Singapore 655 10 - 250 85 195 55South Korea 5,330 130 * 4,525 5 370 100Sri Lanka 4,065 155 5 2,520 305 490 270Taiwan 1,280 35 * 1,050 † 95 10
Thailand 2,990 85 * 1,790 5 330 95Other Asia 5,405 130 - 3,455 250 440 185
Remainder of Asia 79,810 1,750 10 53,845 1,305 14,080 3,820
Asia 142,720 4,995 20 77,350 10,315 32,415 7,975
OceaniaAustralia 6,465 435 180 460 85 2,925 585New Zealand 3,040 245 55 195 30 1,250 295Other Oceania 340 10 - 35 † 40 15
Oceania 9,845 690 235 690 115 4,215 895
British Overseas 185 5 - 120 5 15 † citizens
Nationality unknown 55 5 * 25 † † 5
All nationalities (excluding EEA) 287,890 9,150 390 149,325 12,455 55,165 14,230
(9) Hong Kong (Special Administrative Region of China) - see Explanatory Notes paragraph 7.

55
Table 4.1 (continued)
United Kingdom Numbers of decisions
Category of extension Grants of Total Geographical region settlement refusals and nationality
Independent Spouse Other Category (2) of means (probationary extensions Unknown extension
and period (7) or business(5) applications)(6) settlement
Asia
Indian sub-continent † 175 200 90 2,375 1,565 Bangladesh10 815 280 460 5,800 2,680 India15 1,110 355 285 5,905 2,515 Pakistan
25 2,100 835 835 14,080 6,765 Indian sub-continent
Middle East15 100 50 85 540 340 Iran † 100 45 35 875 175 Iraq10 80 20 10 205 110 Israel † 30 10 5 120 50 Jordan - - 5 5 30 † Kuwait
- 30 15 10 190 60 Lebanon5 † 5 10 35 30 Saudi Arabia - 45 5 15 105 105 Syria - 55 10 5 145 40 Yemen - 15 10 10 65 40 Other Middle East
30 465 165 195 2,310 945 Middle East
Remainder of Asia10 680 65 235 1,220 1,140 China5 150 45 40 410 255 Hong Kong (9)
- 60 10 10 125 50 Indonesia † 380 80 80 785 215 Japan † 230 45 75 680 470 Malaysia
- 325 70 120 4,630 550 Philippines † 40 5 10 210 45 Singapore - 85 75 40 250 235 South Korea † 145 90 90 1,590 470 Sri Lanka - 70 † 20 140 35 Taiwan
- 570 50 60 745 200 Thailand - 215 625 100 795 465 Other Asia
20 2,950 1,155 875 11,575 4,125 Remainder of Asia
75 5,515 2,155 1,900 27,965 11,835 Asia
Oceania10 870 615 300 2,505 445 Australia † 395 425 155 1,915 190 New Zealand - 10 210 15 40 45 Other Oceania
10 1,275 1,245 475 4,455 675 Oceania
- 20 15 5 55 35 British Overseas citizens
† 5 † 10 75 30 Nationality unknown
All nationalities15,330 17,185 9,275 5,385 64,665 32,335 (excluding EEA)
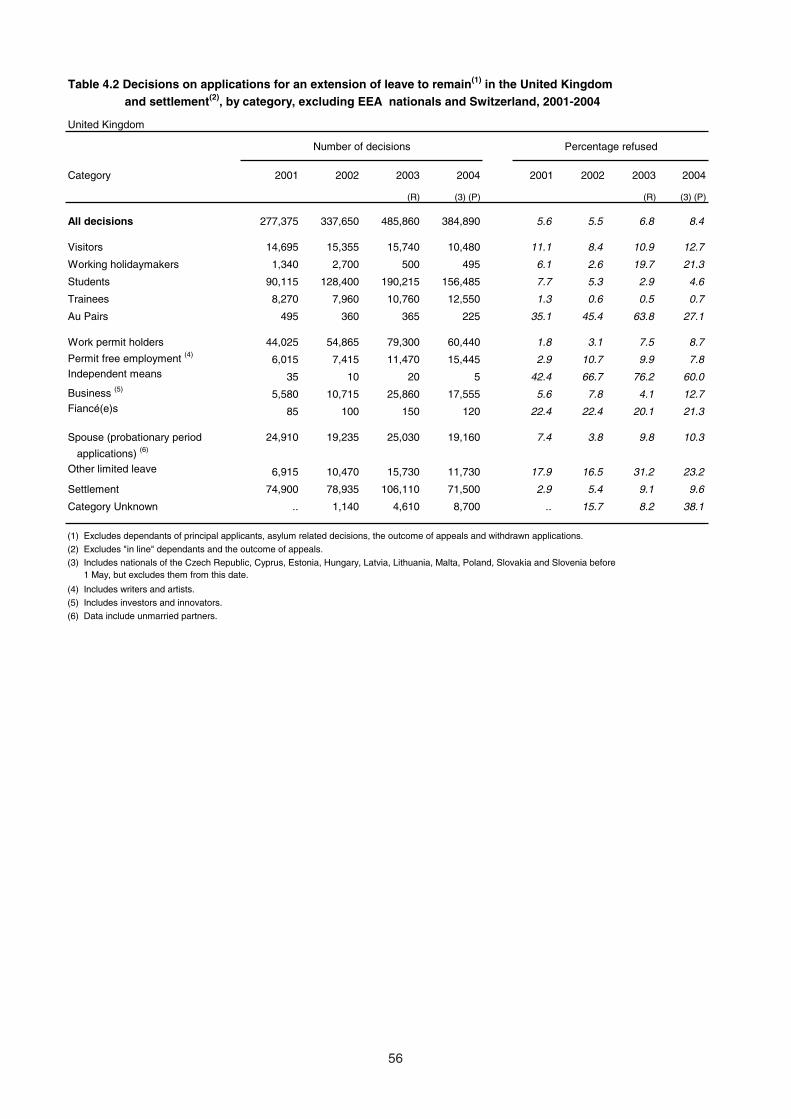
56
Table 4.2 Decisions on applications for an extension of leave to remain(1) in the United Kingdom and settlement(2), by category, excluding EEA nationals and Switzerland, 2001-2004
United Kingdom
Number of decisions Percentage refused
Category 2001 2002 2003 2004 2001 2002 2003 2004
(R) (3) (P) (R) (3) (P)
All decisions 277,375 337,650 485,860 384,890 5.6 5.5 6.8 8.4
Visitors 14,695 15,355 15,740 10,480 11.1 8.4 10.9 12.7
Working holidaymakers 1,340 2,700 500 495 6.1 2.6 19.7 21.3
Students 90,115 128,400 190,215 156,485 7.7 5.3 2.9 4.6
Trainees 8,270 7,960 10,760 12,550 1.3 0.6 0.5 0.7
Au Pairs 495 360 365 225 35.1 45.4 63.8 27.1
Work permit holders 44,025 54,865 79,300 60,440 1.8 3.1 7.5 8.7
Permit free employment (4)6,015 7,415 11,470 15,445 2.9 10.7 9.9 7.8
Independent means 35 10 20 5 42.4 66.7 76.2 60.0
Business (5)5,580 10,715 25,860 17,555 5.6 7.8 4.1 12.7
Fiancé(e)s 85 100 150 120 22.4 22.4 20.1 21.3
Spouse (probationary period 24,910 19,235 25,030 19,160 7.4 3.8 9.8 10.3
applications) (6)
Other limited leave 6,915 10,470 15,730 11,730 17.9 16.5 31.2 23.2
Settlement 74,900 78,935 106,110 71,500 2.9 5.4 9.1 9.6
Category Unknown .. 1,140 4,610 8,700 .. 15.7 8.2 38.1
(1) Excludes dependants of principal applicants, asylum related decisions, the outcome of appeals and withdrawn applications.
(2) Excludes "in line" dependants and the outcome of appeals.
(3) Includes nationals of the Czech Republic, Cyprus, Estonia, Hungary, Latvia, Lithuania, Malta, Poland, Slovakia and Slovenia before(3) 1 May, but excludes them from this date.
(4) Includes writers and artists.
(5) Includes investors and innovators.
(6) Data include unmarried partners.
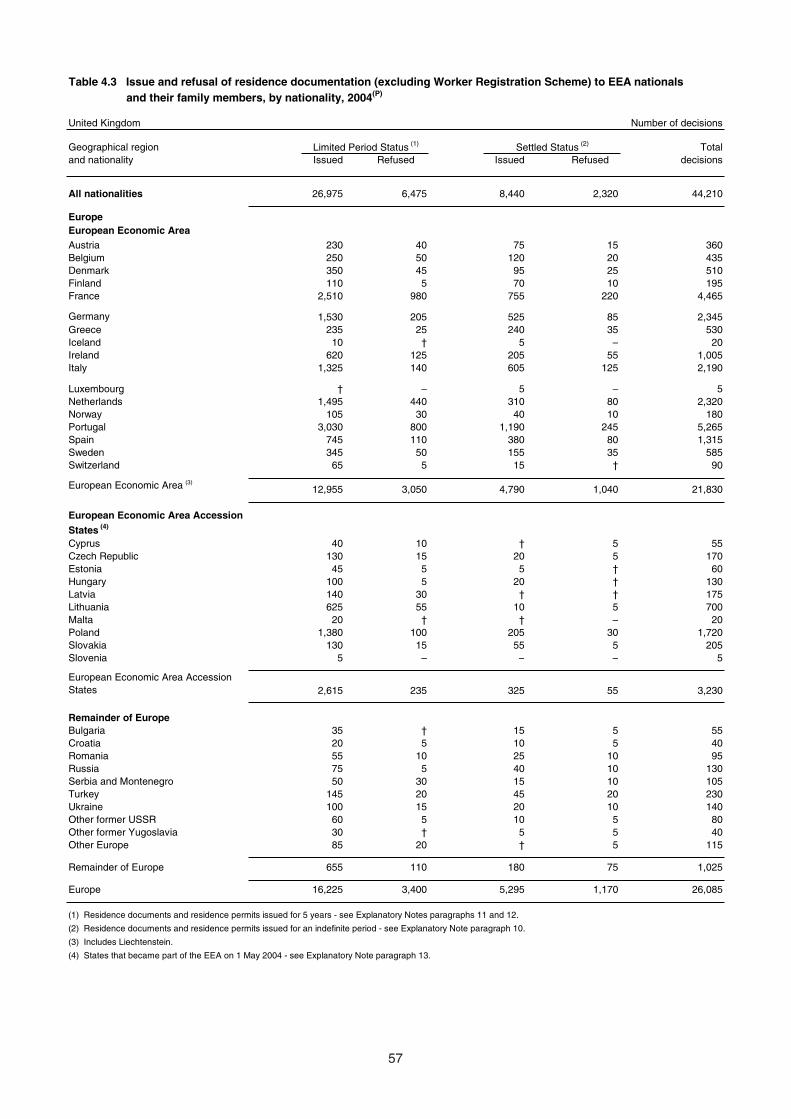
57
Table 4.3 Issue and refusal of residence documentation (excluding Worker Registration Scheme) to EEA nationalsTable 4.3 and their family members, by nationality, 2004(P)
United Kingdom Number of decisions
Geographical region Totaland nationality Issued Refused Issued Refused decisions
All nationalities 26,975 6,475 8,440 2,320 44,210
EuropeEuropean Economic AreaAustria 230 40 75 15 360Belgium 250 50 120 20 435Denmark 350 45 95 25 510Finland 110 5 70 10 195France 2,510 980 755 220 4,465
Germany 1,530 205 525 85 2,345Greece 235 25 240 35 530Iceland 10 † 5 – 20Ireland 620 125 205 55 1,005Italy 1,325 140 605 125 2,190
Luxembourg † – 5 – 5Netherlands 1,495 440 310 80 2,320Norway 105 30 40 10 180Portugal 3,030 800 1,190 245 5,265Spain 745 110 380 80 1,315Sweden 345 50 155 35 585Switzerland 65 5 15 † 90
European Economic Area (3)12,955 3,050 4,790 1,040 21,830
European Economic Area Accession
States (4)
Cyprus 40 10 † 5 55Czech Republic 130 15 20 5 170Estonia 45 5 5 † 60Hungary 100 5 20 † 130Latvia 140 30 † † 175Lithuania 625 55 10 5 700Malta 20 † † – 20Poland 1,380 100 205 30 1,720Slovakia 130 15 55 5 205Slovenia 5 – – – 5
European Economic Area Accession States 2,615 235 325 55 3,230
Remainder of EuropeBulgaria 35 † 15 5 55Croatia 20 5 10 5 40Romania 55 10 25 10 95Russia 75 5 40 10 130Serbia and Montenegro 50 30 15 10 105Turkey 145 20 45 20 230Ukraine 100 15 20 10 140Other former USSR 60 5 10 5 80Other former Yugoslavia 30 † 5 5 40Other Europe 85 20 † 5 115
Remainder of Europe 655 110 180 75 1,025
Europe 16,225 3,400 5,295 1,170 26,085
(1) Residence documents and residence permits issued for 5 years - see Explanatory Notes paragraphs 11 and 12.
(2) Residence documents and residence permits issued for an indefinite period - see Explanatory Note paragraph 10.
(3) Includes Liechtenstein.
(4) States that became part of the EEA on 1 May 2004 - see Explanatory Note paragraph 13.
Limited Period Status (1) Settled Status (2)
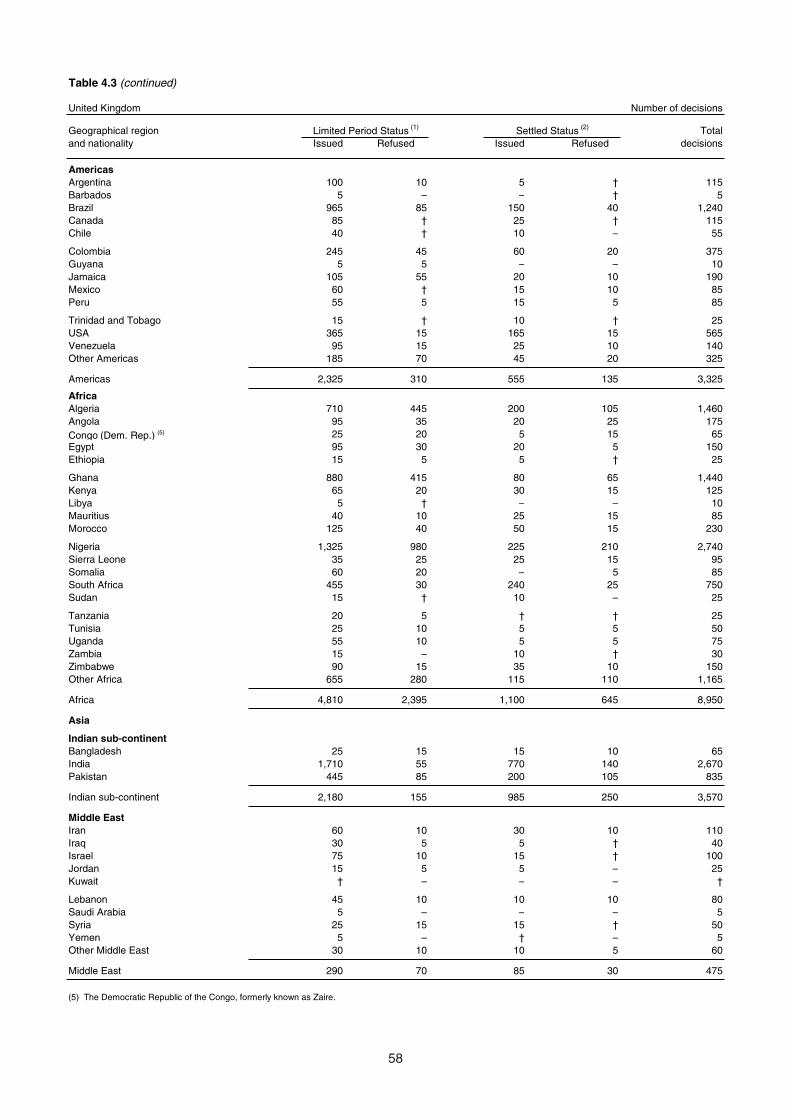
58
Table 4.3 (continued)
United Kingdom Number of decisions
Geographical region Totaland nationality Issued Refused Issued Refused decisions
AmericasArgentina 100 10 5 † 115Barbados 5 – – † 5Brazil 965 85 150 40 1,240Canada 85 † 25 † 115Chile 40 † 10 – 55
Colombia 245 45 60 20 375Guyana 5 5 – – 10Jamaica 105 55 20 10 190Mexico 60 † 15 10 85Peru 55 5 15 5 85
Trinidad and Tobago 15 † 10 † 25USA 365 15 165 15 565Venezuela 95 15 25 10 140Other Americas 185 70 45 20 325
Americas 2,325 310 555 135 3,325
AfricaAlgeria 710 445 200 105 1,460Angola 95 35 20 25 175Congo (Dem. Rep.) (5) 25 20 5 15 65Egypt 95 30 20 5 150Ethiopia 15 5 5 † 25
Ghana 880 415 80 65 1,440Kenya 65 20 30 15 125Libya 5 † – – 10Mauritius 40 10 25 15 85Morocco 125 40 50 15 230
Nigeria 1,325 980 225 210 2,740Sierra Leone 35 25 25 15 95Somalia 60 20 – 5 85South Africa 455 30 240 25 750Sudan 15 † 10 – 25
Tanzania 20 5 † † 25Tunisia 25 10 5 5 50Uganda 55 10 5 5 75Zambia 15 – 10 † 30Zimbabwe 90 15 35 10 150Other Africa 655 280 115 110 1,165
Africa 4,810 2,395 1,100 645 8,950
Asia
Indian sub-continentBangladesh 25 15 15 10 65India 1,710 55 770 140 2,670Pakistan 445 85 200 105 835
Indian sub-continent 2,180 155 985 250 3,570
Middle EastIran 60 10 30 10 110Iraq 30 5 5 † 40Israel 75 10 15 † 100Jordan 15 5 5 – 25Kuwait † – – – †
Lebanon 45 10 10 10 80Saudi Arabia 5 – – – 5Syria 25 15 15 † 50Yemen 5 – † – 5Other Middle East 30 10 10 5 60
Middle East 290 70 85 30 475
(5) The Democratic Republic of the Congo, formerly known as Zaire.
Limited Period Status (1) Settled Status (2)
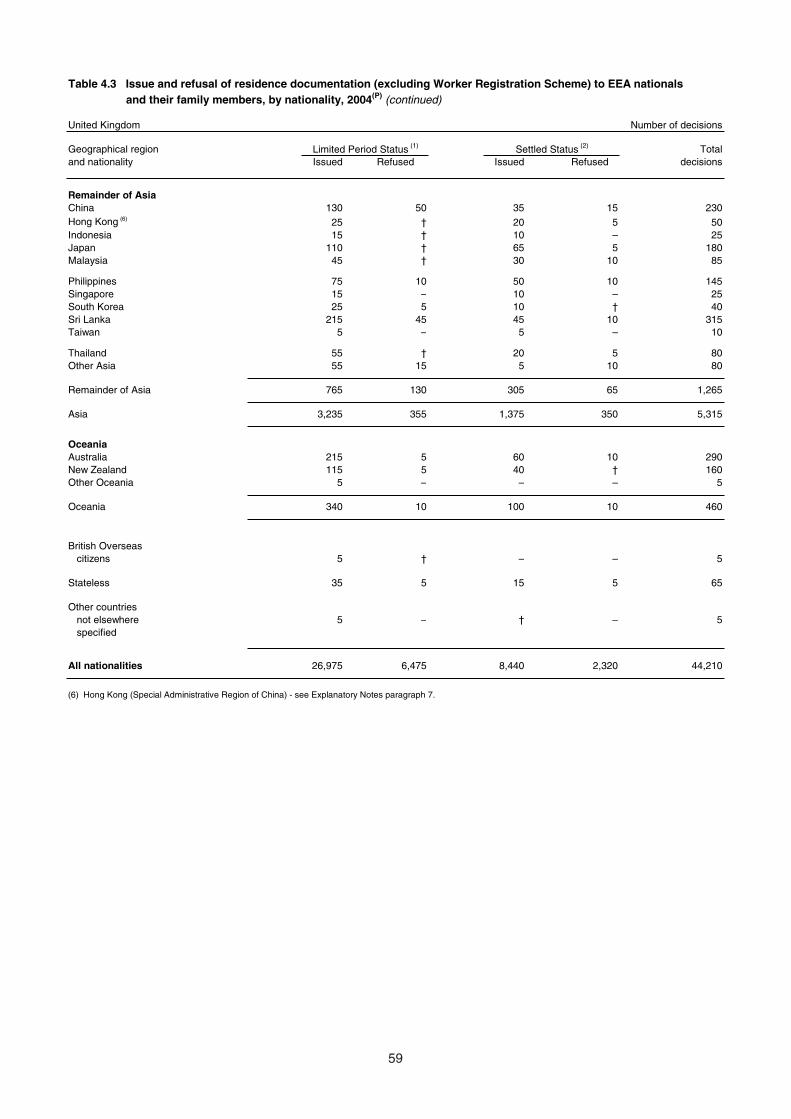
59
Table 4.3 Issue and refusal of residence documentation (excluding Worker Registration Scheme) to EEA nationalsTable 4.3 and their family members, by nationality, 2004(P) (continued)
United Kingdom Number of decisions
Geographical region Totaland nationality Issued Refused Issued Refused decisions
Remainder of AsiaChina 130 50 35 15 230Hong Kong (6) 25 † 20 5 50Indonesia 15 † 10 – 25Japan 110 † 65 5 180Malaysia 45 † 30 10 85
Philippines 75 10 50 10 145Singapore 15 – 10 – 25South Korea 25 5 10 † 40Sri Lanka 215 45 45 10 315Taiwan 5 – 5 – 10
Thailand 55 † 20 5 80Other Asia 55 15 5 10 80
Remainder of Asia 765 130 305 65 1,265
Asia 3,235 355 1,375 350 5,315
OceaniaAustralia 215 5 60 10 290New Zealand 115 5 40 † 160Other Oceania 5 – – – 5
Oceania 340 10 100 10 460
British Overseas citizens 5 † – – 5
Stateless 35 5 15 5 65
Other countries not elsewhere 5 – † – 5 specified
All nationalities 26,975 6,475 8,440 2,320 44,210
(6) Hong Kong (Special Administrative Region of China) - see Explanatory Notes paragraph 7.
Limited Period Status (1) Settled Status (2)

60

SECTION 5: Acceptances for settlement
Page
Table 5.1 Grants of settlement, by nationality and category, excluding EEA nationals and Switzerland, 2004
Table 5.2 Grants of settlement on removal of time limit, by broad nationality, gender and age, excluding EEA nationals and Switzerland, 2004
Table 5.3 Grants of settlement by category of grant, excluding EEA nationals and Switzerland, 1994-2004
Table 5.4 Grants of settlement, by main category and broad nationality, excluding EEA nationals and Switzerland, 1994-2004
Table 5.5 Grants of settlement by nationality, excluding EEA nationals and Switzerland, 1994-2004
Table 5.6 Grants of settlement – Commonwealth citizens and foreign nationals, 1960–2004
Explanatory Notes and Definitions paragraphs 37-43.
61
62
68
69
70
72
75

62
Table 5.1 Grants of settlement, by nationality and category, excluding EEA nationals and Switzerland(1), 2004(P)(2)
United Kingdom Number of persons
Geographical region Total 4 years 4 years' Businessmen Recognised Other Othersand nationality with permit free and refugees discretionary granted
work permit employment person of and persons in own right (3) independent granted
means exceptionalleave(4)
All nationalities 139,260 16,205 1,325 220 19,030 4,080 4,765(excluding EEA)
Europe
Accession States(2)
Cyprus 160 † – – 40 † –Czech Republic 520 5 – – 90 † –Estonia 165 † – – 45 – –Hungary 100 5 † † – – –Latvia 210 † – † 50 † –
Lithuania 610 † † – 165 – –Malta 25 – – – – 5 –Poland 1,235 20 – 60 185 20 –Slovakia 255 5 – 10 30 – –Slovenia 5 – – – – – –
Accession States 3,285 40 † 75 600 30 –
Remainder of EuropeBulgaria 625 105 † 25 75 15 –Croatia 985 25 10 – 240 15 –Romania 560 100 † † 65 5 –Russia 1,620 260 5 10 190 55 –Serbia and Montenegro 9,590 95 5 – 2,365 40 –
Turkey 6,060 105 5 † 1,505 90 –Ukraine 1,050 70 † – 215 20 –Other former USSR 830 65 † † 155 20 –Other former Yugoslavia 285 10 – – 45 5 –Other Europe 1,700 10 – – 365 5 –
Remainder of Europe 23,315 845 20 40 5,220 270 –
Europe 26,600 885 25 115 5,820 300 –
AmericasArgentina 95 20 5 – – † †Barbados 145 45 – – – 10 –Brazil 565 35 15 – 25 25 –Canada 1,225 230 5 5 – 20 240Chile 65 5 – – 5 5 –
Colombia 1,745 30 5 † 435 30 –Guyana 170 30 – – 5 15 –Jamaica 2,930 135 5 – 50 125 †Mexico 130 30 5 † – 5 –Peru 110 10 5 – 15 5 –
Trinidad and Tobago 570 180 † – † 30 5USA 4,120 1,155 100 25 † 70 –Venezuela 85 10 – † 5 † –Other Americas 2,175 50 5 5 425 35 –
Americas 14,130 1,960 145 35 960 375 250
(1) Also excludes dependants of EEA and Swiss nationals in confirmed relationships granted permanent residence - see Explanatory Notes paragraph 10. (2) Includes nationals of the Czech Republic, Cyprus, Estonia, Hungary, Latvia, Lithuania, Malta, Poland, Slovakia and Slovenia before 1 May, but excludes them from this date.
(3) Includes ministers of religion, writers and artists. (4) See Explanatory Notes paragraph 43. (5) Includes unmarried partners.

63
Table 5.1 (continued)
United Kingdom Number of persons
Husbands Wives Children Parents Other and Other Category Geographical region (5) (5) and unspecified acceptances Unknown and nationality
grandparents dependents
12,645 25,235 40,820 1,985 8,410 75 4,470 All nationalities(excluding EEA)
Europe
Accession States(2)
15 20 70 – 15 – 5 Cyprus25 135 210 – 50 – 5 Czech Republic 5 25 70 – 15 – † Estonia
† 65 10 † 5 † 5 Hungary5 50 90 – 15 – † Latvia
25 120 245 – 40 – 10 Lithuania5 5 5 – † – 5 Malta
60 300 430 † 85 – 75 Poland5 120 65 – 15 – 10 Slovakia
† 5 – – – – – Slovenia
145 845 1,185 † 245 † 115 Accession States
40 140 145 10 40 – 35 Bulgaria30 220 380 † 60 – 10 Croatia40 160 135 10 25 – 15 Romania50 510 365 25 80 † 70 Russia
290 1,805 4,500 10 425 – 55 Serbia and Montenegro
605 1,150 2,060 20 410 – 110 Turkey50 285 305 10 65 – 35 Ukraine25 220 255 10 60 – 25 Other former USSR30 95 70 5 15 – 15 Other former Yugoslavia
220 310 670 † 90 – 25 Other Europe
1,375 4,895 8,880 100 1,275 † 390 Remainder of Europe
1,520 5,740 10,065 100 1,515 † 510 Europe
Americas15 30 15 † † – 5 Argentina30 15 25 † 5 † 15 Barbados80 215 100 † 35 – 30 Brazil
110 290 200 10 55 10 50 Canada5 30 10 † 5 † 5 Chile
105 260 705 5 145 – 30 Colombia25 40 40 10 10 – 5 Guyana
950 575 665 40 190 † 195 Jamaica20 50 15 † 5 † 5 Mexico10 35 15 † 10 – 5 Peru
70 85 130 10 35 5 20 Trinidad and Tobago360 1,015 970 10 200 15 205 USA10 30 20 – 5 – 5 Venezuela
195 335 895 10 175 † 50 Other Americas
1,980 2,990 3,800 95 885 40 615 Americas

64
Table 5.1 Grants of settlement, by nationality and category, excluding EEA nationals and Switzerland(1), 2004(P)(2)
Table 5.1 (continued)United Kingdom Number of persons
Geographical region Total 4 years 4 years' Businessmen Recognised Other Othersand nationality with permit free and persons refugees discretionary granted
work permit employment of independent and persons in own right (3) means granted
exceptionalleave (4)
AfricaAlgeria 1,005 15 5 – 315 55 –Angola 1,090 † – – 355 20 –Congo (Dem. Rep.) (7) 2,410 † – – 755 15 –Egypt 485 65 5 † 25 25 –Ethiopia 520 5 5 – 255 5 –
Ghana 2,305 190 15 † 130 260 5Kenya 2,255 115 5 5 590 80 10Libya 465 15 † – 30 40 –Mauritius 530 105 – – 5 75 –Morocco 305 15 5 – 5 30 –
Nigeria 4,620 410 30 † 390 490 5Sierra Leone 1,805 30 † – 745 130 –Somalia 3,825 5 – – 1,530 30 –South Africa 7,565 1,735 25 5 20 35 1,895Sudan 745 15 † † 300 25 –
Tanzania 570 20 † 5 80 45 †Tunisia 115 10 – – 10 5 –Uganda 960 15 † – 255 45 †Zambia 505 90 † – 20 40 5Zimbabwe 3,765 645 5 – 285 85 305Other Africa 3,585 100 5 † 1,050 115 15
Africa 39,440 3,610 105 20 7,155 1,655 2,235
Asia
Indian sub–continentBangladesh 3,115 25 30 † 280 75 †India 11,100 2,875 305 10 210 280 35Pakistan 10,025 240 80 5 955 260 †
Indian sub–continent 24,240 3,140 410 15 1,445 620 35
Middle EastIran 1,725 45 5 5 405 75 –Iraq 1,720 15 – † 720 20 –Israel 505 75 † 5 35 15 –Jordan 250 65 – † 5 10 –Kuwait 90 5 – – 10 10 –
Lebanon 490 35 † † 100 10 –Saudi Arabia 60 5 – † † 20 –Syria 255 20 – † 30 15 –Yemen 420 † † – 75 10 –Other Middle East 525 10 – – 105 5 –
Middle East 6,045 270 10 20 1,495 185 –
(7) The Democratic Republic of the Congo, formerly known as Zaire.

65
Table 5.1 (continued)
United Kingdom Number of persons
Husbands Wives Children Parents Other and Other Category Geographical region (5) (5) and unspecified acceptances Unknown and nationality
grandparents dependents
Africa95 160 270 10 45 † 30 Algeria30 80 515 – 80 – 10 Angola60 170 1,190 5 170 † 45 Congo (Dem. Rep.) (7)
70 95 150 5 35 – 20 Egypt30 55 130 5 25 – 10 Ethiopia
270 310 785 35 205 † 100 Ghana140 215 805 35 170 – 85 Kenya 30 85 195 † 35 – 30 Libya60 95 115 15 40 † 15 Mauritius70 115 25 10 20 – 15 Morocco
515 430 1,585 100 475 † 190 Nigeria80 80 560 25 105 † 40 Sierra Leone45 130 1,560 15 400 † 110 Somalia
775 1,100 1,400 30 325 – 225 South Africa20 105 225 5 35 – 10 Sudan
40 80 225 5 50 – 15 Tanzania40 20 25 – 5 – 5 Tunisia35 80 405 5 95 – 20 Uganda40 40 210 † 30 – 25 Zambia
350 295 1,350 25 320 – 105 Zimbabwe205 300 1,465 15 230 5 80 Other Africa
2,995 4,040 13,195 350 2,880 10 1,180 Africa
Asia
Indian sub–continent730 890 580 190 125 † 190 Bangladesh955 2,895 2,315 275 535 – 410 India
1,815 2,490 2,420 575 645 5 530 Pakistan
3,505 6,275 5,310 1,045 1,300 5 1,135 Indian sub–continent
Middle East70 310 545 65 155 – 45 Iran40 225 480 25 140 – 60 Iraq65 115 150 – 35 – 15 Israel20 55 70 – 15 – 5 Jordan5 10 40 – 5 – 10 Kuwait
25 100 175 10 25 – 10 Lebanon5 5 20 – † – 5 Saudi Arabia
25 55 70 5 20 – 10 Syria25 80 180 † 35 † 10 Yemen25 70 275 – 25 – 5 Other Middle East
305 1,025 2,000 110 460 † 165 Middle East

66
Table 5.1 Grants of settlement, by nationality and category, excluding EEA nationals and Switzerland(1), 2004(P)(2)
Table 5.1 (continued)United Kingdom Number of persons
Geographical region Total 4 years 4 years' Businessmen Recognised Other Othersand nationality with permit free and persons refugees discretionary granted
work permit employment of independent and persons in own right (3) means granted
exceptionalleave(4)
Remainder of AsiaChina 2,315 485 5 † 155 45 –Hong Kong (8) 540 50 † 5 † 160 †Indonesia 195 20 30 – † 10 –Japan 1,360 405 5 † – 105 –Malaysia 955 230 5 † 5 195 †
Philippines 8,200 3,650 415 – 25 25 †Singapore 305 90 5 † † 35 †South Korea 570 105 15 † 5 35 †Sri Lanka 4,875 60 40 † 1,380 80 †Taiwan 205 30 – † † 70 –
Thailand 985 70 20 – 5 60 –Other Asia 2,330 50 60 † 550 65 –
Remainder of Asia 22,830 5,245 605 15 2,135 890 10
Total Asia 53,115 8,655 1,025 50 5,075 1,695 45
OceaniaAustralia 3,240 715 15 † – 20 1,080New Zealand 2,370 365 5 † † 15 1,150Other Oceania 85 10 – – 5 † *
Oceania 5,690 1,090 20 † 5 35 2,235
British Overseas 75 † † – 5 15 † citizens
Nationality Unknown 205 – – – 15 5 †
All nationalities 139,260 16,205 1,325 220 19,030 4,080 4,765(excluding EEA)
(8) Hong Kong (Special Administrative Region of China) - see Explanatory Notes paragraph 7.
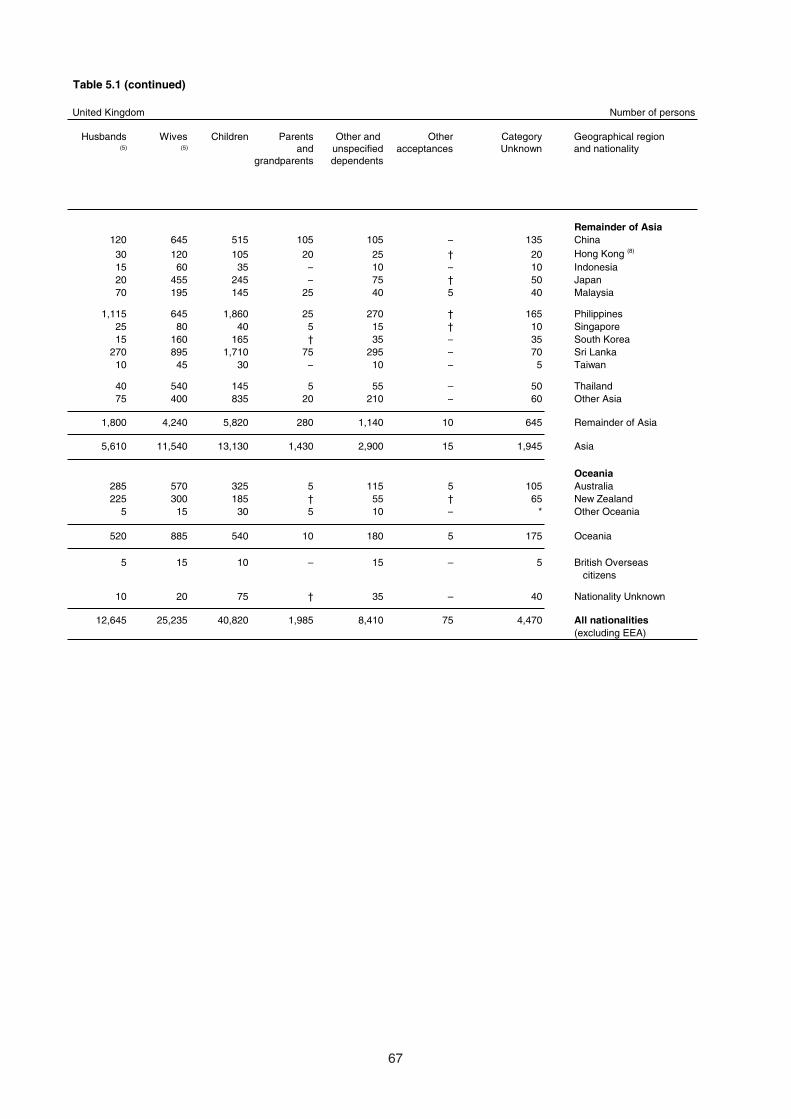
67
Table 5.1 (continued)
United Kingdom Number of persons
Husbands Wives Children Parents Other and Other Category Geographical region (5) (5) and unspecified acceptances Unknown and nationality
grandparents dependents
Remainder of Asia120 645 515 105 105 – 135 China
30 120 105 20 25 † 20 Hong Kong (8)
15 60 35 – 10 – 10 Indonesia20 455 245 – 75 † 50 Japan70 195 145 25 40 5 40 Malaysia
1,115 645 1,860 25 270 † 165 Philippines25 80 40 5 15 † 10 Singapore15 160 165 † 35 – 35 South Korea
270 895 1,710 75 295 – 70 Sri Lanka10 45 30 – 10 – 5 Taiwan
40 540 145 5 55 – 50 Thailand75 400 835 20 210 – 60 Other Asia
1,800 4,240 5,820 280 1,140 10 645 Remainder of Asia
5,610 11,540 13,130 1,430 2,900 15 1,945 Asia
Oceania285 570 325 5 115 5 105 Australia225 300 185 † 55 † 65 New Zealand
5 15 30 5 10 – * Other Oceania
520 885 540 10 180 5 175 Oceania
5 15 10 – 15 – 5 British Overseas citizens
10 20 75 † 35 – 40 Nationality Unknown
12,645 25,235 40,820 1,985 8,410 75 4,470 All nationalities(excluding EEA)

68
Table 5.2 Grants of settlement on removal of time limit, by broad nationality, gender and age(1),Table 6.2 excluding EEA nationals and Switzerland(2), 2004(3)(P)
United Kingdom Number of persons
Geographical Children 16–24 25–34 35–44 45–59 60+ Adultsregion (under 16) (16 and over)
All nationalities
Male 16,895 5,910 17,365 11,605 4,700 1,135 40,715Female 16,305 8,640 20,975 11,115 4,780 1,870 47,385Total 33,205 14,550 38,345 22,720 9,480 3,005 88,100
Europe (excluding EEA)
Male 3,630 1,165 2,280 1,865 615 65 5,990Female 3,395 1,320 3,160 1,615 525 125 6,750Total 7,025 2,485 5,445 3,480 1,140 190 12,740
Americas
Male 1,460 475 1,565 1,305 630 135 4,110Female 1,555 695 2,010 1,415 705 145 4,970Total 3,015 1,170 3,580 2,720 1,335 280 9,080
Africa
Male 5,650 1,815 4,195 3,375 1,480 305 11,170Female 5,555 2,240 5,095 3,475 1,700 530 13,040Total 11,205 4,055 9,290 6,850 3,185 835 24,210
Asia
Indian sub–continent
Male 2,515 1,450 4,230 2,025 810 365 8,880Female 2,410 3,020 3,505 1,275 570 715 9,080Total 4,925 4,470 7,735 3,300 1,380 1,080 17,965
Middle East
Male 750 325 720 505 240 100 1,890Female 655 325 525 400 185 105 1,545Total 1,405 655 1,245 905 425 205 3,430
Remainder of Asia
Male 2,600 615 2,800 2,020 730 150 6,315Female 2,450 900 4,785 2,485 915 220 9,305Total 5,045 1,515 7,585 4,505 1,645 370 15,620
Asia
Male 5,860 2,390 7,750 4,550 1,785 610 17,085Female 5,515 4,250 8,815 4,160 1,665 1,040 19,930Total 11,375 6,640 16,560 8,710 3,450 1,655 37,015
Oceania
Male 260 55 1,560 495 175 15 2,300Female 250 120 1,880 435 175 25 2,640Total 510 175 3,440 930 355 40 4,940
British Overseas citizensand other countries
Male 35 10 15 15 10 5 60Female 40 15 15 15 5 5 55Total 75 25 35 30 15 10 115
(1) Excludes 17,610 persons given settlement on arrival and a further 345 persons whose ages are not available.
(2) Also excludes dependants of EEA and Swiss nationals in confirmed relationships granted permanent residence - see Explanatory Notes paragraph 10.
(3) Includes nationals of the Czech Republic, Cyprus, Estonia, Hungary, Latvia, Lithuania, Malta, Poland, Slovakia and Slovenia before 1 May, but excludes them from this date.
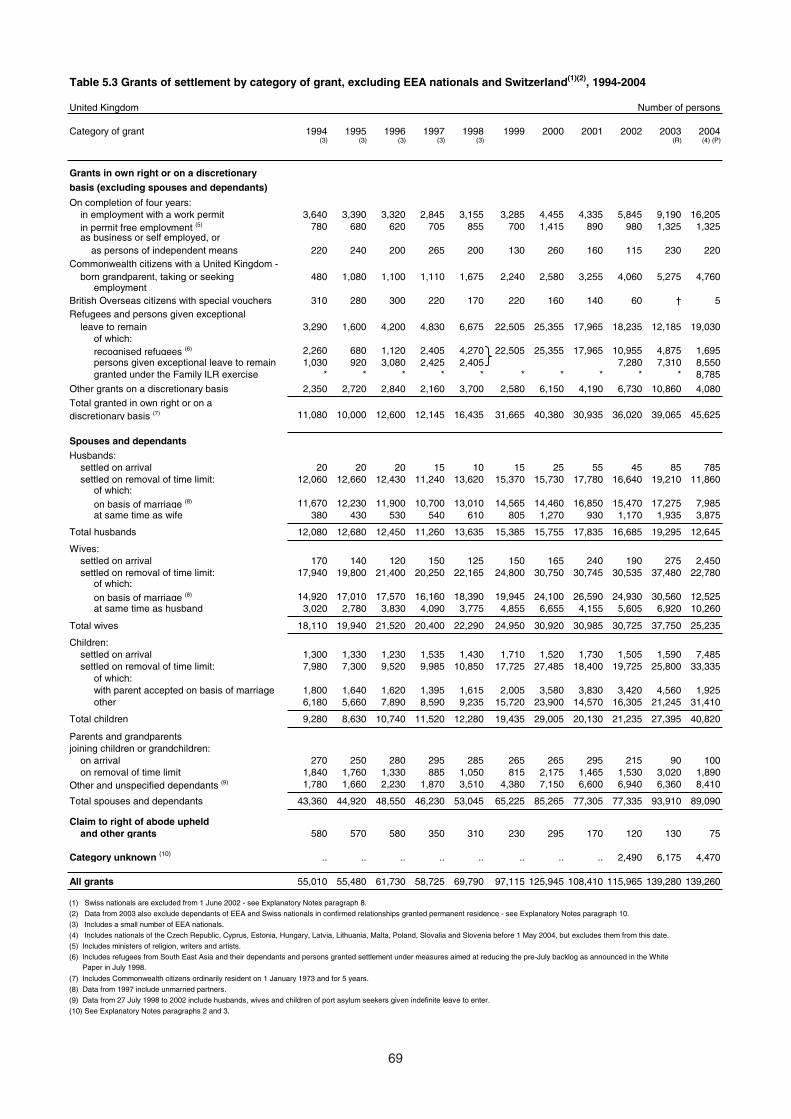
69
Table 5.3 Grants of settlement by category of grant, excluding EEA nationals and Switzerland(1)(2), 1994-2004
United Kingdom Number of persons
Category of grant 1994 1995 1996 1997 1998 1999 2000 2001 2002 2003 2004(3) (3) (3) (3) (3) (R) (4) (P)
Grants in own right or on a discretionary
basis (excluding spouses and dependants)
On completion of four years: in employment with a work permit 3,640 3,390 3,320 2,845 3,155 3,285 4,455 4,335 5,845 9,190 16,205 in permit free employment (5) 780 680 620 705 855 700 1,415 890 980 1,325 1,325 as business or self employed, or as persons of independent means 220 240 200 265 200 130 260 160 115 230 220Commonwealth citizens with a United Kingdom - born grandparent, taking or seeking 480 1,080 1,100 1,110 1,675 2,240 2,580 3,255 4,060 5,275 4,760 employmentBritish Overseas citizens with special vouchers 310 280 300 220 170 220 160 140 60 † 5Refugees and persons given exceptional leave to remain 3,290 1,600 4,200 4,830 6,675 22,505 25,355 17,965 18,235 12,185 19,030 of which: recognised refugees (6) 2,260 680 1,120 2,405 4,270 22,505 25,355 17,965 10,955 4,875 1,695 persons given exceptional leave to remain 1,030 920 3,080 2,425 2,405 7,280 7,310 8,550 granted under the Family ILR exercise * * * * * * * * * * 8,785
Other grants on a discretionary basis 2,350 2,720 2,840 2,160 3,700 2,580 6,150 4,190 6,730 10,860 4,080
Total granted in own right or on a discretionary basis (7) 11,080 10,000 12,600 12,145 16,435 31,665 40,380 30,935 36,020 39,065 45,625
Spouses and dependants
Husbands: settled on arrival 20 20 20 15 10 15 25 55 45 85 785 settled on removal of time limit: 12,060 12,660 12,430 11,240 13,620 15,370 15,730 17,780 16,640 19,210 11,860 of which: on basis of marriage (8) 11,670 12,230 11,900 10,700 13,010 14,565 14,460 16,850 15,470 17,275 7,985 at same time as wife 380 430 530 540 610 805 1,270 930 1,170 1,935 3,875
Total husbands 12,080 12,680 12,450 11,260 13,635 15,385 15,755 17,835 16,685 19,295 12,645
Wives: settled on arrival 170 140 120 150 125 150 165 240 190 275 2,450 settled on removal of time limit: 17,940 19,800 21,400 20,250 22,165 24,800 30,750 30,745 30,535 37,480 22,780 of which: on basis of marriage (8) 14,920 17,010 17,570 16,160 18,390 19,945 24,100 26,590 24,930 30,560 12,525 at same time as husband 3,020 2,780 3,830 4,090 3,775 4,855 6,655 4,155 5,605 6,920 10,260
Total wives 18,110 19,940 21,520 20,400 22,290 24,950 30,920 30,985 30,725 37,750 25,235
Children: settled on arrival 1,300 1,330 1,230 1,535 1,430 1,710 1,520 1,730 1,505 1,590 7,485 settled on removal of time limit: 7,980 7,300 9,520 9,985 10,850 17,725 27,485 18,400 19,725 25,800 33,335 of which: with parent accepted on basis of marriage 1,800 1,640 1,620 1,395 1,615 2,005 3,580 3,830 3,420 4,560 1,925 other 6,180 5,660 7,890 8,590 9,235 15,720 23,900 14,570 16,305 21,245 31,410
Total children 9,280 8,630 10,740 11,520 12,280 19,435 29,005 20,130 21,235 27,395 40,820
Parents and grandparents joining children or grandchildren: on arrival 270 250 280 295 285 265 265 295 215 90 100 on removal of time limit 1,840 1,760 1,330 885 1,050 815 2,175 1,465 1,530 3,020 1,890Other and unspecified dependants (9) 1,780 1,660 2,230 1,870 3,510 4,380 7,150 6,600 6,940 6,360 8,410
Total spouses and dependants 43,360 44,920 48,550 46,230 53,045 65,225 85,265 77,305 77,335 93,910 89,090
Claim to right of abode upheld and other grants 580 570 580 350 310 230 295 170 120 130 75
Category unknown (10) .. .. .. .. .. .. .. .. 2,490 6,175 4,470
All grants 55,010 55,480 61,730 58,725 69,790 97,115 125,945 108,410 115,965 139,280 139,260
(1) Swiss nationals are excluded from 1 June 2002 - see Explanatory Notes paragraph 8.
(2) Data from 2003 also exclude dependants of EEA and Swiss nationals in confirmed relationships granted permanent residence - see Explanatory Notes paragraph 10.
(3) Includes a small number of EEA nationals.
(4) Includes nationals of the Czech Republic, Cyprus, Estonia, Hungary, Latvia, Lithuania, Malta, Poland, Slovalia and Slovenia before 1 May 2004, but excludes them from this date.
(5) Includes ministers of religion, writers and artists.
(6) Includes refugees from South East Asia and their dependants and persons granted settlement under measures aimed at reducing the pre-July backlog as announced in the White (2) Paper in July 1998.
(7) Includes Commonwealth citizens ordinarily resident on 1 January 1973 and for 5 years.
(8) Data from 1997 include unmarried partners.
(9) Data from 27 July 1998 to 2002 include husbands, wives and children of port asylum seekers given indefinite leave to enter.
(10) See Explanatory Notes paragraphs 2 and 3.

70
Table 5.4 Grants of settlement, by main category and broad nationality, excluding EEA nationalsTable 5.4 and Switzerland(1)(2), 1994-2004
United Kingdom Number of persons
Broad nationality 1994 1995 1996 1997 1998 1999 2000 2001 2002 2003 2004
and category (3)
All nationalitiesFour years' employment 4,180 3,930 3,830 3,450 3,765 3,945 5,840 5,185 6,800 10,515 17,530Husbands (4) 11,990 12,640 12,400 11,215 13,585 15,335 15,715 17,805 16,670 19,295 12,645Wives (4) 17,800 19,800 21,410 20,305 22,150 24,870 30,830 30,895 30,670 37,750 25,235Children (5) 9,220 8,590 10,690 11,480 12,215 19,405 28,975 20,095 21,215 27,395 40,820Other 11,070 10,140 13,060 11,970 17,550 33,345 44,365 34,210 40,465 44,325 43,035
Total 54,260 55,120 61,390 58,420 69,275 96,895 125,715 108,190 115,825 139,280 139,260
EuropeFour years' employment 220 300 300 300 335 300 460 400 550 800 910Husbands (4) 710 880 1,020 950 1,085 1,075 1,310 1,460 1,295 1,835 1,520Wives (4) 1,490 1,840 2,710 2,760 2,755 3,090 4,325 4,470 4,300 6,080 5,740Children 750 470 1,510 1,830 1,180 2,695 3,515 2,335 1,605 2,570 10,065Other 690 400 1,620 1,600 1,695 8,595 5,335 5,105 3,850 4,010 8,360
Total 3,870 3,890 7,160 7,440 7,060 15,760 14,935 13,775 11,600 15,295 26,600
AmericasFour years' employment 1,030 900 920 960 1,000 950 1,140 1,110 1,260 1,625 2,110Husbands (4) 1,510 1,740 1,820 1,565 1,795 1,680 2,090 2,730 2,330 3,045 1,980Wives (4) 2,910 3,080 3,260 2,985 3,150 2,980 3,875 4,245 3,720 4,925 2,990Children 1,530 1,530 1,460 1,405 1,885 1,495 2,350 2,175 2,050 3,350 3,800Other 900 930 1,000 875 2,950 1,410 2,090 1,715 2,315 3,515 3,250
Total 7,890 8,180 8,470 7,790 10,785 8,515 11,550 11,975 11,680 16,465 14,130
AfricaFour years' employment 580 650 660 450 630 680 1,090 910 1,265 2,315 3,715Husbands (4) 3,270 3,380 3,080 2,540 2,750 2,705 3,815 4,040 3,785 4,535 2,995Wives (4) 2,870 3,240 3,380 3,380 3,555 3,870 5,715 5,245 5,260 6,325 4,040Children 2,380 2,400 2,770 3,505 4,025 8,115 13,605 8,570 9,720 11,715 13,195Other 2,780 2,330 3,080 3,330 5,130 11,655 20,620 13,160 19,130 19,970 15,490
Total 11,880 12,000 12,970 13,205 16,090 27,025 44,845 31,925 39,165 44,860 39,440
AsiaIndian sub-continentFour years' employment 380 350 340 380 370 520 945 975 1,410 1,915 3,550Husbands (4) 4,810 4,800 4,600 4,555 6,160 8,010 6,280 7,330 6,945 7,070 3,505Wives (4) 5,280 6,040 5,990 5,670 6,680 8,220 8,830 9,075 9,495 10,625 6,275Children 1,610 1,450 1,240 1,330 1,580 2,545 3,455 3,160 3,050 3,965 5,310Other 1,990 1,820 1,420 1,150 1,630 2,145 3,335 2,485 3,760 5,910 5,600
Total 14,070 14,450 13,590 13,085 16,420 21,440 22,840 23,020 24,665 29,490 24,240
Middle EastFour years' employment 140 170 130 105 110 105 140 130 160 170 280Husbands (4) 320 390 390 360 370 355 450 445 415 530 305Wives (4) 640 710 1,070 975 985 985 1,155 910 900 1,110 1,025Children 570 620 1,260 1,200 1,105 1,390 1,840 805 1,020 1,160 2,000Other 940 1,000 1,940 1,520 1,610 2,755 3,645 2,535 2,850 2,045 2,435
Total 2,620 2,880 4,790 4,160 4,175 5,590 7,230 4,830 5,345 5,020 6,045
(1) Excludes EEA and Swiss nationals throughout the period covered and hence the totals will differ slightly from Tables 5.3 and 5.6.
(2) Data from 2003 also exclude dependants of EEA and Swiss nationals in confirmed relationships granted permanent residence - see Explanatory Notes paragraph 10.
(3) Includes nationals of the Czech Republic, Cyprus, Estonia, Hungary, Latvia, Lithuania, Malta, Poland, Slovakia and Slovenia before 1 May 2004, but excludes them from this date.
(4) Data from 1997 include unmarried partners.
(5) Excludes children of South East Asian refugees; these are included in 'Other'.
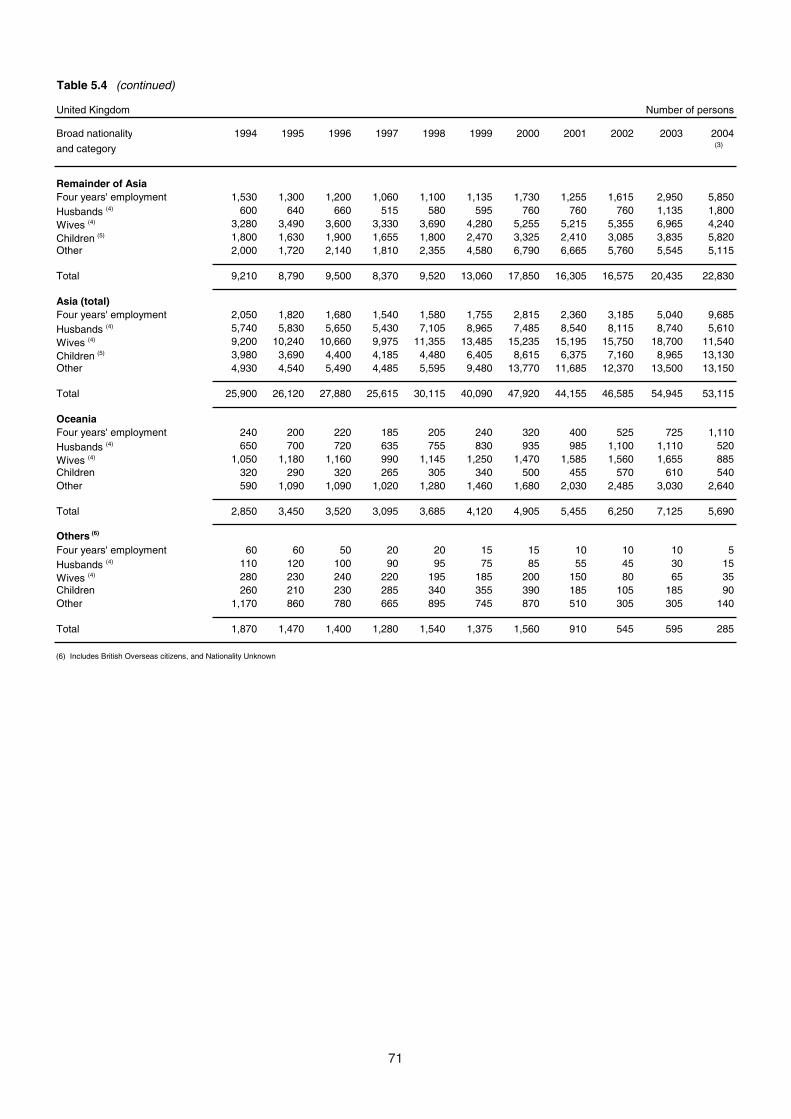
71
Table 5.4 (continued)
United Kingdom Number of persons
Broad nationality 1994 1995 1996 1997 1998 1999 2000 2001 2002 2003 2004
and category (3)
Remainder of AsiaFour years' employment 1,530 1,300 1,200 1,060 1,100 1,135 1,730 1,255 1,615 2,950 5,850Husbands (4) 600 640 660 515 580 595 760 760 760 1,135 1,800Wives (4) 3,280 3,490 3,600 3,330 3,690 4,280 5,255 5,215 5,355 6,965 4,240Children (5) 1,800 1,630 1,900 1,655 1,800 2,470 3,325 2,410 3,085 3,835 5,820Other 2,000 1,720 2,140 1,810 2,355 4,580 6,790 6,665 5,760 5,545 5,115
Total 9,210 8,790 9,500 8,370 9,520 13,060 17,850 16,305 16,575 20,435 22,830
Asia (total)Four years' employment 2,050 1,820 1,680 1,540 1,580 1,755 2,815 2,360 3,185 5,040 9,685Husbands (4) 5,740 5,830 5,650 5,430 7,105 8,965 7,485 8,540 8,115 8,740 5,610Wives (4) 9,200 10,240 10,660 9,975 11,355 13,485 15,235 15,195 15,750 18,700 11,540Children (5) 3,980 3,690 4,400 4,185 4,480 6,405 8,615 6,375 7,160 8,965 13,130Other 4,930 4,540 5,490 4,485 5,595 9,480 13,770 11,685 12,370 13,500 13,150
Total 25,900 26,120 27,880 25,615 30,115 40,090 47,920 44,155 46,585 54,945 53,115
OceaniaFour years' employment 240 200 220 185 205 240 320 400 525 725 1,110Husbands (4) 650 700 720 635 755 830 935 985 1,100 1,110 520Wives (4) 1,050 1,180 1,160 990 1,145 1,250 1,470 1,585 1,560 1,655 885Children 320 290 320 265 305 340 500 455 570 610 540Other 590 1,090 1,090 1,020 1,280 1,460 1,680 2,030 2,485 3,030 2,640
Total 2,850 3,450 3,520 3,095 3,685 4,120 4,905 5,455 6,250 7,125 5,690
Others (6)
Four years' employment 60 60 50 20 20 15 15 10 10 10 5Husbands (4) 110 120 100 90 95 75 85 55 45 30 15Wives (4) 280 230 240 220 195 185 200 150 80 65 35Children 260 210 230 285 340 355 390 185 105 185 90Other 1,170 860 780 665 895 745 870 510 305 305 140
Total 1,870 1,470 1,400 1,280 1,540 1,375 1,560 910 545 595 285
(6) Includes British Overseas citizens, and Nationality Unknown

72
Table 5.5 Grants of settlement by nationality, excluding EEA nationals and Switzerland (1)(2), 1994-2004
United Kingdom Number of persons
Geographical region 1994 1995 1996 1997 1998 1999 2000 2001 2002 2003 2004and nationality (R) (3)(P)
All nationalities 54,260 55,120 61,390 58,420 69,275 96,895 125,715 108,190 115,825 139,280 139,260 (excluding EEA)
Europe
Accession StatesCyprus 190 220 240 240 275 425 515 260 270 565 160Estonia .. .. .. .. 15 25 25 40 50 75 165Hungary 100 130 200 175 185 190 250 215 270 325 100Latvia .. .. .. .. 45 35 60 70 75 125 210Lithuania .. .. .. .. 50 110 150 135 170 325 610
Malta 60 80 80 55 70 60 75 95 80 95 25Poland 490 580 640 565 580 615 830 945 875 1,290 1,235Slovenia .. .. .. .. 10 20 20 10 25 20 5
Former Czechoslovakia 100 190 290 285 * * * * * * * of which, Czech Republic .. .. .. .. 245 270 415 490 495 515 520 of which, Slovakia .. .. .. .. 160 230 345 430 380 425 255
Accession States 940 1,200 1,450 1,320 1,640 1,980 2,680 2,695 2,690 3,755 3,285
Remainder of EuropeBulgaria 100 150 200 165 185 275 295 310 365 750 625Romania 120 190 270 220 240 290 310 360 390 565 560Turkey 1,840 1,170 3,720 4,235 2,360 5,225 5,220 3,310 2,920 4,365 6,060
Former USSR (4) 400 610 820 870 * * * * * * * of which, Russia .. .. .. .. 855 870 1,185 1,025 1,365 2,160 1,620 of which, Ukraine .. .. .. .. 140 200 385 405 460 805 1,050 of which, Other former USSR .. .. .. .. 80 160 300 340 415 625 830
Former Yugoslavia (5) 460 550 680 595 * * * * * * * of which, Croatia .. .. .. .. 185 315 660 710 310 280 985 of which, Serbia and Montenegro .. .. .. .. 870 5,760 2,640 2,785 1,540 1,165 9,590 of which, Other former Yugoslavia .. .. .. .. 440 550 1,130 1,575 955 510 285
Other Europe 10 20 20 30 55 130 135 255 190 315 1,700
Remainder of Europe 2,930 2,690 5,710 6,115 5,410 13,775 12,255 11,080 8,910 11,540 23,315
Europe 3,870 3,890 7,160 7,440 7,060 15,760 14,935 13,775 11,600 15,295 26,600
AmericasArgentina 50 60 50 50 60 60 80 120 120 155 95Barbados 70 70 80 55 100 65 95 115 100 160 145Brazil 300 330 390 330 350 405 460 575 510 695 565Canada 810 940 970 980 1,050 1,010 1,325 1,320 1,300 1,710 1,225Chile 50 40 60 70 50 55 80 75 100 120 65
Colombia 270 280 270 240 365 650 820 785 805 1,000 1,745Guyana 210 190 200 175 185 135 200 210 190 275 170Jamaica 1,280 1,400 1,420 1,030 1,120 1,060 2,095 2,855 2,675 4,500 2,930Mexico 60 90 110 125 120 90 125 130 160 245 130Peru 100 100 80 110 105 140 160 150 155 180 110
Trinidad and Tobago 380 360 340 280 320 280 490 365 410 655 570USA 3,990 3,960 4,030 3,905 3,945 3,760 4,585 4,385 4,355 5,620 4,120Venezuela 40 40 50 45 65 65 80 85 80 120 85Other Americas 270 310 430 395 2,945 750 945 810 720 1,025 2,175
Americas 7,890 8,180 8,470 7,790 10,785 8,515 11,550 11,975 11,680 16,465 14,130
(1) Excludes EEA and Swiss nationals throughout the period covered and hence the totals will differ slightly from Tables 5.3.and 5.6.
(2) Data from 2003 also exclude dependants of EEA and Swiss nationals in confirmed relationships granted permanent residence - see Explanatory Notes paragraph 10.
(3) Includes nationals of the Czech Republic, Cyprus, Estonia, Hungary, Latvia, Lithuania, Malta, Poland Slovakia and Slovenia before 1 May but excludes them from this date.
(4) Data from 1994 to 1997 include former Soviet republic Accession States.
(5) Data from 1994 to 1997 include former Yugoslavian Accession States.

73
Table 5.5 Grants of settlement by nationality, excluding EEA nationals and Switzerland (1)(2), 1994-2004 (continued)
United Kingdom Number of persons
Geographical region 1994 1995 1996 1997 1998 1999 2000 2001 2002 2003 2004and nationality (R) (3)(P)
AfricaAlgeria 400 440 400 370 710 1,130 1,015 775 855 945 1,005Angola 30 40 30 60 95 520 320 280 660 620 1,090Congo (Dem. Rep.) (6) 70 120 90 90 120 2,575 935 800 1,260 1,475 2,410Egypt 300 270 330 330 360 385 485 420 500 615 485Ethiopia 310 170 140 205 190 2,165 2,745 475 345 285 520
Ghana 1,620 1,820 1,970 1,285 1,550 3,475 3,140 2,440 2,585 4,015 2,305Kenya 550 530 590 495 535 760 1,135 1,025 1,055 1,585 2,255Libya 120 70 110 120 165 160 375 370 445 380 465Mauritius 340 390 460 380 450 460 675 375 455 695 530Morocco 510 430 460 405 425 430 590 575 520 660 305
Nigeria 3,090 3,260 3,220 2,535 2,955 3,185 6,525 5,045 5,325 7,570 4,620Sierra Leone 420 440 570 465 545 1,060 1,075 875 855 1,375 1,805Somalia 1,380 760 680 985 2,945 3,180 12,495 8,405 10,000 6,305 3,825South Africa 1,260 1,300 1,040 1,290 2,260 2,955 4,300 4,755 6,135 8,805 7,565Sudan 140 150 360 2,180 465 545 1,555 655 560 665 745
Tanzania 200 250 220 155 220 235 430 310 290 510 570Tunisia 100 80 90 75 115 160 125 190 160 220 115Uganda 230 440 1,040 695 500 1,400 3,445 755 745 830 960Zambia 150 190 220 180 205 235 440 345 330 560 505Zimbabwe 270 330 360 345 405 435 955 1,040 3,530 3,675 3,765Other Africa 380 490 600 550 870 1,570 2,090 2,015 2,550 3,080 3,585
Africa 11,880 12,000 12,970 13,205 16,090 27,025 44,845 31,925 39,165 44,860 39,440
Asia
Indian sub-continentBangladesh 3,050 3,280 2,720 2,870 3,635 3,285 3,685 4,050 4,725 5,590 3,115India 4,780 4,860 4,620 4,645 5,430 6,295 8,050 7,320 8,005 10,955 11,100Pakistan 6,240 6,310 6,250 5,565 7,355 11,865 11,105 11,645 11,935 12,945 10,025
Indian sub-continent 14,070 14,450 13,590 13,085 16,420 21,440 22,840 23,020 24,665 29,490 24,240
Middle EastIran 990 1,120 1,720 1,060 930 1,560 1,985 1,560 1,715 1,585 1,725Iraq 570 540 1,580 1,615 1,650 2,210 2,780 1,715 1,955 1,440 1,720Israel 250 290 290 275 305 260 365 320 375 500 505Jordan 160 150 120 150 130 145 255 175 170 180 250Kuwait 10 30 20 40 55 60 60 30 65 75 90
Lebanon 280 400 660 635 595 760 990 265 365 310 490Saudi Arabia 60 40 40 30 45 55 50 45 40 75 60Syria 70 100 110 120 115 140 245 195 170 280 255Yemen 190 160 180 150 225 260 295 380 300 405 420Other Middle East 40 60 70 85 125 145 205 140 190 170 525
Middle East 2,620 2,880 4,790 4,160 4,175 5,590 7,230 4,830 5,345 5,020 6,045
(6) The Democratic Republic of the Congo, formerly known as Zaire.

74
Table 5.5 Grants of settlement by nationality, excluding EEA nationals and Switzerland (1)(2), 1994-2004 (continued)
United Kingdom Number of persons
Geographical region 1994 1995 1996 1997 1998 1999 2000 2001 2002 2003 2004and nationality (R) (3)(P)
Remainder of AsiaChina 960 1,130 1,180 1,225 1,545 1,525 1,710 1,515 1,705 2,540 2,315Hong Kong (7) 1,490 1,310 1,240 895 810 485 795 605 460 725 540Indonesia 100 100 90 90 115 200 210 205 225 315 195Japan 2,060 1,870 1,780 1,760 1,885 1,590 1,720 1,695 1,785 1,850 1,360Malaysia 640 660 610 505 545 510 780 710 745 1,150 955
Philippines 920 1,090 1,030 890 950 1,190 1,915 1,355 1,505 3,810 8,200Singapore 140 170 150 160 125 170 230 225 220 265 305South Korea 280 260 270 220 275 305 485 480 485 735 570Sri Lanka 1,860 1,370 2,180 1,625 2,105 5,365 7,615 4,240 2,935 2,555 4,875Taiwan 20 40 60 85 100 120 175 165 200 255 205
Thailand 540 520 550 495 535 830 955 1,260 1,335 2,020 985Other Asia 220 270 350 420 530 775 1,265 3,840 4,980 4,215 2,330
Remainder of Asia 9,210 8,790 9,500 8,370 9,520 13,060 17,850 16,305 16,575 20,435 22,830
Asia 25,900 26,120 27,880 25,615 30,115 40,090 47,920 44,155 46,585 54,945 53,115
OceaniaAustralia 1,740 2,020 2,120 1,915 2,195 2,410 2,925 3,205 3,500 4,120 3,240New Zealand 1,080 1,390 1,360 1,155 1,440 1,670 1,925 2,185 2,645 2,920 2,370Other Oceania 40 40 40 25 50 40 55 60 100 85 85
Oceania 2,850 3,450 3,520 3,095 3,685 4,120 4,905 5,455 6,250 7,125 5,690
British Overseas citizens 710 690 620 540 965 560 635 520 330 265 75
Nationality unknown (8) 1,170 780 780 740 575 815 930 390 215 330 205
All nationalities 54,260 55,120 61,390 58,420 69,275 96,895 125,715 108,190 115,825 139,280 139,260
(7) Hong Kong (Special Administrative Region of China) - see Explanatory Notes paragraph 7.
(8) Includes refugees from South East Asia.

75
Table 5.6 Grants of settlement – Commonwealth(1) citizens and foreign nationals, 1960–2004 (2)(3)(4)
United Kingdom Number of persons
Year of Total On removal of time limit Settlement on arrival grant grants Commonwealth Foreign Commonwealth Foreign
citizens(3) nationals citizens(5) nationals
1960 16,430 .. .. .. ..1961 15,690 .. .. .. ..1962 34,420 (6) – .. 18,810 (6) ..1963 75,160 – .. 59,810 ..1964 75,110 – .. 55,900 ..
1965 77,970 290 .. 57,060 ..1966 71,270 1,850 .. 50,460 ..1967 83,310 3,590 14,660 61,380 3,6901968 84,470 5,270 16,500 59,110 3,6001969 69,950 5,280 18,990 42,810 2,870
1970 63,310 5,660 18,590 36,720 2,3301971 72,300 10,620 19,850 38,220 3,6201972 92,190 9,910 16,650 62,600 3,0301973 55,160 8,450 17,150 26,900 2,6701974 68,880 19,800 19,370 26,680 3,030
1975 82,400 21,510 20,460 37,130 3,2901976 80,740 20,510 16,160 40,480 3,6001977 69,310 18,600 14,990 32,130 3,6001978 72,330 20,120 18,210 30,260 3,7301979 69,670 17,510 18,790 26,510 6,860
1980 69,750 16,980 18,920 23,530 10,3201981 59,060 14,860 16,550 21,890 5,7601982 53,870 15,450 14,920 20,100 3,4001983 53,460 14,520 15,880 18,820 4,2401984 50,950 13,310 14,670 18,920 4,050
1985 55,360 15,410 16,310 19,800 3,8401986 47,820 12,840 14,880 16,430 3,6401987 45,980 13,680 14,740 14,070 3,4901988 49,280 16,310 15,740 13,870 3,3601989 49,650 19,070 16,490 11,980 2,110
1990 53,200 23,930 18,790 8,270 2,2001991 53,900 27,030 20,860 4,030 1,9901992 52,570 27,410 19,850 3,410 1,9101993 55,640 28,880 23,140 2,180 1,4401994 55,010 31,990 20,410 1,790 810
1995 55,480 33,070 20,090 1,680 6401996 61,730 33,960 25,650 1,550 5701997 58,725 29,380 26,995 1,685 6701998 69,790 38,795 28,100 1,705 1,1901999 97,115 48,300 41,975 2,465 4,375
2000 125,945 63,000 54,750 2,875 5,3152001 108,410 53,510 42,950 5,880 6,0702002 (R) 115,965 58,600 48,800 4,440 4,1202003 (R) 139,280 78,300 57,055 1,965 1,9602004 139,260 64,085 57,565 5,135 12,475
(1) As Commonwealth citizens were not subject to immigration control until 1 July 1962, when the Commonwealth Immigrants Act 1962 came into effect, earlier Commonwealth(1) figures were recorded on a different basis. The available information is that from 1 January 1955 to 30 June 1962 the net intake(the total number entering, less the number
(1) leaving during the same period), is estimated at about 472,500.
(2) The breakdown of figures by settlement on arrival and on removal of time limit of foreign nationals is not available before 1967.
(3) Excludes EEA nationals from 1999, Switzerland from 1 June 2002 and Accession States from 1 May 2004, hence the totals will differ slightly from tables 5.4 and 5.5.
(4) Data from 2003 exclude dependants of EEA and Swiss nationals in confirmed relationships granted permanent residence - see Explanatory Notes paragraph 10.
(5) Figures for settlement of Pakistani nationals have been included in Commonwealth throughout the period covered. South African nationals have been included in(3) Commonwealth from 1994 only.
(6) Includes Commonwealth nationals from 1 July to 31 December 1962 only.

SECTION 6: Enforcement of immigration law
Page
Table 6.1 Persons removed from the United Kingdom and those subject to enforcement action,1994 to 2004
Table 6.2 Persons removed from the United Kingdom as a result of enforcement action, 2000 to2004
Table 6.3 Persons recorded as being in detention in the United Kingdom solely under ImmigrationAct powers as at 25 December 2004, by gender, length of detention and place ofdetention
Table 6.4 Persons recorded as being in detention in the United Kingdom solely under ImmigrationAct powers as at 25 December 2004, by nationality
Table 6.5 Persons proceeded against for offences under Immigration Acts 1971 to 2002 in Englandand Wales, 2000-2004
Explanatory Notes and Definitions paragraph 44.
76
77
78
79
80
81
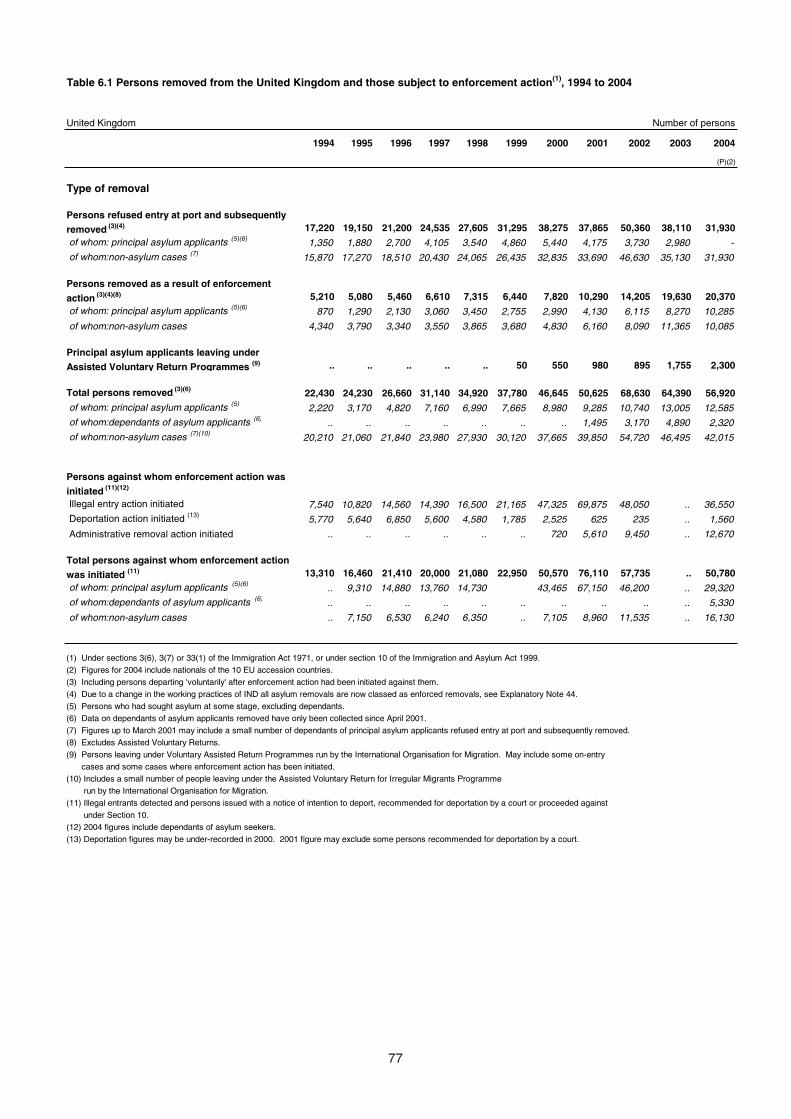
77
Table 6.1 Persons removed from the United Kingdom and those subject to enforcement action(1), 1994 to 2004
United Kingdom Number of persons
1994 1995 1996 1997 1998 1999 2000 2001 2002 2003 2004
(P)(2)
Type of removal
Persons refused entry at port and subsequently
removed (3)(4) 17,220 19,150 21,200 24,535 27,605 31,295 38,275 37,865 50,360 38,110 31,930 of whom: principal asylum applicants (5)(6) 1,350 1,880 2,700 4,105 3,540 4,860 5,440 4,175 3,730 2,980 -
of whom:non-asylum cases (7) 15,870 17,270 18,510 20,430 24,065 26,435 32,835 33,690 46,630 35,130 31,930
Persons removed as a result of enforcement
action (3)(4)(8) 5,210 5,080 5,460 6,610 7,315 6,440 7,820 10,290 14,205 19,630 20,370 of whom: principal asylum applicants (5)(6) 870 1,290 2,130 3,060 3,450 2,755 2,990 4,130 6,115 8,270 10,285
of whom:non-asylum cases 4,340 3,790 3,340 3,550 3,865 3,680 4,830 6,160 8,090 11,365 10,085
Principal asylum applicants leaving under
Assisted Voluntary Return Programmes (9) .. .. .. .. .. 50 550 980 895 1,755 2,300
Total persons removed (3)(6) 22,430 24,230 26,660 31,140 34,920 37,780 46,645 50,625 68,630 64,390 56,920 of whom: principal asylum applicants (5) 2,220 3,170 4,820 7,160 6,990 7,665 8,980 9,285 10,740 13,005 12,585
of whom:dependants of asylum applicants (6) .. .. .. .. .. .. .. 1,495 3,170 4,890 2,320
of whom:non-asylum cases (7)(10) 20,210 21,060 21,840 23,980 27,930 30,120 37,665 39,850 54,720 46,495 42,015
Persons against whom enforcement action was
initiated (11)(12)
Illegal entry action initiated 7,540 10,820 14,560 14,390 16,500 21,165 47,325 69,875 48,050 .. 36,550
Deportation action initiated (13) 5,770 5,640 6,850 5,600 4,580 1,785 2,525 625 235 .. 1,560
Administrative removal action initiated .. .. .. .. .. .. 720 5,610 9,450 .. 12,670
Total persons against whom enforcement action
was initiated (11) 13,310 16,460 21,410 20,000 21,080 22,950 50,570 76,110 57,735 .. 50,780 of whom: principal asylum applicants (5)(6) .. 9,310 14,880 13,760 14,730 43,465 67,150 46,200 .. 29,320
of whom:dependants of asylum applicants (6) .. .. .. .. .. .. .. .. .. .. 5,330
of whom:non-asylum cases .. 7,150 6,530 6,240 6,350 .. 7,105 8,960 11,535 .. 16,130
(1) Under sections 3(6), 3(7) or 33(1) of the Immigration Act 1971, or under section 10 of the Immigration and Asylum Act 1999.(2) Figures for 2004 include nationals of the 10 EU accession countries.(3) Including persons departing 'voluntarily' after enforcement action had been initiated against them.(4) Due to a change in the working practices of IND all asylum removals are now classed as enforced removals, see Explanatory Note 44.(5) Persons who had sought asylum at some stage, excluding dependants. (6) Data on dependants of asylum applicants removed have only been collected since April 2001.(7) Figures up to March 2001 may include a small number of dependants of principal asylum applicants refused entry at port and subsequently removed.(8) Excludes Assisted Voluntary Returns. (9) Persons leaving under Voluntary Assisted Return Programmes run by the International Organisation for Migration. May include some on-entry (9) cases and some cases where enforcement action has been initiated.(10) Includes a small number of people leaving under the Assisted Voluntary Return for Irregular Migrants Programme(10) run by the International Organisation for Migration.(11) Illegal entrants detected and persons issued with a notice of intention to deport, recommended for deportation by a court or proceeded against (11) under Section 10.(12) 2004 figures include dependants of asylum seekers.(13) Deportation figures may be under-recorded in 2000. 2001 figure may exclude some persons recommended for deportation by a court.
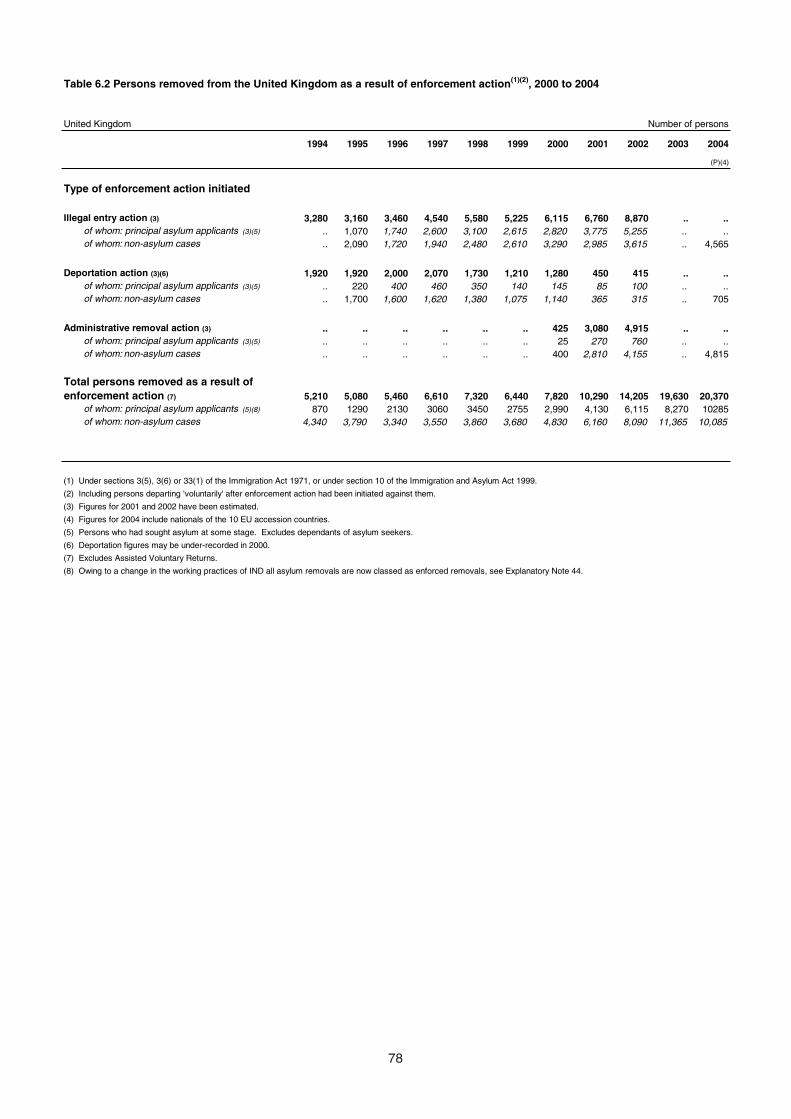
78
Table 6.2 Persons removed from the United Kingdom as a result of enforcement action(1)(2), 2000 to 2004
United Kingdom Number of persons
1994 1995 1996 1997 1998 1999 2000 2001 2002 2003 2004
(P)(4)
Type of enforcement action initiated
Illegal entry action (3) 3,280 3,160 3,460 4,540 5,580 5,225 6,115 6,760 8,870 .. ..of whom: principal asylum applicants (3)(5) .. 1,070 1,740 2,600 3,100 2,615 2,820 3,775 5,255 .. ..of whom: non-asylum cases .. 2,090 1,720 1,940 2,480 2,610 3,290 2,985 3,615 .. 4,565
Deportation action (3)(6) 1,920 1,920 2,000 2,070 1,730 1,210 1,280 450 415 .. ..of whom: principal asylum applicants (3)(5) .. 220 400 460 350 140 145 85 100 .. ..of whom: non-asylum cases .. 1,700 1,600 1,620 1,380 1,075 1,140 365 315 .. 705
Administrative removal action (3) .. .. .. .. .. .. 425 3,080 4,915 .. ..of whom: principal asylum applicants (3)(5) .. .. .. .. .. .. 25 270 760 .. ..of whom: non-asylum cases .. .. .. .. .. .. 400 2,810 4,155 .. 4,815
Total persons removed as a result of enforcement action (7) 5,210 5,080 5,460 6,610 7,320 6,440 7,820 10,290 14,205 19,630 20,370
of whom: principal asylum applicants (5)(8) 870 1290 2130 3060 3450 2755 2,990 4,130 6,115 8,270 10285of whom: non-asylum cases 4,340 3,790 3,340 3,550 3,860 3,680 4,830 6,160 8,090 11,365 10,085
(1) Under sections 3(5), 3(6) or 33(1) of the Immigration Act 1971, or under section 10 of the Immigration and Asylum Act 1999.
(2) Including persons departing 'voluntarily' after enforcement action had been initiated against them.
(3) Figures for 2001 and 2002 have been estimated.
(4) Figures for 2004 include nationals of the 10 EU accession countries.
(5) Persons who had sought asylum at some stage. Excludes dependants of asylum seekers.
(6) Deportation figures may be under-recorded in 2000.
(7) Excludes Assisted Voluntary Returns.
(8) Owing to a change in the working practices of IND all asylum removals are now classed as enforced removals, see Explanatory Note 44.

79
Table 6.3 Persons recorded as being in detention in the United Kingdom solely under Immigration Act powers as at 25 December 2004, by gender, length of detention and place of detention (1)
Gender Total detainees Of whom:asylum seekers minors
(2) (3)
Female 215 165 10 Male 1,735 1,345 15
Total 1,950 1,515 25
Length of detention(4)(5) Total detainees Of whom:asylum seekers minors
(2) (3)
14 days or less 675 500 15 15 to 29 days 430 365 5 1 month to less than 2 months 355 290 †2 months to less than 3 months 145 110 -3 months to less than 4 months 65 45 -4 months to less than 6 months 80 55 -6 months to less than 1 year 115 90 -1 year or more 85 55 -
Total 1,950 1,515 25
Place of detention Total detainees Of whom:asylum seekers minors
(2) (3)
Immigration Service Removal CentresHarmondsworth 420 330 †Dover Immigration Removals Centre 215 175 -Colnbrook Long Term 200 145 -Oakington Reception Centre 170 170 15 Campsfield House 130 105 -Haslar 120 100 -Yarl's Wood 115 85 -Tinsley House 115 90 5 Lindholme 95 85 -Dungavel 80 60 †
Immigration Short Term Holding FacilitiesDover Harbour 15 15 -Manchester Airport 15 15 -Colnbrook Short Term 5 † -Harwich Abbey - - -
Prison establishments(6)
Wandsworth 15 10 -Wormwood Scrubs 15 5 -Belmarsh 10 5 -Elmley 10 5 -The Mount 10 5 -Birmingham 10 † -Norwich 5 5 -Brixton 5 5 -Woodhill 5 5 -Other prison establishments(7) 160 90 -
Total 1,950 1,515 25
(1) Excluding persons detained in police cells and those detained under both criminal and immigration powers.
(2) Persons detained under Immigration Act powers who are recorded as having sought asylum at some stage.
(3) People recorded as being under 18 on 25 December 2004.
(4) Relates to current period of detention only.
(5) 2 months is defined as 61 days; 4 months is defined as 122 days; 6 months is defined as 182 days.
(6) Persons recorded by IND as detained in Prison Service establishments.
(7) Other prison establishments with 5 or fewer detainees.
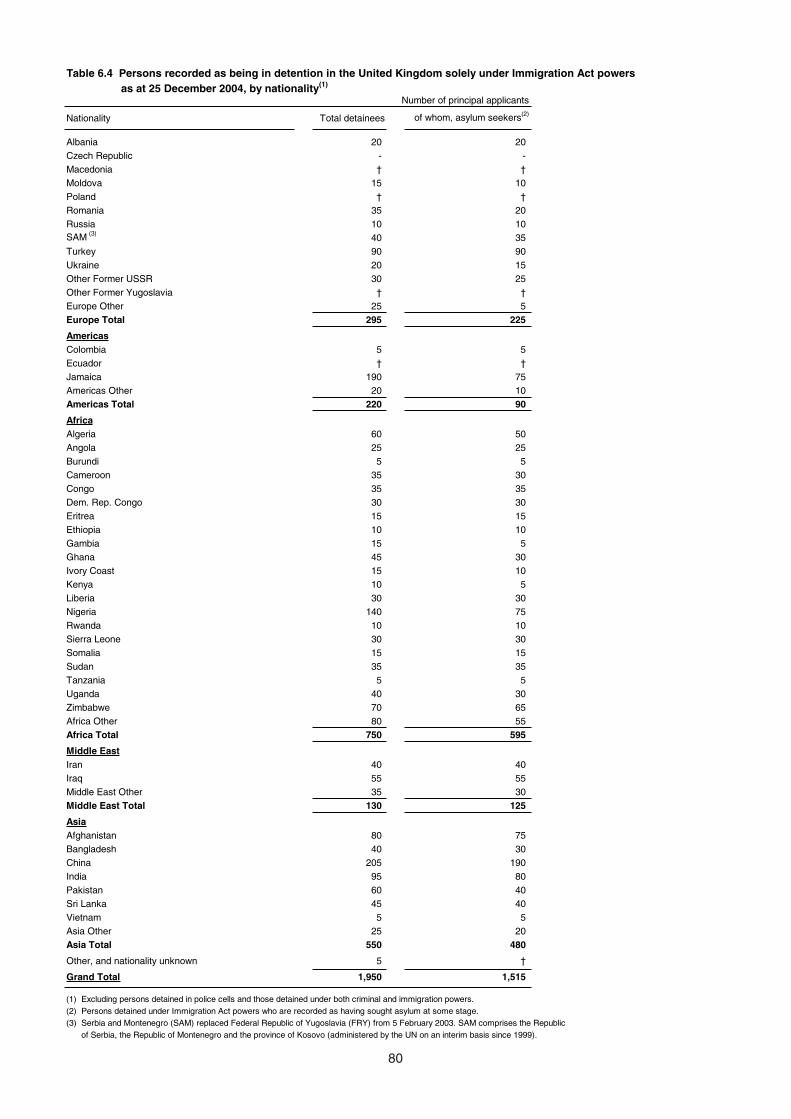
80
Table 6.4 Persons recorded as being in detention in the United Kingdom solely under Immigration Act powers as at 25 December 2004, by nationality(1)
Number of principal applicants
Nationality Total detainees of whom, asylum seekers(2)
Albania 20 20 Czech Republic - -Macedonia † †Moldova 15 10 Poland † †Romania 35 20 Russia 10 10 SAM
(3) 40 35 Turkey 90 90 Ukraine 20 15 Other Former USSR 30 25 Other Former Yugoslavia † †Europe Other 25 5 Europe Total 295 225
AmericasColombia 5 5 Ecuador † †Jamaica 190 75 Americas Other 20 10 Americas Total 220 90
AfricaAlgeria 60 50 Angola 25 25 Burundi 5 5 Cameroon 35 30 Congo 35 35 Dem. Rep. Congo 30 30 Eritrea 15 15 Ethiopia 10 10 Gambia 15 5 Ghana 45 30 Ivory Coast 15 10 Kenya 10 5 Liberia 30 30 Nigeria 140 75 Rwanda 10 10 Sierra Leone 30 30 Somalia 15 15 Sudan 35 35 Tanzania 5 5 Uganda 40 30 Zimbabwe 70 65 Africa Other 80 55 Africa Total 750 595
Middle EastIran 40 40 Iraq 55 55 Middle East Other 35 30 Middle East Total 130 125
AsiaAfghanistan 80 75 Bangladesh 40 30 China 205 190 India 95 80 Pakistan 60 40 Sri Lanka 45 40 Vietnam 5 5 Asia Other 25 20 Asia Total 550 480
Other, and nationality unknown 5 †
Grand Total 1,950 1,515
(1) Excluding persons detained in police cells and those detained under both criminal and immigration powers.(2) Persons detained under Immigration Act powers who are recorded as having sought asylum at some stage.(3) Serbia and Montenegro (SAM) replaced Federal Republic of Yugoslavia (FRY) from 5 February 2003. SAM comprises the Republic(3) of Serbia, the Republic of Montenegro and the province of Kosovo (administered by the UN on an interim basis since 1999).

Table 6.5 Persons proceeded against for offences under Immigration Acts 1971 to 2002 in England and Wales, 2000-2004
England and Wales Number of persons
Act and Section Offence(1) description 2000 2001 2002 2003 2004 2000 2001 2002 2003 2004
Magistrates' CourtsImmigration Act 1971
24(1)(a) Entering UK in breach of a deportation order 3 5 10 17 12 2 3 8 12 10
24(1)(a) Entering UK without leave 39 53 94 99 80 27 36 71 70 58
24(1)(b)(i), 24(1)(c) Overstaying time limit of leave 12 11 17 20 37 3 5 7 15 24
24(1)(b)(ii), 24(1)(d) Failure to observe conditions of leave 9 13 2 6 5 2 13 1 4 4
24(1)(e) Failure to observe restrictions under 3 2 4 8 6 2 1 2 4 4Schedule 2 or 3 as to reporting to policeor an Immigration Officer as to residence
24(A)(2) Seeking leave to enter or remain or 17 121 241 218 245 10 107 173 140 147postponement of revocation by deception
25(1)(a)(3) Knowingly facilitating the entry of an 188 215 225 226 19 33 47 62 58 2illegal entrant
25(1)(b)(3) Knowingly facilitating the entry of an 9 11 4 15 3 - 2 - 4 1asylum claimant
25(1)(c)(3) Knowingly facilitating leave to remain of 9 9 7 9 - 2 1 1 2 -persons by means of deception
25(2) Knowingly harbouring an illegal entrant 3 5 3 10 1 1 1 2 1 1or person who is in breach of theconditions of his leave
25(4) Assisting unlwaful immigration - - - 40 145 - - - 13 3625(A)(4) Helping asylum seeker to enter the UK - - - 9 41 - - - 2 5
26(1)(a) and (b) Refusing to submit to an examination or to 2 2 - 2 2 2 2 - - -produce documents or information to anImmigration Officer or Medical Inspector
26(1)(c) Making false statements to an 2 12 8 3 10 - 10 6 3 9Immigration Officer
26(1)(d) Having possession of forged passport 11 9 12 18 25 5 5 2 8 7or other documents, or without authorityaltering documents
26(1)(f) Foreign national failing to register with 1 1 - 2 4 1 - - - 1police or to produce documents etc
26(1)(f) Failing to keep records of persons - - - - - - - - - -staying at hotels etc
26(1)(f) Failing to supply necessary information 1 1 - - 1 1 1 - - 1when staying at hotels etc
26(1)(f) Other offences in connection with 1 - 1 - 1 - - - - -police registration
26(A)(3)(a)(b)(d)(e)(f)(g) Making/having false registration card - - - 4 - - - - 2 -and 26(A)(3)(c)(h)(6)(5)
26(B)(6) Immigration stamp offences - - - 3 - - - - 3 -
24(1)(f) and (g) Other Immigration Act offences 3 1 1 1 3 2 1 1 - 2
26(1)(e), (g) and 27
Asylum and Immigration Act 1996
8 Employing a person subject to 10 5 2 2 11 4 1 1 1 8immigration control
Immigration and Asylum Act 1999Various All offences - 2 12 34 19 - 2 7 18 12
Nationality, Immigration & Asylum Act 2002145 Trafficking in prostitution - - - 1 - - - - - -
Total Magistrates' Courts 323 478 643 747 670 97 238 344 360 332
2000 2001 2002 2003 2004(P) 2000 2001 2002 2003 2004(P)
The Crown CourtImmigration Act 197124(1)(a) Entering UK in breach of a deportation order - - - - - - - - - -
24(1)(a) Entering UK without leave - 1 2 3 4 - 1 2 2 2
24(1)(b)(i), 24(1)(c) Overstaying time limit of leave 1 - - 1 1 - - - 1 1
24(1)(e) Failure to observe restrictions under - 1 - - - - 1 - - -Schedule 2 or 3 as to reporting to policeor an Immigration Officer as to residence
24(A) (2) Seeking leave to enter or remain or - 5 23 37 69 - 4 20 28 53postponement of revocation by deception
25(1)(a)(3) Knowingly facilitating the entry of an 140 134 170 145 140 108 94 142 107 103illegal entrant
25(1)(b)(3) Knowingly facilitating the entry of an 4 9 7 8 10 3 7 5 5 4asylum claimant
25(1)(c)(3) Knowingly facilitating leave to remain of 10 2 8 9 10 5 2 5 7 6persons by means of deception
26(1)(a) and (b) Refusing to submit to an examination or to - - - 1 - - - - 1 -produce documents or information to an
26(1)(c) Making false statements to an 1 - - - - 1 - - - -Immigration Officer
25(2) Knowingly harbouring an illegal entrant - - 1 1 - - - 1 - -
or person who is in breach of the
conditions of his leave26(B)(6) Immigration stamp offences - - - 1 - - - - 1 -
Total Crown Court 156 152 211 206 234 117 109 175 152 169 (1) Principal immigration offence. (2) As added by Section 2 of the Immigration and Asylum Act 1999 - (replaced section 24 (1) (aa) from 14 February 2000).(3) As amended by Section 5 of the Asylum and Immigration Act 1996.(4) As added by Section 143 of the Nationality, Immigration & Asylum act 2002(5) As added by Section 148 of the Nationality, Immigration & Asylum act 2002(6) As added by Section 149 of the Nationality, Immigration & Asylum act 2002(7) Included in proceeded against above.
Proceeded against Found guilty
For Trial(7) Found Guilty
81

SECTION 7: Appeals against immigration control decisions
Page
Table 7.1 Outcomes of appeals determinations by immigration adjudicators, by broad category,1997-2004
Explanatory Notes and Definitions paragraph 45.
82
83

83
Table 7.1 Outcomes of appeals determinations by immigration adjudicators, by broad category, 1997-2004(1)
United Kingdom Number of principal appellants (cases)
Total OutcomeAppeal category determined Allowed Dismissed Withdrawn
(2)
All appeals 1997 34,960 4,320 25,850 4,7801998 38,200 5,200 29,200 3,7001999(3)
28,610 7,630 17,350 3,6302000(3)
27,130 5,960 20,040 1,1202001(3)
56,815 13,335 42,160 1,3202002(3)
84,260 21,910 59,870 2,4802003(3)
108,350 29,025 76,330 2,995
2004(3)(P)109,220 34,245 72,600 2,375
Refusal of entry clearance(4)
1997 8,760 2,670 4,110 1,9701998 7,600 2,200 4,100 1,2001999(3)
5,800 2,070 3,280 4502000(3)
6,650 2,360 3,690 6002001(3)
10,755 4,415 5,910 4302002(3)
16,295 6,980 8,630 6852003(3)
21,045 11,090 9,070 890
2004(3)(P)44,375 20,825 22,780 770
Asylum related-appeals1997 21,050 1,180 18,150 1,7201998 25,300 2,400 21,200 1,8001999(3)
19,460 5,280 11,130 3,0502000(3)
19,400 3,340 15,580 4802001(3)
43,415 8,155 34,440 8252002(3)
64,405 13,875 48,845 1,6852003(3)
81,725 16,070 63,810 1,845
2004(3)(P)55,975 10,845 43,760 1,370
Other non-asylum(5)
1997 5,150 480 3,580 1,1001998 5,300 500 3,900 7001999(3)
3,350 280 2,940 1302000(3)
1,080 260 770 402001(3)
2,640 765 1,810 652002(3)
3,560 1,060 2,395 1052003(3)
5,580 1,865 3,455 260
2004(3)(P)8,870 2,575 6,060 235
(1) Figures for 1997, 1999, and 2000 rounded to the nearest 10, figures for 1998 rounded to the nearest 100,
and figures for 2001 onwards are rounded to the nearest 5.
(2) Includes cases where the appellant withdrew the appeal because the Home Office had conceded the case, as well those where the
appellant decided not to pursue the appeal further.
(3) Figures are estimates based on data supplied from the Department for Constitutional Affairs and the Presenting Officers Unit in the Home Office.
(4) Including refusal of certificate of entitlement.
(5) After-entry control cases

SECTION 8: Net migration
Page
Table 8.1 Net international migration to/from the United Kingdom, by nationality, 1995-2004 85
84
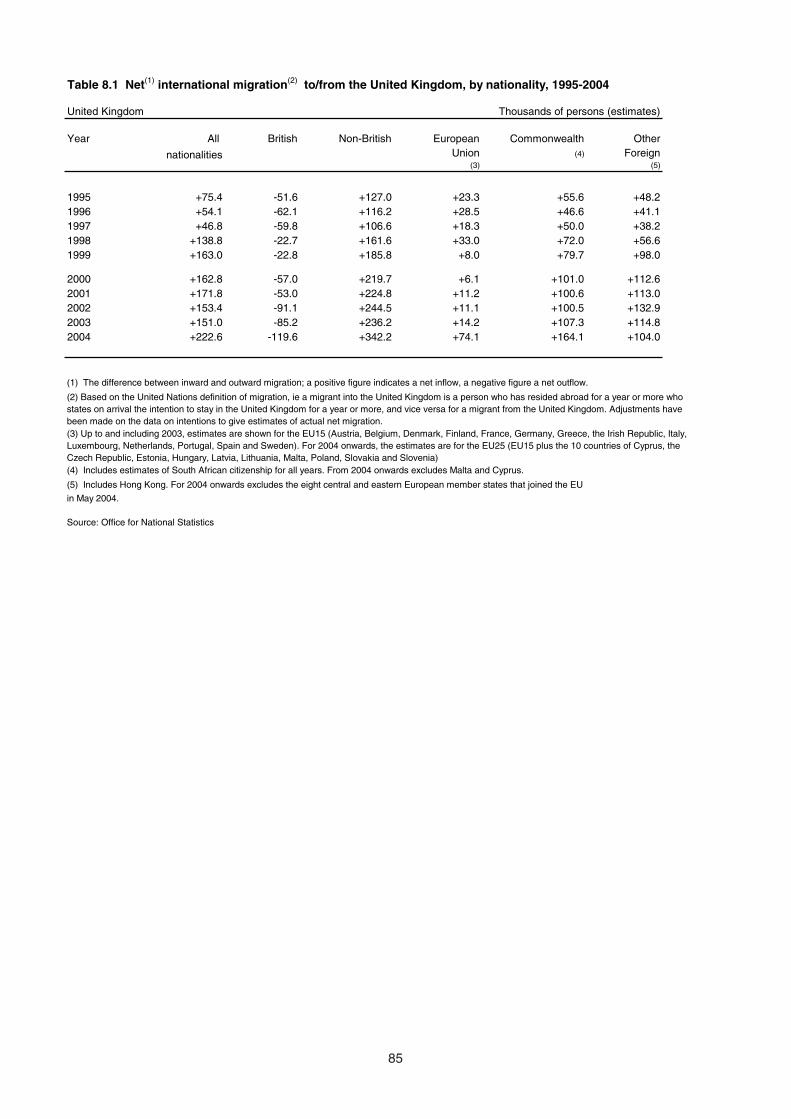
85
Table 8.1 Net(1) international migration(2) to/from the United Kingdom, by nationality, 1995-2004
United Kingdom Thousands of persons (estimates)
Year All British Non-British European Commonwealth Other
nationalities Union (4) Foreign (3) (5)
1995 +75.4 -51.6 +127.0 +23.3 +55.6 +48.21996 +54.1 -62.1 +116.2 +28.5 +46.6 +41.11997 +46.8 -59.8 +106.6 +18.3 +50.0 +38.21998 +138.8 -22.7 +161.6 +33.0 +72.0 +56.61999 +163.0 -22.8 +185.8 +8.0 +79.7 +98.0
2000 +162.8 -57.0 +219.7 +6.1 +101.0 +112.62001 +171.8 -53.0 +224.8 +11.2 +100.6 +113.02002 +153.4 -91.1 +244.5 +11.1 +100.5 +132.92003 +151.0 -85.2 +236.2 +14.2 +107.3 +114.82004 +222.6 -119.6 +342.2 +74.1 +164.1 +104.0
(4) Includes estimates of South African citizenship for all years. From 2004 onwards excludes Malta and Cyprus.
(5) Includes Hong Kong. For 2004 onwards excludes the eight central and eastern European member states that joined the EU
in May 2004.
Source: Office for National Statistics
(2) Based on the United Nations definition of migration, ie a migrant into the United Kingdom is a person who has resided abroad for a year or more who states on arrival the intention to stay in the United Kingdom for a year or more, and vice versa for a migrant from the United Kingdom. Adjustments have been made on the data on intentions to give estimates of actual net migration.
(1) The difference between inward and outward migration; a positive figure indicates a net inflow, a negative figure a net outflow.
(3) Up to and including 2003, estimates are shown for the EU15 (Austria, Belgium, Denmark, Finland, France, Germany, Greece, the Irish Republic, Italy, Luxembourg, Netherlands, Portugal, Spain and Sweden). For 2004 onwards, the estimates are for the EU25 (EU15 plus the 10 countries of Cyprus, the Czech Republic, Estonia, Hungary, Latvia, Lithuania, Malta, Poland, Slovakia and Slovenia)

CHANGES AFFECTING STATISTICS OF IMMIGRATION CONTROL
1. The statistics in this publication reflect the operation of immigration control, which is based on theImmigration Act 1971 which came into force on 1 January 1973. Since then, the main legislation bearing on thestatistics has been the British Nationality Act 1981, which came into force on 1 January 1983, the Immigration Act1988, the Asylum and Immigration Appeals Act 1993, the Asylum and Immigration Act 1996, the Immigration andAsylum Act 1999 and the Nationality, Immigration and Asylum Act 2002, and the Asylum and Immigration(Treatment of Claimants, etc.) Act 2004.
(i) The British Nationality Act 1981 defined British citizenship, British Overseas citizenship andBritish overseas territories citizenship, and two related categories – British protected persons and Britishsubjects under the Act (for the way in which these citizenships are included in the statistics, seeExplanatory Notes paragraph 7). The Act also incorporated certain amendments to the Immigration Act1971, mainly in relation to the right of abode in the UK.
(ii) The Immigration Act 1988 made a number of changes to immigration law; some of its provisionscame into force on 10 July 1988, and most of the remainder on 1 August 1988. Most importantly it repealedsection 1(5) of the Immigration Act 1971, under which dependants of male Commonwealth citizens settledin the UK on 1 January 1973 were exempt from the requirement to serve a probationary year before beinggranted settlement. The effect of the repeal of section 1(5) has been to reduce the number of persons,particularly wives, accepted for settlement on arrival, and to increase the numbers of such personsaccepted on removal of time limit after serving a probationary year. The Act also extended to alladministrative deportation cases the provision allowing the Home Office to pay the fares of personsremoved under supervised departure procedures.
(iii) The Asylum and Immigration Appeals Act 1993 came into force on 26 July 1993 and provided for:new rights of appeal for asylum applicants refused asylum; strict time limits on all stages of processingasylum cases; and a swifter procedure for dealing with manifestly unfounded cases. The Act restricted theappeal rights of persons seeking to enter the country as a visitor, or short-term or prospective student, orseeking to extend their duration of stay beyond the maximum period permitted.
(iv) The Asylum and Immigration Act 1996 (which came into force in stages, mostly during Septemberand October 1996) introduced the following:
(a) an extension of the accelerated appeals procedure to a wider range of refused asylumapplications;
(b) the designation by the Secretary of State, with the approval of Parliament, of selected countriesof destination where there is generally no serious risk of persecution – refusals of such casesbeing liable to the accelerated appeals procedure;
(c) restricting appeals against return to a safe third country within the European Union and othercountries so designated (currently Canada, Norway, Switzerland and the USA) to beingexercisable only after removal from the United Kingdom.
(v) On 2 October 2000, Part IV of the Immigration and Asylum Act 1999 came into force; thissupersedes all previous legislation on asylum appeals. It introduced a comprehensive one-step appealsprocess replacing the old system of multiple appeals. Applicants will be required to set out in a statementall the reasons, outside the scope of the original application, why they wish to enter or remain in the UnitedKingdom. An applicant can make only one application. Anything he says to add to it or change it until suchtime as a decision is made is a variation of that application that will attract only one decision and oneappeal. One problem in the past has been applicants applying for asylum after an immigration appeal hasbeen dismissed in order to delay removal. The “one-stop” system addresses this problem, whilst allowingfor genuine changes in circumstances.
86

(vi) The Nationality, Immigration and Asylum Act 2002 came fully into force on 1st April 2003. It builtupon the “one-stop” system of the 1999 Act with a single right of appeal which could be brought on oneor more well-known grounds restated in Section 84 of the Act. As previously an appellant could raisefurther grounds of appeal in a “one-stop” statement which the adjudicator would consider, indeed it was inhis interests to do so since if the appellant sought to raise the matter at a later date the appeal would be“certified” and therefore discontinued if it falls within the terms of section 96-99 of the NIA Act 2002. Thisact also introduced non-suspensive appeals which did not suspend removal and could only be pursuedoutside the UK. Under section 94 of the Act this would only apply (a) where the Secretary of State certifiesthe asylum or human rights claim as clearly unfounded and (b) where the Secretary of State is satisfiedthat they are entitled to reside in any state nominated in section 94(4) or in any Order derived there from.
(vii) The Asylum and Immigration (Treatment of Claimants, etc.) Act 2004 received Royal Assent inJuly 2004. One of the Act’s key aims is to deter and prevent behaviour designed to frustrate the UK asylumprocess. The Act introduced two new offences from September 2004, one being undocumented withoutreasonable explanation and one of failing to comply with the re-documentation process.
2. The figures in the historical tables also reflect changes in the immigration rules or instructions made underthe Immigration Acts and other factors, as follows:
(i) On 1 January 1994, the European Economic Area (EEA) Agreement came into force. It providedfor the right of admission and residence for nationals of the European Union (EU) to be extended to non-EU EEA nationals. In 1994 the EEA comprised the twelve Member States of the EU, formerly theEuropean Community (EC), together with Austria, Finland, Sweden, Iceland and Norway. Austria, Finlandand Sweden subsequently became Member States of the EU on 1 January 1995 and Liechtensteinbecame part of the EEA on 1 May 1995.
(ii) South Africa re-joined the Commonwealth in June 1994. Citizens of that country thereby becameeligible for admission as working holidaymakers and for employment if they have a UK-born grandparent.
(iii) On 1 October 1994, changes to the Immigration Rules (published as HC 395) replacing HC 251were made. They included the introduction of the investor category for entry to the United Kingdom,restricted the admission of persons of independent means to those aged 60 and over with an income of aminimum of £25,000 per year and further restricted switching into a category leading to settlement.
(iv) On 5 February 1996, the Department of Social Security withdrew a range of non-contributorybenefits from after-entry asylum seekers and from asylum seekers whose application had been refusedand who were appealing against that refusal. These regulations were confirmed by the Asylum andImmigration Act 1996.
(v) The primary purpose rule, which had been modified in June 1992 to take account of applicationswhere the couple had been married for 5 years or more and where one or more children of the marriagehad been born in the UK or had the right of abode in the UK, was abolished on 5 June 1997.
(vi) The 'Dublin Convention' came into force on 1 September 1997. It provides a mechanism (a) todetermine, according to set criteria, the Member State responsible for examining applications for asylumlodged in Member States of the European Communities and (b) for the transfer of an applicant betweenMember States. Prior to the introduction of the 'Dublin Convention' an applicant was normally returned tothe state where s/he embarked to the United Kingdom but, under the Convention, the responsible state inmany cases is not the state of embarkation.
(vii) In July 1998 the White Paper entitled “Fairer, Faster and Firmer – A Modern Approach toImmigration and Asylum” was published. A number of proposals relating to asylum were made, several ofwhich were implemented immediately (27 July 1998), as there was no need for primary legislation. Thesehave the effect of abolishing the qualifying period of four years for grant of settlement to those recognisedas refugees and given asylum and reducing it for those granted exceptional leave from seven to four years.In early 1999 the Home Office established units to implement further measures outlined in the WhitePaper. Many people who applied for asylum prior to July 1993 and were still awaiting an initial decisionwere granted settlement in 1999 under measures aimed at reducing the asylum backlog.
87

(viii) The administrative removal powers contained in section 10 of the 1999 Immigration and AsylumAct came into force on 2 October 2000. The section introduced new arrangements for overstayers, peoplewho fail to observe the conditions attached to their leave, and people who, having entered lawfully in thefirst instance, subsequently obtain further leave by deception, all of whom would previously have beenliable to deportation.
(ix) The Voluntary Assisted Returns Programme (VARP) began as a pilot project in February 1999and was expanded into a full programme in September 2000. VARP is funded by the Home Office but isrun by the International Organization for Migration in partnership with Refugee Action. It provides a serviceto asylum seekers and persons with exceptional leave who are considering returning voluntarily to theircountry of origin: independent advice is given on options for return and eligible persons are provided witha ticket and practical assistance with travel arrangements.
(x) An agreement between member states of the European Economic Area (EEA) and Switzerlandcame into force on 1 June 2002. The agreement confers on Swiss nationals the same rights as thoseenjoyed by EEA nationals and their family members.
(xi) From 18 December 2002 nationals from Poland, Estonia, Latvia, Lithuania, Bulgaria and Romaniabecame eligible to enter the United Kingdom as au pairs.
(xii) With effect from 1 April 2003, the implementation of amendments to rule changes published as HC538has resulted in a number of changes in the Immigration rules relating to spouses, fiancé(e)s andunmarried partners, including the following:
(a) A passenger seeking entry in these categories must be 16 years or over and the sponsor mustbe 18 years or over on the date leave to enter is granted.
(b) Passengers seeking entry as a spouse are to be given 2 years leave to enter rather than 12months.
(c) A passenger seeking entry as a spouse can now be granted indefinite leave to enter rather thancompleting the probationary period if the passenger has been married to a person who has theright of abode in the United Kingdom or has settlement status and is on the same occasionseeking admission to the United Kingdom for the purpose of settlement and the parties weremarried at least 4 years ago since which time they have been living together outside the UnitedKingdom.
(d) A passenger seeking entry as an unmarried partner can now be granted indefinite leave to enterrather than completing the probationary period if the sponsor has the right of abode in the UnitedKingdom or has settled status and the parties have been living together outside the UnitedKingdom in a relationship akin to marriage which has subsisted for 4 years or more.
(xiii) On 1 April 2003, Exceptional Leave to Remain (ELR) was replaced by Humanitarian Protection(HP) and Discretionary Leave (DL). It was considered that the widespread use of ELR was acting as a pullfactor and increasing the number of unfounded asylum applications in the UK. These new policies wereintroduced to ensure that only those who are in genuine need of protection, or where there are othercompelling reasons why they should be allowed to stay in this country, are granted leave to remain hereoutside the Immigration Rules. The criteria to be met for a grant of HP or DL are much narrower and morestrictly defined than those used when granting ELR.
(xiv) The Family ILR Exercise, announced by the Home Secretary on 24 October 2003, allows certainasylum-seeking families who have been in the UK for four or more years to obtain settlement. To qualify,the main applicant of the family unit must have applied for asylum before 2 October 2000 and must havehad at least one dependant aged under 18 (other than a spouse) in the UK on 2 October 2000 and/or 24October 2003.
88

The exercise will not apply to a family where the principal applicant or any of the dependants:
(a) has a criminal conviction;
(b) has been subject of an anti-social behaviour order or sex offender order;
(c) has made (or attempted to make) an application for asylum in the UK in more than one identity;
(d) should have his/her asylum claim considered by another country (i.e. s/he is the subject of apossible third country removal);
(e) presents a risk to security;
(f) falls within the scope of Article 1F of the Refugee Convention; or whose presence in the UK isotherwise not conducive to the public good."
(xv) The Czech Republic, Cyprus, Estonia, Hungary, Latvia, Lithuania, Malta, Poland, Slovakia andSlovenia became part of the EEA on 1 May 2004.
3. Before travelling to the UK, nationals of certain countries are required to obtain a visa from a Britishdiplomatic post abroad. From October 2000, holders of visas were treated for the purposes of the Immigration Actsas having been granted, before arrival, leave to enter the United Kingdom
89

EXPLANATORY NOTES AND DEFINITIONS
1. This is the latest in an annual series of Command Papers on immigration control statistics. It presents fullerinformation, for 2004 and earlier years, further to that published in the regular Home Office Statistical Bulletin“Control of Immigration: Statistics” (most recently, Issue 14/05). It also includes information on applications forasylum and their outcome and demographic characteristics of persons granted settlement in the UK.
Data Quality
2. During the first half of 2002, a new integrated database was implemented by IND to record caseinformation including grants of leave to remain and settlement. This database will in time enable the generation ofhigh quality information, but in the meantime there remain some data quality issues which have affected some ofthe statistics in this publication.
3. The most significant of these concern grants of extensions of leave to remain and grants of settlement.There are 5,385 cases of grants of leave to remain (excluding dependants) and 4,470 cases of grants ofsettlement in 2004 for which the category of extension or settlement is unknown.These cases have been recordedas ‘category unknown’ in Tables 4.1, 4.2, 5.1 and 5.3, and included in ‘other’ in Table 5.4. There is no reason tobelieve that any of these cases fall disproportionately into any of the individual extension or settlement categories.
Coverage
4. The statistics in this publication (apart from Tables 2.1, and 5.3 to 5.6) relate to people who are subject toimmigration control under Immigration Acts (that is, to people who do not have the right of abode in the UK) andare produced mainly as a by product of the process of immigration control. British citizens and thoseCommonwealth citizens who also have the right of abode are not subject to immigration control and may freelyenter and leave the UK; except for Table 2.1 they are not covered by the statistics. Nearly all of these persons areBritish citizens who, together with other EEA nationals and passengers in direct transit, comprised 87 per cent ofthe 97 million total passenger arrivals from outside the Common Travel Area (see paragraph 8) in 2004.
5. Immigration control regulates the entry and refusal of entry of passengers into the UK, the conditions ofstay in the UK, the variation of such conditions following entry, settlement and the deportation of persons underthe Act. The administration of immigration control is governed by the immigration rules which are laid beforeParliament by the Home Secretary from time to time. The ones current in 2002 (consolidating previous ruleschanges) were “Statement of Changes in Immigration Rules” HC 395, which took effect from 1 October 1994.Changes in the rules have affected the statistics over the years, and an account of the more notable changes andof other developments are given in the previous section.
6. Persons who emigrate from the UK are not included in this publication. It is not possible for the HomeOffice to provide information on how many people have left the country, as we do not count everyone into and outof the United Kingdom. However, estimates of the total number of international migrants are available from theOffice for National Statistics (www.statistics.gov.uk). These estimates are based mainly on the results of theInternational Passenger Survey, a sample survey of all passengers, which identifies those intending to stay for ayear or longer in their new country of residence.
Classification of countries and nationalities
7. The heading “British Overseas citizens” includes also British protected persons and British subjects underthe British Nationality Act 1981 and covers those people classified in the pre-1983 issues of this publication as“United Kingdom Passport Holders”. British overseas territories citizens from Hong Kong, stateless persons fromHong Kong, British Nationals (Overseas) and holders of Hong Kong Special Administrative Region passports arerecorded under “Hong Kong”, and other BOTCs are included under the relevant geographical region. The term“Indian sub-continent” refers to India, Pakistan and Bangladesh, but excludes Sri Lanka, reflecting the specialimmigration history of the three mainland countries. Pakistan and South Africa rejoined the Commonwealth on 1October 1989 and 1 June 1994 respectively; for the purposes of this publication, Pakistan is regarded asCommonwealth for the whole period covered but South Africa is not. The term “foreign” means “non-Commonwealth”.
European Economic Area (EEA) nationals
90

8. This publication does not include figures for citizens of the Republic of Ireland, who are generally able totravel freely within the Common Travel Area(13). Other EEA nationals are also free to enter, and to remain in, theUK without requiring leave to do so (see Changes Affecting Statistics of Immigration Control paragraph 2(i)). EEAnationals are therefore not included in the statistics in this publication on: admissions with limited leave; extensionsof stay; or settlement on arrival (Table 2.1 is an exception to this rule). Data on EEA nationals granted settlementwas not recorded between 1999 and 2000. An agreement between the member states of the European EconomicArea and Switzerland came into force in the UK on 1 June 2002. This agreement confers on Swiss nationals thesame rights as those enjoyed by EEA nationals and their family members. Data on admissions of Swiss nationalsin this publication are included for arrivals up to 31 May 2002.
9. On 1 May 2004, Czech Republic, Cyprus, Estonia, Hungary, Latvia, Lithuania, Malta, Poland, Slovakia andSlovenia all joined the EEA. Tables in sections 2, 4 and 5 within this bulletin have been compiled to include dataon these countries up to 1 May 2004. Cyprus (Non-European Union) is included in other Europe from 2004.
10. Since 2000, although they are not obliged to, EEA nationals have been able to seek permanent residencewhen they have exercised a European treaty right (excluding students) for four years. Family members of EEANationals are also able to seek permanent residence on the basis of living with an EEA national exercisingEuropean treaty rights (excluding as a student) during that period. Permanent residence is approved underparagraph 255 of the Immigration rules to EEA nationals and Non-EEA national family members of EEA nationals.
11 A residence permit is issued to an EEA national when sought to confirm that they are exercising a treatyright. A permit is normally issued for a period of five years.
12. A residence document is issued to a Non-EEA national family member of an EEA national when sought.It confirms their status as a family member of an EEA national and is normally issued for a period of five years
13. Prior to 1 May 2004, documents issued to nationals of the states that acceded to the EU on this date willhave been residence documents as a family member of an EEA national. From 1 May 2004 individuals will havebeen entitled to seek a residence permit in their own right.
14. Based on information from the International Passenger Survey, it is estimated that about 17 million EEAnationals (excluding arrivals from within the Common Travel Area) entered the United Kingdom in 2004 (seeTable 2.1).
Passenger admissions and refusals (Tables 2.1-2.5)
15. The statistics of passengers given leave to enter the UK and of those refused entry and removed excludeEEA nationals, passengers who enter as members of HM or NATO forces, officers or members of the crew ofships, aircraft or Channel Tunnel trains, those who land briefly in the UK in transit without passing throughimmigration control, and any passengers who enter the UK from other parts of the Common Travel Area. The dataare of the number of journeys made; a person who makes more than one journey is counted on each occasion,either in a specific category if given fresh leave to enter or in “passengers returning”.The data on visitors, students,passengers in transit and passengers returning (previously settled) are based, mainly or partly depending on thecategory, on a sample of such persons. Improvements to the sampling methodology were introduced from July2003 and therefore caution should be exercised when making statistical comparisons with earlier periods at adetailed level. There are certain breaks in some of the admission series as a result of Austria, Finland, Iceland,Norway, Sweden and Liechtenstein joining the EEA in 1994-5, and hence being excluded from the figures fromthen on. Additionally, Swiss nationals are excluded from 1 June 2002 and accession countries(14) from 1 May 2004.
16. “Dependants of work permit holders” includes spouses, and children under 18 years old, of work permitholders.
17. “Passengers returning” includes both people who are settled in the UK and who have been absent for lessthan two years, and those subject to a limited leave to enter who have returned within the time limit of that leave.The initial admissions of such passengers will have been counted in one of the specific categories of Table 3.2 inthe year in question.
18. “Asylum-related cases and their dependants” covers persons who have applied for asylum at ports (and
91
(13) The Common Travel Area consists of the United Kingdom, the Channel Islands, the Isle of Man and the Republic of Ireland.(14) Czech Republic, Cyprus, Estonia, Hungary, Latvia, Lithuania, Malta, Poland, Slovakia and Slovenia.

their accompanying dependants) and who have been granted asylum, Humanitarian Protection, DiscretionaryLeave or who have been allowed to stay under the Family ILR exercise (Changes Affecting Statistics ofImmigration Control paragraph 2(xiv)), and are hence given leave to enter. Port asylum applicants are usuallygiven temporary admission initially while their claim is being considered, and the grant of leave to enter maytherefore occur some time after the initial entry to the country.These figures are not directly comparable with thosein Tables 3.1 and 3.2 since they exclude grants to in-country asylum applicants and include dependants.
19. In Table 2.2, “Others given leave to enter” includes:
(a) children seeking settlement;
(b) diplomats and officials;
(c) domestic workers;
(d) ministers of religion;
(e) persons of independent means, investors, in business, self-employed persons, writers and thosecoming for permit-free employment;
(f) seasonal agricultural workers;
(g) United Kingdom ancestry cases (i.e. Commonwealth citizens with a UK-born grandparent, who aretaking or seeking employment);
(h) unmarried partners;
(i) working holidaymakers;
(j) United Kingdom ancestry cases (i.e. Commonwealth citizens with a UK-born grandparent, who aretaking or seeking employment);
(k) dependants of (b) to (j) where applicable, of students and NATO forces.
Asylum (Tables 3.1-3.7)
20. The criteria for recognition as a refugee, and hence the granting of asylum, are set out in the 1951 UnitedNations Convention relating to the Status of Refugees, extended in its application by the 1967 Protocol relating tothe Status of Refugees. The Convention defines a refugee as a person who “owing to a well-founded fear of beingpersecuted for reasons of race, religion, nationality, membership of a particular social group or political opinion, isoutside the country of his nationality and unable or, owing to such fear, is unwilling to avail himself of the protectionof that country; or who, not having a nationality and being outside the country of his former habitual residence ...is unable or, owing to such fear, is unwilling to return to it”.
21. People who are found not to be refugees within the terms of the Convention will be refused asylum. Incertain circumstances they may be granted Humanitarian Protection (HP) or Discretionary Leave (DL) for a limitedperiod (HP and DL replaced exceptional leave to remain (ELR) on 1 April 2003).
22. People granted asylum are given indefinite leave to remain (settlement). Those granted exceptional leaveprior to 1 April 2003 may apply for settlement after four years with that status (see paragraph 43). Those grantedHumanitarian Protection are eligible to apply for settlement after three years and those on Discretionary Leave arenormally eligible to apply for settlement after completing six years in this category.
23. A reconsideration case refers to an asylum decision by the Secretary of State which is later required to bereconsidered as a result of additional information and or significant changes in current circumstances and countryinformation.
92
24. Non-compliance refusals (under paragraph 340 of the immigration rules and paragraph 180F prior to 1October 1994) are for failure to provide evidence to support the asylum claim within a reasonable period. FromNovember 1991 these include refusals for failure to respond to invitations to interview to establish identity underthe measures introduced then. Non-compliance refusals are separately identified in the manual counts ofdecisions from December 1991 but were not previously identifiable from other types of refusal.
25. There is no provision in the Immigration Rules to seek asylum in the UK from aboard. However,exceptionally, some cases are referred to the Home Office from overseas diplomatic posts. If entry clearance isgranted exceptionally, and the applicant subsequently travels to the UK and applies for asylum, the applicationwould be included in the figures in the same way as other applications. Limited information is available onapplications that are processed abroad. No overseas applications are recorded as having been lodged since 1992.
26. The right of appeal is now based in law on the taking of an “immigration decision” as defined by section82 of the Nationality, Immigration & Asylum Act 2002. Section 83 extends the right of appeal to those asylumapplicants whose application has been refused, but who have been granted a period of over 12 months leave toenter or remain since their last arrival in the UK. This right of appeal is subject to limitations and exceptionsdetailed in sections 88 to 89 of the NIA Act 2002. Immigration Appeals adjudicators hear all asylum appeals.Thoseapplicants whose appeals are dismissed by adjudicators are entitled to apply for leave to appeal to the ImmigrationAppeals Tribunal (IAT) and, if dismissed by the IAT, to the Court of Appeal, on a point of law. However, in caseswhere the Secretary of State has certified the refusal and the adjudicator dismisses the appeal and upholds thecertificate, there is no right of appeal to the Tribunal.
27. In addition to individual applications for asylum, South East Asian refugees formed a distinct group ofpeople, already recognised as refugees, who were granted settlement on their arrival in the UK. These cases areincluded in recognised refugees in Table 5.3. Under arrangements announced on 30 November 1992 and 6August 1995 some 3,000 vulnerable former Yugoslavs who were in need of evacuation were admitted into the UK,on an exceptional basis. In addition the Government announced that the UK was willing to receive people fromKosovo whom UNHCR had classified as being vulnerable and in need of evacuation, together with theirdependants. As at the end of June 1999, 4,345 people from Kosovo, including dependants, were admitted to theUK under the UNHCR Humanitarian Evacuation Programme. The evacuation programme closed at the beginningof July 1999.
28. Asylum statistics are based on numbers of principal applicants, excluding dependants. If dependants applyfor asylum in their own right then they are recorded as principal applicants and removed from all otherapplications.
29. The National Asylum Support Service (NASS) began supporting asylum seekers on 3 April 2000. NASSwas set up to provide accommodation and/or subsistence payments to asylum seekers so that they can supportthemselves whilst they are awaiting a decision on their asylum application. Any cases that applied for asylum inthe UK after 3 April 2000 were only eligible to apply for NASS support (apart from some in-country cases thatwere part of the roll-out), whereas prior to 3 April 2000 asylum seekers, depending on the location of theirapplication for asylum, could apply for support from the Department for Work and Pensions (DWP) or localauthorities. Asylum seekers that apply for NASS support can apply to receive accommodation only (where theyare allocated accommodation in a dispersal area and must otherwise support themselves); or subsistence only(where they receive cash to support themselves but must find their own accommodation); or accommodation andsubsistence (where they are allocated accommodation in a dispersal area and cash to support themselves).
30. Asylum applicants who are in receipt of NASS support can have their support terminated for variousreasons. If an asylum seeker receives refugee status or exceptional leave to remain they are entitled to apply forDWP support and therefore have their support terminated by NASS. Conversely, if an asylum seeker receives afinal negative decision, and is a single applicant or a family with no children under 18 they also have their supportterminated – families with children under 18 remain supported until they are removed from the UK. Also supportcan be terminated if asylum seekers do not abide by the regulations set out when the support is provided to theasylum seekers, for example, if the asylum seeker does not move in to the allocated accommodation.
93

31. Where an applicant has made more than one application during a year, only one application is recordedin the numbers. These numbers therefore reflect the total number of principal applicants applying for NASSsupport. It should be noted however, that where an applicant has made an application in two separate years thiswill be recorded as an application in each year. By contrast the estimates published quarterly by the Home Officeinclude both the original and any subsequent re-applications.
32. The English regions include the following counties
East Of England – Bedfordshire, Cambridgeshire, Essex, Hertfordshire, Norfolk, and Suffolk East Midlands –Derbyshire, Leicestershire, Lincolnshire, Northamptonshire, Nottinghamshire, and RutlandGreater London North East – Cleveland, Durham, Northumberland and Tyne and WearNorth West – Cheshire, Cumbria, Greater Manchester, Lancashire, and MerseysideSouth East – Berkshire, Buckinghamshire, East Sussex, Hampshire, Isle of Wight, Kent, Oxfordshire, Surrey, andWest SussexSouth West – Cornwall, Devon, Dorset, Gloucestershire, Somerset, and WiltshireWest Midlands – Herefordshire, Shropshire, Staffordshire, Warwickshire, West Midlands, and WorcestershireYorkshire and Humberside – Humberside, North Yorkshire, South Yorkshire and West YorkshireThe tables also include figures for Northern Ireland, Scotland and Wales.
33. Under section 55 of the Immigration and Asylum Act 2002, which came into force on 8 January 2003,asylum, seekers have to apply for asylum as soon as reasonably practicable in order to be eligible for NationalAsylum Support Service (NASS) support. From 17 December 2003 the Home Secretary announced that thosewho could give a credible account that their asylum claim was made within three days of arrival in the UnitedKingdom will normally be accepted as having applied as soon as reasonably practicable.
34. Interviewing and assessments of eligibility under section 55 were suspended on 21 May 2004 followingthe Court of Appeal’s judgement in the cases of Limbuela, Tesema and Adam. The effect of the judgement is thatNASS should not refuse support under section 55 to an asylum seeker unless it is positively satisfied that theindividual concerned does have some alternative form of support available to him/her. This support should includeadequate food and basic amenities, such as washing facilities and night shelter. The Home Office is appealing thatdecision. An interim approach to section 55 decision making was introduced on 28 June 2004 to comply with theCourt of Appeal’s judgement pending an appeal to the House of Lords, which is scheduled to be heard on 4October to 6 October 2005.
35. The provision of initial accommodation is a temporary arrangement for asylum seekers who wouldotherwise be destitute and;
● are supported under section 98 of the Immigration and Asylum Act 1999 and awaiting a decision fromthe Secretary of State on whether he may provide asylum support under section 95 of that act; or
● are supported under section 95 and are awaiting transfer to their dispersal accommodation.
36. Further information on asylum applications and decisions in the years 1996-2004 is published in the latestHome Office Statistical Bulletin, “Asylum Statistics United Kingdom 2004” which is obtainable free of charge fromthe address at paragraph 49, and from the RDS website http://www.homeoffice.gov.uk/rds/index.html.
Grants of settlement (Tables 5.1-5.6)
37. The statistics of grants of settlement – i.e. people subject to immigration control who are allowed to remainin the UK indefinitely – are the main available measure of longer term immigration of persons subject toimmigration control. The settlement figures comprise people granted settlement on arrival at ports, and peopleinitially admitted to the country subject to a time limit which was subsequently removed on application to the HomeOffice. Following changes to the immigration rules in recent years, the majority of grants are on removal of timelimit.
38. Grants are counted once in the year in which they occur; subsequent journeys are counted once each inTables 2.2 and 2.3 as described above. If a settled person is absent from the UK for more than two years he/shewill be treated as a new arrival unless there are special circumstances; indefinite leave to enter for settlement maybe granted again so the person would fall to be counted in more than one year's figures of settlement, or theperson might be re-admitted with limited leave.
94

39. The term “granted settlement in own right” in Tables 5.1 and 5.3 means that the basis of the grant was anentitlement under the immigration rules and did not depend on the individual's relationship to another person (forexample a spouse or parent) already settled or settling at the same time.
40. The category “Other grants on a discretionary basis” in Tables 5.1 and 5.3 includes grants, on adiscretionary basis, after a long period of continuous residence in the UK. It also includes those people grantedsettlement following application under the regularisation scheme for overstayers (persons who had permission toenter or remain in the UK for a limited time only and who had remained beyond the time allowed). From 2 October2000 all overstayers required to leave the UK no longer had the right of appeal from removal except on asylum,human rights or discrimination grounds. The regularisation scheme offered overstayers who applied to regularisetheir stay, prior to 2 October 2002, the opportunity to retain the right of appeal if their application was subsequentlyrefused. No special consideration was given to those who applied under the scheme; in the absence ofcompassionate circumstances outweighing the public interest, deportation was the normal course. The benefit ofthe scheme to applicants who were refused permission to stay is that they kept the right of appeal before removalfrom the UK.
41. The category “claim to right of abode upheld and other grants” in Table 5.3 includes grants to thosepreviously settled but then absent from the UK for some time and who, on return, were initially re-admitted withlimited leave.
42. Table 5.2 shows an analysis by gender and age of grants to non-EEA nationals on removal of time limit.These comprise around 86 per cent of total grants to non-EEA nationals, and are reasonably representative ofthis total. However they understate somewhat the relative numbers of children under 16 (a relatively highproportion of whom are granted settlement on arrival and so not included in these figures) and so may tend tounderstate the proportion of younger age.
43. The figures in Tables 5.1 and 5.3 of grants of settlement of refugees and exceptional leave cases are ofthose granted settlement after a period of residence in the UK, along with South-East Asian refugees (seeparagraph 27). People recognised as refugees in the UK and hence granted asylum are now simultaneouslygranted settlement when they are granted refugee status. Those granted exceptional leave may now apply forsettlement after four years' residence with that status. Those granted Humanitarian Protection are eligible to applyfor settlement after three years and those on Discretionary Leave are normally eligible to apply for settlement aftercompleting six years in this category (see paragraph 22). Information on applications for asylum and decisions isshown in Tables 3.1-3.3.
Enforcement and Detention (Tables 6.1 to 6.5)
44. Owing to a change in the working practices of IND all asylum removals (other than voluntary returns) arenow classed as enforced removals.Therefore, there are no longer any asylum removals classed as “Refused entryat port and subsequently removed”, and so the figures for 2004 are not directly comparable with previous years.This reclassification has no effect on the total removals recorded for 2004. This reclassification occurred inFebruary 2003 and so applied to all asylum removals conducted in 2004. This reclassification has no effect on therecording of non-asylum removals.
Appeals against managed migration (non-asylum) decisions (Table 7.1)
45. There is a two-tier system for appeals in these cases – adjudicators at the first level and the ImmigrationAppeal Tribunal at the second – which is the responsibility of the Department of Constitutional Affairs (formerly theLord Chancellor’s Department). Most appeals are finalised before adjudicators and Table 7.1 gives informationabout the outcome of these appeals. The figures for appeals withdrawn include cases where the appellantwithdrew the appeal because the Home Office had conceded the case, as well as those where the appellantdecided not to pursue the appeal further. It should be noted that the Nationality, Immigration & Asylum Act 2002abolishes previous distinctions between asylum and non-asylum appeals.
95

Conventions used in the tables
46. Despite the care which is taken in collecting and collating all the information obtained, the figures aresubject to the inaccuracies inherent in any large recording system and are not necessarily accurate to the lastdigit. The rounding of figures also serves to ensure the confidentiality of the original source data used and theindividuals to whom it relates. Figures on admissions, extensions of leave, and settlement are now rounded to thenearest 5, or three significant figures, to be consistent with other statistics of immigration and asylum. Thisrounding convention has been used for figures for 1997 to 2001; figures relating to 1996 and earlier have beenrounded to the nearest 10, or three significant figures. The components in some of the tables in this report maynot add to the totals shown because they have been rounded independently.
47. Symbols used in tables:
. . not available – nil* not applicable † negligible (i.e. two or less)(R) some figures in the column or # five of fewer
row have been revised (P) provisional figures
Enquiries and other information
48. This publication has been prepared by the Research, Development and Statistics Directorate of the HomeOffice. Enquiries about the figures should be addressed to the Immigration Research and Statistics Service,Apollo House, 36 Wellesley Road, Croydon CR9 3RR (tel: 020 8760 8289). Press enquiries should be made tothe Home Office Press Office, Peel Building, 2 Marsham Street, London SW1p 4DF (Tel: 020 7035 4381)
49. Summary statistics on the control of immigration are also published once yearly in a Home OfficeStatistical Bulletin. This is obtainable from: www.homeoffice.gov.uk/rds
Statistical information on grants of British citizenship is published annually in Home Office Statistical Bulletin, Issue08/05 “Persons granted British citizenship, United Kingdom, 2004”, also available from the above address.
Other statistical and research publications related to immigration control and international migration can beaccessed via the Research, Development and Statistics Directorate website athttp://www.homeoffice.gov.uk/rds/immigration.html
96
Printed in the UK by The Stationery Office Limitedon behalf of the Controller of Her Majesty’s Stationery Office
11/05 320026 183395 19585

97

98

99

100

101

102
Published by TSO (The Stationery Office) and available from:
Onlinewww.tsoshop.co.uk
Mail,Telephone, Fax & E-mailTSOPO Box 29, Norwich NR3 1GNTelephone orders/General enquiries: 0870 600 5522Order through the Parliamentary Hotline Lo-call 0845 7 023474Fax orders: 0870 600 5533E-mail: [email protected] 0870 240 3701
TSO Shops123 Kingsway, London WC2B 6PQ020 7242 6393 Fax 020 7242 639468-69 Bull Street, Birmingham B4 6AD0121 236 9696 Fax 0121 236 96999-21 Princess Street, Manchester M60 8AS0161 834 7201 Fax 0161 833 063416 Arthur Street, Belfast BT1 4GD028 9023 8451 Fax 028 9023 540118-19 High Street, Cardiff CF10 1PT029 2039 5548 Fax 029 2038 434771 Lothian Road, Edinburgh EH3 9AZ0870 606 5566 Fax 0870 606 5588
TSO Accredited Agents(See Yellow Pages)
and through good booksellers