control de calidad de los pavimentos de hormigón -...
TRANSCRIPT

Control de Calidad de los
Pavimentos de Hormigón
Mark Snyder

Quality Control of
Concrete Paving
International Seminar on Concrete Pavements:Improving the Quality of Concrete Pavements
Viña del Mar, ChileSeptember 3-4, 2013
Mark B. Snyder, Ph.D., P.E.
International Society for Concrete Pavements

3
• Achieving quality equates to conformance to
requirements
• Requirements need to be well-defined,
measurable, and not arbitrary
• Quality must be built into a project. It is not a
“hit-or-miss” proposition.
What is Construction Quality?

How Do The Following People
Affect “Quality”?
o Designer/Specifier
o Agency Inspector
o QC Technician
o Loader Operator at the concrete plant
o Truck Driver
o Paver Operator
o Concrete Finisher
o Texture/Cure Machine Operator

Quality Measurement Tools
• Two principal tools used to measure
conformance with requirements:
� Inspection
�Testing

Inspection
• Equipment
• Environmental
Conditions
• Materials
• Product
Workmanship

Testing
• Three criteria:
�Quality Characteristics
(What do we want?)
�Quality Measures
(How do I measure it?)
�Quality Limits
(How much is enough?)

How Much Quality Is Enough?
• Is 99.9% “good enough”?
� 45 minutes of unsafe drinking water every month
� 2 long or short landings at many American
airport each day
� 500 incorrect surgical operations each week
� 3,000 newborns accidentally falling from the
hands of nurses or doctors each year
� 22,000 checks deducted from the wrong bank
account each hour

QA Principles
• Types of Tests
�Process Control Test
�Not Random
�Contractors use when needed
–Change in process or material
� Independent Assurance
�Not the project personnel
�Random Samples
�For compliance with specifications
�No others count for compliance

Basis for Testing
• Random testing assumes that the results
are normally distributed
• The mean and standard deviation of test
results are used to determine if the
samples are within specified limits
• Variability is due to the operator (and
equipment), the test procedure, and the
material being tested

Quality vs. Construction Variability
• Variability is an inherent part of construction.
�Many sources
• All sources of variability have a negative impact
on the property being measured.
• Need to understand the magnitude of the
different sources of variability
• Quality construction requires control over all
sources of variability.
Source: Shiraz Tayabji, Fugro Consultants, Inc.

QA Principles
N = 1
• Sources of Variability
�Material
�Sampling
�Tester
�Equipment
�Procedures

Material Process Sampling Testing
Composite
Variability
Sources of Variability

Precision and Bias
• Established test procedures (ASTM,
AASHTO) have accounted for test
variability through precision and bias
statements
• All physical tests have built in variability
that must be accounted for in some
manner
• The following slide illustrates the problem
in determining a “right answer”

Precision and Bias

16
REASONABLE LEVELS OF VARIABILITY
(In terms of acceptable standard deviation)
• Subgrade Density: 1 to 3 lb/cu. ft
• Concrete Thickness: 0.25 to 0.50 in.
• Concrete Flex Strength: 40 to 60 psi
• Concrete f’c: 300 to 500 psi

17
Higher levels of variability =>> construction process is not under control and/or testing procedures are
marginal

Quality Control (QC)
• QC generally refers to testing by the
contractor for the purpose of process
control and to ensure meeting or exceeding
specifications
• A comprehensive QC program is much more
involved than QA because all aspects of the
project must be proactively monitored
(materials, batching, placement, etc.)

Quality Control
• Contractor’s QC system should address:
�Materials production processes
�Materials transportation and handling
�Field placement procedures
�Calibration and maintenance of
equipment
�Watching the process
�Fixing the process

Quality Control Charts
• Quality control charts (QCC) are statistically based and used primarily for process control
• Graphical format of QCC provides a simple and effective means to determine when a specific process is trending out of limits

Statistical Process Control

Concrete Batching QC
• Uniformity between concrete batches is critical in producing a smooth and long-lasting pavement
• The following parameters are routinely checked during batching:
� Aggregate moisture
� Water content
� Water/cementitious materials ratio
• Plant calibration and continuous monitoring are required

ASTM Batching Tolerances
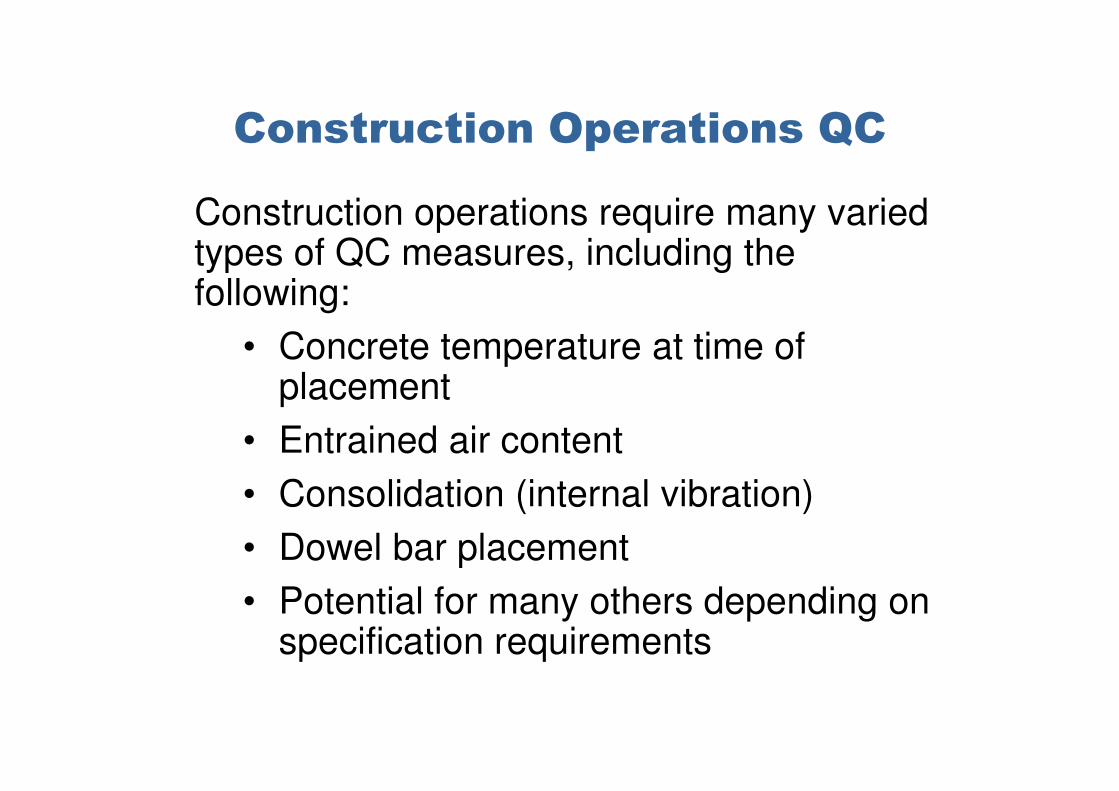
Construction Operations QC
Construction operations require many varied types of QC measures, including the following:
• Concrete temperature at time of placement
• Entrained air content
• Consolidation (internal vibration)
• Dowel bar placement
• Potential for many others depending on specification requirements

Testing – Temperature
• ASTM C1064• EASY, just place thermometer in
concrete• Results help verify conformance to
requirements

Testing – Slump
• ASTM C143 / AASHTO T119
• Measures consistency; NOT QUALITY!
• Typical values:�Slipform: 0.5-1.5 in.�Fixed form: 3-4 in.
• Slump is dependent on mixture and also on time of testing

Testing – Density (Unit Weight)
• ASTM C138 / AASHTO T121
• Measures known volume
• Typically 130 to 150 lb/ft3
• Indicates batch-to-batch variability
• Reduction in density may indicate:
�Higher air content, higher water
content, lower cement content, change
in proportions of ingredients, or change
in aggregate specific gravity or
moisture
• One of the most valuable tests for process
control

Testing – Air Content
• ASTM C231 / AASHTO T152
• Target air depends on agg size
• Testing at plant or in front of
paver doesn’t account for air
loss of up to 2% in paver
• Quality critical to durability
• AVA and petrography are other
means to measure
Max AggSize
Target Air
9.5mm 7 ½%
13mm. 7%
19mm 6%
25mm 6%
38mm 5 ½%

Testing – Air Content (continued)
• Affected in the field by:
�Cement
�SCMs
�Chemical admixtures
�Gradation of aggregates
�w/cm ratio
�Temperature
�Delays
�Placement/consolidation

Air Content
• Why important?• Does not address
aggregate durability problems
• Typically specified as a target value and range (e.g., 5.0% 1.0%)�Nonfreeze states: 1-6%�Freeze states: 4-8%

Quality Assurance (QA)
• QA typically involves testing by the
agency or its representative to determine
compliance with specifications
• The most frequently used QA criteria for
paving jobs include
� Slab thickness
� Concrete strength
� Entrained air content
� Ride quality

Acceptance Testing
• Intent of testing is not to discriminate absolutely
between good and bad end product� Otherwise, we would be testing every cy of concrete
and every sy of the pavement
• Intent is to discriminate sufficiently to minimize � Contractor’s risk of good end product being rejected
� Owner’s risk of a bad end product being accepted
• Balance is maintained by type & extent of testing
and rules used to accept test results
Source: Shiraz Tayabji, Fugro Consultants, Inc.

Qualifications
• QC/QA personnel must be adequately
trained (and, often, certified)
• Repeatability and reproducibility of results
are critical for both QC and QA functions

Key Concrete Pavement
Acceptance Items
• Air content • Slab thickness• Concrete strength• Initial
smoothness

Thickness
• Probe
• Probe
• Probe

Slab Thickness
• Why important?• Traditional method:
�Cores at prescribed locations
�Governed by ASTM C174
• NDT methods:�GPR (limitations)�Impact echo

Slab Thickness Measuring:
Magnetic Imaging Tomography

Concrete Strength
• Why important?• Traditional measurement methods
�Flexural strength of beams�Compressive strength of cylinders
or cores�Split tensile testing of cylinders or
cores

Flexural, Compressive Strength
• Strength testing of concrete is one of the most common tests performed
• It is usually a combination of field preparation and laboratory (or mobile laboratory) testing
• Relatively simple, but variability in results can often be attributed to slight variations in procedure

Testing – Comp & Flex Strength
• ASTM C39 / AASHTO T22 for cylinders• ASTM C78 / AASHTO T97 for beams• Typical strength requirements (low / avg / high)
�Compressive: 21 / 24.5 / 28 MPa�Flexural: 3.8 / 4.2 / 4.5 MPa

Concrete Strength Testing:
Traditional Measurement Methods
Beams
Cylinders
Cores

Concrete Strength:
Type Used for Acceptance
0
5
10
15
20
Nu
mb
er
of
Sta
tes
Compressive Flexural
3-day
7-day
14-day
28-day
Unknown

Concrete Strength:
Specifying Strength
• Strength type (flex, comp, split tensile)• Time of measurement (3, 7, 14, 28 days)• Strength value (average or minimum)
• Typical*:�Avg f’c = 28 MPa at 28 days �Min f’c = 24 MPa at 28 days
*ACPA Database of State Practices (2007)

Concrete Strength:
Alternative Methods
• Maturity (ASTM C1074)�Monitoring in-place concrete pavement
temperatures to estimate strength• Pulse velocity (ASTM C597)
�Measuring speed at which ultrasonic waves travel through concrete
• Seismic pavement analyzer�Measuring resonant frequency of stress
waves imparted in concrete

• Strength of concrete = f(time, temp) • Laboratory-derived correlation curve• Monitoring of field
pavement temps• Precision to
cylinders: ±5%• Governed by
ASTM C 1074
Concrete Strength:
Maturity
Temperature-Time Factor, M(t)
Co
mp
ressiv
e S
tren
gth
(M
Pa)
Co
mp
ressiv
e S
tren
gth
(p
si)
0 100 200 300 400 5000
5
10
15
20
25
30
35
40
0
1000
2000
3000
4000
5000

Testing – Maturity

Testing – MaturityASTM C1074 / AASHTO T325

Testing – Maturity

Maturity Testing
• Early sawing• Surface texturing• Compatible equipment• Equipment condition

Initial Smoothness
• Why important?• Measurement methods
�Straight edge�Profilograph (California)�Lightweight profilers
• Typically expressed in terms of:�Profile Index
� 5-mm blanking band (typ. 0.08 – 0.16 m/km)
� 0-mm blanking band: (typ. 0.32 – 0.47 m/km)
�IRI (typ. 0.95 – 1.10 m/km)

Initial Smoothness:
Measurement Methods
California Profilograph
Lightweight Profiler

Current Smoothness Issues
• Accuracy
�Wavelengths (profilograph)
�Tining, joints, cracks
• Repeatability of device
�Tining, joints, cracks
�Coarse textured pavements
These are current topics of research…
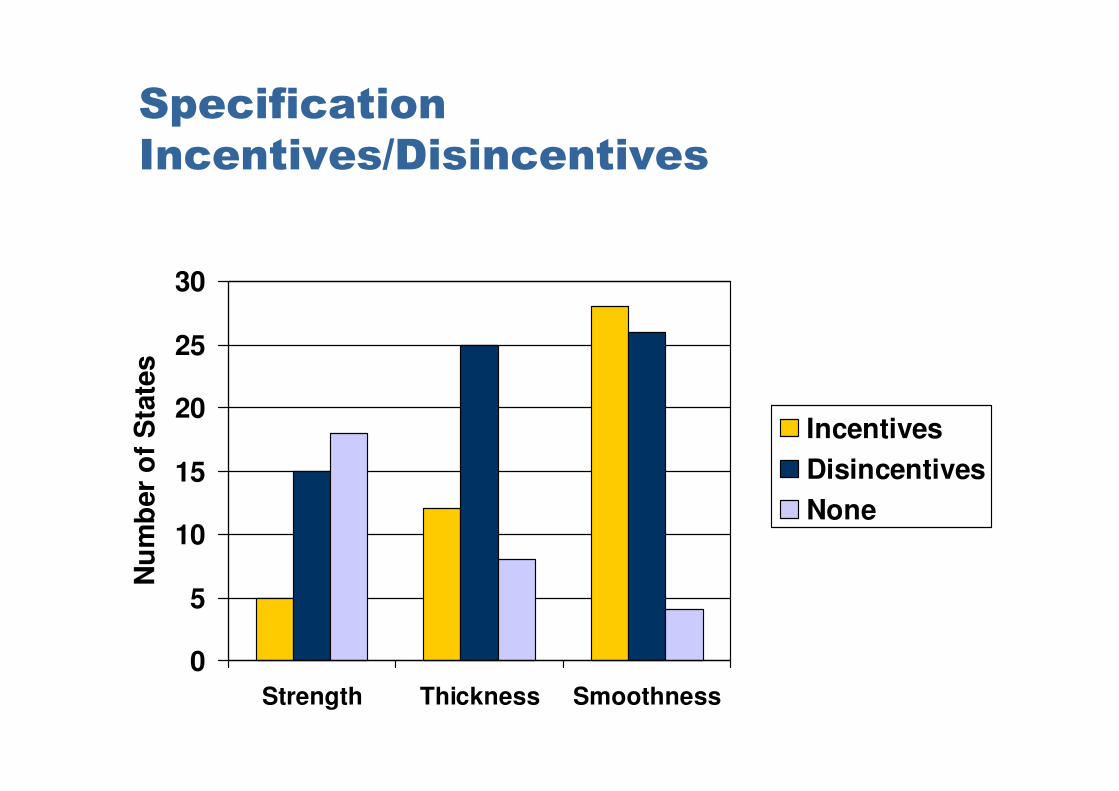
Specification
Incentives/Disincentives
0
5
10
15
20
25
30
Strength Thickness Smoothness
Nu
mb
er
of
Sta
tes
Incentives
Disincentives
None

Summary
• Key specification acceptance items
�Strength
�Thickness
�Air content
�Smoothness
• Conventional test methods well established
• New and innovative test methods evolving
�Rapid
�Nondestructive
�More test points

Acknowledgments
• U.S. Federal Highway Administration Concrete
Pavement Technology Program
• CTL Group, Inc.
• U.S. National Highway Institute
• American Association of State Highway and
Transportation Officials (AASHTO)
• American Concrete Pavement Association
• Iowa State University National Concrete
Pavement Technology Center

Questions?