control and operation of multi- terminal hvdc (mtdc) · control and operation of multi-terminal...
TRANSCRIPT

1
Control and Operation of Multi-terminal HVDC (MTDC)
and its application for offshore wind energy integration in the North Sea
Temesgen Haileselassie,Kjetil Uhlen
Department of Electrical Power Engineering,Norwegian Univerisity of Science and Technology ( NTNU)

2
Background – Why MTDC?
• Wind power and market integration: Efforts to achieve the 2020 goals (at least 20%
renewables by the year 2020)
• Suitable sites for wind farms are running out on land (or controversial). This has led to looking for new sites offshore. 1,700 MW currently operational offshore wind farms Expected to grow to 19,000 MW by 2015
• Going for offshore sites not only offers advantagesbut also brings about new challenges
Grid connection being one of them.

3
The grid integration problem in the context of the North Sea
1. Considerations for developing wind farms in the North sea as far as 100-300km away from shore HVDC stands out as the more feasible solution for such
long subsea power transmission2. Availability of offshore loads (oil & gas platforms)
in the North Sea Trends to electrify oil/gas platforms of Norway from
onshore (Troll A, Valhall) by HVDC
Multi-terminal HVDC (MTDC) is a promising solution for integration of offshore wind farms, and oil/gas platforms

4
An early stage scenario of MTDC in the North Sea
5
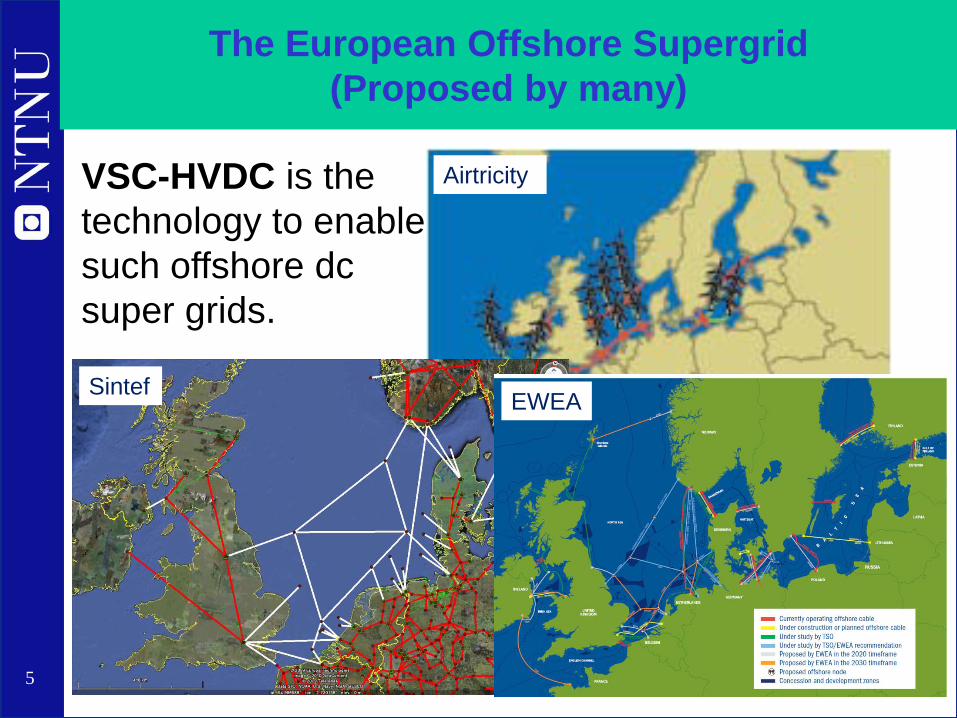
The European Offshore Supergrid(Proposed by many)
VSC-HVDC is the technology to enable such offshore dc super grids.
Sintef EWEA
Airtricity

6
TECHNOLOGY GAPSIn general: IGBT technology not widely used for DC transmission Suitability for offshore application must be
demonstrated Scaling up from the current capacity level of ≈ 400MW XLPE submarine cable systems must be proven for
operation at 300kV DC (current projects operate at 150kV)
For multi-terminal systems: EHV DC Circuit Breaker Control systems

7
Each converter should independently control:
Active Power Control in MTDC
• the active power flow (as given by the power reference signal)
• the dc bus voltage of the converter– to manage the power balance within the DC grid
• be robust to contingencies• contribute to the balance of the ac grids
(contribute to the primary frequency droop control)
Controls should also:

8
Generation station-1
Generation station-2
AggregatePgen1 Ptot
f f f
Pgen2
fmax
Power balance control in AC grids: Traditionally by frequency droop

9
VSC-HVDC station-1
VSC-HVDC station-2
Aggregate
P1 Ptot
UDC
P2
UDC,max
UDC,min
UDC UDC
Inverter mode
Rectifier mode
Power flow control in DC grid :achieved by DC voltage droop
No need for communication between terminals Many converter terminals contribute to dc voltage regulation DC analogy to distributed frequency droop control in AC
systems

10
An early stage scenario of MTDC in the North Sea

11
Sample view of the DC droop control

12
Frequency support by MTDC
• Enables sharing of primary reserves between different AC grids connected to same MTDC even though they operate asynchronously.Hence (possibly) lower cost for primary
reserves.

13
Schematics of the HVDC control
DC voltage droop
controller
Frequency droop controller
AC grid HVDC

14
Frequency support - Simulation examples
0 5 10 15 20 25 30
0.985
0.99
0.995
Freq
uenc
y (p
u)
0 5 10 15 20 25 30
0
10
20
30
Powe
r (M
W)
0 5 10 15 20 25 3049.6
49.8
50
50.2
50.4
Time (s)
DC v
olta
ge (k
V)Grid-1Grid-2
Grid-1Grid-2
0 5 10 15 20 25 30
0.985
0.99
0.995
Freq
uenc
y (pu
)
0 5 10 15 20 25 30
0
10
20
30
Powe
r (M
W)
0 5 10 15 20 25 3048.6
48.8
49
49.2
49.4
Time (s)
DC vo
ltage
(kV)
Grid-1Grid-2
Grid-1Grid-2
Before After
15
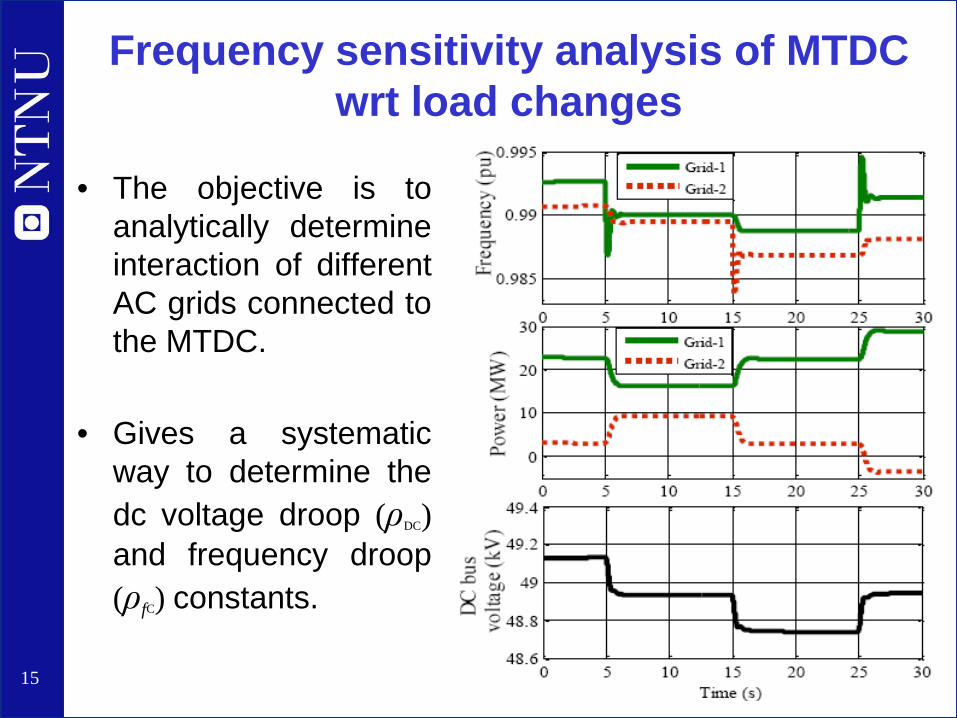
Frequency sensitivity analysis of MTDC wrt load changes
• The objective is toanalytically determineinteraction of differentAC grids connected tothe MTDC.
• Gives a systematicway to determine thedc voltage droop (ρDC)and frequency droop(ρfC) constants.
16
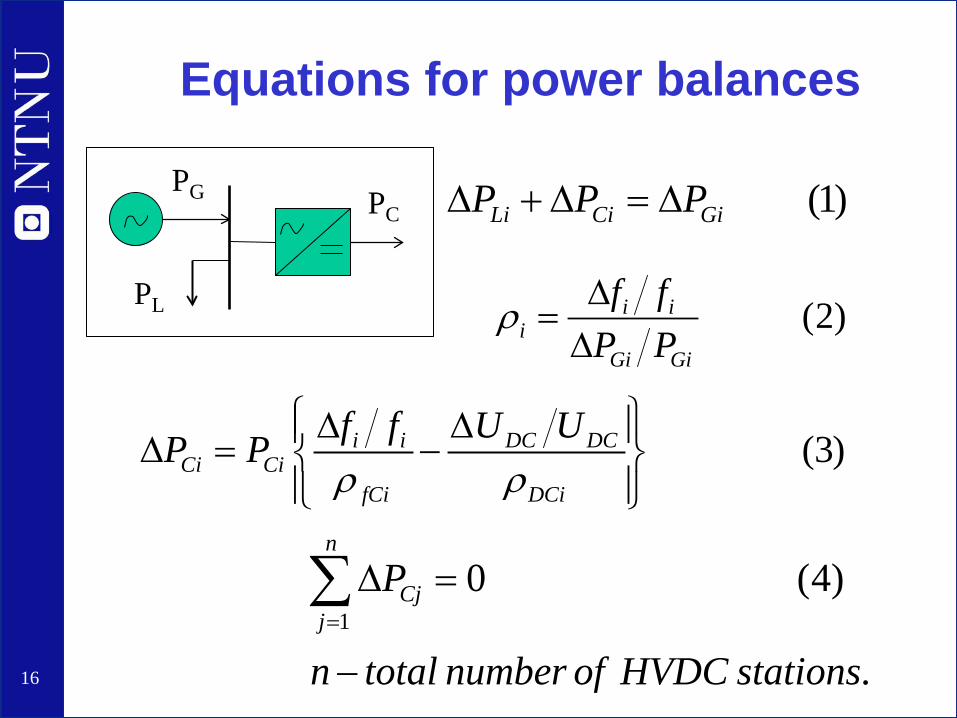
Equations for power balances
(1)Li Ci GiP P P∆ + ∆ = ∆
(2)i ii
Gi Gi
f fP P
ρ ∆=∆
(3)i i DC DCCi Ci
fCi DCi
f f U UP Pρ ρ
∆ ∆ ∆ = −
10 (4)
.
n
Cjj
P
n total number of HVDC stations=
∆ =
−
∑
PG
PL
PC

17
After solving (1)-(4) we get the frequency sensitivity expression
Frequency sensitivity matrix
1 1 2 2 1 1 1
2 1 1 2 2 2 2
1 1 2 2
1 1 2 2
C fC Ci fCi Cn fCn pu
C fC Ci fCi Cn fCn pu
i C fC i C fC i i Cn fCn ipu
n C fC n C fC n Ci fCi n npu
K q P q P q P fq P K q P q P f
q P q P K q P f
q P q P q P K f
ρ ρ ρρ ρ ρ
ρ ρ ρ
ρ ρ ρ
− ⋅ ⋅ ∆ − ⋅ ⋅ ∆ ⋅ ⋅ ⋅ ⋅ ⋅ ⋅ ⋅
⋅ − ⋅ ∆ ⋅ ⋅ ⋅ ⋅ ⋅ ⋅ ⋅ ⋅ ⋅ − ∆
1
2
L
L
Li
Ln
PP
P
P
∆ ∆ ⋅
= ∆
⋅ ∆

18
Simulation study of for a four terminal system

19
Terminal No
AC Grid size (GW)
Converter size (GW) ρfci (Converter
freq. droop)ρDCi
South Norway 12 (6 GW/Hz) 1.0 0.05000 0.025
Netherlands 6 (3 GW/Hz) 0.8 0.00833 0.025England 8 (4 GW/Hz) 1.0 0.01250 0.025Offsh. Windfarm 0.2 0.2 ∞ (insensitive) ∞ (insensitive)
Resulting sensitivity matrix:1 1
2 2
3 3
4 4
312.9 34.29 28.57 05.71 218.6 22.86 07.14 34.29 251.4 0
0 0 0 5
pu L
pu L
pu L
pu L
f Pf Pf Pf P
∆ ∆− ∆ ∆− = ∆ ∆− ∆ ∆−
UDC=400 kV, ρi =0.04

20
Simulated shut down of generation (1.64 GW) in the UK ac grid (ΔPG3=1.64 GW)
150 200 250 300 350 400 4500.95
1
Freq
uenc
y (p
u)
150 200 250 300 350 400 450
-500
0
500
Cov
erte
rpo
wer
(MW
)
150 200 250 300 350 400 450385
390
395
Time (s)
DC
vol
tage
(kV)
Nor. Neder. UK

21
Conclusions• MTDC has the potential to fully integrate power markets
between asynchronous areas.• Can be operated in a similar manner as ac grids (with the
dc voltage droop control)• No need of fast communication between converter
terminals, instead DC voltage droop control is used.• Primary reserves can be traded between asynchronous
areas (with frequency droop on the converter)• With primary reserves exchange by MTDC, cost of
operating spinning reserves can be reduced.


23
Remarks• With the proposed analytical method, the
observed and the predicted frequency changeswere in good agreement.
• The method, can further be used for small signalstability study of MTDC connected ac grids.

24
Observed
Calculated
1 1
2 2
3 3
0.00055 0.2053
0.00064 0.1068
0.00660 0.3120
0.0048
pu L
pu L
pu L
DCpu
P GWP GWP GW
U
ω
ω
ω
∆ = − ∆ =
∆ = − ∆ =
∆ = − ∆ = −
∆ = −
1 1
2 2
3 3
0.0007 0.203
0.0007 0.110
0.0066 0.314
0.0055
pu L
pu L
pu L
DCpu
P GWP GWP GW
U
ω
ω
ω
∆ = − ∆ =
∆ = − ∆ =
∆ = − ∆ = −
∆ = −
Comparison of Results