control and management of pv integrated charging facilities for
TRANSCRIPT
Chapter 2Control and Management of PVIntegrated Charging Facilities for PEVs
Preetham Goli and Wajiha Shireen
Abstract The ongoing research in the field of plug-in electric vehicles (PEVs) andthe growing global awareness for a pollution free environment, will lead to anincrease in the number of PEVs in the near future. The proliferation of these PEVswill add stress to the already overloaded power grid creating new challenges for thedistribution network. To mitigate this issue several researchers have proposed theidea of charging PEVs using renewables coupled with smart charging strategies.This chapter reviews the current literature on the state of the art infrastructureproposed for PEV charging facilities integrated with photovoltaic system. Theproposed control algorithms, various smart charging techniques and different powerelectronic topologies for photovoltaic charging facilities (PCFs) are reviewed.Studies assessing the ability of photovoltaic charging stations to minimize theloading on distribution transformers are assessed. Finally, a simple and uniqueenergy management algorithm for a PV based workplace charging facility based ondc link voltage sensing is presented. The power needed to charge the plug-inelectric vehicles comes from grid-connected photovoltaic (PV) generation or theutility or both. The efficacy of the proposed algorithm is validated through simu-lation and experimental results.
Keywords Plug-in electric vehicles (PEVs) � Photovoltaic charging facility (PCF) �Distribution network
P. Goli (&)Department of Electrical and Computer Engineering, University of Houston, Houston, USAe-mail: [email protected]; [email protected]
W. ShireenDepartment of Electrical and Computer Engineering, Department of EngineeringTechnology, University of Houston, Houston, USAe-mail: [email protected]
© Springer Science+Business Media Singapore 2015S. Rajakaruna et al. (eds.), Plug In Electric Vehicles in Smart Grids,Power Systems, DOI 10.1007/978-981-287-317-0_2
23

2.1 Introduction
With the growing global awareness for a pollution free environment, rising energycosts, PEVs are being introduced by many automotive makers. It is known that if25 % of the 176 million fleets of light vehicles in U.S were converted to PEVs, itwill rival the entire U.S power generation capacity [1]. The proliferation in PEVsrequires charging stations to fulfil their battery requirements. Though PEVs arebeing marketed with the goal of minimizing the pollution from automobiles, theenergy requirements for charging the batteries is still met by power generated byfossil fuel sources. Hence many researchers have proposed the idea of chargingPEVs using renewable energy sources like wind and photovoltaic. Many pilotprojects are also underway to charge PEVs from solar photovoltaic system [2–5].Charging stations based on wind power is still in the nascent stages though fewventures have been announced [6]. Due to the social and economic benefits,research on charging stations featuring photovoltaic system has attractedresearchers around the world.
Using solar power to charge batteries is not a new idea. It is a reliable source forcharging light duty electric vehicles such as golf carts, scooters and airport utilityvehicles [7]. Large-scale deployment of photovoltaic chargers in a parking lot isanalysed in [8]. A 2.1 kW photovoltaic charging station integrated with the utility atSanta Monica is described in [9]. An experimental control strategy for electricvehicle charging system composed of photovoltaic array, emulated power grid andprogrammable dc electronic load representing lithium ion battery emulator is pre-sented in [10]. PV parking lot charging and other business models to charge PEVswith solar energy are discussed in [11]. Economics of PV powered workplacecharging station has been studied in [12, 13]. The analysis shows the feasibility of aPV based workplace parking garage with benefits to the vehicle owner as comparedto home charging, such that the garage owner will get the payback of installationsand maintenance cost and profit within the lifetime of the PV panels. According to[13] integrating a solar collector into a parking lot would result in a much morerapid payback-period, encouraging widespread installation of solar capacity. Ref-erence [14] describes how smart control strategies can help PEVs and PV tointegrate with the present electricity systems. Co-benefits of large scale deploymentof PEVs and PV systems has been studied in [15]. The study concludes that PVprovides a potential source of midday generation capacity for PEVs, while PEVsprovide a dispatchable load for low value or otherwise unusable PV generationduring periods of low demand (particularly in the spring).
As per the National household travel survey vehicles are parked for at least 5 h inworkplaces [16]. Hence these places are favorable for developing charging stationinfrastructure but this would lead to serious overloading issues at the distributionlevel. Since upgrading of transformers is an expensive option for the utilities, thisissue needs close attention as the PEV penetration increases. Several papers havebeen published to address the overloading of distribution transformers whilecharging the PEVs [17–19]. Nevertheless, not much study has been reported to be
24 P. Goli and W. Shireen

tightly related to the case of reducing the loading on distribution transformers usinga photovoltaic system. Though few papers exist in the literature, they are mostlyconfined to residential distribution networks [20, 21]. There is plenty of parkingarea in the U.S—a reasonable fraction of which is suitable for PV installation. Thischapter reviews the current literature on the state of the art infrastructure proposedfor PEV charging facilities integrated with photovoltaic system. The proposedcontrol algorithms, various smart charging techniques and the economic benefits ofphotovoltaic charging facilities (PCFs) are reviewed. Various power electronictopologies, control algorithms and charging strategies will be discussed. It will beshown that a network of PCFs will accelerate the deployment of PEVs througheconomic and environmental benefits to the utilities and vehicle owners. The impactof grid connected photovoltaic system on the utility distribution networks is ana-lyzed. The suitability of using PV power for charging PEVs is accessed in thischapter.
Determining the size and type of PV panel is an important consideration for asolar carport. Few papers [22, 23] have recommended the use of monocrystallinesilicon as the most cost-effective solar cell type for PV charging facilities. Table 2.1shows the PV characteristics of various modules, the peak energy produced and thetotal cost of the PV module. The PV panel can be sized by taking the best and worstmonths into consideration. As described in [24], the initial cost of the PV panelwould be $20,000 when it is designed based on the worst month of the year and$10,000 when it is designed based on the best month of the year. However, for thefirst case, surplus energy can be injected into the grid, to balance the final cost.
2.2 Impact of PEV Charging on the Distribution System
Large-scale penetration of PEVs can have a detrimental and destabilizing effect onthe electric power grid. With the variation in demand, the production of power canvary significantly. Variation in charging time of PEVs can result in distinct dif-ferences in fuels and generating technologies [25]. Figure 2.1 illustrates the impactof charging one million PEVs on the Virginia—Carolinas electric grid in 2018 onthe various generation technologies. As shown in Fig. 2.1, at low specific powerand late in the evening, coal was the major fuel used, while charging more heavily
Table 2.1 PV characteristics [23]
PV type Module price($/WP)
Efficiency (%) Peak energy (WP) Total costof PV ($)
Crystalline silicon 2.14 22 264 565
Polycrystalline silicon 1.74 15.5 186 324
Thin film 0.93 12 144 134
2 Control and Management of PV Integrated … 25

during peak times led to more use of combustion turbines and combined cycleplants. Since the initial deployment of PEVs is assumed to be clustered to a par-ticular neighborhood, many authors have focused their research on the study ofdistribution transformer impacts. Depending upon the time, place of vehiclecharging, various charging methods and the charging power levels there could beseveral ramifications on the distribution network. Various analytical techniques anddifferent simulation tools were employed by several authors to estimate the trans-formers loss-of-life, average lifetime and harmonic losses. The percentage oftransformers loss-of-life and average lifetime are important factors to be consideredwhile studying the charging behavior of PEVs on future distribution system. Highpenetration of PEVs in the future will increase the loss-of-life factor of distributiontransformers [26–29].
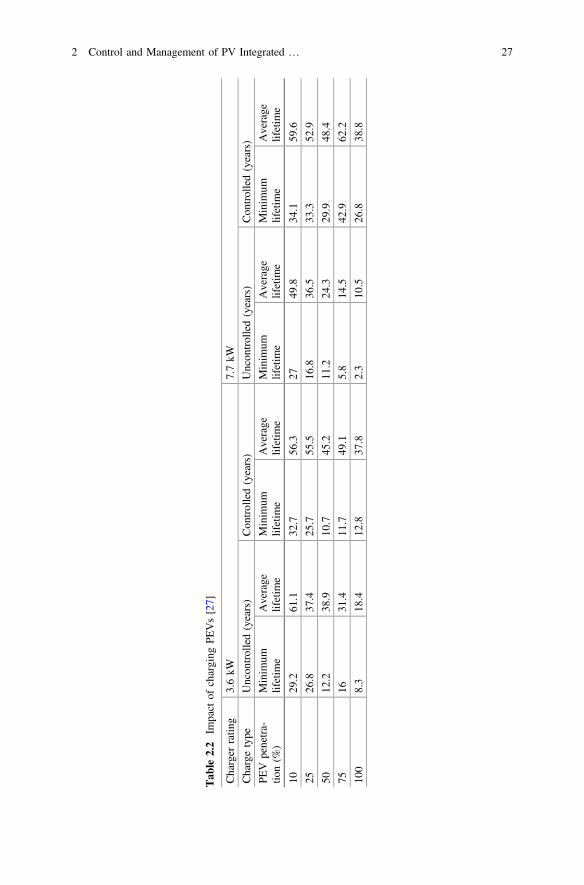
The impact of controlled and uncontrolled charging of PEVs on the averagelifetime of a transformer is described in [24, 26]. As per [24], the average lifetime ofa transformer is reduced by 4–20 % under uncontrolled charging for a PEV pen-etration of 10 %. At 50 % penetration of PEVs, the average lifetime is reduced by200–300 % with uncontrolled charging. On the other hand controlled chargingincreases the lifetime by 100–200 % with respect to uncontrolled charging for 50 %penetration of PEVs. Plug-in electric vehicle charging rates can have a significantimpact on the lifetime of a transformer [24, 25]. Table 2.2 summarizes the sensi-tivity of transformer lifetime to different charging rates (3.6 and 7.7 kW) undercontrolled and uncontrolled charging for various levels of PEV penetration. Asexpected, transformer life degradation is exacerbated when the charging rate isincreased from 3.6 to 7.7 kW.
The percentage of transformers loss-of-life can be minimized through distributedcharging and controlled off-peak charging which requires coordination amongutilities, customers and charging stations. Simulation results in [17] show thatdistributing the load profile of the battery charging helps to minimize the distri-bution transformer loss-of-life. Power management of the PEV battery chargeprofile can help manage the loss-of-life of the distribution transformer. Controlled
Fig. 2.1 Generation shares by plant type for PEV charging level and timing [25]
26 P. Goli and W. Shireen
Tab
le2.2
Impact
ofcharging
PEVs[27]
Charger
ratin
g3.6kW
7.7kW
Chargetype
Uncon
trolled(years)
Con
trolled(years)
Uncon
trolled(years)
Con
trolled(years)
PEV
penetra-
tion(%
)Minim
umlifetim
eAverage
lifetim
eMinim
umlifetim
eAverage
lifetim
eMinim
umlifetim
eAverage
lifetim
eMinim
umlifetim
eAverage
lifetim
e
1029
.261
.132
.756
.327
49.8
34.1
59.6
2526
.837
.425
.755
.516
.836
.533
.352
.9
5012
.238
.910
.745
.211
.224
.329
.948
.4
7516
31.4
11.7
49.1
5.8
14.5
42.9
62.2
100
8.3
18.4
12.8
37.8
2.3
10.5
26.8
38.8
2 Control and Management of PV Integrated … 27

off-peak charging can shift PEVs charging load to an off-peak time. Usuallycharging PEVs at night time is proposed as the best way to mitigate the loss-of-lifeissues of distribution transformers. However, PEVs can also introduce a new peakor near peak in early off-peak time. Generally, the impact of extra load on trans-formers in summer is much greater than that in winter. However, some wintermornings with peak load may be an exception. Charging from midnight throughearly morning in those days may exert strong impact on transformers. Figure 2.2describes this effect by taking the average residential load for East Texas intoconsideration. As shown in the figure for a particular day in winter, February 11th,the load consumed in the early morning is higher than that in summer days.Therefore, it is not always appropriate to charge electric vehicles at 1 am in thosedays. The required control strategy should depend on the actual load profile in aparticular area for a particular time period.
2.3 Mitigating the Impact of PEV Chargingon the Distribution System
To mitigate the issue of transformer loss-of-life due to PEV charging, integration ofrenewables like rooftop PV systems into the existing power grid has been proposed.In [30], a case study for the year 2030 was built based on demand increase,forecasted PEV and DG units. The results showed that PEV battery charging wouldprove onerous for the constraints studied. DG penetration would be able to providesupport for PEV battery charging but PEV battery charging management would benecessary to minimize the impact in order to reach high levels of PEV penetration.
6Winter (Jan.1st)
Summer (Aug.18th)
5
4
3
2
1
0 0 1 2 3 4 5 6 7 8 9 10
Time of The day (hr)
Average Residential Load For East Texas L
oad
(kw
)
11 12 13 14 15 16 17 18 19 20 21 22 23 24
Winter (Feb.11th)
Spring (Mar.1st)
Fall (Nov.1st)
Fig. 2.2 15 min interval data of average residential individual customer in East Texas [26]
28 P. Goli and W. Shireen

The possibility of smoothing out the load variance in a household microgrid byregulating the charging patterns of family PEVs is investigated in [31]. A case studyis presented, which demonstrates that, by regulating the charging profiles of thePEVs, the variance of load power can be dramatically reduced. Integration ofresidential PV system with PEVs is studied in [32]. A residential PV system wassimulated for various charging schemes of PEVs and the results are shown inFig. 2.3. Several cases with different combinations of PV, PEV, V2H (Vehicle toHome i.e. discharge of PEV) and various charging schemes were analyzed. Case 1describes a residential facility without PV and PEV. Case 2 describes a residentialfacility integrated with rooftop PV system without PEV. Therefore, these 2 casesanalyze the effects of using PV while using gasoline vehicles instead of PEVs. Case3 represents a residential facility with PV and PEV without V2H capabilities. Cases4–6 have all the facilities (i.e. PV, PEV and V2H capabilities) but their charge-discharge schemes are different. As shown in Fig. 2.3 the local consumption rate ofPV output increased by 1.7 % when gasoline vehicles are replaced with PEVs. Onthe other hand the rate of PV utilization increased by 8.6 % when the chargingscheme changed from fixed (fixed target of SOC) to variable (variable target valueof SOC).
The integration of PV rooftop in PCFs can relieve the burden on the distributionnetworks, by reducing the effective load seen by the distribution grid peak charging,as well as supplying power to the grid when excess power is generated by PVrooftops. A PV parking lot for PEVs is proposed in [33], in which the PEVs can becharged from the PV source as well as the distribution grid. Mathematical modelsare developed to estimate the electric power capacity for PV parking lot. Anevaluation of impacts resulting from expected scenarios are performed throughstochastic sequential simulations of the distribution system with load and PVgeneration in [34]. Figure 2.4 shows the LOL (loss-of-life) experienced at a par-ticular distribution transformer, for change in stochastic load and PV generation
Fig. 2.3 The rate of PV utilization [32]
2 Control and Management of PV Integrated … 29

units. It is evident from the figure that rooftop PV coupled with PEVs can reduceLOL of the distribution transformer. These studies have shown that PV generationcoupled with PEV charging can delay and reduce the temperature rise of distri-bution transformers.
2.4 Proposed Architectures for PV Based PEV ChargingFacilities
The charging units for PEVs can be either on-board or off-board. In case of an off-board charger, the charger is an external unit while in the case of an on-boardcharger it is a component of the vehicle. On-board chargers are supplied with acpower and they consist of an AC/DC rectifier, DC/DC boost converter for powerfactor correction and a DC/DC converter to charge the battery as shown in Fig. 2.5.Currently AC charging is being employed to charge PEVs by means of on-boardchargers. The major drawback of this technology is that it does not support fastcharging as it is required to increase the power capability of the on-board chargerthereby increasing the cost and weight of the PEV. Hence to support fast charging
0.02
0.018
0.016
0.014
0.012
0.01
0.003
0.006
0.004
0.002
00 5 10 15 20
Base Load
Base Load + PEV
25
Time (hours)
Base Load + PEV + PVTX Rated Loss Of Life
Tran
sfor
mer
LoL
%
Fig. 2.4 Stochastic distribution transformer loss of life [34]
Fig. 2.5 Conventional PEV charger
30 P. Goli and W. Shireen

of PEVs off-board chargers are proposed which directly supply dc power to thePEV charging inlet. It is to be noted that in case of an off-board charger the entirepower conversion (AC/DC) takes place in an external unit and therefore it isfeasible to increase the ratings of the power converters in order to support fastcharging.
AC system is being used since years for power distribution and there are welldeveloped infrastructure-standards and technologies. DC system on the other handhas many advantages, starting with the fact that overall efficiency of the systemcould be higher and it facilitates the integration of renewable energy sources withfewer power converters. Since PV arrays generate dc power, a charging facilityfeaturing PV power facilitates the charging of PEVs from a dc bus which is moreeffective, economical and efficient since it does not involve more power conversionstages unlike AC charging. Various methods have been proposed for integratingPEV chargers within a photovoltaic system. Several power electronic topologies fora PCF have been proposed in the literature based on the type and the number ofconverters which are classified as:
A. Centralized architectureB. Distributed architectureC. Single stage conversion with Z-converter
A. Centralized architectureDetailed block diagram representing the centralized architecture is shown inFig. 2.6. It consists of a central DC/DC boost converter which performs the functionof maximum power point tracking. The DC/DC chargers are integrated with the PVcharging facility at the dc link. Multiple PEVs can be charged by increasing thecorresponding ratings of PV panels and the associated power converters. Eachparking spot must have a dedicated DC/DC buck converter which is connected tothe dc link. This configuration is suitable for charging stations in the range ofseveral kilowatts. It is applicable for charging vehicles like golf carts, campus utilityvehicles etc. which commute for very short distances with low battery capacities.Battery switch station powered by PV is a good candidate for adopting centralizedarchitecture. But this kind of configuration does not support fast charging since
Fig. 2.6 Centralized architecture
2 Control and Management of PV Integrated … 31
installation of a very high power DC/DC converter is very expensive and it isvulnerable to single fault shutdown.
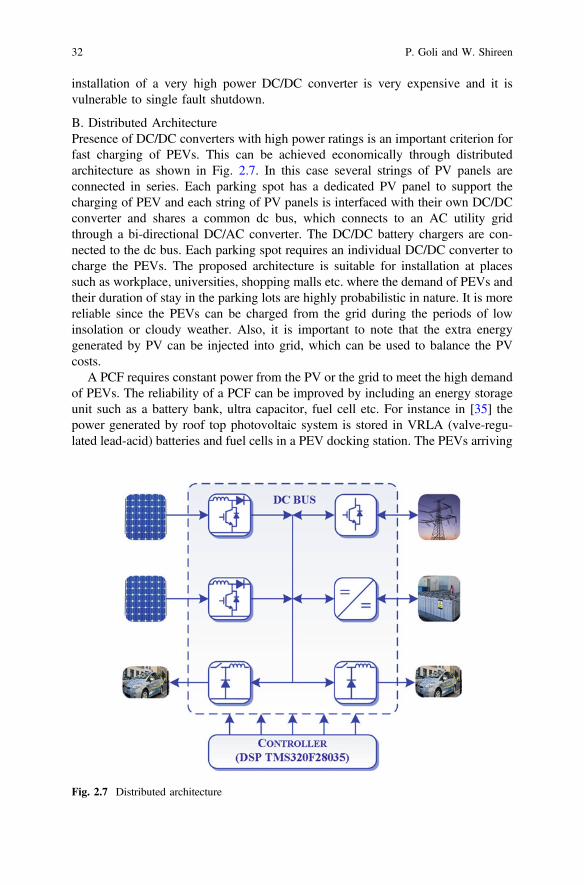
B. Distributed ArchitecturePresence of DC/DC converters with high power ratings is an important criterion forfast charging of PEVs. This can be achieved economically through distributedarchitecture as shown in Fig. 2.7. In this case several strings of PV panels areconnected in series. Each parking spot has a dedicated PV panel to support thecharging of PEV and each string of PV panels is interfaced with their own DC/DCconverter and shares a common dc bus, which connects to an AC utility gridthrough a bi-directional DC/AC converter. The DC/DC battery chargers are con-nected to the dc bus. Each parking spot requires an individual DC/DC converter tocharge the PEVs. The proposed architecture is suitable for installation at placessuch as workplace, universities, shopping malls etc. where the demand of PEVs andtheir duration of stay in the parking lots are highly probabilistic in nature. It is morereliable since the PEVs can be charged from the grid during the periods of lowinsolation or cloudy weather. Also, it is important to note that the extra energygenerated by PV can be injected into grid, which can be used to balance the PVcosts.
A PCF requires constant power from the PV or the grid to meet the high demandof PEVs. The reliability of a PCF can be improved by including an energy storageunit such as a battery bank, ultra capacitor, fuel cell etc. For instance in [35] thepower generated by roof top photovoltaic system is stored in VRLA (valve-regu-lated lead-acid) batteries and fuel cells in a PEV docking station. The PEVs arriving
Fig. 2.7 Distributed architecture
32 P. Goli and W. Shireen

at the docking station can be charged from two separate tracks i.e. using the energyfrom the VRLA batteries or the fuel cells. The use of storage capacity in PCFs hasthe following advantages [36]:
• Efficient use of renewable energy sources• Maximization of renewable energy sources contribution• Better demand and production match, better auxiliary service supply and
improved overall reliability
The core idea of including an ESU (energy storage unit) is that the power demandby PEVs can be either supplied by the PV or the utility or through a local energystorage unit. Energy derived from the ESU can charge the PEVs during certaincontingencies such as islanding condition without the availability of PV power. Itfacilitates the charging of PEVs using minimum energy from the grid. The chargingstation appears as a dc microgrid with local generation from the PV system, PEVs’as loads and battery bank representing the storage system.
C. Single stage conversion with Z-converterThe double stage conversion described in the above architectures is replaced by asingle stage using a Z-converter [22] as shown in Fig. 2.8. It does not require anadditional DC/DC converter for each charging spot and a single DC/DC converteris employed to provide galvanic isolation. The Z-converter has double modulationcapability, and can shape the grid current while simultaneously regulating PEVbattery charging. The unit can be employed for both power absorption and injec-tion, with simultaneously controlled battery charging. This ensures close to unitypower factor for all operating modes and power flow paths; achieving this with asingle conversion stage can be considered a unique advantage of the Z-converter.Furthermore, this topology possesses inherent buck-boost capability, allowingincreased voltage range on the PV or grid. Despite the single conversion stage,reliability, rather than efficiency or cost, is the strong point of the Z-topology. Alsothe single phase power processed by the Z-converter consists of 120 Hz double linefrequency ripple. This ripple can be mitigated by placing an additional decouplingcapacitor across the PV source which introduces possible deviation from perfectlyconstant power extraction at the PV panels.
Fig. 2.8 Single stage conversion with Z-converter
2 Control and Management of PV Integrated … 33

2.5 Control Strategies
Workplace based photovoltaic charging facilities and residential PV charging arethe two available options for charging PEVs using solar power. Depending on thesolar irradiation, PEVs can be charged either from the photovoltaic or the distri-bution grid or both. The solar charging station should distribute the power availableat the PV panels to the PEVs effectively and safely. Typically PEVs arrive at thecharging facility with different State-of-Charge (SOC). More than often, the amountof PV power available to charge multiple PEVs is limited. Furthermore, the PVsource is stochastic in nature, its power characteristic is nonlinear and the PEVbatteries to be charged should be within certain voltage and current limits. There-fore, this process necessitates intelligent control of the power conditioning unit tomanage the direction of power flow in PV integrated charging stations. Severalalgorithms have been proposed in the literature which differ significantly based onthe type and location of the PCF. The algorithms also differ based on the variouscontrol parameters such as PV power, load demand, state-of-charge etc. Accord-ingly they can be classified as follows:
A. Residential Photovoltaic ChargingB. Battery Switch StationsC. Workplace Photovoltaic Charging
A. Residential Photovoltaic ChargingFew authors [37–40] have proposed an architecture for a grid-connected residentialphotovoltaic system that can be used to charge PEVs as well as to supply theexisting household loads. The control algorithms depend on the power generated bythe PV and the SOC of the PEV battery. Raul et al. [39] proposed a residential loadcoordination mechanism to charge PEVs. Depending on the load demand of thedistribution transformers, the PEVs can be charged using renewable energy (PV/Wind) or the power from the grid. Each household is installed with a rooftop PVsystem and a small scale wind turbine. A residential microgrid composed of rooftoppanels and a biodiesel generator to charge PEVs and supply AC/DC householdloads is described in [41]. In order to share the load among the sources, master-slave control method is employed. The operation of the residential microgriddepends on the PV power, load demand, SOC of the battery storage and tariff set bythe utility. Most of the PEVs are not available for charging during daytime atresidential facilities. Hence, this process demands for an additional component inthe form of an energy storage unit which might not be economically attractive foran individual home owner. Residential charging is advantageous for householdswith more than one PEV.
B. Battery Switch Stations:A PV based battery control strategy for charging multiple batteries in a solar batterycharging station (SBCS) is proposed in [42]. The architecture of the SBCS is similarto the one shown in Fig. 2.6 but the DC/DC chargers are replaced by bi-directionalswitches. The proposed control strategy first charges each individual battery until
34 P. Goli and W. Shireen

they reach the same voltage level and then charges the multiple batteries in parallelsimultaneously according to the battery charging period and the available solarenergy. This control strategy eliminates the use of multiple DC/DC converters perbattery connection, making the SBCS less complicated and economical. Thoughbeing economical, the proposed architecture does not consider the scenarios whenthe PV panel is not generating any power or generating power in excess. Hence itcannot be considered for charging PEVs. A PV-based battery switch station (BSS)is proposed in [43]. The energy exchange strategy depends on the battery swappingdemand of the PEVs and power generated by the PV. An algorithm is proposed tocharge PEV batteries using the maximum energy from PV.
C. Workplace Photovoltaic ChargingIn few cases, authors have proposed the idea of inserting a DC/DC battery chargerat the dc link of the grid-connected PV system. By measuring the power generatedby the PV and the power demand of the PEV, the control algorithm ensures thecharging of the PEV battery from the appropriate source as described in [44]. Basedon the imbalance between the PV power and the load demand, various possiblescenarios are described. In case of [45], the power flow in a PV parking lot ismanaged through a set of computer controlled relays. PV panels of different ratingsare interfaced with PEV chargers and the power grid through computer controlledrelays. Depending on the irradiation levels, the relays direct the entire PV power tothe PEVs or the grid or both. Hamilton et al. [46, 47] proposed an extension to thismethod for a modular dc PV charging station. Several PV panels are interfaced withthe dc bus through a set of DC/DC converters. The DC/DC converter intelligentlycontrols the power flow to the PEVs based on a certain preset limits of the dc busvoltage. Based on the preset limits the energy conversion unit facilitates three wayenergy flow among the power grid, PV modules and PEVs.
The concept of dc bus signalling has been proposed by several authors toschedule power to dc loads in a microgrid [48–50]. Few of them have extended thisconcept to charge PEVs in a microgrid environment [48, 49]. A smart chargingstation architecture integrated with PV power is proposed in [51, 52]. The smartcharging station can operate in standalone mode and grid-connected mode. Theswitching between various modes is facilitated by the variation in dc link voltagelevels induced due to the change in solar insolation. During the period of low solarinsolation and peak load on distribution transformer, the controller shifts thecharging of PEVs to non-peak period. The proposed control algorithm is simple asit involves only a single parameter i.e. dc link voltage to manage the direction ofpower flow in the charging station. It facilitates the charging of PEVs using min-imum energy from the grid without any adverse impacts on the distributiontransformer. The following sections explain the concept of dc link voltage sensingand its application for control and management of PV powered charging facilities.
2 Control and Management of PV Integrated … 35
2.5.1 Concept of DC Link Voltage Sensing
The primary requirement for a microgrid operation is to maintain the common dcbus voltage within an acceptable range. The terminals within a microgrid can begenerally categorized into four types: generation, load, energy storage unit (ESU),and grid connection using voltage-source converters (VSCs). These four types ofterminals can be further divided into two groups in terms of their contribution tosystem control and operation which are the power terminal and the slack terminal.
A power terminal is the one which outputs or absorbs power to/from the mi-crogrid on its own and usually does not take the system’s need into account.Typical examples would be variable dc loads (PEVs) and nondispatchable (vari-able) generation, such as wind turbines and photovoltaic based generations, whenoperating purely according to environmental conditions. Conversely, a slack ter-minal is the one which is responsible for balancing the power surplus/deficit causedby power terminals and maintaining stable system operation. Typical examplesinclude a grid-connected VSC terminal (G-VSC) and ESU when they are activelysupporting the dc microgrid system.
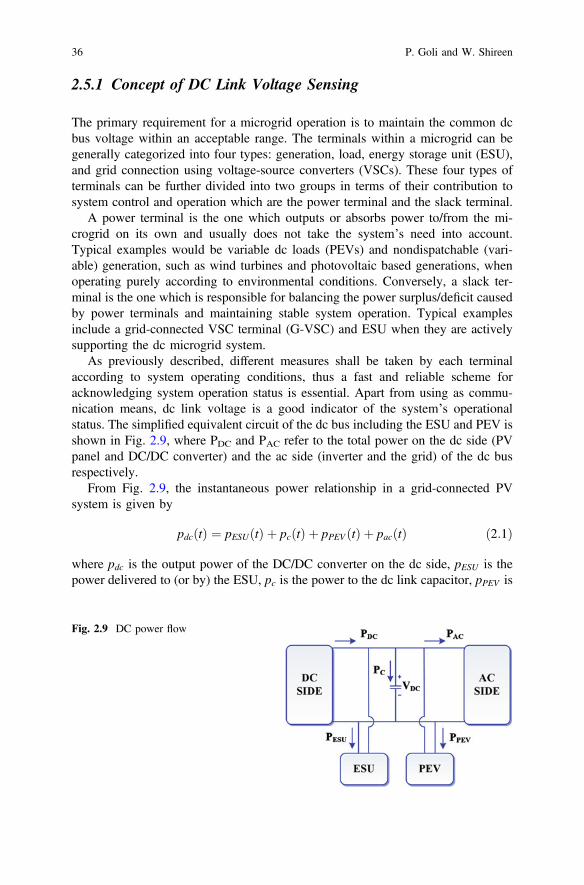
As previously described, different measures shall be taken by each terminalaccording to system operating conditions, thus a fast and reliable scheme foracknowledging system operation status is essential. Apart from using as commu-nication means, dc link voltage is a good indicator of the system’s operationalstatus. The simplified equivalent circuit of the dc bus including the ESU and PEV isshown in Fig. 2.9, where PDC and PAC refer to the total power on the dc side (PVpanel and DC/DC converter) and the ac side (inverter and the grid) of the dc busrespectively.
From Fig. 2.9, the instantaneous power relationship in a grid-connected PVsystem is given by
pdc tð Þ ¼ pESU tð Þ þ pc tð Þ þ pPEV tð Þ þ pacðtÞ ð2:1Þ
where pdc is the output power of the DC/DC converter on the dc side, pESU is thepower delivered to (or by) the ESU, pc is the power to the dc link capacitor, pPEV is
Fig. 2.9 DC power flow
36 P. Goli and W. Shireen

the power consumed by the plug-in electric vehicles, and pac is the power extractedby the inverter on the ac side. The instantaneous ac power (output of the inverter)can be written as
pgrid tð Þ ¼ ðVm sinxtÞðIm sinxtÞ ð2:2Þ
¼ VmIm2
� VmIm2
cosxt ð2:3Þ
where pgrid is the power injected into the grid, Vm is the amplitude of the phasevoltage and Im is the amplitude of the grid current. The ac power includes a dc termand a second-order ripple in the dc voltage. The average input power to the ac sidecan be written as
PAC ¼ VDCIAC ð2:4Þ
where IAC is the average input current to the ac side (i.e. on the dc side of theinverter). Equating the average power on the input of ac side to the dc term on theoutput of ac side
VmIm2
¼ gVDCIAC ð2:5Þ
where g is the efficiency of the inverter. If Vdc and Vdcðref Þ are the actual andreference values of dc link voltage, respectively, the change in energy DEdc storedin the dc link capacitor Cdc can be written as
DEdc ¼ cdc2
V2dcðref Þ �V2
dc
� �ð2:6Þ
To inject the PV power to the grid while maintaining a constant Vdc, the fol-lowing energy balance should be satisfied:
DEdc ¼ Tðpdc � pesu � pPEV � VmIm2g
Þ ð2:7Þ
where T is the time period of ac supply.Combining (2.6) and (2.7)
V2dc ¼ V2
dcðref Þ �2TCdc
pdc � pPEVð Þ þ 2TCdc
pdc þ 2TCdcg
VmIm ð2:8Þ
Vdc ¼ffiffiffiffiffiffiffiffiffiffiffiffiffiffiffiffiffiffiffiffiffiffiffiffiffiffiffiffiffiffiffiffiffiffiffiffiffiffiffiffiffiffiffiffiffiffiffiffiffiffiffiffiffiffiffiffiffiffiffiffiffiffiffiffiffiffiffiffiffiffiffiffiffiffiffiffiffiffiffiffiffiffiffiffiffiffiffiffiffiffiffiffiffiffiffiffiffiffiffiV2dcðref Þ �
2TCdc
pdc � pPEVð Þ þ 2TCdc
pESU þ 2TCdcg
VmIm
sð2:9Þ
2 Control and Management of PV Integrated … 37

Vdc ¼ffiffiffiffiffiffiffiffiffiffiffiffiffiffiffiffiffiffiffiffiffiffiffiffiffiffiffiffiffiffiffiffiffiffiffiffiffiffiffiffiffiffiffiffiffiffiffiffiffiffiffiffiffiffiffiffiffiffiffiffiffiffiffiffiffiffiffiffiffiffiffiffiffiffiffiffiffiffiffiffiffiffiffiffiffiffiffiffiffiffiffiffiffiffiffiffiffiffiffiffiffiffiffiffiffiffiffiffiffiffiV2dcðref Þ �
2TCdc
gboostpPV � pPEVð Þ þ 2TCdc
pESU þ 2TCdcg
VmIm
sð2:10Þ
where gboost is the efficiency of the DC/DC converter on the dc side.From (2.10), it is clear that the fluctuations in PV power due to the change in
solar irradiance causes variations in the dc link voltage. For a workplace basedcharging facility PEVs can be assumed to stay in the parking lot from morning tillevening. Hence the variation in PEV load is considered.
Also from (2.7), the charging power of the dc capacitor can be written as
pc ¼ pdc � pesu � pPEV � VmIm2g
ð2:11Þ
12cv2dc ¼ pdc � pesu � pPEV � VmIm
2gð2:12Þ
cvdcdvdcdt
¼ pdc � pesu � pPEV � VmIm2g
ð2:13Þ
From 2.13, it can be inferred that a constant dc voltage indicates a balancedpower flow among all the terminals, and a rising or dropping dc voltage indicatespower surplus or deficit, respectively. Since the dc voltage can be used as aneffective indicator of power-flow status, the control scheme of the proposedcharging facility can be designed according to dc link voltage variation. Assumingthe PEV demand to be constant over a period of time, the variation in dc linkvoltage occurs only due to the fluctuation in solar insolation. The operationalvoltage range can be divided into several levels. Based on the voltage level thecharging facility has several modes of operation.
Figure 2.10 shows the variation in the dc link voltage and the power from the PVarray with step changes in irradiation. A PV panel of rating 5.5 kW was modeled inMatlab taking the battery capacity of a single PEV into consideration. The referencedc link voltages have been chosen taking into consideration the change in sunconditions from early morning to late evening. As shown in Fig. 2.10 the PV arraystarts delivering power when the dc link voltage is greater than 50 V. At 250 V thePV system delivers 4,500 W which is the power requirement of standard PEVbattery. Between 300 and 350 V the power delivered by the PV array is greater than5,000 W, exceeding the power requirement of the PEV. This excess power can besent to the grid. By taking the dc link voltage and the corresponding powerdelivered by the PV array into consideration, three reference voltage levels havebeen chosen as VDC-1 = 50 V, VDC-2 = 250 V and VDC-3 = 350 V. The modes ofoperation of the charging station are classified depending on the change in the dclink voltage. As the dc link voltage is the only criteria for switching betweenvarious modes the overall complexity of the system is reduced.
38 P. Goli and W. Shireen

2.6 Power Management Algorithm for PVCharging Facility
The detailed circuit configuration for the proposed workplace based chargingfacility is shown in Fig. 2.11. The architecture consists of several strings of PVpanels interfaced to their own DC/DC converters which share a common dc bus.The DC/DC boost converter performs the function of maximum power pointtracking (MPPT) to facilitate the operation of PV panel at the maximum powerpoint. The energy storage unit (ESU) is connected to the dc bus via a bi-directionalDC/DC buck-boost converter. The ESU will support the charging of PEVs whenthere is no power available either from the grid or the PV. The battery pack in theESU can be charged either from the grid during off peak hours or from the PV afterall the PEVs have been charged in the charging facility. DC/DC buck converterconnected to the dc bus controls the charging of the PEV. The control descriptionshown for the charging facility in Fig. 2.11 is based on the requirements for twoPEVs. Multiple PEVs can be charged by having separate buck converters installedfor each charging point. The charging facility is connected to the power distributionnetwork through a DC/AC bi-directional grid tied converter.
The control unit monitors and controls the power flow between the source andPEV. As shown in Fig. 2.11 the control unit generates the switching signals tocontrol the various power converters in the charging facility based on the voltageand current values sensed by the voltage and current sensing units. VPV, voltageacross the PV array and IPV, the current flowing from the PV array are used toimplement MPPT by means of incremental conductance algorithm. VDC is themagnitude of the voltage at the dc bus, VB1 and VB2 are the detected batteryvoltages of the PEVs which give a measure of the state-of-charge (SOC) while
Fig. 2.10 Change in the dc link voltage and power generated by the PV with the change in suncondition
2 Control and Management of PV Integrated … 39

VESU gives the measure of the SOC of the ESU. IDMD represents the loadingcondition of the distribution transformer, Igrid is the current fed into the grid by theDC/AC converter and VGrid is the grid side voltage.
2.6.1 Modes of Operation
The operation of the charging station can be categorized into four modes: Mode-1(grid-connected rectification), Mode-2 (PV charging and grid-connected rectifica-tion), Mode-3 (PV charging) and Mode-4 (grid-connected inversion). A set ofvariables IDMD, IDMD-max, VDC-1, VDC-2, VDC-3, VB and VBH are used to describe themodes of operation. IDMD represents the distribution transformer load and IDMD-max
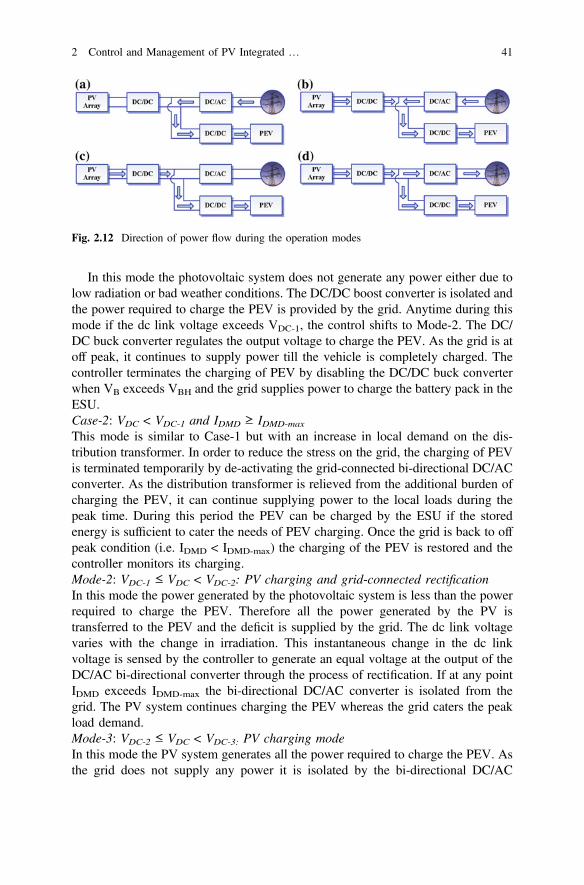
represents the peak load condition of the transformer. VDC is the voltage at the dc bus.VDC-1, VDC-2 and VDC-3 are the three chosen reference voltage levels of the dc bus.VB and VESU are the detected battery voltages of the PEV and the ESU. VBH is thebattery voltage corresponding to the threshold value of the state-of-charge (TSOC).The charging of PEV should be terminated once the battery voltage VB is equal toVBH. Figure 2.12 shows the direction of power flow during various modes ofoperation of the charging station.
The four modes of operation are described as follows:Mode-1: VDC < VDC-1: Grid-connected rectificationCase-1: VDC < VDC-1 and IDMD < IDMD-max
Fig. 2.11 Detailed circuit configuration of the proposed architecture
40 P. Goli and W. Shireen
In this mode the photovoltaic system does not generate any power either due tolow radiation or bad weather conditions. The DC/DC boost converter is isolated andthe power required to charge the PEV is provided by the grid. Anytime during thismode if the dc link voltage exceeds VDC-1, the control shifts to Mode-2. The DC/DC buck converter regulates the output voltage to charge the PEV. As the grid is atoff peak, it continues to supply power till the vehicle is completely charged. Thecontroller terminates the charging of PEV by disabling the DC/DC buck converterwhen VB exceeds VBH and the grid supplies power to charge the battery pack in theESU.Case-2: VDC < VDC-1 and IDMD ≥ IDMD-max
This mode is similar to Case-1 but with an increase in local demand on the dis-tribution transformer. In order to reduce the stress on the grid, the charging of PEVis terminated temporarily by de-activating the grid-connected bi-directional DC/ACconverter. As the distribution transformer is relieved from the additional burden ofcharging the PEV, it can continue supplying power to the local loads during thepeak time. During this period the PEV can be charged by the ESU if the storedenergy is sufficient to cater the needs of PEV charging. Once the grid is back to offpeak condition (i.e. IDMD < IDMD-max) the charging of the PEV is restored and thecontroller monitors its charging.Mode-2: VDC-1 ≤ VDC < VDC-2: PV charging and grid-connected rectificationIn this mode the power generated by the photovoltaic system is less than the powerrequired to charge the PEV. Therefore all the power generated by the PV istransferred to the PEV and the deficit is supplied by the grid. The dc link voltagevaries with the change in irradiation. This instantaneous change in the dc linkvoltage is sensed by the controller to generate an equal voltage at the output of theDC/AC bi-directional converter through the process of rectification. If at any pointIDMD exceeds IDMD-max the bi-directional DC/AC converter is isolated from thegrid. The PV system continues charging the PEV whereas the grid caters the peakload demand.Mode-3: VDC-2 ≤ VDC < VDC-3: PV charging modeIn this mode the PV system generates all the power required to charge the PEV. Asthe grid does not supply any power it is isolated by the bi-directional DC/AC
Fig. 2.12 Direction of power flow during the operation modes
2 Control and Management of PV Integrated … 41

converter. The controller ensures that the PEV is not over charged by terminating itscharging once VB exceeds VBH (voltage corresponding to 95 % state of charge ofthe PEV battery). This mode occurs as long as the dc link voltage is in betweenVDC-2 and VDC-3.Mode-4: VDC-link ≥ VDC-3: PV charging mode and Grid inversion modeThe PV array generates excess power once the dc link voltage exceeds VDC-3. Thisadditional power generated by the PV array is sent to the grid via the bi-directionalDC/AC converter. Once the PEVs are charged, all the power from the PV source issent to the grid. The mode then resembles normal operation of PV generationsystems.
2.6.2 Control Description
2.6.2.1 DC/DC Boost Converter
The control method for DC/DC boost converter is summarized in Fig. 2.13.A single phase boost stage is used to boost the PV voltage and track the MPP of thepanel. To track the MPP, input voltage (VPV) and input current (IPV) are sensed.The two values are then used by the MPPT algorithm. The MPPT is realized usingan outer voltage loop that regulates the input voltage i.e. panel voltage by modu-lating the current reference for the inner current loop of the boost stage.
Two 2-pole 2-zero controllers, GV(S) and GI(S) are used to close the inner DC-DC boost current loop and the outer input voltage loop. MPPT algorithm providesreference input voltage, VMPPT to the boost stage to enable panel operation atmaximum power point. The sensed input voltage is compared with the voltagecommand (VMPPT), generated by MPPT controller, in the voltage control loop. Thevoltage controller output, Iboostsw_Ref is then compared with the output current(Iboostsw) feedback in the current controller. The current loop controller outputdetermines the PWM duty cycle so as to regulate the input voltage indirectly.
2.6.2.2 DC/AC Inverter
The control method for grid-connected DC/AC converter is shown in Fig. 2.14.This stage uses two nested control loops—an outer voltage loop and an innercurrent loop. Vdc_Ref is the reference voltage for the DC link, VDC is the detected
Fig. 2.13 Control diagram of DC/DC boost converter
42 P. Goli and W. Shireen

DC link voltage, Vgrid is the voltage at the secondary of the distribution transformer,θ is the grid phase angle, IREF is the reference current for the DC/AC convertergenerated by the voltage loop and Ifdbk is the current fed into the grid by the DC/ACconverter.
Two PID controllers, GV(S) and Gi(S) are used to close the outer voltage loopand the inner current loop. The voltage loop generates the reference command (IRef)for the current loop as increasing the current command will load the stage and hencecause a drop in the DC link voltage the sign for reference and the feedback arereversed. The current command is then multiplied by the AC angle to get theinstantaneous current reference. Since the inverter is grid connected the grid angleis provided by the PLL. The instantaneous current reference is then used by thecurrent compensator along with the feedback current (Ifdbk) to provide duty cyclefor the full bridge inverter.
2.6.2.3 DC/DC Buck Converter
The control method for DC/DC buck converter for PEV charging is based on VB,VBH, IDMD and IDMD-max as shown in Fig. 2.15. VB is the detected battery voltage,VBH is the battery voltage corresponding to 95 % SOC. IDMD is the load on thedistribution transformer and IDMD-max represents the peak load condition. Thecontrol mode is determined by the detected battery voltage of the PEV and theloading condition of the distribution transformer. The charging of the PEV is turned
Fig. 2.14 Control diagram of DC/AC inverter
Fig. 2.15 Control diagram of DC/DC buck converter
2 Control and Management of PV Integrated … 43

off once the battery voltage reaches VBH or the distribution transformer reaches thepeak load condition.
2.6.3 Simulation Studies
In order to validate the proposed control algorithm simulations were done in MatlabSimulink using the simpowersystems toolbox. The reference dc bus voltages i.e.VDC-1, VDC-2 and VDC-3 are set at 50, 250 and 350 V. The reference dc link voltagelevels are selected based on a training mode wherein the PEV load is kept constantand the solar irradiation is allowed to vary in steps. The values of IDMD-max and Tsoc
are set at 80 A (peak to peak) and 95 %. Toyota Prius plug-in hybrid has beenchosen as the PEV which has a total battery capacity equal to 4.5 kWh and nominalvoltage equal to 48 V. The rms value of AC grid voltage is 240 V. A PV panel ofrating 5.5 kW has been modelled taking the battery capacity of the PEV intoconsideration. The reference dc bus voltages have been chosen taking into con-sideration the change in sun conditions from early morning to late evening(Fig. 2.10). As the dc bus voltage varies, the source from which the PEV is chargedalso varies accordingly. Simulation results describing the transitions between var-ious modes are shown below.
Figure 2.16 shows the transition of the grid from off peak to on peak when thecharging station is operating in mode 1. The loading condition is accessed bymeasuring the current (IDMD) on the secondary side of the distribution transformer.Initially the grid is at off peak and hence the AC grid delivers the power required tocharge the PEV and other local loads. As shown in Fig. 2.16, from 1.5 to 2.0 s the
Fig. 2.16 Matlab simulink outputs for transition from mode-1 case-2. a DC bus voltage. b Currentflowing from the distribution transformer to the loads and the PEV. c Power delivered to the PEV(charging power). d Output voltage of the DC/DC buck converter
44 P. Goli and W. Shireen

current flowing in the secondary side of the distribution transformer is less than80 A. With the increase in utility load at 2.0 s, IDMD exceeds 80 A (IDMD-max). Thecharging of the PEV is terminated when the current flowing from the distributiontransformer, IDMD exceeds IDMD-max. This is done to reduce the stress beingimposed on the AC grid during the peak time. Hence the power consumed by thePEV reduces to zero during the peak time as shown in the figure.
The simulation results for the transition from mode 2 to mode 3 are shown inFig. 2.17. During the initial stages the dc bus voltage is less than 250 V and gridcontinues to supply the deficit power to charge the PEV. Once the dc bus voltageexceeds 250 V, the PV system alone caters the charging of PEV. The power flowingfrom the PV and the Power Grid is shown in Fig. 2.17. As shown in the figure, thedeficit power of 1,000 W to charge the PEV is supplied by the grid in mode-2 and itdoes not supply any power in mode-3 as the PV alone caters to the demand of thePEV.
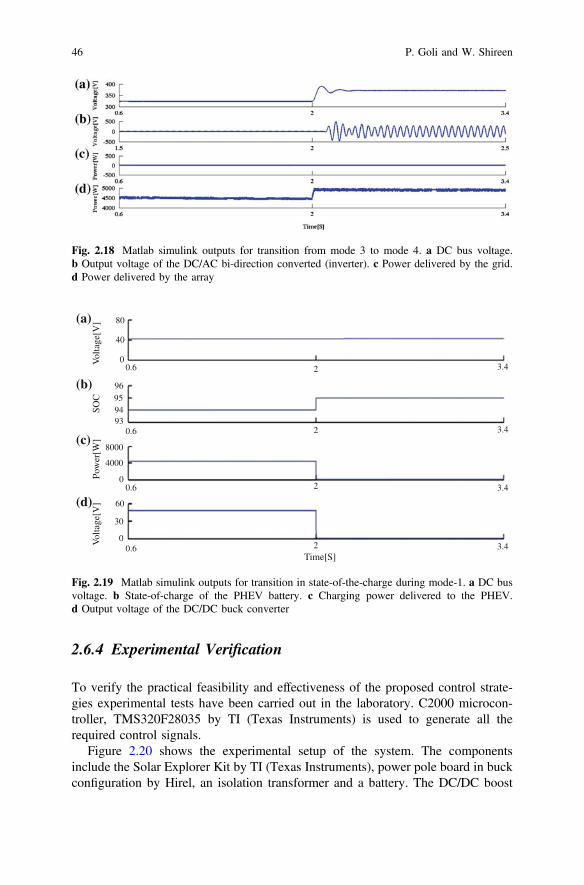
The transition from mode 3 to mode 4 is shown in Fig. 2.18. With the dc busvoltage exceeding 350 V there is an increase in power flowing from the PV in mode4. The PV system feeds this excess power to the grid in addition to charging thePEV. The sinusoidal output of the DC/AC bi-directional converter shows that it actsas an inverter in this case. In order to maintain the energy balance the dc linkvoltage is kept constant at 360 V. Finally Fig. 2.19 shows the termination of thevehicle charging when SOC = Tsoc.
The simulation results validate the modes of operation and the control algorithmdescribed in this section. As described in Sect. 1.5.1, the modes of operation changedue to the change in the dc bus voltage which in turn changes due to the change inthe irradiation levels according to the time of the day.
Fig. 2.17 Matlab simulink outputs for transition from mode 2 to mode 3. a DC bus voltage.b Voltage of the grid. c Power delivered by the grid. d Power delivered by the PV array
2 Control and Management of PV Integrated … 45
2.6.4 Experimental Verification
To verify the practical feasibility and effectiveness of the proposed control strate-gies experimental tests have been carried out in the laboratory. C2000 microcon-troller, TMS320F28035 by TI (Texas Instruments) is used to generate all therequired control signals.
Figure 2.20 shows the experimental setup of the system. The componentsinclude the Solar Explorer Kit by TI (Texas Instruments), power pole board in buckconfiguration by Hirel, an isolation transformer and a battery. The DC/DC boost
Fig. 2.18 Matlab simulink outputs for transition from mode 3 to mode 4. a DC bus voltage.b Output voltage of the DC/AC bi-direction converted (inverter). c Power delivered by the grid.d Power delivered by the array
80
40
00.6 2 3.4
3.42
2
2Time[S]
0.6
0.6
0.6
3.4
3.4
96959493
4000
8000
0
60
30
0Vol
tage
[V]
Pow
er[W
]SO
CV
olta
ge[V
](a)
(b)
(c)
(d)
Fig. 2.19 Matlab simulink outputs for transition in state-of-the-charge during mode-1. a DC busvoltage. b State-of-charge of the PHEV battery. c Charging power delivered to the PHEV.d Output voltage of the DC/DC buck converter
46 P. Goli and W. Shireen
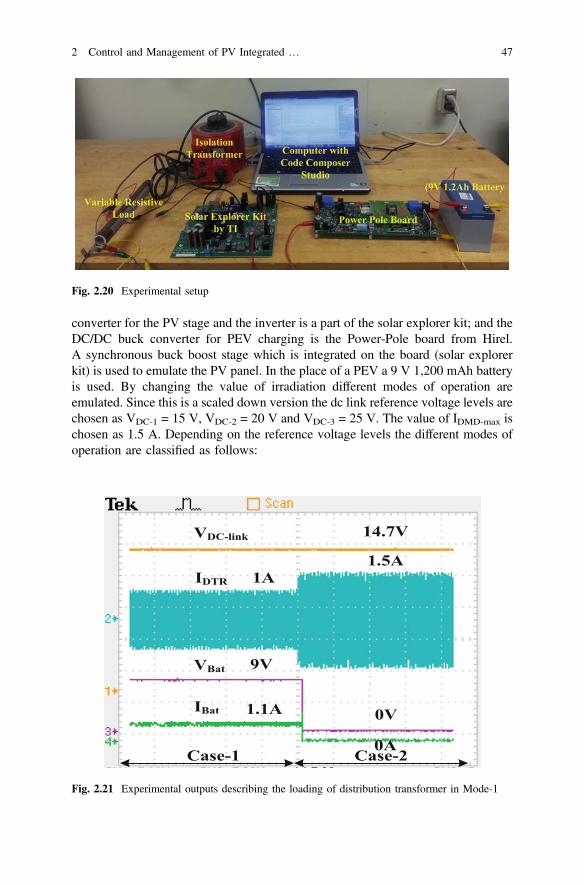
converter for the PV stage and the inverter is a part of the solar explorer kit; and theDC/DC buck converter for PEV charging is the Power-Pole board from Hirel.A synchronous buck boost stage which is integrated on the board (solar explorerkit) is used to emulate the PV panel. In the place of a PEV a 9 V 1,200 mAh batteryis used. By changing the value of irradiation different modes of operation areemulated. Since this is a scaled down version the dc link reference voltage levels arechosen as VDC-1 = 15 V, VDC-2 = 20 V and VDC-3 = 25 V. The value of IDMD-max ischosen as 1.5 A. Depending on the reference voltage levels the different modes ofoperation are classified as follows:
Fig. 2.20 Experimental setup
Fig. 2.21 Experimental outputs describing the loading of distribution transformer in Mode-1
2 Control and Management of PV Integrated … 47

Vdc�Link \ 15V� Mode-1
15V\Vdc�Link \ 20V � Mode-2
20V\Vdc�Link \ 25V� Mode-3
Vdc�Link [ 25V� Mode-4
Experimental tests have been carried out in terms of steady-state performanceand transient-performance between different modes and the results are providedbelow. Figure 2.21 through 2.25 explain the experimental results for the variousmodes of operation.
Experimental results for Mode-1 are shown in Fig. 2.21. With the increase in theloading of distribution transformer, IDMD increases from 1 to 1.5 A as shown inFig. 2.21 and accordingly the PEV is turned off so that the grid can cater to other loadswithout overloading the distribution transformer (assuming that IDMD-max = 1.5 A).The turning-off of the PEV is illustrated by the fact that VB and IB go to zero with theincrease in distribution transformer loading. This is done by generating a duty cycleof zero for the buck converter switch.
Experimental results for the transition between Mode-2 and Mode-3 are shownin Fig. 2.22. In the initial state, the dc link voltage is around 15.7 V and currentflows from both the PV as well as the grid to charge the PEV. Once the dc linkvoltage increases to 22.4 V (Mode-3) no power is drawn from the grid.
Transition from Mode-3 to Mode-4 is shown in Fig. 2.23. With the change in dclink voltage from 22.4 to 29.9 V the bi-directional converter goes from off-state to
Fig. 2.22 Experimental outputs for transition from Mode-2 to Mode-3
48 P. Goli and W. Shireen
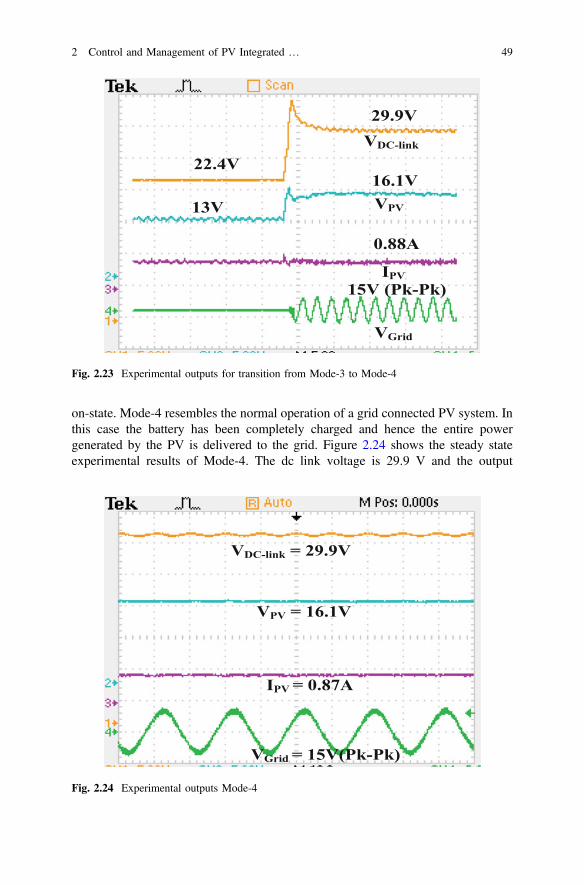
on-state. Mode-4 resembles the normal operation of a grid connected PV system. Inthis case the battery has been completely charged and hence the entire powergenerated by the PV is delivered to the grid. Figure 2.24 shows the steady stateexperimental results of Mode-4. The dc link voltage is 29.9 V and the output
Fig. 2.23 Experimental outputs for transition from Mode-3 to Mode-4
Fig. 2.24 Experimental outputs Mode-4
2 Control and Management of PV Integrated … 49

voltage of the inverter is a sine wave. A high switching frequency along with LCLfilter meets the total harmonic distortion (THD) requirements. Unipolar switchingstrategy was followed for inverter switching and the switching takes place at20 kHz. The inverter switching at 20 kHz together with the LCL filter generates afiltered single phase AC output. The total harmonic distortion (THD) of the inverteroutput voltage is calculated to be 5.4 %. Figure 2.25 shows the Fast FourierTransform (FFT) of the inverter output voltage.
2.7 Conclusion
To mitigate the loading on distribution transformers due to PEV charging, smartcharging strategies coupled with renewable energy resources are the need of thehour. This chapter discussed the current state of the infrastructure for PV poweredcharging facilities for PEVs. Several power electronic topologies are presented andcompared. Control strategies are reviewed for residential and workplace basedphotovoltaic charging. The chapter proposed a charging station architecture basedon distributed topology. A unique control strategy based on dc link voltage sensing,which decides the direction of power flow is presented and the various modes of
Fig. 2.25 FFT of inverter output voltage
50 P. Goli and W. Shireen

operation have been described. The practical feasibility and effectiveness of theproposed control strategy has been validated by simulation and experimentalresults. The proposed control method based on the change in dc link voltage leveldue to the change in irradiation of the sun, is simple and unique. The energymanagement algorithm facilitates charging of the PEVs using minimum energyfrom the utility with a kind of demand management to improve the energy effi-ciency. Smart charging techniques like the one proposed in this chapter will helpavoid major expense to upgrade distribution transformers and other substationequipment with the increase in PEV loads on the distribution system.
References
1. Kempton W, Tomic J (2005) Vehicle-to-grid power implementation: from stabilizing the gridto supporting large-scale renewable energy. J Power Sources 144(1):280–294
2. EPRI (2012) Tennessee valley authority smart modal area recharge terminal (SMART) stationproject. http://www.epri.com/abstracts/Pages/ProductAbstract.aspx?ProductId=000000000001026583. Accessed Nov 2012
3. Gorton M (2011) Solar-powered electric vehicle charging stations sprout up nationally. http://www.renewableenergyworld.com/rea/news/article/2011/11/solar-powered-electric-vehicle-charging-stations-sprout-up-nationally. Accessed Nov 2011
4. Motavalli J (2013) Here now: the world’s first portable, self-contained solar EV charging station.http://www.plugincars.com/here-now-worlds-first-portable-self-contained-solar-ev-charging-station-128015.html. Accessed Aug 2013
5. Ayre J Solar-integrated EV fast charging station (eco station) gets CODA energy storagesystem. http://cleantechnica.com/2013/09/02/solar-integrated-ev-fast
6. Giges NS (2012) Wind-powered charging stations coming soon. https://www.asme.org/engineering-topics/articles/renewable-energy/wind-powered-charging-stations-coming-soon.Accessed Oct 2012
7. Liu K, Makaran J (2009) Design of a solar powered battery charger. In: Electrical power andenergy conference (EPEC), 22–23 Oct 2009
8. Neumann H, Schar D, Baumgartner F (2012) The potential of photovoltaic carports to coverthe energy demand of road passenger transport. Prog Photovolt Res Appl 20:639–649
9. Ingersoll JG, Perkins CA (1996) The 2.1 kW photovoltaic electric vehicle charging station inthe city of Santa Monica, California. In: The twenty fifth IEEE photovoltaic specialistsconference, 13–17 May 1996
10. Locment F, Sechilariu M, Forgez C (2010) Electric vehicle charging system with PV grid-connected configuration. In: IEEE vehicle power and propulsion conference (VPPC), 1–3 Sept2010
11. Letendre S (2009) Solar electricity as a fuel for light vehicles. In: Proceedings of the 2009American solar energy society annual conference, Boulder, CO
12. Tulpule PJ, Marano V, Yurkovich S, Rizzoni G (2013) Economic and environmental impactsof a PV powered workplace parking garage charging station. J Appl Energy 108:323–332
13. Birnie III DP (2009) Solar-to-vehicle (S2 V) systems for powering commuters of the future.J Power Sources 186(2):539–542
14. Zhang Q, Tezuka T, Ishihara KN, Mclellan BC (2012) Integration of PV power into futurelow-carbon smart electricity systems with EV and HP in Kansai Area, Japan. J Renew Energy44:99–108
15. Denholm P, Kuss M, Margolis RM (2012) Co-benefits of large scale plug-in hybrid electricvehicle and solar PV deployment. J Power Sources 236:350–356
2 Control and Management of PV Integrated … 51

16. National Houshold Travel Survey (NHTS) (2009). Summary of travel trends-2009. http://nhts.ornl.gov/2009/pub/stt.pdf. Accessed Oct 2009
17. Rutherford MJ, Yousefzadeh V (2011) The impact of electric vehicle battery charging ondistribution transformers. In: Twenty-sixth annual IEEE applied power electronics conferenceand exposition (APEC), 2011
18. Green RC, Wang L, Alam M (2011) The impact of plug-in hybrid electric vehicles ondistribution networks: a review and outlook. J Renew Sustain Energy Rev 15(1):544–553
19. Shao SN, Pipattanasomporn M, Rahman S (2009) Challenges of PHEV penetration to theresidential distribution network. In: IEEE power and energy society general meeting, 26–30July 2009
20. Zhao J, Kucuksari S, Mazhari E, Son YJ (2013) Integrated analysis of high-penetration PVand PHEV with energy storage and demand response. J Appl Energy 112:35–51
21. Erol-Kantarci M, Mouftah H (2011) Management of PHEV batteries in the smart grid towardsa cyber-physical power infrastructure. In: IEEE workshop on design, modeling and evaluationof cyber physical systems, July 2011
22. Carli G, Williamson SS (2013) Technical considerations on power conversion for electric andplug-in hybrid electric vehicle battery charging in photovoltaic installations. IEEE TransPower Electron 28(12):5784–5792
23. Giannouli M, Yianoulis P (2012) Study on the incorporation of photovoltaic systems as anauxiliary power source for hybrid and electric vehicles. J Sol Energy 86(1):441–451
24. Li X, Lopes LAC, Williamson SS (2009) On the suitability of plug-in hybrid electric vehicle(PHEV) charging infrastructures based on wind and solar energy. In: IEEE power and energysociety general meeting, 26–30 July 2009
25. Hadley, SW (2007) Evaluating the impact of plug-in hybrid electric vehicles on regionalelectricity supplies. In: Bulk power system dynamics and control—VII. Revitalizingoperational reliability, Aug 2007
26. Yan Q, Kezunovic M (2012) Impact analysis of electric vehicle charging on distributionsystem. In: North American power symposium (NAPS), Sept 2012
27. Moghe R, Kreikebaum F, Hernandez JE, Kandula RP, Divan D (2011) Mitigating distributiontransformer lifetime degradation caused by grid-enabled vehicle (GEV) charging. In: IEEEenergy conversion congress and exposition (ECCE), Sept 2011
28. Masoum AS, Deilami S, Moses PS, Abu-Siada (2010) A impacts of battery charging rates ofplug-in electric vehicle on smart grid distribution systems. In: IEEE PES innovative smart gridtechnologies conference Europe (ISGT Europe), Oct 2010
29. Qian K, Zhou C, Allan M, Yuan Y (2010) Load model for prediction of electric vehiclecharging demand. In: International conference on power system technology (POWERCON),Oct 2010
30. Papadopoulos P, Skarvelis-Kazakos S, Grau I, Cipcigan LM, Jenkins N (2010) Predictingelectric vehicle impacts on residential distribution networks with distributed generation. In:IEEE vehicle power and propulsion conference (VPPC), Sept 2010
31. Jian L, Xue H, Xu G, Zhu X, Zhao D, Shao Z (2013) Regulated charging of plug-in hybridelectric vehicles for minimizing load variance in household smart microgrid. IEEE TransIndustr Electron 60(8):3218–3226
32. Osawa M, Yoshimi K, Yamashita D, Yokoyama R, Masuda T, Kondou H, Hirota T (2012)Increase the rate of utilization of residential photovoltaic generation by EV charge-dischargecontrol. In: IEEE innovative smart grid technologies—Asia (ISGT Asia), May 2012
33. Chukwu UC, Mahajan SM (2014) V2G parking lot with pv rooftop for capacity enhancementof a distribution system. IEEE Trans Sustain Energy 5(1):119–127
34. Geiles TJ, Islam S (2013) Impact of PEV charging and rooftop PV penetration on distributiontransformer life. In: IEEE power and energy society general meeting (PES), 21–25 July 2013
35. Robalino DM, Kumar G, Uzoechi LO, Chukwu UC, Mahajan SM (2009) Design of a dockingstation for solar charged electric and fuel cell vehicles. In: International conference on cleanelectrical power, 9–11 June 2009
52 P. Goli and W. Shireen

36. Alamri BR, Alamri AR (2009) Technical review of energy storage technologies whenintegrated with intermittent renewable energy. In: International conference on sustainablepower generation and supply, SUPERGEN, 6–7 April 2009
37. Gurkaynak Y, Khaligh A (2009) Control and power management of a grid connected residentialphotovoltaic system with plug-in hybrid electric vehicle (PHEV) load. In: Twenty-fourth annualIEEE applied power electronics conference and exposition (APEC), 15–19 Feb 2009
38. Nagarajan A, Shireen W (2010) Grid connected residential photovoltaic energy systems withplug-in hybrid electric vehicles (PHEV) as energy storage. In: IEEE power and energy societygeneral meeting, 25–29 July 2010
39. Oviedo RM, Fan Z, Gormus S, Kulkarni P (2014) A residential PHEV load coordinationmechanism with renewable sources in smart grids. J Electr Power Energy Syst 55:511–521
40. Gurkaynak Y, Li Z, Khaligh A (2009) A novel grid-tied, solar powered residential home withplug-in hybrid electric vehicle (PHEV) loads. In: IEEE vehicle power and propulsionconference VPPC 09, 7–10 Sept 2009
41. Roggia L, Rech C, Schuch L, Baggio JE, Hey HL, Pinheiro JR (2011) Design of a sustainableresidential microgrid system including PHEV and energy storage device. In: Proceedings ofthe 2011—14th European conference on power electronics and applications (EPE 2011), 30Aug–1 Sept 2011
42. Sheng S, Hsu CT, Li P, Lehman B (2013) Energy management for solar battery chargingstation. In: IEEE 14th workshop on control and modeling for power electronics (COMPEL),23–26 June 2013
43. Chen Z, Liu N, Xiao X, Lu X, Zhang J (2013) Energy exchange model of PV-based batteryswitch stations based on battery swap service and power distribution. In: IEEE vehicle powerand propulsion conference (VPPC), Oct 2013
44. Choe GY, Kim JS, Lee BK, Won CY, Lee TW (2010) A bi-directional battery charger forelectric vehicles using photovoltaic PCS systems. In: IEEE vehicle power and propulsionconference (VPPC), 1–3 Sept 2010
45. Vaidya M, Stefanakos EK, Krakow B, Lamb HC, Arbogast T, Smith T (1996) Direct DC-DCelectric vehicle charging with a grid connected photovoltaic system. In: Twenty fifth IEEEphotovoltaic specialists conference, 13–17 May 1996
46. Gamboa G, Hamilton C, Kerley R, Elmes S, Arias A, Shen J, Batarseh I (2011) Controlstrategy of a multi-port, grid connected, direct-DC PV charging station for plug-in electricvehicles. In: IEEE energy conversion congress and exposition (ECCE), 12–16 Sept 2011
47. Hamilton C, Gamboa G, Elmes J, Kerley R, Arias A, Pepper M, Shen J, Batarseh I (2010)System architecture of a modular direct-DC PV charging station for plug-in electric vehicles.In: 36th annual conference on IEEE industrial electronics society (IECON), 7–10 Nov 2010
48. Schönberger J, Duke R, Round SD (2006) DC-Bus signaling: a distributed control strategy fora hybrid renewable nanogrid. IEEE Trans Industr Electron 53(5):1453–1460
49. Sun K, Zhang L, Xing Y, Guerrero JM (2011) A distributed control strategy based on dc bussignaling for modular photovoltaic generation systems with battery energy storage. IEEETrans Power Electron 26(10):3032–3045
50. Jin C, Wang P, Xiao J, Tang Y, Choo FH (2014) Implementation of hierarchical control in DCmicrogrids. IEEE Trans Industr Electron 61(8):4032–4042
51. Preetham G, Shireen W (2012) Photovoltaic charging station for plug-in hybrid electricvehicles in a smart grid environment. Paper presented at IEEE PES innovative smart gridtechnologies, 16–20 Jan 2012
52. Goli P, Shireen W (2014) PV integrated smart charging of PHEVs based on DC link voltagesensing. IEEE Trans Smart Grid 5(3):1421–1428
2 Control and Management of PV Integrated … 53

http://www.springer.com/978-981-287-316-3