contributions to the assessment of demersal fish stocks off … · contributions to the assessment...
TRANSCRIPT

General rights Copyright and moral rights for the publications made accessible in the public portal are retained by the authors and/or other copyright owners and it is a condition of accessing publications that users recognise and abide by the legal requirements associated with these rights.
Users may download and print one copy of any publication from the public portal for the purpose of private study or research.
You may not further distribute the material or use it for any profit-making activity or commercial gain
You may freely distribute the URL identifying the publication in the public portal If you believe that this document breaches copyright please contact us providing details, and we will remove access to the work immediately and investigate your claim.
Downloaded from orbit.dtu.dk on: Mar 07, 2020
Contributions to the assessment of demersal fish stocks off Namibia
Kathena, Johannes N.
Publication date:2019
Document VersionPublisher's PDF, also known as Version of record
Link back to DTU Orbit
Citation (APA):Kathena, J. N. (2019). Contributions to the assessment of demersal fish stocks off Namibia. Kgl. Lyngby:Technical University of Denmark.
Contributions to the assessment of demersal fish stocks off Namibia
PhD Thesis
Johannes Nduvudi Kathena
DTU Aqua National Institute of Aquatic Resources

Contributions to the assessment of demersal fish stocks off Namibia
PhD thesis by:
Johannes Nduvudi Kathena
June 2019
National Institute of Aquatic Resources
Technical University of Denmark
Life Science
Kemitorvet, Bygning 202
2800 Kgs. Lyngby, Denmark
www.aqua.dtu.dk


3
Contents
Preface ............................................................................................................................................................... 7
Dedication.......................................................................................................................................................... 8
Acknowledgements ........................................................................................................................................... 9
Summary (English) .......................................................................................................................................... 11
Summary (Danish) ........................................................................................................................................... 13
List of publications .......................................................................................................................................... 15
Chapter 1: Introduction .................................................................................................................................... 18
1.1 Motivation ............................................................................................................................................. 18
1.2 Objectives .............................................................................................................................................. 19
1.3 Overview ................................................................................................................................................ 19
Chapter 2: Background .................................................................................................................................... 21
2.1 Benguela Current Large Marine Ecosystem .......................................................................................... 21
2.2 Biology and ecology of the hake, monkfish and west coast sole .......................................................... 23
2.2.1 Stock structure................................................................................................................................ 23
2.2.1.1 Cape hake ................................................................................................................................ 23
2.2.1.2 Cape monkfish ......................................................................................................................... 24
2.2.1.3 West Coast sole ....................................................................................................................... 25
2.2.2 Distribution and migration ............................................................................................................. 26
2.2.2.1 Cape hake species .................................................................................................................... 26
2.2.2.2 Cape monkfish ......................................................................................................................... 27
2.2.2.3 West Coast sole ....................................................................................................................... 27
2.2.3 Age and growth .............................................................................................................................. 27
2.2.3.1 Cape hake species .................................................................................................................... 27
2.2.3.2 Cape monkfish ......................................................................................................................... 28
2.2.3.3 West Coast sole ....................................................................................................................... 29
2.2.4 Reproductive biology and recruitments ......................................................................................... 29
2.2.4.1 Cape hake species .................................................................................................................... 29

4
2.2.4.2 Cape monkfish ......................................................................................................................... 30
2.2.4.3 West Coast sole ....................................................................................................................... 31
2.2.5 Feeding ecology .............................................................................................................................. 31
2.2.5.1 Cape hake species .................................................................................................................... 31
2.2.5.2 Cape monkfish ......................................................................................................................... 32
2.2.5.3 West Coast sole ....................................................................................................................... 33
2.3 Main demersal fishery in Namibia ......................................................................................................... 33
2.3.1 Cape hake species ........................................................................................................................... 33
2.3.2 Cape monkfish ................................................................................................................................ 34
2.3.3 West Coast sole .............................................................................................................................. 35
2.4 Monitoring ............................................................................................................................................. 37
2.4.1 Cape hake survey ............................................................................................................................ 37
2.4.2 Cape monkfish survey ..................................................................................................................... 38
2.5 Assessment of the main demersal stocks in Namibia ........................................................................... 39
2.5.1 Cape hake assessment .................................................................................................................... 39
2.5.2 Cape monkfish assessment ............................................................................................................ 40
2.5.3 West Coast sole assessment ........................................................................................................... 40
2.6 Management of the main demersal stocks in Namibia ......................................................................... 40
2.6.1 Cape hake management ................................................................................................................. 40
2.6.2 Cape monkfish management .......................................................................................................... 42
2.6.3 West Coast sole management ........................................................................................................ 42
2.7 Three recent trends in fisheries stock assessment ............................................................................... 42
Chapter 3: Contributions to the Namibian stock management, fisheries management and stock assessment
......................................................................................................................................................................... 46
3.1 Splitting commercial catches of mixed hake into species (Paper I) ...................................................... 46
3.1.1 Data ................................................................................................................................................ 48
3.1.2 Modelling ........................................................................................................................................ 49
3.1.3 Result highlights ............................................................................................................................. 52

5
3.1.4 Discussion ....................................................................................................................................... 53
3.2 Commercial catch rate analysis (Paper II) ............................................................................................. 55
3.2.1 Data ................................................................................................................................................ 56
3.2.2 Modelling ........................................................................................................................................ 56
3.2.3 Result highlights ............................................................................................................................. 57
3.2.4 Discussion ....................................................................................................................................... 58
3.3 Combined hake assessment vs single species hake assessments (Paper III) ........................................ 59
3.3.1 Materials and Methods .................................................................................................................. 60
3.3.1.1 Input data ................................................................................................................................ 60
3.3.1.2 Fundamental of SAM ............................................................................................................... 60
3.3.2 Results highlights ............................................................................................................................ 62
3.3.3 Discussion ....................................................................................................................................... 64
3.4 The uncertainty of assessment due to ageing biases (systematic error) .............................................. 65
3.4.1 Material and method ...................................................................................................................... 65
3.4.2 Results highlights ............................................................................................................................ 68
3.4.3 Discussion ....................................................................................................................................... 69
3.5 Data-rich vs data-moderate assessment of Namibian stocks (Paper IV) .............................................. 70
3.5.1 Modelling and Data ........................................................................................................................ 72
3.5.1.1 Fundament beneath SPiCT ...................................................................................................... 72
3.5.1.2 Comparison with age-structure data ....................................................................................... 73
3.5.2 Result highlights ............................................................................................................................. 73
3.5.3 Discussion ....................................................................................................................................... 75
Chapter 4: Stock assessment perspective for Namibia ................................................................................... 77
4.1 Stock assessment perspective for Cape hake ........................................................................................ 77
4.1.1 Hake splitting .................................................................................................................................. 77
4.1.2 Stock assessment ............................................................................................................................ 78
4.1.3 Transboundary challenges .............................................................................................................. 79
6
4.2 Data-limited fish stock assessment ....................................................................................................... 81
4.3 Conclusions ............................................................................................................................................ 82
4.3.1 Summarizing according to the objectives....................................................................................... 82
4.3.2 How do regional fishery biologists learn to operate state-space assessment techniques? .......... 84
4.3.3 Challenges from a fishery biological perspective: Cape hake ........................................................ 84
4.3.4 Towards improved assessment, advice, and management in the Benguela Current Large Marine
Ecosystem (BCLME) ................................................................................................................................. 85
References ....................................................................................................................................................... 89
Paper I.............................................................................................................................................................103
Paper II……………………………………………………………………………………………………...115
Paper III……………..………………………………………………………………………………………146
Paper IV………..…………………………………………………………………………………………...160
7
Preface
This thesis was prepared at the Technical University of Denmark (DTU) National Institute of Aquatic
Resources (DTU Aqua), under supervision of Associate professor Uffe Høgsbro Thygesen (DTU
Aqua, DTU Compute since June 2017), Senior Researchers Anders Nielsen and Teunis Jansen and
Hashali Hamukwaya (Benguela Current Convention, BCC). The project was funded by the
Development of ecological sustainable fisheries practices in the Benguela Current Large Marine
Ecosystem (ECOFISH).
This thesis consists of a series of 4 scientific papers.
Kongens Lyngby, June 2019
Johannes Nduvudi Kathena
8
Dedication
This thesis is dedicated to my late mother: Naango, late father: Ignatius and late father-in-law: Jason. Their
love for education has led me to pursue a Ph.D. I am deeply grateful for their support and influence during my
battle of pursuing school through to a Ph.D. It saddens me greatly that they did not see my battle through to
the end of my formal qualifications. May their souls continue to rest in eternal peace!

9
Acknowledgements
At the top of this long list of thank you’s - I am grateful for the commitment and support from my Principal
Supervisor Uffe Høgsbro Thygesen. Without you, I would not have discovered the “wonderful” world of
fisheries modelling. Uffe was really quick to identify my weaknesses and did his best to help me with them.
Thanks go to my co-supervisors Anders Nielsen, Teunis Jansen and Hashali Hamukuaya; they were always
available when I needed their advice. I consider myself fortunate to have been allocated this supervisory team
for my Ph.D. They have expertise ranging from theoretical ecology to advance statistics and applied
mathematics.
Special thanks go to my mentor Jan E. Beyer. Jan has continuously encouraged me throughout this project. He
has been very supportive and full of great ideas. Jan was always there to share and discuss ideas about stock
assessment ranging from classical assumptions of fishery biology to state-space modelling. You have truly
been an amazing mentor.
Thank you to the Benguela Current Convention ECOFISH project (funded by the European Union under the
Europe Aid grant 2010/222387) for providing the funds necessary for undertaking this Ph.D. I am also grateful
to the Ministry of Fisheries and Marine Resource, Namibia, and National Institute of Aquatic Resources, DTU
for the study opportunity. Thank you moreover to Jan E. Beyer, Hashali Hamukuaya and Fritz Kӧster without
whom I might not have been offered the opportunity to do this Ph.D. in the first place.
I wish to acknowledge and honour the contributions of my research associates: Jan E. Beyer, Alexandros
Kokkalis, Casper Willestofte Berg, Martin W. Pedersen, Espen Johnsen, Dawit Yemane and Nixon Bahamon
for their various contributions to this project.
Many people have contributed to the realization of this thesis in different ways and I do thank them
wholeheartedly: Lillian Andersen, Nina Qvistgaard, Eva Maria Pedersen, Lis Ramberg, Alexandros Kokkalis,

10
Sarah Paulus, Vasana Tutjavi, Collette Simwanza, Tobias Endjambi, Paul Kainge, Titus Iilende and Graca
D’Almeida.
I had the privilege to share an office with the modelling group, SAM and SPiCT developer, thank you all for
the support and encouragement you have offered along the journey that has been the undertaking of this Ph.D.
Without you, I would not have discovered the concepts (“random walk and variance parameters in fisheries
modelling”). I am very appreciative of your significant contribution to the work involved in developing the
two models that are described and explored in this thesis.
Motsazizowala - your reliable support and encouragement are highly appreciated. I look forward to seeing
more of such projects.
Most important of course my family: Tulonga, Tangomuwa, Taamba and my lovely wife Sabina, I appreciate
all of you in every sense of the word. Thank you for your support at all levels, it kept me going. I am sorry that
I was not always home when you needed me the most, but that is for a good reason.

11
Summary (English)
In Northern Benguela, the two hake species M. capensis and M. paradoxus with similar visual appearance
have a common habitat and overlapping depth and latitudinal distribution. These species can be found in the
same hauls in what can be referred to as a mixed fishery. The challenges in mixed fisheries are that it is often
not possible to obtain Maximum Sustainable Yield from all stocks at the same time. Species-specific
assessments are important for management and sustainable utilization of the fisheries resources. Since the two
species are similar and not distinguished by the commercial fisheries, methods should be developed to separate
the species in commercial landings.
This thesis has developed splitting algorithms to split the two hake species in the commercial landings using
observer and survey data (Paper I). The results support the previous findings: M. capensis had a shallower
and more northern distribution than M. paradoxus, while M. paradoxus dominated the annual hake catches.
Based on the results from Paper I, the thesis proceeds to develop a species-specific abundance at each
commercial haul (Paper II). We develop a generalized additive model (GAM) to identify factors that are
affecting catch rates or catch-per-unit- of effort (CPUE) of M. capensis and M. paradoxus for each tow (Paper
II). Standardized catch rates for M. paradoxus are significantly higher than catch rates of M. capensis.
Furthermore, seasonal migration patterns are described for the first time and are found to correspond to the
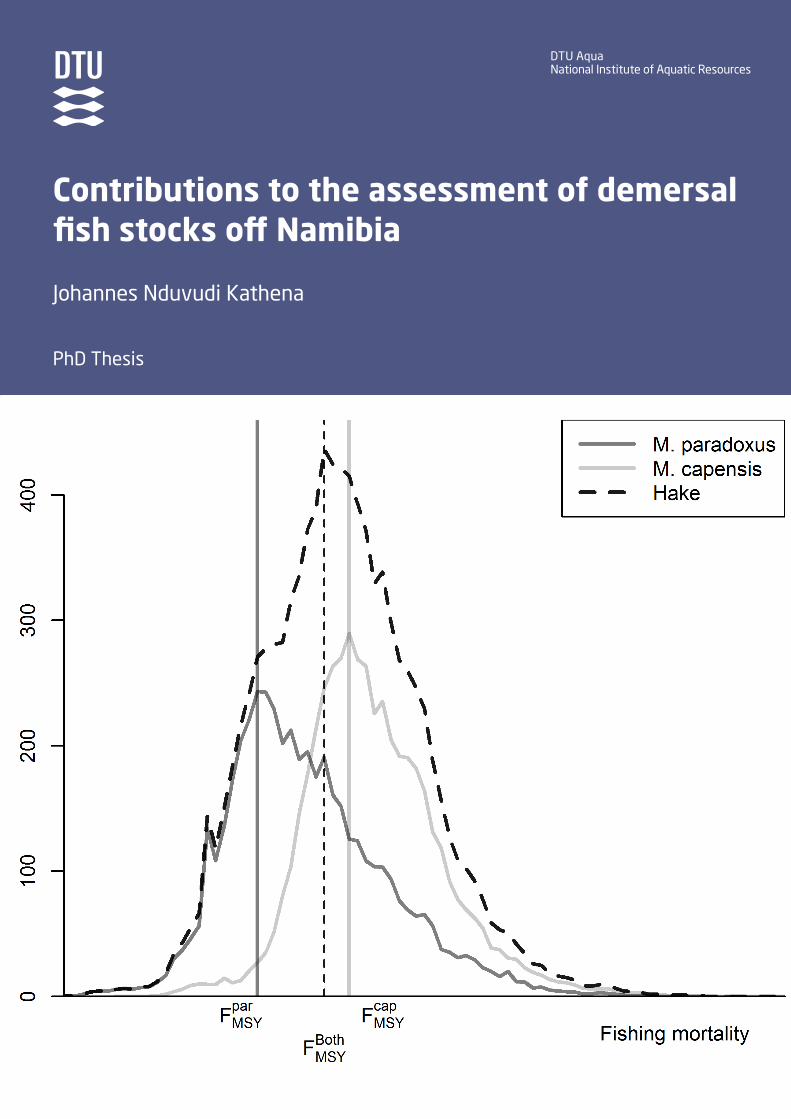
spawning areas and season. We conclude on hake species-specific studies by implementing a data-rich state-
space assessment model (SAM) (Paper III) for two independent single-species assessments, one for M.
capensis, and the other for M. paradoxus. M. capensis showed a higher spawning stock biomass than M.
paradoxus, while fishing mortality was higher on M. paradoxus.
Finally, in (Paper IV) a biomass dynamic model (SPiCT) was applied to a data-rich Cape monkfish and a
data-moderate West Coast sole with a perspective of evaluating their use in Northern Benguela with a
particular focus on assessing demersal resources off Namibia.
Overall, the thesis work has constructed state-of-the-art single-species assessment models of hake and
monkfish, using SAM, has explored the applicability of data-moderate assessment methods, specifically

12
SPiCT, to monkfish and applied it to west coast sole, and has examined the differences in distribution between
the two hake species, thus addressing the species splitting problem which is a prerequisite for separate
assessments of the two species. Thus, the work has contributed to the advance of the state-of-the-art with
respect to fisheries assessment and sustainable management of the living resources off Namibia and in the
Benguela current system.

13
Summary (Danish)
De to kulmule-arter, M. capensis og M. paradoxus i det nordlige Benguela, har meget ens udseende, fælles
habitat og overlappende dybde og breddegrads-fordeling. Disse arter kan findes i samme trawltræk i, hvad der
kan betegnes som et blandet fiskeri. Udfordringerne i blandet fiskeri er, at det ofte ikke er muligt at opnå
maksimalt bæredygtige fangster (Maximum Sustainable Yields) fra alle bestande på samme tid. Separate
bestandsvurderinger for hver art er vigtige for management og bæredygtig udnyttelse af fiskeri ressourcer.
Siden de to arter ligner hinanden, og det kommercielle fiskeri ikke skelner mellem dem, bør der udvikles
metoder til at adskille arterne i de kommercielle landinger.
Denne afhandling har udviklet metoder til at adskille fangsterne af de to kulmule-arter i de kommercielle
landinger ved at bruge data fra observatører på de kommercielle skibe og videnskabelige
bundtrawlundersøgelser (Paper I). Resultaterne støtter tidligere fund: M. capensis fandtes på lavere vand og
nordligere end M. paradoxus, mens M. paradoxus dominerede det dybere vand, undtagen syd for 25 `S hvor
denne ”dybhavs-kulmule” forefindes på meget lavere vand. M. paradoxus dominerede de årlige kulmule
fangster. Baseret på resultaterne fra Paper I fortsætter afhandlingen med at udvikle et artsspecifik indeks for
forekomst i hvert kommercielt trawltræk (Paper II). Vi udvikler en generaliseret additiv model (GAM) for at
identificere faktorer, som påvirker fangstrater eller fangst-per-indsatsenhed (CPUE) af M. capensis og M.
paradoxus for hver træk (Paper II). De standardiserede fangstrater af M. paradoxus er markant højere end
fangstraterne af M. capensis. Endvidere bliver sæsonprægede migrationsmønstre beskrevet for første gang og
viser sig at være i overensstemmelse med gydeområder og -periode. Vi afslutter de artsspecifikke kulmule-
studier ved at implementere en data-rig ”tilstandsbaseret” model SAM, på engelsk ”data-rich State-space
Assessment Model” (Paper III) for to uafhængige en-art bestandsvurderinger, en for M. capensis, og den
anden for M. paradoxus. M. capensis viste en højere gyde-bestands-biomasse end M. paradoxus, mens fiskeri
dødeligheden var højere for M. paradoxus.
14
Til slut (Paper IV) blev en dynamisk biomasse model (SPiCT) anvendt på en data-rig Cape havtaskebestand
og en data-moderat bestand af Vestkyst-tunge med det perspektiv at evaluere deres nytte i det nordlige
Benguela, med særlig fokus på at bestandsvurdere Namibias demersale ressourcer.
Samlet har arbejdet med afhandlingen skabt state-of-the-art enkeltart bestandsvurderings modeller for kulmule
og havtaske ved at anvende SAM har udforsket anvendeligheden af data-moderate bestandsvurderingsmetoder,
specielt SPiCT, for havtaske samt anvendt den på vestkyst-tunge, og har undersøgt forskellene i fordeling
mellem de to kulmulearter, og således arbejdet med ”the species splitting problem”, som er en forudsætning
for seperate bestandsvurderinger af de to arter. Arbejdet har således bidraget til at fremme state-of-the-art hvad
angår fiskerivurderinger og bæredygtig management af de levende fiskeri-ressourcer i Namibia og i Benguela-
strøm-systemet.

15
List of publications
The thesis is based on the following original research papers:
I. Johnsen, E., Kathena, J., 2012. A robust method for generating separate catch time-series for each
of the hake species caught in the Namibian trawl fishery. African Journal of Marine Science, 34:
43–53.
II. Kathena, J.N., Yemane, D., Bahamon, N., Jansen, T., 2018. Population abundance and seasonal
migration patterns indicated by commercial catch-per-unit-effort of hakes (Merluccius capensis
and M. paradoxus) in the northern Benguela Current Large Marine Ecosystem. African Journal
of Marine Science, 40(2): 197-209, https://doi.org/10.2989/1814232X.2018.1476264
III. Kathena, J.N., Nielsen, A., Thygesen, U.H., Berg, C.W., 2016. Hake species (Merluccius capensis
and M. paradoxus) assessment in the Benguela Current Large Marine Ecosystem Environmental
Development, 17: 193–201, http://dx.doi.org/10.1016/j.envdev.2015.11.011.
IV. Kathena, J.N., Kokkalis, A., Pedersen, W. M., Beyer, J. E., Thygesen, U. H., 2018. Data-moderate
assessment of Cape monkfish (Lophius vomerinus) and West Coast sole (Austroglossus
microlepis) in Namibian waters. African Journal of Marine Science, 40(3): 293-302,
https://doi.org/10.2989/1814232X.2018.1512527
The following list of publications presents co-authored papers written during the PhD project which are either
bordering on the subject in this thesis, or where the author of this thesis did not have a leading role in producing
the manuscript, or a combination of the two. The content of these papers will not be discussed directly, but are
included in the discussions of the main papers where relevant.
Jansen, T., Kristensen, K., Fairweather, T. P., Kainge, P., Kathena, J. N., Durholtz, D., Beyer,J. E., Thygesen,
U. H., 2017. Geostatistical modelling of the spatial life history of post-larval deep-water hake (Merluccius
paradoxus) in the Benguela Current Large Marine Ecosystem. African Journal of Marine Science, 39: 349-
361 doi: 10.2989/1814232X.2017.1379437

Jansen, T., Kristensen, K., Kainge, P., Durholtz, D., Strømme, T., Thygesen, U. H., Wilhelm, M. R., Kathena,
J. N., Fairweather, T. P., Paulus, S., Degel, H., Lipinski, M. R., Beyer, J. E., 2016. Migration, distribution and
population (stock) structure of shallow-water hake (Merluccius capensis) in the Benguela Current Large
Marine Ecosystem inferred using a geostatistical population model. Fisheries Research, 179: 156–167
Wilhelm, M.R., Kirchner, C.H., Roux, J.-P., Jarre, A., Iitembu, J.A., Kathena, J.N., Kainge, P., 2015. Biology
and fisheries of the shallow-water hake (Merluccius capensis) and the deep-water hake (M. paradoxus) in
Namibia. Chapter 3 In: Hakes: biology and exploitation, pp 70-100. Ed. by H. Arancibia. John Wiley & Sons,
Ltd: Chichester, UK. doi: 10.1002/9781118568262.ch3
Jansen, T., Kainge, P., Singh, L., Wilhelma, M. R., Durholtz, D., Strømme, T., Kathena, J. N., Erasmus, V.,
2015. Spawning patterns of shallow-water hake (Merluccius capensis) and deep-water hake (M. paradoxus)
in the Benguela Current Large Marine Ecosystem inferred from gonadosomatic indices. Fisheries Research,
172: 168–180
Kainge, P., Bahamon, N., Bartholomae, C. H., Kathena, J. N., van der Plas, A. K., Gordoa, A., 2013. Stock
environment recruitment analysis for Namibian Cape hake Merluccius capensis. African Journal of Marine
Science, 35(4): 555-564
Kirkman, S. P., Yemane, D., Kathena, J. N., Mafwila, S. K., Nsiangango, S. E., Samaai, T., Axelsen, B. E.,
Singh, L., 2013. Identifying and characterizing demersal fish biodiversity hotspots in the Benguela Current
16
17
Large Marine Ecosystem: relevance in the light of global changes. – ICES Journal of Marine Science,
doi:10.1093/icesjms/fst040.
Kirkman, S. P., Yemane, D., Atkinson, L., Kathena, J. N., Nsiangango, S. E., Singh, L., Axelsen, B. E.,
Samaai, T., 2015. Regime shifts in demersal assemblages of the Benguela Current Large Marine Ecosystem:
a comparative assessment. Fisheries Oceanography, 24: 15–30.
Yemane, D., Kirkman, S. P., Kathena, J. N., N’siangango, S. E., Axelsen, B. E., Samaai, T., 2014. Assessing
changes in the distribution and range size of demersal fish populations in the Benguela Current Large Marine
Ecosystem. Rev Fish Biol Fisheries. doi: 10.1007/s11160-014-9357-7
Yemane, D., Mafwila, S. K., Kathena, J. N., N’siangango, S. E., Kirkman, S. P., 2015. Spatio-temporal
trends in diversity of demersal fish species in the Benguela current large marine ecosystem region. Fisheries
Oceanography, 24: 102–121
Kathena, J. N., Nielsen, N., Berg, C. W., Thygesen, U. H., Jansen, T., Gordoa, A., Guijarro, B., Rademeyer,
R., Butterworth, D., Hamukwaya, H., 2015. A comparison of different assessment models for the Namibian
hake stock. Unpublished report, January 12, 2015: 15 pp.
18
Chapter 1: Introduction
1.1 Motivation
In 2012, at the International Stock Assessment Workshop at the University of Cape Town, South Africa,
Danish fisheries scientist Dr Anders Nielsen stunned the participants with a presentation on a state-of-the-art
stock assessment model (SAM). A state-space model that can be executed on a web interface so assessments
can be conducted simultaneously by many people in different places of the world. The presentation and the
subsequent discussion on SAM triggered my appetite to pursue this field. For biologists, the innovation of
assessing a stock through a web interface has made it easier to conduct assessments without going into the
technical details of the machine room.
This experience motivated me to study SAM and similar stochastic assessment techniques. However, my aim
should not be to contribute to statistic stock assessment methodology but rather to demonstrate applications of
such methodology. This would help Namibian fishery biologists continue this new line of implementing and
interpreting state-of-the-art assessment techniques.
The focus of my work has been Cape hakes, Cape monkfish and West Coach sole, the latter as a representative
of the data-poor stocks not yet assessed in Namibia.
Cape hake consists mainly of two species which in Namibia today are assessed and managed as one combined
species. Since hake in every respect constitutes the most important fishery in Namibia, I considered it a great
motivation to investigate how available knowledge from commercial catch rates together with species-specific
survey information could be used to provide new input for stock assessment allowing for separate assessments
of the two hake species. It is from this basis with SAM as a starting point that I developed clear objectives for
my PhD study with an ambition of producing a thesis that would advance the field of science and critically
discuss the results.
19
1.2 Objectives
The overall objectives of this PhD study were to produce a single-species assessment of four demersal fish
stocks off Namibia. Specifically:
Develop a splitting method for the commercial catches of the two hake species.
Use the time-series of the separated hake commercial catches to:
– Extract information from commercial CPUE to infer population abundance and seasonal
migration patterns.
– Use the same data-rich state-space assessment modelling for comparing combined hake
assessment with individual hake species assessment.
Compare results of data-rich to the data-moderate state-space assessment of monkfish.
Perform a data-moderate state-space assessment of west coast sole.
Disseminate all results to the scientific community, in particularly in the region, with the ultimate goal
of facilitating improved assessment, advice, and management in the Benguela Current Large Marine
Ecosystem.
1.3 Overview
This thesis uses data of four demersal living resources off Namibia with which I examine a series of issues
related to improving stock assessment of these resources. Although the results are specific to these species, the
assessment methods and approaches are of general relevance to many of the assessed and/or unassessed stocks
off Namibia, in the Benguela current system and elsewhere. I assess these stocks using the established
assessment methods, mainly SAM and SPiCT, currently used in ICES. These established methods are used to
perform an assessment for data-rich and/or data-moderate stocks. I describe the dynamics of these fish stocks,
present the results and discuss the new perceptions.
Chapter 2 provides background information on the Benguela Current Large Marine Ecosystem and
summarizes the biology and ecology of the four species, the fisheries that target them, monitoring programs,
20
assessment and management. The information is mainly gathered from the literature. It is of relevance to the
understanding of the role these living resources play in the ecosystem. They also provide input data to the
models used in the thesis. Finally the chapter highlights three current trends in fisheries stock assessment which
formed the background and inspiration for the current thesis: First, the increased interest in data limited
assessment methods; second, a more rigorous application of statistical methods in assessment, e.g. to quantify
confidence; and third, emphasizing transparency in model coding and model formulation.
Chapter 3 presents the contribution of the thesis. The original research is documented in papers which are in
appendices, but this chapter summarizes the findings, adds some extra content, discussion and extensions. In
Paper I, we developed the algorithm of splitting commercial catches into hake species-specific ratio. The
algorithm was presented at the International stock assessment review panel at the University of Cape Town,
Cape Town, South Africa in December 2011. Critical review and input by the panel are incorporated in the
algorithm. In Paper II, we proceeded by applying GAMs to the data source of haul-by-haul species-specific
commercial catch ratio. In Paper III, we implemented a species-specific assessment using the state-space
assessment model (SAM). Chapter 3 extends the analysis with an experiment on the significance of age-
reading bias. Finally, in Paper IV, we applied a data-moderate assessment method, the stochastic surplus
production model in continuous time (SPiCT).
In chapter 4, I express some important perspectives for the assessment and management of these demersal
living resources off Namibia. I round off with a conclusion emanating from the new findings.
The Appendixes I – IV are the four papers that were produced during this study.
21
Chapter 2: Background
In the following, I will briefly describe the Benguela Current Large Marine Ecosystem. Then I describe the
biology and ecology, monitoring programs, assessment and management of the four demersal species in the
northern Benguela, i.e. the waters off Namibia (Hutchings et al. 2009; Jarre et al. 2015). This is followed by a
discussion of three general current trends in fisheries stock assessment, specifically, looking at the
newdevelopment of state-of-the-art stock assessment tools and methods. First, the advancement in data-
moderate methods, then the more data-demanding approaches that include more biological processes, and
finally a discussion of the move to open source models.
2.1 Benguela Current Large Marine Ecosystem
The coastal region of Namibia is within the Benguela Current Large Marine Ecosystem (BCLME) (Figure 1)
(Shannon 1985; Hamukuaya et al. 2016). This ecosystem is one of the world’s four major eastern boundary
systems characterized by active upwelling (Shannon 1985). This LME is bounded by two warm water regimes:
the Agulhas on the south coast (between 36˚ and 37˚ S) and the Angola-Benguela Frontal zone in the northern
Namibia/southern Angola (Shannon 1985). The upwelling activities are generated by the intense equator-ward
wind stress pattern that exists over the Benguela current (Shannon 1985), resulting in some of the world's most
productive fishing grounds (Crawford et al. 1987).
22
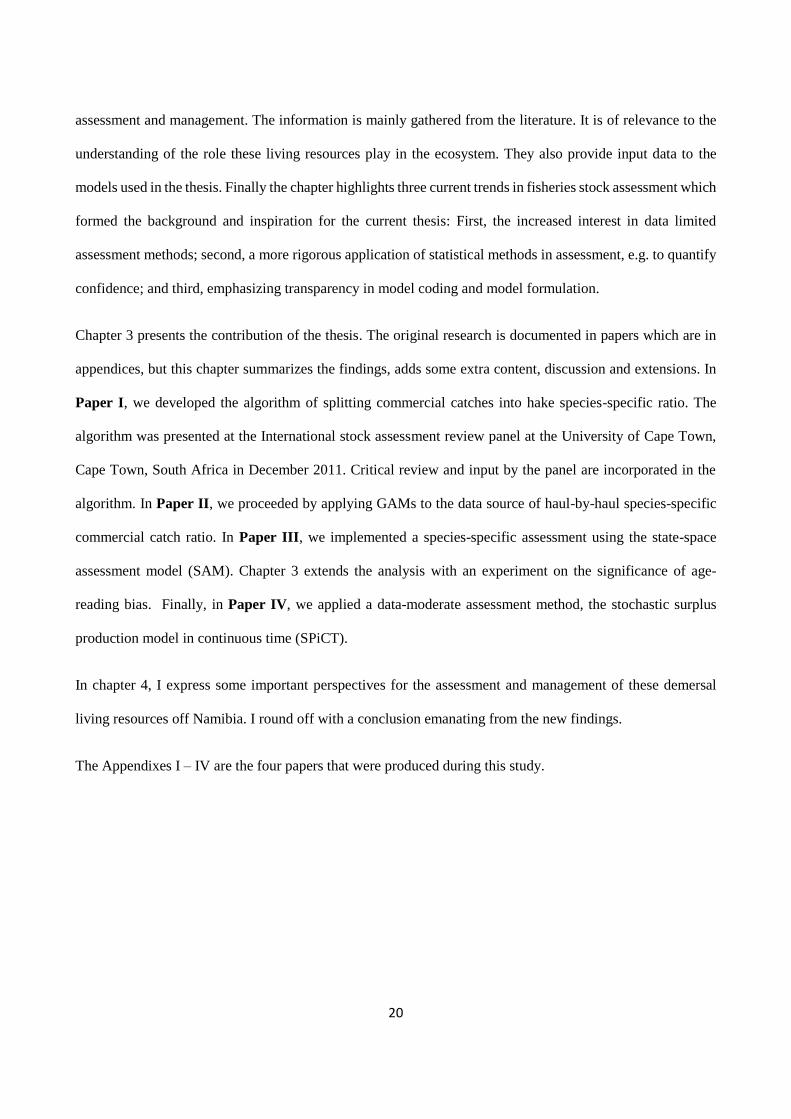
Figure 1: Conceptual image showing the main physical features and surface current in the Benguela Current
Large Marine Ecosystem. Gray shading shows continental shelf, dotted lines are front, the red arrows indicate
the warm current and the blue arrows represent the cold current. (Source: BCC, 2008).
The ecosystem is shared between Angola, Namibia and South Africa, a situation that underscores the need for
collaboration in the region to ensure sustainable utilization of all transboundary fish stocks. The BCLME is
commercially exploited by a range of key economic sectors such as fisheries, petroleum, coastal mining,
tourism and marine transportation. The total commercial catch in the Namibian EEZ in 2017 of all (finfish,
crustaceans and seals) species under quota management control was over 534 000 tonnes, of which 31% was

23
hake and 60% was horse mackerel (MFMR 2018). The Cape monkfish fishery is the third highest contributor
to the total catch, while west coast sole is the third highest contributor of demersal by-catch.
The region has experienced a number of major environmental changes that had affected the distribution and
abundance of commercially important resources (Monteiro and van der Plas 2006). The most dramatic of these
was the wide-scale advection of low-oxygen water into the northern Benguela from Angola in 1993 and 1994,
and the subsequent Benguela Niño of 1995 (Monteiro and van der Plas 2006), which appears to have severely
affected the Namibian sardine population and its major predators (particularly seals), and to have directly or
indirectly increased mortality in juvenile hake on the Namibian shelf (Hamukuaya et al. 1998). A recent study
by Rouaulta et al. (2018) observed the development and demise of the 2010-2011 Benguela Niño and
concluded that it was the warmest event since 1995.
In this thesis, the focus is on hakes, monkfish and west coast sole. These are demersal species with a common
habitat and overlapping depth and latitudinal distribution and can be found in the same hauls in what can be
referred to as a mixed fishery. Due to their habitat proximity, the removal of the directed fishery has a direct
impact on the untargeted species, hence proper assessment should be instituted to avoid depletion of the
untargeted resources.
2.2 Biology and ecology of the hake, monkfish and west coast sole
2.2.1 Stock structure
2.2.1.1 Cape hake
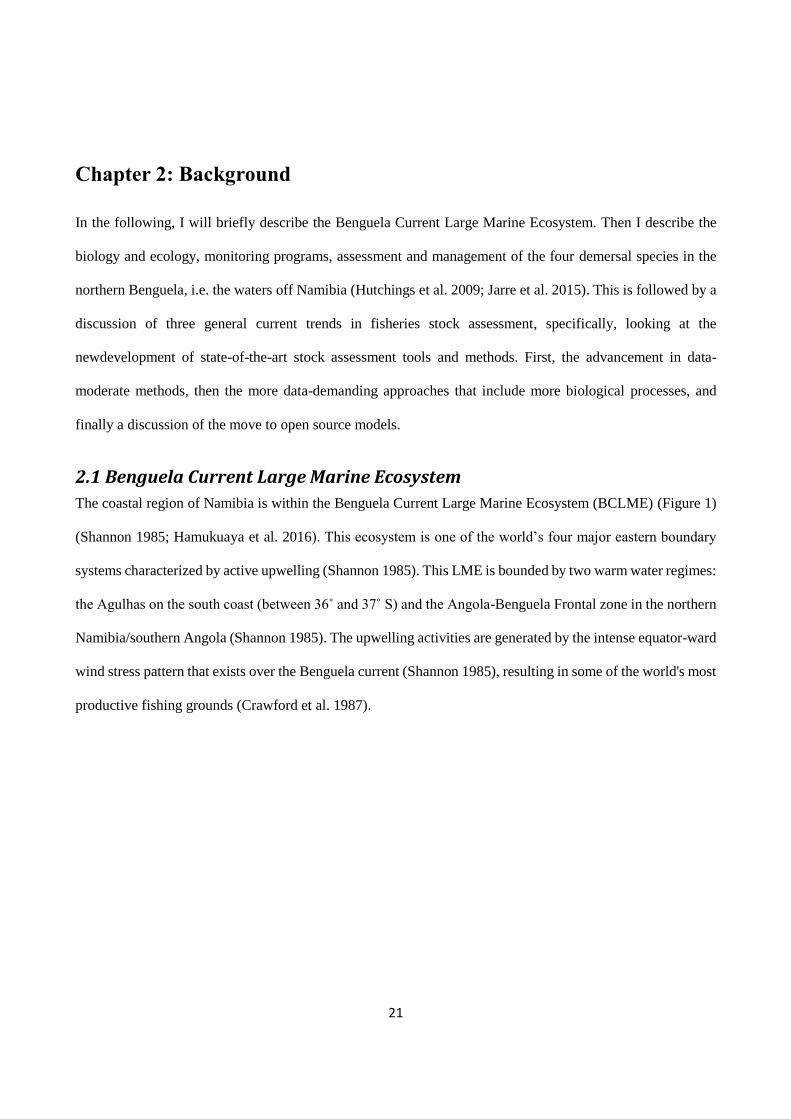
Morphologically, the two hake species; Merluccius capensis and M. paradoxus are very similar (Figure 2 a
and b, respectively) in appearance e.g. shape, structure and colour (Gordoa and Duarte 1991; Lloris et al.
2005), but differ in their number of vertebrae (von der Heyden et al. 2007), pigmentation on the gill rakers
(Bentz 1976), colour of the anal fin, otolith structure and pectoral fin shape (Gordoa et al. 1995) and genetically
(Henriques et al. 2016).
24
(a)
(b)
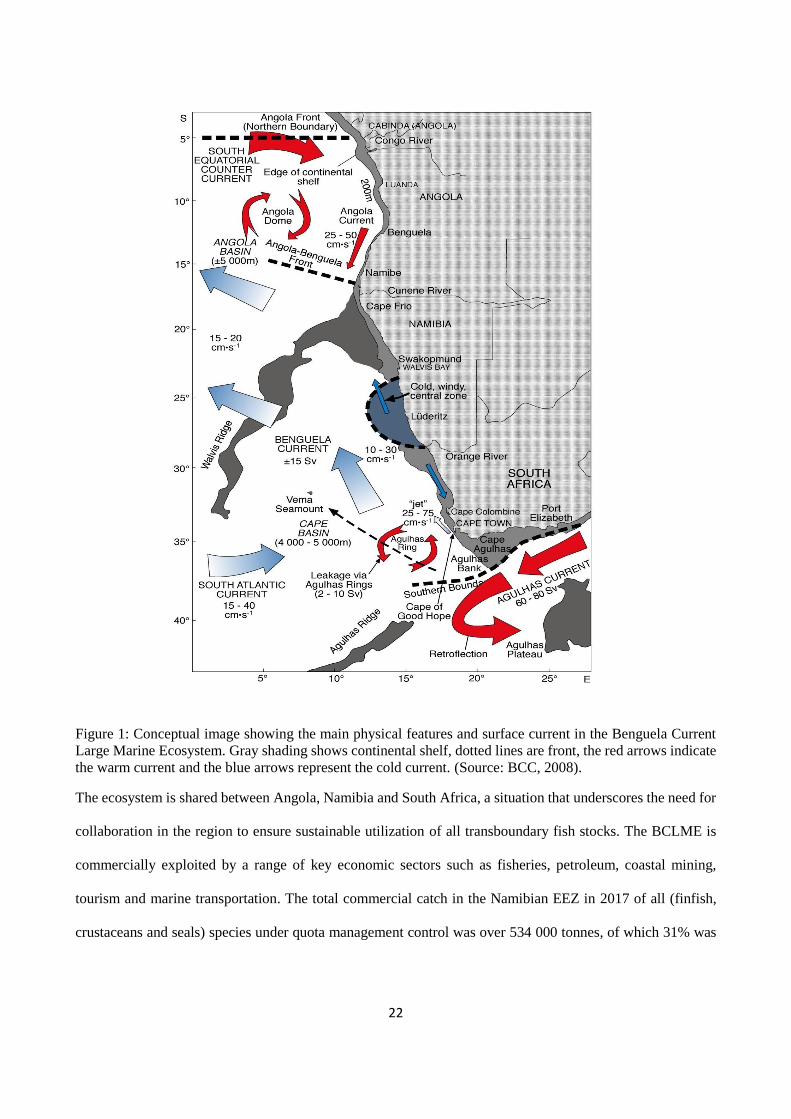
Figure 2: Images of (a) Merluccius capensis and (b) M. paradoxus (Photographs by Oddger Alvheim during a
hake annual biomass survey).
Earlier studies found varying evidence suggesting single and multiple stocks of M. capensis and M. paradoxus
(Burmeister 2005; von der Heyden et al. 2007). The most recent studies found concurring evidence of a single
M. paradoxus stock (Strømme et al. 2016; Jansen et al. 2017), and two or possibly three M. capensis stocks
(Henriques et al. 2016; Jansen et al. 2016). An analysis using a geostatistical model (GeoPop) to estimate
growth rate, mortality and spatial and temporal distribution patterns of M. capensis, has revealed some
previously unknown migration patterns, indicated natal homing and the existence of three primary population
components in the region, namely the Walvis (central and northern Namibia), the Orange (area of mixing
between the two (Southern Namibia—Northern South Africa)) and the Agulhas (Southern part of South Africa)
components (Jansen et al. 2016).
2.2.1.2 Cape monkfish
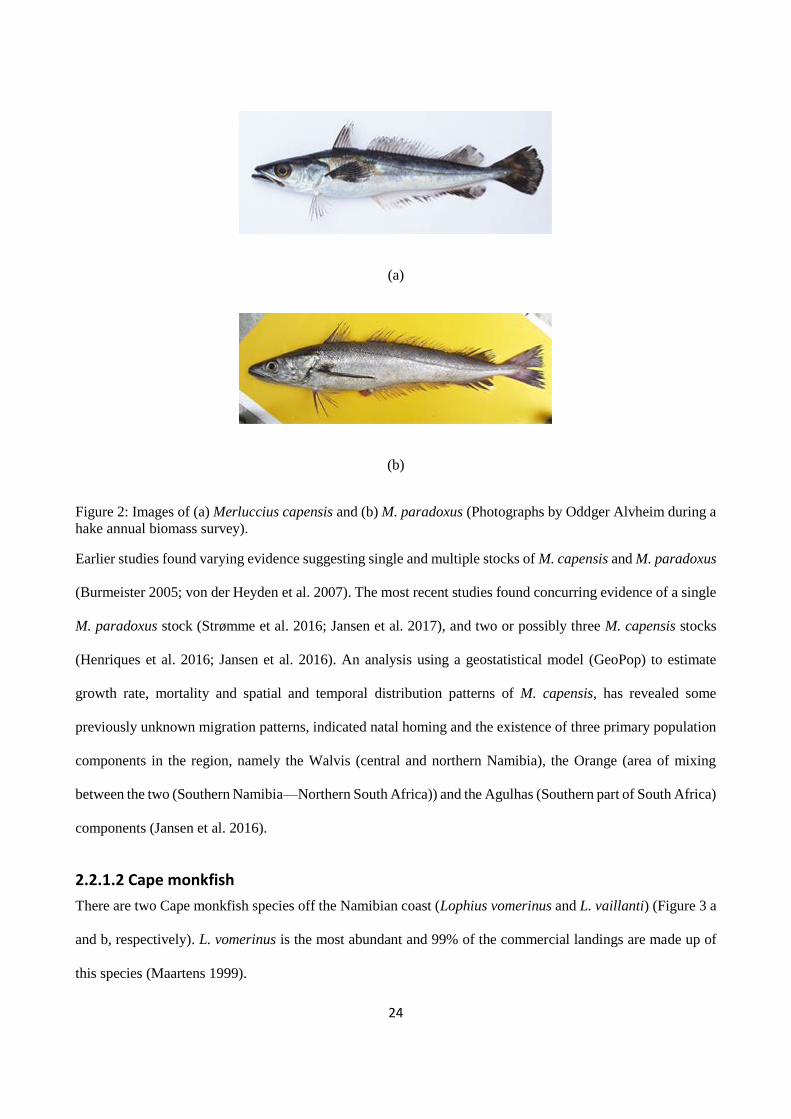
There are two Cape monkfish species off the Namibian coast (Lophius vomerinus and L. vaillanti) (Figure 3 a
and b, respectively). L. vomerinus is the most abundant and 99% of the commercial landings are made up of
this species (Maartens 1999).

25
(a)
(b)
Figure 3: Images of (a) Lophius vomerinus and (b) L. vaillanti (Photographs by John Gamatham during a 2009
monkfish annual biomass survey).
The population structure of Lophius species is poorly known. Analyses of allele frequencies revealed no
genetic differentiation between the L. vomerinus stock off Namibia and South Africa (Leslie and Grant 1990).
A study by Leslie and Grant (1990), found a high level of genetic variation in L. vomerinus off South Africa.
Generally, there is limited genetic structure, and low genetic variation in the North Atlantic species
(Crozier1989), and the species along the US east coast (Chikarmane et al. 2000).
2.2.1.3 West Coast sole
The population structure of west coast sole (Austroglossus microlepis) has not been studied, hence, it is poorly
known. The shape of A. microlepis can readily be distinguished from the other species found in the area by its
general body shape (Figure 4), relatively large size and differences in fin ray counts (Smith 1970).

26
Figure 4: Images of Austroglossus microlepis (Photographs by Oddger Alvheim during a hake annual biomass
survey).
2.2.2 Distribution and migration
2.2.2.1 Cape hake species
The geographical distribution of M. capensis and M. paradoxus covers the area from 12ºS and 14°E in Angola
to about 35ºS and 30°E off the east coast of South Africa (BCC 2012). These species are therefore among the
shared demersal stocks in the BCLME (BCC 2012). M. capensis has a higher concentration north of 27ºS while
M. paradoxus is more concentrated south of 27ºS (Botha 1985; Burmeister 2001; Johnsen and Kathena 2012).
Horizontal movements are observed for both species throughout life, shifting gradually with age indicating
substantial alongshore migration (Jansen et al. 2016; Jansen et al. 2017). In the Northern Benguela, the
distribution and migration patterns differ between the two species (Jansen et al. 2016; Jansen et al. 2017). M.
capensis juveniles appeared to move northward away from Walvis Bay, their most likely origin. As they got
older, larger and started spawning they progressively aggregate in the vicinity of Walvis Bay, the most
important nursery area (Jansen et al. 2016). Considerable quantities of M. paradoxus appeared to move
northward from the area around Orange River (Jansen et al. 2017).
The vertical distributions also differ between the two species. Both species generally move deeper as they
grow older (Gordoa and Duarte 1991; Burmeister 2001). M. capensis appeared to stay at depths between a
100-200 m when they are 0.4 to 1.4 years of age, after which they gradually migrate into deeper water (300 m
bottom depth) (Jansen et al. 2016). M. paradoxus initially appeared to move to shallow water at around 80 m
depth, and when they are 0.5 to 5 years old, they gradually move deeper and inhabit waters from 150 to 1000
m bottom depth (Jansen et al. 2017). South of 25°S the distribution of M. paradoxus extends to areas shallower
27
than 200 m depth (Johnsen and Kathena 2012). The two species mainly overlaps in areas with 350-400 m
bottom depth (Macpherson and Daurte 1991).
2.2.2.2 Cape monkfish
The distribution of Lophius vomerinus extends from northern Namibia (21˚S) in the southeast Atlantic to
Durban, Natal (30˚S, 31˚E) on the east coast of South Africa and in the northern and western Indian Ocean
(FAO, 2008). Lophius vaillanti is found in the eastern Atlantic from north of Walvis Bay (23˚S) to the Gulf of
Guinea (Maartens and Booth 2005). The bathydemersal Lophius vomerinus is found on the continental shelf
and upper slope at 150-800 m bottom depths, on soft muddy to hard sand and gravel substrate (Bianchi et al.
1999). The early life stages (egg and larvae) are pelagic (Bianchi et al. 1999).
2.2.2.3 West Coast sole
Austroglossus microlepis is distributed from northern Namibia to False Bay (34˚S 19˚E) in South Africa
(Bianchi et al. 1999; Diaz de Astarloa 2002). In the southeast Atlantic, there are three geographically distinct
stocks of west coast sole (Payne and Badenhorst 1989). Commercially exploitable quantities of an Angolan
stock lie mainly off the mount of the Zaire River, of a northern stock between 20-25˚S, south-west and north-
west of Walvis Bay and of a southern stock between 28-30˚S off the mouth of the Orange River (Macpheson
and Gordoa 1992). The northern stock is found in depths ranging from 75-300m, whereas the southern stock
has only been fished in depths of 50-100m (Macpheson and Gordoa 1992). The early life stages (egg and
larvae) are pelagic while adults live close to the seabed (Bianchi et al. 1999).
2.2.3 Age and growth
2.2.3.1 Cape hake species
M. capensis and M. paradoxus attain a maximum size of 149 and 127 cm total length and a maximum weight
of 6 and 4 kg respectively (Paulus et al. 2013).The age of M. capensis and M. paradoxus are determined from
annual rings formation on otoliths that can be counted with a microscope (Wilhelm 2012). Age determination
criteria have been reviewed during several workshops in the region (e.g. BENEFIT 2005), and routine age
reading in the Ministry of Fisheries and Marine Resources (MFMR) laboratory. Growth curve parameters of
28
M. capensis and M. paradoxus are estimated from otoliths data collected on annual hake scientific surveys
(Wilhelm 2012). The otoliths are read annually to determine the age of the fish and to develop an age-length
key (Wilhelm 2012). These data are currently used in annual hake stock assessments in Namibia (Kirchner et
al. 2012). M. capensis generally grow faster and mature younger than M. paradoxus (Chlapowski 1974; Botha
1986). Females usually grow faster than males for both species (Macpherson 1976). M. paradoxus usually
show a higher weight-at-length and lower proportion maturity at length than M. capensis (Wilhelm 2012).
A recent validation study on the annual occurrence of otoliths growth zones using seal scat samples shows that
M. capensis grow at about 12 cm year-1 (Wilhelm et al. 2013). The results of this study suggest that the current
method for age determination overestimates age and longevity and under-estimate weight-at-age, length-at-
age and maturity-at- age (Wilhelm 2012). The result of this study is not implemented in the current stock
assessment of hake.
2.2.3.2 Cape monkfish
L. vomerinus attains a maximum size of 117 cm total length and a maximum weight of 12 kg (Maartens et al.
1999). Different hard parts (otoliths and illicia) have been used to obtain age estimates for L. vomerinus
(Maartens et al. 1999). Considerable difficulties were experienced in the interpretation of growth zones in
Lophius species, especially in older fish (Maartens et al. 1999; Griffiths and Hecht1986; Duarte et al. 1997).
Maartens et al. (1999) experience difficulties using sectioned otoliths. Sectioned illicia were, therefore,
considered to be the most suitable hard structure to age L. vomerinus (Maartens et al. 1999). L. vomerinus is a
relatively slow-growing and long-lived species with a lifespan in excess of 10 years (Maartens et al. 1999).
Age determination criteria for L. vomerinus have been reviewed during several workshops through the
Namibia-Spanish bilateral agreement (Landa et al. 2013). The method was validated using length frequency
data, through cohort progression analysis. This is the method currently used in ageing L. vomerinus in Namibia
and adapted to acquire routine annual age data for current use in stock assessments (Landa et al. 2013)

29
2.2.3.3 West Coast sole
A. microlepis attains a maximum size of 75 cm total length and a maximum weight of 4 kg (Lucks et al. 1973).
Currently, there is no age information on A. microlepis.
2.2.4 Reproductive biology and recruitments
2.2.4.1 Cape hake species
M. capensis mature earlier than M. paradoxus, 50% have maturated at the age of 1.34 years and 2.8 years
respectively (Paulus et al. 2013). A recent study by Jansen et al. (2015) calculated the Gonadosomatic index
(GSI) and found the M. capensis GSI to be related to fish length for both females and male in Namibia and
South Africa. For M. paradoxus the effect of length is not significant for GSI in females in Namibia and males
in South Africa.
M. capensis and M. paradoxus spawn at different locations, depths and times (Jansen et al. 2015). Historically,
M. capensis is known to spawn in the northern Benguela in two different areas in the 1970s and 1980s:
Northern (20– 21º30'S) and Central (22ºS–25ºS) (O’Toole 1976, 1978; Assorov and Berenbeim 1983; Olivar
et al. 1988). In the 1990s and recently it appears that the spawning areas have shifted southward: Central (22–
24°S) and South (26–28°S) (Kainge et al. 2007; Jansen et al. 2015; Wilhelm et al. 2015). M. capensis spawners
were found in shallower water (Kainge et al. 2007; Jansen et al. 2015) whereas M. paradoxus spawn offshore
at depths of 200-650m (Jansen et al. 2015). M. paradoxus are known to spawn off the coast of South Africa
and the juvenile and adult fish migrate to Namibia (von der Heyden et al. 2007). In a recent study, Jansen et
al. (2015) documented a few M. paradoxus off southern Namibia (South of 25°S) with very large gonads
indicating spawning activity in Namibian waters.
Historically in the northern Benguela, peak spawning for M. capensis occurred in the shallowest waters in
spring, from September to November (O’Toole 1978; Olivar et al. 1988; Sundby et al. 2001). However, recent
studies suggest that the main spawning season is the austral winter (July–September, peaking in August)
(Jansen et al. 2015), or winter and autumn (Wilhelm et al. 2015). A few spawning M. paradoxus were observed
in August (Jansen et al. 2015). In the southern Benguela, off the South African South Coast peak spawning for
30
M. capensis is observed in summer (around January). M. paradoxus spawn along the coast of South Africa
with increased spawning intensity observed around March and August – October (Jansen et al. 2015).
A study by Voges et al. (2002) shows that optimal conditions for hake recruitment with values above the long-
term average were associated with moderate upwelling strength. Lower and higher upwelling intensities
reduced recruitment success to below average (Voges et al. 2002). Similar findings were observed by Kainge
et al. (2013). Kainge et al. (2013) also found that spawning stock biomass only affects Cape hake recruitment,
significantly when it is combined with an index of upwelling strength during the peak spawning period. The
model with the explanatory variables: spawning stock biomass and index of upwelling strength explained 88%
of the Cape hake recruitment variability.
2.2.4.2 Cape monkfish
L. vomerinus spawn flat gelatinous egg masses, called veils, into the water, which float just below the surface
(Leslie and Grant 1990). Larval L. vomerinus 15-20 mm long have been taken in pelagic fine-mesh nets, and
it is therefore estimated that the eggs and larvae remain in the pelagic zone for 4-8 weeks (Leslie and
Grant1990; Armstrong et al. 1992). During this time, surface currents can transport egg masses and larvae
between 400 -800 km (Shannon 1985). The gonad mass of a mature female in spawning condition forms up to
35-50% of the body mass (Walmsley et al. 2005), representing a considerable energetic contribution to
reproduction. Female Lophius mature at a larger size than male and spawning seasonality varies between
species and geographic area. The spawning season of L. vomerinus is austral spring (Maartens and Booth
2005). Lengths-at-first maturity are 58.2 and 39.9 cm for females and males respectively (Maartens and Booth
2005). The common reproductive strategy of Lophius, releasing eggs in single veils, may facilitate their
dispersion and that of the larvae over a great distance, which allows for their protection against predators
(Armstrong et al. 1992).
Historically, the International Commission of the South East Atlantic Fisheries (ICSEAF), and in particular
Spanish researchers, identified two separate recruitment areas; the first being off Walvis Bay (23ºS - 25ºS) at
depths between 150 and 300m and the second near the Orange River 28ºS at depths between 100 and 300 m
31
(ICSEAF 1984). These observations were confirmed by independent data collected by the Norwegian RV Dr
Fridtjof Nansen during a trawl survey in 1990. A similar observation was recently confirmed by Erasmus
(2018) through an L. vomerinus port sampling program. Erasmus (2018) has also confirmed the previous
finding that peak spawning for L. vomerinus in northern Benguela occur between July and September, similar
to earlier finds by O’Toole (1978) and Maartens and Booth (2005).
2.2.4.3 West Coast sole
Historically, the coastal water between Cape Cross (21º30'S) and Hollam’s Bird Island (24º30'S) is an
important spawning location for A. microlepis (O’Toole 1978). The abundance and length composition of
larvae indicates a relatively short spawning season from early spring until early summer, rapidly decreasing
thereafter (O’Toole 1978). Spawning was generally confined to upwelling areas within 30 km from shore and
is apparently heaviest in the vicinity of Conception Bay (24ºS) and Hollam’s Bird Island (24º30'S), and
between Cape Cross (21º30'S) and Walvis Bay (23ºS) (O’Toole 1978).
2.2.5 Feeding ecology
2.2.5.1 Cape hake species
Both M. capensis and M. paradoxus are opportunistic feeders that consume available prey, including smaller
conspecifics (cannibalism) in relation to the prey’s abundance (Roel and Macpherson 1988; Macpherson and
Gordoa 1994). Being opportunistic feeders their diet changes seasonally (Roel and Macpherson 1988). The
most common species groups in the hake diets are Krill, crustaceans, cephalopods and other demersal and
pelagic fish species (Macpherson and Roel 1987; Traut 1996). The feeding ecology of M. capensis and M.
paradoxus has been studied mainly using stomach content analysis (Macpherson and Roel 1987; Traut 1996).
The stomach content results show that M. capensis and M. paradoxus have a similar diet. M. capensis feed
actively during the day (07:00 – 13:00), while M. paradoxus feed mainly at night (01:00 – 07:00) (Gordoa and
Macpherson 1991). A recent study using stable isotopes observed that the values of C13 and N15 were
indistinguishable in smaller hake (<30 cm), of both species, suggesting these size classes shared some degree
of trophic overlap. In contrast, larger sizes (>30 cm) expressed greater differentiation in both values (Iitembu
32
et al. 2012). The trophic results also showed that large M. paradoxus feed at a higher trophic level than large
M. capensis (Iitembu et al. 2012).
Other than predation by hake, hake is eaten by many organisms such as monkfish (Gordoa and Macpherson
1991), sharks, seabirds, whales, dolphins, fur seals, snoek and other large pelagic predatory fish (Heymans et
al. 2004; Roux and Shannon 2004; Mecenero et al. 2006). Estimation of the proportion of the total hake
mortality caused by each of the predators is currently not possible due to lack of data. Payne et al. (1987)
suggested that hake is the dominant species in its habitat; hence the major predator on hake is probably hake.
2.2.5.2 Cape monkfish
Cape monkfish are opportunistic, non-selective feeders, with a common feeding strategy (Gordoa and
Macpherson1990). They are sit-and-wait predators, by camouflaging themselves in the soft sediments and
using flicking motions of their illicium to attract forage fishes (Walmsley et al. 2005). Gordoa and Macpherson
(1990) suggested that the diet of L. vomerinus could be dependent on the reaction of prey species to the lure
of the illicium. Prey species such as shallow-water Cape hake Merluccius capensis, Gobies Sufflogobius
bibarbatus and Flying squid Todarodes sagittatus, that themselves feed chiefly on mobile prey like
euphausiids, decopads, and other mobile prey items, were caught more readily by L. vomerinus (Gordoa and
Macpherson1990). Macpherson (1985) noted that L. vomerinus was a daytime predator remaining inactive
once it has captured its prey, and that food-intake was lowest during January-February and highest in June-
August. A recent study by Erasmus (2018) confirmed previously known L. vomerinus forage species such as
Jacopever Helicolenus dactylopterus, shallow-water Cape hake Merluccius paradoxus, Gobies Sufflogobius
bibarbatus, Shortnose greeneye Chlorophthalmus agazizi, West Coast sole Austroglossus microlepis etc.
Information on food habitats and diet composition of L. vaillanti is limited. Very low incidences of cannibalism
have been reported for L. vomerinus (Walmsley et al. 2005; Erasmus 2018). The diet spectrum is size-
dependent; small juveniles mainly feed on crustaceans and cephalopods, while large juveniles and adults feed
on a wide range of pelagic and benthic fish prey (Gordoa and Macpherson1990). The large L. vomerinus are
thus among the top demersal predators in the BCLME. L. vomerinus are eaten by various predacious fish
including swordfish and sharks (Ebert 1994).
33
2.2.5.3 West Coast sole
Adult west coast sole prey on worms, crustaceans, molluscs and fish such as gobies. A. microlepis constitute
a large part of the diet of monkfish (Walmsley et al. 2005; Erasmus 2018). Diet composition by percentage
frequency of occurrence and index of relative importance for L. vomerinus shows that A. microlepis is an
important prey (Walmsley et al. 2005)
2.3 Main demersal fishery in Namibia
2.3.1 Cape hake species
The hake fishery off Namibia for M. capensis and M. paradoxusis the main demersal fishery in the northern
Benguela (Burmeister 2001). This fishery is the most important commercial resource in terms of revenue,
export value and employment (Wilhelm et al. 2015). These species can be found in the same hauls. This fishery
can, therefore, be referred to as a mixed fishery.
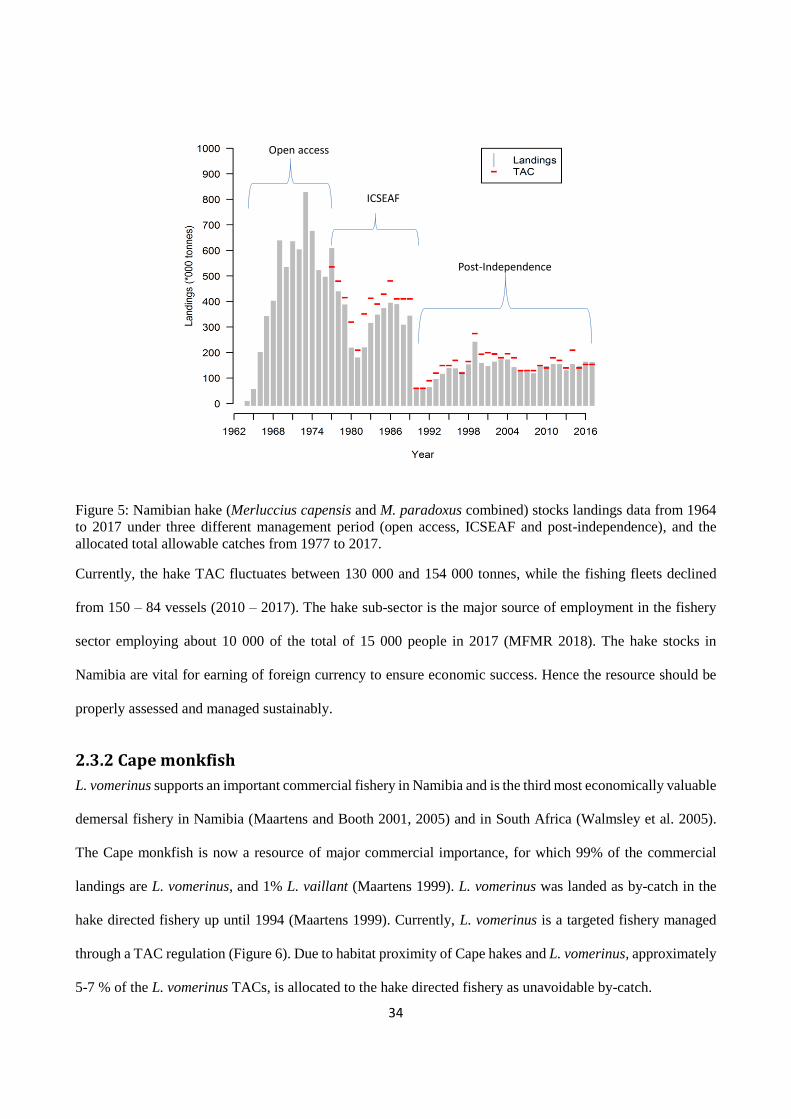
The Namibian hake fishery has a relatively long exploitation history comprising of three different management
periods (Figure 5): 1964-1976 (open access), 1977-1989 (International Commission for the Southeast Atlantic
Fisheries (ICSEAF)) and from 1990 to date (post Namibian independence). During the open access period
there were no management measures in place. The annual landings increased sharply during the 60’s and
peaked at more than 800 000 tonnes in 1973. After Namibia gained independence in 1990, the Namibian
Ministry of Fisheries and Marine Resources (MFMR) took over the management of the resources. The overall
management strategy was changed, TACs were set very low and increased gradually, but still remained
relatively low when compared to the ICSEAF period (Figure 5).
34
Figure 5: Namibian hake (Merluccius capensis and M. paradoxus combined) stocks landings data from 1964
to 2017 under three different management period (open access, ICSEAF and post-independence), and the
allocated total allowable catches from 1977 to 2017.
Currently, the hake TAC fluctuates between 130 000 and 154 000 tonnes, while the fishing fleets declined
from 150 – 84 vessels (2010 – 2017). The hake sub-sector is the major source of employment in the fishery
sector employing about 10 000 of the total of 15 000 people in 2017 (MFMR 2018). The hake stocks in
Namibia are vital for earning of foreign currency to ensure economic success. Hence the resource should be
properly assessed and managed sustainably.
2.3.2 Cape monkfish
L. vomerinus supports an important commercial fishery in Namibia and is the third most economically valuable
demersal fishery in Namibia (Maartens and Booth 2001, 2005) and in South Africa (Walmsley et al. 2005).
The Cape monkfish is now a resource of major commercial importance, for which 99% of the commercial
landings are L. vomerinus, and 1% L. vaillant (Maartens 1999). L. vomerinus was landed as by-catch in the
hake directed fishery up until 1994 (Maartens 1999). Currently, L. vomerinus is a targeted fishery managed
through a TAC regulation (Figure 6). Due to habitat proximity of Cape hakes and L. vomerinus, approximately
5-7 % of the L. vomerinus TACs, is allocated to the hake directed fishery as unavoidable by-catch.
Open access
ICSEAF
Post-Independence

35
Landing statistics for monkfish date back to 1974 (Figure 6). Landings recorded by the International
Commission for the Southeast Atlantic Fisheries (ICSEAF) between 1974 and 1989 increased to a peak in
excess of 16 000 tonnes in 1982. Since Namibian independence in 1990, the annual monkfish landings have
been increasing to a peak of around 17 000 tonnes in 1998 and decreased thereafter (Figure 6).
Figure 6: Namibian monkfish (Lophius vomerinus) landings statistics from 1974 to 2017 and the allocated
total allowable catches from 2001 to 2017.
Historically, L. vomerinus was the main by-catch in the hake fishery; however, due to the escalation of its
economic value, it has resulted in the development of a fishery targeting L. vomerinus (Maartens and Booth
2005). In 1994, a monkfish target fishery was established, managed through effort control, with limited access
and a restriction of 800 horsepower on vessel capacity (Maartens et al. 1999). Currently, the monkfish TAC is
set around 9 000 – 13 000 tones, harvested by 19 - 24 fishing vessels targeting L. vomerinus.
2.3.3 West Coast sole
A. microlepis was important commercially since 1960, but was heavily overfished (1969-1971). The landings
of A. microlepis peaked at nearly 2000 t in 1972, but have declined steeply since then, currently amounting to

36
less than 800 tonnes per year (Lucks et al. 1973; Diaz de Astarloa 2002). In the northern Benguela, A.
microlepis is commercially the only important flatfish. A. microlepis is generally captured as by-catch during
bottom trawling for demersal species such as Cape hakes and Cape monkfish (Bianchi et al. 1999).
Economically, A. microlepis is the most important by-catch species in the Namibian Cape monkfish fishery.
A. microlepis landings represent a relatively small fraction of the total demersal landings in the northern
Benguela. Landings statistics for A. microlepis from the monkfish directed fishery between 1999 – 2017 are
shown in Figure 7. The annual landings increased to a peak of around 900 tonnes in 2007 and decreased
thereafter (Figure 7).
Since 1970, the A. microlepis landings have predominantly come from the area between Rocky Point (19˚S)
and Palgrave Point (20˚30΄S) (O’Toole 1977). This was particularly evident during the peak A. microlepis
years 1971 to 1974. Only a small portion of A. microlepis landings resulted from fishing in more extensive
grounds south of Walvis Bay (O’Toole 1977).
Figure 7: Namibian west coast sole (Austroglossus microlepis) landings as by-catch in the monkfish fishery
from 1999 to 2017.

37
2.4 Monitoring
In Namibia, seven scientific surveys are conducted annually, applying methods that include swept-area bottom
trawl, mid-water trawl, acoustics, traps and pots. Each survey is directed to one of the following species: hake,
monkfish, orange roughy, deep sea red crab, horse mackerel, sardine and rock lobster. These surveys are
conducted at different times of the year. All species caught in each trawl are identified to the lowest taxa and
sampled, either as total or sub-sample counted, weighed and recorded to the nearest centimetre and gram.
Additional biological measures are taken from representative subsamples. This includes sex, weight, maturity
and otoliths for age determination. The survey information is added to the Nan-SIS database (Strømme 1992).
By law, during commercial fishing operations, each vessel is obliged to carry a fisheries observer, and a
logbook (MFMR 2000). Fisheries observers are required to sample biological information such as length, sex,
maturity. Information such as trawl position, date, time, depth, and other vessel details is captured in the daily
logbook. Commercial logbooks and biological information from fisheries observes are stored in the Fisheries
Information and Management Systems (FIMS).
2.4.1 Cape hake survey
The scientific swept-area surveys targeting M. capensis and M. paradoxus started in 1990. These surveys were
conducted by the Namibian Ministry of Fisheries and Marine Resources onboard the Norwegian R/V Dr
Fridtjof Nansen up until 1999 (Sætersdal et al. 1999). The first six years 2–3 surveys per year were conducted
and from 1997 to date only one survey per year in austral summer (January–February) (Burmeister 2001). The
survey has a target to cover about 200 fixed trawl stations each year.
Figure 8 shows normalized biomass (𝐵�̃� =𝐵𝑡
�̅�) where �̅� is the overall mean biomass and subscripts t represents
the year. We plotted normalized biomass because the swept-area survey biomass estimates only give an index,
and here the reference is the average. There is substantial year-to-year variation within and between M.
37

38
capensis and M. paradoxus (Figure 8). Further investigations and data will be required to conclude on this
recent apparent strong negative correlation between the survey results of the two hake species.
Figure 8: Normalized biomasses of M. capensis (dashed black line) and M. paradoxus (dashed red line) with
respective standard deviations shown. These indices are shown since the establishment of the hake biomass
swept-area survey by the Ministry of Fisheries and Marine Resources in 1990. Source: Data extracted from
the Nan-SIS database (Strømme, 1992), a survey database for the Ministry of Fisheries and Marine Resources.
2.4.2 Cape monkfish survey
Cape monkfish are monitored through an annual swept-area scientific survey. The surveys started in 2000
onboard the R/V Welwitchia up until 2014, and from 2015 onward surveys were conducted by R/V Mirabilis.
The survey has a target to cover about 94 fixed trawl stations each year and is conducted during the month on
November. Figure 9 shows a normalized biomass (𝐵�̃�= 𝐵𝑡
�̅� where �̅� is the overall mean biomass and subscripts
t represents the year). Normalized biomass results show a declining trend since the inception of the monkfish
scientific survey in 2000 until 2005. In 2006, the survey was not conducted. The normalized biomass was
above average between 2009-2011, and has been fluctuating above and below average until 2016 (Figure 9).

39
Figure 9: Normalized biomass of Lophius vomerinus with respective standard deviations shown. These
indices are shown since the establishment of the monkfish swept-area biomass survey by the Ministry of
Fisheries and Marine Resources in 2000. Source: Data extracted from the Nan-SIS database (Strømme
1992), a survey database for the Ministry of Fisheries and Marine Resources.
2.5 Assessment of the main demersal stocks in Namibia
In Namibia, stock assessments are the basis for advice to the fisheries managers. Mathematical models and
data from surveys and commercial fisheries are used to conduct the assessment. Hence, there is a high reliance
on statistical analysis, when providing management advice.
2.5.1 Cape hake assessment
At present, M. capensis and M. paradoxus are assessed and managed as a combined single stock in Namibia
(Kirchner et al. 2012; Kathena et al. 2016). Management advice and TAC allocation are based on a statistical
catch-at-age analysis (SCAA) model fitted to data (Kirchner et al. 2012; Radermeyer et al. 2008). This
assessment ignores species-specific dynamics. SCAA uses estimates of weight-at-age, maturity-at-age, natural
mortality and survey biomass coefficient of variation (CV) derived from M. capensis, thus ignoring the
dynamics of M. paradoxus. The current assessment is comprised of twelve different model specifications: a
base case and eleven sensitivity tests (Kirchner et al. 2012). The sensitivity tests are designed to consider
different scenarios, such as assuming age independent natural mortality, age-dependent natural mortality,

40
omitting some of the commercial information, excluding historical surveys, etc. (Kirchner et al. 2012; Wilhelm
et al. 2015). The selection of the best fit model is based on the Akaike Information Criteria.
2.5.2 Cape monkfish assessment
Currently, L. vomerinus stock is assessed annually using an Age-Structured Production Model (ASPM,
Rademeyer and Nishida 2011). Input data to the model are stock and catch weight-at-age, maturity-at-age,
natural mortality, survey biomass index, commercial catch rates, survey catch-at-age and commercial-catch-
at-age. The current assessment of L. vomerinus has indicated that the spawning stock biomass is above the
spawning stock biomass leading to the maximum sustainable yield (MSY) level.
ASPM approach involves constructing an age-structured model to simulate the population dynamics of the
stock and tuning it to available indices by maximizing a likelihood function. The number of recruits at the start
of each year is related to the previous year’s spawner stock biomass using the Beverton and Holt stock-
recruitment relationship.
2.5.3 West Coast sole assessment
A. microlepis has never formally been assessed and there are no conservation measures in place.
2.6 Management of the main demersal stocks in Namibia
Annually, for each fishery, the ministry scientists present the TAC recommendations to the Marine Resource
Advisory Council (MRAC). MRAC consists of members from the fishing industry, banking sector, labour
union, legal fraternity and fishery experts. MRAC considers the scientific advice and drafts recommendations
to the Minister of Fisheries and Marine Resources. The minister then presents these recommendations to the
cabinet, and the cabinet decides on the TAC. The cabinet decision is passed on to the Attorney General’s office
for gazette (legally-binding publication). Once gazetted, the officials from the ministry of fisheries will allocate
quotas to individual fishing right holders.
2.6.1 Cape hake management
The International Commission for Southeast Atlantic Fisheries (ICSEAF) came into force in 1972
(Butterworth and Rademeyer 2005). ICSEAF divided the Namibian coastline into three management divisions:

41
Division 1.3 (17 – 20˚ S), Division 1.4 (20 -25˚ S) and Division 1.5 (25 – 30˚ S). Management of the hake
fishery in the northern Benguela began in 1977, with the allocation of TAC by the ICSEAF (Butterworth and
Rademeyer 2005). The fishery over-caught the first set TAC.
After independence in 1990, the Ministry of Fisheries and Marine Resources (MFMR) took over the
management of the fishery. At that time the hake stocks were considered to be heavily depleted (Payne and
Punt 1995). From 1990 to 1994 the MFMR took several measures to protect the hake stocks, including a ban
on foreign fishing fleets, proclamation of a 200-mile-EEZ, according to international law, 200-m depth
restriction (no hake-directed fishing allowed shallower than the 200-m-isobath), a minimum mesh size set at
110 mm, aimed at protecting <36 cm hakes, and TAC reduced to 60 000 tonnes (HMP 2014). The government
furthermore established institutions and implemented policies to monitor fishing and regulate fishing rights in
Namibian waters, such as the introduction of the national policy on exploitation rights and quota allocation,
and the establishment of the Directorate of monitoring, control and surveillance. An observer program was
also established and all hake fishing vessels are required to carry a Fisheries Observer onboard, as well as
offload their catches at either Walvis Bay or Luderitz ports under the inspection of the Fisheries Inspectors.
The role of a Fisheries observer onboard is to ensure that the vessel complies with the fishing regulation and
to collect scientific information. In 2006, an additional measure was introduced restricting hake fishing
shallower than 300 m bottom depth south of 25 ºS (Johnsen and Kathena 2012).
During the years 1990 to 1996 TAC’s were equated to 20% of the fishable biomass estimates from the research
swept-area biomass survey. This was assumed to be a conservative approach (Butterworth and Rademeyer
2005; Butterworth and Geromont 2001). Fishable biomass in this context was defined as the biomass of fish
that have attained a total length of > 36 cm, at the time of a survey. The survey estimates during that period
fluctuated and created great uncertainty about the status of the hake resource. The reliability of this method in
setting TAC was heavily debated. These debates resulted in the development of the Interim Management
Procedures (IMP) in 1997. The IMP was structured such that it could adjust the recommended TAC up or
down depending on trends in the research survey and the commercial CPUE data (Butterworth and Geromont
2001). The purpose of the IMP’s was to provide a recommended TAC in a precautionary way and to resolve

42
the debate on the survey estimates, whether survey estimates should be treated as absolute or relative
abundance indices in stock assessment models (Butterworth and Geromont 2001). The IMP was used for
management from 1998 to 2001 and confirmed that survey estimates should be treated as relative abundance
indices in stock assessment models (Butterworth and Geromont 2001). In 2002, an Operational Management
Procedure (OMP) was implemented and served for the subsequent three years (HMP 2014). In 2005, an SCAA
model was developed. Since 2005, advice and subsequent management has been based on the output from this
model, (Kirchner et al. 2012).
2.6.2 Cape monkfish management
In 1994, fishing rights to catch L. vomerinus with a hake by-catch quota were implemented. The monkfish
fishery was managed through effort control, with limited access and a restriction of 800 horsepower on vessel
capacity until the year 2000 (Maartens 1999). From 2001 to date, the monkfish is a targeted fishery managed
through a TAC regulation (Maartens 1999). Due to habitat proximity of these stocks a certain percentage,
approximately 5-7% of the Cape monkfish TAC, is allocated to the hake directed fishery as unavoidable by-
catch. For the past decade the TAC for L. vomerinus has been fluctuating around 10 000 tons.
2.6.3 West Coast sole management
The fishery is managed by setting by-catch levies. These are set at a high level, to deter operators from
deliberately targeting this species.
2.7 Three recent trends in fisheries stock assessment
Three particular recent trends in fish stock assessment have had a major impact on designing and implementing
this thesis to produce a promising platform for improving the assessment and management of Namibian
demersal fish stocks. First, the increasing expectation by decision-makers in jurisdictions such as Australia,
New Zealand, and the United States (Punt et al. 2013), and non-governmental organizations such as Marine
Stewardship Council (MSC), that there should be quantitative stock assessments for most if not all exploited
fish. Similar interest has recently been expressed by the Namibian government, the Namibian fishing industry,
and other stakeholders that all exploited stocks should be assessed to provide scientific advice on optimal
harvesting.

43
Demands for science-based management decisions have spurred a whole new field of data-limited methods
(e.g. Carruthers et al. 2014). Alone in the USA, the requirement for annual catch limits (ACLs) has spurred
the development and adoption of at least 16 methods for establishing ACLs for data-limited fisheries (Newman
et al. 2015). Length-based assessment methods constitute an important part of data-limited methods because
it is much easier to obtain reliable length measurements of catch samples than to measure total catch or record
effort data for small-scale or non-target species (Harley et al. 2001; Kokkalis et al. 2015; Rudd and Thorson
2018). It is surprising that with a general understanding of biological parameters it is actually possible to
estimate the status of a stock (F/Fmsy) from a length distribution of the catch in just one year (Kokkalis et al.
2017). However, it is impossible to determine the cause of many small fish in the catch from a single year of
data with methods based on equilibrium assumptions. Is the cause due to strong year-classes in recent years or
to the removal of larger fish from the system? (Rudd and Thorson 2018). For such reasons and because
situations exist in Namibia where neither length or age data are available, we focused on surplus production
modelling requiring only time-series of commercial catch and biomass or catch-per-unit-of-effort data (Punt
2003; Froese et al. 2017; Pedersen and Berg 2017). We chose the method introduced by Pedersen and Berg
(2017), i.e. the stochastic surplus production model in continuous time (SPiCT) to introduce data-limited stock
assessments for demersal fish stocks in Namibia.
The perspective in the second trend is nicely formulated by (Thorson 2018): “Let’s simplify stock assessment
by replacing tuning algorithms with statistics”. Inspired by Cotter et al. (2004) it is instructive to see this as a
broader trend in a longer perspective starting by going a generation back when the development of assessment
models was very limited by computational power. Then it was natural to focus only on what could be computed
and how. Statisticians had computational tools for linear models and then for general linear models (GLMs)
but these tools did not allow much creativity in formulating a model that could explain fisheries data. Instead,
models were based on ideas like the Virtual Population Analysis (VPA); ad hoc tunings, the extended
survivor's analysis (XSA) and tracking cohorts. Then at some point, it became possible to fit parameters in a
model by writing a likelihood function (or a similar measure of fit) and maximizing this numerically with
respect to parameters. ADMB (without the Random Effect module) was a very effective tool for this. This

44
meant more flexibility in describing the stock and the fisheries, and in fitting models to the data. A problem
with these models is that they contain a large number of parameters, for example, fishing mortalities. We can’t
estimate more parameters than we have data points, so some “prior” is needed to reduce the number of degrees
of freedom. A natural way to do this is mixed-effect models, where the fishing mortalities are considered
random variables and the model specifies their joint distribution. In a time series context, it is natural to
formulate these mixed-effect models as state-space models. Here, it is important to realize that such mixed-
effect models were not computationally tractable until recently. The arrival of ADMB-RE changed this and
after that Template Model Builder (TMB) (Kristensen et al. 2016). It is now possible to write the model as the
biologists see the world, including unobserved random quantities, and then let the software integrate
unobserved random variable out and maximize over the parameters. The Thorson (2018) advocacy is in line
with the new development in the state - space model framework. State-space models are regarded as powerful
tools for modelling time-varying selectivity (Nielsen and Berg 2014) because they simultaneously account for
both process and observation errors.
Although SCAA is currently used to assess the combined hake resources off Namibia, we chose to use the new
state-space approach SAM (Nielsen and Berg 2014) in this study to represent the new trend for data-rich stock
assessment. A preliminary comparison of SAM and SCAA was carried out at the start of this PhD study
(Kathena et al. 2015). The models share many of the same assumptions and basic equations but they differ in
two important areas. First, SCAA considers observation noise only whereas SAM splits into process noise and
observation noise. Second, the hake SCAA model uses a parametric function to describe the selectivity
(relative fishing mortality of the different age groups), whereas SAM uses the random walk approach
mentioned above as an unobserved stochastic process. The main driver behind the differences observed seems
to be linked to the differences between the estimated selectivity (Kathena et al. 2015). SAM is free to estimate
the selectivity of any shape, whereas SCAA is constrained by a parametric shape. This SCAA assumption of
time-invariant selectivity considered constant in three-time blocks may explain some of the differences since
SAM selectivity estimates are time-varying.
45
The third trend in fisheries stock assessment includes more transparency in model coding and model
formulation. A decade or two ago, the analyst would show up at stock assessment workshops with their own
model, implemented in excel or in their own codes. The analyst did not share code and often only the author
had a full understanding of the model. The new Open-Source trend uses tools such as GitHub (github.org)
providing a platform for the model developer to share their models and improve assessment procedures. Such
a globally accessible repository provides increased transparency and promotes good practice. This implies that
biologists in the future can be more directly engaged in the model building because they can share available
models so that all stakeholders can reproduce the results and improve on the models.

46
Chapter 3: Contributions to the Namibian stock management,
fisheries management and stock assessment This study is aimed at contributing towards the current understanding with regards to stock assessment of
demersal fish stocks off Namibia. The contribution should lead to better-informed management advice. This
thesis developed an algorithm to estimate the hake species ratio at each commercial haul. This is achieved
through spatiotemporal models (Paper I), which utilize the species separated data from the observer
programme and/or the scientific surveys. We feed these models with logsheet information on depth and latitude
to predict the species ratio of hake species in the individual commercial trawl catches.
Using Paper I as input the thesis proceeds to estimate a species-specific abundance measure for hake at each
commercial haul (Paper II). We develop a generalized additive model (GAM) to identify factors that are
affecting the separated catch rates of M. capensis and M. paradoxus in the commercial fishing, and conclude
on hake species-specific studies by implementing a data-rich state-space assessment model (Paper III) for
two independent single-species assessment, one for M. capensis, and the other for M. paradoxus.
Finally, we applied the Stochastic Surplus Production model in Continuous Time (SPiCT) (Paper IV), a data-
moderate method, to conduct an assessment for west coast sole for the first time.
3.1 Splitting commercial catches of mixed hake into species (Paper I)
Commercial catch data are provided by the fishing industry through the mandatory logbooks. The fishermen
log the catch in each catch operation and the entire commercial logsheet database provides the scientists with
a unique and highly disaggregated dataset for research and stock assessment. However, the fishermen do not
distinguish between the two hake species M. capensis and M. paradoxus and record them by weight as one
single hake category. The work in this paper closes this gap between the aggregated hake catches and the
species-specific catches required for beginning to make single-species hake assessment for Namibia (Paper II
and Paper III).
47
We developed models that predict the hake species ratio from explanatory variables including latitude and
depth. The input to these generalized linear models (GLM’s) was the species proportion by weight in samples
from the commercial hauls obtained through the observer sampling programme. The robustness of the splitting
method was examined by comparing differences in model output when the input data instead was taken from
the scientific surveys. To facilitate these comparisons, uncertainties were taken into account raising survey
catches to adjust for size and species-dependent escapement under the fishing line (which does not occur with
the commercial trawl, because there is no gap between the fishing line and the ground gear) and then reducing
catches by the codend selectivity in the commercial trawl (since codend selectivity in the survey trawl is
negligible for commercial hake sizes). Finally, the selected model was used to split catches in the logbook into
species, providing a dataset with catch per species in the individual commercial hauls. The process and data
flow are illustrated in Figure 10
This work was fully detailed and published in African Journal of Marine Science in 2012 as: Johnsen, E.,
Kathena, J., 2012. A robust method for generating separate catch time-series for each of the hake species
caught in the Namibian trawl fishery. African Journal of Marine Science, 34: 43–53. This peer-reviewed paper
is attached as paper I in the present thesis (see Appendix I).

48
Figure 10: Flowchart illustrating the steps and data used in predicting the species catch ratio by weight in
commercial catches. Note independent models of species ratio by weight with depth, latitude and (year,
quarter) were developed from survey data and observer data respectively.
A brief description of the methods and highlights of the results are given below.
3.1.1 Data
Commercial samples were extracted from the Fisheries Information and Management Systems (FIMS)
database administered by NatMIRC. These samples were collected by fisheries observers onboard the
commercial trawlers. This involved samples from selected hauls for length measurements (200 fish) and/or
biological measures (80 fish) such as sex determination and maturity staging. Raising to the total catch was
done by the ratio of total weight to estimated sample weight. The commercial trawlers use a minimum codend
mesh size of 110 mm, allowing some escapement of small hake, and the majority of the trawlers used trawls
with a vertical net opening of 4-8 m (Johnsen and Iilende 2007).
Survey length frequency distribution data were obtained from the NAN-SIS database of demersal biomass
surveys conducted by NatMIRC (Strømme 1992). There were 15 surveys in January –February (austral
Survey datacatch in numbers and weight by
species, length, haul
Observer dataSpecies and length distribution of
commercial catches (by haul)
Number of fish caught if a survey trawl was replaced by a
commercial trawl at that station
Escapement probability (Jorgensen et al 2007)
Length Weight key
Catch in weight by species by haul
Paper 2(Uses catch rates
by species by
haul)Species ratio in weight by depth,
latitude, (quarter, year)
Paper 3(Uses catch in numbers by
species by age)Catch in numbers and weight by
species length, haul, if survey had been conducted with the
commercial trawl
Logbook DataCatches of hake in weight per haul (both species combined)
Numbers of fish caught if there was no escapement under the
trawl
Convert species -specific length frequency to weight using the LWR
fro m survey
Species ratio in weight by depth, latitude, (quarter, year) , if survey had been conducted
with the commercial trawl
Models of species ratio by weight, depth, latitude (year, quarter)
Age Length Key from surveys
and length frequency from
commercial observers data
Paper 1
Selectivity of commercial trawl (Galvez and Rebolledo 2005)
Models of species ratio by weight, depth, latitude, (year, quarter)
Catches in weight by species by haul by model
Catches in weight by species by haul by model
Model selection and validation
Final model of species weight ratio by depth and latitude

49
summer) from 1993 to 2008 and five winter/autumn surveys in April - June and September - November
(Burmeister 2001). The survey vessel used a Gisund Super two-panel bottom trawl with 20 mm outer-codend
mesh, lined with 10 mm inner-net, with the vertical net opening of 4.2-4.5 m. From each trawl haul, a total
catch or a sub-sample of M. capensis and M. paradoxus was measured for fish total length (TL). Sub-samples
were raised to the total catch by weight.
3.1.2 Modelling
We made two sets of GLM models, one using the observer data, and another using the survey data. However,
to make these models compatible, the data from the survey trawl was preprocessed to simulate comparable
data from the commercial trawl. This preprocessing included two steps:
1. We first considered the species-and size-dependent escapement under the fishing line that was
demonstrated by Jørgensen et al. (2007) using the Gisund Super trawl. They mounted a collecting bag
under the trawl so that all fish escaping under the fishing line was captured in the collecting bag.
Assuming that neither M. capensis nor M. paradoxus escaped above the headline of the trawl, the
proportion of fish retained by the trawl at each of the trawl stations was calculated as the number of
fish in the codend divided by the total number of fish in the codend and in the collecting bag for each
class. Jørgensen et al. (2007) modelled retention (r) as a function of fish length (l) by a logistic
regression with the logit link function
r(l) = exp (𝑎+𝑏𝑙)
1+exp (𝑎+𝑏𝑙)
= 1(1 + 𝑒𝑥𝑝(−𝑏(𝑙 + 𝑎/𝑏)))⁄
wherea and b are generic parameters. From the bag-experiments, they estimated consistently negative
values of b for both species implying that retention decreased with increasing fish length, i.e. larger
fish escape under the fishing line more frequently than small fish. The parameter a was estimated
positive giving positive values of L50 = -a/b, the length at which retention has decreased to ½. We
used averaged values of a andb from their bag-experiments.
However, to account for the considerable variations in haul-specific retention curves obtained by
Jørgensen et al. (2007), we used stochastic simulation (see input data in Table 2 Paper I) to generate
random a and b parameters by the “mvnorm” function (Venables and Ripley 2004) in R. The retention
parameters for M. capensis were considered independent of the retention parameters for M. paradoxus.
Thus for each survey station, we simulate two new independent retention curves for the two species.
Figure 11 shows 20 such curves for M. capensis (top graph) and 20 curves for M. paradoxus (middle
graph). The escapement is considerably smaller (i.e. higher retention) with a narrower distribution for
M. capensis than the more variable and pronounced escapement increase with fish size for M.
paradoxus.
This first step was concluded by dividing for each survey station the catch rate by species and length
class by a simulated survey selectivity (r) to obtain the estimated catch if there was no escapement
under the fishing line (Eq. 2 Paper I)

50
2. The second step addresses the difference in codend selectivity between the two trawls. We use standard
S-shaped selection curves (a<0, b>0, Table 2 Paper I). Since no study had been conducted on codend
selectivity in the Namibian hake fishery, we extracted the selectivity parameter from a study by Galvez
and Rebolledo (2005). Galvez and Rebolledo (2005) studied codend mesh size selectivity of bottom
trawl nets in the Chilean hake (Merluccius gayigayi) fishery for four mesh sizes openings in the codend
(100, 110, 130 and 140mm mesh openings) and using a covered codend method. Simulations of the
applied codend mesh size selectivity for Namibian hake fishery are shown in Figure 11 (bottom) using
a 110 mm codend. All the selection runs in Figure 11 take into account the fact that species-specific a
and b parameters are not entirely independent (covariance is given in Table 2 Paper 1 based on
Jørgensen et al. (2007) for the retention and Jørgensen et al. (2006) for codend selectivity of cod).
This second step was concluded by multiplying the catch rates with this simulated codend selectivity
of hakes in the commercial trawl. Converting catches to weight the proportion of M. capensis in the
catch at each survey station could be calculated (spr Eq. 6 Paper I).
Figure 11: Simulated retention curves and simulated mesh size selectivity (n=20). The two top panels express
that large fish are able to escape under the fishing line while the bottom panel shows that small fish can escape
through the mesh;(top panel) Merluccius capensis, (middle panel) M. paradoxus and (bottom panel) used to
simulate codend mesh size selection in the commercial trawl with a 110 mm codend (Figure 1 from Paper I).

51
We applied GLMs to derive the spatial-temporal patterns of species ratio using temporal (year, quarter) and
spatial (latitude, depth) data from the observer and survey datasets. The modelling was done to establish factors
affecting the species ratio since the fishery is unevenly spread in time and space across a gradient. Modelling
of the species ratio (M. capensis and M. paradoxus) was implemented with species ratio as the response
variable. The explanatory variables used are latitude, depth, year and quarter. The models applied in this study
are listed in Table 1 and 2. The model fitting was done in R (R core Team, 2012) using the lm (package)
(Wood, 2011). Model selection was based on the explanatory power of the different variables and chi2-based
tests of the residual deviance and p-value. Model 1 in both tables provided the best fit for both data and was
selected for further analysis.
Table 1: Model specification for the survey length species ratio, called spr in Eq. 6 Paper I
Model # Predictors
1 (LSR ~ depth + latitude, family = binomial(link=logit))
2 (LSR ~ depth + latitude + quarter, family =binomial(link=logit))
3 (LSR ~ depth + latitude + quarter + year, family = binomial(link=logit))
4 (LSR ~ depth + latitude + year, family = binomial(link=logit))
Table 2: Model specification for the observer species ratio, called spro in Eq. 7 Paper I
Model # Predictors
1 (SPR ~ depth + latitude, family = binomial(link=logit))
2 (SPR ~ depth + latitude + quarter, family = binomial(link=logit))
3 (SPR ~ depth + latitude + quarter + year, family = binomial(link=logit))
4 (SPR ~ depth + latitude + year, family = binomial(link=logit))
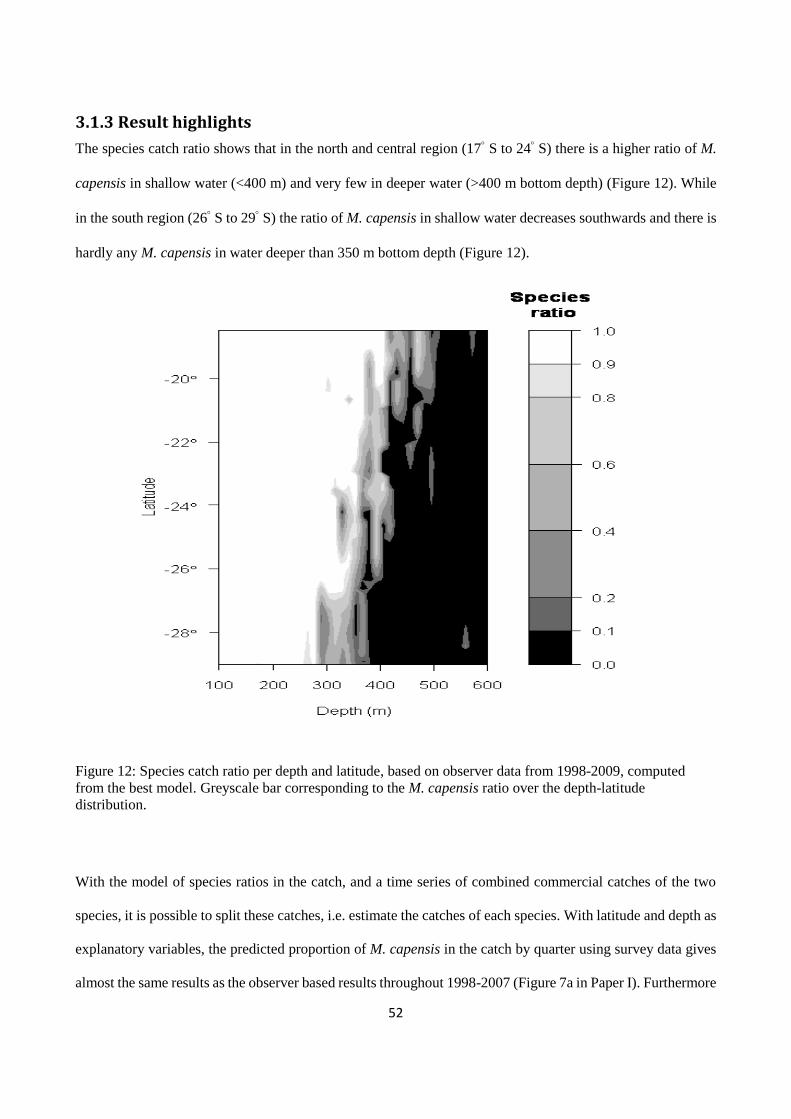
52
3.1.3 Result highlights
The species catch ratio shows that in the north and central region (17 S to 24 S) there is a higher ratio of M.
capensis in shallow water (<400 m) and very few in deeper water (>400 m bottom depth) (Figure 12). While
in the south region (26 S to 29 S) the ratio of M. capensis in shallow water decreases southwards and there is
hardly any M. capensis in water deeper than 350 m bottom depth (Figure 12).
Figure 12: Species catch ratio per depth and latitude, based on observer data from 1998-2009, computed
from the best model. Greyscale bar corresponding to the M. capensis ratio over the depth-latitude
distribution.
With the model of species ratios in the catch, and a time series of combined commercial catches of the two
species, it is possible to split these catches, i.e. estimate the catches of each species. With latitude and depth as
explanatory variables, the predicted proportion of M. capensis in the catch by quarter using survey data gives
almost the same results as the observer based results throughout 1998-2007 (Figure 7a in Paper I). Furthermore

53
the effect of including quarter as an explanatory variable appears negligible when based on observer data.
Figure 7c (Paper I) also demonstrates that although our simulations result in considerable variation in the M.
capensis species proportions (spr) with increasing species overlap (spr between 0.3 and 0.7 in Figure 3 Paper
I), this variation seems to disappear when calculating the quarterly averages using percentage of M. capensis
in the individual hake catches by stations as relative weights. Figure 13 shows the estimated yearly commercial
catches time series of M. capensis and M. paradoxus for the period 1998-2014. The catch trends are very
similar throughout the studied period. Nearly 70% of the landings from the hake directed fishery was estimated
to be M. paradoxus.
Figure 13: Stacked total catch of M. capensis and M. paradoxus in tonnes from the hake trawl fleets off the
Namibian coastline for the period 1998 –2014, representing annual catch input to Paper II.
3.1.4 Discussion
This analysis of species catch ratio was based on species-separated survey and observer data. Both datasets are
subsampled onboard commercial vessels during fishing operations and onboard the research vessel during the
scientific surveys. GLM’s were applied to these datasets to determine the factors affecting the species catch
ratio. GLM analysis demonstrated the value of considering depth and latitude when estimating the species
catch ratio. Our results support previous and more recent findings (Gordoa et al. 1995; Strømme et al. 2016;
0
20000
40000
60000
80000
100000
120000
140000
160000
19
98
19
99
20
00
20
01
20
02
20
03
20
04
20
05
20
06
20
07
20
08
20
09
20
10
20
11
20
12
20
13
20
14
Tota
l Cat
ch in
to
nn
es
Year
M. capensis M. paradoxus
54
Jansen et al. 2015; Henriques et al. 2016) that, M. capensis and M. paradoxus in the northern Benguela have
partially overlapping depth-latitudinal distributions where more than 75% of the M. Capensis are found
shallower than 300m depth while the same percentage of M. paradoxus is found deeper than 300 m depth
(Burmeister 2001). Overlapping distributions and the morphological similarities have led to the recording of
the two hake species as one single hake category in the commercial landings. Thus, species-specific
assessments of the two hake species in the northern Benguela have not been conducted. We show here that
species separated data from surveys and observer programme can be used to split the commercial catch into
species-specific catches of each commercial haul.
The survey data was preprocessed to account for escapement under the fishing line and the codend mesh size
selectivity. Furthermore, both availability to and escapement from the trawl vary between species and with
fish size and are also affected by individual behavioural and ecological factors such as changes in the
environment, and an individual’s motivation, for example, spawning and feeding. All these factors will
certainly affect the relationship between the relative catch of each species (Hjellvik et al. 2003). The use of
empirically based and realistically wide-ranging selectivity curves cannot compensate for unknown factors
such as the position of fish in the water column and their reaction to the survey vessel and catching equipment.
Jørgensen et al. (2007) also concluded that further bag-experiments are required to understand the marked
depth and fish size effects on escapements of M. paradoxus. Thus, at present, it is still not known what causes
the difference between the proportion of M. paradoxus as a function of depth in the survey data and in the
observer data.
The observer sampled data onboard the commercial fishing fleets have some advantages. First, the seasonal
sampling coverage of the observer data is much higher than in the surveys. Second species proportions based
on commercial samples are not affected by the uncertainties in the retention modelling as it is for the survey.
However, the disadvantages of using observer data are some risk of mis-species identification (cf Figure 4,
Paper I) and sampling biased towards larger vessels. But everything taking into account has favoured the
observed based species splitting model.

55
The spatiotemporal variability in the distribution of the two hake species and the developed procedure may
lack flexibility during periods of abrupt species displacement, as occurred in 1994 when large amounts of
juvenile M. capensis migrated offshore to avoid hypoxic water and were subsequently caught by commercial
trawlers (Hamukuaya et al. 1998). A model that allows for changes in the spatial pattern in species ratio (spro)
over time could be an important extension of the current splitting procedure. Furthermore, Paper II indicates
that for example vessel (gear) characteristics also have an effect on spro. Commercial size classes used as a
categorical variable should also be pursued. Possibly this also gives rise to significant interactions between
variables and the task of improving the species splitting algorithm and examining their consequences on the
assessments deserves a PhD study in itself.
In conclusion, the hake species splitting for Namibia is still to be considered a challenge in particular
concerning escapement under the fishing line if survey information is used. With increased computational
abilities in the future, it should become feasible to implement an integrated approach such as using all data
simultaneously in performing splitting by length and GAM CPUE standardization (Paper II and section 3.2.2)
3.2 Commercial catch rate analysis (Paper II)
Based on the results from paper 1, commercial catch rates or catch-per-unit- of effort (CPUE) of M. capensis
and M. paradoxus have been calculated for each trawl haul that targeted hake in Namibian waters from 1998-
2014. These data are potentially useful as input to stock assessment models. Many assessment models, be they
data- limited, data-moderate or data-rich, use CPUE as a relative index of fish stock abundance. However, the
annual mean of CPUE by haul cannot be used directly in stock assessment models because the fishery is
unevenly spread in space and time across a gradient that affects the CPUE. The CPUE of a single haul is
affected by many other factors than the total fish stock abundance, such as the time of the day, the fishing
vessel characteristics, and the position. Not accounting for these factors may, therefore, bias the CPUE index
and lead to wrong conclusions. The utility of indices of abundance based on catch and effort data can thus be
improved by standardizing them; that is, removing from the data any variation due to effects other than fish
abundance (Punt et al. 2000). This process is often referred to as catch-effort standardization.

56
The aim of this study was to standardize the dataset of haul-by-haul species-specific catch and effort data. The
study identifies factors (time, position, depth, vessel and light levels) affecting the CPUE of M. capensis and
M. paradoxusso that the effect of these factors can be removed from the CPUE time series. Furthermore, the
estimation of these effects provides ecological and behavioural information of these species in northern
Benguela.
This work was fully detailed and published in African Journal of Marine Science in 2018 as: Kathena, J.N.,
Yemane, D., Bahamon, N., Jansen, T., 2018.Population abundance and seasonal migration patterns indicated
by commercial catch-per-unit-effort of hakes (Merluccius capensis and paradoxus) in the northern Benguela
Current Large Marine Ecosystem. African Journal of Marine Science, 40(2): 197-209
https://doi.org/10.2989/1814232X.2018.1476264. This peer-reviewed paper is attached as paper II in the
present thesis (see Appendix II).
A brief description of the methods and highlights of the results are given below.
3.2.1 Data
We used a unique dataset of haul-by-haul species-specific catch and effort data, which was developed in Paper
I, where total hake catches had been split into M. capensis and M. paradoxus based on the observer data-based
model. The size of the database was approximately 764 633 individual trawl hauls for the period 1998-2014.
The datasets contained haul-by-haul commercial trawl catches of M. capensis and M. paradoxus by vessel ID,
vessel type (wet trawler or freezer trawler), vessels characteristics (gross registered tonnage, length, and
horsepower), trawl position, date, time and depth.
3.2.2 Modelling
We used GAMs to model the catch rates (CPUE, in Kg per hour-of-trawling) of species (either M. capensis or
M. paradoxus), with catch-per-species as the response variable and the effort (trawl duration in hours) as an
offset variable. We developed nine GAMs, for each species using different combinations of the explanatory
variables; time, latitude, depth, light levels and vessel. The model with the lowest AIC value for each species
was selected as the best model.

57
3.2.3 Result highlights
Standardized catch rates for M. paradoxus were significantly higher than catch rates of M. capensis. The
temporal patterns in the time-series of the two species were similar and indicated a series of low values between
2002 and 2007 and a peak in 2011 (Figure 14). Yearly distribution maps also indicated interannual variations
(Figure 15). The M. capensis distribution (Figure 15 a and b) shows a shift in distribution towards deeper water
in 2011, while M. paradoxus shows a higher density around 17˚ S in the year 2014, which was not observed
the previous year (Figure 15 c and d).
Figure 14: Yearly effect of catch rates of Merluccius capensis and M. paradoxus in the northern Benguela
system, predicted by generalized additive models (GAMs) model # 1. The thin dashed lines represent the 95%
confidence interval from the GAM and the central line is the predicted mean. The upper limit confidence
interval extends to 7600 kg/hr for M. paradoxus in 2011 (Figure 3a from paper II).

58
Figure 15: Yearly difference in spatial distribution of catch rates according to depth and latitude of (a, b)
Merluccius capensis is 2010 and 2011, and (c, d) M. paradoxus in 2013 and 2014, respectively, in the northern
Benguela system (Figure 6 from paper II).
3.2.4 Discussion
We standardized the dataset of haul-by-haul species-specific catch and effort data and described seasonal
patterns. Seasonal migration patterns were found to correspond to the known spawning areas and season for
M. capensis and M. paradoxus. The study also found that yearly standardized CPUE time-series are
problematic as proxies for total stock abundance because of spatial coverage issues. Consequently, such CPUE
data should not be used for stock-size assessment and fisheries advice concerning northern Benguela hake until
this is solved.

59
The present analysis of catch rates was based on the data set produced by applying the method developed in
the paper I, i.e. on model output rather than raw data. This is in itself not uncommon in fisheries science when
computational or practical reasons prohibit integrated models that are based directly on raw data. This approach
does, however, violate the assumptions of statistical analyses, so that care is needed. The splitting algorithm
developed in paper I relies on covariates which affect the species ratio; for example, the depth, and the present
study examines among other factors the variation with depth in the CPUE of each species. This double use of
covariates, such as depth, implies a spill-over of uncertainty: an error in how the species ratio varies with depth
will imply an error on the species splitting and therefore the species-specific catches, and this could then be
interpreted wrongly as a depth pattern in the abundance of each species. It is difficult to quantify the uncertainty
that arises from this double use of covariates, without conducting a major simulation study. It would be
preferable to construct an integrated study that builds on raw data and which includes both species ratios and
the CPUE. However, given the complexity and alarge number of observations, this was not practically possible.
Future improvement in computational abilities may make such an integrated model feasible.
3.3 Combined hake assessment vs single species hake assessments (Paper
III)
Traditionally, and presently, the two species M. capensis and M. paradoxus off the Namibian coast are assessed
combined as a single stock, using the Statistical catch-at-age analysis (Butterworth and Rademeyer 2005;
Kirchner et al. 2012). The reason for this has been that fishermen do not distinguish the two species, but record
the commercial catch data in the logbooks as one hake species. However, differences in biology and ecology
suggest that the species should be managed and assessed separately. The work in Paper I and subsequent work
in Paper II closes this gap between commercial catch data and species-specific assessments. Hence, in this
paper, we perform the first species-specific assessments using the state-space framework. We apply three state-
space models to assess hake stocks off Namibia: two independent single-species assessments, one for each
species, and one combined assessment which treats the two species as a single stock.
This work was fully detailed and published in Environmental Development in 2016 as: Kathena, J.N., Nielsen,
A., Thygesen, U.H., Berg, C.W., 2016. Hake species (Merluccius capensis and M. paradoxus) assessment in

60
the Benguela Current Large Marine Ecosystem. Environmental Development, 17: 193–201,
http://dx.doi.org/10.1016/j.envdev.2015.11.011. This peer-reviewed paper is attached as paper III in the
present thesis (see Appendix III).
A brief description of the methods and highlights of the results are given below.
3.3.1 Materials and Methods
3.3.1.1 Input data
In this paper, we use data for Namibian hake stocks for the period 1998-2012. We used the estimated numbers-
at-age (ages 0-8 years) from surveys and commercial catches. Otoliths samples, from which the age
information are derived, are collected annually during the summer swept area biomass survey. The maturity
ogives for the two hake species are calculated annually for assessment purposes and to describe the species-
specific age at maturity
For the combined assessment, we need maturity ogives and weight-at-age, but we only have these for the
separate species. The species combined maturities and weight-at-age were calculated as the weighted mean of
the species-specific value, with weights being the numbers-at-age proportions by species as estimated by the
species-specific assessments.
3.3.1.2 Fundamental of SAM
Traditional single species fish stock assessment is based on cohort analysis, where the models track the number
of surviving individuals in a cohort. This number decays according to the equation
𝑁𝑡+1 = 𝑁𝑡 ∗ e−(𝑀+𝐹)
where 𝑁𝑡 is the number of fish alive at time t, 𝐹𝑡 is the yearly fishing mortality and M is the natural mortality.
Fishing and natural mortality are to be understood as average mortalities over the year, that apply to this cohort.
61
The number of individuals that die is equated to 𝑁𝑡 − 𝑁𝑡+1, and out of these a fraction𝐹
𝑀+𝐹 are fished while
the remaining fraction 𝑀
𝑀+𝐹 die of other causes.
Therefore, the catch of that cohort during the year is;
𝐶𝑡 = (𝑁𝑡 − 𝑁𝑡+1) ∗𝐹𝑡
(𝐹𝑡+𝑀)
A basic problem of fisheries assessment is that there are too many unknowns in these equations. The natural
mortality M is really unknown but typically assumed known and constant. Even with this simplification, for
each year and each cohort, the abundance N and the fishing mortality F are unknown, and only the catch C is
known (assuming the data-rich situation where the age-structure of the commercial catch is known). This
contrasts the desirable situation in statistics, which is that there are many more data points than parameters to
be estimated. Survey data helps this situation by providing independent measurements of the abundances N.
To reduce the number of unknowns even further, one approach is to assume a multiplicative structure, where
the fishing mortality 𝐹𝑎,𝑡 on age group a in year t can be written
𝐹𝑎,𝑡 = 𝐹𝑎 ∗ 𝐹𝑡
The motivation for this structure is that fishing techniques remain constant, so that the relative mortalities on
the different age groups do not vary between years, but that the overall fishing mortality𝐹𝑡varies from year to
year.
A more modern approach to assessment models is to make use of mixed effects models, where the abundances
N and fishing mortalities F are not considered unknown parameters, but rather unobserved random variables.
The model assigns prior distributions to abundances and fishing mortalities, and when the model is confronted
with data, posterior distributions of N and F arise, from which the final estimates and confidence intervals are
computed.

62
In SAM, this rule consists of the cohort equation, with some noise added in the logarithmic domain, while the
fishing mortality for each year class is a random walk in the logarithmic domain. The motivation for the
logarithmic domain is that uncertainty is relative; it also implies that the abundances and fishing mortalities
necessarily stay positive. The random walks of the fishing mortalities may be correlated between age classes,
with the same motivation as the multiplicative structure. The recruitment model needs to be specified, i.e. the
abundance of the youngest year class. One may assume a stock-recruitment relationship, but SAM recognizes
that the spawning stock biomass holds very little information about next year's recruitment, and therefore
assumes that the each year's recruitment is simply a random variable independent of everything else.
3.3.2 Results highlights
The trends in the estimated spawning stock biomasses and fishing mortalities are similar between the species-
combined assessment and M. capensis species-specific assessment (Figure 16 and 17). The spawning stock
biomass for M. paradoxus followed different patterns than M. capensis (Figure 16). While the species-specific
assessment for M. capensis shows an increase in the later years the abundance of M. paradoxus has remained
more or less constant of the whole time-series. The Fbar for M. paradoxus is higher than the Fbar for the
combined-species assessment (Figure 17).
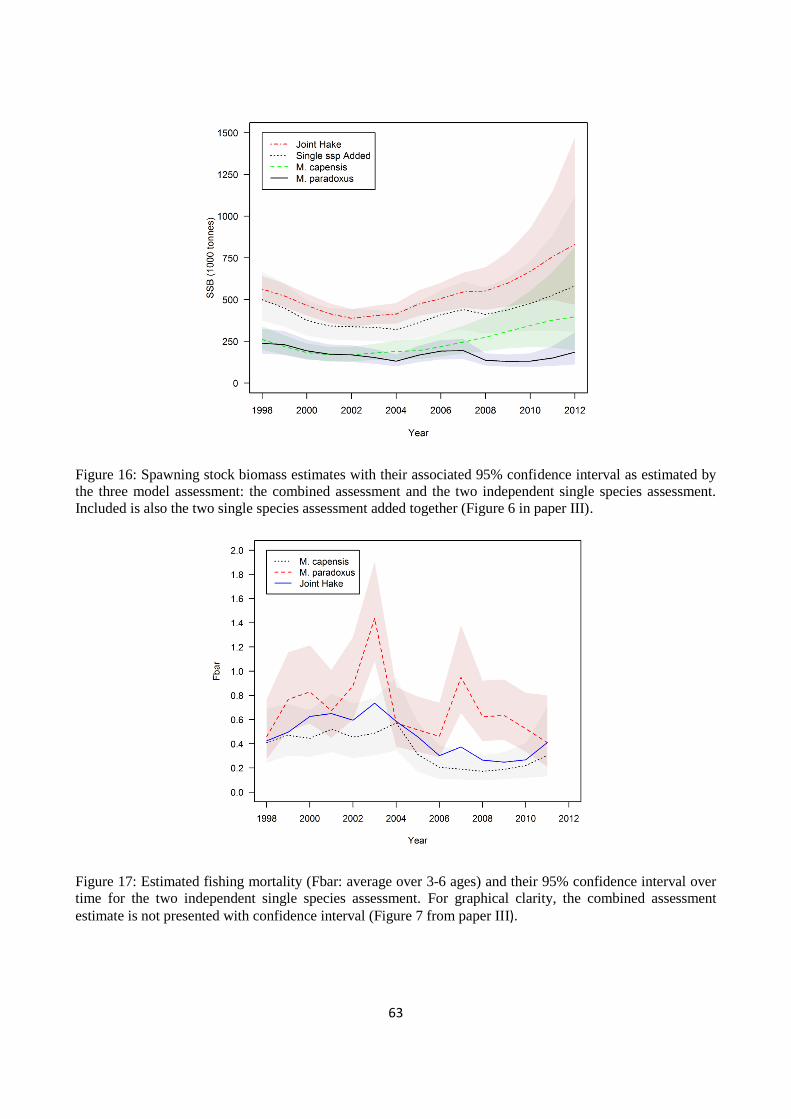
63
Figure 16: Spawning stock biomass estimates with their associated 95% confidence interval as estimated by
the three model assessment: the combined assessment and the two independent single species assessment.
Included is also the two single species assessment added together (Figure 6 in paper III).
Figure 17: Estimated fishing mortality (Fbar: average over 3-6 ages) and their 95% confidence interval over
time for the two independent single species assessment. For graphical clarity, the combined assessment
estimate is not presented with confidence interval (Figure 7 from paper III).

64
3.3.3 Discussion
In this analysis, we compared the results of applying state-space species-specific assessments and a state-space
species-combined assessment to Namibian hake (Merluccius capensis and M. paradoxus) data. The species-
specific assessments showed that the spawning stock biomass of M. capensis has increased in the last five
years while that of M. paradoxus has decreased. Fishing mortality on M. paradoxus is higher than fishing
mortality on the combined-species. In the context of this study, the morphological similarities between the two
species, and the combined fishery argue for a combined assessment, but differences in biological rates and
spatial distributions speak for separate assessments of the two species. In this situation, it is important to
understand quantitatively the differences in our perception of hake stocks that result from combined-species
and split-species assessments. Ignoring the biological parameters of each species may lead to over-harvesting
or under-harvesting of one stock.
Using the results from the species-specific assessments for creating input to the combined assessment, for
example, maturity ogives, are clear examples of introducing circularities due to problems of estimating proper
values of parameters for an artificial stock as the combined hake stock really is. The sensitivity of combined
assessment results could be examined by robustness tests using alternative methods of parameter estimations
such as average weighting based on overall catch proportions by species. However, it is difficult to avoid
circularities completely, and hake splitting procedures, which clearly serve as the fundamental input to species-
specific assessments, are still a challenge. Under these circumstances, it could be recommended to develop an
annual reference case assessment for Namibian hake based on models that assess the two species as two
independent stocks and is fitted to species-disaggregated data as well as species-combined data.
Similarly, for age-based stock assessments such as SAMs, correct age-length keys (ALKs) constitute a
fundamental input to the assessments. Thus robustness testing of the impact of possible uncertainties in ageing
procedures needs to be given priority, this is explored in the subsequent section.

65
3.4 The uncertainty of assessment due to ageing biases (systematic error)
In this section, we investigate the effect of age-reading bias on the assessment. Both age-reading bias and
variance are a concern in age-structured stock assessment methods (Campana et al. 1995), but this study
focuses on the bias. This problem has been identified in many fisheries worldwide (Campana et al. 1995). The
ageing-reading bias affects all age-structured parameters in assessment models (Kalish et al. 1995). Age-
reading is partly based on subjective judgments, where age-readers rely heavily on their experience. Several
studies have reported problems of incorrect age readings mainly due to: lack of visibility of translucent rings
for the Eastern Baltic cod (Reeves 2003); the otoliths nucleus region in older fish thickens, Lophius piscatorius
in the North Irish sea (Crozier 1989); and the opaque zones have a tendency of splitting in two in the case of
L. vomerinus off Namibia (Maartens et al. 1999).
Given the uncertainties in age reading and the central role of age data in age-structured assessment models, it
is perhaps surprising that the literature contains only relatively few studies of the effect of age reading errors
on assessments. Reeves (2003) simulated age reading errors on Baltic cod, including both variance and bias,
and next simulated XSA assessment runs using the erroneous age data. The conclusion from that study was
that the age reading errors did not affect stock significantly, but did affect catch forecasts and management
advice. Bertignac and Pontual (2007) performed a similar study on hake (Merluccius merluccius) in the Bay
of Biscay and found broadly similar conclusions.
This section describes a simulation experiment which aims to examine the effect of biased age readings on the
estimates produced by SAM on SSB’s, recruitment and fishing mortality.
3.4.1 Material and method
The study is based on a simulated data set which is simulated with SAM, where parameters are estimates based
on Cape monkfish. This ensures that the simulation study is reasonably close to reality, but the study does not
hinge on the accuracy of the assessment. We then perturb the data sets, to simulate the effect of bias in age
reading. This results in perturbed numbers-at-age for both the commercial catches and the surveys shown in
Figure 18. It also results in perturbed weight-at-age curves shown in Figure 19.

66
The data sets are perturbed as follows: We assume that all age-readers make a 10% error on the ages. We
create two perturbed data sets in order to examine errors in both directions, i.e. first we examine the effect of
under-estimating the age, then the effect of over-estimating the age.
For the case of under-estimation of the age, we assume that the read age is a random variable, which conditional
on the true age follows a binomial distribution, where the true age is the number parameter and the probability
parameter is 0.9. Thus, each true year ring has a probability of 0.9 of being detected by the age reader.
For the case of over-estimation of the age, the age-reader identifies features as year rings, even if they are not
true year rings. We assume that the number of such false year rings is a random variable, which conditional on
the true age follows a negative binomial distribution with probability parameter 0.9. The true and perturbed
age distributions in the commercial catches are seen in Figure 18.
Next, we perturb the weight-at-age curves, assuming the same errors in the read age which form the basis of
these curves. For example, if the age is over-estimated, the weight-at-age is under-estimated (Figure 19). We
then run assessments, based on both the ”true” (unperturbed) data set and the perturbed data sets. We compare
the results of these effects, to investigate the effect of age reading bias on the assessment.
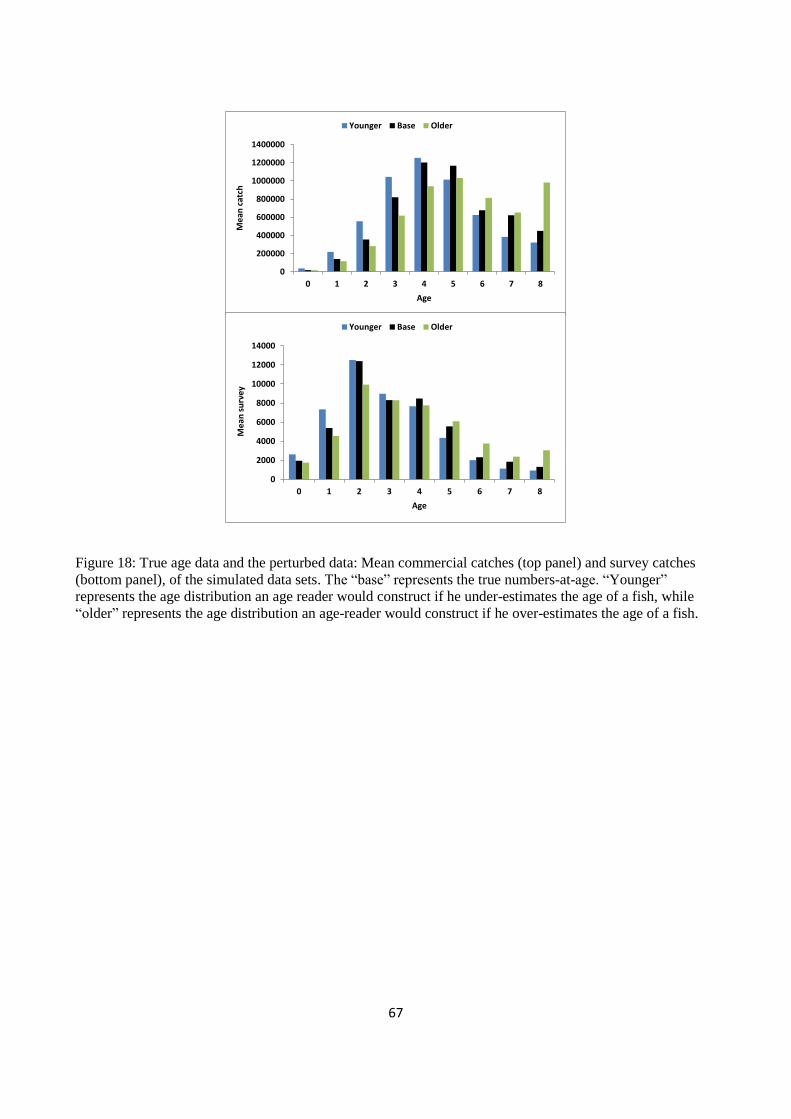
67
Figure 18: True age data and the perturbed data: Mean commercial catches (top panel) and survey catches
(bottom panel), of the simulated data sets. The “base” represents the true numbers-at-age. “Younger”
represents the age distribution an age reader would construct if he under-estimates the age of a fish, while
“older” represents the age distribution an age-reader would construct if he over-estimates the age of a fish.
0
200000
400000
600000
800000
1000000
1200000
1400000
0 1 2 3 4 5 6 7 8
Me
an c
atch
Age
Younger Base Older
0
2000
4000
6000
8000
10000
12000
14000
0 1 2 3 4 5 6 7 8
Me
an s
urv
ey
Age
Younger Base Older

68
Figure 19: Stock mean weight-at-age of the base run and the updated stock mean weight-at-age that are
consistent with the assumed age-reading error. Base: represents the true weight-at-age. Younger: represents
the growth curve an age reader would construct if he underestimates the age of a fish. Older: represents the
growth curve an age-reader would construct if he over-estimates the age of a fish.
3.4.2 Results highlights
Figure 20 (a-c) shows the results of the base run and the runs with simulated age-reading errors. Over-
estimating the age implies an over-estimation of SSB and under-estimation of fishing mortality. Under-
estimating the age leads to the converse results, namely under-estimation of SSB and over-estimation of fishing
mortality. Over-estimating the age leads to over-estimation of recruitment, while under-estimating the age
leads to under-estimation of recruitment.
Here, we assume 10% error on the ages. When the ages are over-estimated by 10% the model produced a
higher estimate of SSB roughly two times larger than the base run, while fishing mortality is twice lower than
the base run throughout the whole time period (Figure 20 a-b). The estimates of SSB and fishing mortality are
outside the 95% confidence interval of the base case. The recruitment trend is estimated to be very close to the
base run and is within the 95% confidence interval (Figure 20c).
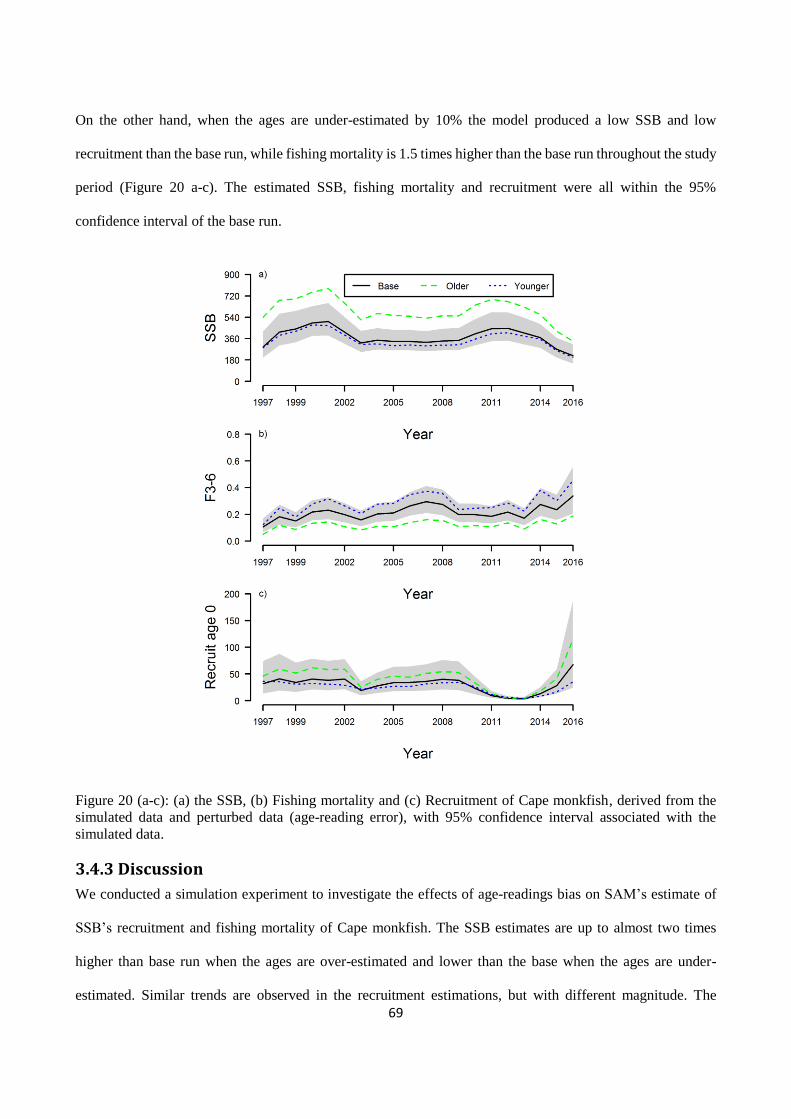
69
On the other hand, when the ages are under-estimated by 10% the model produced a low SSB and low
recruitment than the base run, while fishing mortality is 1.5 times higher than the base run throughout the study
period (Figure 20 a-c). The estimated SSB, fishing mortality and recruitment were all within the 95%
confidence interval of the base run.
Figure 20 (a-c): (a) the SSB, (b) Fishing mortality and (c) Recruitment of Cape monkfish, derived from the
simulated data and perturbed data (age-reading error), with 95% confidence interval associated with the
simulated data.
3.4.3 Discussion
We conducted a simulation experiment to investigate the effects of age-readings bias on SAM’s estimate of
SSB’s recruitment and fishing mortality of Cape monkfish. The SSB estimates are up to almost two times
higher than base run when the ages are over-estimated and lower than the base when the ages are under-
estimated. Similar trends are observed in the recruitment estimations, but with different magnitude. The

70
estimated fishing mortality is two times lower than the base run when the ages are over-estimated and 1.5 times
higher than the base run when the ages are under-estimated. These results indicate that errors in the age
readings can have a significant effect on the assessment, even if temporal patterns in the time series are similar.
These conclusions are qualitatively similar to those reached by Reeves (2003) and Bertignac and Pontual
(2007). If the age is overestimated, immature fish are wrongly classified as mature, which will lead to an
overestimation of the spawning stock biomass. This assumes that the correct maturity ogives are used.
Conversely, underestimating the age will result in more fish classified as immature and hence reduce the
spawning stock biomass.
The result highlights the impact that biases in age-reading can have on the estimates of management quantities.
This also highlights the importance of ensuring that the bias in age-reading is reduced. On the other hand, these
biases motivate analysts to continuously develop and improve assessment methods that do not rely on age-
structured data, which is explored further in the subsequent section.
3.5 Data-rich vs data-moderate assessment of Namibian stocks (Paper IV)
“All models are wrong but some are useful”. – George Box
There is an increasing interest in assessment techniques that require less data than conventional methods. This
interest comes from an aim of having more stocks assessed; also from stocks of lesser economic importance,
or species that appear mostly as by-catch, for example, to be able to document that the fishery is sustainable.
Data for conventional assessments require costly surveys, monitoring programmes, and laboratory analyses of
samples to determine ageing and maturities, and therefore there is an interest in assessment modelling
frameworks that require fewer data.
The aim of the present study was to investigate the applicability of a recent data-moderate assessment model,
SPiCT, to Namibian stocks. A first part of the study compared the results from this data-moderate model with
the results of a data-rich assessment method.
The Namibian government Marine Resources Act (Act No. 27 of 2000) Section 32 (2) obligates all fishermen
harvesting marine resources in Namibian waters to record all harvest in the logbooks (MFMR2000), and

71
regularly submit these logbooks to the scientists at NatMIRC. The Marine Resources Act also stipulates that
all by-catch species must be landed and recorded in the logbooks (MFMR 2000). The logbooks information is
used as input to stock assessment methods, a tool for management advice. In this study, we utilize information
from the commercial fishing operation targeting Cape monkfish. We supplemented this information with the
scientific trawl survey also targeting Cape monkfish. We applied a biomass dynamic model to a data-rich Cape
monkfish and a data-moderate west coast sole, the main bycatch in the Cape monkfish fishery. Surplus
production models are simple, computationally‐efficient methods to fit an observed time series of index of
relative abundance (Martell and Froese 2013; Froese et al. 2017; Pedersen and Berg 2017). Surplus Production
is simply the change in biomass (B) from one year to the next (Hilborn 2001). Surplus production (SP) arises
through compensatory population processes that occur as a result of mortality, due to harvest (Prager 1994;
Hilborn 2001). Thus, surplus production specifically incorporates biomass lost to fishing through yearly catch
and are not differentiated by age and/ or size (Prager 1994). In surplus production models, somatic growth,
reproduction and natural mortality are not separately captured but consolidated in the two parameters: the
intrinsic rate of population increase r and carrying capacity K (Froese et al. 2017; Polacheck et al. 1993).This
is perceived as the greatest shortcoming of surplus production models. Recent development has grouped
surplus production models as state-space models that separate process and observation errors (Buckland et al.
2004). Stochastic Surplus Production model in Continuous Time (SPiCT) (Pedersen and Berg 2017) is an
example of one of such models. SPiCT is an updated version of the traditional Pella-Tomlinson surplus
production model (Pella-Tomlinson 1969). The essential improvement of SPiCT over the tradition Pella and
Tomlinson surplus production model is the implementation of a state-space approach (Pedersen and Berg
2017). Process error can account for natural variability of stock biomass due to stochasticity in recruitment,
natural mortality, growth and maturation, whereas observation error determines the uncertainty in the observed
abundance index due to measurement error and unaccounted variations in catchability (Carvalho et al. 2014;
Francis et al. 2003).
This work was fully detailed and published in African Journal of Marine Science in 2018 as: Kathena, J.N.,
Kokkalis, A., Pedersen, W. M., Beyer, J.E., Thygesen, U. H. 2018. Data-moderate assessment of Cape monkfish
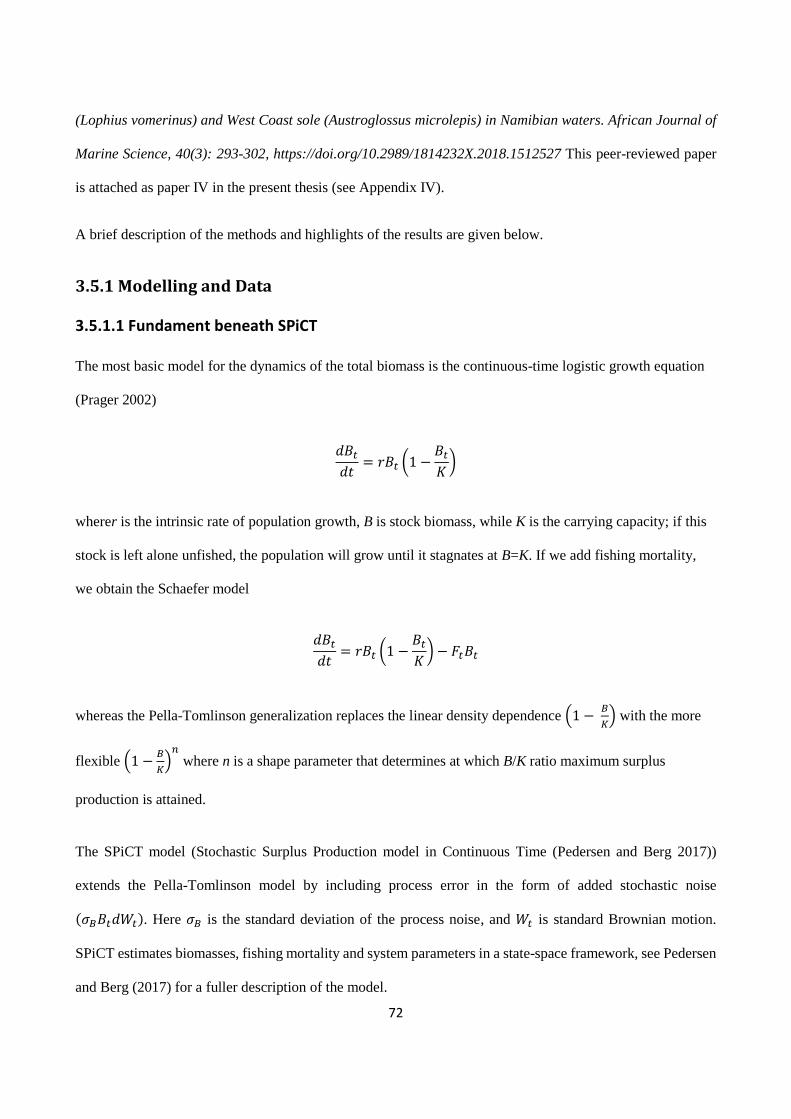
72
(Lophius vomerinus) and West Coast sole (Austroglossus microlepis) in Namibian waters. African Journal of
Marine Science, 40(3): 293-302, https://doi.org/10.2989/1814232X.2018.1512527 This peer-reviewed paper
is attached as paper IV in the present thesis (see Appendix IV).
A brief description of the methods and highlights of the results are given below.
3.5.1 Modelling and Data
3.5.1.1 Fundament beneath SPiCT
The most basic model for the dynamics of the total biomass is the continuous-time logistic growth equation
(Prager 2002)
𝑑𝐵𝑡
𝑑𝑡= 𝑟𝐵𝑡 (1 −
𝐵𝑡
𝐾)
wherer is the intrinsic rate of population growth, B is stock biomass, while K is the carrying capacity; if this
stock is left alone unfished, the population will grow until it stagnates at B=K. If we add fishing mortality,
we obtain the Schaefer model
𝑑𝐵𝑡
𝑑𝑡= 𝑟𝐵𝑡 (1 −
𝐵𝑡
𝐾) − 𝐹𝑡𝐵𝑡
whereas the Pella-Tomlinson generalization replaces the linear density dependence (1 − 𝐵
𝐾) with the more
flexible (1 −𝐵
𝐾)
𝑛 where n is a shape parameter that determines at which B/K ratio maximum surplus
production is attained.
The SPiCT model (Stochastic Surplus Production model in Continuous Time (Pedersen and Berg 2017))
extends the Pella-Tomlinson model by including process error in the form of added stochastic noise
(𝜎𝐵𝐵𝑡𝑑𝑊𝑡). Here 𝜎𝐵 is the standard deviation of the process noise, and 𝑊𝑡 is standard Brownian motion.
SPiCT estimates biomasses, fishing mortality and system parameters in a state-space framework, see Pedersen
and Berg (2017) for a fuller description of the model.
73
SPiCT is formulated in continuous time allowing the model to handle varying sample times. For example, the
two input indices, commercial landings and survey indices may be recorded at any time of the year and still be
used as data for the estimation process. Input data to SPiCT are total catch and catch per unit of effort from
fishery dependent and fishery independent sources. SPiCT assumes that fishing mortality acts on the total
exploitable biomass and neglects population structure and its impact on fisheries selectivity and maturation.
3.5.1.2 Comparison with age-structure data
The comparison of biomasses between the two methods was done by calculating a normalized error. The
formula used to calculate a normalized error is wrongly published in Paper IV and should be published as:
log (𝐵 𝐵𝑀𝑆𝑌)⁄ 𝑆𝑃𝑖𝐶𝑇 − 𝑙𝑜𝑔(𝐵 𝐵𝑀𝑆𝑌⁄ )𝑆𝐴𝑀
√𝜎𝑆𝑃𝑖𝐶𝑇2 + 𝜎𝑆𝐴𝑀
2
Where 𝜎𝑆𝑃𝑖𝐶𝑇2 and 𝜎𝑆𝐴𝑀
2 are the variance of the estimates (in log domain) as reported by the two models. A
similar error was computed for the fishing mortalities.
3.5.2 Result highlights
The SPiCT assessment for Cape monkfish produced a higher estimate of F/FMSY than SAM in the middle of
the time period (Figure 21a). The 95% confidence intervals for SPiCT were relatively large and exceeded those
of SAM for most of the timeperiod, except around 2003, where the confidence intervals do not overlap. After
2011, the two models presented different biomass trends: SAM showed declining biomass with increasing
fishing mortality, whereas SPiCT showed stable relative biomass and a stable relative fishing mortality (Figure
21a, b). Measured by the normalised error, SPiCT and SAM gave largely consistent estimates of F/FMSY except
for a large difference peaking around 2003–2004 (Figure 22a). The B/BMSY estimates match closely from 2003
to 2011, but SPiCT estimates higher relative biomass beyond these years, with the normalised errors exceeding
2 in the first and last years (Figure 22b).

74
Figure 21: Assessment of Cape monkfish Lophius vomerinus in terms of (a) relative fishing mortality F/Fmsy
and (b) relative to exploitable biomass B/Bmsy; the y-axes are in log scale. Two methods were used: state-space
assessment model (SAM) (solid lines, the dark grey area represents 95% confidence bounds) and the stochastic
surplus production model in continuous time (SPiCT) (dashed lines, the pale grey area represents 95%
confidence bounds (Figure 2 in paper IV)).
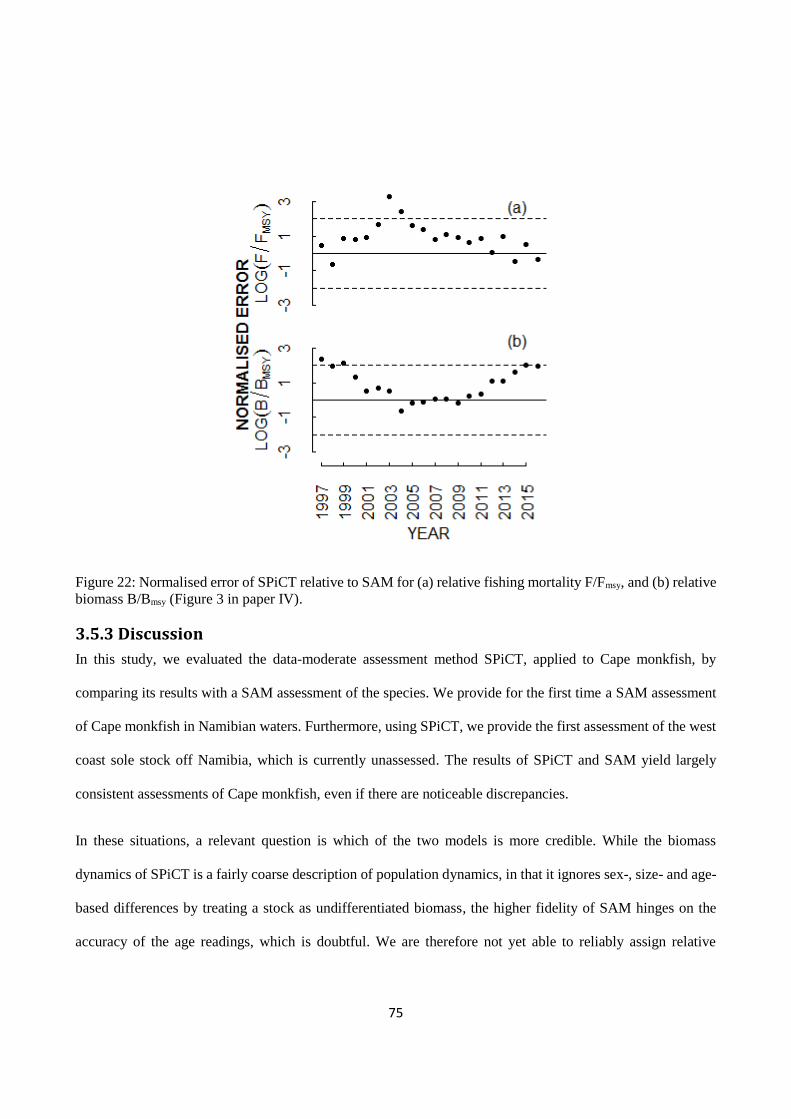
75
Figure 22: Normalised error of SPiCT relative to SAM for (a) relative fishing mortality F/Fmsy, and (b) relative
biomass B/Bmsy (Figure 3 in paper IV).
3.5.3 Discussion
In this study, we evaluated the data-moderate assessment method SPiCT, applied to Cape monkfish, by
comparing its results with a SAM assessment of the species. We provide for the first time a SAM assessment
of Cape monkfish in Namibian waters. Furthermore, using SPiCT, we provide the first assessment of the west
coast sole stock off Namibia, which is currently unassessed. The results of SPiCT and SAM yield largely
consistent assessments of Cape monkfish, even if there are noticeable discrepancies.
In these situations, a relevant question is which of the two models is more credible. While the biomass
dynamics of SPiCT is a fairly coarse description of population dynamics, in that it ignores sex-, size- and age-
based differences by treating a stock as undifferentiated biomass, the higher fidelity of SAM hinges on the
accuracy of the age readings, which is doubtful. We are therefore not yet able to reliably assign relative

76
credibility to the two models. To remedy this situation, future studies could explore additional validation
techniques for these models, as well as analyse the sensitivity of the models, such as through simulation studies.
Age information is both costly to acquire and prone to errors, which explains the current interest in alternative
assessment methods that do not require such age information, namely data-moderate methods. This is
particularly relevant for Namibian stocks that are currently unassessed. Although the present study has
identified some differences between estimates from SAM and from SPiCT, the potential of data-moderate
methods justifies further studies of their performance, and their particular use for assessing the Cape monkfish
and west coast sole stocks in Namibian waters—thereby supporting informed management decisions. We
consider this a promising start for applying data-moderate assessments to Namibian fish stocks.
It should be noted that length data for monkfish and sole exist from commercial fishing, collected onboard by
the observers from 1998 (1996 for monkfish) and from the scientific surveys from 2000 onwards. This opens
up for applying promising new length-based stock assessments (Rudd and Thorson 2018) not only for
monkfish and sole but also in other considerably more data-limited fisheries where neither reliable ageing data,
fishery-independent survey or catch time-series data is available. With a general understanding of biological
parameters using the concept of Beverton-Holt life-history invariants (Prince et al. 2015), it is possible to give
an idea of the status of a stock from a length distribution of fish in the catch from just one year assuming
equilibrium conditions (Kokkalis et al. 2015; Hordyk et al. 2015; Rudd and Thorson 2018).
77
Chapter 4: Stock assessment perspective for Namibia Stock assessment perspectives are introduced by considering hake catch splitting, single-species hake stock
assessments and transboundary challenges in section 4.1 and data-limited fish stock assessment in section 4.2.
On this basis I enter the conclusion in section 4.3 starting with summarizing the contributions of the thesis
according to the objectives and after re-visiting hake challenges in Namibia from a biological perspective, I
finally move towards improved assessment, advice, and management in the Benguela Large Marine Ecosystem
(BCLME, section 4.3.4). I end up with a general statement that advances in fishery management and advice
require spatial understanding of fisheries, fish stocks and their interactive dynamics. I see such a development
towards increased spatio-temporal mechanistic knowledge of the vital rates as forming a fourth trend in fishery
stock assessments.
4.1 Stock assessment perspective for Cape hake
4.1.1 Hake splitting
The only source of hake species separated data from commercial fishing is length frequency data collected by
fisheries observers’ onboard commercial fishing vessels. Any error in species identification by the observer
during sampling would affect the species ratio, and that will propagate through the splitting algorithms into
the assessment.
Splitting commercial catches of mixed hake into species is a crucial step in improving hake stock assessment
off Namibia. This work provides a step forward advancing the Namibian hake assessment from a traditional
combined assessment to a species disaggregated assessment. Species disaggregated numbers-at-age in the
commercial catches are key inputs into the stock assessment model. This study did not find an indication to
suggest that any bias is introduced by the method of splitting commercial catches.
The study recommends an intensive training programme for fisheries observers to ensure that species
identification is fully understood. Furthermore, in the future, an integrated modelling should be considered to
avoid a two steps approach currently applied in the analysis performed in Paper I and Paper II. The catch

78
species ratio should be based on analysis of a dataset preprocessed with an observer data model using also year
and month as an explanatory variable. It is also worth noting that the species-disaggregated assessment should
be updated into historical and most recent years. Future studies need to investigate the appropriate age-specific
catchability and their implication to management quantities of interest. The study also recommends that CPUE
standardization should consider including vessel ID, hake size classes and possible interaction effects using
GAM or GLMMs. Including robustness tests, such comprehensive analyses require and deserves a PhD study
by itself. Thus, species splitting of hake still constitutes an extremely important task to attend to in the future
to continue improving hake specific stock assessments in Namibia.
4.1.2 Stock assessment
Data-rich stock assessment models heavily rely on age-structured data. Age-structured data are generated
through reading annual rings on otoliths (Wilhelm et al. 2015). The survey and commercial catch-at-age
information derived from the observed otoliths rings are used to estimate the stock size and fishing mortality
(Wilhelm et al. 2015). Misreading of the annual rings would either lead to an underestimation or
overestimation of the true age of that specific species.
The species disaggregated assessments showed that M. capensis has a higher spawning biomass than M.
paradoxus, while the fishing mortalities are higher on M. paradoxus. This indicates that fishing pressure is
higher on M. paradoxus and this can lead to local depletion if it is not addressed. This result appears to add a
new dimension to the understanding of the hake species-specific stock status in the Northern Benguela. M.
paradoxus has a late onset maturity and a lower intrinsic rate of natural increase, as compared to M. capensis
(Paulus et al. 2013). In such a case a sound management strategy would be to take the smaller of the two FMSY
estimates (Sparre and Venema 1998).
The results of this study have increased knowledge and understanding on age-specific catchability i.e.
systematic patterns in the residual plots of the younger age classes were observed, but the situation improved
when the younger age classes were allocated a different standard deviation indicating that assuming constant
catchability by age is inappropriate.

79
In addition, based on recent descriptions of hake spawning peaks from growth rates and survey information
(Wilhelm et al. 2013, 2015), from the gonadosomatic index (Jansen et al. 2015) and given length-at-maturity
from histological analysis (Singh et al. 2011), adjustments need to be made in the current assessment of the
timing of recruitment and the length at maturity for both M. capensis and M. paradoxus.
Results from the age-reading error experiment in this study indicate that errors in the age reading can have
significant effects on the assessments. This highlights the importance of controlling age-reading. However, it
also highlights the importance of robustness tests concerning assessment consequences of uncertainties in
splitting and ageing. Length-based input as an alternative to a purely age-based input to the assessment may
also be considered in the future together with realistic stochastic growth modelling.
4.1.3 Transboundary challenges
Several publications have shown that the spatial distribution of both hake species extends into South African
waters. More recent evidence emanating from the Ecofish project has reported that M. capensis in Namibian
waters is a unit stock whereas M. paradoxus forms a transboundary stock extending from Namibian waters
towards the southern Benguela and is hence shared with South Africa (Strømme et al. 2016; Jansen et al. 2017;
Henriques et al. 2016). The situation underscores the need for transboundary management of the Cape hake
stocks. This evidence brings to the fore a complication of two completely different problems facing the current
stock assessment of hake in the Namibian water i.e. assessing the two species combined as a single stock and
then assuming that the M. paradoxus in Namibia is a distinct stock independent from the South African part
of the population. The evidence provided suggests that current assessments in Namibia and South Africa are
not assessing the M. paradoxus stock in its totality.

80
Figure 23: Time series of Namibian share of M paradoxus biomass based on the surveys in the years 2005–
2012, and arithmetic mean for all these years. The lowest and highest estimates are in 2010 and 2012,
respectively. Adult range 35-55 cm in Namibia indicated. Adopted from Strømme et al. (2016).
The time series of the Namibian share of M. paradoxus presented by Strømme et al. (2016) shows this very
clearly, see Figure 23. A remarkable stable plateau shows that on average 40% of the adult M. paradoxus stock
in the size range 35 cm to 55 cm is found in Namibia. These fish are recruited from South Africa at around 20
cm since no evidence of spawning has been detected in Namibia. M. paradoxus do not grow bigger in Namibia
either because they are fished or because they return to South Africa. As mentioned above, the evidence of
homing behavior is piling up. This catch picture becomes even sharper when the effect of size correlations etc.
are incorporated in geostatistical modelling and the impact of local noise (nugget effect) removed (Figure 10c
in Jansen et al. 2017): virtually all 60+ cm fish stay south of the border. It is difficult not to conclude that large
fish eventually return to the spawning grounds in South Africa, but the frequency and strength of this migration
is still not known (Strømme et al. 2016).
As an example of elucidating this migration effect on the Namibian stock assessment of M. paradoxus we may
consider natal homing as a continuous process described by an instantaneous rate of migration (Ly,a),(L for
leave) such that cohorts annually are not only reduced by the standard exponential survivorship, exp(-(My,a +
81
Fy,a)) as described in section 3.3.1.2, but also by exp(-Ly,a). Thus the impact can be examined by replacing
natural mortality, My,a with My,a + Ly,a. One problem, of course, is that we do not know Ly,a but neither do we
actually know My,a. What we expect is that M due to predation decreases with size or age and that L increases
with age. If L is ignored as in Paper III one could expect an artificial higher F estimate for adult fish, but
further speculations here would benefit from simulation experiments as suggested in closing Paper III.
4.2 Data-limited fish stock assessment
SPiCT has provided a chance to assess data-moderate stock and make inferences. It has therefore provided an
opportunity to investigate and contribute to the understanding of species-specific dynamics of by-catch species.
Estimated species-specific fishing mortality and spawning stock biomass in both data rich and data poor stocks
make it easier to provide species-specific management advice. Understanding the temporal development in
fishing mortality is one of the important steps in fisheries management.
Although the study reveals the status of A. microlepis stock, more data are needed in order to help establish
effective management advice for this stock. This is particularly important because A. microlepis is an important
by-catch species in monk fisheries and exploitation of this stock will continue for many more years to come.
The results from this study will also be used to explore the assessment of other by-catch demersal living
resources off Namibia that are currently unassessed. The SAM and SPiCT toolboxes are continuously under
development and a new SPiCT-version will be ready in 2019, this version is able to account for changes in
productivity over time both within and between years (Casper W Berg, personal communication). It has already
been used to demonstrate a regime shift for Baltic cod which raises questions about the concept of a single
MSY. It will be interesting to use this model on hake, for example, based on long time series of combined hake
catches.
It is not only the amount of data that should determine to which degree a fishery is data-limited. The quality
of the data should play an equally important role. For this and several other reasons, the development of data-
limited methods for assessing the status of a stock seems to continue. Data-limited methods could be part of
the assessment for all stocks. This study has focused on SPiCT, but in particular, length-based methods should

82
receive attention. Length-based assessment methods constitute an important part of data-limited methods
because it is much easier to obtain reliable length measurements of catch samples than to measure total catch
or record effort data for small-scale or non-target species (Harley et al. 2001; Kokkalis et al. 2015; Rudd and
Thorson 2018).
4.3 Conclusions
This final section of my thesis moves from summarizing the results according to the specific objectives given
in section 1.2 to some questions of how we in the region can continue improving this new line of implementing
and interpreting state-space assessment techniques such as SAM and SPiCT. Then in section 4.3.3, realizing
that the machine room of SAM and SPiCT apart from its advanced statistics is still based on the classical
assumptions of fishery biology outlined in paragraphs 3.3.1.2 and 3.5.1.1, I return to biological processes and
the need for improving current knowledge of the vital rates. Finally, moving from short-term to longer-term
goals, I consider my ultimate goal of facilitating improved assessment, advice, and management in the
Benguela Current Large Marine Ecosystem.
4.3.1 Summarizing according to the objectives
The thesis contributes with research providing new and more precise population dynamic parameters
improving the knowledge basis for the fisheries biology of demersal stocks off Namibia. It provides new input
to the foundation and input to hake stock assessment. This includes developing the first existing method for
splitting the hake species in the combined hake landings, more advanced approaches including evaluating the
impact on assessments due to systematic ageing bias, as well as new methods with GAMs to provide
standardized catch rates with species-specific abundances at each commercial haul and to identifying factors
that are affecting catch rates or CPUE for each tow. On this basis, the thesis provides an application of the new
parameters and information in stochastic assessment methods to test the assessment performance and
applicability according to the new input data. The results are evaluated and discussed by comparing single
stock runs with combined hake runs with the same stochastic assessment model (SAM). A sensible next step
could be to compare assessment models for the hake stocks and their advisory and management implications

83
but that was not part of the objectives, which is why a scientific report from 2015 comparing SCAA and SAM
modelling although interesting is not discussed in the thesis.
Finally, to assess a data-poor Namibian stock for the first time the new stochastic version of surplus production
modelling (SPiCT) was applied to west coast sole. SPiCT appears to be a sensible choice when ageing data
are not available or trustworthy because without using available ageing information it has proved its value in
a number of ICES cases when compared to the results of age-based SAM assessments. For monkfish both
SAM and SPiCT were applied to evaluate the performance of the latter and its application to data-poor stocks
in general in the Benguela Current Large Marine Ecosystem (BCLME).
Although the study reveals the status of west coast sole stock, further investigations are necessary in order to
help establish effective management advice for this stock. One problem is that current time-series are too short
for reliable estimation, and naturally this problem will gradually be resolved with continued data collection.
The results from this study will also be used to explore the assessment of other by-catch demersal living
resources off Namibia that are currently unassessed. We consider this a promising start for applying data-
moderate assessments to Namibian fish stocks.
To improve these very first individual assessments of M. paradoxus and M. capensis in Paper III my first tasks
will be to build on the knowledge gained from my PhD study including the ageing-bias examination in order
to quantify the uncertainties of the species-specific catch and survey time-series input. This includes for
example new attempts to prolong the time-series hopefully back to the start of surveys in 1990 with attached
uncertainties, re-analysis of Namibian hake survey data removing time of day effect, and identifying
anomalous years potentially due to environmental forcing such as 2010 where the Namibian ratio of adult M.
paradoxus biomass suddenly was halved (Figure 23). These analyses will also involve updating knowledge on
vital rates (section 4.3.3) and other preparatory tasks required for the implementation of transboundary M.
paradoxus stock assessment (section 4.3.4). The successful improvement of stock assessments further relies
on Namibian fishery biologists being able to take advantage of new developments of the toolbox as indicated
in the next section.

84
4.3.2 How do regional fishery biologists learn to operate state-space assessment
techniques?
My PhD study was initialized as part of the Ecofish action since it was realized that it would be hard work to
create local ownership of modern stock assessment techniques. As a biologist, I can only agree. I realize now
that I must struggle the rest of my working life to continue communication with experts of the machine room
and disseminate it to local colleagues. Such communication is necessary as tools and possibilities are
developing all the time.
Regionally, there are BCC Working Groups established as a result of the Ecofish project aimed to set-up a
joint assessment. The general aim of the Working Groups is to contribute to the improved management of
shared demersal and pelagic resources in the BCLME through cooperative work among member countries in
order to ensure sustainable use of these resources. The Regional Working Groups Terms of Reference make
provision to establish Task Teams to address specific technical issues as required. Under this specific function,
the working group would invite external experts and that is one way the region can continue improving this
new line of implementing and interpreting state-space assessment techniques such as SAM and SPiCT.
Parallel, regional fishery biologists can learn through a variety of mechanisms such as personnel exchanging
of stock assessment scientists, or cooperative research projects, in-service training courses offered on-site, or
professional leave to take university courses, specialized short courses, and workshops.
These combined activities should ensure the necessary continuity in learning and training and I hope personally
to be able to contribute to such cascading effects for the region.
4.3.3 Challenges from a fishery biological perspective: Cape hake
It is important for stock assessment and management to get the vital rates right but more difficult than I
anticipated at the start of this study. Concerning recruitment, for example, the case of Namibian M. paradoxus
adds the complexity of spawning not taking place off Namibia. In this respect, Namibian M. paradoxus is to
be considered an adult extension of the South African stock (Strømme et al. 2016) so recruitment in Namibia
is most likely entirely determined by what happens in South Africa.
85
Reading age rings on hake otoliths is still a challenge and if length-based modelling is considered an alternative
we do not really know how individual growth takes place and how much it differs annually in space and time.
Just assuming a one-to-one correspondence between age and some average VBGE-growth curve is not solving
the problem, but transferring unknown ageing to an unknown growth problem. Since available knowledge on
growth, in general, indicates that individual growth trajectories do not overlap but tend to spread out it is a
well-known procedure to describe individual growth with the same curvature parameter K of the VBGE but
with individual Linf following a log-normal distribution or similar (Beyer and Lassen 1994).
Without correct ageing, it is difficult to get mortalities right in the classical cohort approach underlying SAM.
In the case of Namibian M. paradoxus, we are probably now also facing migration at least of bigger fish back
to South Africa. Simulation experiments with migration as an additional natural mortality component as
suggested in section 4.1.3 could gain insight into the nature of migration that would have a profound effect on
the Namibian assessment of the species.
Understanding and quantifying natural mortality constitutes a major challenge and it will, in particular, be
important to gain insight into hake-on-hake predation and cannibalism. Hake stomach sampling has been
initiated in Namibia but needs further pursuing (Kainge 2017).
4.3.4 Towards improved assessment, advice, and management in the Benguela
Current Large Marine Ecosystem (BCLME)
The assessment models considered in this thesis provide the short-term predictions that are required for yearly
management decisions such as setting total allowable catches. More strategic management decisions require
trustworthy long-term predictions, which include the response to changing climate, ecosystem composition,
and species interactions. For such purposes, proper representation of the mechanisms of stock dynamics
(reproductive success, growth, mortality including both cannibalism and multispecies interactions, and
migration) becomes more critical. As such, although the work in this thesis has contributed to the scientific
basis for management of important demersal living resources off Namibia and in BCLME, it should be clear
from the previous discussion and my four Papers that the work should be continued in several directions. Focus
in ending this discussion will be on transboundary challenges.

86
BCC was established to monitor the major transboundary fish resources in the region. A primary candidate
resource for such consideration is hake (Merluccius capensis and M. paradoxus) off the coast of Namibia and
South Africa and horse mackerel (Trachurus trachurus capensis) off the coast of Namibia and Angola. A total
of 9 trans-boundary surveys were conducted between 2003-2012, monitored at the beginning of each year
(January–February), to allow for a synoptic overview of distribution and abundance of resources that may be
shared across the region. The transboundary hake challenge has been a subject of discussion for a long time.
Shared-stocks and management issues for marine fish occur virtually throughout the world, and there tends to
be a natural progression in how potentially shared-stock fisheries proceed. Typically, cooperation begins in
the area of scientific research through the development of common sampling protocols.
Shared-stocks research leading to effective management is a priority for Namibia at the moment, since the
Namibian hake fishery is being assessed by the Marine Stewardship Council (MSC) for certification. MSC has
requested Namibia to put in place a mechanism for organized and effective cooperation with South Africa,
required by shared stocks, which can deliver outcomes for any shared hake stock. The South African hake
fishery has already been certified and will be subjected to similar conditions in the next round of certification.
Ideally, a number of different assessment modelling approaches should be attempted to make an assessment
for the entire distributional area of M. paradoxus. It is worthwhile to mention that spatial box modelling was
believed to constitute a promising and important approach in Ecofish, but it turned out after considerable trials
for South African waters that too many parameters necessarily became involved, so it was not feasible to get
useful results and South Africa stayed with their old fleet-as-area approach. The most promising tool developed
was the geostatistical model GeoPop but the problem here is that the results of this model are only based on
correlations from survey data.
Other developments in mixed-effect modelling create new possibilities for advanced stock assessment. On the
state-space front, Namibia could benefit from a step-by-step development using SAM and SPiCT. It is also
very important that Namibia work towards improving the hake-splitting procedure in-cooperation with South
Africa. The countries clearly need to agree on a number of procedures at various levels e.g. harmonization of
data collection protocols.

87
SAM and SPiCT comparisons with SCAA will be needed. For further comparative details of the two methods
applied to the Namibian hake stock in the case of combined species, the reader is referred to the report listed
under other work performed during the PhD study (Kathena et al., 2015). It should be noted that SAM-SCAA
comparisons have not yet been reported for species which do not have the complexities associated with those
for Cape Hake, e.g. splitting the species challenge. However, such an international study should be in progress
following the World Fisheries Congress in Korea in 2016. Results from such comparisons can be used to direct
survey programs to improve data quality and to assess the degree of improvements achieved over time.
Building on the innovative hake splitting procedure the most important contribution of this PhD project is a
promising start for applying stochastic assessment methods to data-rich as well as data-moderate fish stocks
in the region. The published results serve as starting points for improving fish stock assessment and
management in Namibia and elsewhere. Apart from assessment and management challenges of shared-stocks
important challenges ahead include understanding the effects of species interaction, climate change and
density-dependent mechanisms. This understanding could begin with elucidating the impact of species
interaction on stock assessments in particular for Cape hake since M. capensis and M. paradoxus interact
through hake-on-hake predation, food competition etc. Focus could be on connecting single-stock assessments
through correlated survival (Albertsen et al. 2017). The strategy of analysis could be to first consider only hake
interaction, then to add seals and later include other species (e.g monkfish) in the modelling. We may also
learn something on the historical development from a combined hake assessment using the entire catch series
from 1963 (Figure 5) since SPiCT now can deal with estimating regime shifts which are becoming of
increasing importance under climate change (Mildenberger et al. 2019). What we lack in general to develop
fishery management and advice a major step further most likely is the spatial understanding of fisheries, fish
stocks and their interactive dynamics. I believe this understanding will increase tremendously once stock
assessment tools are developed further based on a spatio-temporal mechanistic knowledge of the vital rates.
We need to be able to quantify and scale the effects of local density-dependent mechanisms to understand
important phenomena such as when in life recruitment is determined for various species. I see this development
in an optimistic view because of promising starting points, tools such as GeoPop, together with fast on-going

88
progress in computer science and analysis (including TMB developments) most likely is about to form a fourth
trend in fishery stock assessments.
89
References
Armstrong, M. P., Musick, J. A., Colvocoresses, J. A., 1992. Age, growth and reproduction of the goosefish Lophius
americanus (Pisces: Lophiiformes). Fishery Bulletin, 90: 217-230.
Assorov, V. V., Berenbeim, D. Y., 1983. Spawning grounds and cycles of Cape hake in the southeast Atlantic.
Collection of Scientific Papers of the International Commission for Southeast Atlantic Fisheries, 10: 27–30.
BCC, 2012. State of the Fishery Resources in the Benguela Current Large Marine Ecosystem. Benguela Current
Convention, Swakopmund, Namibia Report no. 3.
BCC, 2008. Benguela Current of Plenty. A history of international cooperation in marine science and ecosystem
management. Edited by Gotthilf Hempel, Micheal O’Toole and Neville Sweijd. Published by Benguela
Current Commission, Swakopmund, Namibia, September 2008: 143 pp.
BENEFIT, 2005. Report on the 2005 BENEFIT hake otolith reading workshop. National Marine Information and
Research Centre, Swakopmund, Namibia, 19–30 September 2005: 20 pp.
Bentz, K. L. M., 1976. Gill arch morphology of the Cape hakes Merluccius capensis Cast. and M. paradoxus Franca.
Fisheries Bulletin of South Africa, 8: 17–22.
Bertignac, M., de Pontual, H., 2007. Consequences of bias in age estimation on assessment of the northern stock of
European hake (Merluccius merluccius) and on management advice. – ICES Journal of Marine Science, 64:
981–988.
Beyer, J. E., Lassen, H., 1994. The effect of size-selective mortality on the size-at-age of Baltic herring. Dana, 10:
204-234.
Bianchi, G., Carpenter, K., Roux, J.-P., Molloy, F., Boyer, D., Boyer, H., 1999. The living marine resources of
Namibia. FAO species identification field guide for fishery purposes. FAO.

90
Botha, L., 1986. Reproduction, sex ratio and rate of natural mortality of Cape hakes Merluccius capensis Castelnau
and M. paradoxus Franca in the Cape of Good Hope area. South African Journal of Marine Science, 4: 23-35.
Botha, L., 1985. Occurrence and distribution of Cape hake Merluccius capensis Cast. and M. paradoxus Franca in the
Cape of Good Hope area. South African Journal of Marine Science, 3: 179–190.
Buckland, S.T., Newman, K.B., Thomas, L., Koesters, N.B., 2004. State-space models for the dynamics of wild
animal populations. Ecological Model, 171: 157–175. http://dx.doi. org/10.1016/j.ecolmodel.2003.08.002.
Burmeister, L-M., 2001. Depth-stratified density estimates and distribution of the Cape hake Merluccius capensis and
M. paradoxus off Namibia deduced from survey data, 1990–1999. South African Journal of Marine Science,
23: 347–356.
Burmeister, L-M., 2005. Is there a single stock of Merluccius paradoxus in the Benguela ecosystem? African Journal
of Marine Science, 27: 23–32.
Butterworth, D. S., Rademeyer, R. A., 2005. Sustainable management initiatives for the Southern African Hake
fisheries over recent years. Bulletin of Marine Science, 76(2): 287-319.
Butterworth, D. S., Geromont, H. F., 2001. Evaluation of a range of possible simple interim management procedures
for the Namibian hake fishery. In A Decade of Namibian Fisheries Science. Payne, A.I.L., Pillar, S.C. and
R.J.M. Crawford (eds.). South African Journal of Marine Science, 23: 357-374.
Campana, S., Annand, M. C., McMillan, J. I., 1995. Graphical and statistical methods for determining the consistency
of age determinations. Transactions of the American Fisheries Society, 124: 131-138.
Carvalho, F., Ahrens, R., Murie, D., 2014. Incorporating specific change points in catchability in fisheries stock
assessment models: an alternative approach applied to the blue shark (Pronace glauca) stock in the south
Atlantic Ocean. Fisheries Research, 154: 135-146.
91
Carruthers, T.R., Punt, A.E., Walters, C.J., MacCall, A., McAllister, M.K., Dick, E.J., Cope, J., 2014. Evaluating
methods for setting catch limits in data-limited fisheries. Fisheries Research, 153: 48–68. doi:
10.1016/j.fishres.2013.12.014.
Chikarmane, H. M., Kuzirian, A. M., Kozlowski, R., Kuzirian, M., Lee, T., 2000. Population Genetic Structure of the
Goosefish, Lophius americanus. Biological Bulletin, 199: 227-228 doi: 10.2307/1542912.
Chlapowski, K., 1974. Length composition and maturity of hakes Merluccius capensis and M. paradoxus caught in
the ICSEAF area during the period from November 1972 to January 1973. Collection of Scientific Papers of
the International Commission for Southeast Atlantic Fisheries, 1: 182–192.
Cotter, A.J.R., Burt, L., Paxton, C.G.M., Fernandez, C., Buckland, S.T., Pan, J-X., 2004. Are stock assessment
methods too complicated? Fish and Fisheries, 5: 235-254.
Crawford, R. J. M., Shannon, L. V., Pollock, D. E., 1987. The Benguela ecosystem. Part IV. The major fish and
invertebrate resources. Oceanography and Marine Biology: An Annual Review, 25: 353–505.
Crozier, W. W., 1989. Age and growth of angler-fish (Lophius piscatorius L.) in the North Irish Sea. Fisheries
Research, 7: 267-278.
Diaz de Astarloa, J. M., 2002. A review of the flatfish fisheries of the south Atlantic Ocean. Revista de Biologia
Marina y Oceanografia, 37 (2): 113-125.
Duarte, R., Azevedo, E., Pereda, P., 1997. Study of growth of southern black and white monkfish stocks. ICES Journal
of Marine Science, 54: 866 - 874.
Ebert, D. A., 1994. Diet of the sixgill shark Hexanchus griseus off southern Africa. South African Journal of Marine
Science, 14(1): 213-218, doi: 10.2989/025776194784287030.
Erasmus, V. N., 2018. The monkfish (Lophius vomerinus) port sampling programme - updated for the 2018
assessment. Unpublished report. Swakopmund, Namibia: National Marine Information and Research Centre.

92
FAO (Food and Agriculture Organization of the United Nations), 2008. The state of world fisheries and aquaculture
2008. Rome: FAO.
Francis, R. I. C. C., Hurst, R. J., Renwick, J. A., 2003. Quantifying annual variation in catchability for commercial
and research fishing. Fishery Bulletin,101: 293-304.
Froese, R., Demirel, N., Coro, G., Kleisner, K. M., Winker, H., 2017. Estimating fisheries reference points from catch
and resilience. Fish and Fisheries, 18: 506-526.
Galvez, M., Rebolledo, H., 2005. Estimating codend size selectivity of bottom trawl net in Chilean hake (Merluccius
gayi gayi) fishery. Investigaciones Marinas, 33: 151–165.
Gordoa, A., Macpherson, E., 1990. Food selection by a sit-and-wait predator, the monkfish, Lophius upsicephalus,
off Namibia (South West Africa). Environmental Biology of Fishes, 27: 71-76.
Gordoa, A., Duarte, C. M., 1991. Size-dependent spatial distribution of hake (Merluccius capensis and Merluccius
paradoxus) in Namibian waters. Canadian Journal of Fisheries and Aquatic Sciences, 48: 2095–2099.
Gordoa, A., Macpherson, E., 1991. Diurnal variation in the feeding activity and catch rate of Cape hake (Merluccius
capensis and M. paradoxus) off Namibia. Fisheries Research, 12 (4): 299–305.
Gordoa, A., Macpherson, E., Olivar, M. P., 1995. Biology and fisheries of Namibian hakes (M. capensis and M.
paradoxus). In Hake fisheries ecology and markets, pp. 49–79. Ed. by J. Alheit, and T. J. Pitcher. Chapman
& Hall, London.
Griffiths, M. H., Hetcht, T., 1986. A preliminary study of age and growth of the monkfish Lophius upsicephalus
(Pisces: Lophiidae) on the Agulhas Bank, South Africa. South African Journal of Marine Science, 4: 51-60,
doi: 10.2989/025776186784461792.
Hamukuaya, H., O’Toole, M. J., Woodhead, P. M. J., 1998. Observations of severe hypoxia and offshore displacement
of Cape hake over the Namibian shelf. South African Journal of Marine Science, 19: 57–59.

93
Hamukuaya, H., Attwood, C., Willemse, N., 2016. Transition to the ecosystem-based governance of the Benguela
Current Large Marine Ecosystem. Environmental Development, 17: 310-321.
Harley, S.J., Myers, R.A., Dunn, A., 2001. Is catch-per-unit of effort proportional to abundance? Canadian Journal of
Fisheries and Aquatic Sciences, 58 (9): 1760-1773.
Henriques, R., von der Heyden, S., Lipinski, M.R., du Toit, N., Kainge, P., Bloomer, P., Matthee, C.A., 2016. Spatio-
temporal genetic structure and the effects of long-term fishing in two partially sympatric offshore demersal
fishes. Molecular Ecology.doi:10.1111/mec.13890.
Heymans, J. J., Shannon, L. J., Jarre, A., 2004. Changes in the northern Benguela ecosystem over three decades:
1970s, 1980s, and 1990s. Ecological Modelling, 172: 175–195.
Hilborn, R., 2001. Calculation of biomass trend, exploitation rate, and surplus production from the survey and catch
data. Canadian Journal of Fisheries and Aquatic Sciences, 58: 579-584.
Hjellvik, V., Michalsen, K., Aglen, A., Nakken, O., 2003. An attempt at estimating the effective fishing height of the
bottom trawl using acoustic survey recordings. ICES Journal of Marine Science, 60: 967–979.
HMP, 2014. Management Plan for the Namibian hake fishery. Ministry of Fisheries and Marine Resources, Republic
of Namibia: 36 pp.
Hordyk, A., Ono, K., Valencia, S., Loneragan, N., Prince, J., 2015. A novel length-based empirical estimation method
of spawning potential ratio (SPR), and tests of its performance, for small-scale, data-poor fisheries. ICES
Journal of Marine Science, 72: 217–231.
Hutchings, L., van der Lingen, C. D., Shannon, L. J., Crawford, R. J. M., Verheye, H. M. S., et al. 2009. The Benguela
Current: An ecosystem of four components. Progress in Oceanography, 83: 15-32.
ICSEAF, 1984. Proc. Rep. Meeting International Commission for South East Atlantic Fisheries (ICSEAF) 1984 (II),
1985, Madrid.

94
Iitembu, J. A., Miller, T. W., Ohmori, K., Kanime, A., Wells, S., 2012. Comparison of an ontogenetic trophic shift in
two hake species, Merluccius capensis and Merluccius paradoxus, from the Northern Benguela Current
ecosystem (Namibia) using stable isotope analysis. Fisheries Oceanography, 21: 215–225.
Jansen, T., Kainge, P., Singh, L., Strømme, T., Durholtz, M.D., Kathena, J., Wilhelm, M.R., Erasmus, V., Beyer, J.E.,
2015. Spawning Patterns of Shallow-Water Hake (Merluccius capensis) and Deep-Water hake (M. paradoxus)
in the Benguela Current Large Marine Ecosystem Shown by Gonadosomatic Index (GSI). Fisheries
Research,172: 168-180 doi:10.1016/j.fishres.2015.07.009.
Jansen, T., Kristensen, K., Kainge, P., Durholtz, D., Strømme, T., Thygesen, U.H., Wilhelm, M.R., Kathena, J.,
Fairweather, T.P., Paulus, S., Degel, H., Lipinski, M.R., Beyer, J.E., 2016. Migration, distribution and
population (stock) structure of 466 shallow-water hakes (Merluccius capensis) in the Benguela Current Large
Marine Ecosystem inferred using a geostatistical population model. Fisheries Research, 179: 156–167.
doi:10.1016/j.fishres.2016.02.026.
Jansen, T., Kristensen, K., Fairweather, T., Kainge, P., Kathena, J. N., Durholtz, D., Beyer, J. E Thygesen, U. H.,
2017. Geostatistical modelling of the spatial life history of post-larval deep-water hake (Merluccius paradoxus)
in the Benguela Current Marine Ecosystem. African Journal of Marine Science, 39: 349-361. doi:
10.2989/1814232X.2017.1379437.
Jarre, A., Hutchings, L., Kirkman, S. P., Kreiner, A., Tchipalanga, P. C. M., Kainge, P., et al. 2015. Synthesis: climate
effects on biodiversity, abundance and distribution of marine organisms in the Benguela. Fisheries
Oceanography, 24: 122 – 149.
Johnsen, E., Kathena, J., 2012. A robust method for generating separate catch time-series for each of the hake species
caught in the Namibian trawl fishery. African Journal of Marine Science, 34: 43–53.
Johnsen, E., Iilende, T., 2007. Factors affecting the diel variation in commercial CPUE of Namibian hake—Can new
information improve standard survey estimates? Fisheries Research, 88: 70–79.

95
Jørgensen, T., Engås, A., Johnsen, E., Iilende, T., Kainge, P., Schneider, P., 2007. Escapement of Cape hakes under
the fishing line of the Namibian demersal sampling trawl. African Journal of Marine Science, 29: 209–221.
Jørgensen, T., Ingolfsson, O. A., Graham, N., Isaksen, B., 2006. Size selection of cod by rigid grids – is anything
gaining compared to diamond mesh codends only? Fisheries Research, 79: 337–348.
Kainge, P., 2017. Environmental effects on the availability of shallow and deep-water hake to the demersal trawl
survey in Namibian waters. PhD thesis. National Institute of Aquatic Resources, Technical University of
Denmark.
Kainge, P., Bahamon, N., Bartholomae, C. H., Kathena, J. N., van der Plas A. K., Gordoa, A., 2013. Stock-
environment recruitment analysis for Namibian Cape hake Merluccius capensis. African Journal of Marine
Science, 35(4): 555-564. doi.org/10.2989/1814232X.2013.862509.
Kainge, P., Kjesbu, O. S., Thorsen, A., Salvanes, A. G., 2007. Merluccius capensis spawns in Namibian waters, but
does M. paradoxus? African Journal of Marine Science, 29(3): 379-392.
Kalish, J. M., Beamish, R. J., Brothers, E. B., Casselman, J. M., Francis, R. I. C. C., et al. (1995). Glossary for otolith
studies. In ‘Recent Developments in Fish Otolith Research’. (Eds D. A. Secor, J. M. Dean and S. E. Campana.)
pp. 723–729. (University of South Carolina Press: Columbia, SC.).
Kathena, J.N., Nielsen, A., Thygesen, U.H., Berg, C.W., 2016. Hake species (Merluccius capensis and M. paradoxus)
assessment in the Benguela Current Large Marine Ecosystem. Environmental Development, 17: 193–201,
http://dx.doi.org/10.1016/j.envdev.2015.11.011.
Kathena, J. N., Nielsen, A., Berg, C. W., Thygesen, U. H., Jansen, T., Gordoa, A., Guijarro, B., Rademeyer, R.,
Butterworth, D., Hamukwaya, H., 2015. A comparison of different assessment models for the Namibian hake
stock Unpublished report, January 12, 2015: 15 pp.
96
Kirchner, C. H., Kainge, P., Kathena, J. N., 2012. Evaluation of the status of the Namibian hake resource (Merluccius
spp.) using statistical catch-at-age analysis. The environment for Development Discussion Paper Series, 12:
1–52.
Kokkalis, A., Eikeset, A.M., Thygesen, U.H., Steingrund, P., Andersen, K.H., 2017. Estimating uncertainty of data
limited stock assessments. ICES Journal of Marine Science, 74: 69–77. doi:10.1093/icesjms/fsw145.
Kokkalis, A., Thygesen, U.H., Nielsen, A., Andersen, K.H., 2015. Limits to the reliability of size-based fishing status
estimation for data-poor stocks. Fisheries Research, 171: 4–11. doi:10.1016/j.fishres.2014.10.007.
Kristensen, K., Nielsen, A., Berg, C.W., Skaug, H., Bell, B.M., 2016. TMB: Automatic differentiation and Laplace
approximation. Journal of Statistical Software, 70: 1–21. doi:10.18637/jss.v070.i05.
Landa, J., Neshuku, H., Simwaza, C., Quinzan, M., 2013. Age estimation guide for monkfish (Lophius vomerinus) in
Namibia. Unpublished report. Swakopmund, Namibia: National Marine Information and Research Centre.
Leslie, R. W., Grant, W. S., 1990. Lack of congruence between the genetic and morphological stock structure of the
Southern African Anglerfish Lophius vomerinus. South African Journal of Marine Science, 9: 379-398.
Lloris, D., Matallanas, J., Oliver, P., 2005. Hakes of the world (Family Merlucciidae). An annotated and illustrated
catalogue of hake species known to date. FAO Species Catalogue for Fishery Purposes. No. 2. Rome, FAO,
57 pp.
Lucks, D. K., Payne, A. I. L., Maree, S., 1973. The trawl fishery of South West Africa. South African Shipping News
and Fishing Industry Review, 28(9): 65 – 71.
Maartens, L., Booth, A. J., 2005. Aspects of the reproductive biology of monkfish Lophius vomerinus off Namibia,
African Journal of Marine Science, 27: 325-329, doi: 10.2989/18142320509504090.
Maartens, L., Booth, A. J., 2001. Quantifying commercial catch and effort of monkfish Lophius vomerinus and L.
vaillanti off Namibia. In A Decade of Namibian Fisheries Science. Payne, A. I. L., Pillar, S. C. and R. J. M.
Crawford (Eds). South African Journal of Marine Science, 23: 291–306.
97
Maartens, L., 1999. An assessment of the monkfish resource of Namibia. PhD Thesis. Rhodes University.
Maartens, L., Booth, A. J., Hecht, T., 1999. The growth of monkfish Lophius vomerinus in Namibian waters, with a
comparison of otoliths and illicia methods of ageing. Fisheries Research, 44: 139-148.
Macpherson, E., Gordoa, A., 1994. Effect of prey densities on cannibalism in Cape hake (Merluccius capensis) off
Namibia. Marine Biology, 119 (1): 145–149.
Macpherson, E., Gordoa, A., 1992. Trends in the demersal fish community off Namibia from 1983 to 1990. In: Payne
AIL, KH Brinck, KH Mann & R Hilborn (eds), Benguela Trophic Functioning. South African Journal of
Marine Science, 12: 635-649.
Macpherson, E., Duarte, C. M., 1991. Bathymetric trends in demersal fish size: is there a general relationship? Marine
Ecology Progress Series, 71:103-112.
Macpherson, E., Roel, B. A., 1987. Trophic relationships in the demersal fish community off Namibia. South African
Journal of Marine Science, 5: 585–596.
Macpherson, E., 1985. Daily ration and feeding periodicity of some fishes off the coast of Namibia. Marine Ecological
Progress Series, 26: 253-260.
Macpherson, E., 1976. Relative growth in Merluccius capensis. Collection of Scientific Papers of the International
Commission for Southeast Atlantic Fisheries, 3: 115 – 118.
Martell, S., Froese, R., 2013. A simple method for estimating MSY from catch and resilience. Fish and Fisheries, 14:
504-514.
Mecenero, S., Roux, J.-P., Underhill, L. G., Bester, M. N., 2006. Diet of Cape fur seals Arctocephalus pusilluspusillus
at three mainland breeding colonies in Namibia. 1. Spatial variation. African Journal of Marine Science, 28
(1): 57–71.
MFMR., NPC., 2018. Ministry of Fisheries and Marine Resources. Statistics. Unpublished data. Ministry of Fisheries
and Marine Resources, Republic of Namibia.
98
MFMR., 2000. Marine Resources Act 2000 (Act no. 27 of 2000). Government Gazette of the Republic of Namibia,
2458: 40 pp. http://209.88.21.36/opencms/opencms/grnnet/MFMR/Laws_and_Policies/marineAct.html.
Mildenberger, T., Berg, C. W., Pedersen, M., Kokkalis, A., Nielsen, J. R., 2019. Time-varient productivity in biomass
dynamic models on seasonal and long-term scales. In Press. ICES Journal of Marine Science
Monteiro, P. M. S., van der Plas, A. K., 2006. Forecasting Low Oxygen Water (LOW) variability in the Benguela
System. In: Benguela: Predicting a Large Marine Ecosystem. Elsevier series, Large Marine Ecosystem Part II:
Chapter 5, pp 71-90.
Newman, D., Berkson, J., Suatoni, L., 2015. Current methods for setting catch limits for data-limited fish stocks in
the United States. Fisheries Research, 164: 86-93.
Nielsen, A., Berg, C. W., 2014. Estimation of time-varying selectivity in stock assessment using state-space models.
Fisheries Research, 158: 96-101.
O’Toole, M. J., 1976. Distribution and abundance of the hake Merluccius spp. off South West Africa 1972–1974.
Collection of Scientific Papers of the International Commission for Southeast Atlantic Fisheries, 2: 151–158.
O’Toole, M. J., 1977. Investigations into some important fish larvae in the S. E. Atlantic in relation to the hydrological
Environment, PhD thesis, University of Cape Town.
O'Toole, M. J., 1978. Aspects of the early life history of the hake, Merluccius capensis Castelnau, off South West
Africa. Fisheries Bulletin of South Africa, 10: 20–36.
Olivar, M.-P., Rubiés, P., Salat, J., 1988. Early life history and spawning of Merluccius capensis Castelnau in the
northern Benguela current. South African Journal of Marine Science, 6: 245–254.
Paulus, S., Kashava, S., Mbangula, T., 2013. Age structure, weight and maturity-at-age data of the Namibian hakes,
Merluccius capensis and M. paradoxus, updated for the 2013 assessment. Hake Working Group Meeting
Report. DWG/HK/No. 3.Ministry of Fisheries and Marine Resources, Swakopmund, 26pp, unpublished
results.

99
Payne, A. I. L., Punt, A. E., 1995. Biology and fisheries of South African hakes (M. capensis and M. paradoxus).In
Hake fisheries ecology and markets, pp. 15–47. Ed. by J. Alheit, and T. J. Pitcher. Chapman & Hall, London.
Payne, A. I. L., Badenhorst, A., 1989. Other groundfish resources. In: Payne AIL & RJM Crawford (eds), Oceans of
life off southern Africa, pp. 148-156. Cape Town, Vlaeberg.
Payne, A. I. L., Rose, B., Leslie, R. W., 1987. Feeding of hake and a first attempt at determining their trophic role in
the South African West Coast marine environment. South African Journal of Marine Science, 5(1): 471–501.
Pedersen, M.W., Berg, C.W., 2017. A stochastic surplus production model in continuous-time. Fish and Fisheries,
18; 226-243. doi:10.1111/faf.12174.
Pella, J.J., Tomlinson, P.K., 1969. A Generalized Stock Production Model. Bulletin of the Inter-American Tropical
Tuna Commission, 13: 421-458.
Polacheck, T., Hilborn, R., Punt, A.E., 1993. Fitting surplus production models: comparing methods and measuring
uncertainty. Canadian Journal of Fisheries and Aquatic Sciences, 50: 2597-2607.
Prager, M. H., 2002. Comparison of logistic and generalized surplus-production models applied to swordfish, Xiphias
gladius, in the north Atlantic Ocean. Fisheries Research, 58: 41-57.
Prager, M. H., 1994. A suite of extensions to a non-equilibrium surplus-production model. Fishery Bulletin, 92: 374-
389.
Prince, J., Hordyk, A., Valencia, S. R., Loneragan, N., Sainsbury, K., 2015. Revisiting the concept of Beverton-Holt
life-history invariants with the aim of informing data-poor fisheries assessment. ICES Journal of Marine
Science, 72: 194–203.
Punt , A. E., Anthony D. Smith, A. D. M., Smith , D. C., Tuck, G. N., Klaer, N. L., 2013. Selecting relative abundance
proxies for BMSY and BMEY. ICES Journal of Marine Science, 71 (3): 469–483,
https://doi.org/10.1093/icesjms/fst162.

100
Punt, A.E., 2003. Extending production models to include process error in the population dynamics. Canadian Journal
of Fisheries and Aquatic Sciences, 60: 1217–1228.
Punt, A.E., Walker, T.I., Taylor, B.L., Pribac, F., 2000. Standardization of catch and effort data in a spatially-
structured shark fishery. Fisheries Research, 45(2): 129– 145. doi:10.1016/S0165-7836(99)00106-X.
Rademeyer, R. A., Butterworth, D. S., Plagányi, E. E., 2008. A history of recent bases for management and the
development of a species-combined Operational Management Procedure for the South African hake resource.
African Journal of Marine Science, 30(2): 291-310.
Rademeyer, R., Nishida, T., 2011. Users’ manual: AD model builder implemented age-structured production model
(ASPM) software. Available at www.iotc.org/sites/default/files/documents/.../ IOTC-2011-WPTT13-
46%20Rev_1.pdf [accessed February 2016].
R Core Team., 2012. R: a language and environment for statistical computing. Vienna, Austria: R Foundation for
Statistical Computing.
Reeves, S. A., 2003. A simulation study of the implications of age-reading errors for stock assessment and
management advice. ICES Journal of Marine Science, 60: 314-328.
Roel, B. A., Macpherson, E., 1988. Feeding of Merluccius capensis and M. paradoxus off Namibia. South African
Journal of Marine Science, 6: 227–243.
Rouaulta, M., Illiga, S., Lübbecked, J., Koungue, R. A. I., 2018. Origin, development and demise of the 2010–2011
Benguela Niño. Journal of Marine Systems, doi: 10.1016/j.jmarsys.2017.07.007.
Roux, J.-P., Shannon, L. J., 2004. Ecosystem approach to fisheries management in the Northern Benguela: the
Namibian experience. African Journal of Marine Science, 26: 79–93.
Rudd, M. B., Thorson, J. T., 2018. Accounting for variable recruitment and fishing mortality in length-based stock
assessments for data-limited fisheries. Canadian Journal of Fisheries and Aquatic Sciences, 75(7): 1019-1035,
doi.org/10.1139/cjfas-2017-0143.

101
Shannon, L. V., 1985. The Benguela ecosystem. Part I. Evolution of the Benguela, physical features and processes.
Oceanography and Marine Biology Annual Review, 23: 105–182.
Singh, L., Melo, Y. C., Glazer, J. P., 2011. Merluccius capensis and M. paradoxus length at 50% maturity based on
histological analyses of gonads from surveys. Demersal working group document, Department of Agriculture,
Forestry and Fisheries, Cape Town, South Africa, FISHERIES/2011/JUL/SWG-DEM/33: 6 pp.
Smith, J. L. B., 1970. The Sea Fishes of Southern Africa. Fifth Edition, Central News Agency, South Africa.
Sparre, P., Venema, S. C., 1998. Introduction to tropical fish stock assessment. Part 1: Manual. FAO Fisheries
Technical Paper, 306/1 (Rev. 2).
Strømme T., 1992. NAN-SIS: Software for Fishery Survey Data Logging and Analysis. User’s Manual.
Computerized Information Series (Fisheries) No. 4. FAO, Rome, 103 pp.
Strømme, T., Lipinski, M.R., Kainge, P., 2016. Life cycle of hake and likely management implications. Reviews in
Fish Biology and Fisheries, 26: 235–248. doi:10.1007/s11160-015-9415-9.
Sundby, S., Boyd, A.J., Hutchings, L., O’Toole, M.J., Thorisson, K., Thorsen, A., 2001. Interaction between Cape
hake spawning and the circulation in the northern Benguela upwelling ecosystem. South African Journal of
Marine Science, 23: 317–336.
Thorson, J. T., 2018. Perspective: Let’s simplify stock assessment by replacing tuning algorithms with statistics.
Fisheries Research, https://doi.org/10.1016/j.fishres.2018.02.005.
Traut, P. J., 1996. Diet and annual consumption for the Cape hakes on the Namibian shelf, with special reference to
cannibalism. MPhil thesis, University of Bergen, Norway: 66 pp.
Venables, W. N., Ripley, B. D., 2004. Modern applied statistics with S. (4th edn). New York: Springer-Verlag.
Voges, E., Gordoa, A., Field, J. G., Bartholomae C., 2002. Estimating the probability of different levels of
recruitment for Cape hakes Merluccius capensis off Namibia, using environmental indices. Fisheries
Research, 58: 333–340.

102
von der Heyden, S., Lipinski, M. R., Matthee, C. A., 2007. Mitochondrial DNA analyses of the Cape hakes reveal an
expanding, panmictic population for Merluccius capensis and population structuring for mature fish in
Merluccius paradoxus. Molecular Phylogenetics and Evolution, 42: 517–527.
Walmsley, S. A., Leslie, R. W., Sauer, W. H. H., 2005. The biology and distribution of the monkfish Lophius
vomerinus off South Africa. African Journal of Marine Science, 27 (1): 157-168.
Wilhelm, M. R., 2012. Growth and otolith zone formation of Namibian hake Merluccius capensis. PhD thesis,
University of Cape Town, South Africa: 236 pp.
Wilhelm, M. R., Roux, J-P., Moloney, C. L., Jarre, A., 2013. Data from fur seal scats reveal when Namibian
Merluccius capensis are hatched and how fast they grow. ICES Journal of Marine Science, 70:1429–1438.
Wilhelm, M.R., Kirchner, C.H., Roux, J-P., Jarre, A., Iitembu, J.A., Kathena, J.N., Kainge, P., 2015. Biology and
fisheries of the shallow-water hake (Merluccius capensis) and the deep-water hake (M. paradoxus) in Namibia.
Chapter 3 In Hakes: biology and exploitation, pp 70-100 Ed. by H. Arancibia, H. John Wiley & Sons, Ltd.,
Chichester, UK. doi: 10.1002/9781118568262.ch3.
Wood, S. N., 2011. Fast stable restricted maximum likelihood and marginal likelihood estimation of semi-parametric
generalized linear models. Journal of the Royal Statistical Society, 73: 3–36.

Appendix I
Paper I
A robust method for generating separate catch
time-series for each of the hake species caught
in the Namibian trawl fishery.
Full citation:
Johnsen, E., Kathena, J., 2012. A robust method for generating separate catch time-series for each
of the hake species caught in the Namibian trawl fishery. African Journal of Marine Science, 34:
43–53.
Due to copyright, the paper is not included in this version of the thesis.

Appendix II
Paper II
Population abundance and seasonal migration
patterns indicated by commercial catch-per-
unit-effort of hakes (Merluccius capensis and
M. paradoxus) in the northern Benguela
Current Large Marine Ecosystem.
Full citation:
Kathena, J. N., Yemane, D., Bahamon, N., Jansen, T., 2018. Population abundance and seasonal
migration patterns indicated by commercial catch-per-unit-effort of hakes (Merluccius capensis and
M. paradoxus) in the northern Benguela Current Large Marine Ecosystem. African Journal of
Marine Science, 40(2): 197-209 https://doi.org/10.2989/1814232X.2018.1476264
Due to copyright, the paper is not included in this version of the thesis.

Appendix III
Paper III
Hake species (Merluccius capensis and M.
paradoxus) assessment in the Benguela
Current Large MarineEcosystem
Full citation:
Kathena, J.N., Nielsen, A., Thygesen, U.H., Berg, C.W., 2016. Hake species (Merluccius capensis
and M. paradoxus) assessment in the Benguela Current Large MarineEcosystem. Environmental
Development, 17: 193–201 http://dx.doi.org/10.1016/j.envdev.2015.11.011.
Due to copyright, the paper is not included in this version of the thesis.
Appendix IV
Paper IV
Data-moderate assessment of Cape monkfish
(Lophius vomerinus) and West Coast sole
(Austroglossus microlepis) in Namibian waters.
Full citation:
Kathena, J.N., Kokkalis, A., Pedersen, W. M., Beyer, J.E., Thygesen, U. H., 2018. Data-moderate
assessment of Cape monkfish (Lophius vomerinus) and West Coast sole (Austroglossus microlepis)
in Namibian waters. African Journal of Marine Science, 40(3): 293-302,
https://doi.org/10.2989/1814232X.2018.1512527
Due to copyright, the paper is not included in this version of the thesis.

Technical University of Denmark
DTU AquaKemitorvetDK-2800 Kgs. Lyngby
www.aqua.dtu.dk