contribution to dynamic simulation of activated sludge wastewater … › downloadfile... · iii...
TRANSCRIPT
Contribution to dynamic simulation of activated slu dge wastewater treatment plants
Sara Patrícia da Silva Batista Pinto
Dissertação para obtenção do Grau de Mestre em
Engenharia do Ambiente
Júri
Presidente: José Manuel de Saldanha Gonçalves Matos, DECivil, IST-UTL
Orientadora: Filipa Maria Santos Ferreira, DECivil, IST-UTL
Co-orientador: António João Carvalho de Albuquerque, DECA, UBI
Vogal: Helena Maria Vasconcelos Rodrigues Pinheiro, DEQB, IST-UTL
Julho de 2010

I
AKNOWLEDGEMENTS
First of all, I would like to express my gratitude to my supervisors Professors Filipa
Ferreira (IST-UTL) and António Albuquerque (UBI) for all their support, advice and
explanations about the challenges of wastewater treatment modeling and respirometry, as
these were new areas to me. Furthermore, I must give special thanks to Professor Filipa
Ferreira for given me this opportunity, for our productively discussions and for her careful
proof reading of this thesis which improved its quality considerably.
I am very grateful to Sabrina Semitela (UBI) for collaborating with me in the respirometric
tests and especially for her patience when answering to all my questions (over and over
again). I also would like to thank my fellow colleague Marta Matos, who helped me during
an intensive and long day of the campaign, and who gave me enthusiastic support
throughout this project.
I wish to thank Águas do Zêzere e Côa for allowing me to use Valhelhas wastewater
treatment plant as my case study, and especially to staff for their technical support.
I am also grateful to Professor Pedro Rodrigues (IPG) and his assistant, for their
collaboration with the laboratory analysis.
Thanks are also due to IGAOT, namely to Tiago Sameiro, Pedro Lourenço and Filipe
Vitorino, for providing me valuable information presented in Chapter 2.2.
I also would like to express my thanks to Will Kirwin for his careful reading of this thesis
and for helping me improving my linguistic skills.
This work has been supported financially by the Fundação para a Ciência e Tecnologia
(FCT) as part of the MOGIS project, reference number PPCDT/AMB/56349/2004. This
support is gratefully acknowledged.

III
ABSTRACT
In Portugal, many wastewater treatment plants are presently operating in accordance to
predetermined schemes, with few concerns to variations of the activated sludge process
and without optimizing its performance to achieve a better effluent quality. Little attention
has been given to the activated sludge models as powerful tools for wastewater treatment
process understanding, design, control and optimization.
The main goal of this study is to contribute to the understanding of the activated sludge
process, to the simulation of organic carbon removal based on ASM3 and to the use of
respirometric assays in order to obtain kinetic and stoichiometric coefficients for model
calibration.
Respirometric assays were carried out using raw wastewater (as substrate source) and
return activated sludge (as biomass source) from the Valhelhas wastewater treatment
plant (WWTP); the values 2.88 d-1, 4.32 d-1, 6.4 d-1, 0.7 g CODVSS/g COD and 523 g
COD/m3 were subsequently obtained for parameters ��, ��, �����, �� and ,
respectively. Monitoring campaigns were conducted in order to characterize the
composition of flows from seven different sections of the WWTP and to investigate the
dissolved oxygen concentrations in the biological reactors.
The dynamic simulation of the WWTP was confronted with several limitations related to
the treatment plant performance and the desired stability for modeling was not verified. An
alternative academic approach was performed as an attempt to understand the
consequences of different operation methodologies, in terms of process efficiency. As a
result, the global quality of the final effluent could theoretically be improved and the
operation costs minimized if only one treatment line was used.
Keywords: activated sludge; ASM3; modeling; wastewater treatment; respirometry.

V
RESUMO
Em Portugal, muitas estações de tratamento de águas residuais (ETAR) operam
actualmente de acordo com esquemas pré-determinados, sem considerarem as
variações do processo de lamas activadas e sem optimizarem o seu desempenho de
forma a atingir uma melhor qualidade do efluente. Tem sido dada pouca atenção aos
modelos de lamas activadas enquanto ferramentas importantes para a compreensão,
concepção, controlo e optimização do processo de tratamento de águas residuais por
lamas activadas.
Este trabalho pretende contribuir para a compreensão do processo de lamas activadas,
para a simulação da remoção de carbono orgânico baseada no modelo ASM3 e para a
utilização de ensaios respirométricos, destinados à obtenção de coeficientes cinéticos e
estequeométricos para calibração do modelo.
Foram realizados ensaios respirométricos tendo como fonte de substrato a água residual
afluente e, como fonte de biomassa, as lamas activadas da ETAR de Valhelhas;
posteriormente foram obtidos os valores 2.88 d-1, 4.32 d-1, 6.4 d-1, 0.7 g CODVSS/g COD e
523 g COD/m3 para os parâmetros: ��, ��, �����, �� e , respectivamente.
Realizaram-se campanhas de monitorização para caracterizar a composição dos caudais
em sete secções diferentes da ETAR e para averiguar as concentrações de oxigénio
dissolvido nos reactores biológicos.
A simulação dinâmica da ETAR deparou-se com algumas limitações resultantes da
própria operação da ETAR, pelo que não foi possível obter a estabilidade desejada para
a modelação. Deste modo, optou-se por uma abordagem alternativa, de natureza
académica, numa tentativa de compreender as consequências de diferentes
metodologias de operação na eficiência do processo. Como resultado, observou-se que a
qualidade global do efluente final poderia ser, teoricamente, melhorada e os custos
operacionais reduzidos, se apenas uma linha de tratamento estivesse em operação.
Palavras-chave: ASM3; lamas activadas; modelação; respirometria; tratamento de águas
residuais.

VII
TABLE OF CONTENTS
AKNOWLEDGEMENTS……………………………………………………………….……….………I
ABSTRACT…………………………………………………………………………….…….……...III
RESUMO………………………………………………………………………………..………..….V
TABLE OF CONTENTS ………………………………………………………………….………….VII
LIST OF TABLES …………………………………………………………..……………..…………IX
LIST OF FIGURES………………………………………………………………………………....…X
LIST OF TABLES OF APPENDICES ………………………………………………………………….XI
LIST OF FIGURES OF APPENDICES………………………………………………………………...XI
NOTATION AND ABBREVIATION ………………………………………………………………..…XIII
1. INTRODUCTION .................................................................................................................. 1
1.1. Background and motivation of this thesis .............................................................. 1
1.2. Objective ............................................................................................................... 2
1.3. Outline of the thesis ............................................................................................... 2
2. LEGAL FRAMEWORK AND SANITATION IN PORTUGAL .......................................................... 5
2.1. Legal framework .................................................................................................... 5
2.2. Sanitation in Portugal ............................................................................................ 9
3. BIOLOGICAL TREATMENT ................................................................................................. 13
3.1. Composition of urban wastewater ....................................................................... 13
3.1.1 Chemical and physical properties ................................................................ 13
3.1.2 Organic components .................................................................................... 14
3.1.3 Inorganic non-metallic constituents .............................................................. 14
3.2. Basic aspects of microbiology ............................................................................. 16
3.3. Removal of Pollutants ......................................................................................... 18
3.3.1 Removal of organic constituents .................................................................. 18
3.3.2 Biological removal of nutrients ..................................................................... 20
3.4. Activated Sludge Process ................................................................................... 23
3.4.1 Historical perspective ................................................................................... 23
3.4.2 Oxidation ditch process ................................................................................ 24
3.5. Sedimentation ..................................................................................................... 28
4. RESPIROMETRY ............................................................................................................... 29
4.1. Respirometers ..................................................................................................... 30
4.2. Respirometric experiments .................................................................................. 32
4.2.1 Measurement conditions .............................................................................. 32
4.2.2 Measurement and deduction of variables .................................................... 34
5. MODELING OF WASTEWATER TREATMENT PLANTS ............................................................ 37
VIII
5.1. General considerations of modeling ................................................................... 37
5.2. Biological model: Activated sludge models ......................................................... 38
5.2.1 Description of the Activated sludge model Nº3 (ASM3) ............................... 39
5.3. Sedimentation models ........................................................................................ 44
5.4. Model calibration and validation .......................................................................... 46
6. CASE STUDY ................................................................................................................... 47
6.1. Overview of the work performed ......................................................................... 47
6.2. Characterization of the wastewater treatment system ........................................ 48
6.3. Respirometric assays .......................................................................................... 51
6.3.1 General considerations ................................................................................ 51
6.3.2 Materials and methods ................................................................................ 52
6.3.3 Results of the respirometric experiments .................................................... 55
6.4. Monitoring campaigns ......................................................................................... 61
6.4.1 General considerations and constraints ...................................................... 61
6.4.2 Description and methods ............................................................................. 63
6.4.3 Results of the measuring campaigns ........................................................... 65
6.5. Dynamic simulation of Valhelhas WWTP ............................................................ 73
6.5.1 General considerations ................................................................................ 74
6.5.2 Model construction ....................................................................................... 74
6.5.3 Simulation results ........................................................................................ 75
7. CONCLUSIONS ................................................................................................................ 77
REFERENCES ...................................................................................................................... 80
APPENDICES…………………………………………………………………………………..A1
Appendix A.1 – Respirometer classification ………………………………………………A3
Appendix A.2 – Respiration rate of substrate oxidation……………...…………………..A5
Appendix A.3 – Determination of the oxygen mass transfer coefficient (��)..…….….A7
Appendix A.4 – Simplified ASM3 process equations………….………………………….A9
Appendix A.5 – ASM3 model: Matrix of Petersen, typical values and components....A11
Appendix A.6 – Map of Valhelhas wastewater drainage system………………………A13
Appendix A.7 – Plant of operation of Valhelhas wastewater treatment plant…….…..A15
Appendix A.8 – Detailed measurements carried out at Valhelhas wastewater treatment
plant………………………………………………………………………....A17
IX
LIST OF TABLES
Table 2.1 | Requirements for discharges of WWTPs in sensitive areas (adopted from INAG, 2002) 7
Table 2.2 | Microbiological parameters according to their classification (adopted from Law
nº135/2009) (MPN: most probable number) .................................................................... 8
Table 2.3 | Problems of the wastewater drainage and treatment sector in Portugal presented in
PEAASAR II (adopted from MAOTDR, 2007) ............................................................... 12
Table 3.1 | Composition values of raw wastewater (adopted from Henze, 1997; quoted by Ferreira,
2006) ............................................................................................................................. 16
Table 3.2 | Main bacterial reactions in wastewater according with the environmental conditions
(adopted from Ferreira, 2006) ....................................................................................... 19
Table 4.1 | Typical values for stoichiometric and kinetic parameters for heterotrophic biomass ..... 37
Table 6.1 | Physical characteristics of the most relevant treatment units of Valhelhas WWTP ....... 49
Table 6.2 | Average daily flows of wastewater influent and return activated sludge (RAS) registered
from June 2008 to April 2009 ........................................................................................ 50
Table 6.3 | Summary of historical wastewater influent and final effluent analytical composition (data
related to the period from June 2008 to December 2009); full data is reported in Table
A.8.1 in Appendix A.8; q.l.: quantification limit of the method ........................................ 51
Table 6.4 | Composition and used volumes of the mineral solutions .............................................. 53
Table 6.5 | Characterization of the influent wastewater (substrate) and the volume of the
respirometric cell after substrate injection ..................................................................... 56
Table 6.6 | Stoichiometric and kinetic parameters obtained from the respirometric assays ............ 57
Table 6.7 | Comparison of several parameter set obtained through model based interpretation and
empiric calculation of respirogram R1-2; Legend: ......................................................... 60
Table 6.8 | Analytical methods used for physical-chemical and microbiological measurements
during the campaign at Valhelhas WWTP ..................................................................... 63
Table 6.9 | Average hourly flows for wastewater influent and RAS from 2 to 17 December ........... 65
Table 6.10 | Average concentrations of influent wastewater components (average values) during
the campaign of 16/17 December, 2009 ....................................................................... 67
Table 6.11 | Results of the measured dissolved oxygen in the oxidation ditches during the
campaign and in accordance with the sections of measurement as indicated in Figure
6.12 (n.a.: not assessed) ............................................................................................... 69
Table 6.12 | Summary of measurements of wastewater influent and final effluent carried out during
the campaign of 14/15 December at Valhelhas WWTP and the percentage of
component removal ....................................................................................................... 71
Table 6.13 | Summary of measurements of wastewater influent and final effluent carried out during
the campaign of 16/17 December at Valhelhas WWTP ................................................ 71
Table 6.14 | Comparison between dimension values adopted for design and historical operation
values relative to 2008/2009 from Valhelhas WWTP .................................................... 72
X
Table 6.15 | Comparison between the volume of the aeration tank of Valhelhas WWTP relative to
design parameters and different operation scenarios ................................................... 73
LIST OF FIGURES
Figure 2.1 | Compliance with Articles 4 and 5 of the UWWT Directive (adapted from Commission of
the European Communities, 2009) .................................................................................. 7
Figure 2.2 | Index of population served with wastewater drainage and treatment systems (adopted
from IRAR, 2009) ............................................................................................................ 9
Figure 2.3 | Indexes of distribution of population served with wastewater drainage (left) and
wastewater treatment (right), by municipalities and Hydrographic Regions (RH)
(adopted from INAG, 2009) ........................................................................................... 10
Figure 2.4 | Distribution of a) treatment systems (adopted from INSAAR, 2007 – data for 2007); b)
influent wastewater subject to each level of treatment (adopted from INE, 2009 – data
for 2008). Data includes WWTP and septic tanks ......................................................... 11
Figure 2.5 | Statistical results of a WWTP inspection relatively to 2006/2007; a) Fulfillment of all
legal requirements; b) Percentage of WWTPs that exceeded in more than 100% the
limit value for emission of each component analyzed ................................................... 11
Figure 3.1 | Microbial growth curve of a pure (a) and mixed (b) batch cultures, respectively
(adapted from Metcalf & Eddy, 1991) ............................................................................ 17
Figure 3.2 | Effect of a limiting substrate ( �) on the specific growth rate (�), according to Monod 17
Figure 3.3 | Typical oxidation ditch activated sludge system ........................................................... 24
Figure 4.1 | DO and OUR curves of a LFS respirometer test .......................................................... 35
Figure 5.1 | Wastewater characterization COD components in ASM3 (modified from Jeppsson,
1996) ............................................................................................................................. 40
Figure 5.2 | Nitrogen components in ASM3 (modified from Jeppsson, 1996) ................................. 41
Figure 5.3 | Substrate flows of COD in ASM3 for nitrifiers and heterotrophs (adopted from Gujer et
al., 2000) ....................................................................................................................... 42
Figure 5.4 | Solids balance around the settler layers (adopted from Hydromantis, 2006) ............... 44
Figure 5.5 | Graphical representation of the settling velocity model of Takács (adopted from
Hydromantis, 2006) ....................................................................................................... 46
Figure 6.1 | Flow diagram of the liquid and solid phases of the Valhelhas WWTP ......................... 49
Figure 6.2 | Schematic layout of the respirometer ........................................................................... 53
Figure 6.3 | Respirometer device for measurement of OUR ........................................................... 54
Figure 6.4 | Oxygen uptake rate evolution over time for all the respirometric tests (1 minute
measurements) ............................................................................................................. 56
Figure 6.5 | Estimation of ����� and � based on the data presented in Table 6.6 ..................... 58
Figure 6.6 | Heterotrophic OUR variation over time of R1-2 (OUR simulated considering Set 4 of
Table 6.7) ...................................................................................................................... 61
Figure 6.7 | Foaming sludge in the oxidation ditch (left) and rising of sludge in the clarifier (right) . 62
XI
Figure 6.8 | View from the sampling locations in Valhelhas WWTP ................................................ 64
Figure 6.9 | Concentrations of influent wastewater components and average influent flow during the
campaign of 14/15 December, 2009 (fulfilled points: measured values; unfulfilled points:
estimated values) .......................................................................................................... 66
Figure 6.10 | Concentrations of nitrogen compounds in the influent wastewater during the
campaign of 14/15 December, 2009 (fulfilled points: measured values; unfulfilled points:
estimated values) .......................................................................................................... 67
Figure 6.11 | Sections of measurement of dissolved oxygen in the oxidations ditches 1 and 2,
according to Table 6.11 (the arrows indicate the direction of the flow) ......................... 68
Figure 6.12 | Samples collected in 16 December ............................................................................ 72
Figure 6.13 | Simplified layout of Valhelhas WWTP used for modeling .......................................... 75
Figure 6.15 | Example of application: Results of the dynamic simulation with ASM3 (T=10 ºC),
considering: 1 line; Qras/Qinf= 0.6; Qes/Qinf≈0.02 ....................................................... 76
LIST OF TABLES OF THE APPENDICES
Table A.1.1 | Respirometer classification (adapted from Spanjers et al., 1998)…………………….A3
Table A.1.2 | Respirometer description (adapted from Spanjers et al., 1998)……………………….A4
Table A.3.1 | Measured DO concentration values of the respirometric experiment R1-14………...A7
Table A.5.1 | Typical values of kinetic parameters for ASM3
(adopted from Gujer et al., 2000)……………………………………………………...…A11
Table A.5.2 | Typical stoichiometric and composition parameters for ASM3
(Source: Gujer et al. (2000))…………...……………………………………………...….A11
Table A.5.3 | Stoichiometric matrix ��,� , composition matrix ��,� and kinetic rate expressions �� for
ASM3 (adopted from Gujer et al., 2000)….………………………………………...…..A12
Table A.8.1 | Historical wastewater influent and final effluent compositions……….……..………A17
Table A.8.2 | Results of measurements carried out during the campaign of 14/15
December at Valhelhas WWTP…………………………………………………………..A18
Table A.8.3 | Results of measurements carried out during the campaign of 16/17 of
December at Valhelhas WWTP…………………………………………………………..A19
LIST OF FIGURES OF THE APPENDICES
Figure A.2.1 | DO curve of a LFS respirometer test (illustration of ����)………………..………A5
Figure A.3.1 | Decline curve of Ln(DOS-DO) in function of time…………………………………A7
Figure A.4.1 | Simplified model for aerobic conditions (adapted from Avcioglu et al. (2003))..A9

XIII
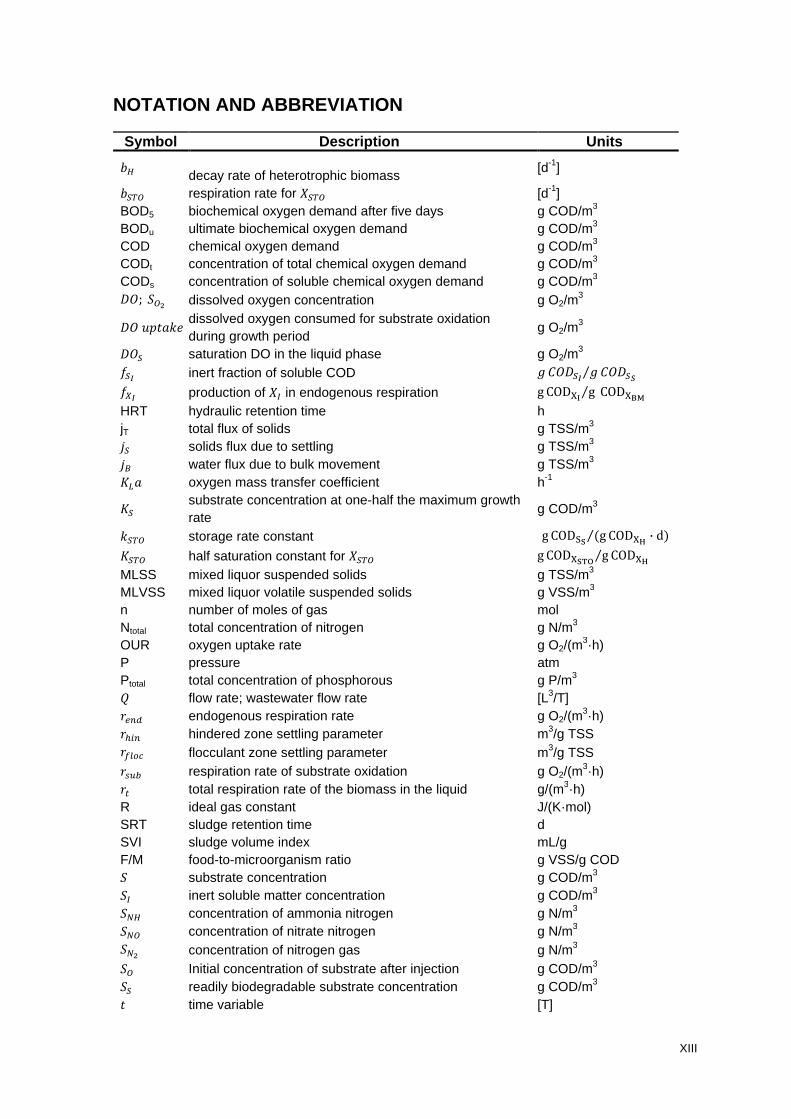
NOTATION AND ABBREVIATION
Symbol Description Units �� decay rate of heterotrophic biomass
[d-1] �� respiration rate for !� [d-1] BOD5 biochemical oxygen demand after five days g COD/m3 BODu ultimate biochemical oxygen demand g COD/m3 COD chemical oxygen demand g COD/m3
CODt concentration of total chemical oxygen demand g COD/m3
CODs concentration of soluble chemical oxygen demand g COD/m3 "#; � % dissolved oxygen concentration g O2/m3
"# &'(�)* dissolved oxygen consumed for substrate oxidation during growth period
g O2/m3 "# saturation DO in the liquid phase g O2/m3 +, inert fraction of soluble COD - .#", -⁄ .#"0 +1, production of !2 in endogenous respiration g COD78 g⁄ COD79:
HRT hydraulic retention time h jT total flux of solids g TSS/m3 ; solids flux due to settling g TSS/m3 ;< water flux due to bulk movement g TSS/m3 �� oxygen mass transfer coefficient h-1
substrate concentration at one-half the maximum growth rate
g COD/m3 )� storage rate constant g COD=> (g⁄ COD7@ ∙ d) � half saturation constant for !� g COD7>DE g⁄ COD7@
MLSS mixed liquor suspended solids g TSS/m3 MLVSS mixed liquor volatile suspended solids g VSS/m3 n number of moles of gas mol Ntotal total concentration of nitrogen g N/m3 OUR oxygen uptake rate g O2/(m
3·h) P pressure atm Ptotal total concentration of phosphorous g P/m3 F flow rate; wastewater flow rate [L3/T] GHIJ endogenous respiration rate g O2/(m
3·h) GKLI hindered zone settling parameter m3/g TSS GMNOP flocculant zone settling parameter m3/g TSS GQRS respiration rate of substrate oxidation g O2/(m3·h) GT total respiration rate of the biomass in the liquid g/(m3·h)
R ideal gas constant J/(K·mol) SRT sludge retention time d SVI sludge volume index mL/g F/M food-to-microorganism ratio g VSS/g COD � substrate concentration g COD/m3 �2 inert soluble matter concentration g COD/m3 �U� concentration of ammonia nitrogen g N/m3 �U concentration of nitrate nitrogen g N/m3 �U% concentration of nitrogen gas g N/m3 � Initial concentration of substrate after injection g COD/m3 � readily biodegradable substrate concentration g COD/m3 ( time variable [T]
XIV
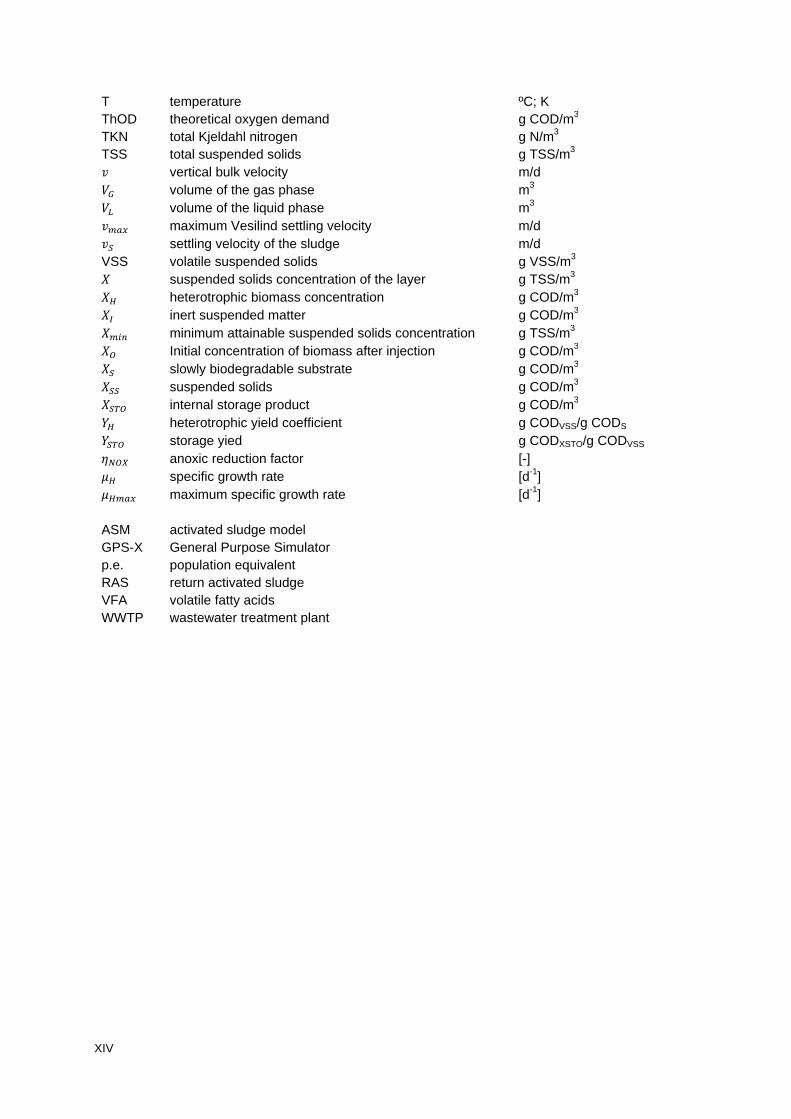
T temperature ºC; K ThOD theoretical oxygen demand g COD/m3 TKN total Kjeldahl nitrogen g N/m3 TSS total suspended solids g TSS/m3 V vertical bulk velocity m/d WX volume of the gas phase m3 W� volume of the liquid phase m3 V��� maximum Vesilind settling velocity m/d V settling velocity of the sludge m/d VSS volatile suspended solids g VSS/m3 ! suspended solids concentration of the layer g TSS/m3 !� heterotrophic biomass concentration g COD/m3 !2 inert suspended matter g COD/m3 !�LI minimum attainable suspended solids concentration g TSS/m3 ! Initial concentration of biomass after injection g COD/m3 ! slowly biodegradable substrate g COD/m3 ! suspended solids g COD/m3 !� internal storage product g COD/m3 �� heterotrophic yield coefficient g CODVSS/g CODS �� storage yied g CODXSTO/g CODVSS YU 1 anoxic reduction factor [-] �� specific growth rate [d-1] ����� maximum specific growth rate [d-1]
ASM activated sludge model GPS-X General Purpose Simulator p.e. population equivalent RAS return activated sludge VFA volatile fatty acids WWTP wastewater treatment plant
1
1. INTRODUCTION
1.1. BACKGROUND AND MOTIVATION OF THIS THESIS
Modern wastewater treatment techniques have been in use for over a century. Today, the
activated sludge process is one of the most widespread biological wastewater purification
technologies. In this process, wastewater is mixed with a concentrated bacterial biomass
suspension (the activated sludge) which degrades the pollutants. Originally, the concern
was mainly to remove the organic carbon substances from the wastewater, which could
be easily achieved by simple process designs. However, during the last three decades the
increased public awareness about the quality of waters and the management of hydric
resources has considerably increased the requirements imposed on treatment plants,
reflected in more stringent effluent regulations. As a consequence, the design and
operation of activated sludge plants had to be modified to more advanced levels to make
the treatment plants suited for biological nitrogen and phosphorus removal.
These more stringent requirements, and the associated technological improvements
resulted in an increase of knowledge about the biological degradation processes and in
the development and use of advanced dynamic mathematical models that are be able to
describe the biological removal processes, known as the Activated Sludge Models (Henze
et al., 1987; Henze et al., 1995; Henze et al., 1999; Gujer et al., 2000). These activated
sludge models allow one to study and increase the understanding of the influence of
process modifications on treatment process efficiency.
The activated sludge process is required to meet effluent standards while minimizing
investment, sludge production and energy consumption. A problem inherent in achieving
this aim is that the activated sludge process is highly dynamic due to variations in the
influent flow rate and its composition. Many wastewater treatment plants are presently
operated according to predetermined schemes with very little consideration to these
variations. In general, the combination of a better understanding of the dynamic behavior
of the processes, efficient monitoring control systems, adequate mathematical models and
identification of model parameters, have a significant potential for solving operational
problems and meet effluent quality standards at low operational costs.
In Portugal, little attention has been given to the activated sludge models as powerful tools
for wastewater treatment process understanding, design, control and optimization
(Ferreira, 2006).
2
1.2. OBJECTIVE
The aim of this study is to contribute to the understanding (theoretical and practical) and
to the assessment of the activated sludge treatment process, by combining dynamic
model simulation with respirometric tests in order to determine relevant kinetic and
stoichiometric parameters of these models. To this end, basic knowledge had to be
developed concerning:
♦ Sensitive analysis of wastewater treatment plant data;
♦ Planning and management of campaigns in the field (e.g. methodology and materials);
♦ Modeling construction and simulation of the wastewater treatment process;
♦ Interpretation of respirograms.
1.3. OUTLINE OF THE THESIS
The thesis is divided into 7 chapters and 8 appendices:
Chapter 1 introduces the scope and background, including the goals and structure of the
work.
Chapter 2 summarizes the legal framework of wastewater treatment in the European
Union and in Portugal, including the required effluent discharges and the degree of
compliance with legislation among some European countries. The evolution of sanitation
in Portugal is also presented, in particular regarding drainage and wastewater treatment
systems, and some inherent problems are highlighted in the perspective of the objectives
defined in the Strategic Plan of Distribution of Water and Drainage of Wastewater 2007-
2013 (PEAASAR II).
Chapter 3 reviews basic aspects of microbiology and biological treatment, namely the
composition of urban wastewater (physical properties, organic and inorganic non-metallic
constituents). Furthermore, it describes the biological removal of carbon, nitrogen and
phosphorous, focusing on the activated sludge process.
Chapters 4 and 5 include a review of literature on respirometry and modeling of
wastewater treatment plants, respectively. Chapter 4 presents basic concepts of
respirometric experiments and measurement conditions. It also describes what
parameters can be measured or deduced from the interpretation of a respirogram.
Chapter 5 deals with the main aspects of modeling biological wastewater treatment and
sedimentation processes and focuses on the Activated Sludge Model Nº3 as the selected
model used in this study. Model calibration and validation are also briefly discussed.
3
Chapter 6 includes all aspects related to the experimental work that was carried out in the
case study, Valhelhas wastewater treatment plant. The characterization of the system, the
respirometric assays, the measuring campaigns and the dynamic simulation are
presented separately. Firstly, the case study is described and the available operation data
is presented and analyzed. Secondly, the materials and methods used in the respirometric
assays are described, followed by the presentation and discussion of results concerning
the measurements of oxygen uptake rates (OUR) of activated sludge. A model based
interpretation of the obtained OUR curves is applied with the purpose of estimating kinetic
and stoichiometric parameters. Next, the monitoring campaigns conducted in Valhelhas
WWTP are described, regarding to its dynamic simulation. The problems which occurred
in the treatment plant in that period are highlighted and their influence in the overall result
of this work is discussed. Finally, the dynamic simulation of Valhelhas WWTP is
presented. Taking the mentioned constraints into account, it was only possible to perform
a simplified and academic dynamic simulation of this treatment plant.
Lastly, Chapter 7 summarizes the work that was carried out and the obtained results
which were obtained in this thesis. Perspectives for future work development and
research are also outlined.
Appendix 1 indicates the classification and a brief description of respirometers according
to Spanjers et al. (1998), including the oxygen measuring phase, regimes, mass balances
and a diagram illustrating each class.
Appendix 2 shows how the respiration rate of substrate oxidation can be estimated from a
dissolved oxygen curve.
Appendix 3 explains the determination of the oxygen mass transfer coefficient used in the
respirometric experiments.
Appendix 4 includes the simplified model equations of ASM3 considered in the model
based interpretation (presented in Chapter 6.3.3) of the measurements of OUR.
Appendix 5 presents all the information relative to the Activated Sludge Model Nº3,
including the stoichiometric and composition matrixes of Petersen, kinetic rate equations
and typical values of kinetic and stoichiometric parameters of the model.
Appendix 6 shows the map of Valhelhas wastewater drainage system, including all the
civil parishes served.
Appendix 7 presents the Valhelhas wastewater treatment plant, including all the treatment
units. The locations where the samples, relative to the measuring campaigns, were
collected are also indicated.

4
Appendix 8 contains all the detailed data resulted from the monitoring campaigns.

5
2. LEGAL FRAMEWORK AND SANITATION IN PORTUGAL
2.1. LEGAL FRAMEWORK
Ecosystems are vulnerable to various pressures caused by human activities such as
wastewater discharges. These can lead to over-fertilization and speed up biodiversity
loss, and can affect drinking water supplies and thereby have important impacts in public
health. Those impacts may in turn have serious negative consequences for economic
sectors such as tourism. This has been recognized by many countries and therefore,
since the 1970s, a range of environmental directives have been adopted by the European
Union (EU) in order to protect and improve the quality of water. The most important
legislations in the EU concerning wastewater treatment are:
♦ Directive 2000/60/EC – The Water Framework Directive establishes a framework for
community action in the field of water policy;
♦ Directive 91/271/EEC – The Urban Wastewater Treatment Directive concerns the
collection, treatment and discharge of urban and industrial wastewater and was altered
by Directive 98/15/EC;
♦ Directive 2006/7/EC – The Bathing Water Directive concerns the management of
bathing water quality and revokes Directive 76/160/EEC;
♦ Directive 91/676/EEC – The Nitrates Directive concerns the protection of waters
against pollution caused by nitrates from agricultural sources;
The Water Framework Directive (WFD) is considered to be the most important
legislation in Europe for water protection. It sets up a new legislative approach
establishing very ambitious objectives for the quality and protection of waters, and relies
on a river basin approach for water management. This directive of the Council of 23
October 2000 commits EU Member States to achieve good qualitative and quantitative
status for all water bodies (inland surface waters such as rivers and lakes, groundwater,
coastal and transitional waters) by 2015. It also regulates the sustainable use of water
resources throughout Europe. It was transposed for the National Portuguese Law by Law
nº 58/2005 of 29 December.
The WFD is also based on the following key principles:
♦ Waters should be managed at a river basin level through River Basin Management
Plans, which in the case of transboundary water bodies implies co-operation between
countries. These plans should enhance the characteristics of each hydrographic
6
region, including the analysis of the impact of human activities, characterization of
water bodies and identification of sources for drinking water.
♦ Active participation of all stakeholders, including NGOs (Non Governmental
Organizations) and local communities in water management activities has to be
ensured.
♦ Water pricing policies based on the “user pays” principle are required.
♦ The interests of the environment with those who depend on it should be maintained in
balance.
The aim of the Urban Wastewater Treatment Directive (UWWTD) of 21 May 1991 is to
protect the environment from the adverse effects of wastewater discharges. Urban
wastewater is considered any domestic wastewater, mixture of domestic and industrial
wastewater, and/or runoff or rainwater. The directive sets out guidelines and legislation on
how urban wastewater is collected, treated and discharged. The directive requires that all
European agglomerations with more than 2000 population equivalents (p.e.) are equipped
with collecting and treatment systems for their wastewaters. According to Article 4 of
UWWTD, the basic level of treatment is secondary treatment (i.e. removal of organic
pollution) whereas in sensitive areas, a more stringent treatment is required (for instance,
the removal of nutrients which are responsible for eutrophication) – Article 5. The
timetable for implementation of the directive depends on the sensitivity of the area into
which wastewaters are discharged and the population equivalents served.
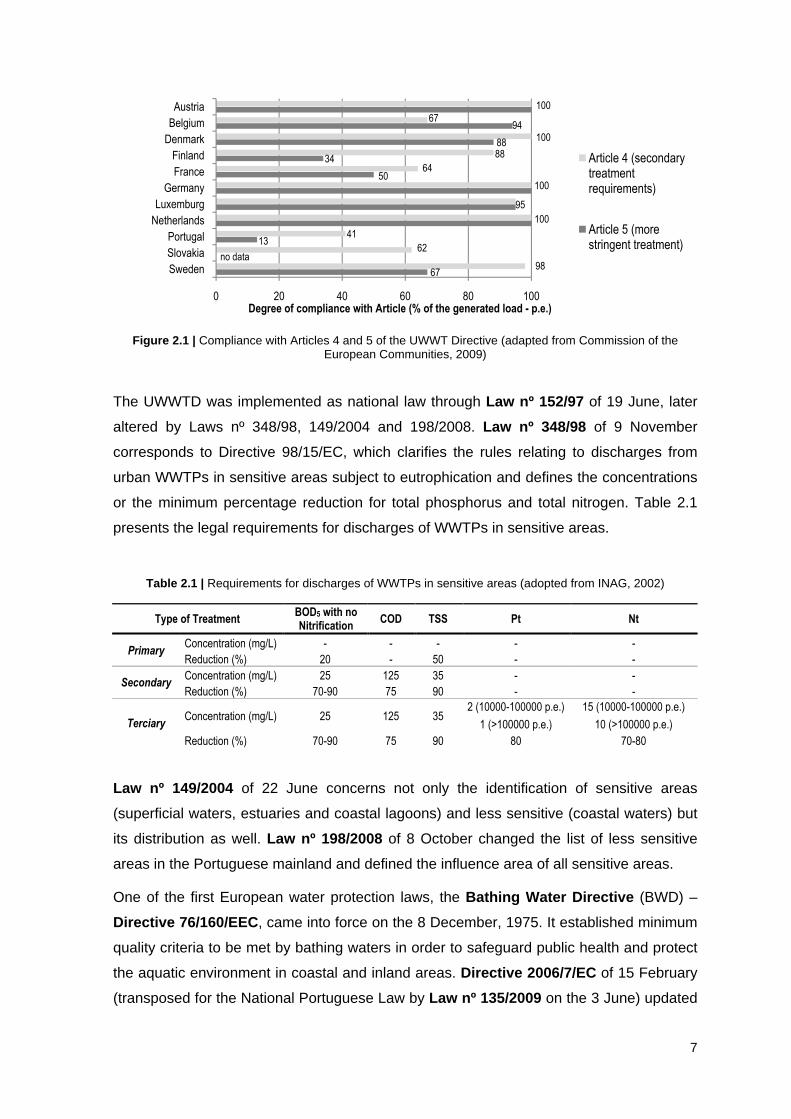
In 2009, an assessment of the implementation of UWWTD was carried out by the
Commission of the European Communities reporting data from December 2005
(Commission of the European Communities, 2009). It was noticed that there were large
discrepancies in the compliance of agglomerations with the requirements settled in Article
4 and Article 5 of the UWWTD, in relation to the load subject to compliance, between
individual member states (Figure 2.1). The compliance rates of Austria, Germany and
Netherlands achieved 100% for both Articles, by contrast France and especially Portugal
had significantly lower compliance rates. It was also reported that, from the generated
load of all the 404 agglomerations of Portugal with more than 2000 p.e. (corresponding to
a generated load of 11 255 420 p.e.), around 95% were collected in collecting systems in
compliance with Article 4 of the UWWTD Directive. From those, only 41% fully complied
with the requirements of the Directive. Furthermore, from the 46 agglomerations subject to
compliance with Article 5, as few as 13% fully accomplished the requirements.
7
Figure 2.1 | Compliance with Articles 4 and 5 of the UWWT Directive (adapted from Commission of the European Communities, 2009)
The UWWTD was implemented as national law through Law nº 152/97 of 19 June, later
altered by Laws nº 348/98, 149/2004 and 198/2008. Law nº 348/98 of 9 November
corresponds to Directive 98/15/EC, which clarifies the rules relating to discharges from
urban WWTPs in sensitive areas subject to eutrophication and defines the concentrations
or the minimum percentage reduction for total phosphorus and total nitrogen. Table 2.1
presents the legal requirements for discharges of WWTPs in sensitive areas.
Table 2.1 | Requirements for discharges of WWTPs in sensitive areas (adopted from INAG, 2002)
Type of Treatment BOD5 with no Nitrification
COD TSS Pt Nt
Primary Concentration (mg/L) - - - - -
Reduction (%) 20 - 50 - -
Secondary Concentration (mg/L) 25 125 35 - -
Reduction (%) 70-90 75 90 - -
Terciary Concentration (mg/L) 25 125 35
2 (10000-100000 p.e.) 15 (10000-100000 p.e.)
1 (>100000 p.e.) 10 (>100000 p.e.)
Reduction (%) 70-90 75 90 80 70-80
Law nº 149/2004 of 22 June concerns not only the identification of sensitive areas
(superficial waters, estuaries and coastal lagoons) and less sensitive (coastal waters) but
its distribution as well. Law nº 198/2008 of 8 October changed the list of less sensitive
areas in the Portuguese mainland and defined the influence area of all sensitive areas.
One of the first European water protection laws, the Bathing Water Directive (BWD) –
Directive 76/160/EEC , came into force on the 8 December, 1975. It established minimum
quality criteria to be met by bathing waters in order to safeguard public health and protect
the aquatic environment in coastal and inland areas. Directive 2006/7/EC of 15 February
(transposed for the National Portuguese Law by Law nº 135/2009 on the 3 June) updated
67
13
50
34
88
94
98no data
41
100
95
100
64
88
100
67
100
0 20 40 60 80 100
Sweden
Slovakia
Portugal
Netherlands
Luxemburg
Germany
France
Finland
Denmark
Belgium
Austria
Degree of compliance with Article (% of the generated load - p.e.)
Article 4 (secondary treatment requirements)
Article 5 (more stringent treatment)62
8
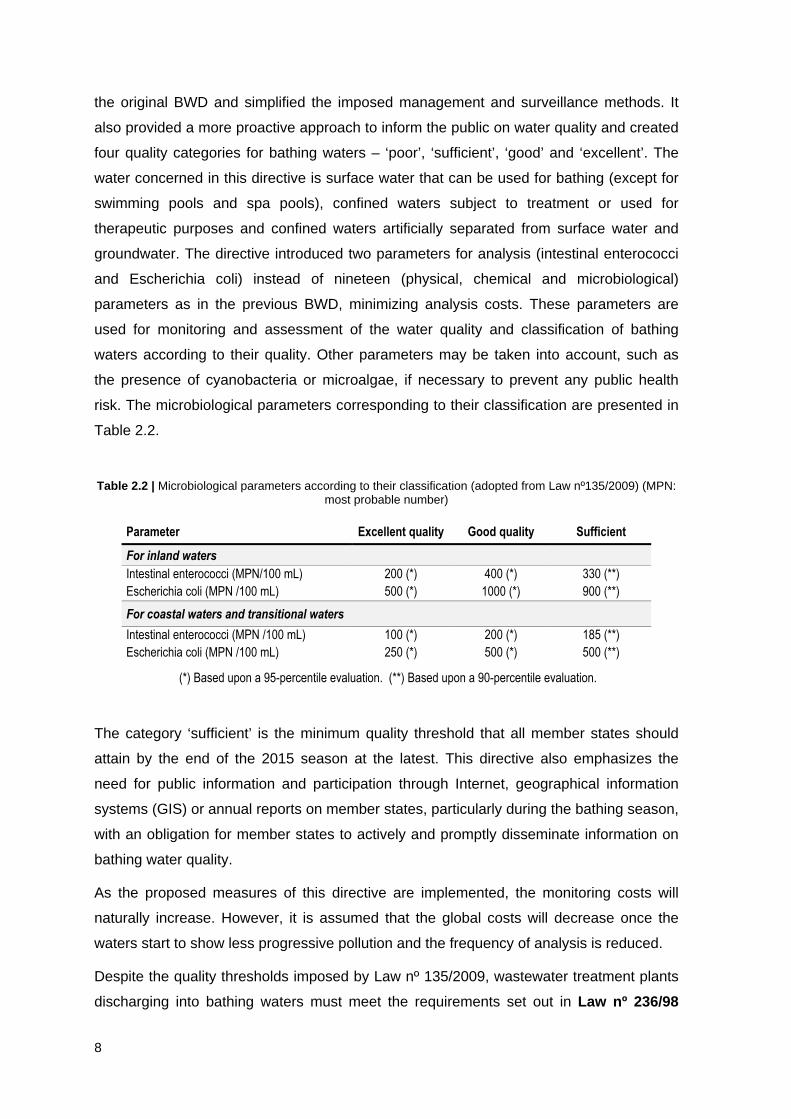
the original BWD and simplified the imposed management and surveillance methods. It
also provided a more proactive approach to inform the public on water quality and created
four quality categories for bathing waters – ‘poor’, ‘sufficient’, ‘good’ and ‘excellent’. The
water concerned in this directive is surface water that can be used for bathing (except for
swimming pools and spa pools), confined waters subject to treatment or used for
therapeutic purposes and confined waters artificially separated from surface water and
groundwater. The directive introduced two parameters for analysis (intestinal enterococci
and Escherichia coli) instead of nineteen (physical, chemical and microbiological)
parameters as in the previous BWD, minimizing analysis costs. These parameters are
used for monitoring and assessment of the water quality and classification of bathing
waters according to their quality. Other parameters may be taken into account, such as
the presence of cyanobacteria or microalgae, if necessary to prevent any public health
risk. The microbiological parameters corresponding to their classification are presented in
Table 2.2.
Table 2.2 | Microbiological parameters according to their classification (adopted from Law nº135/2009) (MPN: most probable number)
Parameter Excellent quality Good quality Sufficient
For inland waters
Intestinal enterococci (MPN/100 mL) 200 (*) 400 (*) 330 (**)
Escherichia coli (MPN /100 mL) 500 (*) 1000 (*) 900 (**)
For coastal waters and transitional waters
Intestinal enterococci (MPN /100 mL) 100 (*) 200 (*) 185 (**)
Escherichia coli (MPN /100 mL) 250 (*) 500 (*) 500 (**)
(*) Based upon a 95-percentile evaluation. (**) Based upon a 90-percentile evaluation.
The category ‘sufficient’ is the minimum quality threshold that all member states should
attain by the end of the 2015 season at the latest. This directive also emphasizes the
need for public information and participation through Internet, geographical information
systems (GIS) or annual reports on member states, particularly during the bathing season,
with an obligation for member states to actively and promptly disseminate information on
bathing water quality.
As the proposed measures of this directive are implemented, the monitoring costs will
naturally increase. However, it is assumed that the global costs will decrease once the
waters start to show less progressive pollution and the frequency of analysis is reduced.
Despite the quality thresholds imposed by Law nº 135/2009, wastewater treatment plants
discharging into bathing waters must meet the requirements set out in Law nº 236/98
9
concerning fecal coliforms. The concentration of fecal coliforms in the final effluent should
be in the range of 100-2000 MPN/100 mL.
Directive 91/676/CEE , the “Nitrates Directive” concerning the protection of waters against
pollution caused or induced by nitrates from agricultural sources, was transposed to the
Portuguese Law by Law nº 235/97 of 3 September and altered by Law nº 68/99 of 11
March. This directive introduced a set of measures in order to reduce and prevent water
pollution, including the requirements for identification of polluted areas and areas which
contribute to pollution, the establishment of codes of good agricultural practices and the
implementation of action programmes by member states. The vulnerable areas in
Portugal, which drain into waters that are polluted or contribute to pollution, were identified
in Portaria nº 1100/2004 of 3 September, Portaria nº 833/2005 of 16 September, Portaria
nº 1433/2006 of 27 December and Portaria nº 1366/2007 of 18 October.
2.2. SANITATION IN PORTUGAL
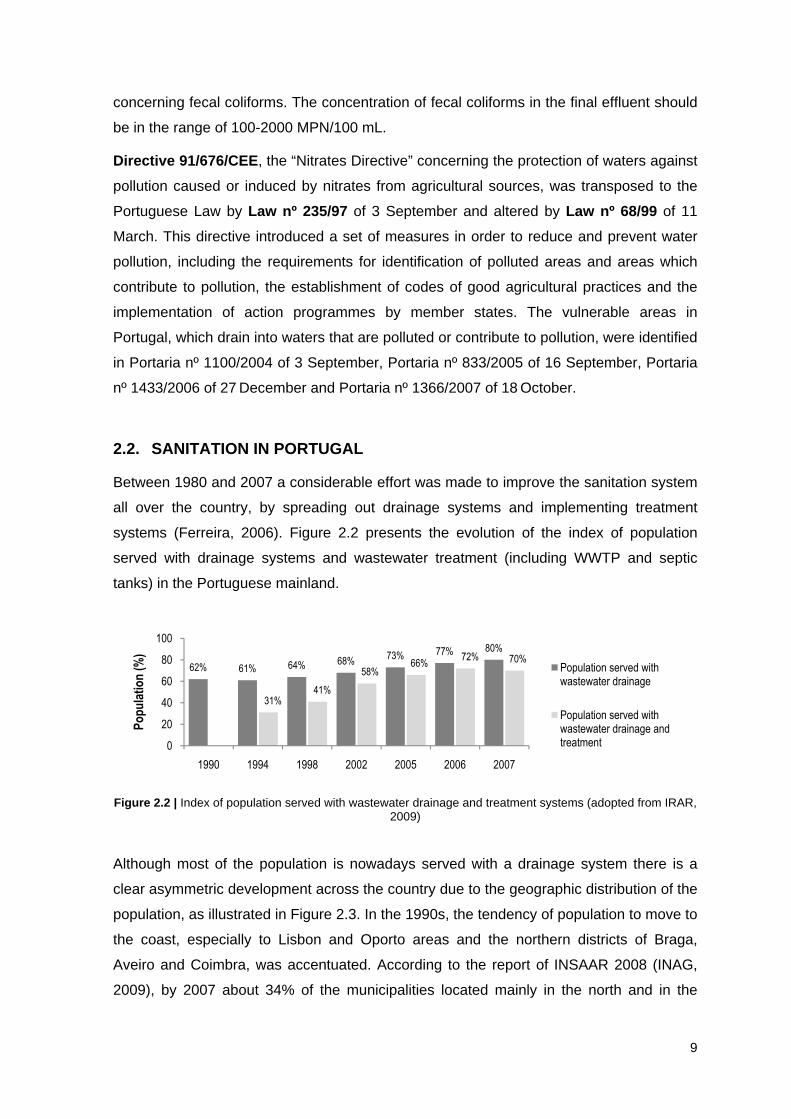
Between 1980 and 2007 a considerable effort was made to improve the sanitation system
all over the country, by spreading out drainage systems and implementing treatment
systems (Ferreira, 2006). Figure 2.2 presents the evolution of the index of population
served with drainage systems and wastewater treatment (including WWTP and septic
tanks) in the Portuguese mainland.
Figure 2.2 | Index of population served with wastewater drainage and treatment systems (adopted from IRAR, 2009)
Although most of the population is nowadays served with a drainage system there is a
clear asymmetric development across the country due to the geographic distribution of the
population, as illustrated in Figure 2.3. In the 1990s, the tendency of population to move to
the coast, especially to Lisbon and Oporto areas and the northern districts of Braga,
Aveiro and Coimbra, was accentuated. According to the report of INSAAR 2008 (INAG,
2009), by 2007 about 34% of the municipalities located mainly in the north and in the
62% 61% 64% 68%73% 77% 80%
31%41%
58%66%
72% 70%
0
20
40
60
80
100
1990 1994 1998 2002 2005 2006 2007
Po
pu
lati
on
(%
)
Population served with wastewater drainage
Population served with wastewater drainage and treatment
10
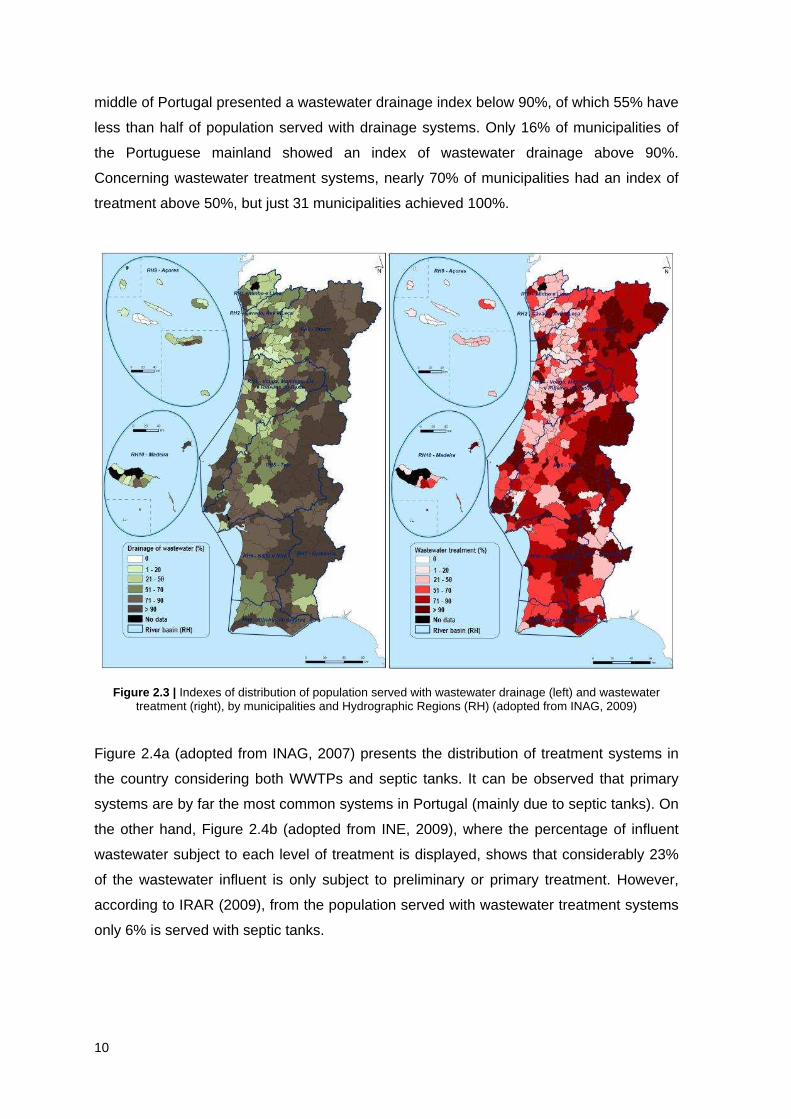
middle of Portugal presented a wastewater drainage index below 90%, of which 55% have
less than half of population served with drainage systems. Only 16% of municipalities of
the Portuguese mainland showed an index of wastewater drainage above 90%.
Concerning wastewater treatment systems, nearly 70% of municipalities had an index of
treatment above 50%, but just 31 municipalities achieved 100%.
Figure 2.3 | Indexes of distribution of population served with wastewater drainage (left) and wastewater treatment (right), by municipalities and Hydrographic Regions (RH) (adopted from INAG, 2009)
Figure 2.4a (adopted from INAG, 2007) presents the distribution of treatment systems in
the country considering both WWTPs and septic tanks. It can be observed that primary
systems are by far the most common systems in Portugal (mainly due to septic tanks). On
the other hand, Figure 2.4b (adopted from INE, 2009), where the percentage of influent
wastewater subject to each level of treatment is displayed, shows that considerably 23%
of the wastewater influent is only subject to preliminary or primary treatment. However,
according to IRAR (2009), from the population served with wastewater treatment systems
only 6% is served with septic tanks.
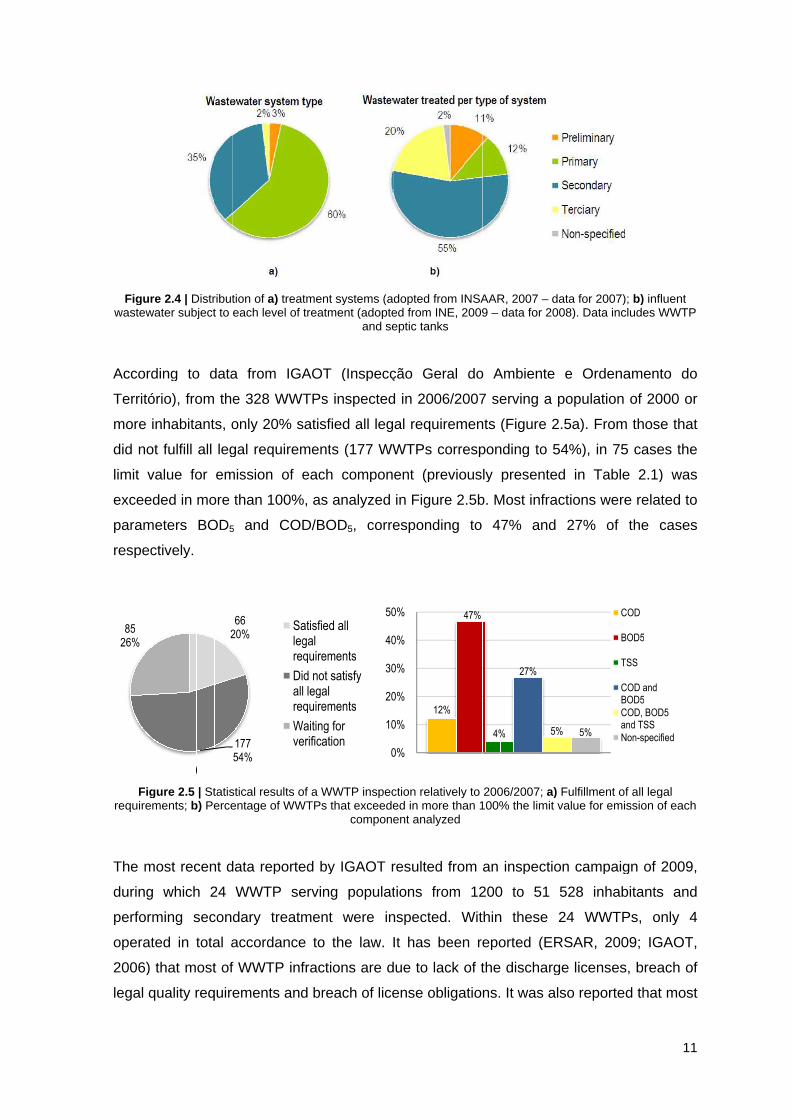
Figure wastewater subject to each level of treatment (
According to data from IGAOT (
Território
more inhabitants
did not fulfill
limit value for emission of each component
exceeded in more than 100%, as analyzed in
parameters BOD
respectively.
requirements;
The most recent data report
during which
performing secondary treatment were inspected. Within these 24 WWTP
operated in
2006
legal quality requirements and
8526%
Figure wastewater subject to each level of treatment (
According to data from IGAOT (
erritório
more inhabitants
did not fulfill
limit value for emission of each component
exceeded in more than 100%, as analyzed in
parameters BOD
respectively.
Figure requirements;
The most recent data report
during which
performing secondary treatment were inspected. Within these 24 WWTP
operated in
2006) that
legal quality requirements and
Figure 2.4wastewater subject to each level of treatment (
According to data from IGAOT (
erritório), from the 328 WWTP
more inhabitants
did not fulfill
limit value for emission of each component
exceeded in more than 100%, as analyzed in
parameters BOD
respectively.
Figure 2requirements;
The most recent data report
during which
performing secondary treatment were inspected. Within these 24 WWTP
operated in
) that
legal quality requirements and
4 | Distribution of wastewater subject to each level of treatment (
According to data from IGAOT (
), from the 328 WWTP
more inhabitants
did not fulfill
limit value for emission of each component
exceeded in more than 100%, as analyzed in
parameters BOD
respectively.
2.5 requirements; b)
The most recent data report
during which
performing secondary treatment were inspected. Within these 24 WWTP
operated in total
) that most of WWTP
legal quality requirements and
a)
Distribution of wastewater subject to each level of treatment (
According to data from IGAOT (
), from the 328 WWTP
more inhabitants
all legal requirement
limit value for emission of each component
exceeded in more than 100%, as analyzed in
parameters BOD
| Statistical results of b) Percentage of WWTP
The most recent data report
during which 24 WWTP serving populat
performing secondary treatment were inspected. Within these 24 WWTP
total
most of WWTP
legal quality requirements and
a)
Distribution of wastewater subject to each level of treatment (
According to data from IGAOT (
), from the 328 WWTP
more inhabitants, only 20% satisfied all legal requirements (
all legal requirement
limit value for emission of each component
exceeded in more than 100%, as analyzed in
parameters BOD5
Statistical results of Percentage of WWTP
The most recent data report
24 WWTP serving populat
performing secondary treatment were inspected. Within these 24 WWTP
total accordance to the law
most of WWTP
legal quality requirements and
20%
Distribution of wastewater subject to each level of treatment (
According to data from IGAOT (
), from the 328 WWTP
only 20% satisfied all legal requirements (
all legal requirement
limit value for emission of each component
exceeded in more than 100%, as analyzed in
5 and
Statistical results of Percentage of WWTP
The most recent data report
24 WWTP serving populat
performing secondary treatment were inspected. Within these 24 WWTP
accordance to the law
most of WWTP
legal quality requirements and
6620%
17754%
Distribution of a)wastewater subject to each level of treatment (
According to data from IGAOT (
), from the 328 WWTP
only 20% satisfied all legal requirements (
all legal requirement
limit value for emission of each component
exceeded in more than 100%, as analyzed in
and
Statistical results of Percentage of WWTP
The most recent data report
24 WWTP serving populat
performing secondary treatment were inspected. Within these 24 WWTP
accordance to the law
most of WWTP
legal quality requirements and
17754%
a) treatment systems (wastewater subject to each level of treatment (
According to data from IGAOT (
), from the 328 WWTP
only 20% satisfied all legal requirements (
all legal requirement
limit value for emission of each component
exceeded in more than 100%, as analyzed in
and C
Statistical results of Percentage of WWTP
The most recent data report
24 WWTP serving populat
performing secondary treatment were inspected. Within these 24 WWTP
accordance to the law
most of WWTP
legal quality requirements and
treatment systems (wastewater subject to each level of treatment (
According to data from IGAOT (
), from the 328 WWTP
only 20% satisfied all legal requirements (
all legal requirement
limit value for emission of each component
exceeded in more than 100%, as analyzed in
COD/
Statistical results of Percentage of WWTP
The most recent data reported by IGAOT resulted from
24 WWTP serving populat
performing secondary treatment were inspected. Within these 24 WWTP
accordance to the law
infractions are due to lack of
legal quality requirements and
Satisfied all legal requirements
Did not satisfy all legal requirements
Waiting for verification
treatment systems (wastewater subject to each level of treatment (
According to data from IGAOT (
), from the 328 WWTPs
only 20% satisfied all legal requirements (
all legal requirement
limit value for emission of each component
exceeded in more than 100%, as analyzed in
OD/B
Statistical results of a WWTP inspPercentage of WWTPs
ed by IGAOT resulted from
24 WWTP serving populat
performing secondary treatment were inspected. Within these 24 WWTP
accordance to the law
infractions are due to lack of
legal quality requirements and breach
Satisfied all legal requirements
Did not satisfy all legal requirements
Waiting for verification
treatment systems (wastewater subject to each level of treatment (
According to data from IGAOT (
s inspected in 2006/2007
only 20% satisfied all legal requirements (
all legal requirements (177 WWTP
limit value for emission of each component
exceeded in more than 100%, as analyzed in
BOD
WWTP insps that exceeded in more than 100% the limit value for emission of each
ed by IGAOT resulted from
24 WWTP serving populat
performing secondary treatment were inspected. Within these 24 WWTP
accordance to the law
infractions are due to lack of
breach
Satisfied all
requirements
Did not satisfy all legal requirements
Waiting for verification
treatment systems (wastewater subject to each level of treatment (
According to data from IGAOT (Inspecção Geral do Ambiente e Ordenamento do
inspected in 2006/2007
only 20% satisfied all legal requirements (
s (177 WWTP
limit value for emission of each component
exceeded in more than 100%, as analyzed in
OD5,
WWTP inspthat exceeded in more than 100% the limit value for emission of each
component analyzed
ed by IGAOT resulted from
24 WWTP serving populat
performing secondary treatment were inspected. Within these 24 WWTP
accordance to the law
infractions are due to lack of
breach
Satisfied all
requirements
Did not satisfy
requirements
Waiting for verification
treatment systems (wastewater subject to each level of treatment (adopted from
and septic tanks
Inspecção Geral do Ambiente e Ordenamento do
inspected in 2006/2007
only 20% satisfied all legal requirements (
s (177 WWTP
limit value for emission of each component
exceeded in more than 100%, as analyzed in
correspond
WWTP inspthat exceeded in more than 100% the limit value for emission of each
component analyzed
ed by IGAOT resulted from
24 WWTP serving populat
performing secondary treatment were inspected. Within these 24 WWTP
accordance to the law
infractions are due to lack of
breach of license obligations. It was also reported that most
Did not satisfy
treatment systems (adopted from INSAAR, 2007 adopted fromand septic tanks
Inspecção Geral do Ambiente e Ordenamento do
inspected in 2006/2007
only 20% satisfied all legal requirements (
s (177 WWTP
limit value for emission of each component
exceeded in more than 100%, as analyzed in
correspond
WWTP inspection relatively to 2006/2007that exceeded in more than 100% the limit value for emission of each
component analyzed
ed by IGAOT resulted from
24 WWTP serving populat
performing secondary treatment were inspected. Within these 24 WWTP
accordance to the law. It has been reported (
infractions are due to lack of
of license obligations. It was also reported that most
0%
10%
20%
30%
40%
50%
adopted from INSAAR, 2007 adopted fromand septic tanks
Inspecção Geral do Ambiente e Ordenamento do
inspected in 2006/2007
only 20% satisfied all legal requirements (
s (177 WWTP
limit value for emission of each component
exceeded in more than 100%, as analyzed in Figure
correspond
ection relatively to 2006/2007that exceeded in more than 100% the limit value for emission of each
component analyzed
ed by IGAOT resulted from
24 WWTP serving populations from 1200 to 51 528 inhabitants and
performing secondary treatment were inspected. Within these 24 WWTP
It has been reported (
infractions are due to lack of
of license obligations. It was also reported that most
0%
10%
20%
30%
40%
50%
adopted from INSAAR, 2007 adopted fromand septic tanks
Inspecção Geral do Ambiente e Ordenamento do
inspected in 2006/2007
only 20% satisfied all legal requirements (
s (177 WWTPs
limit value for emission of each component (previously
Figure
correspond
ection relatively to 2006/2007that exceeded in more than 100% the limit value for emission of each
component analyzed
ed by IGAOT resulted from
ions from 1200 to 51 528 inhabitants and
performing secondary treatment were inspected. Within these 24 WWTP
It has been reported (
infractions are due to lack of
of license obligations. It was also reported that most
adopted from INSAAR, 2007 adopted from INE, 2009 and septic tanks
Inspecção Geral do Ambiente e Ordenamento do
inspected in 2006/2007
only 20% satisfied all legal requirements (
s corresponding to 54%), in 75 cases the
previously
Figure
corresponding to 47% and 27% of the cases
ection relatively to 2006/2007that exceeded in more than 100% the limit value for emission of each
component analyzed
ed by IGAOT resulted from
ions from 1200 to 51 528 inhabitants and
performing secondary treatment were inspected. Within these 24 WWTP
It has been reported (
infractions are due to lack of
of license obligations. It was also reported that most
12%
adopted from INSAAR, 2007 INE, 2009
and septic tanks
Inspecção Geral do Ambiente e Ordenamento do
inspected in 2006/2007
only 20% satisfied all legal requirements (
corresponding to 54%), in 75 cases the
previously
Figure 2.
ing to 47% and 27% of the cases
ection relatively to 2006/2007that exceeded in more than 100% the limit value for emission of each
component analyzed
ed by IGAOT resulted from
ions from 1200 to 51 528 inhabitants and
performing secondary treatment were inspected. Within these 24 WWTP
It has been reported (
infractions are due to lack of
of license obligations. It was also reported that most
12%
47%
adopted from INSAAR, 2007 INE, 2009
Inspecção Geral do Ambiente e Ordenamento do
inspected in 2006/2007
only 20% satisfied all legal requirements (
corresponding to 54%), in 75 cases the
previously
.5b.
ing to 47% and 27% of the cases
ection relatively to 2006/2007that exceeded in more than 100% the limit value for emission of each
ed by IGAOT resulted from an inspection campaign
ions from 1200 to 51 528 inhabitants and
performing secondary treatment were inspected. Within these 24 WWTP
It has been reported (
infractions are due to lack of the
of license obligations. It was also reported that most
47%
adopted from INSAAR, 2007 INE, 2009 –
Inspecção Geral do Ambiente e Ordenamento do
inspected in 2006/2007 serving
only 20% satisfied all legal requirements (
corresponding to 54%), in 75 cases the
previously
b. Most infracti
ing to 47% and 27% of the cases
ection relatively to 2006/2007that exceeded in more than 100% the limit value for emission of each
an inspection campaign
ions from 1200 to 51 528 inhabitants and
performing secondary treatment were inspected. Within these 24 WWTP
It has been reported (
the
of license obligations. It was also reported that most
4%
adopted from INSAAR, 2007 data for 2008). Data includes WWTP
Inspecção Geral do Ambiente e Ordenamento do
serving
only 20% satisfied all legal requirements (Figure
corresponding to 54%), in 75 cases the
previously presented in
Most infracti
ing to 47% and 27% of the cases
ection relatively to 2006/2007that exceeded in more than 100% the limit value for emission of each
an inspection campaign
ions from 1200 to 51 528 inhabitants and
performing secondary treatment were inspected. Within these 24 WWTP
It has been reported (
the discharge license
of license obligations. It was also reported that most
4%
b)
adopted from INSAAR, 2007 data for 2008). Data includes WWTP
Inspecção Geral do Ambiente e Ordenamento do
serving
Figure
corresponding to 54%), in 75 cases the
presented in
Most infracti
ing to 47% and 27% of the cases
ection relatively to 2006/2007that exceeded in more than 100% the limit value for emission of each
an inspection campaign
ions from 1200 to 51 528 inhabitants and
performing secondary treatment were inspected. Within these 24 WWTP
It has been reported (
discharge license
of license obligations. It was also reported that most
27%
b)
adopted from INSAAR, 2007 – data for 2007); data for 2008). Data includes WWTP
Inspecção Geral do Ambiente e Ordenamento do
serving a population of 2000 or
Figure 2
corresponding to 54%), in 75 cases the
presented in
Most infracti
ing to 47% and 27% of the cases
ection relatively to 2006/2007; a)that exceeded in more than 100% the limit value for emission of each
an inspection campaign
ions from 1200 to 51 528 inhabitants and
performing secondary treatment were inspected. Within these 24 WWTP
It has been reported (ERSAR, 2009;
discharge license
of license obligations. It was also reported that most
27%
5%
data for 2007); data for 2008). Data includes WWTP
Inspecção Geral do Ambiente e Ordenamento do
a population of 2000 or
2.5a
corresponding to 54%), in 75 cases the
presented in
Most infracti
ing to 47% and 27% of the cases
a) Fulfillment of that exceeded in more than 100% the limit value for emission of each
an inspection campaign
ions from 1200 to 51 528 inhabitants and
performing secondary treatment were inspected. Within these 24 WWTP
ERSAR, 2009;
discharge license
of license obligations. It was also reported that most
5%
data for 2007); data for 2008). Data includes WWTP
Inspecção Geral do Ambiente e Ordenamento do
a population of 2000 or
a). F
corresponding to 54%), in 75 cases the
presented in
Most infractions were related to
ing to 47% and 27% of the cases
Fulfillment of that exceeded in more than 100% the limit value for emission of each
an inspection campaign
ions from 1200 to 51 528 inhabitants and
performing secondary treatment were inspected. Within these 24 WWTP
ERSAR, 2009;
discharge license
of license obligations. It was also reported that most
5%
data for 2007); data for 2008). Data includes WWTP
Inspecção Geral do Ambiente e Ordenamento do
a population of 2000 or
). From those that
corresponding to 54%), in 75 cases the
Table
ons were related to
ing to 47% and 27% of the cases
Fulfillment of that exceeded in more than 100% the limit value for emission of each
an inspection campaign
ions from 1200 to 51 528 inhabitants and
performing secondary treatment were inspected. Within these 24 WWTP
ERSAR, 2009;
discharge license
of license obligations. It was also reported that most
5%
data for 2007); data for 2008). Data includes WWTP
Inspecção Geral do Ambiente e Ordenamento do
a population of 2000 or
rom those that
corresponding to 54%), in 75 cases the
Table
ons were related to
ing to 47% and 27% of the cases
Fulfillment of that exceeded in more than 100% the limit value for emission of each
an inspection campaign
ions from 1200 to 51 528 inhabitants and
performing secondary treatment were inspected. Within these 24 WWTP
ERSAR, 2009;
discharge licenses
of license obligations. It was also reported that most
COD
BOD5
TSS
COD and BOD5
COD, BOD5 and TSS
Non
data for 2007); b)data for 2008). Data includes WWTP
Inspecção Geral do Ambiente e Ordenamento do
a population of 2000 or
rom those that
corresponding to 54%), in 75 cases the
Table 2
ons were related to
ing to 47% and 27% of the cases
Fulfillment of all legal that exceeded in more than 100% the limit value for emission of each
an inspection campaign
ions from 1200 to 51 528 inhabitants and
performing secondary treatment were inspected. Within these 24 WWTPs,
ERSAR, 2009;
s, breach of
of license obligations. It was also reported that most
COD
BOD5
TSS
COD and BOD5
COD, BOD5 and TSS
Non-specified
b) influent data for 2008). Data includes WWTP
Inspecção Geral do Ambiente e Ordenamento do
a population of 2000 or
rom those that
corresponding to 54%), in 75 cases the
2.1)
ons were related to
ing to 47% and 27% of the cases
all legal that exceeded in more than 100% the limit value for emission of each
of 2009,
ions from 1200 to 51 528 inhabitants and
only 4
ERSAR, 2009; IGAOT
, breach of
of license obligations. It was also reported that most
BOD5
COD and BOD5
COD, BOD5 and TSS
specified
influent data for 2008). Data includes WWTP
Inspecção Geral do Ambiente e Ordenamento do
a population of 2000 or
rom those that
corresponding to 54%), in 75 cases the
) was
ons were related to
ing to 47% and 27% of the cases
all legal that exceeded in more than 100% the limit value for emission of each
2009,
ions from 1200 to 51 528 inhabitants and
only 4
IGAOT
, breach of
of license obligations. It was also reported that most
COD, BOD5
specified
11
influent data for 2008). Data includes WWTP
Inspecção Geral do Ambiente e Ordenamento do
a population of 2000 or
rom those that
corresponding to 54%), in 75 cases the
was
ons were related to
ing to 47% and 27% of the cases
that exceeded in more than 100% the limit value for emission of each
2009,
ions from 1200 to 51 528 inhabitants and
only 4
IGAOT,
, breach of
of license obligations. It was also reported that most
11
data for 2008). Data includes WWTP
Inspecção Geral do Ambiente e Ordenamento do
a population of 2000 or
rom those that
corresponding to 54%), in 75 cases the
was
ons were related to
ing to 47% and 27% of the cases
that exceeded in more than 100% the limit value for emission of each
2009,
ions from 1200 to 51 528 inhabitants and
only 4
,
, breach of
of license obligations. It was also reported that most
12
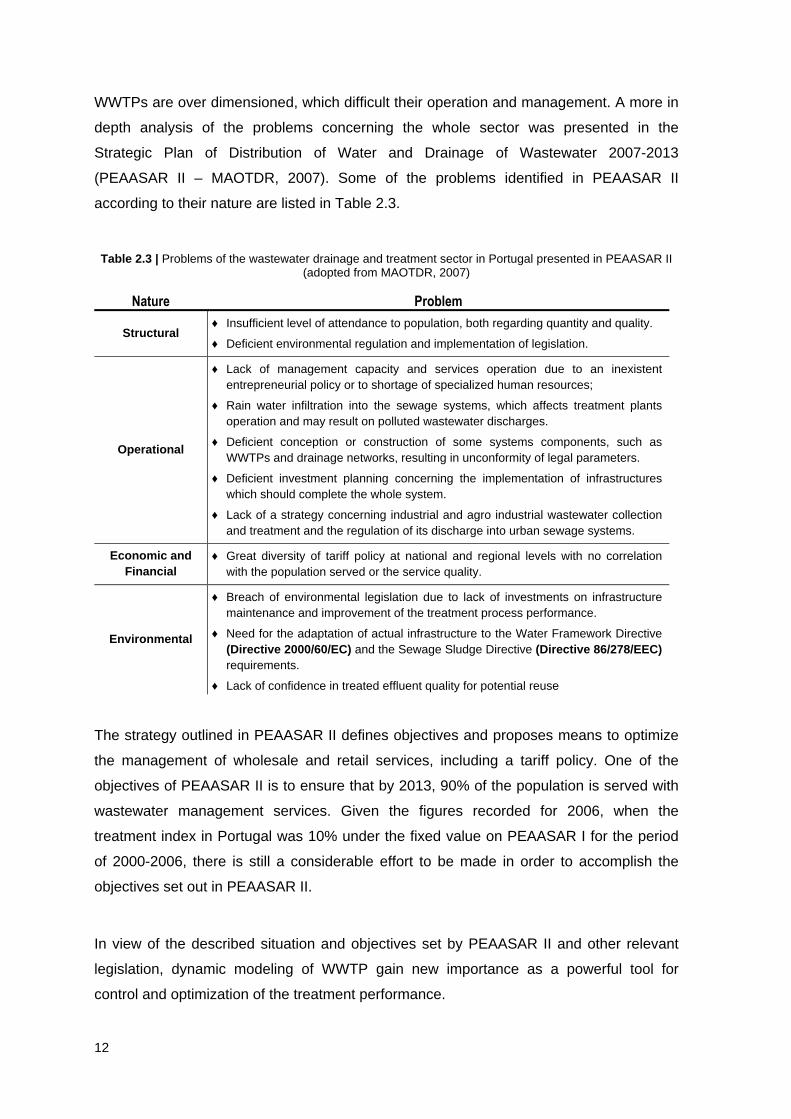
WWTPs are over dimensioned, which difficult their operation and management. A more in
depth analysis of the problems concerning the whole sector was presented in the
Strategic Plan of Distribution of Water and Drainage of Wastewater 2007-2013
(PEAASAR II – MAOTDR, 2007). Some of the problems identified in PEAASAR II
according to their nature are listed in Table 2.3.
Table 2.3 | Problems of the wastewater drainage and treatment sector in Portugal presented in PEAASAR II (adopted from MAOTDR, 2007)
Nature Problem
Structural ♦ Insufficient level of attendance to population, both regarding quantity and quality.
♦ Deficient environmental regulation and implementation of legislation.
Operational
♦ Lack of management capacity and services operation due to an inexistent entrepreneurial policy or to shortage of specialized human resources;
♦ Rain water infiltration into the sewage systems, which affects treatment plants operation and may result on polluted wastewater discharges.
♦ Deficient conception or construction of some systems components, such as WWTPs and drainage networks, resulting in unconformity of legal parameters.
♦ Deficient investment planning concerning the implementation of infrastructures which should complete the whole system.
♦ Lack of a strategy concerning industrial and agro industrial wastewater collection and treatment and the regulation of its discharge into urban sewage systems.
Economic and Financial
♦ Great diversity of tariff policy at national and regional levels with no correlation with the population served or the service quality.
Environmental
♦ Breach of environmental legislation due to lack of investments on infrastructure maintenance and improvement of the treatment process performance.
♦ Need for the adaptation of actual infrastructure to the Water Framework Directive (Directive 2000/60/EC) and the Sewage Sludge Directive (Directive 86/278/EEC) requirements.
♦ Lack of confidence in treated effluent quality for potential reuse
The strategy outlined in PEAASAR II defines objectives and proposes means to optimize
the management of wholesale and retail services, including a tariff policy. One of the
objectives of PEAASAR II is to ensure that by 2013, 90% of the population is served with
wastewater management services. Given the figures recorded for 2006, when the
treatment index in Portugal was 10% under the fixed value on PEAASAR I for the period
of 2000-2006, there is still a considerable effort to be made in order to accomplish the
objectives set out in PEAASAR II.
In view of the described situation and objectives set by PEAASAR II and other relevant
legislation, dynamic modeling of WWTP gain new importance as a powerful tool for
control and optimization of the treatment performance.
13
3. BIOLOGICAL TREATMENT
3.1. COMPOSITION OF URBAN WASTEWATER
The characteristics of wastewaters influent to WWTPs vary due to a combination of
several factors such as (Almeida, 2000):
♦ wastewater characteristics influent to the sewer system (surface runoff, household
effluents or foul wastewater, presence of commercial/industrial wastewater, infiltration,
social characteristics of the connected population);
♦ drainage system type and features (separate and/or combined, extension, slope, etc.);
♦ physical, chemical and biochemical processes occurring within the sewer (that depend
on temperature, transport time, oxygen supply, among others) and
♦ dry/wet weather flow fluctuations (time of day, day of the week and month).
The most important components found in wastewaters are solids, biodegradable organics
(proteins, carbohydrates and fats), nutrients (nitrogen and phosphorus), dissolved
inorganics (such as calcium and sulfate), pathogens, heavy metals and other toxic
pollutants (from industrial activities). The most relevant parameters used to characterize
wastewaters are presented below.
3.1.1 Chemical and physical properties
Redox potencial
The redox potential is a measure that can be used to indicate which oxidation-reduction
reactions can occur (Almeida, 2000) and thus is very useful to identify the environmental
conditions in the water.
Temperature
Temperature is a very important parameter since it influences dissolved oxygen
concentration, chemical and biological processes and their respective rates.
Total suspended solids (TSS)
TSS comprise volatile suspended solids (VSS) (organic matter) and cellular residues from
endogenous respiration (inorganic matter) and are usually used in the control of WWTPs
operation. The VSS give an estimation of the amount of organic matter present in the
wastewater.
14
3.1.2 Organic components
Biochemical Oxygen Demand (BOD)
The BOD measures the amount of oxygen consumed for the biochemical degradation of
organic matter (carbonaceous demand) and for the oxidation of inorganic material such as
sulphides and ferrous iron, during a specified incubation period (usually 5 days at 20ºC)
(Almeida, 2000). It also measures the oxygen used to oxidize reduced forms of nitrogen
(nitrogenous demand) unless an inhibitor is used (Almeida, 2000). After a 5-day period of
measurement, only 60-70% of the total carbonaceous BOD is measured. Therefore, in
order to estimate up to 95-99% of the oxidized carbonaceous organic matter, this period is
extended to 20 days and the ultimate BOD (BODu) is measured. For ordinary wastewater
the ratio BOD5/BODu is 0.5 to 0.7 (Metcalf & Eddy, 1991).
Chemical Oxygen Demand (COD)
The COD test measures the oxygen equivalent of the organic matter that can be oxidized
by using a strong chemical oxidizing agent (commonly potassium dichromate) in an acid
solution. It is based upon the fact that that all organic compounds, with a few exceptions,
and some inorganic substances (Cl-, NO2-, S2
-, S2O32-, Fe2+, SO3
2-) are oxidized. This
measurement is a good estimation of the total content of organic matter as the mentioned
organic compounds are not present in significant concentrations (Henze et al., 1995) and
considering that the oxidation of most organic compounds is 95-100% of the theoretical
value (ThOD).
The biodegradability of the wastewater is given by the relation BOD5/COD: values
between 0.2 and 0.6 indicate wastewaters biodegradable by selected and adapted
organisms, values lower and higher than this range indicate hard and easy biodegradable
wastewaters, respectively.
Oxygen Uptake Rate (OUR)
The OUR is the rate at which microorganisms use oxygen as they consume food. It can
be used as a measure of the biological activity; high OURs indicate high biological activity.
It can be measured using respirometry, as described in Chapter 4.
3.1.3 Inorganic non-metallic constituents
Dissolved oxygen (DO)
The concentration of DO is an indicator for water pollution control. The DO levels depend
on physical, chemical and biochemical conditions in the waters. In equilibrium with air, the
15
solubility of DO in water is referred to as its saturation value; it decreases with the
increase of both temperature and salinity and with the decrease of pressure (Almeida,
2000).
pH
Measurement of the pH value is very important since most biological processes take place
in the pH range of 6.5-8.5 (Ferreira, 2006).
Alkalinity
The alkalinity of the wastewater results in the presence of OH-, CO32- and HCO3
2- ions. In
activated sludge treatment plants, there are many biochemical processes that change the
alkalinity of wastewaters, which influences the pH value and consequently environmental
conditions for biological activity.
Nitrogen
In wastewater, nitrogen is generally in the forms of nitrate (NO3-), nitrite (NO2
-), ammonia
(NH3), ammonium ion (NH4+) and organic nitrogen. All of these forms of nitrogen, as well
as nitrogen gas (N2), are biochemically interconvertible and are components of the
nitrogen cycle. Analytically, organic nitrogen and ammonia can be determined through the
Kjeldahl nitrogen method, which measures the total unoxidised nitrogen (Almeida, 2000).
Exactly as for COD components, nitrogen components can be divided into a number of
fractions further presented in Chapter 5.2.1.1.
Phosphorous
The presence of phosphorous in water and wastewater is almost always in the form of
organic phosphorous and polyphosphate (PO43-), which is used for cell synthesis and
energy transport. It occurs in solution in particle or detritus or in the bodies of aquatic
organisms. Detergents from domestic wastewater and fertilizers dragged by storm water
runoff are the main sources of this contaminant.
Table 3.1 presents typical values of the parameters that characterizes raw domestic
wastewater in European countries and vary from very weak to strong wastewaters.
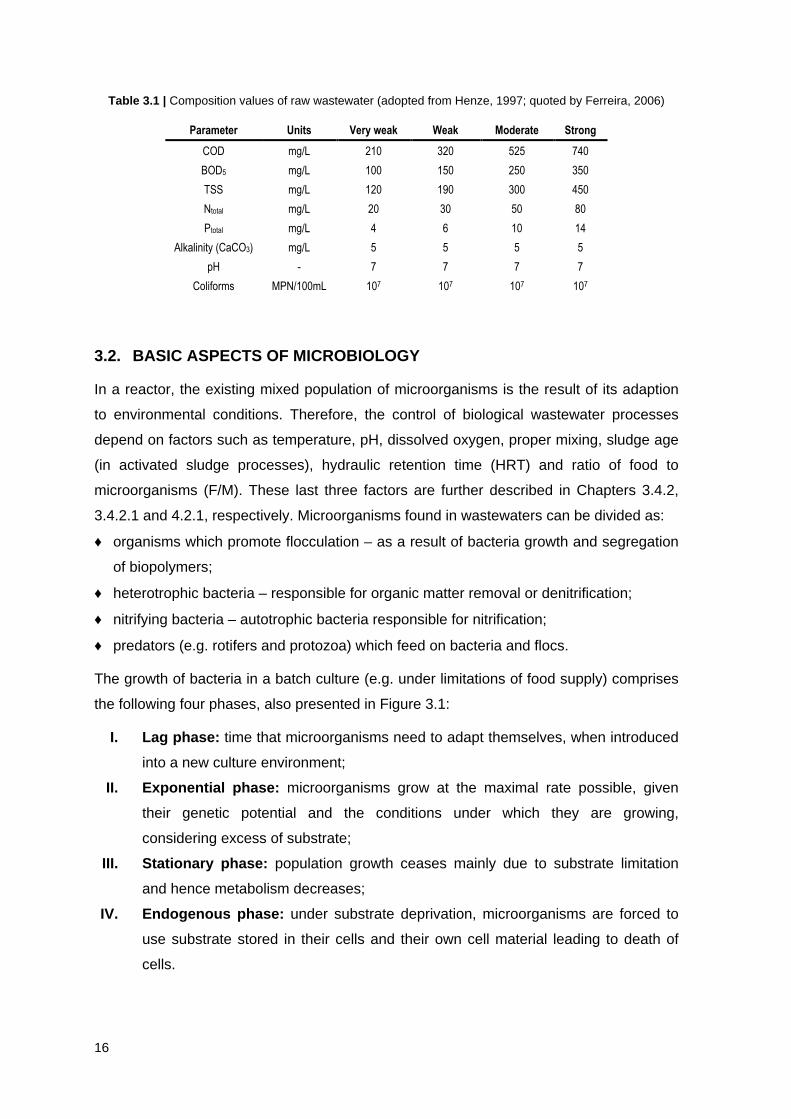
16
Table 3.1 | Composition values of raw wastewater (adopted from Henze, 1997; quoted by Ferreira, 2006)
Parameter Units Very weak Weak Moderate Strong
COD mg/L 210 320 525 740
BOD5 mg/L 100 150 250 350
TSS mg/L 120 190 300 450
Ntotal mg/L 20 30 50 80
Ptotal mg/L 4 6 10 14
Alkalinity (CaCO3) mg/L 5 5 5 5
pH - 7 7 7 7
Coliforms MPN/100mL 107 107 107 107
3.2. BASIC ASPECTS OF MICROBIOLOGY
In a reactor, the existing mixed population of microorganisms is the result of its adaption
to environmental conditions. Therefore, the control of biological wastewater processes
depend on factors such as temperature, pH, dissolved oxygen, proper mixing, sludge age
(in activated sludge processes), hydraulic retention time (HRT) and ratio of food to
microorganisms (F/M). These last three factors are further described in Chapters 3.4.2,
3.4.2.1 and 4.2.1, respectively. Microorganisms found in wastewaters can be divided as:
♦ organisms which promote flocculation – as a result of bacteria growth and segregation
of biopolymers;
♦ heterotrophic bacteria – responsible for organic matter removal or denitrification;
♦ nitrifying bacteria – autotrophic bacteria responsible for nitrification;
♦ predators (e.g. rotifers and protozoa) which feed on bacteria and flocs.
The growth of bacteria in a batch culture (e.g. under limitations of food supply) comprises
the following four phases, also presented in Figure 3.1:
I. Lag phase: time that microorganisms need to adapt themselves, when introduced
into a new culture environment;
II. Exponential phase: microorganisms grow at the maximal rate possible, given
their genetic potential and the conditions under which they are growing,
considering excess of substrate;
III. Stationary phase: population growth ceases mainly due to substrate limitation
and hence metabolism decreases;
IV. Endogenous phase: under substrate deprivation, microorganisms are forced to
use substrate stored in their cells and their own cell material leading to death of
cells.
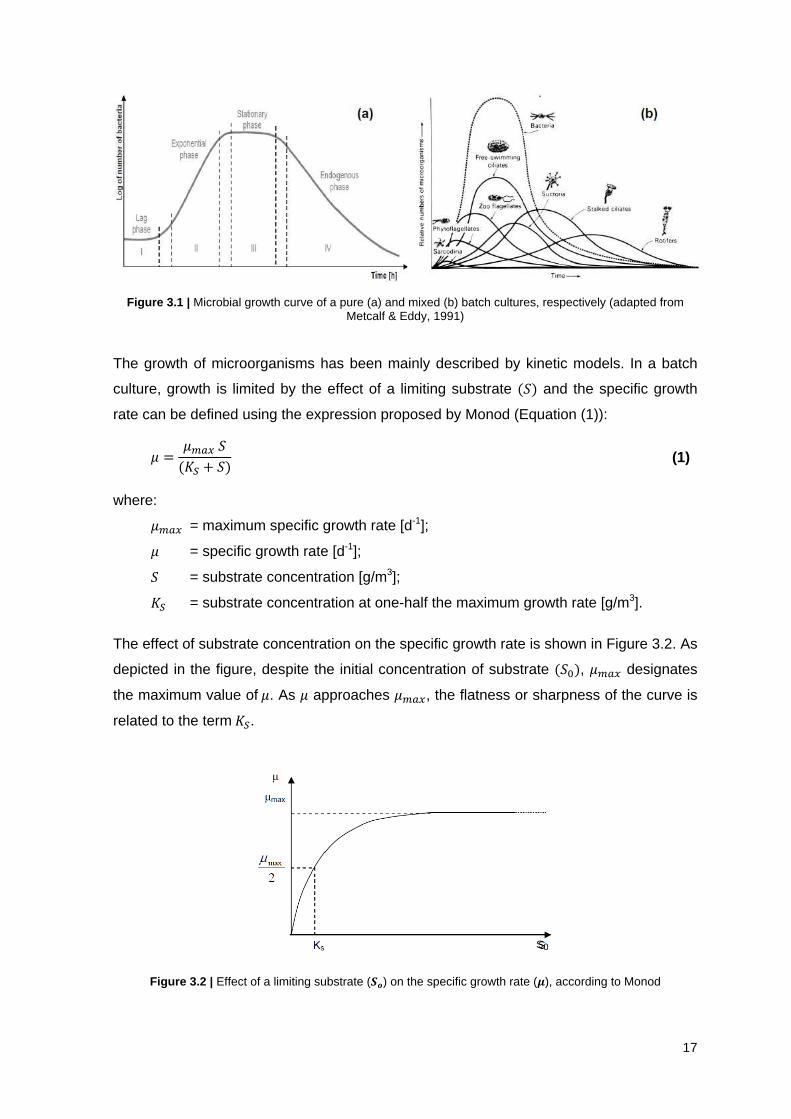
17
Figure 3.1 | Microbial growth curve of a pure (a) and mixed (b) batch cultures, respectively (adapted from Metcalf & Eddy, 1991)
The growth of microorganisms has been mainly described by kinetic models. In a batch
culture, growth is limited by the effect of a limiting substrate (�) and the specific growth
rate can be defined using the expression proposed by Monod (Equation (1)):
� = ���� �( + �) (1)
where: ���� = maximum specific growth rate [d-1]; � = specific growth rate [d-1]; � = substrate concentration [g/m3]; = substrate concentration at one-half the maximum growth rate [g/m3].
The effect of substrate concentration on the specific growth rate is shown in Figure 3.2. As
depicted in the figure, despite the initial concentration of substrate (�\), ���� designates
the maximum value of �. As � approaches ����, the flatness or sharpness of the curve is
related to the term .
Figure 3.2 | Effect of a limiting substrate ( �) on the specific growth rate (�), according to Monod
S0
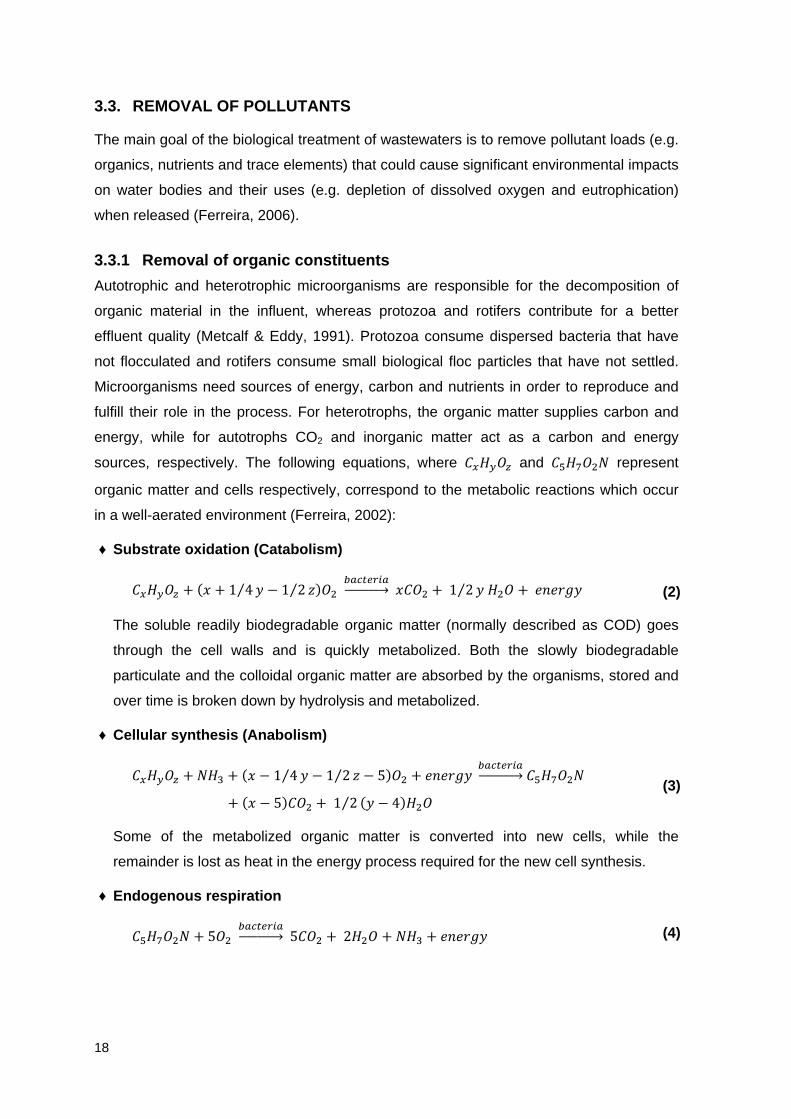
18
3.3. REMOVAL OF POLLUTANTS
The main goal of the biological treatment of wastewaters is to remove pollutant loads (e.g.
organics, nutrients and trace elements) that could cause significant environmental impacts
on water bodies and their uses (e.g. depletion of dissolved oxygen and eutrophication)
when released (Ferreira, 2006).
3.3.1 Removal of organic constituents
Autotrophic and heterotrophic microorganisms are responsible for the decomposition of
organic material in the influent, whereas protozoa and rotifers contribute for a better
effluent quality (Metcalf & Eddy, 1991). Protozoa consume dispersed bacteria that have
not flocculated and rotifers consume small biological floc particles that have not settled.
Microorganisms need sources of energy, carbon and nutrients in order to reproduce and
fulfill their role in the process. For heterotrophs, the organic matter supplies carbon and
energy, while for autotrophs CO2 and inorganic matter act as a carbon and energy
sources, respectively. The following equations, where .��]#^ and ._�`#ab represent
organic matter and cells respectively, correspond to the metabolic reactions which occur
in a well-aerated environment (Ferreira, 2002):
♦ Substrate oxidation (Catabolism)
.��]#^ + (� + 1 4⁄ e − 1 2⁄ h)#a S�PTHiL�jkkkkkl �.#a + 1 2⁄ e �a# + *m*G-e (2)
The soluble readily biodegradable organic matter (normally described as COD) goes
through the cell walls and is quickly metabolized. Both the slowly biodegradable
particulate and the colloidal organic matter are absorbed by the organisms, stored and
over time is broken down by hydrolysis and metabolized.
♦ Cellular synthesis (Anabolism)
.��]#^ + b�n + (� − 1 4⁄ e − 1 2⁄ h − 5)#a + *m*G-e S�PTHiL�jkkkkkl ._�`#ab+ (� − 5).#a + 1 2⁄ (e − 4)�a# (3)
Some of the metabolized organic matter is converted into new cells, while the
remainder is lost as heat in the energy process required for the new cell synthesis.
♦ Endogenous respiration
._�`#ab + 5#a S�PTHiL�jkkkkkl 5.#a + 2�a# + b�n + *m*G-e (4)
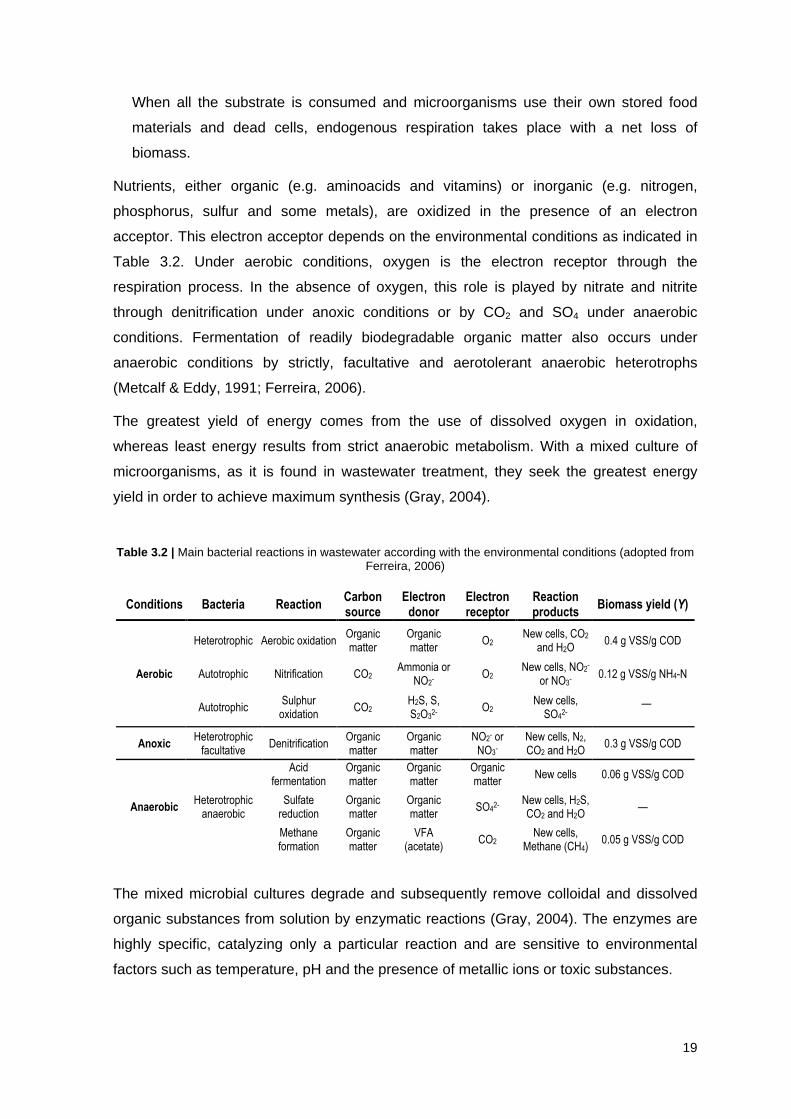
19
When all the substrate is consumed and microorganisms use their own stored food
materials and dead cells, endogenous respiration takes place with a net loss of
biomass.
Nutrients, either organic (e.g. aminoacids and vitamins) or inorganic (e.g. nitrogen,
phosphorus, sulfur and some metals), are oxidized in the presence of an electron
acceptor. This electron acceptor depends on the environmental conditions as indicated in
Table 3.2. Under aerobic conditions, oxygen is the electron receptor through the
respiration process. In the absence of oxygen, this role is played by nitrate and nitrite
through denitrification under anoxic conditions or by CO2 and SO4 under anaerobic
conditions. Fermentation of readily biodegradable organic matter also occurs under
anaerobic conditions by strictly, facultative and aerotolerant anaerobic heterotrophs
(Metcalf & Eddy, 1991; Ferreira, 2006).
The greatest yield of energy comes from the use of dissolved oxygen in oxidation,
whereas least energy results from strict anaerobic metabolism. With a mixed culture of
microorganisms, as it is found in wastewater treatment, they seek the greatest energy
yield in order to achieve maximum synthesis (Gray, 2004).
Table 3.2 | Main bacterial reactions in wastewater according with the environmental conditions (adopted from Ferreira, 2006)
Conditions Bacteria Reaction Carbon source
Electron donor
Electron receptor
Reaction products
Biomass yield (Y)
Aerobic
Heterotrophic Aerobic oxidation Organic matter
Organic matter
O2 New cells, CO2
and H2O 0.4 g VSS/g COD
Autotrophic Nitrification CO2 Ammonia or
NO2-
O2 New cells, NO2
- or NO3
- 0.12 g VSS/g NH4-N
Autotrophic Sulphur oxidation
CO2 H2S, S, S2O3
2- O2
New cells, SO4
2- —
Anoxic Heterotrophic
facultative Denitrification
Organic matter
Organic matter
NO2- or
NO3-
New cells, N2, CO2 and H2O
0.3 g VSS/g COD
Anaerobic Heterotrophic
anaerobic
Acid fermentation
Organic matter
Organic matter
Organic matter
New cells 0.06 g VSS/g COD
Sulfate reduction
Organic matter
Organic matter
SO42-
New cells, H2S, CO2 and H2O
—
Methane formation
Organic matter
VFA (acetate)
CO2 New cells,
Methane (CH4) 0.05 g VSS/g COD
The mixed microbial cultures degrade and subsequently remove colloidal and dissolved
organic substances from solution by enzymatic reactions (Gray, 2004). The enzymes are
highly specific, catalyzing only a particular reaction and are sensitive to environmental
factors such as temperature, pH and the presence of metallic ions or toxic substances.
20
3.3.2 Biological removal of nutrients
Although the stabilization of carbonaceous matter is the main objective of wastewater
treatment, nutrients such as nitrogen and phosphorus contribute greatly to the
eutrophication of the receiving waters. Consequently, many countries have legislation that
imposes the removal of those compounds from wastewater.
The biological processes for nutrient removal have high potential removal efficiency,
increase the sludge settleability and reduce sludge production and oxygen demand in the
aeration tank. They also reduce the chemical products consumed, when compared to
chemical precipitation processes. The main difficulty lies in the fact that microorganisms
performing nitrification, denitrification and enhanced biological phosphorus removal
require very different biochemical environments to function effectively, that is, a
combination of aerobic, anoxic and anaerobic conditions (Jeppsson, 1996).
3.3.2.1 Biological nitrogen removal
The biological removal of nitrogen is carried out through a three-step mechanism: i)
ammonification, production of ammonia from organic nitrogen by hydrolysis; ii) nitrification,
aerobic conversion of ammonia to nitrate by reacting with oxygen and iii) denitrification,
conversion of nitrate to nitrogen gas by reacting with organic carbon under anoxic
conditions.
The formation of ammonia from organic nitrogen is expressed by Equation (6). The other
processes are explained in more detail below.
bpG- + �a# S�PTHiL�jkkkkl b�qr + .#a (5)
The ion NH4+ is undesirable in receiving water because it causes excessive oxygen
demand and is toxic for fish.
Nitrification
In nitrification, ammonium is converted to nitrate by nitrifying bacteria (autotrophs) in two
steps. In the first step, called nitritation, Nitrosomonas oxidize ammonia-nitrogen to nitrite
(Equation (6)). In the second step, denominated nitratation, nitrite is converted to nitrate
by Nitrobacter (Equation (7)).
b�qr + 3 2t #a ULTiOQO�OI�Qjkkkkkkkkkl 2�r + �a# + b#au + *m*G-e (6)
b#au + 1 2t #a ULTiOS�PTHijkkkkkkkl b#nu + *m*G-e (7)
21
All acidity and most energy are produced in nitritation (Stypka, 1998). It should be noted
that there is a considerable oxygen demand by autotrophic bacteria during nitrification, of
4.57 g O2 per g of ammonium oxidized. If the dissolved oxygen is not replaced, then
aerobic growth will eventually stop when the oxygen is exhausted, allowing only the slow
anaerobic processes to continue (Gray, 2004).
Nitrifying bacteria are very sensitive to environmental conditions, such as temperature, pH
(optimal range between 7.5 and 8) and alkalinity (between 50 and 100 g CaCO3/m3).
Nitrification normally requires a long retention time, a low F/M ratio, a high mean cell
residence time and adequate buffering alkalinity (the process produces acid that lowers
the pH and may reduce the growth rate of nitrifying bacteria). The concentration of
dissolved oxygen should be above 2 g/m3 and DO levels below 0.5 g/m3 inhibit nitrification
(Ferreira, 2006). Finally, the growth rate of Nitrobacter is higher than the growth rate of
Nitrossomonas, which means that ammonia-nitrogen may accumulate in the process (if
the ammonification rate is high) and become an inhibitor.
Nitrification may be sufficient as a nitrogen removal process, if the receiving waters are
less sensitive, because it ensures the limitation of toxicity by ammonium and the reduction
of oxygen demand.
Denitrification
Denitrification is biologically accomplished under anoxic conditions (in the absence of
oxygen and when nitrite or nitrate act as electron receptors). This process converts
nitrate-nitrogen into nitrogen gas by a sequence of reactions for nitrate reduction:
b#nu v b#au v b# v ba# v ba (8)
Equation (9) shows that in the conversion of nitrate to nitrogen gas, organic matter is
consumed although in a smaller proportion than in aerobic conditions.
.��]#^ + (4� + e − 2h)5 �r + (4� + e − 2h)5 b#nu S�PTHiL�jkkkkl �.#a+ (2� + 3e − 2h)5 �a# + (4� + e − 2h)10 ba
(9)
Heterotrophic bacteria, such as Pseudomonas, Bacillus, Microccoccus and Aerobacter,
are responsible for denitrification and are sensitive to changes in temperature since it
influences their growth rate. The optimal pH lies between 7 and 8, with different optimum
values for different bacterial populations (Metcalf & Eddy, 1991). The main inhibitor of
denitrification is oxygen and therefore dissolved oxygen concentration should not exceed
22
0.2 g/m3 (Ferreira, 2006). This process produces alkalinity that increases the buffering
power and needs a carbon source.
Moreover, nitrous oxide (N2O) produced during the process is a pollutant gas and care
must be taken in the WWTP operation to avoid its production in the system (Gray, 2004;
Ferreira, 2006).
Although nitrification and denitrification require different environmental conditions for the
efficient action of nitrifying and denitrifying bacteria, both processes may occur
simultaneously in the reactor. In one hand, in the biological reactor both anoxic and
aerobic zones can exist, depending on the stirring conditions of operation. On the other
hand, when analyzing the floc (composed by TSS, autotrophs and heterotrophs) at a
microscopic scale, the denitrifying bacteria can be involved in anoxic conditions despite
any dissolved oxygen in the mixed liquor (mixture of wastewater and activated sludge, as
explained in Chapter 3.4).
3.3.2.2 Biological phosphorus removal
Phosphorus appears in wastewater as orthophosphate (PO43-), polyphosphate (P2O7) and
organically bound phosphorus (Metcalf & Eddy, 1991).
Biological phosphorus removal works by encouraging the growth of phosphate-
accumulating organisms (PAOs), usually Acinetobacter species, which are subjected to
both anaerobic and aerobic conditions. Under anaerobic conditions, the microbes break
the high-energy bonds in internally accumulated polyphosphate, resulting in the release of
phosphate and the consumption of organic matter in the form of volatile fatty acids (VFAs)
or other easily biodegradable organic compounds. Under aerobic conditions,
microorganisms take up phosphate and store it as polyphosphate. According to Pattarkine
and Randall (1999), the involved equations in biological phosphorus removal under
anaerobic and aerobic conditions, respectively, are as follows:
xy#z + z(pG*{ 'p|e'ℎpz'ℎ�(* + ~-ar + r + -|e�p-*m + W�y v xy#z+ z(pG*{ ��p'p|e�*Gz + ~-ar + r + .#a + �a# + x#qnu (10)
xy#z + z(pG*{ ��p'p|e�*Gz + ~-ar + r + #a(pG b#nu) +x#qnu v xy#z+ z(pG*{ 'p|e'ℎpz'ℎ�(* + ~-ar + r + .#a + �a# + -|e�p-*m (11)
This luxury uptake results in more phosphate being included in the cells than was
released in the anaerobic zone, so the total phosphate concentration is reduced. When
these microorganisms enriched in polyphosphate are removed, the contained phosphate
is also removed.
23
3.4. ACTIVATED SLUDGE PROCESS
The activated sludge process is the most generally applied biological wastewater
treatment method and has been extensively used in all sort of modified forms (plug-flow,
extended aeration, deep shaft, etc.). Since the case study presented in Chapter 6 consists
of a WWTP having an oxidation ditch, this process will be subject to a detailed description.
The activated sludge process consists of the maintenance of suspended material
(bacteria and other microorganisms, organic and inorganic particles) in wastewater in the
reactor by stirring and/or aeration. Through hydrolysis organic particles are broken down
into simpler components and used by the microorganisms in the system as an energy
source, i.e., the organic material from the raw wastewater is removed whereas more
biomass is produced. This biological conversion of organic material produces CO2, NO3
and SO4, among other end products (Stypka, 1998).
In order to control the amount of suspended biomass in the system, a sedimentation tank
is placed at the end of the process, where the biomass is transported towards the bottom
by gravity settling as excess sludge, while the purified wastewater is withdrawn from the
top of the sedimentation tank and released either for further treatment or directly into a
receiving water body. A fraction of the sludge is returned to the aeration tank containing a
high density of biomass.
3.4.1 Historical perspective
In 1914, Edward Arden and William T. Lockett from the River Committee of the
Manchester Corporation were the pioneers of one of the most popular processes in
sewage treatment. After aeration and sedimentation of wastewater, they saved the
flocculent solids, which they called activated sludge, and studied the effect of their
repeated use in sewage treatment by aeration (Jeppsson, 1996). Arden and Lockett
proved that the use of activated sludge could appreciably increase the purification
capacity of simple aeration depending on the proportion of activated sludge to the sewage
treated. Over the following years, this batch process was converted into a continuous
process using an aeration tank, a sedimentation tank and a sludge recycle system, once it
was proven to be the best practical method for activated sludge.
However, the characteristics and quantity of raw wastewater were altered due to rapid
population growth and industrial development and the existing WWTP became
inadequate. This problem, along with the higher effluent quality requirements, encouraged
the development of modified processes, such as the oxidation ditch process.
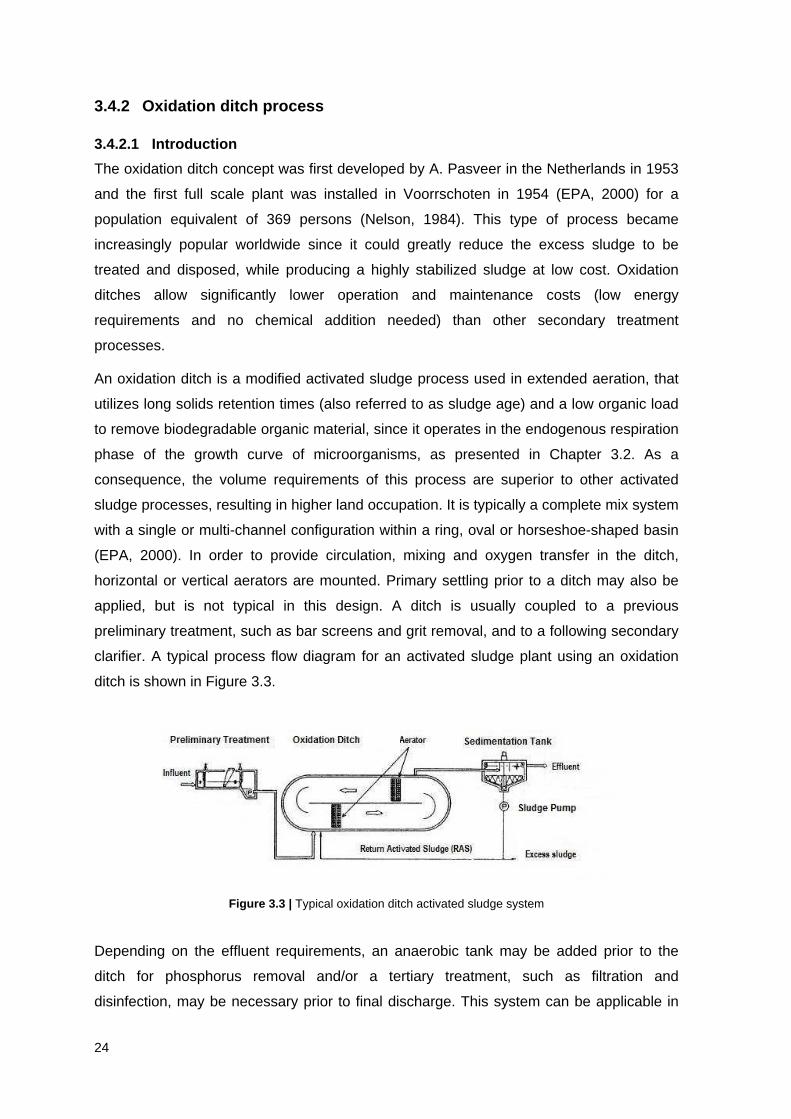
24
3.4.2 Oxidation ditch process
3.4.2.1 Introduction
The oxidation ditch concept was first developed by A. Pasveer in the Netherlands in 1953
and the first full scale plant was installed in Voorrschoten in 1954 (EPA, 2000) for a
population equivalent of 369 persons (Nelson, 1984). This type of process became
increasingly popular worldwide since it could greatly reduce the excess sludge to be
treated and disposed, while producing a highly stabilized sludge at low cost. Oxidation
ditches allow significantly lower operation and maintenance costs (low energy
requirements and no chemical addition needed) than other secondary treatment
processes.
An oxidation ditch is a modified activated sludge process used in extended aeration, that
utilizes long solids retention times (also referred to as sludge age) and a low organic load
to remove biodegradable organic material, since it operates in the endogenous respiration
phase of the growth curve of microorganisms, as presented in Chapter 3.2. As a
consequence, the volume requirements of this process are superior to other activated
sludge processes, resulting in higher land occupation. It is typically a complete mix system
with a single or multi-channel configuration within a ring, oval or horseshoe-shaped basin
(EPA, 2000). In order to provide circulation, mixing and oxygen transfer in the ditch,
horizontal or vertical aerators are mounted. Primary settling prior to a ditch may also be
applied, but is not typical in this design. A ditch is usually coupled to a previous
preliminary treatment, such as bar screens and grit removal, and to a following secondary
clarifier. A typical process flow diagram for an activated sludge plant using an oxidation
ditch is shown in Figure 3.3.
Figure 3.3 | Typical oxidation ditch activated sludge system
Depending on the effluent requirements, an anaerobic tank may be added prior to the
ditch for phosphorus removal and/or a tertiary treatment, such as filtration and
disinfection, may be necessary prior to final discharge. This system can be applicable in
25
plants that require nitrification since the basin can be sized using an appropriate solids
retention time (STR) in order to achieve nitrification at the mixed liquor minimum
temperature and has proved to be very effective. It is particularly recommended in small
communities and industrial installations, because it requires more land than conventional
treatment plants.
3.4.2.2 Design parameters, operation and control
Screened wastewater enters the ditch and is aerated by surface aerators, such as brush
rotors, disc aerators, draft tube aerators or fine bubble diffusers. The dissolved oxygen
concentration sharply increases with aeration but decreases as the mixed liquor travels
through the ditch. The stirring process entrains oxygen into the mixed liquor to enhance
microbial growth and ensures an adequate velocity, which enables the contact of
microorganisms with the incoming wastewater and maintains the solids in suspension. In
oxidation ditches, horizontal velocity can vary between 0.25 and 0.60 m/s, with typical
values from 0.25 to 0.35 m/s (Metcalf & Eddy, 1991). A minimum velocity of 0.25 m/s is
usually required to prevent the organic particles from settling on the channel surface
(Abusam et al., 2002).
The hydraulic retention time within the oxidation ditch ranges from 6 to 30 hours for most
municipal WWTPs (EPA, 2000), which minimizes the impact of a shock load or hydraulic
surge. A BOD loading rate of 80 to 480 g/m3 per day is commonly used as a design
loading rate. The typical oxygen coefficient for BOD removal ranges from 1.1 to 1.5 g of
O2 per g of BOD removed and 4.57 g of O2 per g of TKN oxidized (EPA, 2000). Sludge
production for the oxidation ditch process ranges from 0.2 to 0.85 g TSS per g BOD
applied, with typical values of 0.65 g TSS per g of BOD (EPA, 2000), which is less than
conventional activated sludge facilities due to long solids retention times (SRT). The SRT
is selected as a function of nitrification requirements at the minimum mixed liquor
temperature, with design values varying from 4 to 48 or more days. In case where
nitrification is required, SRT usually ranges from 12 to 24 days (EPA, 2000).
The operation of a WWTP based in activated sludge processes should take into account
the following parameters: sludge age; substrate/microorganisms relation (F/M); sludge
production; aerobic and anoxic conditions (in order to allow the biological reactions for
organic matter and nutrients removal to take place); alkalinity and settleability of the mixed
liquor (Ferreira, 2006). Control of the system is mainly done through aeration and recycle
of activated sludge/removal of excess sludge.
In order to enable aerobic and anoxic conditions in the ditch, cycles of aeration on/off
combined with continuous operation of stirrers are advised (Dayton and Knight, 2001).
26
Nevertheless, in most conventional activated sludge plants mechanical aerators are
responsible for both aeration and mixing. As soon as the blowers are shut off at the end
of the aerobic phase, the concentration of DO in the mixed liquor will typically decline
rapidly to near zero, as bacteria continue to oxidize BOD and ammonia, exhausting the
residual DO in the process liquid. As DO disappears from solution, facultative bacteria
turn to nitrate as an alternative electron acceptor to carry out their metabolic processes,
resulting in continued BOD removal and denitrification of nitrates. If the air-off period is
allowed to continue after all available nitrates are removed from solution by denitrification,
the environment will become anaerobic at that point (i.e. neither free dissolved oxygen nor
nitrates are present). Under anaerobic conditions, oxidation of BOD by facultative
organisms will cease and fermentation of organic matter starts. The removal rate of BOD
by fermentation is negligible compared to that under aerobic and anoxic conditions;
consequently, if the anaerobic phase is allowed to continue while untreated wastewater
flows into the bioreactor, the BOD concentration in the process effluent will begin to
increase. Therefore, to achieve optimum BOD removal and to prevent nuisance odors, the
aeration blowers should be restarted immediately after all of the nitrates disappear from
solution.
Due to the high internal recirculation rate, significant amounts of nitrate and dissolved
oxygen are recirculated from the last compartment (effluent) to the first compartment
(influent). These amounts will obviously affect the DO profile along the ditch and
consequently the ditch performance (Abusam et. al., 2002).
The return activated sludge (RAS) recycle ratio varies from 75 to 150% (to maintain the
necessary F/M relation in the ditch) and the mixed liquor suspended solids (MLSS)
concentration is usually between 3000 and 6000 g/m3 (Metcalf & Eddy, 1991). Nearly 1 to
6% of the WWTP influent is removed as excess sludge from the bottom of the secondary
clarifier.
3.4.2.3 Sludge properties
The ability of microorganisms to form flocs along with the adsorptive capacity of these
flocs is vital for the activated sludge treatment process. The floc structure enables the
adsorption of soluble substrates, colloidal matter and macro-molecules usually found in
most wastewater. However, the ability of the flocs to settle in a relatively short time under
quiescent conditions is also very important, in order to avoid the discharge of biomass,
produced as a result of oxidation of the waste, into the receiving waters.
A number of parameters have been developed to obtain a quantitative measure of the
settleability of activated sludge. Among others, the most applied of these is the Sludge
27
Volume Index (SVI) (also known as Mohlman sludge index), which measures the sludge
volume after 30 minutes of sedimentation in a 1 liter sedimentation vessel (the higher the
SVI value, the lower the sludge settleability). However, as explained by Dick and Vesilind
(Stypka, 1998), this index is not related to the sludge yield strength, the plastic viscosity or
the initial velocity of the sludge. Hence, the variation of SVI values with the total
suspended solids concentration (SST) and the sludge volume makes it difficult to compare
the SVI values between different plants.
In cases where the settleability conditions are not verified, there are four main
phenomena that lead to a decrease of the quality of the effluent due to the escape of
flocs (Stypka, 1998):
♦ Bulking sludge , when the sludge settles poorly. There are two types of bulking:
i) Filamentous bulking: Filamentous microorganisms (such as Microthrix parvicella and
Nocardia sp. Type 0041) extended from the floc particle decrease its settling rate
and hold the particles apart, preventing them from compacting;
ii) Zoogleal bulking: when filamentous organisms are completely missing, this is
related to the viscous extracellular polymers produced in excess by some kind of
bacteria (Zooglea sp., Acinetobacter sp.), in which the exocellular slime capsule
absorbs a lot of water increasing the volume of the floc. In these cases the sludge
exhibits high SVI and loses the ability to settle.
♦ Pin-point sludge or dispersed sludge, consisting of small floc particles present in the
supernatant after the sludge has settled. This phenomenon results in an environmental
shock (such as excessive turbulence in the aeration basin): microorganisms form a
non-settleable suspended solid (pin-point floc) and do not agglomerate or incorporate
into a floc.
♦ Foaming sludge due to microbial activity. Some bacteria (usually filamentous
microorganisms) produce a lipid material (hydrophobic compounds) which is excrete
into the mixed liquor and collects on the surface of air bubbles. The bubbles mesh
together including some microorganisms and float on the surface forming scum.
♦ Rising of the sludge after settlement in the clarifier due to the nitrogen produced in
denitrification process.
A detailed description of the factors that influence the growth of filamentous bacteria and
its control strategies can be found in Stypka (1998).
28
3.5. SEDIMENTATION
In the activated sludge process the efficiency of the whole treatment system and
consequently the quality of the final effluent are based on a strong relationship between
the design of the aeration tank and of the secondary clarifier. The performance of the
aeration tank varies with the return sludge concentration and flow rate, while the
clarification and thickening functions of the clarifier depend on the characteristics of the
effluent formed in the aeration tank. These functions translate the solid-liquid separation
process that happens once the aeration tank effluent enters the sedimentation tank. A part
of the load flows to the surface of the clarifier where it is discharged as a clarified effluent
(overflow). The remaining part settles down by gravity and concentrates on the bottom of
the clarifier, from where it is removed as return activated sludge or as excess sludge
(underflow). In some cases, the settler may also be considered for sludge storage in its
bottom part or as a reactor where additional biological conversions can occur (e.g.
denitrification).
The sedimentation tank can be divided into three functioning areas (clarification zone,
settling zone and sludge zone) according to four different types of settling:
♦ Discrete particle settling: in the clarification zone, particles settle individually without
interaction with neighboring particles. The settling velocity regime is based on the
Stokes equation.
♦ Discrete flocculent particle settling: in the clarification zone, flocculation causes the
particles to increase in mass and settle at a faster rate.
♦ Hindered settling: in the settling zone, the particles are close enough so that
interparticulate forces may hold them fixed relative to one another so that the whole
mass tends to settle as a single "blanket" of sludge.
♦ Compression: at the bottom of the tank (sludge zone) the concentration of particles is
so high that their weight leads to a progressively greater compression with depth and
thickening of sludge.
There are many factors that influence the clarification and thickening functions of the
secondary clarifiers. Ekama et al. (1997) reported that excessive solids in secondary
clarifier effluents occur primarily because of one or more of the following aspects:
♦ Hydraulic short-circuiting or resuspension of solids from the surface of the sludge
blankets by high velocity currents.
♦ Thickening overloads, resulting in high sludge blankets and potential loss of solids
when the blanket reaches the effluent weir.
29
♦ Denitrification, causing solids to float to the surface of the clarifier due to the release of
nitrogen gas.
♦ Flocculation problems due to either flocs breakup or poor floc formation.
♦ Insufficient capacity of the sludge collection system.
In addition, external dimensions of the clarifier (such as area and depth), internal features
(such as inlet, outlet sludge collection and baffling arrangement) as well as flow
disturbances (short circuiting, turbulence) also influence these functions.
4. RESPIROMETRY Respirometry is the measurement and interpretation of the oxygen consumption rate per
unit of time and volume. Because oxygen consumption is directly associated with both
biomass growth and substrate removal, respirometry is a useful technique for modeling
and operating the activated sludge (Spanjers et al., 1998). This technique was first applied
to wastewater in 1890 but only later in the 1960s it raised interest in the scientific
community for process control. It can provide very diverse information, such as
composition of the wastewater (concentration, COD fractionation and toxicity), indication
of specific activity of organisms (e.g. kinetic parameters), information on how the biomass
interacts with the wastewater components and purification performance. During the past
two decades, respirometry has been widely used to obtain biokinetic characteristics and
gained most relevance in activated sludge modeling, as in the work of Copp et al. (2002).
Although respirometry is based on the same biochemical principles, depending on the
purpose of the respirometric assay different procedures may be considered, and the direct
or indirect use of the generated information differs from author to author.
According to Domingos (1999) (quoted by Ferreira, 2004) in a batch reactor of a mixed
culture, the kinetic parameters are observed to be slightly heterogeneous and may be
related with the existing bacterial species and with the history of the culture. The history of
the culture, which comprises many different aspects such as the selection of
microorganisms, substrate affinity and the capacity to adapt to different environmental
conditions, influences the initial physiologic state of the culture. Hence, biodegradation
kinetic parameters, such as the maximum specific growth rate (����), Monod saturation
constant () and the heterotrophic yield (��), can also be affected and should be
analyzed carefully.
30
4.1. RESPIROMETERS
A respirometer is a device used to measure the respiration rate, i.e. the variation of
dissolved oxygen as a result of its consumption by biomass over time. This can be done
directly by measuring DO or indirectly by measuring gaseous oxygen or pressure. A
respirometer consists of a reactor or respiration cell (where the sample is placed) and
sensorial instruments coupled with equipment data acquisition system. In the reactor
substrate, biomass and dissolved oxygen are brought together, among other components
that allow the control of reactions in the system. Usually an air pump or compressor and a
magnetic stirrer are also used to provide enough oxygen and ensure complete mix in the
reactor, respectively. Many different configurations of respirometers have been developed
with more or less complexity, from a simple and manually operated bottle equipped with a
DO sensor to complex instruments that operate fully automatically.
Ros (1993) (quoted by Ferreira, 2002, and Ferreira, 2004) divided respirometers into two
groups: closed respirometers (subdivided into manometric, volumetric and combined) and
open respirometers (continuous or descontinuous, according to the measuring continuity).
Spanjers et al. (1998) have pointed out that respirometers can be grouped in accordance
with these basic criteria: (1) the phase where oxygen concentration is measured (gas or
liquid) and (2) whether or not there is an input and output of gas and liquid (flowing or
static regime). In Table A.1.1 and Table A.1.2Table A.1. of Appendix A.1 the classification
and a brief description of respirometers according to Spanjers et al. (1998) is presented,
respectively, considering oxygen measuring phase, regime, mass balance and diagram.
The gas phase includes oxygen dispersed as bubbles in the liquid phase.
According to Spanjers et al. (1998) and Rozich & Gaudy (1992) the respirometric devices
generate a profile that registers the variation of DO over time (the respirogram).
Conceptually, this curve may contain four phases (as showed in Figure A.2.1. of Appendix
A.2), the first two developed to evaluate the endogenous respiration, the second to
determine and control the oxygen rate (��) and the last one to estimate the kinetics and
stoichiometric parameters. The area A of the respirogram only is developed if a
continuous aeration procedure is applied. Some authors (Ros, 1993; Spanjers et al.,
1998; and Mathieu & Etienne, 2000), have used continuous aeration in order to developed
a OD recovery curve and, therefore, to estimated some parameters through an integration
graphic method.
However, the studies of Rozich & Gaudy (1992), Spanjers et al. (1998), Ferreira (2002),
Ferreira (2004) and Mhlanga et al. (2009) the aeration was not used after substrate
injection since most of parameters may be estimated from the DO decay curve. If the
31
substrate source is not properly removed it may be performed additional cycles of
aeration/no aeration in order to compare the values obtained for each decay curve.
Respirometers based on the principle of measuring the DO concentration in the liquid are
based on the DO mass balance over the liquid phase, given by Equation (12). The liquid
in the respirometer must be a complete mixture (CSTR reactor), in order to avoid
concentration gradients.
�(W�"#)�( = FLI"#LI − FORT"# + W���("# − "#) − W�GT (12)
where: "# = DO concentration in the liquid phase [g O2/m3]; "#LI = DO concentration in the liquid phase entering the system [g O2/m
3]; "# = saturation DO in the liquid phase [g O2/m3]; FLI = flow rate of the liquid entering the system [m3/h]; FORT = flow rate of the liquid leaving the system [m3/h]; W� = volume of the liquid phase [m3]; �� = oxygen mass transfer coefficient (based on the liquid volume) [h-1]; GT = total respiration rate of the biomass in the liquid [g O2/m
3·h].
Some respirometers are based on measurements of gaseous oxygen. Therefore, in
addition to the DO mass balance in the liquid phase, an oxygen mass balance for the gas
phase has to be considered as expressed by Equation (13):
�(WX#a)�( = �LI#a,LI − �ORT#a − W���("# − "#) (13)
where: #a = O2 concentration in the gas phase [g O2/m3]; #a,LI = O2 concentration in the gas phase entering the system [g O2/m
3]; "# = DO concentration in the liquid phase [g O2/m3]; "# = saturation DO concentration in the liquid phase [g O2/m
3]; �LI = flow rate of the gas entering the system [m3/h]; �ORT = flow rate of the gas leaving the system [m3/h]; WX = volume of the gas phase [m3]; W� = volume of the liquid phase [m3]; �� = oxygen mass transfer coefficient (based on the liquid volume [h-1].
Some respirometers measure the variation of volume or pressure instead of the oxygen.
The oxygen concentration is subsequently obtained according to the ideal gas law
32
(xW = m��). Since continuous aeration is used, one must control very well the oxygen
transfer rate (��), which is applied in the expressions for parameters estimation.
4.2. RESPIROMETRIC EXPERIMENTS
4.2.1 Measurement conditions
According to Spanjers et al. (1998), in respirometry a respiration rate value or a
percentage of inhibition calculated from respiration rate measurements cannot be
interpreted without additional information about some measurement attributes. The most
relevant attributes are: biomass source, type of substrate, time of measurement and initial
substrate-to-biomass ratio (S0/X0). Other environmental conditions such as pH,
temperature and pressure are also important for the measurement result. Therefore, they
are assumed similar to the conditions in the treatment plant or kept constant in order not
to influence the results. The previous attributes are briefly described as follows:
Biomass
There are several sources of respirometer biomass: raw/settled sewage, activated sludge
from the aeration tank, returned activated sludge, effluent from the final settlement tank
and specific cultures grown on a synthetic substrate. As reported in Spanjers et al. (1998),
activated sludge sampled from the aeration tank often contains dissolved oxygen and a
varying and mostly unknown quantity of substrate. Return activated sludge has a high
biomass concentration and usually low dissolved oxygen and substrate concentrations,
whereas raw sewage has a low biomass and high substrate concentrations. The initial
concentration of biomass (X0) should be known (as explained later) and corresponds to
the concentration of volatile suspended solids, converted into units of COD by
multiplication of a conversion factor (+�V).
Most of the experiments in respirometers use the biomass from the activated sludge
process, since the objective is to get information on kinetic activity in the bioreactor. The
experiments should be carried out in a short time in order to avoid changes in the biomass
dynamics. The introduction of an external source may not be homogeneous with respect
to past history of environmental conditions, and the growth of this biomass will not be a
balanced (steady-state) growth even when the bioreactor operates in steady state
conditions.
According to Dang et al. (1989) (quoted by Ferreira, 2004), the consumption of DO is
associated to the removal of substrates and for biomass growth (both aerobic
heterotrophics and autotrophic nitrifiers). In order to better defined the respiration rate for
33
heterotrophics, nitrifiers and protozoa activities need to be inhibited (e.g. with
allylthiourea). Prior the beginning of the assay, the residual substrate must be exhausted
in order to allow the growth of biomass and the removal of substrates immediately after
substrate inoculation.
Substrate
As described by Spanjers et al. (1998), four substrates types have been considered in
respirometry: wastewater (raw or settled), treated effluent, return liquors from the sludge
treatment and specific substrates. A specific substrate such as acetate or ammonium can
be used to mimic the oxidation of particular components is wastewater. The initial
concentration of substrate (S0) (expressed as units of COD) and the time of measurement
(long term or short term experiments) are both very important conditions since the OUR
measurements depend on their variability. Moreover, when the respiration rate is
measured immediately after sampling, the respirogram can provide more accurate
information on biomass and substrate and closely reflect the condition of the treatment
process.
The ratio So/Xo is usually measured after the injection of the substrate and may result of
the sum of the mass of the input pulse and the mass already existent in the respirometer.
In most of the cases this evaluation uses the experimental values determined after the
pulse injection (i.e. in the mixed volume).
Time of measurement
The respiration rate is a function of time. Therefore, in a respirometric assay, the
respiration rate is measured for some time to obtain a time series of respiration rate
values. Depending on the characteristics of the sample to be analyzed and the aim of the
experiment (i.e. the set of parameters to be estimated from the respirogram), the time of
measurement usually varies between 5 to 6 hours for a short term experiment (Mathieu &
Etienne, 2000; Ferreira, 2004) and between 1 to 2 days for long term experiments (Ekama
et al., 1986).
Initial substrate to biomass ratio (S0/X0)
The outcome of the experiments and its quality is influenced by the initial substrate to
biomass ratio (Chudoba et al., 1992; Grady Jr. et al., 1996; Mathieu and Etienne, 2000).
S0/X0 influences the history of a culture and the kinetic parameter estimation in correlation
with the Monod parameters � and . If S0/X0 is very high, significant changes in the
community structure will happen and the measured kinetics parameters will reflect the
34
characteristics of faster growing species rather than the ones of the original culture (Grady
Jr. et al., 1996). On the other hand, if S0/X0 is very small, the storage of substrate into the
cells is enhanced and at some point the growth is limited by the shortage of a carbon
source (Ferreira, 2004). If kinetic parameter estimation is done with the aim of modeling, a
value of S0/X0 below 4 is usually used, since it is considered to be more representative of
the kinetics in the source environment (Chudoba et al., 1992).
4.2.2 Measurement and deduction of variables
In order to obtain relevant parameters of a wastewater treatment process, respirometric
measurements must first be converted to deduced variables. A deduced variable is
defined as a variable that results from a calculation (for instance arithmetic, integration,
parameter estimation, comparison and/or model based interpretation) performed with one
or more measured respiration rate values and possibly other measured variables
(Spanjers et al., 1998). Considering the set of parameters to be determined by
respirometry and its utilization in the calibration of an ASM, different approaches for the
deduction of such parameters may be undertaken. In this work, a combination of both
model based interpretation and equations was used in order to deduce stoichiometric and
kinetic coefficients based on respirometric experiments.
Figure 4.1 illustrates the DO curve pattern corresponding to an operation cycle of a
respirometer based on the LFS principle (see Table A.1.1, Appendix A.1), but with
aeration stopped after injection as suggested by Rozich & Gaudy (1992), Spanjers et al.
(1998) and Ferreira (2004). The DO curve is divided into four phases. In phase I, the DO
concentration increases quickly to saturation levels (6-8 g/m3) as a consequence of a
rapidly aeration (Melcer et al., 2003). Aeration is then turned off (t0) and the consequent
decrease of DO concentration is observed (phase II). The endogenous respiration rate
(GHIJ) may be obtained from the slope of the linear section of DO response. During phase
III, the sample is reaerated (t1) and the oxygen mass transfer coefficient (��) can be
calculated from the curve (as described in Appendix A.3). The main goal of these three
stages is to remove any residual substrate from the system before the addition of a known
substrate. When DO reaches again the saturation level (t2), the substrate is injected (t3) in
order to obtain the respirogram – that is, a graphical representation of the OUR as a
function of time (phase IV).
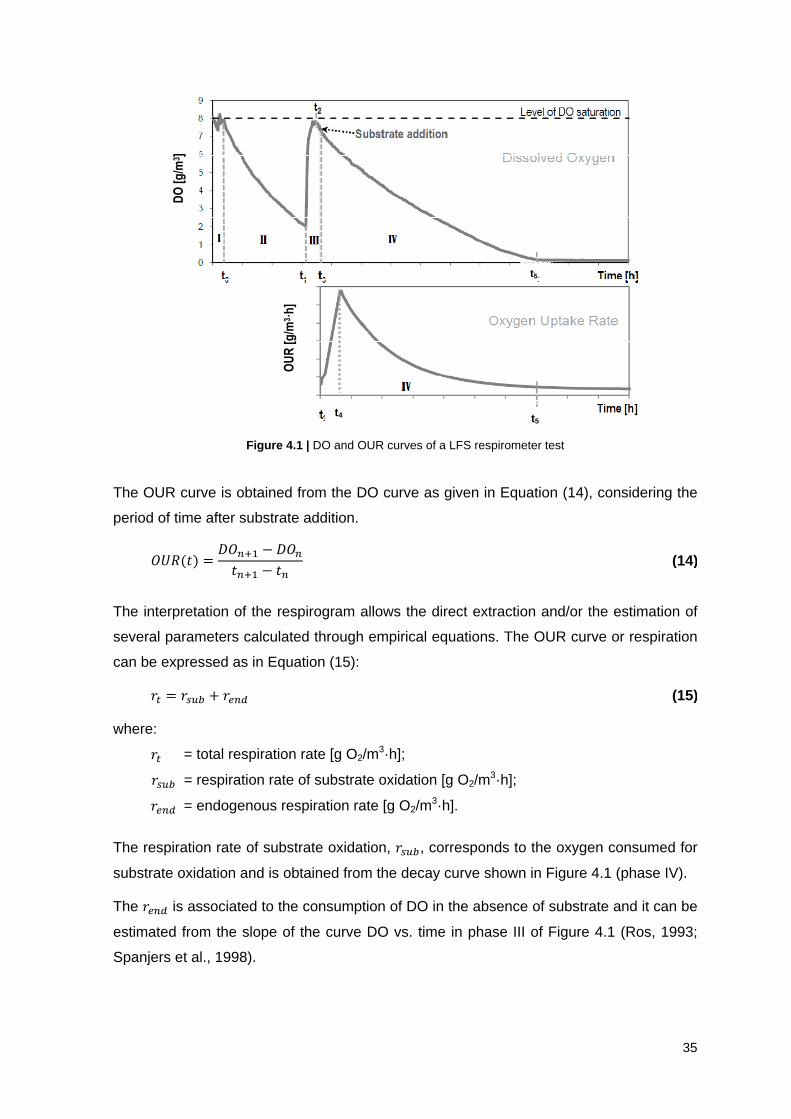
35
Figure 4.1 | DO and OUR curves of a LFS respirometer test
The OUR curve is obtained from the DO curve as given in Equation (14), considering the
period of time after substrate addition.
#��(() = "#Ir� − "#I(Ir� − (I (14)
The interpretation of the respirogram allows the direct extraction and/or the estimation of
several parameters calculated through empirical equations. The OUR curve or respiration
can be expressed as in Equation (15):
GT = GQRS + GHIJ (15)
where: GT = total respiration rate [g O2/m3·h]; GQRS = respiration rate of substrate oxidation [g O2/m
3·h]; GHIJ = endogenous respiration rate [g O2/m3·h].
The respiration rate of substrate oxidation, GQRS, corresponds to the oxygen consumed for
substrate oxidation and is obtained from the decay curve shown in Figure 4.1 (phase IV).
The GHIJ is associated to the consumption of DO in the absence of substrate and it can be
estimated from the slope of the curve DO vs. time in phase III of Figure 4.1 (Ros, 1993;
Spanjers et al., 1998).
OU
R [
g/m
3 �h
]
DO
[g
/m3 ]
t4 t5
t5
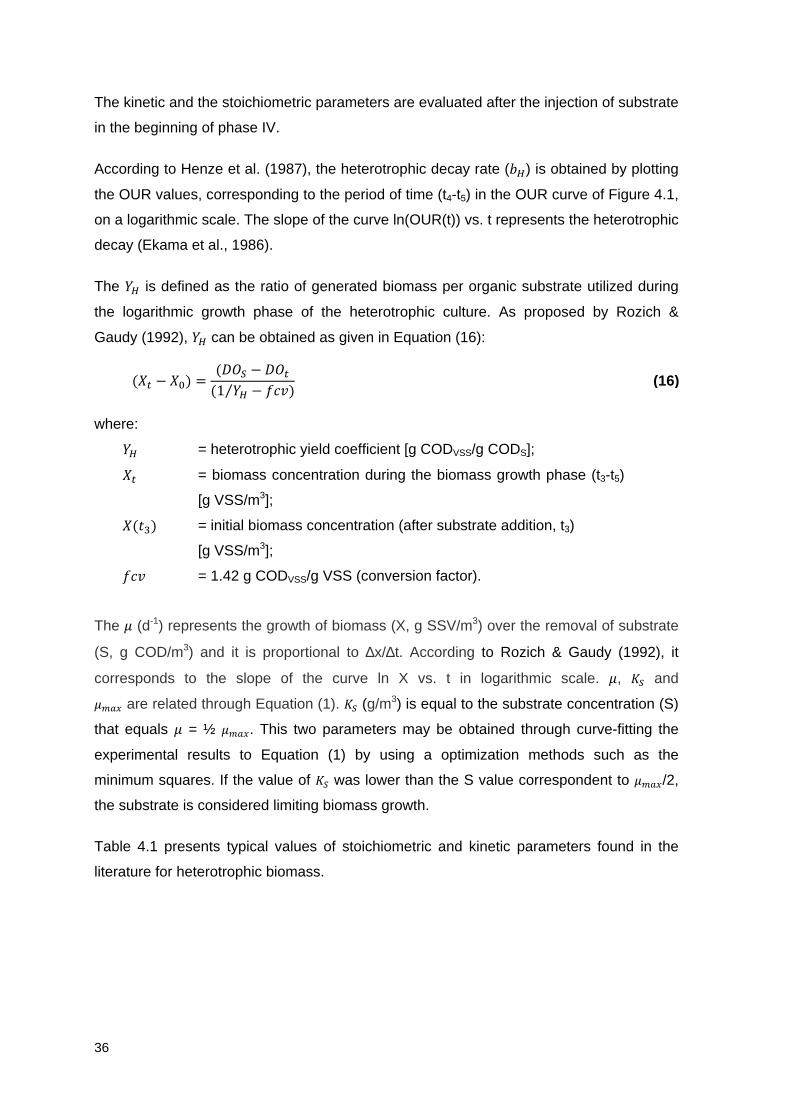
36
The kinetic and the stoichiometric parameters are evaluated after the injection of substrate
in the beginning of phase IV.
According to Henze et al. (1987), the heterotrophic decay rate (��) is obtained by plotting
the OUR values, corresponding to the period of time (t4-t5) in the OUR curve of Figure 4.1,
on a logarithmic scale. The slope of the curve ln(OUR(t)) vs. t represents the heterotrophic
decay (Ekama et al., 1986).
The �� is defined as the ratio of generated biomass per organic substrate utilized during
the logarithmic growth phase of the heterotrophic culture. As proposed by Rozich &
Gaudy (1992), �� can be obtained as given in Equation (16):
(!T − !\) = ("# − "#T(1 ��⁄ − +�V) (16)
where: �� = heterotrophic yield coefficient [g CODVSS/g CODS]; !T = biomass concentration during the biomass growth phase (t3-t5)
[g VSS/m3]; !((n) = initial biomass concentration (after substrate addition, t3)
[g VSS/m3]; +�V = 1.42 g CODVSS/g VSS (conversion factor).
The � (d-1) represents the growth of biomass (X, g SSV/m3) over the removal of substrate
(S, g COD/m3) and it is proportional to ∆x/∆t. According to Rozich & Gaudy (1992), it
corresponds to the slope of the curve ln X vs. t in logarithmic scale. �, and ���� are related through Equation (1). (g/m3) is equal to the substrate concentration (S)
that equals � = ½ ����. This two parameters may be obtained through curve-fitting the
experimental results to Equation (1) by using a optimization methods such as the
minimum squares. If the value of was lower than the S value correspondent to ����/2,
the substrate is considered limiting biomass growth.
Table 4.1 presents typical values of stoichiometric and kinetic parameters found in the
literature for heterotrophic biomass.
37
Table 4.1 | Typical values for stoichiometric and kinetic parameters for heterotrophic biomass
Parameter Unit Typical Minimum Maximum Reference �� g CODVSS/g COD 0,67 0,6 0,75 Grady Jr. et al. (1999), Drolka et al. (2001), Insel et al. (2002) �� d-1 6 4 - Henze et al. (1987), Ekama et al. (1986) ����� d-1 4,8 3,4 6,5 Sozen et al. (1998) �� d-1 0,05 0,03 0,07 Grady Jr. et al. (1999), Drolka et al. (2001), Insel et al. (2002) �� d-1 - 0,1 0,4 Henze et al. (1987), Ekama et al. (1986) � g COD/m3 40.0 15 70 Metcalf & Eddy (1991) ��� h-1 12 - - Droste (1997)
5. MODELING OF WASTEWATER TREATMENT PLANTS
5.1. GENERAL CONSIDERATIONS OF MODELING
Modeling of biological wastewater treatment processes is currently a very active research
area. Generally, mathematical models are used, where equations of various types are
defined to relate inputs, outputs and characteristics of a system.
Overall, a model aims to describe as accurately as possible the behavior of a given
system. Models are therefore a valuable tool which enables the investigation of the static
and dynamic behavior of a system, thereby reducing the number of practical experiments
necessary, which may be rather expensive and time-consuming (Jeppsson, 1996).
However, no model illustrates the whole reality. The system of interest may be complex
and models of it may need to be simplified in order for the model to become useful for
modellers and practioners (i.e. assumptions have to be made, boundary conditions have
to be established and the consequent propagation of errors has to be considered and
evaluated).
WWTP model studies can have different purposes: (1) learning, i.e. use of simulations to
increase process understanding; (2) design, i.e. evaluate several design alternatives for
new WWTP or extension of existing ones; (3) process optimization and control, i.e.
evaluate several scenarios that might lead to improve operation and/or reduce its costs.
For the WWTP operator, simulations might be useful to indicate the consequences of
process operation modifications on the activated sludge composition and the WWTP
effluent quality.
In the simulation of an activated sludge WWTP, a number of factors have to be
considered, such as the ultimate goals of the model and the level of accuracy desired: a
38
step-wise approach is needed to move from the definition of the modeling goals to the
point where a WWTP model is ready for simulations.
5.2. BIOLOGICAL MODEL: ACTIVATED SLUDGE MODELS
One of the most widespread biological wastewater treatment techniques is the activated
sludge process. The increased knowledge about the mechanisms of different biological
processes that occur in activated sludge plants was translated into dynamics models
which describe the degradation processes. In 1982, the International Water Association
(IWA) formed a task group aiming to create a common platform that could be used for
future development of models for nitrogen-removal activated sludge processes, with a
minimum of complexity and which could give realistic results. Since then, a set of models
known as Activated Sludge Models (ASMs) has been developed. ASM1 (Henze et al.,
1987) is considered the reference model, since it triggered the general acceptance of
WWTP modeling and has been widely used. This model includes organic carbon and
nitrogen removal processes. ASM2 (Henze et al., 1995) extended the capability of ASM1
by including biological and chemical phosphorus removal processes. The ASM2d model
(Henze et al., 1999), built on the previous ASM2, added the denitrifying activity of PAOs
(phosphorus-accumulating organisms). ASM3 (Gujer et al., 2000) was intended to
become the new standard model, correcting for a number of defects of ASM1 and further
including internal storage compounds processes, which have an important role in the
metabolism of organisms.
Koch et al. (2000) concluded that ASM1 and ASM3 are both capable of describing the
dynamic behavior in common municipal WWTPs. Furthermore ASM3 performs better in
situations where the storage of readily biodegradable substrate is significant (industrial
wastewater) or in WWTPs with substantial anoxic zones. In accordance with
Vanrolleghem et al. (1999), the use of the endogenous respiration concept in the ASM3
model should allow easier comparisons between the results of kinetic parameters (derived
from respirometric batch experiments with the activated sludge of the plant to be modeled)
and the activated sludge model used to describe the phenomena in the full-scale plant.
Taking these two factors into account, as well as the characteristics of the biological
reactor considered in this thesis, the use of ASM3 model was decided upon.
A description of ASM2 and ASM2d is therefore not included since phosphorus removal is
not dealt with in this study. Also the description of ASM1 has been excluded because of
the reasons presented above. Consequently, the review presented in this chapter focuses
on the model concepts of Activated Sludge Model Nº3.
39
5.2.1 Description of the Activated sludge model Nº3 (ASM3)
ASM3 is presented in a matrix format in Appendix A.5 according to Gujer et al. (2000).
The matrix consists of 13 components and 12 process rate equations, which translate the
biological transformation of each component. Default kinetic and stoichiometric model
parameters are also presented in Table A.5.1 and presented in more detail in Table A.5.2
of Appendix A.5, respectively. Many of the basic concepts of ASM were adapted from the
activated sludge model defined by Dold (1980).
5.2.1.1 Components in ASM3
The components in the model are basically divided into COD and nitrogen compounds, as
described below. The other two components are the suspended solids (!) and the
dissolved oxygen concentration (� %), which is subject to gas exchange.
COD components
COD is selected as the most suitable parameter for defining the carbon substrates as it
provides a link between electron equivalents in the organic substrate, the biomass and the
oxygen utilized. In this model the COD is divided based on (i) solubility, (ii)
biodegradability, (iii) biodegradation rate and (iv) viability (biomass) (Petersen, 2000):
(i) The COD is divided into soluble (�) and particulate (!) components.
(ii) The COD is further subdivided into non-biodegradable and biodegradable matter. The
non-biodegradable matter is inert and its form is unaffected by the system. The inert
soluble matter (�2) leaves the system at the same concentration as it enters, by the
secondary clarifier effluent. Inert suspended matter (!2) from the wastewater influent
or produced via biomass decay becomes enmeshed in the sludge mass and
accumulates as inert VSS (volatile suspended solids). It is removed from the system
through sludge wastage.
(iii) A cell internal storage product (!� ) is considered in the model, although only as a
functional component required for modeling. The biodegradable COD is divided into
readily biodegradable substrate (�) and slowly biodegradable substrate (!). The
readily biodegradable substrate is formed by hydrolysis of particulate organic matter
entrapped in the biofloc. � is assumed to be first directly taken up by heterotrophic
organisms, storage in the form of !� and latter used for growth of new biomass.
The slowly biodegradable substrate appears in the wastewater influent as a result of
hydrolysis. It consists of complex molecules that require enzymatic breakdown prior
to absorption and utilization. It should be stressed that a fraction of ! may actually be
soluble although it is treated as a particulate material in the model (Jeppsson, 1996).
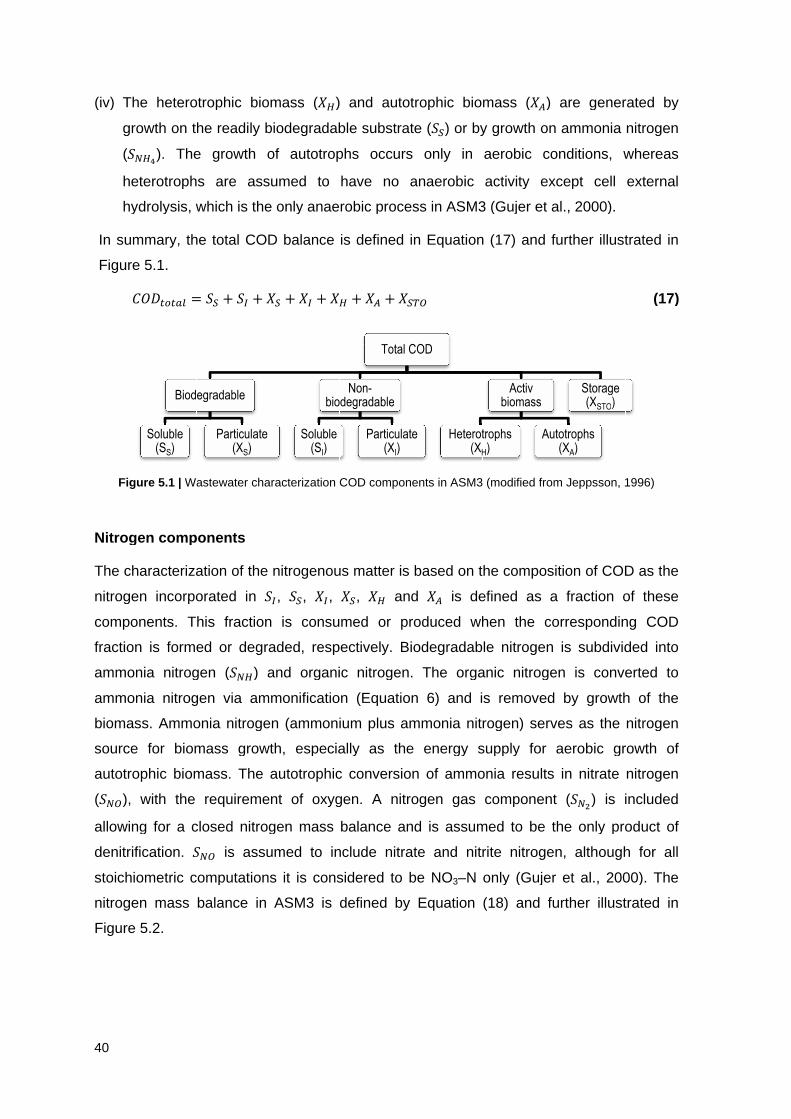
40
(iv)
In summary, the total
Figure
Nitrogen components
The characterization of the nitr
nitrogen incorporated in
components. This fraction is consumed or produced when the corresponding COD
fractio
ammonia nitrogen (
ammonia nitrogen via ammonification
biomas
source for biomass growth, especially as the energy supply for aerobic growth of
autotrophic biomass. The autotrophic conversion of ammonia results in nitrate nitrogen
(�U allowing for a closed nitrogen mass balance and is assumed to be the only product of
denitrification.
stoichiometric computations it is considered to be
nitrogen mass bala
Figure
40
(iv) The heterotrophic biomass (
growth on the readily biodegradable substrate (
(
heterotrophs are assumed to have no anaerobic act
hydrolysis, which is the only anaerobic process in ASM3 (
In summary, the total
Figure
Figure
Nitrogen components
The characterization of the nitr
nitrogen incorporated in
components. This fraction is consumed or produced when the corresponding COD
fractio
ammonia nitrogen (
ammonia nitrogen via ammonification
biomas
source for biomass growth, especially as the energy supply for aerobic growth of
autotrophic biomass. The autotrophic conversion of ammonia results in nitrate nitrogen
U )
allowing for a closed nitrogen mass balance and is assumed to be the only product of
denitrification.
stoichiometric computations it is considered to be
nitrogen mass bala
Figure
The heterotrophic biomass (
growth on the readily biodegradable substrate (
(�U�heterotrophs are assumed to have no anaerobic act
hydrolysis, which is the only anaerobic process in ASM3 (
In summary, the total
Figure
.#"
Figure
Nitrogen components
The characterization of the nitr
nitrogen incorporated in
components. This fraction is consumed or produced when the corresponding COD
fraction is formed or degraded, respectively. B
ammonia nitrogen (
ammonia nitrogen via ammonification
biomass. Ammonia nitrogen (ammonium plus ammonia nitrogen) serves as the nit
source for biomass growth, especially as the energy supply for aerobic growth of
autotrophic biomass. The autotrophic conversion of ammonia results in nitrate nitrogen
), with the requirement of oxygen.
allowing for a closed nitrogen mass balance and is assumed to be the only product of
denitrification.
stoichiometric computations it is considered to be
nitrogen mass bala
Figure 5
The heterotrophic biomass (
growth on the readily biodegradable substrate (
U��). The growth of autotrophs occurs only in aerobic conditions, whereas
heterotrophs are assumed to have no anaerobic act
hydrolysis, which is the only anaerobic process in ASM3 (
In summary, the total
Figure 5.1
.#"TOT�N
Figure 5
Nitrogen components
The characterization of the nitr
nitrogen incorporated in
components. This fraction is consumed or produced when the corresponding COD
n is formed or degraded, respectively. B
ammonia nitrogen (
ammonia nitrogen via ammonification
s. Ammonia nitrogen (ammonium plus ammonia nitrogen) serves as the nit
source for biomass growth, especially as the energy supply for aerobic growth of
autotrophic biomass. The autotrophic conversion of ammonia results in nitrate nitrogen
, with the requirement of oxygen.
allowing for a closed nitrogen mass balance and is assumed to be the only product of
denitrification.
stoichiometric computations it is considered to be
nitrogen mass bala
5.2.
Soluble (S
The heterotrophic biomass (
growth on the readily biodegradable substrate (
). The growth of autotrophs occurs only in aerobic conditions, whereas
heterotrophs are assumed to have no anaerobic act
hydrolysis, which is the only anaerobic process in ASM3 (
In summary, the total
1.
TOT�N
5.1 |
Nitrogen components
The characterization of the nitr
nitrogen incorporated in
components. This fraction is consumed or produced when the corresponding COD
n is formed or degraded, respectively. B
ammonia nitrogen (
ammonia nitrogen via ammonification
s. Ammonia nitrogen (ammonium plus ammonia nitrogen) serves as the nit
source for biomass growth, especially as the energy supply for aerobic growth of
autotrophic biomass. The autotrophic conversion of ammonia results in nitrate nitrogen
, with the requirement of oxygen.
allowing for a closed nitrogen mass balance and is assumed to be the only product of
denitrification.
stoichiometric computations it is considered to be
nitrogen mass bala
.
Biodegradable
Soluble (SS)
The heterotrophic biomass (
growth on the readily biodegradable substrate (
). The growth of autotrophs occurs only in aerobic conditions, whereas
heterotrophs are assumed to have no anaerobic act
hydrolysis, which is the only anaerobic process in ASM3 (
In summary, the total
TOT�N =
| Wastewater characterization COD components i
Nitrogen components
The characterization of the nitr
nitrogen incorporated in
components. This fraction is consumed or produced when the corresponding COD
n is formed or degraded, respectively. B
ammonia nitrogen (
ammonia nitrogen via ammonification
s. Ammonia nitrogen (ammonium plus ammonia nitrogen) serves as the nit
source for biomass growth, especially as the energy supply for aerobic growth of
autotrophic biomass. The autotrophic conversion of ammonia results in nitrate nitrogen
, with the requirement of oxygen.
allowing for a closed nitrogen mass balance and is assumed to be the only product of
denitrification. �stoichiometric computations it is considered to be
nitrogen mass bala
Biodegradable
Soluble
The heterotrophic biomass (
growth on the readily biodegradable substrate (
). The growth of autotrophs occurs only in aerobic conditions, whereas
heterotrophs are assumed to have no anaerobic act
hydrolysis, which is the only anaerobic process in ASM3 (
In summary, the total
= �
Wastewater characterization COD components i
Nitrogen components
The characterization of the nitr
nitrogen incorporated in
components. This fraction is consumed or produced when the corresponding COD
n is formed or degraded, respectively. B
ammonia nitrogen (
ammonia nitrogen via ammonification
s. Ammonia nitrogen (ammonium plus ammonia nitrogen) serves as the nit
source for biomass growth, especially as the energy supply for aerobic growth of
autotrophic biomass. The autotrophic conversion of ammonia results in nitrate nitrogen
, with the requirement of oxygen.
allowing for a closed nitrogen mass balance and is assumed to be the only product of �U stoichiometric computations it is considered to be
nitrogen mass bala
Biodegradable
The heterotrophic biomass (
growth on the readily biodegradable substrate (
). The growth of autotrophs occurs only in aerobic conditions, whereas
heterotrophs are assumed to have no anaerobic act
hydrolysis, which is the only anaerobic process in ASM3 (
In summary, the total
+
Wastewater characterization COD components i
Nitrogen components
The characterization of the nitr
nitrogen incorporated in
components. This fraction is consumed or produced when the corresponding COD
n is formed or degraded, respectively. B
ammonia nitrogen (�ammonia nitrogen via ammonification
s. Ammonia nitrogen (ammonium plus ammonia nitrogen) serves as the nit
source for biomass growth, especially as the energy supply for aerobic growth of
autotrophic biomass. The autotrophic conversion of ammonia results in nitrate nitrogen
, with the requirement of oxygen.
allowing for a closed nitrogen mass balance and is assumed to be the only product of
U is assumed to include nitrate and nitrite nitrogen, althoug
stoichiometric computations it is considered to be
nitrogen mass balance i
Biodegradable
Particulate (X
The heterotrophic biomass (
growth on the readily biodegradable substrate (
). The growth of autotrophs occurs only in aerobic conditions, whereas
heterotrophs are assumed to have no anaerobic act
hydrolysis, which is the only anaerobic process in ASM3 (
In summary, the total COD balance is defined in Equation
+ �2
Wastewater characterization COD components i
Nitrogen components
The characterization of the nitr
nitrogen incorporated in
components. This fraction is consumed or produced when the corresponding COD
n is formed or degraded, respectively. B�U�ammonia nitrogen via ammonification
s. Ammonia nitrogen (ammonium plus ammonia nitrogen) serves as the nit
source for biomass growth, especially as the energy supply for aerobic growth of
autotrophic biomass. The autotrophic conversion of ammonia results in nitrate nitrogen
, with the requirement of oxygen.
allowing for a closed nitrogen mass balance and is assumed to be the only product of
is assumed to include nitrate and nitrite nitrogen, althoug
stoichiometric computations it is considered to be
nce i
Biodegradable
Particulate (XS)
The heterotrophic biomass (
growth on the readily biodegradable substrate (
). The growth of autotrophs occurs only in aerobic conditions, whereas
heterotrophs are assumed to have no anaerobic act
hydrolysis, which is the only anaerobic process in ASM3 (
COD balance is defined in Equation
+ !
Wastewater characterization COD components i
The characterization of the nitr
nitrogen incorporated in �components. This fraction is consumed or produced when the corresponding COD
n is formed or degraded, respectively. B
U�) and organic nitrogen. The organic nitrogen is converted to
ammonia nitrogen via ammonification
s. Ammonia nitrogen (ammonium plus ammonia nitrogen) serves as the nit
source for biomass growth, especially as the energy supply for aerobic growth of
autotrophic biomass. The autotrophic conversion of ammonia results in nitrate nitrogen
, with the requirement of oxygen.
allowing for a closed nitrogen mass balance and is assumed to be the only product of
is assumed to include nitrate and nitrite nitrogen, althoug
stoichiometric computations it is considered to be
nce in ASM3 is defined by Equation
Particulate )
The heterotrophic biomass (
growth on the readily biodegradable substrate (
). The growth of autotrophs occurs only in aerobic conditions, whereas
heterotrophs are assumed to have no anaerobic act
hydrolysis, which is the only anaerobic process in ASM3 (
COD balance is defined in Equation
! +
Wastewater characterization COD components i
The characterization of the nitr�2, components. This fraction is consumed or produced when the corresponding COD
n is formed or degraded, respectively. B
) and organic nitrogen. The organic nitrogen is converted to
ammonia nitrogen via ammonification
s. Ammonia nitrogen (ammonium plus ammonia nitrogen) serves as the nit
source for biomass growth, especially as the energy supply for aerobic growth of
autotrophic biomass. The autotrophic conversion of ammonia results in nitrate nitrogen
, with the requirement of oxygen.
allowing for a closed nitrogen mass balance and is assumed to be the only product of
is assumed to include nitrate and nitrite nitrogen, althoug
stoichiometric computations it is considered to be
n ASM3 is defined by Equation
Particulate
The heterotrophic biomass (
growth on the readily biodegradable substrate (
). The growth of autotrophs occurs only in aerobic conditions, whereas
heterotrophs are assumed to have no anaerobic act
hydrolysis, which is the only anaerobic process in ASM3 (
COD balance is defined in Equation
+ !
Wastewater characterization COD components i
The characterization of the nitrogenous matter is based on the composition of COD as t
, �,
components. This fraction is consumed or produced when the corresponding COD
n is formed or degraded, respectively. B
) and organic nitrogen. The organic nitrogen is converted to
ammonia nitrogen via ammonification
s. Ammonia nitrogen (ammonium plus ammonia nitrogen) serves as the nit
source for biomass growth, especially as the energy supply for aerobic growth of
autotrophic biomass. The autotrophic conversion of ammonia results in nitrate nitrogen
, with the requirement of oxygen.
allowing for a closed nitrogen mass balance and is assumed to be the only product of
is assumed to include nitrate and nitrite nitrogen, althoug
stoichiometric computations it is considered to be
n ASM3 is defined by Equation
Soluble
The heterotrophic biomass (!growth on the readily biodegradable substrate (
). The growth of autotrophs occurs only in aerobic conditions, whereas
heterotrophs are assumed to have no anaerobic act
hydrolysis, which is the only anaerobic process in ASM3 (
COD balance is defined in Equation
!2 +
Wastewater characterization COD components i
ogenous matter is based on the composition of COD as t
, !components. This fraction is consumed or produced when the corresponding COD
n is formed or degraded, respectively. B
) and organic nitrogen. The organic nitrogen is converted to
ammonia nitrogen via ammonification
s. Ammonia nitrogen (ammonium plus ammonia nitrogen) serves as the nit
source for biomass growth, especially as the energy supply for aerobic growth of
autotrophic biomass. The autotrophic conversion of ammonia results in nitrate nitrogen
, with the requirement of oxygen.
allowing for a closed nitrogen mass balance and is assumed to be the only product of
is assumed to include nitrate and nitrite nitrogen, althoug
stoichiometric computations it is considered to be
n ASM3 is defined by Equation
Soluble (SI
!�) and autotrophic bi
growth on the readily biodegradable substrate (
). The growth of autotrophs occurs only in aerobic conditions, whereas
heterotrophs are assumed to have no anaerobic act
hydrolysis, which is the only anaerobic process in ASM3 (
COD balance is defined in Equation
+ !�
Wastewater characterization COD components i
ogenous matter is based on the composition of COD as t!2, components. This fraction is consumed or produced when the corresponding COD
n is formed or degraded, respectively. B
) and organic nitrogen. The organic nitrogen is converted to
ammonia nitrogen via ammonification
s. Ammonia nitrogen (ammonium plus ammonia nitrogen) serves as the nit
source for biomass growth, especially as the energy supply for aerobic growth of
autotrophic biomass. The autotrophic conversion of ammonia results in nitrate nitrogen
, with the requirement of oxygen.
allowing for a closed nitrogen mass balance and is assumed to be the only product of
is assumed to include nitrate and nitrite nitrogen, althoug
stoichiometric computations it is considered to be
n ASM3 is defined by Equation
biodegradable
Soluble
I)
) and autotrophic bi
growth on the readily biodegradable substrate (
). The growth of autotrophs occurs only in aerobic conditions, whereas
heterotrophs are assumed to have no anaerobic act
hydrolysis, which is the only anaerobic process in ASM3 (
COD balance is defined in Equation
!� +
Wastewater characterization COD components i
ogenous matter is based on the composition of COD as t
, !,
components. This fraction is consumed or produced when the corresponding COD
n is formed or degraded, respectively. B
) and organic nitrogen. The organic nitrogen is converted to
ammonia nitrogen via ammonification (Equation 6)
s. Ammonia nitrogen (ammonium plus ammonia nitrogen) serves as the nit
source for biomass growth, especially as the energy supply for aerobic growth of
autotrophic biomass. The autotrophic conversion of ammonia results in nitrate nitrogen
, with the requirement of oxygen.
allowing for a closed nitrogen mass balance and is assumed to be the only product of
is assumed to include nitrate and nitrite nitrogen, althoug
stoichiometric computations it is considered to be
n ASM3 is defined by Equation
Nonbiodegradable
Soluble
) and autotrophic bi
growth on the readily biodegradable substrate (
). The growth of autotrophs occurs only in aerobic conditions, whereas
heterotrophs are assumed to have no anaerobic act
hydrolysis, which is the only anaerobic process in ASM3 (
COD balance is defined in Equation
+ !�
Wastewater characterization COD components i
ogenous matter is based on the composition of COD as t
, !components. This fraction is consumed or produced when the corresponding COD
n is formed or degraded, respectively. B
) and organic nitrogen. The organic nitrogen is converted to
(Equation 6)
s. Ammonia nitrogen (ammonium plus ammonia nitrogen) serves as the nit
source for biomass growth, especially as the energy supply for aerobic growth of
autotrophic biomass. The autotrophic conversion of ammonia results in nitrate nitrogen
, with the requirement of oxygen. A nitrogen gas component (
allowing for a closed nitrogen mass balance and is assumed to be the only product of
is assumed to include nitrate and nitrite nitrogen, althoug
stoichiometric computations it is considered to be
n ASM3 is defined by Equation
Non-biodegradable
Particulate
) and autotrophic bi
growth on the readily biodegradable substrate (
). The growth of autotrophs occurs only in aerobic conditions, whereas
heterotrophs are assumed to have no anaerobic act
hydrolysis, which is the only anaerobic process in ASM3 (
COD balance is defined in Equation
� +
Wastewater characterization COD components i
ogenous matter is based on the composition of COD as t!�
components. This fraction is consumed or produced when the corresponding COD
n is formed or degraded, respectively. B
) and organic nitrogen. The organic nitrogen is converted to
(Equation 6)
s. Ammonia nitrogen (ammonium plus ammonia nitrogen) serves as the nit
source for biomass growth, especially as the energy supply for aerobic growth of
autotrophic biomass. The autotrophic conversion of ammonia results in nitrate nitrogen
A nitrogen gas component (
allowing for a closed nitrogen mass balance and is assumed to be the only product of
is assumed to include nitrate and nitrite nitrogen, althoug
stoichiometric computations it is considered to be
n ASM3 is defined by Equation
Total COD
biodegradable
Particulate (X
) and autotrophic bi
growth on the readily biodegradable substrate (
). The growth of autotrophs occurs only in aerobic conditions, whereas
heterotrophs are assumed to have no anaerobic act
hydrolysis, which is the only anaerobic process in ASM3 (
COD balance is defined in Equation
+ !�
Wastewater characterization COD components i
ogenous matter is based on the composition of COD as t
and
components. This fraction is consumed or produced when the corresponding COD
n is formed or degraded, respectively. Biodegradable nitrogen is subdivided into
) and organic nitrogen. The organic nitrogen is converted to
(Equation 6)
s. Ammonia nitrogen (ammonium plus ammonia nitrogen) serves as the nit
source for biomass growth, especially as the energy supply for aerobic growth of
autotrophic biomass. The autotrophic conversion of ammonia results in nitrate nitrogen
A nitrogen gas component (
allowing for a closed nitrogen mass balance and is assumed to be the only product of
is assumed to include nitrate and nitrite nitrogen, althoug
stoichiometric computations it is considered to be
n ASM3 is defined by Equation
Total COD
biodegradable
Particulate (XI)
) and autotrophic bi
growth on the readily biodegradable substrate (
). The growth of autotrophs occurs only in aerobic conditions, whereas
heterotrophs are assumed to have no anaerobic act
hydrolysis, which is the only anaerobic process in ASM3 (
COD balance is defined in Equation
�
Wastewater characterization COD components i
ogenous matter is based on the composition of COD as t
and !components. This fraction is consumed or produced when the corresponding COD
iodegradable nitrogen is subdivided into
) and organic nitrogen. The organic nitrogen is converted to
(Equation 6)
s. Ammonia nitrogen (ammonium plus ammonia nitrogen) serves as the nit
source for biomass growth, especially as the energy supply for aerobic growth of
autotrophic biomass. The autotrophic conversion of ammonia results in nitrate nitrogen
A nitrogen gas component (
allowing for a closed nitrogen mass balance and is assumed to be the only product of
is assumed to include nitrate and nitrite nitrogen, althoug
stoichiometric computations it is considered to be
n ASM3 is defined by Equation
Total COD
Particulate
) and autotrophic bi
growth on the readily biodegradable substrate (�) or by growth on ammonia nitrogen
). The growth of autotrophs occurs only in aerobic conditions, whereas
heterotrophs are assumed to have no anaerobic act
hydrolysis, which is the only anaerobic process in ASM3 (
COD balance is defined in Equation
Wastewater characterization COD components in ASM3 (modified from Jeppsson,
ogenous matter is based on the composition of COD as t!�
components. This fraction is consumed or produced when the corresponding COD
iodegradable nitrogen is subdivided into
) and organic nitrogen. The organic nitrogen is converted to
(Equation 6)
s. Ammonia nitrogen (ammonium plus ammonia nitrogen) serves as the nit
source for biomass growth, especially as the energy supply for aerobic growth of
autotrophic biomass. The autotrophic conversion of ammonia results in nitrate nitrogen
A nitrogen gas component (
allowing for a closed nitrogen mass balance and is assumed to be the only product of
is assumed to include nitrate and nitrite nitrogen, althoug
stoichiometric computations it is considered to be NO
n ASM3 is defined by Equation
Total COD
) and autotrophic bi
) or by growth on ammonia nitrogen
). The growth of autotrophs occurs only in aerobic conditions, whereas
heterotrophs are assumed to have no anaerobic act
hydrolysis, which is the only anaerobic process in ASM3 (
COD balance is defined in Equation
n ASM3 (modified from Jeppsson,
ogenous matter is based on the composition of COD as t
is defined as a fraction of these
components. This fraction is consumed or produced when the corresponding COD
iodegradable nitrogen is subdivided into
) and organic nitrogen. The organic nitrogen is converted to
and is removed by growth of the
s. Ammonia nitrogen (ammonium plus ammonia nitrogen) serves as the nit
source for biomass growth, especially as the energy supply for aerobic growth of
autotrophic biomass. The autotrophic conversion of ammonia results in nitrate nitrogen
A nitrogen gas component (
allowing for a closed nitrogen mass balance and is assumed to be the only product of
is assumed to include nitrate and nitrite nitrogen, althoug
NO3–
n ASM3 is defined by Equation
Heterotrophs
) and autotrophic biomass (
) or by growth on ammonia nitrogen
). The growth of autotrophs occurs only in aerobic conditions, whereas
heterotrophs are assumed to have no anaerobic act
hydrolysis, which is the only anaerobic process in ASM3 (
COD balance is defined in Equation
n ASM3 (modified from Jeppsson,
ogenous matter is based on the composition of COD as t
is defined as a fraction of these
components. This fraction is consumed or produced when the corresponding COD
iodegradable nitrogen is subdivided into
) and organic nitrogen. The organic nitrogen is converted to
and is removed by growth of the
s. Ammonia nitrogen (ammonium plus ammonia nitrogen) serves as the nit
source for biomass growth, especially as the energy supply for aerobic growth of
autotrophic biomass. The autotrophic conversion of ammonia results in nitrate nitrogen
A nitrogen gas component (
allowing for a closed nitrogen mass balance and is assumed to be the only product of
is assumed to include nitrate and nitrite nitrogen, althoug
–N
n ASM3 is defined by Equation (
Heterotrophs (XH
omass (
) or by growth on ammonia nitrogen
). The growth of autotrophs occurs only in aerobic conditions, whereas
heterotrophs are assumed to have no anaerobic act
hydrolysis, which is the only anaerobic process in ASM3 (Gujer
COD balance is defined in Equation (17
n ASM3 (modified from Jeppsson,
ogenous matter is based on the composition of COD as t
is defined as a fraction of these
components. This fraction is consumed or produced when the corresponding COD
iodegradable nitrogen is subdivided into
) and organic nitrogen. The organic nitrogen is converted to
and is removed by growth of the
s. Ammonia nitrogen (ammonium plus ammonia nitrogen) serves as the nit
source for biomass growth, especially as the energy supply for aerobic growth of
autotrophic biomass. The autotrophic conversion of ammonia results in nitrate nitrogen
A nitrogen gas component (
allowing for a closed nitrogen mass balance and is assumed to be the only product of
is assumed to include nitrate and nitrite nitrogen, althoug
N only (Gujer
(18
Heterotrophs
H)
omass (
) or by growth on ammonia nitrogen
). The growth of autotrophs occurs only in aerobic conditions, whereas
heterotrophs are assumed to have no anaerobic activity except cell external
Gujer
17)
n ASM3 (modified from Jeppsson,
ogenous matter is based on the composition of COD as t
is defined as a fraction of these
components. This fraction is consumed or produced when the corresponding COD
iodegradable nitrogen is subdivided into
) and organic nitrogen. The organic nitrogen is converted to
and is removed by growth of the
s. Ammonia nitrogen (ammonium plus ammonia nitrogen) serves as the nit
source for biomass growth, especially as the energy supply for aerobic growth of
autotrophic biomass. The autotrophic conversion of ammonia results in nitrate nitrogen
A nitrogen gas component (
allowing for a closed nitrogen mass balance and is assumed to be the only product of
is assumed to include nitrate and nitrite nitrogen, althoug
only (Gujer
18) and further illustrated in
Activ biomass
Heterotrophs
omass (!) or by growth on ammonia nitrogen
). The growth of autotrophs occurs only in aerobic conditions, whereas
ivity except cell external
Gujer et al.
and further illustrated in
n ASM3 (modified from Jeppsson,
ogenous matter is based on the composition of COD as t
is defined as a fraction of these
components. This fraction is consumed or produced when the corresponding COD
iodegradable nitrogen is subdivided into
) and organic nitrogen. The organic nitrogen is converted to
and is removed by growth of the
s. Ammonia nitrogen (ammonium plus ammonia nitrogen) serves as the nit
source for biomass growth, especially as the energy supply for aerobic growth of
autotrophic biomass. The autotrophic conversion of ammonia results in nitrate nitrogen
A nitrogen gas component (
allowing for a closed nitrogen mass balance and is assumed to be the only product of
is assumed to include nitrate and nitrite nitrogen, althoug
only (Gujer
and further illustrated in
Activ biomass
!�) are generated by
) or by growth on ammonia nitrogen
). The growth of autotrophs occurs only in aerobic conditions, whereas
ivity except cell external
et al.
and further illustrated in
n ASM3 (modified from Jeppsson,
ogenous matter is based on the composition of COD as t
is defined as a fraction of these
components. This fraction is consumed or produced when the corresponding COD
iodegradable nitrogen is subdivided into
) and organic nitrogen. The organic nitrogen is converted to
and is removed by growth of the
s. Ammonia nitrogen (ammonium plus ammonia nitrogen) serves as the nit
source for biomass growth, especially as the energy supply for aerobic growth of
autotrophic biomass. The autotrophic conversion of ammonia results in nitrate nitrogen
A nitrogen gas component (
allowing for a closed nitrogen mass balance and is assumed to be the only product of
is assumed to include nitrate and nitrite nitrogen, althoug
only (Gujer
and further illustrated in
biomass
Autotrophs
) are generated by
) or by growth on ammonia nitrogen
). The growth of autotrophs occurs only in aerobic conditions, whereas
ivity except cell external
et al.,
and further illustrated in
n ASM3 (modified from Jeppsson,
ogenous matter is based on the composition of COD as t
is defined as a fraction of these
components. This fraction is consumed or produced when the corresponding COD
iodegradable nitrogen is subdivided into
) and organic nitrogen. The organic nitrogen is converted to
and is removed by growth of the
s. Ammonia nitrogen (ammonium plus ammonia nitrogen) serves as the nit
source for biomass growth, especially as the energy supply for aerobic growth of
autotrophic biomass. The autotrophic conversion of ammonia results in nitrate nitrogen
A nitrogen gas component (�allowing for a closed nitrogen mass balance and is assumed to be the only product of
is assumed to include nitrate and nitrite nitrogen, althoug
only (Gujer et al.
and further illustrated in
Autotrophs (XA
) are generated by
) or by growth on ammonia nitrogen
). The growth of autotrophs occurs only in aerobic conditions, whereas
ivity except cell external
, 2000
and further illustrated in
n ASM3 (modified from Jeppsson,
ogenous matter is based on the composition of COD as t
is defined as a fraction of these
components. This fraction is consumed or produced when the corresponding COD
iodegradable nitrogen is subdivided into
) and organic nitrogen. The organic nitrogen is converted to
and is removed by growth of the
s. Ammonia nitrogen (ammonium plus ammonia nitrogen) serves as the nit
source for biomass growth, especially as the energy supply for aerobic growth of
autotrophic biomass. The autotrophic conversion of ammonia results in nitrate nitrogen �U%allowing for a closed nitrogen mass balance and is assumed to be the only product of
is assumed to include nitrate and nitrite nitrogen, althoug
et al.
and further illustrated in
Autotrophs
A)
Storage (X
) are generated by
) or by growth on ammonia nitrogen
). The growth of autotrophs occurs only in aerobic conditions, whereas
ivity except cell external
2000).
and further illustrated in
n ASM3 (modified from Jeppsson,
ogenous matter is based on the composition of COD as t
is defined as a fraction of these
components. This fraction is consumed or produced when the corresponding COD
iodegradable nitrogen is subdivided into
) and organic nitrogen. The organic nitrogen is converted to
and is removed by growth of the
s. Ammonia nitrogen (ammonium plus ammonia nitrogen) serves as the nit
source for biomass growth, especially as the energy supply for aerobic growth of
autotrophic biomass. The autotrophic conversion of ammonia results in nitrate nitrogen
%) is included
allowing for a closed nitrogen mass balance and is assumed to be the only product of
is assumed to include nitrate and nitrite nitrogen, althoug
et al., 2000
and further illustrated in
Autotrophs
Storage (XSTO
) are generated by
) or by growth on ammonia nitrogen
). The growth of autotrophs occurs only in aerobic conditions, whereas
ivity except cell external
).
and further illustrated in
n ASM3 (modified from Jeppsson, 1996)
ogenous matter is based on the composition of COD as t
is defined as a fraction of these
components. This fraction is consumed or produced when the corresponding COD
iodegradable nitrogen is subdivided into
) and organic nitrogen. The organic nitrogen is converted to
and is removed by growth of the
s. Ammonia nitrogen (ammonium plus ammonia nitrogen) serves as the nit
source for biomass growth, especially as the energy supply for aerobic growth of
autotrophic biomass. The autotrophic conversion of ammonia results in nitrate nitrogen
) is included
allowing for a closed nitrogen mass balance and is assumed to be the only product of
is assumed to include nitrate and nitrite nitrogen, although for all
2000
and further illustrated in
Storage
STO)
) are generated by
) or by growth on ammonia nitrogen
). The growth of autotrophs occurs only in aerobic conditions, whereas
ivity except cell external
and further illustrated in
1996)
ogenous matter is based on the composition of COD as t
is defined as a fraction of these
components. This fraction is consumed or produced when the corresponding COD
iodegradable nitrogen is subdivided into
) and organic nitrogen. The organic nitrogen is converted to
and is removed by growth of the
s. Ammonia nitrogen (ammonium plus ammonia nitrogen) serves as the nitrogen
source for biomass growth, especially as the energy supply for aerobic growth of
autotrophic biomass. The autotrophic conversion of ammonia results in nitrate nitrogen
) is included
allowing for a closed nitrogen mass balance and is assumed to be the only product of
h for all
2000).
and further illustrated in
) are generated by
) or by growth on ammonia nitrogen
). The growth of autotrophs occurs only in aerobic conditions, whereas
ivity except cell external
and further illustrated in
(17)
1996)
ogenous matter is based on the composition of COD as t
is defined as a fraction of these
components. This fraction is consumed or produced when the corresponding COD
iodegradable nitrogen is subdivided into
) and organic nitrogen. The organic nitrogen is converted to
and is removed by growth of the
rogen
source for biomass growth, especially as the energy supply for aerobic growth of
autotrophic biomass. The autotrophic conversion of ammonia results in nitrate nitrogen
) is included
allowing for a closed nitrogen mass balance and is assumed to be the only product of
h for all
). The
and further illustrated in
) are generated by
) or by growth on ammonia nitrogen
). The growth of autotrophs occurs only in aerobic conditions, whereas
ivity except cell external
and further illustrated in
(17)
ogenous matter is based on the composition of COD as the
is defined as a fraction of these
components. This fraction is consumed or produced when the corresponding COD
iodegradable nitrogen is subdivided into
) and organic nitrogen. The organic nitrogen is converted to
and is removed by growth of the
rogen
source for biomass growth, especially as the energy supply for aerobic growth of
autotrophic biomass. The autotrophic conversion of ammonia results in nitrate nitrogen
) is included
allowing for a closed nitrogen mass balance and is assumed to be the only product of
h for all
The
and further illustrated in
) are generated by
) or by growth on ammonia nitrogen
). The growth of autotrophs occurs only in aerobic conditions, whereas
ivity except cell external
he
is defined as a fraction of these
components. This fraction is consumed or produced when the corresponding COD
iodegradable nitrogen is subdivided into
) and organic nitrogen. The organic nitrogen is converted to
and is removed by growth of the
rogen
source for biomass growth, especially as the energy supply for aerobic growth of
autotrophic biomass. The autotrophic conversion of ammonia results in nitrate nitrogen
) is included
allowing for a closed nitrogen mass balance and is assumed to be the only product of
h for all
The
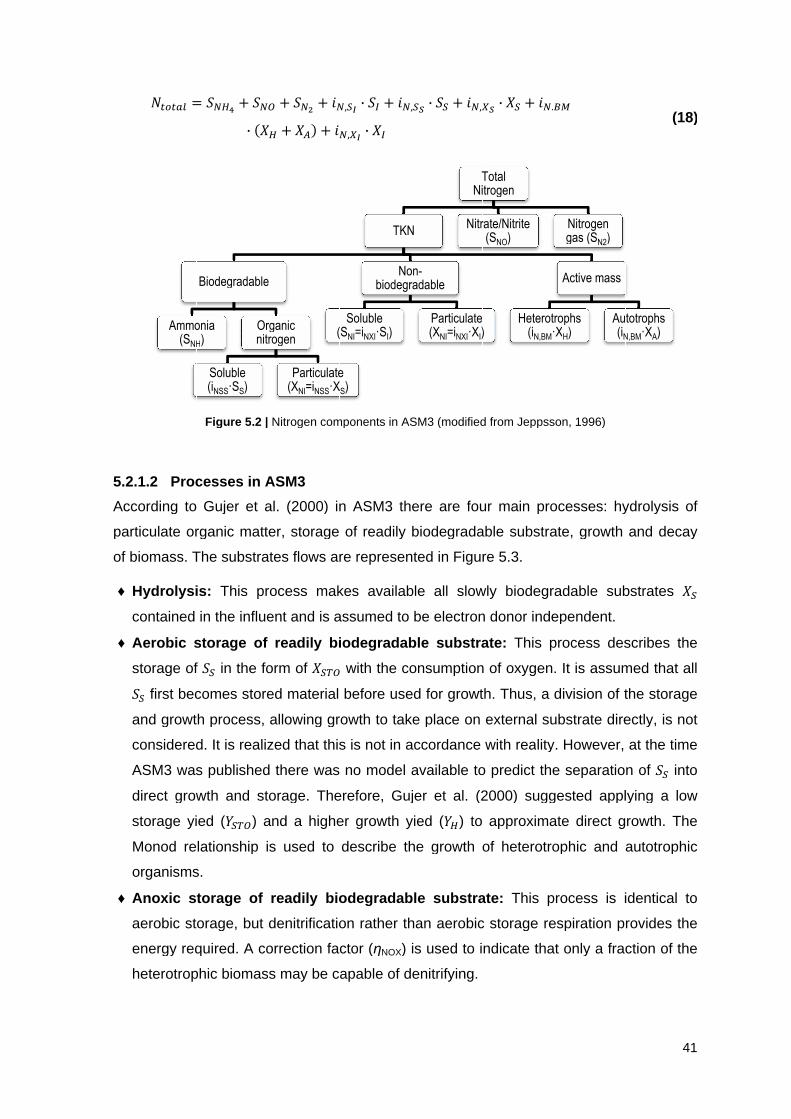
5.2.1.2
According to Gujer
particulate organic matter, storage of readily biodegradable substrate, growth and decay
of biomass. The substrates flows are
♦
♦
♦
5.2.1.2
According to Gujer
particulate organic matter, storage of readily biodegradable substrate, growth and decay
of biomass. The substrates flows are
♦ Hydrolysis:
contained in the influent and is assumed to be electron donor independent.
♦ Aerobic storage of readily biodegradable substrate:
storage�and growth process, allowing growth to take place on external substrate directly, is not
considered. It is realized that this is not in accordance with rea
ASM3 was published there was no model available to predict the separation of
direct growth and storage. Therefore, Gujer
storage yied (
Monod relationship is used to describe the growth of heterotrophic and autotrophic
organisms.
♦ Anoxic storage of readily biodegradable substrate:
aerobic storage, but denitrification rathe
energy required. A correction factor (
heterotrophic biomass may be capable of denitrifying.
bTOT�N
5.2.1.2
According to Gujer
particulate organic matter, storage of readily biodegradable substrate, growth and decay
of biomass. The substrates flows are
Hydrolysis:
contained in the influent and is assumed to be electron donor independent.
Aerobic storage of readily biodegradable substrate:
storage
first
and growth process, allowing growth to take place on external substrate directly, is not
considered. It is realized that this is not in accordance with rea
ASM3 was published there was no model available to predict the separation of
direct growth and storage. Therefore, Gujer
storage yied (
Monod relationship is used to describe the growth of heterotrophic and autotrophic
organisms.
Anoxic storage of readily biodegradable substrate:
aerobic storage, but denitrification rathe
energy required. A correction factor (
heterotrophic biomass may be capable of denitrifying.
bTOT�N
Processes in ASM3
According to Gujer
particulate organic matter, storage of readily biodegradable substrate, growth and decay
of biomass. The substrates flows are
Hydrolysis:
contained in the influent and is assumed to be electron donor independent.
Aerobic storage of readily biodegradable substrate:
storage
first becomes stored material before used for growth. Thus, a division of the storage
and growth process, allowing growth to take place on external substrate directly, is not
considered. It is realized that this is not in accordance with rea
ASM3 was published there was no model available to predict the separation of
direct growth and storage. Therefore, Gujer
storage yied (
Monod relationship is used to describe the growth of heterotrophic and autotrophic
organisms.
Anoxic storage of readily biodegradable substrate:
aerobic storage, but denitrification rathe
energy required. A correction factor (
heterotrophic biomass may be capable of denitrifying.
Ammonia
TOT�N =
Processes in ASM3
According to Gujer
particulate organic matter, storage of readily biodegradable substrate, growth and decay
of biomass. The substrates flows are
Hydrolysis:
contained in the influent and is assumed to be electron donor independent.
Aerobic storage of readily biodegradable substrate:
storage of
becomes stored material before used for growth. Thus, a division of the storage
and growth process, allowing growth to take place on external substrate directly, is not
considered. It is realized that this is not in accordance with rea
ASM3 was published there was no model available to predict the separation of
direct growth and storage. Therefore, Gujer
storage yied (
Monod relationship is used to describe the growth of heterotrophic and autotrophic
organisms.
Anoxic storage of readily biodegradable substrate:
aerobic storage, but denitrification rathe
energy required. A correction factor (
heterotrophic biomass may be capable of denitrifying.
Ammonia (SNH
= �U�
Figure
Processes in ASM3
According to Gujer
particulate organic matter, storage of readily biodegradable substrate, growth and decay
of biomass. The substrates flows are
Hydrolysis:
contained in the influent and is assumed to be electron donor independent.
Aerobic storage of readily biodegradable substrate:
of �becomes stored material before used for growth. Thus, a division of the storage
and growth process, allowing growth to take place on external substrate directly, is not
considered. It is realized that this is not in accordance with rea
ASM3 was published there was no model available to predict the separation of
direct growth and storage. Therefore, Gujer
storage yied (
Monod relationship is used to describe the growth of heterotrophic and autotrophic
organisms.
Anoxic storage of readily biodegradable substrate:
aerobic storage, but denitrification rathe
energy required. A correction factor (
heterotrophic biomass may be capable of denitrifying.
Biodegradable
Ammonia
NH)
Soluble (iNSS
U��
Figure
Processes in ASM3
According to Gujer
particulate organic matter, storage of readily biodegradable substrate, growth and decay
of biomass. The substrates flows are
This process makes available all slowly biodegradable substrates
contained in the influent and is assumed to be electron donor independent.
Aerobic storage of readily biodegradable substrate:
in the form of
becomes stored material before used for growth. Thus, a division of the storage
and growth process, allowing growth to take place on external substrate directly, is not
considered. It is realized that this is not in accordance with rea
ASM3 was published there was no model available to predict the separation of
direct growth and storage. Therefore, Gujer
storage yied (�� Monod relationship is used to describe the growth of heterotrophic and autotrophic
Anoxic storage of readily biodegradable substrate:
aerobic storage, but denitrification rathe
energy required. A correction factor (
heterotrophic biomass may be capable of denitrifying.
Biodegradable
Ammonia
Soluble
NSS�S
� +·
Figure 5
Processes in ASM3
According to Gujer et al.
particulate organic matter, storage of readily biodegradable substrate, growth and decay
of biomass. The substrates flows are
This process makes available all slowly biodegradable substrates
contained in the influent and is assumed to be electron donor independent.
Aerobic storage of readily biodegradable substrate:
in the form of
becomes stored material before used for growth. Thus, a division of the storage
and growth process, allowing growth to take place on external substrate directly, is not
considered. It is realized that this is not in accordance with rea
ASM3 was published there was no model available to predict the separation of
direct growth and storage. Therefore, Gujer
��
Monod relationship is used to describe the growth of heterotrophic and autotrophic
Anoxic storage of readily biodegradable substrate:
aerobic storage, but denitrification rathe
energy required. A correction factor (
heterotrophic biomass may be capable of denitrifying.
Biodegradable
Soluble �SS)
�U
· ?!
5.2 |
Processes in ASM3
et al.
particulate organic matter, storage of readily biodegradable substrate, growth and decay
of biomass. The substrates flows are
This process makes available all slowly biodegradable substrates
contained in the influent and is assumed to be electron donor independent.
Aerobic storage of readily biodegradable substrate:
in the form of
becomes stored material before used for growth. Thus, a division of the storage
and growth process, allowing growth to take place on external substrate directly, is not
considered. It is realized that this is not in accordance with rea
ASM3 was published there was no model available to predict the separation of
direct growth and storage. Therefore, Gujer
� ) and a higher growth yied (
Monod relationship is used to describe the growth of heterotrophic and autotrophic
Anoxic storage of readily biodegradable substrate:
aerobic storage, but denitrification rathe
energy required. A correction factor (
heterotrophic biomass may be capable of denitrifying.
Biodegradable
Organic nitrogen
[
?!� [
| Nitrogen components in ASM3 (modified from Jepp
Processes in ASM3
et al.
particulate organic matter, storage of readily biodegradable substrate, growth and decay
of biomass. The substrates flows are
This process makes available all slowly biodegradable substrates
contained in the influent and is assumed to be electron donor independent.
Aerobic storage of readily biodegradable substrate:
in the form of
becomes stored material before used for growth. Thus, a division of the storage
and growth process, allowing growth to take place on external substrate directly, is not
considered. It is realized that this is not in accordance with rea
ASM3 was published there was no model available to predict the separation of
direct growth and storage. Therefore, Gujer
) and a higher growth yied (
Monod relationship is used to describe the growth of heterotrophic and autotrophic
Anoxic storage of readily biodegradable substrate:
aerobic storage, but denitrification rathe
energy required. A correction factor (
heterotrophic biomass may be capable of denitrifying.
Biodegradable
Organic nitrogen
[ �U
? [ !�
Nitrogen components in ASM3 (modified from Jepp
Processes in ASM3
(2000
particulate organic matter, storage of readily biodegradable substrate, growth and decay
of biomass. The substrates flows are
This process makes available all slowly biodegradable substrates
contained in the influent and is assumed to be electron donor independent.
Aerobic storage of readily biodegradable substrate:
in the form of
becomes stored material before used for growth. Thus, a division of the storage
and growth process, allowing growth to take place on external substrate directly, is not
considered. It is realized that this is not in accordance with rea
ASM3 was published there was no model available to predict the separation of
direct growth and storage. Therefore, Gujer
) and a higher growth yied (
Monod relationship is used to describe the growth of heterotrophic and autotrophic
Anoxic storage of readily biodegradable substrate:
aerobic storage, but denitrification rathe
energy required. A correction factor (
heterotrophic biomass may be capable of denitrifying.
Organic nitrogen
Particulate (XNI
U%[
!�C [
Nitrogen components in ASM3 (modified from Jepp
Processes in ASM3
2000
particulate organic matter, storage of readily biodegradable substrate, growth and decay
of biomass. The substrates flows are
This process makes available all slowly biodegradable substrates
contained in the influent and is assumed to be electron donor independent.
Aerobic storage of readily biodegradable substrate:
in the form of !�
becomes stored material before used for growth. Thus, a division of the storage
and growth process, allowing growth to take place on external substrate directly, is not
considered. It is realized that this is not in accordance with rea
ASM3 was published there was no model available to predict the separation of
direct growth and storage. Therefore, Gujer
) and a higher growth yied (
Monod relationship is used to describe the growth of heterotrophic and autotrophic
Anoxic storage of readily biodegradable substrate:
aerobic storage, but denitrification rathe
energy required. A correction factor (
heterotrophic biomass may be capable of denitrifying.
Particulate
NI=iNSS
[ �U
C [ �U
Nitrogen components in ASM3 (modified from Jepp
2000) in ASM3 there are four main processes: hydrolysis of
particulate organic matter, storage of readily biodegradable substrate, growth and decay
of biomass. The substrates flows are
This process makes available all slowly biodegradable substrates
contained in the influent and is assumed to be electron donor independent.
Aerobic storage of readily biodegradable substrate:
�
becomes stored material before used for growth. Thus, a division of the storage
and growth process, allowing growth to take place on external substrate directly, is not
considered. It is realized that this is not in accordance with rea
ASM3 was published there was no model available to predict the separation of
direct growth and storage. Therefore, Gujer
) and a higher growth yied (
Monod relationship is used to describe the growth of heterotrophic and autotrophic
Anoxic storage of readily biodegradable substrate:
aerobic storage, but denitrification rathe
energy required. A correction factor (
heterotrophic biomass may be capable of denitrifying.
Particulate
NSS�X
(S
U,,
C U,1,
Nitrogen components in ASM3 (modified from Jepp
) in ASM3 there are four main processes: hydrolysis of
particulate organic matter, storage of readily biodegradable substrate, growth and decay
of biomass. The substrates flows are represented
This process makes available all slowly biodegradable substrates
contained in the influent and is assumed to be electron donor independent.
Aerobic storage of readily biodegradable substrate:
� with the consumption of oxygen. It is assumed tha
becomes stored material before used for growth. Thus, a division of the storage
and growth process, allowing growth to take place on external substrate directly, is not
considered. It is realized that this is not in accordance with rea
ASM3 was published there was no model available to predict the separation of
direct growth and storage. Therefore, Gujer
) and a higher growth yied (
Monod relationship is used to describe the growth of heterotrophic and autotrophic
Anoxic storage of readily biodegradable substrate:
aerobic storage, but denitrification rathe
energy required. A correction factor (
heterotrophic biomass may be capable of denitrifying.
Particulate �XS)
Soluble (SNI=i
· �2
,· !
Nitrogen components in ASM3 (modified from Jepp
) in ASM3 there are four main processes: hydrolysis of
particulate organic matter, storage of readily biodegradable substrate, growth and decay
represented
This process makes available all slowly biodegradable substrates
contained in the influent and is assumed to be electron donor independent.
Aerobic storage of readily biodegradable substrate:
with the consumption of oxygen. It is assumed tha
becomes stored material before used for growth. Thus, a division of the storage
and growth process, allowing growth to take place on external substrate directly, is not
considered. It is realized that this is not in accordance with rea
ASM3 was published there was no model available to predict the separation of
direct growth and storage. Therefore, Gujer
) and a higher growth yied (
Monod relationship is used to describe the growth of heterotrophic and autotrophic
Anoxic storage of readily biodegradable substrate:
aerobic storage, but denitrification rathe
energy required. A correction factor (η
heterotrophic biomass may be capable of denitrifying.
Soluble =iNXI
�2 [
!2
Nitrogen components in ASM3 (modified from Jepp
) in ASM3 there are four main processes: hydrolysis of
particulate organic matter, storage of readily biodegradable substrate, growth and decay
represented
This process makes available all slowly biodegradable substrates
contained in the influent and is assumed to be electron donor independent.
Aerobic storage of readily biodegradable substrate:
with the consumption of oxygen. It is assumed tha
becomes stored material before used for growth. Thus, a division of the storage
and growth process, allowing growth to take place on external substrate directly, is not
considered. It is realized that this is not in accordance with rea
ASM3 was published there was no model available to predict the separation of
direct growth and storage. Therefore, Gujer
) and a higher growth yied (
Monod relationship is used to describe the growth of heterotrophic and autotrophic
Anoxic storage of readily biodegradable substrate:
aerobic storage, but denitrification rather than aerobic storage respiration provides the
ηNOX
heterotrophic biomass may be capable of denitrifying.
TKN
biodegradable
Soluble
NXI�SI)
[ �U,
Nitrogen components in ASM3 (modified from Jepp
) in ASM3 there are four main processes: hydrolysis of
particulate organic matter, storage of readily biodegradable substrate, growth and decay
represented
This process makes available all slowly biodegradable substrates
contained in the influent and is assumed to be electron donor independent.
Aerobic storage of readily biodegradable substrate:
with the consumption of oxygen. It is assumed tha
becomes stored material before used for growth. Thus, a division of the storage
and growth process, allowing growth to take place on external substrate directly, is not
considered. It is realized that this is not in accordance with rea
ASM3 was published there was no model available to predict the separation of
direct growth and storage. Therefore, Gujer
) and a higher growth yied (
Monod relationship is used to describe the growth of heterotrophic and autotrophic
Anoxic storage of readily biodegradable substrate:
r than aerobic storage respiration provides the
NOX) is used to indicate that only a fraction of the
heterotrophic biomass may be capable of denitrifying.
TKN
Nonbiodegradable
,0·
Nitrogen components in ASM3 (modified from Jepp
) in ASM3 there are four main processes: hydrolysis of
particulate organic matter, storage of readily biodegradable substrate, growth and decay
represented
This process makes available all slowly biodegradable substrates
contained in the influent and is assumed to be electron donor independent.
Aerobic storage of readily biodegradable substrate:
with the consumption of oxygen. It is assumed tha
becomes stored material before used for growth. Thus, a division of the storage
and growth process, allowing growth to take place on external substrate directly, is not
considered. It is realized that this is not in accordance with rea
ASM3 was published there was no model available to predict the separation of
direct growth and storage. Therefore, Gujer
) and a higher growth yied (
Monod relationship is used to describe the growth of heterotrophic and autotrophic
Anoxic storage of readily biodegradable substrate:
r than aerobic storage respiration provides the
) is used to indicate that only a fraction of the
heterotrophic biomass may be capable of denitrifying.
TKN
Non-biodegradable
(X
· �
Nitrogen components in ASM3 (modified from Jepp
) in ASM3 there are four main processes: hydrolysis of
particulate organic matter, storage of readily biodegradable substrate, growth and decay
represented in
This process makes available all slowly biodegradable substrates
contained in the influent and is assumed to be electron donor independent.
Aerobic storage of readily biodegradable substrate:
with the consumption of oxygen. It is assumed tha
becomes stored material before used for growth. Thus, a division of the storage
and growth process, allowing growth to take place on external substrate directly, is not
considered. It is realized that this is not in accordance with rea
ASM3 was published there was no model available to predict the separation of
direct growth and storage. Therefore, Gujer et al
) and a higher growth yied (�
Monod relationship is used to describe the growth of heterotrophic and autotrophic
Anoxic storage of readily biodegradable substrate:
r than aerobic storage respiration provides the
) is used to indicate that only a fraction of the
heterotrophic biomass may be capable of denitrifying.
biodegradable
Particulate (XNI
[
Nitrogen components in ASM3 (modified from Jepp
) in ASM3 there are four main processes: hydrolysis of
particulate organic matter, storage of readily biodegradable substrate, growth and decay
in Figure
This process makes available all slowly biodegradable substrates
contained in the influent and is assumed to be electron donor independent.
Aerobic storage of readily biodegradable substrate:
with the consumption of oxygen. It is assumed tha
becomes stored material before used for growth. Thus, a division of the storage
and growth process, allowing growth to take place on external substrate directly, is not
considered. It is realized that this is not in accordance with rea
ASM3 was published there was no model available to predict the separation of
et al. (
��) to approximate direct growth. The
Monod relationship is used to describe the growth of heterotrophic and autotrophic
Anoxic storage of readily biodegradable substrate:
r than aerobic storage respiration provides the
) is used to indicate that only a fraction of the
heterotrophic biomass may be capable of denitrifying.
Particulate
NI=iNXI
�U,1
Nitrogen components in ASM3 (modified from Jepp
) in ASM3 there are four main processes: hydrolysis of
particulate organic matter, storage of readily biodegradable substrate, growth and decay
Figure
This process makes available all slowly biodegradable substrates
contained in the influent and is assumed to be electron donor independent.
Aerobic storage of readily biodegradable substrate:
with the consumption of oxygen. It is assumed tha
becomes stored material before used for growth. Thus, a division of the storage
and growth process, allowing growth to take place on external substrate directly, is not
considered. It is realized that this is not in accordance with rea
ASM3 was published there was no model available to predict the separation of
et al. (2000
) to approximate direct growth. The
Monod relationship is used to describe the growth of heterotrophic and autotrophic
Anoxic storage of readily biodegradable substrate:
r than aerobic storage respiration provides the
) is used to indicate that only a fraction of the
heterotrophic biomass may be capable of denitrifying.
Total Nitrogen
Particulate
NXI�XI)
Nitrate/Nitrite
10·
Nitrogen components in ASM3 (modified from Jepp
) in ASM3 there are four main processes: hydrolysis of
particulate organic matter, storage of readily biodegradable substrate, growth and decay
Figure 5
This process makes available all slowly biodegradable substrates
contained in the influent and is assumed to be electron donor independent.
Aerobic storage of readily biodegradable substrate:
with the consumption of oxygen. It is assumed tha
becomes stored material before used for growth. Thus, a division of the storage
and growth process, allowing growth to take place on external substrate directly, is not
considered. It is realized that this is not in accordance with rea
ASM3 was published there was no model available to predict the separation of
2000
) to approximate direct growth. The
Monod relationship is used to describe the growth of heterotrophic and autotrophic
Anoxic storage of readily biodegradable substrate:
r than aerobic storage respiration provides the
) is used to indicate that only a fraction of the
Total Nitrogen
Particulate )
Nitrate/Nitrite (SNO
· !
Nitrogen components in ASM3 (modified from Jepp
) in ASM3 there are four main processes: hydrolysis of
particulate organic matter, storage of readily biodegradable substrate, growth and decay
5.3
This process makes available all slowly biodegradable substrates
contained in the influent and is assumed to be electron donor independent.
Aerobic storage of readily biodegradable substrate: This process describes the
with the consumption of oxygen. It is assumed tha
becomes stored material before used for growth. Thus, a division of the storage
and growth process, allowing growth to take place on external substrate directly, is not
considered. It is realized that this is not in accordance with rea
ASM3 was published there was no model available to predict the separation of
2000) suggested applying a low
) to approximate direct growth. The
Monod relationship is used to describe the growth of heterotrophic and autotrophic
Anoxic storage of readily biodegradable substrate: This process is identical to
r than aerobic storage respiration provides the
) is used to indicate that only a fraction of the
Total Nitrogen
Heterotrophs
Nitrate/Nitrite
NO)
[
Nitrogen components in ASM3 (modified from Jepp
) in ASM3 there are four main processes: hydrolysis of
particulate organic matter, storage of readily biodegradable substrate, growth and decay
3.
This process makes available all slowly biodegradable substrates
contained in the influent and is assumed to be electron donor independent.
This process describes the
with the consumption of oxygen. It is assumed tha
becomes stored material before used for growth. Thus, a division of the storage
and growth process, allowing growth to take place on external substrate directly, is not
considered. It is realized that this is not in accordance with rea
ASM3 was published there was no model available to predict the separation of
) suggested applying a low
) to approximate direct growth. The
Monod relationship is used to describe the growth of heterotrophic and autotrophic
This process is identical to
r than aerobic storage respiration provides the
) is used to indicate that only a fraction of the
Heterotrophs (iN,BM
Nitrate/Nitrite
�U.<�
Nitrogen components in ASM3 (modified from Jeppsson, 1996)
) in ASM3 there are four main processes: hydrolysis of
particulate organic matter, storage of readily biodegradable substrate, growth and decay
This process makes available all slowly biodegradable substrates
contained in the influent and is assumed to be electron donor independent.
This process describes the
with the consumption of oxygen. It is assumed tha
becomes stored material before used for growth. Thus, a division of the storage
and growth process, allowing growth to take place on external substrate directly, is not
considered. It is realized that this is not in accordance with reality. However,
ASM3 was published there was no model available to predict the separation of
) suggested applying a low
) to approximate direct growth. The
Monod relationship is used to describe the growth of heterotrophic and autotrophic
This process is identical to
r than aerobic storage respiration provides the
) is used to indicate that only a fraction of the
Heterotrophs
N,BM�X
<�
sson, 1996)
) in ASM3 there are four main processes: hydrolysis of
particulate organic matter, storage of readily biodegradable substrate, growth and decay
This process makes available all slowly biodegradable substrates
contained in the influent and is assumed to be electron donor independent.
This process describes the
with the consumption of oxygen. It is assumed tha
becomes stored material before used for growth. Thus, a division of the storage
and growth process, allowing growth to take place on external substrate directly, is not
lity. However,
ASM3 was published there was no model available to predict the separation of
) suggested applying a low
) to approximate direct growth. The
Monod relationship is used to describe the growth of heterotrophic and autotrophic
This process is identical to
r than aerobic storage respiration provides the
) is used to indicate that only a fraction of the
Active mass
Heterotrophs �XH)
Nitrogen gas (S
sson, 1996)
) in ASM3 there are four main processes: hydrolysis of
particulate organic matter, storage of readily biodegradable substrate, growth and decay
This process makes available all slowly biodegradable substrates
contained in the influent and is assumed to be electron donor independent.
This process describes the
with the consumption of oxygen. It is assumed tha
becomes stored material before used for growth. Thus, a division of the storage
and growth process, allowing growth to take place on external substrate directly, is not
lity. However,
ASM3 was published there was no model available to predict the separation of
) suggested applying a low
) to approximate direct growth. The
Monod relationship is used to describe the growth of heterotrophic and autotrophic
This process is identical to
r than aerobic storage respiration provides the
) is used to indicate that only a fraction of the
Active mass
Heterotrophs
Nitrogen gas (S
sson, 1996)
) in ASM3 there are four main processes: hydrolysis of
particulate organic matter, storage of readily biodegradable substrate, growth and decay
This process makes available all slowly biodegradable substrates
contained in the influent and is assumed to be electron donor independent.
This process describes the
with the consumption of oxygen. It is assumed tha
becomes stored material before used for growth. Thus, a division of the storage
and growth process, allowing growth to take place on external substrate directly, is not
lity. However,
ASM3 was published there was no model available to predict the separation of
) suggested applying a low
) to approximate direct growth. The
Monod relationship is used to describe the growth of heterotrophic and autotrophic
This process is identical to
r than aerobic storage respiration provides the
) is used to indicate that only a fraction of the
Active mass
Nitrogen gas (SN2)
) in ASM3 there are four main processes: hydrolysis of
particulate organic matter, storage of readily biodegradable substrate, growth and decay
This process makes available all slowly biodegradable substrates
contained in the influent and is assumed to be electron donor independent.
This process describes the
with the consumption of oxygen. It is assumed tha
becomes stored material before used for growth. Thus, a division of the storage
and growth process, allowing growth to take place on external substrate directly, is not
lity. However,
ASM3 was published there was no model available to predict the separation of
) suggested applying a low
) to approximate direct growth. The
Monod relationship is used to describe the growth of heterotrophic and autotrophic
This process is identical to
r than aerobic storage respiration provides the
) is used to indicate that only a fraction of the
Active mass
Autotrophs (iN,BM
Nitrogen )
) in ASM3 there are four main processes: hydrolysis of
particulate organic matter, storage of readily biodegradable substrate, growth and decay
This process makes available all slowly biodegradable substrates
This process describes the
with the consumption of oxygen. It is assumed tha
becomes stored material before used for growth. Thus, a division of the storage
and growth process, allowing growth to take place on external substrate directly, is not
lity. However, at
ASM3 was published there was no model available to predict the separation of
) suggested applying a low
) to approximate direct growth. The
Monod relationship is used to describe the growth of heterotrophic and autotrophic
This process is identical to
r than aerobic storage respiration provides the
) is used to indicate that only a fraction of the
Autotrophs
N,BM�X
) in ASM3 there are four main processes: hydrolysis of
particulate organic matter, storage of readily biodegradable substrate, growth and decay
This process makes available all slowly biodegradable substrates
This process describes the
with the consumption of oxygen. It is assumed tha
becomes stored material before used for growth. Thus, a division of the storage
and growth process, allowing growth to take place on external substrate directly, is not
the time
ASM3 was published there was no model available to predict the separation of �
) suggested applying a low
) to approximate direct growth. The
Monod relationship is used to describe the growth of heterotrophic and autotrophic
This process is identical to
r than aerobic storage respiration provides the
) is used to indicate that only a fraction of the
Autotrophs �XA)
(18)
) in ASM3 there are four main processes: hydrolysis of
particulate organic matter, storage of readily biodegradable substrate, growth and decay
This process makes available all slowly biodegradable substrates
This process describes the
with the consumption of oxygen. It is assumed that all
becomes stored material before used for growth. Thus, a division of the storage
and growth process, allowing growth to take place on external substrate directly, is not
the time
� into
) suggested applying a low
) to approximate direct growth. The
Monod relationship is used to describe the growth of heterotrophic and autotrophic
This process is identical to
r than aerobic storage respiration provides the
) is used to indicate that only a fraction of the
Autotrophs
41
(18)
) in ASM3 there are four main processes: hydrolysis of
particulate organic matter, storage of readily biodegradable substrate, growth and decay
!
This process describes the
t all
becomes stored material before used for growth. Thus, a division of the storage
and growth process, allowing growth to take place on external substrate directly, is not
the time
into
) suggested applying a low
) to approximate direct growth. The
Monod relationship is used to describe the growth of heterotrophic and autotrophic
This process is identical to
r than aerobic storage respiration provides the
) is used to indicate that only a fraction of the
41
(18)
) in ASM3 there are four main processes: hydrolysis of
particulate organic matter, storage of readily biodegradable substrate, growth and decay
This process describes the
t all
becomes stored material before used for growth. Thus, a division of the storage
and growth process, allowing growth to take place on external substrate directly, is not
the time
into
) suggested applying a low
) to approximate direct growth. The
Monod relationship is used to describe the growth of heterotrophic and autotrophic
This process is identical to
r than aerobic storage respiration provides the
) is used to indicate that only a fraction of the
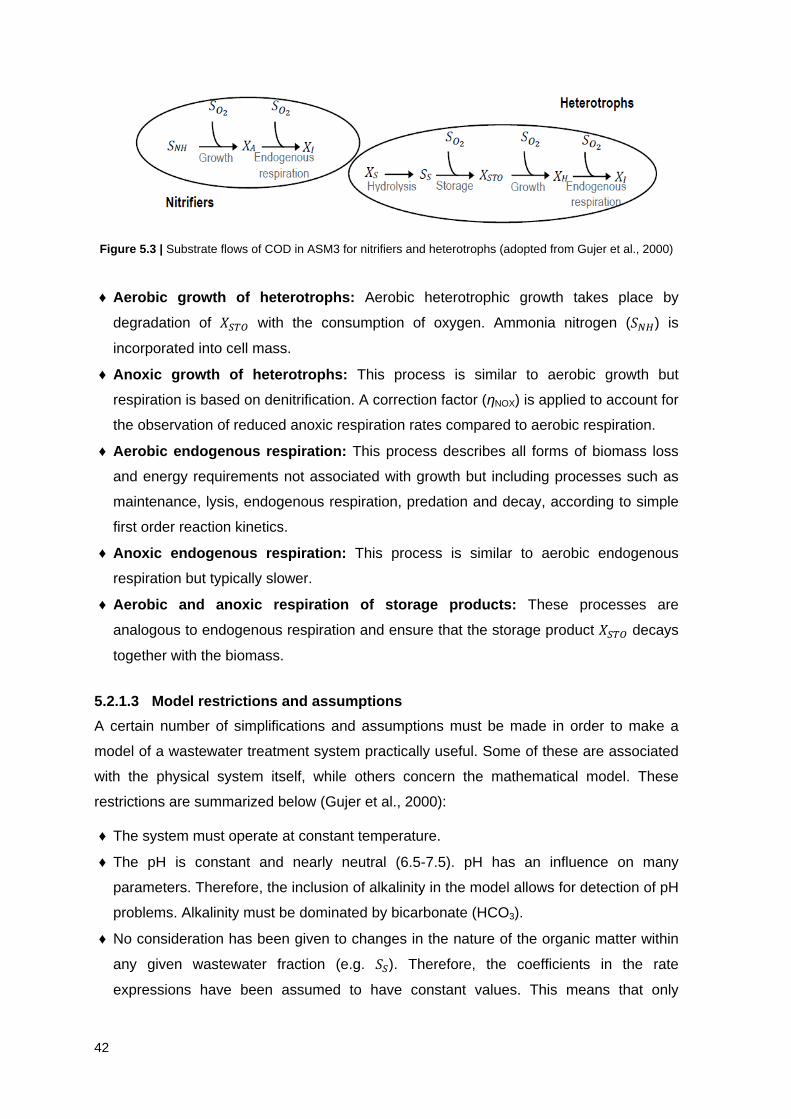
42
Figure 5.3 | Substrate flows of COD in ASM3 for nitrifiers and heterotrophs (adopted from Gujer et al., 2000)
♦ Aerobic growth of heterotrophs: Aerobic heterotrophic growth takes place by
degradation of !� with the consumption of oxygen. Ammonia nitrogen (�U�) is
incorporated into cell mass.
♦ Anoxic growth of heterotrophs: This process is similar to aerobic growth but
respiration is based on denitrification. A correction factor (ηNOX) is applied to account for
the observation of reduced anoxic respiration rates compared to aerobic respiration.
♦ Aerobic endogenous respiration: This process describes all forms of biomass loss
and energy requirements not associated with growth but including processes such as
maintenance, lysis, endogenous respiration, predation and decay, according to simple
first order reaction kinetics.
♦ Anoxic endogenous respiration: This process is similar to aerobic endogenous
respiration but typically slower.
♦ Aerobic and anoxic respiration of storage products: These processes are
analogous to endogenous respiration and ensure that the storage product !� decays
together with the biomass.
5.2.1.3 Model restrictions and assumptions
A certain number of simplifications and assumptions must be made in order to make a
model of a wastewater treatment system practically useful. Some of these are associated
with the physical system itself, while others concern the mathematical model. These
restrictions are summarized below (Gujer et al., 2000):
♦ The system must operate at constant temperature.
♦ The pH is constant and nearly neutral (6.5-7.5). pH has an influence on many
parameters. Therefore, the inclusion of alkalinity in the model allows for detection of pH
problems. Alkalinity must be dominated by bicarbonate (HCO3).
♦ No consideration has been given to changes in the nature of the organic matter within
any given wastewater fraction (e.g. �). Therefore, the coefficients in the rate
expressions have been assumed to have constant values. This means that only
43
concentration changes in the wastewater components can be handled by the model
whereas changes in the wastewater character cannot.
♦ The effects of nutrient limitations (e.g. N and P) on the cell growth have not been
considered.
♦ The correction factor for denitrification (ηNOX) is fixed and constant for a given
wastewater, even though it is possible that its value depends on the system
configuration.
♦ The coefficients for nitrification are assumed to be constant and to incorporate any
inhibitory effects that wastewater constituents may have on them.
♦ The heterotrophic biomass is homogenous and does not undergo changes in species
diversity with time. This means that effects of substrate concentration gradients, reactor
configuration, etc. on sludge settleability are not considered.
♦ The storage of readily biodegradable substrate in the biomass is assumed to be
instantaneous.
♦ Hydrolysis of organic matter and organic nitrogen are coupled and occur
simultaneously with equal rates.
♦ The model does not include processes that describe behaviors under anaerobic
conditions. Therefore, simulations of systems with large fractions of anaerobic reactor
volume may lead to errors.
♦ It is not advised to apply the model to systems where industrial contributions dominate
the characteristics of the wastewater.
♦ ASM3 cannot deal with elevated nitrite concentrations.
♦ The model is not design to deal with activated sludge systems with very high load or
small retention times (SRT<1 day) where flocculation/adsorption of XS and storage may
become limiting.
♦ The theoretical oxygen demand (ThOD) is extensively used in the continuity check of
the stoichiometric coefficients. For organic compounds COD may analytically
approximate this ThOD. For some inorganic compounds ThOD must be calculated
based on redox equations in which each reactive electron is equivalent to a ThOD of 8
g/mole.
♦ The user of the model is responsible for the identification of applicable parameters and
the wastewater characterization. However, a set of typical model parameters and
concentrations of model compounds is provided in Table A.5.2 and Table A.5.3 in
Appendix A.5.
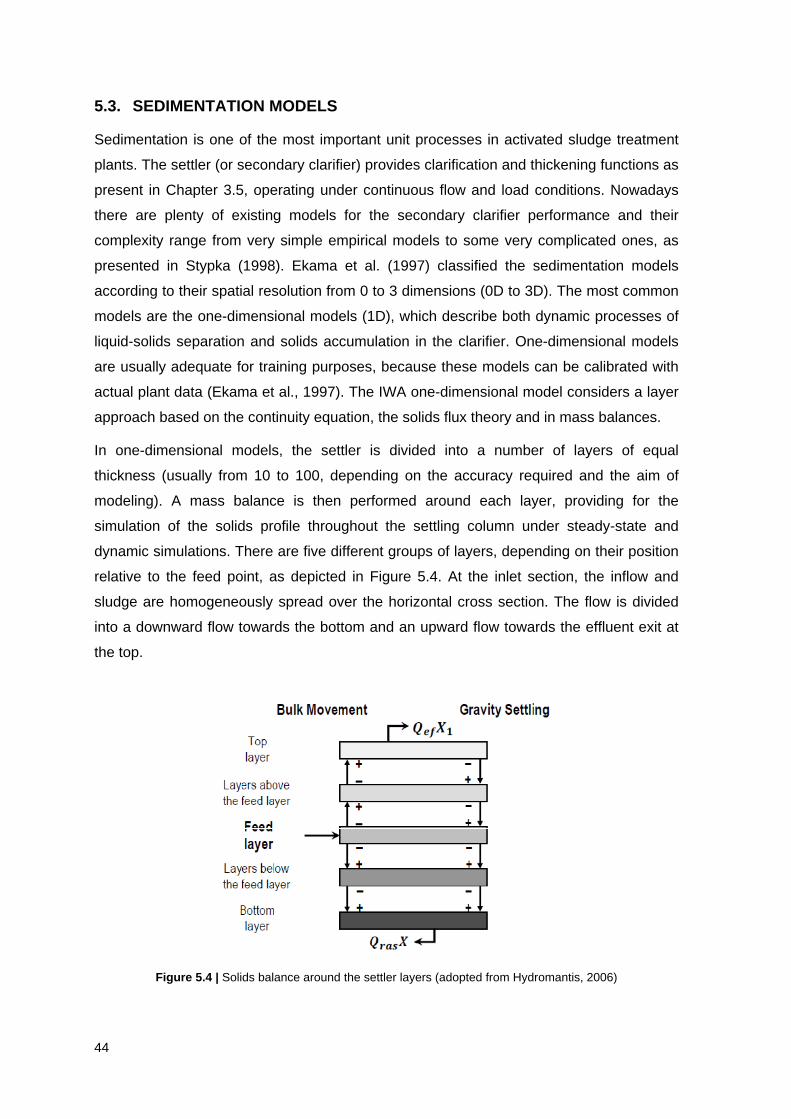
44
5.3. SEDIMENTATION MODELS
Sedimentation is one of the most important unit processes in activated sludge treatment
plants. The settler (or secondary clarifier) provides clarification and thickening functions as
present in Chapter 3.5, operating under continuous flow and load conditions. Nowadays
there are plenty of existing models for the secondary clarifier performance and their
complexity range from very simple empirical models to some very complicated ones, as
presented in Stypka (1998). Ekama et al. (1997) classified the sedimentation models
according to their spatial resolution from 0 to 3 dimensions (0D to 3D). The most common
models are the one-dimensional models (1D), which describe both dynamic processes of
liquid-solids separation and solids accumulation in the clarifier. One-dimensional models
are usually adequate for training purposes, because these models can be calibrated with
actual plant data (Ekama et al., 1997). The IWA one-dimensional model considers a layer
approach based on the continuity equation, the solids flux theory and in mass balances.
In one-dimensional models, the settler is divided into a number of layers of equal
thickness (usually from 10 to 100, depending on the accuracy required and the aim of
modeling). A mass balance is then performed around each layer, providing for the
simulation of the solids profile throughout the settling column under steady-state and
dynamic simulations. There are five different groups of layers, depending on their position
relative to the feed point, as depicted in Figure 5.4. At the inlet section, the inflow and
sludge are homogeneously spread over the horizontal cross section. The flow is divided
into a downward flow towards the bottom and an upward flow towards the effluent exit at
the top.
Figure 5.4 | Solids balance around the settler layers (adopted from Hydromantis, 2006)
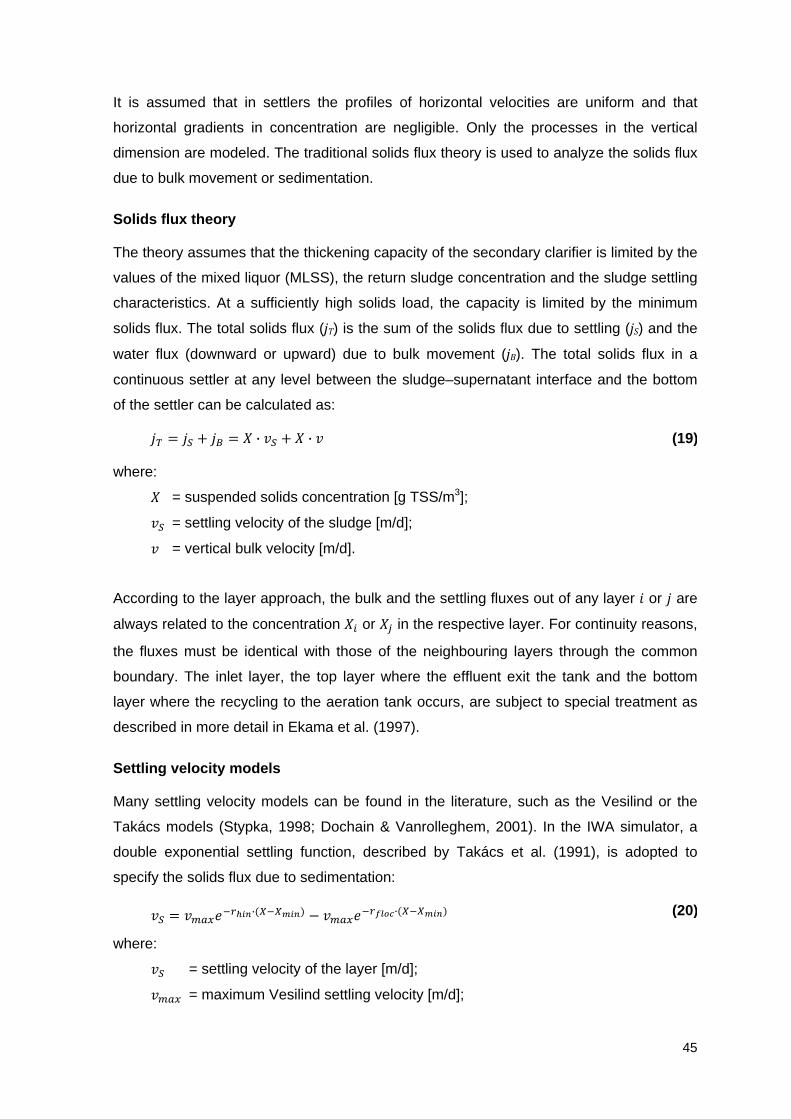
45
It is assumed that in settlers the profiles of horizontal velocities are uniform and that
horizontal gradients in concentration are negligible. Only the processes in the vertical
dimension are modeled. The traditional solids flux theory is used to analyze the solids flux
due to bulk movement or sedimentation.
Solids flux theory
The theory assumes that the thickening capacity of the secondary clarifier is limited by the
values of the mixed liquor (MLSS), the return sludge concentration and the sludge settling
characteristics. At a sufficiently high solids load, the capacity is limited by the minimum
solids flux. The total solids flux (jT) is the sum of the solids flux due to settling (jS) and the
water flux (downward or upward) due to bulk movement (jB). The total solids flux in a
continuous settler at any level between the sludge–supernatant interface and the bottom
of the settler can be calculated as:
;� = ; + ;< = ! ∙ V + ! ∙ V (19)
where: ! = suspended solids concentration [g TSS/m3]; V = settling velocity of the sludge [m/d]; V = vertical bulk velocity [m/d].
According to the layer approach, the bulk and the settling fluxes out of any layer � or ; are
always related to the concentration !L or !� in the respective layer. For continuity reasons,
the fluxes must be identical with those of the neighbouring layers through the common
boundary. The inlet layer, the top layer where the effluent exit the tank and the bottom
layer where the recycling to the aeration tank occurs, are subject to special treatment as
described in more detail in Ekama et al. (1997).
Settling velocity models
Many settling velocity models can be found in the literature, such as the Vesilind or the
Takács models (Stypka, 1998; Dochain & Vanrolleghem, 2001). In the IWA simulator, a
double exponential settling function, described by Takács et al. (1991), is adopted to
specify the solids flux due to sedimentation:
V = V���*ui���∙(1u1���) − V���*ui����∙(1u1���) (20)
where: V = settling velocity of the layer [m/d]; V��� = maximum Vesilind settling velocity [m/d];
46
GKLI = hindered zone settling parameter [m3/g TSS]; GMNOP = flocculant zone settling parameter [m3/g TSS]; ! = suspended solids concentration of the layer [g TSS/m3]; !�LI = minimum attainable suspended solids concentration [g TSS/m3].
In Equation (20), sedimentation is represented by the first exponential term and
clarification by the second exponential term. The settling velocity model of Takács is
shown in Figure 5.5, where four different regions are depicted (Hydromantis, 2006):
I. The settling velocity equals to zero, as the TSS reach the minimum attainable
concentration, !�LI;
II. The settling velocity is specially influenced by the flocculating nature of the
particles; thus the settling velocity depends mainly on the parameter GMNOP;
III. Settling velocity has become independent of TSS concentration; it is admitted that
particles have reached their maximum size and settle at maximum velocity, V���′; IV. Settling velocity is dominated by hindering (GKLI), which is why the model reduces
to the Vesilind equation (the first term of Equation (24)).
Figure 5.5 | Graphical representation of the settling velocity model of Takács (adopted from Hydromantis, 2006)
5.4. MODEL CALIBRATION AND VALIDATION
One of the final steps in the development of an WWTP model is its calibration and
validation (Olsson & Newell, 1999; Dochain & Vanrolleghem, 2001; quoted by Ferreira,
2006). Model calibration is understood as a sequence of steps that have to be taken for
the model to fit a certain set of information obtained from the full-scale WWTP under
study. To this end and concerning the calibration of ASMs, four different systematic
calibration protocols are available in the current literature (Hulsbeek et al., 2002;
47
Vanrolleghem et al., 2003; Melcer et al., 2003; Langergraber et al., 2004). These
protocols differ from the range of its applicability and complexity, the technical limitation of
available tools for data collection, design of measurement campaigns,
knowledge/experience of the modeler and use of mathematical approaches for sensitivity
analysis/parameter selection. Sin et al. (2005) performed a SWOT analysis (Strengths,
Weaknesses, Opportunities, Threats) of these protocols and addressed that although all
of them highlight the very important point of standardization of calibration efforts, the
complex calibration practice of ASMs needs to be further improved. Moreover, the degree
of detail and structure of both WWTP model and calibration procedure are constrained by
time, budget and definition of a goal. The calibration of ASMs includes a measurement
campaign, which consists of sampling and measuring some characteristics of (all) the
flows of the WWTP and lab-scale experiments for the determination of
kinetic/stoichiometric parameters of the biological process ongoing in the WWTP, namely
based on respirometric assays.
Model validation consists of the comparison of the results obtained with the model and an
independent set of experimental data that was not used during calibration. The validation
process establishes the credibility of the model by demonstrating its ability to replicate the
WWTP behavior.
These are therefore essential steps when the WWTP models are developed with the
purpose of process optimization and control, as mentioned in Chapter 5.1
6. CASE STUDY
6.1. OVERVIEW OF THE WORK PERFORMED
The experimental work included both measurements in the field and in the laboratory, as
follows:
♦ Field monitoring campaigns of quality parameters at seven different sections of the
wastewater treatment plant;
♦ Measurement of dissolved oxygen in the oxidation ditches;
♦ Laboratory determination of the oxygen uptake rate of activated sludge.
During the model application step, after some attempts to translate the treatment
processes of Valhelhas WWTP into a model, it was verified that the simulation results
were not similar to the measured data, possibly due to all the problems and constraints
referred in Chapter 6.4.1. This task became rather difficult and time-consuming, and it was
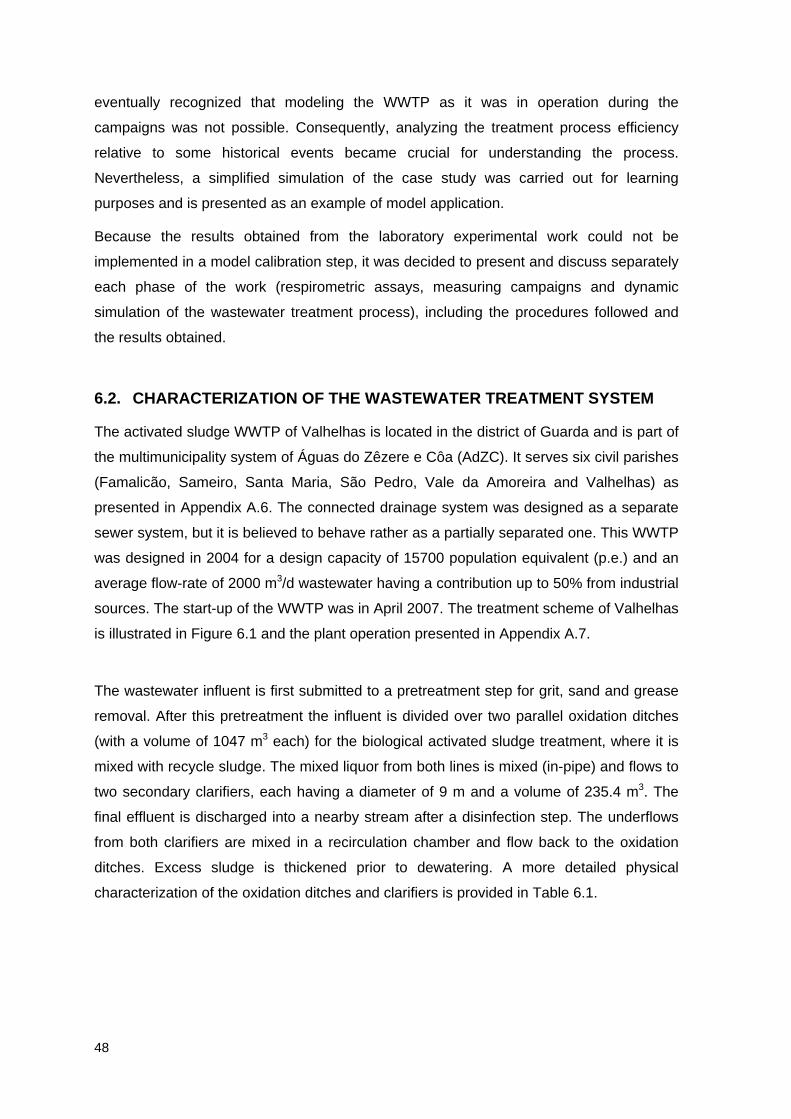
48
eventually recognized that modeling the WWTP as it was in operation during the
campaigns was not possible. Consequently, analyzing the treatment process efficiency
relative to some historical events became crucial for understanding the process.
Nevertheless, a simplified simulation of the case study was carried out for learning
purposes and is presented as an example of model application.
Because the results obtained from the laboratory experimental work could not be
implemented in a model calibration step, it was decided to present and discuss separately
each phase of the work (respirometric assays, measuring campaigns and dynamic
simulation of the wastewater treatment process), including the procedures followed and
the results obtained.
6.2. CHARACTERIZATION OF THE WASTEWATER TREATMENT S YSTEM
The activated sludge WWTP of Valhelhas is located in the district of Guarda and is part of
the multimunicipality system of Águas do Zêzere e Côa (AdZC). It serves six civil parishes
(Famalicão, Sameiro, Santa Maria, São Pedro, Vale da Amoreira and Valhelhas) as
presented in Appendix A.6. The connected drainage system was designed as a separate
sewer system, but it is believed to behave rather as a partially separated one. This WWTP
was designed in 2004 for a design capacity of 15700 population equivalent (p.e.) and an
average flow-rate of 2000 m3/d wastewater having a contribution up to 50% from industrial
sources. The start-up of the WWTP was in April 2007. The treatment scheme of Valhelhas
is illustrated in Figure 6.1 and the plant operation presented in Appendix A.7.
The wastewater influent is first submitted to a pretreatment step for grit, sand and grease
removal. After this pretreatment the influent is divided over two parallel oxidation ditches
(with a volume of 1047 m3 each) for the biological activated sludge treatment, where it is
mixed with recycle sludge. The mixed liquor from both lines is mixed (in-pipe) and flows to
two secondary clarifiers, each having a diameter of 9 m and a volume of 235.4 m3. The
final effluent is discharged into a nearby stream after a disinfection step. The underflows
from both clarifiers are mixed in a recirculation chamber and flow back to the oxidation
ditches. Excess sludge is thickened prior to dewatering. A more detailed physical
characterization of the oxidation ditches and clarifiers is provided in Table 6.1.
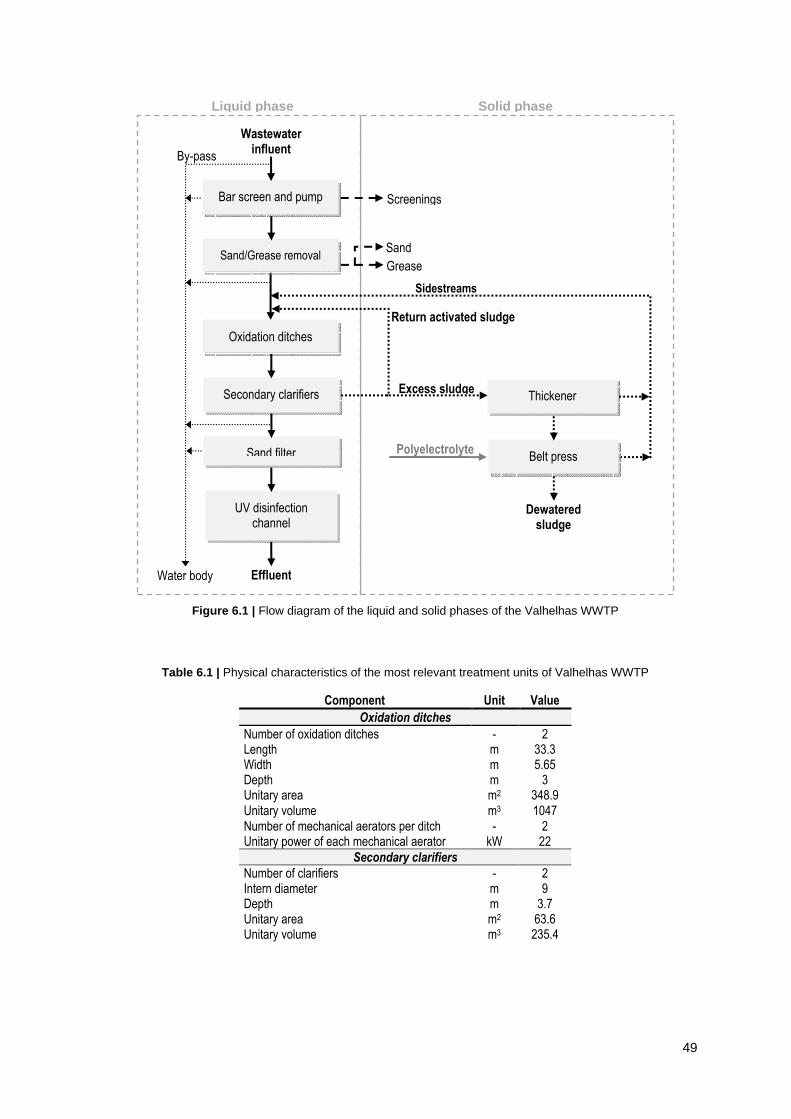
49
Figure 6.1 | Flow diagram of the liquid and solid phases of the Valhelhas WWTP
Table 6.1 | Physical characteristics of the most relevant treatment units of Valhelhas WWTP
Component Unit Value
Oxidation ditches
Number of oxidation ditches - 2 Length m 33.3 Width m 5.65 Depth m 3 Unitary area m2 348.9 Unitary volume m3 1047 Number of mechanical aerators per ditch - 2 Unitary power of each mechanical aerator kW 22
Secondary clarifiers
Number of clarifiers - 2 Intern diameter m 9 Depth m 3.7 Unitary area m2 63.6 Unitary volume m3 235.4
By-pass
Water body
Sand/Grease removal chamber
Bar screen and pump
Wastewater influent
Screenings
Sand
Grease
Sidestreams
Return activated sludge
Secondary clarifiers
Oxidation ditches
UV disinfection channel
Sand filter
Effluent
Excess sludge
Dewatered sludge
Polyelectrolyte Belt press
Thickener
Liquid phase Solid phase
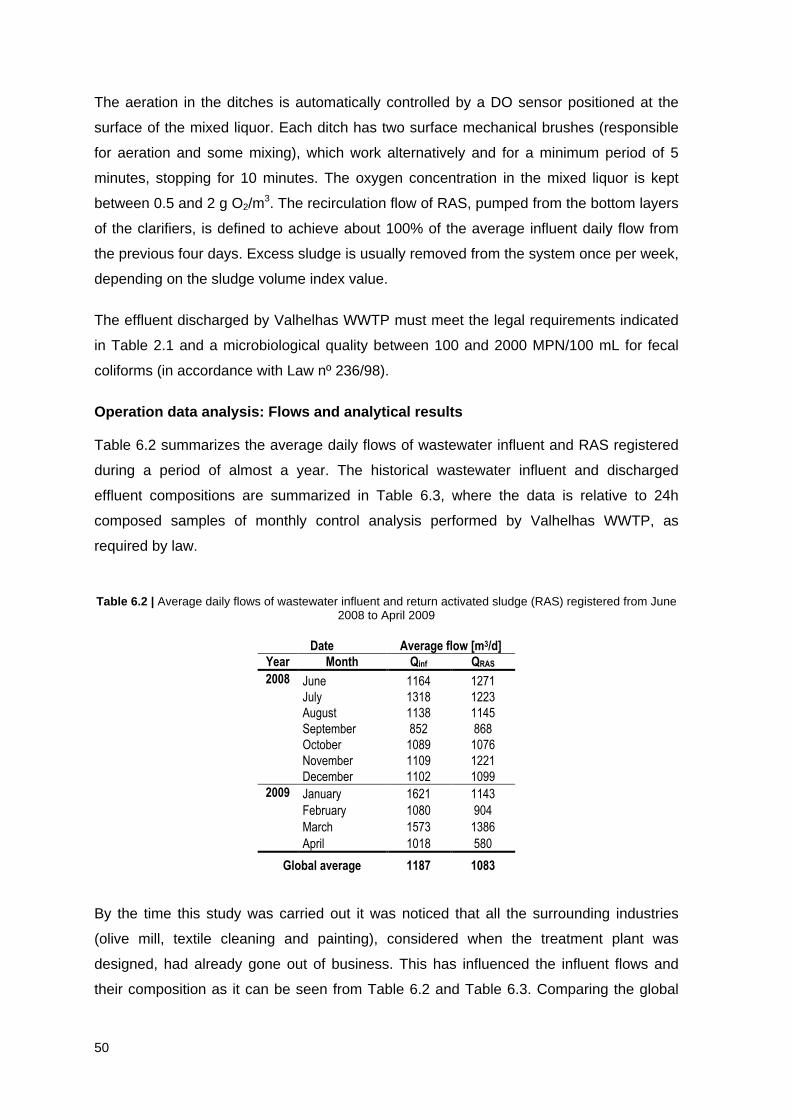
50
The aeration in the ditches is automatically controlled by a DO sensor positioned at the
surface of the mixed liquor. Each ditch has two surface mechanical brushes (responsible
for aeration and some mixing), which work alternatively and for a minimum period of 5
minutes, stopping for 10 minutes. The oxygen concentration in the mixed liquor is kept
between 0.5 and 2 g O2/m3. The recirculation flow of RAS, pumped from the bottom layers
of the clarifiers, is defined to achieve about 100% of the average influent daily flow from
the previous four days. Excess sludge is usually removed from the system once per week,
depending on the sludge volume index value.
The effluent discharged by Valhelhas WWTP must meet the legal requirements indicated
in Table 2.1 and a microbiological quality between 100 and 2000 MPN/100 mL for fecal
coliforms (in accordance with Law nº 236/98).
Operation data analysis: Flows and analytical results
Table 6.2 summarizes the average daily flows of wastewater influent and RAS registered
during a period of almost a year. The historical wastewater influent and discharged
effluent compositions are summarized in Table 6.3, where the data is relative to 24h
composed samples of monthly control analysis performed by Valhelhas WWTP, as
required by law.
Table 6.2 | Average daily flows of wastewater influent and return activated sludge (RAS) registered from June 2008 to April 2009
Date Average flow [m3/d]
Year Month Qinf QRAS
2008 June 1164 1271
July 1318 1223
August 1138 1145
September 852 868
October 1089 1076
November 1109 1221
December 1102 1099
2009 January 1621 1143
February 1080 904
March 1573 1386
April 1018 580
Global average 1187 1083
By the time this study was carried out it was noticed that all the surrounding industries
(olive mill, textile cleaning and painting), considered when the treatment plant was
designed, had already gone out of business. This has influenced the influent flows and
their composition as it can be seen from Table 6.2 and Table 6.3. Comparing the global
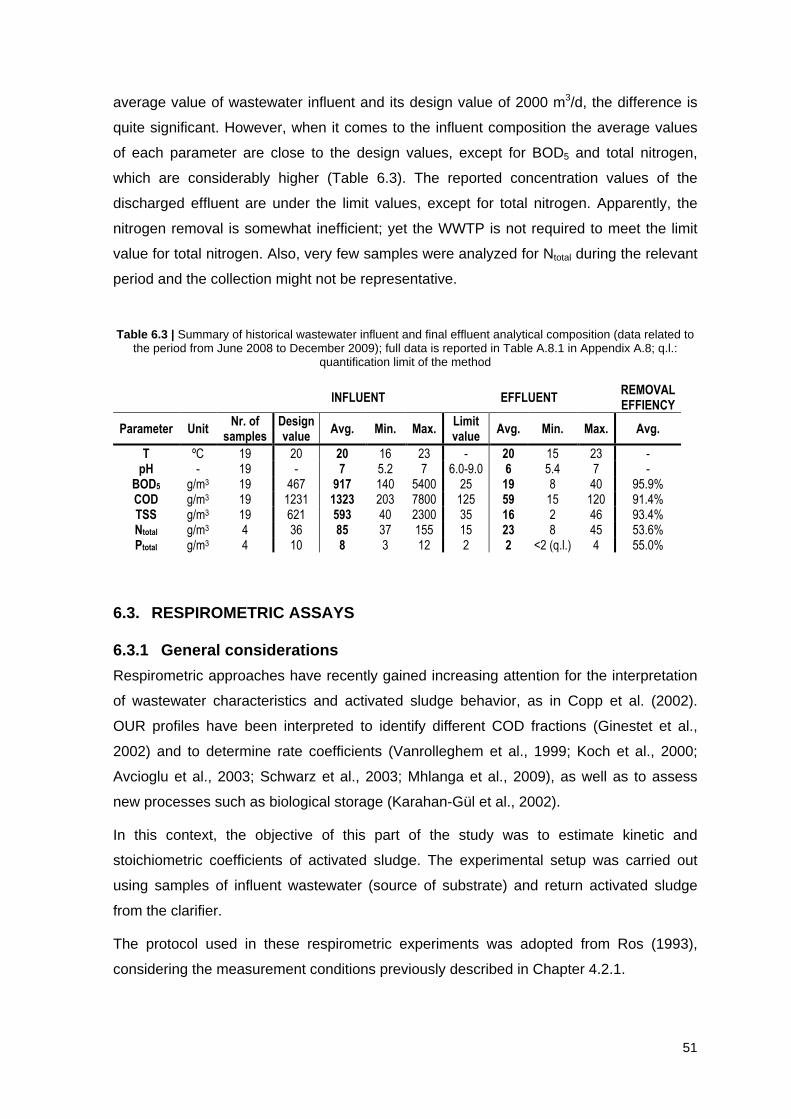
51
average value of wastewater influent and its design value of 2000 m3/d, the difference is
quite significant. However, when it comes to the influent composition the average values
of each parameter are close to the design values, except for BOD5 and total nitrogen,
which are considerably higher (Table 6.3). The reported concentration values of the
discharged effluent are under the limit values, except for total nitrogen. Apparently, the
nitrogen removal is somewhat inefficient; yet the WWTP is not required to meet the limit
value for total nitrogen. Also, very few samples were analyzed for Ntotal during the relevant
period and the collection might not be representative.
Table 6.3 | Summary of historical wastewater influent and final effluent analytical composition (data related to the period from June 2008 to December 2009); full data is reported in Table A.8.1 in Appendix A.8; q.l.:
quantification limit of the method
INFLUENT EFFLUENT
REMOVAL EFFIENCY
Parameter Unit Nr. of
samples Design value
Avg. Min. Max. Limit value
Avg. Min. Max. Avg.
T ºC 19 20 20 16 23 - 20 15 23 - pH - 19 - 7 5.2 7 6.0-9.0 6 5.4 7 -
BOD5 g/m3 19 467 917 140 5400 25 19 8 40 95.9% COD g/m3 19 1231 1323 203 7800 125 59 15 120 91.4% TSS g/m3 19 621 593 40 2300 35 16 2 46 93.4% Ntotal g/m3 4 36 85 37 155 15 23 8 45 53.6% Ptotal g/m3 4 10 8 3 12 2 2 <2 (q.l.) 4 55.0%
6.3. RESPIROMETRIC ASSAYS
6.3.1 General considerations
Respirometric approaches have recently gained increasing attention for the interpretation
of wastewater characteristics and activated sludge behavior, as in Copp et al. (2002).
OUR profiles have been interpreted to identify different COD fractions (Ginestet et al.,
2002) and to determine rate coefficients (Vanrolleghem et al., 1999; Koch et al., 2000;
Avcioglu et al., 2003; Schwarz et al., 2003; Mhlanga et al., 2009), as well as to assess
new processes such as biological storage (Karahan-Gül et al., 2002).
In this context, the objective of this part of the study was to estimate kinetic and
stoichiometric coefficients of activated sludge. The experimental setup was carried out
using samples of influent wastewater (source of substrate) and return activated sludge
from the clarifier.
The protocol used in these respirometric experiments was adopted from Ros (1993),
considering the measurement conditions previously described in Chapter 4.2.1.
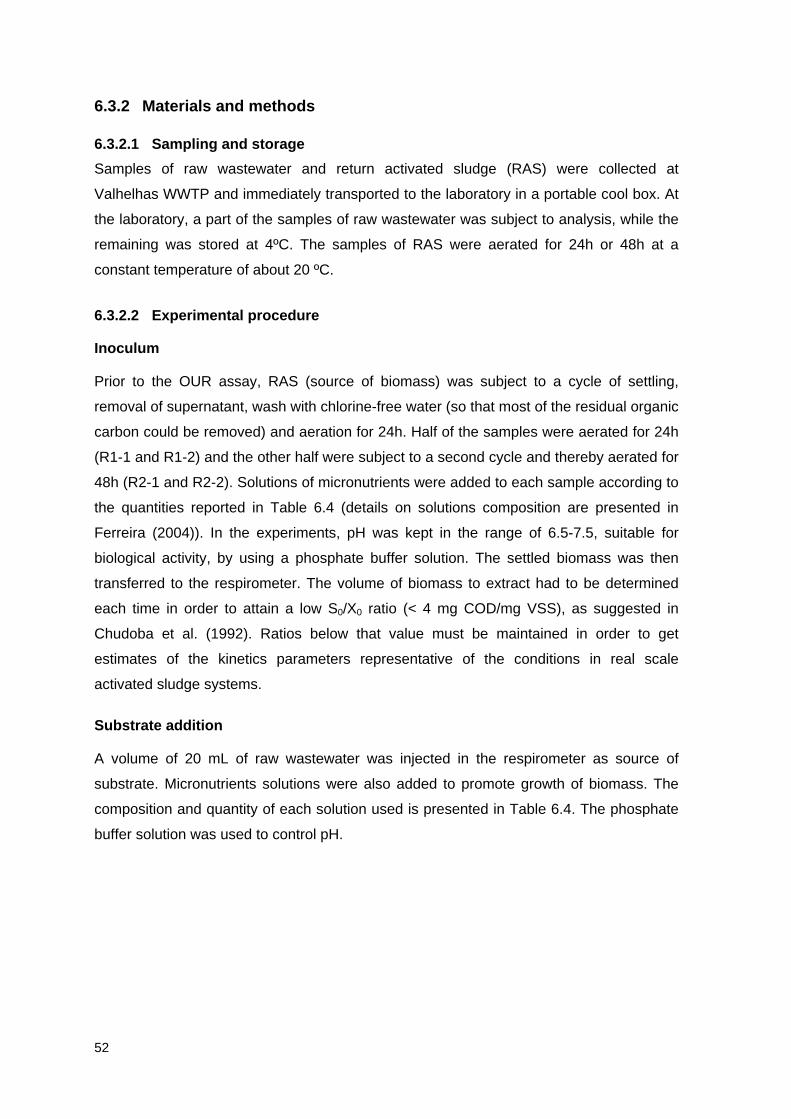
52
6.3.2 Materials and methods
6.3.2.1 Sampling and storage
Samples of raw wastewater and return activated sludge (RAS) were collected at
Valhelhas WWTP and immediately transported to the laboratory in a portable cool box. At
the laboratory, a part of the samples of raw wastewater was subject to analysis, while the
remaining was stored at 4ºC. The samples of RAS were aerated for 24h or 48h at a
constant temperature of about 20 ºC.
6.3.2.2 Experimental procedure
Inoculum
Prior to the OUR assay, RAS (source of biomass) was subject to a cycle of settling,
removal of supernatant, wash with chlorine-free water (so that most of the residual organic
carbon could be removed) and aeration for 24h. Half of the samples were aerated for 24h
(R1-1 and R1-2) and the other half were subject to a second cycle and thereby aerated for
48h (R2-1 and R2-2). Solutions of micronutrients were added to each sample according to
the quantities reported in Table 6.4 (details on solutions composition are presented in
Ferreira (2004)). In the experiments, pH was kept in the range of 6.5-7.5, suitable for
biological activity, by using a phosphate buffer solution. The settled biomass was then
transferred to the respirometer. The volume of biomass to extract had to be determined
each time in order to attain a low S0/X0 ratio (< 4 mg COD/mg VSS), as suggested in
Chudoba et al. (1992). Ratios below that value must be maintained in order to get
estimates of the kinetics parameters representative of the conditions in real scale
activated sludge systems.
Substrate addition
A volume of 20 mL of raw wastewater was injected in the respirometer as source of
substrate. Micronutrients solutions were also added to promote growth of biomass. The
composition and quantity of each solution used is presented in Table 6.4. The phosphate
buffer solution was used to control pH.
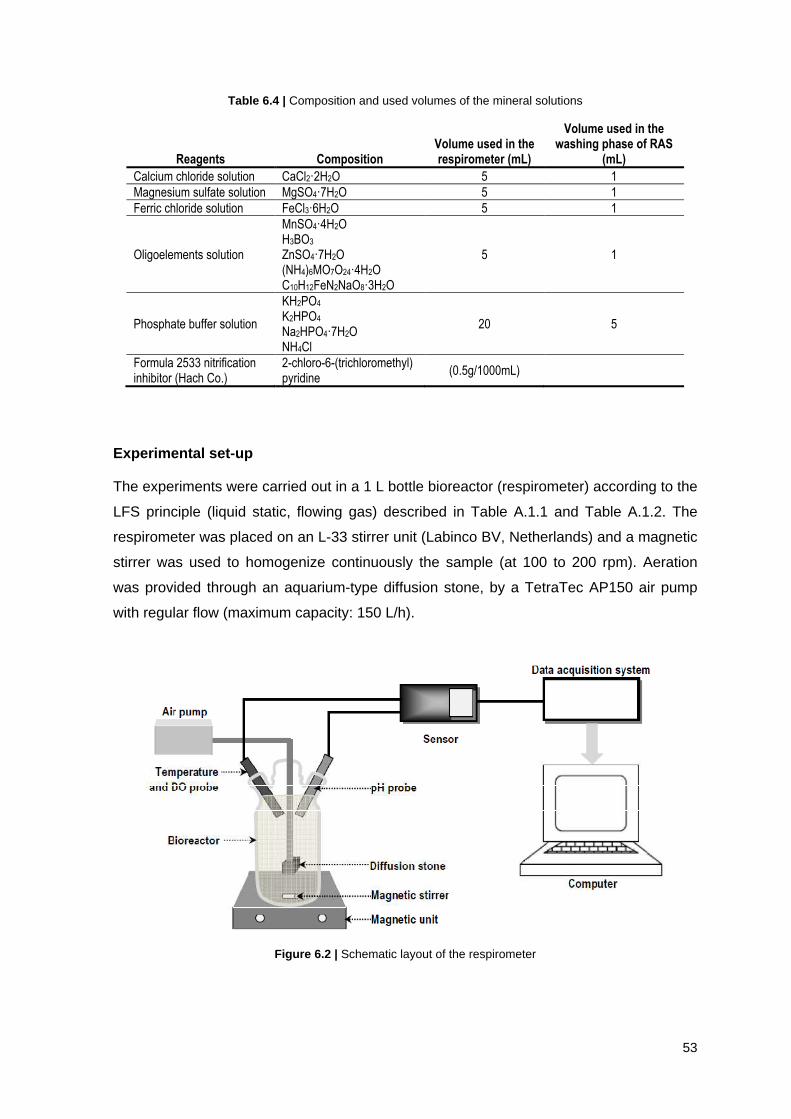
53
Table 6.4 | Composition and used volumes of the mineral solutions
Reagents Composition Volume used in the respirometer (mL)
Volume used in the washing phase of RAS
(mL)
Calcium chloride solution CaCl2�2H2O 5 1
Magnesium sulfate solution MgSO4�7H2O 5 1
Ferric chloride solution FeCl3�6H2O 5 1
Oligoelements solution
MnSO4�4H2O
5 1 H3BO3 ZnSO4�7H2O (NH4)6MO7O24�4H2O C10H12FeN2NaO8�3H2O
Phosphate buffer solution
KH2PO4
20 5 K2HPO4 Na2HPO4�7H2O NH4Cl
Formula 2533 nitrification inhibitor (Hach Co.)
2-chloro-6-(trichloromethyl) pyridine
(0.5g/1000mL)
Experimental set-up
The experiments were carried out in a 1 L bottle bioreactor (respirometer) according to the
LFS principle (liquid static, flowing gas) described in Table A.1.1 and Table A.1.2. The
respirometer was placed on an L-33 stirrer unit (Labinco BV, Netherlands) and a magnetic
stirrer was used to homogenize continuously the sample (at 100 to 200 rpm). Aeration
was provided through an aquarium-type diffusion stone, by a TetraTec AP150 air pump
with regular flow (maximum capacity: 150 L/h).
Figure 6.2 | Schematic layout of the respirometer
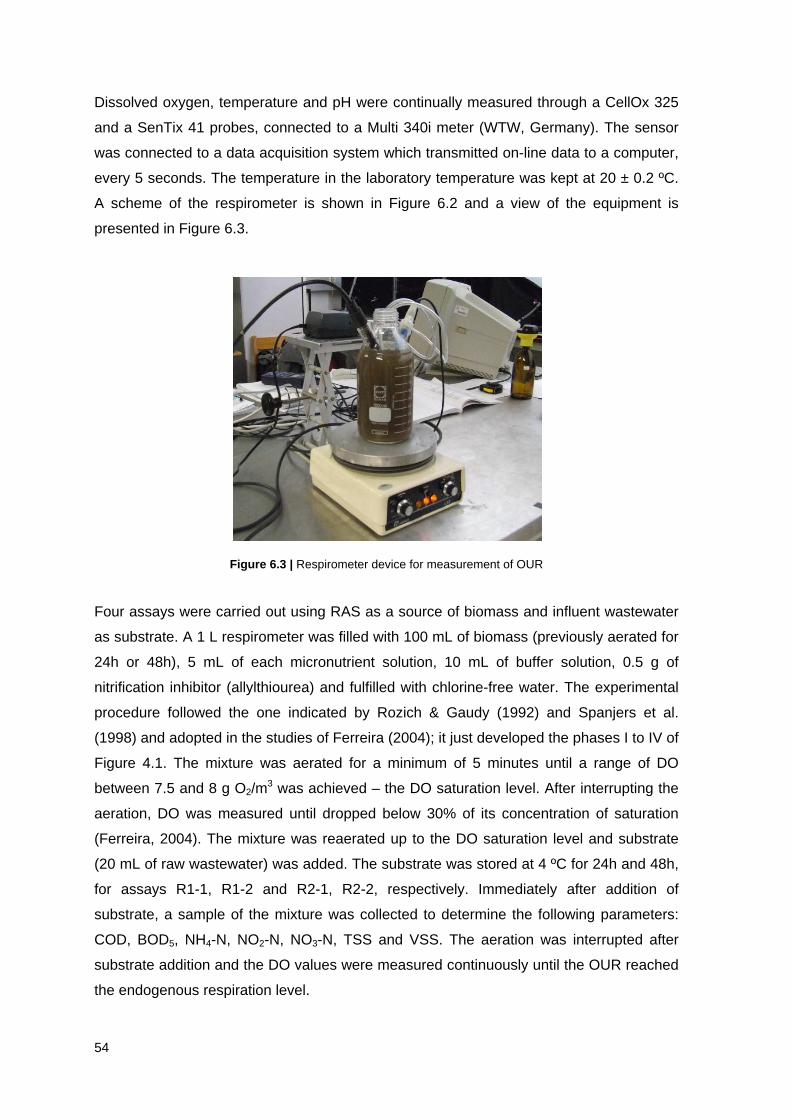
54
Dissolved oxygen, temperature and pH were continually measured through a CellOx 325
and a SenTix 41 probes, connected to a Multi 340i meter (WTW, Germany). The sensor
was connected to a data acquisition system which transmitted on-line data to a computer,
every 5 seconds. The temperature in the laboratory temperature was kept at 20 ± 0.2 ºC.
A scheme of the respirometer is shown in Figure 6.2 and a view of the equipment is
presented in Figure 6.3.
Figure 6.3 | Respirometer device for measurement of OUR
Four assays were carried out using RAS as a source of biomass and influent wastewater
as substrate. A 1 L respirometer was filled with 100 mL of biomass (previously aerated for
24h or 48h), 5 mL of each micronutrient solution, 10 mL of buffer solution, 0.5 g of
nitrification inhibitor (allylthiourea) and fulfilled with chlorine-free water. The experimental
procedure followed the one indicated by Rozich & Gaudy (1992) and Spanjers et al.
(1998) and adopted in the studies of Ferreira (2004); it just developed the phases I to IV of
Figure 4.1. The mixture was aerated for a minimum of 5 minutes until a range of DO
between 7.5 and 8 g O2/m3 was achieved – the DO saturation level. After interrupting the
aeration, DO was measured until dropped below 30% of its concentration of saturation
(Ferreira, 2004). The mixture was reaerated up to the DO saturation level and substrate
(20 mL of raw wastewater) was added. The substrate was stored at 4 ºC for 24h and 48h,
for assays R1-1, R1-2 and R2-1, R2-2, respectively. Immediately after addition of
substrate, a sample of the mixture was collected to determine the following parameters:
COD, BOD5, NH4-N, NO2-N, NO3-N, TSS and VSS. The aeration was interrupted after
substrate addition and the DO values were measured continuously until the OUR reached
the endogenous respiration level.
55
The samples of raw wastewater and the mixture of RAS/raw wastewater were analyzed
for the same set of parameters previously referred. COD concentrations were determined,
according to the standard DIN 38409-4, using a CADAS 50 spectrophotometer UV-Vis
(LANGE, Germany) and the cuvette-tests LCK 314 (15-150 g/m3), LCK 414 (5-60 g/m3)
and LCK 514 (100-2000 g/m3). The concentrations of NH4-N, NO2-N and NO3-N were
obtained using the same spectrophotometer and the cuvette-tests LCK 302 (47-130 g
NH4-N/m3), LCK 303 (2-47 g NH4-N/m3), LCK 304 (0.015-2 g NH4-N/m3), LCK 341 (0.015-
0.6 g NO2-N/m3), LCK 342 (0.6-6 g NO2-N/m3), LCK 339 (0.23-13.5 g NO3-N/m3) and LCK
340 (5-35 g NO3-N/m3), in accordance with standards DIN 38406-E 5-1 (NH4-N), DIN
38405 D10 (NO2-N) and DIN 38405-9 (NO3-N). For concentrations above the limit of the
cuvette-tests, the samples were previously diluted. VSS and TSS were determined
according to Standard Methods (APHA-AWWA-WEF, 1999). CBO5 concentrations were
determined using a manometric equipment, OxiTop®C (WTW, Germany).
6.3.3 Results of the respirometric experiments
The physical-chemical characterization of the influent wastewater (injected substrate) and
the volume of the respirometric cell after substrate injection is provided in Table 6.5 for the
four respirometric experiments. These result are relative to discrete samples, therefore the
differences between each set of parameters (for substrate) may reflect the influence of a
small industrial wastewater discharge. However, the biodegradability indicates that
generally the wastewater is biodegradable by selected microorganisms; only one sample
had low readily biodegradable substrate (R1-1).
Figure 6.4 presents the respirograms obtained of sludge samples with addition of
wastewater influent. Dissolved oxygen measurements were registered one time per
minute and the values were later converted into hours in order to facilitate comparisons
with other reported values. Comparing the respirograms R1-1 and R1-2 given in Figure
6.4, a peak of the OUR of R1-1 can be observed, which is related to a higher
concentration of biomass and S0 (corresponding to the concentrations of VSS and CODS
in Table 6.5 after injection, respectively). Although the soluble fraction (CODS) could be
more quickly biodegraded, microorganisms continued to hydrolyze the particulate fraction,
with the consequent consumption of dissolved oxygen.
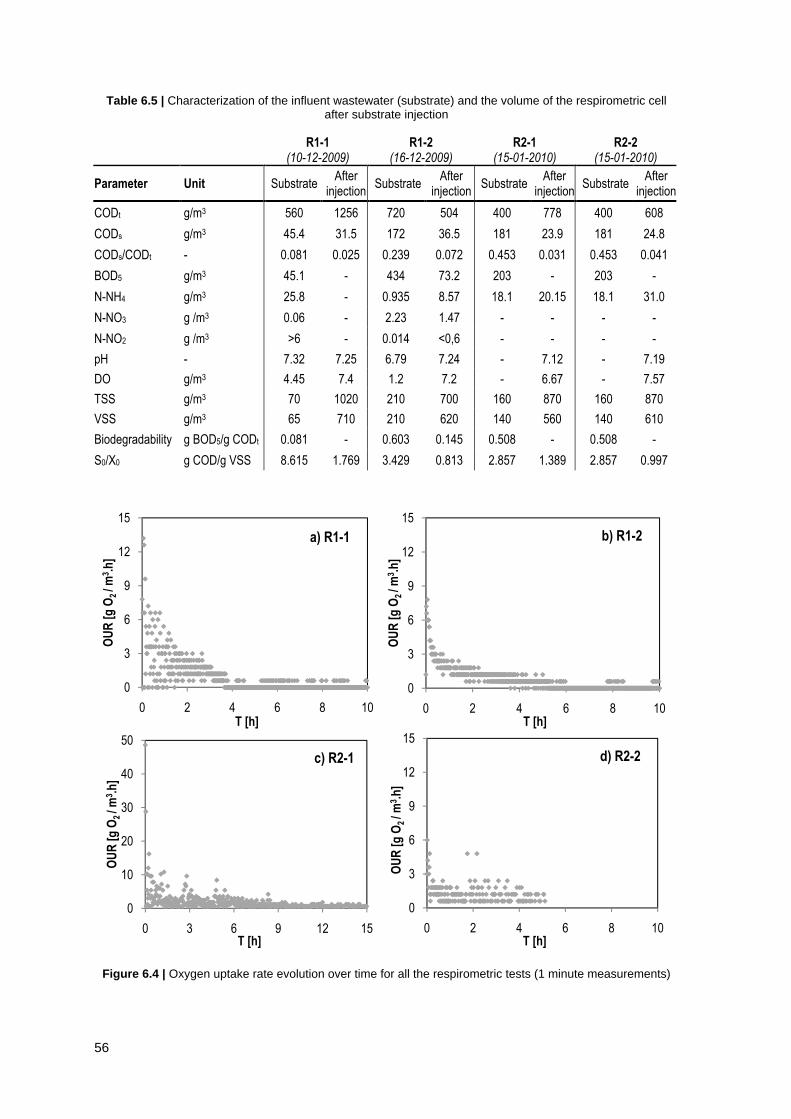
56
Table 6.5 | Characterization of the influent wastewater (substrate) and the volume of the respirometric cell after substrate injection
R1-1 R1-2 R2-1 R2-2
(10-12-2009) (16-12-2009) (15-01-2010) (15-01-2010)
Parameter Unit Substrate After
injection Substrate
After injection
Substrate After
injection Substrate
After injection
CODt g/m3 560 1256 720 504 400 778 400 608
CODs g/m3 45.4 31.5 172 36.5 181 23.9 181 24.8
CODs/CODt - 0.081 0.025 0.239 0.072 0.453 0.031 0.453 0.041
BOD5 g/m3 45.1 - 434 73.2 203 - 203 -
N-NH4 g/m3 25.8 - 0.935 8.57 18.1 20.15 18.1 31.0
N-NO3 g /m3 0.06 - 2.23 1.47 - - - -
N-NO2 g /m3 >6 - 0.014 <0,6 - - - -
pH - 7.32 7.25 6.79 7.24 - 7.12 - 7.19
DO g/m3 4.45 7.4 1.2 7.2 - 6.67 - 7.57
TSS g/m3 70 1020 210 700 160 870 160 870
VSS g/m3 65 710 210 620 140 560 140 610
Biodegradability g BOD5/g CODt 0.081 - 0.603 0.145 0.508 - 0.508 -
S0/X0 g COD/g VSS 8.615 1.769 3.429 0.813 2.857 1.389 2.857 0.997
Figure 6.4 | Oxygen uptake rate evolution over time for all the respirometric tests (1 minute measurements)
0
3
6
9
12
15
0 2 4 6 8 10
OU
R [
g O
2 / m
3 .h
]
T [h]
a) R1-1
0
3
6
9
12
15
0 2 4 6 8 10
OU
R [
g O
2 / m
3 .h
]
T [h]
b) R1-2
0
10
20
30
40
50
0 3 6 9 12 15
OU
R [
g O
2 / m
3 .h
]
T [h]
c) R2-1
0
3
6
9
12
15
0 2 4 6 8 10
OU
R [
g O
2 / m
3 .h
]
T [h]
d) R2-2
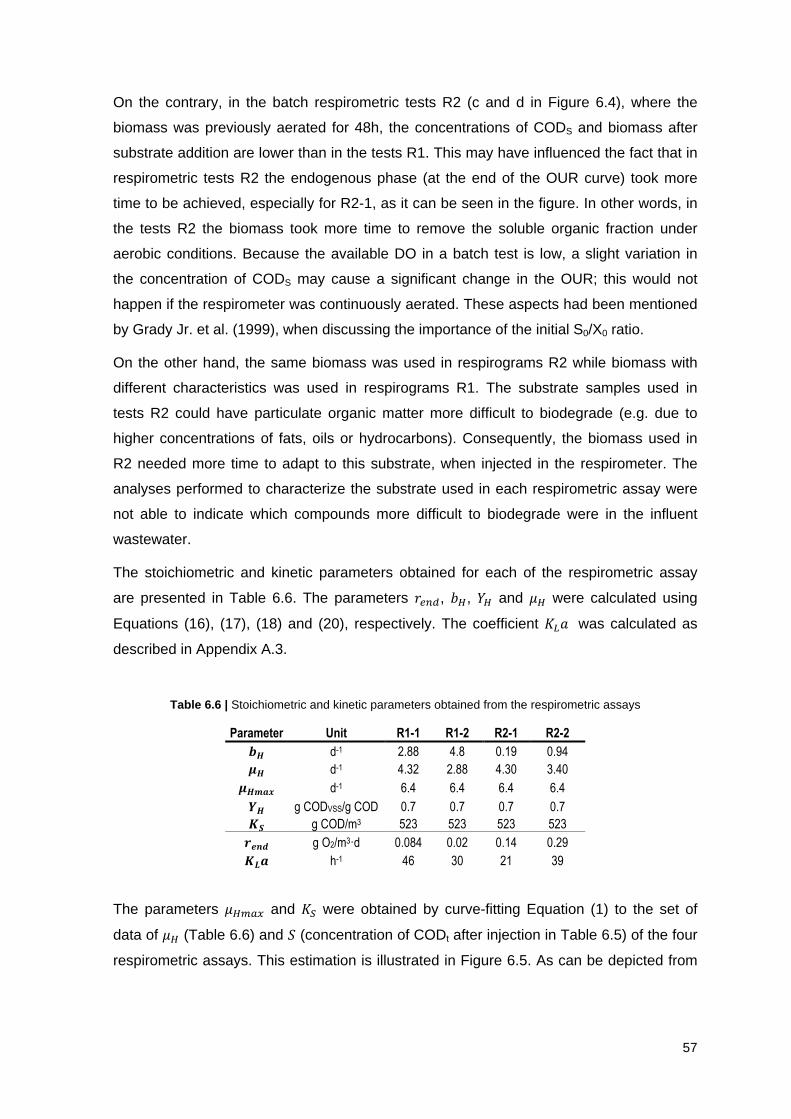
57
On the contrary, in the batch respirometric tests R2 (c and d in Figure 6.4), where the
biomass was previously aerated for 48h, the concentrations of CODS and biomass after
substrate addition are lower than in the tests R1. This may have influenced the fact that in
respirometric tests R2 the endogenous phase (at the end of the OUR curve) took more
time to be achieved, especially for R2-1, as it can be seen in the figure. In other words, in
the tests R2 the biomass took more time to remove the soluble organic fraction under
aerobic conditions. Because the available DO in a batch test is low, a slight variation in
the concentration of CODS may cause a significant change in the OUR; this would not
happen if the respirometer was continuously aerated. These aspects had been mentioned
by Grady Jr. et al. (1999), when discussing the importance of the initial S0/X0 ratio.
On the other hand, the same biomass was used in respirograms R2 while biomass with
different characteristics was used in respirograms R1. The substrate samples used in
tests R2 could have particulate organic matter more difficult to biodegrade (e.g. due to
higher concentrations of fats, oils or hydrocarbons). Consequently, the biomass used in
R2 needed more time to adapt to this substrate, when injected in the respirometer. The
analyses performed to characterize the substrate used in each respirometric assay were
not able to indicate which compounds more difficult to biodegrade were in the influent
wastewater.
The stoichiometric and kinetic parameters obtained for each of the respirometric assay
are presented in Table 6.6. The parameters GHIJ, ��, �� and �� were calculated using
Equations (16), (17), (18) and (20), respectively. The coefficient �� was calculated as
described in Appendix A.3.
Table 6.6 | Stoichiometric and kinetic parameters obtained from the respirometric assays
Parameter Unit R1-1 R1-2 R2-1 R2-2 �� d-1 2.88 4.8 0.19 0.94 �� d-1 4.32 2.88 4.30 3.40 ����� d-1 6.4 6.4 6.4 6.4 �� g CODVSS/g COD 0.7 0.7 0.7 0.7 � g COD/m3 523 523 523 523 ���� g O2/m3�d 0.084 0.02 0.14 0.29 ��� h-1 46 30 21 39
The parameters ����� and were obtained by curve-fitting Equation (1) to the set of
data of �� (Table 6.6) and � (concentration of CODt after injection in Table 6.5) of the four
respirometric assays. This estimation is illustrated in Figure 6.5. As can be depicted from
58
the figure, for a value of of 523 g COD/m3 the parameter �� equals to �����/2, which
means that in the experiments substrate was not limiting.
Figure 6.5 | Estimation of ����� and based on the data presented in Table 6.6
In general, reasonable results for ��, �� and ����� were obtained in comparison with
typical values for these parameters (Table 4.1). Concerning the decay rate, ��, only the
results obtained for R2-1 and R2-2 were consistent with the literature.
Model based interpretation
Since the major purpose of this work was to obtain kinetic and stoichiometric parameters
from respirometry to calibrate the WWTP simulation model more accurately, a model
based interpretation of the respirograms was carried out. Much research in recent years
has focused on the calibration of ASM3 with experimental respirometric data (Koch et al.,
2000; Karahan-Gül et al., 2002; Avcioglu et al., 2003; Schwarz et al., 2003; Mhlanga et
al., 2009). Hence, the dynamic biological model used was adapted from Avcioglu et al.
(2003) and consists in a simplified version of ASM3 for aerobic processes. The simplified
model fits empirical equations to the respirogram data considering three phases
(endogenous, storage and growth); in each phase different kinetic/stoichiometric
coefficients should be obtained. The process equations relative to the simplified model are
presented in Appendix A.4. For a set of parameters and initial conditions ( ), the model
was fitted to the experimental OUR data and the error (¡) was calculated by a least
squares method, as given in Equation (21), comparing simulated and experimental
respirograms (Mathieu & Etienne, 2000).
0
1
2
3
4
5
0 504 608 778 1256
µ H[d
-1]
S [g COD/m3]
Estimation of µHmax and KS
Experimental
Simulated
KSKS
µHmax/2
59
¡( ) = ¢ £¤¢ ¥#��H�¦( , (L) − #��QL�((L)§aUL¨� © ªmL,� − 1«¬n
�¨� (21)
Where: #��H�¦ = experimental heterotrophic oxygen uptake rate [h-1]; #��QL� = simulated heterotrophic oxygen uptake rate [h-1]; ( = time [h]; ; = number of phases constituting the model; � = number of measurements on each phase; mL,� = number of total measurements performed at each phase.
A simple optimization procedure was then used in order to minimize this function and
select optimized values for stoichiometric and/or kinetic coefficients.
Different methods for parameter estimation were compared and it was decided, as an
alternative approach, that the combination of the methods was more suitable. The
advantage was the ability to estimate more model coefficients as accurately as possible.
As an example of this approach, Table 6.7 summarizes the results obtained for the model
based interpretation of R1-2. In the table, five sets of parameters are presented
corresponding to five different combinations of parameter estimation methods.
The parameters �� , !� , )� and � were held constant and equal to ASM3 default
values for all trials. The inert fraction of soluble COD (+,) was considered to correspond to
the ratio of soluble COD measured at the beginning (substrate) and at the end of the
respirometric assay. � and !� (in Set 1) were obtained from the application of the
TSSCOD model of Influent Advisor, an auxiliary GPS-X tool for the characterization of
wastewater influent. In Set 5, the calculated parameters ��, ��, �� and presented in
Table 6.6 were simultaneously used, yet the error was higher than in the other cases.
Other parameters were obtained through model simulation.
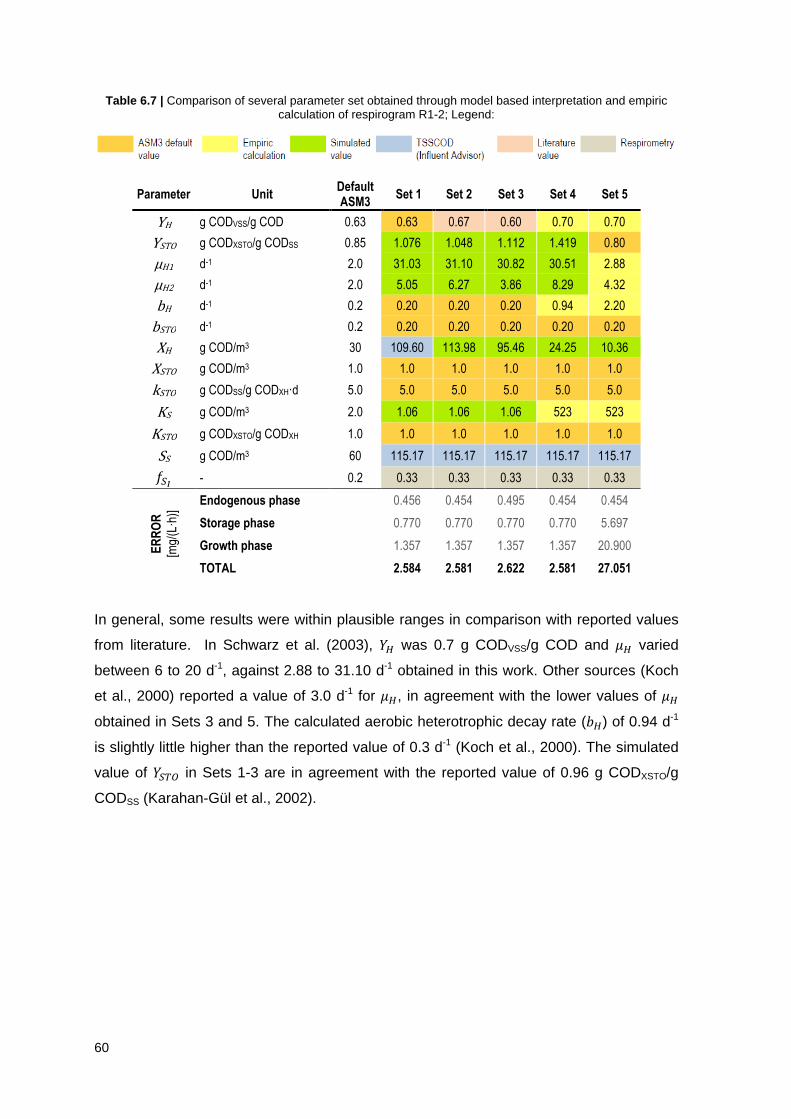
60
Table 6.7 | Comparison of several parameter set obtained through model based interpretation and empiric calculation of respirogram R1-2; Legend:
Parameter Unit Default ASM3
Set 1 Set 2 Set 3 Set 4 Set 5 YH g CODVSS/g COD 0.63 0.63 0.67 0.60 0.70 0.70 YSTO g CODXSTO/g CODSS 0.85 1.076 1.048 1.112 1.419 0.80 µH1 d-1 2.0 31.03 31.10 30.82 30.51 2.88 µH2 d-1 2.0 5.05 6.27 3.86 8.29 4.32 bH d-1 0.2 0.20 0.20 0.20 0.94 2.20 bSTO d-1 0.2 0.20 0.20 0.20 0.20 0.20 XH g COD/m3 30 109.60 113.98 95.46 24.25 10.36 XSTO g COD/m3 1.0 1.0 1.0 1.0 1.0 1.0 kSTO g CODSS/g CODXH�d 5.0 5.0 5.0 5.0 5.0 5.0 KS g COD/m3 2.0 1.06 1.06 1.06 523 523 KSTO g CODXSTO/g CODXH 1.0 1.0 1.0 1.0 1.0 1.0 SS g COD/m3 60 115.17 115.17 115.17 115.17 115.17 +, - 0.2 0.33 0.33 0.33 0.33 0.33
ER
RO
R
[mg/
(L�h
)] Endogenous phase 0.456 0.454 0.495 0.454 0.454
Storage phase
0.770 0.770 0.770 0.770 5.697
Growth phase
1.357 1.357 1.357 1.357 20.900
TOTAL
2.584 2.581 2.622 2.581 27.051
In general, some results were within plausible ranges in comparison with reported values
from literature. In Schwarz et al. (2003), �� was 0.7 g CODVSS/g COD and �� varied
between 6 to 20 d-1, against 2.88 to 31.10 d-1 obtained in this work. Other sources (Koch
et al., 2000) reported a value of 3.0 d-1 for ��, in agreement with the lower values of ��
obtained in Sets 3 and 5. The calculated aerobic heterotrophic decay rate (��) of 0.94 d-1
is slightly little higher than the reported value of 0.3 d-1 (Koch et al., 2000). The simulated
value of �� in Sets 1-3 are in agreement with the reported value of 0.96 g CODXSTO/g
CODSS (Karahan-Gül et al., 2002).
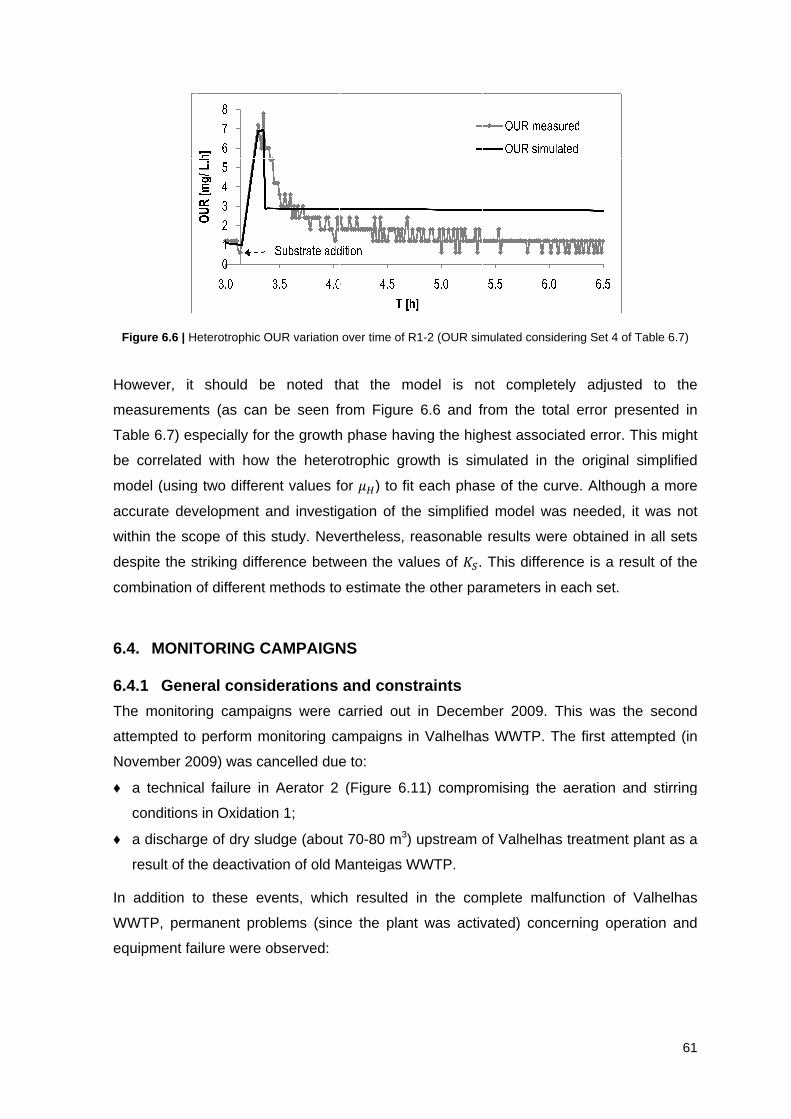
Figure
However, it should be noted that the model is not completely adj
measurements (as
Table
be correlated with how the heterotrophic growth is simulated in
model (
accurate development and investigation of the simplified model was needed, it was not
within the scope of this study. Nevertheless, reasonable results were obtained in a
despite the str
combination
6.4.
6.4.1
The m
attempted to perform m
November 2009) was cancelled due to
♦
♦
In addition to th
WWTP
equipment failure were observed
Figure
owever, it should be noted that the model is not completely adj
measurements (as
Table
be correlated with how the heterotrophic growth is simulated in
model (
accurate development and investigation of the simplified model was needed, it was not
within the scope of this study. Nevertheless, reasonable results were obtained in a
despite the str
combination
6.4.
6.4.1
The m
attempted to perform m
November 2009) was cancelled due to
a
conditions in Oxidation 1;
a
result of the deactivation of
In addition to th
WWTP
equipment failure were observed
Figure
owever, it should be noted that the model is not completely adj
measurements (as
Table 6
be correlated with how the heterotrophic growth is simulated in
model (
accurate development and investigation of the simplified model was needed, it was not
within the scope of this study. Nevertheless, reasonable results were obtained in a
despite the str
combination
M
6.4.1
The monitor
attempted to perform m
November 2009) was cancelled due to
technical failure in Aerator 2 (
conditions in Oxidation 1;
discharge of dry sludge (a
result of the deactivation of
In addition to th
WWTP,
equipment failure were observed
Figure 6.6
owever, it should be noted that the model is not completely adj
measurements (as
6.7) especially for the growth phase having the highest associated error. This
be correlated with how the heterotrophic growth is simulated in
model (using two different values
accurate development and investigation of the simplified model was needed, it was not
within the scope of this study. Nevertheless, reasonable results were obtained in a
despite the str
combination
MONITORING
General considerations and constrain
onitor
attempted to perform m
November 2009) was cancelled due to
technical failure in Aerator 2 (
conditions in Oxidation 1;
discharge of dry sludge (a
result of the deactivation of
In addition to th
, permanent problems (since the plant was activated)
equipment failure were observed
| H
owever, it should be noted that the model is not completely adj
measurements (as
) especially for the growth phase having the highest associated error. This
be correlated with how the heterotrophic growth is simulated in
sing two different values
accurate development and investigation of the simplified model was needed, it was not
within the scope of this study. Nevertheless, reasonable results were obtained in a
despite the str
combination of
ONITORING
General considerations and constrain
onitoring
attempted to perform m
November 2009) was cancelled due to
technical failure in Aerator 2 (
conditions in Oxidation 1;
discharge of dry sludge (a
result of the deactivation of
In addition to th
permanent problems (since the plant was activated)
equipment failure were observed
Heterotrophic
owever, it should be noted that the model is not completely adj
measurements (as
) especially for the growth phase having the highest associated error. This
be correlated with how the heterotrophic growth is simulated in
sing two different values
accurate development and investigation of the simplified model was needed, it was not
within the scope of this study. Nevertheless, reasonable results were obtained in a
despite the striking difference between the values of
of different methods to estimate the other parameters in each set.
ONITORING
General considerations and constrain
ing
attempted to perform m
November 2009) was cancelled due to
technical failure in Aerator 2 (
conditions in Oxidation 1;
discharge of dry sludge (a
result of the deactivation of
In addition to th
permanent problems (since the plant was activated)
equipment failure were observed
eterotrophic
owever, it should be noted that the model is not completely adj
measurements (as
) especially for the growth phase having the highest associated error. This
be correlated with how the heterotrophic growth is simulated in
sing two different values
accurate development and investigation of the simplified model was needed, it was not
within the scope of this study. Nevertheless, reasonable results were obtained in a
iking difference between the values of
different methods to estimate the other parameters in each set.
ONITORING
General considerations and constrain
campaigns were carried out in December 2009. This was the second
attempted to perform m
November 2009) was cancelled due to
technical failure in Aerator 2 (
conditions in Oxidation 1;
discharge of dry sludge (a
result of the deactivation of
In addition to the
permanent problems (since the plant was activated)
equipment failure were observed
eterotrophic
owever, it should be noted that the model is not completely adj
measurements (as can be
) especially for the growth phase having the highest associated error. This
be correlated with how the heterotrophic growth is simulated in
sing two different values
accurate development and investigation of the simplified model was needed, it was not
within the scope of this study. Nevertheless, reasonable results were obtained in a
iking difference between the values of
different methods to estimate the other parameters in each set.
ONITORING
General considerations and constrain
campaigns were carried out in December 2009. This was the second
attempted to perform m
November 2009) was cancelled due to
technical failure in Aerator 2 (
conditions in Oxidation 1;
discharge of dry sludge (a
result of the deactivation of
ese
permanent problems (since the plant was activated)
equipment failure were observed
eterotrophic OUR vari
owever, it should be noted that the model is not completely adj
can be
) especially for the growth phase having the highest associated error. This
be correlated with how the heterotrophic growth is simulated in
sing two different values
accurate development and investigation of the simplified model was needed, it was not
within the scope of this study. Nevertheless, reasonable results were obtained in a
iking difference between the values of
different methods to estimate the other parameters in each set.
ONITORING CAMPAIGNS
General considerations and constrain
campaigns were carried out in December 2009. This was the second
attempted to perform m
November 2009) was cancelled due to
technical failure in Aerator 2 (
conditions in Oxidation 1;
discharge of dry sludge (a
result of the deactivation of
events
permanent problems (since the plant was activated)
equipment failure were observed
OUR vari
owever, it should be noted that the model is not completely adj
can be
) especially for the growth phase having the highest associated error. This
be correlated with how the heterotrophic growth is simulated in
sing two different values
accurate development and investigation of the simplified model was needed, it was not
within the scope of this study. Nevertheless, reasonable results were obtained in a
iking difference between the values of
different methods to estimate the other parameters in each set.
CAMPAIGNS
General considerations and constrain
campaigns were carried out in December 2009. This was the second
attempted to perform monitoring
November 2009) was cancelled due to
technical failure in Aerator 2 (
conditions in Oxidation 1;
discharge of dry sludge (a
result of the deactivation of
events
permanent problems (since the plant was activated)
equipment failure were observed
OUR vari
owever, it should be noted that the model is not completely adj
can be seen
) especially for the growth phase having the highest associated error. This
be correlated with how the heterotrophic growth is simulated in
sing two different values
accurate development and investigation of the simplified model was needed, it was not
within the scope of this study. Nevertheless, reasonable results were obtained in a
iking difference between the values of
different methods to estimate the other parameters in each set.
CAMPAIGNS
General considerations and constrain
campaigns were carried out in December 2009. This was the second
onitoring
November 2009) was cancelled due to
technical failure in Aerator 2 (
conditions in Oxidation 1;
discharge of dry sludge (a
result of the deactivation of
events,
permanent problems (since the plant was activated)
equipment failure were observed
OUR variation over
owever, it should be noted that the model is not completely adj
seen
) especially for the growth phase having the highest associated error. This
be correlated with how the heterotrophic growth is simulated in
sing two different values
accurate development and investigation of the simplified model was needed, it was not
within the scope of this study. Nevertheless, reasonable results were obtained in a
iking difference between the values of
different methods to estimate the other parameters in each set.
CAMPAIGNS
General considerations and constrain
campaigns were carried out in December 2009. This was the second
onitoring
November 2009) was cancelled due to
technical failure in Aerator 2 (
discharge of dry sludge (about 70
result of the deactivation of old
, which
permanent problems (since the plant was activated)
equipment failure were observed
ation over
owever, it should be noted that the model is not completely adj
seen from
) especially for the growth phase having the highest associated error. This
be correlated with how the heterotrophic growth is simulated in
sing two different values for
accurate development and investigation of the simplified model was needed, it was not
within the scope of this study. Nevertheless, reasonable results were obtained in a
iking difference between the values of
different methods to estimate the other parameters in each set.
CAMPAIGNS
General considerations and constrain
campaigns were carried out in December 2009. This was the second
onitoring campaigns in Valhelhas WWTP. The first attempted (in
November 2009) was cancelled due to
technical failure in Aerator 2 (
bout 70
old Manteigas
which
permanent problems (since the plant was activated)
equipment failure were observed:
ation over
owever, it should be noted that the model is not completely adj
from
) especially for the growth phase having the highest associated error. This
be correlated with how the heterotrophic growth is simulated in
for
accurate development and investigation of the simplified model was needed, it was not
within the scope of this study. Nevertheless, reasonable results were obtained in a
iking difference between the values of
different methods to estimate the other parameters in each set.
CAMPAIGNS
General considerations and constrain
campaigns were carried out in December 2009. This was the second
campaigns in Valhelhas WWTP. The first attempted (in
November 2009) was cancelled due to
technical failure in Aerator 2 (Figure
bout 70
Manteigas
which resulted in
permanent problems (since the plant was activated)
ation over time
owever, it should be noted that the model is not completely adj
from Figure
) especially for the growth phase having the highest associated error. This
be correlated with how the heterotrophic growth is simulated in
for ��) t
accurate development and investigation of the simplified model was needed, it was not
within the scope of this study. Nevertheless, reasonable results were obtained in a
iking difference between the values of
different methods to estimate the other parameters in each set.
General considerations and constrain
campaigns were carried out in December 2009. This was the second
campaigns in Valhelhas WWTP. The first attempted (in
November 2009) was cancelled due to:
Figure
bout 70-80 m
Manteigas
resulted in
permanent problems (since the plant was activated)
time
owever, it should be noted that the model is not completely adj
Figure
) especially for the growth phase having the highest associated error. This
be correlated with how the heterotrophic growth is simulated in
) to fit each phase of the curve.
accurate development and investigation of the simplified model was needed, it was not
within the scope of this study. Nevertheless, reasonable results were obtained in a
iking difference between the values of
different methods to estimate the other parameters in each set.
General considerations and constrain
campaigns were carried out in December 2009. This was the second
campaigns in Valhelhas WWTP. The first attempted (in
Figure
80 m
Manteigas
resulted in
permanent problems (since the plant was activated)
of R
owever, it should be noted that the model is not completely adj
Figure
) especially for the growth phase having the highest associated error. This
be correlated with how the heterotrophic growth is simulated in
o fit each phase of the curve.
accurate development and investigation of the simplified model was needed, it was not
within the scope of this study. Nevertheless, reasonable results were obtained in a
iking difference between the values of
different methods to estimate the other parameters in each set.
General considerations and constrain
campaigns were carried out in December 2009. This was the second
campaigns in Valhelhas WWTP. The first attempted (in
Figure 6.11
80 m3)
Manteigas WWTP
resulted in
permanent problems (since the plant was activated)
R1-2
owever, it should be noted that the model is not completely adj
Figure 6.
) especially for the growth phase having the highest associated error. This
be correlated with how the heterotrophic growth is simulated in
o fit each phase of the curve.
accurate development and investigation of the simplified model was needed, it was not
within the scope of this study. Nevertheless, reasonable results were obtained in a
iking difference between the values of
different methods to estimate the other parameters in each set.
General considerations and constrain
campaigns were carried out in December 2009. This was the second
campaigns in Valhelhas WWTP. The first attempted (in
11) compromising the aeration and sti
) upstream of Valhelhas treatment plant as a
WWTP
resulted in
permanent problems (since the plant was activated)
2 (OUR simulated considering Set 4 of
owever, it should be noted that the model is not completely adj
.6
) especially for the growth phase having the highest associated error. This
be correlated with how the heterotrophic growth is simulated in
o fit each phase of the curve.
accurate development and investigation of the simplified model was needed, it was not
within the scope of this study. Nevertheless, reasonable results were obtained in a
iking difference between the values of
different methods to estimate the other parameters in each set.
General considerations and constrain
campaigns were carried out in December 2009. This was the second
campaigns in Valhelhas WWTP. The first attempted (in
) compromising the aeration and sti
upstream of Valhelhas treatment plant as a
WWTP
the complete malfunction
permanent problems (since the plant was activated)
(OUR simulated considering Set 4 of
owever, it should be noted that the model is not completely adj
and
) especially for the growth phase having the highest associated error. This
be correlated with how the heterotrophic growth is simulated in
o fit each phase of the curve.
accurate development and investigation of the simplified model was needed, it was not
within the scope of this study. Nevertheless, reasonable results were obtained in a
iking difference between the values of different methods to estimate the other parameters in each set.
General considerations and constrain ts
campaigns were carried out in December 2009. This was the second
campaigns in Valhelhas WWTP. The first attempted (in
) compromising the aeration and sti
upstream of Valhelhas treatment plant as a
WWTP.
the complete malfunction
permanent problems (since the plant was activated)
(OUR simulated considering Set 4 of
owever, it should be noted that the model is not completely adj
and from the total error presented in
) especially for the growth phase having the highest associated error. This
be correlated with how the heterotrophic growth is simulated in
o fit each phase of the curve.
accurate development and investigation of the simplified model was needed, it was not
within the scope of this study. Nevertheless, reasonable results were obtained in a.
different methods to estimate the other parameters in each set.
campaigns were carried out in December 2009. This was the second
campaigns in Valhelhas WWTP. The first attempted (in
) compromising the aeration and sti
upstream of Valhelhas treatment plant as a
the complete malfunction
permanent problems (since the plant was activated)
(OUR simulated considering Set 4 of
owever, it should be noted that the model is not completely adj
from the total error presented in
) especially for the growth phase having the highest associated error. This
be correlated with how the heterotrophic growth is simulated in
o fit each phase of the curve.
accurate development and investigation of the simplified model was needed, it was not
within the scope of this study. Nevertheless, reasonable results were obtained in a
This difference
different methods to estimate the other parameters in each set.
campaigns were carried out in December 2009. This was the second
campaigns in Valhelhas WWTP. The first attempted (in
) compromising the aeration and sti
upstream of Valhelhas treatment plant as a
the complete malfunction
permanent problems (since the plant was activated) concerning operation and
(OUR simulated considering Set 4 of
owever, it should be noted that the model is not completely adj
from the total error presented in
) especially for the growth phase having the highest associated error. This
be correlated with how the heterotrophic growth is simulated in
o fit each phase of the curve.
accurate development and investigation of the simplified model was needed, it was not
within the scope of this study. Nevertheless, reasonable results were obtained in a
This difference
different methods to estimate the other parameters in each set.
campaigns were carried out in December 2009. This was the second
campaigns in Valhelhas WWTP. The first attempted (in
) compromising the aeration and sti
upstream of Valhelhas treatment plant as a
the complete malfunction
concerning operation and
(OUR simulated considering Set 4 of
owever, it should be noted that the model is not completely adj
from the total error presented in
) especially for the growth phase having the highest associated error. This
the original simplified
o fit each phase of the curve. Although a more
accurate development and investigation of the simplified model was needed, it was not
within the scope of this study. Nevertheless, reasonable results were obtained in a
This difference is a
different methods to estimate the other parameters in each set.
campaigns were carried out in December 2009. This was the second
campaigns in Valhelhas WWTP. The first attempted (in
) compromising the aeration and sti
upstream of Valhelhas treatment plant as a
the complete malfunction
concerning operation and
(OUR simulated considering Set 4 of
owever, it should be noted that the model is not completely adjusted to the
from the total error presented in
) especially for the growth phase having the highest associated error. This
the original simplified
Although a more
accurate development and investigation of the simplified model was needed, it was not
within the scope of this study. Nevertheless, reasonable results were obtained in a
is a
different methods to estimate the other parameters in each set.
campaigns were carried out in December 2009. This was the second
campaigns in Valhelhas WWTP. The first attempted (in
) compromising the aeration and sti
upstream of Valhelhas treatment plant as a
the complete malfunction
concerning operation and
(OUR simulated considering Set 4 of
usted to the
from the total error presented in
) especially for the growth phase having the highest associated error. This
the original simplified
Although a more
accurate development and investigation of the simplified model was needed, it was not
within the scope of this study. Nevertheless, reasonable results were obtained in a
is a result
different methods to estimate the other parameters in each set.
campaigns were carried out in December 2009. This was the second
campaigns in Valhelhas WWTP. The first attempted (in
) compromising the aeration and sti
upstream of Valhelhas treatment plant as a
of Valhelhas
concerning operation and
(OUR simulated considering Set 4 of Table
usted to the
from the total error presented in
) especially for the growth phase having the highest associated error. This
the original simplified
Although a more
accurate development and investigation of the simplified model was needed, it was not
within the scope of this study. Nevertheless, reasonable results were obtained in a
result
campaigns were carried out in December 2009. This was the second
campaigns in Valhelhas WWTP. The first attempted (in
) compromising the aeration and sti
upstream of Valhelhas treatment plant as a
of Valhelhas
concerning operation and
Table
usted to the
from the total error presented in
) especially for the growth phase having the highest associated error. This
the original simplified
Although a more
accurate development and investigation of the simplified model was needed, it was not
within the scope of this study. Nevertheless, reasonable results were obtained in all sets
result o
campaigns were carried out in December 2009. This was the second
campaigns in Valhelhas WWTP. The first attempted (in
) compromising the aeration and sti
upstream of Valhelhas treatment plant as a
of Valhelhas
concerning operation and
Table 6.7
usted to the
from the total error presented in
) especially for the growth phase having the highest associated error. This might
the original simplified
Although a more
accurate development and investigation of the simplified model was needed, it was not
ll sets
of the
campaigns were carried out in December 2009. This was the second
campaigns in Valhelhas WWTP. The first attempted (in
) compromising the aeration and stirring
upstream of Valhelhas treatment plant as a
of Valhelhas
concerning operation and
61
7)
usted to the
from the total error presented in
might
the original simplified
Although a more
accurate development and investigation of the simplified model was needed, it was not
ll sets
f the
campaigns were carried out in December 2009. This was the second
campaigns in Valhelhas WWTP. The first attempted (in
rring
upstream of Valhelhas treatment plant as a
of Valhelhas
concerning operation and
61
usted to the
from the total error presented in
might
the original simplified
Although a more
accurate development and investigation of the simplified model was needed, it was not
ll sets
f the
campaigns were carried out in December 2009. This was the second
campaigns in Valhelhas WWTP. The first attempted (in
rring
upstream of Valhelhas treatment plant as a
of Valhelhas
concerning operation and
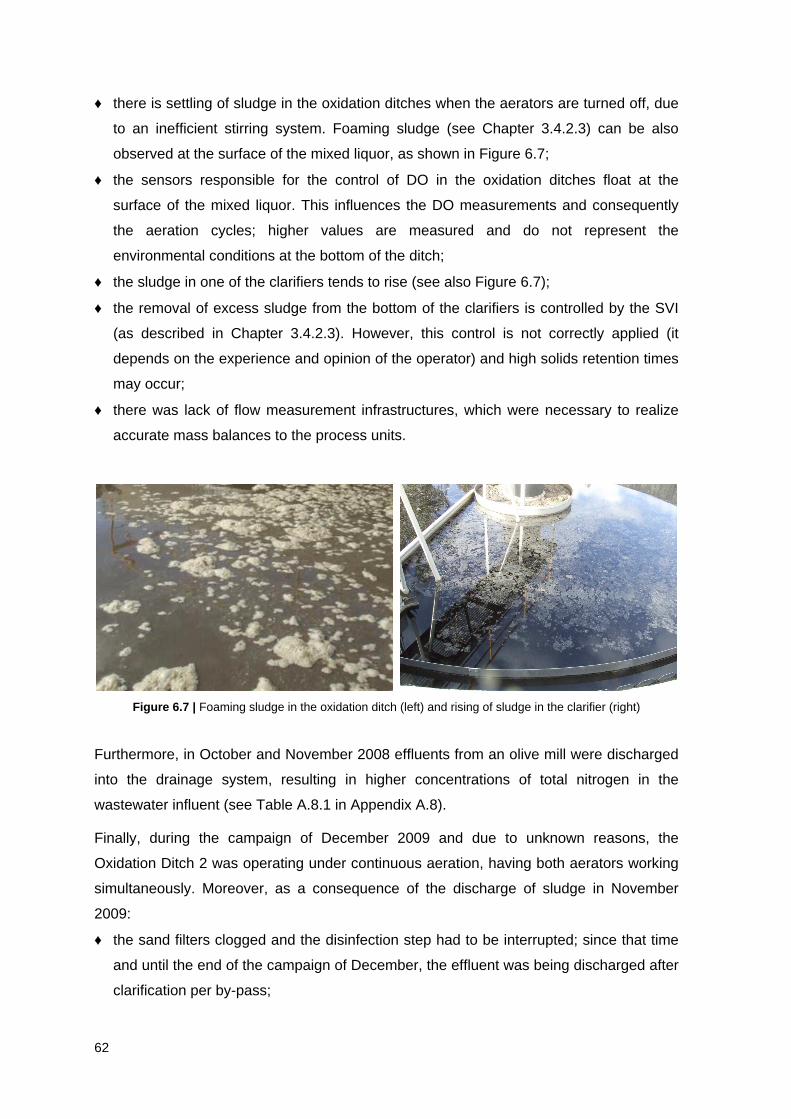
62
♦ there is settling of sludge in the oxidation ditches when the aerators are turned off, due
to an inefficient stirring system. Foaming sludge (see Chapter 3.4.2.3) can be also
observed at the surface of the mixed liquor, as shown in Figure 6.7;
♦ the sensors responsible for the control of DO in the oxidation ditches float at the
surface of the mixed liquor. This influences the DO measurements and consequently
the aeration cycles; higher values are measured and do not represent the
environmental conditions at the bottom of the ditch;
♦ the sludge in one of the clarifiers tends to rise (see also Figure 6.7);
♦ the removal of excess sludge from the bottom of the clarifiers is controlled by the SVI
(as described in Chapter 3.4.2.3). However, this control is not correctly applied (it
depends on the experience and opinion of the operator) and high solids retention times
may occur;
♦ there was lack of flow measurement infrastructures, which were necessary to realize
accurate mass balances to the process units.
Figure 6.7 | Foaming sludge in the oxidation ditch (left) and rising of sludge in the clarifier (right)
Furthermore, in October and November 2008 effluents from an olive mill were discharged
into the drainage system, resulting in higher concentrations of total nitrogen in the
wastewater influent (see Table A.8.1 in Appendix A.8).
Finally, during the campaign of December 2009 and due to unknown reasons, the
Oxidation Ditch 2 was operating under continuous aeration, having both aerators working
simultaneously. Moreover, as a consequence of the discharge of sludge in November
2009:
♦ the sand filters clogged and the disinfection step had to be interrupted; since that time
and until the end of the campaign of December, the effluent was being discharged after
clarification per by-pass;
63
♦ the collection tank of sidestreams (drainages and liquid removed by sludge dewatering
processes) accumulated a great amount of sediments, generating the establishment of
a thick layer of solids enmeshed in sludge at the liquid surface, as depicted in Figure
6.8. As a result the pumping control was changed into manual because the level
sensors became stuck in that layer and could not work properly, and in the sludge
treatment building occurred floods since there is a connection to that tank in the ground
(see Appendix A.7).
6.4.2 Description and methods
The monitoring campaigns of December included a 1-day campaign (in order to obtain
data to calibrate the WWTP model) and, after a one-day break, a 2-day campaign (aiming
to collect information for model validation). During the 1-day campaign samples were
collected every 3 hours in several locations of the WWTP as indicated in Appendix A.7
and illustrated in Figure 6.8. On the 2-days campaign, samples were collected only twice
per day in the exact same locations.
Discrete samples were carefully manually collected, stored in refrigerated boxes and
transported to the laboratory, twice per campaign. The influent samples were analyzed for
the following parameters: TSS, VSS, COD, BOD5, Ntotal, NH3-N, NH4-N, NO2-N, NO3-N,
Ptotal and fecal coliforms. The effluent samples were analyzed for TSS, VSS, COD, BOD5,
Ntotal, Ptotal and fecal coliforms. Samples taken from intermediate sections of the WWTP
were analyzed for TSS, VSS and COD. In Table 6.8 the analytical methods used in the
measurement of those parameters are indicated. Influent and recirculation flow data were
obtained from the treatment plant operation logbooks.
Table 6.8 | Analytical methods used for physical-chemical and microbiological measurements during the campaign at Valhelhas WWTP
Parameter Analytical method
BOD5 Manometric with pressure sensor (OxiTop®C system)
COD Digestion using potassium dichromate TSS/VSS Filtration, drying at 105 ºC and ignition at 550 ºC Ntotal, nitrite, nitrate, ammonium and Ptotal Ultraviolet spectrophotometry Fecal coliforms Multiple tubes: Most Probable Number (MPN)
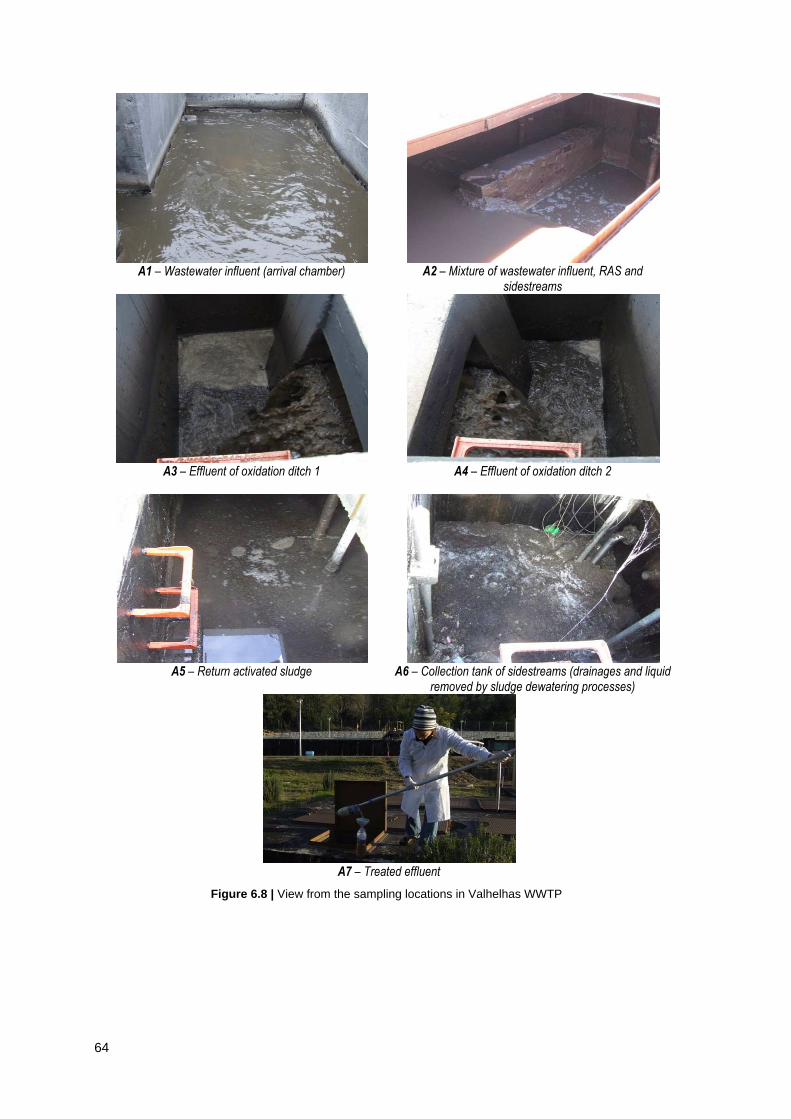
64
A1 – Wastewater influent (arrival chamber)
A2 – Mixture of wastewater influent, RAS and
sidestreams
A3 – Effluent of oxidation ditch 1
A4 – Effluent of oxidation ditch 2
A5 – Return activated sludge
A6 – Collection tank of sidestreams (drainages and liquid
removed by sludge dewatering processes)
A7 – Treated effluent
Figure 6.8 | View from the sampling locations in Valhelhas WWTP
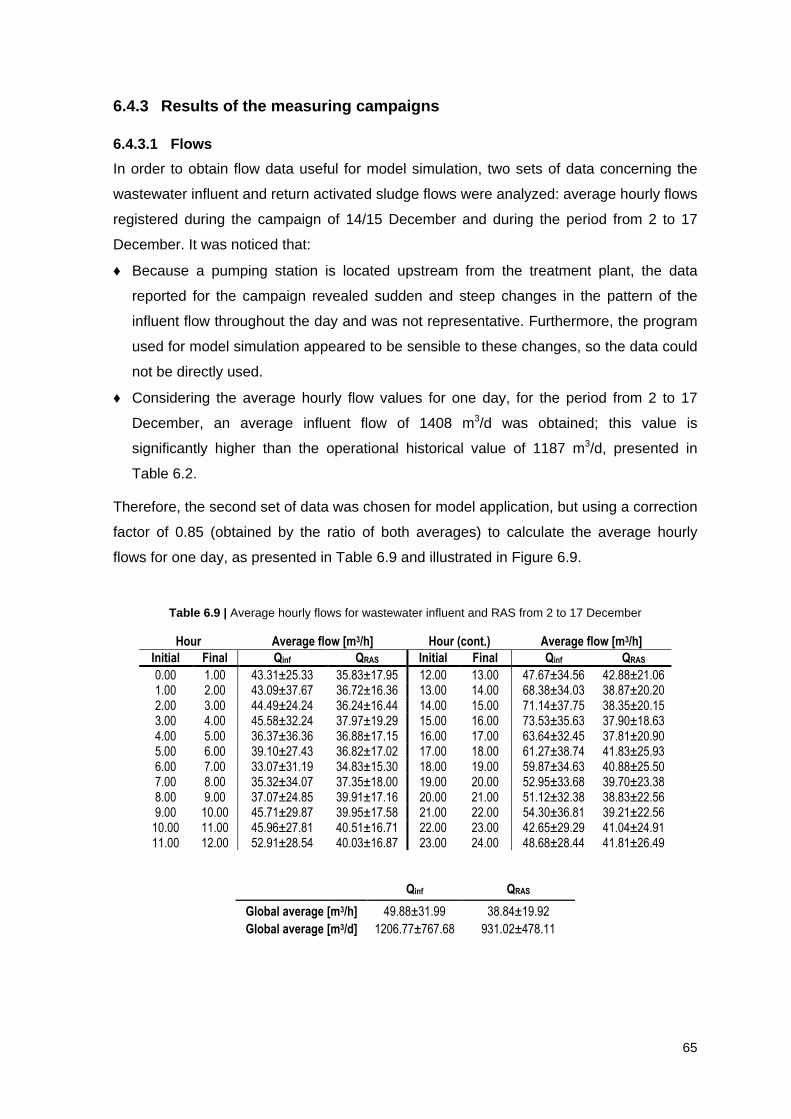
65
6.4.3 Results of the measuring campaigns
6.4.3.1 Flows
In order to obtain flow data useful for model simulation, two sets of data concerning the
wastewater influent and return activated sludge flows were analyzed: average hourly flows
registered during the campaign of 14/15 December and during the period from 2 to 17
December. It was noticed that:
♦ Because a pumping station is located upstream from the treatment plant, the data
reported for the campaign revealed sudden and steep changes in the pattern of the
influent flow throughout the day and was not representative. Furthermore, the program
used for model simulation appeared to be sensible to these changes, so the data could
not be directly used.
♦ Considering the average hourly flow values for one day, for the period from 2 to 17
December, an average influent flow of 1408 m3/d was obtained; this value is
significantly higher than the operational historical value of 1187 m3/d, presented in
Table 6.2.
Therefore, the second set of data was chosen for model application, but using a correction
factor of 0.85 (obtained by the ratio of both averages) to calculate the average hourly
flows for one day, as presented in Table 6.9 and illustrated in Figure 6.9.
Table 6.9 | Average hourly flows for wastewater influent and RAS from 2 to 17 December
Hour Average flow [m3/h] Hour (cont.) Average flow [m3/h]
Initial Final Qinf QRAS Initial Final Qinf QRAS
0.00 1.00 43.31±25.33 35.83±17.95 12.00 13.00 47.67±34.56 42.88±21.06 1.00 2.00 43.09±37.67 36.72±16.36 13.00 14.00 68.38±34.03 38.87±20.20 2.00 3.00 44.49±24.24 36.24±16.44 14.00 15.00 71.14±37.75 38.35±20.15 3.00 4.00 45.58±32.24 37.97±19.29 15.00 16.00 73.53±35.63 37.90±18.63 4.00 5.00 36.37±36.36 36.88±17.15 16.00 17.00 63.64±32.45 37.81±20.90 5.00 6.00 39.10±27.43 36.82±17.02 17.00 18.00 61.27±38.74 41.83±25.93 6.00 7.00 33.07±31.19 34.83±15.30 18.00 19.00 59.87±34.63 40.88±25.50 7.00 8.00 35.32±34.07 37.35±18.00 19.00 20.00 52.95±33.68 39.70±23.38 8.00 9.00 37.07±24.85 39.91±17.16 20.00 21.00 51.12±32.38 38.83±22.56 9.00 10.00 45.71±29.87 39.95±17.58 21.00 22.00 54.30±36.81 39.21±22.56
10.00 11.00 45.96±27.81 40.51±16.71 22.00 23.00 42.65±29.29 41.04±24.91 11.00 12.00 52.91±28.54 40.03±16.87 23.00 24.00 48.68±28.44 41.81±26.49
Qinf QRAS
Global average [m3/h] 49.88±31.99 38.84±19.92
Global average [m3/d] 1206.77±767.68 931.02±478.11
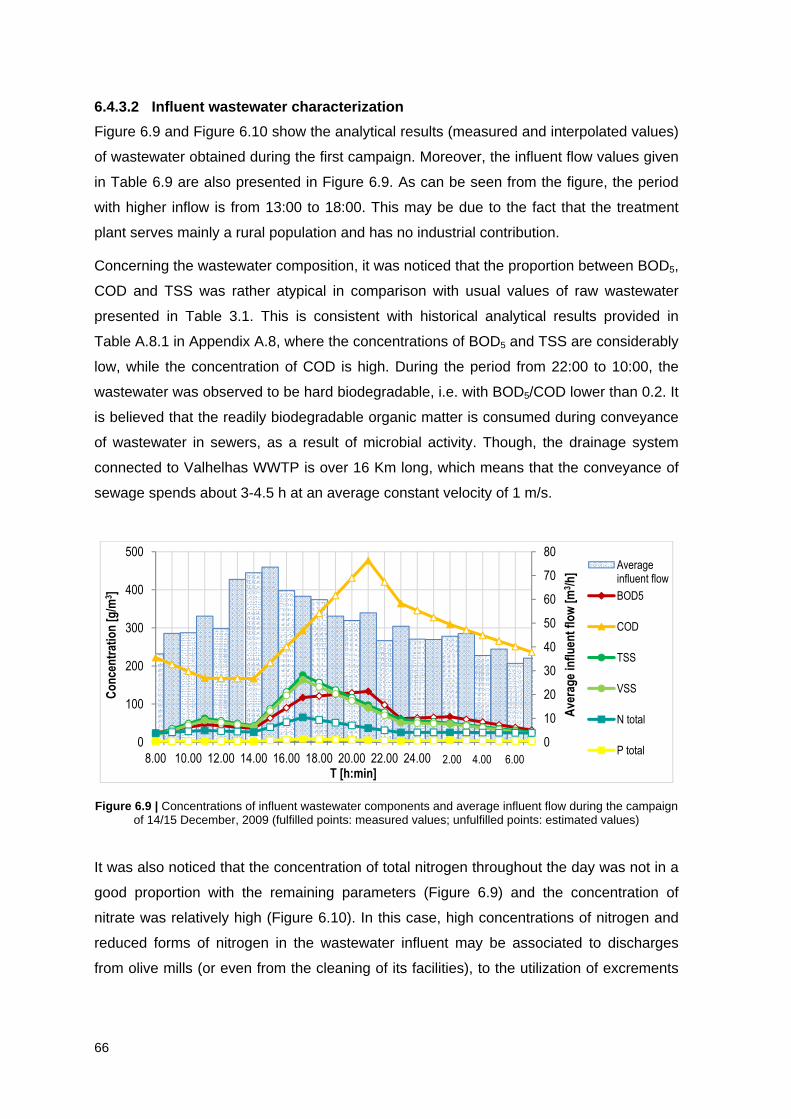
66
6.4.3.2 Influent wastewater characterization
Figure 6.9 and Figure 6.10 show the analytical results (measured and interpolated values)
of wastewater obtained during the first campaign. Moreover, the influent flow values given
in Table 6.9 are also presented in Figure 6.9. As can be seen from the figure, the period
with higher inflow is from 13:00 to 18:00. This may be due to the fact that the treatment
plant serves mainly a rural population and has no industrial contribution.
Concerning the wastewater composition, it was noticed that the proportion between BOD5,
COD and TSS was rather atypical in comparison with usual values of raw wastewater
presented in Table 3.1. This is consistent with historical analytical results provided in
Table A.8.1 in Appendix A.8, where the concentrations of BOD5 and TSS are considerably
low, while the concentration of COD is high. During the period from 22:00 to 10:00, the
wastewater was observed to be hard biodegradable, i.e. with BOD5/COD lower than 0.2. It
is believed that the readily biodegradable organic matter is consumed during conveyance
of wastewater in sewers, as a result of microbial activity. Though, the drainage system
connected to Valhelhas WWTP is over 16 Km long, which means that the conveyance of
sewage spends about 3-4.5 h at an average constant velocity of 1 m/s.
Figure 6.9 | Concentrations of influent wastewater components and average influent flow during the campaign of 14/15 December, 2009 (fulfilled points: measured values; unfulfilled points: estimated values)
It was also noticed that the concentration of total nitrogen throughout the day was not in a
good proportion with the remaining parameters (Figure 6.9) and the concentration of
nitrate was relatively high (Figure 6.10). In this case, high concentrations of nitrogen and
reduced forms of nitrogen in the wastewater influent may be associated to discharges
from olive mills (or even from the cleaning of its facilities), to the utilization of excrements
8.00 10.00 12.00 14.00 16.00 18.00 20.00 22.00 24.00 26.00 28.00 30.00
0
10
20
30
40
50
60
70
80
0
100
200
300
400
500
Ave
rag
e in
flu
ent
flo
w [
m3 /
h]
Co
nce
ntr
atio
n [
g/m
3 ]
T [h:min]
Average influent flow
BOD5
COD
TSS
VSS
N total
P total2.00 4.00 6.00
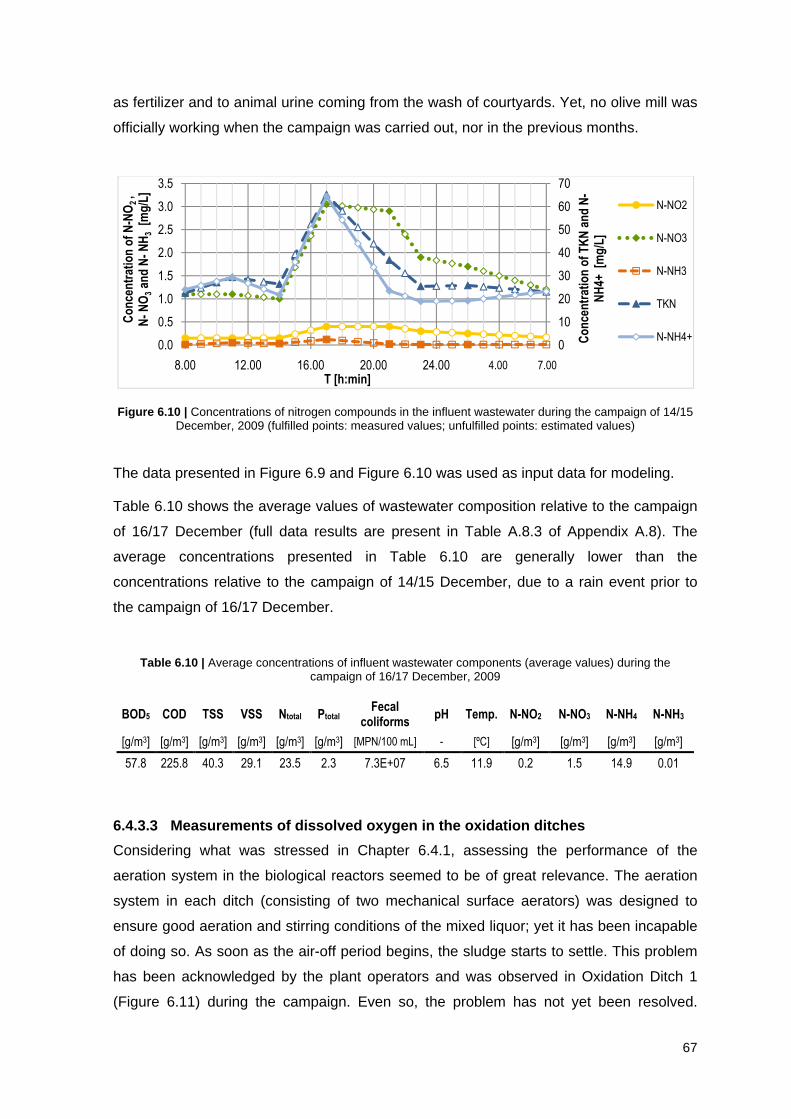
67
as fertilizer and to animal urine coming from the wash of courtyards. Yet, no olive mill was
officially working when the campaign was carried out, nor in the previous months.
Figure 6.10 | Concentrations of nitrogen compounds in the influent wastewater during the campaign of 14/15 December, 2009 (fulfilled points: measured values; unfulfilled points: estimated values)
The data presented in Figure 6.9 and Figure 6.10 was used as input data for modeling.
Table 6.10 shows the average values of wastewater composition relative to the campaign
of 16/17 December (full data results are present in Table A.8.3 of Appendix A.8). The
average concentrations presented in Table 6.10 are generally lower than the
concentrations relative to the campaign of 14/15 December, due to a rain event prior to
the campaign of 16/17 December.
Table 6.10 | Average concentrations of influent wastewater components (average values) during the campaign of 16/17 December, 2009
BOD5 COD TSS VSS Ntotal Ptotal Fecal
coliforms pH Temp. N-NO2 N-NO3 N-NH4 N-NH3
[g/m3] [g/m3] [g/m3] [g/m3] [g/m3] [g/m3] [MPN/100 mL] - [ºC] [g/m3] [g/m3] [g/m3] [g/m3]
57.8 225.8 40.3 29.1 23.5 2.3 7.3E+07 6.5 11.9 0.2 1.5 14.9 0.01
6.4.3.3 Measurements of dissolved oxygen in the oxi dation ditches
Considering what was stressed in Chapter 6.4.1, assessing the performance of the
aeration system in the biological reactors seemed to be of great relevance. The aeration
system in each ditch (consisting of two mechanical surface aerators) was designed to
ensure good aeration and stirring conditions of the mixed liquor; yet it has been incapable
of doing so. As soon as the air-off period begins, the sludge starts to settle. This problem
has been acknowledged by the plant operators and was observed in Oxidation Ditch 1
(Figure 6.11) during the campaign. Even so, the problem has not yet been resolved.
0
10
20
30
40
50
60
70
0.0
0.5
1.0
1.5
2.0
2.5
3.0
3.5
8.00 12.00 16.00 20.00 24.00 28.00
Co
nce
ntr
atio
n o
f T
KN
an
d N
-N
H4+
[m
g/L
]
Co
nce
ntr
atio
n o
f N
-NO
2 ,
N-
NO
3an
d N
-N
H3
[mg
/L]
T [h:min]
N-NO2
N-NO3
N-NH3
TKN
N-NH4+
4.00 7.00
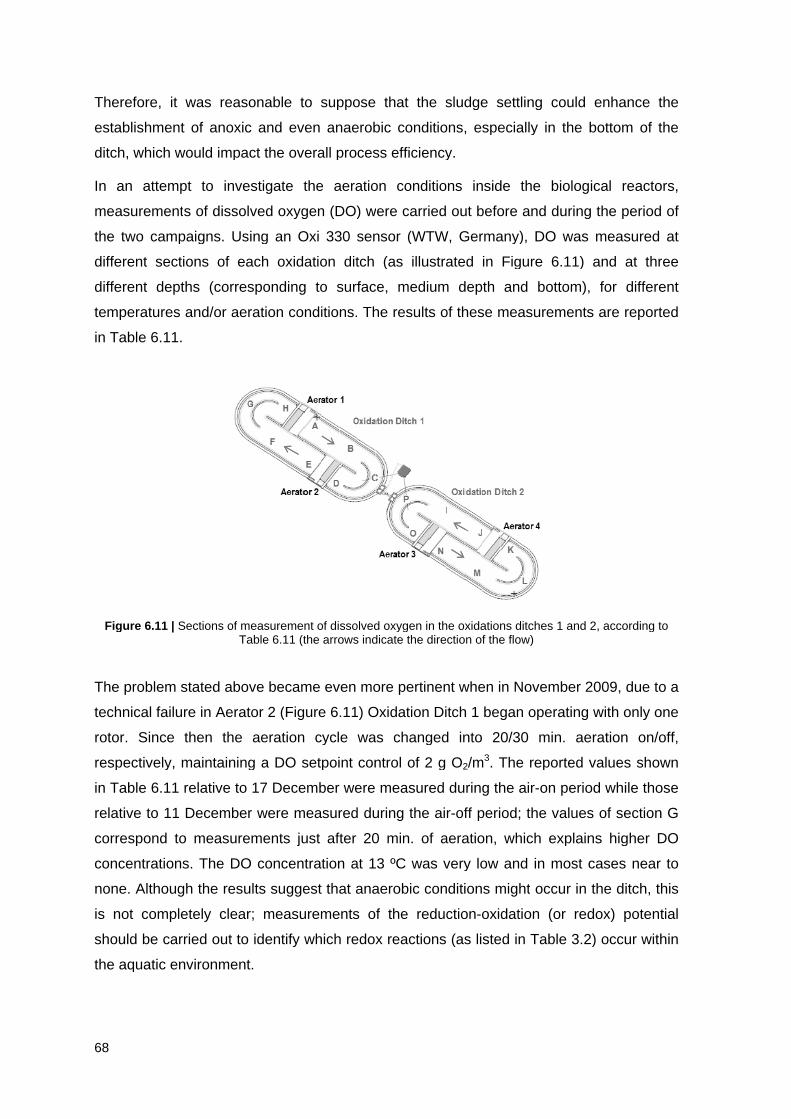
68
Therefore, it was reasonable to suppose that the sludge settling could
establishment of anoxic and even anaerobic conditions, especially in the bottom of the
ditch
In an attempt to
measurement
the two campaigns
different sections of each oxidation ditch (as illustrated in
different depths (corresponding to surface, medium depth and bottom), for different
temperatures and/or aeration conditions. The results of these measurements are reported
in
Figure
The
technical failure in Aerator 2 (
rotor.
respec
in
relative to 11
correspond to measurements just after 20 min. of aeration, which explains higher DO
concentrations. Th
none
is not completely clear; measurements of the reduction
should be carried out
the aquatic env
68
Therefore, it was reasonable to suppose that the sludge settling could
establishment of anoxic and even anaerobic conditions, especially in the bottom of the
ditch
In an attempt to
measurement
the two campaigns
different sections of each oxidation ditch (as illustrated in
different depths (corresponding to surface, medium depth and bottom), for different
temperatures and/or aeration conditions. The results of these measurements are reported
in Table
Figure
The problem stated above
technical failure in Aerator 2 (
rotor.
respec
in Table
relative to 11
correspond to measurements just after 20 min. of aeration, which explains higher DO
concentrations. Th
none
is not completely clear; measurements of the reduction
should be carried out
the aquatic env
Therefore, it was reasonable to suppose that the sludge settling could
establishment of anoxic and even anaerobic conditions, especially in the bottom of the
ditch, which would impact
In an attempt to
measurement
the two campaigns
different sections of each oxidation ditch (as illustrated in
different depths (corresponding to surface, medium depth and bottom), for different
temperatures and/or aeration conditions. The results of these measurements are reported
Table
Figure
problem stated above
technical failure in Aerator 2 (
rotor. S
respectively, maintaining a DO setpoint control
Table
relative to 11
correspond to measurements just after 20 min. of aeration, which explains higher DO
concentrations. Th
none. Although the results suggest that anaerobic conditi
is not completely clear; measurements of the reduction
should be carried out
the aquatic env
Therefore, it was reasonable to suppose that the sludge settling could
establishment of anoxic and even anaerobic conditions, especially in the bottom of the
, which would impact
In an attempt to
measurement
the two campaigns
different sections of each oxidation ditch (as illustrated in
different depths (corresponding to surface, medium depth and bottom), for different
temperatures and/or aeration conditions. The results of these measurements are reported
Table 6.
Figure 6.11
problem stated above
technical failure in Aerator 2 (
Since then the aeration cycle was changed into 20/30 min. aeration on/off,
tively, maintaining a DO setpoint control
Table 6.
relative to 11
correspond to measurements just after 20 min. of aeration, which explains higher DO
concentrations. Th
Although the results suggest that anaerobic conditi
is not completely clear; measurements of the reduction
should be carried out
the aquatic env
Therefore, it was reasonable to suppose that the sludge settling could
establishment of anoxic and even anaerobic conditions, especially in the bottom of the
, which would impact
In an attempt to
measurement
the two campaigns
different sections of each oxidation ditch (as illustrated in
different depths (corresponding to surface, medium depth and bottom), for different
temperatures and/or aeration conditions. The results of these measurements are reported
.11
11 | Sections of measurement of dissolved oxygen in the oxidations ditches 1 and 2, according to
problem stated above
technical failure in Aerator 2 (
ince then the aeration cycle was changed into 20/30 min. aeration on/off,
tively, maintaining a DO setpoint control
.11
relative to 11
correspond to measurements just after 20 min. of aeration, which explains higher DO
concentrations. Th
Although the results suggest that anaerobic conditi
is not completely clear; measurements of the reduction
should be carried out
the aquatic env
Therefore, it was reasonable to suppose that the sludge settling could
establishment of anoxic and even anaerobic conditions, especially in the bottom of the
, which would impact
In an attempt to
measurements of diss
the two campaigns
different sections of each oxidation ditch (as illustrated in
different depths (corresponding to surface, medium depth and bottom), for different
temperatures and/or aeration conditions. The results of these measurements are reported
11.
Sections of measurement of dissolved oxygen in the oxidations ditches 1 and 2, according to
problem stated above
technical failure in Aerator 2 (
ince then the aeration cycle was changed into 20/30 min. aeration on/off,
tively, maintaining a DO setpoint control
11 relative to
relative to 11 December were measured during the air
correspond to measurements just after 20 min. of aeration, which explains higher DO
concentrations. Th
Although the results suggest that anaerobic conditi
is not completely clear; measurements of the reduction
should be carried out
the aquatic environment.
Therefore, it was reasonable to suppose that the sludge settling could
establishment of anoxic and even anaerobic conditions, especially in the bottom of the
, which would impact
In an attempt to
of diss
the two campaigns
different sections of each oxidation ditch (as illustrated in
different depths (corresponding to surface, medium depth and bottom), for different
temperatures and/or aeration conditions. The results of these measurements are reported
Sections of measurement of dissolved oxygen in the oxidations ditches 1 and 2, according to
problem stated above
technical failure in Aerator 2 (
ince then the aeration cycle was changed into 20/30 min. aeration on/off,
tively, maintaining a DO setpoint control
relative to
December were measured during the air
correspond to measurements just after 20 min. of aeration, which explains higher DO
concentrations. Th
Although the results suggest that anaerobic conditi
is not completely clear; measurements of the reduction
should be carried out
ironment.
Therefore, it was reasonable to suppose that the sludge settling could
establishment of anoxic and even anaerobic conditions, especially in the bottom of the
, which would impact
In an attempt to investigate
of diss
the two campaigns. U
different sections of each oxidation ditch (as illustrated in
different depths (corresponding to surface, medium depth and bottom), for different
temperatures and/or aeration conditions. The results of these measurements are reported
Sections of measurement of dissolved oxygen in the oxidations ditches 1 and 2, according to
problem stated above
technical failure in Aerator 2 (
ince then the aeration cycle was changed into 20/30 min. aeration on/off,
tively, maintaining a DO setpoint control
relative to
December were measured during the air
correspond to measurements just after 20 min. of aeration, which explains higher DO
concentrations. The DO concentration at 13 ºC was very low and in most cases near to
Although the results suggest that anaerobic conditi
is not completely clear; measurements of the reduction
should be carried out
ironment.
Therefore, it was reasonable to suppose that the sludge settling could
establishment of anoxic and even anaerobic conditions, especially in the bottom of the
, which would impact
investigate
of dissolved oxygen (DO) w
Using an Oxi 330 sensor (WTW, Germany)
different sections of each oxidation ditch (as illustrated in
different depths (corresponding to surface, medium depth and bottom), for different
temperatures and/or aeration conditions. The results of these measurements are reported
Sections of measurement of dissolved oxygen in the oxidations ditches 1 and 2, according to Table
problem stated above
technical failure in Aerator 2 (
ince then the aeration cycle was changed into 20/30 min. aeration on/off,
tively, maintaining a DO setpoint control
relative to
December were measured during the air
correspond to measurements just after 20 min. of aeration, which explains higher DO
e DO concentration at 13 ºC was very low and in most cases near to
Although the results suggest that anaerobic conditi
is not completely clear; measurements of the reduction
to identify which redox reactions (as listed in
ironment.
Therefore, it was reasonable to suppose that the sludge settling could
establishment of anoxic and even anaerobic conditions, especially in the bottom of the
, which would impact the
investigate
olved oxygen (DO) w
sing an Oxi 330 sensor (WTW, Germany)
different sections of each oxidation ditch (as illustrated in
different depths (corresponding to surface, medium depth and bottom), for different
temperatures and/or aeration conditions. The results of these measurements are reported
Sections of measurement of dissolved oxygen in the oxidations ditches 1 and 2, according to Table
problem stated above
technical failure in Aerator 2 (
ince then the aeration cycle was changed into 20/30 min. aeration on/off,
tively, maintaining a DO setpoint control
17 December were measured during the air
December were measured during the air
correspond to measurements just after 20 min. of aeration, which explains higher DO
e DO concentration at 13 ºC was very low and in most cases near to
Although the results suggest that anaerobic conditi
is not completely clear; measurements of the reduction
to identify which redox reactions (as listed in
ironment.
Therefore, it was reasonable to suppose that the sludge settling could
establishment of anoxic and even anaerobic conditions, especially in the bottom of the
the
investigate
olved oxygen (DO) w
sing an Oxi 330 sensor (WTW, Germany)
different sections of each oxidation ditch (as illustrated in
different depths (corresponding to surface, medium depth and bottom), for different
temperatures and/or aeration conditions. The results of these measurements are reported
Sections of measurement of dissolved oxygen in the oxidations ditches 1 and 2, according to Table 6.11
became
technical failure in Aerator 2 (Figure
ince then the aeration cycle was changed into 20/30 min. aeration on/off,
tively, maintaining a DO setpoint control
17 December were measured during the air
December were measured during the air
correspond to measurements just after 20 min. of aeration, which explains higher DO
e DO concentration at 13 ºC was very low and in most cases near to
Although the results suggest that anaerobic conditi
is not completely clear; measurements of the reduction
to identify which redox reactions (as listed in
Therefore, it was reasonable to suppose that the sludge settling could
establishment of anoxic and even anaerobic conditions, especially in the bottom of the
the overall process efficiency.
investigate the aeration conditions inside
olved oxygen (DO) w
sing an Oxi 330 sensor (WTW, Germany)
different sections of each oxidation ditch (as illustrated in
different depths (corresponding to surface, medium depth and bottom), for different
temperatures and/or aeration conditions. The results of these measurements are reported
Sections of measurement of dissolved oxygen in the oxidations ditches 1 and 2, according to 11 (the arrows indicate the direction of the flow)
became
Figure
ince then the aeration cycle was changed into 20/30 min. aeration on/off,
tively, maintaining a DO setpoint control
17 December were measured during the air
December were measured during the air
correspond to measurements just after 20 min. of aeration, which explains higher DO
e DO concentration at 13 ºC was very low and in most cases near to
Although the results suggest that anaerobic conditi
is not completely clear; measurements of the reduction
to identify which redox reactions (as listed in
Therefore, it was reasonable to suppose that the sludge settling could
establishment of anoxic and even anaerobic conditions, especially in the bottom of the
overall process efficiency.
the aeration conditions inside
olved oxygen (DO) w
sing an Oxi 330 sensor (WTW, Germany)
different sections of each oxidation ditch (as illustrated in
different depths (corresponding to surface, medium depth and bottom), for different
temperatures and/or aeration conditions. The results of these measurements are reported
Sections of measurement of dissolved oxygen in the oxidations ditches 1 and 2, according to (the arrows indicate the direction of the flow)
eve
Figure 6.
ince then the aeration cycle was changed into 20/30 min. aeration on/off,
tively, maintaining a DO setpoint control
17 December were measured during the air
December were measured during the air
correspond to measurements just after 20 min. of aeration, which explains higher DO
e DO concentration at 13 ºC was very low and in most cases near to
Although the results suggest that anaerobic conditi
is not completely clear; measurements of the reduction
to identify which redox reactions (as listed in
Therefore, it was reasonable to suppose that the sludge settling could
establishment of anoxic and even anaerobic conditions, especially in the bottom of the
overall process efficiency.
the aeration conditions inside
olved oxygen (DO) w
sing an Oxi 330 sensor (WTW, Germany)
different sections of each oxidation ditch (as illustrated in
different depths (corresponding to surface, medium depth and bottom), for different
temperatures and/or aeration conditions. The results of these measurements are reported
Sections of measurement of dissolved oxygen in the oxidations ditches 1 and 2, according to (the arrows indicate the direction of the flow)
even more pertinent
.11
ince then the aeration cycle was changed into 20/30 min. aeration on/off,
tively, maintaining a DO setpoint control
17 December were measured during the air
December were measured during the air
correspond to measurements just after 20 min. of aeration, which explains higher DO
e DO concentration at 13 ºC was very low and in most cases near to
Although the results suggest that anaerobic conditi
is not completely clear; measurements of the reduction
to identify which redox reactions (as listed in
Therefore, it was reasonable to suppose that the sludge settling could
establishment of anoxic and even anaerobic conditions, especially in the bottom of the
overall process efficiency.
the aeration conditions inside
olved oxygen (DO) w
sing an Oxi 330 sensor (WTW, Germany)
different sections of each oxidation ditch (as illustrated in
different depths (corresponding to surface, medium depth and bottom), for different
temperatures and/or aeration conditions. The results of these measurements are reported
Sections of measurement of dissolved oxygen in the oxidations ditches 1 and 2, according to (the arrows indicate the direction of the flow)
n more pertinent
11) Oxidation Ditch 1
ince then the aeration cycle was changed into 20/30 min. aeration on/off,
tively, maintaining a DO setpoint control
17 December were measured during the air
December were measured during the air
correspond to measurements just after 20 min. of aeration, which explains higher DO
e DO concentration at 13 ºC was very low and in most cases near to
Although the results suggest that anaerobic conditi
is not completely clear; measurements of the reduction
to identify which redox reactions (as listed in
Therefore, it was reasonable to suppose that the sludge settling could
establishment of anoxic and even anaerobic conditions, especially in the bottom of the
overall process efficiency.
the aeration conditions inside
olved oxygen (DO) were
sing an Oxi 330 sensor (WTW, Germany)
different sections of each oxidation ditch (as illustrated in
different depths (corresponding to surface, medium depth and bottom), for different
temperatures and/or aeration conditions. The results of these measurements are reported
Sections of measurement of dissolved oxygen in the oxidations ditches 1 and 2, according to (the arrows indicate the direction of the flow)
n more pertinent
Oxidation Ditch 1
ince then the aeration cycle was changed into 20/30 min. aeration on/off,
tively, maintaining a DO setpoint control
17 December were measured during the air
December were measured during the air
correspond to measurements just after 20 min. of aeration, which explains higher DO
e DO concentration at 13 ºC was very low and in most cases near to
Although the results suggest that anaerobic conditi
is not completely clear; measurements of the reduction
to identify which redox reactions (as listed in
Therefore, it was reasonable to suppose that the sludge settling could
establishment of anoxic and even anaerobic conditions, especially in the bottom of the
overall process efficiency.
the aeration conditions inside
ere carried out before and during the period of
sing an Oxi 330 sensor (WTW, Germany)
different sections of each oxidation ditch (as illustrated in
different depths (corresponding to surface, medium depth and bottom), for different
temperatures and/or aeration conditions. The results of these measurements are reported
Sections of measurement of dissolved oxygen in the oxidations ditches 1 and 2, according to (the arrows indicate the direction of the flow)
n more pertinent
Oxidation Ditch 1
ince then the aeration cycle was changed into 20/30 min. aeration on/off,
tively, maintaining a DO setpoint control of 2
17 December were measured during the air
December were measured during the air
correspond to measurements just after 20 min. of aeration, which explains higher DO
e DO concentration at 13 ºC was very low and in most cases near to
Although the results suggest that anaerobic conditi
is not completely clear; measurements of the reduction
to identify which redox reactions (as listed in
Therefore, it was reasonable to suppose that the sludge settling could
establishment of anoxic and even anaerobic conditions, especially in the bottom of the
overall process efficiency.
the aeration conditions inside
carried out before and during the period of
sing an Oxi 330 sensor (WTW, Germany)
different sections of each oxidation ditch (as illustrated in
different depths (corresponding to surface, medium depth and bottom), for different
temperatures and/or aeration conditions. The results of these measurements are reported
Sections of measurement of dissolved oxygen in the oxidations ditches 1 and 2, according to (the arrows indicate the direction of the flow)
n more pertinent
Oxidation Ditch 1
ince then the aeration cycle was changed into 20/30 min. aeration on/off,
of 2
17 December were measured during the air
December were measured during the air
correspond to measurements just after 20 min. of aeration, which explains higher DO
e DO concentration at 13 ºC was very low and in most cases near to
Although the results suggest that anaerobic conditi
is not completely clear; measurements of the reduction
to identify which redox reactions (as listed in
Therefore, it was reasonable to suppose that the sludge settling could
establishment of anoxic and even anaerobic conditions, especially in the bottom of the
overall process efficiency.
the aeration conditions inside
carried out before and during the period of
sing an Oxi 330 sensor (WTW, Germany)
different sections of each oxidation ditch (as illustrated in
different depths (corresponding to surface, medium depth and bottom), for different
temperatures and/or aeration conditions. The results of these measurements are reported
Sections of measurement of dissolved oxygen in the oxidations ditches 1 and 2, according to (the arrows indicate the direction of the flow)
n more pertinent
Oxidation Ditch 1
ince then the aeration cycle was changed into 20/30 min. aeration on/off,
of 2 g O
17 December were measured during the air
December were measured during the air
correspond to measurements just after 20 min. of aeration, which explains higher DO
e DO concentration at 13 ºC was very low and in most cases near to
Although the results suggest that anaerobic conditi
is not completely clear; measurements of the reduction
to identify which redox reactions (as listed in
Therefore, it was reasonable to suppose that the sludge settling could
establishment of anoxic and even anaerobic conditions, especially in the bottom of the
overall process efficiency.
the aeration conditions inside
carried out before and during the period of
sing an Oxi 330 sensor (WTW, Germany)
different sections of each oxidation ditch (as illustrated in
different depths (corresponding to surface, medium depth and bottom), for different
temperatures and/or aeration conditions. The results of these measurements are reported
Sections of measurement of dissolved oxygen in the oxidations ditches 1 and 2, according to (the arrows indicate the direction of the flow)
n more pertinent when
Oxidation Ditch 1
ince then the aeration cycle was changed into 20/30 min. aeration on/off,
g O2
17 December were measured during the air
December were measured during the air-off pe
correspond to measurements just after 20 min. of aeration, which explains higher DO
e DO concentration at 13 ºC was very low and in most cases near to
Although the results suggest that anaerobic conditi
is not completely clear; measurements of the reduction
to identify which redox reactions (as listed in
Therefore, it was reasonable to suppose that the sludge settling could
establishment of anoxic and even anaerobic conditions, especially in the bottom of the
the aeration conditions inside
carried out before and during the period of
sing an Oxi 330 sensor (WTW, Germany)
different sections of each oxidation ditch (as illustrated in
different depths (corresponding to surface, medium depth and bottom), for different
temperatures and/or aeration conditions. The results of these measurements are reported
Sections of measurement of dissolved oxygen in the oxidations ditches 1 and 2, according to (the arrows indicate the direction of the flow)
when
Oxidation Ditch 1
ince then the aeration cycle was changed into 20/30 min. aeration on/off,
2/m
17 December were measured during the air
off pe
correspond to measurements just after 20 min. of aeration, which explains higher DO
e DO concentration at 13 ºC was very low and in most cases near to
Although the results suggest that anaerobic conditions m
is not completely clear; measurements of the reduction-oxidation
to identify which redox reactions (as listed in
Therefore, it was reasonable to suppose that the sludge settling could
establishment of anoxic and even anaerobic conditions, especially in the bottom of the
the aeration conditions inside
carried out before and during the period of
sing an Oxi 330 sensor (WTW, Germany)
different sections of each oxidation ditch (as illustrated in
different depths (corresponding to surface, medium depth and bottom), for different
temperatures and/or aeration conditions. The results of these measurements are reported
Sections of measurement of dissolved oxygen in the oxidations ditches 1 and 2, according to (the arrows indicate the direction of the flow)
when in November 2009
Oxidation Ditch 1 began
ince then the aeration cycle was changed into 20/30 min. aeration on/off,
/m3. The reported values shown
17 December were measured during the air
off period; the values of section G
correspond to measurements just after 20 min. of aeration, which explains higher DO
e DO concentration at 13 ºC was very low and in most cases near to
ons m
oxidation
to identify which redox reactions (as listed in
Therefore, it was reasonable to suppose that the sludge settling could
establishment of anoxic and even anaerobic conditions, especially in the bottom of the
the aeration conditions inside
carried out before and during the period of
sing an Oxi 330 sensor (WTW, Germany)
different sections of each oxidation ditch (as illustrated in Figure
different depths (corresponding to surface, medium depth and bottom), for different
temperatures and/or aeration conditions. The results of these measurements are reported
Sections of measurement of dissolved oxygen in the oxidations ditches 1 and 2, according to (the arrows indicate the direction of the flow)
in November 2009
began
ince then the aeration cycle was changed into 20/30 min. aeration on/off,
The reported values shown
17 December were measured during the air
riod; the values of section G
correspond to measurements just after 20 min. of aeration, which explains higher DO
e DO concentration at 13 ºC was very low and in most cases near to
ons might
oxidation
to identify which redox reactions (as listed in
Therefore, it was reasonable to suppose that the sludge settling could
establishment of anoxic and even anaerobic conditions, especially in the bottom of the
the biological reactors,
carried out before and during the period of
sing an Oxi 330 sensor (WTW, Germany), DO was measured at
Figure
different depths (corresponding to surface, medium depth and bottom), for different
temperatures and/or aeration conditions. The results of these measurements are reported
Sections of measurement of dissolved oxygen in the oxidations ditches 1 and 2, according to (the arrows indicate the direction of the flow)
in November 2009
began operating with only one
ince then the aeration cycle was changed into 20/30 min. aeration on/off,
The reported values shown
17 December were measured during the air-
riod; the values of section G
correspond to measurements just after 20 min. of aeration, which explains higher DO
e DO concentration at 13 ºC was very low and in most cases near to
ight occur in the ditch, this
oxidation
to identify which redox reactions (as listed in Table
Therefore, it was reasonable to suppose that the sludge settling could
establishment of anoxic and even anaerobic conditions, especially in the bottom of the
the biological reactors,
carried out before and during the period of
DO was measured at
Figure 6
different depths (corresponding to surface, medium depth and bottom), for different
temperatures and/or aeration conditions. The results of these measurements are reported
Sections of measurement of dissolved oxygen in the oxidations ditches 1 and 2, according to
in November 2009
operating with only one
ince then the aeration cycle was changed into 20/30 min. aeration on/off,
The reported values shown
-on p
riod; the values of section G
correspond to measurements just after 20 min. of aeration, which explains higher DO
e DO concentration at 13 ºC was very low and in most cases near to
occur in the ditch, this
oxidation (or redox)
Table
Therefore, it was reasonable to suppose that the sludge settling could
establishment of anoxic and even anaerobic conditions, especially in the bottom of the
the biological reactors,
carried out before and during the period of
DO was measured at
6.11
different depths (corresponding to surface, medium depth and bottom), for different
temperatures and/or aeration conditions. The results of these measurements are reported
Sections of measurement of dissolved oxygen in the oxidations ditches 1 and 2, according to
in November 2009
operating with only one
ince then the aeration cycle was changed into 20/30 min. aeration on/off,
The reported values shown
on period while those
riod; the values of section G
correspond to measurements just after 20 min. of aeration, which explains higher DO
e DO concentration at 13 ºC was very low and in most cases near to
occur in the ditch, this
(or redox)
Table 3
Therefore, it was reasonable to suppose that the sludge settling could
establishment of anoxic and even anaerobic conditions, especially in the bottom of the
the biological reactors,
carried out before and during the period of
DO was measured at
11) and at thr
different depths (corresponding to surface, medium depth and bottom), for different
temperatures and/or aeration conditions. The results of these measurements are reported
Sections of measurement of dissolved oxygen in the oxidations ditches 1 and 2, according to
in November 2009
operating with only one
ince then the aeration cycle was changed into 20/30 min. aeration on/off,
The reported values shown
eriod while those
riod; the values of section G
correspond to measurements just after 20 min. of aeration, which explains higher DO
e DO concentration at 13 ºC was very low and in most cases near to
occur in the ditch, this
(or redox)
3.2
Therefore, it was reasonable to suppose that the sludge settling could enhan
establishment of anoxic and even anaerobic conditions, especially in the bottom of the
the biological reactors,
carried out before and during the period of
DO was measured at
) and at thr
different depths (corresponding to surface, medium depth and bottom), for different
temperatures and/or aeration conditions. The results of these measurements are reported
Sections of measurement of dissolved oxygen in the oxidations ditches 1 and 2, according to
in November 2009
operating with only one
ince then the aeration cycle was changed into 20/30 min. aeration on/off,
The reported values shown
eriod while those
riod; the values of section G
correspond to measurements just after 20 min. of aeration, which explains higher DO
e DO concentration at 13 ºC was very low and in most cases near to
occur in the ditch, this
(or redox)
2) occur within
enhan
establishment of anoxic and even anaerobic conditions, especially in the bottom of the
the biological reactors,
carried out before and during the period of
DO was measured at
) and at thr
different depths (corresponding to surface, medium depth and bottom), for different
temperatures and/or aeration conditions. The results of these measurements are reported
Sections of measurement of dissolved oxygen in the oxidations ditches 1 and 2, according to
in November 2009, due to
operating with only one
ince then the aeration cycle was changed into 20/30 min. aeration on/off,
The reported values shown
eriod while those
riod; the values of section G
correspond to measurements just after 20 min. of aeration, which explains higher DO
e DO concentration at 13 ºC was very low and in most cases near to
occur in the ditch, this
(or redox) potential
) occur within
enhance
establishment of anoxic and even anaerobic conditions, especially in the bottom of the
the biological reactors,
carried out before and during the period of
DO was measured at
) and at thr
different depths (corresponding to surface, medium depth and bottom), for different
temperatures and/or aeration conditions. The results of these measurements are reported
Sections of measurement of dissolved oxygen in the oxidations ditches 1 and 2, according to
, due to
operating with only one
ince then the aeration cycle was changed into 20/30 min. aeration on/off,
The reported values shown
eriod while those
riod; the values of section G
correspond to measurements just after 20 min. of aeration, which explains higher DO
e DO concentration at 13 ºC was very low and in most cases near to
occur in the ditch, this
potential
) occur within
e the
establishment of anoxic and even anaerobic conditions, especially in the bottom of the
the biological reactors,
carried out before and during the period of
DO was measured at
) and at thr
different depths (corresponding to surface, medium depth and bottom), for different
temperatures and/or aeration conditions. The results of these measurements are reported
Sections of measurement of dissolved oxygen in the oxidations ditches 1 and 2, according to
, due to
operating with only one
ince then the aeration cycle was changed into 20/30 min. aeration on/off,
The reported values shown
eriod while those
riod; the values of section G
correspond to measurements just after 20 min. of aeration, which explains higher DO
e DO concentration at 13 ºC was very low and in most cases near to
occur in the ditch, this
potential
) occur within
the
establishment of anoxic and even anaerobic conditions, especially in the bottom of the
the biological reactors,
carried out before and during the period of
DO was measured at
) and at three
different depths (corresponding to surface, medium depth and bottom), for different
temperatures and/or aeration conditions. The results of these measurements are reported
Sections of measurement of dissolved oxygen in the oxidations ditches 1 and 2, according to
, due to a
operating with only one
ince then the aeration cycle was changed into 20/30 min. aeration on/off,
The reported values shown
eriod while those
riod; the values of section G
correspond to measurements just after 20 min. of aeration, which explains higher DO
e DO concentration at 13 ºC was very low and in most cases near to
occur in the ditch, this
potential
) occur within
the
establishment of anoxic and even anaerobic conditions, especially in the bottom of the
carried out before and during the period of
DO was measured at
ee
different depths (corresponding to surface, medium depth and bottom), for different
temperatures and/or aeration conditions. The results of these measurements are reported
a
operating with only one
ince then the aeration cycle was changed into 20/30 min. aeration on/off,
The reported values shown
eriod while those
riod; the values of section G
correspond to measurements just after 20 min. of aeration, which explains higher DO
e DO concentration at 13 ºC was very low and in most cases near to
occur in the ditch, this
potential
) occur within
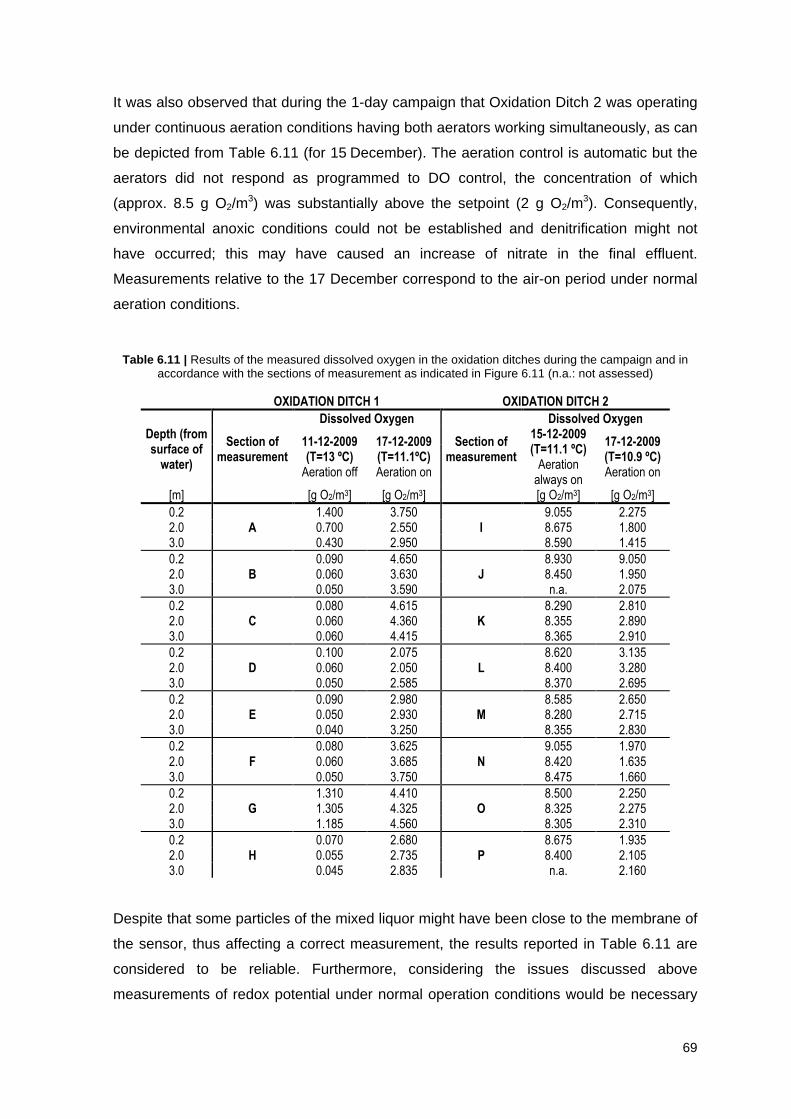
69
It was also observed that during the 1-day campaign that Oxidation Ditch 2 was operating
under continuous aeration conditions having both aerators working simultaneously, as can
be depicted from Table 6.11 (for 15 December). The aeration control is automatic but the
aerators did not respond as programmed to DO control, the concentration of which
(approx. 8.5 g O2/m3) was substantially above the setpoint (2 g O2/m
3). Consequently,
environmental anoxic conditions could not be established and denitrification might not
have occurred; this may have caused an increase of nitrate in the final effluent.
Measurements relative to the 17 December correspond to the air-on period under normal
aeration conditions.
Table 6.11 | Results of the measured dissolved oxygen in the oxidation ditches during the campaign and in accordance with the sections of measurement as indicated in Figure 6.11 (n.a.: not assessed)
OXIDATION DITCH 1 OXIDATION DITCH 2
Depth (from surface of
water)
Section of measurement
Dissolved Oxygen
Section of measurement
Dissolved Oxygen
11-12-2009 (T=13 ºC)
Aeration off
17-12-2009 (T=11.1ºC) Aeration on
15-12-2009 (T=11.1 ºC)
Aeration always on
17-12-2009 (T=10.9 ºC) Aeration on
[m]
[g O2/m3] [g O2/m3]
[g O2/m3] [g O2/m3]
0.2 A
1.400 3.750 I
9.055 2.275 2.0 0.700 2.550 8.675 1.800 3.0 0.430 2.950 8.590 1.415
0.2 B
0.090 4.650 J
8.930 9.050 2.0 0.060 3.630 8.450 1.950 3.0 0.050 3.590 n.a. 2.075
0.2 C
0.080 4.615 K
8.290 2.810 2.0 0.060 4.360 8.355 2.890 3.0 0.060 4.415 8.365 2.910
0.2 D
0.100 2.075 L
8.620 3.135 2.0 0.060 2.050 8.400 3.280 3.0 0.050 2.585 8.370 2.695
0.2 E
0.090 2.980 M
8.585 2.650 2.0 0.050 2.930 8.280 2.715 3.0 0.040 3.250 8.355 2.830
0.2 F
0.080 3.625 N
9.055 1.970 2.0 0.060 3.685 8.420 1.635 3.0 0.050 3.750 8.475 1.660
0.2 G
1.310 4.410 O
8.500 2.250 2.0 1.305 4.325 8.325 2.275 3.0 1.185 4.560 8.305 2.310
0.2 H
0.070 2.680 P
8.675 1.935 2.0 0.055 2.735 8.400 2.105 3.0 0.045 2.835 n.a. 2.160
Despite that some particles of the mixed liquor might have been close to the membrane of
the sensor, thus affecting a correct measurement, the results reported in Table 6.11 are
considered to be reliable. Furthermore, considering the issues discussed above
measurements of redox potential under normal operation conditions would be necessary
70
in order for a full characterization of the aerobic/anoxic/anaerobic dynamics in the
biological reactors to be possible.
6.4.3.4 Analysis of the treatment process efficienc y
Table 6.12 summarizes the monitoring results of wastewater influent and final effluent
relative to the campaign of 14/15 December; more detailed data is reported in Table A.8.2
in Appendix A.8. It also shows the percentage of component removal of the system.
However, it should be stressed that the percentages were calculated without
consideration of the hydraulic retention time in the system (i.e. the concentrations of each
component in the raw influent and final effluent were compared at the same instant t).
Hence, these results allow for a characterization on the whole, but their individual analysis
care for some criticism.
In general, the average concentration values of COD, BOD5, TSS, Ntotal, Ptotal and fecal
coliforms in the effluent significantly exceed the limit values for emission presented in
Table 2.1. Also, the maximum percentage of component removal is considerably lower
than the legal requirements, except in the case of BOD5 which percentage of removal fits
the range of 70-90%. The concentration of fecal coliforms in the effluent was high above
the legal requirements. However, this can be explained by the fact that although the
WWTP has a filtration/UV disinfection step (as shown in Figure 6.1), it was deactivated
during the campaign due to clogging of the sand filters.
From Table 6.12 it is evident that the efficiency of TSS removal is very low, which is
consistent with the problem of rising of sludge in the clarifiers (see Figure 6.7).
The values relative to the percentage of total nitrogen removal have to be analyzed with
caution. Comparing detailed results of total nitrogen concentrations in the wastewater
influent (A1) and final effluent (A7) (see Table A.8.2 in Appendix A.8) shows that during
the day the removal of the component lies between 19% and 68%. Yet, the effluent
samples collected at 23:00 and 2:00 revealed very high concentrations of total nitrogen. It
is believed that this is due to a measurement error, since no significant alterations were
observed on the other components.
Table 6.13 displays the measurement results of wastewater influent and final effluent
relative to the campaign of 16/17 December; more detailed data is reported in Table A.8.3
in Appendix A.8.
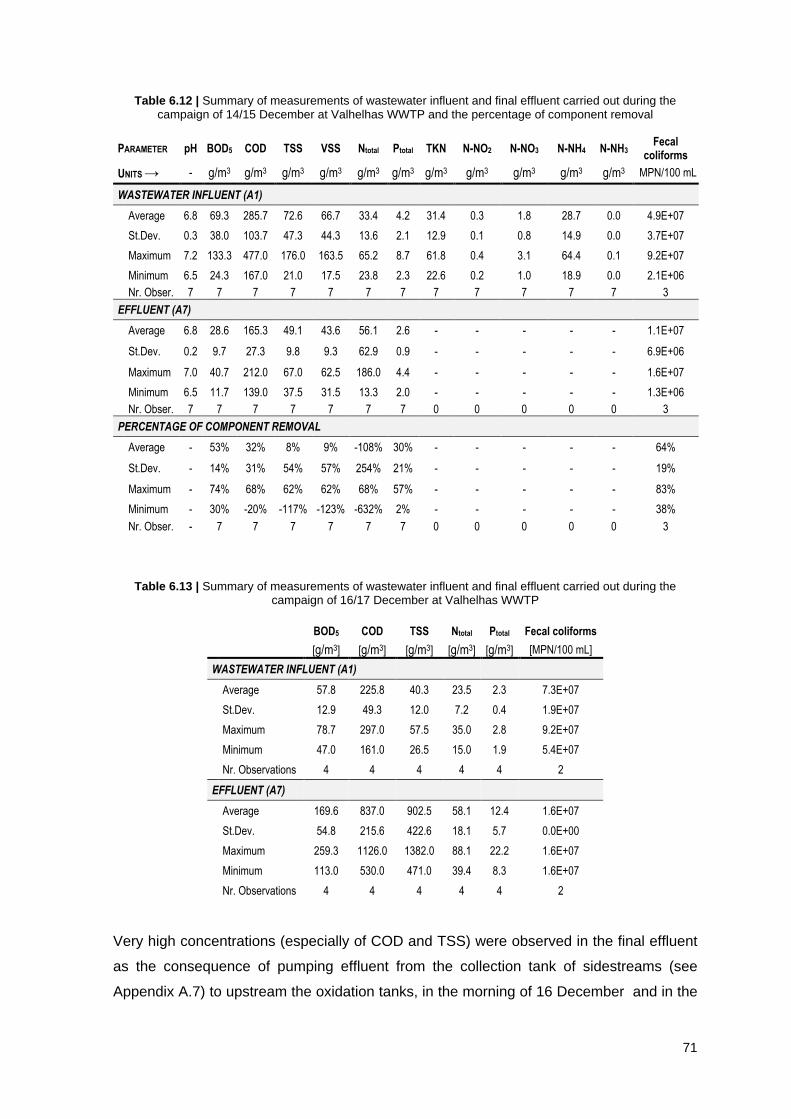
71
Table 6.12 | Summary of measurements of wastewater influent and final effluent carried out during the campaign of 14/15 December at Valhelhas WWTP and the percentage of component removal
PARAMETER pH BOD5 COD TSS VSS Ntotal Ptotal TKN N-NO2 N-NO3 N-NH4 N-NH3 Fecal
coliforms
UNITS → - g/m3 g/m3 g/m3 g/m3 g/m3 g/m3 g/m3 g/m3 g/m3 g/m3 g/m3 MPN/100 mL
WASTEWATER INFLUENT (A1)
Average 6.8 69.3 285.7 72.6 66.7 33.4 4.2 31.4 0.3 1.8 28.7 0.0 4.9E+07
St.Dev. 0.3 38.0 103.7 47.3 44.3 13.6 2.1 12.9 0.1 0.8 14.9 0.0 3.7E+07
Maximum 7.2 133.3 477.0 176.0 163.5 65.2 8.7 61.8 0.4 3.1 64.4 0.1 9.2E+07
Minimum 6.5 24.3 167.0 21.0 17.5 23.8 2.3 22.6 0.2 1.0 18.9 0.0 2.1E+06
Nr. Obser. 7 7 7 7 7 7 7 7 7 7 7 7 3
EFFLUENT (A7)
Average 6.8 28.6 165.3 49.1 43.6 56.1 2.6 - - - - - 1.1E+07
St.Dev. 0.2 9.7 27.3 9.8 9.3 62.9 0.9 - - - - - 6.9E+06
Maximum 7.0 40.7 212.0 67.0 62.5 186.0 4.4 - - - - - 1.6E+07
Minimum 6.5 11.7 139.0 37.5 31.5 13.3 2.0 - - - - - 1.3E+06
Nr. Obser. 7 7 7 7 7 7 7 0 0 0 0 0 3
PERCENTAGE OF COMPONENT REMOVAL
Average - 53% 32% 8% 9% -108% 30% - - - - - 64%
St.Dev. - 14% 31% 54% 57% 254% 21% - - - - - 19%
Maximum - 74% 68% 62% 62% 68% 57% - - - - - 83%
Minimum - 30% -20% -117% -123% -632% 2% - - - - - 38%
Nr. Obser. - 7 7 7 7 7 7 0 0 0 0 0 3
Table 6.13 | Summary of measurements of wastewater influent and final effluent carried out during the campaign of 16/17 December at Valhelhas WWTP
BOD5 COD TSS Ntotal Ptotal Fecal coliforms
[g/m3] [g/m3] [g/m3] [g/m3] [g/m3] [MPN/100 mL]
WASTEWATER INFLUENT (A1)
Average 57.8 225.8 40.3 23.5 2.3 7.3E+07
St.Dev. 12.9 49.3 12.0 7.2 0.4 1.9E+07
Maximum 78.7 297.0 57.5 35.0 2.8 9.2E+07
Minimum 47.0 161.0 26.5 15.0 1.9 5.4E+07
Nr. Observations 4 4 4 4 4 2
EFFLUENT (A7)
Average 169.6 837.0 902.5 58.1 12.4 1.6E+07
St.Dev. 54.8 215.6 422.6 18.1 5.7 0.0E+00
Maximum 259.3 1126.0 1382.0 88.1 22.2 1.6E+07
Minimum 113.0 530.0 471.0 39.4 8.3 1.6E+07
Nr. Observations 4 4 4 4 4 2
Very high concentrations (especially of COD and TSS) were observed in the final effluent
as the consequence of pumping effluent from the collection tank of sidestreams (see
Appendix A.7) to upstream the oxidation tanks, in the morning of 16 December and in the
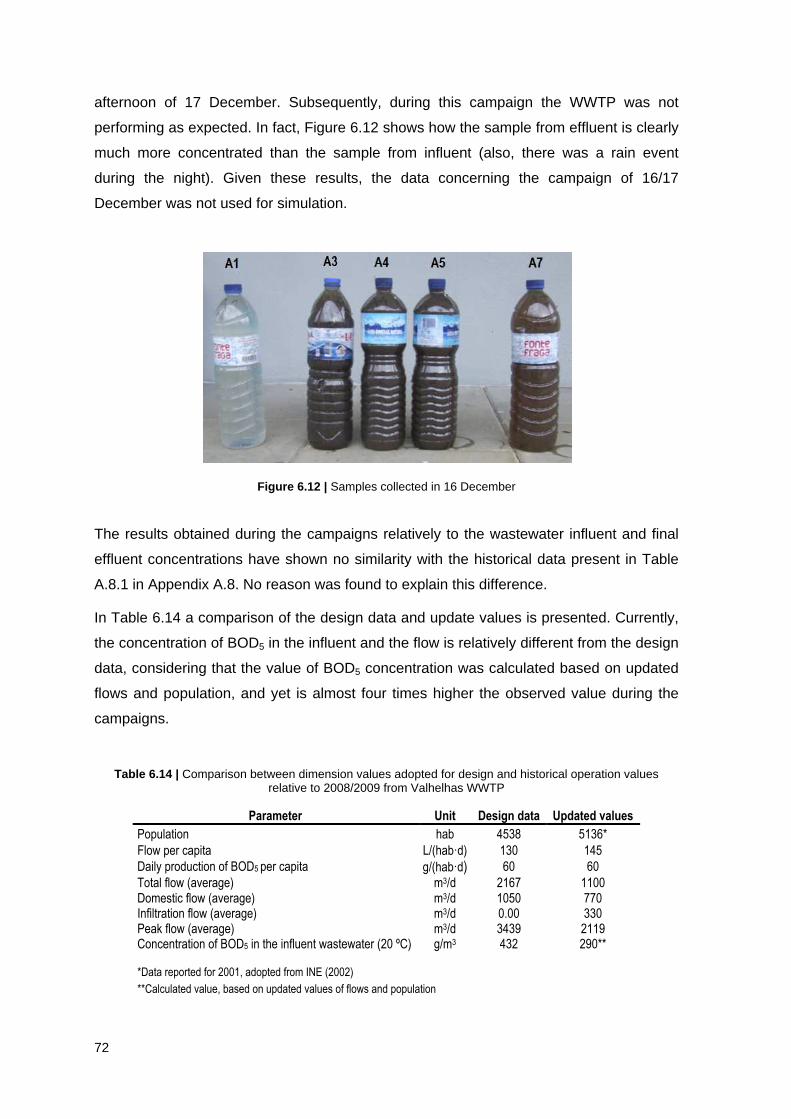
72
afternoon of 17 December. Subsequently, during this campaign the WWTP was not
performing as expected. In fact, Figure 6.12 shows how the sample from effluent is clearly
much more concentrated than the sample from influent (also, there was a rain event
during the night). Given these results, the data concerning the campaign of 16/17
December was not used for simulation.
Figure 6.12 | Samples collected in 16 December
The results obtained during the campaigns relatively to the wastewater influent and final
effluent concentrations have shown no similarity with the historical data present in Table
A.8.1 in Appendix A.8. No reason was found to explain this difference.
In Table 6.14 a comparison of the design data and update values is presented. Currently,
the concentration of BOD5 in the influent and the flow is relatively different from the design
data, considering that the value of BOD5 concentration was calculated based on updated
flows and population, and yet is almost four times higher the observed value during the
campaigns.
Table 6.14 | Comparison between dimension values adopted for design and historical operation values relative to 2008/2009 from Valhelhas WWTP
Parameter Unit Design data Updated values
Population hab 4538 5136*
Flow per capita L/(hab�d) 130 145
Daily production of BOD5 per capita g/(hab�d) 60 60
Total flow (average) m3/d 2167 1100 Domestic flow (average) m3/d 1050 770 Infiltration flow (average) m3/d 0.00 330 Peak flow (average) m3/d 3439 2119 Concentration of BOD5 in the influent wastewater (20 ºC) g/m3 432 290**
*Data reported for 2001, adopted from INE (2002)
**Calculated value, based on updated values of flows and population
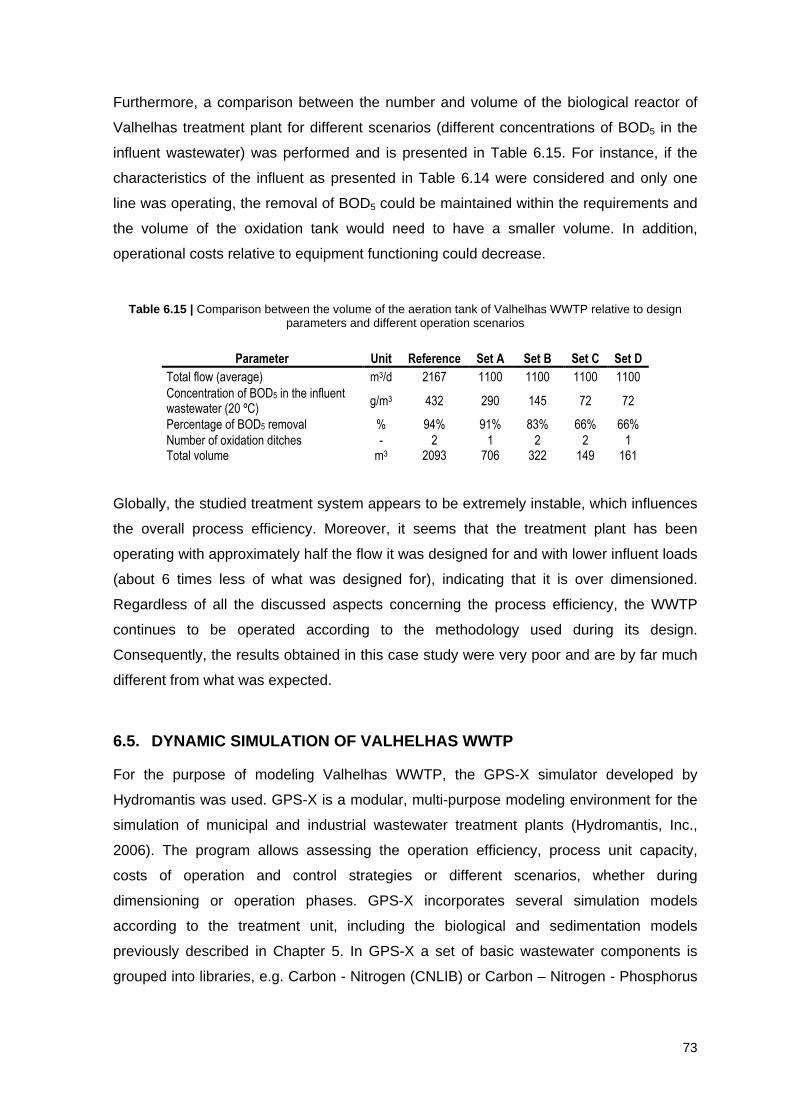
73
Furthermore, a comparison between the number and volume of the biological reactor of
Valhelhas treatment plant for different scenarios (different concentrations of BOD5 in the
influent wastewater) was performed and is presented in Table 6.15. For instance, if the
characteristics of the influent as presented in Table 6.14 were considered and only one
line was operating, the removal of BOD5 could be maintained within the requirements and
the volume of the oxidation tank would need to have a smaller volume. In addition,
operational costs relative to equipment functioning could decrease.
Table 6.15 | Comparison between the volume of the aeration tank of Valhelhas WWTP relative to design parameters and different operation scenarios
Parameter Unit Reference Set A Set B Set C Set D
Total flow (average) m3/d 2167 1100 1100 1100 1100
Concentration of BOD5 in the influent wastewater (20 ºC)
g/m3 432 290 145 72 72
Percentage of BOD5 removal % 94% 91% 83% 66% 66%
Number of oxidation ditches - 2 1 2 2 1 Total volume m3 2093 706 322 149 161
Globally, the studied treatment system appears to be extremely instable, which influences
the overall process efficiency. Moreover, it seems that the treatment plant has been
operating with approximately half the flow it was designed for and with lower influent loads
(about 6 times less of what was designed for), indicating that it is over dimensioned.
Regardless of all the discussed aspects concerning the process efficiency, the WWTP
continues to be operated according to the methodology used during its design.
Consequently, the results obtained in this case study were very poor and are by far much
different from what was expected.
6.5. DYNAMIC SIMULATION OF VALHELHAS WWTP
For the purpose of modeling Valhelhas WWTP, the GPS-X simulator developed by
Hydromantis was used. GPS-X is a modular, multi-purpose modeling environment for the
simulation of municipal and industrial wastewater treatment plants (Hydromantis, Inc.,
2006). The program allows assessing the operation efficiency, process unit capacity,
costs of operation and control strategies or different scenarios, whether during
dimensioning or operation phases. GPS-X incorporates several simulation models
according to the treatment unit, including the biological and sedimentation models
previously described in Chapter 5. In GPS-X a set of basic wastewater components is
grouped into libraries, e.g. Carbon - Nitrogen (CNLIB) or Carbon – Nitrogen - Phosphorus
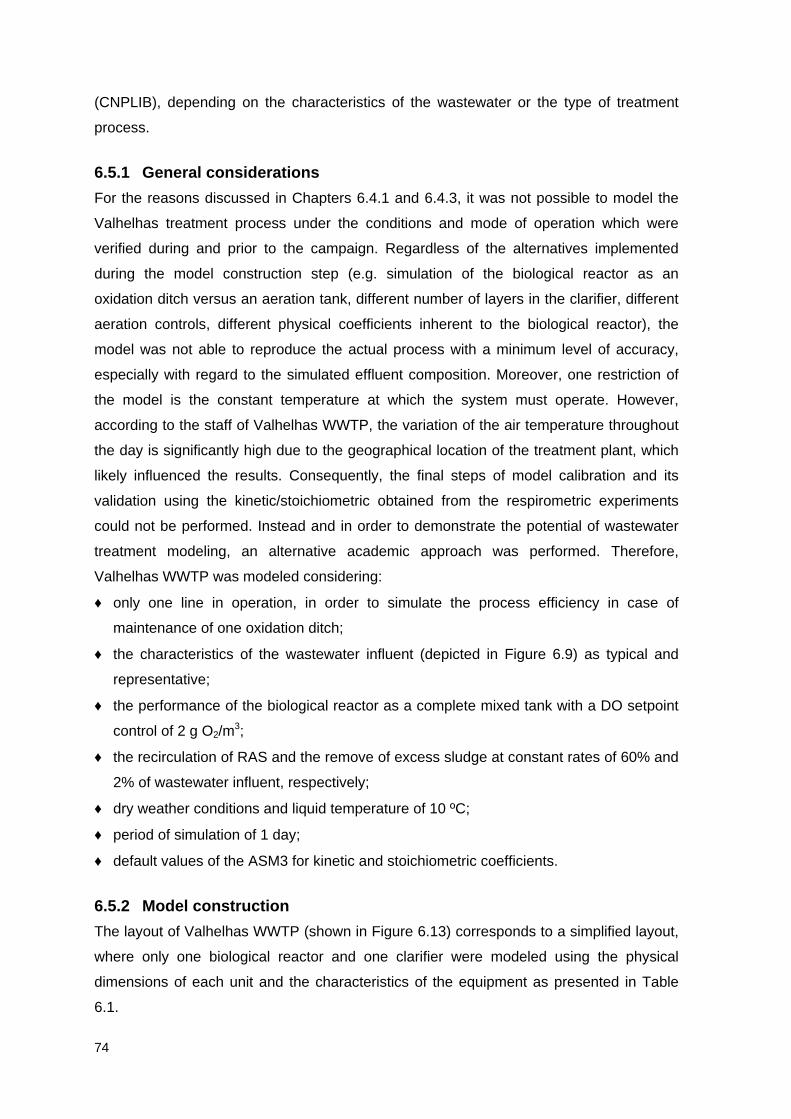
74
(CNPLIB), depending on the characteristics of the wastewater or the type of treatment
process.
6.5.1 General considerations
For the reasons discussed in Chapters 6.4.1 and 6.4.3, it was not possible to model the
Valhelhas treatment process under the conditions and mode of operation which were
verified during and prior to the campaign. Regardless of the alternatives implemented
during the model construction step (e.g. simulation of the biological reactor as an
oxidation ditch versus an aeration tank, different number of layers in the clarifier, different
aeration controls, different physical coefficients inherent to the biological reactor), the
model was not able to reproduce the actual process with a minimum level of accuracy,
especially with regard to the simulated effluent composition. Moreover, one restriction of
the model is the constant temperature at which the system must operate. However,
according to the staff of Valhelhas WWTP, the variation of the air temperature throughout
the day is significantly high due to the geographical location of the treatment plant, which
likely influenced the results. Consequently, the final steps of model calibration and its
validation using the kinetic/stoichiometric obtained from the respirometric experiments
could not be performed. Instead and in order to demonstrate the potential of wastewater
treatment modeling, an alternative academic approach was performed. Therefore,
Valhelhas WWTP was modeled considering:
♦ only one line in operation, in order to simulate the process efficiency in case of
maintenance of one oxidation ditch;
♦ the characteristics of the wastewater influent (depicted in Figure 6.9) as typical and
representative;
♦ the performance of the biological reactor as a complete mixed tank with a DO setpoint
control of 2 g O2/m3;
♦ the recirculation of RAS and the remove of excess sludge at constant rates of 60% and
2% of wastewater influent, respectively;
♦ dry weather conditions and liquid temperature of 10 ºC;
♦ period of simulation of 1 day;
♦ default values of the ASM3 for kinetic and stoichiometric coefficients.
6.5.2 Model construction
The layout of Valhelhas WWTP (shown in Figure 6.13) corresponds to a simplified layout,
where only one biological reactor and one clarifier were modeled using the physical
dimensions of each unit and the characteristics of the equipment as presented in Table
6.1.
75
Figure 6.13 | Simplified layout of Valhelhas WWTP used for modeling
The layout is comprised of the following simulation models for each treatment unit:
♦ Influent wastewater: influent flow was described by a BODbased model, to which
input data consists on values of BOD5, TSS and TKN; other parameters (e.g. COD, �
and !2) are calculated according to stoichiometric coefficients given by the modeler.
♦ Biological reactor: ASM3 (described in detail in Chapter 5.2.1) was used to model the
biological reactions, based upon the CN library (CNLIB) which allows the simulation of
carbon and nitrogen removal.
♦ Secondary clarifier: the clarifier was modeled by simple1d, which consists in a multi-
layer model (as described in Chapter 5.3) associated to a double exponential settling
function (Takács et al., 1991) to specify the solids flux due to sedimentation (Equation
(24)).
6.5.3 Simulation results
The results obtained from the dynamic model ASM3 are presented in Figure 6.14,
respectively to operation flows, concentrations of TSS and DO in the biological reactor,
solids retention time and the global concentrations in the final effluent.
These results are intended to represent an example of model application, considering
however real influent data and design parameters as previously addressed in Chapter
3.4.2.2 (e.g. recirculation and removal of excess sludge rates, concentration of total
suspended solids of the mixed liquor). Moreover, they consist of an attempt to understand
the consequences, in terms of process efficiency, of operation with only one line. In
general, given the considerations stated in Chapter 6.5.1, the discharge of the final
effluent would be in compliance with the legal requirements relatively to component
concentrations and/or component removal. However, the concentrations of total nitrogen
in the effluent seemed to be higher than what was expected, which may be due to the
atypical characteristics of the wastewater influent used as input data.
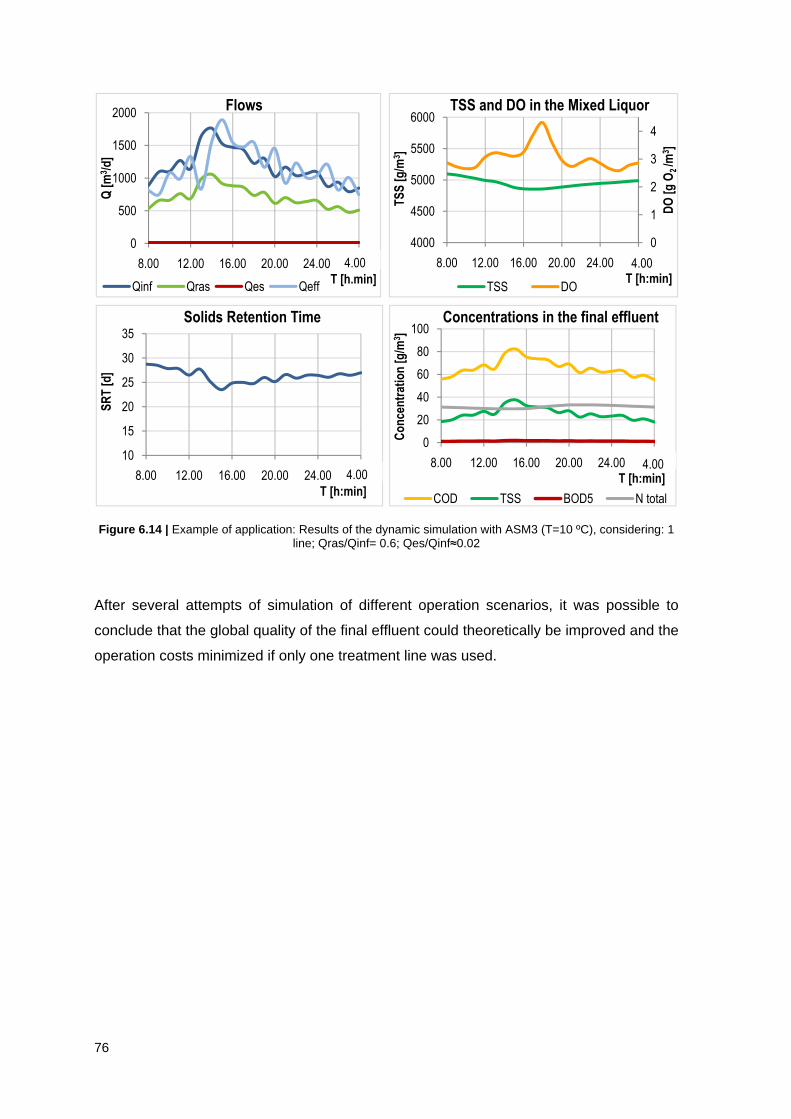
76
Figure 6.14 | Example of application: Results of the dynamic simulation with ASM3 (T=10 ºC), considering: 1 line; Qras/Qinf= 0.6; Qes/Qinf≈0.02
After several attempts of simulation of different operation scenarios, it was possible to
conclude that the global quality of the final effluent could theoretically be improved and the
operation costs minimized if only one treatment line was used.
0
500
1000
1500
2000
8.00 12.00 16.00 20.00 24.00 28.00
Q [
m3 /
d]
T [h.min]
Flows
Qinf Qras Qes Qeff
4.00
0
1
2
3
4
4000
4500
5000
5500
6000
8.00 12.00 16.00 20.00 24.00 28.00
DO
[g
O2 /m
3 ]
TS
S [
g/m
3 ]
T [h:min]
TSS and DO in the Mixed Liquor
TSS DO
4.00
10
15
20
25
30
35
8.00 12.00 16.00 20.00 24.00 28.00
SR
T [
d]
T [h:min]
Solids Retention Time
4.00
0
20
40
60
80
100
8.00 12.00 16.00 20.00 24.00 28.00
Co
nce
ntr
atio
n [
g/m
3 ]
T [h:min]
Concentrations in the final effluent
COD TSS BOD5 N total
4.00
77
7. CONCLUSIONS Within the last two decades, one of the most significant advances in wastewater treatment
has been the development of dynamic mathematical models capable of describing the
physical, chemical and biological removal pathways that occur in a wastewater treatment
processes. Specifically, the Activated Sludge Model Nº3 (Gujer et al., 2000) was proposed
in order to correct some deficiencies of the former ASM1 (Henze et al., 1987) and become
the new standard model. ASM3 has introduced the concepts of endogenous decay and
biochemical storage (as the primary mechanism of substrate utilization), and
consequently, a new set of kinetic and stoichiometric coefficients (Gujer et al., 2000).
However, the default values of these coefficients suggested with the model were not
validated with experimental work, which has instigated much research by using
respirometric procedures for the assessment of ASM3 parameters.
The activated sludge models are worldwidely recognized and used as powerful tools for
design, control and optimization of wastewater treatment processes. However, in Portugal
little attention has been given to their potential. Considering the general precarious
situation of treatment plants, in regard to process efficiency and compliance with
discharge legal requirements, and the objectives set out in PEAASAR II for the sector, the
development of WWTP modeling seems to be necessary on a national level.
The main goal of this study was to contribute to understanding of the activated sludge
process, simulation of organic carbon removal based on ASM3 and the use of
respirometric assays in order to obtain kinetic and stoichiometric coefficients for model
calibration.
Respirometric experiments were carried out using raw wastewater (as substrate source)
and return activated sludge (as biomass source) from the WWTP and the parameters ��, ��, �����, �� and were estimated.
In the field, two monitoring campaigns were carried out to characterize the composition
effluents from seven different sections of the wastewater treatment plant. Depending on
the section of the WWTP, the following parameters were analyzed: BOD5, COD, TSS,
VSS, Ntotal, NH3-N, NH4-N, NO2-N, NO3-N, Ptotal and fecal coliforms. Concerning the
wastewater composition, it was noticed that the proportion between BOD5, COD and TSS
was rather atypical in comparison with usual values of raw wastewater. Regarding the
process efficiency, the average concentration values of COD, BOD5, TSS, Ntotal, Ptotal and
fecal coliforms in the effluent significantly exceed the limit values for discharge. Also, the
maximum percentage of component removal was considerably lower than the legal
requirements, except in the case of BOD5, of which the percentage of removal fitted the
78
range of 70-90%. The concentration of fecal coliforms in the effluent was high above the
legal requirements. In addition, measurements of dissolved oxygen were performed to
investigate the aeration conditions inside the biological reactors.
Apparently, these results of the monitoring campaigns were strongly related to several
events and operational problems that occurred in the WWTP before and during the
campaigns. Examples of these problems are: the discharge of dry sludge; deficient
aeration and stirring conditions in the biological reactors resulting in the settlement of
sludge; resuspension of sludge on the secondary clarifier.
The dynamic simulation of the Valhelhas WWTP was confronted with several limitations:
a) scarcity of good analytical and flows information, and lack of flow measurement
infrastructures, which were necessary for the accuracy of mass balances to the process
units; b) over dimensioning of the system regarding to the influent characteristics (flows
and loads); and c) deficient operation. The desired stability for modeling was not verified
and consequently, the calibration and validation of the model of this WWTP as it was in
operation was not possible. Alternatively, an academic approach was carried out as an
attempt to understand the consequences, in terms of process efficiency, considering
different operation methodologies and a simplified layout. As a result, the global quality of
the final effluent could theoretically be improved and the operation costs minimized if only
one treatment line was used.
Despite the difficulties encountered throughout this project, which constrained the
development of the work, the goals of the study were accomplished. Moreover, it is
believed that this is the first study to integrate two different fields, namely wastewater
treatment modeling and respirometry, into a Portuguese case study.
Topics for future research
In the course of the work presented in this thesis, several types of problems and questions
that deserve future attention were encountered. In relation to the results that have been
presented, some important issues that need to be focused upon are:
1) Application of the wastewater treatment modeling to systems that have a more
stringent monitoring and better performances, in order to facilitate the calibration
and validation steps for learning purposes;
2) Development of the comprehension of the respirometric experiments for calibration
of activated sludge models;
3) Promotion of a dynamic international cooperation within this field of research to
increase the use of modeling in control and optimization of processes.

79
80
REFERENCES Abusam, A., Keesman, K., Spanjers, H., & van Straten, G. a. (2002). Effect of oxidation
ditch horizontal velocity on the nitrogen removal process. European Water Management
Online , European Water Association.
Almeida, M. C. (2000). Pollutant transformation processes in sewers under aerobic dry
weather flow conditions. PhD. Collection Teses e Programas de Investigação LNEC 17.
LNEC, Lisbon.
APHA-AWWA-WEF (1999). Standard methods for the examination of water and
wastewater (20th ed.). American Public Health Association, Washington DC, USA.
Avcioglu, E., Karahan-Gül, Ö., & Orhon, D. (2003). Estimation of stoichiometric and kinetic
coefficients of ASM3 under aerobic and anoxic conditions via respirometry. Wat. Sci.
Tech.,48 (8), 185-194.
Chudoba, P., Capdeville, B., & Chudoba, J. (1992). Explanation of biological meaning of
the So/Xo ratio in batch cultivation. Wat. Sci. Tech., 26 (3/4), 743-751.
Commission of the European Communities (2009). 5th Commission Summary on the
Implementation of the Urban Waste Water Treatment Directive. Brussels: Commission of
the European Communities.
Copp, J., Spanjers, H., & Vanrolleghem, P. (2002). Respirometry in control of the
activated sludge process: Benchmarking control strategies. IWA Scientific and Technical
Report Nº 11. IWA Publishing, London, UK.
Dang, J., Harvey, D., & Grady Jr., C. (1989). Evaluation of biodegradation kinetic with
respirometric data. Research Journal of the Water Pollution Control Federation, 61
(11/12), 1711-1721.
Dayton and Knight (2001). Optimization of the oxidation ditch process through automated
ORP control of aerobic/anoxic operation. Dayton and Knight LDA, Canada.
Dochain, D., & Vanrolleghem, P. (2001). Dynamical modelling and estimation in
wastewater treatment processes. IWA Publishing, London, UK.
Dold, P. (1980). A general model for the activated sludge process. Prog. Wat. Tech., 12
(6), 47-77.
Domingos, I. J. (1999). Contribuição para o estudo da biodegradação aeróbia de ácido
abiético e terpineol. PhD. UNL-FCT, Lisbon.
81
Drolka, M., Plazl, I., & Koloini, T. (2001). The results of mathematical model and pilot plant
research of wastewater treatment. Chemical Biochemical, 15 (2), 71-74.
Droste, R. (1997). Theory and practice of water and wastewater treatment. John Willey
and Sons, Inc.
Ekama, G., Barnard, J., Günthert, F., Krebs, P., MCorquodale, J., Parker, D., et al. (1997).
Secondary settling tanks: Theory, modeling, design and operation. IAWQ Scientific and
Technical Report Nº 6. IAWQ, London, England.
Ekama, G., Dold, P., & Marais, G. (1986). Procedures for determining influent COD
fractions and the maximum specific growth rate of heterotrophs in activated sludge
systems. Wat. Sci.Tech., 18 (6), 91-114.
EPA (2000). Wastewater Technology Fact Sheet: Oxidation ditches. Environmental
Protection Agency, Washington, D.C., U.S.A..
ERSAR (2009). Relatório Anual do Sector de Águas e Residuos em Portugal (2008).
Volume 3 - Avaliação da qualidade do serviço prestado aos utilizadores. Entidade
Reguladora dos Serviços de Águas e Resíduos.
Ferreira, E. (2002). Aplicação da respirometria na caracterização do esgoto doméstico
afluente a uma ETE por processo de lodos ativados. Faculdade de Tecnologia,
Departamento de Engenharia Civil e Ambiental. Universidade de Brasília, Brasília.
Ferreira, F. (2006). Modelação e gestão integrada de sistemas de águas residuais. PhD.
UTL, Instituto Superior Técnico, Departamento de Engenharia Civil, Lisboa.
Ferreira, M. d. (2004). Estudo da cinética da biodegradação de águas residuais por
respirometria. Departamento de Engenharia Civil e de Arquitectura. Universidade da
Beira Interior, Covilhã.
Ginestet, P., Maisonnier, A., & Spérandio, M. (2002). Wastewater COD characterization:
biodegradablity of physico-chemical fractions. Wat. Sci. Tech., 45 (6), 89-97.
Grady Jr., C. L., Smets, B. F., & Barbeau, D. (1996). Variability in kinetic parameter
estimates: A review of possible causes and a proposed terminology. Wat. Res., 30 (3),
742-748.
Grady Jr., C., Daigger, G., & Lim, H. (1999). Biological wastewater treatment (2nd ed.),
1076. Marcel Dekker, Inc., New York.
Gray, N. (2004). Biology of wastewater treatment (2nd ed.). Imperial College Press,
London.
82
Gujer, W., Henze, M., Mino, T., & van Loosdrecht, M. (2000). Activated Sludge Model Nº
3. Scientific and Technical Report Nº9. IWA, London.
Henze, M., Grady, C. J., Gujer, W., Marais, G., & Matsuo, T. (1987). Activated Sludge
Model Nº 1. Scientific and Technical Report Nº1. IAWPRC, London.
Henze, M., Gujer, W., Mino, T., Matsuo, T., Wentzel, M., & Marais, G. (1995). Activated
Sludge Model Nº2. IAWQ Scientific and Technical Report Nº3. IAWQ, London.
Henze, M., Gujer, W., Mino, T., Wentzel, M., Marais, G., & van Loosdrecht, M. (1999).
Activated Sludge Model Nº 2d. Wat. Sci. Technol., 39 (1), 165-182.
Hulsbeek, J., Kruit, J., Roeleveld, P., & van Loosdrecht, M. (2002). A pratical protocol for
dynamic modeling of activated sludge systems. Wat. Sci. Tech., 45 (6), 127-136.
Hydromantis, Inc. (2006). GPS-X technical reference: Version 5.0. Hydromantis, Inc.
IGAOT (2006). Temática - Avaliação do nível de cumprimento da Directiva do Conselho
91/271/CEE, de 21 de Maio. Decree-Lei nº 152/97, de 19 de Junho - Tratamento de
águas residuais urbanas índice geral. IGAOT, Lisboa.
INAG (2002). Aplicação da Directiva 91/271/CEE do Conselho, de 21 de Maio de 1991,
relativa ao tratamento de águas residuais urbanas, alterada pela Directiva 98/15/CE da
Comissão, de 27 de Fevereiro de 1998: Relatório da situação em Dezembro de 2000
Portugal. Instituto da Água, MAOTDR.
INAG (2007). Retrieved from Inventário Nacional de Sistemas de Abastecimento de Água
e de Águas Residuais: URL: http://insaar.inag.pt/index2_noflash.htm in December 2009.
INAG (2009). Relatório do estado do abastecimento de água e drenagem e do tratamento
de águas residuais, Sistemas públicos urbanos:INSAAR 2008. Instituto da Água.
INE (2002). Instituto Nacional de Estatística. Retrieved from http://www.ine.pt/ in
December 2009.
INE (2009). Estatísticas do Ambiente 2008. Instituto Nacional de Estatística, Lisboa.
Insel, G., Orhon, D., Vanrolleghem, P., & Henze, M. (2002). Important limitations in the
modeling of activated sludge - Biased calibration of the hydrolysis process. Wat.
Sci.Tech., 45 (12), 23-36.
IRAR. (2009). Annual report on water and waste services in Portugal 2007: Executive
summary. Institute for the Regulation of Water and Solid Waste.
Jeppsson, U. (1996). Modelling aspects of wastewater treatment processes. PhD. Lund
University, Lund Institute of Technology, Lund.
83
Karahan-Gül, Ö., Artan, N., Orhon, D., Henze, M., & van Loosdrecht, M. (2002).
Respirometric assessment of storage yield for different substrates. Wat. Sci. Tech., 46 (1),
345-352.
Koch, G., Kuhni, M., Gujer, W., & Siegrist, H. (2000). Calibration and validation of
activated sludge model Nº 3 for Swiss municipal wastewater. Water Res., 34, 3580-3590.
Langergraber, G., Rieger, L., Winkler, S., Alex, J., Wiese, J., Owerdieck, C., et al. (2004).
A guideline for simulation studies of wastewater treatment plants. Water Sci. Tech., 50 (7),
131-138.
MAOTDR (2007). PEAASAR II: Plano Estratégico de Abastecimento de Água e de
Saneamento de Águas Residuais 2007-2013. Ministério do Ambiente, do Ordenamento
do Território e do Desenvolvimento Regional.
Mathieu, S., & Etienne, P. (2000). Estimation of wastewater biodegradable COD fractions
by combining respirometric experiments in various S0/X0 ratios. Wat. Res., 34 (4), 1233-
1246.
Melcer, H., Dold, P. L., Jones, R. M., Bye, C. M., Takács, I., Stensel, H. D., et al. (2003).
Methods for wastewater characterization in activated sludge modeling. Water
Environment Research Foundation, Alexandria.
Metcalf & Eddy (1991). Wastewater engineering: treatment, disposal and reuse (3rd ed.).
McGraw-Hill.
Mhlanga, F., Brouckaert, C., Foxon, K., Fennemore, C., Mzulwini, D., & Buckley, C.
(2009). Simulation of a wastewater treatment plant receiving industrial effluents. Water
SA, 35 (4), 447-454.
Nelson, D. (1984). Biological treatment process control: Oxidation ditches. Student
manual. Linn-Benton Community College, Oregon.
Olsson, G., & Newell, B. (1999). Wastewater treatment systems: Modelling, diagnosis and
control. IWA Publishing, London.
Pattarkine, V.M., & Randall, C.W. (1999). The requirement of metal cations for enhanced
biological phosphorous removal by activated sludge. Water Sci. Tech., 40 (2),159-165.
Petersen, B. (2000). Calibration, identifiability and optimal experimental design for
activated sludge models. PhD., Universiteit Gent, Gent.
Ros, M. (1993). Respirometry of activated sludge. Technomic Publishing Company, Inc..
Lancaster, U.S.A..
84
Rozich, A. F., & Gaudy, A. F. (1992). Design and operation of activated sludge processes
using respirometry. Lewis Publishers, U.S.A..
Schwarz, C. A., Eilersen, A., Henze, M., Wichern, M., & Wilderer, P. (2003). Modeling of
storage and endogenous respiration with Activated Sludge Model Nº3. Environmental
Informatics Archive, 1, 357-365.
Sin, G., van Hulle, S. W., De Pauw, D. J., van Griensven, A., & Vanrolleghem, P. A.
(2005). A critical comparison of systematic calibration protocols for activated sludge
models: A SWOT analysis. Water Res,39, 2459-2474.
Sozen, S., Çokgor, E. U., Orhon, D., & Henze, M. (1998). Respirometric analysis of
activated sludge behaviour - Heterotrophic growth under aerobic and anoxic conditions.
Wat. Res., 32 (2), 476-488.
Spanjers, H., Vanrolleghem, P., Olsson, G., & Dold, P. (1998). Respirometry in control of
the activated sludge process: Principles. IAWQ Scientific and Technical Report Nº 7.
IAWQ, London.
Stypka, A. (1998). Factors influencing sludge settling parameters and solids flux in the
activated sludge process: A literature review. Advanced Wastewater Treatment Report
Series. Royal Institute of Technology, Stockholm.
Takács, I., Patry, G., & Nolasco, D. (1991). A dynamic model of the clarification thickening
process. Water Research, 25 (10), 1263-1271.
Vanrolleghem, P.A., Insel, G., Petersen, B., Sin, G., De Pauw, D., Nopens, I., Weijers, S.,
Gernaey, K. (2003). A comprehensive model calibration procedure for activated sludge
models. In: Proceedings: WEFTEC 2003, 76th Annual Technical Exhibition and
Conference.
Vanrolleghem, P., Spanjers, H., Petersen, B., Ginestet, P., & Takács, I. (1999). Estimating
(combinations of) activated sludge model Nº1 parameters and components by
respirometry. Water Sci. Tech., 39 (1), 195-214.

A1
APPENDICES


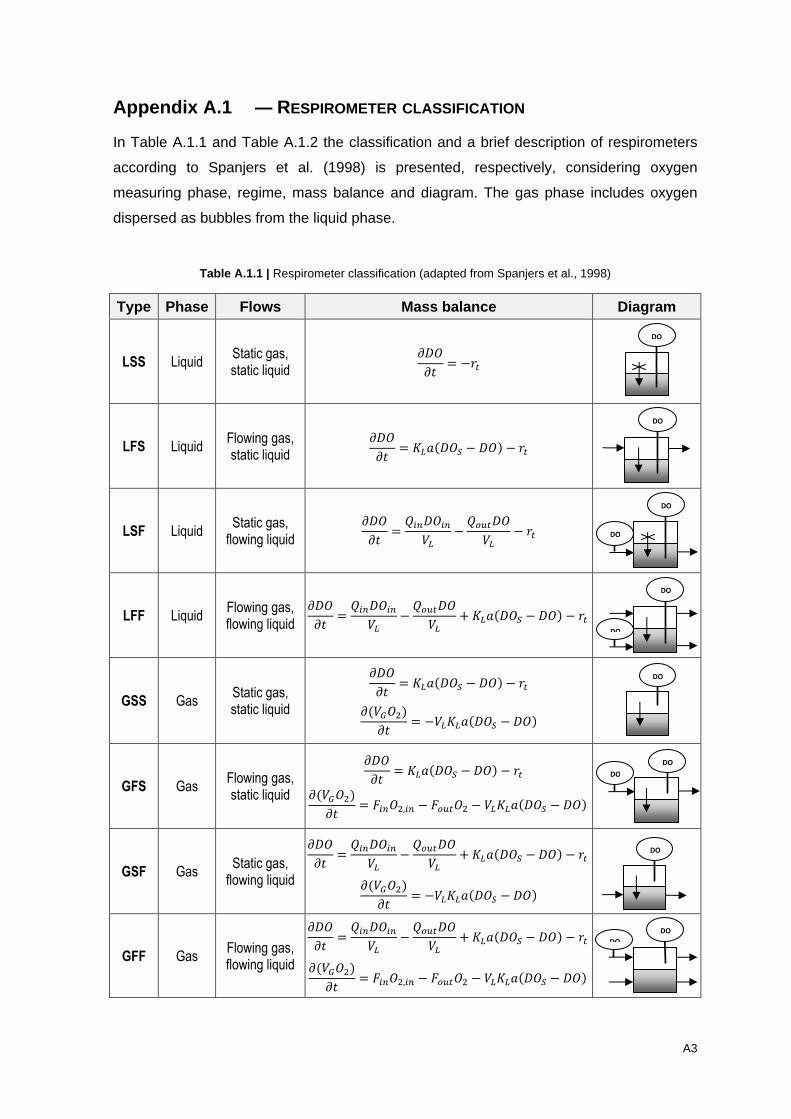
A3
Appendix A.1 ― RESPIROMETER CLASSIFICATION
In Table A.1.1 and Table A.1.2 the classification and a brief description of respirometers
according to Spanjers et al. (1998) is presented, respectively, considering oxygen
measuring phase, regime, mass balance and diagram. The gas phase includes oxygen
dispersed as bubbles from the liquid phase.
Table A.1.1 | Respirometer classification (adapted from Spanjers et al., 1998)
Type Phase Flows Mass balance Diagram
LSS Liquid Static gas, static liquid
�"#�( = −GT
LFS Liquid Flowing gas, static liquid
�"#�( = ��("# − "#) − GT
LSF Liquid Static gas,
flowing liquid
�"#�( = FLI"#LIW� − FORT"#W� − GT
LFF Liquid Flowing gas, flowing liquid
�"#�( = FLI"#LIW� − FORT"#W� + ��("# − "#) − GT
GSS Gas Static gas, static liquid
�"#�( = ��("# − "#) − GT �(WX#a)�( = −W���("# − "#)
GFS Gas Flowing gas, static liquid
�"#�( = ��("# − "#) − GT �(WX#a)�( = �LI#a,LI − �ORT#a − W���("# − "#)
GSF Gas Static gas,
flowing liquid
�"#�( = FLI"#LIW� − FORT"#W� + ��("# − "#) − GT
�(WX#a)�( = −W���("# − "#)
GFF Gas Flowing gas, flowing liquid
�"#�( = FLI"#LIW� − FORT"#W� + ��("# − "#) − GT
�(WX#a)�( = �LI#a,LI − �ORT#a − W���("# − "#)
DO
DO
DO
DO
DO
DO
DO
DO
DO
DO
DO
DO
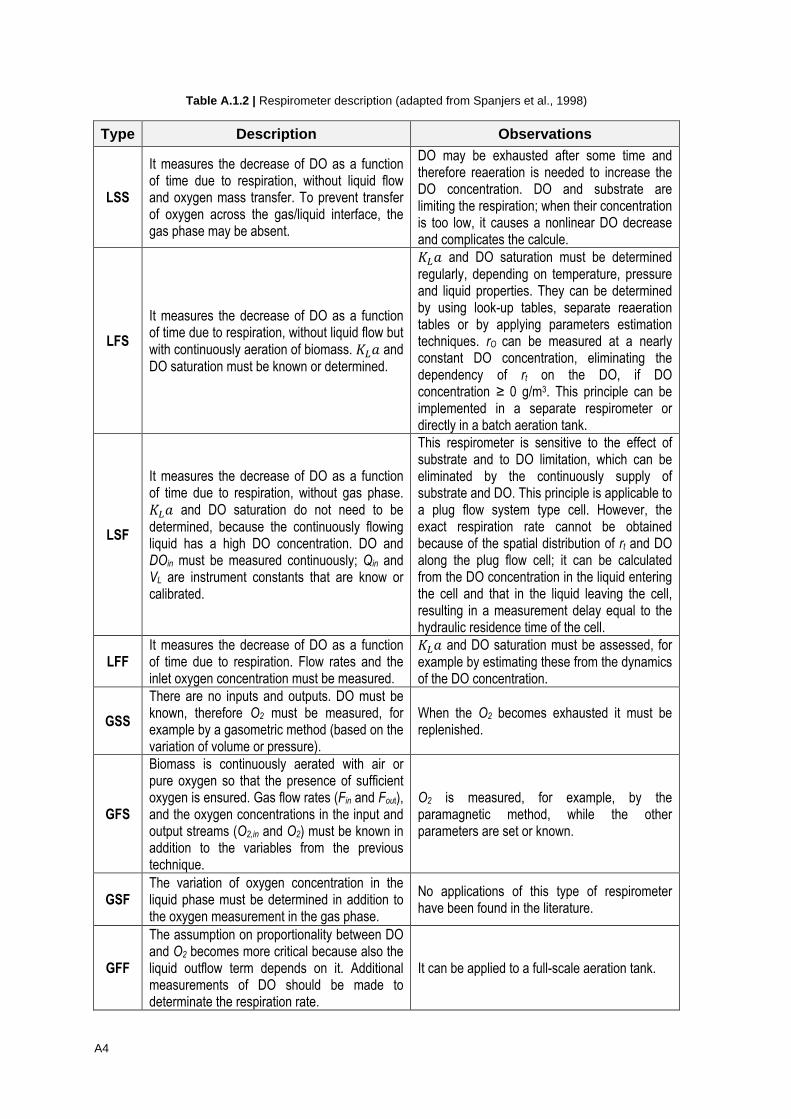
A4
Table A.1.2 | Respirometer description (adapted from Spanjers et al., 1998)
Type Description Observations
LSS
It measures the decrease of DO as a function of time due to respiration, without liquid flow and oxygen mass transfer. To prevent transfer of oxygen across the gas/liquid interface, the gas phase may be absent.
DO may be exhausted after some time and therefore reaeration is needed to increase the DO concentration. DO and substrate are limiting the respiration; when their concentration is too low, it causes a nonlinear DO decrease and complicates the calcule.
LFS
It measures the decrease of DO as a function of time due to respiration, without liquid flow but with continuously aeration of biomass. �� and DO saturation must be known or determined.
�� and DO saturation must be determined regularly, depending on temperature, pressure and liquid properties. They can be determined by using look-up tables, separate reaeration tables or by applying parameters estimation techniques. rO can be measured at a nearly constant DO concentration, eliminating the dependency of rt on the DO, if DO concentration ≥ 0 g/m3. This principle can be implemented in a separate respirometer or directly in a batch aeration tank.
LSF
It measures the decrease of DO as a function of time due to respiration, without gas phase. �� and DO saturation do not need to be determined, because the continuously flowing liquid has a high DO concentration. DO and DOin must be measured continuously; Qin and VL are instrument constants that are know or calibrated.
This respirometer is sensitive to the effect of substrate and to DO limitation, which can be eliminated by the continuously supply of substrate and DO. This principle is applicable to a plug flow system type cell. However, the exact respiration rate cannot be obtained because of the spatial distribution of rt and DO along the plug flow cell; it can be calculated from the DO concentration in the liquid entering the cell and that in the liquid leaving the cell, resulting in a measurement delay equal to the hydraulic residence time of the cell.
LFF It measures the decrease of DO as a function of time due to respiration. Flow rates and the inlet oxygen concentration must be measured.
�� and DO saturation must be assessed, for example by estimating these from the dynamics of the DO concentration.
GSS
There are no inputs and outputs. DO must be known, therefore O2 must be measured, for example by a gasometric method (based on the variation of volume or pressure).
When the O2 becomes exhausted it must be replenished.
GFS
Biomass is continuously aerated with air or pure oxygen so that the presence of sufficient oxygen is ensured. Gas flow rates (Fin and Fout), and the oxygen concentrations in the input and output streams (O2,in and O2) must be known in addition to the variables from the previous technique.
O2 is measured, for example, by the paramagnetic method, while the other parameters are set or known.
GSF The variation of oxygen concentration in the liquid phase must be determined in addition to the oxygen measurement in the gas phase.
No applications of this type of respirometer have been found in the literature.
GFF
The assumption on proportionality between DO and O2 becomes more critical because also the liquid outflow term depends on it. Additional measurements of DO should be made to determinate the respiration rate.
It can be applied to a full-scale aeration tank.
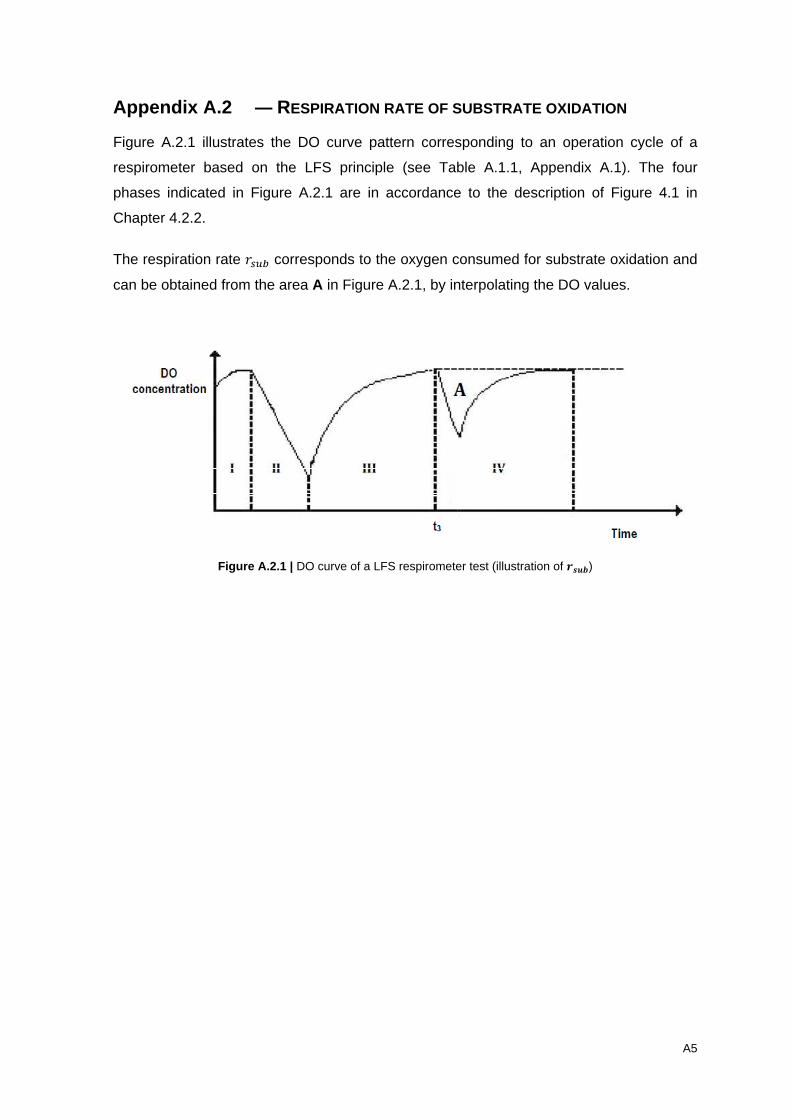
A5
Appendix A.2 ― RESPIRATION RATE OF SUBSTRATE OXIDATION
Figure A.2.1 illustrates the DO curve pattern corresponding to an operation cycle of a
respirometer based on the LFS principle (see Table A.1.1, Appendix A.1). The four
phases indicated in Figure A.2.1 are in accordance to the description of Figure 4.1 in
Chapter 4.2.2.
The respiration rate GQRS corresponds to the oxygen consumed for substrate oxidation and
can be obtained from the area A in Figure A.2.1, by interpolating the DO values.
Figure A.2.1 | DO curve of a LFS respirometer test (illustration of ����)

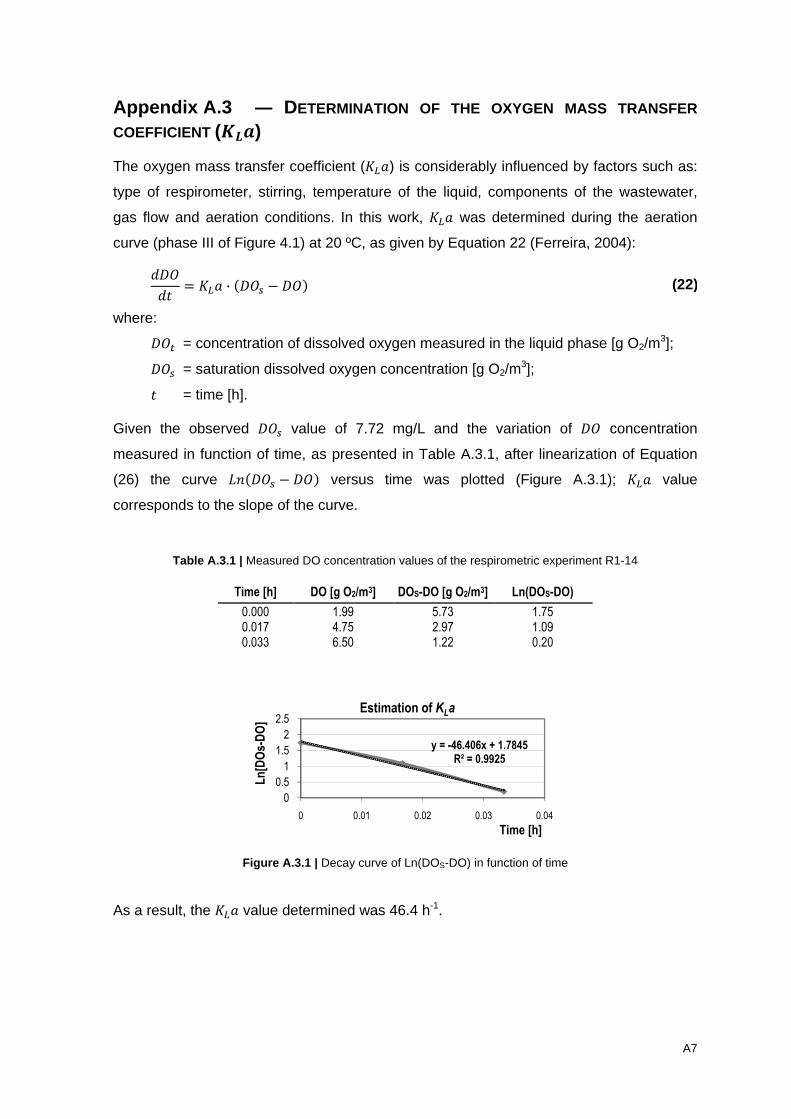
A7
Appendix A.3 ― DETERMINATION OF THE OXYGEN MASS TRANSFER
COEFFICIENT ( � )
The oxygen mass transfer coefficient (��) is considerably influenced by factors such as:
type of respirometer, stirring, temperature of the liquid, components of the wastewater,
gas flow and aeration conditions. In this work, �� was determined during the aeration
curve (phase III of Figure 4.1) at 20 ºC, as given by Equation 22 (Ferreira, 2004): {"#{( = �� ∙ ("#Q − "#) (22)
where: "#T = concentration of dissolved oxygen measured in the liquid phase [g O2/m3]; "#Q = saturation dissolved oxygen concentration [g O2/m
3]; ( = time [h].
Given the observed "#Q value of 7.72 mg/L and the variation of "# concentration
measured in function of time, as presented in Table A.3.1, after linearization of Equation
(26) the curve ¶m("#Q − "#) versus time was plotted (Figure A.3.1); �� value
corresponds to the slope of the curve.
Table A.3.1 | Measured DO concentration values of the respirometric experiment R1-14
Time [h] DO [g O2/m3] DOS-DO [g O2/m3] Ln(DOS-DO)
0.000 1.99 5.73 1.75 0.017 4.75 2.97 1.09 0.033 6.50 1.22 0.20
Figure A.3.1 | Decay curve of Ln(DOS-DO) in function of time
As a result, the �� value determined was 46.4 h-1.
y = -46.406x + 1.7845R² = 0.9925
0
0.5
1
1.5
2
2.5
0 0.01 0.02 0.03 0.04
Ln
[DO
s-D
O]
Time [h]
Estimation of KLa

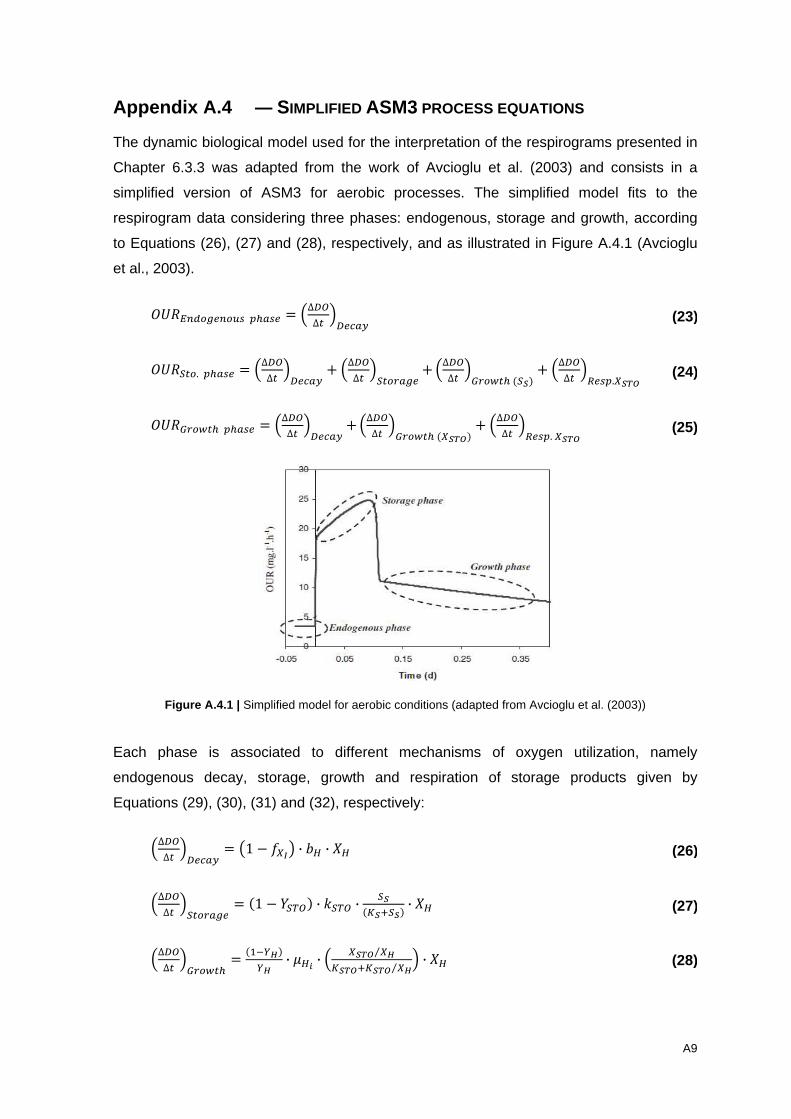
A9
Appendix A.4 ― SIMPLIFIED ASM3 PROCESS EQUATIONS
The dynamic biological model used for the interpretation of the respirograms presented in
Chapter 6.3.3 was adapted from the work of Avcioglu et al. (2003) and consists in a
simplified version of ASM3 for aerobic processes. The simplified model fits to the
respirogram data considering three phases: endogenous, storage and growth, according
to Equations (26), (27) and (28), respectively, and as illustrated in Figure A.4.1 (Avcioglu
et al., 2003).
#��·IJO¸HIORQ ¦K�QH = ¥∆º ∆T §ºHP�] (23)
#��TO. ¦K�QH = ¥∆º ∆T §ºHP�] + ¥∆º ∆T §TOi�¸H + ¥∆º ∆T §XiO»TK (0) + ¥∆º ∆T §¼HQ¦.10½¾ (24)
#��XiO»TK ¦K�QH = ¥∆º ∆T §ºHP�] + ¥∆º ∆T §XiO»TK (10½¾) + ¥∆º ∆T §¼HQ¦. 10½¾ (25)
Figure A.4.1 | Simplified model for aerobic conditions (adapted from Avcioglu et al. (2003))
Each phase is associated to different mechanisms of oxygen utilization, namely
endogenous decay, storage, growth and respiration of storage products given by
Equations (29), (30), (31) and (32), respectively:
¥∆º ∆T §ºHP�] = ª1 − +1,« ∙ �� ∙ !� (26)
¥∆º ∆T §TOi�¸H = (1 − �� ) ∙ )� ∙ 0(¿0r0) ∙ !� (27)
¥∆º ∆T §XiO»TK = (�uÀÁ)ÀÁ ∙ ��� ∙ ¥ 10½¾ 1Á⁄¿0½¾r¿0½¾ 1Á⁄ § ∙ !� (28)
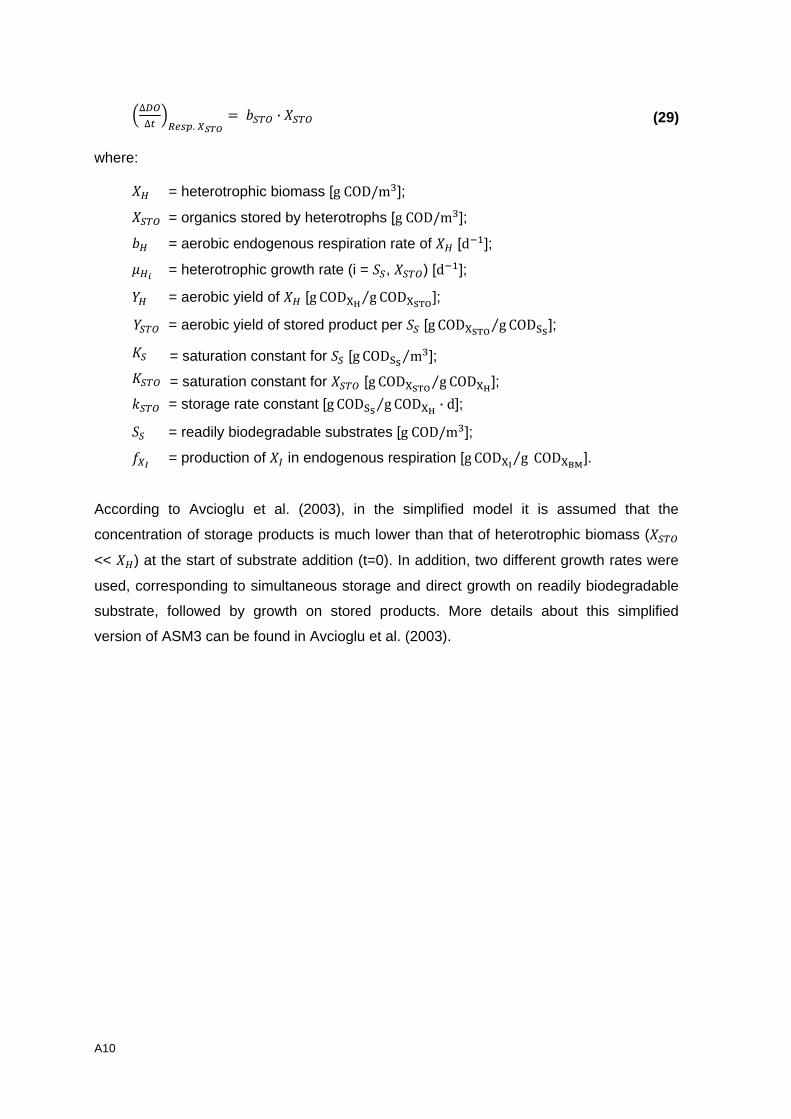
A10
¥∆º ∆T §¼HQ¦. 10½¾ = �� ∙ !� (29)
where:
!� = heterotrophic biomass [g COD/mn]; !� = organics stored by heterotrophs [g COD/mn]; �� = aerobic endogenous respiration rate of !� [du�]; ��� = heterotrophic growth rate (i = �, !� ) [du�]; �� = aerobic yield of !� [g COD7@ g⁄ COD7>DE]; �� = aerobic yield of stored product per � [g COD7>DE g⁄ COD=>]; = saturation constant for � [g COD=> mn⁄ ]; � = saturation constant for !� [g COD7>DE g⁄ COD7@]; )� = storage rate constant [g COD=> g⁄ COD7@ ∙ d]; � = readily biodegradable substrates [g COD/mn]; +1, = production of !2 in endogenous respiration [g COD78 g⁄ COD79:].
According to Avcioglu et al. (2003), in the simplified model it is assumed that the
concentration of storage products is much lower than that of heterotrophic biomass (!�
<< !�) at the start of substrate addition (t=0). In addition, two different growth rates were
used, corresponding to simultaneous storage and direct growth on readily biodegradable
substrate, followed by growth on stored products. More details about this simplified
version of ASM3 can be found in Avcioglu et al. (2003).
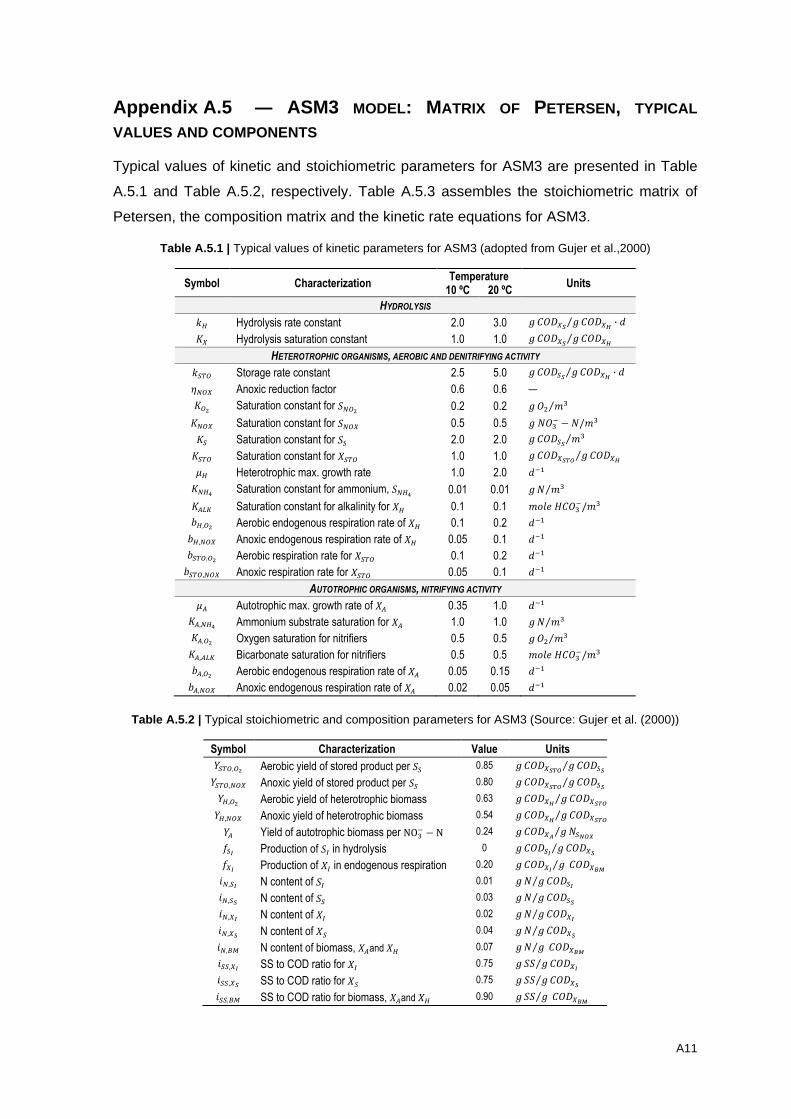
A11
Appendix A.5 ― ASM3 MODEL: MATRIX OF PETERSEN, TYPICAL
VALUES AND COMPONENTS
Typical values of kinetic and stoichiometric parameters for ASM3 are presented in Table
A.5.1 and Table A.5.2, respectively. Table A.5.3 assembles the stoichiometric matrix of
Petersen, the composition matrix and the kinetic rate equations for ASM3.
Table A.5.1 | Typical values of kinetic parameters for ASM3 (adopted from Gujer et al.,2000)
Symbol Characterization Temperature
Units 10 ºC 20 ºC
HYDROLYSIS )� Hydrolysis rate constant 2.0 3.0 - .#"10 -⁄ .#"1Á ∙ { 1 Hydrolysis saturation constant 1.0 1.0 - .#"10 -⁄ .#"1Á
HETEROTROPHIC ORGANISMS, AEROBIC AND DENITRIFYING ACTIVITY )� Storage rate constant 2.5 5.0 - .#"0 -⁄ .#"1Á ∙ { YU 1 Anoxic reduction factor 0.6 0.6 — % Saturation constant for �U % 0.2 0.2 - #a �n⁄ U 1 Saturation constant for �U 1 0.5 0.5 - b#nu − b/�n Saturation constant for � 2.0 2.0 - .#"0 �n⁄ � Saturation constant for !� 1.0 1.0 - .#"10½¾ -⁄ .#"1Á �� Heterotrophic max. growth rate 1.0 2.0 {u� U�� Saturation constant for ammonium, �U�� 0.01 0.01 - b �n⁄ ��¿ Saturation constant for alkalinity for !� 0.1 0.1 �p|* �.#nu/�n ��, % Aerobic endogenous respiration rate of !� 0.1 0.2 {u� ��,U 1 Anoxic endogenous respiration rate of !� 0.05 0.1 {u� �� , % Aerobic respiration rate for !� 0.1 0.2 {u� �� ,U 1 Anoxic respiration rate for !� 0.05 0.1 {u�
AUTOTROPHIC ORGANISMS, NITRIFYING ACTIVITY �� Autotrophic max. growth rate of !� 0.35 1.0 {u� �,U�� Ammonium substrate saturation for !� 1.0 1.0 - b �n⁄ �, % Oxygen saturation for nitrifiers 0.5 0.5 - #a �n⁄ �,��¿ Bicarbonate saturation for nitrifiers 0.5 0.5 �p|* �.#nu/�n ��, % Aerobic endogenous respiration rate of !� 0.05 0.15 {u� ��,U 1 Anoxic endogenous respiration rate of !� 0.02 0.05 {u�
Table A.5.2 | Typical stoichiometric and composition parameters for ASM3 (Source: Gujer et al. (2000))
Symbol Characterization Value Units �� , % Aerobic yield of stored product per � 0.85 - .#"10½¾ -⁄ .#"0 �� ,U 1 Anoxic yield of stored product per � 0.80 - .#"10½¾ -⁄ .#"0 ��, % Aerobic yield of heterotrophic biomass 0.63 - .#"1Á -⁄ .#"10½¾��,U 1 Anoxic yield of heterotrophic biomass 0.54 - .#"1Á -⁄ .#"10½¾�� Yield of autotrophic biomass per NOnu − N 0.24 - .#"1Ä -⁄ bÅ¾Æ +, Production of �2 in hydrolysis 0 - .#", -⁄ .#"10 +1, Production of !2 in endogenous respiration 0.20 - .#"1, -⁄ .#"1ÇÈ �U,, N content of �2 0.01 - b -⁄ .#", �U,0 N content of � 0.03 - b -⁄ .#"0 �U,1, N content of !2 0.02 - b -⁄ .#"1, �U,10 N content of !� 0.04 - b -⁄ .#"10 �U,<� N content of biomass, !�and !� 0.07 - b -⁄ .#"1ÇÈ �,1, SS to COD ratio for !2 0.75 - �� -⁄ .#"1, �,10 SS to COD ratio for !� 0.75 - �� -⁄ .#"10 �,<� SS to COD ratio for biomass, !�and !� 0.90 - �� -⁄ .#"1ÇÈ
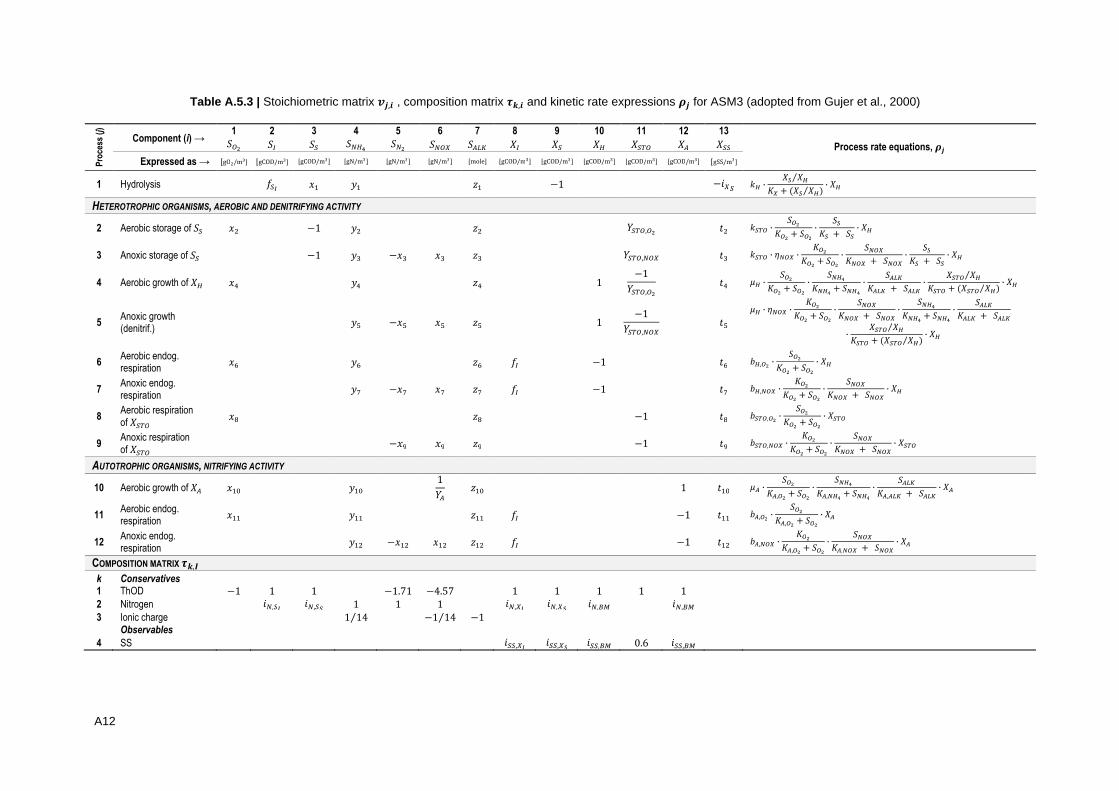
A12
Table A.5.3 | Stoichiometric matrix ��,� , composition matrix ��,� and kinetic rate expressions �� for ASM3 (adopted from Gujer et al., 2000) P
roce
ss (j)
Component (i) → 1 2 3 4 5 6 7 8 9 10 11 12 13
Process rate equations, �� � % �2 � �U�� �U% �U 1 ���¿ !2 ! !� !� !� !
Expressed as → [gOa/mn] [gCOD/mn] [gCOD/mn] [gN/mn] [gN/mn] [gN/mn] [mole] [gCOD/mn] [gCOD/mn] [gCOD/mn] [gCOD/mn] [gCOD/mn] [gSS/m3] 1 Hydrolysis +, �� e� h� −1 −�1 )� ∙ ! !�⁄1 + (! !�)⁄ ∙ !� HETEROTROPHIC ORGANISMS, AEROBIC AND DENITRIFYING ACTIVITY
2 Aerobic storage of � �a −1 ea ha �� , % (a )� ∙ � % % + � % ∙ � + � ∙ !� 3 Anoxic storage of � −1 en −�n �n hn �� ,U 1 (n )� ∙ YU 1 ∙ % % + � % ∙ �U 1U 1 + �U 1 ∙ � + � ∙ !� 4 Aerobic growth of !� �q eq hq 1 −1�� , % (q �� ∙ � % % + � % ∙ �U��U�� + �U�� ∙ ���¿��¿ + ���¿ ∙ !� !�⁄� + (!� !�)⁄ ∙ !� 5
Anoxic growth (denitrif.)
e_ −�_ �_ h_ 1 −1�� ,U 1 (_ �� ∙ YU 1 ∙ % % + � % ∙ �U 1U 1 + �U 1 ∙ �U��U�� + �U�� ∙ ���¿��¿ + ���¿∙ !� !�⁄� + (!� !�)⁄ ∙ !� 6
Aerobic endog. respiration
�Î eÎ hÎ +2 −1 (Î ��, % ∙ � % % + � % ∙ !� 7
Anoxic endog. respiration
e` −�` �` h` +2 −1 (` ��,U 1 ∙ % % + � % ∙ �U 1U 1 + �U 1 ∙ !� 8
Aerobic respiration of !�
�Ï hÏ −1 (Ï �� , % ∙ � % % + � % ∙ !� 9
Anoxic respiration of !�
−�Ð �Ð hÐ −1 (Ð �� ,U 1 ∙ % % + � % ∙ �U 1U 1 + �U 1 ∙ !� AUTOTROPHIC ORGANISMS, NITRIFYING ACTIVITY 10 Aerobic growth of !� ��\ e�\ 1�� h�\ 1 (�\ �� ∙ � %�, % + � % ∙ �U���,U�� + �U�� ∙ ���¿�,��¿ + ���¿ ∙ !� 11
Aerobic endog. respiration
��� e�� h�� +2 −1 (�� ��, % ∙ � %�, % + � % ∙ !� 12
Anoxic endog. respiration
e�a −��a ��a h�a +2 −1 (�a ��,U 1 ∙ %�, % + � % ∙ �U 1�,U 1 + �U 1 ∙ !� COMPOSITION MATRIX ��,Ñ k Conservatives 1 ThOD −1 1 1 −1.71 −4.57 1 1 1 1 1 2 Nitrogen �U,, �U,0 1 1 1 �U,1, �U,10 �U,<� �U,<� 3 Ionic charge 1 14⁄ −1 14⁄ −1 Observables
4 SS �,1, �,10 �,<� 0.6 �,<�

A13
Appendix A.6 ― MAP OF VALHELHAS WASTEWATER DRAINAGE SYSTEM

A15
Appendix A.7 ― PLANT OF OPERATION OF VALHELHAS WASTEWATER
TREATMENT PLANT

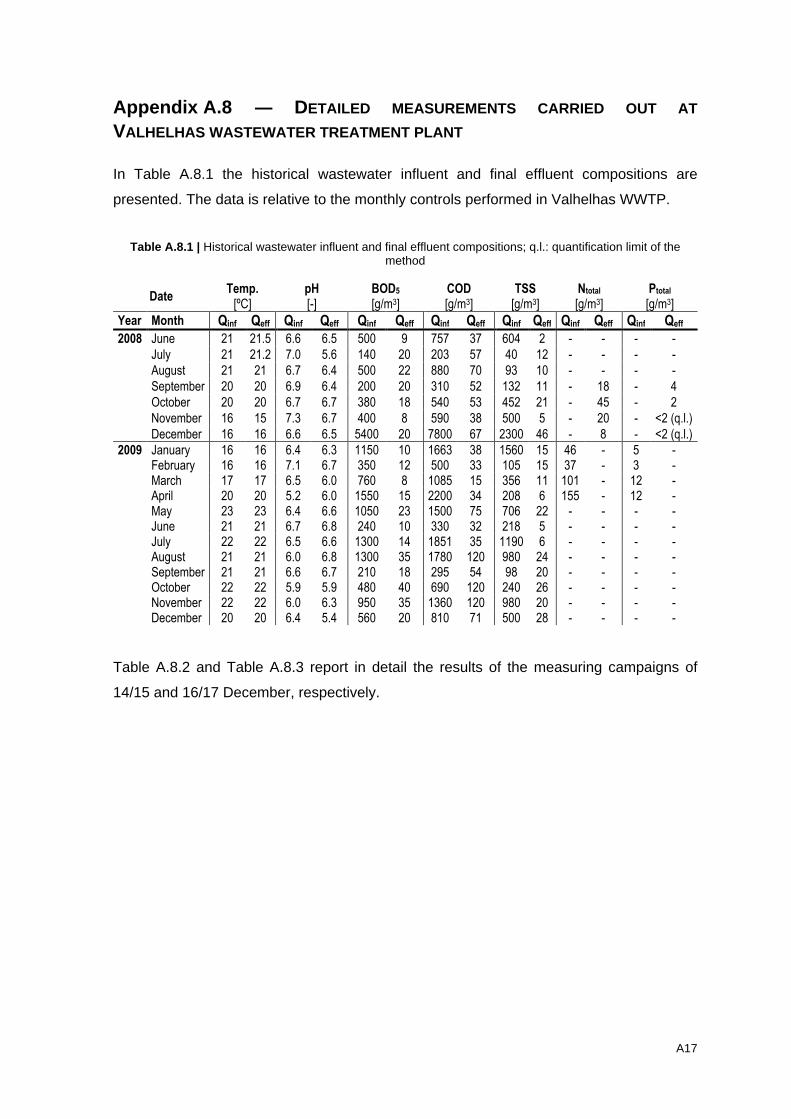
A17
Appendix A.8 ― DETAILED MEASUREMENTS CARRIED OUT AT
VALHELHAS WASTEWATER TREATMENT PLANT
In Table A.8.1 the historical wastewater influent and final effluent compositions are
presented. The data is relative to the monthly controls performed in Valhelhas WWTP.
Table A.8.1 | Historical wastewater influent and final effluent compositions; q.l.: quantification limit of the method
Date Temp.
[ºC] pH [-]
BOD5 [g/m3]
COD [g/m3]
TSS [g/m3]
Ntotal [g/m3]
Ptotal [g/m3]
Year Month Qinf Qeff Qinf Qeff Qinf Qeff Qinf Qeff Qinf Qeff Qinf Qeff Qinf Qeff
2008 June 21 21.5 6.6 6.5 500 9 757 37 604 2 - - - -
July 21 21.2 7.0 5.6 140 20 203 57 40 12 - - - -
August 21 21 6.7 6.4 500 22 880 70 93 10 - - - -
September 20 20 6.9 6.4 200 20 310 52 132 11 - 18 - 4
October 20 20 6.7 6.7 380 18 540 53 452 21 - 45 - 2
November 16 15 7.3 6.7 400 8 590 38 500 5 - 20 - <2 (q.l.)
December 16 16 6.6 6.5 5400 20 7800 67 2300 46 - 8 - <2 (q.l.)
2009 January 16 16 6.4 6.3 1150 10 1663 38 1560 15 46 - 5 - February 16 16 7.1 6.7 350 12 500 33 105 15 37 - 3 - March 17 17 6.5 6.0 760 8 1085 15 356 11 101 - 12 - April 20 20 5.2 6.0 1550 15 2200 34 208 6 155 - 12 - May 23 23 6.4 6.6 1050 23 1500 75 706 22 - - - - June 21 21 6.7 6.8 240 10 330 32 218 5 - - - - July 22 22 6.5 6.6 1300 14 1851 35 1190 6 - - - - August 21 21 6.0 6.8 1300 35 1780 120 980 24 - - - - September 21 21 6.6 6.7 210 18 295 54 98 20 - - - - October 22 22 5.9 5.9 480 40 690 120 240 26 - - - - November 22 22 6.0 6.3 950 35 1360 120 980 20 - - - - December 20 20 6.4 5.4 560 20 810 71 500 28 - - - -
Table A.8.2 and Table A.8.3 report in detail the results of the measuring campaigns of
14/15 and 16/17 December, respectively.
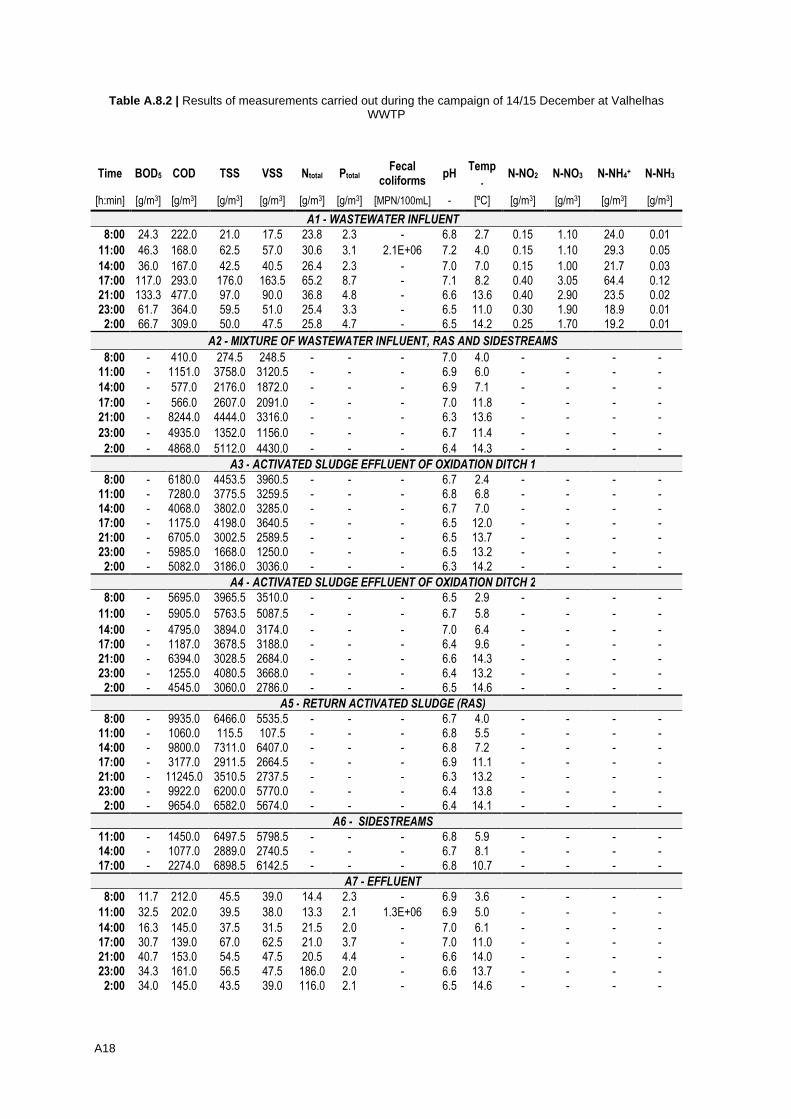
A18
Table A.8.2 | Results of measurements carried out during the campaign of 14/15 December at Valhelhas WWTP
Time BOD5 COD TSS VSS Ntotal Ptotal Fecal
coliforms pH
Temp.
N-NO2 N-NO3 N-NH4+ N-NH3
[h:min] [g/m3] [g/m3] [g/m3] [g/m3] [g/m3] [g/m3] [MPN/100mL] - [ºC] [g/m3] [g/m3] [g/m3] [g/m3]
A1 - WASTEWATER INFLUENT
8:00 24.3 222.0 21.0 17.5 23.8 2.3 - 6.8 2.7 0.15 1.10 24.0 0.01
11:00 46.3 168.0 62.5 57.0 30.6 3.1 2.1E+06 7.2 4.0 0.15 1.10 29.3 0.05
14:00 36.0 167.0 42.5 40.5 26.4 2.3 - 7.0 7.0 0.15 1.00 21.7 0.03 17:00 117.0 293.0 176.0 163.5 65.2 8.7 - 7.1 8.2 0.40 3.05 64.4 0.12 21:00 133.3 477.0 97.0 90.0 36.8 4.8 - 6.6 13.6 0.40 2.90 23.5 0.02 23:00 61.7 364.0 59.5 51.0 25.4 3.3 - 6.5 11.0 0.30 1.90 18.9 0.01 2:00 66.7 309.0 50.0 47.5 25.8 4.7 - 6.5 14.2 0.25 1.70 19.2 0.01
A2 - MIXTURE OF WASTEWATER INFLUENT, RAS AND SIDESTREAMS
8:00 - 410.0 274.5 248.5 - - - 7.0 4.0 - - - - 11:00 - 1151.0 3758.0 3120.5 - - - 6.9 6.0 - - - -
14:00 - 577.0 2176.0 1872.0 - - - 6.9 7.1 - - - -
17:00 - 566.0 2607.0 2091.0 - - - 7.0 11.8 - - - - 21:00 - 8244.0 4444.0 3316.0 - - - 6.3 13.6 - - - -
23:00 - 4935.0 1352.0 1156.0 - - - 6.7 11.4 - - - -
2:00 - 4868.0 5112.0 4430.0 - - - 6.4 14.3 - - - -
A3 - ACTIVATED SLUDGE EFFLUENT OF OXIDATION DITCH 1
8:00 - 6180.0 4453.5 3960.5 - - - 6.7 2.4 - - - - 11:00 - 7280.0 3775.5 3259.5 - - - 6.8 6.8 - - - - 14:00 - 4068.0 3802.0 3285.0 - - - 6.7 7.0 - - - - 17:00 - 1175.0 4198.0 3640.5 - - - 6.5 12.0 - - - - 21:00 - 6705.0 3002.5 2589.5 - - - 6.5 13.7 - - - - 23:00 - 5985.0 1668.0 1250.0 - - - 6.5 13.2 - - - - 2:00 - 5082.0 3186.0 3036.0 - - - 6.3 14.2 - - - -
A4 - ACTIVATED SLUDGE EFFLUENT OF OXIDATION DITCH 2
8:00 - 5695.0 3965.5 3510.0 - - - 6.5 2.9 - - - -
11:00 - 5905.0 5763.5 5087.5 - - - 6.7 5.8 - - - -
14:00 - 4795.0 3894.0 3174.0 - - - 7.0 6.4 - - - - 17:00 - 1187.0 3678.5 3188.0 - - - 6.4 9.6 - - - - 21:00 - 6394.0 3028.5 2684.0 - - - 6.6 14.3 - - - - 23:00 - 1255.0 4080.5 3668.0 - - - 6.4 13.2 - - - - 2:00 - 4545.0 3060.0 2786.0 - - - 6.5 14.6 - - - -
A5 - RETURN ACTIVATED SLUDGE (RAS)
8:00 - 9935.0 6466.0 5535.5 - - - 6.7 4.0 - - - - 11:00 - 1060.0 115.5 107.5 - - - 6.8 5.5 - - - - 14:00 - 9800.0 7311.0 6407.0 - - - 6.8 7.2 - - - - 17:00 - 3177.0 2911.5 2664.5 - - - 6.9 11.1 - - - - 21:00 - 11245.0 3510.5 2737.5 - - - 6.3 13.2 - - - - 23:00 - 9922.0 6200.0 5770.0 - - - 6.4 13.8 - - - - 2:00 - 9654.0 6582.0 5674.0 - - - 6.4 14.1 - - - -
A6 - SIDESTREAMS
11:00 - 1450.0 6497.5 5798.5 - - - 6.8 5.9 - - - - 14:00 - 1077.0 2889.0 2740.5 - - - 6.7 8.1 - - - - 17:00 - 2274.0 6898.5 6142.5 - - - 6.8 10.7 - - - -
A7 - EFFLUENT
8:00 11.7 212.0 45.5 39.0 14.4 2.3 - 6.9 3.6 - - - -
11:00 32.5 202.0 39.5 38.0 13.3 2.1 1.3E+06 6.9 5.0 - - - -
14:00 16.3 145.0 37.5 31.5 21.5 2.0 - 7.0 6.1 - - - - 17:00 30.7 139.0 67.0 62.5 21.0 3.7 - 7.0 11.0 - - - - 21:00 40.7 153.0 54.5 47.5 20.5 4.4 - 6.6 14.0 - - - - 23:00 34.3 161.0 56.5 47.5 186.0 2.0 - 6.6 13.7 - - - - 2:00 34.0 145.0 43.5 39.0 116.0 2.1 - 6.5 14.6 - - - -
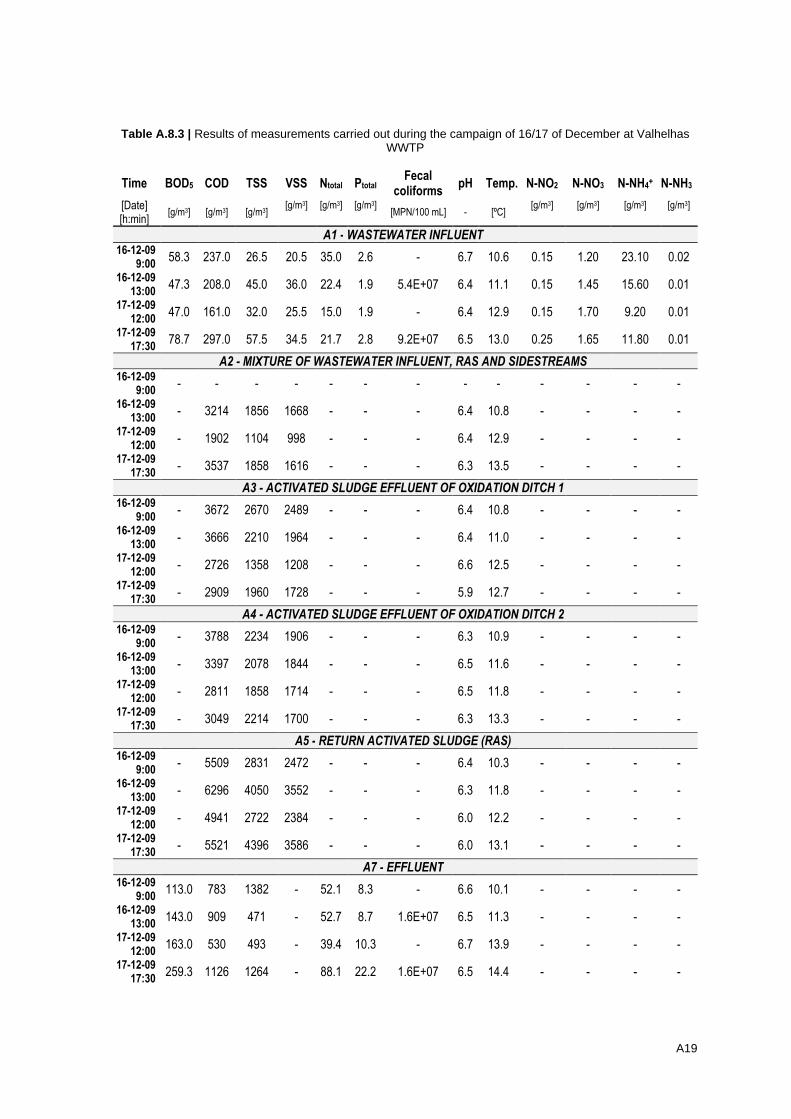
A19
Table A.8.3 | Results of measurements carried out during the campaign of 16/17 of December at Valhelhas WWTP
Time BOD5 COD TSS VSS Ntotal Ptotal Fecal
coliforms pH Temp. N-NO2 N-NO3 N-NH4+ N-NH3
[Date] [h:min]
[g/m3] [g/m3] [g/m3] [g/m3] [g/m3] [g/m3]
[MPN/100 mL] - [ºC] [g/m3] [g/m3] [g/m3] [g/m3]
A1 - WASTEWATER INFLUENT 16-12-09
9:00 58.3 237.0 26.5 20.5 35.0 2.6 - 6.7 10.6 0.15 1.20 23.10 0.02
16-12-09 13:00
47.3 208.0 45.0 36.0 22.4 1.9 5.4E+07 6.4 11.1 0.15 1.45 15.60 0.01
17-12-09 12:00
47.0 161.0 32.0 25.5 15.0 1.9 - 6.4 12.9 0.15 1.70 9.20 0.01
17-12-09 17:30
78.7 297.0 57.5 34.5 21.7 2.8 9.2E+07 6.5 13.0 0.25 1.65 11.80 0.01
A2 - MIXTURE OF WASTEWATER INFLUENT, RAS AND SIDESTREAMS 16-12-09
9:00 - - - - - - - - - - - - -
16-12-09 13:00
- 3214 1856 1668 - - - 6.4 10.8 - - - -
17-12-09 12:00
- 1902 1104 998 - - - 6.4 12.9 - - - -
17-12-09 17:30
- 3537 1858 1616 - - - 6.3 13.5 - - - -
A3 - ACTIVATED SLUDGE EFFLUENT OF OXIDATION DITCH 1 16-12-09
9:00 - 3672 2670 2489 - - - 6.4 10.8 - - - -
16-12-09 13:00
- 3666 2210 1964 - - - 6.4 11.0 - - - -
17-12-09 12:00
- 2726 1358 1208 - - - 6.6 12.5 - - - -
17-12-09 17:30
- 2909 1960 1728 - - - 5.9 12.7 - - - -
A4 - ACTIVATED SLUDGE EFFLUENT OF OXIDATION DITCH 2 16-12-09
9:00 - 3788 2234 1906 - - - 6.3 10.9 - - - -
16-12-09 13:00
- 3397 2078 1844 - - - 6.5 11.6 - - - -
17-12-09 12:00
- 2811 1858 1714 - - - 6.5 11.8 - - - -
17-12-09 17:30
- 3049 2214 1700 - - - 6.3 13.3 - - - -
A5 - RETURN ACTIVATED SLUDGE (RAS) 16-12-09
9:00 - 5509 2831 2472 - - - 6.4 10.3 - - - -
16-12-09 13:00
- 6296 4050 3552 - - - 6.3 11.8 - - - -
17-12-09 12:00
- 4941 2722 2384 - - - 6.0 12.2 - - - -
17-12-09 17:30
- 5521 4396 3586 - - - 6.0 13.1 - - - -
A7 - EFFLUENT 16-12-09
9:00 113.0 783 1382 - 52.1 8.3 - 6.6 10.1 - - - -
16-12-09 13:00
143.0 909 471 - 52.7 8.7 1.6E+07 6.5 11.3 - - - -
17-12-09 12:00
163.0 530 493 - 39.4 10.3 - 6.7 13.9 - - - -
17-12-09 17:30
259.3 1126 1264 - 88.1 22.2 1.6E+07 6.5 14.4 - - - -
