contribution of variations in northern hemisphere annular
TRANSCRIPT

1
Contribution of variations in Northern Hemisphere annular mode to the near-surface wind speed 1
changes over Eastern China for 1979-2017 2
Jinlin Zha1,2, Cheng Shen3, Jian Wu2,*, Deming Zhao1,†, and Cesar Azorin-Molina4,5 3
1CAS Key Laboratory of Regional Climate and Environment for Temperate East Asia, Institute of 4
Atmospheric Physics, Chinese Academy of Sciences, Beijing 100029, People’s Republic of China 5
2Key Laboratory of Atmospheric Environment and Processes in the Boundary Layer over the Low-Latitude 6
Plateau Region, Department of Atmospheric Science, Yunnan University, Kunming 650091, People’s 7
Republic of China 8
3Gaochun Meteorological Bureau, Nanjing 211300, People’s Republic of China 9
4Centro de Investigaciones sobre Desertificación, Consejo Superior de Investigaciones Científicas 10
(CIDE-CSIC), Moncada, Valencia, Spain 11
5 University of Gothenburg, Department of Earth Sciences - Regional Climate Group, Gothenburg, Sweden 12
*Corresponding author: Jian Wu ([email protected]) 13
†Additionally corresponding author: Deming Zhao ([email protected]) 14

2
Abstract 15
Studies have shown that large-scale ocean-atmosphere circulations (LOACs) played the major role to the 16
near-surface wind speed (NWS) changes over China; however, the mechanisms whereby LOACs influences 17
NWS to have received little attention. In this study, the processes of the Northern Hemisphere annular mode 18
(NAM) influencing the NWS changes are revealed over eastern China for 1979-2017. The results showed a 19
slowdown in NWS, at a rate of −0.09±0.01 m s-1 decade-1; meanwhile, this decline could be partly driven by 20
the weakening of the zonal wind component. When the NAM exhibits positive phases, the zonal-mean 21
westerly weakens at the low-to-mid-latitudes (10°–40°N); meanwhile, in the troposphere descending flows 22
prevail near 40°N and ascending flows prevail near 65°N, and in the lower troposphere there are northerly 23
anomalies at the low-to-mid-latitudes and southerly anomalies at mid-to-high latitudes (40°–70°N). The 24
anomalous meridional flows transport heat from lower latitudes to higher latitudes and weaken the 25
north–south air temperature gradient. The decreased air temperature gradient over East Asia reduces the 26
pressure-gradient near the surface in eastern China, thereby decreasing the NWS. Furthermore, the effects of 27
NAM on NWS changes are more significant at interannual scale than decadal scale. 32.0±15.8 % of the 28
changes in the annual mean NWS are caused by the variations in NAM; meanwhile, the NAM contribution 29
to the interannual changes in the zonal component of NWS reach 45.0±12.9 %. 30
Keywords: near-surface wind speed, temperature gradient, pressure gradient, Northern Hemisphere annular 31
mode 32
1 Introduction 33
Near-surface wind speed (NWS) partially governs the transfer of energy, water, and momentum between 34
the land surface and the lower atmosphere (Azorin-Molina et al. 2014; Kim and Paik 2015). Changes in the 35
NWS affect long-term wind energy production (Pryor and Barthelmie 2011; Tobin et al. 2015, 2016; Tian et 36

3
al. 2018), evapotranspiration (McVicar et al. 2012), aerosol dispersion (Lin et al. 2015; Segovia et al. 2017; 37
Shi et al. 2019; Zhang et al. 2019a), among others. Consequently, understanding what causes the NWS to 38
change is critical for addressing some regional environmental issues (Jacobson and Kaufman 2006; McVicar 39
et al. 2007). 40
A long-term decrease in NWS has been discovered at global-scale (Berrisford et al. 2015; Dunn et al. 41
2016; Azorin-Molina et al. 2017; Zhang et al. 2019b), with an average linear trend of −0.08 m s-1 decade-1 42
for 1979-2008 (Vautard et al. 2010). At regional-scale, the NWS exhibited decreasing trends of −0.09, −0.16, 43
−0.12, and −0.07 m s-1 decade-1 in Europe, Central Asia, East Asia, and North America, respectively 44
(Vautard et al. 2010). In Europe, the decrease in NWS was discovered mainly in Turkey (Dadaser-Celik and 45
Cengiz 2014), Portugal and Spain (Azorin-Molina et al. 2014, 2016), and Finland (Laapas and Venalainen 46
2018). In Asia, it was reported principally in South Korea (Kim and Paik 2015) and China (Liu et al. 2014; 47
Wu et al. 2016, 2018a; Shi et al. 2015, 2019; Zha et al. 2017a, b; Zhang et al. 2019c). In North America, the 48
NWS decrease was found in Canada (Wan et al. 2010) and America (Pryor et al. 2009; Pryor and Ledolter 49
2010; Malloy et al. 2015), and it has been discovered also in Australia (McVicar et al. 2008). Overall, 50
decreased NWS is a global fact (McVicar et al. 2012; Wu et al. 2018b). Roderick et al. (2007) termed this 51
decreasing trend in SWS “stilling”. 52
A terrestrial stilling has been revealed over the past several decades, but some studies also discovered that 53
a weak increase in NWS over the past decades, termed “reversal” (Zeng et al. 2019). Yang et al. (2012) 54
proposed that the annual mean NWS increased over southwestern China after 2000, with an increasing trend 55
of +0.55 m s-1 decade-1. The strengthening of NWS was also observed over northwestern China for 56
1993-2005, with a trend coefficient of +0.04 m s-1 decade-1 (Li et al. 2018). Zha et al. (2019a) discovered 57
that a weak increase in NWS over eastern China was detected only in winter since 2000. Zhang and Wang 58
(2020) suggested that the original NWS time series increased over entire China after 1990s. Hence, the 59

4
turning point of stilling is not consistent among different regions. Zeng et al (2019) highlighted the major 60
role of the ocean-atmosphere oscillations in explaining the “stilling” vs. “reversal” phenomena. 61
The causes of NWS decrease can be attributed to both global and regional scale factors (McVicar et al. 62
2012; Wu et al. 2018b). Significant reductions in NWSs have been observed in many global regions as 63
mentioned above, thereby indicating that large-scale ocean-atmosphere circulations (LOACs) played a 64
considerable role to the stilling and reversal (Earl et al. 2013; Jerez et al. 2013; Azorin-Molina et al. 2014, 65
2016; Zhang and Wang 2020). In China, Yang et al. (2012) indicated that the NWS changes in southwestern 66
China were affected by LOACs. Lin et al. (2013) strongly proposed that the spatial gradients of warming or 67
cooling might change the NWS significantly at regional-scale through atmospheric thermal adaption. Xu 68
et al. (2006) proposed that the decreased NWS could be attributed to the steady decline in the East Asia 69
monsoons during 1969–2000. Fu et al. (2011) pointed out that the temporal variations in NWS over China 70
corresponded well with the positive and negative phases of the interdecadal Pacific oscillation. Chen et al. 71
(2013) revealed that the warm and cold Arctic Oscillation (AO) phases have distinct influences on the NWS 72
probability distribution; thus, they proposed the internal climate variability as a major source of both 73
interannual and long-term NWS changes. Accordingly, the LOACs impact on the NWS changes showed 74
large uncertainty over China (Jiang et al. 2010a; Fu et al. 2011; Lin et al. 2013; Wu et al. 2018a). 75
Variations in LOACs can alter air temperature gradient and pressure gradient (Wu et al. 2017, 2018b; Li et 76
al. 2018). Guo et al. (2017) indicated that the NWS and the air temperature showed negative correlations 77
over and around the Tibetan Plateau in China. You et al. (2010) proposed that the most likely cause of the 78
decreased NWS over Tibetan Plateau was the asymmetric reduction of latitudinal surface air temperature 79
gradient. Guo et al. (2011) quantified the influence of pressure gradient on the weakening of NWS over 80
China for 1969-2005. In the former study, we calculated the pressure-gradient force from the surface to 81
300 hPa and discovered the changes in NWS over eastern China might be due primarily to the 82

5
pressure-gradient force (Wu et al. 2018a). These abovementioned studies hypothesized that the air 83
temperature gradient and pressure gradient play the predominant roles. However, how the changes of 84
LOACs impact on the air temperature and pressure gradients and, therefore, on NWS changes are rarely 85
analyzed in the scientific literature (You et al. 2010; Guo et al. 2011; Lin et al. 2013). 86
The dominant circulation pattern in Northern Hemisphere is the Northern Hemisphere annular mode 87
(NAM), also known as AO (You et al. 2010; Lin et al. 2013). The NAM has been revealed to have played a 88
prominent role in the changes of NWS in eastern China over the past several decades (Wu et al. 2018a); 89
nevertheless, the processes whereby the NAM affects NWS were not revealed systematically. Therefore, the 90
novelty of this manuscript over previously published work lies in two key points: 1) the processes of NAM 91
influencing the NWS changes are revealed and 2) the relative contributions of NAM to variations in NWS 92
are estimated. 93
2 Datasets and Methods 94
2.1 Datasets 95
We selected eastern China (15°–55°N, 105°–135°E) as the study region, due to its dense meteorological 96
stations and mostly flat topography. We used the observed NWS (in m s-1) at 10 m to investigate the 97
spatiotemporal characteristics and changes. The wind speed dataset was obtained from China Meteorological 98
Administration (CMA) (http://www.nmic.cn/site/index.html; last accessed 14 November 2020). The site 99
selection of the observation stations, the anemometer installation, and the observation process were all done 100
according to the standards of the World Meteorological Organization’s guide to the Global Observing 101
System and the CMA’s technical regulations on weather observation (CMA 2003; Feng et al. 2004; Guo et al. 102
2011). Based on the introduction of CMA, the correct data, questionable data, and incorrect data was labeled 103
with the quality control code ‘0’, ‘1’, and ‘2’, respectively. Spatial pattern of total stations in Eastern China 104

6
are shown in Fig. 1. The quality control and homogenization of observed NWS is explained in section 2.2. 105
To investigate the changes in LOAC pattern, the variables including the daily mean zonal wind (in m s-1), 106
meridional wind (in m s-1), air temperature (in K), sea-level pressure (in Pa), and surface pressure (in Pa) in 107
the ERA5 reanalysis data at a spatial resolution of 0.75°×0.75° over the Northern Hemisphere from 108
1979-2017 were used, which were produced by European Centre for Medium-Range Weather Forecasts 109
(ECMWF; Hersbach and Dee (2016)). ERA5 data released covers the period from 1979 and continues to be 110
extended forward in near real time, which was produced using 4D-Var data assimilation in CY41R2 of 111
ECMWF’s Integrated Forecast System (IFS) and was operational at ECMWF in 2016. Relative to the 112
ERA-Interim dataset (Simmons et al. 2007, 2010, 2014), the ERA5 reanalysis dataset benefits from a decade 113
of developments in model physics, core dynamics and data assimilation. In addition to a significantly 114
enhanced horizontal resolution, ERA5 has a number of innovative features. These include hourly output 115
throughout and an uncertainty estimate (Copernicus Climate Change Service (C3S) 2017). Compared with 116
the other global reanalysis datasets, the ERA5 reanalysis dataset shows better performance in describing the 117
regional mean climate at a seasonal scale and representing the spatiotemporal variations of the wind speed 118
(Ramon et al. 2019). The ERA5 dataset includes 137 hybrid sigma/pressure (model) levels in the vertical, 119
with the top level at 0.01 hPa. The daily mean surface pressure, sea-level pressure, 10 meter U and V 120
wind component (in m s-1) were used; meanwhile, the U and V wind components and air temperature at 121
27 vertical levels from 1000 to 100 hPa were also used. 122
To explore the process whereby the NAM affects the NWS changes over eastern China, the NAM index 123
derived from Li and Wang (2003) is employed (http://ljp.gcess.cn/dct/page/65540; last accessed 14 124
November 2020), which is one measure of the hemispheric-wide fluctuations in surface air pressure 125
occurring at the mid-to-high-latitude annular belt of actions. Compared to other zonal indices, the NAM 126
index better reflects the zonal hemispheric fluctuation in air mass, and therefore it has been extensively used 127

7
to investigate the variations of the atmospheric circulation (Baldwin and Thompson 2009; You et al. 2013; 128
Rotstaln et al. 2014; Liu et al. 2016; He et al. 2018). 129
2.2 Methods 130
To improve the quality of NWS data, the stations used in this study were selected based on the following 131
criteria: 1) the station must be the national meteorological station; 2) there is no missing data in a whole year 132
after 1979; meanwhile, there is no missing data in a whole season and month in a year; 3) the total days of 133
missing data accounted for less than 1% of the length of the total data series; 4) the wind speed must be 134
accompanied by the quality control code ‘0’ in the datasets. Finally, 587 stations during the period from 135
1979-2017 were selected for analysis (Fig. 1, green dots). The standard normal homogeneity test (SNHT) 136
method was further used to test the homogenization of selected stations, which has been extensively used in 137
the former studies (Alexandersson 1986; Liu 2000; He et al. 2012; Azorin-Molina et al. 2014; Zhang et al. 138
2020). Firstly, the reference function is defined, named as Eq. (1). 139
n
j
jjij
n
j
ji
i
XYX
Y
Q
1
2
1
2
)/(
(1) 140
where iY denotes the mean wind speed of tested station in the i year. Y denotes the mean value of tested 141
station. jiX denotes the mean wind speed of j reference station in the i year. jX denotes the mean value of 142
j reference station from 1979-2017. j denotes the correlation coefficient between the tested station and 143
reference station j. The reference station is selected according to the followed criterion: if the stations are 144
enclosed within a circle with radius of 1° latitude and longitude centered at middle of tested station, the 145
stations are selected as the reference stations (Li et al. 2003). Based on Eq. (1), computing a new 146
standardized series iZ ( i
i
Q
Q QZ
S
). Q and QS
denote the mean value and standard deviation of iQ , 147

8
respectively. If iZ has a breakpoint, which is occurred in K point ( iK 1 ), establishing the testing 148
statistic KT : 149
2
2
2
1 )( KiKTK (2) 150
where 1 and 2 denote the mean value of serial in prior and after breakpoint K ( 21 ). If maximum 151
value of KT is less than threshold (7.94, p<0.10), the data passed the significance test at the 0.10 level (Liu 152
2000). Based on the SNHT method, the observed NWSs used in study are homogeneous. 153
To assess the consistency of the phases between two data series, the probability of an anomaly appearing 154
at the same time point in the two data series are calculated (named as PAST) (Wu et al. 2018a; Zha et al. 155
2019a, b) (Eq. (3)). 156
%100
)(1
m
NP
PAST
m
i
ii
(3) 157
where iP and iN denote the positive and negative anomalies of two data series at the same years, 158
respectively. m denotes the whole study period ( 39m ). 159
To analyze whether the decrease in NWS is caused by the weakening of zonal or meridional circulations, 160
the observed NWS is decomposed into zonal and meridional components based on the wind direction of the 161
ERA5 reanalysis dataset, this being because the wind direction of the observed daily mean NWS is not 162
available. Cressman objective analysis method is employed to interpolate the stations’ observational data to 163
grid at a resolution of 0.75° (Cressman 1959). A Gaussian low-pass filter with a 9-yr window is used to 164
extract the decadal signals in the data (Li et al. 2010, 2011; Zhu et al. 2012), then the inter-annual sequence 165
of the data is obtained based on the raw sequence minus the decadal sequence (Wu et al. 2018a). The 166
least-squares method (LSM) is used to calculate the linear trend coefficient (in m s-1 decade-1). To compare 167
the trend calculated based on LSM, a non-parametric Thiel-Sen approach (TSA) is used (Thiel 1950; Sen 168

9
1968). Correlation analysis and two-tailed Student’s t-test are used to determine the significance of the data. 169
Composite analysis is used to discuss the circulation differs between positive and negative NAM phases. 170
The positive and negative values of NAMI were defined as the positive NAM phase (NAM+) and negative 171
NAM phase (NAM−), respectively. 172
3 Results 173
3.1 Spatiotemporal characteristics of NWS 174
Spatiotemporal characteristics of NWS over eastern China have been presented in our former study (Wu 175
et al. 2018a); therefore, herein we exhibited only the main NWS characteristics for completeness. The NWS 176
decreased significantly at a rate of −0.09±0.01 m s-1 decade-1 (p<0.01) for 1979-2017, which mainly 177
showed positive anomalies before 2000 and negative anomalies after (Fig. 2a). Compared with the previous 178
studies in the other regions (Yang et al. 2012; Li et al. 2018, Zeng et al. 2019; Zhang and Wang 2020), a 179
recovery of NWS after 2010 was also observed in eastern China, at a rate of +0.21±0.099 m s-1 decade-1 180
(p<0.10). The results exhibit that the zonal component of the observed NWS (denoted by u) had a 181
decreasing trend, at a rate of −0.04±0.01 m s-1 decade-1 (p<0.01), which accounted for 44.4% of the 182
decreasing trend of the NWS (Fig. 2b). The meridional component of the observed NWS (denoted by v) also 183
exhibited a decreasing trend, at a rate of -0.005±0.014 m s-1 decade-1 (p>0.10). The decreasing trend of v 184
accounted for only 5.6% of the decreasing trend of NWS (Fig. 2c). The trends were calculated based on 185
LSM were consistent with that were computed based on TSA. Additionally, the correlation coefficients 186
between the total wind speed and u and v were 0.60 (p<0.01) and 0.15 (p>0.10), respectively, the PAST 187
between the NWS and u and v were 69.2% and 58.9%, respectively, and the values of the residual sum of 188
squares of the linear fitting between the NWS and u and v were 0.13 and 0.39 m2 s-2, respectively. 189
Consequently, the significant reduction in NWS was mainly caused by the reduction in u. 190
10
Spatial patterns of NWS and the corresponding trends are shown in Fig. 3. The regional mean values of 191
NWS was 2.29 m s-1. The highest values exceeding 2.4 m s-1 were located in northeastern China, Inner 192
Mongolia, Shandong peninsula, and coastal regions (Fig. 3a). The NWS has generally decreased for 193
1979-2017, with the trend coefficients exceeding the significance t-test at the 0.10 level in most regions. The 194
strongest reduction in NWS was located in northeastern China and some regions of the middle and lower 195
reaches of the Yellow River and Yangtze River, this being −0.20 m s-1 decade-1 (p<0.01), and the weakest 196
decrease in NWS was located in central China, being less than −0.05 m s-1 decade-1 (p<0.10) (Fig. 3b). 197
Previous studies have shown a significant slowdown in NWS over eastern China (Fu et al. 2011; Guo et al. 198
2011; Lin et al. 2013). The u experienced a decreasing trend for 1979-2017, with most downward trends 199
passed significance t-test at the 0.10 level. The most significant reduction in u was found in northern China, 200
with a trend coefficient exceeding -0.10 m s-1 decade-1 (p<0.01) (Fig. 3c). The decreasing trend of v was not 201
significant in southeastern China and North China plain, especially for southern China, the v exhibited an 202
increasing trend in some regions. Among all stations, 91.9% and 60.6% showed that u and v had a 203
decreasing trend, respectively. These results mean that the decreasing trend of u was more significant than 204
that of v during the study period 1979-2017, and that the observed decrease in NWS was mainly induced by 205
the reduction of u. 206
3.2 Effects of NAM on large-scale atmospheric circulations 207
We discovered that changes in the near-surface and troposphere wind speeds over eastern China could be 208
influenced by the NAM (Wu et al. 2018a); the NAMI exhibited a weak increasing trend during the study 209
period. The NAM kept the strong positive phases, which were the strongest periods over the past 100 years 210
(Li and Wang 2003; Li 2005). The NAM+ and NAM− accounted for 74.4% and 25.6% of all the years in the 211
study period for 1979-2017, respectively (Fig. 4). 212
Before revealing the processes whereby the NAM influences the NWS changes over eastern China, we 213

11
first analyzed how NAM modulates the large-scale wind fields over the Northern Hemisphere. During a 214
NAM+, a negative wind speed anomaly occurred over and around 30°N in the Northern Hemisphere, and a 215
positive wind speed anomaly occurred over and around 60°N (Fig. 5a). The spatial pattern of the composite 216
difference in the zonal-mean westerly between NAM+ and NAM− (Fig. 5b) is consistent with Fig. 5a. The 217
correlation coefficient between the NAMI and wind speed exhibited a zonal pattern. The negative and 218
positive correlation coefficients located at mid-latitudes and high latitudes, respectively, and that the 219
significant correlations above a significance t-test at 0.10 level located around 30°N and 60°N, respectively, 220
implying that accompanied by the variations of NAM, the wind speed decreased at mid-latitudes and 221
increased at high latitudes (Fig. 5c). The spatial pattern of the correlation coefficient between the NAMI and 222
zonal wind was consistent with that between the NAMI and wind speed, which also presented a zonal 223
annular belt (Fig. 5d). These results implied that the continuously positive anomaly of NAM could induce 224
the decrease of NWS at mid-latitudes of Northern Hemisphere (China lies in this region); moreover, the 225
influence of the NAM on the NWS changes can be due to its modulation of zonal-mean westerlies. 226
3.3 Physical processes of NAM and its influence on NWS changes 227
The abovementioned results show that the effects of the NAM on the large-scale zonal flows are 228
pronounced. Here, we investigate the processes behind the NAM that control the observed NWS changes. 229
Vertical characteristics of the composite differences between NAM+ and NAM− are shown in Fig. 6. A 230
negative zonal-mean zonal wind speed difference (denoted by ZWSD) between NAM+ and NAM− was 231
found at 10°–40°N, and a positive zonal-mean ZWSD was found from 40°N to polar. The strongest negative 232
ZWSD were found around 30°N and positive ZWSD were found around 55°N (contour). Accordingly, 233
accompanied by the variations of NAM, the zonal westerly decreased over mid-latitudes and increased over 234
high-latitudes. A negative zonal-mean meridional wind speed difference (denoted by MWSD) between 235
NAM+ and NAM− was found at 5°–35°N in the lower troposphere, and a positive zonal-mean MWSD was 236

12
found at 40°–65°N in the lower troposphere (shaded). These results indicate that the northerly anomalies at 237
5°–35°N and the southerly anomalies at 40°–65°N in the lower troposphere accompanied by continuous 238
NAM warm phases during the period from 1979-2017. The anomalous ascending flows occurred at 239
60°–72°N and the anomalous descending flows occurred over mid-latitudes at 30°–50°N (vector). 240
Consequently, the Ferrell cell at high latitudes enhanced along with the continuous NAM warm phases. 241
Hence, the NAM had considerable effects on the vertical circulation field. Actually, these characteristics can 242
also be produced at four seasons (Fig. S1). 243
The NAM caused the anomalies of meridional winds in the lower troposphere over the mid- and high- 244
latitudes in Northern Hemisphere; meanwhile, the descending flows of Ferrell cell further increased the 245
southerly in the low troposphere. The increased southerly in the lower troposphere transport heat from lower 246
latitudes to higher latitudes near the surface; thus, the surface air temperature (SAT) at mid-to-high latitudes 247
could rise. Consequently, the SAT difference between NAM+ and NAM− at the near-surface layer are 248
investigated (Fig. 7a). The SAT was higher at mid-to-high latitudes between 30°N and 70°N during a NAM+ 249
than it was during a NAM−; meanwhile, a significant SAT difference occurred at mid-to-high latitudes of 250
East Asia, which exceeded +0.8°C (p<0.10). The SAT at subtropical and low latitudes was lower during a 251
NAM+ than it was during a NAM−, although the SAT difference failed to exceed the significance t-test at 252
the 0.10 level. These results indicate that the SAT increased at mid-to-high latitudes accompanied by the 253
continuous NAM warm phases from 1979-2017, especially for East Asia. The north–south SAT difference 254
between mid-to-high latitudes and low-latitudes over East Asia could decrease due to the significant positive 255
SAT anomaly that occurred at mid-to-high latitudes in East Asia. Therefore, we investigated further the 256
north–south SAT difference between mid-to-high latitudes (35°–60°N, 60°–140°E) and low latitudes 257
(0°–20°N, 60°–140°E) over East Asia (denoted as SATD) (Fig. 7b). The temporal changes in SATD 258
exhibited a downward trend, at a rate of −0.21±0.066 °C decade-1 (p<0.01); meanwhile, the NAM and SATD 259

13
exhibited a negative correlation of −0.60 (p<0.01) (Fig. 7c). These results mean that NAM strengthening 260
considerably reduced the SATD between mid-to-high latitudes and low latitudes of East Asia. 261
Looking into Fig. 7a, all parts of the east of 100°E showed a positive SAT difference, so the west-east 262
SAT gradient could be influenced by variations of NAM. Consequently, the west-east gradient of SAT that 263
over two regions 15°–50°N, 65°–105°E and 15°–50°N, 105°–138°E are analyzed. These two regions cover 264
the entire China. The results show that the west-east SAT difference showed decreasing trend from 265
1979-1998, at a rate of -0.27±0.079 ℃ decade-1 (p<0.01), and showed increasing trend from 1999-2017, at a 266
rate of +0.15±0.079 ℃ decade-1 (p<0.10) (Fig. S2). Compare to Fig. 7b, the temporal changes of west-east 267
SAT difference were not consistent with that of north-south SAT difference. The correlation coefficients 268
between west-east SAT difference and NWS, between west-east SAT difference and NAMI were +0.21 269
(p>0.10), and -0.50 (p<0.01), respectively. Compared to Fig. 2a, the temporal changes of west-east SAT 270
difference were also not consistent with that of observed NWS. Consequently, the changes of west-east SAT 271
difference could not be the primary factor that caused the NWS changes over eastern China. 272
According to the state equation, RTP ( P is the pressure, is air density, R is air constant, and T is 273
the air temperature), changes in air temperature can influence changes in surface pressure; therefore, 274
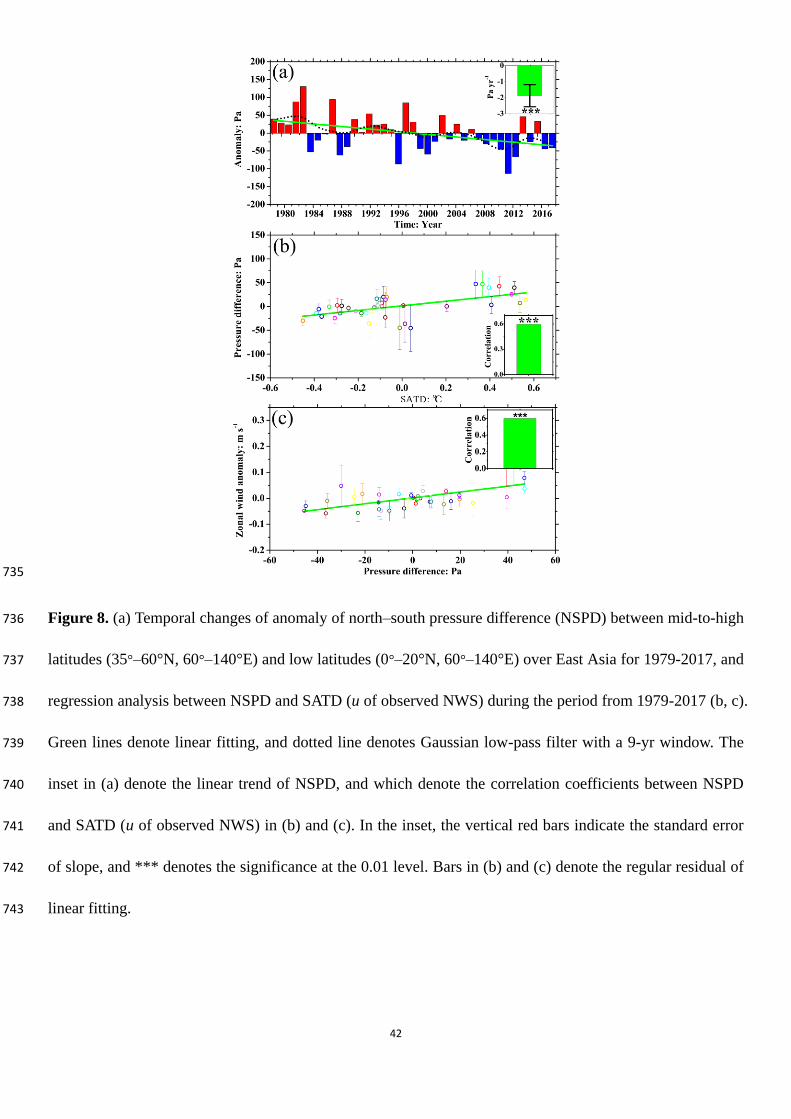
changes in north-south SATD could cause the changes in the north–south pressure difference. Hence, the 275
pressure difference between mid-to-high latitudes (35°–60°N, 60°–140°E) and low latitudes (0°–20°N, 276
60°–140°E) is calculated (Fig. 8a). A downward trend in the surface pressure difference was observed, at a 277
rate of −1.87±0.69 Pa yr-1 (p<0.01). Furthermore, the pressure difference and SATD exhibited a significant 278
correlation, with a correlation coefficient of +0.60 (p<0.01) (Fig. 8b). Because the meridional pressure 279
gradient changes can affect the zonal wind changes, the relationship between the meridional pressure 280
gradient and u of the observed NWS is also investigated. These exhibited a significant positive correlation, 281
with a correlation coefficient of +0.60 (p<0.01) (Fig. 8c). To summarize, variations in NAM reduced the 282

14
SATD, which in turn weakened the meridional pressure gradient over East Asia and, thus, resulted in the 283
decreased NWS in eastern China. 284
4 Discussion 285
4.1 Effects of NAM on the interannual variability of NWS 286
In a previous study, the correlation coefficient between the NAM and the observed NWS is more 287
significant at interannual scale than that at decadal scale (Wu et al. 2018a). Therefore, we investigate here 288
whether the physical processes of NAM on the NWS could be better presented at interannual scale and 289
estimate the potential contribution of the NAM to interannual fluctuations of NWS. To estimate whether the 290
interannual variability of NWS are influenced by the freedom of Gaussian low-pass filter, the interannual 291
sequence of NWS is also extracted based on the raw sequence minus the linear fitting (Gong et al. 2014). 292
The results showed that the year-by-year variability is similar based on two methods, with a correlation 293
coefficient reaching 0.73 (p<0.001). The probability of the extremums appearing at the same time point in 294
the two data serials reaching 100.0% (Fig. S3). Consequently, the extracted interannual signals based on the 295
method used in this study are credible. 296
Before considering how the NWS and LOACs are related, the effects of NAM on the interannual 297
variations of the circulation fields are analyzed first. The NAM index is defined based on the sea level 298
pressure (SLP); therefore, the relationships between the NAM and the SLP at different timescales are 299
investigated. The results show that significant positive correlation between NAMI and SLP was found at the 300
belt of 30°N, and negative correlation was found at the belt of 60°N, with correlation coefficients exceeding 301
±0.4 (p<0.05) (Fig. 9a and 9b). Collectively, these spatial patterns of correlation coefficients present the 302
typical NAM pattern. The mean values of the negative and positive correlations over the significant region 303
(the blue and red rectangles in Fig. 9a and 9b) were also pronounced at interannual scale (Tab. 1), although 304

15
the percentage differences for the grid with the significant negative and positive correlations were not 305
significant. Compared to Fig. 5d, the annular belt pattern of the correlation coefficient between the NAMI 306
and zonal wind was reproduced well at interannual scale, and significant negative and positive correlations 307
exceeding a confidence level of 0.10 were also located around 30°N and 60°N, respectively (Fig. 9c). The 308
correlations between the NWS over eastern China and the SLP field over Northern Hemisphere were also 309
analyzed (Fig. 9d). Compared to Fig. 9a, Fig. 9d shows the reverse spatial pattern of the correlation 310
coefficient between the NWS over eastern China and the SLP, especially for the center of the significant 311
correlation exceeded the 0.10 level. However, a similar spatial pattern was not presented when the decadal 312
signals in the NWS were not excluded (Fig. 9e). The quantitative results show that the mean values of the 313
negative and positive correlations over the significant region as shown by the blue and red rectangles in 314
Fig. 9d were +0.30 (p<0.10) and -0.27 (p<0.10), respectively. The percentages of the grid with significant 315
positive and negative correlations over the significant region were 80.2% and 78.6% at interannual scale, 316
respectively, but these reached only 11.40% and 3.13% when the decadal signals of the NWS were not 317
excluded, respectively (Tab. 1). The zonal pattern of the correlation coefficient between the NWS in eastern 318
China and the zonal wind was more evident at interannual scale (Fig. 9f). Accordingly, the annular belt 319
pattern of the correlation coefficient between the NWS and the zonal wind was more significant at 320
interannual scale, especially for the annular belts around 30°N and 60°N. 321
The vertical characteristics of the circulation pattern associated with the NAM at interannual scale are 322
also compared (Fig. 10). The NAM and zonal-mean meridional wind exhibited negative and positive 323
correlations at 10°–40°N and 45°–70°N in the lower troposphere, respectively (Fig. 10a). Significant 324
ascending flow was found around 65°N and descending flow was found around 40°N in the troposphere 325
(Fig. 10b). Quantitatively, the percentages of grids with negative (positive) correlation coefficient based on 326
raw and interannual sequences over the region with descending (ascending) flows at 30°–50°N (60°–72°N) 327

16
were 92.0% (84.7%) and 93.6% (82.4%), respectively (Tab. 2). Compared to Fig.6, the Ferrell cell at high 328
latitudes was well reproduced in Fig. 10a; consequently, the effects of NAM on vertical circulations can be 329
reproduced well at interannual scale. If the effects of the NAM on the interannual variations of NWS in 330
eastern China are more significant, the NWS should respond well to the changes in vertical circulation 331
caused by the variations in NAM. Therefore, the relationships between NWS in eastern China and vertical 332
circulations are compared at different timescales. Compared to Fig. 10a, the correlation coefficient between 333
NWS and zonal-mean meridional wind exhibited a similar vertical structure (Fig. 10c). Negative correlation 334
at 10°–40°N in the lower troposphere corresponded to reduced NWS over eastern China accompanied by 335
weakening meridional wind, namely an enhanced northerly. Positive correlation at 45°–70°N in the lower 336
troposphere corresponded to reduced NWS over eastern China accompanied by strengthening meridional 337
wind, namely an enhanced southerly. The similar vertical characteristics of correlation coefficient between 338
NWS and zonal-mean meridional wind as shown in Fig. 10e were consistent with those shown in Fig. 10c, 339
but the more significant correlations were found at the interannual scale (Fig. 10c). At interannual scale, the 340
significant positive correlation exceeded the 0.10 level between NWS and descending flow mainly located 341
around the latitude belt of 40°N and negative correlation between the NWS and ascending flow mainly 342
located around the latitude belts of 65°N, in particular for the region of the Ferrell cell (Fig. 10d). These 343
results cannot be well presented when the decadal signals of the NWS were not excluded (Fig. 10f). 344
The quantitative results show that the mean correlation coefficients computed based on raw and 345
interannual sequences over the region with descending (ascending) flows at 30°–50°N (60°–72°N) were 346
−0.13 (+0.11) and −0.27 (+0.17), respectively; therefore, all the correlation coefficients calculated based on 347
raw sequences failed to exceed the significance t-test at 0.10 level (Tab. 2). Over the regions as shown using 348
the blue and red rectangles in Fig. 10d, the percentage of grids exhibiting a significant negative and positive 349
correlation between NWS and vertical velocity based on the interannual sequences accounted for 21.3% and 350

17
38.2% of all grids, respectively. However, based on the raw sequence, over the regions as shown using the 351
blue and red rectangles in Fig. 10f, the percentage of grids exhibiting a significant negative and positive 352
correlation between NWS and vertical velocity just accounted for 5.0% and 6.1% of all grids, respectively. 353
(Tab. 2). The results are compared in detail in Tab. 2. Consequently, the more significant descending and 354
ascending flows were found at interannual scale, which means that the effects of changes in vertical cell 355
caused by the variations in NAM on NWS were stronger at interannual scale. To quantify the effects of 356
NAM on the NWS changes, we normalized both the NAMI and NWS, and performed regression analyses at 357
different timescales. We considered that the regression coefficients between NAMI and NWS as the relative 358
contribution of the NAM to the NWS changes. At interannual scale, 32.0±15.8 % of the changes in the 359
observed annual mean NWS over eastern China could be attributed to the NAM changes; however, the 360
NAM contribution on interannual variations of u of the observed NWS over eastern China could be more 361
significant, which reached 45.0±12.9 %. Nevertheless, the NAM contribution to the annual mean NWS and 362
u over eastern China based on raw sequence only reached 23.5±15.2 % and 35.6%±13.1 %, respectively. All 363
these results at interannual scale passed the significance t-test at 0.05 level. Therefore, the NAM 364
contribution to the u of the observed NWS over eastern China is stronger than that to the observed total wind 365
speed at the same timescale. 366
4.2 Other potential drivers of NWS changes 367
Terrestrial stilling changes include the effects of large and regional scale factors. In this study, we mainly 368
focused on the role of NAM. Actually, except for the NAM, some studies also reported that NWS reduction 369
might be attributed to other LOACs. Chen et al. (2013) hypothesized that the warm and cold ENSO phases 370
have significant influence on probability distribution of wind speeds, thus internal climate variability could 371
be a major source of both interannual and long-term variability; however, the processes of ENSO 372
influencing the NWS were not analyzed in detail. Fu et al. (2011) showed that a negative Pacific Decadal 373

18
Oscillation (PDO) phase did not show a decreasing trend of NWS, and a positive PDO phase was associated 374
with a statistically significant decreasing trend of NWS. Nevertheless, the PDO mainly influenced the 375
decadal variability of NWS (Wu et al. 2018a). Xu et al. (2006) proposed that the slowdown of NWS could 376
be attributed to East Asian monsoons circulations. The winter decline might be attributed to increase 377
greenhouse gas emission, and the summer decline over south-central China may result from air pollution. 378
However, Wu et al. (2016) found no significant wind speed difference between strong and weak monsoon 379
years. Therefore, there is large uncertainty regarding how the East Asian monsoons influence the NWS. It is 380
worth noting that the potential effects of LOACs on the NWS constitute a complex process. The interaction 381
and modulation of different LOACs are evident; therefore, it is difficult to isolating and estimating the 382
contributions of different LOACs to variability in NWS. These issues might be examined and identified 383
using numerical simulations with a global climate model coupled to a regional climate model in near future. 384
Except for the variations of LOACs can induce the variability in NWS, some studies have observed that 385
NWS reduction could also be attributed to other factors. For instance, land use and cover change (LUCC) 386
can cause the changes in surface roughness, and which is likely the principal contributor to the reduction of 387
NWS over China over the last several decades. It is note that the uncertainty of estimation results of LUCC 388
impact on variations in NWS is considerable based on different methods (Tab. 3). The most distinctive 389
manifestation of anthropogenic LUCC is urbanization (Zha et al. 2016; Wang et al. 2020). Effects of 390
urbanization on NWS were revealed by both observation and numerical simulation (Tab. 3). Global warming 391
also can induce significant changes in the large-scale meridional circulation and thus lead to changes in 392
NWS over China (Jiang et al. 2009, 2010b). The greenhouse gases could alter the thermodynamic and 393
dynamic processes of the atmosphere, and these changes can induce the variability in NWS (Zhang et al. 394
2016a). However, isolating the effects of greenhouse gases on the changes of NWS is difficult using the 395
observation datasets. This aspect could be estimated based on the Coupled Model Intercomparison Project 396
19
(CMIP) (e.g., CMIP5/6) in the future work. Additionally, some former studies hypothesized that an increase 397
in air stability due to aerosol interactions with radiation reduces vertical mixing which in turn, reduces the 398
vertical flux of horizontal momentum. Because winds are generally higher aloft than at the surface, reduced 399
vertical mixing decreased the transfer of fast winds aloft to the surface, and thereby slowing NWS (Jacobson 400
and Kaufman 2006; Zhao et al. 2006; Li et al. 2016). The anthropogenic heat release reduces the boundary 401
layer stability and enhances the vertical mixing, and thereby the anthropogenic heat release could lead to 402
increase of the NWS (Zhang et al. 2016b). However, the real mechanisms of the aerosol emissions and 403
anthropogenic heat release affecting NWS were not systematically revealed in current work. These issues 404
might be examined and identified using numerical simulations with a global climate model coupled to a 405
regional climate model in near future. 406
5 Conclusions 407
In this study, the potential process whereby the NAM affects the NWS over eastern China are revealed; 408
meanwhile, the quantitative contribution of the NAM to interannual variations of NWS are estimated. The 409
main conclusions are summarized as follows. 410
The NWS in eastern China mainly exhibited a decrease, with a linear trend of −0.09±0.01 m s-1 decade-1. 411
The strongest reduction was found in northeastern China and some regions of the middle and lower Yellow 412
River and Yangtze River, reached −0.2 m s-1 decade-1. The weakest slowdown was in central China, it being 413
less than −0.05 m s-1 decade-1. The zonal component of the observed NWS also exhibited a significant 414
reduction, with a linear trend of −0.04±0.01 m s-1 decade-1; however, no significant reduction was found in 415
the meridional component of the observed NWS. Hence, the decrease in the observed NWS could be mainly 416
caused by the weakening in the zonal component of the wind speed. 417
The NAM had a pronounced effect on the changes of the NWS over eastern China. During NAM+, the 418

20
zonal-mean westerly decreased over mid-latitudes, while the vertical movement was prevailingly descending 419
flow at mid-latitudes (30°–50°N) and ascending flow at 60°–72°N in the troposphere. Consequently, the 420
Ferrell cell enhanced accompanied by the continuous warm phases of NAM from 1979-2017. The 421
strengthening of the Ferrell cell induced northerly anomalies at mid-latitudes and southerly anomalies at 422
mid-to-high latitudes in the lower troposphere. The anomalous meridional flows transported heat from lower 423
latitudes to higher latitudes, thereby reducing the meridional SATD, which in turn decreased the driving 424
force of NWS changes over eastern China and caused a reduction of NWS. 425
32.0±15.8 % of the changes in the observed annual mean NWS over eastern China could be attributed to 426
the variations in NAM at interannual scale; however, the NAM contribution on interannual variations in u of 427
the observed NWS was more significant, reaching 45.0±12.9 %. Nevertheless, the NAM contribution to the 428
annual mean NWS and u based on raw sequences over eastern China reached only 23.5±15.2 % and 429
35.6%±13.1 %, respectively. 430
In this study, we investigated the processes whereby the NAM affects the variations of NWS and obtained 431
several interesting results. The mechanisms whereby LOACs influence NWS variations constitute a 432
challenging scientific issue; hence, the results shown here could help to promote future work on this topic. 433
Some limitations and drawbacks also must be mentioned. The NWS presented seasonal characteristics, so 434
the variations in NAM could not explain all changes in NWS during different seasons. How the LOACs 435
influence seasonal NWS changes is a next logical step in our future work. Actually, the effects of LOACs on 436
the NWS constitute a complex process, and the interaction and modulation of different LOACs must be 437
examined by using numerical simulations with a global climate model coupled to a regional climate one. 438
Acknowledgments 439
The work is supported by National Key Research and Development Program of China (2018YFA0606004, 440

21
2016YFA0600403), Natural Science Foundation of China (42005023, 41675149, 41775087, 41875178), and 441
Project funded by China Postdoctoral Science Foundation (2019M660761). This work is also supported by 442
the Program for Special Research Assistant Project of Chinese Academy of Sciences, the Program for Key 443
Laboratory in University of Yunnan Province, and the Chinese Jiangsu Collaborative Innovation Center for 444
Climate Change. C.A.M. was supported by Ramon y Cajal fellowship (RYC-2017-22830) and the grants no. 445
VR-2017-03780 and RTI2018-095749-A-I00 (MCIU/AEI/FEDER, UE). 446
References 447
Alexandersson H (1986) A homogeneity test applied precipitation data. Int J Climatol 6:661-675. 448
https://doi.org/10.1002/joc.3370060607 449
Azorin-Molina C, Vicente-Serrano SM, McVicar TR, Jerez S, Sanchez-Lornzo A, Lopez-Moreno JI, 450
Revuelto J, Trigo RM, Lopez-Bustins JA, Espirito-Santo F (2014) Homogenization and assessment of 451
observed near-surface wind speed trends over Spain and Portugal, 1961-2011. J Climate 27:3692-3712. 452
https://doi.org/10.1175/JCLI-D-13-00652.1 453
Azorin-Molina C, Guijarro JA, McVicar TR, Vicente-Serrano SM, Chen DL, Jerez S, Espirito-Santo F (2016) 454
Trends of daily peak wind gusts in Spain and Portugal, 1961-2014. J Geophys Res-Atmos 121:1059-1078. 455
https://doi.org/10.1002/2015JD024485 456
Azorin-Molina C, Dunn RJH, Mears CA, Berrisford P, McVicar TR (2017) Surface winds [in “State of the 457
Climate in 2016”]. Bull Amer Meteor Soc 98:S37-S39 458
Baldwin MP, Thompson DWJ (2009) A critical comparison of stratosphere-troposphere coupling indices. Q 459
J R Meteorol Soc 135:1661-1672. https://doi.org/10.1002/qj.479 460
Berrisford P, Tobin I, Dunn RJH, Vautard R, McVicar TR (2015) Global climate; Atmospheric circulation; 461
Surface winds) Land surface wind speed (in “State of the Climate in 2014”). Bull Am Meteorol Soc 462
22
95:S33-S34 463
Bichet A, Wild W, Folini D, Schar S (2012) Causes foe decadal variations of speed over land: sensitivity 464
studies with a global climate model. Geophys Res Lett 39:L11701. 465
https://doi.org/10.1029/2012GL051685 466
Chen L, Li D, Pryor SC (2013) Wind speed trends over China: quantifying the magnitude and assessing 467
causality. Int J Climatol 33:2579-2590. https://doi.org/10.1002/joc.3613 468
China Meteorological Administration (2003) Ground surface meteorological observation. Beijing: China 469
Meteorological Press, 157 pp 470
Copernicus Climate Change Service (C3S) (2017) ERA5: Fifth Generation of ECMWF Atmospheric 471
Reanalyses of the Global Climate. Copernicus Climate Change Service Climate Data Store (CDS). 472
ECMWF. Available at: https://cds.climate.copernicus.eu/cdsapp#!/home [Accessed 1st August 2019] 473
Cressman GP (1959) An operational objective analysis system. Mon Weather Rev 87:367-374. 474
https://doi.org/10.1175/1520-0493(1959)087<0367:AOOAS>2.0.CO;2 475
Dadaser-Celik F, Cengiz E (2014) Wind speed trends over Turkey from 1975 to 2006. Int J Climatol 476
34:1913-1927. https://doi.org/10.1002/joc.3810 477
Dunn RJH., Azorin-Molina C, Mears CA, Berrisford P, McVicar TR (2016) Surface winds (in “State of the 478
climate in 2015”). Bull Am Meteorol Soc 97:S38-S40 479
Earl N, Dorling S, Hewston R, von Glasow R (2013) 1980-2010 variability in U.K. surface wind climate. J 480
Climate 26:172-1191. https://doi.org/10.1175/JCLI-D-12-00026.1 481
Feng S, Hu Q, Qian WH (2004) Quality control of daily meteorological data in China, 1951-2000: a new 482
dataset. Int J Climatol 24:853-870. https://doi.org/10.1002/joc.1047 483

23
Fu GB, Yu JJ, Zhang YC, Hu SS, Quyang RL, Liu WB (2011) Temporal variation of wind speed in China 484
for 1961-2007. Theor Appl Climatol 104:313-324. https://doi.org/10.1007/s00704-010-0348-x 485
Gong HN, Wang L, Chen W, Wu RG, Wei K, Cui XF (2014) The climatology and interannual variability of 486
the East Asian winter monsoon in CMIP5 models. J Climate, 27:1659-1678. 487
https://doi.org/10.1175/JCLI-D-13-00039.1 488
Guo H, Xu M, Hu Q (2011) Changes in near-surface wind speed in China: 1969-2005. Int J Climatol 489
31:349-358. https://doi.org/10.1002/joc.2091 490
Guo XY, Wang L, Tian LD, Li XP (2017) Elevation-dependent reductions in wind speed over and around the 491
Tibetan Plateau. Int J Climatol 37(2):1117-1126. https://doi.org/10.1002/joc.4727 492
He DY, Tian H, Deng WT (2012) Comparative analysis of the effects of different methods in homogeneity 493
test on annual wind speed. Transactions of Atmospheric Sciences 35:342-349 (in Chinese) 494
He YL, Huang JP, Li DD, Xie YK, Zhang GL, Qi YL, Wang SS, Totz S (2018) Comparison of the effects of 495
land-sea thermal contrast on interdecadal variations in winter and summer blockings. Clim Dyn 496
51:1275-1294. https://doi.org/10.1007/s00382-017-3954-9 497
Hersbach H, Dee D (2016) ERA5 reanalysis is in production, ECMWF Newsletter No.147, 7 498
Jacobson MZ, Kaufman YJ (2006) Wind reduction by aerosol particles. Geophys Res Lett 33:L24814. 499
https://doi.org/10.1029/2006GL027838 500
Jerez S, Trigo RM, Vicente-Serrano SM, Pozo-Vazquez D, Lorente-Plazas R, Lorenzo-Lacruz J, 501
Santos-Alamillos F, Montavez JP (2013) The impact of the North Atlantic Oscillation on the renewable 502
energy resources in southwestern Europe. J Appl Meteorol Clim 52:2204-2225. 503
https://doi.org/10.1175/JAMC-D-12-0257.1 504

24
Jiang Y, Luo Y, Zhao ZC (2009) Evaluation of wind speeds in China as simulated by global climate models. 505
Acta Meteorologica Sinica, 67:923-934 (in Chinese) 506
Jiang Y, Luo Y, Zhao ZC, Tao SW (2010a) Changes in wind speed over China during 1956-2004. Theor 507
Appl Climatol 99:421-430. https://doi.org/10.1007/s00704-009-0152-7 508
Jiang Y, Luo Y, Zhao ZC (2010b) Projection of wind speed changes in China in the 21st century by climate 509
models. Chinese Journal of Atmospheric Sciences 34:323-336 (in Chinese) 510
Kim ZB, Paik K (2015) Recent recovery of surface wind speed after decadal decrease: a focus on South 511
Korea. Clim Dyn 45:1699-1712. https://doi.org/10.1007/s00382-015-2546-9 512
Laapas M, Venalainen A (2018) Homogenization and trend analysis of monthly mean and maximum wind 513
speed time series in Finland, 1959-2015. Int J Climatol 37:4803-4813. https://doi.org/10.1002/joc.5124 514
Li JP, Wang JXL (2003) A modified zonal index and its physical sense. Geophys Res Lett 30:1632. 515
https://doi.org/10.1029/2003GL017441 516
Li QX, Liu XN, Zhang HZ, Tu QP (2003) Homogeneity study of situ observational climate series. 517
Meteorological Science and Technology 31:3-10 (in Chinese) 518
Li JP (2005) Coupled air-sea oscillations and climate variations in China, in: Climate and Environmental in 519
China (First Volume), Edt. D. Qin, Beijing: China Meteorological Press 1:324-333 (in Chinese) 520
Li JP, Wu ZW, Jiang ZH, He JH (2010) Can global warming strengthen the East Asian summer monsoon?. J 521
Climate 23:6696-6705. https://doi.org/10.1175/2010JCLI3434.1 522
Li JP, Feng F, Li Y (2011) A possible cause of decreasing summer rainfall in Northern Australia. Int J 523
Climatol 32:995-1005. https://doi.org/10.1002/joc.2328 524
Li ZQ, Lau W, Ramanathan V, et al (2016) Aerosol and monsoon climate interactions over Asia. Reviews of 525

25
Geophysics 54:866-929. https://doi.org/10.1002/2015RG000500 526
Li Y, Chen Y, Li Z, Fang G (2018) Recent recovery of surface wind speed in northwest China. Int J Climatol 527
38:4445-4458. https://doi.org/10.1002/joc.5679 528
Liu XN (2000) The homogeity test on mean annual wind speed over China. Quarterly Journal of Applied 529
Meteorology 11:28-34 (in Chinese) 530
Liu X, Zhang XJ, Tang Q, Zhang XZ (2014) Effect of surface wind speed decline on modeled hydrological 531
conditions in China. Hydrol Earth Syst Sc 18:2803-2813. https://doi.org/10.5194/hess-18-2803-2014 532
Liu WB, Wang L, Chen DL, Tu K, Ruan CQ, Hu ZY (2016) Large-scale circulation classification and its 533
links to observed precipitation in the eastern and central Tibetan Plateau. Clim Dyn 46:3481-3497. 534
https://doi.org/10.1007/s00382-015-2782-z 535
Lin CG, Yang K, Qin J, Fu R (2013) Observation coherent trends of surface and upper-Air wind speed over 536
China since 1960. J Climate 26: 2891-2903. https://doi.org/10.1175/JCLI-D-12-00093.1 537
Lin CG, Yang K, Huang JP, Tang WJ, Qin J, Niu XL, Chen YY, Chen DL, Lu N, Fu R (2015) Impacts of 538
wind stilling on solar radiation variability in China. Sci Rep-UK 5:15135. 539
https://doi.org/10.1038/srep15135 540
Malloy JW, Krahenbuhl DS, Bush CE, Balling RC, Santoro MM, White JR, Elder RC, Pace MB, Cerveny 541
RS (2015) A surface wind extremes (“Wind Lulls” and “Wind Blows”) Climatology for Central North 542
America and Adjoining Oceans (1979-2012). J Appl Meteorol Clim 54:643-657. 543
https://doi.org/10.1175/JAMC-D-14-0009.1 544
McVicar TR, Van Niel TG, Li LT, Hutchinson MF, Mu XM, Liu ZH (2007) Spatial distributing monthly 545
reference evapotranspiration and pan evaporation considering topographic influences. J Hydrol 546

26
338:196-220. https://doi.org/10.1016/j.jhydrol.2007.02.018 547
McVicar TR, Van Niel TG, Li LT, Roderick ML, Rayner DP, Ricciardulli L, Donohue R (2008) Wind speed 548
climatology and trends for Australia, 1975-2006: Capturing the stilling phenomenon and comparison with 549
near-surface reanalysis output. Geophys Res Lett 35:L20403. https://doi.org/10.1029/2008GL035627 550
McVicar TR, Roderick ML, Donohue RJ, Li LT, Van Niel TG, Thomas A, Grieser J, Jhajharia D, Himri Y, 551
Mahowald NM, Mescherskaya AV, Kruger AC, Rehman S, Dinpashoh Y (2012) Global review and 552
synthesis of trends in observed terrestrial near-surface wind speeds: Implications for evaporation. J 553
Hydrol 416:182-205. https://doi.org/10.1016/j.jhydrol.2011.10.024 554
Pryor SC, Barthelmie RJ, Young DT, Takle ES, Arritt AW, Flory D, Gutowski WJ, Nunes A, Roads J (2009) 555
Wind speed trends over the contiguous United States. J Geophys Res-Atmos 114:1159-1171. 556
https://doi.org/10.1029/2008JD011416 557
Pryor SC, Ledolter J (2010) Addendum to “Wind speed trends over the contiguous United States”. J 558
Geophys Res-Atmos 115:1159-1171. https://doi.org/10.1029/2009JD013281 559
Pryor SC, Barthelmie RJ (2011) Assessing climate change impacts on the near-term stability of the wind 560
energy resource over the United States. Proc Natl Acad Sci 108:8167-8171. 561
https://doi.org/10.1073/pnas.1019388108 562
Ramon J, Lledó L, Torralba V, Soret A, Doblas-Reyes FJ (2019) What global reanalysis best represents 563
near-surface winds?. Q J R Meteorol Soc 145:3236-3251. https://doi.org/10.1002/qj.3616 564
Roderick ML, Rotstayn LD, Farquhar GD, Hobbins MT (2007) On the attribution of changing pan 565
evaporation. Geophys Res Lett 34:251-270. https://doi.org/10.1029/2007GL031166 566
Rotstaln LD, Plymin EL, Collier MA, Boucher O, Dufresne JL, Luo JJ, Salzen KV, Jeffrey SJ, Foujols MA, 567

27
Ming Y, Horowitz LW (2014) Declining aerosols in CMIP5 Projections: Effects on atmospheric 568
temperature structure and midlatitude Jets. J Climate 27:6960-6967. 569
https://doi.org/10.1175/JCLI-D-14-00258.1 570
Segovia C, Gomez JD, Gallardo P, Lozano FJ, Asensio C (2017) Soil nutrients losses by wind erosion in a 571
citrus crop at southeast Spain. Eurasian Soil Sci 50:756-763. https://doi.org/10.1134/S1064229317060114 572
Sen PK (1968) Estimates of the regression coefficients based on Kendall’s tau. J Am Stat Assoc 573
63:1379-1389. https://doi.org/10.1080/01621459.1968.10480934 574
Shi P, Zhang G, Kong F, Ye Q (2015) Wind speed change regionalization in China (1961-2012). Adv Clim 575
Chang Res 6:151-158 (in Chinese) 576
Shi P, Zhang G, Kong F, Chen DL, Azorin-Molina C, Guijarro JA (2019) Variability of winter haze over the 577
Beijing-Tianjin-Hebei region tied to wind speed in the lower troposphere and particulate sources. Atmos 578
Res 215:1-11. https://doi.org/10.1016/j.atmosres.2018.08.013 579
Simmons AJ, Uppala S, Dee D, et al (2007) ERA-Interim: New ECMWF reanalysis products from 1989 580
onwards. ECMWF Newsletter 110:25-35 581
Simmons AJ, Willett KM, Jones PD (2010) Low-frequency variations in surface atmospheric humidity, 582
temperature and precipitation: Inferences from reanalysis and monthly gridded observational datasets. J 583
Geophys Res-Atmos 115:D01110. https://doi.org/10.1029/2009JD012442 584
Simmons AJ, Poli P, Dee DP, et al (2014) Estimating low-frequency variability and trends in atmospheric 585
temperature using ERA-Interim. Q J R Meteor Soc 140:329-353. https://doi.org/10.1002/qj.2317 586
Thiel H (1950) A rank-invariant method of linear and polynomial analysis, part 3. Ned Akad Wet Proc 587
53:1397-1412. https://doi.org/10.1007/978-94-011-2546-8_20 588

28
Tian Q, Huang G, Hu K, Niyogi D (2018) Observed and global climate model based on changes in wind 589
power potential over the Northern Hemisphere during 1979-2016. Energy, 590
https://doi.org/10.1016/j.energy.2018.11.027iyo 591
Tobin I, Vautard R, Balog I, Breon FM, Jerez S, Ruti PM, Thais F, Vrac M, Yiou P (2015) Assessing climate 592
change impacts on European wind energy from ensembles high-resolution climate projections. Climatic 593
Change 128:99-112. https://doi.org/10.1007/s10584-014-1291-0 594
Tobin I, Jerez S, Vautard R, Thais FE, Meijgaard V, Prein V, Deque M, Kotlarski S, Maule CF, Nikulin G, 595
Noel T, Teichmann C (2016) Climate change impacts on the power generation potential of a European 596
mid-century wind farms scenario. Environ Res Lett 11:034013 597
Vautard R, Cattiaux JH, Yiou P, Thepaut JN, Ciais P (2010) Northern Hemisphere atmospheric stilling partly 598
attributed to an increase in surface roughness. Nat Geosci 3:756-761. https://doi.org/10.1038/ngeo979 599
Wan H, Wang X L, Swail V R (2010) Homogenization and trend analysis of Canadian near-surface wind 600
speeds. J Climate 23:1209-1225. https://doi.org/10.1175/2009JCLI3200.1 601
Wang J, Feng JM, Yan ZW, Zha JL (2020) Urbanization impact on regional wind stilling: A modeling study 602
in the Beijing-Tianjin-Hebei region of China. J Geophys Res-Atmos 125:e2020JD033132. 603
https://doi.org/10.1029/2020JD033132 604
Wu J, Zha JL, Zhao DM (2016) Estimating the impact of the changes in land use and cover on the surface 605
wind speed over the East China Plain during the period 1980-2011. Clim Dyn 46:847-863. 606
https://doi.org/10.1007/s00382-015-2616-z 607
Wu J, Zha JL, Zhao DM (2017) Evaluating the effects of land use and cover change on the decrease of 608
surface wind speed over China in recent 30 years using a statistical downscaling method. Clim Dyn 609
48:131-149. https://doi.org/10.1007/s00382-016-3065-z 610

29
Wu J, Zha JL, Zhao DM, Yang QD (2018a) Changes of wind speed at different heights over Eastern China 611
during 1980-2011. Int J Climatol 38:4476-4495. https://doi.org/10.1002/joc.5681 612
Wu J, Zha JL, Zhao DM, Yang QD (2018b) Changes in terrestrial near-surface wind speed and their possible 613
causes: an overview. Clim Dyn 51:2039-2078. https://doi.org/10.1007/s00382-017-3997-y 614
Xu M, Chang CP, Fu CB, Qi Y, Robock A, Robinson D, Zhang HM (2006) Steady decline of East Asian 615
monsoon winds, 1969-2000: Evidence from direct ground measurements of wind speed. J Geophys 616
Res-Atmos 111:D24111. https://doi.org/10/1029/2006JD007337 617
Yang XM, Li ZX, Feng Q, He YQ, An WL, Zhang W, Cao WH, Yu TF, Wang YM, Theakstone WH (2012) 618
The decreasing wind speed in southwestern China during 1969-2009, and possible causes. Quatern Int 619
263:71-84. https://doi.org/10.1016/j.quaint.2012.02.020 620
You QL, Kang SC, Flugel WA, Pepin N, Yan YP, Huang J (2010) Decreasing wind speed and weakening 621
latitudinal surface pressure gradients in the Tibetan Plateau. Clim Res 42:57-64. 622
https://doi.org/10.3354/cr00864 623
You QL, Ren GY, Fraedrich K, Kang SC, Ren YY, Wang PL (2013) Winter temperature extremes in China 624
and their possible causes. Int J Climatol 33:1444-1455. https://doi.org/10.1002/joc.3525 625
Zeng ZZ, Ziegler AD, Searchinger T, Yang L, Chen AP, Ju KL, Piao S, Li L, Ciais P, Chen D, Liu J, 626
Azorin-Molina C, Chappell A, Medvigy D, Wood E F (2019) A reversal in global terrestrial stilling and its 627
implications for wind energy production. Nature Climate Change 9:979-985. 628
https://doi.org/10.1038/s41558-019-0622-6 629
Zha JL, Wu J, Zhao DM (2016) Changes of probabilities in different wind grades induced by land use and 630
cover change in Eastern China Plain during 1980-2011. Atmos Sci Lett 17:264-269. 631
https://doi.org/10.1002/asl.653 632

30
Zha JL, Wu J, Zhao DM (2017a) Effects of land use and cover change on the near-surface wind speed over 633
China in the last 30 years. Prog Phys Geog, 41:46-67. https://doi.org/10.1177/0309133316663097 634
Zha JL, Wu J, Zhao DM, Yang QD (2017b) Changes of the probabilities in different ranges of near-surface 635
wind speed in China during the period for 1970-2011. J Wind Eng Ind Aerodyn 169:156-167. 636
https://doi.org/10.1016/j.jweia.2017.07.019 637
Zha JL, Wu J, Zhao DM, Tang JP (2019a) A possible recovery of the near-surface wind speed in Eastern 638
China during winter after 2000 and the potential causes. Theor Appl Climatol 136:119-134. 639
https://doi.org/10.1007/s00704-018-2471-z 640
Zha JL, Zhao DM, Wu J, Zhang PW (2019b) Numerical simulation of the effects of land use and cover 641
change on the near-surface wind speed over Eastern China. Clim Dyn 53:1783-1803. 642
https://doi.org/10.1007/s00382-019-04737-w 643
Zhang L, Li T, Lu MM (2016a) Surface wind energy trends near Taiwan in winter since 1871. Terr Atmos 644
Ocean Sci. https://doi.org/10.3319/TAO.2016.04.29.01(A) 645
Zhang N, Gao ZQ, Wang XM, Chen Y (2010) Modeling the impact of urbanization on the local and regional 646
climate in Yangtze River Delta, China. Theor Appl Climatol 102:331-342. 647
https://doi.org/10.1007/s00704-010-0263-1 648
Zhang N, Wang XM, Chen Y, Dai W, Wang XY (2016b) Numerical simulations on influence of urban land 649
cover expansion and anthropogenic heat release on urban meteorological environment in Pearl River 650
Delta. Theor Appl Climatol 126:469-479. https://doi.org/10.1007/s00704-015-1601-0 651
Zhang G, Azorin-Molina C, Shi P, Lin D, Guijarro JA, Kong F, Chen DL (2019a) Impact of near-surface 652
wind speed variability on wind erosion in the eastern agro-pastoral transitional zone of Northern China, 653
1982-2016. Agric For Meteorol 271:102-115. https://doi.org/10.1016/j.agrformet.2019.02.039 654

31
Zhang ZT, Wang KC, Chen DL, Li JP, Dickinson R (2019b) Increase in surface friction dominates the 655
observed surface wind speed decline during 1973-2014 in the northern Hemisphere lands. J Climate 656
32:7421-7435. https://doi.org/10.1175/JCLI-D-18-0691.1 657
Zhang RH, Zhang SY, Luo JL, Han YY, Zhang JX (2019c) Analysis of near-surface wind speed changes in 658
China during 1958-2015. Theor Appl Climatol 137:2785-2801. 659
https://doi.org/10.1007/s00704-019-02769-0 660
Zhang ZT, Wang KC (2020) Stilling and recovery of the surface wind speed based on observation, reanalysis, 661
and geostrophic wind theory over China from 1960 to 2017. J Climate 33:3989-4008. 662
https://doi.org/10.1175/JCLI-D-19-0281.1 663
Zhang GF, Azorin-Molina C, Chen DL, et al (2020) Variability of daily maximum wind speed across China, 664
1975-2016: An examination of likely causes. J Climate 33:2793-2816. 665
https://doi.org/10.1175/JCLI-D-19-0603.1 666
Zhao C, Tie X, Lin Y (2006) A possible positive feedback of reduction of precipitation and increase in 667
aerosols over eastern central China. Geophy Res Lett 33:L11814. https://doi.org/10.1029/2006GL025959 668
Zhu J, Liao H, Li JP (2012) Increases in aerosol concentrations over eastern China due to the decadal-scale 669
weakening of the East Asian summer monsoon. Geophys Res Lett 39:L09809. 670
https://doi.org/10.1029/2012GL051428 671

32
Table 1. Correlation coefficients between Northern Hemisphere annular mode (NAM) and sea level pressure (SLP), 672
and between near-surface wind speed (NWS) and SLP at different timescales. Top: correlation coefficients computed 673
based on raw sequences of NAM (NWS) and SLP; bottom: same as top but for interannual sequences. *, **, and *** 674
denote correlation coefficient (R) exceeding significance t-test at 0.10, 0.05, and 0.01 levels, respectively. Regions 1 675
and 2 are shown in Fig. 9 by blue and red rectangles, respectively. 676
Mean value of
negative R over
region 1
Percentage of the grids
with the significant
negative R over region 1
Mean value of
positive R over
region 2
Percentage of the grids
with the significant
positive R over region 2
NAM and SLP
-0.56*** 92.55% 0.51*** 93.22%
-0.50*** 88.36% 0.46*** 86.40%
NWS and SLP
0.21 11.40% -0.006 3.13%
0.30** 80.02% -0.27* 78.56%
677

33
Table 2. Correlation coefficients between NAM (NWS) and vertical velocity ( w ) at different timescales, and 678
percentages of grids with negative (positive) correlation coefficients. Top: correlation coefficients computed based on 679
raw sequences of NAM (NWS) and w ; bottom: same as top line but for interannual sequences. *, **, and *** denote 680
correlation coefficient (R) exceeding significance t-test at 0.10, 0.05, and 0.01 levels, respectively. R−: negative 681
correlation coefficient. R+: positive correlation coefficient. Percentage represents the percentage of grids with 682
negative correlation coefficient (R−), positive correlation coefficient (R+), significant R−, or significant R+ over 683
regions 1 and 2, which are the regions with descending and ascending flows at 30°–50°N and 60°–72°N, respectively, 684
as shown in Fig. 10 by the blue and red rectangles, respectively. 685
Mean value
of R over
region 1
Mean value of
R- over region
1 and
(Percentage)
Mean value of
Significant R-
over region 1 and
(Percentage)
Mean
value of
R over
region 2
Mean value
of R+ over
region 2 and
(Percentage)
Mean value of
Significant R+
over region 2 and
(Percentage)
NAM
and
w
-0.29*
-0.32**
(91.96%)
-0.42**
(55.53%)
0.32**
0.41***
(84.74%)
0.51***
(58.94%)
-0.29*
-0.31**
(93.57%)
-0.42***
(54.64%)
0.28*
0.37**
(82.37%)
0.48***
(55.53%)
NWS
and
w
-0.10
-0.13
(86.25%)
-0.29*
(5.0%)
0.11
0.14
(85.26%)
0.28*
(6.05%)
-0.12
-0.27*
(71.96%)
-0.35**
(21.25%)
0.17
0.27*
(78.95%)
0.38**
(38.16%)
686

34
Table 3. Other potential drivers of variability in NWS. AHR: anthropogenic heat release. BHT: 687
Beijing-Hebei-Tianjin. CRU: comparison of rural and urban NWS. FWM: friction wind model. GHGs: 688
greenhouse gases. LUCC: land use and cover change. OMR: observation minus reanalysis. PRD: Pearl 689
River delta. SDM: statistical downscaling method. YRD: Yangtze River delta. 690
Order Region Driver factor Method Role Study
period Original paper
1 China Urbanization CRU Large city: -0.02 m s-1 a-1
Small city: -0.018 m s-1 a-1 1969-2000 Xu et al. (2006)
2 YRD,
China Urbanization
Numerical
simulation
Urban expansion caused a
50% NWS decrease 2003-2007
Zhang et al.
(2010)
3 BHT,
China Urbanization
Numerical
simulation
Urbanization caused a
decrease of annual NWS
approximately -0.37 m s-1
1980-2018 Wang et al. (2020)
4 China LUCC OMR Inducing the reduction in
NWS: -0.12 m s-1 decade-1 1979-2010 Zha et al. (2017a)
5 Eastern
China LUCC SDM
LUCC caused a
downward trend of 0.17 m
s-1 decade-1 in NWS
1980-2011 Wu et al. (2017)
6 Eastern
China LUCC FWM
Inducing the reduction in
NWS: -0.2 m s-1 decade-1 1980-2011 Wu et al. (2016)
7 Eastern
China LUCC
Numerical
simulation
LUCC caused a decrease
of 0.17 m s-1 in NWS 1980-2010 Zha et al. (2019b)
8 Taiwan,
China GHGs
Correlation
analysis
-1.4 m s-1 per century
primarily attributed to
GHGs, rather than
quantitative estimation
1871-2010 Zhang et al.
(2016a)
9 PRD,
China AHR
Numerical
simulation
Leading to increase in the
NWS 2010
Zhang et al.
(2016b)
10 China Aerosol
emissions
Numerical
simulation
May reduce NWS by up to
8% locally 2002-2004
Jacobson and
Kaufman (2006)
11 China non-climate-re
lated factors
Statistical
analysis
Quantitative results are
not shown 1951-1990 Liu (2000)
691

35
692
693
Figure 1. Terrain height (shading) (unit: meters above sea level) and spatial pattern of total meteorological 694
stations (red circles) over eastern China in the dataset, as well as the location of eastern China (inset). Green 695
dots: 587 stations that are selected to use in this study. Red dots: the stations that are removed out. 696

36
697
Figure 2. Temporal changes of (a) NWS anomaly, (b) zonal component of observed NWS, and (c) 698
meridional component of observed NWS during the period 1979-2017 (unit: m s-1). Green lines denote 699
linear fitting curves, and black dotted lines denote Gaussian low-pass filter with a 9-yr moving window. The 700
linear trends of wind speeds are presented in insets (unit: m s-1 decade-1). In the inset, the vertical black bars 701
indicate the standard errors of slopes. The significances of trends are as follows: *** Significance at the 0.01 702
level, and blank indicates a trend is not significant. 703

37
704
Figure 3. Spatial patterns of (a) mean near-surface wind speed (NWS) (unit: m s-1), (b) linear trend of NWS, 705
(c) linear trends of zonal component of observed NWS and (d) meridional component of observed NWS 706
over eastern China during the period from 1979-2017 (unit: m s-1 decade-1). Shades in (b), (c) and (d) denote 707
the trend coefficients passed the 90%, 95% and 99% significance t-test, respectively. 708

38
709
Figure 4. Temporal changes in NAMI during the period from 1979 to 2017. Black dotted line denotes a 710
Gaussian low-pass filter with a 9-yr window, and green line denote the linear fitting. 711

39
712
Figure 5. Spatial patterns of (a, b) composite difference in near-surface wind speed (NWS) between positive 713
and negative NAM phases (positive NAM phases minus negative NAM phases), and (c, d) the correlation 714
coefficients between NAM and NWS over Northern Hemisphere during the period from 1979-2017. (a) and 715
(c) denote the total wind speed, (b) and (d) denote the zonal-mean westerly. Contour in (c) and (d) denotes 716
the correlation coefficient exceeding the 90% confidence level t-test. 717

40
718
Figure 6. Vertical structures of composite difference of zonal-mean meridional wind (shade), zonal-mean 719
zonal wind (contour), and meridional circulation (vector) between positive NAM phases (NAM+) and 720
negative NAM phases (NAM-) (NAM+ minus NAM−) during the period from 1979 to 2017. The vector is 721
that of wind speed difference, whose two components are the zonal mean meridional wind speed difference 722
and the zonal mean vertical velocity difference between NAM+ and NAM−. 723

41
724
Figure 7. (a) Spatial pattern of surface air temperature difference between positive NAM phases (NAM+) 725
and negative NAM phases (NAM-) in Northern Hemisphere (NAM+ minus NAM−) (unit: °C) from 726
1979-2017, (b) temporal changes of surface air temperature (SAT) difference between mid-to-high latitudes 727
(35°–60°N, 60°–140°E) and low latitudes (0°–20°N, 60°–140°E) over East Asia (denoted by SATD) from 728
1979-2017, and (c) regression analysis between SATD and NAM between 1979 and 2017. The contours in 729
(a) denote the SAT difference exceeding 0.10 level. Green lines denote linear fitting, and dotted line denotes 730
Gaussian low-pass filter with a 9-yr window. The insets in (b) and (c) denote the linear trend of SATD and 731
correlation coefficient between NAMI and SATD, respectively. In the inset, the vertical red bars indicate the 732
standard error of slope, and *** denotes the significance at the 0.01 level. Bars in (c) denote the regular 733
residual of linear fitting. 734
42
735
Figure 8. (a) Temporal changes of anomaly of north–south pressure difference (NSPD) between mid-to-high 736
latitudes (35°–60°N, 60°–140°E) and low latitudes (0°–20°N, 60°–140°E) over East Asia for 1979-2017, and 737
regression analysis between NSPD and SATD (u of observed NWS) during the period from 1979-2017 (b, c). 738
Green lines denote linear fitting, and dotted line denotes Gaussian low-pass filter with a 9-yr window. The 739
inset in (a) denote the linear trend of NSPD, and which denote the correlation coefficients between NSPD 740
and SATD (u of observed NWS) in (b) and (c). In the inset, the vertical red bars indicate the standard error 741
of slope, and *** denotes the significance at the 0.01 level. Bars in (b) and (c) denote the regular residual of 742
linear fitting. 743

43
744
Figure 9. Correlation coefficients between (a, b) NAM and SLP, (c) NAM and zonal wind, (d, e) observed 745
NWS over eastern China and SLP, and (f) observed NWS over eastern China and zonal wind in Northern 746
Hemisphere during the period from 1979 to 2017. (a), (c), (d), and (f) are calculated based on interannual 747
sequences; (b) and (e) are calculated based on raw sequences. The threshold for the correlation coefficient 748
exceeding the 90% confidence level is 0.27. The contours in (c) and (f) denote the correlation coefficient 749
exceeding the 0.10 significance level. 750

44
751
Figure 10. Vertical structures of correlations between NAM and zonal-mean meridional wind (a: shade), 752
vertical velocity (b: shade), and meridional circulation (vector) based on interannual sequences from 753
1979-2017. (c) and (d) are the same as (a) and (b), respectively, but for the NWS in eastern China. (e) and (f) 754
are the same as (c) and (d), respectively, but for the raw sequences. Contours denote the correlations 755
exceeding 0.10 level. The vector is a vector of correlations whose two components are the correlation 756
coefficients between NAM (NWS) and zonal-mean meridional wind and between NAM (NWS) and 757
zonal-mean vertical velocity, respectively. Because NWS and NAM exhibit negative correlation, the NWS is 758
added a negative sign when the correlation coefficient is calculated. Descending and ascending flows are 759
with the arrow pointing down and up, respectively. 760

45
761
Figure 11. Quantitative contributions of variations in Northern Hemisphere Annular mode (NAM) to 762
visibility in near-surface wind speed (NWS) and zonal component of NWS (u) during the period from 763
1979-2017. Red bars denote the standard error of estimation results. The significances of estimation results 764
are as follows: *** Significance at the 0.01 level, ** Significance at the 0.05 level. Blank indicates an 765
estimation result of NAM affects variations in NWS is not significant. 766