contribution of the ethanol industry
TRANSCRIPT

CONTRIBUTION OF THE ETHANOL INDUSTRY TO THE ECONOMY OF MINNESOTA IN 2017
February 12, 2018
Prepared for the Minnesota Bio-Fuels Association
John M. Urbanchuk Managing Partner
Agriculture and Biofuels Consulting, LLP
218 Pueblo Road Doylestown, PA 18901
www.abfeconomics.com 215-230-1834

1
Executive Summary
From the farm to the fuel pump, the ethanol industry is a vital component of Minnesota’s
economy. The ethanol industry provides jobs and income not only for the people who work at
bio refineries, but also for businesses that sell inputs and supplies to the ethanol industry. This
includes Minnesota farmers who produce most of the corn used by Minnesota’s biofuels
industry. Private and public-sector biofuels research and development also contribute to the
state’s economy and Minnesota participates in the rapidly growing export markets for ethanol
and co-products.
The impact of the ethanol industry on the Minnesota economy was estimated by applying
economic impact multipliers to expenditures for goods and services purchased from supplying
industries. This analysis was based on economic impact multipliers developed from the
IMPLAN (Impact Analysis for Planning) economic model and database. IMPLAN was used to
construct a model of the Minnesota economy including the sectors that support the ethanol
industry, the links between them, and the level of economic activity. IMPLAN models generate
a range of economic indicators that describe an economy, but the most commonly used are
value added (GDP), labor income (also known as household earnings), and employment.
Minnesota’s ethanol industry produced and estimated 1,204 million gallons, up 1.3 percent from
2016 levels. The ethanol industry in Minnesota spent $1.9 billion on raw materials (mostly
corn), other inputs, goods, and services to produce ethanol and primary co-products DDGS and
corn refiner’s oil. When the impact of these expenditures circulates fully through the Minnesota
economy, the ethanol industry:
• Generated more than $7.1 billion in gross sales for Minnesota businesses
• Accounted for nearly $2.2 billion in state Gross Domestic Product (GDP)1
• Generated more than $1.5 billion worth of income for Minnesota households
• Supported more than 18,800 full time jobs in the state, and
• Contributed $192 million to state and local government tax rolls.2
1 GDP is the value of the goods and services produced in the economy 2 This study estimated the annualized impact of producing 1,204 million gallons of ethanol on Minnesota’s economy. Figures reflect the capacity of ethanol plants operating at year’s end.

2
18,813 jobs for Minnesota residents
$2.2 billion in state GDP
$192 million in state and local
taxes
$1.5 billion in household
income
$7.1 billion in sales receipts for Minnesota
businesses
Annual Economic Impact of the Ethanol Industry in Minnesota

3
CONTRIBUTION OF THE ETHANOL INDUSTRY TO THE ECONOMY OF MINNESOTA IN 2017
February 12, 2018
Introduction
Minnesota’s ethanol industry continued to provide a significant contribution to the state economy
in 2017. However, the year was challenging in several respects. Minnesota’s 19 operating
ethanol plants produced 1,204 million gallons of ethanol in 2017, 1.3 percent more than in 2016.
Ethanol prices in 2017 were virtually unchanged from 2016 while the prices of most inputs
increased. Consequently, net revenue for Minnesota ethanol producers was modestly lower in
2017.
Ethanol plants purchase agricultural raw materials (mostly corn), other inputs, and a wide range
of goods and services such as industrial chemicals; electricity, natural gas, and water; labor;
and services such as maintenance, insurance, and general overhead. In addition, funding for
biofuels research and development from various sources including the federal government and
the private sector benefit the state’s economy. The 1.2 billion gallons of ethanol produced in
Minnesota last year used 415 million bushels of corn, or 28 percent of Minnesota’s 2017 1.48-
billion-bushel corn crop.
Expenditures on these goods and services represent the purchase of output of other industries
and a substantial share of these dollars is spent in Minnesota and the economic impact stays in
the state. Spending associated with ethanol production circulates throughout the entire
economy several-fold. Consequently, this spending stimulates aggregate demand, supports
jobs not only in ethanol production but also jobs throughout the entire economy, generates
additional household income, and provides tax revenue for state and local government.
At the request of the Minnesota Bio-Fuels Association (MBA), ABF Economics developed
models to estimate the economic impacts of ethanol production in Minnesota. The following
report summarizes our methods and results. This report: 1) summarizes current trends in the
national biofuel industry, 2) outlines the methods used to estimate impacts, and 3) presents
results of the analysis.

4
1. National Trends in Ethanol Production The U.S. ethanol industry had a remarkable year in 2017. Ethanol production increased to
record levels, domestic and export demand expanded, and construction of new production
facilities posted its first major gain in more than five years.
• Industry output through October 2017 was 2.8 percent above 2016 levels and was
poised to set a new record of nearly 15.9 billion gallons for the full year.
• World oil prices reversed the declines seen in recent years and posted a 16.5 percent
gain during 2017, leading to higher consumer gasoline prices. Despite higher average
motor gasoline prices during 2017, gasoline – and ethanol – demand expanded by about
one percent.
• Responding to record production and larger stocks, ethanol prices generally fell during
2017. Omaha Rack ethanol prices 6.8 percent lower for the full year, while Iowa ethanol
prices (FOB plant) fell 1.1 percent.
• The export markets were a significant bright spot for the industry. Based on USITC
data, ethanol exports for 2017 increased nearly 17 percent to a record level of 1.37
billion gallons valued at nearly $2.4 billion.
• At year’s end, the U.S. ethanol industry had 465 million gallons of capacity under
expansion or construction. This is the most significant increase in new capacity since
2011.
• The input markets were generally positive for the ethanol industry during 2017. American
corn growers posted the second largest crop on record in 2017, which pushed feedstock
prices lower throughout the year to the benefit of ethanol producers. Average cash
market corn prices during 2017 were 2.3 percent lower than a year earlier.3 Lower corn
prices offset slight increases in natural gas and electricity prices and supported ethanol
profitability in 2017. Net returns over variable costs for a typical dry mill ethanol plant
were modestly higher than year-ago levels during the first half of 2017 but slipped in the
second half as ethanol and DDGS prices fell. Despite this pattern, ethanol profitability
3 No. 2 Yellow Corn, Central Illinois; ethanol FOB Iowa Plant and Ethanol Omaha Rack. Source USDA and Nebraska Ethanol Board.

5
(returns over variable costs) remained positive for the full year, averaging an estimated
20 cents per gallon.4
The regulatory and trade environment continued to provide challenges for the industry. On
November 30, the Environmental Protection Agency (EPA) released its final rule for 2018
renewable volume obligations (RVOs) under the Renewable Fuel Standard (RFS). The final
rule includes a requirement for 15 billion gallons of conventional renewable fuel (e.g., corn
starch ethanol) in 2018, equal to the level established by Congress in the 2007 Energy
Independence and Security Act. However, the rule uses EPA’s cellulosic waiver authority to
reduce the advanced biofuel requirement from the statutory level of 11 billion gallons to 4.29
billion gallons. Within this category the RVO for cellulosic biofuels is 288 million gallons, far
short of the statutory level of 7 billion gallons and 7 percent lower than the final 2017 cellulosic
biofuel requirement.
As pointed out above, ethanol exports expanded significantly in 2017 posting an estimated 12.5
percent increase to a new record level. However, tariffs on U.S. ethanol in China, Brazil, and
the European Union constrained exports from growing more robustly. The situation for exports
of ethanol co-products, notably DDGS, was also affected by trade barriers. As a consequence
of anti-dumping and countervailing duties imposed against U.S. DDGS exports by China,
exports to that country fell from 2.2 million metric tons for the first 11 months of 2016 to 347,000
metric tons in 2017. China, which has been the leading export market for U.S. DDGS, slipped
to eighth place amongst top DDGS export markets.
In addition to ethanol refining and agriculture, there is a significant amount of public and private
sector funding for research and development aimed at discovering and developing advanced
biofuels feedstock and the technology needed to meet the RFS2 targets for cellulosic and
advanced biofuels. The primary public-sector agencies underwriting R&D in biofuels are the
U.S. Departments of Energy (USDOE), Agriculture (USDA), and Defense (DOD). In addition to
the federal government, many states are funding R&D in feedstock as well as infrastructure.
These public funds are being leveraged significantly by private sector firms undertaking
research in a wide range of biofuels activities. We have assumed that R&D spending on
biofuels continued to expand during 2017 as the need for new feedstocks grows. Reflecting this
4 Iowa State University AgDecision Maker Ethanol Profitability available at http://www.extension.iastate.edu/agdm/energy/xls/d1-10ethanolprofitability.xlsx accessed Jan 11, 2018
6
we assumed that industry R&D expenditures grew at the overall rate of inflation and totaled an
estimated 882 million in 2017.5 Minnesota participates in these R&D activities.
2. Methodology
Economic impact analysis measures the effects of an economic activity or event on a specific
geographic area. For example, policy makers or business leaders may want to know how a
proposed manufacturing plant would affect a regional economy, or conversely, they may want to
know how closing a plant or military base would affect a community. In some cases, federal
and state laws require economic impact studies before implementing a policy or project or
changing tax policies. Regardless of the reason, impact studies provide useful information for
guiding economic development and or to mitigate potential negative impacts. Economic impact
analysis is an important decision-making tool that can enhance the quality of decisions made,
as well as the decision-making process in both public and private sectors.
Basically, economic impact models are accounting frameworks for a predefined geographic
area that measures how goods and services flow through different economic sectors including
industries, households and governments. Spending, or the lack of spending by these sectors, is
the primary driver in an impact model. Spending associated with renewable fuels production
circulates throughout the entire Minnesota economy several fold. Consequently, this spending
stimulates aggregate demand, supports the creation of new jobs, generates additional
household income, and provides tax revenue for state and local governments. ABF estimated
the impact of the ethanol industry on the Minnesota economy by applying expenditures by the
relevant supplying industry to the appropriate final demand multipliers for value added output,
earnings, and employment. In this study, ABF used the IMPLAN (Impact Analysis for Planning) economic model to construct
a model of the Minnesota economy including the sectors that support the ethanol industry, the
links between them, and the level of economic activity. IMPLAN is a commonly used economic
input-output (I-O) model. I-O models are constructed based on the concept that all industries
5 Estimates of the amount of R&D spending on biomass and biofuels vary substantially. For a discussion of R&D spending on biofuels see “Agricultural Preparedness and the Agriculture Research Enterprise”. President’s Council of Advisors on Science and Technology. Washington DC, December 2012. A 2013 study prepared by Mary Solecki, Anna Scodel and Bob Epstein at E2 Environmental Entrepreneurs. “Advanced Biofuel Market Report 2013” suggests that R&D spending on biofuels approaches $1.7 billion. A (relatively) new report on federal spending on R&D in energy published by EIA (“Direct Federal Financial Interventions and Subsidies in Energy in Fiscal year 2013”, March 2015) estimates Federal R&D expenditures for biomass of $300 million in FY 2013. This study does not include estimates for corporate (private sector) R&D.

7
within an economy are linked together; the output of one industry becomes the input of another
industry until all final goods and services are produced. I-O models can be used both to analyze
the structure of the economy and to estimate the total economic impact of projects or policies.
For this analysis, ABF used a model of the Minnesota economy based on IMPLAN software and
data to estimate economic impacts of the ethanol industry.
To understand how the economy is affected by an industry such as ethanol production, it is
necessary to understand how different sectors or industries in the economy are linked. For
example, in the renewable fuels production sector, the ethanol industry buys corn from the
agriculture sector; which in turn, buys inputs from other suppliers such as fertilizer and pesticide
producers that also purchase products from a range of other industries. These are referred to as
backward linkages. Use by other sectors of natural gas as an input, such as other
manufacturing operations, is a forward linkage. Natural gas production and transmission
industries are linked through both forward and backward linkages to other economic sectors of
the state’s economy. The household sector is linked to all other sectors as it provides the labor and management
resources. In turn, changes that affect household incomes typically have significant impacts
compared to a change in the sales of other sectors. This is because households typically spend
most of their income on both retail and service goods, both of which are critical components of
the economy. Table 1 shows estimated 2017 expenditures for the Minnesota ethanol industry. Expenditures
are a combination of input price and quantity used for ethanol production. The Minnesota prices
for corn and natural gas – the two largest cost elements and ethanol, DDGS, and Corn refiner’s
oil (the major outputs) are shown in Appendix A.
Each type of expenditure is linked to an appropriate IMPLAN sector and analyzed using
IMPLAN software. In addition to the impacts of these expenditures, our analysis includes
corporate income of the ethanol plants, and income generated by locally owned and cooperative
ethanol firms. All corporate income generated by the ethanol industry that stays in the state is
included in GDP impacts. Corporate earnings transferred to firms outside of Minnesota are
leakages for the economy and are not included. A review of ownership of ethanol firms based
on information provided by MBA suggests that approximately two-thirds of the state’s ethanol
plants are locally owned or have significant local ownership. The earnings of locally owned firms

8
are treated as an addition to the household sector since the income is paid to Minnesotans, so
their impact is more accurately estimated using multipliers for the household sector.
Table 1 2017 Costs and Returns
Minnesota Dry Mill Ethanol Production
Ethanol Industry Expenditures Mil $ Corn $1,329 Enzymes, Yeast and Chemicals $82 Denaturant $62 Electricity $66 Natural Gas $160 Water $21 Direct labor $76 Maintenance & Repairs $33 Transportation $10 Professional Services $39 Total Operating Costs $1,877 Change from 2016 4.0% Revenues
Ethanol $1,746 Distiller’s Dried Grain $391 Corn Refiner’s Oil $66 Total Revenues $2,203 Change from 2016 0.7% EBITA $326 Change from 2016 -14.8%
Multipliers measure three types of impacts: direct, indirect, and induced impacts:
§ Direct effects are the known or predicted changes in the economy.
§ Indirect effects are the business-to-business transactions required to produce direct
effects (i.e., increased output from businesses providing intermediate inputs).

9
§ Induced effects are derived from spending on goods and services by people working to
satisfy direct and indirect effects (i.e., increased household spending resulting from
higher personal income).
Multipliers are calculated from I-O models that are constructed from data for a specified
geographic area. The economy in question is divided into a number of producing industries or
sectors that sell and purchase goods and services to and from each other, and these inter-
industry purchases and sales are key data in I-O models. Sector goods and services are
purchased by domestic households, international customers in the form of exports, government
(federal, state, and local), and for private sector investment. Purchases that are not part of an
economy’s supply chain are final demand. For example, wheat farmers sell wheat to mills that
produce flour and sell it to food manufacturers and bakers that make bread. Those food
manufacturers then sell the bread to wholesale and retail outlets, and ultimately consumers
purchase the bread to eat. Consumer purchases are final demand. When using IMPLAN an important consideration is the definition of the geographic area used in
a study. Economies extend far beyond political boundaries, and workers and their incomes and
transactions among industries flow across political boundaries. Thus, some indirect effects are
likely to occur beyond the geographic region under study. These are called leakages, as
opposed to linkages (supplier-purchaser relationships) within a region, and smaller geographic
regions such counties will have more leakages. In contrast, a larger area such as a state or
nation will have relatively fewer leakages.
IMPLAN models generate a range of economic indicators that describe an economy, but the
most commonly used are output (gross business revenues), value added (GDP), employment,
and labor income (also known as household earnings):
§ Gross Output is the value of production for all industries in an economy measured by
gross sales revenues (i.e., sales).6
§ Value added is the total value of goods and services produced by businesses in an
economy. Generally referred to as gross domestic product (GDP), it is the sum of
6 Although output is a valid metric and important from the perspective of individual businesses, it does not measure the net value of production in an economy. For example, if a farmer sells corn to a mill for $1.00, and the mill processes the corn into feed and sells it for $3.00, the total output value would be $4.00. The net economic value (or value added) only counts the incremental increase in value and includes the original $1.00 sales and the additional $2.00 in value added after the mill processed the corn into feed for a total value added of $3.00.
10
labor income, taxes paid by industries and households, and other property type income
such as corporate profits. Value added including labor income and employment
represent the net economic benefit that accrues to an economy as a result of increased
economic output.
§ Labor income or Household Earnings is the sum of employee compensation
(including all payroll and benefits) and proprietor income (income for self-employed
work). In the case of this analysis, demand for corn and other feedstock to produce
ethanol supports household earnings through higher receipts than would be the case
without ethanol production.
§ Employment represents the annual average number of employees (full time
equivalents), of businesses producing output.7
Changes to the Analysis
We explicitly incorporated the impact of ethanol exports on Minnesota. As pointed out earlier,
U.S. exports of ethanol grew significantly in 2017. Since Minnesota is the nation’s fourth
largest ethanol producer the State’s industry participates in the export market. The
methodology for estimating the impact of trade differs from that used for industry output.8 We
have estimated the impact of ethanol exports by applying USDA Agricultural Trade multipliers
for output and employment to the estimated value of exports for 2017. Since ethanol is an
output of the chemical industry we used the USDA trade multipliers for the other organic
chemicals industry. The USDA multipliers have three major components (or margins):
production, transportation and warehousing, and wholesale/retail trade. Since IMPLAN already
incorporates the impact of ethanol production, to avoid double counting impacts we only applied
the margins for transportation and trade to the value of exports. This represents the post-
production (or ex-plant) impacts from exports. These results were added to the IMPLAN results.
Reflecting this we applied Minnesota’s share of total production to the total national export
impact when applying the USDA Trade Multipliers.
The second major change this year is the recognition of the economic impact provided by
capital expenditures associated with adding infrastructure for higher blend levels of ethanol to
192 additional retail stations in 2017. Based on data provided by the Minnesota Department of
7 Employment numbers in this report are expressed in terms of full-time equivalent jobs. 8 https://www.ers.usda.gov/data-products/agricultural-trade-multipliers.aspx

11
Agriculture the Minnesota Bio-Fuels Association estimates these expenditures for 2017 at $27.9
million.
3. Contribution of the Ethanol Industry to Minnesota
Ethanol manufacturing contributes significantly to the Minnesota economy, spending nearly $1.9
billion on raw materials, other inputs, goods and services to produce 1.2 billion gallons of
ethanol. Corn, which the industry uses as a renewable raw material to make ethanol, distillers
dried grains with solubles (DDGS), and corn refiner’s oil, accounts for 71 percent industry
purchases (natural gas was the second largest input at 8.5 percent of total production costs). In
2017 the Minnesota ethanol industry used 415 million bushels of corn to produce ethanol,
DDGS, and corn refiner’s oil.9 In addition to providing a growing and reliable domestic market for Minnesota, the ethanol
industry also provides the opportunity for farmers to enjoy some of the value added to their
commodity by further processing. Locally owned ethanol plants, including cooperative farmer
owned plants account for about 60 percent of Minnesota fuel ethanol plants and production
capacity. The remainder of the spending by the ethanol industry is for a wide range of inputs such as
industrial chemicals; electricity, natural gas, and water; labor; transportation; and services such
as maintenance, insurance, and general overhead. In addition, the Minnesota ethanol industry
purchased goods and services for expansion of production capacity and blender pumps to
support distribution of higher blends of ethanol. Spending for these goods and services
represents the purchase of output of other industries, many of which operate in Minnesota.
Table 2 summarizes results of our analysis. Ethanol manufacturing and supporting research
and development (excluding expenditures on grain feedstock which is allocated to the
agriculture sector) contributed $1.1 billion to Minnesota GDP based on economic conditions in
2017. Direct employment, including jobs at ethanol plants, amounts to 1,717 jobs in the state
with household incomes totaling $314 million.10 Note that the total income generated includes
income (i.e., profits) to owners of locally owned plants, which is substantial. The Indirect
9 The authors of this report recognize that the corn used in ethanol manufacturing might be grown regardless of the ethanol industry, albeit farmers would likely realize lower prices for their corn without the ethanol industry. Regardless, corn production is currently a major part of the industry’s supply chain, and thus should be included in an economic impact analysis, which by definition is distinct from a cost benefit analysis. 10 The Census Bureau does not report employment in ethanol production. The number of direct jobs associated with ethanol production is based on an estimated industry average of 50 jobs per plant.

12
contribution of ethanol manufacturing to GDP totaled $376 million and consisted of GDP created
by non-agricultural input suppliers such as natural gas companies, Induced GDP comes from
businesses that benefit from income spent by ethanol plant workers and owners, and income
spent by employees who work in supporting industries. Induced GDP totaled $324 million, and
induced household earnings total $223 million.
Since ethanol production relies primarily on corn grown by Minnesota farmers, ethanol plants
have a very large impact on agriculture, supporting more than 2,600 direct farm and farm-
related jobs.11 Most of the agriculture jobs supported by the ethanol industry are farm workers
and laborers associated with corn production and harvest. However, a wide range of jobs in
support activities related to crop production ranging from farm managers and bookkeepers to
farm equipment operators are supported by ethanol production. Indirect and induced jobs
supported by the agriculture output used by Minnesota ethanol producers amount to an
additional 4,004 indirect jobs in the corn production supply chain, and 1,785 jobs in business
supported by the ethanol industry.
As the impact of the direct spending by ethanol plants expands throughout the economy, the
employment impact grows significantly over a large number of sectors. These include jobs in
engineering, marketing, sales, logistics, power automation providers, emission testers,
accounting, rail transportation, industrial cleaning, underground tank installers, blender pump
installers, water management, dust collector manufacturers, risk management service
providers and enzyme providers.
Minnesota participated in the mini construction boom the U.S. industry experienced in 2017.
This included both new construction and expansion of existing facilities. Information provided by
the Minnesota Bio-Fuels Association and U.S. Renewable Fuels Association indicates that 105
million gallons of new capacity were under construction or expansion at the end of 2017. We
estimate that the Minnesota industry spent more than $200 million on capital expansion in 2017.
Construction expenditures contributed $314 million to Minnesota GDP in 2017, supported 2,411
jobs in all sectors of the economy and generated $223 million in household income.
11 Based on a review of the location of Minnesota’s ethanol plants and the guideline that most ethanol pants procure their feedstock from within a 50-75-mile radius of the plant, we estimated that about three-quarters of the corn used to produce ethanol in Minnesota was grown by Minnesota farmers.

13
The ethanol industry supported the establishment of new flex-fuel pumps needed to support the
demand for higher ethanol blends. Minnesota petroleum marketers added 192 retail stations
that offered higher blend levels of ethanol during 2017 for a total of 253 stations, up from 61
stations at the end of 2016. Fourteen brands offered E15 during 2017. All of Minnesota Biofuels
Infrastructure Partnership Grant Program (BIP) funds are scheduled to be used to engage
independent fuel retailers (some with 3 to 21 or more stations) to make the changes necessary
to sell E15.12 In turn that engagement action helped leverage other larger retailers in making the
conversion to either install blender pumps or to substitute E15 for the petroleum mid-grade (i.e.,
the substitution uses the compatible mid-grade tank to hold pre-blended E15, usually selling as
"Unleaded 88" and "Unleaded Plus". As indicated earlier the Minnesota Bio-Fuels Association
estimates that the capital expenditures associated with the expansion of E15 and higher blends
of ethanol totaled $27.9 million in 2017. This expansion of ethanol retail fueling infrastructure is
estimated to add $41 million to Minnesota GDP, support 273 jobs in a wide range of industries
such as underground tank installers and blender pump installers and add $28 million to
household income.
The contribution of exports of ethanol by the Minnesota industry is estimated to generate an
additional $125 million of GDP and supported 615 jobs in all sectors of the state economy.
In total, ethanol plants, the corn and other feedstocks used by them, biofuels research,
construction activity and trade contributed nearly $2.2 billion to GDP for Minnesota, supported
18,813 full time jobs in the state and put more than $1.5 billion worth of earnings in the pockets
of Minnesota households. The total jobs and earnings estimates include all industries in
Minnesota that support ethanol manufacturing; not only businesses that make up the supply
chain such as corn farmers (i.e., indirect impacts), but also firms that benefit from the employee
spending by workers that staff ethanol plants and supporting industries (i.e., induced impacts).
For example, in terms of induced jobs the largest sectors in Minnesota impacted by ethanol
production are retail trade and health care. When measured by household earnings, the sectors
most affected include natural gas distributors (indirect), and the health care and banking and
finance industries (induced).
12 “The Minnesota Biofuels Infrastructure Partnership Grant Program (BIP) is funded by the United States Department of Agriculture, the State of Minnesota, and private-sector partners for the primary purpose of increasing consumption of biofuel in the form of ethanol.” https://www.mda.state.mn.us/grants/grants/bipgrant.aspx

14
Appendix B shows the major industries affected for both agriculture and ethanol manufacturing
by GDP, household earnings and employment. Although, not shown in Table 2, we estimate
that state and local taxes generated by the ethanol industry totaled nearly $192 million in
2017.13
Table 2 Contribution of the Ethanol Industry to the Economy of Minnesota 2017
Sales Gross Domestic Employment Household Revenue Product (Full Time) Earnings (Mil $) (Mil $) Jobs (Mil $) Ethanol Mfg. and R&D
Direct $2,388 $381 1,717 $314 Indirect $1,006 $376 2,167 $300 Induced $943 $324 3,230 $223 Subtotal $4,337 $1,081 7,114 $837 Agriculture Direct $1,096 $82 2,610 $70 Indirect $738 $384 4,004 $231 Induced $268 $152 1,785 $91 Subtotal $2,102 $618 8,400 $391 Construction
Direct $210 $86 1,131 $79 Indirect $88 $109 553 $73 Induced $97 $119 727 $71 Subtotal $394 $314 2,411 $223 E15 Infrastructure $49 $41 273 $28 Exports $254 $125 615 $67 Total
Direct $3,722 $561 5,584 $473 Indirect $2,096 $1,007 7,402 $681 Induced $1,319 $610 5,827 $394 Grand Total $7,136 $2,178 18,813 $1,548 Change from 2016 8.9% 18.3% 11.6% 12.6%
13 Minnesota taxes were estimated by applying the share of state and local taxes for the U.S. to U.S. GDP (8.8 percent) to the estimate of Minnesota GDP contributed by the ethanol and supporting industries.

15
4. Co-Product Production and Fuel Co-Existing with Food The ethanol industry produces valuable co-products in addition to biofuel. In order to produce
1.2 billion gallons of ethanol the Minnesota ethanol industry used approximately 415 million
bushels of corn. The ethanol production process converts the starch in the grain to sugar which
is then fermented and distilled into alcohol, most of which is used for fuel. It is important to
recognize that this process converts only the starch in the grain and leaves the remaining fiber,
nutrients, and oil to be recovered as co-products used primarily as a feed ingredient for livestock
and poultry. The refiners’ oil recovered by corn dry mills has become an important feedstock for
biodiesel production. Consequently, the full food value of the corn used to produce ethanol is
retained. This set of factors is of particular relevance as it demonstrates the production of
biofuel can, and does, co-exist with food. By producing valuable feed ingredient co-products,
the ethanol industry effectively reduces the amount of grain required by the livestock and poultry
industry. A USDA study on the substitution of corn and soybean meal by ethanol co-products
reported that one ton of DDGS could effectively replace more than 1.2 tons of feed consisting of
corn and soybean meal.14
In the process of converting approximately 415 million bushels of corn into ethanol, the
Minnesota ethanol industry produced an estimated 3.7 million tons of Dried Distiller’s Grains
(DDGS) and 247 million pounds of corn refiner’s oil in 2017. This amount of distillers’ grains is
sufficient to meet the annual feed requirements of more than 2.5 million beef and dairy cattle, or
the entire inventory of cattle and calves in Minnesota.15 Moreover since DDGS is used as a
feed supplement it displaces both corn and soybean meal.16 Thus, given the availability of
DDGS from ethanol production, the livestock and poultry industry requires less grain corn and
soybean meal to feed the same number of animals and produce the same amount of meat and
dairy products.
14 Linwood A. Hoffman and Allen Baker. “Estimating the Substitution of Distillers’ Grains for Corn and Soybean Meal in the U.S. Feed Complex”. USDA/ERS FDS-11-1-01. Updated January 7, 2012 15 Personal conversations with Dr. Caitlin Foley, Assistant Professor of Dairy Science at the University of Georgia suggest an average daily DDGS consumption of 5 to 10 lbs. per cow per day is a reasonable assumption. This is consistent with inclusion rates cited in the literature. USDA/NASS reported that Minnesota had 2.4 million cattle and calves in inventory on January 1, 2017. 16 Corn refiners’ oil also is used as a feed supplement and ingredient in compound feeds.

16
The corn refiner’s oil produced as an ethanol co-product is used as a feedstock for biodiesel
production, as an animal feed ingredient and as an intermediary for industrial products. If all of
the corn refiner’s oil produced by Minnesota ethanol plants was used as a biodiesel feedstock, it
could produce nearly 34 million gallons of biodiesel, or more than 26 percent of the biodiesel
capacity of Minnesota’s biodiesel plants.17
CONCLUSION
The ethanol industry makes a significant contribution to the economy of Minnesota in terms of
job and income creation and generation of tax revenue while producing a renewable fuel to
displace refined petroleum products. The importance of the ethanol industry to Minnesota
agriculture and rural economies is particularly notable. Continued growth and expansion of the
ethanol industry through innovation and the use of new technologies and renewable feedstock
will enhance the industry’s position as the original creator of green jobs, and will enable
Minnesota, and America, to make further strides toward energy independence.
17 http://www.eia.gov/biofuels/biodiesel/production/

17
Appendix A
Minnesota Prices
Corn, Farm Corn, Farm Corn, No 2 Yel Corn, No 2 Yel Price, MN Price, MN Minneapolis Minneapolis
2016 2017 Percent 2016 2017 Percent ($/bu) /1 ($/bu) /1 Change ($/bu) /2 ($/bu) /2 Change
Jan $3.47 $3.21 -7.5% $3.18 $3.40 6.9% Feb $3.31 $3.25 -1.8% $3.08 $3.44 11.7% Mar $3.25 $3.31 1.8% $3.26 $3.28 0.6% Apr $3.37 $3.24 -3.9% $3.47 $3.36 -3.2% May $3.49 $3.31 -5.2% $3.61 $3.36 -6.9% Jun $3.65 $3.29 -9.9% $3.77 $3.33 -11.7% Jul $3.47 $3.30 -4.9% $3.17 $3.32 4.7% Aug $3.04 $3.07 1.0% $2.89 $3.07 6.2% Sep $2.96 $2.99 1.0% $2.85 $2.87 0.7% Oct $3.15 $3.02 -4.1% $2.93 $2.86 -2.4% Nov $3.10 $2.92 -5.8% $2.98 $2.96 -0.7% Dec $3.21 -- $2.89 $2.85 -1.4%
Average $3.29 $3.17 -3.5% $3.17 $3.18 0.1%
Ethanol Ethanol Distillers Grains Distillers Grains Minnesota Minnesota 10%, MN 10%, MN
2016 2017 Percent 2016 2017 Percent ($/gal) /3 ($/gal) /3 Change ($/ton) /3 ($/ton) /3 Change
Jan $1.29 $1.35 4.7% $117.40 $95.50 -18.7% Feb $1.30 $1.41 8.5% $118.95 $97.11 -18.4% Mar $1.29 $1.44 11.7% $119.45 $96.22 -19.5% Apr $1.42 $1.59 11.6% $112.08 $94.70 -15.5% May $1.48 $1.44 -2.7% $128.46 $95.25 -25.8% Jun $1.53 $1.53 -0.3% $156.66 $98.43 -37.2% Jul $1.44 $1.53 6.3% $137.15 $104.68 -23.7% Aug $1.35 $1.53 13.4% $113.85 $106.05 -6.9% Sep $1.52 $1.57 3.3% $110.72 $108.25 -2.2% Oct $1.51 $1.38 -8.6% $97.53 $110.60 13.4% Nov $1.54 $1.35 -12.3% $97.88 $120.24 22.8% Dec $1.67 $1.26 -24.6% $97.86 $128.15 31.0%
Average $1.44 $1.45 0.2% $117.33 $104.60 -10.9%
18
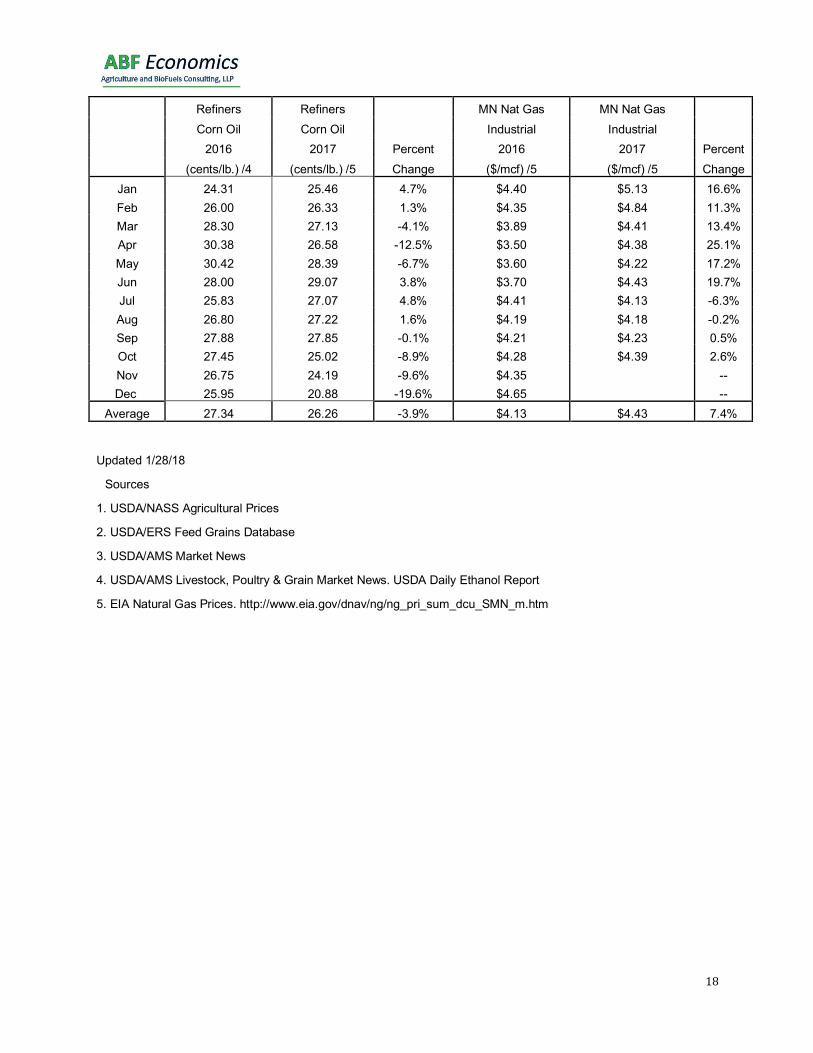
Refiners Refiners MN Nat Gas MN Nat Gas Corn Oil Corn Oil Industrial Industrial
2016 2017 Percent 2016 2017 Percent (cents/lb.) /4 (cents/lb.) /5 Change ($/mcf) /5 ($/mcf) /5 Change
Jan 24.31 25.46 4.7% $4.40 $5.13 16.6% Feb 26.00 26.33 1.3% $4.35 $4.84 11.3% Mar 28.30 27.13 -4.1% $3.89 $4.41 13.4% Apr 30.38 26.58 -12.5% $3.50 $4.38 25.1% May 30.42 28.39 -6.7% $3.60 $4.22 17.2% Jun 28.00 29.07 3.8% $3.70 $4.43 19.7% Jul 25.83 27.07 4.8% $4.41 $4.13 -6.3% Aug 26.80 27.22 1.6% $4.19 $4.18 -0.2% Sep 27.88 27.85 -0.1% $4.21 $4.23 0.5% Oct 27.45 25.02 -8.9% $4.28 $4.39 2.6% Nov 26.75 24.19 -9.6% $4.35 -- Dec 25.95 20.88 -19.6% $4.65 --
Average 27.34 26.26 -3.9% $4.13 $4.43 7.4%
Updated 1/28/18
Sources
1. USDA/NASS Agricultural Prices
2. USDA/ERS Feed Grains Database
3. USDA/AMS Market News
4. USDA/AMS Livestock, Poultry & Grain Market News. USDA Daily Ethanol Report
5. EIA Natural Gas Prices. http://www.eia.gov/dnav/ng/ng_pri_sum_dcu_SMN_m.htm

19
Table B-1
Top 10 Industries Impacted by Ethanol Manufacturing 2017 Employment
Sector Employment Healthcare 1,804 Natural gas distribution 481 Full-service restaurants 340 Limited-service restaurants 310 Accounting services 286 Real estate 272 Banking and Finance 241 Wholesale trade 213 Retail - General 202 Legal services 201 Total Top 10 4,350
Source: ABF Economics using IMPLAN Pro™ data and software
Table B-2 Top 10 Industries Impacted by Ethanol Manufacturing
2017 Household Income
Sector Mil $ Healthcare $153.9 Natural gas distribution $128.1 Banking and Finance $66.0 Wholesale trade $49.1 Maintenance and repair $41.9 Accounting services $39.5 Legal services $39.4 Insurance carriers $29.4 Truck transportation $16.8 Water, sewage $15.3 Total Top 10 $579.4
Source: ABF Economics using IMPLAN Pro™ data and software

20
Table B-3
Top 10 Industries Impacted by Ethanol Manufacturing 2017 GDP
Sector Mil $ Natural gas distribution $148.2 Healthcare $88.0 Real estate $67.1 Wholesale trade $146.6 Banking and Finance $38.1 Insurance carriers $32.3 Legal services $56.5 Petroleum refineries $24.3 Accounting services $22.8 Maintenance and repair $20.8 Total Top 10 $644.6
Source: ABF Economics using IMPLAN Pro™ data and software
Table B-4 Top 10 Industries Impacted by Ethanol Related Agriculture
2017 Employment
Sector Jobs Grain farming 2,981 Agriculture Services 795 Real estate 562 Wholesale trade 512 Insurance carriers 472 Banking and Finance 450 Healthcare 397 Maintenance and repair 352 All other crop farming 333 Employment services 332 Total Top 10 7,186 Source: ABF Economics using IMPLAN Pro™ data and software

21
Table B-5 Top 10 Industries Impacted by Ethanol Related Agriculture
2017 Household Income
Sector Mil $ Agriculture Services $75.2 Grain farming $62.6 Real Estate $32.3 Wholesale trade $24.0 Banking and Finance $20.5 Insurance carriers $19.3 Healthcare $19.3 Maintenance and repair $14.4 All other crop farming $8.2 Truck transportation $7.5 Total Top 10 $283.3 Source: ABF Economics using IMPLAN Pro™ data and software
Table B-6 Top 10 Industries Impacted by Ethanol Related Agriculture
2017 GDP
Sector Jobs Real estate $103.4 Agricultural Services $102.3 Grain farming $61.4 Wholesale trade $46.8 Agriculture Services $39.4 Healthcare $26.6 Insurance carriers $22.5 Banking and Finance $16.9 Petroleum refineries $15.9 Maintenance and repair $14.5 All other crop farming 449.7 Total Top 10 $103.4 Source: ABF Economics using IMPLAN Pro™ data and software