contribution of agroforestry activities to the financial, … · research report contribution of...
TRANSCRIPT
RESEARCH REPORT
Contribution of agroforestry activities to the financial,socioeconomic and environmental sustainability of a carbon sink project
in the province of Kinshasa
Catherine PAULSeptember 2011
Research report submitted in partial fulfilment of the requirements for the MSc in AppliedEnvironmental Economics for Distance Learning Students of the University of London,
Centre for Development, Environment and Policy (CeDEP),School of Oriental and African Studies (SOAS)
Supervisor: Prof. Iain Fraser, School of Economics, University of Kent
i
ii
Table of contents
Table of contents......................................................................................................................................ii
List of tables ............................................................................................................................................iii
List of figures ........................................................................................................................................... iv
List of boxes............................................................................................................................................. iv
Acronyms and abbreviations....................................................................................................................v
Abstract ..................................................................................................................................................vii
Résumé.................................................................................................................................................. viii
Acknowledgements ................................................................................................................................. ix
1. Introduction......................................................................................................................................1
1.1. Background and justification................................................................................................... 1
1.2. Research objectives and questions ......................................................................................... 2
2. Literature review ..............................................................................................................................3
2.1. Forest resources in DRC........................................................................................................... 3
2.2. Deforestation and forest degradation .................................................................................... 3
2.3. Wood energy’s contribution to forest degradation................................................................ 4
2.4. Making woodfuel supply more sustainable ............................................................................ 5
2.5. Impact of woodfuel plantations on forest protection: a livelihoods approach ...................... 5
2.6. Financial sustainability ............................................................................................................ 7
3. Methods ...........................................................................................................................................8
3.1. Data collection......................................................................................................................... 8
3.2. Data analysis.......................................................................................................................... 10
3.3. Constraints and limitations ................................................................................................... 12
4. Results ........................................................................................................................................... 13
4.1. Financial analysis ................................................................................................................... 13
4.2. Survey of rural households: data description ....................................................................... 16
4.3. Survey of rural households: statistical tests.......................................................................... 19
iii
4.4. Focus group meetings ........................................................................................................... 22
5. Interpretation and discussion ....................................................................................................... 24
5.1. Financial sustainability .......................................................................................................... 24
5.2. Socioeconomic and environmental sustainability................................................................. 26
6. Conclusions.................................................................................................................................... 30
7. References..................................................................................................................................... 32
8. Bibliography................................................................................................................................... 39
Annex I: Conceptual framework............................................................................................................ 41
Annex II: Data collection and analysis framework ................................................................................ 42
Annex III: List of key informants and other people met........................................................................ 47
Annex IV: Survey – Questionnaire......................................................................................................... 50
Annex V: Data collection methods – Additional information ............................................................... 66
Annex VI: Cost-benefit analysis – Main assumptions and summary of results..................................... 72
Annex VII: Survey results – Detailed data description .......................................................................... 83
Annex VIII: Statistical test results ........................................................................................................ 109
Annex IX: Focus groups – Detailed account of discussions ................................................................. 121
List of tables
Table 4.1 – Key characteristics of the baseline CBA scenario ............................................................... 13
Table 4.2 – CBA results for the baseline scenario ................................................................................. 14
Table 4.3 – Variant scenarios used in sensitivity analysis ..................................................................... 15
Table 4.4 – Sensitivity analysis: IRR associated with variant scenarios................................................. 15
Table 4.5 – Key survey results ............................................................................................................... 16
Table 4.6 – Key statistical test results ................................................................................................... 20
Table V.1 – Characteristics of the sampling frames .............................................................................. 69
Table VI.1 – Key assumptions underlying CBA ...................................................................................... 72
Table VI.2 – Key differences between the scenarios ‘with’ and ‘without’ agroforestry....................... 76
iv
Table VI.3 – Cumulative revenues, costs and cashflow over 30 years – With agroforestry ................. 77
Table VI.4 – Cumulative revenues, costs and cashflow over 30 years – Without agroforestry............ 78
Table VI.5 – Cumulative revenues, costs and cashflow over 30 years – Difference between
scenarios ‘with’ and ‘without’ agroforestry ......................................................................................... 79
Table VI.6 – NPV (2011 USD) and IRR for variant scenarios, excluding land acquisition ...................... 80
Table VI.7 – NPV (2011 USD) and IRR for variant scenarios, including land acquisition....................... 80
Table VII.1 – Survey data description.................................................................................................... 85
Table VIII.1 – Statistical test results..................................................................................................... 110
List of figures
Figure I.1 – Conceptual framework for the research ............................................................................ 41
List of boxes
Box VI.1 – Changes in relative prices: rationale .................................................................................... 81
v
Acronyms and abbreviations
CDF Congolese (DRC) franc
CDM Clean Development Mechanism of the Kyoto Protocol
CERs Certified Emission Reductions under the CDM, with CER units corresponding to the
removal of one t CO2e
CO2e Carbon dioxide equivalent
DRC Democratic Republic of Congo
ERAIFT The UNESCO-financed ‘École régionale d’aménagement et de gestion intégrés des
forêts et territoires tropicaux’, University of Kinshasa
ERPA Emission reduction purchase agreement
FLEGT Forest Law Enforcement, Governance and Trade – an EU initiative to fight the
international trade in illegal timber and promote the development of legal timber
supply chains in developing countries
GHG Greenhouse gas
ha Hectare(s)
IPCC Intergovernmental Panel on Climate Change
IPCC GPG IPCC Good Practice Guidance for Land Use, Land Use Change and Forestry (2003)
IRR Internal rate of return
MRV Monitoring, reporting and verification
NPV Net present value
PDD Project description document submitted to the CDM Executive Board
REDD+ Initiative for Reducing emissions from deforestation and forest degradation, under
the UNFCCC
t CO2e Tonne(s) of carbon dioxide equivalent
TARAM Tool for Afforestation and Reforestation Methodologies – spreadsheet-based tool for
estimating ex ante the amount of emission reductions generated by
afforestation/reforestation projects, for methodologies approved under the CDM;
developed by CATIE, the BioCarbon Fund and TÜV-Süd
tCERs Temporary CERs under the CDM, with tCER units corresponding to the removal of
one t CO2e by afforestation/reforestation projects

vi
UNFCCC United Nations Framework Convention on Climate Change
USD US dollar
VERs Verified Emission Reductions, corresponding to the removal of one t CO2e, issued in
compliance with a recognised standard (e.g. Voluntary Carbon Standard) and traded
in voluntary carbon markets
vii
Abstract
Through the experience of the Ibi-Batéké carbon sink project, a private afforestation project in
Kinshasa province, and of the neighbouring Mampu woodfuel plantation, with a focus on their
agroforestry activities, the research looks into three questions: whether sustainably produced
cassava, charcoal and timber can contribute to the financial sustainability of ‘Ibi-like’ carbon sink
projects; whether agroforestry activities in woodfuel plantations can generate and sustain benefits in
terms of improved livelihoods; and whether the development of more sustainable livelihoods can
actually alleviate pressure on the remaining, much degraded natural forests in Kinshasa province.
Using data collected by means of a survey of rural households, focus group meetings, semi-
structured interviews and a documentary review, and analysed using a mix of quantitative and
qualitative approaches (cost-benefit analysis, descriptive statistics, statistical tests and a simplified
form of content analysis), the research concludes that:
- Relatively low-value agroforestry activities can contribute to the financial sustainability of an ‘Ibi-
like’ project, but only as long as forest carbon prices remain low.
- Higher forest carbon prices, rewarding also the significant social and local environmental benefits
generated by labour-intensive, agroforestry-based woodfuel plantation projects, would improve
their (currently low) profitability and thus help attract investment and sustain benefits.
- Such projects do generate social benefits – and through livelihoods-related mechanisms (on top
of increased charcoal supplies), can indeed contribute to alleviating pressure on remaining natural
forests.
- Supportive public policies are needed to create a more favourable context for woodfuel
plantation development, and enhance their positive impacts of forest protection.
viii
Résumé
À travers l’expérience du projet de puits de carbone d’Ibi-Batéké, un projet d’afforestation privé situé
dans la province de Kinshasa, et de la plantation de bois-énergie voisine de Mampu, la recherche,
centrée sur leurs activités d’agroforesterie, aborde trois questions : celles de savoir si le manioc, le
charbon de bois et le bois d’œuvre produits dans des conditions durables peuvent contribuer à la
viabilité financière de projets de puits de carbone du type ‘Ibi’ ; si les activités d’agroforesterie
menées dans ces plantations peuvent générer, dans la durée, des avantages en termes
d’amélioration des moyens de subsistance ; et si le développement de stratégies de subsistance plus
durables peut effectivement contribuer à réduire la pression sur les forêts restantes, très dégradées,
dans la province de Kinshasa.
En utilisant des données récoltées par le biais d’une enquête auprès des ménages ruraux, de
réunions de ‘groupes de focus’, d’interviews semi-structurées et d’une revue documentaire, et
analysées sur base d’une combinaison d’approches quantitatives et qualitatives (analyse coûts-
avantages, statistiques descriptives, tests statistiques et une forme simplifiée d’analyse du contenu),
la recherche conclut que :
- Des activités d’agroforesterie à relativement faible valeur ajoutée peuvent contribuer à la viabilité
financière d’un projet du type ‘Ibi’, mais uniquement tant les prix du carbone forestier restent
bas.
- Des prix du carbone forestier plus élevés, qui récompenseraient également les importants
avantages sociaux et environnementaux locaux engendrés par des plantations de bois-énergie à
haute intensité de main d’œuvre, basées sur l’agroforesterie, permettraient d’améliorer leur
rentabilité (actuellement faible) et ainsi d’attirer des investissements tout en assurant la
pérennité des avantages produits.
- Des projets de ce type génèrent bien des avantages sociaux – et au travers de mécanismes liés
aux moyens et stratégies de subsistance (en plus d’une augmentation de l’offre de charbon de
bois), peuvent effectivement contribuer à alléger la pression sur les forêts naturelles restantes.
- Des politiques publiques ‘habilitantes’ sont nécessaires pour créer un contexte plus favorable au
développement des plantations de bois-énergie, et amplifier leurs effets positifs sur la protection
des forêts.
ix
Acknowledgements
A lot of people have contributed, in various ways, to the implementation and, I believe, the success
of this research project. I am grateful to all those who have dedicated some time and efforts to
supporting it, or just provided some guidance and encouragements.
I am very grateful to the staff of ERAIFT, the Unesco-funded ‘École régionale post-universitaire
d’aménagement et de gestion intégrés des forêts et territoires tropicaux’ at the University of
Kinshasa – and in particular to its director, Mr Baudouin Michel, for their outstanding logistical
support to my field missions and to the organisation of survey work. Without this support and our
good collaboration, this research project would probably not have seen the light – and its
implementation would have been much more complicated. Thank you also to Mr Michel for some
technical guidance and, years ago, for initiating me to the secrets and beauties of cost-benefit
analysis – I hope he will find that I have put this knowledge to good use.
I would also like to express my utmost gratitude to Mssrs Olivier and Thierry Mushiete, the two
brothers who manage the Novacel company and initiated the Ibi-Batéké project. They have shared
with me a lot of very useful documents and data, in the most honest and transparent way, and have
shown endless patience in answering my questions, in many successive rounds of interviews. Thank
you for the trust you have placed in me, and congratulations about the good work you have
accomplished and keep doing.
On the Novacel side, I would also like to thank all the other members of the management team who
have dedicated time to meeting me and answering my questions, in spite of a very heavy workload. I
cannot cite them all – but Mr Dany Mulabu, head of forestry (and ad interim of the cassava plant at
the time of my visits), who also took me on my first visit to Mampu and Kinzono, Mr Ruphin
Ngabulongo, head of statistics and quality assurance, Mr Delly Kayuka, head of Ibi station,
Mr Gauthier Tshikaya, financial and administrative director, and Mssrs Louison Mungu and Amouda
Ngankili, in charge of sales in Kinshasa and Ibi respectively, have been particularly supportive.
Mr Jean-Claude Steffens, not from Novacel but closely associated with the project, has also been
most helpful (and very patient) in explaining the methodology for estimating the accrual of carbon
credits.
The first concrete ideas for this research project emerged during a meeting with Prof Jean Lejoly,
coordinator of GIAgro, the research and development NGO that operates on the Ibi site and plays a
x
key role in providing social and agriculture-related services to the site’s workers and the
neighbouring communities. Prof Lejoly and other staff of GIAgro provided useful information and
technical support throughout the duration of my stays in Ibi and Kinshasa, and much appreciated
material support for the organisation of focus group meetings and survey work. Particular thanks to
Mr Tolérant Lubalega for his participation in focus group meetings, both as interpreter and facilitator
– and for motor-crossing me to Mampu and the CADIM site; without his help, I could not have
achieved what I did during my second field mission. Ms Philomène Misinga gave good support to the
organisation of focus groups in Ibi. And I thank Mr Gauthier Tshikaya, this time in his capacity of
GIAgro treasurer, for his patient support to some administrative aspects of survey work.
My sincere thanks also go to Mssrs Emmanuel Mvula, Max Mfumundala and Ruffin Nsielolo for their
good work in relation to the surveys. Thanks in particular to Mr Mvula for introducing me to the
customary authorities in Mutiene, and for accompanying me on a memorable visit to the Kikodi
charcoal market; and to Mr Mfumundala for facilitating survey work in Kinzono, and then
implementing it with remarkable dedication, notably during his holiday time.
Mrs Jolien Schure (CIFOR), and Mssrs Emilien Dubiez and Pierre Proces (CIRAD) from the EU-funded
Makala Project have, each in their own way, supported this work, by providing useful tips and a few
very relevant documents at crucial steps during the research process; I appreciated their friendliness,
and I am looking forward to seeing future publications on their own work. Thanks also to
Mssrs Franck Bisiaux and Dieudonné Batababudi (Hanns Seidel Foundation), and Mssrs Enselme
Nsueya and Jean-Pierre Katalay (respectively former and new chairman of the Mampu Farmers’
Union), for approving and supporting survey work in Mampu; and to Ms Carine Luzala from CADIM,
who was most helpful and effective in setting up the Mbankana focus group meetings.
I thank Mr Nkoba, director of CADIM; Mssrs Jean-Pierre Katalay and Laurent Kisandzau, chairman and
first secretary from the Mampu Farmers’ Union; Mr Dominique Bauwens and Dr Clément Vangu
Lutete, from the FAO’s Kinshasa office; Hon. Ngaliema Milanda, customary chief of Mutiene, Mr
Ernest Kaluama, his assistant, and Mr Médard Milanda, his son; Mssrs Gustave Kabuya, Minkondo
Ndzingi and Miakanda Nsilu, met on the Kikodi charcoal market; for accepting to meet me and
dedicating time to answering my questions.
I will not name here all the other people met during my stay in Ibi Village and Kinshasa, or on the
occasion of ‘Ibi Task Force’ meetings in Brussels, but many of them provided support in the form of
useful information, some technical advice, explanations on specific aspects of my research, and also
xi
encouragements and friendship; this also helped me a lot, and I hope they will recognise themselves
in this sentence.
Last but definitely not least, I would like to express my gratitude to the academic staff who helped
me successfully complete this research work. Prof Iain Fraser of the School of Economics, University
of Kent, was the best supervisor a student can dream of; I particularly appreciated the way he
promptly replied to my questions and messages, often late in the evening; the precision of his
answers and advice; and the positive feedback and encouragements he gave me throughout the
research process. Many thanks also to Dr Rebecca Kent of CeDEP, SOAS, who provided clear and
precise answers to my many questions over the past two years, and generally gives outstanding
support to the group of exhausted distance-learning students who make it to the final stage of the
MSc journey.
1
1. Introduction
1.1. Background and justification
The Ibi-Batéké carbon sink project, located 140 km east of Kinshasa, is an afforestation project
registered under the Kyoto Protocol’s Clean Development Mechanism (CDM) – the first of its kind in
Africa (Novacel 2010).
It was conceived as a comprehensive agroforestry project involving the development of a plantation
forest on a vast degraded savannah plateau, combined with the cultivation of cassava. The project’s
initial objective is to develop 4,200 ha over five years; tree planting started in 2008.
Acacia1 is the plantation’s dominant tree species. An initially short but gradually lengthening rotation
schedule (5 to 18+ years) is planned. The current plan is to convert the harvested acacia biomass into
charcoal for the Kinshasa market, with other, longer-rotation species used for timber. This, combined
with the agricultural production associated with afforestation and re-planting, provides income for
the project and employment opportunities for the local population. This development is expected to
alleviate the pressure on the few remaining river margin forests in the region, where charcoal making
associated with traditional slash-and-burn agriculture is still the dominant subsistence model.
The government of the Democratic Republic of Congo (DRC) supports the optimisation of woodfuel
supply chains and the development of woodfuel plantations, notably in the context of the
preparation of the national REDD+ strategy (DRC 2010). It is also keen to attract private investment in
this sector. However, the long-term financial sustainability of the proposed model, i.e. a medium-
sized plantation relying on private initiative (rather than development assistance), has not so far
been investigated in much detail. Furthermore, the link between woodfuel plantation development
and forest degradation reversal in woodfuel supply basins is usually taken for granted, but may be
less direct or obvious than expected. Two issues deserve specific attention:
- whether agroforestry activities conducted under socially and environmentally sustainable
conditions at the scale of several thousand hectares can generate profits and contribute to the
overall financial sustainability of ‘carbon sink cum woodfuel plantation’ projects;
1Some plots are also planted with eucalyptus, pine and native species.
2
- whether the proposed agroforestry model is attractive enough for local populations, and has a
sufficient ‘critical mass’, to induce a switch from environmentally damaging subsistence strategies
to more sustainable rural livelihoods.
This research investigates these aspects through the specific case of the Ibi-Batéké project – also
using the experience of another woodfuel plantation on the Batéké plateau, the neighbouring
Mampu plantation, in particular where this is useful for understanding socioeconomic and livelihood
issues.
1.2. Research objectives and questions
The research focuses on the agroforestry component of the Ibi-Batéké model (with additional
reference to the Mampu model for socioeconomic aspects), and the contribution it makes to various
aspects of sustainability.
The first objective is to determine whether cassava, charcoal and timber sustainably produced as an
integral part of an ‘Ibi-like’ project have a chance of being competitive in the Kinshasa market – and
thus of contributing to its financial sustainability. The second objective is to determine the extent to
which the chosen agroforestry model can support the development of sustainable rural livelihoods,
and thereby contribute to reducing forest degradation in Kinshasa province in other ways than just
by increasing charcoal supply.
To meet these objectives, the research addresses the following questions:
1) Can the production of cassava, charcoal and timber under sustainable conditions generate profits
and thus contribute to the financial sustainability of an ‘Ibi-like’ project?
2) Can agroforestry activities in woodfuel plantations generate and sustain socioeconomic benefits,
in particular in terms of improved livelihoods?
3) Can the development of alternative, sustainable livelihoods around woodfuel plantations actually
alleviate pressure on the remaining, much degraded natural forests in Kinshasa province?
3
2. Literature review
2.1. Forest resources in DRC
The DRC has a forest area of 1,555,000 km², covering two-thirds of its territory (Eba’a Atyi and Bayol,
2009). Timber and non-timber forest products make a significant contribution to the livelihoods of
the population, mostly in the subsistence and informal sectors. The population, both rural and urban,
uses forest products as a source of food, domestic energy (firewood, charcoal), materials for
construction, tools, arts and crafts, and care products (Ndoye et al, 2007; Aveling, 2009; Eba’a Atyi
and Bayol, 2009). It also uses forest land as a land reserve for agricultural expansion. In addition,
forests provide important environmental services that generate a variety of benefits and
opportunities at the local, regional and global levels (Lescuyer et al, 2009).
2.2. Deforestation and forest degradation
By the standards of other tropical forest regions, the deforestation rate in the Congo Basin and DRC
has been quite moderate over the past decades (Eba’a Atyi et al, 2009). Nevertheless, forest
degradation and deforestation are significant in some regions, particularly those surrounding
Kinshasa and other large cities (Eba’a Atyi and Bayol, 2009).
The causes of deforestation and forest degradation are multiple, involving a mix of ‘proximate’
drivers (infrastructure development, agricultural expansion, wood extraction, ...) and underlying
drivers (demographic, economic, technological, policy-related, institutional and cultural factors)
characterised by complex interactions (Geist and Lambin, 2001). The dominant deforestation pattern
around Kinshasa and other large Congolese cities is one of ‘family farming/firewood conjunction’
(DRC, 2010). It is characterised by the concentration around urban areas of extensive farming
activities based on slash-and-burn practices, used to clear land and in the process also to produce
charcoal. As a result of demographic growth and increasing demand for energy, fallow periods are
getting shorter, which hinders forest regeneration and degrades soils (Aveling, 2009; Marien, 2009a;
DRC, 2010).
4
2.3. Wood energy’s contribution to forest degradation
There have been many discussions and controversies, since the 1970s, over the existence of a
‘woodfuel gap’ or ‘woodfuel crisis’, with some predicting that demand outpacing supply would lead
to severe shortages and the deforestation of much of Africa by the end of the 20th century; and
others noting that, for a variety of reasons, in the aggregate this has not happened (Dewees, 1989;
Girard, 2002; Arnold et al, 2003; Clancy, 2008; Trefon et al, 2010). Woodfuel collection often takes
place on peri-urban land cleared for agriculture, so that it is not usually the primary driver of
deforestation or insufficient forest regeneration (Dewees, 1989; Arnold et al, 2003). It is clear,
however, that local problems exist and require attention (Arnold et al, 2003 and 2006), and that the
rapid growth of charcoal production around large African cities is a cause of environmental
degradation as well as socioeconomic problems (Schure et al, 2010).
Currently, up to 90% of the wood material extracted from Central Africa’s forests is woodfuel
(Marien, 2009a; FAO, 2010). In DRC, annual volumes produced are estimated at 500,000 m³ for the
formal timber sector, 5,000,000 m³ for the informal timber sector and 50,000,000 m³ for wood
energy (Marien, 2009a); woodfuel is estimated to account for 92% of the country’s total energy
consumption (Schure et al, 2010; Trefon et al, 2010, citing Mbala, 2007). Woodfuel extraction is thus
a much bigger threat to forests than logging – especially in the supply basin of large cities.
Power generation and supply infrastructure in DRC is dramatically underdeveloped. Only 5% of the
population is estimated to have access to electricity, in spite of the huge theoretical hydropower
potential (Brummett et al, 2009; Marien, 2009a) – so the vast majority of households use woodfuels
(primarily fuelwood in rural areas and charcoal in urban ones) to meet domestic energy needs
(Schure et al, 2010; Trefon et al, 2010). Power supply development and rising incomes should
ultimately modify these patterns, but moving along the ‘energy ladder’ may take decades: charcoal is
the ‘transition fuel’ of choice in urban areas – and urban poverty is a brake on switching from
biomass fuels to modern fuels (Arnold et al, 2006; Drigo and Salbitano, 2008).
Demand in fast-growing urban areas far exceeds the sustainable supply capacity of peri-urban
forests. Wood energy supply for the 8–10 million inhabitants of Kinshasa is estimated at 4.7 million
m³ per year, including the wood needed for producing 490,000 tonnes of charcoal (Projet Makala,
2011). Large deforestation rings have formed around the city; the gallery (riverine) forests typical of
the region have disappeared within a radius of 50 km, and the remaining forests are severely
degraded within a radius of 200 km (Marien, 2009a; Trefon et al, 2010). Poverty and the lack of
5
employment opportunities drive uncontrolled harvesting, and most supplies originate from informal
supply chains – an obstacle to sustainable resource management (Marien, 2009a; Schure et al, 2010;
Trefon et al, 2010).
2.4. Making woodfuel supply more sustainable
Banning woodfuels is not an appropriate response: power supply cannot meet all needs; fossil fuel-
based alternatives may be unavailable or unaffordable for most households, and are ecologically
questionable. Given the large number of rural and urban people involved in woodfuel supply chains
and the lack of alternative income opportunities, a ban would also have significant adverse
socioeconomic impacts. A better alternative is to adopt an integrated supply chain approach, making
woodfuel supply more sustainable while promoting more efficient use and sustainable fuel switching
on the demand side (Girard, 2002; Arnold et al, 2003; Clancy, 2008; Ducenne, 2009; World Bank,
2009; Schure et al, 2010; Trefon et al, 2010).
Improved efficiency in charcoal production (through the use of improved equipment and techniques)
and charcoal use (improved stoves) can indeed be part of the solution. However, the development of
sustainably managed woodfuel plantations is considered an inescapable part of the solution
(Ducenne, 2009; Marien, 2009a; Schure et al, 2010; Trefon et al, 2010). Pilot projects in the DRC’s
‘REDD-readiness plan’ comprise the development of such plantations on savannah land in the
relative proximity of urban centres; they are expected to build up permanent carbon sinks while
simultaneously reducing pressure on remaining natural forests through the supply of sustainably
produced woodfuels (Kasulu Seya et al, 2009; Lescuyer et al, 2009; DRC, 2010).
2.5. Impact of woodfuel plantations on forest protection: a livelihoods approach
Sustainably produced woodfuels are thus expected to substitute unsustainably extracted fuels – at
least if a certain scale can be achieved (Ducenne, 2009). Nevertheless, the mechanisms through
which this substitution could take place seem to be under-researched.
Considering the significant contribution of woodfuel trade to the livelihoods of the poor (Arnold et al,
2003 and 2006; Schure et al, 2010), we argue that the capacity of plantation projects to reduce
pressure on natural forests depends in part on their socioeconomic impacts – in particular their
impacts on livelihood strategies. As noted in World Bank (2009:18):
6
‘Plantations have to provide direct pecuniary benefits to rural households in order to divert
pressures from natural forests. One of the main reasons for rural households to engage in
unsustainable charcoal production is their need for cash, which is almost exclusively
provided by the charcoal business’.
In the absence of alternative livelihood opportunities, the availability of sustainably produced
woodfuels is unlikely to modify the behaviour of rural producers. The contribution of plantation
projects to sustainable livelihoods should thus be considered.
A livelihood:
‘comprises the capabilities, assets (including both material and social resources) and
activities required for a means of living. A livelihood is sustainable when it can cope with
and recover from stresses and shocks and maintain or enhance its capabilities and assets
both now and in the future, while not undermining the natural resource base’ (DFID,
1999a:1).
The sustainable livelihoods framework (SLF) developed by DFID (1999b) provides a conceptual
framework from which to assess the developmental effects of an intervention (Landry, 2009). It
considers that livelihood strategies, and the resulting outcomes (including more sustainable use of
natural resources), are determined by:
- the vulnerability context in which individuals operate;
- the livelihood assets to which they have access, including human, natural, financial, physical and
social capital;
- and the prevailing institutional structures and processes.
Smith et al (2005) adapted the SLF to develop a framework for understanding the determinants of
livelihood outcomes in inland fisheries – a resource sharing characteristics (common property
resource, often de facto open access, renewable but exhaustible resource) with forest resources. The
authors identified four livelihood strategies that, although related to fishing, mutatis mutandis seem
relevant to the exploitation of woodfuel:
- Survival: resource exploitation as a last-resort activity, for subsistence purposes.

7
- Semi-subsistence diversification: resource exploitation for own consumption, but also (while
exploiting complementarities with farming in labour use) for occasional cash, labour and
consumption ‘smoothing’, and risk reduction.
- Specialisation: resource exploitation for market production and income, and for accumulating
assets. This strategy typically requires investment in equipment, social capital (marketing
networks, resource management institutions) and skills and knowledge.
- Diversification for accumulation: resource exploitation primarily for accumulating assets, as part
of a diversified ‘portfolio’ of income-generating activities, and accounting for a declining share of
total income.
A key question is whether livelihood diversification strategies that include charcoal production reflect
worsening impoverishment (diversification involving activities that offer lower returns to labour than
farming, adopted as an involuntary coping strategy in reaction to adversity), or increasing prosperity
(diversification involving activities that offer higher returns to labour than farming, adopted as
rational risk management strategies that also support asset accumulation) (Ellis, 1998; Bryceson,
2002; Smith, 2004).
The ease of access to the woodfuel resource, and low barriers to entry to the woodfuel trade, turn
woodfuel harvesting and selling into activities mainly engaged in by the very poor, often leading to
strong competition and very low returns (Arnold et al, 2003). This can make woodfuel production an
activity of last resort, not conducive to the successful type of livelihood diversification. On the other
hand, according to Trefon et al (2010), professional charcoal makers in the Kinshasa supply basin
tend to have higher-than-average income. Whether specialisation strategies built around charcoal
production may be more successful than diversification strategies, and how such strategies can
evolve with the development of woodfuel plantations, should be investigated.
2.6. Financial sustainability
Capacity to generate sustainable socioeconomic and environmental benefits also depends on the
financial viability of the implemented plantation model. Marien (2009a) considers private woodfuel
plantations in peri-urban areas to be in principle profitable and competitive if compared with other
land uses – but there are nevertheless concerns about competition from poor suppliers, operating in
the informal sector with very low returns and exerting strong downward pressure on prices (Arnold
et al, 2003; World Bank, 2009). Dewees (1989) also questions the competitiveness of sustainably
8
produced woodfuel vis-à-vis the non-sustainable type, in the absence of absolute physical scarcity or
market intervention.
Smith and Scherr (2003), in a study of the livelihood benefits and risks of six types of forest carbon
projects, highlight the existence of tradeoffs between the social benefits they generate and their
cost-effectiveness. Livelihood-enhancing projects, in particular agroforestry systems and community
plantations, tend to exhibit higher production costs than industrial-type plantations or strict forest
conservation, which puts them at a disadvantage in carbon markets.
The Ibi-Batéké plantation, although privately promoted and managed, is based on sustainable
development principles, with a strong focus on generating benefits for local communities. Carbon
finance alone cannot sustain it – especially as the emission reductions produced by
afforestation/reforestation projects are considered temporary, and therefore fetch lower prices than
other carbon credits (Gardette and Locatelli, 2007). It thus makes sense to investigate whether
agroforestry activities can make a positive contribution to its financial viability, while generating the
bulk of the anticipated socioeconomic and environmental benefits.
Based on the above, a conceptual framework (available in Annex I) was designed as a guiding thread
to the proposed research.
3. Methods
This research is based on a case study combined with a survey strategy. It uses a mix of quantitative
and qualitative methods. Qualitative data are especially useful to interpret survey results.
3.1. Data collection
Data collection was organised around a ‘data collection and analysis framework’ presented in
Annex II. Data were collected using the following techniques:
- Review of documents published, studies undertaken and data collected in relation to the Ibi-
Batéké project.
9
- Review of documents published and studies undertaken in the context of other research and/or
development projects, in particular the Mampu project and the ongoing EC-funded Makala
Project.
- Semi-structured interviews with key informants, including project insiders and outsiders,
representing various stakeholder groups. Overall, twenty key informants were interviewed. Useful
insights were also collected during more informal conversations with twenty additional
interlocutors, and during visits to two Kinshasa markets (Marché de la Liberté and Kikodi charcoal
market). A list of key informants and other people met is provided in Annex III. Interview guides
were built for each interlocutor by extracting topics to be discussed from the framework
presented in Annex II.
- Focus groups involving representatives of rural households established on the ‘Ibi domain’ (Ibi
plantation and surrounding area) and in the neighbouring rural town Mbankana; separate groups
were organised for men and women, to support better representation of women’s viewpoints.
- A formal survey, conducted in four locations: Ibi, Mampu, Mutiene (village located 30 km from Ibi,
on the main road to Kinshasa) and Kinzono (village located close to Mampu, on the Mampu track).
120 rural households were randomly sampled (30 in each location). The survey was based on a
questionnaire (see Annex IV) comprising six sections: on human capital, physical capital, natural
capital (focused on access to land), means of subsistence in general, use of natural resources, and
relations with/perception of woodfuel plantations.
All this was complemented by a review of the literature focused on variables/themes of interest.
The documentary review and semi-structured interviews primarily supported the collection of data
for formulating assumptions for the financial analysis and answering the first research question.
Focus groups and the formal survey primarily supported the collection of data for answering the
second and third research questions. Further details on methods are available in Annex V.
The initial review of project-related documents and the scientific literature was undertaken between
November 2010 and January 2011. An 12-day preparatory field mission (to Kinshasa and Ibi
plantation) was conducted in February 2011 to support the finalisation of the research proposal. A
second field mission, for data collection, took place between mid-March and mid-April 2011. Survey
work was undertaken between April and August 2011. Data processing/analysis and drafting work
were undertaken from Belgium.
10
3.2. Data analysis
Financial cost-benefit analysis (CBA) provides the backbone for data analysis and the presentation of
results in relation to the first research question. This classical tool has notably been used to assess
the profitability of charcoal production (Luoga et al, 2000), of various types of plantation models
(Muhammed et al, 2008), and of the Mampu agroforestry model (Ducenne, 2009).
Rather than focusing specifically on the Ibi-Batéké project (which officially started in 2008, but builds
on infrastructure and experience developed over two generations by the owning family), it was
decided to undertake CBA for a hypothetical ‘Ibi-like’ project sharing some features with the Ibi
project (notably in terms of location, a significant determinant of costs/revenues), starting from
scratch in the conditions prevailing in 2011. This helps avoid the distortions that would result from
ignoring past investment. A more ‘universal’ scenario also makes the exercise more relevant from a
policy development viewpoint.
A scenario ‘with agroforestry activities’ was developed and compared with a scenario ‘without’, i.e. a
‘passive carbon sink’ without exploitation of forest resources during the CDM crediting period. This is
rather theoretical, but serves the purpose of highlighting the contribution of agroforestry activities to
financial sustainability. Differences in estimated revenues and costs between the two scenarios, and
the resulting difference in net cashflow, were calculated on a yearly basis. A model for producing
cashflow tables based on given cost and revenue assumptions was built in an Excel spreadsheet; it
supports the calculation of financial indicators and the simulation of the impact of changes in
assumptions.
CBA was conducted for a period of 30 years, corresponding with the duration of the CDM crediting
period. It was conducted in constant (2011) US dollars.
Financial analysis results are presented using three classical indicators:
- the payback period, i.e. the time it takes for the initial expenditures to be recovered;
- the net present value (NPV), i.e. the difference between discounted revenues and discounted
costs; a positive NPV indicates a project generates net benefits over the considered period at the
chosen discount rate;
- the internal rate of return (IRR), which measures profitability in relative terms and should ideally
be greater than the opportunity cost of capital (European Commission, 1997).
11
Sensitivity analysis was undertaken to test the effect of some changes in assumptions on the NPV
and IRR. These financial indicators help answer the first research question.
For answering the second and third research questions, a combination of qualitative and quantitative
approaches was used. Data collected by means of documentary and literature reviews, semi-
structured interviews and focus group meetings were analysed using qualitative methods, more
specifically a ‘basic’ form of content analysis: they were systematically coded using codes
corresponding to topics/variables, as organised in the developed data collection/analysis framework
(see Annex II). This facilitated cross-checking and the identification of similarities/differences across
sources.
Quantitative analysis was applied to survey data, using descriptive statistics and statistical tests.
Before analysis, data were verified, validated (on the basis of consistency checks and plausibility),
and entered into an SPSS file. A household education index, household wealth index, livelihood
diversification index and agricultural diversification index were calculated (see Annex VII for details).
Statistical tests aimed at testing the existence of relationships between variables were carried out
using SPSS 15.0 software. Three types of variables were used in these tests:
- Variables reflecting ‘exposure’ to woodfuel plantations, in particular location (within or outside a
plantation domain), and plantation-related employment.
- Socioeconomic variables: household education and wealth, means of subsistence, access to land,
livelihood and agricultural diversification.
- Variables related to natural resource exploitation: type of agriculture practised, involvement in
charcoal production, origin of trees for charcoal production.
Considering that most survey variables are categorical ones, a non-parametric test, the chi-square
test for relatedness or independence was used. Non-parametric tests are less powerful and less
informative than parametric ones, but offer several advantages, including the possibility of applying
tests to categorical variables and to variables that depart from a normal distribution (frequent in the
dataset) (CeDEP 2010).
Test results, combined with qualitative information, are used to provide answers to the second and
third research questions.
12
3.3. Constraints and limitations
Due to limitations in the availability of time and information, and the need to avoid excessive
complexity, the financial analysis does not include the following elements:
- Fire risk: all calculations were made on the basis of a ‘no fire’ assumption, which is not very
realistic. Provisions were made for firebreak maintenance and plantation patrolling, but not for
wildfire-related revenue losses and extra costs.2
- Residual values: increases in land value as a result of afforestation and soil restoration are not
reflected in the analysis; in the agroforestry scenario, the average age of tree stands at the end of
30 years is lower – but a large amount of infrastructure is in place, and a lot of experience has
accrued on how to run a large-scale plantation; this should more than offset the lower value of
standing trees, compared with the ‘passive carbon sink’ scenario.
- Taxes, apart from a small ‘flat-rate’ annual provision.
Due to limitations in budget resources and the duration of the field missions, and lack of previous
experience, there are some flaws in survey work. In particular:
- The ‘Ibi domain’ encompasses two socioeconomically very different populations – those living on
and outside the plantation. Rather than drawing a single sample on this site, two distinct samples
of 20-30 households should have been drawn/surveyed.
- There is evidence of enumerator bias with regard to some questions. It was in part corrected
through requests for clarification and complementary survey work, taking care not to introduce
researcher-induced bias in the process. However, part of the bias could have been avoided by: (i)
thoroughly field-testing the questionnaire (plans for this were hampered by financial, logistical
and time constraints); (ii) dedicating two days, rather than one, to enumerator training; (iii)
providing enumerators with a Lingala translation of the questionnaire.
- With hindsight, a few questions in the questionnaire could have been better formulated, and
some questions not directly relevant to the research could have been omitted, thus reducing
respondent/enumerator fatigue towards the end of interviews.
2The alternated cultivation of plants such as cassava and stylosanthes (a legume) in firebreaks can both
significantly reduce fire risk and generate extra profits. This is not included in our scenario, but can be a goodway of reducing fire risk.
13
In spite of these problems, survey data appear to be overall reliable and robust enough to support
statistical testing and conclusion drawing.
4. Results
4.1. Financial analysis
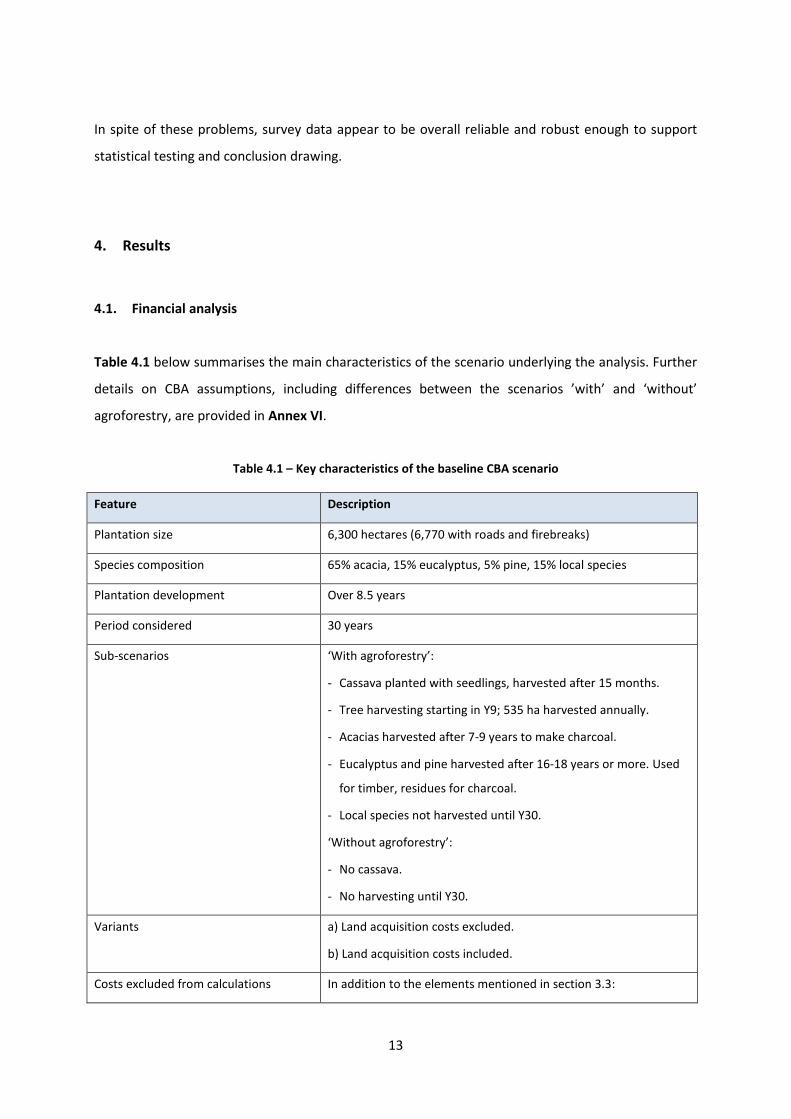
Table 4.1 below summarises the main characteristics of the scenario underlying the analysis. Further
details on CBA assumptions, including differences between the scenarios ’with’ and ‘without’
agroforestry, are provided in Annex VI.
Table 4.1 – Key characteristics of the baseline CBA scenario
Feature Description
Plantation size 6,300 hectares (6,770 with roads and firebreaks)
Species composition 65% acacia, 15% eucalyptus, 5% pine, 15% local species
Plantation development Over 8.5 years
Period considered 30 years
Sub-scenarios ‘With agroforestry’:
- Cassava planted with seedlings, harvested after 15 months.
- Tree harvesting starting in Y9; 535 ha harvested annually.
- Acacias harvested after 7-9 years to make charcoal.
- Eucalyptus and pine harvested after 16-18 years or more. Used
for timber, residues for charcoal.
- Local species not harvested until Y30.
‘Without agroforestry’:
- No cassava.
- No harvesting until Y30.
Variants a) Land acquisition costs excluded.
b) Land acquisition costs included.
Costs excluded from calculations In addition to the elements mentioned in section 3.3:
14
Feature Description
- CDM registration costs;
- pre-project research and scientific experiments;
- provision of social services (schooling, healthcare) to plantation
staff and neighbouring communities.
Source: Researcher
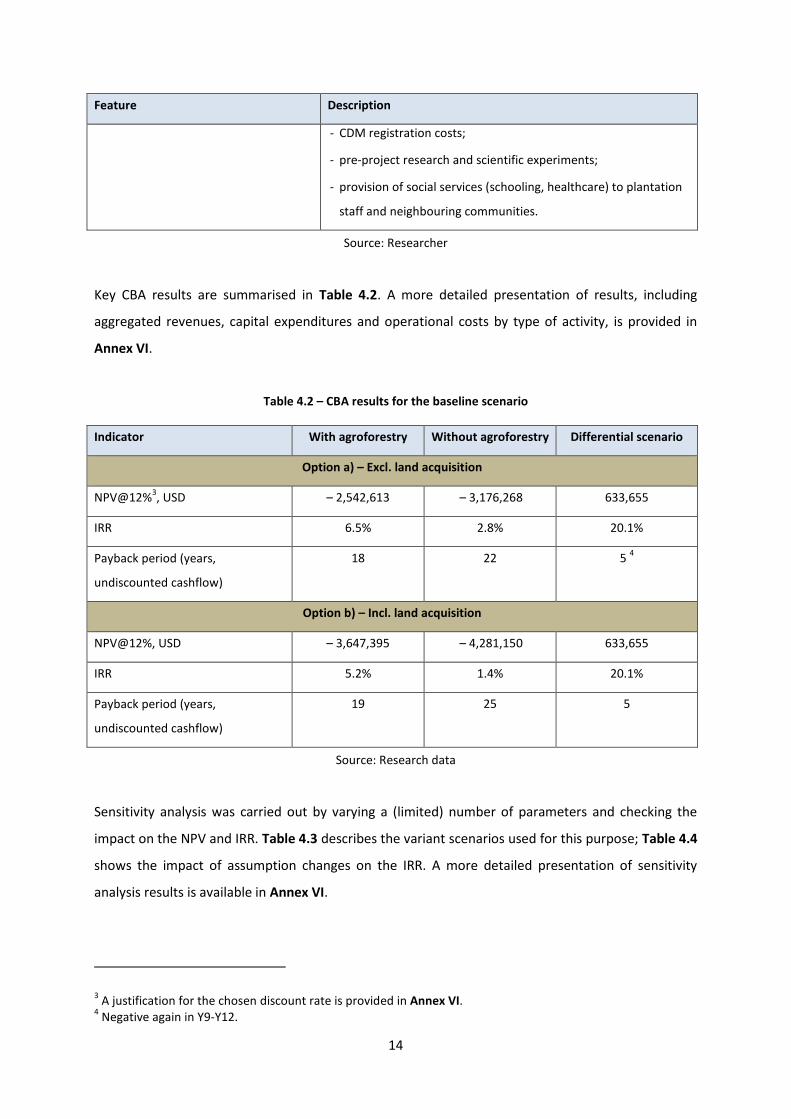
Key CBA results are summarised in Table 4.2. A more detailed presentation of results, including
aggregated revenues, capital expenditures and operational costs by type of activity, is provided in
Annex VI.
Table 4.2 – CBA results for the baseline scenario
Indicator With agroforestry Without agroforestry Differential scenario
Option a) – Excl. land acquisition
NPV@12%3, USD – 2,542,613 – 3,176,268 633,655
IRR 6.5% 2.8% 20.1%
Payback period (years,
undiscounted cashflow)
18 22 54
Option b) – Incl. land acquisition
NPV@12%, USD – 3,647,395 – 4,281,150 633,655
IRR 5.2% 1.4% 20.1%
Payback period (years,
undiscounted cashflow)
19 25 5
Source: Research data
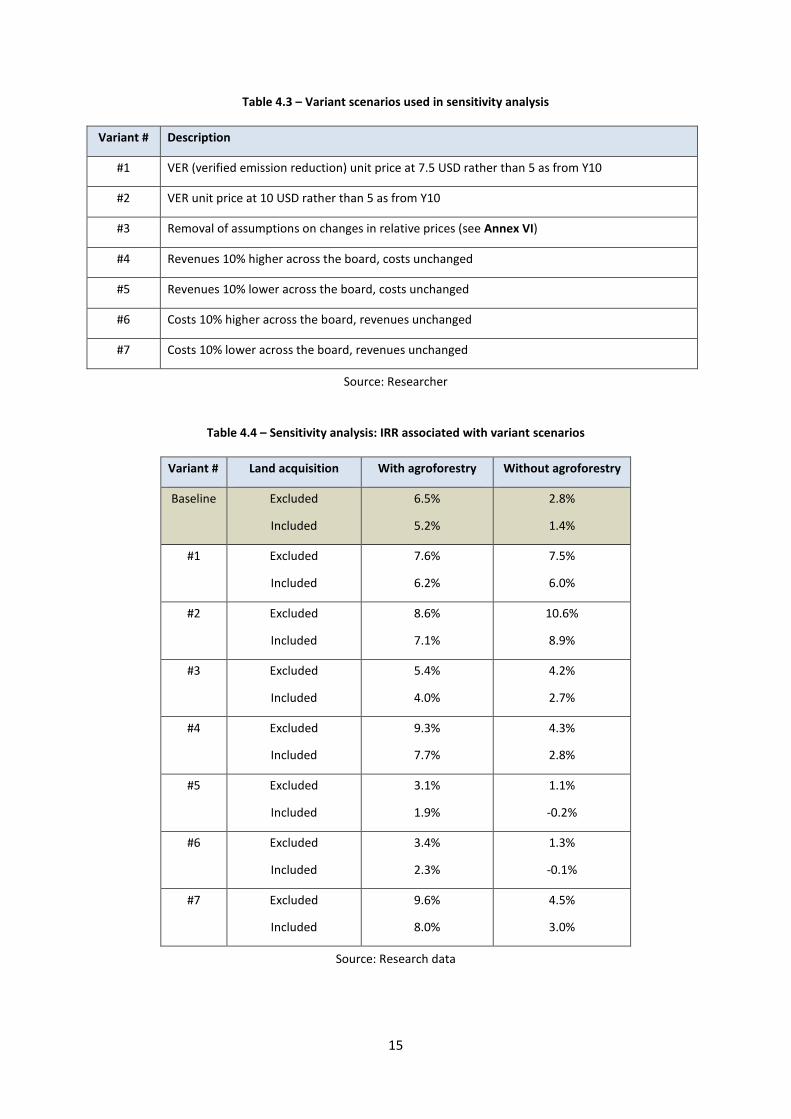
Sensitivity analysis was carried out by varying a (limited) number of parameters and checking the
impact on the NPV and IRR. Table 4.3 describes the variant scenarios used for this purpose; Table 4.4
shows the impact of assumption changes on the IRR. A more detailed presentation of sensitivity
analysis results is available in Annex VI.
3A justification for the chosen discount rate is provided in Annex VI.
4Negative again in Y9-Y12.
15
Table 4.3 – Variant scenarios used in sensitivity analysis
Variant # Description
#1 VER (verified emission reduction) unit price at 7.5 USD rather than 5 as from Y10
#2 VER unit price at 10 USD rather than 5 as from Y10
#3 Removal of assumptions on changes in relative prices (see Annex VI)
#4 Revenues 10% higher across the board, costs unchanged
#5 Revenues 10% lower across the board, costs unchanged
#6 Costs 10% higher across the board, revenues unchanged
#7 Costs 10% lower across the board, revenues unchanged
Source: Researcher
Table 4.4 – Sensitivity analysis: IRR associated with variant scenarios
Variant # Land acquisition With agroforestry Without agroforestry
Baseline Excluded
Included
6.5%
5.2%
2.8%
1.4%
#1 Excluded
Included
7.6%
6.2%
7.5%
6.0%
#2 Excluded
Included
8.6%
7.1%
10.6%
8.9%
#3 Excluded
Included
5.4%
4.0%
4.2%
2.7%
#4 Excluded
Included
9.3%
7.7%
4.3%
2.8%
#5 Excluded
Included
3.1%
1.9%
1.1%
-0.2%
#6 Excluded
Included
3.4%
2.3%
1.3%
-0.1%
#7 Excluded
Included
9.6%
8.0%
4.5%
3.0%
Source: Research data
16
The carbon price that equalises the IRR of the ‘with’ and ‘without’ agroforestry scenarios is 7.60
USD/tonne CO2e. The carbon price at which the NPV (@12%) of the agroforestry scenario becomes
positive is 20.10 USD excluding land acquisition costs, 26.60 USD including them. For the ‘passive
carbon sink’ scenario, the ‘switching value’ of carbon credits is, respectively, 11.55 and 13.80 USD.
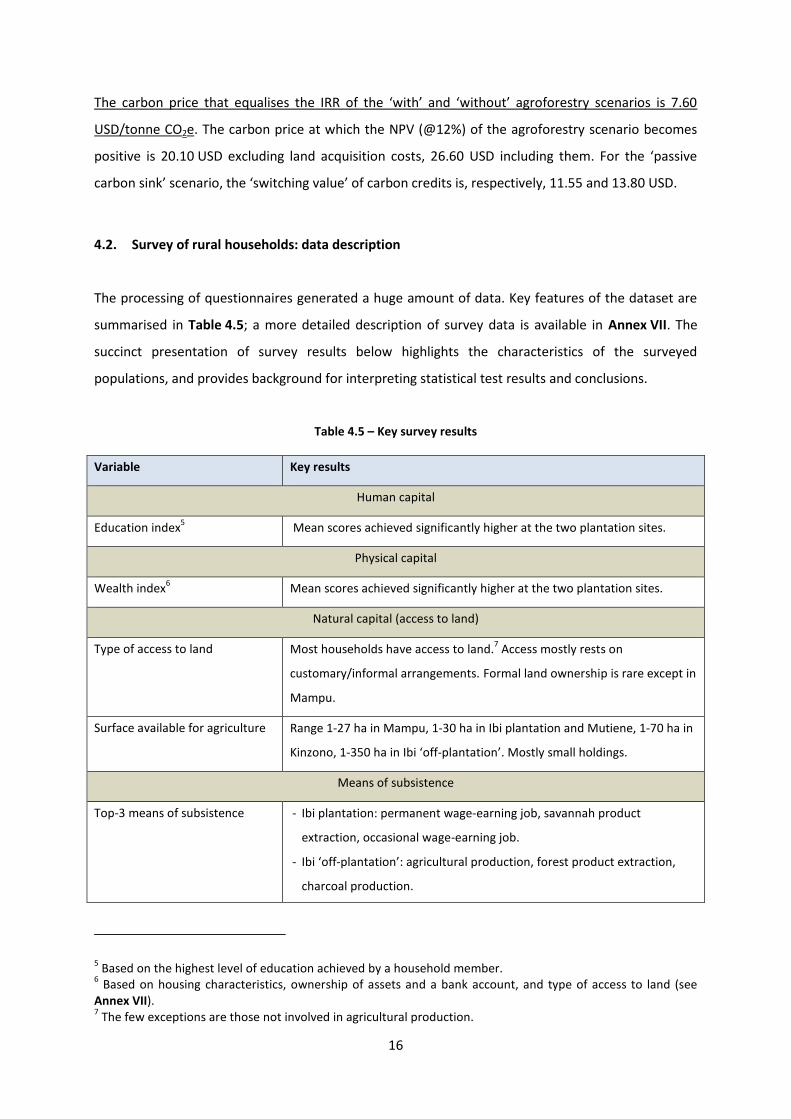
4.2. Survey of rural households: data description
The processing of questionnaires generated a huge amount of data. Key features of the dataset are
summarised in Table 4.5; a more detailed description of survey data is available in Annex VII. The
succinct presentation of survey results below highlights the characteristics of the surveyed
populations, and provides background for interpreting statistical test results and conclusions.
Table 4.5 – Key survey results
Variable Key results
Human capital
Education index5
Mean scores achieved significantly higher at the two plantation sites.
Physical capital
Wealth index6
Mean scores achieved significantly higher at the two plantation sites.
Natural capital (access to land)
Type of access to land Most households have access to land.7
Access mostly rests on
customary/informal arrangements. Formal land ownership is rare except in
Mampu.
Surface available for agriculture Range 1-27 ha in Mampu, 1-30 ha in Ibi plantation and Mutiene, 1-70 ha in
Kinzono, 1-350 ha in Ibi ‘off-plantation’. Mostly small holdings.
Means of subsistence
Top-3 means of subsistence - Ibi plantation: permanent wage-earning job, savannah product
extraction, occasional wage-earning job.
- Ibi ‘off-plantation’: agricultural production, forest product extraction,
charcoal production.
5Based on the highest level of education achieved by a household member.
6Based on housing characteristics, ownership of assets and a bank account, and type of access to land (see
Annex VII).7
The few exceptions are those not involved in agricultural production.

17
Variable Key results
- Mutiene: agricultural production, charcoal production, trade.
- Mampu: agricultural production, charcoal production, permanent wage-
earning job.
- Kinzono: agricultural production, permanent wage-earning job, charcoal
production.
Livelihood diversification index8
Range 1-7. Mean values of, respectively, 3.82, 5.06, 3.20, 3.70 and 2.53 for
the Ibi plantation, Ibi ‘off-plantation’, Mutiene, Mampu and Kinzono
samples.
Agricultural diversification index9
Range 3-9. Mean values of, respectively, 4.20, 6.24, 5.04, 5.97 and 4.47.
Use of natural resources
Sources of cooking energy Firewood followed by charcoal10
are the quasi-exclusive sources of cooking
energy across all sites.
Type of agriculture practiced Agroforestry is unsurprisingly the dominant type of agriculture in Mampu;
in Ibi, it is practised on the plantation itself but not by employees who
exploit small plots outside the carbon sink. Traditional slash-and-burn
agriculture remains dominant in Ibi ‘off-plantation’ and Mutiene; in
Kinzono, which has few forests left, most households practice fixed-plot
agriculture (but not agroforestry).
Involvement in charcoal
production
Nobody in the Ibi plantation sample produces charcoal. The majority of
Mampu respondents are involved in charcoal making, as well as all Ibi off-
plantation respondents and three-quarters of Mutiene respondents. This is
consistent with the high prevalence of agroforestry (Mampu) or traditional
slash-and-burn agriculture (Ibi ‘off-plantation’, Mutiene). In Kinzono, only
one-third of respondents make charcoal, mainly on an occasional basis.
Context of charcoal production Charcoal production is mostly linked to agriculture at all sites except
Kinzono, where carbonisation ‘for its own sake’ is the main objective for
two-thirds of respondents.
Charcoal production: origin of
trees
Natural forests followed by savannah are the dominant sources of wood
for charcoal among respondents from Ibi ‘off-plantation’ and Mutiene –
and for the smaller number of surveyed Kinzono charcoal makers. In
8Calculated as the sum of declared main means of subsistence.
9Calculated as the sum of declared agricultural productions, minus eggs and meat (which tend to be
underreported), plus one point for each type of animal bred.10
Or ex aequo with charcoal, in Mampu.
18
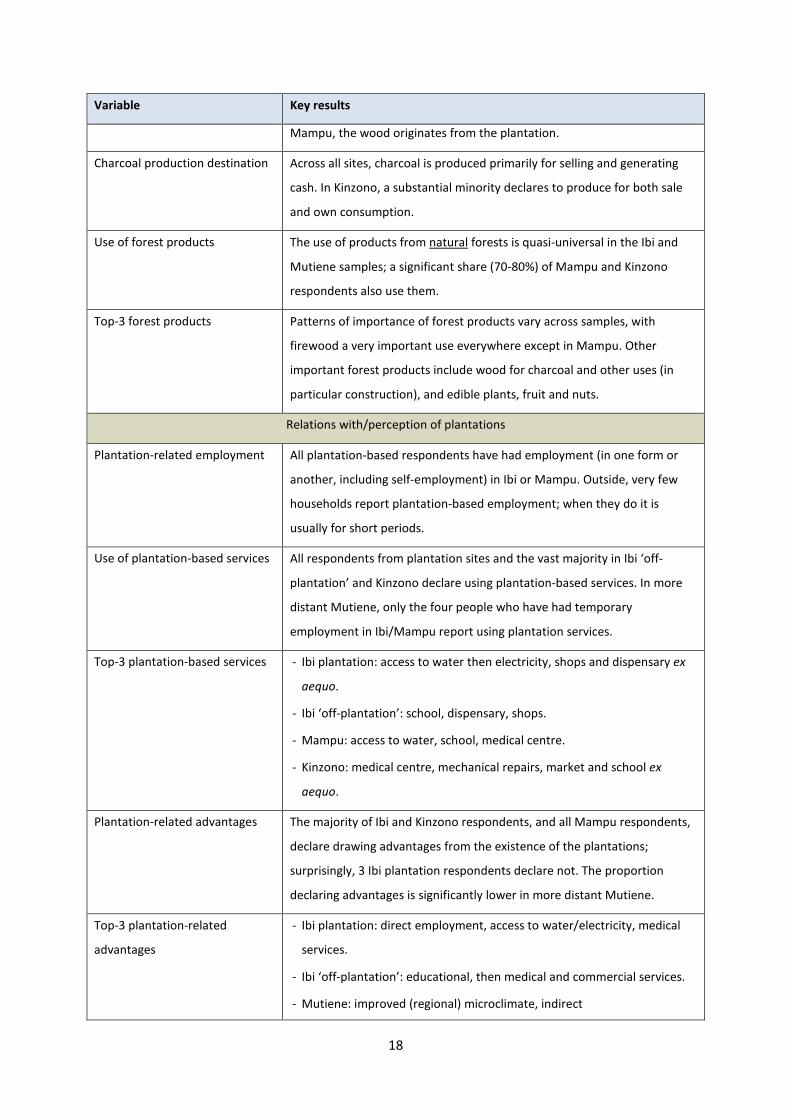
Variable Key results
Mampu, the wood originates from the plantation.
Charcoal production destination Across all sites, charcoal is produced primarily for selling and generating
cash. In Kinzono, a substantial minority declares to produce for both sale
and own consumption.
Use of forest products The use of products from natural forests is quasi-universal in the Ibi and
Mutiene samples; a significant share (70-80%) of Mampu and Kinzono
respondents also use them.
Top-3 forest products Patterns of importance of forest products vary across samples, with
firewood a very important use everywhere except in Mampu. Other
important forest products include wood for charcoal and other uses (in
particular construction), and edible plants, fruit and nuts.
Relations with/perception of plantations
Plantation-related employment All plantation-based respondents have had employment (in one form or
another, including self-employment) in Ibi or Mampu. Outside, very few
households report plantation-based employment; when they do it is
usually for short periods.
Use of plantation-based services All respondents from plantation sites and the vast majority in Ibi ‘off-
plantation’ and Kinzono declare using plantation-based services. In more
distant Mutiene, only the four people who have had temporary
employment in Ibi/Mampu report using plantation services.
Top-3 plantation-based services - Ibi plantation: access to water then electricity, shops and dispensary ex
aequo.
- Ibi ‘off-plantation’: school, dispensary, shops.
- Mampu: access to water, school, medical centre.
- Kinzono: medical centre, mechanical repairs, market and school ex
aequo.
Plantation-related advantages The majority of Ibi and Kinzono respondents, and all Mampu respondents,
declare drawing advantages from the existence of the plantations;
surprisingly, 3 Ibi plantation respondents declare not. The proportion
declaring advantages is significantly lower in more distant Mutiene.
Top-3 plantation-related
advantages
- Ibi plantation: direct employment, access to water/electricity, medical
services.
- Ibi ‘off-plantation’: educational, then medical and commercial services.
- Mutiene: improved (regional) microclimate, indirect
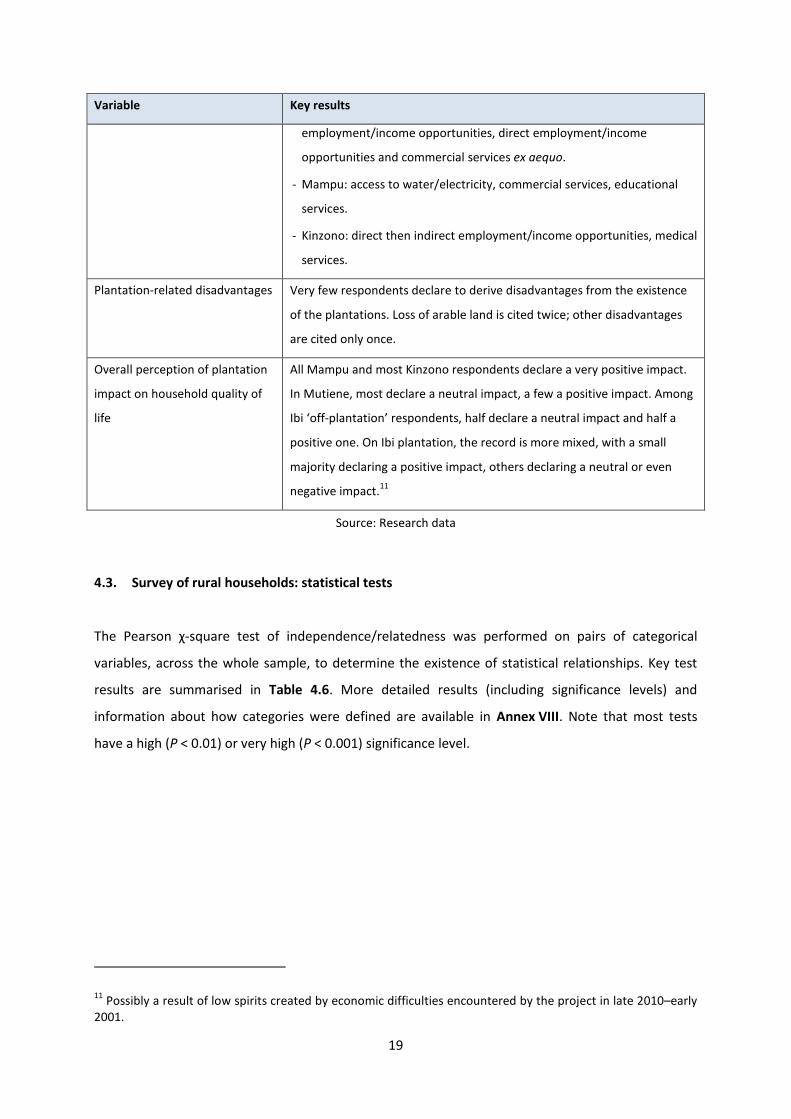
19
Variable Key results
employment/income opportunities, direct employment/income
opportunities and commercial services ex aequo.
- Mampu: access to water/electricity, commercial services, educational
services.
- Kinzono: direct then indirect employment/income opportunities, medical
services.
Plantation-related disadvantages Very few respondents declare to derive disadvantages from the existence
of the plantations. Loss of arable land is cited twice; other disadvantages
are cited only once.
Overall perception of plantation
impact on household quality of
life
All Mampu and most Kinzono respondents declare a very positive impact.
In Mutiene, most declare a neutral impact, a few a positive impact. Among
Ibi ‘off-plantation’ respondents, half declare a neutral impact and half a
positive one. On Ibi plantation, the record is more mixed, with a small
majority declaring a positive impact, others declaring a neutral or even
negative impact.11
Source: Research data
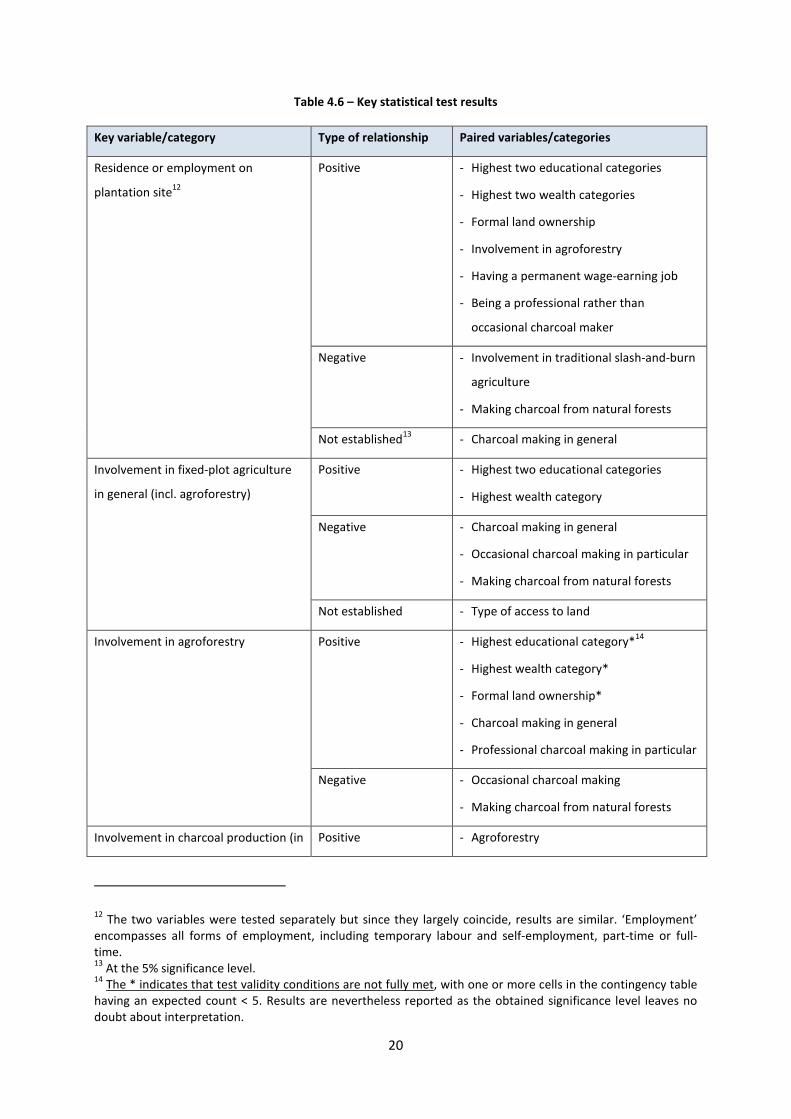
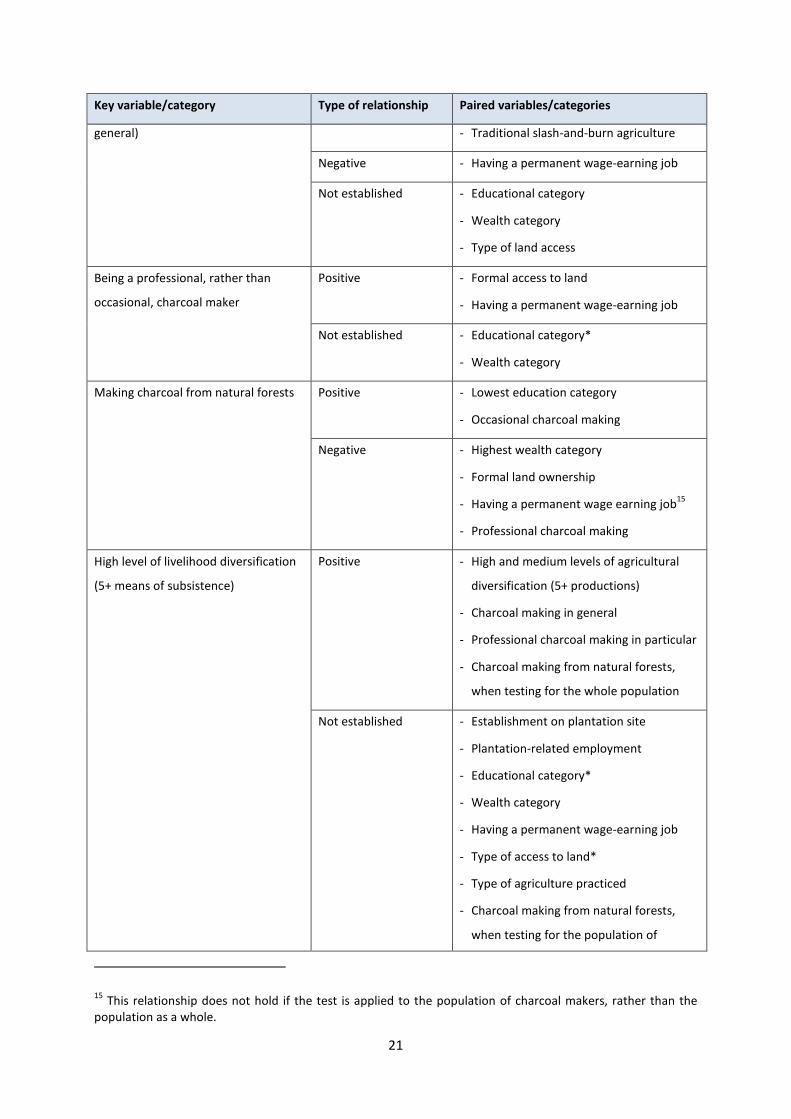
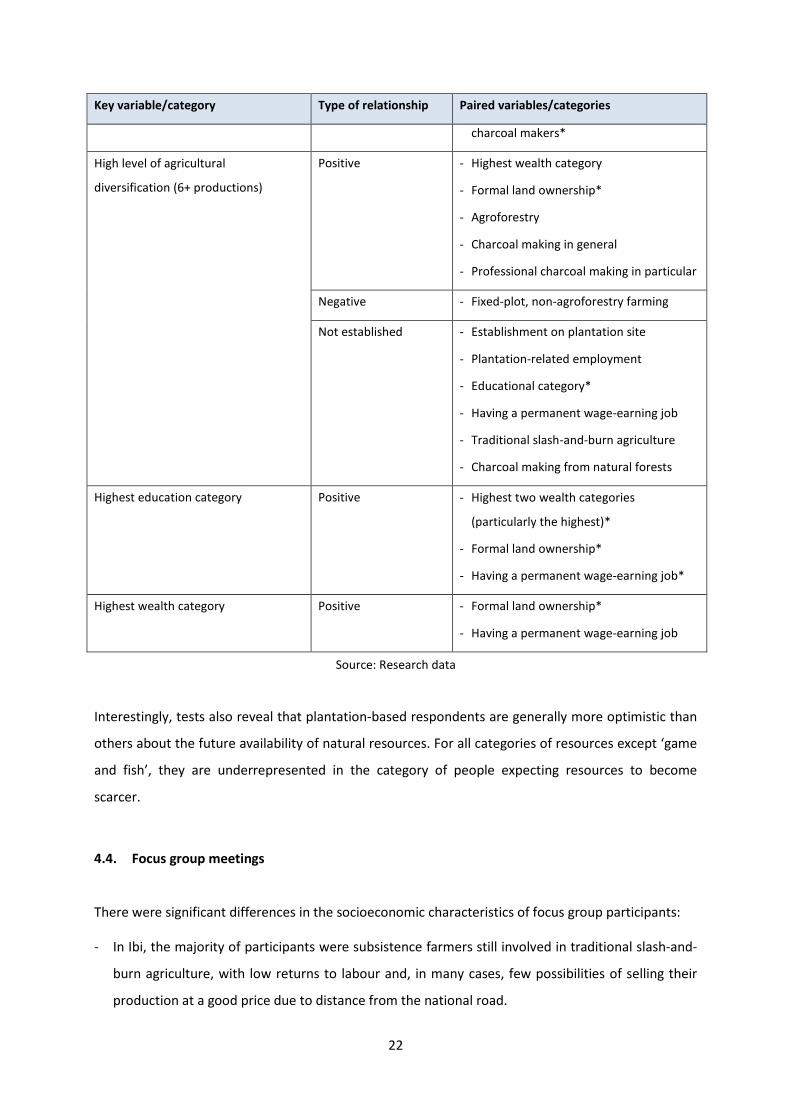
4.3. Survey of rural households: statistical tests
The Pearson χ-square test of independence/relatedness was performed on pairs of categorical
variables, across the whole sample, to determine the existence of statistical relationships. Key test
results are summarised in Table 4.6. More detailed results (including significance levels) and
information about how categories were defined are available in Annex VIII. Note that most tests
have a high (P < 0.01) or very high (P < 0.001) significance level.
11Possibly a result of low spirits created by economic difficulties encountered by the project in late 2010–early
2001.
20
Table 4.6 – Key statistical test results
Key variable/category Type of relationship Paired variables/categories
Residence or employment on
plantation site12
Positive - Highest two educational categories
- Highest two wealth categories
- Formal land ownership
- Involvement in agroforestry
- Having a permanent wage-earning job
- Being a professional rather than
occasional charcoal maker
Negative - Involvement in traditional slash-and-burn
agriculture
- Making charcoal from natural forests
Not established13
- Charcoal making in general
Involvement in fixed-plot agriculture
in general (incl. agroforestry)
Positive - Highest two educational categories
- Highest wealth category
Negative - Charcoal making in general
- Occasional charcoal making in particular
- Making charcoal from natural forests
Not established - Type of access to land
Involvement in agroforestry Positive - Highest educational category*14
- Highest wealth category*
- Formal land ownership*
- Charcoal making in general
- Professional charcoal making in particular
Negative - Occasional charcoal making
- Making charcoal from natural forests
Involvement in charcoal production (in Positive - Agroforestry
12The two variables were tested separately but since they largely coincide, results are similar. ‘Employment’
encompasses all forms of employment, including temporary labour and self-employment, part-time or full-time.13
At the 5% significance level.14
The * indicates that test validity conditions are not fully met, with one or more cells in the contingency tablehaving an expected count < 5. Results are nevertheless reported as the obtained significance level leaves nodoubt about interpretation.
21
Key variable/category Type of relationship Paired variables/categories
general) - Traditional slash-and-burn agriculture
Negative - Having a permanent wage-earning job
Not established - Educational category
- Wealth category
- Type of land access
Being a professional, rather than
occasional, charcoal maker
Positive - Formal access to land
- Having a permanent wage-earning job
Not established - Educational category*
- Wealth category
Making charcoal from natural forests Positive - Lowest education category
- Occasional charcoal making
Negative - Highest wealth category
- Formal land ownership
- Having a permanent wage earning job15
- Professional charcoal making
High level of livelihood diversification
(5+ means of subsistence)
Positive - High and medium levels of agricultural
diversification (5+ productions)
- Charcoal making in general
- Professional charcoal making in particular
- Charcoal making from natural forests,
when testing for the whole population
Not established - Establishment on plantation site
- Plantation-related employment
- Educational category*
- Wealth category
- Having a permanent wage-earning job
- Type of access to land*
- Type of agriculture practiced
- Charcoal making from natural forests,
when testing for the population of
15This relationship does not hold if the test is applied to the population of charcoal makers, rather than the
population as a whole.
22
Key variable/category Type of relationship Paired variables/categories
charcoal makers*
High level of agricultural
diversification (6+ productions)
Positive - Highest wealth category
- Formal land ownership*
- Agroforestry
- Charcoal making in general
- Professional charcoal making in particular
Negative - Fixed-plot, non-agroforestry farming
Not established - Establishment on plantation site
- Plantation-related employment
- Educational category*
- Having a permanent wage-earning job
- Traditional slash-and-burn agriculture
- Charcoal making from natural forests
Highest education category Positive - Highest two wealth categories
(particularly the highest)*
- Formal land ownership*
- Having a permanent wage-earning job*
Highest wealth category Positive - Formal land ownership*
- Having a permanent wage-earning job
Source: Research data
Interestingly, tests also reveal that plantation-based respondents are generally more optimistic than
others about the future availability of natural resources. For all categories of resources except ‘game
and fish’, they are underrepresented in the category of people expecting resources to become
scarcer.
4.4. Focus group meetings
There were significant differences in the socioeconomic characteristics of focus group participants:
- In Ibi, the majority of participants were subsistence farmers still involved in traditional slash-and-
burn agriculture, with low returns to labour and, in many cases, few possibilities of selling their
production at a good price due to distance from the national road.
23
- In Mbankana, by contrast, the majority of participants were associated with the activities of
CADIM, the local development agency. They were involved in higher-value integrated agricultural
practices (integrated livestock and crops, agroforestry, agrosylvopastoral activities, integrated
aquaculture/agriculture); many of them also had a formal job, and their education level was
higher. The town’s location on the main road to Kinshasa offers better marketing opportunities.
Here are some highlights from the discussions:
- On livelihoods: agriculture remains the main means of subsistence for the vast majority. Charcoal
making is a by-product of farming; it is hard and unrewarding work, practiced only because it
generates cash income (unlike agricultural produce which is first consumed and sold only for the
surplus, the quasi totality of charcoal produced is sold). Rural incomes are not increasing, for a
variety of reasons. Kinshasa is the main outlet for local production – but high transport costs keep
prices down for rural producers. The rehabilitation of the national road is nevertheless a good
thing for the local economy – and income opportunities associated with agriculture are attracting
new settlers originating from Kinshasa. In the absence of permanent, formal jobs, temporary
employment is seen in a positive light.
- On agricultural practices: Small farmers on the Ibi domain still practice mainly slash-and-burn
agriculture but are gradually turning to fixed-plot farming on savannah land – as a result of
support received from GIAgro but also decreasing availability of forest land. They are open to the
adoption of new techniques if this helps improve yields/income (they think it will, but are still
expecting to see the results of their first trials); the biggest perceived obstacle is lack of access to
mechanisation. Mbankana farmers involved in CADIM activities no longer need convincing about
the benefits of agroforestry and other integrated agricultural techniques, and confirm the
adoption of improved agricultural practices is a long process requiring long-term education
efforts. Diversification of agricultural production is seen as a positive development by all.
- On the use of forests and other natural resources: Access to forest resources is still governed by
customary chiefs, who have a mixed record in protecting the resource. All participants collect
forest and savannah products – and all are very much aware of forest degradation and its multiple
adverse consequences. A switch away from traditional agriculture to fixed-plot cultivation on
savannah land, in particular in agroforestry systems, is seen as the most effective response.
Improved forest governance and enforcement of the forest code, and improved security of land
tenure arrangements, would support this transition – but the switch to a new system of land
tenure should be better managed than it is now, to preserve sufficient access to land for local
populations. The creation of employment opportunities for young people, and a differentiated tax
24
regime for sustainably and non-sustainably produced charcoal, would also help reduce pressure
on forests. If people are offered the opportunity to make charcoal in plantations rather than
natural forests, they will be willing to switch – provided they can earn at least as much.
- On large plantation projects: Ibi participants appreciate the support received from GIAgro for the
adoption of new practices – and would like to get even more, as well as assurances of continued
support; they do not want, however, agroforestry practices to be imposed on them. They also use
and appreciate the ‘social’ services (notably the school and dispensary) made available at the
plantation – while having some unrealistic expectations about improvements in these services.
Their overall opinion of the Ibi project is positive – but they seem to be even more seduced by the
Mampu model, while hoping positive fallout from the Ibi project will develop gradually and raise
their living standards. Mbankana participants are even more enthusiastic about large plantation
projects, and wish more will see the light. They are aware of the wealth creation and ‘multiplier
effect’ on the local economy associated with Mampu and Ibi. The two main advantages in their
view are the creation of new forest resources and new employment opportunities, notably for
young people. None of the focus groups could come up with disadvantages associated with the
region’s plantation projects – except for local air pollution associated with charcoal making.
A more detailed account of focus group discussions is available in Annex IX.
5. Interpretation and discussion
5.1. Financial sustainability
Examination of CBA results, combined with findings from the development of model assumptions,
reveals the following:
- Assuming the price of forest carbon credits remains low, the ‘passive carbon sink’ scenario, in
which trees remain unharvested until the 30-year term of the CDM crediting period, is
characterised by very low returns and is financially unsustainable – especially considering the risk
of fire, not factored into the analysis.
- The agroforestry scenario, while not providing the type of returns that typical private investors
would expect, offers better but still low returns – which however could be acceptable to investors
which, like Novacel, are primarily motivated by development objectives. However, the very long
25
payback period makes a project of this type impossible without access to long-term capital. Note
that the increase in land value resulting from afforestation is not factored into the analysis; if it
was, a better IRR would be achieved. Note also that quite conservative assumptions were
generally made for costs and revenues.
- With low carbon prices, agroforestry activities can make a positive contribution to the financial
sustainability of the project, even assuming the exclusive production of output with low added
value in a context of competition with low-cost, informal sector producers getting very low
returns to labour. However, this can only be achieved if very rigorous cost control and
productivity monitoring are in place and continuously enforced. This is challenging in a country
where management skills are still little developed.
- The provision of social services is not included in the baseline scenario. If it was, profitability
would be further reduced. With thin profit margins in a difficult environment, private investors
cannot be expected to provide extensive social services – but like Novacel, can achieve service
development by mobilising external sources of funding (e.g. development cooperation resources)
and providing material support to service deployment and delivery.
- Charcoal making based on traditional earth kilns is a low-return activity. Simulations of production
using hired labour resulted in losses – which justifies the retained scenario of letting teams of self-
employed charcoal makers operate on the plantation, under a production-sharing arrangement.
Sensitivity analysis usefully complements baseline scenario analysis by showing that:
- The IRR is quite sensitive to changes in scenario assumptions.
- The scenario ‘with agroforestry’ is usually the most attractive. The ‘passive carbon sink’ does
better in only one of the tested variants (where the VER unit price reaches 10 USD).
- Increasing the carbon unit price improves the IRR both ‘with’ and ‘without’ agroforestry. The
carbon price that equalises the IRR of the ‘with’ and ‘without’ agroforestry scenarios is
7.60 USD/unit; above, the ‘passive carbon sink’ scenario is financially more attractive. However,
with higher carbon prices the agroforestry scenario also becomes more attractive (in absolute
terms) – and it is definitely the best from a social point of view.
Indeed, these results must be interpreted in the light of significantly different levels of employment
generated by the two scenarios: estimates of the total workforce required for implementing the
project indicate that implementation of the agroforestry scenario would require approx. 32,000 man-
years over 30 years - whereas the ‘passive carbon sink’ option would require less than 2,300 man-
years.
26
5.2. Socioeconomic and environmental sustainability
Statistical test results, by highlighting the existence or absence of relationship between pairs of
variables, provide useful insights into the mechanisms by which woodfuel plantation projects,
through their impacts on livelihoods, can contribute to forest protection. Caution must nevertheless
be applied when interpreting results, keeping in mind that:
- ‘Correlation is not causation’: a significant test does not establish the existence of a causal
relationship; qualitative data collected during interviews and focus group meetings, combined
with logic, may indicate which variable is likely to be the explanatory one, but any conclusion on
the existence and direction of causation should be prudent, especially as third variables (not
captured by the test) may influence the relationship.
- Test results reflect in part the choice of survey locations and the composition of the overall
sample: if, for instance, one of the survey sites had been a village involved in community-based
agroforestry, rather than Mampu, some tests may have produced different results.
Key findings from the statistical tests must be interpreted in light of the following elements:
- The population of short-term workers operating in plantations is not represented in the samples.
- The negative association of employment/residence in a plantation with slash-and-burn agriculture
(typically related to charcoal production in natural forests) must largely explain the negative
association of these factors with charcoal making from natural forests. Households involved in
agroforestry (Mampu) produce charcoal from plantation wood; in Ibi, surveyed plantation
residents, wealthier than the average, have other means of subsistence than charcoal making.
- The positive association between employment/residence in a plantation and higher levels of
educational achievement can be explained by at least two factors: (i) plantation sites employ a
number of highly-skilled people (clearly the case in Ibi); (ii) people living on plantation sites are
more likely than others to belong to the highest wealth categories (see next point), and thus to be
able to afford education.
- The positive association between employment/residence in a plantation and the highest wealth
categories reflects at least in part better-than-average accommodation: this aspect has significant
weight in the wealth index. Apart from this, qualitative information confirms that standards of
living are much higher in Mampu there than anywhere else in the region – and most of the
27
surveyed Ibi plantation residents have a formal wage-earning job, a factor positively correlated
with wealth.
- The positive association between employment/residence in a plantation and formal land
ownership results from the farmer-owner system characteristic of Mampu.
- The negative association between charcoal making in natural forests and formal land ownership
certainly reflects the fact that formally registered properties are typically on savannah rather than
forest land. It is also consistent with natural resource economic theory, which holds that stronger
property rights create incentives for more sustainable resource management (see for instance
Bromley, 1991).
With all this in mind, survey and test results combined with qualitative information support the idea
that woodfuel plantations such as Ibi and Mampu could contribute to reducing pressure on natural
forests, through a nexus of associated factors. These include formal land ownership; the practice of
agroforestry on fixed plots outside natural forests; the creation of employment, in the form of
permanent but also temporary wage-earning jobs (model prevailing in Ibi) or self-employment
(model prevailing in Mampu); greater wealth and higher education levels; and the professionalisation
of charcoal making. The development of a variety of services accessible to outsiders as well as
residents is also an important aspect of the livelihood enhancement potential of plantation projects.
However, the extent to which populations located outside plantations can benefit from these factors
determines the potential for positive impacts extending beyond plantation boundaries:
- The chance for outsiders to access formal land ownership is at best unrelated to the existence of
plantations – or could possibly be reduced, if large-scale plantation development makes land
scarcer for local populations; formal land ownership or at least security of tenure can
nevertheless be supported by adequate national policies.
- The successful practice of agroforestry (associated with greater wealth) on woodfuel plantations
could play a positive role in demonstrating the superiority of this approach to traditional slash-
and-burn agriculture, and attracting followers outside plantation boundaries. This is especially
true as local populations are faced with the rapid dwindling of forest resources, reducing the
scope for continuing traditional slash-and-burn practices. The transition to more environmentally
sustainable agricultural practices can be accelerated through the provision of training in new
techniques at the initiative of plantation managers – something done in Ibi.
28
- Plantation projects do create employment – formal and informal – but fail to create much direct
employment for neighbouring populations. Distance and the lack of transport means explain most
of this: unless they are willing to resettle on the plantation site, neighbouring populations cannot
work there because daily commuting is impossible or too exacting. This could in theory be helped
by plantation managers organising regular transport connections with the surrounding villages –
but this could be prohibitively expensive. Neighbouring villagers may also have little interest in
getting involved in low-skilled jobs on plantations. As a result, plantation projects attract a lot of
non-native workers originating from Kinshasa city or neighbouring provinces – something verified
in both Ibi and Mampu.
- On the other hand, economic activity on plantation sites does support indirect job and income
creation – as is visible in the local town Mbankana, where economic activity and greater-than-
average wealth in Mampu and Ibi spill over into the local economy. This may draw some local
people away from traditional livelihood patterns, into new ones based notably on service jobs.
- Plantation projects can contribute to enhancing education levels by subsidising schools and
attracting children from surrounding areas. Both Ibi and Mampu offer educational opportunities
to ‘outsider’ children (with a boarding school arrangement in the case of Ibi). Some other services
they offer are also used (and appreciated) by neighbouring communities, even if distance is
sometimes an obstacle.
- By offering neighbouring communities the possibility of making charcoal on their site, plantation
projects can contribute to increased professionalisation of this activity on a regional scale. This
may support higher carbonisation yields (Ellegård et al, 2001), while keeping some producers
away from natural forests.
A potential thus clearly exists for agroforestry-based woodfuel plantations to act as magnets of
sustainable rural development, and alleviate pressures on natural forests through livelihoods-related
mechanisms. However, realising this potential may take time; the persistence of forest degradation
on the margins of the Ibi domain shows sustained efforts are needed to change habits.
Also noteworthy is how very few people mention disadvantages associated with plantations. Because
the Ibi and Mampu plantations were established on previously unoccupied land at some distance
from existing settlements, reduced availability of land for neighbouring communities is not usually
perceived as a problem. Similarly, the influx of migrant labourers has few impacts on surrounding
communities, as they are accommodated on the plantation sites.
29
Finally, a word on livelihood strategies and whether charcoal making can contribute to lifting people
out of poverty. Diversification of livelihoods appears to be unrelated to wealth – but, in the general
population, a high degree of livelihood diversification is associated with charcoal making from natural
forests, an activity of the less-affluent. This is consistent with theory: diversification may help people
reduce risks and smooth their income, but it does not necessarily allow asset accumulation (Ellis,
1998; Bryceson, 2002; Smith, 2004). On the other hand, a high degree of agricultural diversification is
associated with wealth, agroforestry and professional charcoal making. Information obtained from
focus groups indicates that access to market, combined with technical knowledge of integrated
agricultural practices, makes the difference between agricultural diversification that merely allows
basic subsistence, and the type that supports asset accumulation and improved living standards. The
latter pattern appears to be more prevalent in plantations.
Data collected for this research provide ample evidence that charcoal production from natural
forests gives people some much-needed cash income but does not make them rich. Referring back to
the typology of livelihood strategies of Smith et al (2005), charcoal making from natural forests is
akin to a ‘semi-subsistence diversification strategy’, involving complementarities with farming in
labour use, providing an occasional cash source, and supporting labour and consumption ‘smoothing’
and risk reduction: this is not bad, but not enough to escape poverty and above all completely
unsustainable at the present rate of exploitation, so at high risk of becoming a doomed ‘survival
strategy’.
Charcoal making from plantation forests, on the other hand, is associated with greater wealth. This
type of resource exploitation is akin to a ‘specialisation’ strategy (as part of the practice of
agroforestry, integrated in rather than exclusive of a product diversification strategy), with resource
exploitation practised for market production and income, and for accumulating assets. This is much
more likely to get people out of poverty. This model can be adopted in plantations but also on a
smaller scale, by village communities and enterprising small farmers.
30
6. Conclusions
6.1. Financial sustainability
Financial analysis shows that relatively low-value agroforestry activities can contribute to the
financial sustainability of a carbon sink project of the Ibi-Batéké type – but only to the extent that
carbon prices remain low. For the chosen CBA scenario and assumptions, above a price of
7.60 USD/tonne CO2e, a ‘passive carbon sink’ is financially more attractive.
Overall, returns appear to be very low. Significantly higher forest carbon prices (or improved margins
on agroforestry activities) would be required to make such projects viable and attractive to private
investors – even if increased land values associated with afforestation of degraded lands may
somewhat improve the picture.
However, the financial analysis fails to reflect the positive social and environmental externalities
generated by the project, in the form of employment, improved livelihoods opportunities, provision
of local ecosystem services, and protection of natural forests and the associated ecosystem services.
If such externalities were valued and included in the analysis, there is no doubt that the economic
IRR of the agroforestry scenario would dramatically improve.
This calls for the following conclusions:
- As long as the prices of forest carbon credits remain low and reflect exclusively carbon
sequestration, they are unlikely to provide sufficient incentives for the development of new
medium- to large-scale afforestation projects in the Kinshasa supply basin. If however a liquid,
reliable, long-term financial mechanism of ‘payment for environmental and social services’ could
develop in which buyers, in addition to offsetting their carbon emissions, would be willing to pay
an extra price for rewarding the social and local environmental benefits generated by forest
carbon projects, financial sustainability would improve and more investors could be attracted.
- Also affecting financial viability are the rather low margins on cassava, charcoal and timber sales,
considering the significant investments required and costs incurred to produce them sustainably,
at the scale of a large plantation. Moving to more processed, higher-value products or making
efficiency-enhancing investments may be part of the solution – although the financial impact of
31
such moves should be tested carefully.16 Price undercutting by small producers from the informal
sector, who operate without consideration of resource depletion, remains a significant problem
for the development of woodfuel plantations (Arnold et al 2003, World Bank 2009). National
policies that create an economic advantage for sustainably produced charcoal (but also timber
and cassava) vs. the unsustainable kind (for instance through differentiated taxation), and support
the formalisation of the agricultural, charcoal and timber sectors, would help in this regard – but
would be difficult to implement without significant improvements in governance (World Bank
2009).
6.2. Socioeconomic and environmental sustainability
This research provides ample quantitative and qualitative evidence that medium- to large-scale
woodfuel plantation projects such as Ibi-Batéké and Mampu, in the context of the Batéké plateau in
Kinshasa province, can generate benefits in terms of improved livelihoods – and contribute to
alleviating pressure on the remaining natural forests through livelihoods-related mechanisms, in
addition to increasing supply volumes. These impacts occur through a nexus of factors including
formal land ownership; the practice of agroforestry on fixed plots; the creation of employment in
various forms; the professionalisation of charcoal making; the development of social and economic
services; and the general association of plantation sites with greater wealth and higher education
levels. These effects are first felt within plantation boundaries. They can also spill over into
neighbouring areas. However, positive impacts are more likely to occur, and on a vaster scale, if
proactive measures in favour of improved livelihoods beyond plantation boundaries are
implemented simultaneously.
Nevertheless, these benefits cannot be sustained if the financial fundamentals are wrong – and
under present conditions they are quite weak. Plantation owners and managers, whether private or
supported by development aid, can only go so far as financial sustainability allows – and in terms of
service provision for their workers and for neighbouring communities, cannot be expected to remedy
all the failures of the state, nor to take up alone responsibility for local development. Accompanying
measures and supportive policies at government level – including land tenure policies, territorial
planning, infrastructure development, education policies, reproductive health policies (to prevent
demographic growth from continuously outpacing economic growth), and the creation of economic
16For instance, the profitability of investment in semi-industrial or industrial charcoal kilns is not evident, as the
cost of on-site transport of harvested wood may offset efficiency gains.
32
incentives for environmentally sustainable agriculture and charcoal production – are very much
needed to create a more favourable context for woodfuel plantations, and enhance their positive
effects on forest protection and regeneration.
7. References
Arnold M., Köhlin G., Persson R. and Shepherd G. (2003) Fuelwood Revisited: What Has Changed in
the Last Decade? CIFOR Occasional Paper no. 39, Center for International Forestry Research, Jakarta,
35 p.
Arnold M., Köhlin G. and Persson R. (2006) Woodfuels, Livelihoods, and Policy Interventions:
Changing Perspectives. World Development, vol. 34, issue 3, pp. 596-611.
Aveling C. (2009) The Contribution of Biodiversity to the Maintenance of Forest Goods and Services.
In: de Wasseige C., Devers D., de Marcken P., Eba’a Atyi R., Nasi R. and Mayaux Ph. (Eds) (2009) The
Forests of the Congo Basin – State of the Forest 2008. Publications Office of the European Union,
Luxembourg, pp. 159-172.
Bakala Kiba, Alphonse. Chef de programme gestion sociale, EFC (société Eucalyptus Fibre Congo),
Pointe Noire, République du Congo. (Personal communication, 7 July 2011)
BERCI (2006) Analyse d’impact socio-environnemental du projet ‘Puits Carbone, Station Ibi’, mise en
œuvre par Novacel sprl. Bureau d’Études, de Recherche et de Consulting International, Gombe,
Kinshasa, 75 p. [Unpublished]
Bromley, D.W. (1991) Environment and Economy: Property Rights and Public Policy. Blackwell, Oxford
University Press, Cambridge, MA and Oxford, UK, 247 p.
Brummett R., Tanania C., Pandi A., Ladel J., Munzimi Y., Russell A., Stiassny M., Thieme M., White S.
and Davies D. (2009) Water Resources, Forests and Ecosystem Goods and Services. In: de Wasseige
C., Devers D., de Marcken P., Eba’a Atyi R., Nasi R. and Mayaux Ph. (Eds) (2009) The Forests of the
Congo Basin – State of the Forest 2008. Publications Office of the European Union, Luxembourg,
pp. 141-157.
33
Bryceson D.F. (2002) The Scramble in Africa : Reorienting Rural Livelihoods. World Development, vol.
30, issue 5, pp. 725-739.
CeDEP (2010) Research Methods. Unit 8 ‘Quantitative Data Analysis II : Basic Statistical Tests. Course
materials, Centre for Development, Environment and Policy, School of Oriental and African Studies,
University of London, London.
Clancy J. (2008) Urban ecological footprints in Africa. African Journal of Ecology, vol. 46, issue 4,
pp. 463-470.
de Wasseige C., Devers D., de Marcken P., Eba’a Atyi R., Nasi R. and Mayaux Ph. (Eds) (2009) The
Forests of the Congo Basin – State of the Forest 2008. Publications Office of the European Union,
Luxembourg, 416 p.
Dewees P. (1989) The Woodfuel Crisis Reconsidered: Observations on the Dynamics of Abundance
and Scarcity. World Development, vol. 17, issue 8, pp. 1159-1172.
DFID (1999a) Sustainable Livelihoods Guidance Sheets – Section 1: Introduction. UK Department for
International Development, London, 10 p.
DFID (1999b) Sustainable Livelihoods Guidance Sheets – Section 2: Framework. UK Department for
International Development, London, 26 p.
DRC (2010) Readiness Plan for REDD 2010-2012. R-PP final version, July 15th, 2010. Conservation of
Nature and Tourism, Ministry of Environment, Democratic Republic of Congo, 153 p. Available from:
http://www.forestcarbonpartnership.org/fcp/ZR [Accessed 31 December 2010].
Drigo R. and Salbitano F., under the supervision of Trossero R. And Gauthier M. (2008) WISDOM for
cities: Analysis of wood energy and urbanization using WISDOM* methodology. Food and Agriculture
Organization, Rome, 126 p.
Ducenne Q. (2009) Evaluation des actions agroforestières à Mampu. Rapport final, Volumes II et III.
Cardno Agrisystems Ltd, 78 p. + annexes. [Unpublished]
34
Dufour T. and Demenois J. (2010) Ibi-Batéké degraded savannah afforestation project for fuelwood
production – Democratic Republic of Congo: Monitoring plan. ONF International, Paris, 20 p.
Eba’a Atyi R., Devers D., de Wasseige C. and Maisels F. (2009) State of the Forests of Central Africa:
Regional Synthesis. In: de Wasseige C., Devers D., de Marcken P., Eba’a Atyi R., Nasi R. and Mayaux
Ph. (Eds) (2009) The Forests of the Congo Basin – State of the Forest 2008. Publications Office of the
European Union, Luxembourg, pp. 15-41.
Eba’a Atyi R. and Bayol N. (2009) The Forests of the Democratic Republic of Congo in 2008. In: de
Wasseige C., Devers D., de Marcken P., Eba’a Atyi R., Nasi R. and Mayaux Ph. (Eds) (2009) The Forests
of the Congo Basin – State of the Forest 2008. Publications Office of the European Union,
Luxembourg, pp. 111-124.
Ellegård A., Chidumayo E., Malimbwi R., Pereira C. and Voss A. (2002) Charcoal Potential in Southern
Africa (CHAPOSA). Stockholm Environmental Institute, Stockholm, 88p. Available from:
http://www.sei-international.org/mediamanager/documents/Publications/Climate/chaposa.pdf
[Accessed 27 September 2011].
Ellis F. (1998) Household strategies and rural livelihood diversification. Journal of Development
Studies, volume 35, issue 1, pp. 1-38. Cited by Bryceson (2002) and Smith (2004).
European Commission (1997) Manual – Financial and economic analysis of development projects.
Office for Official Publications of the European Communities, Luxembourg, 375 p.
FAO (2010) Global Forest Resources Assessment 2010: Main report. FAO Forestry Paper 163. Food
and Agriculture Organization, Rome, 371 p.
Gardette Y.M. and Locatelli B. (2007) Les marchés du carbone forestier : Comment un projet forestier
peut-il vendre des crédits carbone ? [Forest carbon markets: How can a forestry project sell carbon
credits?]. ONF International, Paris and CIRAD, Montpellier, 72 p.
Geist H. and Lambin E. (2001) What Drives Tropical Deforestation? A meta-analysis of proximate and
underlying causes of deforestation based on subnational case study evidence. LUCC Report Series
no. 4. Land Use and Land Cover Change (LUCC) International Project Office, University of Louvain,
Louvain-la-Neuve, Belgium, 118 p.
35
Girard, Jacques. Senior development consultant. (Personal communication, 7 July 2011)
Girard P. (2002) Charcoal production and use in Africa: what future? Unasylva, vol. 53, issue 211,
pp. 30-35.
Goossens, Paul. Senior investment officer, BIO (Belgian Investment Company for Developing
Countries). (Personal communication, 7 July 2011)
Ingram V. and Schure J. (2010) Méthodologie de Recherche Projet Makala Module 2: Les aspects
socio-économiques de la filière bois-énergie. Report produced in the context of the Makala Project
(EuropeAid DCI-ENV/2008/151-384). Projet Makala/Center for International Forestry Research
(CIFOR), 86 p. Available from: http://makala.cirad.fr/les_produits [Accessed 3 December 2010].
IPCC (2003) Good Practice Guidelines for Land Use, Land Use Change and Forestry. Task Force on
National Greenhouse Gas Inventories, Intergovernmental Panel on Climate Change. [Online]
Available from: http://www.ipcc-nggip.iges.or.jp/public/gpglulucf/gpglulucf.html [Accessed
29 September 2011].
Kandu Kasongo C. (2006) Étude de filière du secteur des cultures vivrières : Profil de la filière de
production des tubercules et racines. Project report, project GCP/DRC/031/BEL ‘Appui à la définition
des politiques de développement agricole en RDC’. Food and Agriculture Organization, Kinshasa,
88 p.
Kasulu Seya Makongai V., Armathé Amougouii J. and Hamel O. (2009) Congo Basin Countries and the
Reduced Emissions from Deforestation and Degradation (REDD) Process – Building the COMIFAC
Position within the Framework of International Negotiations. In: de Wasseige C., Devers D., de
Marcken P., Eba’a Atyi R., Nasi R. and Mayaux Ph. (Eds) (2009) The Forests of the Congo Basin – State
of the Forest 2008. Publications Office of the European Union, Luxembourg, pp. 173-190.
Landry J. (2009) Analysis of the potential socio-economic impact of establishing plantation forestry on
rural communities in Sanga District, Niassa Province, Mozambique. Thesis submitted in partial
fulfilment of the requirements for the degree of Master of Science in Forestry at Stellenbosch
University, 109 pp. [Online] Available from:
36
https://scholar.sun.ac.za/bitstream/handle/10019.1/2925/Landry%20JA.pdf?sequence=1 [Accessed
3 January 2011].
Landry J. and Chirwa P. (2011) Analysis of the potential socio-economic impact of establishing
plantation forestry on rural communities in Sanga district, Niassa province, Mozambique. Land Use
Policy, vol. 28, issue 3, pp. 542-551.
Lescuyer G., Karsenty A. and Eba’a Atyi R. (2009) A New Tool for Sustainable Forest Management in
Central Africa: Payments for Environmental Services. In: de Wasseige C., Devers D., de Marcken P.,
Eba’a Atyi R., Nasi R. and Mayaux Ph. (Eds) (2009) The Forests of the Congo Basin – State of the Forest
2008. Publications Office of the European Union, Luxembourg, pp. 127-139.
Lescuyer G., Cerutti P., Essiane Mendoula E., Eba’a Atyi R. and Nasi R. (2011) Le marché domestique
du bois dans le Bassin du Congo : défis et opportunités. Center for International Forestry Research
(CIFOR), Yaoundé, Cameroon, 26 slides. Presentation made at the validation workshop for the
preparation of the ‘State of the Forests of the Congo Basin 2010’ edition, Douala, 29-30 March 2011.
[Online] Available from: http://www.pfbc-cbfp.org/rapports/items/EDF-rapport-presentation-F.html
[Accessed 3 July 2011].
Luoga E.J., Witkowski E.T.F. and Balkwill K. (2000) Economics of charcoal production in miombo
woodlands of eastern Tanzania: some hidden costs associated with commercialization of the
resources. Ecological Economics, vol. 35, issue 2, pp. 243-257.
Marien J.N. (2009a) Peri-Urban Forests and Wood Energy: What are the Perspectives for Central
Africa? In: de Wasseige C., Devers D., de Marcken P., Eba’a Atyi R., Nasi R. and Mayaux Ph. (Eds)
(2009) The Forests of the Congo Basin – State of the Forest 2008. Publications Office of the European
Union, Luxembourg, pp. 209-221.
Marien J.N. (2009b) Projet Makala: Gérer durablement la ressource bois énergie en RDC. Projet
Makala (EuropeAid DCI-ENV/2008/151-384) – Presentation note, 7p.
Available from: http://makala.cirad.fr/les_produits [Accessed 3 December 2010].
Mbala S.M. (2007). République Démocratique du Congo: intégrer les questions de genre dans le
secteur forestier en Afrique. Food and Agriculture Organization, Rome. Cited by Trefon et al, 2010.
37
Muhammed N., Koike M., Haque F. and Miah M.D. (2008) Quantitative assessment of people-
oriented forestry in Bangladesh: A case study in the Tangail forest division. Journal of Environmental
Management, vol. 88, issue 1, pp. 83-92.
Ndoye O., Awono A., Preece L. and Toirambe B. (2007) Marchés de produits non ligneux dans les
provinces de l’Equateur et de Bandundu: présentation d’une enquête de terrain. In: BTC (2007) Quel
avenir pour les forêts de la République Démocratique du Congo? Instruments et mécanismes
innovants pour une gestion durable des forêts. Reflection and discussion paper 2007/01. Belgian
Technical Cooperation, Brussels, pp. 68-70.
Nkoua, Méthode. Responsable gestion sociale et environnementale, Centre de Recherche sur la
Durabilité et la Productivité des Plantations Industrielles (CRDPI), Pointe-Noire, République du Congo.
(Personal communication, 1 July 2011)
Novacel (2010) Ibi Batéké degraded savannah afforestation project for fuelwood production
(Democratic Republic of Congo). Project Design Document Form for Afforestation and Deforestation
Project Activities (CDM-AR-PDD), submitted to the CDM Development Board. Version PCI-B#1.1,
1 December 2010, 90 p. Available from:
http://cdm.unfccc.int/Projects/DB/ErnstYoung1291309493.36/view [Accessed 30 May 2011].
Oréade-Brèche (2008) Puits de carbone d’Ibi, plateau des Batéké: étude d’impact socio-
environnemental. [Ibi carbon sink on the Batéké plateau: social and environmental impact
assessment] Draft final report, 93 p. [Unpublished]
Proces P., Dubiez E. and Vermeulen C. (2010) Recensement, histoire, occupation spatiale et secteur
associatif du village de Mutiene. Report produced in the context of the Makala Project (EuropeAid
DCI-ENV/2008/151-384). Projet Makala/CIRAD/Gembloux AgroBioTech, 56 p. [Unpublished]
Projet Makala (2011) La filière bois-énergie des villes de Kinshasa et Kisangani. Notes de perspective
du Projet Makala n°2, août 2011. Available from: http://makala.cirad.fr/les_produits [Accessed
27 September 2011].
Schure J., Mvondo S.A., Awono A., Ingram V., Lescuyer G., Sonwa D. and Somorin O. (2010) L’état de
l’art du bois énergie en RDC : Analyse institutionnelle et socio économique de la filière bois énergie.
38
Report produced in the context of the Makala Project (EuropeAid DCI-ENV/2008/151-384). Center for
International Forestry Research (CIFOR), Yaoundé, Cameroon, 103 p. [Unpublished]
Smith J. and Scherr S. (2003) Capturing the Value of Forest Carbon for Local Livelihoods. World
Development, vol. 31, issue 12, pp. 2143-2160.
Smith L.E.D. (2004) Assessment of the Contribution of Irrigation to Poverty Reduction and
Sustainable Livelihoods. Water Resources Development, vol. 20, issue 2, pp. 243-257.
Smith L.E.D., Nguyen Khoa S. and Lorenzen K. (2005) Livelihood functions of inland fisheries: policy
implications in developing countries. Water Policy, issue 7, pp. 359-383.
The Economist (24 September 2011) Commodities: Crowded out. Graph entitled ‘Crude awakening:
oil price, $ per barrel at 2011 prices’, p. 22 of special report on the world economy (sources: The
Economist and Thomson Reuters).
Trefon T., Hendriks T., Kabuyaya N. and Ngoy B. (2010) L’économie politique de la filière du charbon
de bois à Kinshasa et à Lubumbashi : Appui stratégique à la politique de reconstruction post-conflit en
RDC. IOB Working Paper 2010.03. Institute of Development Policy and Management (IOB), University
of Antwerp, 112 p.
UN (2010a) World Population Prospects: The 2010 Revision. Country profiles. Population Division,
Department of Economic and Social Affairs, United Nations, New York [On line] Available from:
http://esa.un.org/unpd/wpp/index.htm [Accessed 29 September 2011].
UN (2010b) World Urbanization Prospects: The 2009 Revision. Excel file on ‘Urban agglomerations: 30
largest cities’. Population Division, Department of Economic and Social Affairs, United Nations [On
line]. Available from: http://esa.un.org/unpd/wup/index.htm [Accessed 29 September 2011].
World Bank (2009) Environmental crisis or sustainable development opportunity? Transforming the
charcoal sector in Tanzania. A Policy Note. World Bank, Washington, DC, 58 p.
World Bank (2010) Agriculture rehabilitation and recovery support project, Democratic Republic of
Congo. Project appraisal document, Report No. 49169-ZR, March 4, 2010. World Bank, Washington,
DC, 143 p.
39
8. Bibliography
Minang A.P. and Murphy D. (2010) REDD after Copenhagen: The way forward. International Institute
for Sustainable Development, Winnipeg, Manitoba, Canada, 36 p. Available from:
http://www.iisd.org/pdf/2010/redd_after_copenhagen.pdf [Accessed 29 September 2011].
Arnold M. and Persson R. (2003) Reassessing the fuelwood situation in developing countries.
International Forestry Review, vol. 5, issue 4, pp. 379-383.
BTC (2007) Quel avenir pour les forêts de la République Démocratique du Congo? Instruments et
mécanismes innovants pour une gestion durable des forêts. Reflection and discussion paper 2007/01.
Belgian Technical Cooperation, Brussels, 79 p.
Debroux L., Hart T., Kaimowitz D., Karsenty A. and Topa G (eds) (2007) Forests in Post-Conflict
Democratic Republic of Congo: Analysis of a Priority Agenda. CIFOR/World Bank/CIRAD, Bogor,
Indonesia.
Delvingt W. and Lescuyer G. (2007) Certification et gestion forestière: enjeux et perspectives pour les
forêts du Congo. In: BTC (2007) Quel avenir pour les forêts de la République Démocratique du Congo?
Instruments et mécanismes innovants pour une gestion durable des forêts. Reflection and discussion
paper 2007/01. Belgian Technical Cooperation, Brussels, pp. 62-67.
Jumbe C. and Angelsen A. (2006) Household’s choice of fuelwood source in Malawi: A multinomial
probit analysis. Paper prepared for presentation at the International Association of Agricultural
Economists Conference, Gold Coast, Australia, 12-18 August 2006, 21 pp. [Online] Available from:
http://ageconsearch.umn.edu/bitstream/25450/1/cp061095.pdf [Accessed 3 January 2011].
Mushiete O. (2007) Plantation forestière et puits de carbone d’Ibi-Batéké: un souffle d’espoir pour la
forêt congolaise. In: BTC (2007) Quel avenir pour les forêts de la République Démocratique du Congo?
Instruments et mécanismes innovants pour une gestion durable des forêts. Reflection and discussion
paper 2007/01. Belgian Technical Cooperation, Brussels, pp. 52-56.
40
Nasi R., Mayaux P., Devers D., Bayol N., Eba’a Atyi R., Mugnier A., Cassagne B. Billand A. and Sonwa
D. (2009) A First Look at Carbon Stocks and their Variation in Congo Basin Forests. In: de Wasseige C.,
Devers D., de Marcken P., Eba’a Atyi R., Nasi R. and Mayaux Ph. (Eds) (2009) The Forests of the Congo
Basin – State of the Forest 2008. Publications Office of the European Union, Luxembourg, pp. 191-
207.
Thrän D. (2002) Wood energy terminology, information, statistics and standards. Unasylva, vol. 53,
issue 211, pp. 10-11 [box].
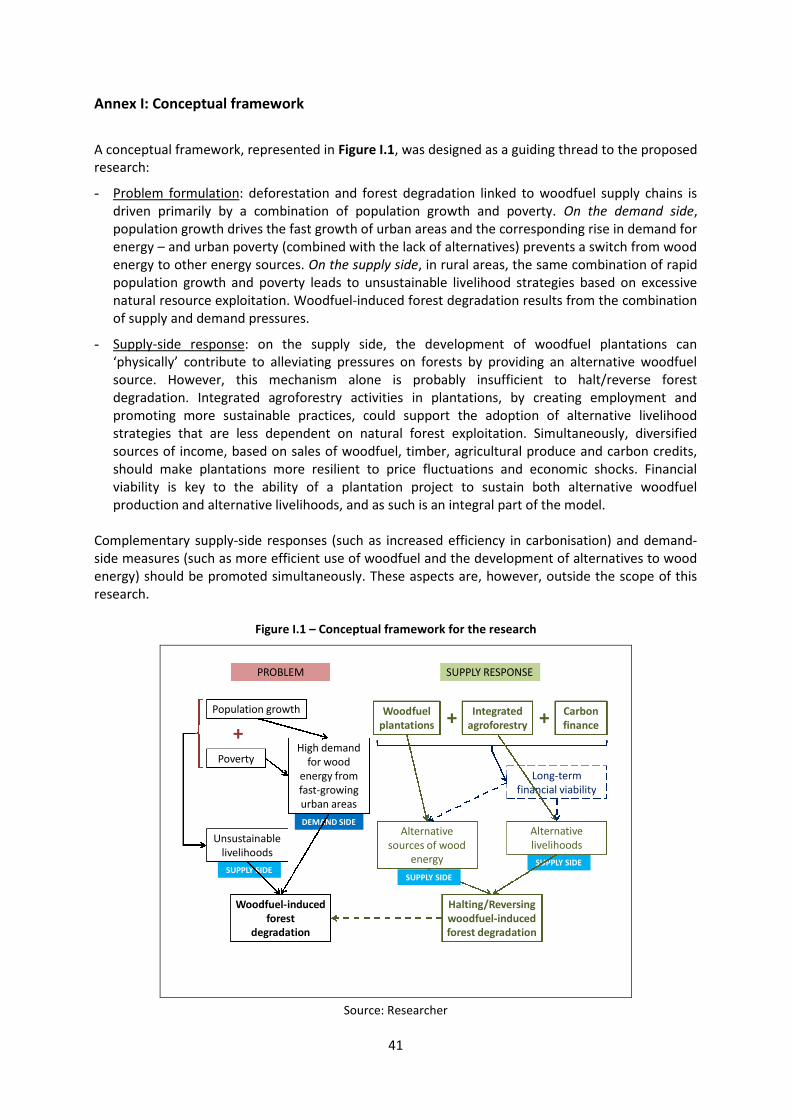
41
Annex I: Conceptual framework
A conceptual framework, represented in Figure I.1, was designed as a guiding thread to the proposedresearch:
- Problem formulation: deforestation and forest degradation linked to woodfuel supply chains isdriven primarily by a combination of population growth and poverty. On the demand side,population growth drives the fast growth of urban areas and the corresponding rise in demand forenergy – and urban poverty (combined with the lack of alternatives) prevents a switch from woodenergy to other energy sources. On the supply side, in rural areas, the same combination of rapidpopulation growth and poverty leads to unsustainable livelihood strategies based on excessivenatural resource exploitation. Woodfuel-induced forest degradation results from the combinationof supply and demand pressures.
- Supply-side response: on the supply side, the development of woodfuel plantations can‘physically’ contribute to alleviating pressures on forests by providing an alternative woodfuelsource. However, this mechanism alone is probably insufficient to halt/reverse forestdegradation. Integrated agroforestry activities in plantations, by creating employment andpromoting more sustainable practices, could support the adoption of alternative livelihoodstrategies that are less dependent on natural forest exploitation. Simultaneously, diversifiedsources of income, based on sales of woodfuel, timber, agricultural produce and carbon credits,should make plantations more resilient to price fluctuations and economic shocks. Financialviability is key to the ability of a plantation project to sustain both alternative woodfuelproduction and alternative livelihoods, and as such is an integral part of the model.
Complementary supply-side responses (such as increased efficiency in carbonisation) and demand-side measures (such as more efficient use of woodfuel and the development of alternatives to woodenergy) should be promoted simultaneously. These aspects are, however, outside the scope of thisresearch.
Figure I.1 – Conceptual framework for the research
SUPPLY SIDE
DEMAND SIDE
SUPPLY SIDE
Woodfuel-inducedforest
degradation
Population growth
High demandfor wood
energy fromfast-growingurban areas
Unsustainablelivelihoods
PROBLEM SUPPLY RESPONSE
Carbonfinance
Woodfuelplantations +
Alternativesources of wood
energy
Alternativelivelihoods
Halting/Reversingwoodfuel-inducedforest degradation
Poverty
+
Long-termfinancial viability
SUPPLY SIDE
Integratedagroforestry +
Source: Researcher
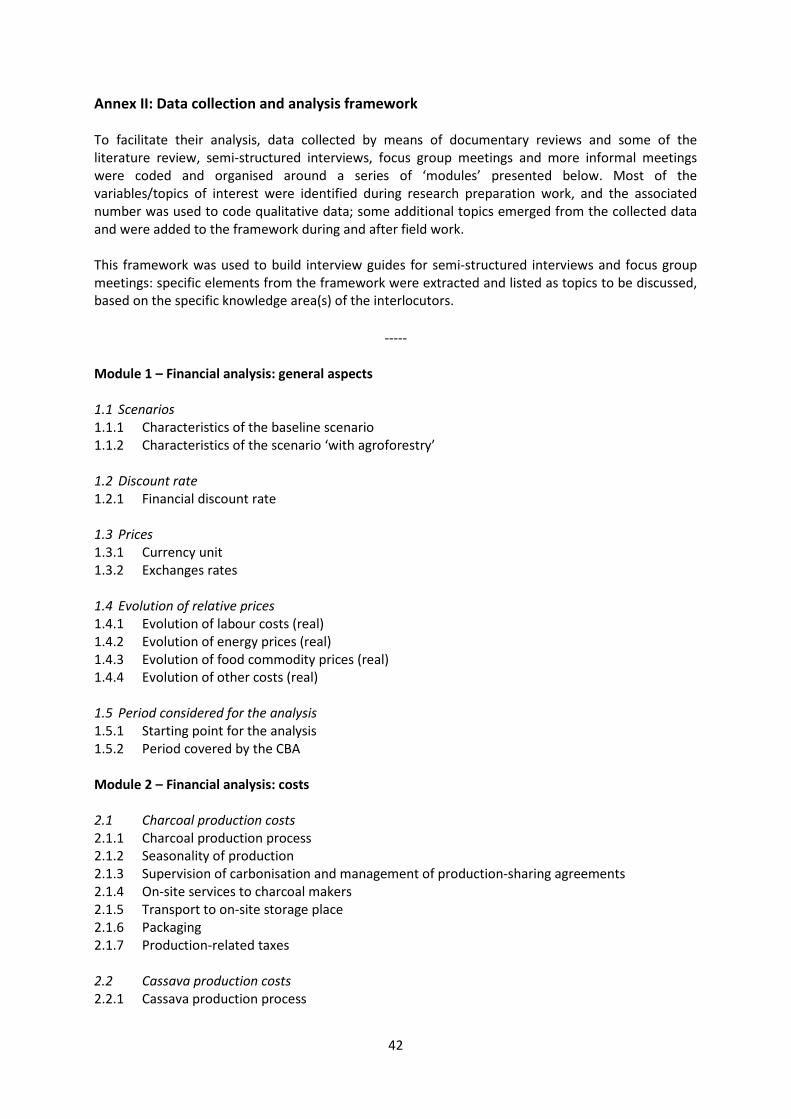
42
Annex II: Data collection and analysis framework
To facilitate their analysis, data collected by means of documentary reviews and some of theliterature review, semi-structured interviews, focus group meetings and more informal meetingswere coded and organised around a series of ‘modules’ presented below. Most of thevariables/topics of interest were identified during research preparation work, and the associatednumber was used to code qualitative data; some additional topics emerged from the collected dataand were added to the framework during and after field work.
This framework was used to build interview guides for semi-structured interviews and focus groupmeetings: specific elements from the framework were extracted and listed as topics to be discussed,based on the specific knowledge area(s) of the interlocutors.
-----
Module 1 – Financial analysis: general aspects
1.1 Scenarios1.1.1 Characteristics of the baseline scenario1.1.2 Characteristics of the scenario ‘with agroforestry’
1.2 Discount rate1.2.1 Financial discount rate
1.3 Prices1.3.1 Currency unit1.3.2 Exchanges rates
1.4 Evolution of relative prices1.4.1 Evolution of labour costs (real)1.4.2 Evolution of energy prices (real)1.4.3 Evolution of food commodity prices (real)1.4.4 Evolution of other costs (real)
1.5 Period considered for the analysis1.5.1 Starting point for the analysis1.5.2 Period covered by the CBA
Module 2 – Financial analysis: costs
2.1 Charcoal production costs2.1.1 Charcoal production process2.1.2 Seasonality of production2.1.3 Supervision of carbonisation and management of production-sharing agreements2.1.4 On-site services to charcoal makers2.1.5 Transport to on-site storage place2.1.6 Packaging2.1.7 Production-related taxes
2.2 Cassava production costs2.2.1 Cassava production process
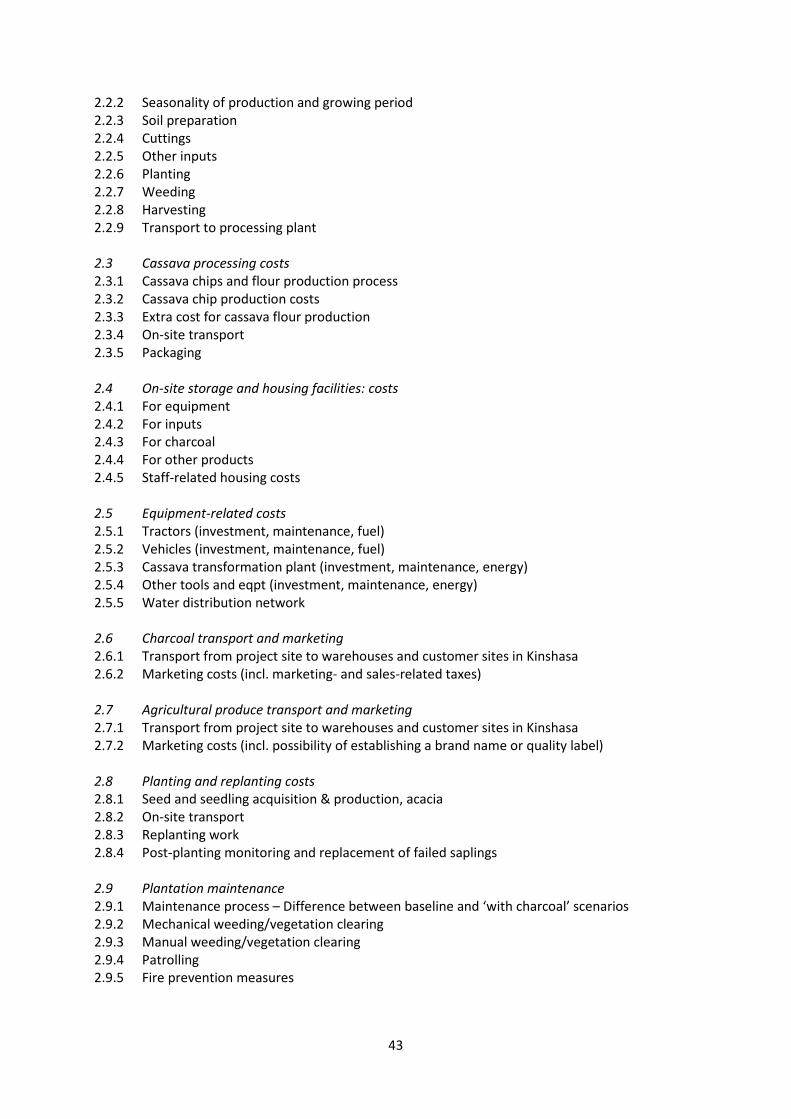
43
2.2.2 Seasonality of production and growing period2.2.3 Soil preparation2.2.4 Cuttings2.2.5 Other inputs2.2.6 Planting2.2.7 Weeding2.2.8 Harvesting2.2.9 Transport to processing plant
2.3 Cassava processing costs2.3.1 Cassava chips and flour production process2.3.2 Cassava chip production costs2.3.3 Extra cost for cassava flour production2.3.4 On-site transport2.3.5 Packaging
2.4 On-site storage and housing facilities: costs2.4.1 For equipment2.4.2 For inputs2.4.3 For charcoal2.4.4 For other products2.4.5 Staff-related housing costs
2.5 Equipment-related costs2.5.1 Tractors (investment, maintenance, fuel)2.5.2 Vehicles (investment, maintenance, fuel)2.5.3 Cassava transformation plant (investment, maintenance, energy)2.5.4 Other tools and eqpt (investment, maintenance, energy)2.5.5 Water distribution network
2.6 Charcoal transport and marketing2.6.1 Transport from project site to warehouses and customer sites in Kinshasa2.6.2 Marketing costs (incl. marketing- and sales-related taxes)
2.7 Agricultural produce transport and marketing2.7.1 Transport from project site to warehouses and customer sites in Kinshasa2.7.2 Marketing costs (incl. possibility of establishing a brand name or quality label)
2.8 Planting and replanting costs2.8.1 Seed and seedling acquisition & production, acacia2.8.2 On-site transport2.8.3 Replanting work2.8.4 Post-planting monitoring and replacement of failed saplings
2.9 Plantation maintenance2.9.1 Maintenance process – Difference between baseline and ‘with charcoal’ scenarios2.9.2 Mechanical weeding/vegetation clearing2.9.3 Manual weeding/vegetation clearing2.9.4 Patrolling2.9.5 Fire prevention measures
44
2.10 Staff-related costs2.10.1 Permanent worker-related costs2.10.2 Temporary worker-related costs2.10.3 Managerial staff-related costs2.10.4 Managerial staff and time dedicated to charcoal and cassava production
2.11 Other operating costs2.11.1 Facilities-related costs2.11.2 Carbon credit monitoring, reporting and verification costs
2.12 Timber production costs2.12.1 All cost-related information
Module 3 – Financial analysis: revenues
3.1 Sales of carbon credits3.1.1 Agreements related to the sales of carbon credits/CERs3.1.2 Difference in GHG removals between baseline and ‘with charcoal’ scenarios3.1.3 Sales price of carbon credits3.1.4 Carbon sequestration rate
3.2 Charcoal production: yields3.2.1 Plots planted with acacia and planned rotation3.2.2 Acacia – Biomass growth3.2.3 Acacia – Ratio of biomass available for carbonisation to AGB3.2.4 Acacia – Carbonisation yield3.2.5 Characteristics of production-sharing agreements
3.3 Charcoal sales3.3.1 Potential and targeted customers (incl. charcoal commercial networks)3.3.2 Distribution of sales across categories of customers3.3.3 Charcoal sales price (per category of customer)
3.4 Cassava production: yields3.4.1 Cassava root yields3.4.2 Cassava leaf yields3.4.3 Root-to-chips input/output ratio3.4.4 Chips-to-flour input/output ratio
3.5 Cassava product sales3.5.1 Potential and targeted customers (incl. cassava product commercial networks)3.5.2 Distribution of sales across categories of customers3.5.3 Cassava roots and leaves sales price (per category of customer)3.5.4 Cassava chips sales price3.5.5 Cassava flour sales price3.5.6 Cassava cuttings sales price
3.6 Timber sales3.6.1 Timber production potential3.6.2 Timber commercial networks3.6.3 Timber sales prices
45
Module 4 – Socioeconomic aspects of livelihood strategies
4.1 Livelihood strategies on the Batéké plateau4.1.1 Activities contributing to subsistence without necessarily generating a monetary income4.1.2 Activities generating a monetary income4.1.3 Level and evolution of rural salaries4.1.4 Relative importance of income-generating and non-income subsistence activities4.1.5 Degree of diversification of activities (agricultural and non-agricultural)4.1.6 Nature of diversification strategies (‘reactive’ or ‘proactive’)4.1.7 Seasonality of activities
4.2 Social aspects4.2.1 Migrations to and from the Batéké plateau4.2.2 Ethnic and other social group specialisation in relation to economic activities
Module 5 – Environmental aspects of livelihood strategies
5.1 Access to land and natural resources5.1.1 Conditions of access to agricultural land5.1.2 Perception of abundance or scarcity of agricultural land and forest resources5.1.3 Conditions of access to forests and forest resources5.1.4 Legal aspects of access to land, forests and forest resources
5.2 Agricultural practices5.2.1 Prevalence of slash-and-burn agriculture5.2.2 Alternatives to slash-and-burn agriculture5.2.3 Perception of sustainability of agricultural practices
5.3 Exploitation of savannah resources5.3.1 Extractive uses5.3.2 Non-extractive uses5.3.3 Perception of sustainability of savannah resource exploitation
5.4 Exploitation of forest resources5.4.1 Extractive uses5.4.2 Non-extractive uses5.4.3 Perception of sustainability of forest resource exploitation
5.5 Woodfuel extraction practices5.5.1 Woodfuel use for own consumption (sources, quantities)5.5.2 Woodfuel extraction for income generation (sources, quantities)5.5.3 Perception of sustainability of (specifically) charcoal production5.5.4 Readiness to switch carbonisation activities from natural forests to plantations
Module 6 – Perception of woodfuel plantation projects
6.1 Description, use and perception of services offered by woodfuel plantations6.1.1 Description of main services available on the Ibi and Mampu domains6.1.2 Use and perception of services available on the Ibi and Mampu domains
6.2 Perceived benefits of woodfuel plantations6.2.1 Economic benefits
46
6.2.2 Social benefits6.2.3 Environmental and natural resource-related benefits
6.3 Perceived disadvantages of woodfuel plantations6.3.1 Economic costs/threats6.3.2 Social costs/threats6.3.3 Environmental and natural resource-related costs/threats
Module 7 – Miscellaneous
7.1 REDD in DRC7.1.1 UN-REDD – ‘Programmes anticipés’7.1.2 Groupe de coordination thématique ‘Filière bois-énergie’7.1.3 FIP and FCPF7.1.4 Pilot projects7.1.5 Other REDD-related
7.2 Basic information on the Ibi and Mampu plantation projects7.2.1 Ibi7.2.2 Mampu
7.3 Projet Makala
7.4 Management of woodfuel/charcoal supply chain7.4.1 Development of woodfuel plantations (new projects)7.4.2 Control of the charcoal supply chain
7.5 CDM7.5.1 Measurement of carbon stocks
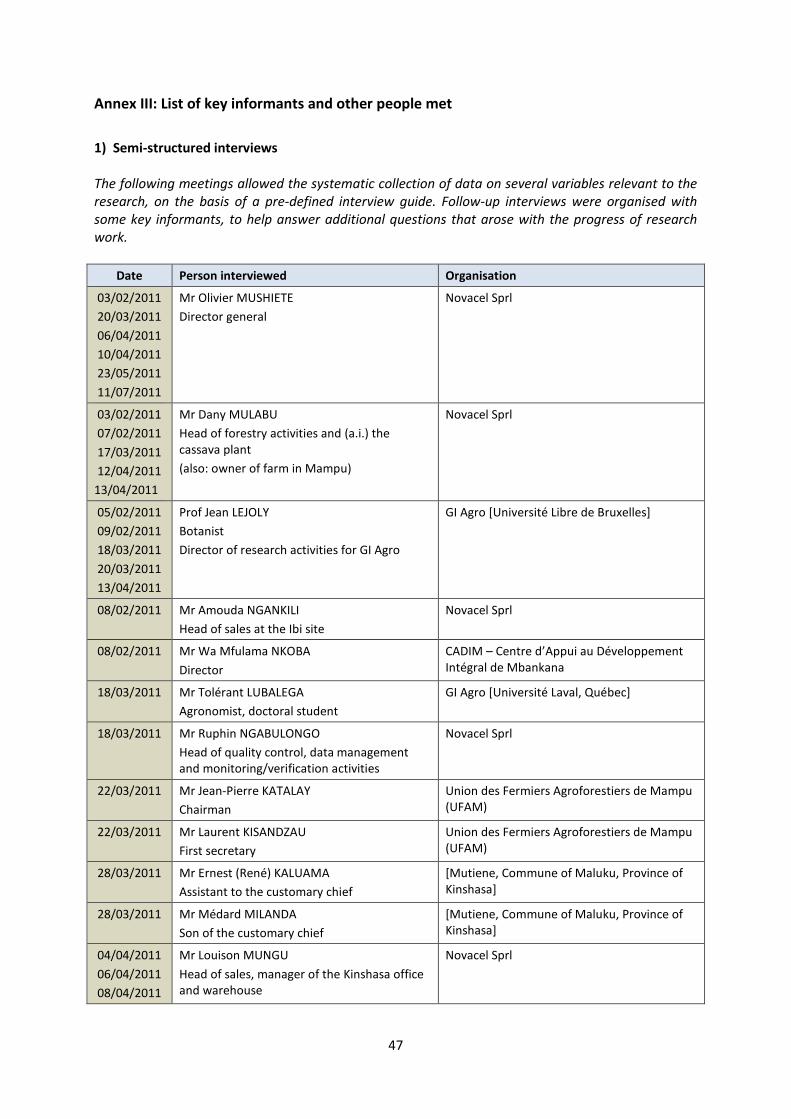
47
Annex III: List of key informants and other people met
1) Semi-structured interviews
The following meetings allowed the systematic collection of data on several variables relevant to theresearch, on the basis of a pre-defined interview guide. Follow-up interviews were organised withsome key informants, to help answer additional questions that arose with the progress of researchwork.
Date Person interviewed Organisation
03/02/2011
20/03/2011
06/04/2011
10/04/2011
23/05/2011
11/07/2011
Mr Olivier MUSHIETE
Director general
Novacel Sprl
03/02/2011
07/02/2011
17/03/2011
12/04/2011
13/04/2011
Mr Dany MULABU
Head of forestry activities and (a.i.) thecassava plant
(also: owner of farm in Mampu)
Novacel Sprl
05/02/2011
09/02/2011
18/03/2011
20/03/2011
13/04/2011
Prof Jean LEJOLY
Botanist
Director of research activities for GI Agro
GI Agro [Université Libre de Bruxelles]
08/02/2011 Mr Amouda NGANKILI
Head of sales at the Ibi site
Novacel Sprl
08/02/2011 Mr Wa Mfulama NKOBA
Director
CADIM – Centre d’Appui au DéveloppementIntégral de Mbankana
18/03/2011 Mr Tolérant LUBALEGA
Agronomist, doctoral student
GI Agro [Université Laval, Québec]
18/03/2011 Mr Ruphin NGABULONGO
Head of quality control, data managementand monitoring/verification activities
Novacel Sprl
22/03/2011 Mr Jean-Pierre KATALAY
Chairman
Union des Fermiers Agroforestiers de Mampu(UFAM)
22/03/2011 Mr Laurent KISANDZAU
First secretary
Union des Fermiers Agroforestiers de Mampu(UFAM)
28/03/2011 Mr Ernest (René) KALUAMA
Assistant to the customary chief
[Mutiene, Commune of Maluku, Province ofKinshasa]
28/03/2011 Mr Médard MILANDA
Son of the customary chief
[Mutiene, Commune of Maluku, Province ofKinshasa]
04/04/2011
06/04/2011
08/04/2011
Mr Louison MUNGU
Head of sales, manager of the Kinshasa officeand warehouse
Novacel Sprl
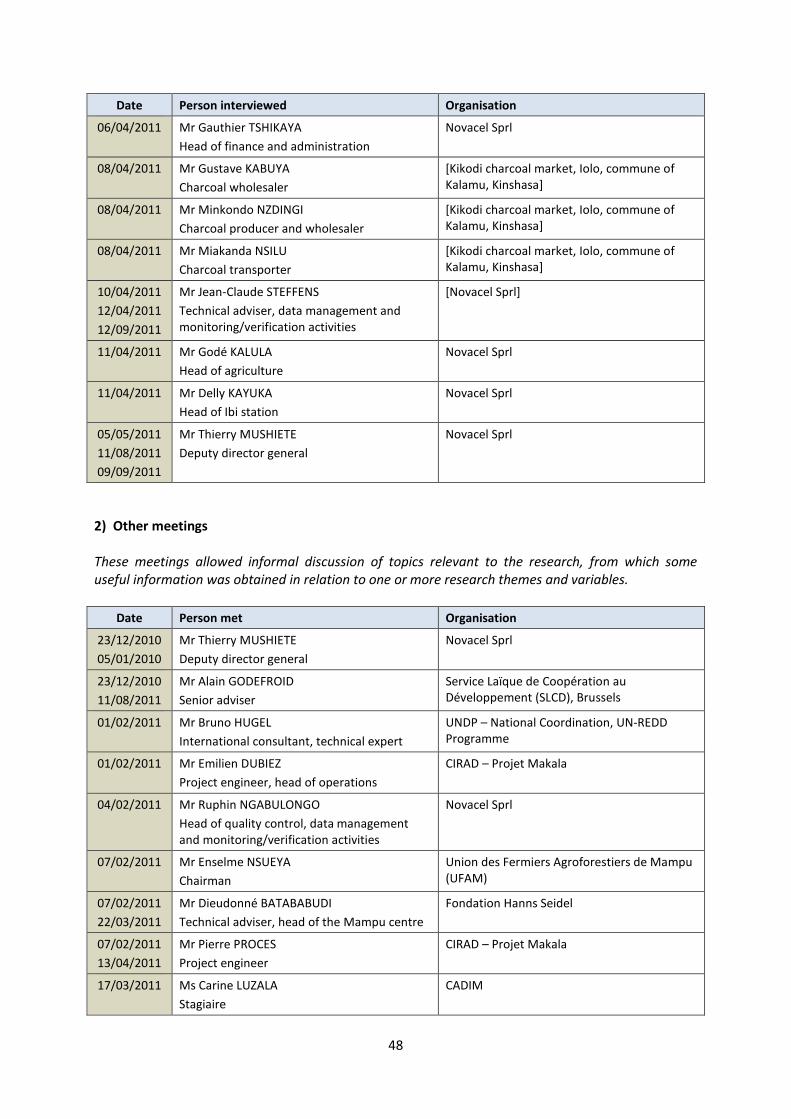
48
Date Person interviewed Organisation
06/04/2011 Mr Gauthier TSHIKAYA
Head of finance and administration
Novacel Sprl
08/04/2011 Mr Gustave KABUYA
Charcoal wholesaler
[Kikodi charcoal market, Iolo, commune ofKalamu, Kinshasa]
08/04/2011 Mr Minkondo NZDINGI
Charcoal producer and wholesaler
[Kikodi charcoal market, Iolo, commune ofKalamu, Kinshasa]
08/04/2011 Mr Miakanda NSILU
Charcoal transporter
[Kikodi charcoal market, Iolo, commune ofKalamu, Kinshasa]
10/04/2011
12/04/2011
12/09/2011
Mr Jean-Claude STEFFENS
Technical adviser, data management andmonitoring/verification activities
[Novacel Sprl]
11/04/2011 Mr Godé KALULA
Head of agriculture
Novacel Sprl
11/04/2011 Mr Delly KAYUKA
Head of Ibi station
Novacel Sprl
05/05/2011
11/08/2011
09/09/2011
Mr Thierry MUSHIETE
Deputy director general
Novacel Sprl
2) Other meetings
These meetings allowed informal discussion of topics relevant to the research, from which someuseful information was obtained in relation to one or more research themes and variables.
Date Person met Organisation
23/12/2010
05/01/2010
Mr Thierry MUSHIETE
Deputy director general
Novacel Sprl
23/12/2010
11/08/2011
Mr Alain GODEFROID
Senior adviser
Service Laïque de Coopération auDéveloppement (SLCD), Brussels
01/02/2011 Mr Bruno HUGEL
International consultant, technical expert
UNDP – National Coordination, UN-REDDProgramme
01/02/2011 Mr Emilien DUBIEZ
Project engineer, head of operations
CIRAD – Projet Makala
04/02/2011 Mr Ruphin NGABULONGO
Head of quality control, data managementand monitoring/verification activities
Novacel Sprl
07/02/2011 Mr Enselme NSUEYA
Chairman
Union des Fermiers Agroforestiers de Mampu(UFAM)
07/02/2011
22/03/2011
Mr Dieudonné BATABABUDI
Technical adviser, head of the Mampu centre
Fondation Hanns Seidel
07/02/2011
13/04/2011
Mr Pierre PROCES
Project engineer
CIRAD – Projet Makala
17/03/2011 Ms Carine LUZALA
Stagiaire
CADIM
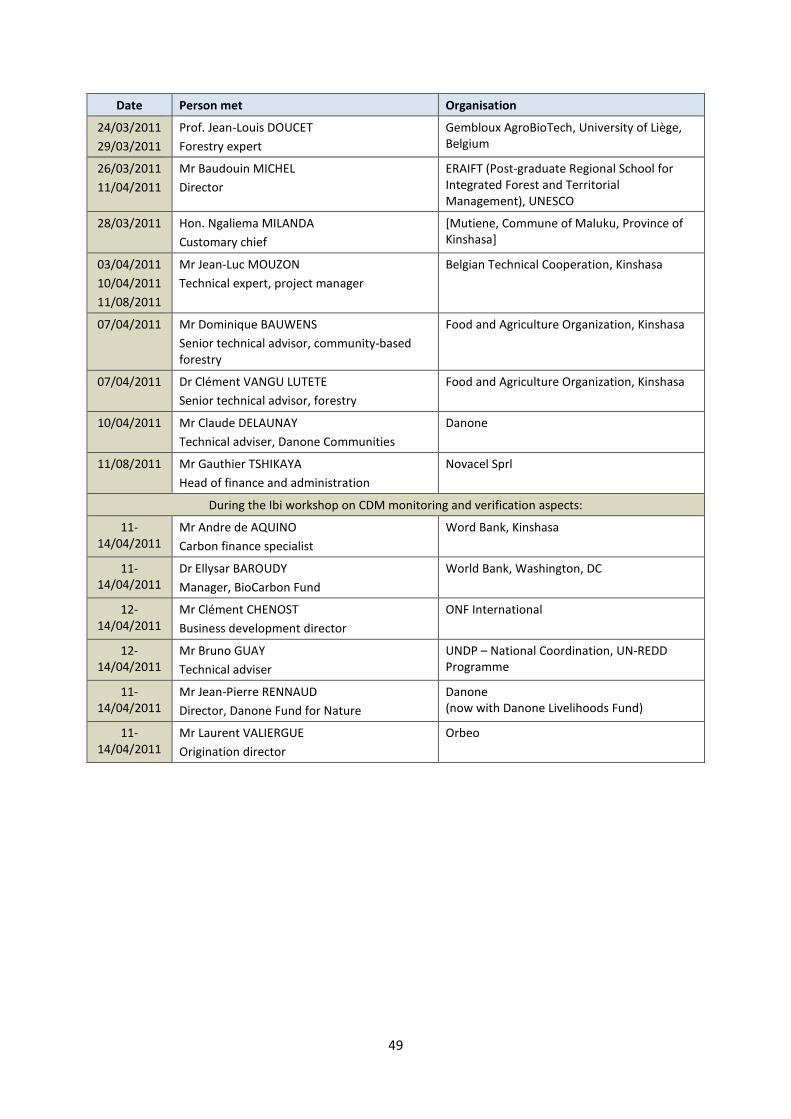
49
Date Person met Organisation
24/03/2011
29/03/2011
Prof. Jean-Louis DOUCET
Forestry expert
Gembloux AgroBioTech, University of Liège,Belgium
26/03/2011
11/04/2011
Mr Baudouin MICHEL
Director
ERAIFT (Post-graduate Regional School forIntegrated Forest and TerritorialManagement), UNESCO
28/03/2011 Hon. Ngaliema MILANDA
Customary chief
[Mutiene, Commune of Maluku, Province ofKinshasa]
03/04/2011
10/04/2011
11/08/2011
Mr Jean-Luc MOUZON
Technical expert, project manager
Belgian Technical Cooperation, Kinshasa
07/04/2011 Mr Dominique BAUWENS
Senior technical advisor, community-basedforestry
Food and Agriculture Organization, Kinshasa
07/04/2011 Dr Clément VANGU LUTETE
Senior technical advisor, forestry
Food and Agriculture Organization, Kinshasa
10/04/2011 Mr Claude DELAUNAY
Technical adviser, Danone Communities
Danone
11/08/2011 Mr Gauthier TSHIKAYA
Head of finance and administration
Novacel Sprl
During the Ibi workshop on CDM monitoring and verification aspects:
11-14/04/2011
Mr Andre de AQUINO
Carbon finance specialist
Word Bank, Kinshasa
11-14/04/2011
Dr Ellysar BAROUDY
Manager, BioCarbon Fund
World Bank, Washington, DC
12-14/04/2011
Mr Clément CHENOST
Business development director
ONF International
12-14/04/2011
Mr Bruno GUAY
Technical adviser
UNDP – National Coordination, UN-REDDProgramme
11-14/04/2011
Mr Jean-Pierre RENNAUD
Director, Danone Fund for Nature
Danone(now with Danone Livelihoods Fund)
11-14/04/2011
Mr Laurent VALIERGUE
Origination director
Orbeo

50
Annex IV: Survey – Questionnaire
The questionnaire hereafter draws significantly on the survey methodology developed by Landry(2009) for ‘[analysing] the potential socioeconomic impact of establishing plantation forestry on ruralcommunities in Sanga District, Niassa Province, Mozambique’ (see also Landry and Chirwa 2011).Some of the questions are also inspired by the methodology developed for investigating thesocioeconomic aspects of the wood energy supply chain in DRC (Ingram and Schure, 2010) and otherpreparatory work (Schure et al, 2010) conducted in the context of the Makala Project.
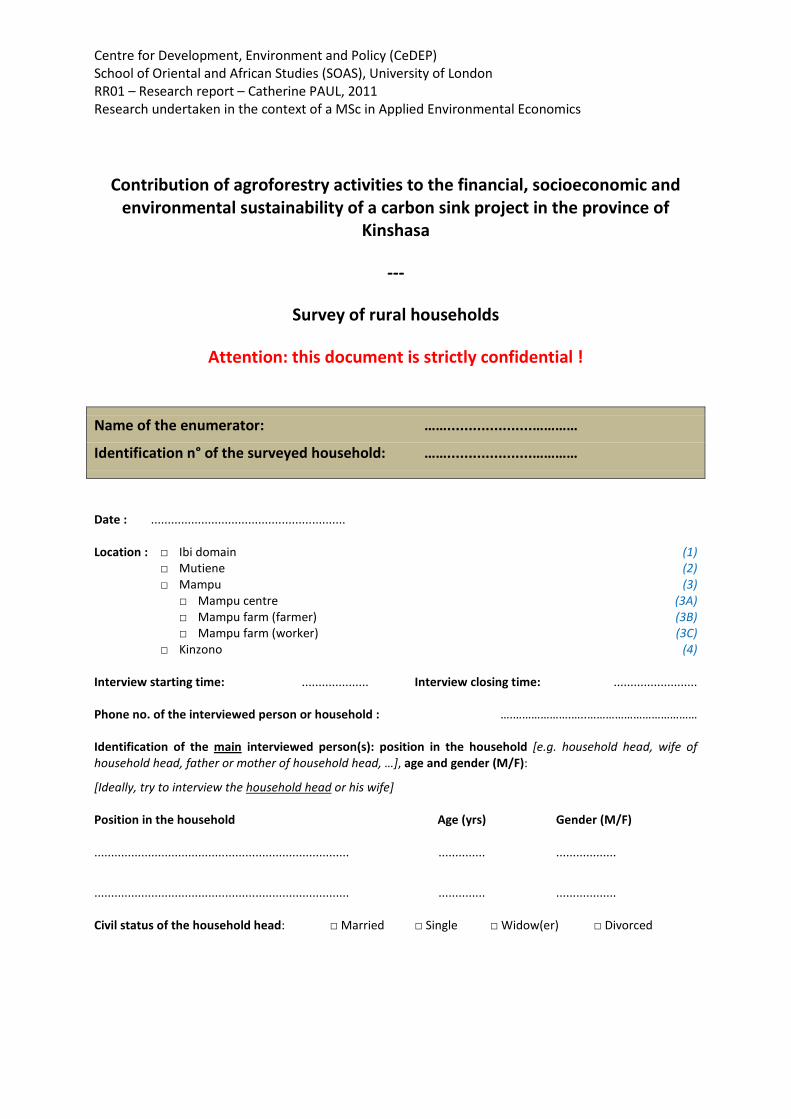
Centre for Development, Environment and Policy (CeDEP)School of Oriental and African Studies (SOAS), University of LondonRR01 – Research report – Catherine PAUL, 2011Research undertaken in the context of a MSc in Applied Environmental Economics
Contribution of agroforestry activities to the financial, socioeconomic andenvironmental sustainability of a carbon sink project in the province of
Kinshasa
---
Survey of rural households
Attention: this document is strictly confidential !
Name of the enumerator: ……....................…………
Identification n° of the surveyed household: ……....................…………
Date : ..........................................................
Location : □ Ibi domain (1) □ Mutiene (2) □ Mampu (3)
□ Mampu centre (3A)□ Mampu farm (farmer) (3B)□ Mampu farm (worker) (3C)
□ Kinzono (4)
Interview starting time: .................... Interview closing time: .........................
Phone no. of the interviewed person or household : ….……………….…..………………………………
Identification of the main interviewed person(s): position in the household [e.g. household head, wife ofhousehold head, father or mother of household head, …], age and gender (M/F):
[Ideally, try to interview the household head or his wife]
Position in the household Age (yrs) Gender (M/F)
............................................................................ .............. ..................
............................................................................ .............. ..................
Civil status of the household head: □ Married □ Single □ Widow(er) □ Divorced
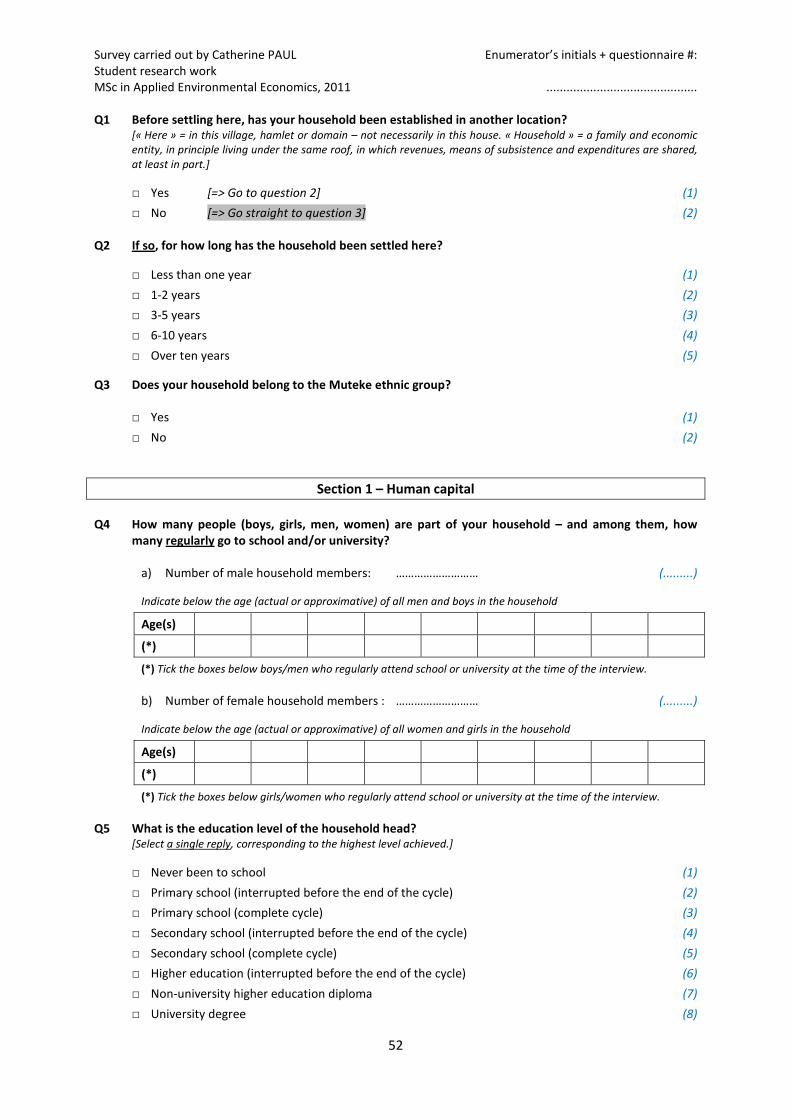
Survey carried out by Catherine PAUL Enumerator’s initials + questionnaire #:Student research workMSc in Applied Environmental Economics, 2011 .............................................
52
Q1 Before settling here, has your household been established in another location?[« Here » = in this village, hamlet or domain – not necessarily in this house. « Household » = a family and economicentity, in principle living under the same roof, in which revenues, means of subsistence and expenditures are shared,at least in part.]
□ Yes [=> Go to question 2] (1)
□ No [=> Go straight to question 3] (2)
Q2 If so, for how long has the household been settled here?
□ Less than one year (1)
□ 1-2 years (2)
□ 3-5 years (3)
□ 6-10 years (4)
□ Over ten years (5)
Q3 Does your household belong to the Muteke ethnic group?
□ Yes (1)
□ No (2)
Section 1 – Human capital
Q4 How many people (boys, girls, men, women) are part of your household – and among them, howmany regularly go to school and/or university?
a) Number of male household members: ……………………… (.........)
Indicate below the age (actual or approximative) of all men and boys in the household
Age(s)
(*)
(*) Tick the boxes below boys/men who regularly attend school or university at the time of the interview.
b) Number of female household members : ……………………… (.........)
Indicate below the age (actual or approximative) of all women and girls in the household
Age(s)
(*)
(*) Tick the boxes below girls/women who regularly attend school or university at the time of the interview.
Q5 What is the education level of the household head?[Select a single reply, corresponding to the highest level achieved.]
□ Never been to school (1)
□ Primary school (interrupted before the end of the cycle) (2)
□ Primary school (complete cycle) (3)
□ Secondary school (interrupted before the end of the cycle) (4)
□ Secondary school (complete cycle) (5)
□ Higher education (interrupted before the end of the cycle) (6)
□ Non-university higher education diploma (7)
□ University degree (8)
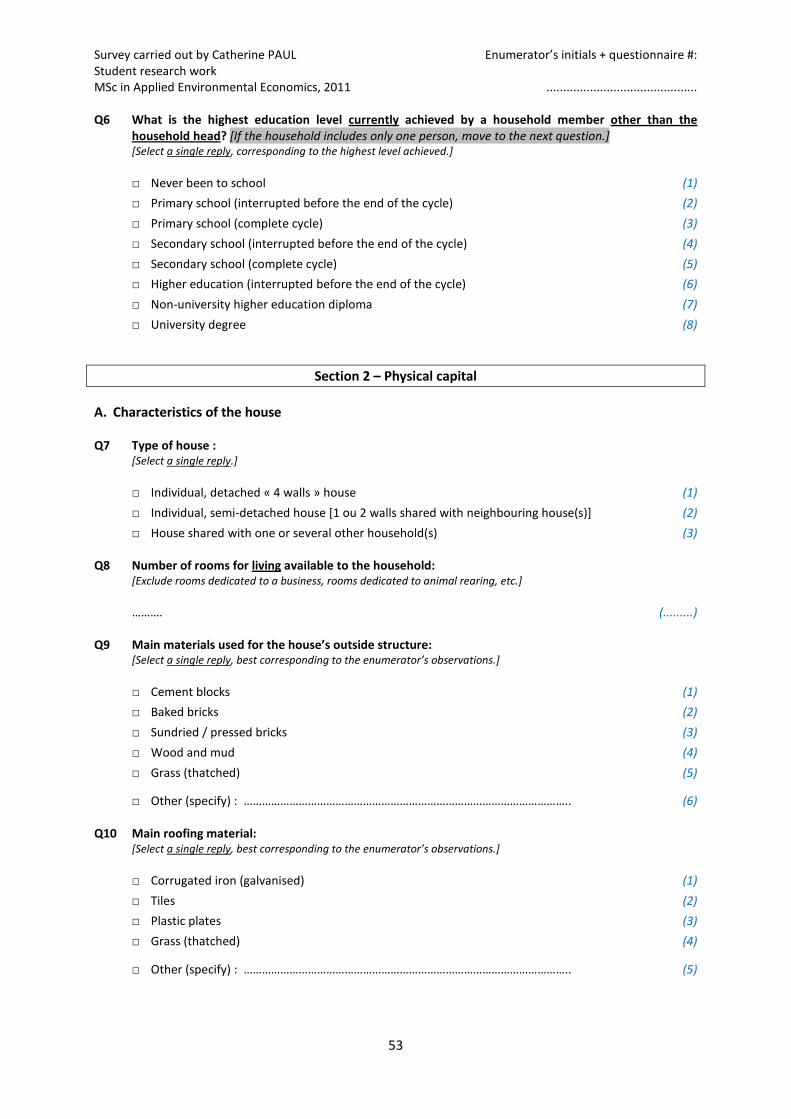
Survey carried out by Catherine PAUL Enumerator’s initials + questionnaire #:Student research workMSc in Applied Environmental Economics, 2011 .............................................
53
Q6 What is the highest education level currently achieved by a household member other than thehousehold head? [If the household includes only one person, move to the next question.][Select a single reply, corresponding to the highest level achieved.]
□ Never been to school (1)
□ Primary school (interrupted before the end of the cycle) (2)
□ Primary school (complete cycle) (3)
□ Secondary school (interrupted before the end of the cycle) (4)
□ Secondary school (complete cycle) (5)
□ Higher education (interrupted before the end of the cycle) (6)
□ Non-university higher education diploma (7)
□ University degree (8)
Section 2 – Physical capital
A. Characteristics of the house
Q7 Type of house :[Select a single reply.]
□ Individual, detached « 4 walls » house (1)
□ Individual, semi-detached house [1 ou 2 walls shared with neighbouring house(s)] (2)
□ House shared with one or several other household(s) (3)
Q8 Number of rooms for living available to the household:[Exclude rooms dedicated to a business, rooms dedicated to animal rearing, etc.]
………. (.........)
Q9 Main materials used for the house’s outside structure:[Select a single reply, best corresponding to the enumerator’s observations.]
□ Cement blocks (1)
□ Baked bricks (2)
□ Sundried / pressed bricks (3)
□ Wood and mud (4)
□ Grass (thatched) (5)
□ Other (specify) : …………………………………………………………………………………………….. (6)
Q10 Main roofing material:[Select a single reply, best corresponding to the enumerator’s observations.]
□ Corrugated iron (galvanised) (1)
□ Tiles (2)
□ Plastic plates (3)
□ Grass (thatched) (4)
□ Other (specify) : …………………………………………………………………………………………….. (5)
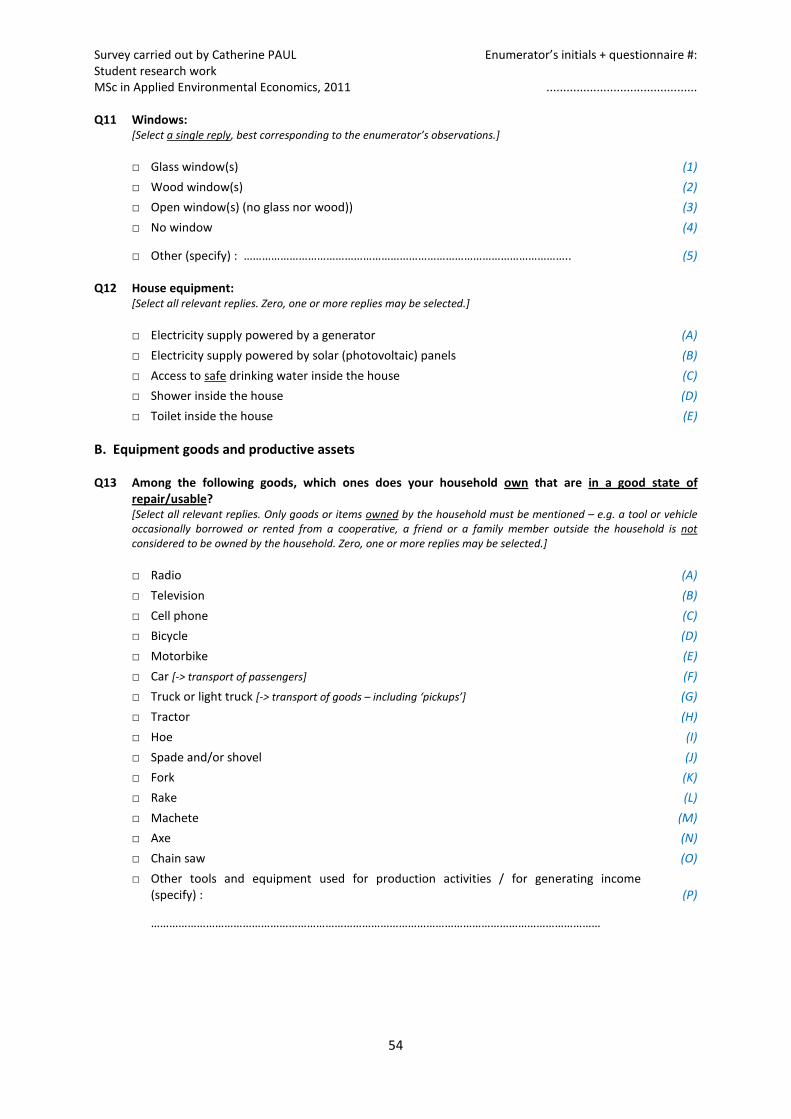
Survey carried out by Catherine PAUL Enumerator’s initials + questionnaire #:Student research workMSc in Applied Environmental Economics, 2011 .............................................
54
Q11 Windows:[Select a single reply, best corresponding to the enumerator’s observations.]
□ Glass window(s) (1)
□ Wood window(s) (2)
□ Open window(s) (no glass nor wood)) (3)
□ No window (4)
□ Other (specify) : …………………………………………………………………………………………….. (5)
Q12 House equipment:[Select all relevant replies. Zero, one or more replies may be selected.]
□ Electricity supply powered by a generator (A)
□ Electricity supply powered by solar (photovoltaic) panels (B)
□ Access to safe drinking water inside the house (C)
□ Shower inside the house (D)
□ Toilet inside the house (E)
B. Equipment goods and productive assets
Q13 Among the following goods, which ones does your household own that are in a good state ofrepair/usable?[Select all relevant replies. Only goods or items owned by the household must be mentioned – e.g. a tool or vehicleoccasionally borrowed or rented from a cooperative, a friend or a family member outside the household is notconsidered to be owned by the household. Zero, one or more replies may be selected.]
□ Radio (A)
□ Television (B)
□ Cell phone (C)
□ Bicycle (D)
□ Motorbike (E)
□ Car [-> transport of passengers] (F)
□ Truck or light truck [-> transport of goods – including ‘pickups’] (G)
□ Tractor (H)
□ Hoe (I)
□ Spade and/or shovel (J)
□ Fork (K)
□ Rake (L)
□ Machete (M)
□ Axe (N)
□ Chain saw (O)
□ Other tools and equipment used for production activities / for generating income (specify) : (P)
…………………………………………………………………………………………………………………………………
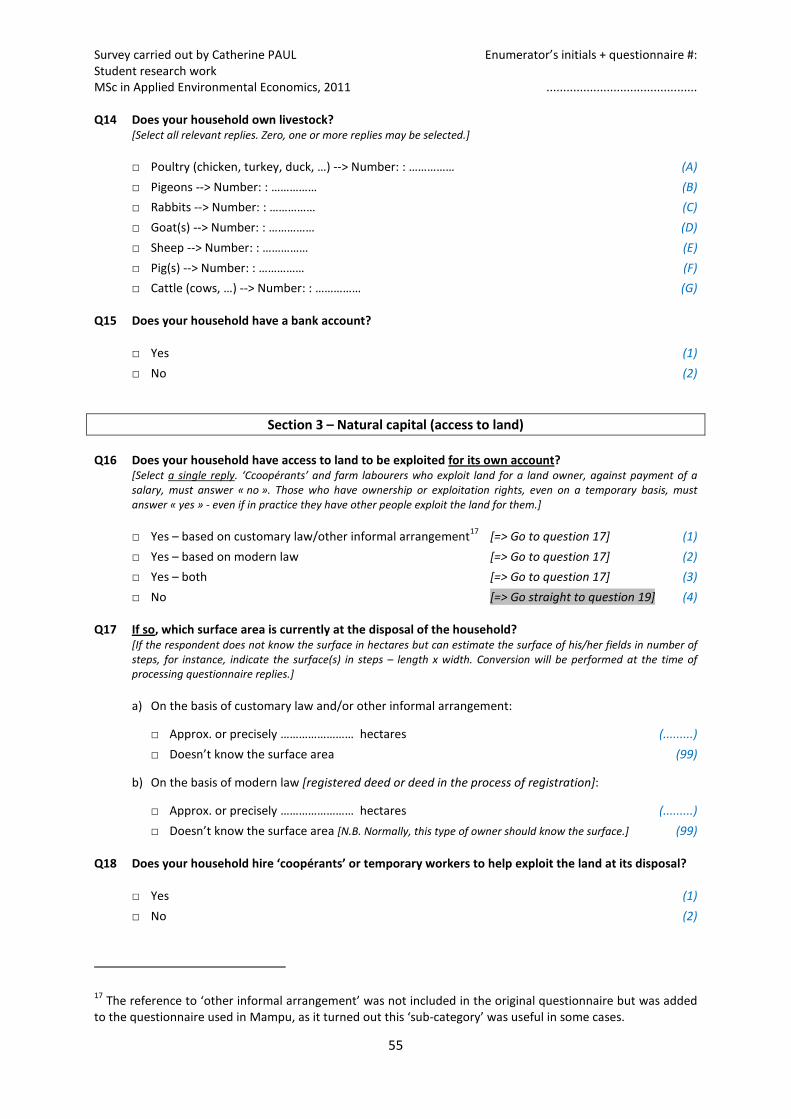
Survey carried out by Catherine PAUL Enumerator’s initials + questionnaire #:Student research workMSc in Applied Environmental Economics, 2011 .............................................
55
Q14 Does your household own livestock?[Select all relevant replies. Zero, one or more replies may be selected.]
□ Poultry (chicken, turkey, duck, …) --> Number: : …………… (A)
□ Pigeons --> Number: : …………… (B)
□ Rabbits --> Number: : …………… (C)
□ Goat(s) --> Number: : …………… (D)
□ Sheep --> Number: : …………… (E)
□ Pig(s) --> Number: : …………… (F)
□ Cattle (cows, …) --> Number: : …………… (G)
Q15 Does your household have a bank account?
□ Yes (1)
□ No (2)
Section 3 – Natural capital (access to land)
Q16 Does your household have access to land to be exploited for its own account?[Select a single reply. ‘Ccoopérants’ and farm labourers who exploit land for a land owner, against payment of asalary, must answer « no ». Those who have ownership or exploitation rights, even on a temporary basis, mustanswer « yes » - even if in practice they have other people exploit the land for them.]
□ Yes – based on customary law/other informal arrangement17
[=> Go to question 17] (1)
□ Yes – based on modern law [=> Go to question 17] (2)
□ Yes – both [=> Go to question 17] (3)
□ No [=> Go straight to question 19] (4)
Q17 If so, which surface area is currently at the disposal of the household?[If the respondent does not know the surface in hectares but can estimate the surface of his/her fields in number ofsteps, for instance, indicate the surface(s) in steps – length x width. Conversion will be performed at the time ofprocessing questionnaire replies.]
a) On the basis of customary law and/or other informal arrangement:
□ Approx. or precisely …………………… hectares (.........)
□ Doesn’t know the surface area (99)
b) On the basis of modern law [registered deed or deed in the process of registration]:
□ Approx. or precisely …………………… hectares (.........)
□ Doesn’t know the surface area [N.B. Normally, this type of owner should know the surface.] (99)
Q18 Does your household hire ‘coopérants’ or temporary workers to help exploit the land at its disposal?
□ Yes (1)
□ No (2)
17The reference to ‘other informal arrangement’ was not included in the original questionnaire but was added
to the questionnaire used in Mampu, as it turned out this ‘sub-category’ was useful in some cases.
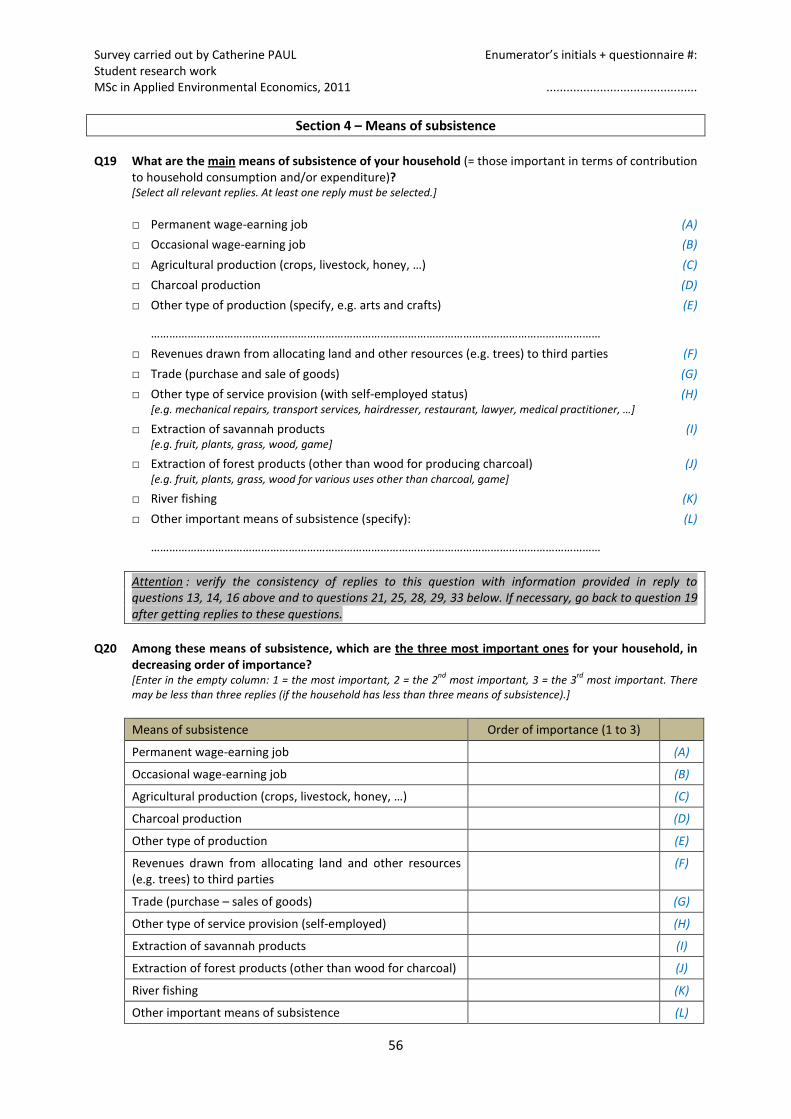
Survey carried out by Catherine PAUL Enumerator’s initials + questionnaire #:Student research workMSc in Applied Environmental Economics, 2011 .............................................
56
Section 4 – Means of subsistence
Q19 What are the main means of subsistence of your household (= those important in terms of contributionto household consumption and/or expenditure)?[Select all relevant replies. At least one reply must be selected.]
□ Permanent wage-earning job (A)
□ Occasional wage-earning job (B)
□ Agricultural production (crops, livestock, honey, …) (C)
□ Charcoal production (D)
□ Other type of production (specify, e.g. arts and crafts) (E)
…………………………………………………………………………………………………………………………………
□ Revenues drawn from allocating land and other resources (e.g. trees) to third parties (F)
□ Trade (purchase and sale of goods) (G)
□ Other type of service provision (with self-employed status) (H)[e.g. mechanical repairs, transport services, hairdresser, restaurant, lawyer, medical practitioner, …]
□ Extraction of savannah products (I)[e.g. fruit, plants, grass, wood, game]
□ Extraction of forest products (other than wood for producing charcoal) (J)[e.g. fruit, plants, grass, wood for various uses other than charcoal, game]
□ River fishing (K)
□ Other important means of subsistence (specify): (L)
…………………………………………………………………………………………………………………………………
Attention : verify the consistency of replies to this question with information provided in reply toquestions 13, 14, 16 above and to questions 21, 25, 28, 29, 33 below. If necessary, go back to question 19after getting replies to these questions.
Q20 Among these means of subsistence, which are the three most important ones for your household, indecreasing order of importance?[Enter in the empty column: 1 = the most important, 2 = the 2
ndmost important, 3 = the 3
rdmost important. There
may be less than three replies (if the household has less than three means of subsistence).]
Means of subsistence Order of importance (1 to 3)
Permanent wage-earning job (A)
Occasional wage-earning job (B)
Agricultural production (crops, livestock, honey, …) (C)
Charcoal production (D)
Other type of production (E)
Revenues drawn from allocating land and other resources(e.g. trees) to third parties
(F)
Trade (purchase – sales of goods) (G)
Other type of service provision (self-employed) (H)
Extraction of savannah products (I)
Extraction of forest products (other than wood for charcoal) (J)
River fishing (K)
Other important means of subsistence (L)
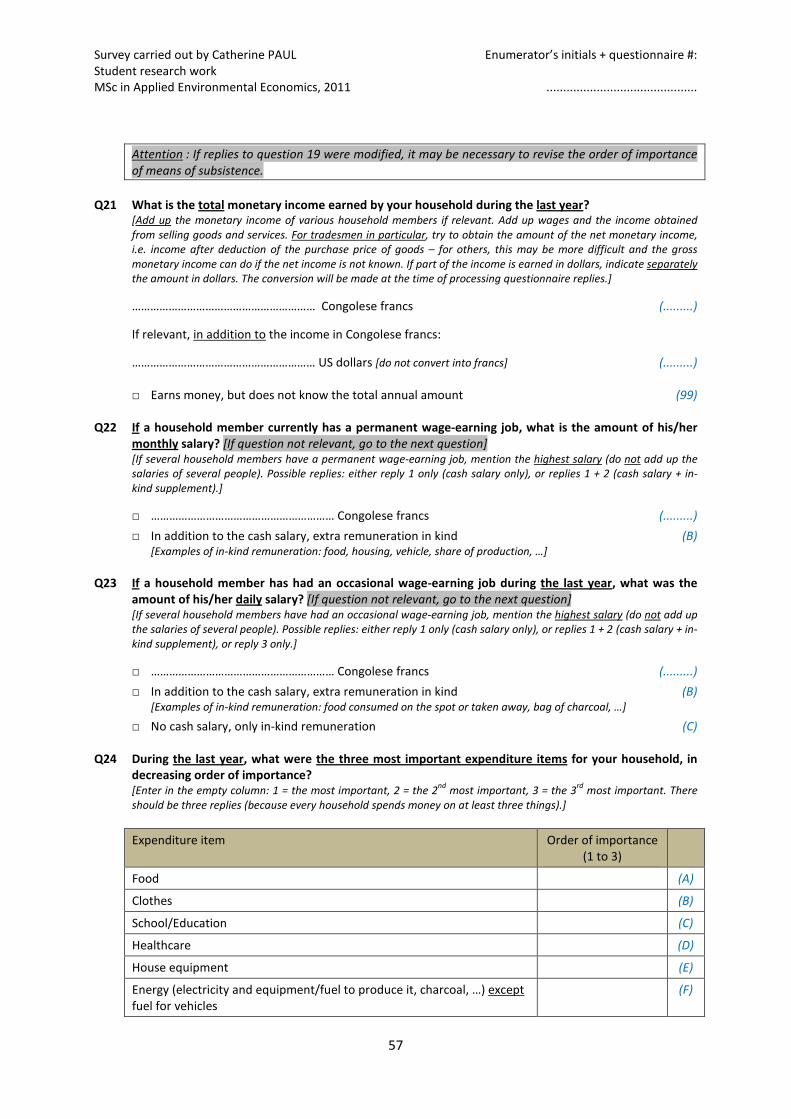
Survey carried out by Catherine PAUL Enumerator’s initials + questionnaire #:Student research workMSc in Applied Environmental Economics, 2011 .............................................
57
Attention : If replies to question 19 were modified, it may be necessary to revise the order of importanceof means of subsistence.
Q21 What is the total monetary income earned by your household during the last year?[Add up the monetary income of various household members if relevant. Add up wages and the income obtainedfrom selling goods and services. For tradesmen in particular, try to obtain the amount of the net monetary income,i.e. income after deduction of the purchase price of goods – for others, this may be more difficult and the grossmonetary income can do if the net income is not known. If part of the income is earned in dollars, indicate separatelythe amount in dollars. The conversion will be made at the time of processing questionnaire replies.]
…………………………………………………… Congolese francs (.........)
If relevant, in addition to the income in Congolese francs:
…………………………………………………… US dollars [do not convert into francs] (.........)
□ Earns money, but does not know the total annual amount (99)
Q22 If a household member currently has a permanent wage-earning job, what is the amount of his/hermonthly salary? [If question not relevant, go to the next question][If several household members have a permanent wage-earning job, mention the highest salary (do not add up thesalaries of several people). Possible replies: either reply 1 only (cash salary only), or replies 1 + 2 (cash salary + in-kind supplement).]
□ …………………………………………………… Congolese francs (.........)
□ In addition to the cash salary, extra remuneration in kind (B)[Examples of in-kind remuneration: food, housing, vehicle, share of production, …]
Q23 If a household member has had an occasional wage-earning job during the last year, what was theamount of his/her daily salary? [If question not relevant, go to the next question][If several household members have had an occasional wage-earning job, mention the highest salary (do not add upthe salaries of several people). Possible replies: either reply 1 only (cash salary only), or replies 1 + 2 (cash salary + in-kind supplement), or reply 3 only.]
□ …………………………………………………… Congolese francs (.........)
□ In addition to the cash salary, extra remuneration in kind (B)[Examples of in-kind remuneration: food consumed on the spot or taken away, bag of charcoal, …]
□ No cash salary, only in-kind remuneration (C)
Q24 During the last year, what were the three most important expenditure items for your household, indecreasing order of importance?[Enter in the empty column: 1 = the most important, 2 = the 2
ndmost important, 3 = the 3
rdmost important. There
should be three replies (because every household spends money on at least three things).]
Expenditure item Order of importance(1 to 3)
Food (A)
Clothes (B)
School/Education (C)
Healthcare (D)
House equipment (E)
Energy (electricity and equipment/fuel to produce it, charcoal, …) exceptfuel for vehicles
(F)
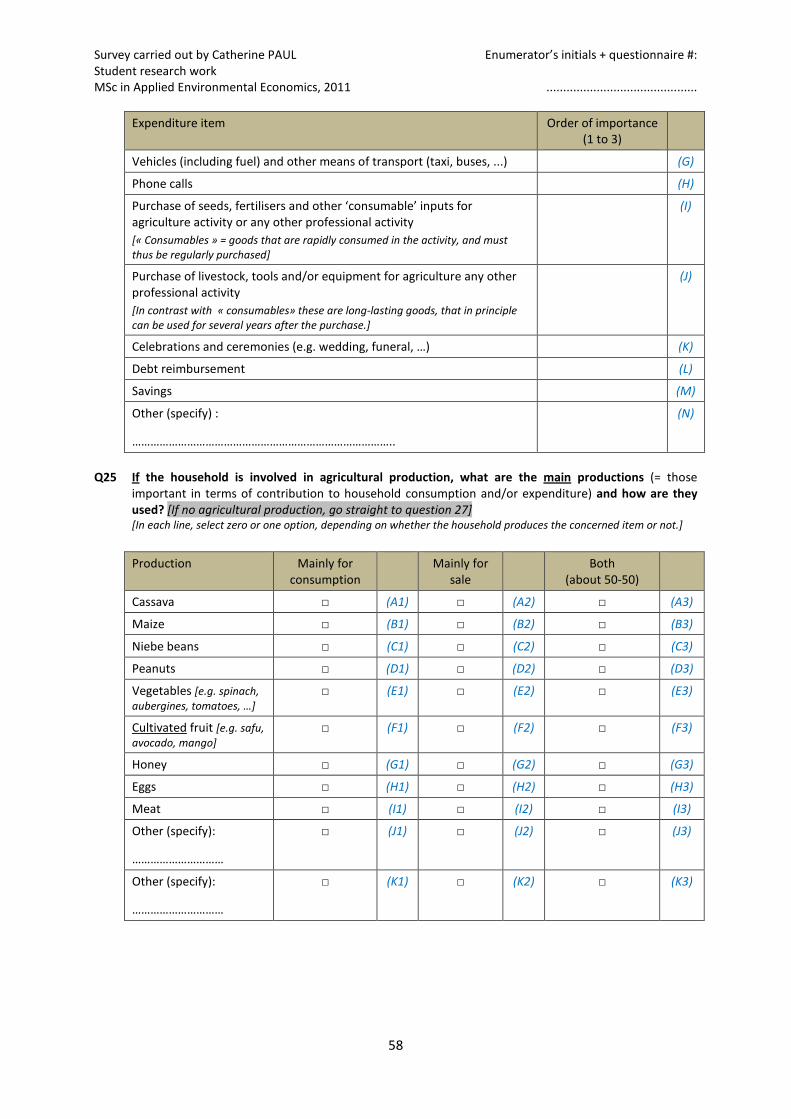
Survey carried out by Catherine PAUL Enumerator’s initials + questionnaire #:Student research workMSc in Applied Environmental Economics, 2011 .............................................
58
Expenditure item Order of importance(1 to 3)
Vehicles (including fuel) and other means of transport (taxi, buses, ...) (G)
Phone calls (H)
Purchase of seeds, fertilisers and other ‘consumable’ inputs foragriculture activity or any other professional activity
[« Consumables » = goods that are rapidly consumed in the activity, and mustthus be regularly purchased]
(I)
Purchase of livestock, tools and/or equipment for agriculture any otherprofessional activity
[In contrast with « consumables» these are long-lasting goods, that in principlecan be used for several years after the purchase.]
(J)
Celebrations and ceremonies (e.g. wedding, funeral, …) (K)
Debt reimbursement (L)
Savings (M)
Other (specify) :
…………………………………………………………………………..
(N)
Q25 If the household is involved in agricultural production, what are the main productions (= thoseimportant in terms of contribution to household consumption and/or expenditure) and how are theyused? [If no agricultural production, go straight to question 27][In each line, select zero or one option, depending on whether the household produces the concerned item or not.]
Production Mainly forconsumption
Mainly forsale
Both(about 50-50)
Cassava □ (A1) □ (A2) □ (A3)
Maize □ (B1) □ (B2) □ (B3)
Niebe beans □ (C1) □ (C2) □ (C3)
Peanuts □ (D1) □ (D2) □ (D3)
Vegetables [e.g. spinach,aubergines, tomatoes, …]
□ (E1) □ (E2) □ (E3)
Cultivated fruit [e.g. safu,avocado, mango]
□ (F1) □ (F2) □ (F3)
Honey □ (G1) □ (G2) □ (G3)
Eggs □ (H1) □ (H2) □ (H3)
Meat □ (I1) □ (I2) □ (I3)
Other (specify):
…………………………
□ (J1) □ (J2) □ (J3)
Other (specify):
…………………………
□ (K1) □ (K2) □ (K3)
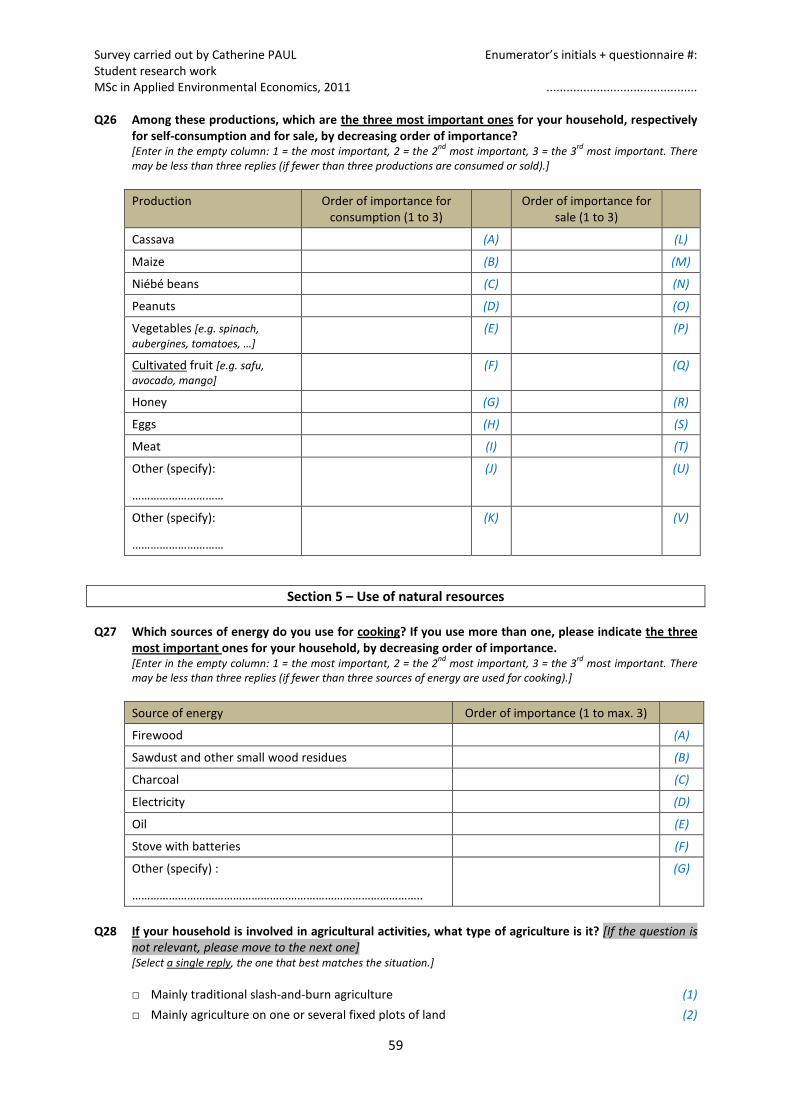
Survey carried out by Catherine PAUL Enumerator’s initials + questionnaire #:Student research workMSc in Applied Environmental Economics, 2011 .............................................
59
Q26 Among these productions, which are the three most important ones for your household, respectivelyfor self-consumption and for sale, by decreasing order of importance?[Enter in the empty column: 1 = the most important, 2 = the 2
ndmost important, 3 = the 3
rdmost important. There
may be less than three replies (if fewer than three productions are consumed or sold).]
Production Order of importance forconsumption (1 to 3)
Order of importance forsale (1 to 3)
Cassava (A) (L)
Maize (B) (M)
Niébé beans (C) (N)
Peanuts (D) (O)
Vegetables [e.g. spinach,
aubergines, tomatoes, …]
(E) (P)
Cultivated fruit [e.g. safu,avocado, mango]
(F) (Q)
Honey (G) (R)
Eggs (H) (S)
Meat (I) (T)
Other (specify):
…………………………
(J) (U)
Other (specify):
…………………………
(K) (V)
Section 5 – Use of natural resources
Q27 Which sources of energy do you use for cooking? If you use more than one, please indicate the threemost important ones for your household, by decreasing order of importance.[Enter in the empty column: 1 = the most important, 2 = the 2
ndmost important, 3 = the 3
rdmost important. There
may be less than three replies (if fewer than three sources of energy are used for cooking).]
Source of energy Order of importance (1 to max. 3)
Firewood (A)
Sawdust and other small wood residues (B)
Charcoal (C)
Electricity (D)
Oil (E)
Stove with batteries (F)
Other (specify) :
…………………………………………………………………………………..
(G)
Q28 If your household is involved in agricultural activities, what type of agriculture is it? [If the question isnot relevant, please move to the next one][Select a single reply, the one that best matches the situation.]
□ Mainly traditional slash-and-burn agriculture (1)
□ Mainly agriculture on one or several fixed plots of land (2)
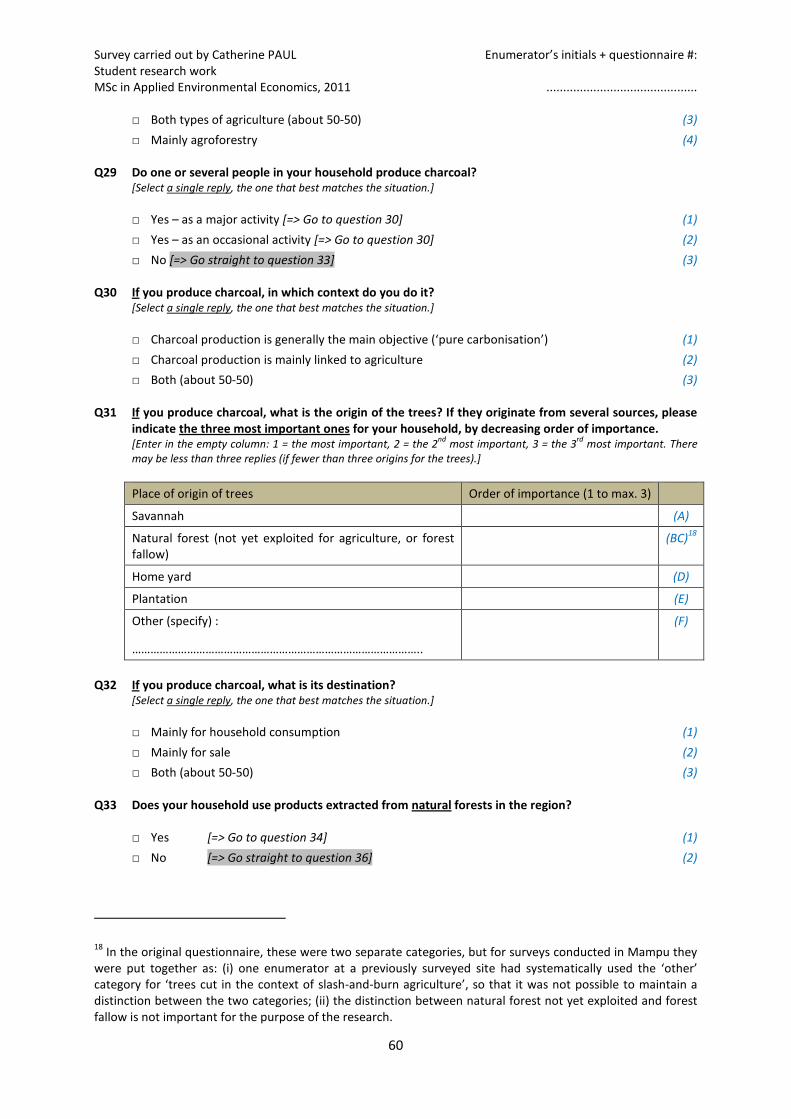
Survey carried out by Catherine PAUL Enumerator’s initials + questionnaire #:Student research workMSc in Applied Environmental Economics, 2011 .............................................
60
□ Both types of agriculture (about 50-50) (3)
□ Mainly agroforestry (4)
Q29 Do one or several people in your household produce charcoal?[Select a single reply, the one that best matches the situation.]
□ Yes – as a major activity [=> Go to question 30] (1)
□ Yes – as an occasional activity [=> Go to question 30] (2)
□ No [=> Go straight to question 33] (3)
Q30 If you produce charcoal, in which context do you do it?[Select a single reply, the one that best matches the situation.]
□ Charcoal production is generally the main objective (‘pure carbonisation’) (1)
□ Charcoal production is mainly linked to agriculture (2)
□ Both (about 50-50) (3)
Q31 If you produce charcoal, what is the origin of the trees? If they originate from several sources, pleaseindicate the three most important ones for your household, by decreasing order of importance.[Enter in the empty column: 1 = the most important, 2 = the 2
ndmost important, 3 = the 3
rdmost important. There
may be less than three replies (if fewer than three origins for the trees).]
Place of origin of trees Order of importance (1 to max. 3)
Savannah (A)
Natural forest (not yet exploited for agriculture, or forestfallow)
(BC)18
Home yard (D)
Plantation (E)
Other (specify) :
…………………………………………………………………………………..
(F)
Q32 If you produce charcoal, what is its destination?[Select a single reply, the one that best matches the situation.]
□ Mainly for household consumption (1)
□ Mainly for sale (2)
□ Both (about 50-50) (3)
Q33 Does your household use products extracted from natural forests in the region?
□ Yes [=> Go to question 34] (1)
□ No [=> Go straight to question 36] (2)
18In the original questionnaire, these were two separate categories, but for surveys conducted in Mampu they
were put together as: (i) one enumerator at a previously surveyed site had systematically used the ‘other’category for ‘trees cut in the context of slash-and-burn agriculture’, so that it was not possible to maintain adistinction between the two categories; (ii) the distinction between natural forest not yet exploited and forestfallow is not important for the purpose of the research.
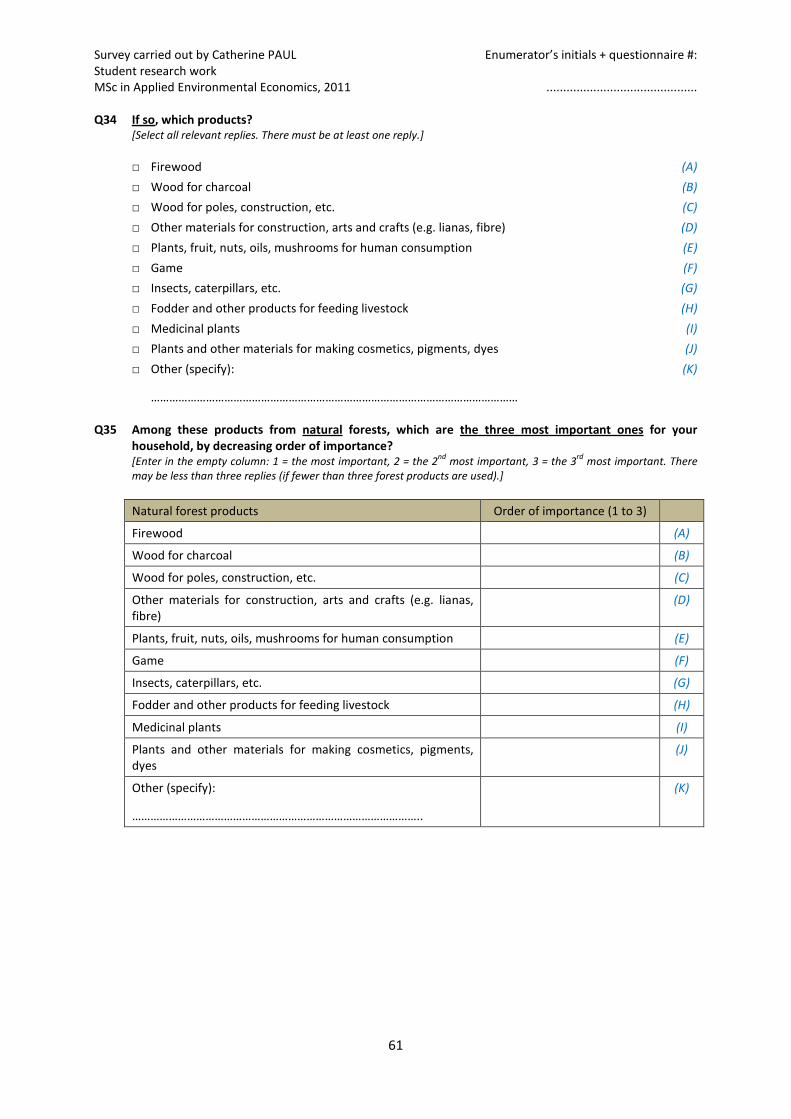
Survey carried out by Catherine PAUL Enumerator’s initials + questionnaire #:Student research workMSc in Applied Environmental Economics, 2011 .............................................
61
Q34 If so, which products?[Select all relevant replies. There must be at least one reply.]
□ Firewood (A)
□ Wood for charcoal (B)
□ Wood for poles, construction, etc. (C)
□ Other materials for construction, arts and crafts (e.g. lianas, fibre) (D)
□ Plants, fruit, nuts, oils, mushrooms for human consumption (E)
□ Game (F)
□ Insects, caterpillars, etc. (G)
□ Fodder and other products for feeding livestock (H)
□ Medicinal plants (I)
□ Plants and other materials for making cosmetics, pigments, dyes (J)
□ Other (specify): (K)
…………………………………………………………………………………………………………
Q35 Among these products from natural forests, which are the three most important ones for yourhousehold, by decreasing order of importance?[Enter in the empty column: 1 = the most important, 2 = the 2
ndmost important, 3 = the 3
rdmost important. There
may be less than three replies (if fewer than three forest products are used).]
Natural forest products Order of importance (1 to 3)
Firewood (A)
Wood for charcoal (B)
Wood for poles, construction, etc. (C)
Other materials for construction, arts and crafts (e.g. lianas,fibre)
(D)
Plants, fruit, nuts, oils, mushrooms for human consumption (E)
Game (F)
Insects, caterpillars, etc. (G)
Fodder and other products for feeding livestock (H)
Medicinal plants (I)
Plants and other materials for making cosmetics, pigments,dyes
(J)
Other (specify):
…………………………………………………………………………………..
(K)
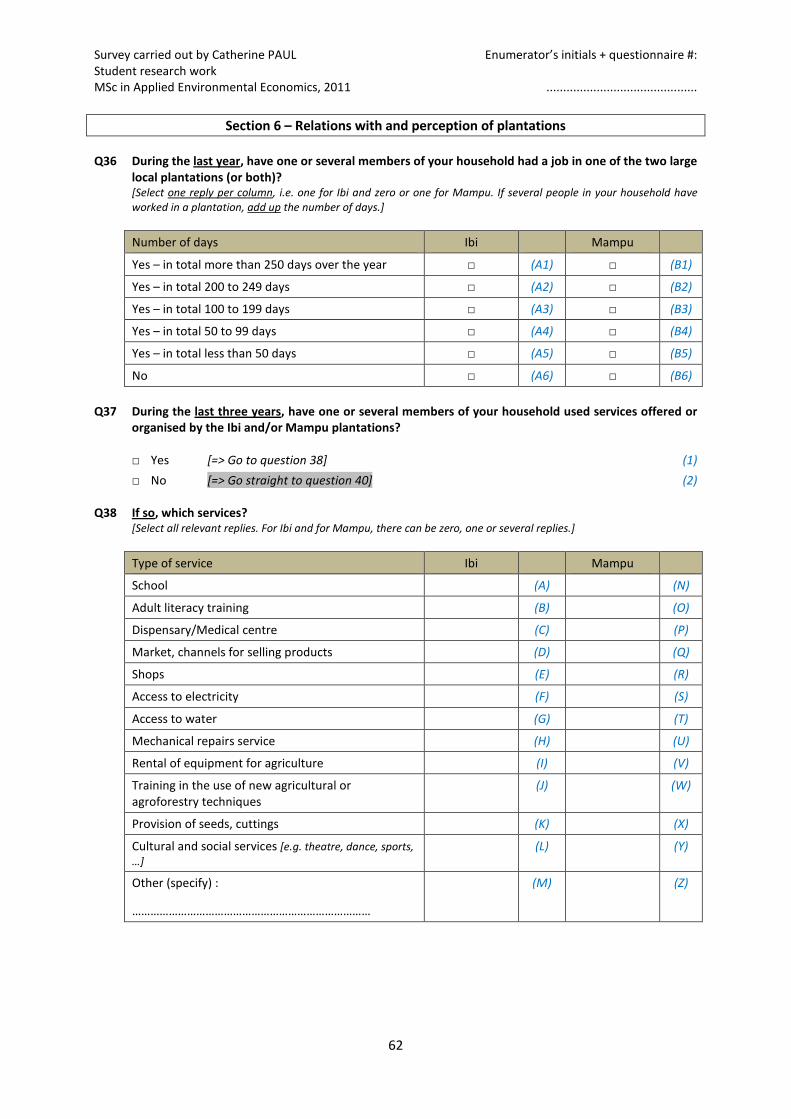
Survey carried out by Catherine PAUL Enumerator’s initials + questionnaire #:Student research workMSc in Applied Environmental Economics, 2011 .............................................
62
Section 6 – Relations with and perception of plantations
Q36 During the last year, have one or several members of your household had a job in one of the two largelocal plantations (or both)?[Select one reply per column, i.e. one for Ibi and zero or one for Mampu. If several people in your household haveworked in a plantation, add up the number of days.]
Number of days Ibi Mampu
Yes – in total more than 250 days over the year □ (A1) □ (B1)
Yes – in total 200 to 249 days □ (A2) □ (B2)
Yes – in total 100 to 199 days □ (A3) □ (B3)
Yes – in total 50 to 99 days □ (A4) □ (B4)
Yes – in total less than 50 days □ (A5) □ (B5)
No □ (A6) □ (B6)
Q37 During the last three years, have one or several members of your household used services offered ororganised by the Ibi and/or Mampu plantations?
□ Yes [=> Go to question 38] (1)
□ No [=> Go straight to question 40] (2)
Q38 If so, which services?[Select all relevant replies. For Ibi and for Mampu, there can be zero, one or several replies.]
Type of service Ibi Mampu
School (A) (N)
Adult literacy training (B) (O)
Dispensary/Medical centre (C) (P)
Market, channels for selling products (D) (Q)
Shops (E) (R)
Access to electricity (F) (S)
Access to water (G) (T)
Mechanical repairs service (H) (U)
Rental of equipment for agriculture (I) (V)
Training in the use of new agricultural oragroforestry techniques
(J) (W)
Provision of seeds, cuttings (K) (X)
Cultural and social services [e.g. theatre, dance, sports,…]
(L) (Y)
Other (specify) :
……………………………………………………………………
(M) (Z)
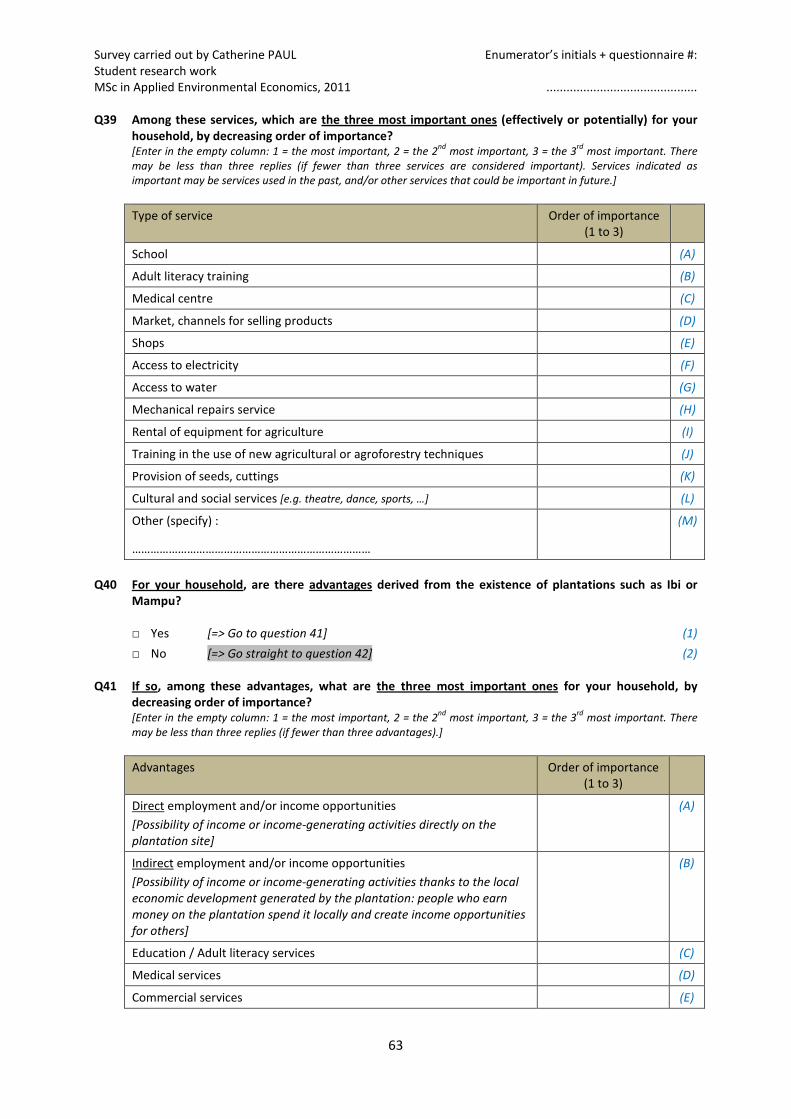
Survey carried out by Catherine PAUL Enumerator’s initials + questionnaire #:Student research workMSc in Applied Environmental Economics, 2011 .............................................
63
Q39 Among these services, which are the three most important ones (effectively or potentially) for yourhousehold, by decreasing order of importance?[Enter in the empty column: 1 = the most important, 2 = the 2
ndmost important, 3 = the 3
rdmost important. There
may be less than three replies (if fewer than three services are considered important). Services indicated asimportant may be services used in the past, and/or other services that could be important in future.]
Type of service Order of importance(1 to 3)
School (A)
Adult literacy training (B)
Medical centre (C)
Market, channels for selling products (D)
Shops (E)
Access to electricity (F)
Access to water (G)
Mechanical repairs service (H)
Rental of equipment for agriculture (I)
Training in the use of new agricultural or agroforestry techniques (J)
Provision of seeds, cuttings (K)
Cultural and social services [e.g. theatre, dance, sports, …] (L)
Other (specify) :
……………………………………………………………………
(M)
Q40 For your household, are there advantages derived from the existence of plantations such as Ibi orMampu?
□ Yes [=> Go to question 41] (1)
□ No [=> Go straight to question 42] (2)
Q41 If so, among these advantages, what are the three most important ones for your household, bydecreasing order of importance?[Enter in the empty column: 1 = the most important, 2 = the 2
ndmost important, 3 = the 3
rdmost important. There
may be less than three replies (if fewer than three advantages).]
Advantages Order of importance(1 to 3)
Direct employment and/or income opportunities
[Possibility of income or income-generating activities directly on theplantation site]
(A)
Indirect employment and/or income opportunities
[Possibility of income or income-generating activities thanks to the localeconomic development generated by the plantation: people who earnmoney on the plantation spend it locally and create income opportunitiesfor others]
(B)
Education / Adult literacy services (C)
Medical services (D)
Commercial services (E)
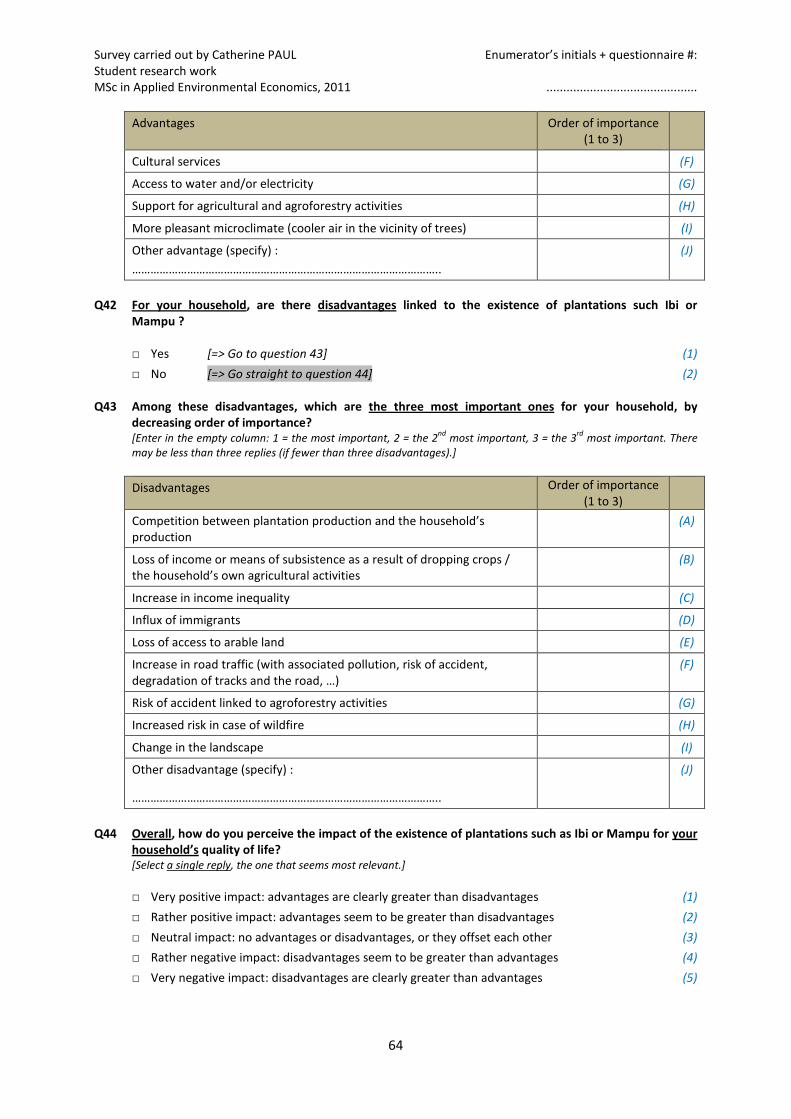
Survey carried out by Catherine PAUL Enumerator’s initials + questionnaire #:Student research workMSc in Applied Environmental Economics, 2011 .............................................
64
Advantages Order of importance(1 to 3)
Cultural services (F)
Access to water and/or electricity (G)
Support for agricultural and agroforestry activities (H)
More pleasant microclimate (cooler air in the vicinity of trees) (I)
Other advantage (specify) :
………………………………………………………………………………………..
(J)
Q42 For your household, are there disadvantages linked to the existence of plantations such Ibi orMampu ?
□ Yes [=> Go to question 43] (1)
□ No [=> Go straight to question 44] (2)
Q43 Among these disadvantages, which are the three most important ones for your household, bydecreasing order of importance?[Enter in the empty column: 1 = the most important, 2 = the 2
ndmost important, 3 = the 3
rdmost important. There
may be less than three replies (if fewer than three disadvantages).]
Disadvantages Order of importance(1 to 3)
Competition between plantation production and the household’sproduction
(A)
Loss of income or means of subsistence as a result of dropping crops /the household’s own agricultural activities
(B)
Increase in income inequality (C)
Influx of immigrants (D)
Loss of access to arable land (E)
Increase in road traffic (with associated pollution, risk of accident,degradation of tracks and the road, …)
(F)
Risk of accident linked to agroforestry activities (G)
Increased risk in case of wildfire (H)
Change in the landscape (I)
Other disadvantage (specify) :
………………………………………………………………………………………..
(J)
Q44 Overall, how do you perceive the impact of the existence of plantations such as Ibi or Mampu for yourhousehold’s quality of life?[Select a single reply, the one that seems most relevant.]
□ Very positive impact: advantages are clearly greater than disadvantages (1)
□ Rather positive impact: advantages seem to be greater than disadvantages (2)
□ Neutral impact: no advantages or disadvantages, or they offset each other (3)
□ Rather negative impact: disadvantages seem to be greater than advantages (4)
□ Very negative impact: disadvantages are clearly greater than advantages (5)
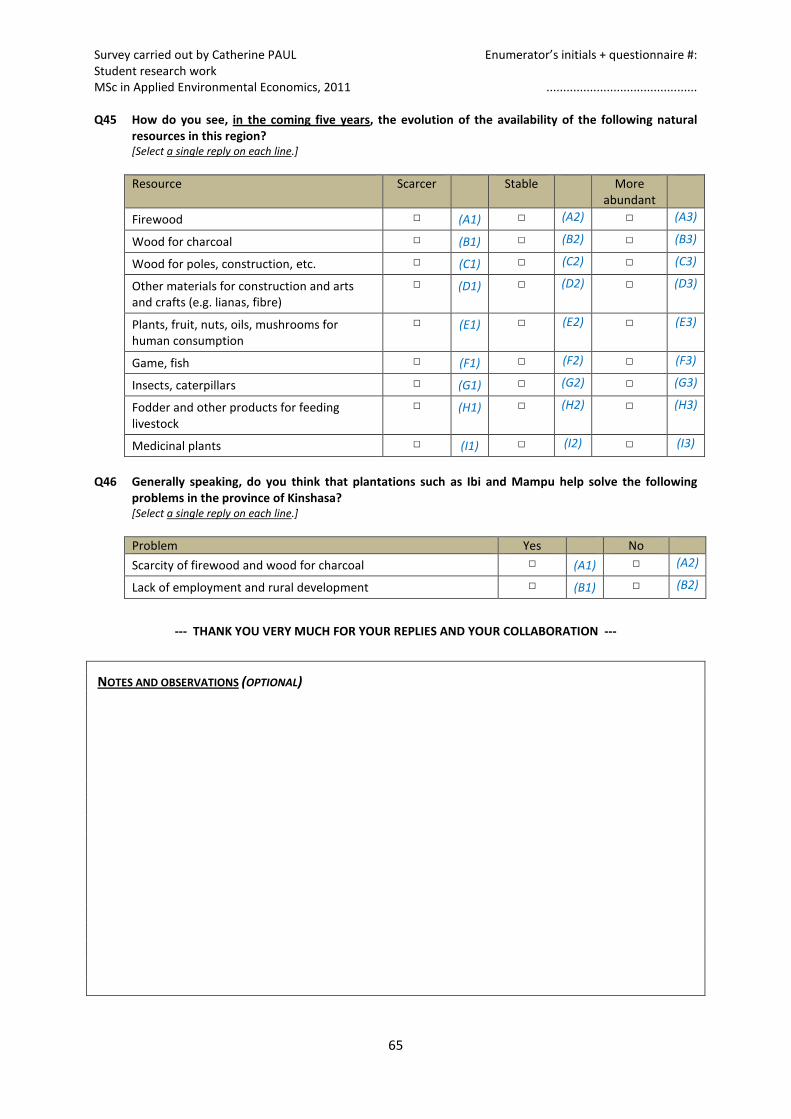
Survey carried out by Catherine PAUL Enumerator’s initials + questionnaire #:Student research workMSc in Applied Environmental Economics, 2011 .............................................
65
Q45 How do you see, in the coming five years, the evolution of the availability of the following naturalresources in this region?[Select a single reply on each line.]
Resource Scarcer Stable Moreabundant
Firewood □ (A1) □ (A2) □ (A3)
Wood for charcoal □ (B1) □ (B2) □ (B3)
Wood for poles, construction, etc. □ (C1) □ (C2) □ (C3)
Other materials for construction and artsand crafts (e.g. lianas, fibre)
□ (D1) □ (D2) □ (D3)
Plants, fruit, nuts, oils, mushrooms forhuman consumption
□ (E1) □ (E2) □ (E3)
Game, fish □ (F1) □ (F2) □ (F3)
Insects, caterpillars □ (G1) □ (G2) □ (G3)
Fodder and other products for feedinglivestock
□ (H1) □ (H2) □ (H3)
Medicinal plants □ (I1) □ (I2) □ (I3)
Q46 Generally speaking, do you think that plantations such as Ibi and Mampu help solve the followingproblems in the province of Kinshasa?[Select a single reply on each line.]
Problem Yes No
Scarcity of firewood and wood for charcoal □ (A1) □ (A2)
Lack of employment and rural development □ (B1) □ (B2)
--- THANK YOU VERY MUCH FOR YOUR REPLIES AND YOUR COLLABORATION ---
NOTES AND OBSERVATIONS (OPTIONAL)
66
Annex V: Data collection methods – Additional information
Data were collected using the following techniques:
1) Review of documents published, studies undertaken and data collected in relation to the Ibi-Batéké project:
These documents notably include:
- The project description document submitted for registration under the Clean DevelopmentMechanism (Novacel, 2010).19
- The Environmental and Social Impact Assessment undertaken in preparation for CDM registration(Oréade-Brèche, 2008; BERCI, 2006).
- Activity and statistical data collected in the context of Novacel operations.
- Reports produced in the context of the activities of GIAgro, a local NGO operating on the Ibidomain in close collaboration with Novacel.
2) Review of documents published and studies undertaken in the context of other relatedresearch and/or development projects, and of the preparation of the national REDD strategy:
These documents notably include:
- Reports produced in the context of the ongoing Makala Project20, a large-scale EU-financedproject that started in 2009. The project, which is being implemented by (among others) CIRAD(Centre de Coopération Internationale en Recherche Agronomique pour le Développement) andCIFOR (Center for International Forestry Research), aims to address the issue of woodfuelresource degradation and urban woodfuel supply insecurity through improvements in themanagement of natural and planted forests, in the energy efficiency of charcoal production, andin the organisation of the concerned rural communities (Marien, 2009b). The project notablyincludes a comprehensive study of the socioeconomic aspects of the charcoal supply chains ofKinshasa and Kisangani (Ingram and Schure, 2010; Schure et al, 2010; Projet Makala 2011).
- An evaluation report produced in relation to the Mampu acacia plantation, also located on theBatéké plateau in the province of Kinshasa, close to Ibi. Mampu was initially developed (in the1980s) as a woodfuel plantation and later converted into an integrated agroforestry project. Itproduces charcoal, cassava, maize, honey and other forest products on a sustainable basis(Ducenne, 2009). Mampu is interesting for this research since: (i) it is established in the samegeographical, geological and socioeconomic environment as the Ibi plantation; (ii) it pioneeredthe agroforestry model used in Ibi, but rests on a completely different economic model(significant dependence on development assistance funding for over 20 years, attribution of 25-hectare parcels to individual farmer-owners that operate in part on the basis of a cooperativesystem); and (iii) it has been established for a much longer period than the Ibi plantation, thus hasmore chances of generating visible socioeconomic impacts.
- The DRC’s ‘REDD readiness plan’ (DRC, 2010).
19Novacel is the private, family-owned company that develops and manages the carbon sink plantation. It
operates on the Ibi domain and, for commercial aspects, also in Kinshasa.20
‘Makala’ is the local name for ‘charcoal’.
67
3) Semi-structured interviews with key informants:
The list of people interviewed is provided in Annex III.
Data obtained from interviews with key informants were captured in the form of field notes, withessential information coded then transcribed directly into the relevant modules of the data collectionand analysis framework (see Annex II). Initial interviews conducted during the preparatory fieldmission confirmed that note-taking is appropriate and sufficient for this type of research. Thetranscription of tens or possibly hundreds of hours of interviews was not possible and also notjustified in the context of this research.
4) Focus groups with representatives of key stakeholder groups in rural areas:
Four focus groups were organised on the rural side, to investigate practices with regard to the use ofnatural resources (in particular forest and savannah resources) and the perception of theopportunities and threats associated with the presence of the Ibi and Mampu plantations:
- one involving 9 men living permanently on the Ibi domain, primarily residents of the independentfarms and hamlets established on the domain outside the plantation (larger and smaller farmers,one teacher), as well as a farmer settled in the plantation’s agroforestry pilot area;
- one involving 9 women living permanently on the Ibi domain (similar group composition, includingthe wife of a local schoolmaster);
- one involving 8 men from the rural town Mbankana, originating from various socioeconomicgroups (larger and smaller farmers, most of them also teachers or community workers involved inrural development and health prevention work);
- one involving 6 women from the rural town Mbankana (same group composition).
Focus groups members on the Ibi domain were recruited with the help of GIAgro, a development andresearch organisation operating on the Ibi domain. In Mbankana, they were recruited with the helpof CADIM, the local development organisation. The socioeconomic composition of focus groups wasnot as diversified as expected by the researcher; rather, groups in Ibi and Mbankana were relativelyhomogeneous, but very different across the two locations. This actually delivered interesting insightsfor the research.
The researcher led focus group discussions, with the help of a GIAgro employee (and doctoralstudent) who took care of French-Lingala and Lingala-French translation.21 Focus group discussionswere not recorded; notes were taken by the researcher and subsequently coded and transcribed intothe relevant modules of the data collection and analysis framework. This procedure was not ideal:some information was definitely ‘lost in translation’, and the translation somewhat interfered withthe spontaneity of discussions. However, the field conditions were not conducive to recording, andoverall the meetings were still very informative.
Both in Mbankana and in Ibi, discussions focused on the socioeconomic and environmental aspectsof livelihood strategies, and the perception of woodfuel plantation projects. The same topics wereproposed for discussion to the male and female groups. Each meeting lasted between two and a halfand three hours. The main topics discussed included:
- livelihood strategies, including the degree of diversification of activities and the nature ofdiversification strategies;
21No translation was needed in the male group in Mbankana.
68
- the evolution of rural income and living standards;
- the perceived sustainability of agricultural practices, including alternatives to slash-and-burnagriculture;
- the role of mechanisation in agriculture (an ‘unplanned’ topic that turned out to be ofconsiderable importance to participants);
- the importance of savannah and forest resource extraction for livelihoods;
- involvement in charcoal making, underlying motivations and obtained benefits;
- the perception of sustainability of forest resource exploitation;
- readiness to switch carbonisation activities from natural forests to plantations;
- use and perception of services available on the Ibi and Mampu domains;
- perception of the overall impact of these plantations.
Finally, note that what started as a semi-structured interview with two village officials in Mutieneended up as an informal ‘focus group meeting’, involving 7 people gathered around a beer in thelocal bar.
5) Formal survey:
A formal survey of rural households was conducted to investigate the following aspects:
- Characteristics of human capital.
- Characteristics of physical capital.
- Access to land.
- Characteristics of livelihoods (financial and non-financial means of subsistence with a focus onagricultural production, spending patterns).
- Natural resource use patterns (considered a specific aspect of livelihoods).
- Relations with and perception of local plantations.
The survey was conducted at four sites:
- The Ibi domain (plantation + neighbouring farms and hamlets).
- The Mampu plantation.
- Mutiene, a village located 30 km from Ibi, on the Kinshasa-Kikwit main road.
- Kinzono, a village located on the track between Mbankana and the Mampu plantation, away fromthe national road, about 10 km from the centre of Mampu.
These four locations (which have populations of different sizes) were chosen on the basis of acombination of purpose and convenience:
- Ibi is the focus of the case study; the site includes the plantation as such, a number of smallvillages/hamlets located close to the rivers that surround the domain, and a few large farms onsavannah land.
- Mampu provides an interesting point of comparison, being a longer-established plantation basedon a similar technical model but a different economic one (25-hectare plots allocated to land-owner farmers, who run their farms with the help of long-term and short-term workers known as‘coopérants’).
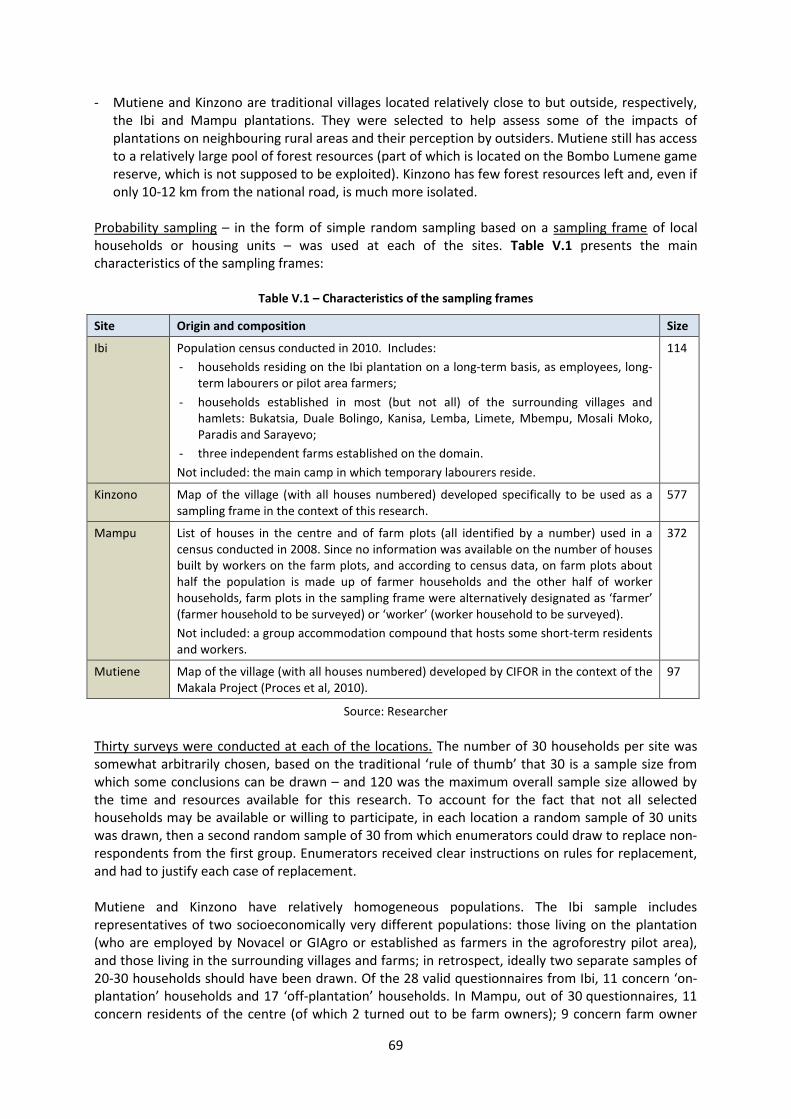
69
- Mutiene and Kinzono are traditional villages located relatively close to but outside, respectively,the Ibi and Mampu plantations. They were selected to help assess some of the impacts ofplantations on neighbouring rural areas and their perception by outsiders. Mutiene still has accessto a relatively large pool of forest resources (part of which is located on the Bombo Lumene gamereserve, which is not supposed to be exploited). Kinzono has few forest resources left and, even ifonly 10-12 km from the national road, is much more isolated.
Probability sampling – in the form of simple random sampling based on a sampling frame of localhouseholds or housing units – was used at each of the sites. Table V.1 presents the maincharacteristics of the sampling frames:
Table V.1 – Characteristics of the sampling frames
Site Origin and composition Size
Ibi Population census conducted in 2010. Includes:
- households residing on the Ibi plantation on a long-term basis, as employees, long-term labourers or pilot area farmers;
- households established in most (but not all) of the surrounding villages andhamlets: Bukatsia, Duale Bolingo, Kanisa, Lemba, Limete, Mbempu, Mosali Moko,Paradis and Sarayevo;
- three independent farms established on the domain.
Not included: the main camp in which temporary labourers reside.
114
Kinzono Map of the village (with all houses numbered) developed specifically to be used as asampling frame in the context of this research.
577
Mampu List of houses in the centre and of farm plots (all identified by a number) used in acensus conducted in 2008. Since no information was available on the number of housesbuilt by workers on the farm plots, and according to census data, on farm plots abouthalf the population is made up of farmer households and the other half of workerhouseholds, farm plots in the sampling frame were alternatively designated as ‘farmer’(farmer household to be surveyed) or ‘worker’ (worker household to be surveyed).
Not included: a group accommodation compound that hosts some short-term residentsand workers.
372
Mutiene Map of the village (with all houses numbered) developed by CIFOR in the context of theMakala Project (Proces et al, 2010).
97
Source: Researcher
Thirty surveys were conducted at each of the locations. The number of 30 households per site wassomewhat arbitrarily chosen, based on the traditional ‘rule of thumb’ that 30 is a sample size fromwhich some conclusions can be drawn – and 120 was the maximum overall sample size allowed bythe time and resources available for this research. To account for the fact that not all selectedhouseholds may be available or willing to participate, in each location a random sample of 30 unitswas drawn, then a second random sample of 30 from which enumerators could draw to replace non-respondents from the first group. Enumerators received clear instructions on rules for replacement,and had to justify each case of replacement.
Mutiene and Kinzono have relatively homogeneous populations. The Ibi sample includesrepresentatives of two socioeconomically very different populations: those living on the plantation(who are employed by Novacel or GIAgro or established as farmers in the agroforestry pilot area),and those living in the surrounding villages and farms; in retrospect, ideally two separate samples of20-30 households should have been drawn. Of the 28 valid questionnaires from Ibi, 11 concern ‘on-plantation’ households and 17 ‘off-plantation’ households. In Mampu, out of 30 questionnaires, 11concern residents of the centre (of which 2 turned out to be farm owners); 9 concern farm owner
70
households residing on farm plots; and 10 concern farm worker households permanently establishedon farm plots (and either living in the farmer’s house22 or in smaller houses built next to it).
The survey was based on a questionnaire drafted in French (see English version in Annex IV), whichenumerators translated in Lingala during interviews. The lack of an ‘official’ Lingala translation of thequestionnaire (initially planned but dropped in the face of reluctance from enumerators) was actuallya mistake, as it would probably have ensured a more consistent way of asking questions. To facilitatethe processing of answers and to limit the impact of enumerator bias, all questions were closed –however, an ‘other – specify’ option was added at the end of many questions, and a section forenumerator observations was included at the end of the questionnaire. The questionnaire was pre-tested during the research preparation mission – but due to logistical difficulties and resourceconstraints, could not be further tested before finalisation.
The survey was conducted by 3 enumerators (one working in Mutiene and Mampu, one in Ibi andone in Kinzono), one of whom only had already conducted survey work. All were educated and hadsome familiarity with the local communities but, due to the absence of conflicts and close links withlocal families and/or their position in society, could be perceived as neutral and trustworthy actors.The researcher took care of preparation and supervision work, with the already experiencedenumerator doing some coordination and support work.
All enumerators signed a confidentiality agreement – and the need for confidentiality was stronglyemphasized during training.
All enumerators participated in a one-day training session animated by the researcher. The agendaincluded:
- A presentation of the nature and objectives of the research.
- A presentation of the ethical aspects of the research, in particular the confidentiality and freeparticipation requirements, and a discussion of their practical implementation modalities.
- An in-depth discussion of the questionnaire and how best to answer it.
- A discussion of practical aspects, including timetable for conducting the survey; organisation ofthe work; targeting of respondents (preferably the household head or his wife); modalities forsecuring optimal participation from selected households; modalities for replacing unavailablehouseholds; and modalities for handing over questionnaires to the coordinator, who in turnhanded them over to a trusted person in ERAIFT (the UNESCO-funded, Kinshasa-based Post-graduate Regional School for Integrated Forest and Territorial Management).
A ‘guide for enumerators’ was drafted by the researcher and presented during the training session,to complement the instructions already included in the questionnaire itself.
Overall, the quality of survey data is deemed to be reasonably good. In Mampu, Mutiene andKinzono, all surveys turned out to be usable; 28 were usable in Ibi.23 There is no evidence of anycheating in filling questionnaires – and detailed data analysis supports this. In all cases, enumeratorswere asked to do some complementary survey work after the researcher had reviewed all or most ofthe surveys; households were revisited as needed to ask a limited number of ad hoc questions (e.g.
22Some farm owners do not actually live in Mampu or not in the farm house, and many delegate responsibility
for daily farm management to a trusted long-term collaborator.23
Two surveys in Ibi were rejected from not respecting the rules for replacement of randomly selectedhouseholds.
71
for completing missing information, removing some inconsistencies in replies, clarifying some replies,or checking/correcting some replies based on a clarification of some concepts). In many cases,plausible explanations were provided to explain what initially appeared as ‘strange’ or inconsistentreplies. This extra survey work, undertaken more systematically in Mampu and Kinzono than in Ibiand Mutiene, is deemed to have significantly contributed to the overall quality and reliability of thedataset. There is some evidence of slightly different ways of asking some questions based on howthey were understood by enumerators, and of enumerator bias in the way of asking the very lastquestions in a long questionnaire (questions on perceptions rather than facts). This must be takeninto account in the analysis and interpretation of data, but does not question the validity of thewhole dataset.
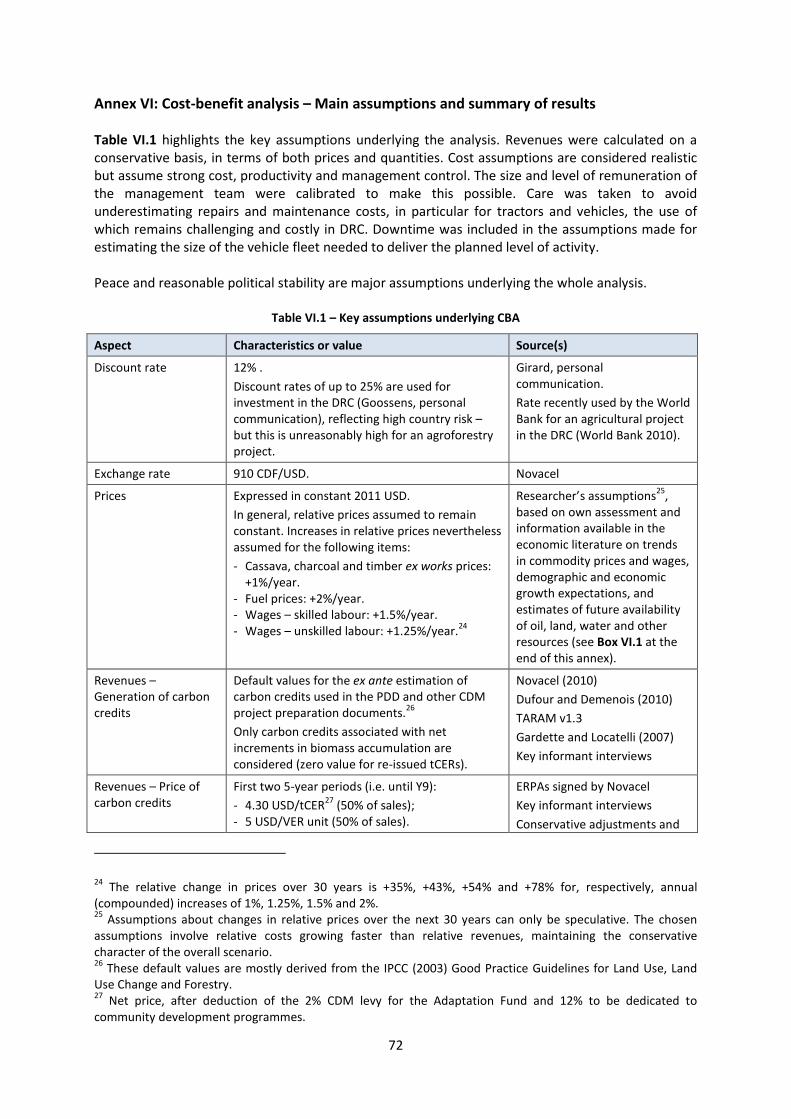
72
Annex VI: Cost-benefit analysis – Main assumptions and summary of results
Table VI.1 highlights the key assumptions underlying the analysis. Revenues were calculated on aconservative basis, in terms of both prices and quantities. Cost assumptions are considered realisticbut assume strong cost, productivity and management control. The size and level of remuneration ofthe management team were calibrated to make this possible. Care was taken to avoidunderestimating repairs and maintenance costs, in particular for tractors and vehicles, the use ofwhich remains challenging and costly in DRC. Downtime was included in the assumptions made forestimating the size of the vehicle fleet needed to deliver the planned level of activity.
Peace and reasonable political stability are major assumptions underlying the whole analysis.
Table VI.1 – Key assumptions underlying CBA
Aspect Characteristics or value Source(s)
Discount rate 12% .
Discount rates of up to 25% are used forinvestment in the DRC (Goossens, personalcommunication), reflecting high country risk –but this is unreasonably high for an agroforestryproject.
Girard, personalcommunication.
Rate recently used by the WorldBank for an agricultural projectin the DRC (World Bank 2010).
Exchange rate 910 CDF/USD. Novacel
Prices Expressed in constant 2011 USD.
In general, relative prices assumed to remainconstant. Increases in relative prices neverthelessassumed for the following items:
- Cassava, charcoal and timber ex works prices:+1%/year.
- Fuel prices: +2%/year.- Wages – skilled labour: +1.5%/year.- Wages – unskilled labour: +1.25%/year.
24
Researcher’s assumptions25
,based on own assessment andinformation available in theeconomic literature on trendsin commodity prices and wages,demographic and economicgrowth expectations, andestimates of future availabilityof oil, land, water and otherresources (see Box VI.1 at theend of this annex).
Revenues –Generation of carboncredits
Default values for the ex ante estimation ofcarbon credits used in the PDD and other CDMproject preparation documents.
26
Only carbon credits associated with netincrements in biomass accumulation areconsidered (zero value for re-issued tCERs).
Novacel (2010)
Dufour and Demenois (2010)
TARAM v1.3
Gardette and Locatelli (2007)
Key informant interviews
Revenues – Price ofcarbon credits
First two 5-year periods (i.e. until Y9):
- 4.30 USD/tCER27
(50% of sales);- 5 USD/VER unit (50% of sales).
ERPAs signed by Novacel
Key informant interviews
Conservative adjustments and
24The relative change in prices over 30 years is +35%, +43%, +54% and +78% for, respectively, annual
(compounded) increases of 1%, 1.25%, 1.5% and 2%.25
Assumptions about changes in relative prices over the next 30 years can only be speculative. The chosenassumptions involve relative costs growing faster than relative revenues, maintaining the conservativecharacter of the overall scenario.26
These default values are mostly derived from the IPCC (2003) Good Practice Guidelines for Land Use, LandUse Change and Forestry.27
Net price, after deduction of the 2% CDM levy for the Adaptation Fund and 12% to be dedicated tocommunity development programmes.
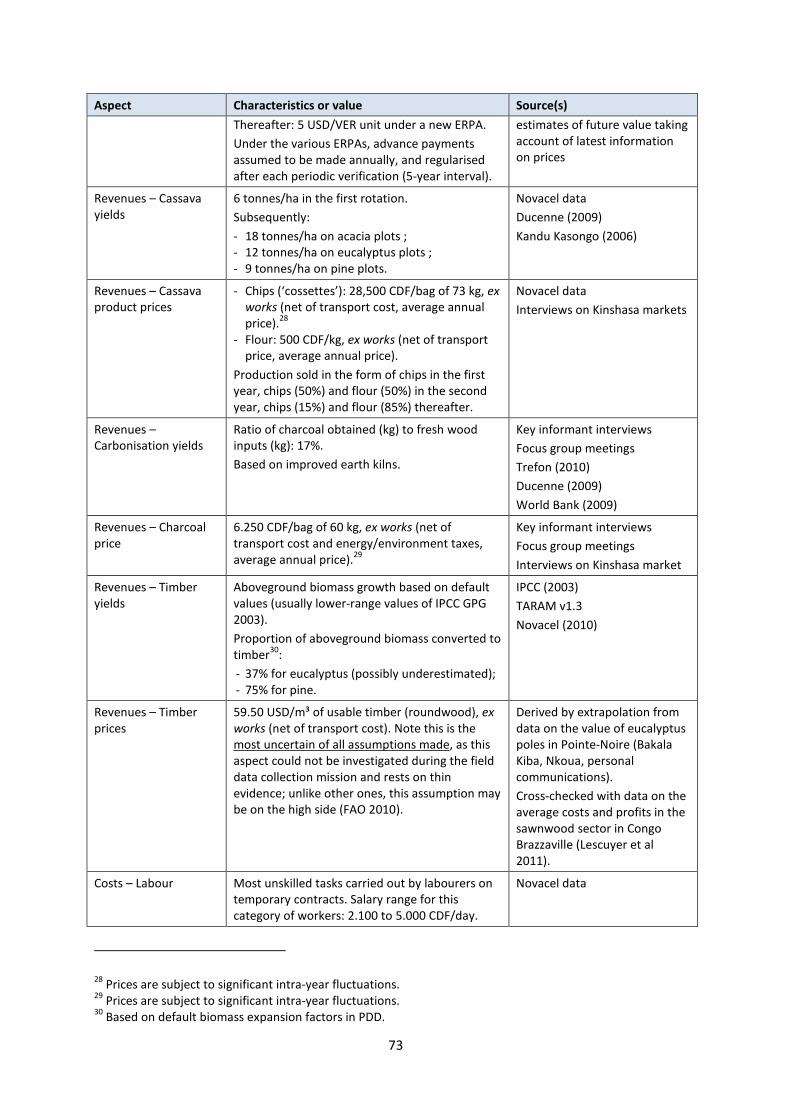
73
Aspect Characteristics or value Source(s)
Thereafter: 5 USD/VER unit under a new ERPA.
Under the various ERPAs, advance paymentsassumed to be made annually, and regularisedafter each periodic verification (5-year interval).
estimates of future value takingaccount of latest informationon prices
Revenues – Cassavayields
6 tonnes/ha in the first rotation.
Subsequently:
- 18 tonnes/ha on acacia plots ;- 12 tonnes/ha on eucalyptus plots ;- 9 tonnes/ha on pine plots.
Novacel data
Ducenne (2009)
Kandu Kasongo (2006)
Revenues – Cassavaproduct prices
- Chips (‘cossettes’): 28,500 CDF/bag of 73 kg, exworks (net of transport cost, average annualprice).
28
- Flour: 500 CDF/kg, ex works (net of transportprice, average annual price).
Production sold in the form of chips in the firstyear, chips (50%) and flour (50%) in the secondyear, chips (15%) and flour (85%) thereafter.
Novacel data
Interviews on Kinshasa markets
Revenues –Carbonisation yields
Ratio of charcoal obtained (kg) to fresh woodinputs (kg): 17%.
Based on improved earth kilns.
Key informant interviews
Focus group meetings
Trefon (2010)
Ducenne (2009)
World Bank (2009)
Revenues – Charcoalprice
6.250 CDF/bag of 60 kg, ex works (net oftransport cost and energy/environment taxes,average annual price).
29
Key informant interviews
Focus group meetings
Interviews on Kinshasa market
Revenues – Timberyields
Aboveground biomass growth based on defaultvalues (usually lower-range values of IPCC GPG2003).
Proportion of aboveground biomass converted totimber
30:
- 37% for eucalyptus (possibly underestimated);- 75% for pine.
IPCC (2003)
TARAM v1.3
Novacel (2010)
Revenues – Timberprices
59.50 USD/m³ of usable timber (roundwood), exworks (net of transport cost). Note this is themost uncertain of all assumptions made, as thisaspect could not be investigated during the fielddata collection mission and rests on thinevidence; unlike other ones, this assumption maybe on the high side (FAO 2010).
Derived by extrapolation fromdata on the value of eucalyptuspoles in Pointe-Noire (BakalaKiba, Nkoua, personalcommunications).
Cross-checked with data on theaverage costs and profits in thesawnwood sector in CongoBrazzaville (Lescuyer et al2011).
Costs – Labour Most unskilled tasks carried out by labourers ontemporary contracts. Salary range for thiscategory of workers: 2.100 to 5.000 CDF/day.
Novacel data
28Prices are subject to significant intra-year fluctuations.
29Prices are subject to significant intra-year fluctuations.
30Based on default biomass expansion factors in PDD.
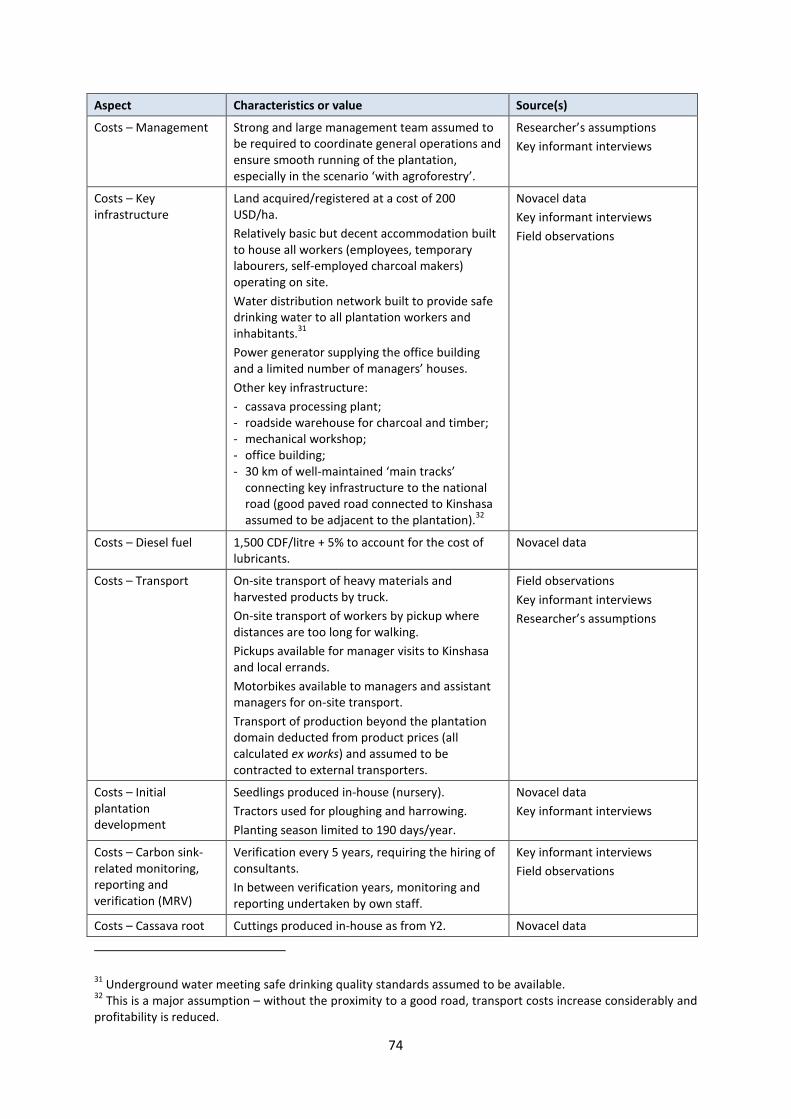
74
Aspect Characteristics or value Source(s)
Costs – Management Strong and large management team assumed tobe required to coordinate general operations andensure smooth running of the plantation,especially in the scenario ‘with agroforestry’.
Researcher’s assumptions
Key informant interviews
Costs – Keyinfrastructure
Land acquired/registered at a cost of 200USD/ha.
Relatively basic but decent accommodation builtto house all workers (employees, temporarylabourers, self-employed charcoal makers)operating on site.
Water distribution network built to provide safedrinking water to all plantation workers andinhabitants.
31
Power generator supplying the office buildingand a limited number of managers’ houses.
Other key infrastructure:
- cassava processing plant;- roadside warehouse for charcoal and timber;- mechanical workshop;- office building;- 30 km of well-maintained ‘main tracks’
connecting key infrastructure to the nationalroad (good paved road connected to Kinshasaassumed to be adjacent to the plantation).
32
Novacel data
Key informant interviews
Field observations
Costs – Diesel fuel 1,500 CDF/litre + 5% to account for the cost oflubricants.
Novacel data
Costs – Transport On-site transport of heavy materials andharvested products by truck.
On-site transport of workers by pickup wheredistances are too long for walking.
Pickups available for manager visits to Kinshasaand local errands.
Motorbikes available to managers and assistantmanagers for on-site transport.
Transport of production beyond the plantationdomain deducted from product prices (allcalculated ex works) and assumed to becontracted to external transporters.
Field observations
Key informant interviews
Researcher’s assumptions
Costs – Initialplantationdevelopment
Seedlings produced in-house (nursery).
Tractors used for ploughing and harrowing.
Planting season limited to 190 days/year.
Novacel data
Key informant interviews
Costs – Carbon sink-related monitoring,reporting andverification (MRV)
Verification every 5 years, requiring the hiring ofconsultants.
In between verification years, monitoring andreporting undertaken by own staff.
Key informant interviews
Field observations
Costs – Cassava root Cuttings produced in-house as from Y2. Novacel data
31Underground water meeting safe drinking quality standards assumed to be available.
32This is a major assumption – without the proximity to a good road, transport costs increase considerably and
profitability is reduced.
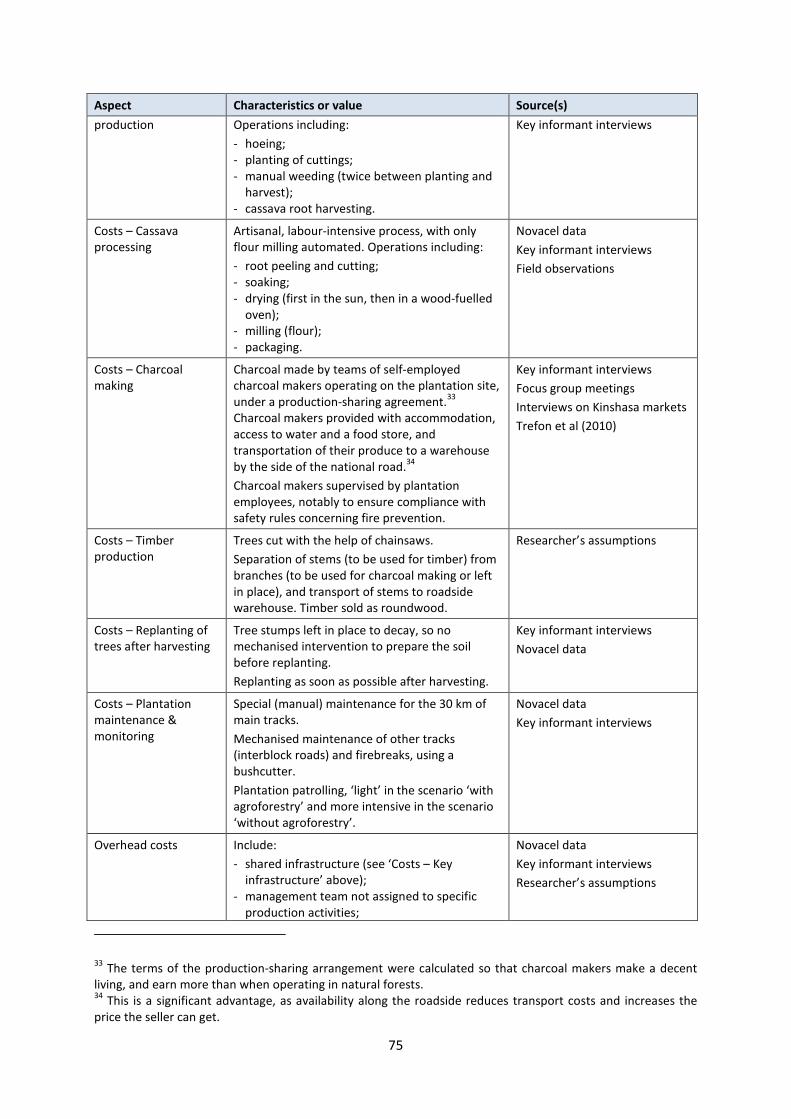
75
Aspect Characteristics or value Source(s)
production Operations including:
- hoeing;- planting of cuttings;- manual weeding (twice between planting and
harvest);- cassava root harvesting.
Key informant interviews
Costs – Cassavaprocessing
Artisanal, labour-intensive process, with onlyflour milling automated. Operations including:
- root peeling and cutting;- soaking;- drying (first in the sun, then in a wood-fuelled
oven);- milling (flour);- packaging.
Novacel data
Key informant interviews
Field observations
Costs – Charcoalmaking
Charcoal made by teams of self-employedcharcoal makers operating on the plantation site,under a production-sharing agreement.
33
Charcoal makers provided with accommodation,access to water and a food store, andtransportation of their produce to a warehouseby the side of the national road.
34
Charcoal makers supervised by plantationemployees, notably to ensure compliance withsafety rules concerning fire prevention.
Key informant interviews
Focus group meetings
Interviews on Kinshasa markets
Trefon et al (2010)
Costs – Timberproduction
Trees cut with the help of chainsaws.
Separation of stems (to be used for timber) frombranches (to be used for charcoal making or leftin place), and transport of stems to roadsidewarehouse. Timber sold as roundwood.
Researcher’s assumptions
Costs – Replanting oftrees after harvesting
Tree stumps left in place to decay, so nomechanised intervention to prepare the soilbefore replanting.
Replanting as soon as possible after harvesting.
Key informant interviews
Novacel data
Costs – Plantationmaintenance &monitoring
Special (manual) maintenance for the 30 km ofmain tracks.
Mechanised maintenance of other tracks(interblock roads) and firebreaks, using abushcutter.
Plantation patrolling, ‘light’ in the scenario ‘withagroforestry’ and more intensive in the scenario‘without agroforestry’.
Novacel data
Key informant interviews
Overhead costs Include:
- shared infrastructure (see ‘Costs – Keyinfrastructure’ above);
- management team not assigned to specificproduction activities;
Novacel data
Key informant interviews
Researcher’s assumptions
33The terms of the production-sharing arrangement were calculated so that charcoal makers make a decent
living, and earn more than when operating in natural forests.34
This is a significant advantage, as availability along the roadside reduces transport costs and increases theprice the seller can get.

76
Aspect Characteristics or value Source(s)
- the rental of a (modest) office in Kinshasa;- miscellaneous supplies and services;- a flat amount of 10,000 USD/year for various
taxes (excluding taxes on profits).
Source: Researcher
Table VI.2 highlights key differences between the ‘agroforestry’ and ‘passive carbon sink’ scenarios.
Table VI.2 – Key differences between the scenarios ‘with’ and ‘without’ agroforestry
Aspect With agroforestry Without agroforestry
Initial plantation development –Soil preparation
Double harrowing followed byhoeing
Single harrowing, no hoeing
Agricultural production (cassava) Included, systematicallyaccompanies the planting ofseedlings. Cassava cultivationsupports initial tree growth bypreventing the re-growth of verycompetitive savannah herbaceousvegetation. This in turns offers asignificant amount of protectionagainst wildfires, which feedprimarily on dry herbaceousvegetation.
Excluded. This implies:
- a higher rate of tree failure, asnatural savannah vegetationrecolonises the space – thushigher costs for replacing failedsaplings;
- a higher risk of fire during theearly years of tree growth (partlyfactored into the analysisthrough higher maintenance andpatrolling costs).
Tree harvesting and replanting 535 ha harvested annually as fromY9. This reduces the amount ofcarbon credits generated by theproject, but this is offset by incomefrom agroforestry productions.
No harvest until Y30 i.e. after theend of the CBA period. Assumingno fire, this maximises thegeneration of carbon credits.
Charcoal and timber production Included – linked to treeharvesting.
Excluded.
Plantation maintenance Main track maintenance workheavier due to heavier traffic.
Firebreak maintenance twice ayear.
Main track maintenance reduceddue to lighter traffic.
Firebreak maintenance four timesa year as overall risk of fireconsidered higher.
35
Plantation monitoring Lighter than in the case of theother scenario, as sustainedactivity takes place on theplantation, limiting the risk ofunnoticed intrusion, theft andundetected fire.
Doubled compared with thescenario ‘with agroforestry’, as alower level of activity on the siteincreases the risk of intrusion,theft and undetected fire.
Site infrastructure Roughly the same baseinfrastructure needed in bothscenarios. Cassava processing plant
The site workforce and activitylevels decrease significantly asfrom Y9, when plantation
35For two reasons: recolonisation of space by fire-prone savannah vegetation in the first years following
planting, and reduced availability of staff to put down wildfires when they occur. The larger number of peopleliving and operating on the plantation may increase fire risk in the agroforestry scenario, but in this scenariofires are also likely to be detected and extinguished earlier, thanks to the permanent presence of a largerworkforce.
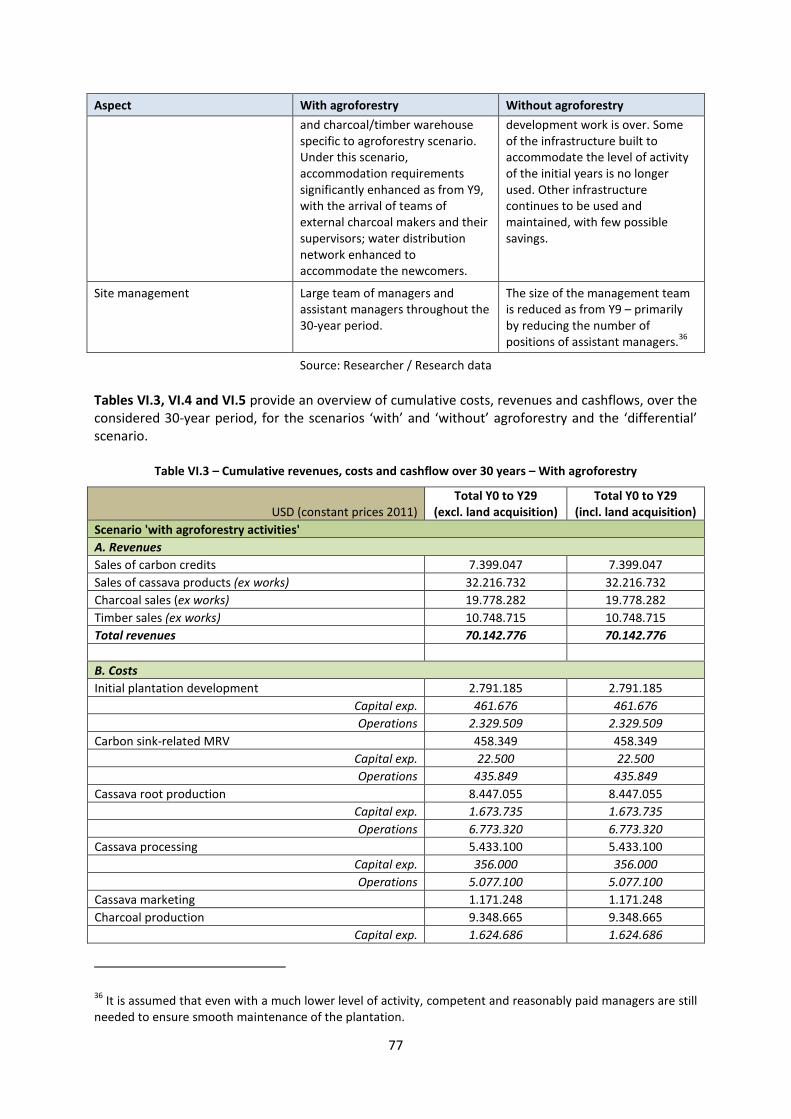
77
Aspect With agroforestry Without agroforestry
and charcoal/timber warehousespecific to agroforestry scenario.Under this scenario,accommodation requirementssignificantly enhanced as from Y9,with the arrival of teams ofexternal charcoal makers and theirsupervisors; water distributionnetwork enhanced toaccommodate the newcomers.
development work is over. Someof the infrastructure built toaccommodate the level of activityof the initial years is no longerused. Other infrastructurecontinues to be used andmaintained, with few possiblesavings.
Site management Large team of managers andassistant managers throughout the30-year period.
The size of the management teamis reduced as from Y9 – primarilyby reducing the number ofpositions of assistant managers.
36
Source: Researcher / Research data
Tables VI.3, VI.4 and VI.5 provide an overview of cumulative costs, revenues and cashflows, over theconsidered 30-year period, for the scenarios ‘with’ and ‘without’ agroforestry and the ‘differential’scenario.
Table VI.3 – Cumulative revenues, costs and cashflow over 30 years – With agroforestry
USD (constant prices 2011)Total Y0 to Y29
(excl. land acquisition)Total Y0 to Y29
(incl. land acquisition)
Scenario 'with agroforestry activities'
A. Revenues
Sales of carbon credits 7.399.047 7.399.047
Sales of cassava products (ex works) 32.216.732 32.216.732
Charcoal sales (ex works) 19.778.282 19.778.282
Timber sales (ex works) 10.748.715 10.748.715
Total revenues 70.142.776 70.142.776
B. Costs
Initial plantation development 2.791.185 2.791.185
Capital exp. 461.676 461.676
Operations 2.329.509 2.329.509
Carbon sink-related MRV 458.349 458.349
Capital exp. 22.500 22.500
Operations 435.849 435.849
Cassava root production 8.447.055 8.447.055
Capital exp. 1.673.735 1.673.735
Operations 6.773.320 6.773.320
Cassava processing 5.433.100 5.433.100
Capital exp. 356.000 356.000
Operations 5.077.100 5.077.100
Cassava marketing 1.171.248 1.171.248
Charcoal production 9.348.665 9.348.665
Capital exp. 1.624.686 1.624.686
36It is assumed that even with a much lower level of activity, competent and reasonably paid managers are still
needed to ensure smooth maintenance of the plantation.
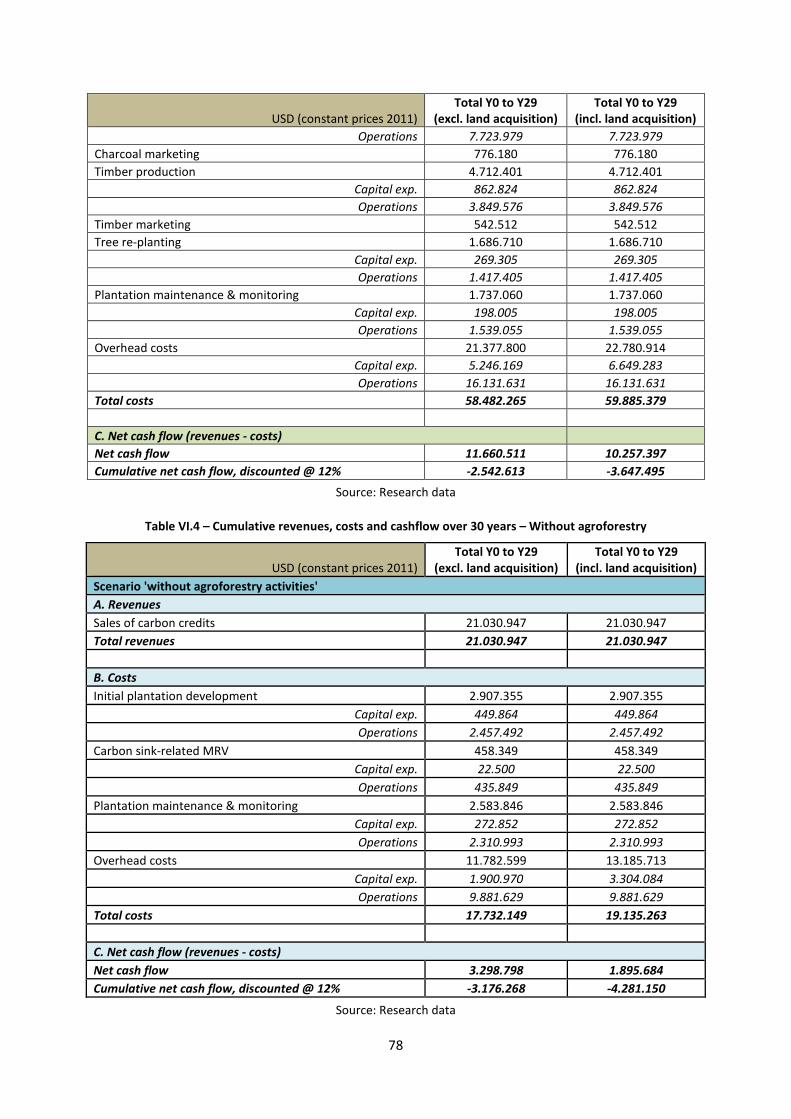
78
USD (constant prices 2011)Total Y0 to Y29
(excl. land acquisition)Total Y0 to Y29
(incl. land acquisition)
Operations 7.723.979 7.723.979
Charcoal marketing 776.180 776.180
Timber production 4.712.401 4.712.401
Capital exp. 862.824 862.824
Operations 3.849.576 3.849.576
Timber marketing 542.512 542.512
Tree re-planting 1.686.710 1.686.710
Capital exp. 269.305 269.305
Operations 1.417.405 1.417.405
Plantation maintenance & monitoring 1.737.060 1.737.060
Capital exp. 198.005 198.005
Operations 1.539.055 1.539.055
Overhead costs 21.377.800 22.780.914
Capital exp. 5.246.169 6.649.283
Operations 16.131.631 16.131.631
Total costs 58.482.265 59.885.379
C. Net cash flow (revenues - costs)
Net cash flow 11.660.511 10.257.397
Cumulative net cash flow, discounted @ 12% -2.542.613 -3.647.495
Source: Research data
Table VI.4 – Cumulative revenues, costs and cashflow over 30 years – Without agroforestry
USD (constant prices 2011)Total Y0 to Y29
(excl. land acquisition)Total Y0 to Y29
(incl. land acquisition)
Scenario 'without agroforestry activities'
A. Revenues
Sales of carbon credits 21.030.947 21.030.947
Total revenues 21.030.947 21.030.947
B. Costs
Initial plantation development 2.907.355 2.907.355
Capital exp. 449.864 449.864
Operations 2.457.492 2.457.492
Carbon sink-related MRV 458.349 458.349
Capital exp. 22.500 22.500
Operations 435.849 435.849
Plantation maintenance & monitoring 2.583.846 2.583.846
Capital exp. 272.852 272.852
Operations 2.310.993 2.310.993
Overhead costs 11.782.599 13.185.713
Capital exp. 1.900.970 3.304.084
Operations 9.881.629 9.881.629
Total costs 17.732.149 19.135.263
C. Net cash flow (revenues - costs)
Net cash flow 3.298.798 1.895.684
Cumulative net cash flow, discounted @ 12% -3.176.268 -4.281.150
Source: Research data
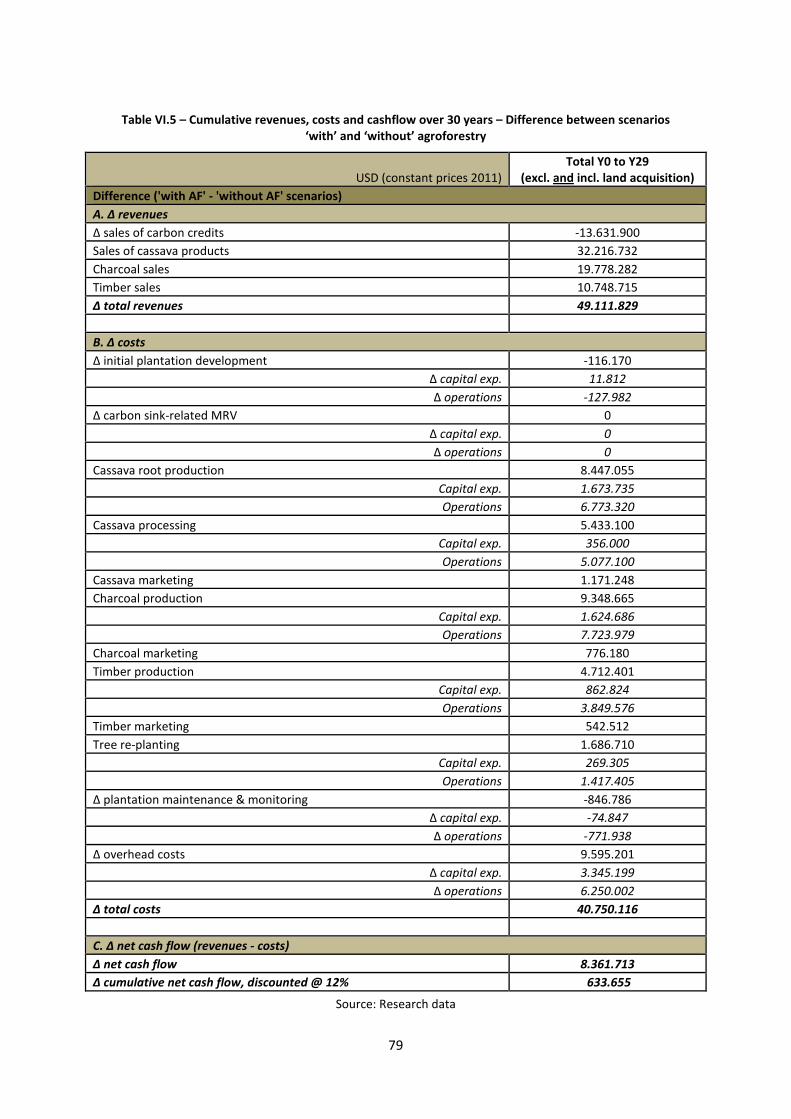
79
Table VI.5 – Cumulative revenues, costs and cashflow over 30 years – Difference between scenarios‘with’ and ‘without’ agroforestry
USD (constant prices 2011)Total Y0 to Y29
(excl. and incl. land acquisition)
Difference ('with AF' - 'without AF' scenarios)
A. Δ revenues
Δ sales of carbon credits -13.631.900
Sales of cassava products 32.216.732
Charcoal sales 19.778.282
Timber sales 10.748.715
Δ total revenues 49.111.829
B. Δ costs
Δ initial plantation development -116.170
Δ capital exp. 11.812
Δ operations -127.982
Δ carbon sink-related MRV 0
Δ capital exp. 0
Δ operations 0
Cassava root production 8.447.055
Capital exp. 1.673.735
Operations 6.773.320
Cassava processing 5.433.100
Capital exp. 356.000
Operations 5.077.100
Cassava marketing 1.171.248
Charcoal production 9.348.665
Capital exp. 1.624.686
Operations 7.723.979
Charcoal marketing 776.180
Timber production 4.712.401
Capital exp. 862.824
Operations 3.849.576
Timber marketing 542.512
Tree re-planting 1.686.710
Capital exp. 269.305
Operations 1.417.405
Δ plantation maintenance & monitoring -846.786
Δ capital exp. -74.847
Δ operations -771.938
Δ overhead costs 9.595.201
Δ capital exp. 3.345.199
Δ operations 6.250.002
Δ total costs 40.750.116
C. Δ net cash flow (revenues - costs)
Δ net cash flow 8.361.713
Δ cumulative net cash flow, discounted @ 12% 633.655
Source: Research data

80
Tables VI.6 and VI.7 present the results of sensitivity analysis, based on the variant scenariosdescribed in Table 4.3, respectively for the variants excluding and including land acquisition.
Table VI.6 – NPV (2011 USD) and IRR for variant scenarios, excluding land acquisition
Variant # Indicator With agroforestry Without agroforestry
Baseline NPV@12%
IRR
– 2,542,613
6.5%
– 3,176,268
2.8%
#1
Carbon price 7.50 USD
NPV@12%
IRR
– 2,120,079
7.6%
– 1,957,468
7.5%
#2
Carbon price 10 USD
NPV@12%
IRR
– 1,697,545
8.6%
– 738,668
10.6%
#3
No changes in relative prices
NPV@12%
IRR
– 2,776,906
5.4%
– 2,826,916
4.2%
#4
Revenues +10% across the board
NPV@12%
IRR
– 1,368,362
9.3%
– 2,800,682
4.3%
#5
Revenues -10% across the board
NPV@12%
IRR
– 3,716,865
3.1%
– 3,551,855
1.1%
#6
Costs +10% across the board
NPV@12%
IRR
– 3,971,126
3.4%
– 3,869,481
1.3%
#7
Costs -10% across the board
NPV@12%
IRR
– 1,114,100
9.6%
– 2,483,056
4.5%
Source: Research data
Table VI.7 – NPV (2011 USD) and IRR for variant scenarios, including land acquisition
Variant # Indicator With agroforestry Without agroforestry
Baseline NPV@12%
IRR
– 3,647,495
5.2%
– 4,281,150
1.4%
#1
Carbon price 7.50 USD
NPV@12%
IRR
– 3,224,961
6.2%
– 3,062,350
6.0%
#2
Carbon price 10 USD
NPV@12%
IRR
– 2,802,427
7.1%
– 1,843,550
8.9%
#3
No changes in relative prices
NPV@12%
IRR
– 3,881,788
4.0%
– 3,931,798
2.7%
#4
Revenues +10% across the board
NPV@12%
IRR
– 2,473,244
7.7%
– 3,905,564
2.8%
#5
Revenues -10% across the board
NPV@12%
IRR
– 4,821,747
1.9%
– 4,656,736
-0.2%
#6
Costs +10% across the board
NPV@12%
IRR
– 5,186,496
2.3%
– 5,084,851
-0.1%
#7
Costs -10% across the board
NPV@12%
IRR
– 2,108,494
8.0%
– 3,477,499
3.0%
Source: Research data
Finally, Box VI.1 provides a justification for assumptions made about changes in relative prices, in thebaseline CBA scenario.
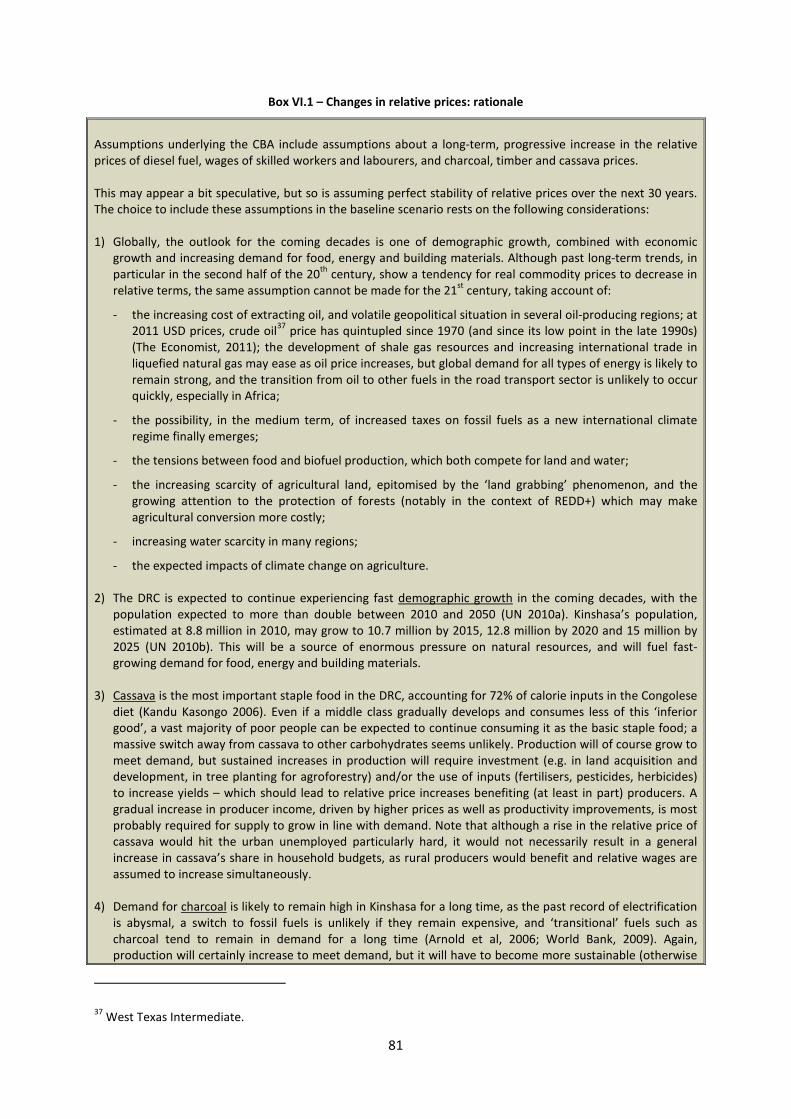
81
Box VI.1 – Changes in relative prices: rationale
Assumptions underlying the CBA include assumptions about a long-term, progressive increase in the relativeprices of diesel fuel, wages of skilled workers and labourers, and charcoal, timber and cassava prices.
This may appear a bit speculative, but so is assuming perfect stability of relative prices over the next 30 years.The choice to include these assumptions in the baseline scenario rests on the following considerations:
1) Globally, the outlook for the coming decades is one of demographic growth, combined with economicgrowth and increasing demand for food, energy and building materials. Although past long-term trends, inparticular in the second half of the 20
thcentury, show a tendency for real commodity prices to decrease in
relative terms, the same assumption cannot be made for the 21st
century, taking account of:
- the increasing cost of extracting oil, and volatile geopolitical situation in several oil-producing regions; at2011 USD prices, crude oil
37price has quintupled since 1970 (and since its low point in the late 1990s)
(The Economist, 2011); the development of shale gas resources and increasing international trade inliquefied natural gas may ease as oil price increases, but global demand for all types of energy is likely toremain strong, and the transition from oil to other fuels in the road transport sector is unlikely to occurquickly, especially in Africa;
- the possibility, in the medium term, of increased taxes on fossil fuels as a new international climateregime finally emerges;
- the tensions between food and biofuel production, which both compete for land and water;
- the increasing scarcity of agricultural land, epitomised by the ‘land grabbing’ phenomenon, and thegrowing attention to the protection of forests (notably in the context of REDD+) which may makeagricultural conversion more costly;
- increasing water scarcity in many regions;
- the expected impacts of climate change on agriculture.
2) The DRC is expected to continue experiencing fast demographic growth in the coming decades, with thepopulation expected to more than double between 2010 and 2050 (UN 2010a). Kinshasa’s population,estimated at 8.8 million in 2010, may grow to 10.7 million by 2015, 12.8 million by 2020 and 15 million by2025 (UN 2010b). This will be a source of enormous pressure on natural resources, and will fuel fast-growing demand for food, energy and building materials.
3) Cassava is the most important staple food in the DRC, accounting for 72% of calorie inputs in the Congolesediet (Kandu Kasongo 2006). Even if a middle class gradually develops and consumes less of this ‘inferiorgood’, a vast majority of poor people can be expected to continue consuming it as the basic staple food; amassive switch away from cassava to other carbohydrates seems unlikely. Production will of course grow tomeet demand, but sustained increases in production will require investment (e.g. in land acquisition anddevelopment, in tree planting for agroforestry) and/or the use of inputs (fertilisers, pesticides, herbicides)to increase yields – which should lead to relative price increases benefiting (at least in part) producers. Agradual increase in producer income, driven by higher prices as well as productivity improvements, is mostprobably required for supply to grow in line with demand. Note that although a rise in the relative price ofcassava would hit the urban unemployed particularly hard, it would not necessarily result in a generalincrease in cassava’s share in household budgets, as rural producers would benefit and relative wages areassumed to increase simultaneously.
4) Demand for charcoal is likely to remain high in Kinshasa for a long time, as the past record of electrificationis abysmal, a switch to fossil fuels is unlikely if they remain expensive, and ‘transitional’ fuels such ascharcoal tend to remain in demand for a long time (Arnold et al, 2006; World Bank, 2009). Again,production will certainly increase to meet demand, but it will have to become more sustainable (otherwise
37West Texas Intermediate.
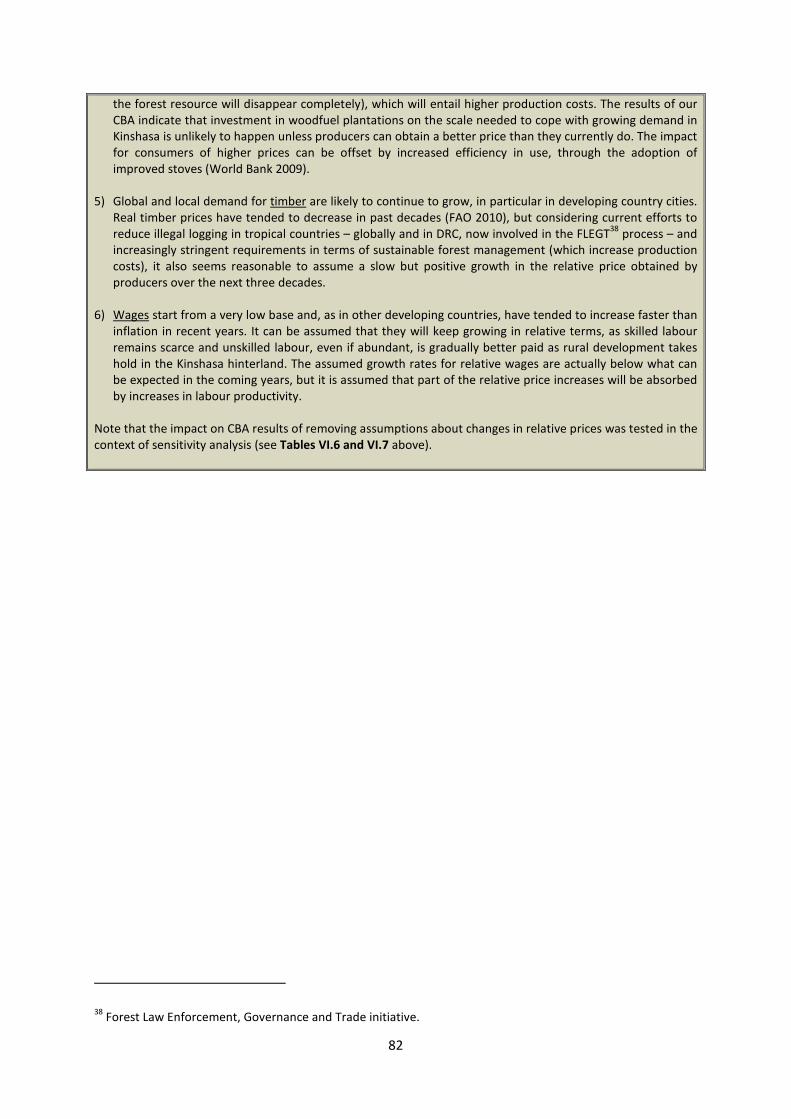
82
the forest resource will disappear completely), which will entail higher production costs. The results of ourCBA indicate that investment in woodfuel plantations on the scale needed to cope with growing demand inKinshasa is unlikely to happen unless producers can obtain a better price than they currently do. The impactfor consumers of higher prices can be offset by increased efficiency in use, through the adoption ofimproved stoves (World Bank 2009).
5) Global and local demand for timber are likely to continue to grow, in particular in developing country cities.Real timber prices have tended to decrease in past decades (FAO 2010), but considering current efforts toreduce illegal logging in tropical countries – globally and in DRC, now involved in the FLEGT
38process – and
increasingly stringent requirements in terms of sustainable forest management (which increase productioncosts), it also seems reasonable to assume a slow but positive growth in the relative price obtained byproducers over the next three decades.
6) Wages start from a very low base and, as in other developing countries, have tended to increase faster thaninflation in recent years. It can be assumed that they will keep growing in relative terms, as skilled labourremains scarce and unskilled labour, even if abundant, is gradually better paid as rural development takeshold in the Kinshasa hinterland. The assumed growth rates for relative wages are actually below what canbe expected in the coming years, but it is assumed that part of the relative price increases will be absorbedby increases in labour productivity.
Note that the impact on CBA results of removing assumptions about changes in relative prices was tested in thecontext of sensitivity analysis (see Tables VI.6 and VI.7 above).
38Forest Law Enforcement, Governance and Trade initiative.

83
Annex VII: Survey results – Detailed data description
1) Mode of calculation of indices
Education index
The highest level of education achieved by a household member (not necessarily the householdhead), calculated on a scale from 1 (lowest) to 8 (highest), was used as a proxy for the household’seducation level.
Wealth index
House characteristic or asset ownership Wealth index score
House type: individual – detached 3
House type: individual – semi-detached 2
House type: shared 1
Number of rooms for living = x/2
Outside house structure: cement blocks 5
Outside house structure: baked bricks 4
Outside house structure: pressed/sundried bricks 3
Outside house structure: wood and mud 2
Outside house structure: thatched 1
Roofing material: corrugated iron (galvanised) 4
Roofing material: tiles 3
Roofing material: plastic plates 2
Roofing material: thatched 1
Window(s): glass 3
Window(s): wood 2
Window(s): open (no glass nor wood) 1
No window 0
House equipment: electricity supply powered by a diesel generator 2
House equipment: electricity supply powered by solar (PV) panels No observation
House equipment: access to safe drinking water inside the house 2
House equipment: shower inside the house 2
House equipment: toilet inside the house No observation
Assets: radio 0.5
Assets: television 2
Assets: mobile phone 0.5
Assets: bicycle 1
Assets: motorbike 3
Assets: car No observation
Assets: van or truck No observation
Assets: tractor No observation
Assets: hoe 0,25
Assets: spade and/or shovel 0,25
Assets: fork 0,25
Assets: rake 0,25
Assets: machete 0,25
Assets: axe 0,25
Assets: chainsaw 2,5
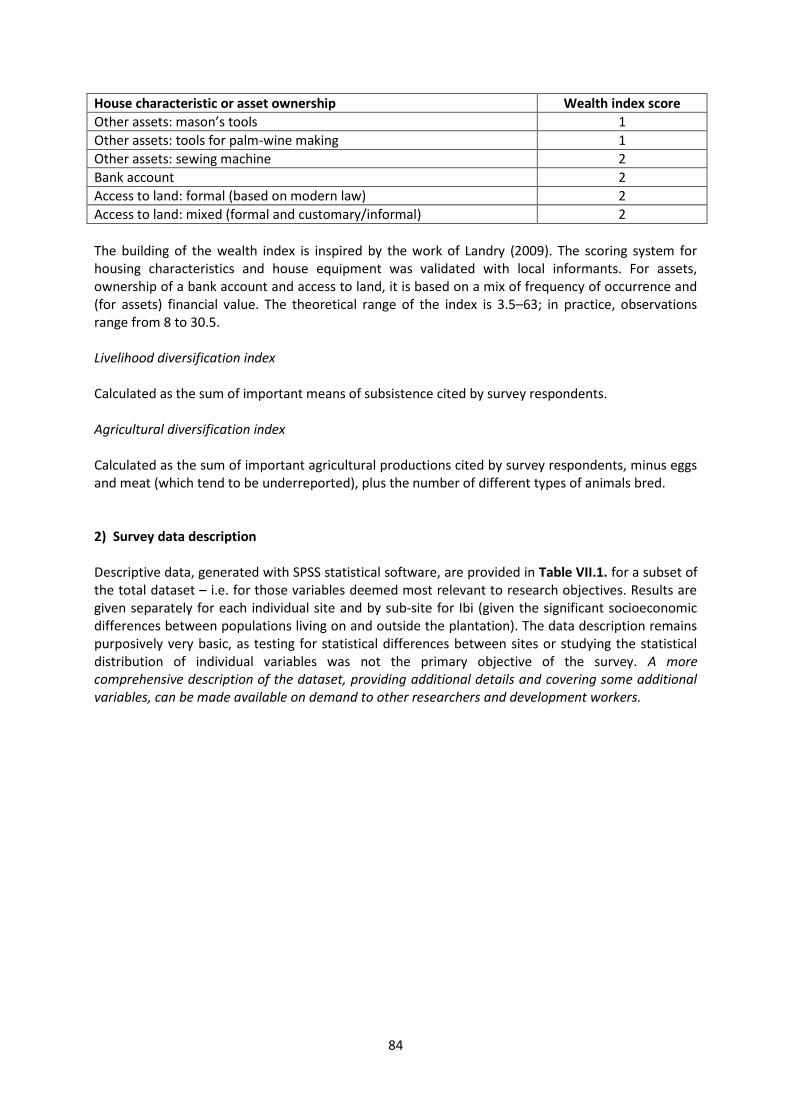
84
House characteristic or asset ownership Wealth index score
Other assets: mason’s tools 1
Other assets: tools for palm-wine making 1
Other assets: sewing machine 2
Bank account 2
Access to land: formal (based on modern law) 2
Access to land: mixed (formal and customary/informal) 2
The building of the wealth index is inspired by the work of Landry (2009). The scoring system forhousing characteristics and house equipment was validated with local informants. For assets,ownership of a bank account and access to land, it is based on a mix of frequency of occurrence and(for assets) financial value. The theoretical range of the index is 3.5–63; in practice, observationsrange from 8 to 30.5.
Livelihood diversification index
Calculated as the sum of important means of subsistence cited by survey respondents.
Agricultural diversification index
Calculated as the sum of important agricultural productions cited by survey respondents, minus eggsand meat (which tend to be underreported), plus the number of different types of animals bred.
2) Survey data description
Descriptive data, generated with SPSS statistical software, are provided in Table VII.1. for a subset ofthe total dataset – i.e. for those variables deemed most relevant to research objectives. Results aregiven separately for each individual site and by sub-site for Ibi (given the significant socioeconomicdifferences between populations living on and outside the plantation). The data description remainspurposively very basic, as testing for statistical differences between sites or studying the statisticaldistribution of individual variables was not the primary objective of the survey. A morecomprehensive description of the dataset, providing additional details and covering some additionalvariables, can be made available on demand to other researchers and development workers.
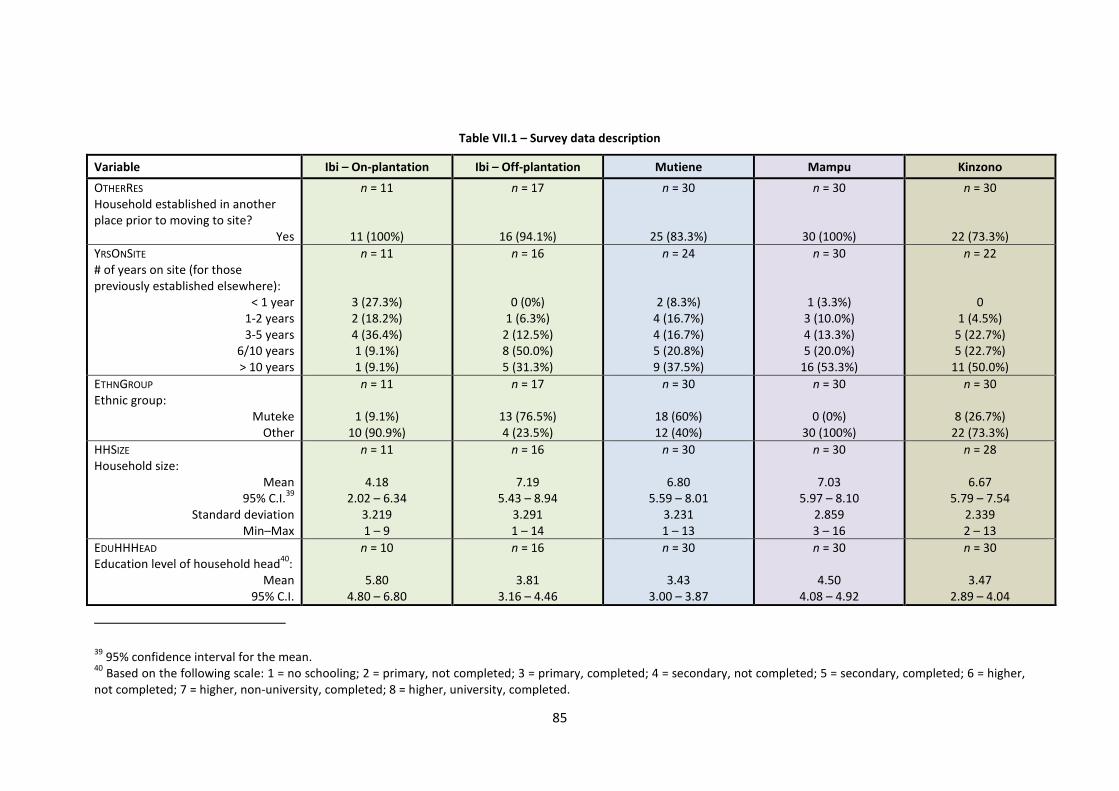
85
Table VII.1 – Survey data description
Variable Ibi – On-plantation Ibi – Off-plantation Mutiene Mampu Kinzono
OTHERRES
Household established in anotherplace prior to moving to site?
Yes
n = 11
11 (100%)
n = 17
16 (94.1%)
n = 30
25 (83.3%)
n = 30
30 (100%)
n = 30
22 (73.3%)
YRSONSITE
# of years on site (for thosepreviously established elsewhere):
< 1 year1-2 years3-5 years
6/10 years> 10 years
n = 11
3 (27.3%)2 (18.2%)4 (36.4%)1 (9.1%)1 (9.1%)
n = 16
0 (0%)1 (6.3%)
2 (12.5%)8 (50.0%)5 (31.3%)
n = 24
2 (8.3%)4 (16.7%)4 (16.7%)5 (20.8%)9 (37.5%)
n = 30
1 (3.3%)3 (10.0%)4 (13.3%)5 (20.0%)
16 (53.3%)
n = 22
01 (4.5%)
5 (22.7%)5 (22.7%)
11 (50.0%)
ETHNGROUP
Ethnic group:Muteke
Other
n = 11
1 (9.1%)10 (90.9%)
n = 17
13 (76.5%)4 (23.5%)
n = 30
18 (60%)12 (40%)
n = 30
0 (0%)30 (100%)
n = 30
8 (26.7%)22 (73.3%)
HHSIZE
Household size:Mean
95% C.I.39
Standard deviationMin–Max
n = 11
4.182.02 – 6.34
3.2191 – 9
n = 16
7.195.43 – 8.94
3.2911 – 14
n = 30
6.805.59 – 8.01
3.2311 – 13
n = 30
7.035.97 – 8.10
2.8593 – 16
n = 28
6.675.79 – 7.54
2.3392 – 13
EDUHHHEAD
Education level of household head40
:Mean
95% C.I.
n = 10
5.804.80 – 6.80
n = 16
3.813.16 – 4.46
n = 30
3.433.00 – 3.87
n = 30
4.504.08 – 4.92
n = 30
3.472.89 – 4.04
3995% confidence interval for the mean.
40Based on the following scale: 1 = no schooling; 2 = primary, not completed; 3 = primary, completed; 4 = secondary, not completed; 5 = secondary, completed; 6 = higher,
not completed; 7 = higher, non-university, completed; 8 = higher, university, completed.
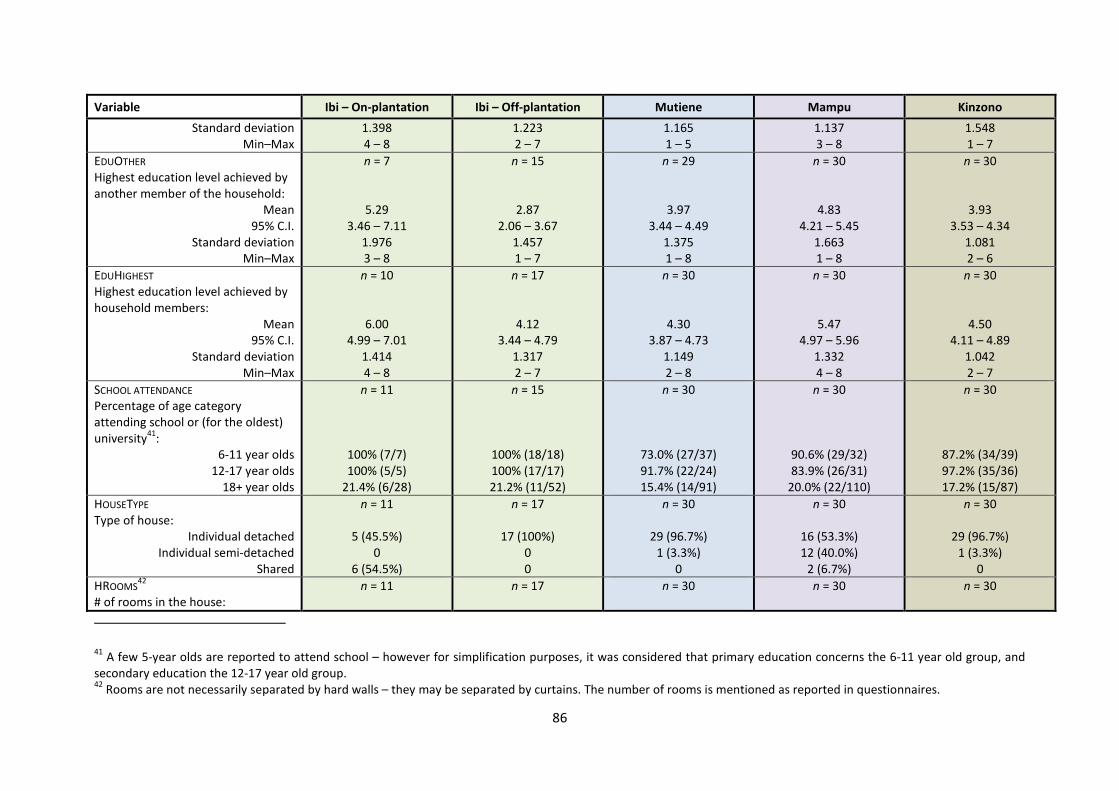
86
Variable Ibi – On-plantation Ibi – Off-plantation Mutiene Mampu Kinzono
Standard deviationMin–Max
1.3984 – 8
1.2232 – 7
1.1651 – 5
1.1373 – 8
1.5481 – 7
EDUOTHER
Highest education level achieved byanother member of the household:
Mean95% C.I.
Standard deviationMin–Max
n = 7
5.293.46 – 7.11
1.9763 – 8
n = 15
2.872.06 – 3.67
1.4571 – 7
n = 29
3.973.44 – 4.49
1.3751 – 8
n = 30
4.834.21 – 5.45
1.6631 – 8
n = 30
3.933.53 – 4.34
1.0812 – 6
EDUHIGHEST
Highest education level achieved byhousehold members:
Mean95% C.I.
Standard deviationMin–Max
n = 10
6.004.99 – 7.01
1.4144 – 8
n = 17
4.123.44 – 4.79
1.3172 – 7
n = 30
4.303.87 – 4.73
1.1492 – 8
n = 30
5.474.97 – 5.96
1.3324 – 8
n = 30
4.504.11 – 4.89
1.0422 – 7
SCHOOL ATTENDANCE
Percentage of age categoryattending school or (for the oldest)university
41:
6-11 year olds12-17 year olds
18+ year olds
n = 11
100% (7/7)100% (5/5)
21.4% (6/28)
n = 15
100% (18/18)100% (17/17)21.2% (11/52)
n = 30
73.0% (27/37)91.7% (22/24)15.4% (14/91)
n = 30
90.6% (29/32)83.9% (26/31)
20.0% (22/110)
n = 30
87.2% (34/39)97.2% (35/36)17.2% (15/87)
HOUSETYPE
Type of house:Individual detached
Individual semi-detachedShared
n = 11
5 (45.5%)0
6 (54.5%)
n = 17
17 (100%)00
n = 30
29 (96.7%)1 (3.3%)
0
n = 30
16 (53.3%)12 (40.0%)
2 (6.7%)
n = 30
29 (96.7%)1 (3.3%)
0
HROOMS42
# of rooms in the house:n = 11 n = 17 n = 30 n = 30 n = 30
41A few 5-year olds are reported to attend school – however for simplification purposes, it was considered that primary education concerns the 6-11 year old group, and
secondary education the 12-17 year old group.42
Rooms are not necessarily separated by hard walls – they may be separated by curtains. The number of rooms is mentioned as reported in questionnaires.
87
Variable Ibi – On-plantation Ibi – Off-plantation Mutiene Mampu Kinzono
123456
5 (45.5%)3 (27.3%)2 (18.2%)1 (9.1%)
00
7 (41.2%)9 (52.9%)1 (5.9%)
000
2 (6.7%)10 (33.3%)10 (33.3%)5 (16.7%)3 (10.0%)
0
1 (3.3%)8 (26.7%)
17 (56.7%)4 (13.3%)
00
07 (23.3%)
12 (40.0%)8 (26.7%)2 (6.7%)1 (3.3%)
HWALLS43
Materials used for the house’soutside structure:
Cement blocksBaked bricks
Pressed, sundried bricksWood and mud
Thatched
n = 11
6 (54.5%)0
5 (45.5%)00
n = 17
000
16 (94.1%)1 (5.9%)
n = 30
00
11 (36.7%)19 (63.3%)
0
n = 30
26 (86.7%)00
3 (10.0%)1 (3.3%)
n = 30
00
5 (16.7%)23 (76.7%)
2 (6.7%)
HROOF
Materials used for the roof:Corrugated iron (galvanised)
TilesHard plastic plates
Thatched
n = 11
11 (100%)000
n = 17
9 (52.9%)00
8 (47.1%)
n = 30
17 (56.7%)0
3 (10.0%)10 (33.3%)
n = 30
12 (40.0%)14 (46.7%)
04 (13.3%)
n = 30
4 (13.3%)00
26 (86.7%)
HWINDOWS
Type of windowsGlass
WoodOpen (no glass or wood)
No window
n = 11
11 (100%)000
n = 17
016 (94.1%)
01 (5.9%)
n = 30
1 (3.3%)10 (33.3%)17 (56.7%)
2 (6.7%)
n = 30
4 (13.3%)22 (73.3%)4 (13.3%)
0
n = 30
1 (3.3%)14 (46.7%)6 (20.0%)9 (30.0%)
HOUSE EQUIPMENT
Power supply (generator)Power supply (photovoltaic)
Drinking water inside
n = 11
4 (36.4%)0
1 (9.1%)
n = 17
000
n = 30
000
n = 30
9 (30.0%)00
n = 30
6 (20.0%)00
43For walls and other house characteristics, where the enumerator selected ‘other’ + description, the researcher assigned a code corresponding to the pre-coded category
closest to the description provided in terms of quality/status. The only purpose of asking for house characteristics is to help calculate the household wealth index.
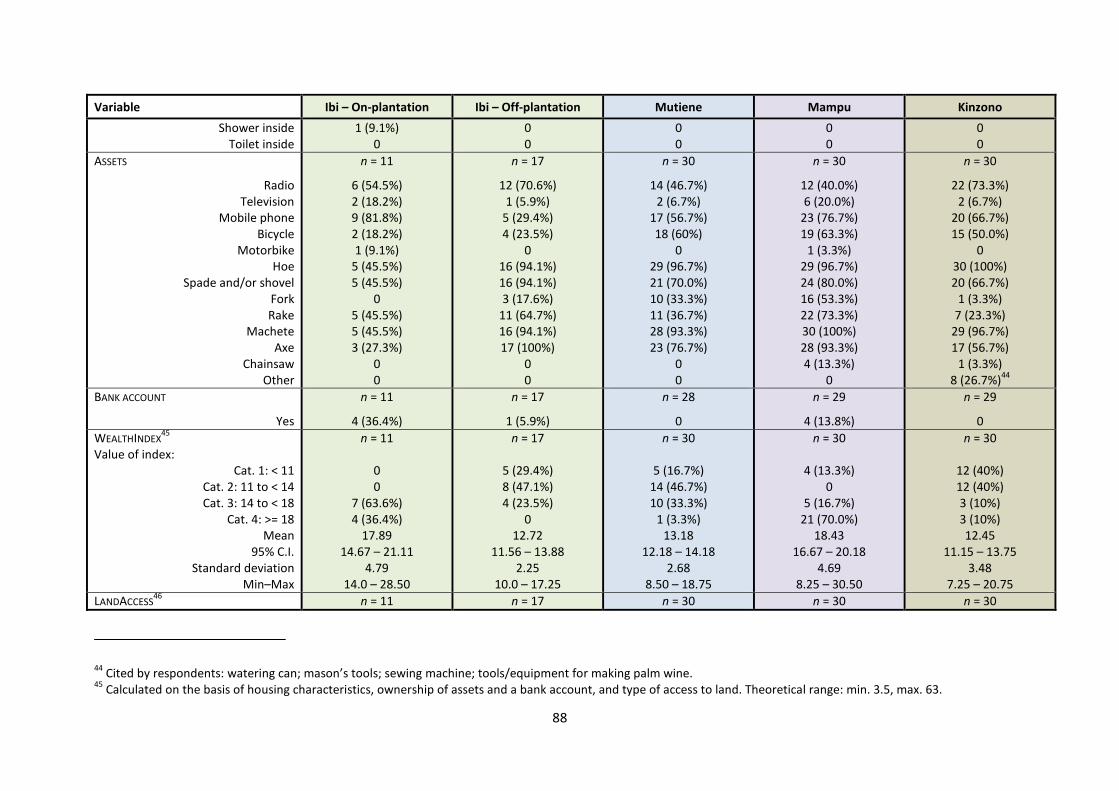
88
Variable Ibi – On-plantation Ibi – Off-plantation Mutiene Mampu Kinzono
Shower insideToilet inside
1 (9.1%)0
00
00
00
00
ASSETS
RadioTelevision
Mobile phoneBicycle
MotorbikeHoe
Spade and/or shovelForkRake
MacheteAxe
ChainsawOther
n = 11
6 (54.5%)2 (18.2%)9 (81.8%)2 (18.2%)1 (9.1%)
5 (45.5%)5 (45.5%)
05 (45.5%)5 (45.5%)3 (27.3%)
00
n = 17
12 (70.6%)1 (5.9%)
5 (29.4%)4 (23.5%)
016 (94.1%)16 (94.1%)3 (17.6%)
11 (64.7%)16 (94.1%)17 (100%)
00
n = 30
14 (46.7%)2 (6.7%)
17 (56.7%)18 (60%)
029 (96.7%)21 (70.0%)10 (33.3%)11 (36.7%)28 (93.3%)23 (76.7%)
00
n = 30
12 (40.0%)6 (20.0%)
23 (76.7%)19 (63.3%)
1 (3.3%)29 (96.7%)24 (80.0%)16 (53.3%)22 (73.3%)30 (100%)28 (93.3%)4 (13.3%)
0
n = 30
22 (73.3%)2 (6.7%)
20 (66.7%)15 (50.0%)
030 (100%)20 (66.7%)
1 (3.3%)7 (23.3%)
29 (96.7%)17 (56.7%)
1 (3.3%)8 (26.7%)
44
BANK ACCOUNT
Yes
n = 11
4 (36.4%)
n = 17
1 (5.9%)
n = 28
0
n = 29
4 (13.8%)
n = 29
0
WEALTHINDEX45
Value of index:Cat. 1: < 11
Cat. 2: 11 to < 14Cat. 3: 14 to < 18
Cat. 4: >= 18Mean
95% C.I.Standard deviation
Min–Max
n = 11
00
7 (63.6%)4 (36.4%)
17.8914.67 – 21.11
4.7914.0 – 28.50
n = 17
5 (29.4%)8 (47.1%)4 (23.5%)
012.72
11.56 – 13.882.25
10.0 – 17.25
n = 30
5 (16.7%)14 (46.7%)10 (33.3%)
1 (3.3%)13.18
12.18 – 14.182.68
8.50 – 18.75
n = 30
4 (13.3%)0
5 (16.7%)21 (70.0%)
18.4316.67 – 20.18
4.698.25 – 30.50
n = 30
12 (40%)12 (40%)3 (10%)3 (10%)12.45
11.15 – 13.753.48
7.25 – 20.75
LANDACCESS46
n = 11 n = 17 n = 30 n = 30 n = 30
44Cited by respondents: watering can; mason’s tools; sewing machine; tools/equipment for making palm wine.
45Calculated on the basis of housing characteristics, ownership of assets and a bank account, and type of access to land. Theoretical range: min. 3.5, max. 63.
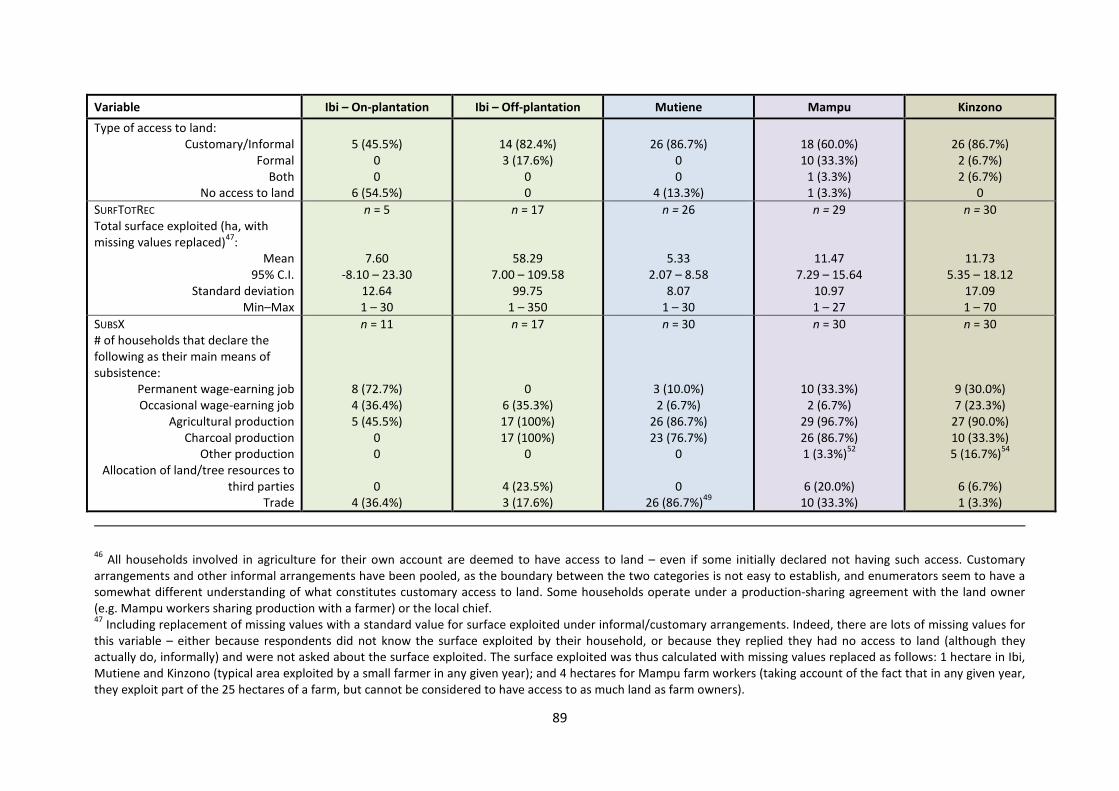
89
Variable Ibi – On-plantation Ibi – Off-plantation Mutiene Mampu Kinzono
Type of access to land:Customary/Informal
FormalBoth
No access to land
5 (45.5%)00
6 (54.5%)
14 (82.4%)3 (17.6%)
00
26 (86.7%)00
4 (13.3%)
18 (60.0%)10 (33.3%)
1 (3.3%)1 (3.3%)
26 (86.7%)2 (6.7%)2 (6.7%)
0
SURFTOTREC
Total surface exploited (ha, withmissing values replaced)
47:
Mean95% C.I.
Standard deviationMin–Max
n = 5
7.60-8.10 – 23.30
12.641 – 30
n = 17
58.297.00 – 109.58
99.751 – 350
n = 26
5.332.07 – 8.58
8.071 – 30
n = 29
11.477.29 – 15.64
10.971 – 27
n = 30
11.735.35 – 18.12
17.091 – 70
SUBSX# of households that declare thefollowing as their main means ofsubsistence:
Permanent wage-earning jobOccasional wage-earning job
Agricultural productionCharcoal production
Other productionAllocation of land/tree resources to
third partiesTrade
n = 11
8 (72.7%)4 (36.4%)5 (45.5%)
00
04 (36.4%)
n = 17
06 (35.3%)17 (100%)17 (100%)
0
4 (23.5%)3 (17.6%)
n = 30
3 (10.0%)2 (6.7%)
26 (86.7%)23 (76.7%)
0
026 (86.7%)
49
n = 30
10 (33.3%)2 (6.7%)
29 (96.7%)26 (86.7%)1 (3.3%)
52
6 (20.0%)10 (33.3%)
n = 30
9 (30.0%)7 (23.3%)
27 (90.0%)10 (33.3%)5 (16.7%)
54
6 (6.7%)1 (3.3%)
46All households involved in agriculture for their own account are deemed to have access to land – even if some initially declared not having such access. Customary
arrangements and other informal arrangements have been pooled, as the boundary between the two categories is not easy to establish, and enumerators seem to have asomewhat different understanding of what constitutes customary access to land. Some households operate under a production-sharing agreement with the land owner(e.g. Mampu workers sharing production with a farmer) or the local chief.47
Including replacement of missing values with a standard value for surface exploited under informal/customary arrangements. Indeed, there are lots of missing values forthis variable – either because respondents did not know the surface exploited by their household, or because they replied they had no access to land (although theyactually do, informally) and were not asked about the surface exploited. The surface exploited was thus calculated with missing values replaced as follows: 1 hectare in Ibi,Mutiene and Kinzono (typical area exploited by a small farmer in any given year); and 4 hectares for Mampu farm workers (taking account of the fact that in any given year,they exploit part of the 25 hectares of a farm, but cannot be considered to have access to as much land as farm owners).
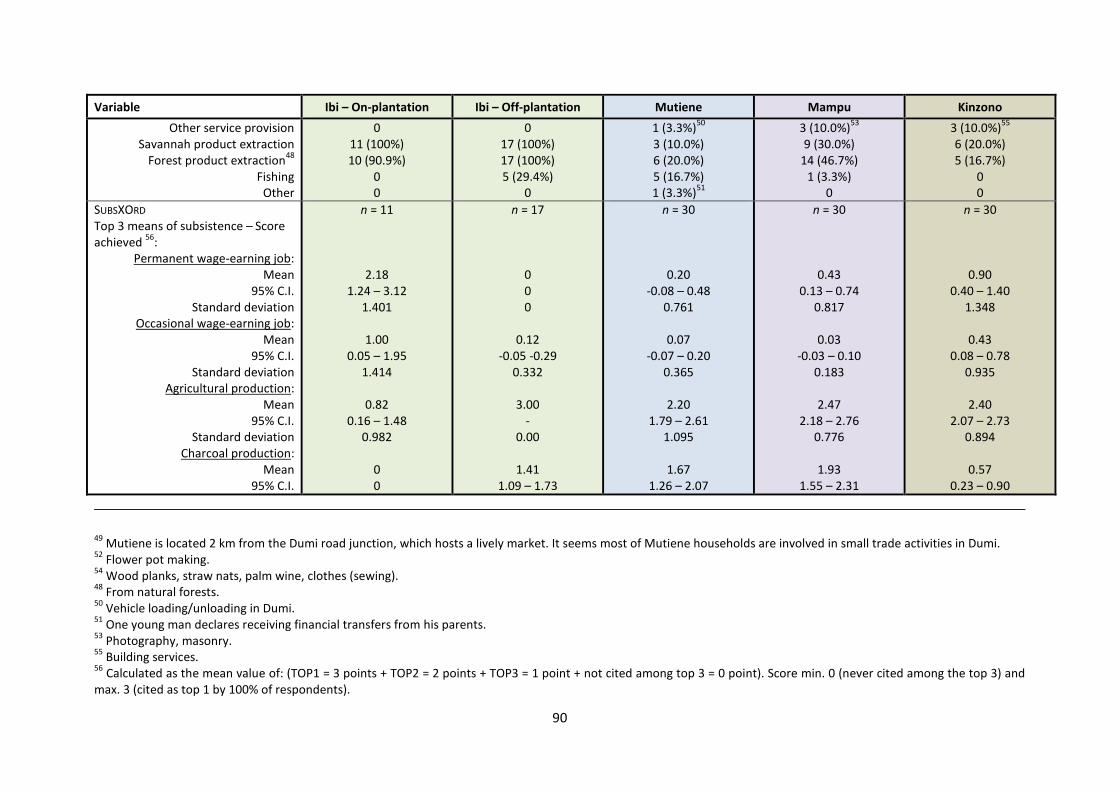
90
Variable Ibi – On-plantation Ibi – Off-plantation Mutiene Mampu Kinzono
Other service provisionSavannah product extraction
Forest product extraction48
FishingOther
011 (100%)10 (90.9%)
00
017 (100%)17 (100%)5 (29.4%)
0
1 (3.3%)50
3 (10.0%)6 (20.0%)5 (16.7%)1 (3.3%)
51
3 (10.0%)53
9 (30.0%)14 (46.7%)
1 (3.3%)0
3 (10.0%)55
6 (20.0%)5 (16.7%)
00
SUBSXORD
Top 3 means of subsistence – Scoreachieved
56:
Permanent wage-earning job:Mean
95% C.I.Standard deviation
Occasional wage-earning job:Mean
95% C.I.Standard deviation
Agricultural production:Mean
95% C.I.Standard deviation
Charcoal production:Mean
95% C.I.
n = 11
2.181.24 – 3.12
1.401
1.000.05 – 1.95
1.414
0.820.16 – 1.48
0.982
00
n = 17
000
0.12-0.05 -0.29
0.332
3.00-
0.00
1.411.09 – 1.73
n = 30
0.20-0.08 – 0.48
0.761
0.07-0.07 – 0.20
0.365
2.201.79 – 2.61
1.095
1.671.26 – 2.07
n = 30
0.430.13 – 0.74
0.817
0.03-0.03 – 0.10
0.183
2.472.18 – 2.76
0.776
1.931.55 – 2.31
n = 30
0.900.40 – 1.40
1.348
0.430.08 – 0.78
0.935
2.402.07 – 2.73
0.894
0.570.23 – 0.90
49Mutiene is located 2 km from the Dumi road junction, which hosts a lively market. It seems most of Mutiene households are involved in small trade activities in Dumi.
52Flower pot making.
54Wood planks, straw nats, palm wine, clothes (sewing).
48From natural forests.
50Vehicle loading/unloading in Dumi.
51One young man declares receiving financial transfers from his parents.
53Photography, masonry.
55Building services.
56Calculated as the mean value of: (TOP1 = 3 points + TOP2 = 2 points + TOP3 = 1 point + not cited among top 3 = 0 point). Score min. 0 (never cited among the top 3) and
max. 3 (cited as top 1 by 100% of respondents).
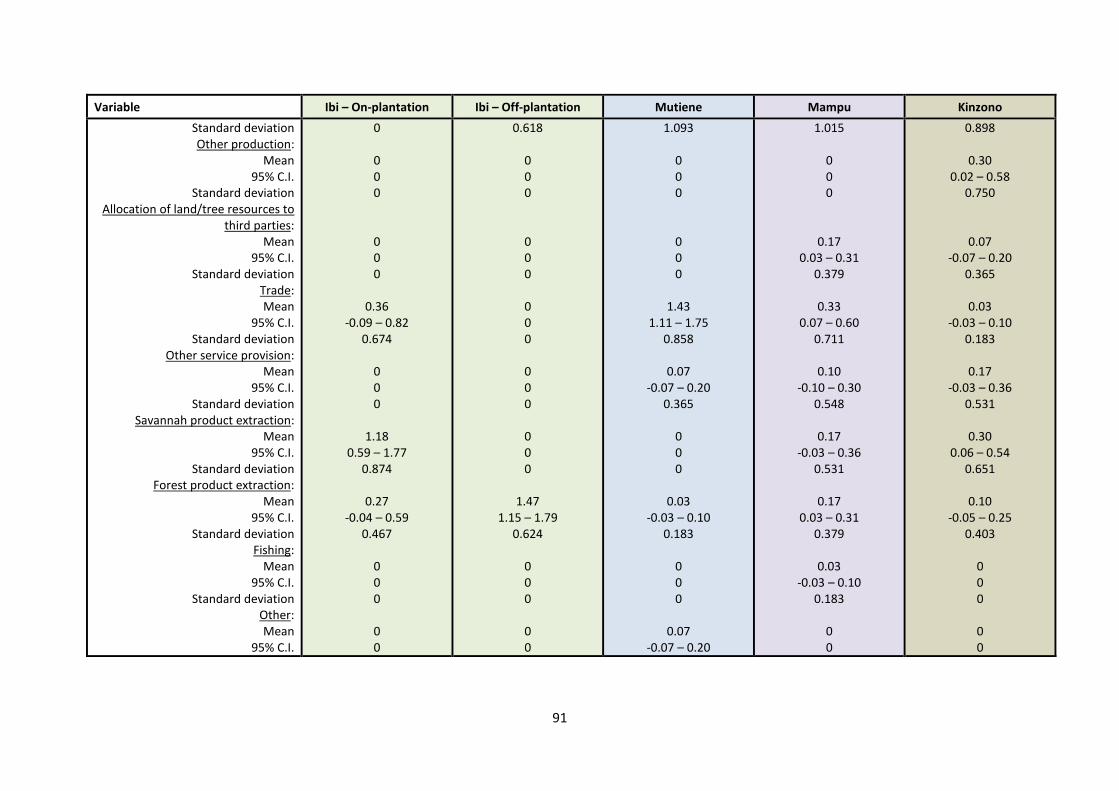
91
Variable Ibi – On-plantation Ibi – Off-plantation Mutiene Mampu Kinzono
Standard deviationOther production:
Mean95% C.I.
Standard deviationAllocation of land/tree resources to
third parties:Mean
95% C.I.Standard deviation
Trade:Mean
95% C.I.Standard deviation
Other service provision:Mean
95% C.I.Standard deviation
Savannah product extraction:Mean
95% C.I.Standard deviation
Forest product extraction:Mean
95% C.I.Standard deviation
Fishing:Mean
95% C.I.Standard deviation
Other:Mean
95% C.I.
0
000
000
0.36-0.09 – 0.82
0.674
000
1.180.59 – 1.77
0.874
0.27-0.04 – 0.59
0.467
000
00
0.618
000
000
000
000
000
1.471.15 – 1.79
0.624
000
00
1.093
000
000
1.431.11 – 1.75
0.858
0.07-0.07 – 0.20
0.365
000
0.03-0.03 – 0.10
0.183
000
0.07-0.07 – 0.20
1.015
000
0.170.03 – 0.31
0.379
0.330.07 – 0.60
0.711
0.10-0.10 – 0.30
0.548
0.17-0.03 – 0.36
0.531
0.170.03 – 0.31
0.379
0.03-0.03 – 0.10
0.183
00
0.898
0.300.02 – 0.58
0.750
0.07-0.07 – 0.20
0.365
0.03-0.03 – 0.10
0.183
0.17-0.03 – 0.36
0.531
0.300.06 – 0.54
0.651
0.10-0.05 – 0.25
0.403
000
00
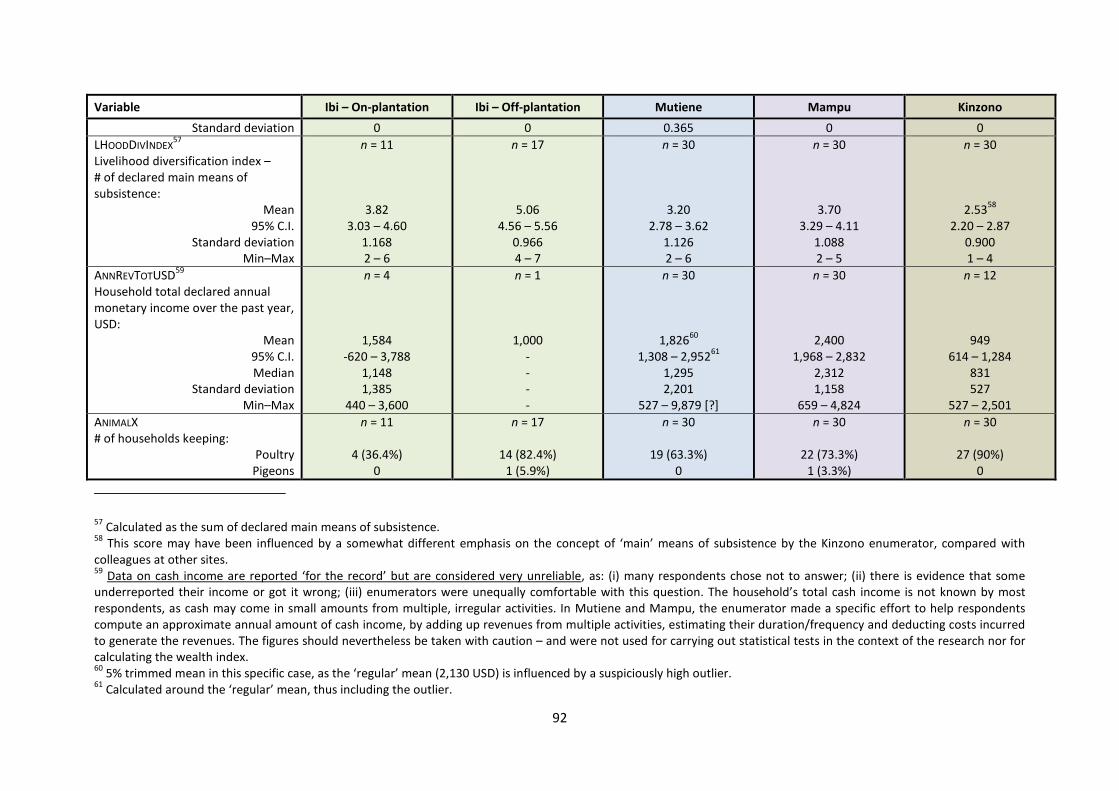
92
Variable Ibi – On-plantation Ibi – Off-plantation Mutiene Mampu Kinzono
Standard deviation 0 0 0.365 0 0
LHOODDIVINDEX57
Livelihood diversification index –# of declared main means ofsubsistence:
Mean95% C.I.
Standard deviationMin–Max
n = 11
3.823.03 – 4.60
1.1682 – 6
n = 17
5.064.56 – 5.56
0.9664 – 7
n = 30
3.202.78 – 3.62
1.1262 – 6
n = 30
3.703.29 – 4.11
1.0882 – 5
n = 30
2.5358
2.20 – 2.870.9001 – 4
ANNREVTOTUSD59
Household total declared annualmonetary income over the past year,USD:
Mean95% C.I.Median
Standard deviationMin–Max
n = 4
1,584-620 – 3,788
1,1481,385
440 – 3,600
n = 1
1,000----
n = 30
1,82660
1,308 – 2,95261
1,2952,201
527 – 9,879 [?]
n = 30
2,4001,968 – 2,832
2,3121,158
659 – 4,824
n = 12
949614 – 1,284
831527
527 – 2,501
ANIMALX# of households keeping:
PoultryPigeons
n = 11
4 (36.4%)0
n = 17
14 (82.4%)1 (5.9%)
n = 30
19 (63.3%)0
n = 30
22 (73.3%)1 (3.3%)
n = 30
27 (90%)0
57Calculated as the sum of declared main means of subsistence.
58This score may have been influenced by a somewhat different emphasis on the concept of ‘main’ means of subsistence by the Kinzono enumerator, compared with
colleagues at other sites.59
Data on cash income are reported ‘for the record’ but are considered very unreliable, as: (i) many respondents chose not to answer; (ii) there is evidence that someunderreported their income or got it wrong; (iii) enumerators were unequally comfortable with this question. The household’s total cash income is not known by mostrespondents, as cash may come in small amounts from multiple, irregular activities. In Mutiene and Mampu, the enumerator made a specific effort to help respondentscompute an approximate annual amount of cash income, by adding up revenues from multiple activities, estimating their duration/frequency and deducting costs incurredto generate the revenues. The figures should nevertheless be taken with caution – and were not used for carrying out statistical tests in the context of the research nor forcalculating the wealth index.60
5% trimmed mean in this specific case, as the ‘regular’ mean (2,130 USD) is influenced by a suspiciously high outlier.61
Calculated around the ‘regular’ mean, thus including the outlier.
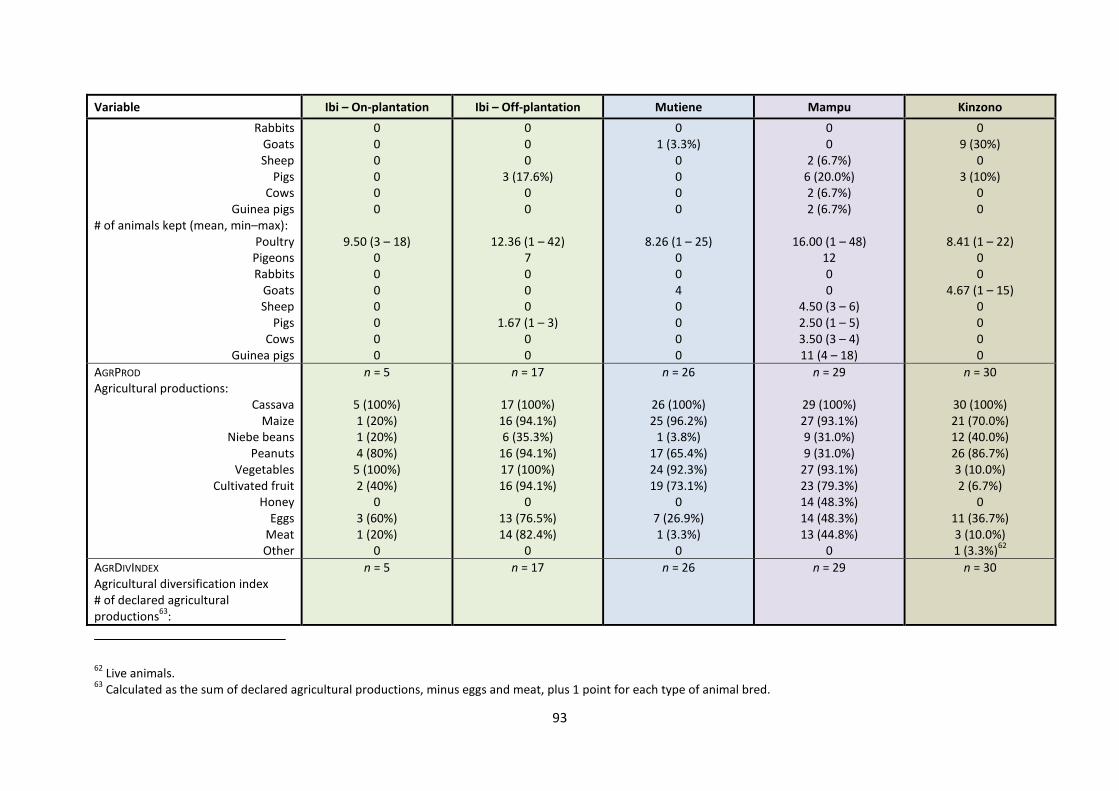
93
Variable Ibi – On-plantation Ibi – Off-plantation Mutiene Mampu Kinzono
RabbitsGoatsSheep
PigsCows
Guinea pigs# of animals kept (mean, min–max):
PoultryPigeonsRabbits
GoatsSheep
PigsCows
Guinea pigs
000000
9.50 (3 – 18)0000000
000
3 (17.6%)00
12.36 (1 – 42)7000
1.67 (1 – 3)00
01 (3.3%)
0000
8.26 (1 – 25)0040000
00
2 (6.7%)6 (20.0%)2 (6.7%)2 (6.7%)
16.00 (1 – 48)1200
4.50 (3 – 6)2.50 (1 – 5)3.50 (3 – 4)11 (4 – 18)
09 (30%)
03 (10%)
00
8.41 (1 – 22)00
4.67 (1 – 15)0000
AGRPROD
Agricultural productions:Cassava
MaizeNiebe beans
PeanutsVegetables
Cultivated fruitHoney
EggsMeatOther
n = 5
5 (100%)1 (20%)1 (20%)4 (80%)
5 (100%)2 (40%)
03 (60%)1 (20%)
0
n = 17
17 (100%)16 (94.1%)6 (35.3%)
16 (94.1%)17 (100%)16 (94.1%)
013 (76.5%)14 (82.4%)
0
n = 26
26 (100%)25 (96.2%)
1 (3.8%)17 (65.4%)24 (92.3%)19 (73.1%)
07 (26.9%)1 (3.3%)
0
n = 29
29 (100%)27 (93.1%)9 (31.0%)9 (31.0%)
27 (93.1%)23 (79.3%)14 (48.3%)14 (48.3%)13 (44.8%)
0
n = 30
30 (100%)21 (70.0%)12 (40.0%)26 (86.7%)3 (10.0%)2 (6.7%)
011 (36.7%)3 (10.0%)1 (3.3%)
62
AGRDIVINDEX
Agricultural diversification index# of declared agriculturalproductions
63:
n = 5 n = 17 n = 26 n = 29 n = 30
62Live animals.
63Calculated as the sum of declared agricultural productions, minus eggs and meat, plus 1 point for each type of animal bred.
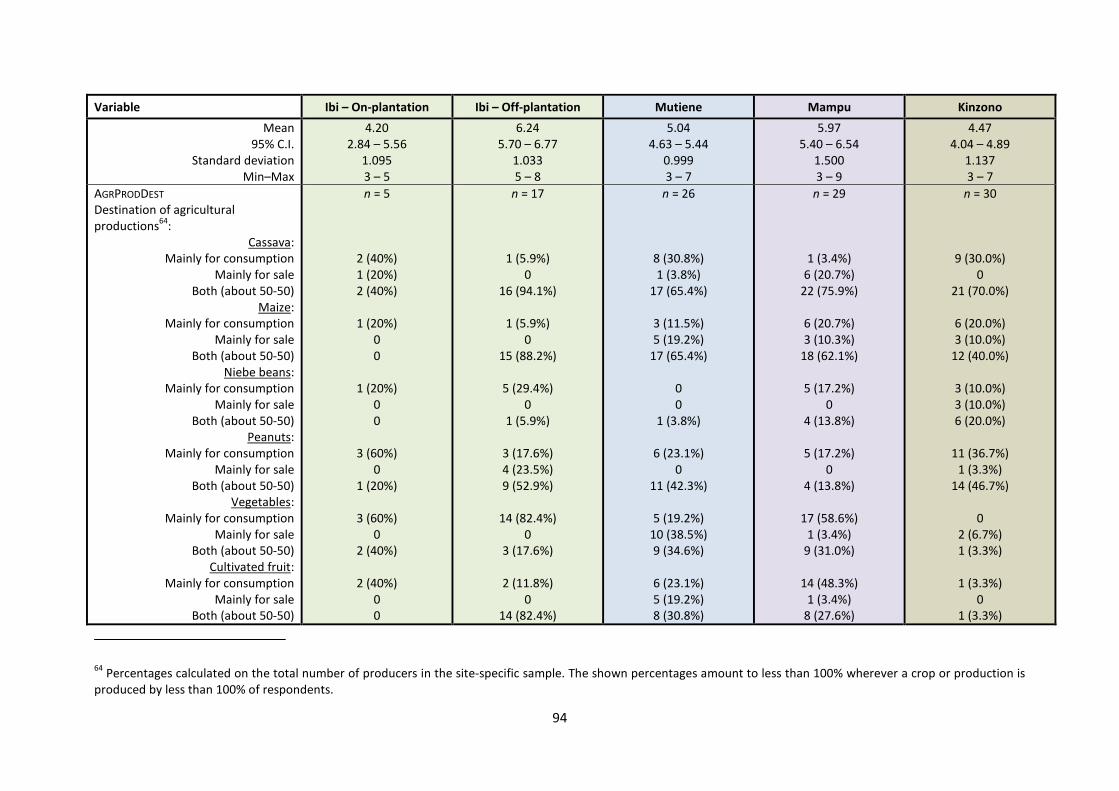
94
Variable Ibi – On-plantation Ibi – Off-plantation Mutiene Mampu Kinzono
Mean95% C.I.
Standard deviationMin–Max
4.202.84 – 5.56
1.0953 – 5
6.245.70 – 6.77
1.0335 – 8
5.044.63 – 5.44
0.9993 – 7
5.975.40 – 6.54
1.5003 – 9
4.474.04 – 4.89
1.1373 – 7
AGRPRODDEST
Destination of agriculturalproductions
64:
Cassava:Mainly for consumption
Mainly for saleBoth (about 50-50)
Maize:Mainly for consumption
Mainly for saleBoth (about 50-50)
Niebe beans:Mainly for consumption
Mainly for saleBoth (about 50-50)
Peanuts:Mainly for consumption
Mainly for saleBoth (about 50-50)
Vegetables:Mainly for consumption
Mainly for saleBoth (about 50-50)
Cultivated fruit:Mainly for consumption
Mainly for saleBoth (about 50-50)
n = 5
2 (40%)1 (20%)2 (40%)
1 (20%)00
1 (20%)00
3 (60%)0
1 (20%)
3 (60%)0
2 (40%)
2 (40%)00
n = 17
1 (5.9%)0
16 (94.1%)
1 (5.9%)0
15 (88.2%)
5 (29.4%)0
1 (5.9%)
3 (17.6%)4 (23.5%)9 (52.9%)
14 (82.4%)0
3 (17.6%)
2 (11.8%)0
14 (82.4%)
n = 26
8 (30.8%)1 (3.8%)
17 (65.4%)
3 (11.5%)5 (19.2%)
17 (65.4%)
00
1 (3.8%)
6 (23.1%)0
11 (42.3%)
5 (19.2%)10 (38.5%)9 (34.6%)
6 (23.1%)5 (19.2%)8 (30.8%)
n = 29
1 (3.4%)6 (20.7%)
22 (75.9%)
6 (20.7%)3 (10.3%)
18 (62.1%)
5 (17.2%)0
4 (13.8%)
5 (17.2%)0
4 (13.8%)
17 (58.6%)1 (3.4%)
9 (31.0%)
14 (48.3%)1 (3.4%)
8 (27.6%)
n = 30
9 (30.0%)0
21 (70.0%)
6 (20.0%)3 (10.0%)
12 (40.0%)
3 (10.0%)3 (10.0%)6 (20.0%)
11 (36.7%)1 (3.3%)
14 (46.7%)
02 (6.7%)1 (3.3%)
1 (3.3%)0
1 (3.3%)
64Percentages calculated on the total number of producers in the site-specific sample. The shown percentages amount to less than 100% wherever a crop or production is
produced by less than 100% of respondents.
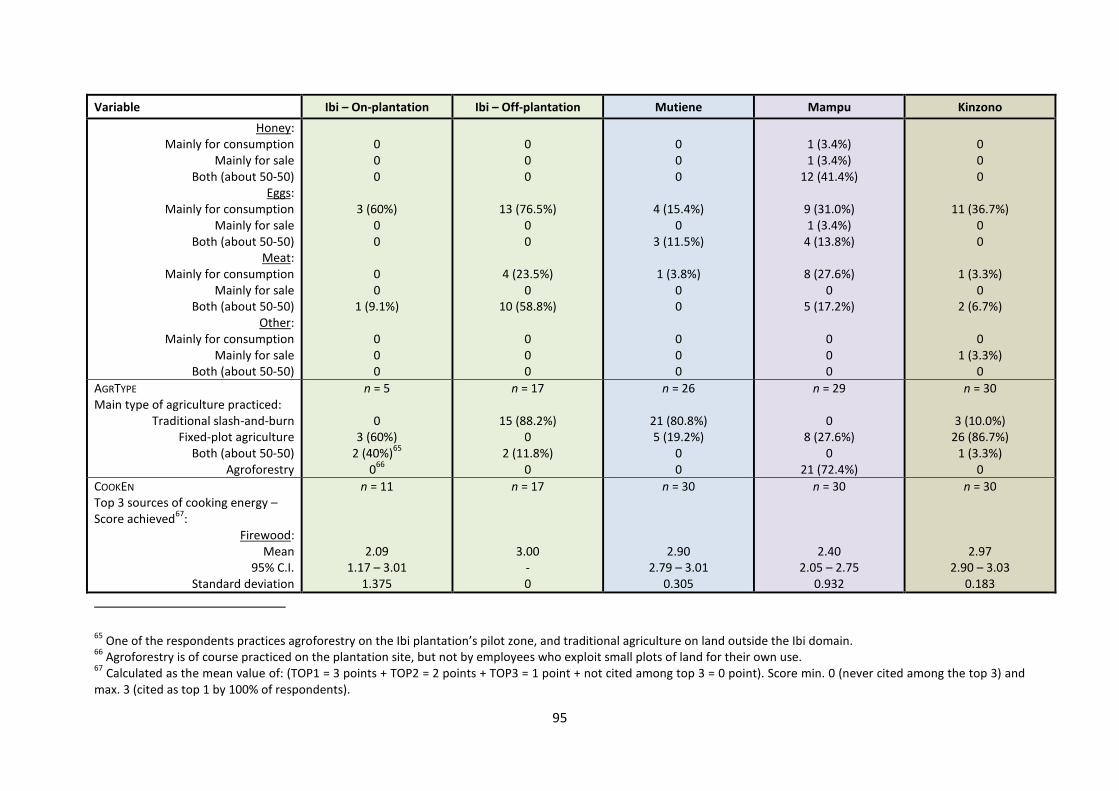
95
Variable Ibi – On-plantation Ibi – Off-plantation Mutiene Mampu Kinzono
Honey:Mainly for consumption
Mainly for saleBoth (about 50-50)
Eggs:Mainly for consumption
Mainly for saleBoth (about 50-50)
Meat:Mainly for consumption
Mainly for saleBoth (about 50-50)
Other:Mainly for consumption
Mainly for saleBoth (about 50-50)
000
3 (60%)00
00
1 (9.1%)
000
000
13 (76.5%)00
4 (23.5%)0
10 (58.8%)
000
000
4 (15.4%)0
3 (11.5%)
1 (3.8%)00
000
1 (3.4%)1 (3.4%)
12 (41.4%)
9 (31.0%)1 (3.4%)
4 (13.8%)
8 (27.6%)0
5 (17.2%)
000
000
11 (36.7%)00
1 (3.3%)0
2 (6.7%)
01 (3.3%)
0
AGRTYPE
Main type of agriculture practiced:Traditional slash-and-burn
Fixed-plot agricultureBoth (about 50-50)
Agroforestry
n = 5
03 (60%)
2 (40%)65
066
n = 17
15 (88.2%)0
2 (11.8%)0
n = 26
21 (80.8%)5 (19.2%)
00
n = 29
08 (27.6%)
021 (72.4%)
n = 30
3 (10.0%)26 (86.7%)
1 (3.3%)0
COOKEN
Top 3 sources of cooking energy –Score achieved
67:
Firewood:Mean
95% C.I.Standard deviation
n = 11
2.091.17 – 3.01
1.375
n = 17
3.00-0
n = 30
2.902.79 – 3.01
0.305
n = 30
2.402.05 – 2.75
0.932
n = 30
2.972.90 – 3.03
0.183
65One of the respondents practices agroforestry on the Ibi plantation’s pilot zone, and traditional agriculture on land outside the Ibi domain.
66Agroforestry is of course practiced on the plantation site, but not by employees who exploit small plots of land for their own use.
67Calculated as the mean value of: (TOP1 = 3 points + TOP2 = 2 points + TOP3 = 1 point + not cited among top 3 = 0 point). Score min. 0 (never cited among the top 3) and
max. 3 (cited as top 1 by 100% of respondents).
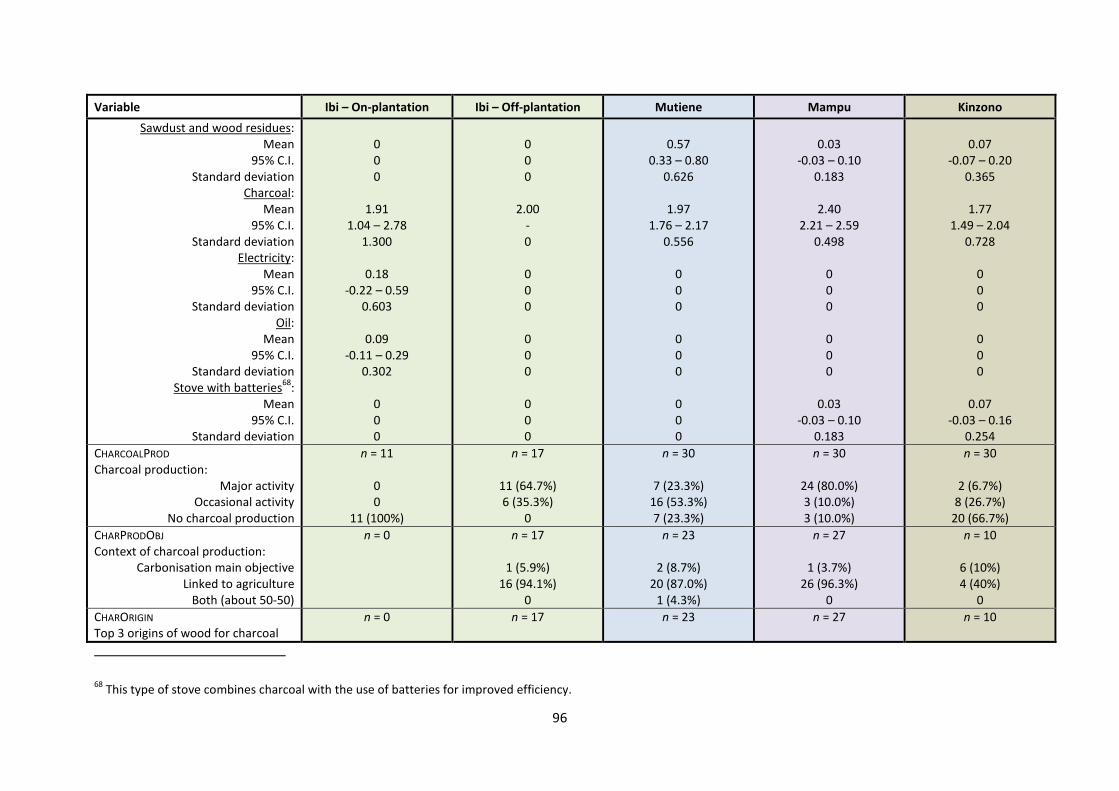
96
Variable Ibi – On-plantation Ibi – Off-plantation Mutiene Mampu Kinzono
Sawdust and wood residues:Mean
95% C.I.Standard deviation
Charcoal:Mean
95% C.I.Standard deviation
Electricity:Mean
95% C.I.Standard deviation
Oil:Mean
95% C.I.Standard deviation
Stove with batteries68
:Mean
95% C.I.Standard deviation
000
1.911.04 – 2.78
1.300
0.18-0.22 – 0.59
0.603
0.09-0.11 – 0.29
0.302
000
000
2.00-0
000
000
000
0.570.33 – 0.80
0.626
1.971.76 – 2.17
0.556
000
000
000
0.03-0.03 – 0.10
0.183
2.402.21 – 2.59
0.498
000
000
0.03-0.03 – 0.10
0.183
0.07-0.07 – 0.20
0.365
1.771.49 – 2.04
0.728
000
000
0.07-0.03 – 0.16
0.254
CHARCOALPROD
Charcoal production:Major activity
Occasional activityNo charcoal production
n = 11
00
11 (100%)
n = 17
11 (64.7%)6 (35.3%)
0
n = 30
7 (23.3%)16 (53.3%)7 (23.3%)
n = 30
24 (80.0%)3 (10.0%)3 (10.0%)
n = 30
2 (6.7%)8 (26.7%)
20 (66.7%)
CHARPRODOBJ
Context of charcoal production:Carbonisation main objective
Linked to agricultureBoth (about 50-50)
n = 0 n = 17
1 (5.9%)16 (94.1%)
0
n = 23
2 (8.7%)20 (87.0%)
1 (4.3%)
n = 27
1 (3.7%)26 (96.3%)
0
n = 10
6 (10%)4 (40%)
0
CHARORIGIN
Top 3 origins of wood for charcoaln = 0 n = 17 n = 23 n = 27 n = 10
68This type of stove combines charcoal with the use of batteries for improved efficiency.
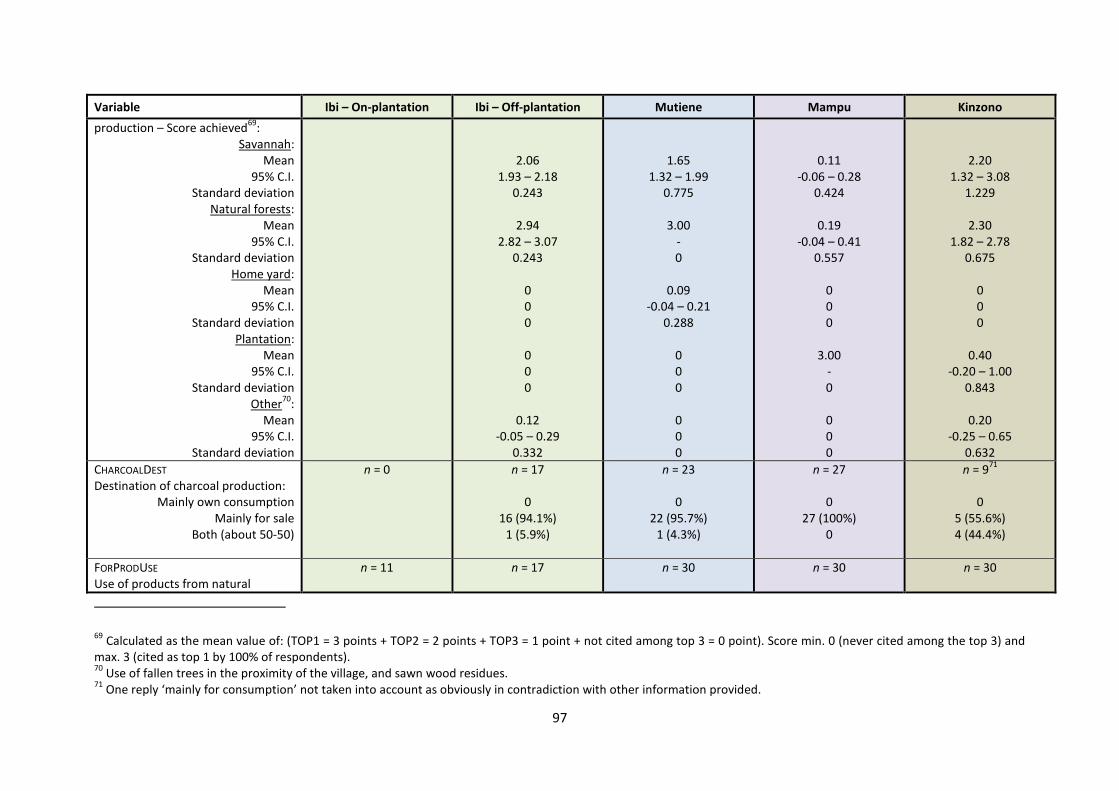
97
Variable Ibi – On-plantation Ibi – Off-plantation Mutiene Mampu Kinzono
production – Score achieved69
:Savannah:
Mean95% C.I.
Standard deviationNatural forests:
Mean95% C.I.
Standard deviationHome yard:
Mean95% C.I.
Standard deviationPlantation:
Mean95% C.I.
Standard deviationOther
70:
Mean95% C.I.
Standard deviation
2.061.93 – 2.18
0.243
2.942.82 – 3.07
0.243
000
000
0.12-0.05 – 0.29
0.332
1.651.32 – 1.99
0.775
3.00-0
0.09-0.04 – 0.21
0.288
000
000
0.11-0.06 – 0.28
0.424
0.19-0.04 – 0.41
0.557
000
3.00-0
000
2.201.32 – 3.08
1.229
2.301.82 – 2.78
0.675
000
0.40-0.20 – 1.00
0.843
0.20-0.25 – 0.65
0.632
CHARCOALDEST
Destination of charcoal production:Mainly own consumption
Mainly for saleBoth (about 50-50)
n = 0 n = 17
016 (94.1%)
1 (5.9%)
n = 23
022 (95.7%)
1 (4.3%)
n = 27
027 (100%)
0
n = 971
05 (55.6%)4 (44.4%)
FORPRODUSE
Use of products from naturaln = 11 n = 17 n = 30 n = 30 n = 30
69Calculated as the mean value of: (TOP1 = 3 points + TOP2 = 2 points + TOP3 = 1 point + not cited among top 3 = 0 point). Score min. 0 (never cited among the top 3) and
max. 3 (cited as top 1 by 100% of respondents).70
Use of fallen trees in the proximity of the village, and sawn wood residues.71
One reply ‘mainly for consumption’ not taken into account as obviously in contradiction with other information provided.
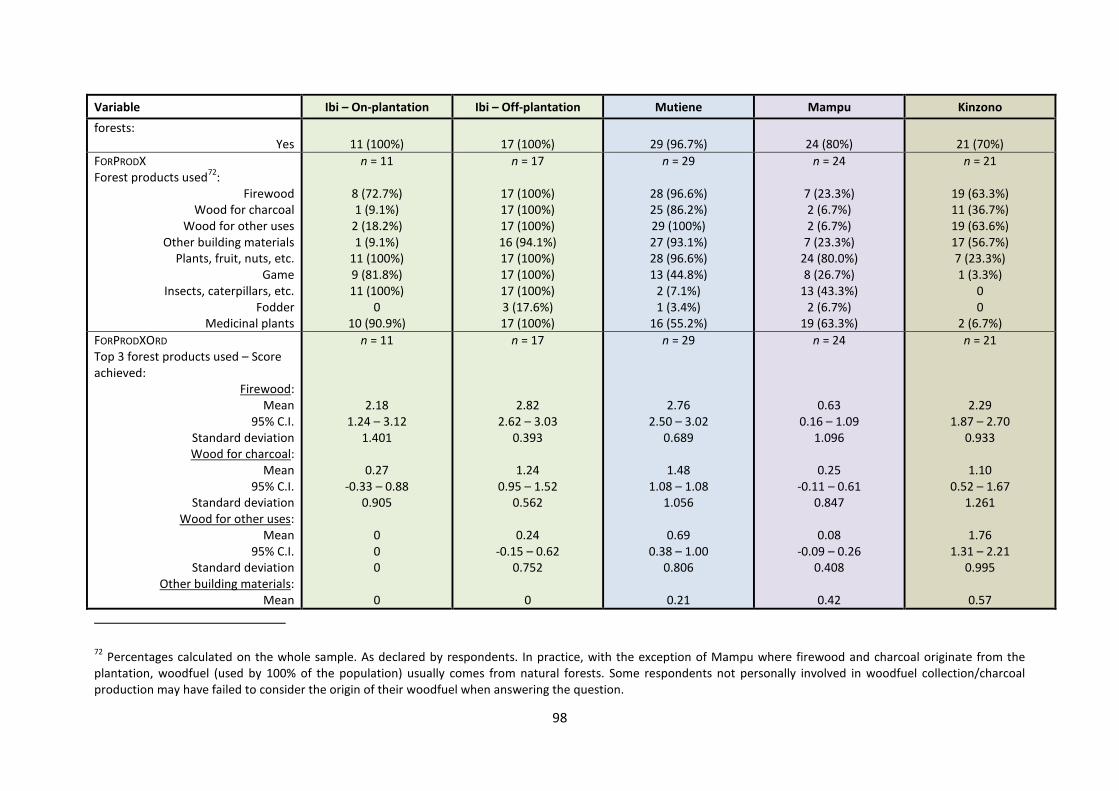
98
Variable Ibi – On-plantation Ibi – Off-plantation Mutiene Mampu Kinzono
forests:Yes 11 (100%) 17 (100%) 29 (96.7%) 24 (80%) 21 (70%)
FORPRODXForest products used
72:
FirewoodWood for charcoal
Wood for other usesOther building materials
Plants, fruit, nuts, etc.Game
Insects, caterpillars, etc.Fodder
Medicinal plants
n = 11
8 (72.7%)1 (9.1%)
2 (18.2%)1 (9.1%)
11 (100%)9 (81.8%)11 (100%)
010 (90.9%)
n = 17
17 (100%)17 (100%)17 (100%)16 (94.1%)17 (100%)17 (100%)17 (100%)3 (17.6%)17 (100%)
n = 29
28 (96.6%)25 (86.2%)29 (100%)27 (93.1%)28 (96.6%)13 (44.8%)
2 (7.1%)1 (3.4%)
16 (55.2%)
n = 24
7 (23.3%)2 (6.7%)2 (6.7%)
7 (23.3%)24 (80.0%)8 (26.7%)
13 (43.3%)2 (6.7%)
19 (63.3%)
n = 21
19 (63.3%)11 (36.7%)19 (63.6%)17 (56.7%)7 (23.3%)1 (3.3%)
00
2 (6.7%)
FORPRODXORD
Top 3 forest products used – Scoreachieved:
Firewood:Mean
95% C.I.Standard deviationWood for charcoal:
Mean95% C.I.
Standard deviationWood for other uses:
Mean95% C.I.
Standard deviationOther building materials:
Mean
n = 11
2.181.24 – 3.12
1.401
0.27-0.33 – 0.88
0.905
000
0
n = 17
2.822.62 – 3.03
0.393
1.240.95 – 1.52
0.562
0.24-0.15 – 0.62
0.752
0
n = 29
2.762.50 – 3.02
0.689
1.481.08 – 1.08
1.056
0.690.38 – 1.00
0.806
0.21
n = 24
0.630.16 – 1.09
1.096
0.25-0.11 – 0.61
0.847
0.08-0.09 – 0.26
0.408
0.42
n = 21
2.291.87 – 2.70
0.933
1.100.52 – 1.67
1.261
1.761.31 – 2.21
0.995
0.57
72Percentages calculated on the whole sample. As declared by respondents. In practice, with the exception of Mampu where firewood and charcoal originate from the
plantation, woodfuel (used by 100% of the population) usually comes from natural forests. Some respondents not personally involved in woodfuel collection/charcoalproduction may have failed to consider the origin of their woodfuel when answering the question.
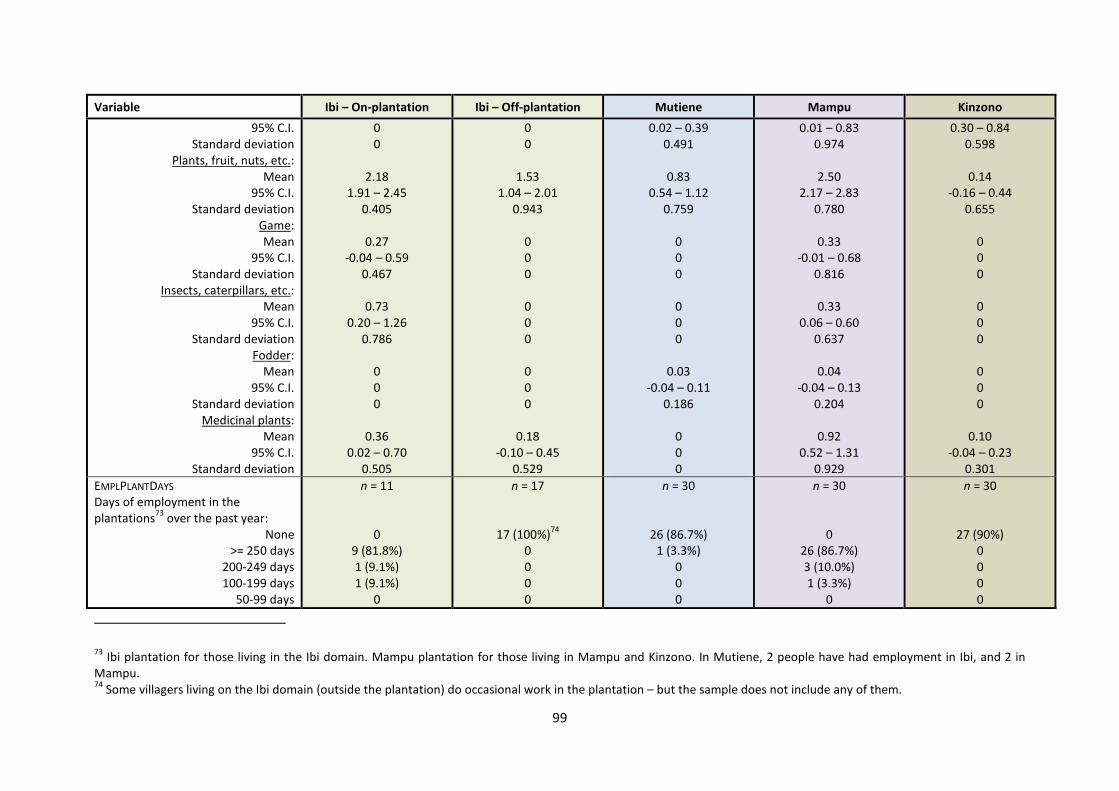
99
Variable Ibi – On-plantation Ibi – Off-plantation Mutiene Mampu Kinzono
95% C.I.Standard deviation
Plants, fruit, nuts, etc.:Mean
95% C.I.Standard deviation
Game:Mean
95% C.I.Standard deviation
Insects, caterpillars, etc.:Mean
95% C.I.Standard deviation
Fodder:Mean
95% C.I.Standard deviation
Medicinal plants:Mean
95% C.I.Standard deviation
00
2.181.91 – 2.45
0.405
0.27-0.04 – 0.59
0.467
0.730.20 – 1.26
0.786
000
0.360.02 – 0.70
0.505
00
1.531.04 – 2.01
0.943
000
000
000
0.18-0.10 – 0.45
0.529
0.02 – 0.390.491
0.830.54 – 1.12
0.759
000
000
0.03-0.04 – 0.11
0.186
000
0.01 – 0.830.974
2.502.17 – 2.83
0.780
0.33-0.01 – 0.68
0.816
0.330.06 – 0.60
0.637
0.04-0.04 – 0.13
0.204
0.920.52 – 1.31
0.929
0.30 – 0.840.598
0.14-0.16 – 0.44
0.655
000
000
000
0.10-0.04 – 0.23
0.301
EMPLPLANTDAYS
Days of employment in theplantations
73over the past year:
None>= 250 days
200-249 days100-199 days
50-99 days
n = 11
09 (81.8%)1 (9.1%)1 (9.1%)
0
n = 17
17 (100%)74
0000
n = 30
26 (86.7%)1 (3.3%)
000
n = 30
026 (86.7%)3 (10.0%)1 (3.3%)
0
n = 30
27 (90%)0000
73Ibi plantation for those living in the Ibi domain. Mampu plantation for those living in Mampu and Kinzono. In Mutiene, 2 people have had employment in Ibi, and 2 in
Mampu.74
Some villagers living on the Ibi domain (outside the plantation) do occasional work in the plantation – but the sample does not include any of them.
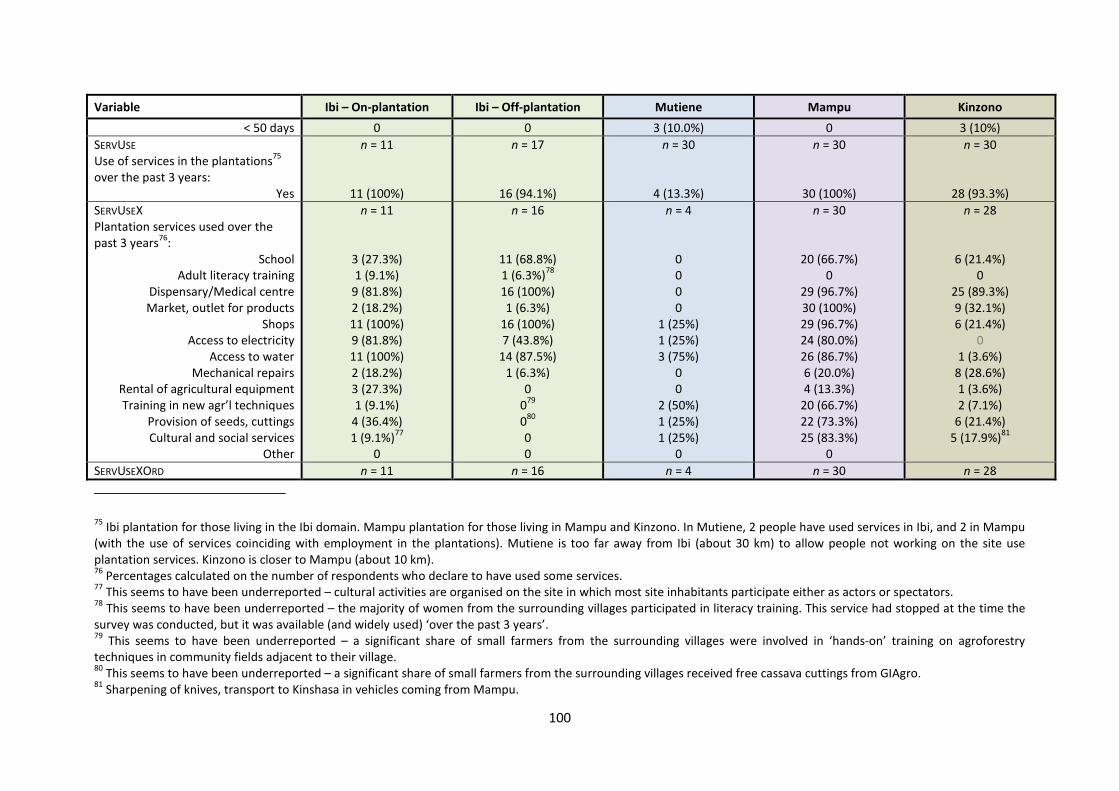
100
Variable Ibi – On-plantation Ibi – Off-plantation Mutiene Mampu Kinzono
< 50 days 0 0 3 (10.0%) 0 3 (10%)
SERVUSE
Use of services in the plantations75
over the past 3 years:Yes
n = 11
11 (100%)
n = 17
16 (94.1%)
n = 30
4 (13.3%)
n = 30
30 (100%)
n = 30
28 (93.3%)
SERVUSEXPlantation services used over thepast 3 years
76:
SchoolAdult literacy training
Dispensary/Medical centreMarket, outlet for products
ShopsAccess to electricity
Access to waterMechanical repairs
Rental of agricultural equipmentTraining in new agr’l techniques
Provision of seeds, cuttingsCultural and social services
Other
n = 11
3 (27.3%)1 (9.1%)
9 (81.8%)2 (18.2%)11 (100%)9 (81.8%)11 (100%)2 (18.2%)3 (27.3%)1 (9.1%)
4 (36.4%)1 (9.1%)
77
0
n = 16
11 (68.8%)1 (6.3%)
78
16 (100%)1 (6.3%)
16 (100%)7 (43.8%)
14 (87.5%)1 (6.3%)
00
79
080
00
n = 4
0000
1 (25%)1 (25%)3 (75%)
00
2 (50%)1 (25%)1 (25%)
0
n = 30
20 (66.7%)0
29 (96.7%)30 (100%)29 (96.7%)24 (80.0%)26 (86.7%)6 (20.0%)4 (13.3%)
20 (66.7%)22 (73.3%)25 (83.3%)
0
n = 28
6 (21.4%)0
25 (89.3%)9 (32.1%)6 (21.4%)
01 (3.6%)
8 (28.6%)1 (3.6%)2 (7.1%)
6 (21.4%)5 (17.9%)
81
SERVUSEXORD n = 11 n = 16 n = 4 n = 30 n = 28
75Ibi plantation for those living in the Ibi domain. Mampu plantation for those living in Mampu and Kinzono. In Mutiene, 2 people have used services in Ibi, and 2 in Mampu
(with the use of services coinciding with employment in the plantations). Mutiene is too far away from Ibi (about 30 km) to allow people not working on the site useplantation services. Kinzono is closer to Mampu (about 10 km).76
Percentages calculated on the number of respondents who declare to have used some services.77
This seems to have been underreported – cultural activities are organised on the site in which most site inhabitants participate either as actors or spectators.78
This seems to have been underreported – the majority of women from the surrounding villages participated in literacy training. This service had stopped at the time thesurvey was conducted, but it was available (and widely used) ‘over the past 3 years’.79
This seems to have been underreported – a significant share of small farmers from the surrounding villages were involved in ‘hands-on’ training on agroforestrytechniques in community fields adjacent to their village.80
This seems to have been underreported – a significant share of small farmers from the surrounding villages received free cassava cuttings from GIAgro.81
Sharpening of knives, transport to Kinshasa in vehicles coming from Mampu.
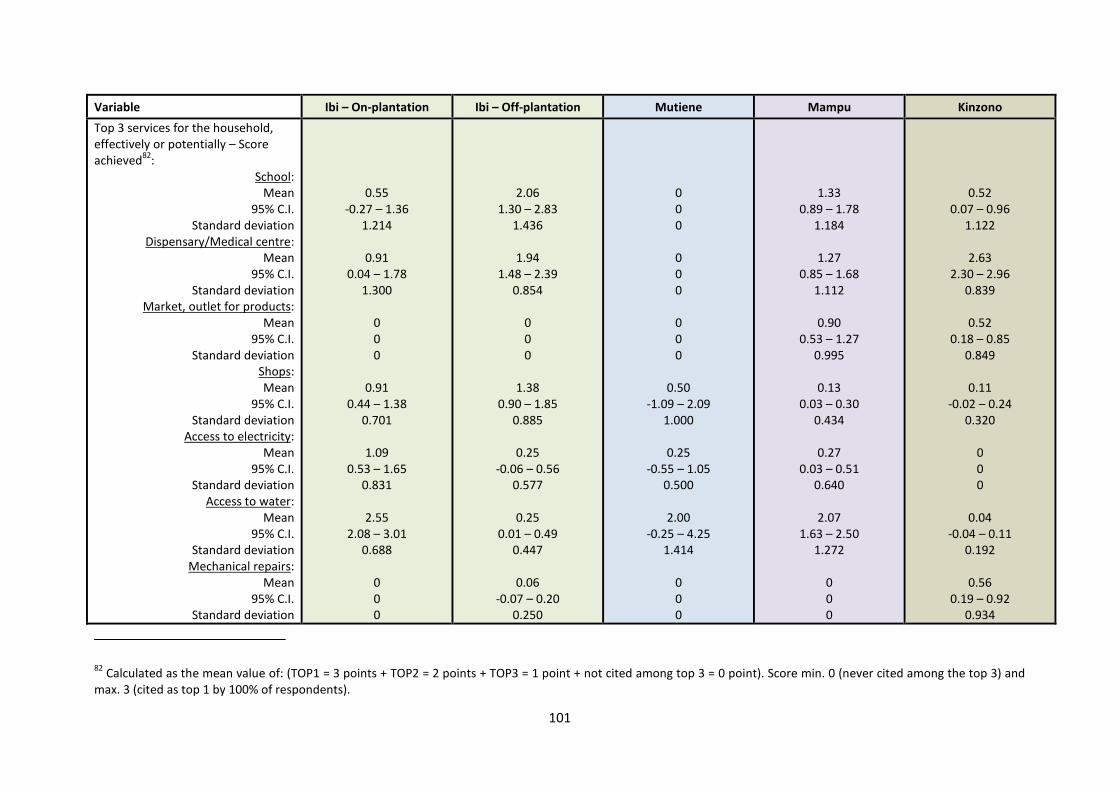
101
Variable Ibi – On-plantation Ibi – Off-plantation Mutiene Mampu Kinzono
Top 3 services for the household,effectively or potentially – Scoreachieved
82:
School:Mean
95% C.I.Standard deviation
Dispensary/Medical centre:Mean
95% C.I.Standard deviation
Market, outlet for products:Mean
95% C.I.Standard deviation
Shops:Mean
95% C.I.Standard deviation
Access to electricity:Mean
95% C.I.Standard deviation
Access to water:Mean
95% C.I.Standard deviation
Mechanical repairs:Mean
95% C.I.Standard deviation
0.55-0.27 – 1.36
1.214
0.910.04 – 1.78
1.300
000
0.910.44 – 1.38
0.701
1.090.53 – 1.65
0.831
2.552.08 – 3.01
0.688
000
2.061.30 – 2.83
1.436
1.941.48 – 2.39
0.854
000
1.380.90 – 1.85
0.885
0.25-0.06 – 0.56
0.577
0.250.01 – 0.49
0.447
0.06-0.07 – 0.20
0.250
000
000
000
0.50-1.09 – 2.09
1.000
0.25-0.55 – 1.05
0.500
2.00-0.25 – 4.25
1.414
000
1.330.89 – 1.78
1.184
1.270.85 – 1.68
1.112
0.900.53 – 1.27
0.995
0.130.03 – 0.30
0.434
0.270.03 – 0.51
0.640
2.071.63 – 2.50
1.272
000
0.520.07 – 0.96
1.122
2.632.30 – 2.96
0.839
0.520.18 – 0.85
0.849
0.11-0.02 – 0.24
0.320
000
0.04-0.04 – 0.11
0.192
0.560.19 – 0.92
0.934
82Calculated as the mean value of: (TOP1 = 3 points + TOP2 = 2 points + TOP3 = 1 point + not cited among top 3 = 0 point). Score min. 0 (never cited among the top 3) and
max. 3 (cited as top 1 by 100% of respondents).
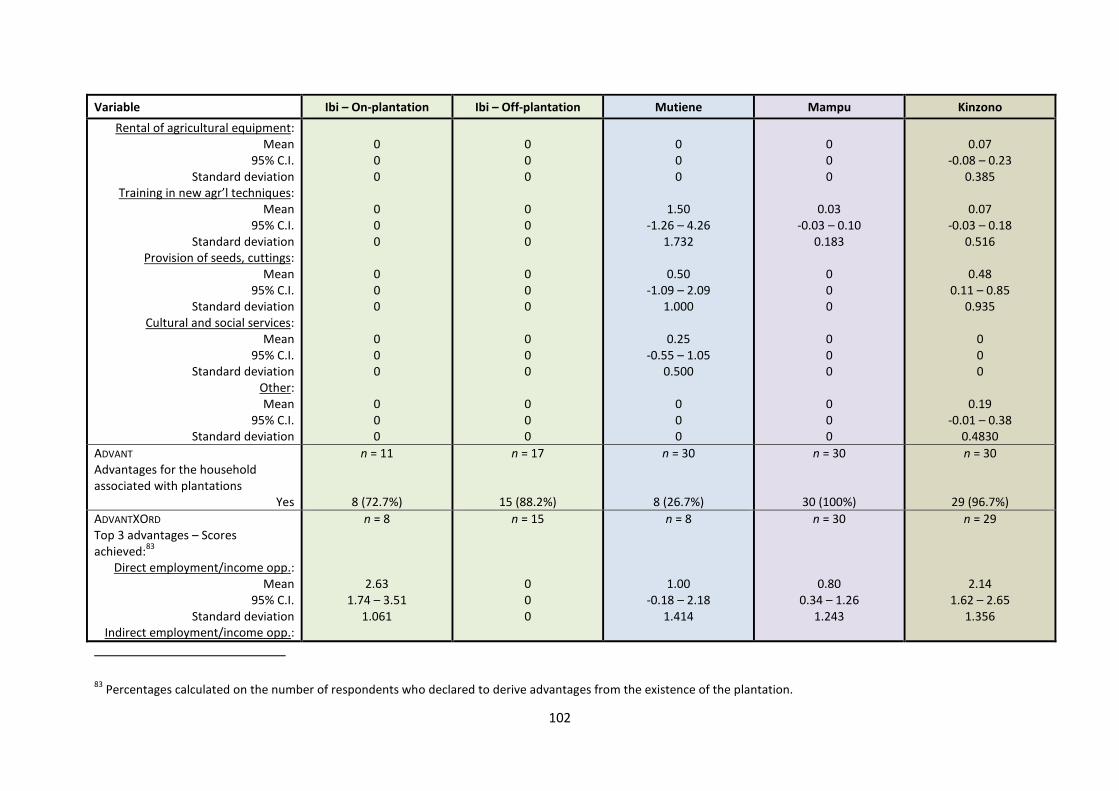
102
Variable Ibi – On-plantation Ibi – Off-plantation Mutiene Mampu Kinzono
Rental of agricultural equipment:Mean
95% C.I.Standard deviation
Training in new agr’l techniques:Mean
95% C.I.Standard deviation
Provision of seeds, cuttings:Mean
95% C.I.Standard deviation
Cultural and social services:Mean
95% C.I.Standard deviation
Other:Mean
95% C.I.Standard deviation
000
000
000
000
000
000
000
000
000
000
000
1.50-1.26 – 4.26
1.732
0.50-1.09 – 2.09
1.000
0.25-0.55 – 1.05
0.500
000
000
0.03-0.03 – 0.10
0.183
000
000
000
0.07-0.08 – 0.23
0.385
0.07-0.03 – 0.18
0.516
0.480.11 – 0.85
0.935
000
0.19-0.01 – 0.38
0.4830
ADVANT
Advantages for the householdassociated with plantations
Yes
n = 11
8 (72.7%)
n = 17
15 (88.2%)
n = 30
8 (26.7%)
n = 30
30 (100%)
n = 30
29 (96.7%)
ADVANTXORD
Top 3 advantages – Scoresachieved:
83
Direct employment/income opp.:Mean
95% C.I.Standard deviation
Indirect employment/income opp.:
n = 8
2.631.74 – 3.51
1.061
n = 15
000
n = 8
1.00-0.18 – 2.18
1.414
n = 30
0.800.34 – 1.26
1.243
n = 29
2.141.62 – 2.65
1.356
83Percentages calculated on the number of respondents who declared to derive advantages from the existence of the plantation.
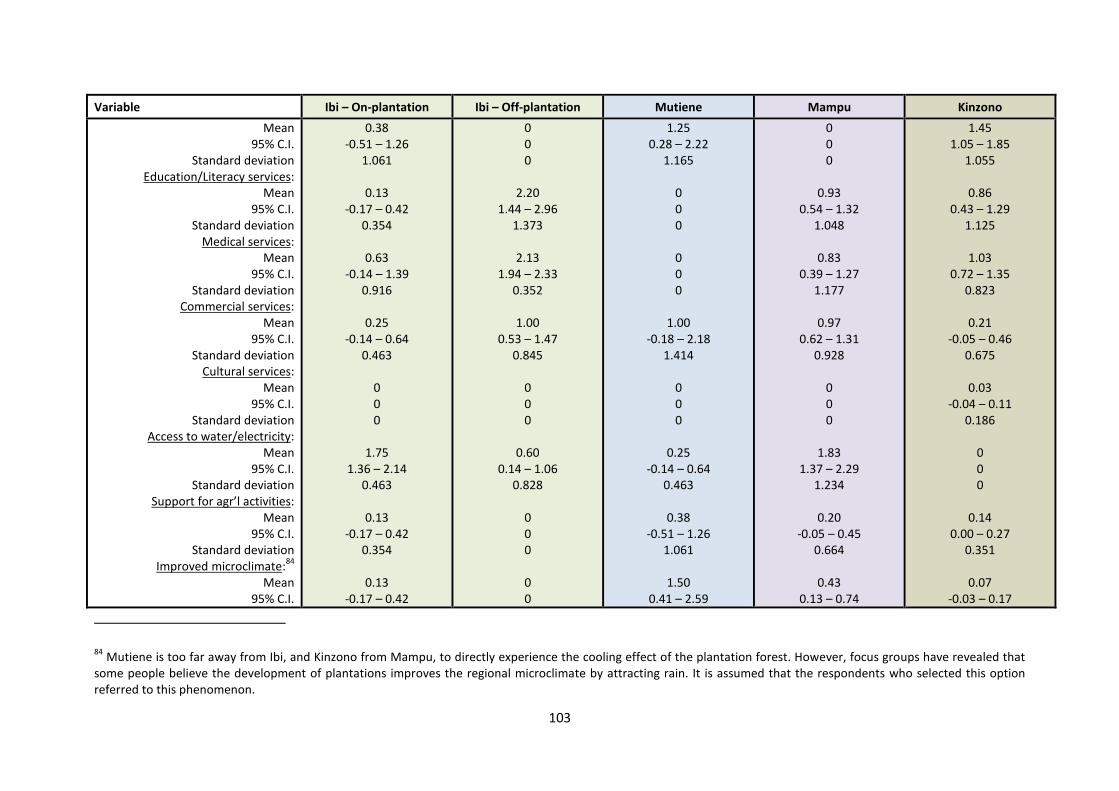
103
Variable Ibi – On-plantation Ibi – Off-plantation Mutiene Mampu Kinzono
Mean95% C.I.
Standard deviationEducation/Literacy services:
Mean95% C.I.
Standard deviationMedical services:
Mean95% C.I.
Standard deviationCommercial services:
Mean95% C.I.
Standard deviationCultural services:
Mean95% C.I.
Standard deviationAccess to water/electricity:
Mean95% C.I.
Standard deviationSupport for agr’l activities:
Mean95% C.I.
Standard deviationImproved microclimate:
84
Mean95% C.I.
0.38-0.51 – 1.26
1.061
0.13-0.17 – 0.42
0.354
0.63-0.14 – 1.39
0.916
0.25-0.14 – 0.64
0.463
000
1.751.36 – 2.14
0.463
0.13-0.17 – 0.42
0.354
0.13-0.17 – 0.42
000
2.201.44 – 2.96
1.373
2.131.94 – 2.33
0.352
1.000.53 – 1.47
0.845
000
0.600.14 – 1.06
0.828
000
00
1.250.28 – 2.22
1.165
000
000
1.00-0.18 – 2.18
1.414
000
0.25-0.14 – 0.64
0.463
0.38-0.51 – 1.26
1.061
1.500.41 – 2.59
000
0.930.54 – 1.32
1.048
0.830.39 – 1.27
1.177
0.970.62 – 1.31
0.928
000
1.831.37 – 2.29
1.234
0.20-0.05 – 0.45
0.664
0.430.13 – 0.74
1.451.05 – 1.85
1.055
0.860.43 – 1.29
1.125
1.030.72 – 1.35
0.823
0.21-0.05 – 0.46
0.675
0.03-0.04 – 0.11
0.186
000
0.140.00 – 0.27
0.351
0.07-0.03 – 0.17
84Mutiene is too far away from Ibi, and Kinzono from Mampu, to directly experience the cooling effect of the plantation forest. However, focus groups have revealed that
some people believe the development of plantations improves the regional microclimate by attracting rain. It is assumed that the respondents who selected this optionreferred to this phenomenon.
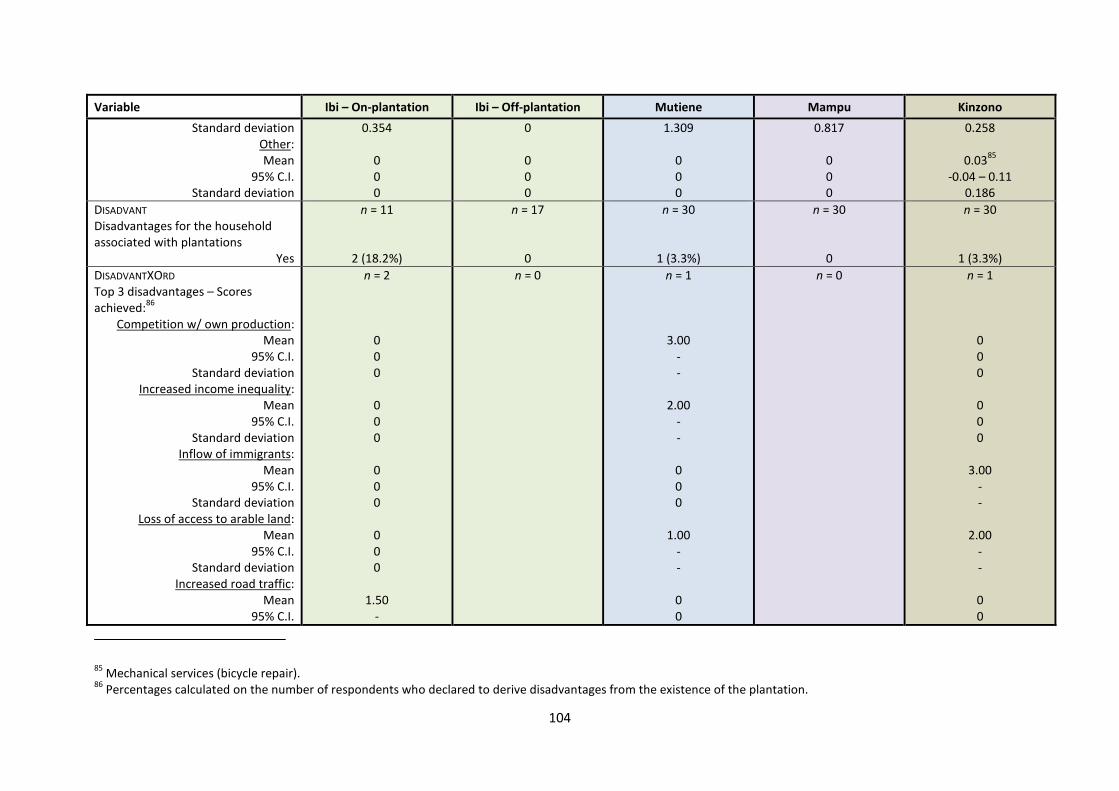
104
Variable Ibi – On-plantation Ibi – Off-plantation Mutiene Mampu Kinzono
Standard deviationOther:Mean
95% C.I.Standard deviation
0.354
000
0
000
1.309
000
0.817
000
0.258
0.0385
-0.04 – 0.110.186
DISADVANT
Disadvantages for the householdassociated with plantations
Yes
n = 11
2 (18.2%)
n = 17
0
n = 30
1 (3.3%)
n = 30
0
n = 30
1 (3.3%)
DISADVANTXORD
Top 3 disadvantages – Scoresachieved:
86
Competition w/ own production:Mean
95% C.I.Standard deviation
Increased income inequality:Mean
95% C.I.Standard deviation
Inflow of immigrants:Mean
95% C.I.Standard deviation
Loss of access to arable land:Mean
95% C.I.Standard deviation
Increased road traffic:Mean
95% C.I.
n = 2
000
000
000
000
1.50-
n = 0 n = 1
3.00--
2.00--
000
1.00--
00
n = 0 n = 1
000
000
3.00--
2.00--
00
85Mechanical services (bicycle repair).
86Percentages calculated on the number of respondents who declared to derive disadvantages from the existence of the plantation.
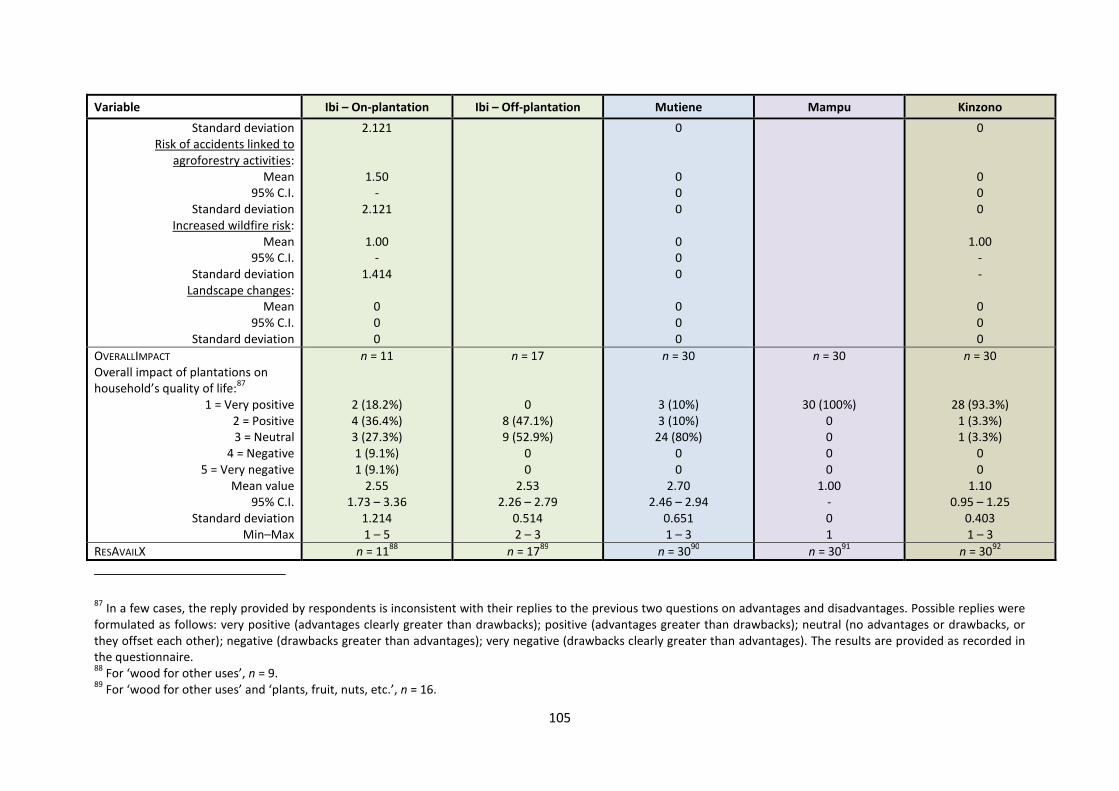
105
Variable Ibi – On-plantation Ibi – Off-plantation Mutiene Mampu Kinzono
Standard deviationRisk of accidents linked to
agroforestry activities:Mean
95% C.I.Standard deviation
Increased wildfire risk:Mean
95% C.I.Standard deviation
Landscape changes:Mean
95% C.I.Standard deviation
2.121
1.50-
2.121
1.00-
1.414
000
0
000
000
000
0
000
1.00--
000
OVERALLIMPACT
Overall impact of plantations onhousehold’s quality of life:
87
1 = Very positive2 = Positive3 = Neutral
4 = Negative5 = Very negative
Mean value95% C.I.
Standard deviationMin–Max
n = 11
2 (18.2%)4 (36.4%)3 (27.3%)1 (9.1%)1 (9.1%)
2.551.73 – 3.36
1.2141 – 5
n = 17
08 (47.1%)9 (52.9%)
00
2.532.26 – 2.79
0.5142 – 3
n = 30
3 (10%)3 (10%)
24 (80%)00
2.702.46 – 2.94
0.6511 – 3
n = 30
30 (100%)0000
1.00-01
n = 30
28 (93.3%)1 (3.3%)1 (3.3%)
00
1.100.95 – 1.25
0.4031 – 3
RESAVAILX n = 1188
n = 1789
n = 3090
n = 3091
n = 3092
87In a few cases, the reply provided by respondents is inconsistent with their replies to the previous two questions on advantages and disadvantages. Possible replies were
formulated as follows: very positive (advantages clearly greater than drawbacks); positive (advantages greater than drawbacks); neutral (no advantages or drawbacks, orthey offset each other); negative (drawbacks greater than advantages); very negative (drawbacks clearly greater than advantages). The results are provided as recorded inthe questionnaire.88
For ‘wood for other uses’, n = 9.89
For ‘wood for other uses’ and ‘plants, fruit, nuts, etc.’, n = 16.
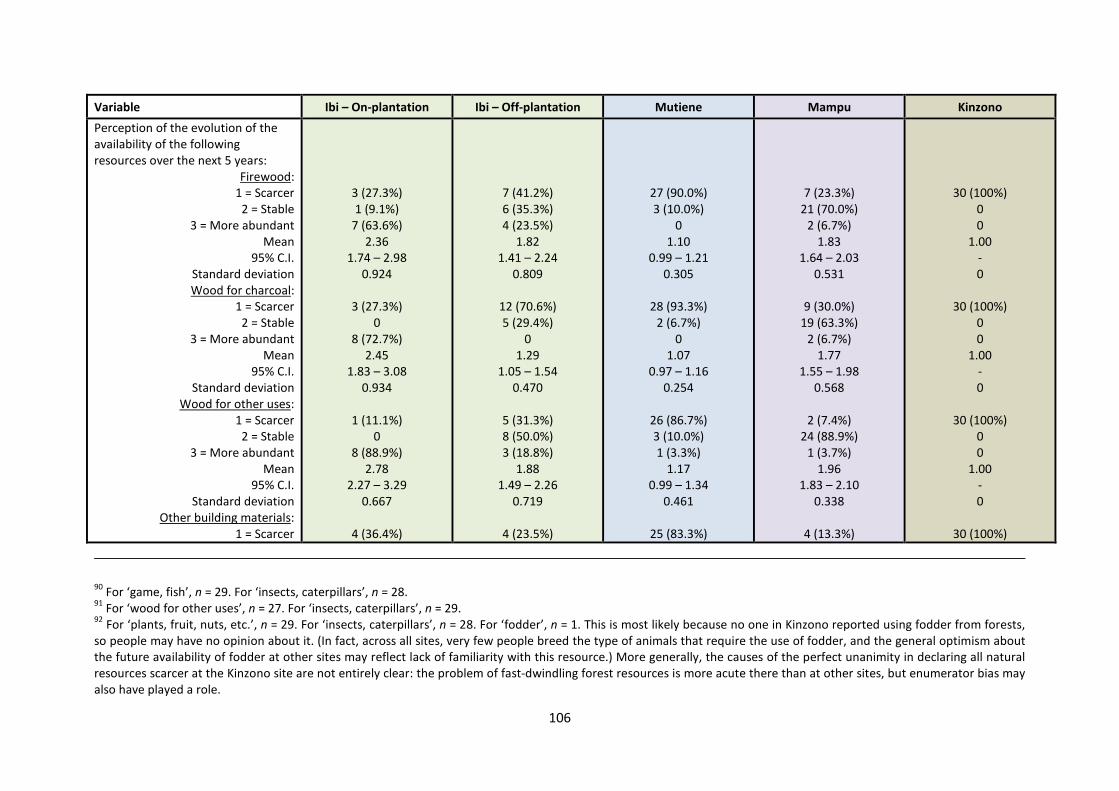
106
Variable Ibi – On-plantation Ibi – Off-plantation Mutiene Mampu Kinzono
Perception of the evolution of theavailability of the followingresources over the next 5 years:
Firewood:1 = Scarcer
2 = Stable3 = More abundant
Mean95% C.I.
Standard deviationWood for charcoal:
1 = Scarcer2 = Stable
3 = More abundantMean
95% C.I.Standard deviation
Wood for other uses:1 = Scarcer
2 = Stable3 = More abundant
Mean95% C.I.
Standard deviationOther building materials:
1 = Scarcer
3 (27.3%)1 (9.1%)
7 (63.6%)2.36
1.74 – 2.980.924
3 (27.3%)0
8 (72.7%)2.45
1.83 – 3.080.934
1 (11.1%)0
8 (88.9%)2.78
2.27 – 3.290.667
4 (36.4%)
7 (41.2%)6 (35.3%)4 (23.5%)
1.821.41 – 2.24
0.809
12 (70.6%)5 (29.4%)
01.29
1.05 – 1.540.470
5 (31.3%)8 (50.0%)3 (18.8%)
1.881.49 – 2.26
0.719
4 (23.5%)
27 (90.0%)3 (10.0%)
01.10
0.99 – 1.210.305
28 (93.3%)2 (6.7%)
01.07
0.97 – 1.160.254
26 (86.7%)3 (10.0%)1 (3.3%)
1.170.99 – 1.34
0.461
25 (83.3%)
7 (23.3%)21 (70.0%)
2 (6.7%)1.83
1.64 – 2.030.531
9 (30.0%)19 (63.3%)
2 (6.7%)1.77
1.55 – 1.980.568
2 (7.4%)24 (88.9%)
1 (3.7%)1.96
1.83 – 2.100.338
4 (13.3%)
30 (100%)00
1.00-0
30 (100%)00
1.00-0
30 (100%)00
1.00-0
30 (100%)
90For ‘game, fish’, n = 29. For ‘insects, caterpillars’, n = 28.
91For ‘wood for other uses’, n = 27. For ‘insects, caterpillars’, n = 29.
92For ‘plants, fruit, nuts, etc.’, n = 29. For ‘insects, caterpillars’, n = 28. For ‘fodder’, n = 1. This is most likely because no one in Kinzono reported using fodder from forests,
so people may have no opinion about it. (In fact, across all sites, very few people breed the type of animals that require the use of fodder, and the general optimism aboutthe future availability of fodder at other sites may reflect lack of familiarity with this resource.) More generally, the causes of the perfect unanimity in declaring all naturalresources scarcer at the Kinzono site are not entirely clear: the problem of fast-dwindling forest resources is more acute there than at other sites, but enumerator bias mayalso have played a role.
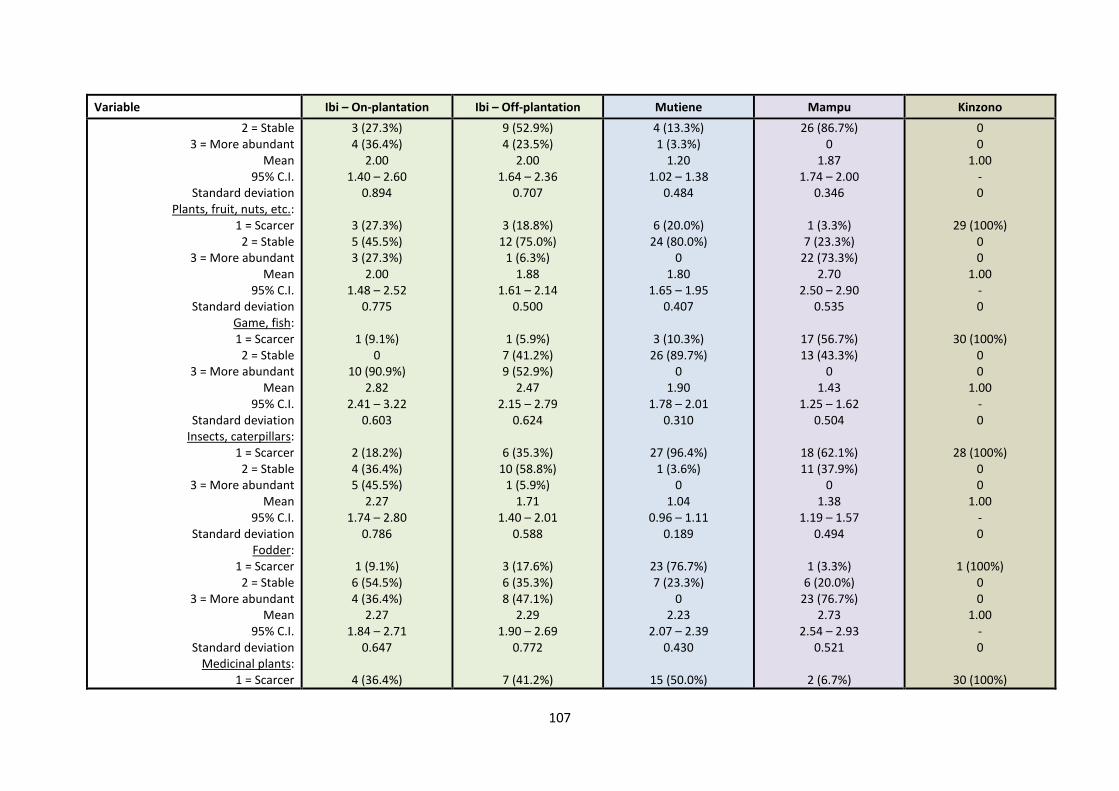
107
Variable Ibi – On-plantation Ibi – Off-plantation Mutiene Mampu Kinzono
2 = Stable3 = More abundant
Mean95% C.I.
Standard deviationPlants, fruit, nuts, etc.:
1 = Scarcer2 = Stable
3 = More abundantMean
95% C.I.Standard deviation
Game, fish:1 = Scarcer
2 = Stable3 = More abundant
Mean95% C.I.
Standard deviationInsects, caterpillars:
1 = Scarcer2 = Stable
3 = More abundantMean
95% C.I.Standard deviation
Fodder:1 = Scarcer
2 = Stable3 = More abundant
Mean95% C.I.
Standard deviationMedicinal plants:
1 = Scarcer
3 (27.3%)4 (36.4%)
2.001.40 – 2.60
0.894
3 (27.3%)5 (45.5%)3 (27.3%)
2.001.48 – 2.52
0.775
1 (9.1%)0
10 (90.9%)2.82
2.41 – 3.220.603
2 (18.2%)4 (36.4%)5 (45.5%)
2.271.74 – 2.80
0.786
1 (9.1%)6 (54.5%)4 (36.4%)
2.271.84 – 2.71
0.647
4 (36.4%)
9 (52.9%)4 (23.5%)
2.001.64 – 2.36
0.707
3 (18.8%)12 (75.0%)
1 (6.3%)1.88
1.61 – 2.140.500
1 (5.9%)7 (41.2%)9 (52.9%)
2.472.15 – 2.79
0.624
6 (35.3%)10 (58.8%)
1 (5.9%)1.71
1.40 – 2.010.588
3 (17.6%)6 (35.3%)8 (47.1%)
2.291.90 – 2.69
0.772
7 (41.2%)
4 (13.3%)1 (3.3%)
1.201.02 – 1.38
0.484
6 (20.0%)24 (80.0%)
01.80
1.65 – 1.950.407
3 (10.3%)26 (89.7%)
01.90
1.78 – 2.010.310
27 (96.4%)1 (3.6%)
01.04
0.96 – 1.110.189
23 (76.7%)7 (23.3%)
02.23
2.07 – 2.390.430
15 (50.0%)
26 (86.7%)0
1.871.74 – 2.00
0.346
1 (3.3%)7 (23.3%)
22 (73.3%)2.70
2.50 – 2.900.535
17 (56.7%)13 (43.3%)
01.43
1.25 – 1.620.504
18 (62.1%)11 (37.9%)
01.38
1.19 – 1.570.494
1 (3.3%)6 (20.0%)
23 (76.7%)2.73
2.54 – 2.930.521
2 (6.7%)
00
1.00-0
29 (100%)00
1.00-0
30 (100%)00
1.00-0
28 (100%)00
1.00-0
1 (100%)00
1.00-0
30 (100%)
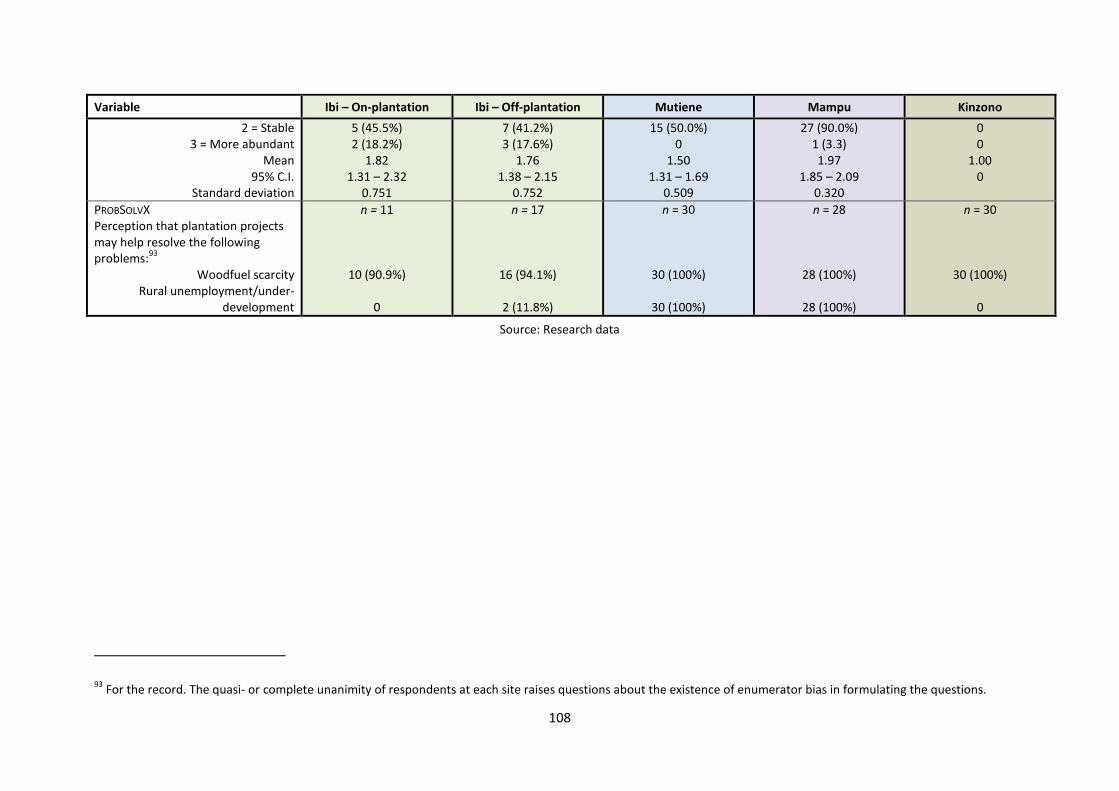
108
Variable Ibi – On-plantation Ibi – Off-plantation Mutiene Mampu Kinzono
2 = Stable3 = More abundant
Mean95% C.I.
Standard deviation
5 (45.5%)2 (18.2%)
1.821.31 – 2.32
0.751
7 (41.2%)3 (17.6%)
1.761.38 – 2.15
0.752
15 (50.0%)0
1.501.31 – 1.69
0.509
27 (90.0%)1 (3.3)1.97
1.85 – 2.090.320
00
1.000
PROBSOLVXPerception that plantation projectsmay help resolve the followingproblems:
93
Woodfuel scarcityRural unemployment/under-
development
n = 11
10 (90.9%)
0
n = 17
16 (94.1%)
2 (11.8%)
n = 30
30 (100%)
30 (100%)
n = 28
28 (100%)
28 (100%)
n = 30
30 (100%)
0
Source: Research data
93For the record. The quasi- or complete unanimity of respondents at each site raises questions about the existence of enumerator bias in formulating the questions.
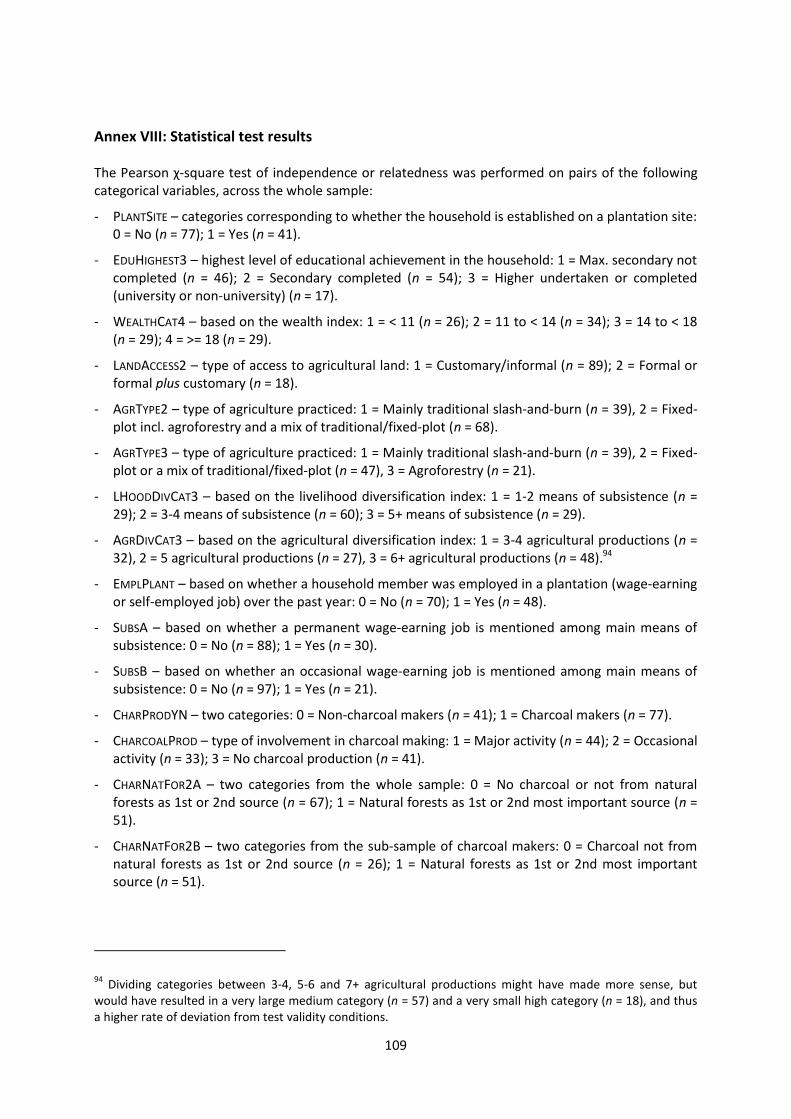
109
Annex VIII: Statistical test results
The Pearson χ-square test of independence or relatedness was performed on pairs of the following categorical variables, across the whole sample:
- PLANTSITE – categories corresponding to whether the household is established on a plantation site:0 = No (n = 77); 1 = Yes (n = 41).
- EDUHIGHEST3 – highest level of educational achievement in the household: 1 = Max. secondary notcompleted (n = 46); 2 = Secondary completed (n = 54); 3 = Higher undertaken or completed(university or non-university) (n = 17).
- WEALTHCAT4 – based on the wealth index: 1 = < 11 (n = 26); 2 = 11 to < 14 (n = 34); 3 = 14 to < 18(n = 29); 4 = >= 18 (n = 29).
- LANDACCESS2 – type of access to agricultural land: 1 = Customary/informal (n = 89); 2 = Formal orformal plus customary (n = 18).
- AGRTYPE2 – type of agriculture practiced: 1 = Mainly traditional slash-and-burn (n = 39), 2 = Fixed-plot incl. agroforestry and a mix of traditional/fixed-plot (n = 68).
- AGRTYPE3 – type of agriculture practiced: 1 = Mainly traditional slash-and-burn (n = 39), 2 = Fixed-plot or a mix of traditional/fixed-plot (n = 47), 3 = Agroforestry (n = 21).
- LHOODDIVCAT3 – based on the livelihood diversification index: 1 = 1-2 means of subsistence (n =29); 2 = 3-4 means of subsistence (n = 60); 3 = 5+ means of subsistence (n = 29).
- AGRDIVCAT3 – based on the agricultural diversification index: 1 = 3-4 agricultural productions (n =32), 2 = 5 agricultural productions (n = 27), 3 = 6+ agricultural productions (n = 48).94
- EMPLPLANT – based on whether a household member was employed in a plantation (wage-earningor self-employed job) over the past year: 0 = No (n = 70); 1 = Yes (n = 48).
- SUBSA – based on whether a permanent wage-earning job is mentioned among main means ofsubsistence: 0 = No (n = 88); 1 = Yes (n = 30).
- SUBSB – based on whether an occasional wage-earning job is mentioned among main means ofsubsistence: 0 = No (n = 97); 1 = Yes (n = 21).
- CHARPRODYN – two categories: 0 = Non-charcoal makers (n = 41); 1 = Charcoal makers (n = 77).
- CHARCOALPROD – type of involvement in charcoal making: 1 = Major activity (n = 44); 2 = Occasionalactivity (n = 33); 3 = No charcoal production (n = 41).
- CHARNATFOR2A – two categories from the whole sample: 0 = No charcoal or not from naturalforests as 1st or 2nd source (n = 67); 1 = Natural forests as 1st or 2nd most important source (n =51).
- CHARNATFOR2B – two categories from the sub-sample of charcoal makers: 0 = Charcoal not fromnatural forests as 1st or 2nd source (n = 26); 1 = Natural forests as 1st or 2nd most importantsource (n = 51).
94Dividing categories between 3-4, 5-6 and 7+ agricultural productions might have made more sense, but
would have resulted in a very large medium category (n = 57) and a very small high category (n = 18), and thusa higher rate of deviation from test validity conditions.
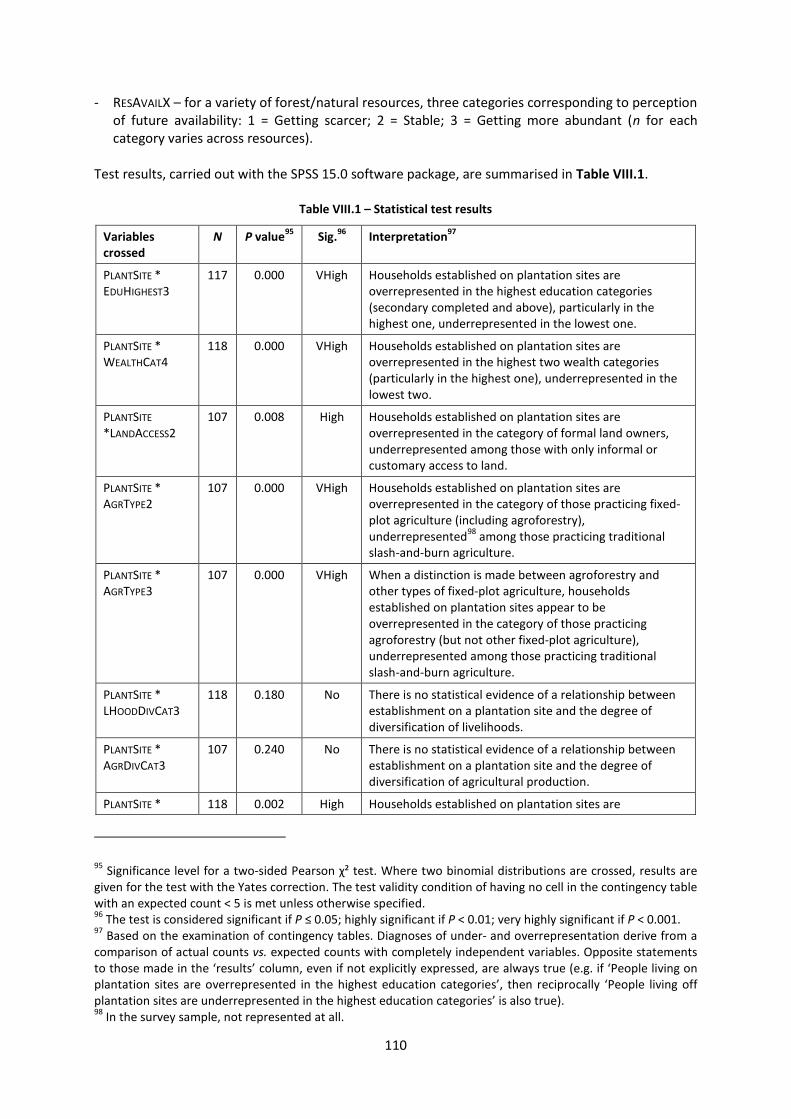
110
- RESAVAILX – for a variety of forest/natural resources, three categories corresponding to perceptionof future availability: 1 = Getting scarcer; 2 = Stable; 3 = Getting more abundant (n for eachcategory varies across resources).
Test results, carried out with the SPSS 15.0 software package, are summarised in Table VIII.1.
Table VIII.1 – Statistical test results
Variablescrossed
N P value95
Sig.96
Interpretation97
PLANTSITE *EDUHIGHEST3
117 0.000 VHigh Households established on plantation sites areoverrepresented in the highest education categories(secondary completed and above), particularly in thehighest one, underrepresented in the lowest one.
PLANTSITE *WEALTHCAT4
118 0.000 VHigh Households established on plantation sites areoverrepresented in the highest two wealth categories(particularly in the highest one), underrepresented in thelowest two.
PLANTSITE
*LANDACCESS2107 0.008 High Households established on plantation sites are
overrepresented in the category of formal land owners,underrepresented among those with only informal orcustomary access to land.
PLANTSITE *AGRTYPE2
107 0.000 VHigh Households established on plantation sites areoverrepresented in the category of those practicing fixed-plot agriculture (including agroforestry),underrepresented
98among those practicing traditional
slash-and-burn agriculture.
PLANTSITE *AGRTYPE3
107 0.000 VHigh When a distinction is made between agroforestry andother types of fixed-plot agriculture, householdsestablished on plantation sites appear to beoverrepresented in the category of those practicingagroforestry (but not other fixed-plot agriculture),underrepresented among those practicing traditionalslash-and-burn agriculture.
PLANTSITE *LHOODDIVCAT3
118 0.180 No There is no statistical evidence of a relationship betweenestablishment on a plantation site and the degree ofdiversification of livelihoods.
PLANTSITE *AGRDIVCAT3
107 0.240 No There is no statistical evidence of a relationship betweenestablishment on a plantation site and the degree ofdiversification of agricultural production.
PLANTSITE * 118 0.002 High Households established on plantation sites are
95 Significance level for a two-sided Pearson χ² test. Where two binomial distributions are crossed, results are
given for the test with the Yates correction. The test validity condition of having no cell in the contingency tablewith an expected count < 5 is met unless otherwise specified.96
The test is considered significant if P ≤ 0.05; highly significant if P < 0.01; very highly significant if P < 0.001.97
Based on the examination of contingency tables. Diagnoses of under- and overrepresentation derive from acomparison of actual counts vs. expected counts with completely independent variables. Opposite statementsto those made in the ‘results’ column, even if not explicitly expressed, are always true (e.g. if ‘People living onplantation sites are overrepresented in the highest education categories’, then reciprocally ‘People living offplantation sites are underrepresented in the highest education categories’ is also true).98
In the survey sample, not represented at all.
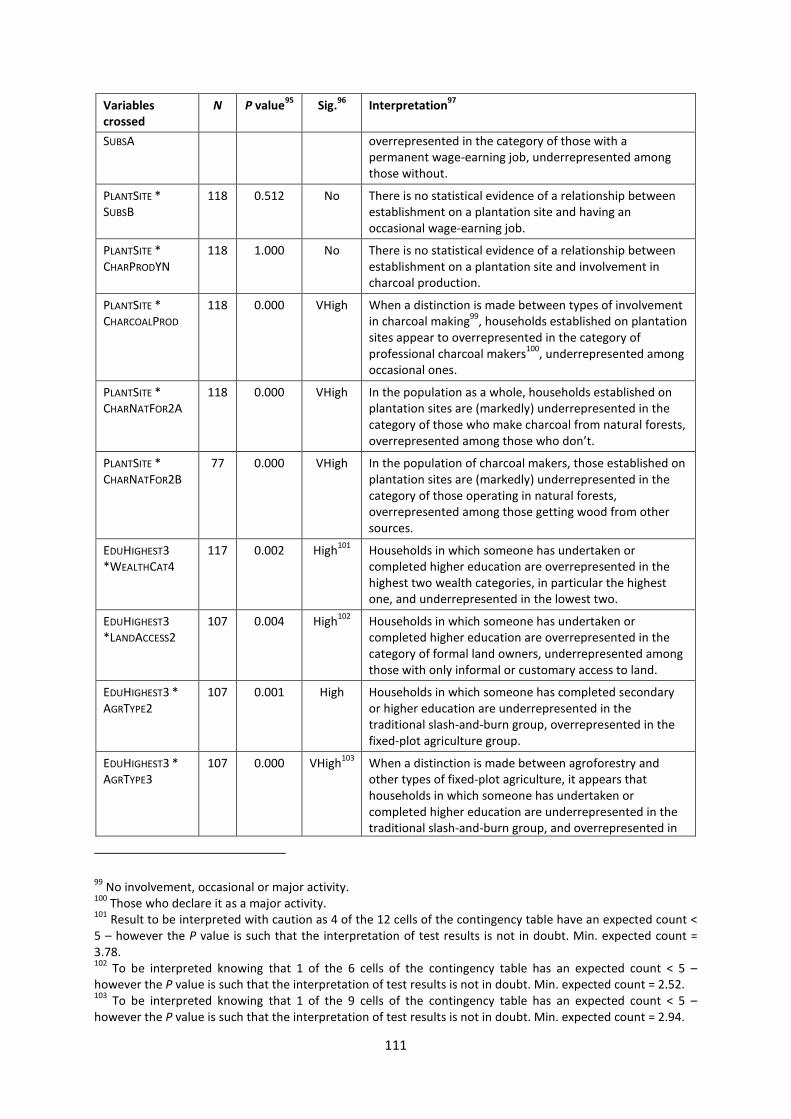
111
Variablescrossed
N P value95
Sig.96
Interpretation97
SUBSA overrepresented in the category of those with apermanent wage-earning job, underrepresented amongthose without.
PLANTSITE *SUBSB
118 0.512 No There is no statistical evidence of a relationship betweenestablishment on a plantation site and having anoccasional wage-earning job.
PLANTSITE *CHARPRODYN
118 1.000 No There is no statistical evidence of a relationship betweenestablishment on a plantation site and involvement incharcoal production.
PLANTSITE *CHARCOALPROD
118 0.000 VHigh When a distinction is made between types of involvementin charcoal making
99, households established on plantation
sites appear to overrepresented in the category ofprofessional charcoal makers
100, underrepresented among
occasional ones.
PLANTSITE *CHARNATFOR2A
118 0.000 VHigh In the population as a whole, households established onplantation sites are (markedly) underrepresented in thecategory of those who make charcoal from natural forests,overrepresented among those who don’t.
PLANTSITE *CHARNATFOR2B
77 0.000 VHigh In the population of charcoal makers, those established onplantation sites are (markedly) underrepresented in thecategory of those operating in natural forests,overrepresented among those getting wood from othersources.
EDUHIGHEST3*WEALTHCAT4
117 0.002 High101
Households in which someone has undertaken orcompleted higher education are overrepresented in thehighest two wealth categories, in particular the highestone, and underrepresented in the lowest two.
EDUHIGHEST3*LANDACCESS2
107 0.004 High102
Households in which someone has undertaken orcompleted higher education are overrepresented in thecategory of formal land owners, underrepresented amongthose with only informal or customary access to land.
EDUHIGHEST3 *AGRTYPE2
107 0.001 High Households in which someone has completed secondaryor higher education are underrepresented in thetraditional slash-and-burn group, overrepresented in thefixed-plot agriculture group.
EDUHIGHEST3 *AGRTYPE3
107 0.000 VHigh103
When a distinction is made between agroforestry andother types of fixed-plot agriculture, it appears thathouseholds in which someone has undertaken orcompleted higher education are underrepresented in thetraditional slash-and-burn group, and overrepresented in
99No involvement, occasional or major activity.
100Those who declare it as a major activity.
101Result to be interpreted with caution as 4 of the 12 cells of the contingency table have an expected count <
5 – however the P value is such that the interpretation of test results is not in doubt. Min. expected count =3.78.102
To be interpreted knowing that 1 of the 6 cells of the contingency table has an expected count < 5 –however the P value is such that the interpretation of test results is not in doubt. Min. expected count = 2.52.103
To be interpreted knowing that 1 of the 9 cells of the contingency table has an expected count < 5 –however the P value is such that the interpretation of test results is not in doubt. Min. expected count = 2.94.
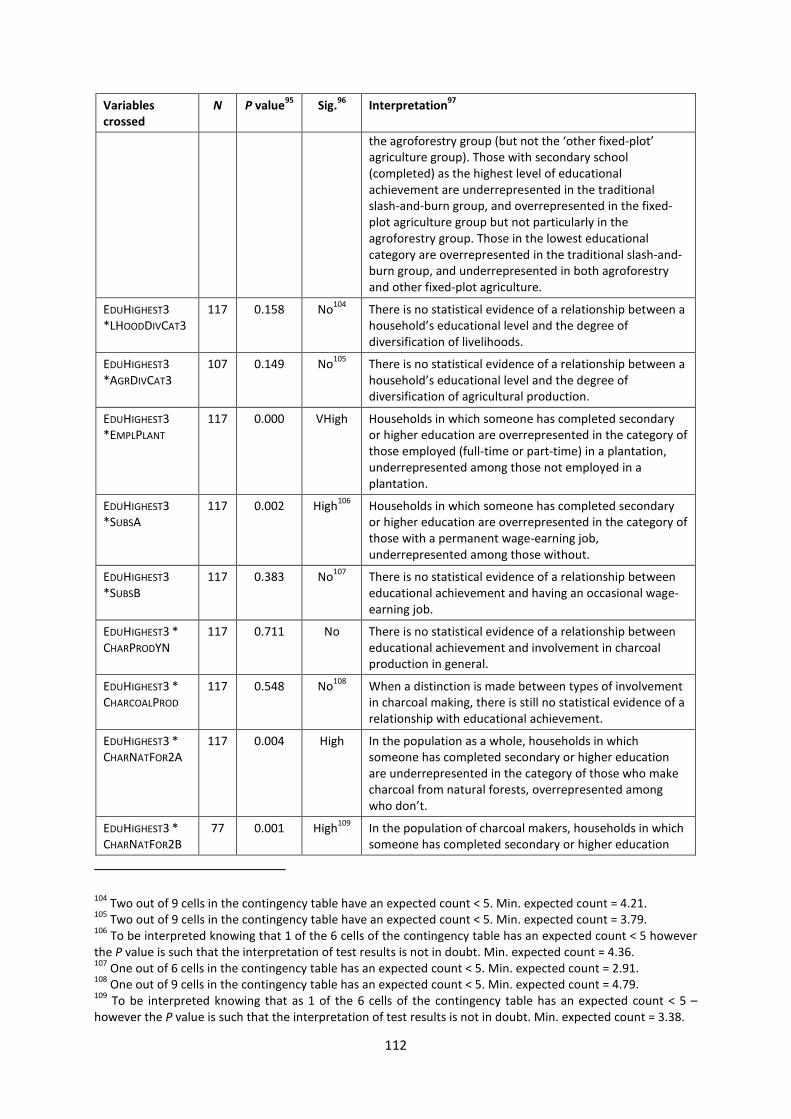
112
Variablescrossed
N P value95
Sig.96
Interpretation97
the agroforestry group (but not the ‘other fixed-plot’agriculture group). Those with secondary school(completed) as the highest level of educationalachievement are underrepresented in the traditionalslash-and-burn group, and overrepresented in the fixed-plot agriculture group but not particularly in theagroforestry group. Those in the lowest educationalcategory are overrepresented in the traditional slash-and-burn group, and underrepresented in both agroforestryand other fixed-plot agriculture.
EDUHIGHEST3*LHOODDIVCAT3
117 0.158 No104
There is no statistical evidence of a relationship between ahousehold’s educational level and the degree ofdiversification of livelihoods.
EDUHIGHEST3*AGRDIVCAT3
107 0.149 No105
There is no statistical evidence of a relationship between ahousehold’s educational level and the degree ofdiversification of agricultural production.
EDUHIGHEST3*EMPLPLANT
117 0.000 VHigh Households in which someone has completed secondaryor higher education are overrepresented in the category ofthose employed (full-time or part-time) in a plantation,underrepresented among those not employed in aplantation.
EDUHIGHEST3*SUBSA
117 0.002 High106
Households in which someone has completed secondaryor higher education are overrepresented in the category ofthose with a permanent wage-earning job,underrepresented among those without.
EDUHIGHEST3*SUBSB
117 0.383 No107
There is no statistical evidence of a relationship betweeneducational achievement and having an occasional wage-earning job.
EDUHIGHEST3 *CHARPRODYN
117 0.711 No There is no statistical evidence of a relationship betweeneducational achievement and involvement in charcoalproduction in general.
EDUHIGHEST3 *CHARCOALPROD
117 0.548 No108
When a distinction is made between types of involvementin charcoal making, there is still no statistical evidence of arelationship with educational achievement.
EDUHIGHEST3 *CHARNATFOR2A
117 0.004 High In the population as a whole, households in whichsomeone has completed secondary or higher educationare underrepresented in the category of those who makecharcoal from natural forests, overrepresented amongwho don’t.
EDUHIGHEST3 *CHARNATFOR2B
77 0.001 High109
In the population of charcoal makers, households in whichsomeone has completed secondary or higher education
104Two out of 9 cells in the contingency table have an expected count < 5. Min. expected count = 4.21.
105Two out of 9 cells in the contingency table have an expected count < 5. Min. expected count = 3.79.
106To be interpreted knowing that 1 of the 6 cells of the contingency table has an expected count < 5 however
the P value is such that the interpretation of test results is not in doubt. Min. expected count = 4.36.107
One out of 6 cells in the contingency table has an expected count < 5. Min. expected count = 2.91.108
One out of 9 cells in the contingency table has an expected count < 5. Min. expected count = 4.79.109
To be interpreted knowing that as 1 of the 6 cells of the contingency table has an expected count < 5 –however the P value is such that the interpretation of test results is not in doubt. Min. expected count = 3.38.
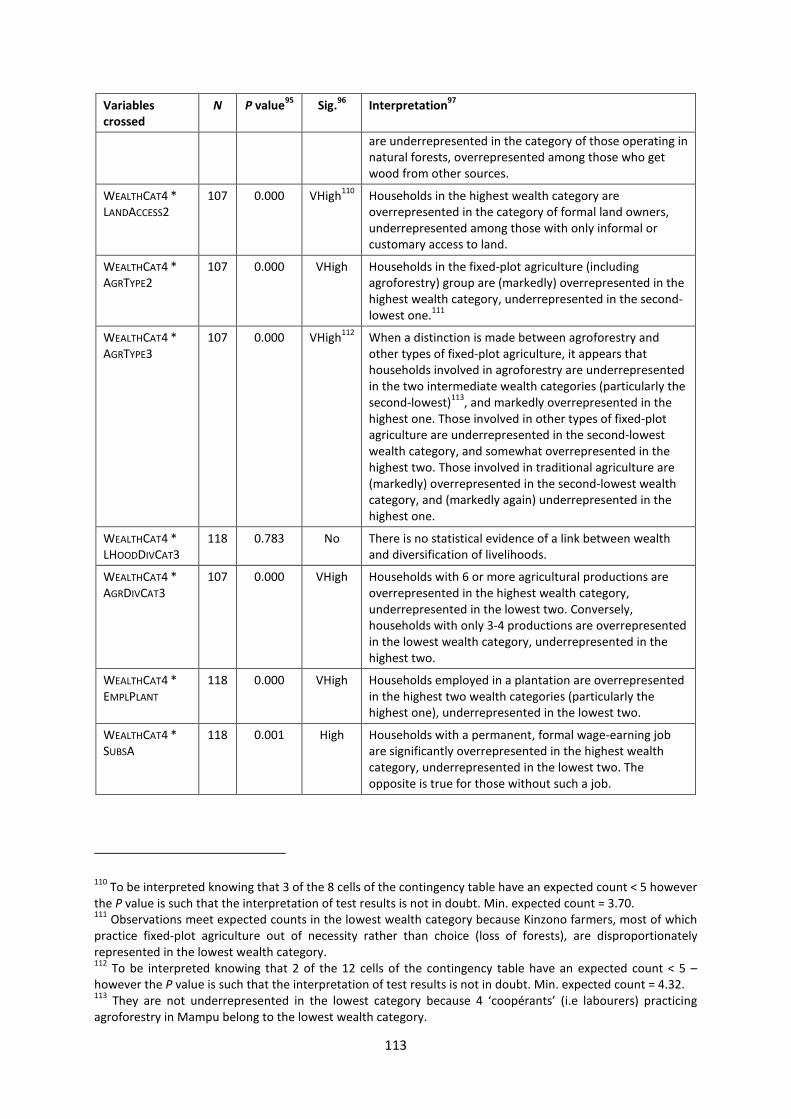
113
Variablescrossed
N P value95
Sig.96
Interpretation97
are underrepresented in the category of those operating innatural forests, overrepresented among those who getwood from other sources.
WEALTHCAT4 *LANDACCESS2
107 0.000 VHigh110
Households in the highest wealth category areoverrepresented in the category of formal land owners,underrepresented among those with only informal orcustomary access to land.
WEALTHCAT4 *AGRTYPE2
107 0.000 VHigh Households in the fixed-plot agriculture (includingagroforestry) group are (markedly) overrepresented in thehighest wealth category, underrepresented in the second-lowest one.
111
WEALTHCAT4 *AGRTYPE3
107 0.000 VHigh112
When a distinction is made between agroforestry andother types of fixed-plot agriculture, it appears thathouseholds involved in agroforestry are underrepresentedin the two intermediate wealth categories (particularly thesecond-lowest)
113, and markedly overrepresented in the
highest one. Those involved in other types of fixed-plotagriculture are underrepresented in the second-lowestwealth category, and somewhat overrepresented in thehighest two. Those involved in traditional agriculture are(markedly) overrepresented in the second-lowest wealthcategory, and (markedly again) underrepresented in thehighest one.
WEALTHCAT4 *LHOODDIVCAT3
118 0.783 No There is no statistical evidence of a link between wealthand diversification of livelihoods.
WEALTHCAT4 *AGRDIVCAT3
107 0.000 VHigh Households with 6 or more agricultural productions areoverrepresented in the highest wealth category,underrepresented in the lowest two. Conversely,households with only 3-4 productions are overrepresentedin the lowest wealth category, underrepresented in thehighest two.
WEALTHCAT4 *EMPLPLANT
118 0.000 VHigh Households employed in a plantation are overrepresentedin the highest two wealth categories (particularly thehighest one), underrepresented in the lowest two.
WEALTHCAT4 *SUBSA
118 0.001 High Households with a permanent, formal wage-earning jobare significantly overrepresented in the highest wealthcategory, underrepresented in the lowest two. Theopposite is true for those without such a job.
110To be interpreted knowing that 3 of the 8 cells of the contingency table have an expected count < 5 however
the P value is such that the interpretation of test results is not in doubt. Min. expected count = 3.70.111
Observations meet expected counts in the lowest wealth category because Kinzono farmers, most of whichpractice fixed-plot agriculture out of necessity rather than choice (loss of forests), are disproportionatelyrepresented in the lowest wealth category.112
To be interpreted knowing that 2 of the 12 cells of the contingency table have an expected count < 5 –however the P value is such that the interpretation of test results is not in doubt. Min. expected count = 4.32.113
They are not underrepresented in the lowest category because 4 ‘coopérants’ (i.e labourers) practicingagroforestry in Mampu belong to the lowest wealth category.
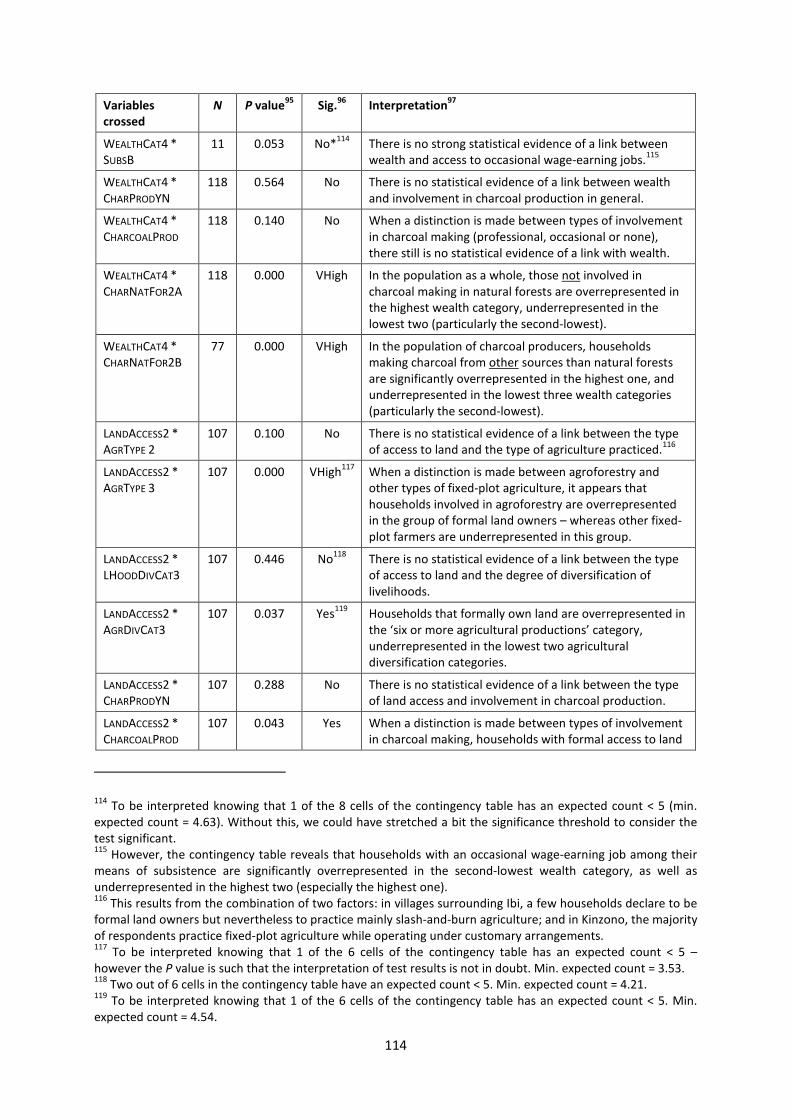
114
Variablescrossed
N P value95
Sig.96
Interpretation97
WEALTHCAT4 *SUBSB
11 0.053 No*114
There is no strong statistical evidence of a link betweenwealth and access to occasional wage-earning jobs.
115
WEALTHCAT4 *CHARPRODYN
118 0.564 No There is no statistical evidence of a link between wealthand involvement in charcoal production in general.
WEALTHCAT4 *CHARCOALPROD
118 0.140 No When a distinction is made between types of involvementin charcoal making (professional, occasional or none),there still is no statistical evidence of a link with wealth.
WEALTHCAT4 *CHARNATFOR2A
118 0.000 VHigh In the population as a whole, those not involved incharcoal making in natural forests are overrepresented inthe highest wealth category, underrepresented in thelowest two (particularly the second-lowest).
WEALTHCAT4 *CHARNATFOR2B
77 0.000 VHigh In the population of charcoal producers, householdsmaking charcoal from other sources than natural forestsare significantly overrepresented in the highest one, andunderrepresented in the lowest three wealth categories(particularly the second-lowest).
LANDACCESS2 *AGRTYPE 2
107 0.100 No There is no statistical evidence of a link between the typeof access to land and the type of agriculture practiced.
116
LANDACCESS2 *AGRTYPE 3
107 0.000 VHigh117
When a distinction is made between agroforestry andother types of fixed-plot agriculture, it appears thathouseholds involved in agroforestry are overrepresentedin the group of formal land owners – whereas other fixed-plot farmers are underrepresented in this group.
LANDACCESS2 *LHOODDIVCAT3
107 0.446 No118
There is no statistical evidence of a link between the typeof access to land and the degree of diversification oflivelihoods.
LANDACCESS2 *AGRDIVCAT3
107 0.037 Yes119
Households that formally own land are overrepresented inthe ‘six or more agricultural productions’ category,underrepresented in the lowest two agriculturaldiversification categories.
LANDACCESS2 *CHARPRODYN
107 0.288 No There is no statistical evidence of a link between the typeof land access and involvement in charcoal production.
LANDACCESS2 *CHARCOALPROD
107 0.043 Yes When a distinction is made between types of involvementin charcoal making, households with formal access to land
114To be interpreted knowing that 1 of the 8 cells of the contingency table has an expected count < 5 (min.
expected count = 4.63). Without this, we could have stretched a bit the significance threshold to consider thetest significant.115
However, the contingency table reveals that households with an occasional wage-earning job among theirmeans of subsistence are significantly overrepresented in the second-lowest wealth category, as well asunderrepresented in the highest two (especially the highest one).116
This results from the combination of two factors: in villages surrounding Ibi, a few households declare to beformal land owners but nevertheless to practice mainly slash-and-burn agriculture; and in Kinzono, the majorityof respondents practice fixed-plot agriculture while operating under customary arrangements.117
To be interpreted knowing that 1 of the 6 cells of the contingency table has an expected count < 5 –however the P value is such that the interpretation of test results is not in doubt. Min. expected count = 3.53.118
Two out of 6 cells in the contingency table have an expected count < 5. Min. expected count = 4.21.119
To be interpreted knowing that 1 of the 6 cells of the contingency table has an expected count < 5. Min.expected count = 4.54.
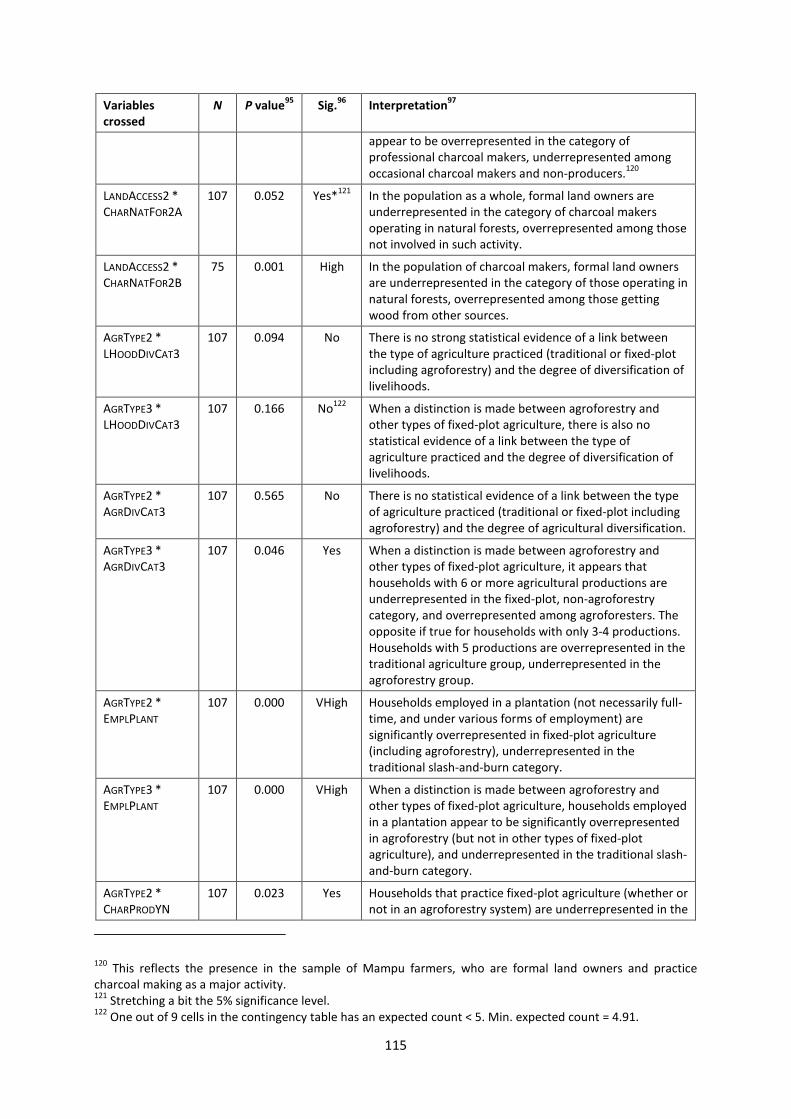
115
Variablescrossed
N P value95
Sig.96
Interpretation97
appear to be overrepresented in the category ofprofessional charcoal makers, underrepresented amongoccasional charcoal makers and non-producers.
120
LANDACCESS2 *CHARNATFOR2A
107 0.052 Yes*121
In the population as a whole, formal land owners areunderrepresented in the category of charcoal makersoperating in natural forests, overrepresented among thosenot involved in such activity.
LANDACCESS2 *CHARNATFOR2B
75 0.001 High In the population of charcoal makers, formal land ownersare underrepresented in the category of those operating innatural forests, overrepresented among those gettingwood from other sources.
AGRTYPE2 *LHOODDIVCAT3
107 0.094 No There is no strong statistical evidence of a link betweenthe type of agriculture practiced (traditional or fixed-plotincluding agroforestry) and the degree of diversification oflivelihoods.
AGRTYPE3 *LHOODDIVCAT3
107 0.166 No122
When a distinction is made between agroforestry andother types of fixed-plot agriculture, there is also nostatistical evidence of a link between the type ofagriculture practiced and the degree of diversification oflivelihoods.
AGRTYPE2 *AGRDIVCAT3
107 0.565 No There is no statistical evidence of a link between the typeof agriculture practiced (traditional or fixed-plot includingagroforestry) and the degree of agricultural diversification.
AGRTYPE3 *AGRDIVCAT3
107 0.046 Yes When a distinction is made between agroforestry andother types of fixed-plot agriculture, it appears thathouseholds with 6 or more agricultural productions areunderrepresented in the fixed-plot, non-agroforestrycategory, and overrepresented among agroforesters. Theopposite if true for households with only 3-4 productions.Households with 5 productions are overrepresented in thetraditional agriculture group, underrepresented in theagroforestry group.
AGRTYPE2 *EMPLPLANT
107 0.000 VHigh Households employed in a plantation (not necessarily full-time, and under various forms of employment) aresignificantly overrepresented in fixed-plot agriculture(including agroforestry), underrepresented in thetraditional slash-and-burn category.
AGRTYPE3 *EMPLPLANT
107 0.000 VHigh When a distinction is made between agroforestry andother types of fixed-plot agriculture, households employedin a plantation appear to be significantly overrepresentedin agroforestry (but not in other types of fixed-plotagriculture), and underrepresented in the traditional slash-and-burn category.
AGRTYPE2 *CHARPRODYN
107 0.023 Yes Households that practice fixed-plot agriculture (whether ornot in an agroforestry system) are underrepresented in the
120This reflects the presence in the sample of Mampu farmers, who are formal land owners and practice
charcoal making as a major activity.121
Stretching a bit the 5% significance level.122
One out of 9 cells in the contingency table has an expected count < 5. Min. expected count = 4.91.
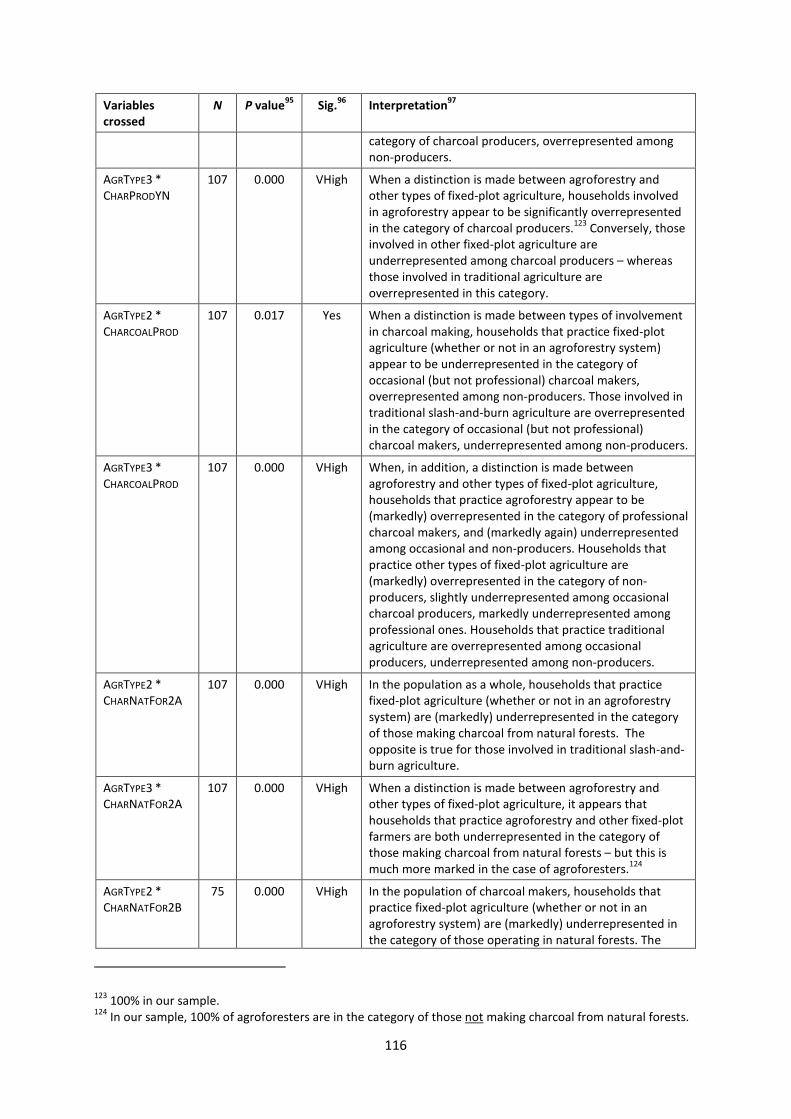
116
Variablescrossed
N P value95
Sig.96
Interpretation97
category of charcoal producers, overrepresented amongnon-producers.
AGRTYPE3 *CHARPRODYN
107 0.000 VHigh When a distinction is made between agroforestry andother types of fixed-plot agriculture, households involvedin agroforestry appear to be significantly overrepresentedin the category of charcoal producers.
123Conversely, those
involved in other fixed-plot agriculture areunderrepresented among charcoal producers – whereasthose involved in traditional agriculture areoverrepresented in this category.
AGRTYPE2 *CHARCOALPROD
107 0.017 Yes When a distinction is made between types of involvementin charcoal making, households that practice fixed-plotagriculture (whether or not in an agroforestry system)appear to be underrepresented in the category ofoccasional (but not professional) charcoal makers,overrepresented among non-producers. Those involved intraditional slash-and-burn agriculture are overrepresentedin the category of occasional (but not professional)charcoal makers, underrepresented among non-producers.
AGRTYPE3 *CHARCOALPROD
107 0.000 VHigh When, in addition, a distinction is made betweenagroforestry and other types of fixed-plot agriculture,households that practice agroforestry appear to be(markedly) overrepresented in the category of professionalcharcoal makers, and (markedly again) underrepresentedamong occasional and non-producers. Households thatpractice other types of fixed-plot agriculture are(markedly) overrepresented in the category of non-producers, slightly underrepresented among occasionalcharcoal producers, markedly underrepresented amongprofessional ones. Households that practice traditionalagriculture are overrepresented among occasionalproducers, underrepresented among non-producers.
AGRTYPE2 *CHARNATFOR2A
107 0.000 VHigh In the population as a whole, households that practicefixed-plot agriculture (whether or not in an agroforestrysystem) are (markedly) underrepresented in the categoryof those making charcoal from natural forests. Theopposite is true for those involved in traditional slash-and-burn agriculture.
AGRTYPE3 *CHARNATFOR2A
107 0.000 VHigh When a distinction is made between agroforestry andother types of fixed-plot agriculture, it appears thathouseholds that practice agroforestry and other fixed-plotfarmers are both underrepresented in the category ofthose making charcoal from natural forests – but this ismuch more marked in the case of agroforesters.
124
AGRTYPE2 *CHARNATFOR2B
75 0.000 VHigh In the population of charcoal makers, households thatpractice fixed-plot agriculture (whether or not in anagroforestry system) are (markedly) underrepresented inthe category of those operating in natural forests. The
123100% in our sample.
124In our sample, 100% of agroforesters are in the category of those not making charcoal from natural forests.
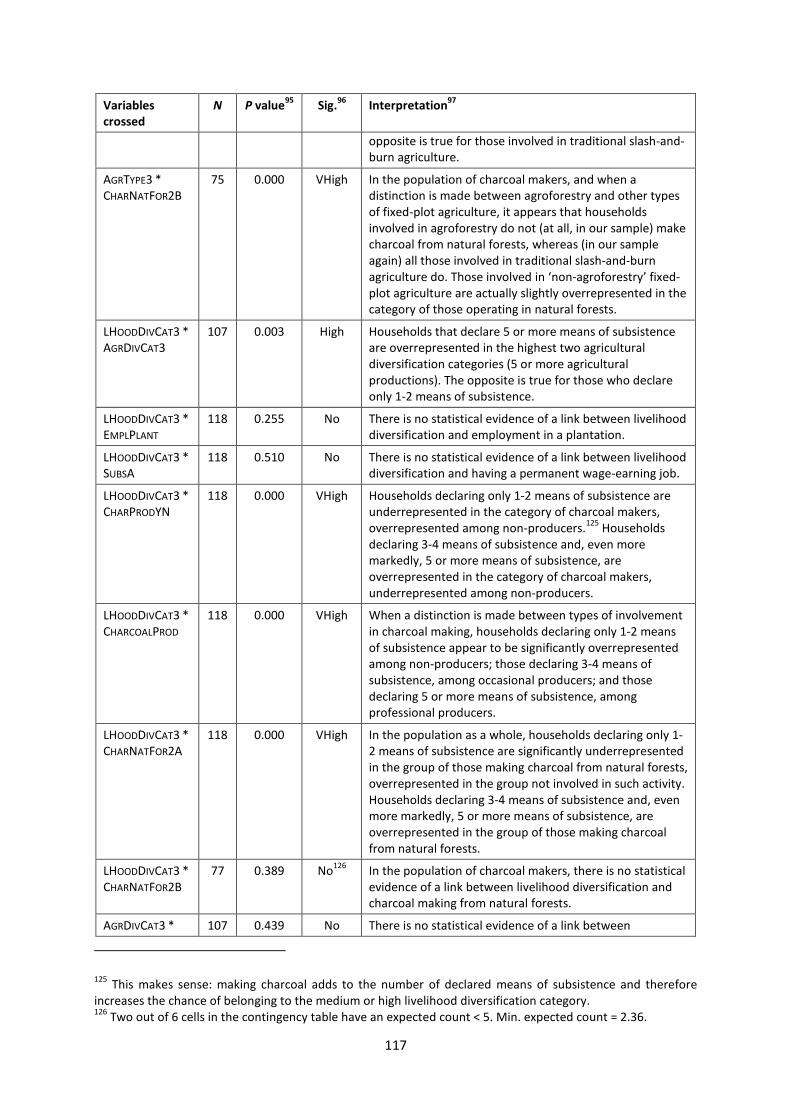
117
Variablescrossed
N P value95
Sig.96
Interpretation97
opposite is true for those involved in traditional slash-and-burn agriculture.
AGRTYPE3 *CHARNATFOR2B
75 0.000 VHigh In the population of charcoal makers, and when adistinction is made between agroforestry and other typesof fixed-plot agriculture, it appears that householdsinvolved in agroforestry do not (at all, in our sample) makecharcoal from natural forests, whereas (in our sampleagain) all those involved in traditional slash-and-burnagriculture do. Those involved in ‘non-agroforestry’ fixed-plot agriculture are actually slightly overrepresented in thecategory of those operating in natural forests.
LHOODDIVCAT3 *AGRDIVCAT3
107 0.003 High Households that declare 5 or more means of subsistenceare overrepresented in the highest two agriculturaldiversification categories (5 or more agriculturalproductions). The opposite is true for those who declareonly 1-2 means of subsistence.
LHOODDIVCAT3 *EMPLPLANT
118 0.255 No There is no statistical evidence of a link between livelihooddiversification and employment in a plantation.
LHOODDIVCAT3 *SUBSA
118 0.510 No There is no statistical evidence of a link between livelihooddiversification and having a permanent wage-earning job.
LHOODDIVCAT3 *CHARPRODYN
118 0.000 VHigh Households declaring only 1-2 means of subsistence areunderrepresented in the category of charcoal makers,overrepresented among non-producers.
125Households
declaring 3-4 means of subsistence and, even moremarkedly, 5 or more means of subsistence, areoverrepresented in the category of charcoal makers,underrepresented among non-producers.
LHOODDIVCAT3 *CHARCOALPROD
118 0.000 VHigh When a distinction is made between types of involvementin charcoal making, households declaring only 1-2 meansof subsistence appear to be significantly overrepresentedamong non-producers; those declaring 3-4 means ofsubsistence, among occasional producers; and thosedeclaring 5 or more means of subsistence, amongprofessional producers.
LHOODDIVCAT3 *CHARNATFOR2A
118 0.000 VHigh In the population as a whole, households declaring only 1-2 means of subsistence are significantly underrepresentedin the group of those making charcoal from natural forests,overrepresented in the group not involved in such activity.Households declaring 3-4 means of subsistence and, evenmore markedly, 5 or more means of subsistence, areoverrepresented in the group of those making charcoalfrom natural forests.
LHOODDIVCAT3 *CHARNATFOR2B
77 0.389 No126
In the population of charcoal makers, there is no statisticalevidence of a link between livelihood diversification andcharcoal making from natural forests.
AGRDIVCAT3 * 107 0.439 No There is no statistical evidence of a link between
125This makes sense: making charcoal adds to the number of declared means of subsistence and therefore
increases the chance of belonging to the medium or high livelihood diversification category.126
Two out of 6 cells in the contingency table have an expected count < 5. Min. expected count = 2.36.
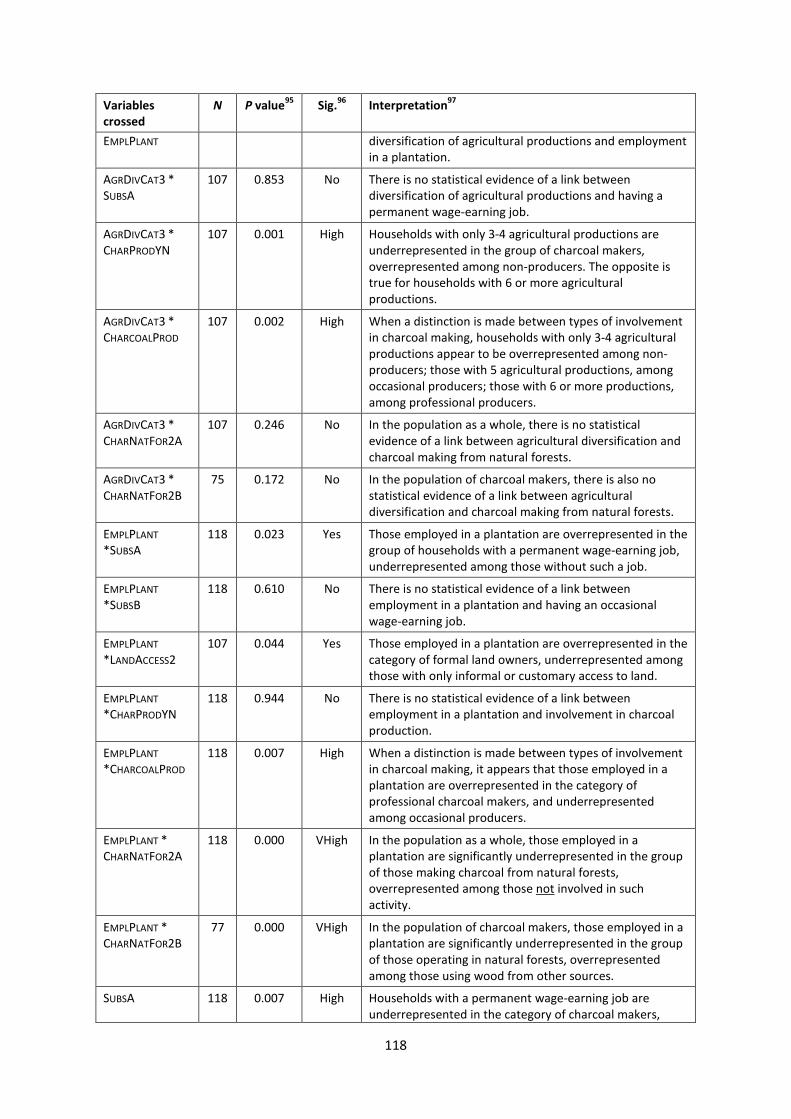
118
Variablescrossed
N P value95
Sig.96
Interpretation97
EMPLPLANT diversification of agricultural productions and employmentin a plantation.
AGRDIVCAT3 *SUBSA
107 0.853 No There is no statistical evidence of a link betweendiversification of agricultural productions and having apermanent wage-earning job.
AGRDIVCAT3 *CHARPRODYN
107 0.001 High Households with only 3-4 agricultural productions areunderrepresented in the group of charcoal makers,overrepresented among non-producers. The opposite istrue for households with 6 or more agriculturalproductions.
AGRDIVCAT3 *CHARCOALPROD
107 0.002 High When a distinction is made between types of involvementin charcoal making, households with only 3-4 agriculturalproductions appear to be overrepresented among non-producers; those with 5 agricultural productions, amongoccasional producers; those with 6 or more productions,among professional producers.
AGRDIVCAT3 *CHARNATFOR2A
107 0.246 No In the population as a whole, there is no statisticalevidence of a link between agricultural diversification andcharcoal making from natural forests.
AGRDIVCAT3 *CHARNATFOR2B
75 0.172 No In the population of charcoal makers, there is also nostatistical evidence of a link between agriculturaldiversification and charcoal making from natural forests.
EMPLPLANT
*SUBSA118 0.023 Yes Those employed in a plantation are overrepresented in the
group of households with a permanent wage-earning job,underrepresented among those without such a job.
EMPLPLANT
*SUBSB118 0.610 No There is no statistical evidence of a link between
employment in a plantation and having an occasionalwage-earning job.
EMPLPLANT
*LANDACCESS2107 0.044 Yes Those employed in a plantation are overrepresented in the
category of formal land owners, underrepresented amongthose with only informal or customary access to land.
EMPLPLANT
*CHARPRODYN118 0.944 No There is no statistical evidence of a link between
employment in a plantation and involvement in charcoalproduction.
EMPLPLANT
*CHARCOALPROD
118 0.007 High When a distinction is made between types of involvementin charcoal making, it appears that those employed in aplantation are overrepresented in the category ofprofessional charcoal makers, and underrepresentedamong occasional producers.
EMPLPLANT *CHARNATFOR2A
118 0.000 VHigh In the population as a whole, those employed in aplantation are significantly underrepresented in the groupof those making charcoal from natural forests,overrepresented among those not involved in suchactivity.
EMPLPLANT *CHARNATFOR2B
77 0.000 VHigh In the population of charcoal makers, those employed in aplantation are significantly underrepresented in the groupof those operating in natural forests, overrepresentedamong those using wood from other sources.
SUBSA 118 0.007 High Households with a permanent wage-earning job areunderrepresented in the category of charcoal makers,
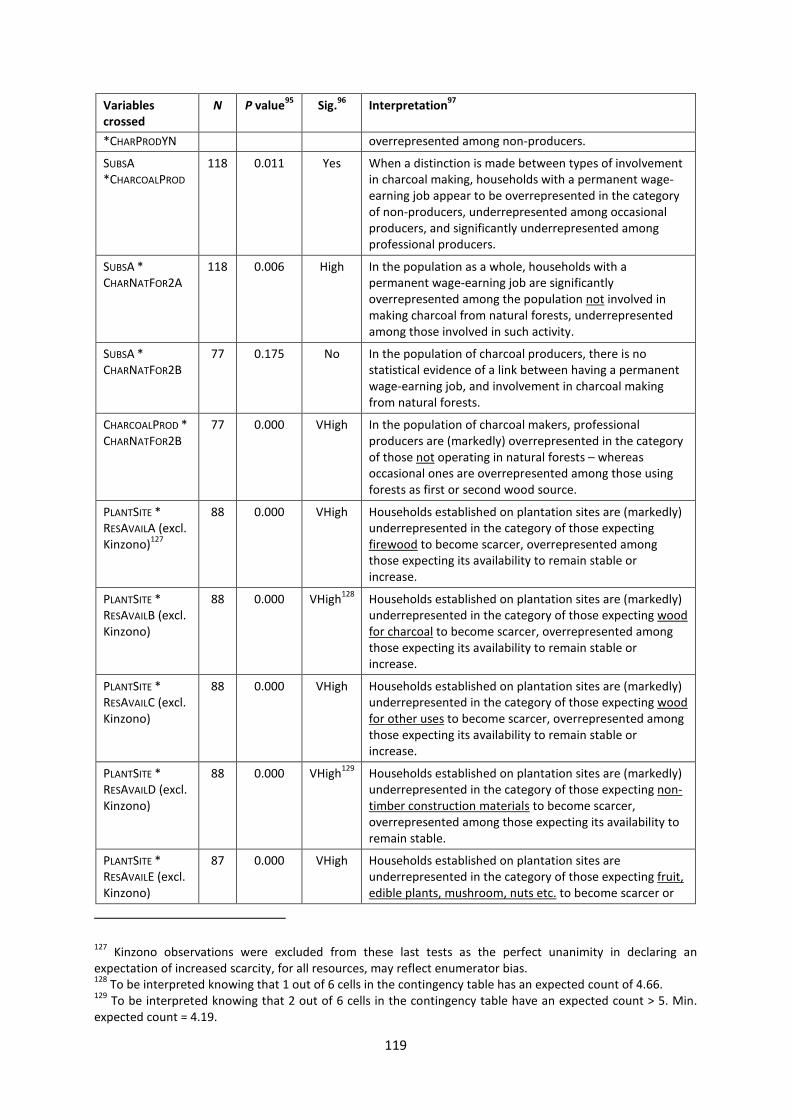
119
Variablescrossed
N P value95
Sig.96
Interpretation97
*CHARPRODYN overrepresented among non-producers.
SUBSA*CHARCOALPROD
118 0.011 Yes When a distinction is made between types of involvementin charcoal making, households with a permanent wage-earning job appear to be overrepresented in the categoryof non-producers, underrepresented among occasionalproducers, and significantly underrepresented amongprofessional producers.
SUBSA *CHARNATFOR2A
118 0.006 High In the population as a whole, households with apermanent wage-earning job are significantlyoverrepresented among the population not involved inmaking charcoal from natural forests, underrepresentedamong those involved in such activity.
SUBSA *CHARNATFOR2B
77 0.175 No In the population of charcoal producers, there is nostatistical evidence of a link between having a permanentwage-earning job, and involvement in charcoal makingfrom natural forests.
CHARCOALPROD *CHARNATFOR2B
77 0.000 VHigh In the population of charcoal makers, professionalproducers are (markedly) overrepresented in the categoryof those not operating in natural forests – whereasoccasional ones are overrepresented among those usingforests as first or second wood source.
PLANTSITE *RESAVAILA (excl.Kinzono)
127
88 0.000 VHigh Households established on plantation sites are (markedly)underrepresented in the category of those expectingfirewood to become scarcer, overrepresented amongthose expecting its availability to remain stable orincrease.
PLANTSITE *RESAVAILB (excl.Kinzono)
88 0.000 VHigh128
Households established on plantation sites are (markedly)underrepresented in the category of those expecting woodfor charcoal to become scarcer, overrepresented amongthose expecting its availability to remain stable orincrease.
PLANTSITE *RESAVAILC (excl.Kinzono)
88 0.000 VHigh Households established on plantation sites are (markedly)underrepresented in the category of those expecting woodfor other uses to become scarcer, overrepresented amongthose expecting its availability to remain stable orincrease.
PLANTSITE *RESAVAILD (excl.Kinzono)
88 0.000 VHigh129
Households established on plantation sites are (markedly)underrepresented in the category of those expecting non-timber construction materials to become scarcer,overrepresented among those expecting its availability toremain stable.
PLANTSITE *RESAVAILE (excl.Kinzono)
87 0.000 VHigh Households established on plantation sites areunderrepresented in the category of those expecting fruit,edible plants, mushroom, nuts etc. to become scarcer or
127Kinzono observations were excluded from these last tests as the perfect unanimity in declaring an
expectation of increased scarcity, for all resources, may reflect enumerator bias.128
To be interpreted knowing that 1 out of 6 cells in the contingency table has an expected count of 4.66.129
To be interpreted knowing that 2 out of 6 cells in the contingency table have an expected count > 5. Min.expected count = 4.19.
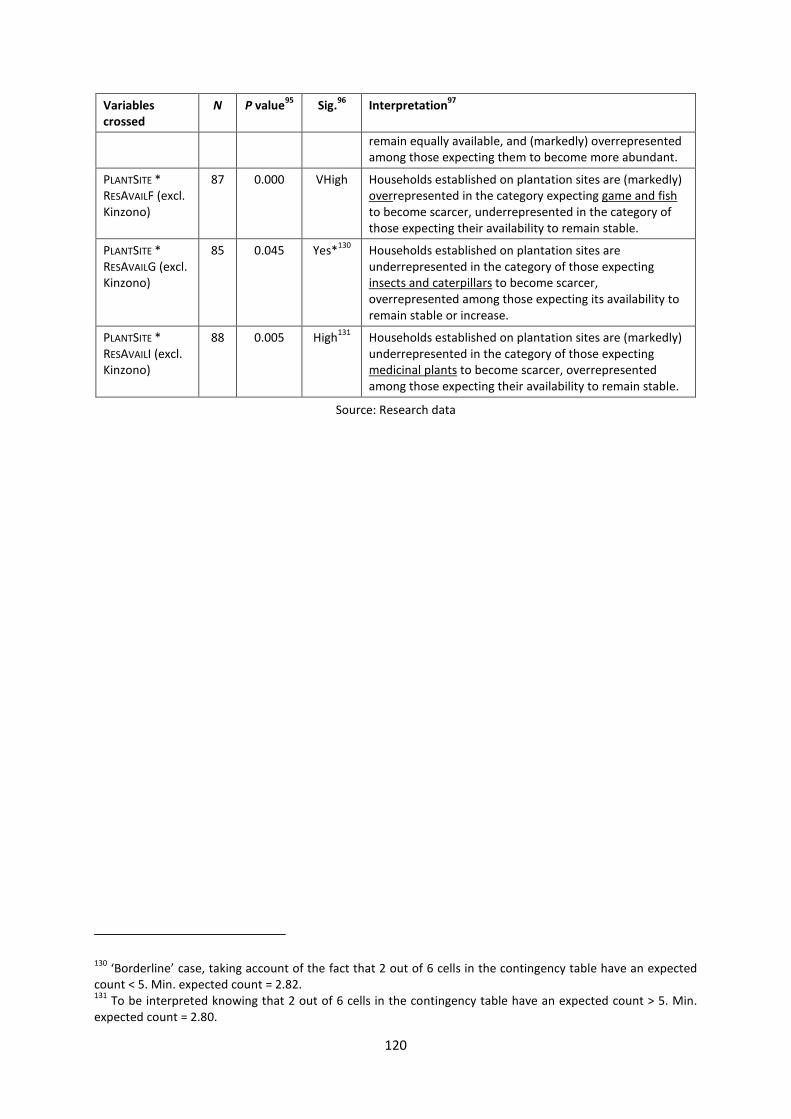
120
Variablescrossed
N P value95
Sig.96
Interpretation97
remain equally available, and (markedly) overrepresentedamong those expecting them to become more abundant.
PLANTSITE *RESAVAILF (excl.Kinzono)
87 0.000 VHigh Households established on plantation sites are (markedly)overrepresented in the category expecting game and fishto become scarcer, underrepresented in the category ofthose expecting their availability to remain stable.
PLANTSITE *RESAVAILG (excl.Kinzono)
85 0.045 Yes*130
Households established on plantation sites areunderrepresented in the category of those expectinginsects and caterpillars to become scarcer,overrepresented among those expecting its availability toremain stable or increase.
PLANTSITE *RESAVAILI (excl.Kinzono)
88 0.005 High131
Households established on plantation sites are (markedly)underrepresented in the category of those expectingmedicinal plants to become scarcer, overrepresentedamong those expecting their availability to remain stable.
Source: Research data
130‘Borderline’ case, taking account of the fact that 2 out of 6 cells in the contingency table have an expected
count < 5. Min. expected count = 2.82.131
To be interpreted knowing that 2 out of 6 cells in the contingency table have an expected count > 5. Min.expected count = 2.80.
121
Annex IX: Focus groups – Detailed account of discussions
1) On livelihoods:
- Agriculture is the main means of subsistence for the vast majority of families. They consume someof their production and sell surpluses.
- Charcoal making is a by-product of farming, which traditionally relies on burning practices. It ishard and unrewarding work, practiced by subsistence farmers primarily for generating cashincome (still a rare opportunity for many) to meet specific needs (e.g. school fees, medicalexpenses, Christmas celebrations, wedding). The quasi totality of the production is sold. If offerslow returns to labour. Farmers involved in agroforestry see charcoal making as a somewhat lessessential by-product of their activity, one of several sources of cash. Those who produce honeyfrom acacia plantations find this activity brings much higher returns than charcoal making.
- Generally speaking, participants feel that rural incomes are not increasing, in spite of theopportunities created by the relative proximity of Kinshasa. Many believe standards of living areeven regressing, compared with ten years ago. Several reasons are provided for this: hightransport costs depressing the price paid to producers, decreasing returns from slash-and-burnagriculture as forests are disappearing or land is lost to erosion, shift in seasons due to climatechange132, lack of tools and equipment, in particular unavailability of tractors at crucial times,demographic growth outpacing economic growth, lack of infrastructure to support growth.
- Kinshasa is the main outlet for local production – the local market is underdeveloped. Transportcosts are very high, even for those living in Mbankana, along the newly paved road to the capital –and even higher for those living in inaccessible villages away from the road. This contributes tokeeping rural incomes low. Nevertheless, the rehabilitation of the national road is a very goodthing and enhances economic activity. Increasingly, people from Kinshasa resettle in the ruralhinterland to exploit income opportunities associated with food production aimed at the capitalcity.
- In the absence of permanent, formal jobs, temporary employment is seen in a positive light;anything that can bring cash income is welcome, and having a temporary job is decisivelypreferable to being unemployed. Farms that use modern, more intensive agricultural practices arespringing up in the region, often on land purchased by Kinshasa politicians and senior militarystaff; they create temporary employment for local people. With one exception, women think themoney earned by their husbands from temporary jobs is brought back home, or used for ‘justifiedexpenses’ benefiting the family.
2) On agricultural practices:
- Small farmers on the Ibi domain still practice mainly slash-and-burn agriculture but are graduallyturning to fixed-plot farming on savannah land. This change results from: (i) the dwindling offorest land suitable for farming; (ii) training in new agricultural techniques and the developmentof community fields by GIAgro. They are open to the adoption of new techniques if this helpsimprove yields/income. The biggest obstacle is that cultivating savannah land is much harder thanworking on forest land, and access to tractors difficult (financially and physically at crucial times inthe farming cycle). Fruit and palm tree cultivation, vegetable growing and small livestock (poultry)breeding have been taken up by some as a way of improving income and diversifying production.These farmers are also being trained in agroforestry practices in community fields developed with
132Attributed by some to the disappearance of forests affecting rainfall patterns, by others to global change.
122
the support of GIAgro. Since this activity is relatively new, at the time of the meeting they werestill expecting to see whether this improved yields compared with their usual practices – but ingeneral were confident about the results. One participant involved in both traditional and fixed-plot agriculture believes the latter is very promising, and more likely to deliver good yields. Manythink a switch to agroforestry on savannah land is an unavoidable development, as the availabilityof forest land suitable for cultivation is decreasing rapidly.
- Mbankana farmers involved in CADIM activities confirmed that the adoption of improvedagricultural practices is a long process requiring long-term education efforts. They are confidentthat people can learn – simply it takes time and sustained support.
- Many subsistence farmers attribute their difficulties to raise income and increase cultivatedsurfaces to the lack of availability of tractors. They often fail to consider that tractors do only partof the job – and that manual labour is still required to adequately prepare soils for cultivation.Some who have experienced the cultivation of larger surfaces than the 1-2 hectares typicallyexploited by a family on an annual basis complain that yields tend to decrease, as themaintenance of larger surfaces (hoeing, weeding) is challenging. Mbankana participants weredivided on the question of tractors: some believe animal traction is a much better solution, asanimals (provided they are adequately fed and taken care of) are more reliable, less costly, alwaysavailable at the time when they are needed, and can contribute to soil fertilisation (manure);others believe tractors are more useful and working with traction animals is hard work. There wasa reasonable consensus on the fact that tractors are better for some types of hard work and onsome terrains, whereas animals are better for lighter work and on some terrains (e.g. steepfields). They can thus be seen as complementary.
- Diversification of agricultural production is seen as a positive development by all – and inparticular by those who practice it as part of integrated production systems. It helps increase aswell as smooth revenue (as the seasonal cycles of various activities differ and there is somethingto sell at all times of the year). It makes people less vulnerable to risks and shocks. Diversificationenhances living standards directly by increasing the availability of food and money, and indirectlyby allowing an accumulation of assets: the profits from one activity can be reinvested in thedevelopment of other activities and the purchase of assets (e.g. land). Diversification also createsemployment, and revenue opportunities for women.
3) On the use of forests and other natural resources:
- Access to forest resources is still governed by customary chiefs – some of which make a ratherpoor job of protecting the resource. Both native and non-native populations have someresponsibility in forest degradation but customary authorities have a responsibility in all cases.Practices vary across villages: in some places, local chiefs authorise outsiders to cut trees withchainsaws to produce charcoal; in other places, access to forest resources is reserved for localpeople, and tree cutting limited to what is necessary for agriculture. Some chiefs are nowencouraging the adoption of agroforestry on customary land.
- All participants declared to collect forest and savannah products (fuelwood, timber, non-timberproducts). Materials extracted from wild lands are used for consumption and sometimes forselling.
- All participants were very much aware of the problem of forest degradation and deforestation,and its consequences: severely reduced availability of non-timber forest products (e.g.mushrooms, caterpillars); loss of biodiversity; reduced farming yields [linked to shorter fallowperiods]; effects on the microclimate (less rainfall, higher temperatures); severe soil erosion andsilting of riverbeds; lower level of the water table. Some declared to have reduced the size of theirforest fields in an attempt to protect the resource against further degradation. All see the
123
development of agriculture on savannah land, in particular in agroforestry systems, as thesolution to this problem: if forests are no longer used for agriculture, they will regenerate(especially if the process is helped by replanting) and forest products will become available again.Two things would help this development: improved forest governance and enforcement of theforest code; and improved security of land tenure arrangements.
- In addition to changes in agricultural practices, Mbankana participants think the creation ofemployment opportunities for young people would help reduce pressure on forests.
- Land tenure insecurity is a crucial issue with regard to the sustainability of agricultural practicesand resource exploitation. Agroforestry, for instance, requires security of tenure. Nevertheless,the transition from the customary to a more formal system of land ownership is not withoutproblems. A lot of what used to be customary land is being sold (formally) to outsiders. Some localpeople also manage to buy land, but on much smaller areas. Land is getting scarcer, and somepeople are losing access to land they used to exploit under customary arrangements. However,none of the focus group participants complained about the Ibi plantation reducing the availabilityof land for local people [most probably because care was taken to establish it at some distancefrom existing farms and settlements]. Mbankana participants actually wish the extension of theIbi plantation (while being hostile to another private development taking place closer to thetown).
- Mbankana participants believe a differentiated taxation system for sustainably and unsustainablyproduced charcoal would also create economic incentives in favour of natural forest protection.However, this would require setting up of a system for tracking the origin of charcoal, and tacklingcorruption.
- If people are offered the opportunity to make charcoal in plantations rather than natural forests,they will be willing to switch – provided they can earn at least as much.
- On the issue of wildfires: improved prevention is needed to avoid the annihilation of tree plantingefforts. Customary chiefs should get more involved in educating the population about fireprevention. Agricultural policies should also emphasize this aspect. Firebreaks are useful but hardto maintain manually: the use of tractors makes it much easier. Honey production is veryprofitable and helps protect forests by providing an incentive to avoid forest fires.
4) On large plantation projects:
- Ibi participants appreciate the support received from GIAgro for the development of agricultureand the adoption of new practices – however they would like to get even more support, and alsoto be sure that support will continue to be provided in future. They do not always seem toappreciate that GIAgro cannot do all the work for them, and that once new fields have beenploughed and harrowed, it is up to them to take over and cultivate. For instance, one womancomplained about her field in the savannah not being harrowed by GIAgro – and it turned out thatit had been harrowed, but she had failed to visit the field so was unaware of this, and had takenno action to exploit it.133 Some participants also expressed the opinion that Ibi plantationmanagers can share their agroforestry model but should not seek to impose it – even if they alsothink this model is superior to current practices.
- Ibi participants also use and appreciate ‘social’ services, notably the primary school (attended byall children on the Ibi domain) and the dispensary. Here again, however, they would like to getmore: expectations include improved quality of teaching at the school, 24/7 availability of medicalstaff at the dispensary (which according to one should be turned into a hospital!), and
133To her discharge, harrowing took place a bit too late in the season to actually start exploitation.
124
decentralisation of some services to the small villages, as distance to the plantation centre is aproblem for some.
- Asked about their overall perception of the Ibi plantation, Ibi participants declared that therewere lots of advantages related to the existence of the plantation, and overall had a positiveopinion on the project, including in terms of improving the local ‘social life’. They seem howeverto have an even better opinion of the Mampu project (in which they are not directly involved):they believe aspects such as agricultural support are better organised in Mampu, and also(although this was less clear) that the economic model is better. They acknowledge Ibi is a muchyounger project than Mampu, and expect positive fallout from the Ibi project to developgradually; they hope their standards of living will ultimately reach those achieved in Mampu.
- Mbankana participants had an extremely positive view of both the Mampu and the Ibi projects.They said some Mbankana inhabitants put their children in the Ibi school, and some also use thedispensary.134 They believe large plantations generate many advantages and few disadvantages,and understand that activities in both Ibi and Mampu create wealth and have positive side effectsfor the economy of their town and the whole region. They are in favour of the development ofnew plantation projects: with 2-3 Mampu-sized projects, they think forest degradation in theregion could be reduced. People met in Mutiene had the same very positive opinion of largeplantation projects. The most significant advantages mentioned, besides the ‘multiplier effect’ onthe local economy, are the creation of new forest resources and new employment opportunities(notably for young people). Other benefits are the improved availability of products such ascassava and honey on the local market, and the return of game in the area.
- Asked about disadvantages associated with large plantations, Ibi and Mbankana participantscould not think of any, except one who mentioned the problem of local atmospheric pollutionassociated with large-scale charcoal production in Mampu.
134This is in spite of the fact that Mbankana has schools and a medical centre.