continuum of hiv care...(israel), maria grazia pompa, anna caraglia, barbara suligoi, lella cosmaro...
TRANSCRIPT
SPECIAL REPORT
Continuum of HIV care Monitoring implementation of the Dublin Declaration on
Partnership to Fight HIV/AIDS in Europe and Central Asia: 2017 progress report
www.ecdc.europa.eu
ECDC SPECIAL REPORT
Thematic report: Continuum of HIV care Monitoring implementation of the Dublin Declaration on partnership to fight HIV/AIDS in Europe and Central Asia: 2017 progress report
ii
This report of the European Centre for Disease Prevention and Control (ECDC) was coordinated by Teymur Noori. Report review was provided by Andrew J. Amato-Gauci, Anastasia Pharris, Annabelle Gourlay, Amanda Mocroft, Jan C. Semenza, Denis Coulombier and Piotr Kramarz.
This report is one in a series of thematic reports based on information submitted by reporting countries in 2016 on monitoring implementation of the Dublin Declaration on Partnership to Fight HIV/AIDS. Other reports in the series can be found on the ECDC website at: http://ecdc.europa.eu/en/healthtopics/aids/Pages/monitoring-dublin-declaration-2016-progress.aspx.
Draft versions of the thematic reports were produced under contract ECDC/2015/013 with Euro Health Group A/S by a team of independent consultants led by Kathy Attawell and David Hales.
Acknowledgements ECDC would like to acknowledge the support and guidance provided by members of the Dublin Declaration advisory group. Members of the advisory group include Irene Rueckerl (Austria), Florence Lot, Daniela Rojas Castro, Richard Stranz (France), Gesa Kupfer (Germany), Derval Igoe (Ireland), Lella Cosmaro (Italy), Charmaine Gauci (Malta), Silke David, Eline Op De Coul (Netherlands), Arild Johan Myrberg (Norway), Olivia Castillo (Spain), Maria Axelsson (Sweden), Valerie Delpech, Alison Brown, Cary James, Brian Rice (United Kingdom), Velina Pendalovska (European Commission), Klaudia Palczak and Dagmar Hedrich (EMCDDA), Taavi Erkkola, Kim Marsh (UNAIDS) and Annemarie Steengard (WHO Regional Office for Europe).
ECDC would also like to thank the following country focal points for providing data through the Dublin Declaration questionnaire in March 2016:Roland Bani (Albania), Montse Gessé (Andorra), Samvel Grigoryan (Armenia), Irene Rueckerl, Bernhard Benka (Austria), Esmira Almammadova (Azerbaijan), Daniel Reynders, Andre Sasse, Dominique Van Beckhoven (Belgium), Šerifa Godinjak, Drazenka Malicbegovic, Indira Hodzic (Bosnia and Herzegovina), Tonka Varleva (Bulgaria), Jasmina Pavlic, Tatjana Nemeth-Blazic (Croatia), Linos Hadjihannas, Anna Demetriou (Cyprus), Veronika Šikolová, Hana Janatova (Czech Republic), Jan Fouchard, Susan Cowan (Denmark), Kristi Rüütel, Anna-Liisa Pääsukene (Estonia), Henrikki Brummer-Korvenkontio (Finland), Jean-Christophe Comboroure. Florence Lot (France), Maia Tsereteli, Ana Aslanikashvili (Georgia), Gesa Kupfer, Ulrich Marcus, (Germany), Vasileia Konte (Greece), Katalin Szalay, Krisztina Tálas (Hungary), Guðrún Sigmundsdóttir (Iceland), Caroline Hurley, Fiona Lyons (Ireland), Daniel Chemtob, Rivka Rich (Israel), Maria Grazia Pompa, Anna Caraglia, Barbara Suligoi, Lella Cosmaro (Italy), Irina Ivanova Petrenko, Alla Yelizarieva, Aliya Bokazhanova (Kazakhstan), Laura Shehu, Pashk Buzhala (Kosovo1), Aikul Ismailova, Nazgul Asybaliev, Talgat Mambetov, Saliya Karymbaeva, Umutkan Chokmorova, Lucia Yanbuhtina, (Kyrgyzstan), Šarlote Konova (Latvia), Irma Caplinskiene (Lithuania), Patrick Hoffman, Pierre Weicherding (Luxembourg), Jackie Maistre Melillo, Charmaine Gauci (Malta), Violeta Teutu, Tatiana Cotelnic-Harea (Moldova), Maja Milanović, Aleksandra Marjanovic, Alma Cicic (Montenegro), Silke David, Eline Op De Coul (Netherlands), Arild Johan Myrberg (Norway), Iwona Wawer, Piotr Wysocki, Adam Adamus, Wojciech Tomczynski (Poland), Antonio Diniz, Teresa Melo (Portugal), Mariana Mardarescu (Romania), Danijela Simic, Sladjana Baros (Serbia), Peter Truska (Slovakia), Irena Klavs (Slovenia), Olivia Castillo, Begoña Rodríguez Ortiz de Salazar, Asuncion Diaz (Spain), Maria Axelsson, Louise Mannheimer, Kristina Ingemarsdotter Persson (Sweden), Stefan Enggist, Axel Schmidt (Switzerland), Alijon Soliev, Sayfuddin Karimov, Dilshod Sayburhonov (Tajikistan), Emel Özdemir Şahin (Turkey), Valerie Delpech, Peter Kirwan, Alison Brown, Sara Croxford, Sandra Okala (United Kingdom), Igor Kuzin, Olga Varetskaya (Ukraine) and Zulfiya Abdurakhimova, Nurmat Atabekov (Uzbekistan).
ECDC would like to thank the operational contact points for HIV surveillance from EU/EEA Member States and the national HIV/AIDS surveillance focal points from other countries of the WHO European Region for making available HIV/AIDS surveillance data.
ECDC would like to thank EMCDDA and UNAIDS for harmonising their monitoring systems with ECDC and making available country-reported data for the purposes of monitoring the Dublin Declaration. ECDC would also like to thank the WHO Regional Office for Europe for jointly coordinating HIV surveillance in the WHO European Region.
Suggested citation: European Centre for Disease Prevention and Control. Thematic report: Continuum of HIV care. Monitoring implementation of the Dublin Declaration on Partnership to Fight HIV/AIDS in Europe and Central Asia: 2017 progress report. Stockholm: ECDC; 2017
Stockholm, April 2017
ISBN 978-92-9498-053-3 doi: 10.2900/71220 Catalogue number TQ-04-17-385-EN-N
© European Centre for Disease Prevention and Control, 2017
Reproduction is authorised, provided the source is acknowledged.
1 This designation is without prejudice to positions on status, and is in line with UNSC 1244 and the ICJ Opinion on the Kosovo Declaration of Independence.

SPECIAL REPORT Continuum of HIV care
1
Introduction This report summarises data on the continuum of HIV care submitted by countries in Europe and Central Asia for the 2014 and 2016 rounds of reporting on implementation of the Dublin Declaration. The report is structured around a four-stage continuum of care, to provide an understanding of the effectiveness of national responses to HIV and to identify areas for improvement.
Why is the continuum of HIV care important? The continuum of HIV care is a conceptual framework that enables countries to monitor the effectiveness of key areas of HIV response. The sequential nature of the stages in the continuum can clearly indicate where countries need to focus their efforts and which programmes and activities require improvement. More specifically, the continuum provides a snapshot of critical stages in achieving viral suppression among people living with HIV (PLHIV). Achieving a high rate of viral suppression among all PLHIV plays a key role in reducing the impact of HIV, by contributing to a better quality of life for PLHIV and reducing new HIV infections.
The continuum of HIV care is also a useful framework for assessing progress against the UNAIDS 90-90-90 targets2 for 2020: 90% of all PLHIV know their status; 90% of those diagnosed are receiving ART; and 90% of those on ART are virally suppressed (Figure 1). When these three targets have been achieved, at least 73% of all PLHIV in a given population will be virally suppressed. UNAIDS’ modelling suggests that achieving these targets by 2020 will enable the world to eliminate the AIDS epidemic by 20302. However, there is evidence suggesting that viral suppression of all PLHIV needs to reach 90% in order to reduce HIV incidence significantly3.
Figure 1. UNAIDS 90-90-90 targets
How are we monitoring the continuum of HIV care in Europe and Central Asia?
In September 2015, ECDC convened an expert meeting to discuss the role of the continuum of HIV care in the European region4. This coincided with the publication of an ECDC report on the continuum using country data reported in 2014 as part of the biennial monitoring of the Dublin Declaration on Partnership to Fight HIV/AIDS5.
2 UNAIDS. 90-90-90 An ambitious target to help end the AIDS epidemic. Geneva: UNAIDS; 2014. 3 Phillips AN, Cambiano V, Miners A, Lampe FC, Rodger A, Nakagawa F, et al. Potential impact on HIV incidence of higher HIV testing rates and earlier antiretroviral therapy initiation in MSM. AIDS. 2015;29(14):1855-62. DOI: 10.1097/QAD.0000000000000767 PMID: 26372391. 4 ECDC. Meeting Report: Optimising analysis of the HIV continuum of care in Europe. Stockholm: September 2015. https://www.researchgate.net/publication/284437767_Optimising analysis of the HIV Continuum of care in Europe -_Report_from_ECDC_meeting_8–9_September_2015 5 European Centre for Disease Prevention and Control. Thematic report: HIV continuum of care. Monitoring implementation of the Dublin Declaration on Partnership to Fight HIV/AIDS in Europe and Central Asia: 2014 progress report. Stockholm: ECDC; 2015.

Continuum of HIV care SPECIAL REPORT
2
Based on the findings of the ECDC Dublin Declaration report on the continuum in 2015, the ECDC expert meeting recommended monitoring a four-stage continuum that is directly relevant in the European region: Stage 1 – the estimated number of all PLHIV; Stage 2 – the number of all PLHIV who have been diagnosed; Stage 3 – the number on PLHIV who have been diagnosed and who are on ART; and Stage 4 – the number of PLHIV on ART who are virally suppressed (Figure 2).
Figure 2. A four-stage continuum of HIV care monitoring framework with targets for Europe and Central Asia
The definitions for each of the four stages are provided in Table 16. These definitions, which were agreed by an advisory group supporting ECDC in the monitoring of the Dublin Declaration, are aligned with the definitions used by an ECDC-EuroCoord project to monitor the continuum of HIV care using national surveillance and cohort data in 11 EU countries7.
Table 1. Consensus definitions to monitor the continuum of HIV care in Dublin Declaration monitoring 2016
Stage 1: Total estimated number of people living with HIV in the country
The total estimated number should be based on an empirical modelling approach, using the ECDC HIV Modelling Tool8, Spectrum or any other empirical estimate. The estimate should include diagnosed and undiagnosed people.
Stage 2: Number/percentage of above (estimated number of people living with HIV in the country) ever having been diagnosed
The number should include all new HIV or AIDS diagnoses. It should also include those people who are in care and those who have not been linked to care.
Stage 3: Number/percentage of above (estimated number of people living with HIV in the country, ever having been diagnosed) who are currently on antiretroviral treatment
The number should include all people currently on ART, regardless of treatment regimen or treatment interruptions/discontinuation.
Stage 4: Number/percentage of above (estimated number of people living with HIV in the country, ever having been diagnosed or having initiated antiretroviral treatment) who had VL ≤200 copies/ml at last visit (virally suppressed)9
The number should include all those who have ever initiated ART, regardless of regimen or treatment interruptions/discontinuation.
6 Countries were asked to report data using these definitions; however, in practice some countries may use slightly different definitions, so caution is required when drawing comparisons between countries. There are also variations in data sources, timeframes, analysis and quality, as discussed on page 4, which limit the scope for directly comparing data between countries. 7 Gourlay A, Noori T, Pharris A. et al. The HIV continuum of care in European Union countries in 2013: data and challenges. Clin Infect Dis 2017 cix212. doi: 10.1093/cid/cix212 8 ECDC Modelling Tool. http://ecdc.europa.eu/en/healthtopics/aids/Pages/hiv-modelling-tool.aspx 9 A viral load threshold for viral suppression of <200 copies/mL was used to allow for changes over time in the lower detection limits of viral load assays. A threshold of 200 copies/mL for population-level monitoring is consistent with recommendations in a recent systematic review of guidelines produced by IAPAC - www.iapac.org/uploads/JIAPAC-IAPAC-Guidelines-for-Optimizing-the-HIV-Care-Continuum-Supplement-Nov-Dec-2015.pdf and the US Centers for Disease Control and Prevention - www.cdc.gov/hiv/pdf/library/factsheets/cdc-hiv-care-continuum.pdf
100%
90%81%
73%
0%
20%
40%
60%
80%
100%
PLHIV Diagnosed On ART Viral suppression
SPECIAL REPORT Continuum of HIV care
3
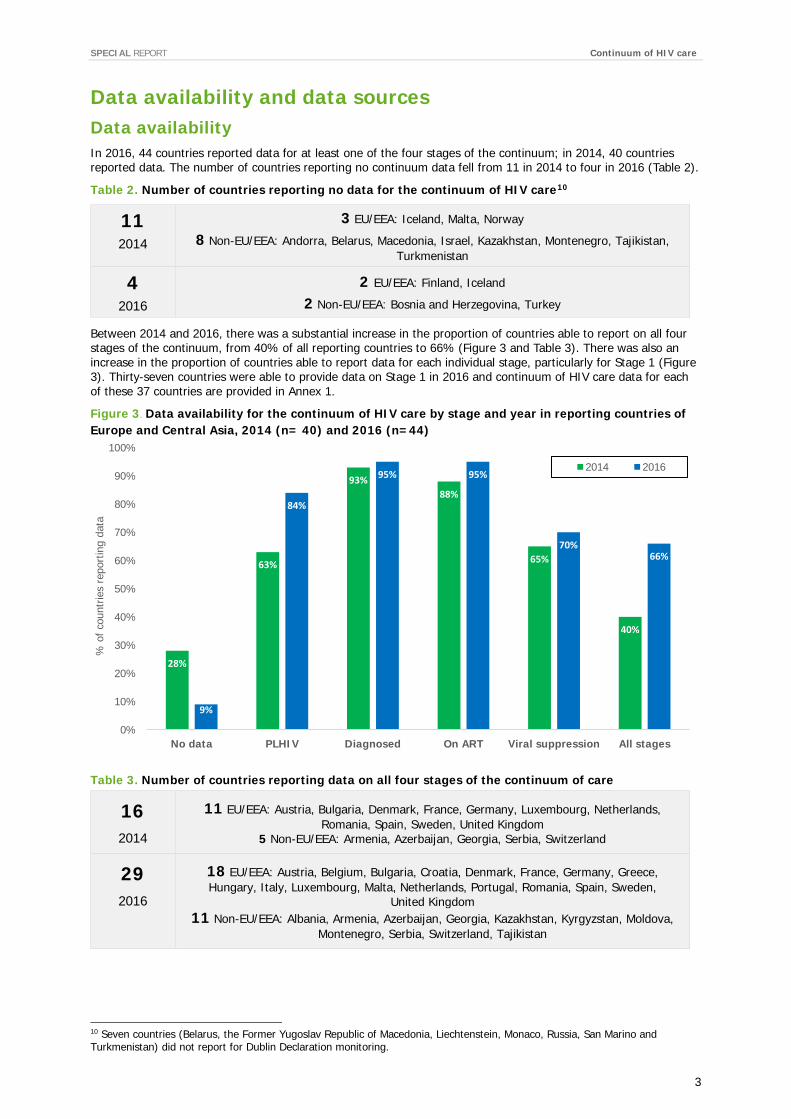
Data availability and data sources Data availability In 2016, 44 countries reported data for at least one of the four stages of the continuum; in 2014, 40 countries reported data. The number of countries reporting no continuum data fell from 11 in 2014 to four in 2016 (Table 2).
Table 2. Number of countries reporting no data for the continuum of HIV care10
11 2014
3 EU/EEA: Iceland, Malta, Norway
8 Non-EU/EEA: Andorra, Belarus, Macedonia, Israel, Kazakhstan, Montenegro, Tajikistan, Turkmenistan
4 2016
2 EU/EEA: Finland, Iceland
2 Non-EU/EEA: Bosnia and Herzegovina, Turkey
Between 2014 and 2016, there was a substantial increase in the proportion of countries able to report on all four stages of the continuum, from 40% of all reporting countries to 66% (Figure 3 and Table 3). There was also an increase in the proportion of countries able to report data for each individual stage, particularly for Stage 1 (Figure 3). Thirty-seven countries were able to provide data on Stage 1 in 2016 and continuum of HIV care data for each of these 37 countries are provided in Annex 1.
Figure 3. Data availability for the continuum of HIV care by stage and year in reporting countries of Europe and Central Asia, 2014 (n= 40) and 2016 (n=44)
Table 3. Number of countries reporting data on all four stages of the continuum of care
16 2014
11 EU/EEA: Austria, Bulgaria, Denmark, France, Germany, Luxembourg, Netherlands, Romania, Spain, Sweden, United Kingdom
5 Non-EU/EEA: Armenia, Azerbaijan, Georgia, Serbia, Switzerland
29 2016
18 EU/EEA: Austria, Belgium, Bulgaria, Croatia, Denmark, France, Germany, Greece, Hungary, Italy, Luxembourg, Malta, Netherlands, Portugal, Romania, Spain, Sweden,
United Kingdom 11 Non-EU/EEA: Albania, Armenia, Azerbaijan, Georgia, Kazakhstan, Kyrgyzstan, Moldova,
Montenegro, Serbia, Switzerland, Tajikistan
10 Seven countries (Belarus, the Former Yugoslav Republic of Macedonia, Liechtenstein, Monaco, Russia, San Marino and Turkmenistan) did not report for Dublin Declaration monitoring.
28%
63%
93%88%
65%
40%
9%
84%
95% 95%
70%66%
0%
10%
20%
30%
40%
50%
60%
70%
80%
90%
100%
No data PLHIV Diagnosed On ART Viral suppression All stages
% o
f co
untr
ies
repo
rtin
g da
ta
2014 2016
Continuum of HIV care SPECIAL REPORT
4
Despite this improvement, Stage 1 and Stage 4 remain the two stages where countries in Europe and Central Asia are least likely to have data available. To help address this issue, ECDC is supporting countries in the use of the ECDC HIV modelling tool to generate robust estimates of the number of PLHIV and facilitating collaboration between public health and clinical experts to improve estimates of viral suppression11.
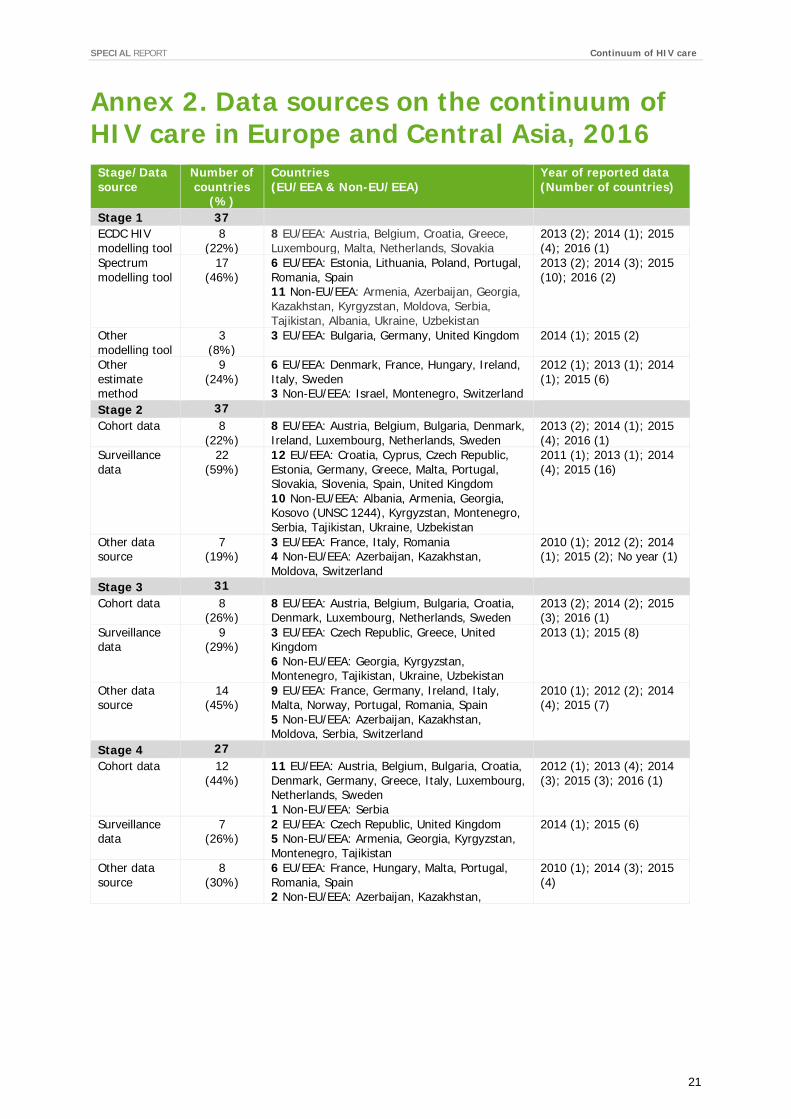
Data sources Data on the continuum of HIV care reported by countries are diverse, in terms of source, timeframe and quality. Annex 2 provides an overview of the different data sources used for each stage of the continuum.12 Although the diversity of data limits the ability to directly compare country estimates, there are elements of consistency across the data reported for each stage of the continuum. For example, among countries identifying the data source and year for different stages:
• 44% used Spectrum and 28% used the ECDC modelling tool for Stage 1 • 60% used surveillance data for Stage 2 • 30% used cohort data and 30% used surveillance data for Stage 3 • 44% used cohort data for Stage 4.
Overall, the data submitted by countries demonstrate that it is possible to use existing data sources to construct continuum of HIV care models at national level. Efforts are underway to develop standards for continuum data13 but, given the diversity of national systems, there will continue to be differences in data collection, calculation and analysis in the short-to-medium term.
Results This section discusses each stage of the continuum of HIV care in more detail, including data availability, data sources, what the data tells us about the current situation in Europe and Central Asia and how this compares with the UNAIDS’ targets.
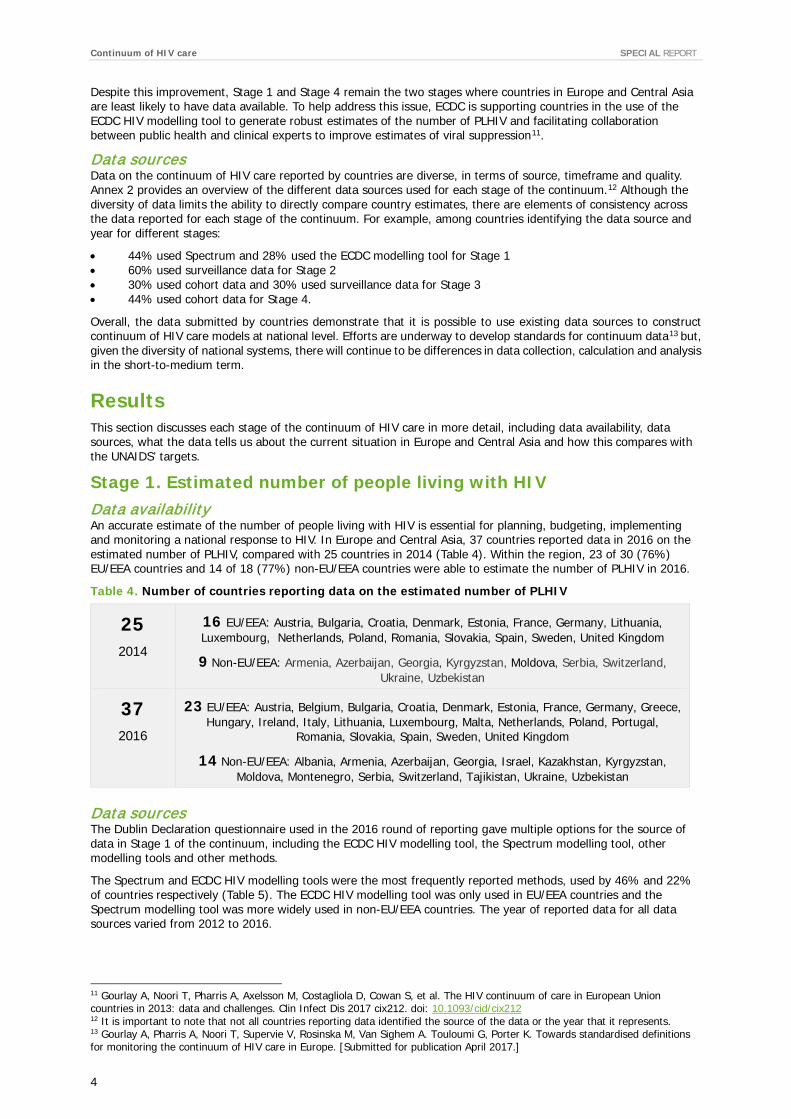
Stage 1. Estimated number of people living with HIV Data availability An accurate estimate of the number of people living with HIV is essential for planning, budgeting, implementing and monitoring a national response to HIV. In Europe and Central Asia, 37 countries reported data in 2016 on the estimated number of PLHIV, compared with 25 countries in 2014 (Table 4). Within the region, 23 of 30 (76%) EU/EEA countries and 14 of 18 (77%) non-EU/EEA countries were able to estimate the number of PLHIV in 2016.
Table 4. Number of countries reporting data on the estimated number of PLHIV
25 2014
16 EU/EEA: Austria, Bulgaria, Croatia, Denmark, Estonia, France, Germany, Lithuania, Luxembourg, Netherlands, Poland, Romania, Slovakia, Spain, Sweden, United Kingdom
9 Non-EU/EEA: Armenia, Azerbaijan, Georgia, Kyrgyzstan, Moldova, Serbia, Switzerland, Ukraine, Uzbekistan
37 2016
23 EU/EEA: Austria, Belgium, Bulgaria, Croatia, Denmark, Estonia, France, Germany, Greece, Hungary, Ireland, Italy, Lithuania, Luxembourg, Malta, Netherlands, Poland, Portugal,
Romania, Slovakia, Spain, Sweden, United Kingdom
14 Non-EU/EEA: Albania, Armenia, Azerbaijan, Georgia, Israel, Kazakhstan, Kyrgyzstan, Moldova, Montenegro, Serbia, Switzerland, Tajikistan, Ukraine, Uzbekistan
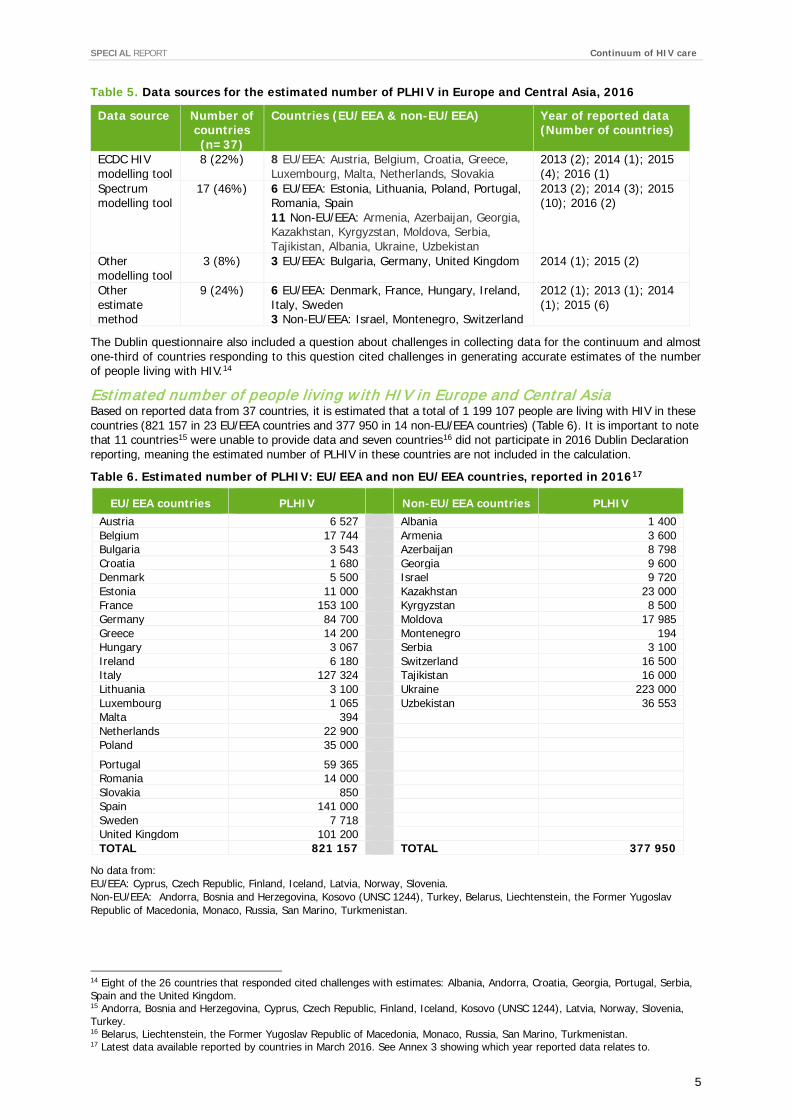
Data sources The Dublin Declaration questionnaire used in the 2016 round of reporting gave multiple options for the source of data in Stage 1 of the continuum, including the ECDC HIV modelling tool, the Spectrum modelling tool, other modelling tools and other methods.
The Spectrum and ECDC HIV modelling tools were the most frequently reported methods, used by 46% and 22% of countries respectively (Table 5). The ECDC HIV modelling tool was only used in EU/EEA countries and the Spectrum modelling tool was more widely used in non-EU/EEA countries. The year of reported data for all data sources varied from 2012 to 2016.
11 Gourlay A, Noori T, Pharris A, Axelsson M, Costagliola D, Cowan S, et al. The HIV continuum of care in European Union countries in 2013: data and challenges. Clin Infect Dis 2017 cix212. doi: 10.1093/cid/cix212 12 It is important to note that not all countries reporting data identified the source of the data or the year that it represents. 13 Gourlay A, Pharris A, Noori T, Supervie V, Rosinska M, Van Sighem A. Touloumi G, Porter K. Towards standardised definitions for monitoring the continuum of HIV care in Europe. [Submitted for publication April 2017.]
SPECIAL REPORT Continuum of HIV care
5
Table 5. Data sources for the estimated number of PLHIV in Europe and Central Asia, 2016
Data source Number of countries (n=37)
Countries (EU/EEA & non-EU/EEA) Year of reported data (Number of countries)
ECDC HIV modelling tool
8 (22%) 8 EU/EEA: Austria, Belgium, Croatia, Greece, Luxembourg, Malta, Netherlands, Slovakia
2013 (2); 2014 (1); 2015 (4); 2016 (1)
Spectrum modelling tool
17 (46%) 6 EU/EEA: Estonia, Lithuania, Poland, Portugal, Romania, Spain 11 Non-EU/EEA: Armenia, Azerbaijan, Georgia, Kazakhstan, Kyrgyzstan, Moldova, Serbia, Tajikistan, Albania, Ukraine, Uzbekistan
2013 (2); 2014 (3); 2015 (10); 2016 (2)
Other modelling tool
3 (8%) 3 EU/EEA: Bulgaria, Germany, United Kingdom 2014 (1); 2015 (2)
Other estimate method
9 (24%) 6 EU/EEA: Denmark, France, Hungary, Ireland, Italy, Sweden 3 Non-EU/EEA: Israel, Montenegro, Switzerland
2012 (1); 2013 (1); 2014 (1); 2015 (6)
The Dublin questionnaire also included a question about challenges in collecting data for the continuum and almost one-third of countries responding to this question cited challenges in generating accurate estimates of the number of people living with HIV.14
Estimated number of people living w ith HIV in Europe and Central Asia Based on reported data from 37 countries, it is estimated that a total of 1 199 107 people are living with HIV in these countries (821 157 in 23 EU/EEA countries and 377 950 in 14 non-EU/EEA countries) (Table 6). It is important to note that 11 countries15 were unable to provide data and seven countries16 did not participate in 2016 Dublin Declaration reporting, meaning the estimated number of PLHIV in these countries are not included in the calculation.
Table 6. Estimated number of PLHIV: EU/EEA and non EU/EEA countries, reported in 201617
No data from: EU/EEA: Cyprus, Czech Republic, Finland, Iceland, Latvia, Norway, Slovenia. Non-EU/EEA: Andorra, Bosnia and Herzegovina, Kosovo (UNSC 1244), Turkey, Belarus, Liechtenstein, the Former Yugoslav Republic of Macedonia, Monaco, Russia, San Marino, Turkmenistan.
14 Eight of the 26 countries that responded cited challenges with estimates: Albania, Andorra, Croatia, Georgia, Portugal, Serbia, Spain and the United Kingdom. 15 Andorra, Bosnia and Herzegovina, Cyprus, Czech Republic, Finland, Iceland, Kosovo (UNSC 1244), Latvia, Norway, Slovenia, Turkey. 16 Belarus, Liechtenstein, the Former Yugoslav Republic of Macedonia, Monaco, Russia, San Marino, Turkmenistan. 17 Latest data available reported by countries in March 2016. See Annex 3 showing which year reported data relates to.
EU/EEA countries PLHIV Non-EU/EEA countries PLHIV Austria 6 527 Albania 1 400 Belgium 17 744 Armenia 3 600 Bulgaria 3 543 Azerbaijan 8 798 Croatia 1 680 Georgia 9 600 Denmark 5 500 Israel 9 720 Estonia 11 000 Kazakhstan 23 000 France 153 100 Kyrgyzstan 8 500 Germany 84 700 Moldova 17 985 Greece 14 200 Montenegro 194 Hungary 3 067 Serbia 3 100 Ireland 6 180 Switzerland 16 500 Italy 127 324 Tajikistan 16 000 Lithuania 3 100 Ukraine 223 000 Luxembourg 1 065 Uzbekistan 36 553 Malta 394 Netherlands 22 900 Poland 35 000
Portugal 59 365
Romania 14 000 Slovakia 850 Spain 141 000 Sweden 7 718 United Kingdom 101 200 TOTAL 821 157 TOTAL 377 950
Continuum of HIV care SPECIAL REPORT
6
Stage 2. Number of PLHIV who have been diagnosed Data availability In both 2014 and 2016, more countries were able to report data on the number of people diagnosed than for any other stage in the continuum. In 2016, 42 countries (27 EU/EEA and 15 non-EU/EEA countries) reported on the number of PLHIV diagnosed, compared with 37 countries (25 EU/EEA and 12 non-EU/EEA countries) in 2014. There was also a significant increase in the number of countries able to report data for both Stages 1 and 2 of the continuum between 2014 (23) and 2016 (37) (Table 7).
Table 7. Number of countries reporting data for both Stage 1 (estimated number of PLHIV) and Stage 2 (number diagnosed)
23 2014
15 EU/EEA: Austria, Bulgaria, Denmark, Estonia, France, Germany, Lithuania, Luxembourg, Netherlands, Poland, Romania, Slovakia, Spain, Sweden, United Kingdom
8 Non-EU/EEA: Armenia, Azerbaijan, Georgia, Moldova, Serbia, Switzerland, Ukraine, Uzbekistan
37 2016
23 EU/EEA: Austria, Belgium, Bulgaria, Croatia, Denmark, Estonia, France, Germany, Greece, Hungary, Ireland, Italy, Lithuania, Luxembourg, Malta, Netherlands, Poland, Portugal, Romania,
Slovakia, Spain, Sweden, United Kingdom
14 Non-EU/EEA: Albania, Armenia, Azerbaijan, Georgia, Israel, Kazakhstan, Kyrgyzstan, Moldova, Montenegro, Serbia, Switzerland, Tajikistan, Ukraine, Uzbekistan
Data sources Surveillance data are the most frequently reported source of data for Stage 2 of the continuum, used by 59% of countries (Table 8). Among the remaining countries that provided information about the source of data, cohort data and other data sources were used by 22% and 19%, respectively. Only EU countries reported using cohort data as the source of data for Stage 218.
Table 8. Data sources for the number of PLHIV diagnosed in Europe and Central Asia, 2016
Data source Number of countries (n=37)
Countries (EU/EEA & Non-EU/EEA) Year of reported data (Number of countries)
Cohort data 8 (22%) 8 EU/EEA: Austria, Belgium, Bulgaria, Denmark, Ireland, Luxembourg, Netherlands, Sweden
2013 (2); 2014 (1); 2015 (4); 2016 (1)
Surveillance data
22 (59%) 12 EU/EEA: Croatia, Cyprus, Czech Republic, Estonia, Germany, Greece, Malta, Portugal, Slovakia, Slovenia, Spain, United Kingdom 10 Non-EU/EEA: Albania, Armenia, Georgia, Kosovo (UNSC 1244), Kyrgyzstan, Montenegro, Serbia, Tajikistan, Ukraine, Uzbekistan
2011 (1); 2013 (1); 2014 (4); 2015 (16)
Other data source
7 (19%) 3 EU/EEA: France, Italy, Romania 4 Non-EU/EEA: Azerbaijan, Kazakhstan, Moldova, Switzerland
2010 (1); 2012 (2); 2014 (1); 2015 (2); No year (1)
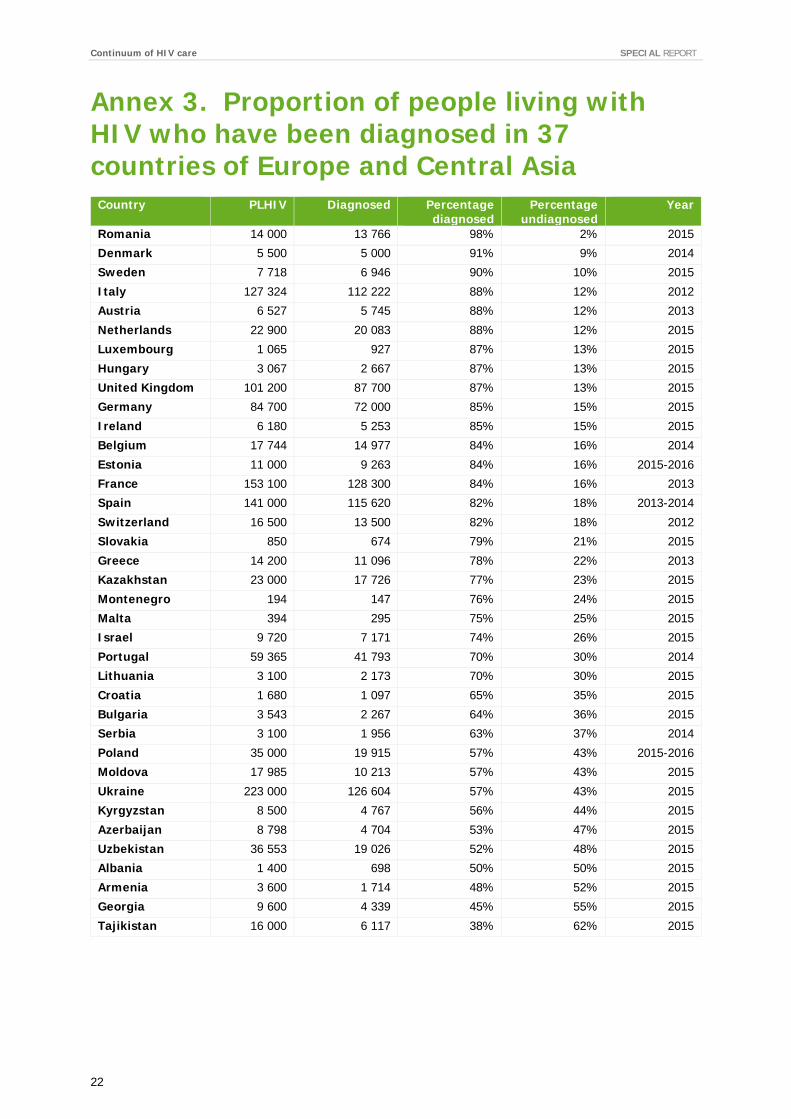
Number of PLHIV who have been diagnosed, and number who have an undiagnosed HIV infection, in Europe and Central Asia In the 37 countries reporting data within Europe and Central Asia for both Stage 1 and Stage 2, an estimated 1 199 000 people are living with HIV, 898 000 of whom (75%; range 147–128 300) have been diagnosed (Table 9 and Annex 3). In these countries, one in four (25%; range 2–62%) people living with HIV in Europe and Central Asia are therefore unaware of their HIV status.
Available data show that overall, the proportion of undiagnosed PLHIV is higher in non-EU/EEA countries than in EU/EEA countries. In the 23 EU/EEA countries with data for both stages, an estimated 821 000 people are living with HIV, 680 000 of whom have been diagnosed (83%; range 57–98%). This means that one in six PLHIV (17%; range 2–43%) in these countries have an undiagnosed HIV infection. This is consistent with the ECDC modelled estimate of the undiagnosed proportion of people living with HIV in the 31 countries of the EU/EEA which concluded that 15% of PLHIV, or 122 000 people, are undiagnosed19.
18 It is important to note that in some countries surveillance is based on cohorts and in some countries these are national cohorts, so there is no distinction between cohort and surveillance data. 19 Pharris A, Quinten C, Noori T, Amato-Gauci AJ, van Sighem A, The ECDC HIV/AIDS Surveillance and Dublin Declaration Monitoring Networks. Estimating HIV incidence and number of undiagnosed individuals living with HIV in the European Union/European Economic Area, 2015. Euro Surveill. 2016;21(48):pii=30417. DOI: http://dx.doi.org/10.2807/1560-7917.ES.2016.21.48.30417

SPECIAL REPORT Continuum of HIV care
7
In the 14 non-EU/EEA countries with data for both stages, an estimated 378 000 people are living with HIV, of whom 218 000 have been diagnosed (58%; range 38–82%). This means that more than two in five PLHIV (42%; range 18–62%) in these countries have undiagnosed HIV infection.
Table 9. Number and percentage of PLHIV with diagnosed and undiagnosed HIV infection in 37 countries in Europe and Central Asia, 2016 (Annex 3)
Countries Estimated number of PLHIV
(range)
Number of PLHIV diagnosed
(range)
% of PLHIV diagnosed
(range)
% of PLHIV undiagnosed
(range)
EU/EEA 821 000 (394–153 100)
680 000 (295–128 300)
83% (57–98%)
17% (2–43%)
Non-EU/EEA 378 000 (194–223 000)
218 000 (147–126 604)
58% (38–82%)
42% (18–62%)
All countries 1 199 000 (194–223 000)
898 000 (147–128 300)
75% (38–98%)
25% (2–62%)
Three of the 37 countries (Romania, Denmark, and Sweden) have achieved the first of the UNAIDS targets with 90% of all PLHIV knowing their status (Figure 4). Of the other 34 countries, 18 report that over 75% (range 75 – 88%) of PLHIV know their status (15 EU/EEA and three non-EU/EEA countries), and 16 countries report that fewer than 75% (range 38–74%) of PLHIV know their status (five EU/EEA and 11 non-EU/EEA countries).
Figure 4. Percentage of all PLHIV who know their status in 37 countries of Europe and Central Asia, 201620
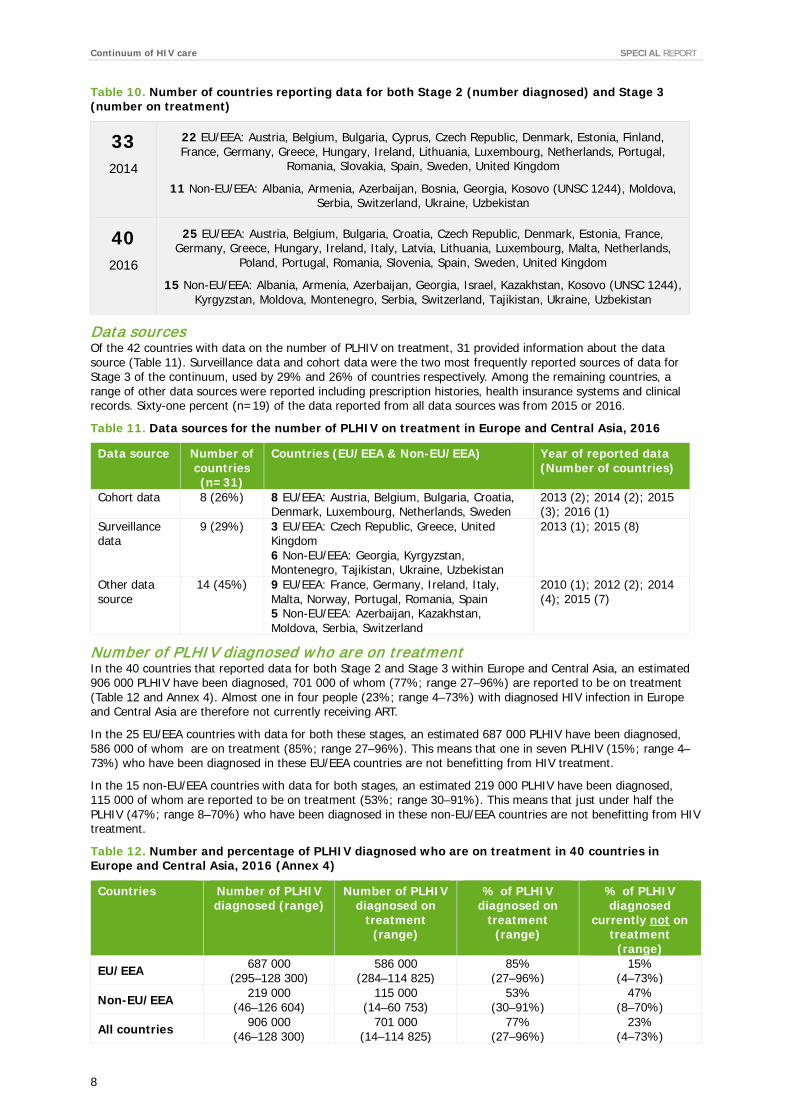
Stage 3. Number of people diagnosed who are on treatment Data availability In 2016, 42 countries (26 EU/EEA and 16 non-EU/EEA countries) reported on the number of PLHIV diagnosed who are currently on treatment21, compared with 35 countries (23 EU/EEA and 12 non-EU/EEA countries) in 2014. There was also a significant increase in the number of countries able to report data for both Stages 2 and 3 of the continuum between 2014 (33) and 2016 (40) (Table 10).
20 Latest data available reported by countries in March 2016. See Annex 3 showing which year reported data relates to. 21 It is unclear which ART regimen is used in different countries.
0%
10%
20%
30%
40%
50%
60%
70%
80%
90%
100%UNAIDS target 90%
Regional average 75%
Continuum of HIV care SPECIAL REPORT
8
Table 10. Number of countries reporting data for both Stage 2 (number diagnosed) and Stage 3 (number on treatment)
33 2014
22 EU/EEA: Austria, Belgium, Bulgaria, Cyprus, Czech Republic, Denmark, Estonia, Finland, France, Germany, Greece, Hungary, Ireland, Lithuania, Luxembourg, Netherlands, Portugal,
Romania, Slovakia, Spain, Sweden, United Kingdom
11 Non-EU/EEA: Albania, Armenia, Azerbaijan, Bosnia, Georgia, Kosovo (UNSC 1244), Moldova, Serbia, Switzerland, Ukraine, Uzbekistan
40 2016
25 EU/EEA: Austria, Belgium, Bulgaria, Croatia, Czech Republic, Denmark, Estonia, France, Germany, Greece, Hungary, Ireland, Italy, Latvia, Lithuania, Luxembourg, Malta, Netherlands,
Poland, Portugal, Romania, Slovenia, Spain, Sweden, United Kingdom
15 Non-EU/EEA: Albania, Armenia, Azerbaijan, Georgia, Israel, Kazakhstan, Kosovo (UNSC 1244), Kyrgyzstan, Moldova, Montenegro, Serbia, Switzerland, Tajikistan, Ukraine, Uzbekistan
Data sources Of the 42 countries with data on the number of PLHIV on treatment, 31 provided information about the data source (Table 11). Surveillance data and cohort data were the two most frequently reported sources of data for Stage 3 of the continuum, used by 29% and 26% of countries respectively. Among the remaining countries, a range of other data sources were reported including prescription histories, health insurance systems and clinical records. Sixty-one percent (n=19) of the data reported from all data sources was from 2015 or 2016.
Table 11. Data sources for the number of PLHIV on treatment in Europe and Central Asia, 2016
Data source Number of countries (n=31)
Countries (EU/EEA & Non-EU/EEA) Year of reported data (Number of countries)
Cohort data 8 (26%) 8 EU/EEA: Austria, Belgium, Bulgaria, Croatia, Denmark, Luxembourg, Netherlands, Sweden
2013 (2); 2014 (2); 2015 (3); 2016 (1)
Surveillance data
9 (29%) 3 EU/EEA: Czech Republic, Greece, United Kingdom 6 Non-EU/EEA: Georgia, Kyrgyzstan, Montenegro, Tajikistan, Ukraine, Uzbekistan
2013 (1); 2015 (8)
Other data source
14 (45%) 9 EU/EEA: France, Germany, Ireland, Italy, Malta, Norway, Portugal, Romania, Spain 5 Non-EU/EEA: Azerbaijan, Kazakhstan, Moldova, Serbia, Switzerland
2010 (1); 2012 (2); 2014 (4); 2015 (7)
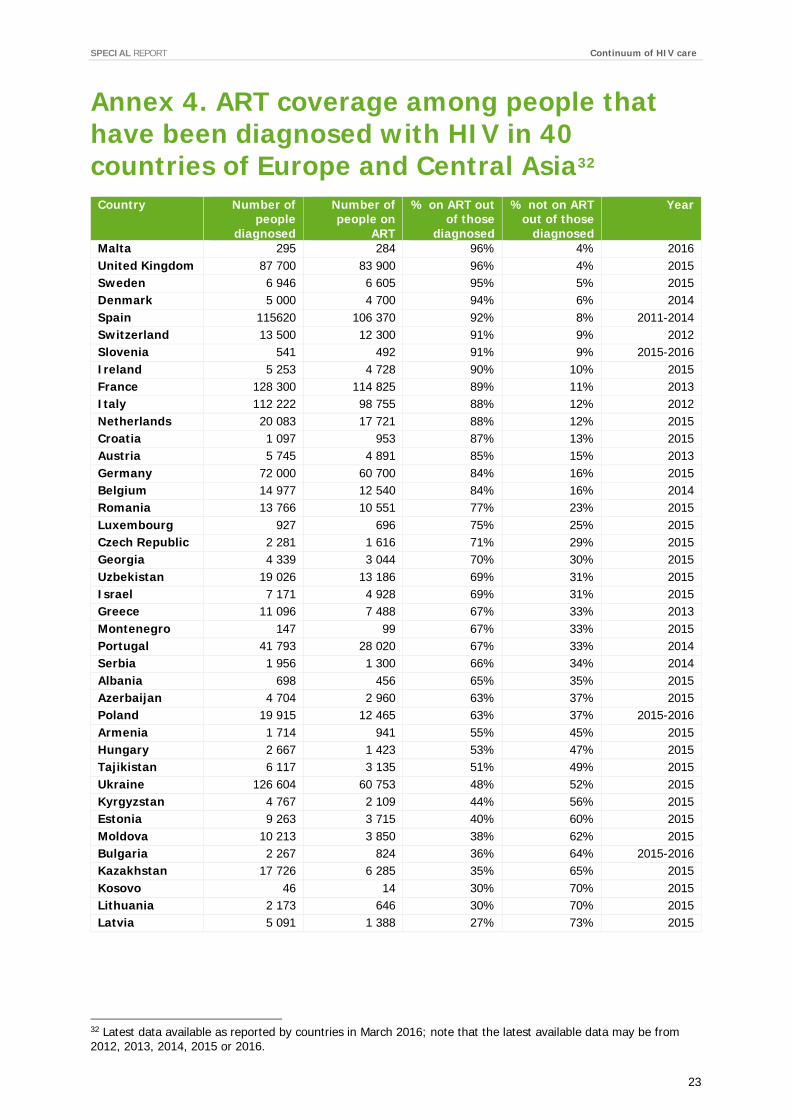
Number of PLHIV diagnosed who are on treatment In the 40 countries that reported data for both Stage 2 and Stage 3 within Europe and Central Asia, an estimated 906 000 PLHIV have been diagnosed, 701 000 of whom (77%; range 27–96%) are reported to be on treatment (Table 12 and Annex 4). Almost one in four people (23%; range 4–73%) with diagnosed HIV infection in Europe and Central Asia are therefore not currently receiving ART.
In the 25 EU/EEA countries with data for both these stages, an estimated 687 000 PLHIV have been diagnosed, 586 000 of whom are on treatment (85%; range 27–96%). This means that one in seven PLHIV (15%; range 4–73%) who have been diagnosed in these EU/EEA countries are not benefitting from HIV treatment.
In the 15 non-EU/EEA countries with data for both stages, an estimated 219 000 PLHIV have been diagnosed, 115 000 of whom are reported to be on treatment (53%; range 30–91%). This means that just under half the PLHIV (47%; range 8–70%) who have been diagnosed in these non-EU/EEA countries are not benefitting from HIV treatment.
Table 12. Number and percentage of PLHIV diagnosed who are on treatment in 40 countries in Europe and Central Asia, 2016 (Annex 4)
Countries Number of PLHIV diagnosed (range)
Number of PLHIV diagnosed on
treatment (range)
% of PLHIV diagnosed on
treatment (range)
% of PLHIV diagnosed
currently not on treatment
(range)
EU/EEA 687 000 (295–128 300)
586 000 (284–114 825)
85% (27–96%)
15% (4–73%)
Non-EU/EEA 219 000 (46–126 604)
115 000 (14–60 753)
53% (30–91%)
47% (8–70%)
All countries 906 000 (46–128 300)
701 000 (14–114 825)
77% (27–96%)
23% (4–73%)

SPECIAL REPORT Continuum of HIV care
9
Eight of the 40 countries (Denmark, Ireland, Malta, Slovenia, Spain, Sweden, Switzerland and the United Kingdom) have achieved the second of the UNAIDS targets: 90% of PLHIV know their status and are on treatment (Figure 5). Of the other 32 countries, eight report that more than 77% (range 77–88%) of PLHIV who know their status are on treatment (eight EU/EEA countries), and 24 report that fewer than 77% (range 27–75%) of PLHIV who know their status are on treatment (10 EU/EEA and 14 non-EU/EEA countries). In nine of these countries, fewer than 50% of PLHIV who know their status are on treatment.
Figure 5. Proportion of people diagnosed with HIV receiving ART in Europe and Central Asia, 201622
Stage 4. Viral suppression in PLHIV on treatment Data availability In 2016, 31 countries (20 EU/EEA and 11 non-EU/EEA countries) reported on the number of PLHIV who are virally suppressed, compared with 26 countries in 2014 (Figure 3). There was also a significant increase between 2014 and 2016 in the number of countries able to report data for both Stages 3 and 4 of the continuum (Table 13).
Table 13. Number of countries reporting data for both Stage 3 (number on treatment) and Stage 4 (number virally suppressed)
24 2014
18 EU/EEA: Austria, Belgium, Bulgaria, Croatia, Czech Republic, Denmark, Finland, France, Germany, Hungary, Ireland, Luxembourg, Netherlands, Portugal, Romania, Spain,
Sweden, United Kingdom 6 Non-EU/EEA: Armenia, Azerbaijan, Georgia, Kyrgyzstan, Serbia, Switzerland
31 2016
20 EU/EEA: Austria, Belgium, Bulgaria, Croatia, Czech Republic, Denmark, Finland, France, Germany, Greece, Hungary, Italy, Luxembourg, Netherlands, Portugal, Romania, Slovenia, Spain,
Sweden, United Kingdom 11 Non-EU/EEA: Albania23, Armenia, Azerbaijan, Georgia, Kazakhstan, Kyrgyzstan, Moldova,
Montenegro, Serbia, Switzerland, Tajikistan
Data sources Of the 31 countries with data on the number of PLHIV who are virally suppressed, 27 provided information concerning the data source (Table 14). Cohort data was the most frequently reported source of data for Stage 4, used by 44% of countries. Among the remaining countries, 26% identified surveillance data as the data source and 30% other data sources, including clinical records, health insurance systems and special surveys. For all data sources more than 50% of the data reported is from 2015 or 2016.
22 Latest data available reported by countries in March 2016. See Annex 4 showing which year reported data relates to. 23 In Albania, viral load has only been measured for approximately 50% of those on ART.
0%
10%
20%
30%
40%
50%
60%
70%
80%
90%
100%
Regional average 77%
UNAIDS target 90%
Continuum of HIV care SPECIAL REPORT
10
Table 14. Data sources for the number of PLHIV who are virally suppressed in Europe and Central Asia, 2016
Data source Number of countries (n=27)
Countries (EU/EEA & Non-EU/EEA) Year of reported data (Number of countries)
Cohort data 12 (44%) 11 EU/EEA: Austria, Belgium, Bulgaria, Croatia, Denmark, Germany, Greece, Italy, Luxembourg, Netherlands, Sweden 1 Non-EU/EEA: Serbia
2012 (1); 2013 (4); 2014 (3); 2015 (3); 2016 (1)
Surveillance data
7 (26%) 2 EU/EEA: Czech Republic, United Kingdom 5 Non-EU/EEA: Armenia, Georgia, Kyrgyzstan, Montenegro, Tajikistan
2014 (1); 2015 (6)
Other data source
8 (30%) 6 EU/EEA: France, Hungary, Malta, Portugal, Romania, Spain 2 Non-EU/EEA: Azerbaijan, Kazakhstan,
2010 (1); 2014 (3); 2015 (4)
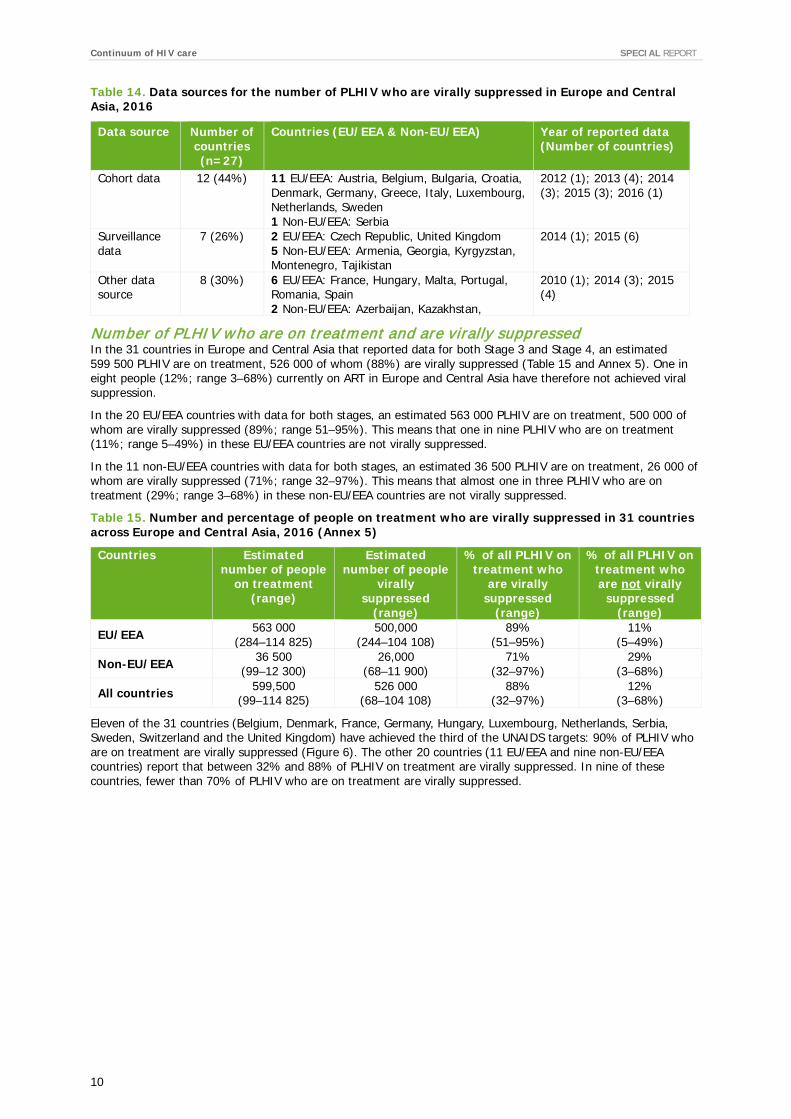
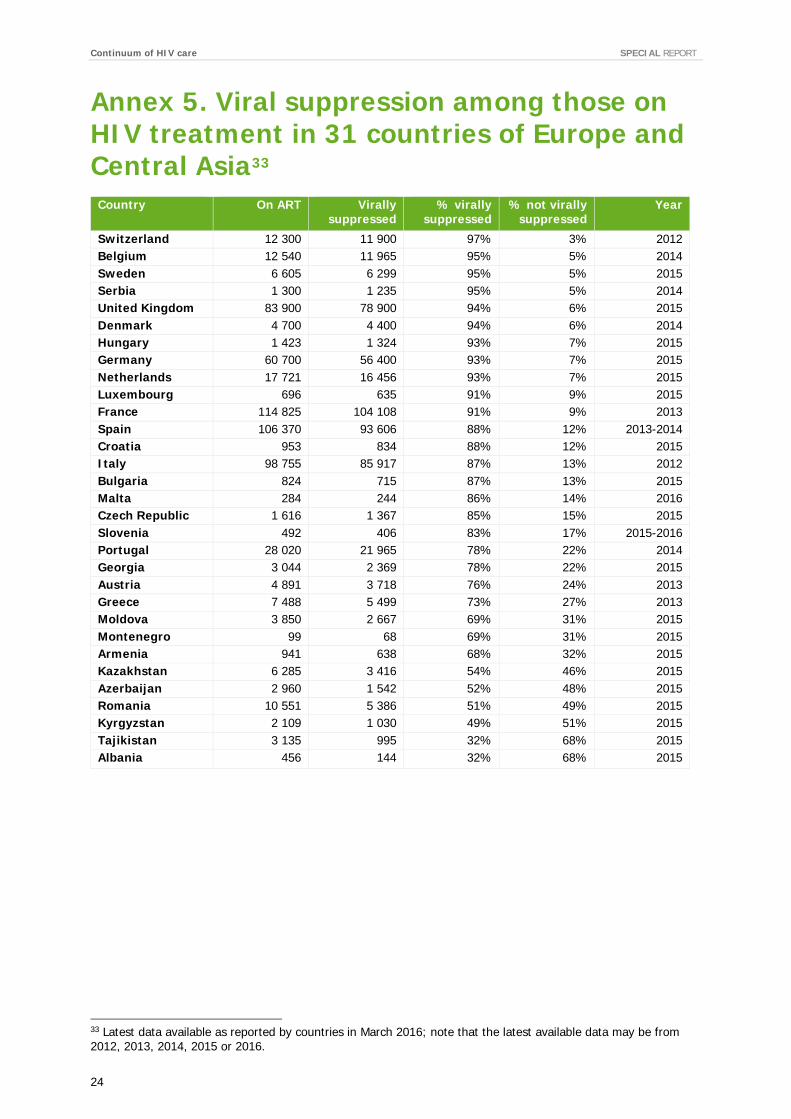
Number of PLHIV who are on treatment and are virally suppressed In the 31 countries in Europe and Central Asia that reported data for both Stage 3 and Stage 4, an estimated 599 500 PLHIV are on treatment, 526 000 of whom (88%) are virally suppressed (Table 15 and Annex 5). One in eight people (12%; range 3–68%) currently on ART in Europe and Central Asia have therefore not achieved viral suppression.
In the 20 EU/EEA countries with data for both stages, an estimated 563 000 PLHIV are on treatment, 500 000 of whom are virally suppressed (89%; range 51–95%). This means that one in nine PLHIV who are on treatment (11%; range 5–49%) in these EU/EEA countries are not virally suppressed.
In the 11 non-EU/EEA countries with data for both stages, an estimated 36 500 PLHIV are on treatment, 26 000 of whom are virally suppressed (71%; range 32–97%). This means that almost one in three PLHIV who are on treatment (29%; range 3–68%) in these non-EU/EEA countries are not virally suppressed.
Table 15. Number and percentage of people on treatment who are virally suppressed in 31 countries across Europe and Central Asia, 2016 (Annex 5)
Countries Estimated number of people
on treatment (range)
Estimated number of people
virally suppressed
(range)
% of all PLHIV on treatment who
are virally suppressed
(range)
% of all PLHIV on treatment who are not virally
suppressed (range)
EU/EEA 563 000 (284–114 825)
500,000 (244–104 108)
89% (51–95%)
11% (5–49%)
Non-EU/EEA 36 500 (99–12 300)
26,000 (68–11 900)
71% (32–97%)
29% (3–68%)
All countries 599,500 (99–114 825)
526 000 (68–104 108)
88% (32–97%)
12% (3–68%)
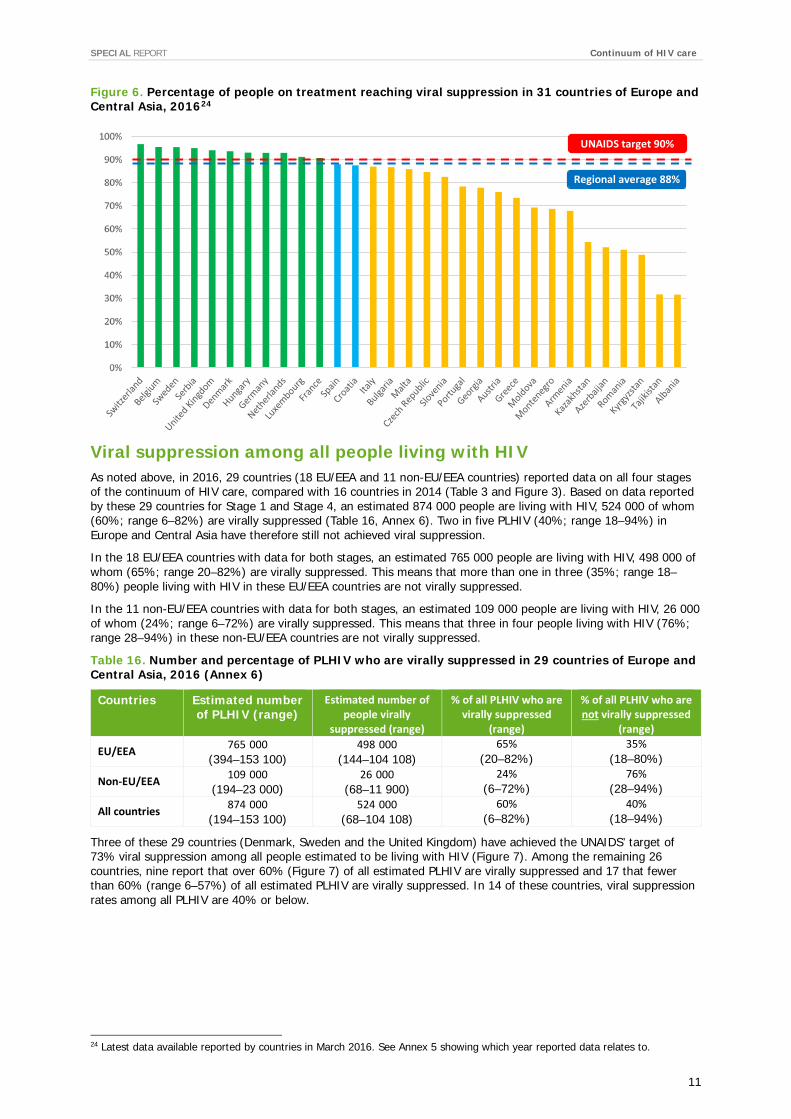
Eleven of the 31 countries (Belgium, Denmark, France, Germany, Hungary, Luxembourg, Netherlands, Serbia, Sweden, Switzerland and the United Kingdom) have achieved the third of the UNAIDS targets: 90% of PLHIV who are on treatment are virally suppressed (Figure 6). The other 20 countries (11 EU/EEA and nine non-EU/EEA countries) report that between 32% and 88% of PLHIV on treatment are virally suppressed. In nine of these countries, fewer than 70% of PLHIV who are on treatment are virally suppressed.
SPECIAL REPORT Continuum of HIV care
11
Figure 6. Percentage of people on treatment reaching viral suppression in 31 countries of Europe and Central Asia, 201624
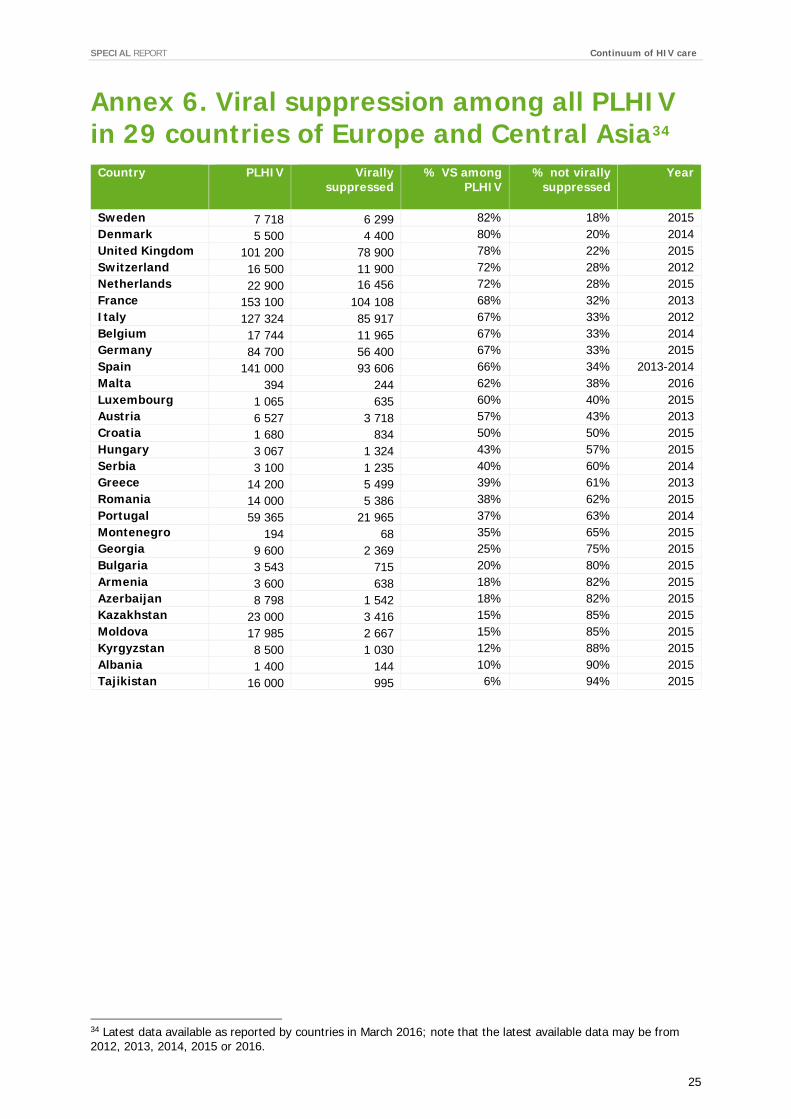
Viral suppression among all people living with HIV As noted above, in 2016, 29 countries (18 EU/EEA and 11 non-EU/EEA countries) reported data on all four stages of the continuum of HIV care, compared with 16 countries in 2014 (Table 3 and Figure 3). Based on data reported by these 29 countries for Stage 1 and Stage 4, an estimated 874 000 people are living with HIV, 524 000 of whom (60%; range 6–82%) are virally suppressed (Table 16, Annex 6). Two in five PLHIV (40%; range 18–94%) in Europe and Central Asia have therefore still not achieved viral suppression.
In the 18 EU/EEA countries with data for both stages, an estimated 765 000 people are living with HIV, 498 000 of whom (65%; range 20–82%) are virally suppressed. This means that more than one in three (35%; range 18–80%) people living with HIV in these EU/EEA countries are not virally suppressed.
In the 11 non-EU/EEA countries with data for both stages, an estimated 109 000 people are living with HIV, 26 000 of whom (24%; range 6–72%) are virally suppressed. This means that three in four people living with HIV (76%; range 28–94%) in these non-EU/EEA countries are not virally suppressed.
Table 16. Number and percentage of PLHIV who are virally suppressed in 29 countries of Europe and Central Asia, 2016 (Annex 6)
Countries Estimated number of PLHIV (range)
Estimated number of people virally
suppressed (range)
% of all PLHIV who are virally suppressed
(range)
% of all PLHIV who are not virally suppressed
(range)
EU/EEA 765 000 (394–153 100)
498 000 (144–104 108)
65% (20–82%)
35% (18–80%)
Non-EU/EEA 109 000 (194–23 000)
26 000 (68–11 900)
24% (6–72%)
76% (28–94%)
All countries 874 000 (194–153 100)
524 000 (68–104 108)
60% (6–82%)
40% (18–94%)
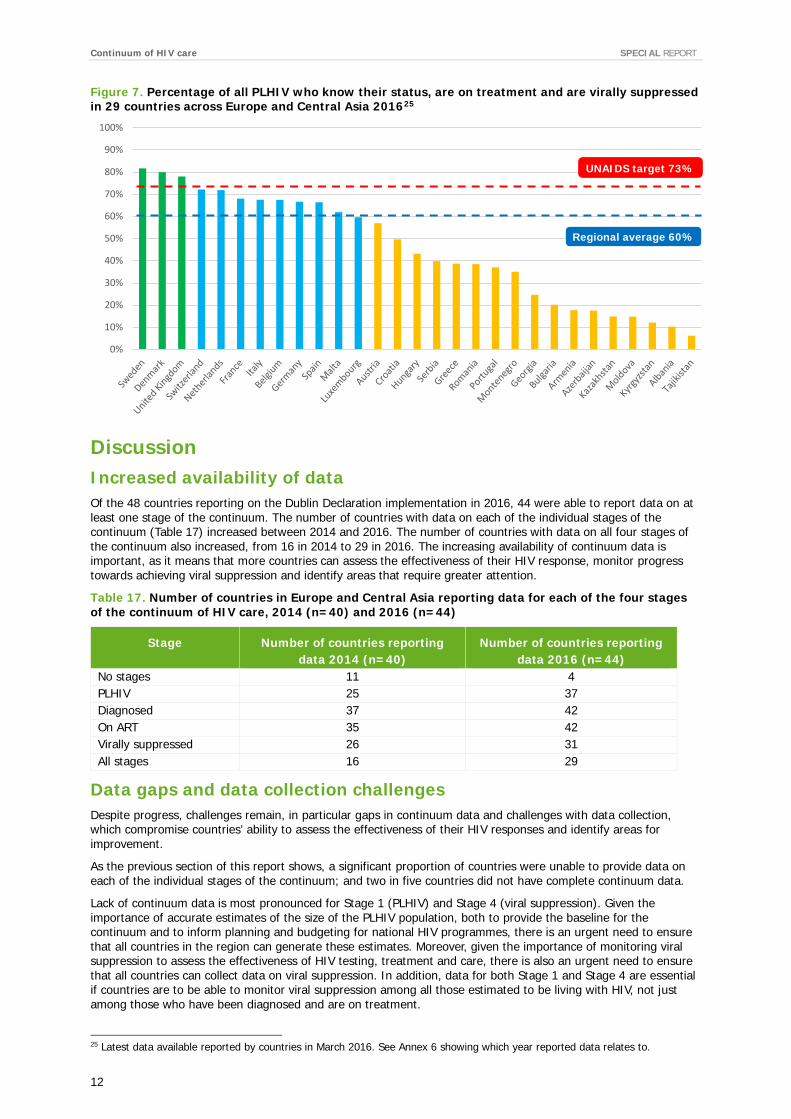
Three of these 29 countries (Denmark, Sweden and the United Kingdom) have achieved the UNAIDS’ target of 73% viral suppression among all people estimated to be living with HIV (Figure 7). Among the remaining 26 countries, nine report that over 60% (Figure 7) of all estimated PLHIV are virally suppressed and 17 that fewer than 60% (range 6–57%) of all estimated PLHIV are virally suppressed. In 14 of these countries, viral suppression rates among all PLHIV are 40% or below.
24 Latest data available reported by countries in March 2016. See Annex 5 showing which year reported data relates to.
UNAIDS target 90%
Regional average 88%
Continuum of HIV care SPECIAL REPORT
12
Figure 7. Percentage of all PLHIV who know their status, are on treatment and are virally suppressed in 29 countries across Europe and Central Asia 201625
Discussion Increased availability of data Of the 48 countries reporting on the Dublin Declaration implementation in 2016, 44 were able to report data on at least one stage of the continuum. The number of countries with data on each of the individual stages of the continuum (Table 17) increased between 2014 and 2016. The number of countries with data on all four stages of the continuum also increased, from 16 in 2014 to 29 in 2016. The increasing availability of continuum data is important, as it means that more countries can assess the effectiveness of their HIV response, monitor progress towards achieving viral suppression and identify areas that require greater attention.
Table 17. Number of countries in Europe and Central Asia reporting data for each of the four stages of the continuum of HIV care, 2014 (n=40) and 2016 (n=44)
Stage Number of countries reporting data 2014 (n=40)
Number of countries reporting data 2016 (n=44)
No stages 11 4 PLHIV 25 37 Diagnosed 37 42 On ART 35 42 Virally suppressed 26 31 All stages 16 29
Data gaps and data collection challenges Despite progress, challenges remain, in particular gaps in continuum data and challenges with data collection, which compromise countries’ ability to assess the effectiveness of their HIV responses and identify areas for improvement.
As the previous section of this report shows, a significant proportion of countries were unable to provide data on each of the individual stages of the continuum; and two in five countries did not have complete continuum data.
Lack of continuum data is most pronounced for Stage 1 (PLHIV) and Stage 4 (viral suppression). Given the importance of accurate estimates of the size of the PLHIV population, both to provide the baseline for the continuum and to inform planning and budgeting for national HIV programmes, there is an urgent need to ensure that all countries in the region can generate these estimates. Moreover, given the importance of monitoring viral suppression to assess the effectiveness of HIV testing, treatment and care, there is also an urgent need to ensure that all countries can collect data on viral suppression. In addition, data for both Stage 1 and Stage 4 are essential if countries are to be able to monitor viral suppression among all those estimated to be living with HIV, not just among those who have been diagnosed and are on treatment.
25 Latest data available reported by countries in March 2016. See Annex 6 showing which year reported data relates to.
0%
10%
20%
30%
40%
50%
60%
70%
80%
90%
100%
UNAIDS target 73%
Regional average 60%
SPECIAL REPORT Continuum of HIV care
13
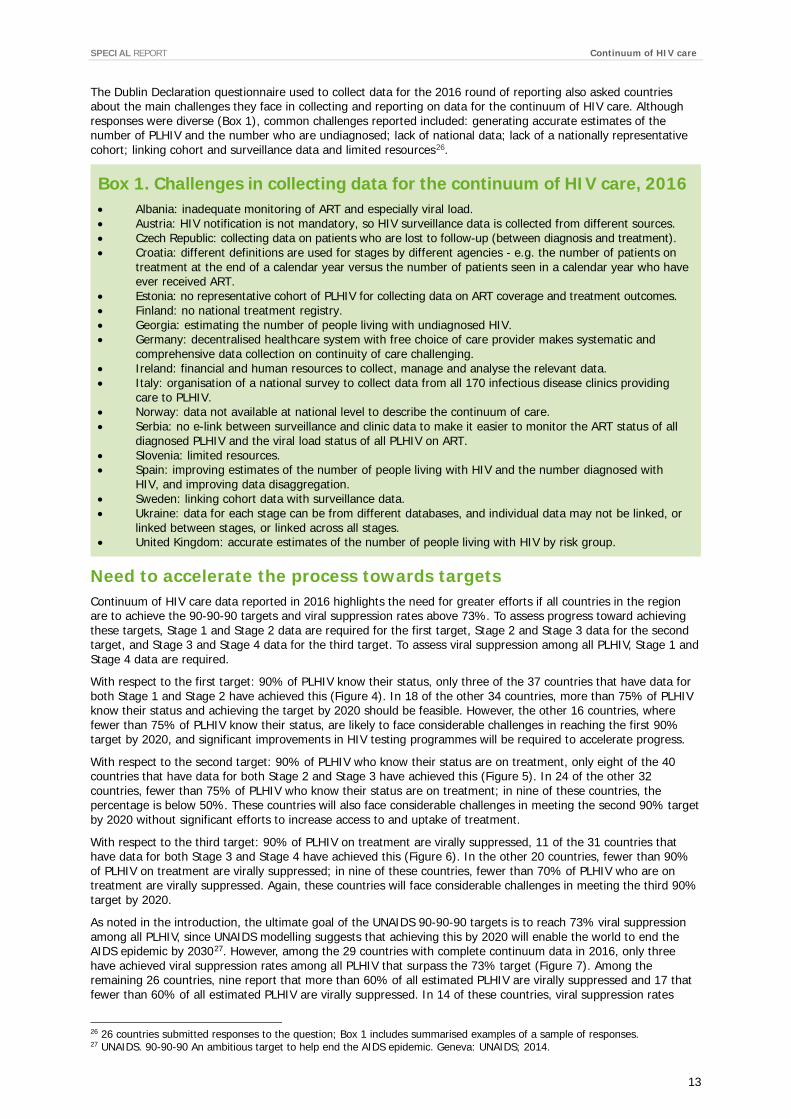
The Dublin Declaration questionnaire used to collect data for the 2016 round of reporting also asked countries about the main challenges they face in collecting and reporting on data for the continuum of HIV care. Although responses were diverse (Box 1), common challenges reported included: generating accurate estimates of the number of PLHIV and the number who are undiagnosed; lack of national data; lack of a nationally representative cohort; linking cohort and surveillance data and limited resources26.
Need to accelerate the process towards targets Continuum of HIV care data reported in 2016 highlights the need for greater efforts if all countries in the region are to achieve the 90-90-90 targets and viral suppression rates above 73%. To assess progress toward achieving these targets, Stage 1 and Stage 2 data are required for the first target, Stage 2 and Stage 3 data for the second target, and Stage 3 and Stage 4 data for the third target. To assess viral suppression among all PLHIV, Stage 1 and Stage 4 data are required.
With respect to the first target: 90% of PLHIV know their status, only three of the 37 countries that have data for both Stage 1 and Stage 2 have achieved this (Figure 4). In 18 of the other 34 countries, more than 75% of PLHIV know their status and achieving the target by 2020 should be feasible. However, the other 16 countries, where fewer than 75% of PLHIV know their status, are likely to face considerable challenges in reaching the first 90% target by 2020, and significant improvements in HIV testing programmes will be required to accelerate progress.
With respect to the second target: 90% of PLHIV who know their status are on treatment, only eight of the 40 countries that have data for both Stage 2 and Stage 3 have achieved this (Figure 5). In 24 of the other 32 countries, fewer than 75% of PLHIV who know their status are on treatment; in nine of these countries, the percentage is below 50%. These countries will also face considerable challenges in meeting the second 90% target by 2020 without significant efforts to increase access to and uptake of treatment.
With respect to the third target: 90% of PLHIV on treatment are virally suppressed, 11 of the 31 countries that have data for both Stage 3 and Stage 4 have achieved this (Figure 6). In the other 20 countries, fewer than 90% of PLHIV on treatment are virally suppressed; in nine of these countries, fewer than 70% of PLHIV who are on treatment are virally suppressed. Again, these countries will face considerable challenges in meeting the third 90% target by 2020.
As noted in the introduction, the ultimate goal of the UNAIDS 90-90-90 targets is to reach 73% viral suppression among all PLHIV, since UNAIDS modelling suggests that achieving this by 2020 will enable the world to end the AIDS epidemic by 203027. However, among the 29 countries with complete continuum data in 2016, only three have achieved viral suppression rates among all PLHIV that surpass the 73% target (Figure 7). Among the remaining 26 countries, nine report that more than 60% of all estimated PLHIV are virally suppressed and 17 that fewer than 60% of all estimated PLHIV are virally suppressed. In 14 of these countries, viral suppression rates
26 26 countries submitted responses to the question; Box 1 includes summarised examples of a sample of responses. 27 UNAIDS. 90-90-90 An ambitious target to help end the AIDS epidemic. Geneva: UNAIDS; 2014.
Box 1. Challenges in collecting data for the continuum of HIV care, 2016 • Albania: inadequate monitoring of ART and especially viral load. • Austria: HIV notification is not mandatory, so HIV surveillance data is collected from different sources. • Czech Republic: collecting data on patients who are lost to follow-up (between diagnosis and treatment). • Croatia: different definitions are used for stages by different agencies - e.g. the number of patients on
treatment at the end of a calendar year versus the number of patients seen in a calendar year who have ever received ART.
• Estonia: no representative cohort of PLHIV for collecting data on ART coverage and treatment outcomes. • Finland: no national treatment registry. • Georgia: estimating the number of people living with undiagnosed HIV. • Germany: decentralised healthcare system with free choice of care provider makes systematic and
comprehensive data collection on continuity of care challenging. • Ireland: financial and human resources to collect, manage and analyse the relevant data. • Italy: organisation of a national survey to collect data from all 170 infectious disease clinics providing
care to PLHIV. • Norway: data not available at national level to describe the continuum of care. • Serbia: no e-link between surveillance and clinic data to make it easier to monitor the ART status of all
diagnosed PLHIV and the viral load status of all PLHIV on ART. • Slovenia: limited resources. • Spain: improving estimates of the number of people living with HIV and the number diagnosed with
HIV, and improving data disaggregation. • Sweden: linking cohort data with surveillance data. • Ukraine: data for each stage can be from different databases, and individual data may not be linked, or
linked between stages, or linked across all stages. • United Kingdom: accurate estimates of the number of people living with HIV by risk group.
Continuum of HIV care SPECIAL REPORT
14
among all PLHIV are 40% or below. Significant improvement is required at each stage of the continuum of HIV to accelerate progress in these 14 countries if they are to progress towards the 73% target.
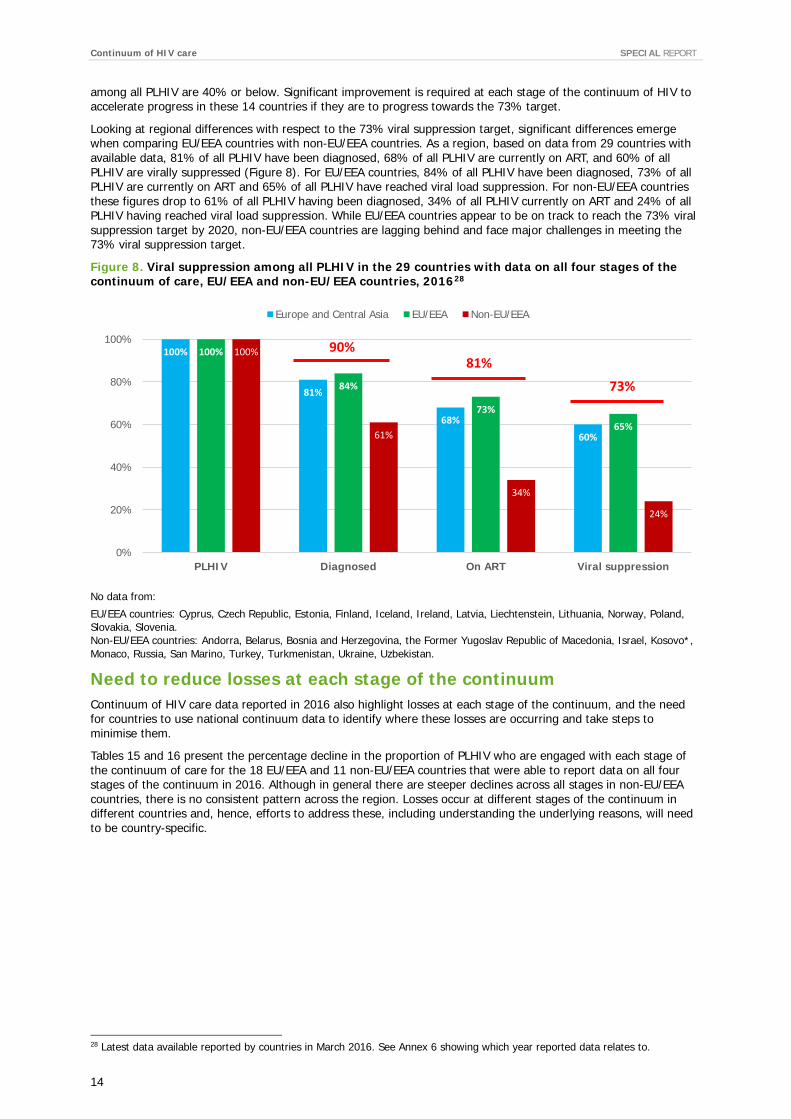
Looking at regional differences with respect to the 73% viral suppression target, significant differences emerge when comparing EU/EEA countries with non-EU/EEA countries. As a region, based on data from 29 countries with available data, 81% of all PLHIV have been diagnosed, 68% of all PLHIV are currently on ART, and 60% of all PLHIV are virally suppressed (Figure 8). For EU/EEA countries, 84% of all PLHIV have been diagnosed, 73% of all PLHIV are currently on ART and 65% of all PLHIV have reached viral load suppression. For non-EU/EEA countries these figures drop to 61% of all PLHIV having been diagnosed, 34% of all PLHIV currently on ART and 24% of all PLHIV having reached viral load suppression. While EU/EEA countries appear to be on track to reach the 73% viral suppression target by 2020, non-EU/EEA countries are lagging behind and face major challenges in meeting the 73% viral suppression target.
Figure 8. Viral suppression among all PLHIV in the 29 countries with data on all four stages of the continuum of care, EU/EEA and non-EU/EEA countries, 201628
No data from:
EU/EEA countries: Cyprus, Czech Republic, Estonia, Finland, Iceland, Ireland, Latvia, Liechtenstein, Lithuania, Norway, Poland, Slovakia, Slovenia. Non-EU/EEA countries: Andorra, Belarus, Bosnia and Herzegovina, the Former Yugoslav Republic of Macedonia, Israel, Kosovo*, Monaco, Russia, San Marino, Turkey, Turkmenistan, Ukraine, Uzbekistan.
Need to reduce losses at each stage of the continuum Continuum of HIV care data reported in 2016 also highlight losses at each stage of the continuum, and the need for countries to use national continuum data to identify where these losses are occurring and take steps to minimise them.
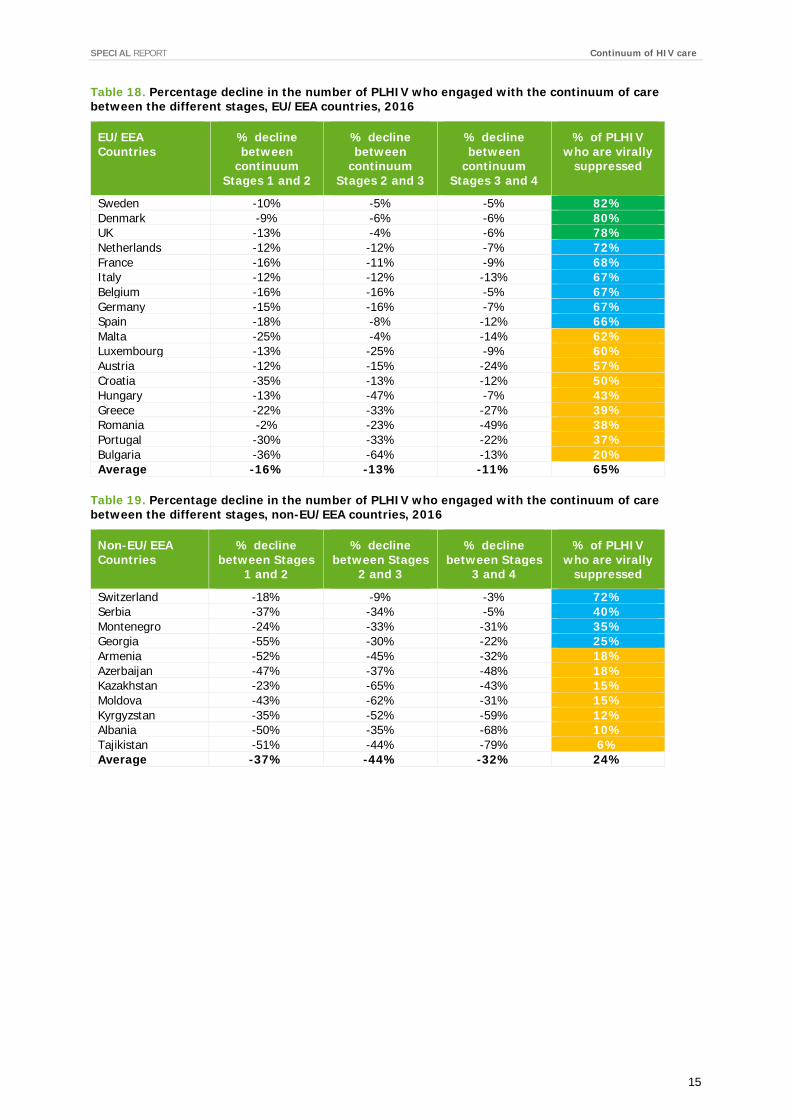
Tables 15 and 16 present the percentage decline in the proportion of PLHIV who are engaged with each stage of the continuum of care for the 18 EU/EEA and 11 non-EU/EEA countries that were able to report data on all four stages of the continuum in 2016. Although in general there are steeper declines across all stages in non-EU/EEA countries, there is no consistent pattern across the region. Losses occur at different stages of the continuum in different countries and, hence, efforts to address these, including understanding the underlying reasons, will need to be country-specific.
28 Latest data available reported by countries in March 2016. See Annex 6 showing which year reported data relates to.
100%
81%
68%
60%
100%
84%
73%
65%
100%
61%
34%
24%
0%
20%
40%
60%
80%
100%
PLHIV Diagnosed On ART Viral suppression
Europe and Central Asia EU/EEA Non-EU/EEA
90% 81%
73%
SPECIAL REPORT Continuum of HIV care
15
Table 18. Percentage decline in the number of PLHIV who engaged with the continuum of care between the different stages, EU/EEA countries, 2016
EU/EEA Countries
% decline between
continuum Stages 1 and 2
% decline between
continuum Stages 2 and 3
% decline between
continuum Stages 3 and 4
% of PLHIV who are virally
suppressed
Sweden -10% -5% -5% 82% Denmark -9% -6% -6% 80% UK -13% -4% -6% 78% Netherlands -12% -12% -7% 72% France -16% -11% -9% 68% Italy -12% -12% -13% 67% Belgium -16% -16% -5% 67% Germany -15% -16% -7% 67% Spain -18% -8% -12% 66% Malta -25% -4% -14% 62% Luxembourg -13% -25% -9% 60% Austria -12% -15% -24% 57% Croatia -35% -13% -12% 50% Hungary -13% -47% -7% 43% Greece -22% -33% -27% 39% Romania -2% -23% -49% 38% Portugal -30% -33% -22% 37% Bulgaria -36% -64% -13% 20% Average -16% -13% -11% 65%
Table 19. Percentage decline in the number of PLHIV who engaged with the continuum of care between the different stages, non-EU/EEA countries, 2016
Non-EU/EEA Countries
% decline between Stages
1 and 2
% decline between Stages
2 and 3
% decline between Stages
3 and 4
% of PLHIV who are virally
suppressed
Switzerland -18% -9% -3% 72% Serbia -37% -34% -5% 40% Montenegro -24% -33% -31% 35% Georgia -55% -30% -22% 25% Armenia -52% -45% -32% 18% Azerbaijan -47% -37% -48% 18% Kazakhstan -23% -65% -43% 15% Moldova -43% -62% -31% 15% Kyrgyzstan -35% -52% -59% 12% Albania -50% -35% -68% 10% Tajikistan -51% -44% -79% 6% Average -37% -44% -32% 24%
Continuum of HIV care SPECIAL REPORT
16
Conclusions Europe and Central Asian countries need to improve the availability of continuum data, use the continuum of HIV care framework to monitor progress and identify areas for improvement, and take country-specific measures to strengthen HIV testing, treatment and care in order to accelerate progress towards the UNAIDS 90-90-90 targets.
The high proportion of people with HIV who do not know their status or who are diagnosed late reflects insufficient rates of testing, gaps in testing services or services not reaching those most at risk. There is limited implementation of alternative approaches that have been known to work, including community-based testing, home-sampling and self-testing, that could help increase uptake and encourage earlier testing by those most at risk.
The high proportion of people who have been diagnosed but who are not on treatment, especially in non-EU/EEA countries, reflects outdated treatment threshold policies and, in some places, legal and policy barriers, health system resource challenges and social and cultural factors.
Although the majority of people on treatment in the region are achieving viral suppression, the proportion varies significantly between countries. This suggests that more attention is needed to improve the quality of HIV treatment and care through better clinical follow-up, patient retention and adherence policies.
There are significant differences between EU/EEA countries and non-EU/EEA countries with regard to viral suppression rates among all people estimated to be living with HIV. While two out of three people living with HIV have achieved viral suppression in EU/EEA countries, only one in four people living with HIV in non-EU/EEA countries have achieved viral suppression. These inequalities in health between sub-regions in Europe and Central Asia must be addressed.
Priority options for action • Strengthen HIV testing and case ascertainment programmes and reduce barriers to testing, in order to
reduce the number of PLHIV with undiagnosed HIV infection and reduce the length of time from infection to linkage to care.
• Ensure national HIV testing policies incorporate innovative approaches to HIV testing, including community-based testing, self-testing and home sampling; involve the affected community in implementation of these policies, and allocate adequate resources to support the implementation and availability of these approaches.
• Reduce missed opportunities for HIV diagnosis in health services, particularly in primary care and other clinical settings; improve awareness among clinicians and other healthcare staff, introduce more routine or opt-out testing where appropriate and implement indicator condition guided testing.
• Eliminate treatment protocols based on CD4 counts and adopt ‘test and treat’ policies in all countries in line with the European AIDS Clinical Society and WHO guidelines29 30 since early initiation of treatment improves the health outcomes of PLHIV and reduces their viral load, which in turn reduces the risk of transmitting HIV to others.
• Reduce barriers to accessing treatment, including inadequate treatment programme coverage, weak referral mechanisms or links to other health and support services, and tackle stigma and discrimination, including among health professionals.
• Increase attention to the quality of HIV treatment and care, including ensuring adequate diagnostic support and similar issues that influence patient achievement of viral suppression, including retention and adherence, close monitoring for HIV drug resistance and the availability of second-line combination antiretroviral drugs.
29 European AIDS Clinical Society Guidelines. Version 8.2, January 2017. http://www.eacsociety.org/files/guidelines_8.2-english.pdf 30 WHO. Guidelines on When to Start Antiretroviral Therapy and Pre-Exposure Prophylaxis for HIV Geneva: World Health Organization, 2015.
SPECIAL REPORT Continuum of HIV care
17
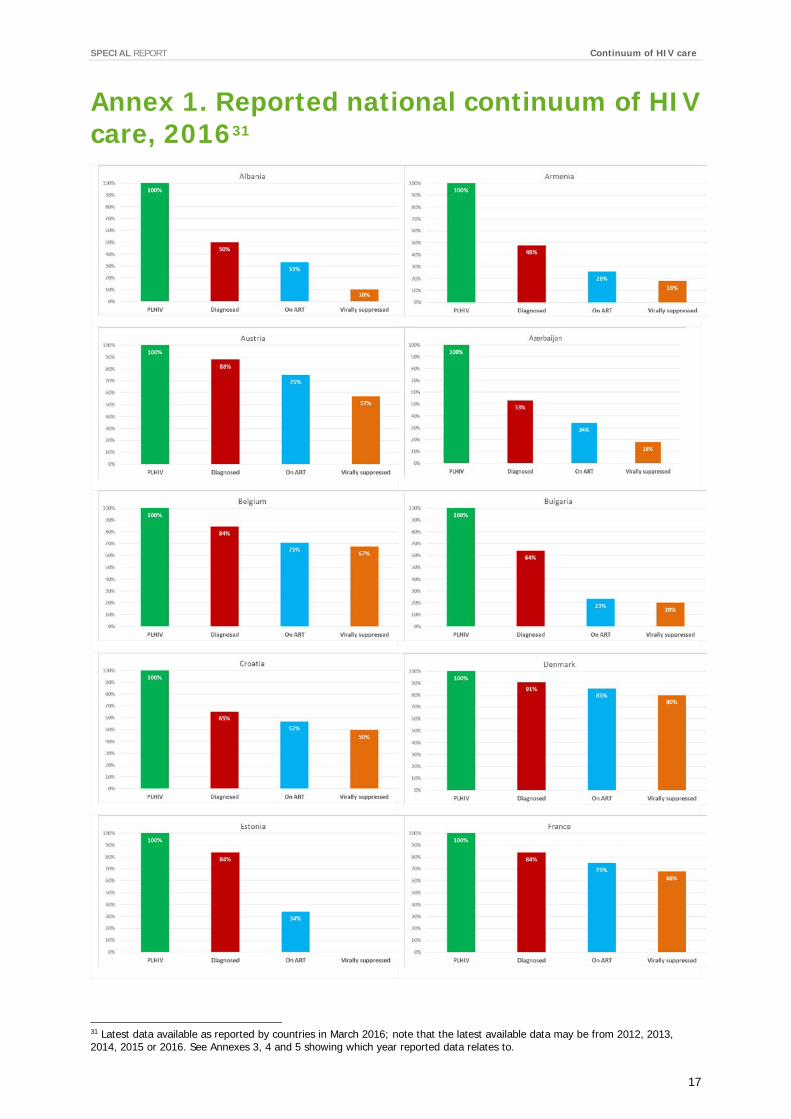
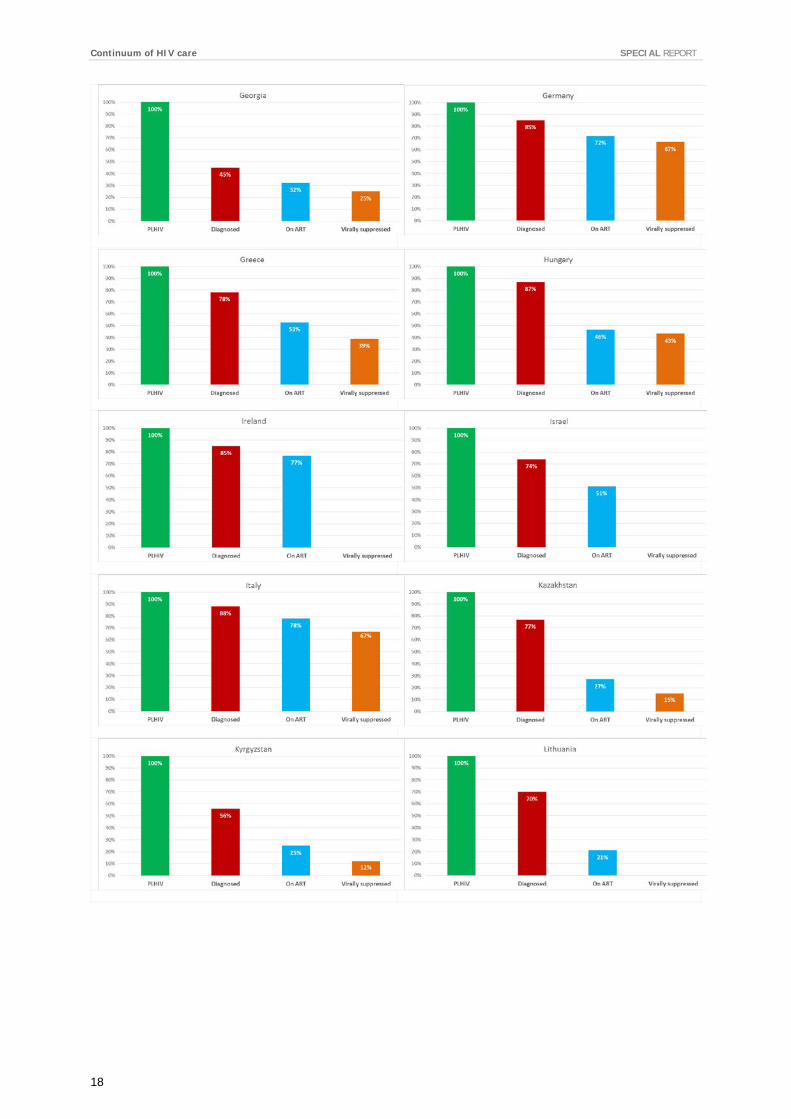
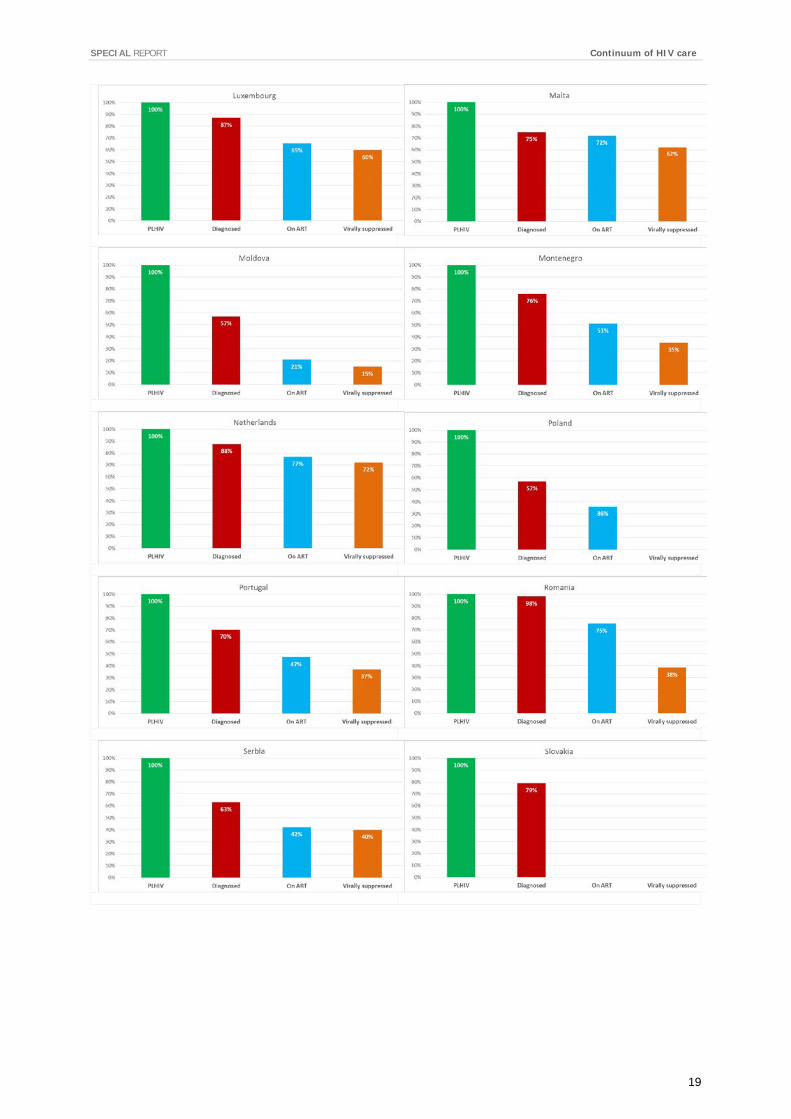
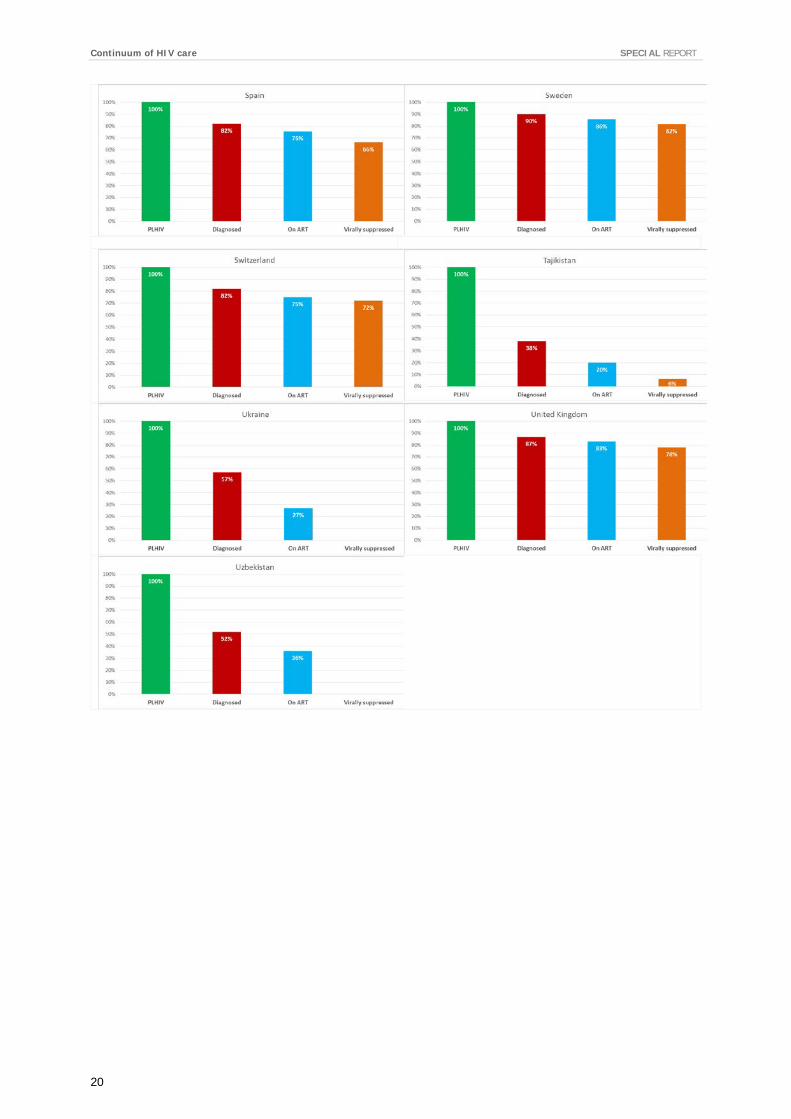
Annex 1. Reported national continuum of HIV care, 201631
31 Latest data available as reported by countries in March 2016; note that the latest available data may be from 2012, 2013, 2014, 2015 or 2016. See Annexes 3, 4 and 5 showing which year reported data relates to.
Continuum of HIV care SPECIAL REPORT
18
SPECIAL REPORT Continuum of HIV care
19
Continuum of HIV care SPECIAL REPORT
20
SPECIAL REPORT Continuum of HIV care
21
Annex 2. Data sources on the continuum of HIV care in Europe and Central Asia, 2016
Stage/Data source
Number of countries
(%)
Countries (EU/EEA & Non-EU/EEA)
Year of reported data (Number of countries)
Stage 1 37 ECDC HIV modelling tool
8 (22%)
8 EU/EEA: Austria, Belgium, Croatia, Greece, Luxembourg, Malta, Netherlands, Slovakia
2013 (2); 2014 (1); 2015 (4); 2016 (1)
Spectrum modelling tool
17 (46%)
6 EU/EEA: Estonia, Lithuania, Poland, Portugal, Romania, Spain 11 Non-EU/EEA: Armenia, Azerbaijan, Georgia, Kazakhstan, Kyrgyzstan, Moldova, Serbia, Tajikistan, Albania, Ukraine, Uzbekistan
2013 (2); 2014 (3); 2015 (10); 2016 (2)
Other modelling tool
3 (8%)
3 EU/EEA: Bulgaria, Germany, United Kingdom 2014 (1); 2015 (2)
Other estimate method
9 (24%)
6 EU/EEA: Denmark, France, Hungary, Ireland, Italy, Sweden 3 Non-EU/EEA: Israel, Montenegro, Switzerland
2012 (1); 2013 (1); 2014 (1); 2015 (6)
Stage 2 37 Cohort data 8
(22%) 8 EU/EEA: Austria, Belgium, Bulgaria, Denmark, Ireland, Luxembourg, Netherlands, Sweden
2013 (2); 2014 (1); 2015 (4); 2016 (1)
Surveillance data
22 (59%)
12 EU/EEA: Croatia, Cyprus, Czech Republic, Estonia, Germany, Greece, Malta, Portugal, Slovakia, Slovenia, Spain, United Kingdom 10 Non-EU/EEA: Albania, Armenia, Georgia, Kosovo (UNSC 1244), Kyrgyzstan, Montenegro, Serbia, Tajikistan, Ukraine, Uzbekistan
2011 (1); 2013 (1); 2014 (4); 2015 (16)
Other data source
7 (19%)
3 EU/EEA: France, Italy, Romania 4 Non-EU/EEA: Azerbaijan, Kazakhstan, Moldova, Switzerland
2010 (1); 2012 (2); 2014 (1); 2015 (2); No year (1)
Stage 3 31 Cohort data 8
(26%) 8 EU/EEA: Austria, Belgium, Bulgaria, Croatia, Denmark, Luxembourg, Netherlands, Sweden
2013 (2); 2014 (2); 2015 (3); 2016 (1)
Surveillance data
9 (29%)
3 EU/EEA: Czech Republic, Greece, United Kingdom 6 Non-EU/EEA: Georgia, Kyrgyzstan, Montenegro, Tajikistan, Ukraine, Uzbekistan
2013 (1); 2015 (8)
Other data source
14 (45%)
9 EU/EEA: France, Germany, Ireland, Italy, Malta, Norway, Portugal, Romania, Spain 5 Non-EU/EEA: Azerbaijan, Kazakhstan, Moldova, Serbia, Switzerland
2010 (1); 2012 (2); 2014 (4); 2015 (7)
Stage 4 27 Cohort data 12
(44%) 11 EU/EEA: Austria, Belgium, Bulgaria, Croatia, Denmark, Germany, Greece, Italy, Luxembourg, Netherlands, Sweden 1 Non-EU/EEA: Serbia
2012 (1); 2013 (4); 2014 (3); 2015 (3); 2016 (1)
Surveillance data
7 (26%)
2 EU/EEA: Czech Republic, United Kingdom 5 Non-EU/EEA: Armenia, Georgia, Kyrgyzstan, Montenegro, Tajikistan
2014 (1); 2015 (6)
Other data source
8 (30%)
6 EU/EEA: France, Hungary, Malta, Portugal, Romania, Spain 2 Non-EU/EEA: Azerbaijan, Kazakhstan,
2010 (1); 2014 (3); 2015 (4)
Continuum of HIV care SPECIAL REPORT
22
Annex 3. Proportion of people living with HIV who have been diagnosed in 37 countries of Europe and Central Asia
Country PLHIV Diagnosed Percentage diagnosed
Percentage undiagnosed
Year
Romania 14 000 13 766 98% 2% 2015
Denmark 5 500 5 000 91% 9% 2014
Sweden 7 718 6 946 90% 10% 2015
Italy 127 324 112 222 88% 12% 2012
Austria 6 527 5 745 88% 12% 2013
Netherlands 22 900 20 083 88% 12% 2015
Luxembourg 1 065 927 87% 13% 2015
Hungary 3 067 2 667 87% 13% 2015
United Kingdom 101 200 87 700 87% 13% 2015
Germany 84 700 72 000 85% 15% 2015
Ireland 6 180 5 253 85% 15% 2015
Belgium 17 744 14 977 84% 16% 2014
Estonia 11 000 9 263 84% 16% 2015-2016
France 153 100 128 300 84% 16% 2013
Spain 141 000 115 620 82% 18% 2013-2014
Switzerland 16 500 13 500 82% 18% 2012
Slovakia 850 674 79% 21% 2015
Greece 14 200 11 096 78% 22% 2013
Kazakhstan 23 000 17 726 77% 23% 2015
Montenegro 194 147 76% 24% 2015
Malta 394 295 75% 25% 2015
Israel 9 720 7 171 74% 26% 2015
Portugal 59 365 41 793 70% 30% 2014
Lithuania 3 100 2 173 70% 30% 2015
Croatia 1 680 1 097 65% 35% 2015
Bulgaria 3 543 2 267 64% 36% 2015
Serbia 3 100 1 956 63% 37% 2014
Poland 35 000 19 915 57% 43% 2015-2016
Moldova 17 985 10 213 57% 43% 2015
Ukraine 223 000 126 604 57% 43% 2015
Kyrgyzstan 8 500 4 767 56% 44% 2015
Azerbaijan 8 798 4 704 53% 47% 2015
Uzbekistan 36 553 19 026 52% 48% 2015
Albania 1 400 698 50% 50% 2015
Armenia 3 600 1 714 48% 52% 2015
Georgia 9 600 4 339 45% 55% 2015
Tajikistan 16 000 6 117 38% 62% 2015
SPECIAL REPORT Continuum of HIV care
23
Annex 4. ART coverage among people that have been diagnosed with HIV in 40 countries of Europe and Central Asia32
Country Number of people
diagnosed
Number of people on
ART
% on ART out of those
diagnosed
% not on ART out of those
diagnosed
Year
Malta 295 284 96% 4% 2016 United Kingdom 87 700 83 900 96% 4% 2015 Sweden 6 946 6 605 95% 5% 2015 Denmark 5 000 4 700 94% 6% 2014 Spain 115620 106 370 92% 8% 2011-2014 Switzerland 13 500 12 300 91% 9% 2012 Slovenia 541 492 91% 9% 2015-2016 Ireland 5 253 4 728 90% 10% 2015 France 128 300 114 825 89% 11% 2013 Italy 112 222 98 755 88% 12% 2012 Netherlands 20 083 17 721 88% 12% 2015 Croatia 1 097 953 87% 13% 2015 Austria 5 745 4 891 85% 15% 2013 Germany 72 000 60 700 84% 16% 2015 Belgium 14 977 12 540 84% 16% 2014 Romania 13 766 10 551 77% 23% 2015 Luxembourg 927 696 75% 25% 2015 Czech Republic 2 281 1 616 71% 29% 2015 Georgia 4 339 3 044 70% 30% 2015 Uzbekistan 19 026 13 186 69% 31% 2015 Israel 7 171 4 928 69% 31% 2015 Greece 11 096 7 488 67% 33% 2013 Montenegro 147 99 67% 33% 2015 Portugal 41 793 28 020 67% 33% 2014 Serbia 1 956 1 300 66% 34% 2014 Albania 698 456 65% 35% 2015 Azerbaijan 4 704 2 960 63% 37% 2015 Poland 19 915 12 465 63% 37% 2015-2016 Armenia 1 714 941 55% 45% 2015 Hungary 2 667 1 423 53% 47% 2015 Tajikistan 6 117 3 135 51% 49% 2015 Ukraine 126 604 60 753 48% 52% 2015 Kyrgyzstan 4 767 2 109 44% 56% 2015 Estonia 9 263 3 715 40% 60% 2015 Moldova 10 213 3 850 38% 62% 2015 Bulgaria 2 267 824 36% 64% 2015-2016 Kazakhstan 17 726 6 285 35% 65% 2015 Kosovo 46 14 30% 70% 2015 Lithuania 2 173 646 30% 70% 2015 Latvia 5 091 1 388 27% 73% 2015
32 Latest data available as reported by countries in March 2016; note that the latest available data may be from 2012, 2013, 2014, 2015 or 2016.
Continuum of HIV care SPECIAL REPORT
24
Annex 5. Viral suppression among those on HIV treatment in 31 countries of Europe and Central Asia33
Country On ART Virally suppressed
% virally suppressed
% not virally suppressed
Year
Switzerland 12 300 11 900 97% 3% 2012 Belgium 12 540 11 965 95% 5% 2014 Sweden 6 605 6 299 95% 5% 2015 Serbia 1 300 1 235 95% 5% 2014 United Kingdom 83 900 78 900 94% 6% 2015 Denmark 4 700 4 400 94% 6% 2014 Hungary 1 423 1 324 93% 7% 2015 Germany 60 700 56 400 93% 7% 2015 Netherlands 17 721 16 456 93% 7% 2015 Luxembourg 696 635 91% 9% 2015 France 114 825 104 108 91% 9% 2013 Spain 106 370 93 606 88% 12% 2013-2014 Croatia 953 834 88% 12% 2015 Italy 98 755 85 917 87% 13% 2012 Bulgaria 824 715 87% 13% 2015 Malta 284 244 86% 14% 2016 Czech Republic 1 616 1 367 85% 15% 2015 Slovenia 492 406 83% 17% 2015-2016 Portugal 28 020 21 965 78% 22% 2014 Georgia 3 044 2 369 78% 22% 2015 Austria 4 891 3 718 76% 24% 2013 Greece 7 488 5 499 73% 27% 2013 Moldova 3 850 2 667 69% 31% 2015 Montenegro 99 68 69% 31% 2015 Armenia 941 638 68% 32% 2015 Kazakhstan 6 285 3 416 54% 46% 2015 Azerbaijan 2 960 1 542 52% 48% 2015 Romania 10 551 5 386 51% 49% 2015 Kyrgyzstan 2 109 1 030 49% 51% 2015 Tajikistan 3 135 995 32% 68% 2015 Albania 456 144 32% 68% 2015
33 Latest data available as reported by countries in March 2016; note that the latest available data may be from 2012, 2013, 2014, 2015 or 2016.
SPECIAL REPORT Continuum of HIV care
25
Annex 6. Viral suppression among all PLHIV in 29 countries of Europe and Central Asia34
Country PLHIV Virally suppressed
% VS among PLHIV
% not virally suppressed
Year
Sweden 7 718 6 299 82% 18% 2015 Denmark 5 500 4 400 80% 20% 2014 United Kingdom 101 200 78 900 78% 22% 2015 Switzerland 16 500 11 900 72% 28% 2012 Netherlands 22 900 16 456 72% 28% 2015 France 153 100 104 108 68% 32% 2013 Italy 127 324 85 917 67% 33% 2012 Belgium 17 744 11 965 67% 33% 2014 Germany 84 700 56 400 67% 33% 2015 Spain 141 000 93 606 66% 34% 2013-2014 Malta 394 244 62% 38% 2016 Luxembourg 1 065 635 60% 40% 2015 Austria 6 527 3 718 57% 43% 2013 Croatia 1 680 834 50% 50% 2015 Hungary 3 067 1 324 43% 57% 2015 Serbia 3 100 1 235 40% 60% 2014 Greece 14 200 5 499 39% 61% 2013 Romania 14 000 5 386 38% 62% 2015 Portugal 59 365 21 965 37% 63% 2014 Montenegro 194 68 35% 65% 2015 Georgia 9 600 2 369 25% 75% 2015 Bulgaria 3 543 715 20% 80% 2015 Armenia 3 600 638 18% 82% 2015 Azerbaijan 8 798 1 542 18% 82% 2015 Kazakhstan 23 000 3 416 15% 85% 2015 Moldova 17 985 2 667 15% 85% 2015 Kyrgyzstan 8 500 1 030 12% 88% 2015 Albania 1 400 144 10% 90% 2015 Tajikistan 16 000 995 6% 94% 2015
34 Latest data available as reported by countries in March 2016; note that the latest available data may be from 2012, 2013, 2014, 2015 or 2016.
ECDC is committed to ensuring the transparency and independence of its work
In accordance with the Staff Regulations for Officials and Conditions of Employment of Other Servants of the European Union and the ECDC Independence Policy, ECDC staff members shall not, in the performance of their duties, deal with a matter in which, directly or indirectly, they have any personal interest such as to impair their independence. Declarations of interest must be received from any prospective contractor(s) before any contract can be awarded.www.ecdc.europa.eu/en/aboutus/transparency
HOW TO OBTAIN EU PUBLICATIONSFree publications:• onecopy: viaEUBookshop(http://bookshop.europa.eu);
• morethanonecopyorposters/maps: fromtheEuropeanUnion’srepresentations(http://ec.europa.eu/represent_en.htm); fromthedelegationsinnon-EUcountries(http://eeas.europa.eu/delegations/index_en.htm); bycontactingtheEuropeDirectservice(http://europa.eu/europedirect/index_en.htm)or calling 00 800 6 7 8 9 10 11 (freephone number from anywhere in the EU) (*).
(*)Theinformationgivenisfree,asaremostcalls(thoughsomeoperators,phoneboxesorhotelsmaychargeyou).
Priced publications:• viaEUBookshop(http://bookshop.europa.eu).
European Centre for Disease Prevention and Control (ECDC)
Postaladdress: Granits väg 8, SE-171 65 Solna, Sweden
Visitingaddress: Tomtebodavägen 11a, SE-171 65 Solna, Sweden
Tel. +46 858601000Fax+46858601001www.ecdc.europa.eu
An agency of the European Unionwww.europa.eu
Subscribe to our publications www.ecdc.europa.eu/en/publications
Contact us [email protected]
Follow us on Twitter @ECDC_EU
Like our Facebook page www.facebook.com/ECDC.EU