continuous measurement by eddy current methods of age ... · calhoun: the nps institutional archive...
TRANSCRIPT

Calhoun: The NPS Institutional Archive
Theses and Dissertations Thesis Collection
1992-09
Continuous measurement by eddy current methods
of age hardening in aluminum alloys
Esarey, John Gilbert
Monterey, California. Naval Postgraduate School
http://hdl.handle.net/10945/23592


UNCLASSIFIEDSECURITY CLASSIFICATION OF THIS PAGE
1a. reporTsecUAiTYclassificaiion UNCLASSIFIED
REPORT DOCUMENTATION PAGE1 b. Uts I hl6TIV/E MAftklN<SS
2a se'curiTY CLASSIFICATION AUThOriTV
2b. DECLAsslr-'
IcATION/DOWNGRADlNG SCHbbUllz
4. PERFORMING ORGANIZATION REPORT NUMBER(S)
3. DIsTribUTIoN/AVAILAbILITY OF REPOUIApproved for public release;
distribution is unlimited
5. MONITORING ORGANIZATION REP6RT NUMBERS)
6a. NAME OF PERFORMING 0AgAN|2ATI0NMech. Engineering Dept.
Naval Postgraduate School
6b. OFFICE SYMBOL(if applicable)
ME
7a. Name OF monITOriNg ORGANIZATIONNaval Postgraduate School
6c. ADDRESS (City, State, and ZIP Code)
Monterey, CA 93943-5000
7b. ADDRESS (City, State, and ZIP Code)
Monterey, CA 93943-5000
8a. NAME OF FUNDING/SPONSORINGORGANIZATION
8b. OFFICE SYMBOL(if applicable)
5! PROCUREMENT INSTRUMENT IDENTIFICATION NUMBER
10. SOURCE OF Funding NUMBERS8c. ADDRESS (City, State, and ZIP Code)PROGRAMELEMENT NO.
PROJECTNO.
TasTTNO.
WORK UNITACCESSION NO
1 1 . TITLE (Include Security Classification)
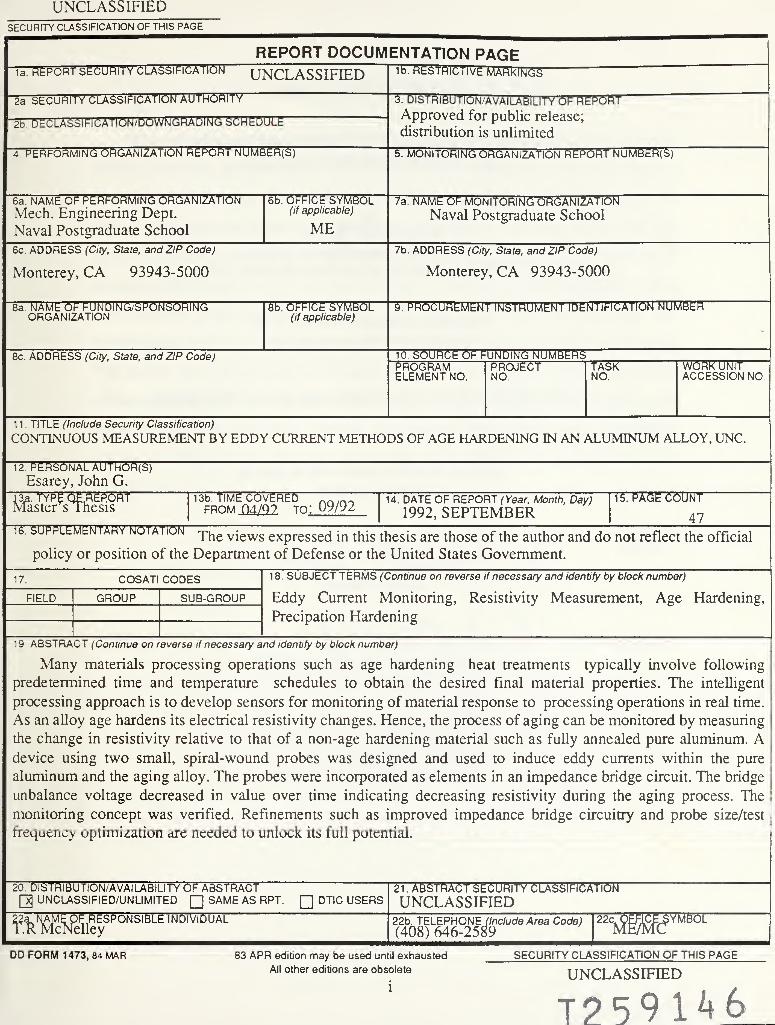
CONTINUOUS MEASUREMENT BY EDDY CURRENT METHODS OF AGE HARDENING IN AN ALUMINUM ALLOY, UNC.
12. PERSONAL AUTHOR(S)
Esarey, John G.13a. TYF* £ OP REP.ORTMaster sThesis
13b. TIME COVERED „„,„-from Q4/Q2 to :
09/9215. PA6E COUNT
47
14. DATE OF REPORT (Year, Month, Day)
1992, SEPTEMBER16. SUPPLEMENTARY NOTATION The yiews expressed jn this thesis are those of the author and do not reflect the official
policy or position of the Department of Defense or the United States Government.
17. COSATI CODES
FIELD GROUP SUB-GROUP
18. SUBJECT TERMS (Continue on reverse if necessary and identify by block number)
Eddy Current Monitoring, Resistivity Measurement, Age Hardening,
Precipation Hardening
19. ABSTRACT (Continue on reverse if necessary and identify by block number)
Many materials processing operations such as age hardening heat treatments typically involve following
predetermined time and temperature schedules to obtain the desired final material properties. The intelligent
processing approach is to develop sensors for monitoring of material response to processing operations in real time.
As an alloy age hardens its electrical resistivity changes. Hence, the process of aging can be monitored by measuring
the change in resistivity relative to that of a non-age hardening material such as fully annealed pure aluminum. Adevice using two small, spiral-wound probes was designed and used to induce eddy currents within the pure
aluminum and the aging alloy. The probes were incorporated as elements in an impedance bridge circuit. The bridge
unbalance voltage decreased in value over time indicating decreasing resistivity during the aging process. The
monitoring concept was verified. Refinements such as improved impedance bridge circuitry and probe size/test
frequency optimization are needed to unlock its full potential.
20. DISTRIBUTION/AVAILABILITY OF ABSTRACT
[J UNCLASSIFIED/UNLIMITED[~J
SAME AS RPT.|~J
DTIC USERS
. F RESPONSIBLE INDIVIDUALelley
21 . ABSTRACT SECURITY CLASSIFICATION
UNCLASSIFIEDCESYMBOL22b. TELEPHONEJ/nc/ude Area Code)
(408) 646-258922c.
DDFORM 1473, 84 MAR 83 APR edition may be used until exhausted
All other editions are obsolete
SECURITY CLASSIFICATION OF THIS PAGE
UNCLASSIFIED
T259146
Approved for public release; distribution is unlimited
Continuous Measurement By Eddy Current Methods
ofAge Hardening in Aluminum Alloys
by
John Gilbert Esarey
Lieutenant, United/States NavyB.S.M.E.T., University of Southern Indiana, 1985
Submitted in partial fulfillment of the
requirements for the degree of
MASTER OF SCIENCE IN MECHANICAL ENGINEERING
from the
NAVAL POSTGRADUATE SCHOOLSeptember, 1992

ABSTRACT
Many materials processing operations such as age hardening heat treatments typically
involve following predetermined time and temperature schedules to obtain the desired
final material properties. The intelligent processing approach is to develop sensors for
monitoring of material response to processing operations in real time. As an alloy age
hardens its electrical resistivity changes. Hence, the process of aging can be monitored by
measuring the change in resistivity relative to that of a non-age hardening material such as
fully annealed pure aluminum. A device using two small, spiral-wound probes was
designed and used to induce eddy currents within the pure aluminum and the aging alloy.
The probes were incorporated as elements in an impedance bridge circuit. The bridge
unbalance voltage decreased in value over time indicating decreasing resistivity during the
aging process. The monitoring concept was verified. Refinements such as improved
impedance bridge circuitry and probe size/test frequency optimization are needed to unlock
its full potential.
111
/ hfi*$
c.J
TABLE OF CONTENTS
I. INTRODUCTION 1
II. BACKGROUND 4
A. ELECTRICAL RESISTIVITY 4
1. Mobility Calculation For Pure Aluminum 4
B. EFFECTS OF TEMPERATURE AND LATTICE DEFECTS ONRESISTIVITY 6
1. Thermal Effects 6
2. Changes Due To Lattice Defects 6
3. Combined Effects of Temperature and Lattice Defects 7
C. EDDY CURRENT PROBE THEORY 10
III. EXPERIMENTAL PROCESS, PROCEDURES AND COMPONENTDESIGN 12
A. PROCESS/PROCEDURES OVERVIEW 12
B. COMPONENT FUNCTIONS 13
1. Testing Apparatus 13
2. Probes 13
3. Impedance Bridge Circuit 15
4. Function Generator 15
5. Digital Multimeter (D.M.M.) 15
6. Data Acquisition Personal Computer (D.A.P.C.) 15
C. TESTING APPARATUS DESIGN 15
1. General Design Considerations 17
2. Probe Design Attributes/Construction 17
3. Testing Apparatus Design Overview 18
D. BRIDGE CIRCUIT DESIGN/ANALYSIS 20
1. Circuit Analysis Assumptions 20
2. Circuit Analysis 20
IV
IV. RESULTS AND DISCUSSION 24
A. MONITORING SYSTEM DESIGN AND OPERATION 24
B. BRIDGE CIRCUIT RESPONSE 24
C. EXPERIMENTAL MEASUREMENT RESULTS FOR Al 7075 ALLOY 28
V. CONCLUSIONS AND RECOMMENDATIONS 34
A. CONCLUSIONS 34
1. Testing Apparatus Design 34
2. Bridge Circuit Design and Operation 34
3. Monitoring Concept 35
B. RECOMMENDATIONS 35
VI. LIST OF REFERENCES 37
VII.INITIAL DISTRIBUTION LIST 38
LIST OF FIGURES
Figure 2.1 Electron Drift Schematic Diagram [Ref.. 1] 5
Figure 2.2 Simplified Resistivity Models 8
Figure 2.3 Simplified Aging Process Models 9
Figure 2.4 Eddy Current Probe Coil Schematic Diagram 11
Figure 3.1 Testing System and Processing Schematic Diagram 14
Figure 3.2 Testing Apparatus Schematic Diagram 16
Figure 3.3 Eddy Current Probe Schematic Diagram 17
Figure 3.4 Photograph of Testing Apparatus and Lifting Cam 19
Figure 3.5 Bridge Circuit Schematic Diagrams 21
Figure 4.1 Theoretical Bridge Output Response (Pure Aluminum Samples) 26
Figure 4.2 Experimental Bridge Output Response (Pure Aluminum Samples) .. 27
Figure 4.3 Experimental Bridge Output Response for AL 7075 Aged at Various
Temperatures 29
Figure 4.4 Experimental Bridge Output Response for Two Test Runs WithAL 7075
Aged at 200°C 30
Figure 4.5 Plot of Data From Figure 4.4 After Applying Signal Processing Scheme
to Yield Percent Deviation 32
Figure 4.6 Plot of Monitoring System Final Output From Data Plotted in Figure
4.3 33
Figure 5.1 Alternate Testing Circuit Schematic Diagram 36
VI

ACKNOWLEDGEMENTS
A special thanks to my thesis advisor, Professor Terry McNelley, who allowed
me to take the risk/opportunity to break new ground in the area of intelligent
processing. The Esarey - McNelley measuring process was designed due to Prof.
McNelley having the insight to ask the right question. Answering his question, "Do
you think you could come up with a way to monitor resistivity changes in an age
hardening aluminum alloy at temperature using a non-intrusive method such as an
eddy current device?", shall be a memory which will never fade.
I am especially grateful to Mr. John Flarity of Flare Technologies for his
excellent technical advice as well as his generosity in supplying me with small
hardware items, saving myself and the U.S. Navy time and money. Mr. Flarity's
good nature and wealth of technical knowledge were critical ingredients to
sustaining my sanity during the course of this research effort.
The unwavering technical support received form Tom Christian and the Naval
Postgraduate School machine shop was second to none and very much appreciated.
The Naval Air Warfare Center's support, with Dr. William Frazer as program
monitor, in developing the intelligent processing concept, is acknowledged and
much appreciated.
For the most important people in my life, my family, without whom I certainly
would not be where I am today. Thanks for all the encouragement, love, and support,
especially from my wife Patti. I only wish that I had been able to spend more time
with you. And finally, a special thank you to my sons and daughter, Justin, Samuel
and Brooke for making me smile even when my mind was pre-occupied.
vn


I. INTRODUCTION
The primary focus of this thesis project was to design, fabricate and test a
simple eddy current sensor device which could be used to monitor in real time the
isothermal age hardening of aluminum alloys. The age hardening of aluminum
alloys has been accomplished primarily by the development of empirical time at
temperature data correlated to mechanical, electrical, corrosion and various other
properties. This practice of applying a standard heat treatment schedule to achieve a
designated age hardened condition does not provide any indication of the progress,
success or failure of the age hardening process in real time. Only upon completion
of the aging treatment is the success or failure of the age hardening process
measured by destructive or non-destructive methods. A wide range of methods may
be employed, including resistivity testing by eddy current methods. At present,
resistivity testing with eddy current devices to determine the extent of aging in
aluminum alloys is conducted at near room temperatures and is a post-heat treatment
measurement.
Monitoring the process in real time utilizing a computerized control system
would allow the heat treatment process to be terminated when the desired properties
are obtained as opposed to an after-the-fact determination of success or failure. The
concept of process monitoring and control in real time is known as intelligent
processing. An eddy current sensing device linked to the computerized control
system mentioned above would establish an intelligent approach to age hardening
of aluminum alloys. With this goal in mind the concept of utilizing existing eddy
current resistivity measuring equipment was first considered. As mentioned above,
existing resistivity measuring devices are primarily used to obtain an indication of a
material's resistivity essentially at room temperature with a temperature correction
factor being applied to allow for small deviations from the calibration temperature.

Such devices normally give output values in absolute units such as Qxcm or
percent of the international annealed copper standard (%IACS) and can be quite
accurate. Utilizing a high temperature probe, one could possibly modify such a
device to monitor the age hardening process. However, conversion cost and
calibration could become considerable obstacles. The relatively complex and
tedious task of obtaining accurate absolute numerical resistivity values, even near
room temperature, sparked the desire to achieve the goal with a less complex
system. A monitoring technique was devised based on the premise that sensing
relative resistivity changes during aging versus obtaining absolute resistivity values
was all that was needed to accurately reflect the aging process. One should note that
this premise relies on the assumption that solutionizing of the material to be aged
was performed properly and consistently. However, it is feasible to include a
computer subroutine to notify the operator of starting conditions which are
inconsistent with those expected for the particular alloy being aged at the specified
aging temperature. The system designed and tested during this period of research
basically consisted of the following five components:
1) Two spiral-wound sensor probes mounted in a testing apparatus;
2) An impedance bridge circuit;
3) An Interstate Electronics Corp. F36 Function Generator;
4) A Hewlett Packard 3478A Digital Multimeter with an HP-IB interface bus;
5) A Hewlett Packard PC (with IEEE 488 data acquisition board installed) to
collect time and voltage data for subsequent analysis.
Utilizing the above equipment, time and impedance bridge unbalance (r.m.s.)
voltage data files which were obtained. Plots of aging time vs. mV as well as aging
time vs. percent deviation from (mean) peak impedance bridge output were
generated for various time/temperature aging conditions. These plots revealed clear
decreases in resistivity during the aging process for all time/temperature aging
conditions. More importantly, the rate of decrease in resistivity increased as the

aging temperature increased. These results were consistent with known trends in
resistivity for age-hardenable alloys thereby verifying the monitoring concept.

II. BACKGROUND
A. ELECTRICAL RESISTIVITY
A basic knowledge of the factors governing the electrical resistivity of
aluminum and its alloys is necessary to understand fully how eddy current probe
coils interact with the tested samples. A detailed development of the electrical
behavior of metals is presented in References 1 and 2. The current work involves the
exploitation of the change in electrical resistivity of age hardenable aluminum alloys
during aging and requires a repeatable reference condition. Aluminum alloys are
metallically bonded materials and their resistivities is governed primarily by the
ease with which valance electrons (charge carriers) can move within the material.
The ease with which these charge carriers can move is commonly defined as
mobility (|x, cm 2/ (V • sec)) . The resistivity, p, of a material is given by the
relation:
p = —!— ft -cm (Eq2.1)nqjl
where n is the number of charge carriers, q is the carrier charge and |i is their
mobility. The charge, q, on each carrier is a constant value of 1.6xl0-19
Coulombs
and n is approximately constant for the alloys tested. This leaves resistivity, p, as a
function of mobility, \i. For the materials considered in this work the mobility,
|i,depends on lattice imperfections, microstructure, and temperature. An example
calculation for the theoretical mobility, u\, of pure aluminum at 25°C is given below.
1. Mobility Calculation For Pure Aluminum
Aluminum is face centered cubic (4 atoms/unit cell) with a lattice
—8parameter of 4.0496x10 cm and has 3 valence electrons per atom. So,

n = (4atoms/unitcell)-(3electrons/atom) = L80695xl023electrons/cm
3,
4.0496 xlO-8
and, with pAL = 2.6525 xl0~6(Q • cm) at 25°C,
^AL =23
L-19 =6= 13 -04 Cm2/(V
•SeC)
1.80695xl023
• 1.6x10⁹
• 2.6525x10
Comparing jiAL to the mobility of pure copper calculated in a similar manner
(^ « 44.2 cm2/ (V • sec) ) shows that the mobility of electrons in pure aluminum
is approximately 25% as great as in copper at room temperature.
The mobility of charge carriers can also be defined by the following relation:
X> -
jj. = -ip, cm 2/ (V • cm) (Eq 2.2)
Where uav
= (Ax) / (At) is the average drift velocity of carrier charges
due to an applied bias voltage (V) across the conducting material (Figure 2.1), and %
is the electric field defined as the voltage drop per unit length of conductor.
AX
Figure 2.1 Electron Drift Schematic Diagram [Ref.. 1]
Equation 2.2 indicates that the average drift velocity is directly proportional to mo-
bility and inversely proportional to resistivity.
B. EFFECTS OF TEMPERATURE AND LATTICE DEFECTS ON
RESISTIVITY
1. Thermal Effects
The mobility of charge carriers is influenced by temperature. Figure 2.2 (a)
and (b) illustrate this effect. As temperature increases, the atoms vibrate about their
equilibrium positions causing of an increasingly imperfect lattice. This leads to an
increase in the number of charge carrier scattering events, a decrease in drift velocity
and a corresponding increase in resistivity. The thermal component of resistivity can
be estimated from the following relation:
pT= p RT (l+yAT) (Eq2.3)
Where pRTis the material's resistivity at room temperature, y is the
resistivity coefficient (slope of the resistivity v.s. temperature curve for a given
material), and AT is the difference between the temperature of interest and room
temperature [Ref. 1].
2. Changes Due To Lattice Defects
Lattice defects cause a significant increase in resistivity also by decreasing
the charge carrier's mean free path as the number of defects increase (Figure
2.2(b),(c) and (d)). The resistivity due to lattice defects, pd , i.e.,defect resistivity, is
defined as the combined effect of solid solution atoms, interstitial atoms, vacancies,
grain boundaries and other lattice imperfections but excluding those which are
thermally induced. The combined effect of these defects is independent of
temperature. During the aging process, illustrated schematically in Figure 2.3, the
defect resistivity, pd , decreases due to precipitation as a result of the non-
equilibrium state of the initially supersaturated condition of the solution treated
alloy. [Ref. 1]
3. Combined Effects of Temperature and Lattice Defects
The total resistivity due to the combined effects of temperature and lattice
defects is given by the relation:
P-Total = PT + Pd <£q2 -4 )
The focus of this work was to obtain a measurement of the change in the
aging alloy's resistivity as a function of the change in defect resistivity, pd , only,
since changes in defect resistivity, pd ,are indicative of the aging process in
aluminum alloys. The schematics in Figure 2.2 (c) and (d) correspond to the initial
supersaturated condition and the precipitation (aging) process, respectively. The
supersaturated condition exhibits the greatest resistivity due the small charge carrier
mean free path. Due to the non-equilibrium nature of the supersaturated state, the
precipitation process occurs leading to a greater charge carrier mean free path and
hence lower resistivity. The effect of changes in thermal resistivity (
p
T ) during
testing were minimized by subjecting a reference probe and reference sample to the
same isothermal furnace environment used for aging the alloy sample.

a.) PURE METAL/PERFECT CRYSTAL
QQ_Q_Q_QOOOOOo o ooooo oo oo
o
oooooooooooooooooooooooob.) PURE METAL/IMPERFECT CRYSTAL
(or HEATED PURE METAL)
OOOpJDOOOoOOOo o cx3 a£> oxiQ^oja_o^^ooooOoWoooooooooooooc.)ALLOYED METAL/IMPERFECT CRYSTAL
(SOLUTIONIZED ALLOY)
oo o^o n m ojd
o°o o 6 o°o ou¥6 o°o
d.) ALLOYED METAL DURING AGING
OOOOooOT5oooooooo oo
oo
Figure 2.2 Simplified Resistivity Models
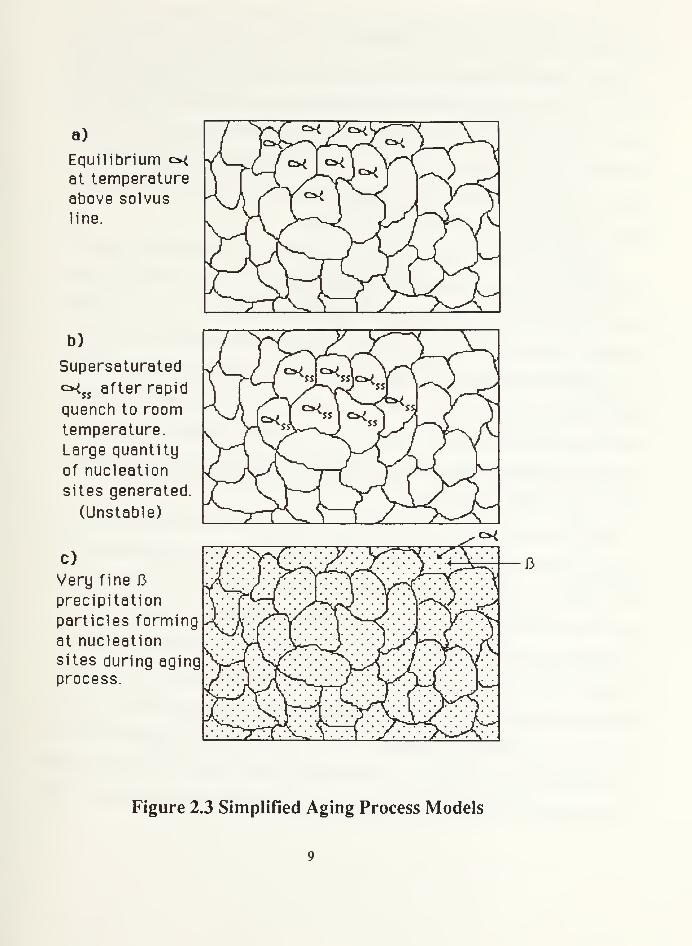
a)
Equilibrium ^at temperature
above solvus
line.
b)
Supersaturated
<*<s$
after rapid
quench to roomtemperature.
Large quantity
of nucleation
sites generated.
(Unstable)
c)
Very fine 13
precipitation
particles forming
at nucleation
sites during agingprocess.
• \ • -4 \ 13
Figure 2.3 Simplified Aging Process Models
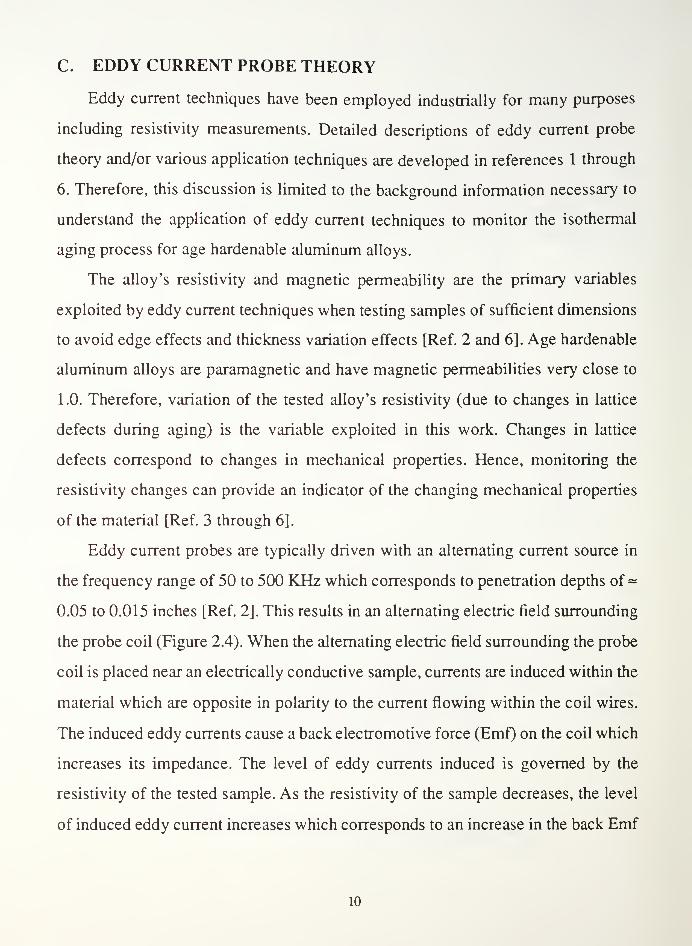
C. EDDY CURRENT PROBE THEORY
Eddy current techniques have been employed industrially for many purposes
including resistivity measurements. Detailed descriptions of eddy current probe
theory and/or various application techniques are developed in references 1 through
6. Therefore, this discussion is limited to the background information necessary to
understand the application of eddy current techniques to monitor the isothermal
aging process for age hardenable aluminum alloys.
The alloy's resistivity and magnetic permeability are the primary variables
exploited by eddy current techniques when testing samples of sufficient dimensions
to avoid edge effects and thickness variation effects [Ref. 2 and 6]. Age hardenable
aluminum alloys are paramagnetic and have magnetic permeabilities very close to
1.0. Therefore, variation of the tested alloy's resistivity (due to changes in lattice
defects during aging) is the variable exploited in this work. Changes in lattice
defects correspond to changes in mechanical properties. Hence, monitoring the
resistivity changes can provide an indicator of the changing mechanical properties
of the material [Ref. 3 through 6].
Eddy current probes are typically driven with an alternating current source in
the frequency range of 50 to 500 KHz which corresponds to penetration depths of
0.05 to 0.015 inches [Ref. 2]. This results in an alternating electric field surrounding
the probe coil (Figure 2.4). When the alternating electric field surrounding the probe
coil is placed near an electrically conductive sample, currents are induced within the
material which are opposite in polarity to the current flowing within the coil wires.
The induced eddy currents cause a back electromotive force (Emf) on the coil which
increases its impedance. The level of eddy currents induced is governed by the
resistivity of the tested sample. As the resistivity of the sample decreases, the level
of induced eddy current increases which corresponds to an increase in the back Emf
10

and increased probe coil impedance. When the probes are placed appropriately as
elements in an impedance bridge network (discussed in Chapter III), very small
changes in impedance can be sensed as a changes in the bridge unbalance voltage
(bridge output) and thus allow the aging process to be monitored.
A.C INPUT SIGNAL
Induced
Eddies
Non-ferrous Electrically
Conductive Material
Figure 2.4 Eddy Current Probe Coil Schematic Diagram
11

III. EXPERIMENTAL PROCESS, PROCEDURES ANDCOMPONENT DESIGN
A. PROCESS/PROCEDURES OVERVIEW
The design objective for the monitoring system was to obtain a signal in real
time indicative of the extent of the aging process in an age-hardenable aluminum
alloy using the eddy current methods outlined in the previous chapter. The standard
processing procedures for age-hardening aluminum alloys consist of solutionizing
the material at an appropriate temperature for a specified length of time, rapid
quenching to room temperature, and reheating at a specified intermediate
temperature for a predetermined length of time in order to obtain the desired
mechanical properties. The testing procedures utilized incorporated the above
processing procedures with additional features to allow for the continuous
measurement of the aging process. Figure 3.1 illustrates the heat treatment steps and
additional procedures required by the monitoring system. The step-by-step
procedures used during the experimental testing are outlined below. The bridge
nulling process was accomplished prior to testing of the alloy by placing pure
aluminum samples under both probes with the testing apparatus in the furnace and
equilibrated at 100°C. The minimum bridge output (null) was obtained by adjusting
the potentiometer.
1) Al 7075 tensile samples were solutionized at approximately 480°C for 50
minutes.
2) Samples were quickly quenched in a large water bath at approximately 25°C.
3) All Samples were immediately placed in cold storage at approximately -15°C
to inhibit aging at room temperature.
4) The convection furnace was set at the desired aging temperature with the
testing apparatus inside and pure aluminum test samples under each probe.
5) With isothermal furnace conditions verified and all system component settings
and circuit connections verified, the data acquisition program was given the
desired instructions regarding timing of sampling intervals for measuring the
bridge unbalance voltage (output voltage).
12
6) A sample was removed from cold storage and allowed to heat until moisture
could be removed from sample.
7) Upon opening the furnace, the probe bar was lifted using the lifting cam, the
pure aluminum sample was removed and the alloy sample inserted under the
testing probe (right probe). The probe bar was lowered allowing the probes to
rest on the samples, and the furnace was closed.(This step was performed as
quickly as possible to minimize heat loss.)
8) The data acquisition program was started, generating time and mV data files
based on instructions given in step 5.
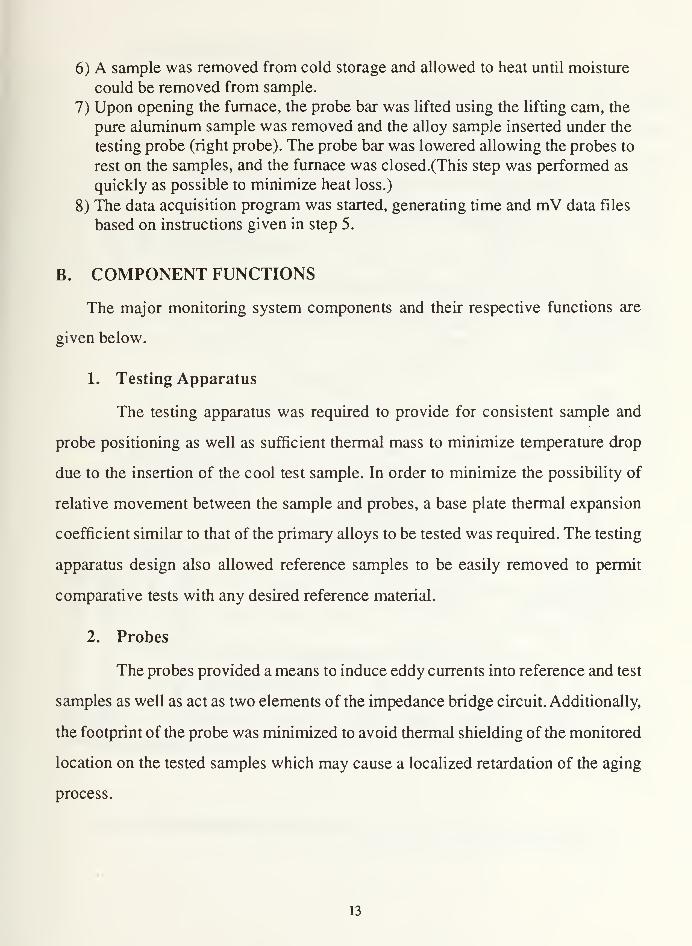
B. COMPONENT FUNCTIONS
The major monitoring system components and their respective functions are
given below.
1. Testing Apparatus
The testing apparatus was required to provide for consistent sample and
probe positioning as well as sufficient thermal mass to minimize temperature drop
due to the insertion of the cool test sample. In order to minimize the possibility of
relative movement between the sample and probes, a base plate thermal expansion
coefficient similar to that of the primary alloys to be tested was required. The testing
apparatus design also allowed reference samples to be easily removed to permit
comparative tests with any desired reference material.
2. Probes
The probes provided a means to induce eddy currents into reference and test
samples as well as act as two elements of the impedance bridge circuit. Additionally,
the footprint of the probe was minimized to avoid thermal shielding of the monitored
location on the tested samples which may cause a localized retardation of the aging
process.
13

ELECTRICAL CONVECTION FURNACE
TESTING APPARATUSFUNCTION GENERATOR
TJJ
<0
Placed in
testing Appr.
<xx><XXJ<xx> 3
*\
•M C
DDDaODDDnonanaDDGITAL MULT I METER
Allowed to
heat until
ice liquifies.
Wipped free
of water.
m
HP IB LINK
Solutionizing oven
DATA AQUISITION P.C.
gj (Start data Aquisition)
ATFreezer
°c
TTJmxxxx:XXXX!
;i m ,-; ;
TV /TTTTTX iCM TW^ TWWWWmTlW^ X X X X XX v v y y y y y y y K^jjy y.y_y y yy XXXXXN£/ \x.xxxx.x
i!.*i.'.*-i.**i,*,«..,.,'.».,•,..•«'
Placed in
freezer for
later testing.
<?
u
480°C
I'.^llll^^ll-il'i't-i
> i i i -i i i -i . i i 1 1 i i ^
Figure 3.1 Testing System and Processing Schematic Diagram
14

3. Impedance Bridge Circuit
The impedance bridge network was required to provide a sufficiently
sensitive means to detect resistivity changes within the test samples. Additionally, it
was configured to provide a means for adjusting bridge element values to achieve an
acceptable minimum initial unbalance voltage (null) with a pure aluminum test
sample.
4. Function Generator
The function generator provided a stable alternating current input signal to
bridge circuit. Settings used for most of the testing were: Voltage =10 volts (peak to
peak), frequency = 52 KHz.
5. Digital Multimeter (D.M.M.)
The D.M.M. provided a means to accurately and continuously measure the
bridge unbalance voltage as well as provide a computer interface for computer
sampling of measured voltage.
6. Data Acquisition Personal Computer (D.A.P.C.)
The D.A.P.C. was used to receive and store bridge unbalance voltage data
from D.M.M. at specified intervals Also, it was programmed to generate a time data
file corresponding to the voltage sampling intervals discussed above.
C. TESTING APPARATUS DESIGN
The testing apparatus was designed to allow the verification of the monitoring
concept. Numerous equally simple, application-specific designs could be developed
for industrial or other uses.
15

PROBE BAR (TEFLON) TT@i?^ni?^l
EDDY CURRENT PROBES
wtma's wns^y SUPPORT COLUMNS(TEFLON)
PROBE LEADS
In4; iL
za*
j ! i
m rat
BASE PLATE (AL 6061)
/"v
Figure 3.2 Testing Apparatus Schematic Diagram
16

1. General Design Considerations
Figure 3.2 illustrates the basic attributes of the final design which
incorporated a balance of the design considerations listed below.
1) Simple to operate with a minimum number of moving parts
2) Maximum utilization of available materials
3) Allow for testing to be accomplished on 0.125" thick tensile bar samples of
1.0" x 8.0" overall dimensions
4) Provide sufficient thermal mass and contact area to rapidly bring cool test
sample to near the desired aging temperature
5) Provide for easy and consistent placement of probes on the reference and tested
samples
6) Provide constant / consistent probe-to-sample contact force
7) Minimizes amount of ferromagnetic materials used and maximize the
displacement of these materials from the probe
2. Probe Design Attributes/Construction
Figure 3.3 illustrates the basic attributes of the probe design. The relevant
dimensional attributes are listed below.
1) Coil slot outside Diameter - 1.0 cm2) Collar diameter - 2.5 cm2) Coil slot inner core diameter - 0.2 cm3) Wire -160 turns of AWG 32 high temperature coated copper wire
4) Thickness of probe section below coil - = 0.05 cm
Probe lead routing holes
Coil slot
Collar
UNWOUND PROBE SPOOL
Probe leads
*&HwHigh temp (spiral wound)
copper magnet wire
WOUND PROBE
Figure 3.3 Eddy Current Probe Schematic Diagram
17
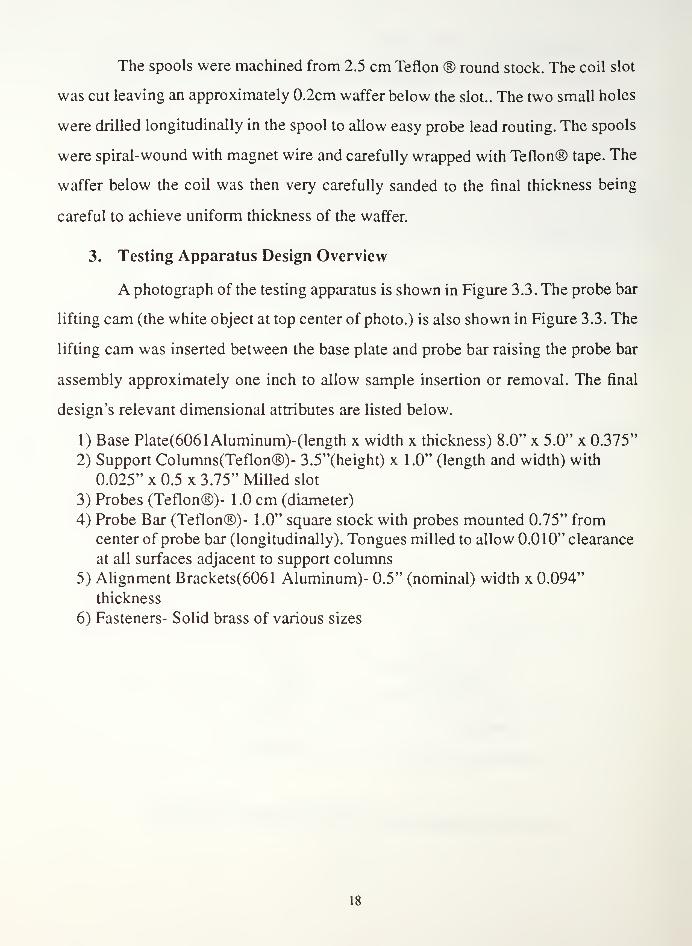
The spools were machined from 2.5 cm Teflon ® round stock. The coil slot
was cut leaving an approximately 0.2cm waffer below the slot.. The two small holes
were drilled longitudinally in the spool to allow easy probe lead routing. The spools
were spiral-wound with magnet wire and carefully wrapped with Teflon® tape. The
waffer below the coil was then very carefully sanded to the final thickness being
careful to achieve uniform thickness of the waffer.
3. Testing Apparatus Design Overview
A photograph of the testing apparatus is shown in Figure 3.3. The probe bar
lifting cam (the white object at top center of photo.) is also shown in Figure 3.3. The
lifting cam was inserted between the base plate and probe bar raising the probe bar
assembly approximately one inch to allow sample insertion or removal. The final
design's relevant dimensional attributes are listed below.
1) Base Plate(6061 Aluminum)-(length x width x thickness) 8.0" x 5.0" x 0.375"
2) Support Columns(Teflon®)- 3.5"(height) x 1.0" (length and width) with
0.025" x 0.5 x 3.75" Milled slot
3) Probes (Teflon®)- 1.0 cm (diameter)
4) Probe Bar (Teflon®)- 1.0" square stock with probes mounted 0.75" from
center of probe bar (longitudinally). Tongues milled to allow 0.010" clearance
at all surfaces adjacent to support columns
5) Alignment Brackets(6061 Aluminum)- 0.5" (nominal) width x 0.094"
thickness
6) Fasteners- Solid brass of various sizes
18

"N*.
Figure 3.4 Photograph of Testing Apparatus and Lifting Cam
19
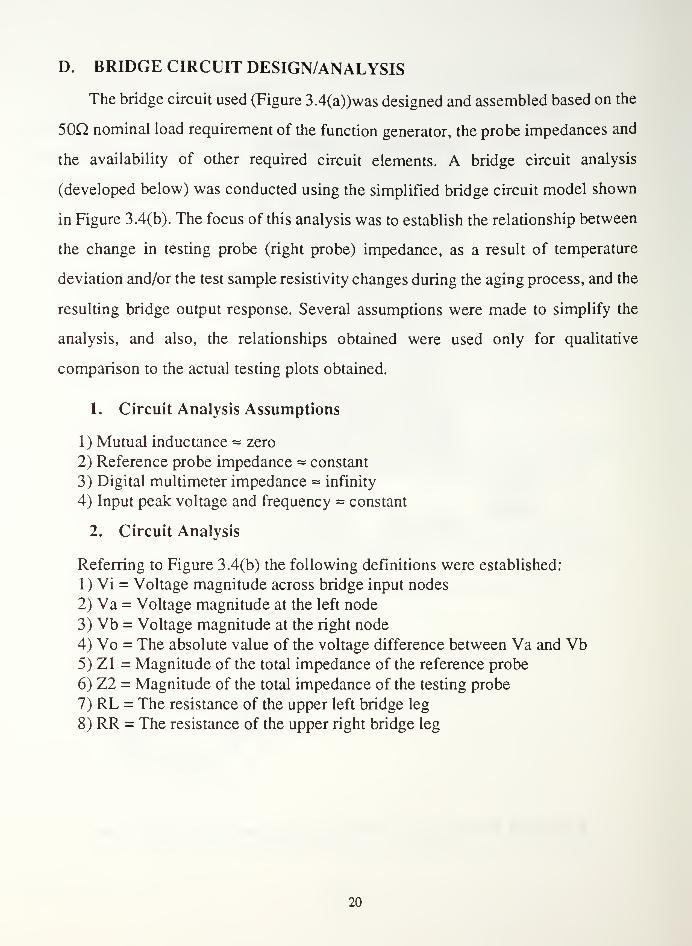
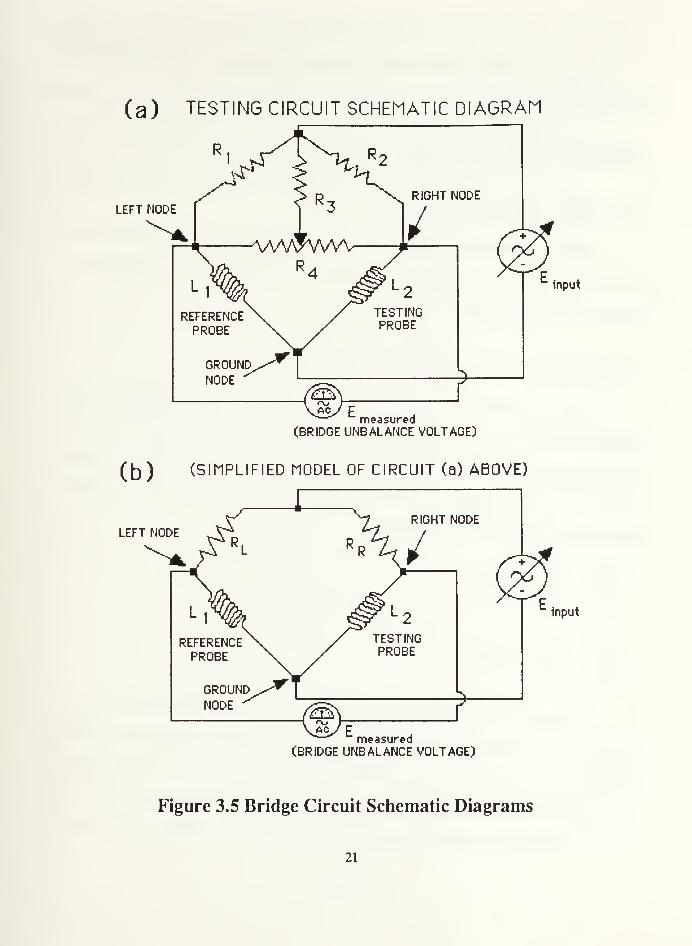
D. BRIDGE CIRCUIT DESIGN/ANALYSIS
The bridge circuit used (Figure 3.4(a))was designed and assembled based on the
50Q nominal load requirement of the function generator, the probe impedances and
the availability of other required circuit elements. A bridge circuit analysis
(developed below) was conducted using the simplified bridge circuit model shown
in Figure 3.4(b). The focus of this analysis was to establish the relationship between
the change in testing probe (right probe) impedance, as a result of temperature
deviation and/or the test sample resistivity changes during the aging process, and the
resulting bridge output response. Several assumptions were made to simplify the
analysis, and also, the relationships obtained were used only for qualitative
comparison to the actual testing plots obtained.
1. Circuit Analysis Assumptions
1) Mutual inductance = zero
2) Reference probe impedance = constant
3) Digital multimeter impedance * infinity
4) Input peak voltage and frequency « constant
2. Circuit Analysis
Referring to Figure 3.4(b) the following definitions were established:
1) Vi = Voltage magnitude across bridge input nodes
2) Va = Voltage magnitude at the left node
3) Vb = Voltage magnitude at the right node
4) Vo = The absolute value of the voltage difference between Va and Vb5) Zl = Magnitude of the total impedance of the reference probe
6) Z2 = Magnitude of the total impedance of the testing probe
7) RL = The resistance of the upper left bridge leg
8) RR = The resistance of the upper right bridge leg
20
(a) TESTING CIRCUIT SCHEMATIC DIAGRAM
R1
wTR-
LEFT NODER RIGHT NODE
AAWVWV /
input
measured(BRIDGE UNBALANCE VOLTAGE)
(b) (SIMPLIFIED MODEL OF CIRCUIT (a) ABOVE)
LEFT NODE
input
measured(BRIDGE UNBALANCE VOLTAGE)
Figure 3.5 Bridge Circuit Schematic Diagrams
21

Using the voltage divider rule at the left and right nodes yields the
following relations:
ZlLeft node-- Va =
(RL+Z1) 'Vi (Ec
l 3 - 1)
Right node - yu = Z2. yi (Eq 3.2)
(RR+Z2)
The bridge output voltage,Vo, is the absolute value of the difference
between Va and Vb which yields the following relationship between bridge circuit
elements and bridge output:
Bridge output - Vo = Zl Z2Vi (Eq3.3)
RL+Z1 RR+Z2|
For ideal conditions, i.e., using assumptions one through eight above and
assuming perfect electrical match for the probe coils, the value of Vo should be zero
at the perfect null condition regardless of the input voltage, Vi. Setting Vo = and
solving for the combinations of values for RL, RR, Zl and Z2 which satisfy the
resulting equation yields the following:
Zl RLZ2 " RR (Ec
*3A)
Zl Z2RL RR
(Eq 3.5)
Equations 3.4 and 3.5 indicate that there are two possible combinations of
bridge element values which would yield the null condition. Only one of these null
conditions can be satisfied at any given time unless the value of all elements are
exactly the same (magnitude and phase angle adjustments must be provided). In
practice, attempting to achieve even one of the perfect null conditions above would
22

be tedious, time consuming and unnecessary to achieve the goal of this thesis work.
Given that the intent of the monitoring system is to measure a relative change in the
bridge output which is directly linked to the resistivity change in the aluminum alloy
to be heat treated, there is no need to achieve a perfect null condition. Equations 3.3
through 3.5 were used in Chapter IV to develop a mathematical model of the bridge
output response for qualitative comparison to actual test data.
23
IV. RESULTS AND DISCUSSION
A. MONITORING SYSTEM DESIGN AND OPERATION
The eddy current monitoring system was easy to operate and experienced no
mechanical difficulties during more than 150 testing cycles with the exception of
significant thermally induced cracks in the probe bar and support columns. The
probe bar, support columns and probe spools were all thought to be made of
Teflon® stock. However, it became apparent that this was not the case as the probe
spools exhibited no degradation during testing.
The bridge circuit was easy to hook up and adjust to the minimum null
condition. No probe balancing potentiometer was installed and hence the minimum
null voltage was governed by how closely the two probes were electrically matched.
The Hewlett Packard multimeter, although self-calibrating, had a 3.502 mV constant
offset error which had to be subtracted from all mV data obtained in order to reflect
the true output (r.m.s.) voltage. Two soldered electrical connections at the probe
lead /coaxial cable junctions failed and had to be repaired at approximately 95
cycles. The 50/50 lead tin solider was heavily oxidized and very brittle, requiring re-
stripping of the probe leads and coaxial cables. The newly soldered connections
were wrapped with woven fiberglass sheet material in an attempt to retard further
environmental degradation. Although wrapping the connections with Teflon® tape
would have given better protection the fiber glass sheet provided sufficient shielding
to conduct the remaining test runs.
B. BRIDGE CIRCUIT RESPONSE
The bridge output voltage (Vo) was shown in Chapter III to be given by the
relation:
24

Bridge output — Vo = Zl Z2RL + Zl RR + Z2
•Vi (Eq4.1)
Where Zl is the magnitude of the reference probe impedance, RL is the
resistance of the upper left bridge leg, Z2 is the magnitude of the testing probe
impedance, and RR is the resistance of the upper right bridge leg. The bridge
analysis for ideal conditions was developed in Chapter III and resulted in the
following bridge element parameter combinations for a perfect null condition:
Zl RLZ2
=RR ^ 4 -4 >
BE= § ^ 4'5)
As discussed in Chapter III, the perfect null conditions were not obtained nor
were they necessary to the success of this monitoring concept. However, the null
unbalance voltage should be minimized within reasonable constraints. An additional
probe balancing potentiometer could easily be employed to further minimize the
null unbalance voltage and is discussed in Chapter V. With only resistance
adjustment incorporated into the design of the bridge circuit, minimum null
condition bridge outputs on the order of 4.5 to 5.5 mV were achieved with a ten volt
(peak to peak) input signal. These minimum null bridge output values were later
shown to be sufficient for verification of the monitoring concept. Although the
bridge circuit used was not ideal, a mathematical model of the theoretical bridge
output as a function of the change in the impedance of the testing probe was used for
qualitative comparison with the actual bridge output during testing using a pure
aluminum test sample. The actual values of the bridge elements contained in
Equation 4.3 were measured at isothermal conditions for temperatures of either
120°C or 200°C with a pure aluminum test sample using an impedance analyzer
25

which generated a one volt (peak to peak) input voltage at 50 K Hertz. The resulting
values are listed in Table 4.1
TABLE 4.1 Measured Bridge Element Values
Temp.°C RL(Q) RR(Q) Zl (Q) Z2(Q)
120° 84.343 82.624 20.427 19.937
200° 84.343 82.624 21.054 20.447
Based on known physical principles, i.e. a linear decrease in the resistivity of
aluminum with decreasing temperature, theoretical bridge output v.s. time curves
were calculated and plotted as shown in Figure 4.1.
w\-_i
o>E
-..-™™™*™-.
ttmHMWM
M 2oo°c
i
» 1 20°C
10 20 30 40
ARBITRARY TIME SCALE
50
Figure 4.1 Theoretical Bridge Output Response (Pure Aluminum Samples)
26
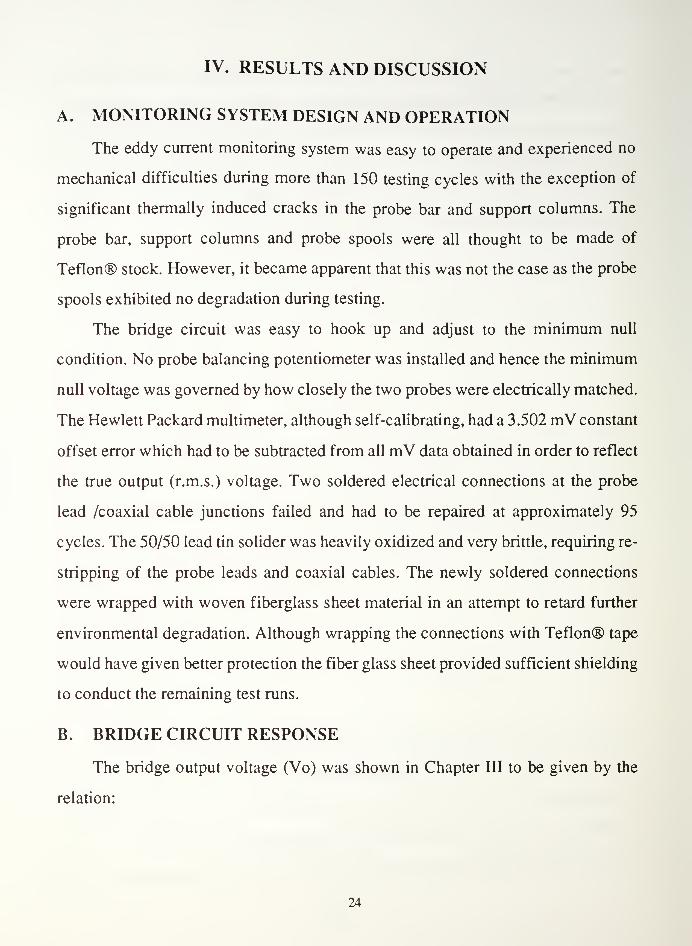
In practice, this involved assumption of initial values for Z2 (testing probe
impedances) which were higher values than shown in Table 4.1 . These values were
decreased in steps to the final values shown in Table 4.1. The higher starting values
of Z2 reflect a lower resistivity of the cool test sample when initially inserted into
the testing apparatus. The curve characteristics shown in Figure 4.1 were then
compared to the plots obtained for actual testing with the pure aluminum samples
and shown in Figure 4.2. The response is clearly very similar to the predicted bridge
output. Also, the fully annealed pure aluminum does not exhibit any change in
resistivity under isothermal conditions. The constant final steady-state output
indicated that the testing system's response under isothermal conditions is
consistent with the absence of aging response under these conditions.
10
TIME(SEC)10 10
Figure 4.2 Experimental Bridge Output Response (Pure Aluminum Samples)
27
C. EXPERIMENTAL MEASUREMENT RESULTS FOR Al 7075 ALLOY
The mV vs. time curves in Figure 4.3 illustrate the bridge output response
characteristics as ANSI 7075 aluminum samples were aged for various times and
temperatures. The bridge output response characteristics for the temperature
transient region were very similar to those obtained from the pure aluminum
samples (Figure 4.2). The peak bridge output values correspond to the point at which
the test samples reach thermal equilibrium. A characteristic and continuous decrease
in bridge output after reaching thermal equilibrium was seen for all test conditions
and the rate of decrease was temperature dependent. The resistivity of the 7075 alloy
is expected to be greatest in the solutionized state, and hence the bridge unbalance
condition would be at its maximum (under isothermal conditions) due to the testing
probe impedance being at its lowest value. Correspondingly, a decrease in the bridge
output from this maximum point reflects a decrease in the alloy's resistivity with
aging. Furthermore, the greater rate of decrease in the alloy's resistivity with
increasing aging temperature is consistent with the physical metallurgy of age
hardening in aluminum alloys.
The peak bridge output values decreased with increasing aging temperature
where as where the corresponding value increased with temperature for the pure
aluminum sample test runs (Figure 4.2). This reversal in peak output voltage trend
with temperature is a result of the differences in the relative magnitudes of the
testing probe impedances when testing the alloy samples as opposed to testing the
pure aluminum.
The question of repeatability of system output was addressed by conducting
multiple tests of 7075 alloy samples at the same aging temperature and initial bridge
null settings. Figure 4.4 illustrates a typical result of these tests. Slight deviations in
the peak bridge output voltages were noted.
28

10" 10
TIME (SEC)
10
Figure 4.3 Experimental Bridge Output Response for AL 7075 Aged at Various
Temperatures
29

18
17
16
15
enH_l
O HE
13
12
11
10
MINIMUM NULL SET AT 120°C
(6.25 VOLTS INPUT) ~H~fHf'
10 10 10J
10
TIME(sec)
10' 10'
Figure 4.4 Experimental Bridge Output Response for Two Test Runs With AL 7075
Aged at 200°C
30

The differences are the result of the extreme sensitivity to variations in
mechanical displacement from the test sample (lift-off distance) as well as sample
surface irregularities. Any type of slight scale or foreign matter would also cause
such variations. Although attempts were made to minimize these factors in this
work, they would be present if such a system is applied to industrial use.
The small test-to-test variation in output voltages could easily cause the testing
system to be inadequate for precise monitoring of the aging process. However, these
effects were minimized by a simple signal processing scheme. The signal processing
scheme consisted of calculating a mean peak bridge output voltage over a short time
span (30-60 sec.) as the sample approached thermal equilibrium. Computing the
percent deviation from these mean peak voltage values resulted in percentage
deviation data which were very consistent and more indicative of resistivity changes
within the test samples. Application of this signal processing scheme to the data
plotted in Figure 4.4 is shown in Figure 4.5. The signal processing scheme did not
change the characteristics of the bridge output, but merely nullified the adverse
effects of minor mechanical irregularities at the probe/test sample interface. Figure
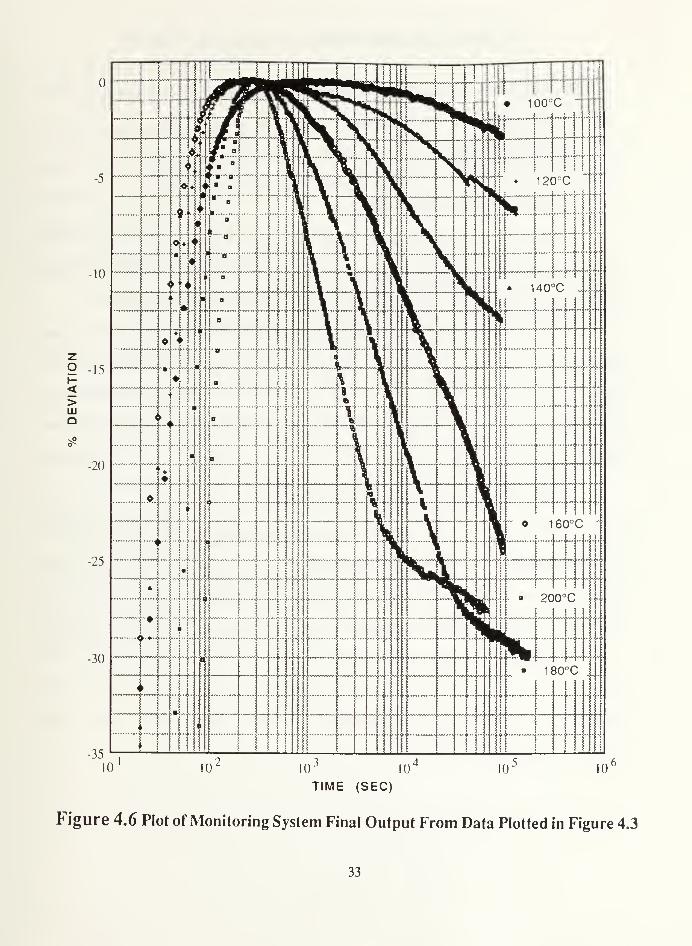
4.6 is a percent deviation v.s. time plot of the data from Figure 4.3 and indicative of
the final monitoring system output for various aging temperatures. Correlation of
these aging curves to the resulting mechanical properties is needed to ensure that
consistent mechanical properties are obtained when the aging process is stopped at
any given value of percent deviation for a specified aging temperature.
31

<>UJQ
-30
-35
MINIMUM NULL SET AT 120°C
(6.25 VOLTS INPUT)—
" y • <
1 1 10 J 10
TIME(sec)
Figure 4.5 Plot of Data From Figure 4.4 After Applying Signal Processing Scheme
to Yield Percent Deviation
32
10"
TIME (SEC)
10 10
Figure 4.6 Plot of Monitoring System Final Output From Data Plotted in Figure 4.3
33

V. CONCLUSIONS AND RECOMMENDATIONS
The conclusions and recommendations discussed below were drawn as a result
of this thesis project.
A. CONCLUSIONS
1. Testing Apparatus Design
The functional aspects of the testing apparatus were sound and need not be
altered to perform future testing. However, a new probe bar and support columns
need to be manufactured from Teflon® stock suitable for 200°C service.
The one-centimeter diameter probes appeared to be mechanically sound
showing no indications of material or electrical degradation after more than 150
cycles. The probes also provided detectable impedance changes as a result of the
aging process. However, no other probe sizes were tested to determine the optimum
probe coil configuration.
2. Bridge Circuit Design and Operation
The bridge circuit was easy to adjust for minimum null and provided for
easy connection to the appropriate components of the monitoring system. Sufficient
sensitivity was achieved with final output percent deviations on the order of 6-7%
after approximately 24 hours of aging at 120°C (approximately T6 aging condition).
The bridge circuit allowed only for balancing the resistance legs of the
bridge circuit and resulted in a minimum null condition which could be improved by
installing a balancing potentiometer between the probe coils (see
recommendations).
34

3. Monitoring Concept
The monitoring concept was determined to be valid as verified by the
resulting significant decreases in percent deviation from the mean peak bridge
output voltages with time at isothermal conditions. Also, the rate of decrease in final
output increased with aging temperature which is consistent with the known aging
response of AL 7075.
B. RECOMMENDATIONS
The bridge circuit design should be revised to allow independent balancing of
the probe impedances (magnitudes). Figure 5.1 shows a simple alternate circuit
which would provide the necessary additional adjustment.
Mechanical testing of aluminum alloy samples aged to the same percent
deviation needs to be conducted to establish and verify the direct link between the
testing system output and the corresponding mechanical properties. Conducting
multiple tests, as mentioned above, at various aging temperatures would result in
system characteristic curves of percent deviation v.s. mechanical property.
The voltage source testing frequency of = 52 KHz. was used to maximize depth
of penetration. However, greater measurement sensitivity could be achieved at
greater frequencies. Further tests need to be conducted to optimize the balance
between test frequency and depth of penetration. [Ref. 2 and 6]
35

INPUT NODE
R1 R2
LEFT NODE
\\
A/VWVWV(POT. 1)
(POT. 2)
A/WWVWVf-i-T * I D/l ir
RIOHTNQDE
measured(BRIDGE UNBALANCE VOLTAGE)
input
Figure 5.1 Alternate Testing Circuit Schematic Diagram
36

LIST OF REFERENCES
1. Askeland, Donald R., The Science and Engineering of Materials, PWS-KENTPublishing Co., 1989.
2. Metals Handbook, 9th Ed., Vol. 2, edited by Baker, Hugh, et. al., ASMInternational, 1979.
3. Metals Handbook, 9th Ed., Vol. 17, edited by Lampman, Steven R., et. al., ASMInternational, 1989.
4. Rummel, W. D., Characterization of2014, 2219, 6061 and 7075 Aluminum Alloy
Heat Treatment Response by Eddy Current Conductivity, Hardness and Mechanical
Properties, American Society for Nondestructive Testing, Inc., 1980.
5. Seltzer, David D., Correlation of Conductivity to Mechanical Properties ofAge-
Hardenable Aluminum Alloys Using Eddy Current Methods, Paper from the
"Proceedings for the Fifth International Conference on Nondestructive Testing",
Dept. of Energy, Mines and Resources, 1969.
6. Chihoski, R. A., et. al., Effect of Specimen Thickness, Cladding and Lift-off
Adjustment on the Conductivity of 7075-T6 Aluminum Alloy, Paper from the
"Proceedings for the 1st National Symposium for Nondestructive Testing of
Aircraft Components", 1960.
37
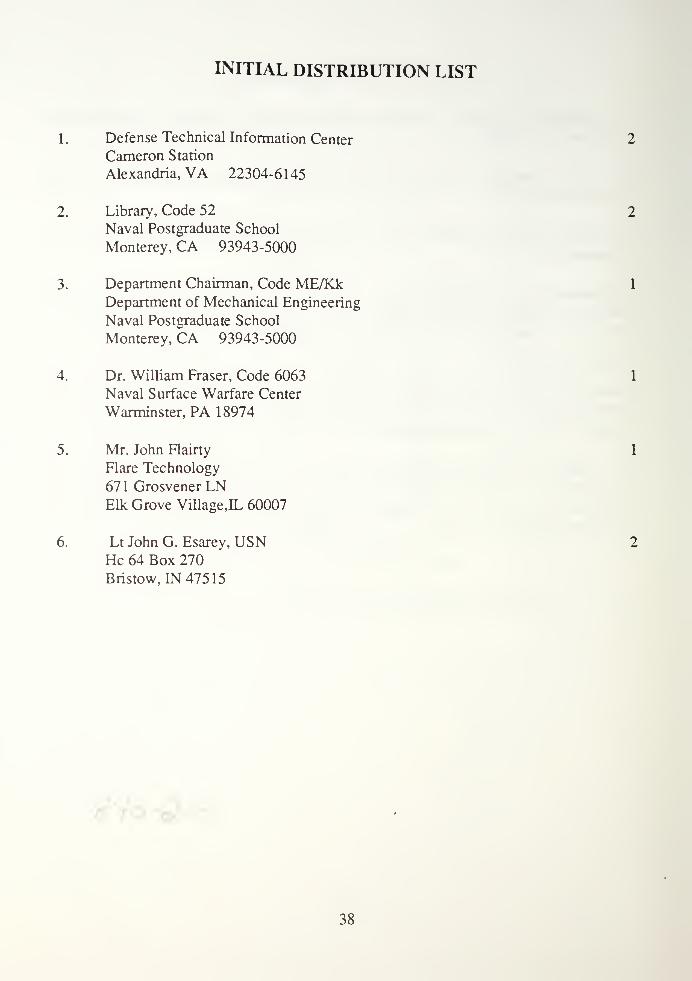
INITIAL DISTRIBUTION LIST
1. Defense Technical Information Center
Cameron Station
Alexandria, VA 22304-6145
2. Library, Code 52
Naval Postgraduate School
Monterey, CA 93943-5000
3. Department Chairman, Code ME/KkDepartment of Mechanical Engineering
Naval Postgraduate School
Monterey, CA 93943-5000
4. Dr. William Fraser, Code 6063
Naval Surface Warfare Center
Warminster, PA 18974
5. Mr. John Flairty
Flare Technology
67 1 Grosvener LNElk Grove Village.IL 60007
6. Lt John G. Esarey, USNHe 64 Box 270
Bristow, IN 47515
38


Thesis
E658 Esarey"i continuous measurement
by eddy current methods of
age hardening in aluminum
alloys.
,
Thesis
E658 Esarey
c.l Continuous measurement
by eddy current methods of
age hardening in aluminumalloys.
AO-93