continuous improvement cells in the highways supply chain · • leads to better task promises in...
TRANSCRIPT
Continuous Improvement Cells in the Highways Supply Chain: Benefits and Challenges
Algan TezelLauri KoskelaPatricia Tzortzopoulos
May 2017

3
;'%0#,(!!!
!!;/24$!<.=./!"#!$! %&#&$%'(!)&**+,! $-! -(&!
.//+0$-"0&!1&#"2/! 3$4!5.1367! 8"#!
%&#&$%'(!"/-&%&#-#!"/'*9:&!
'+/#-%9'-"+/!;%+:9'-"+/!
<$/$2&<&/-=! *&$/! '+/#-%9'-"+/! $/:! .>! "/!'+/#-%9'-"+/7! 8&! "#! $! '"0"*! &/2"/&&%! ,"-(!"/:9#-%?!&@;&%"&/'&!"/!'+/#-%9'-"+/!;%+A&'-!<$/$2&<&/-7!!
!>4',&!?#(@./4!"#!$!;%+)&##+%!+)!B%+A&'-!C$/$2&<&/-!$-!D/"0&%#"-?!+)!89::&%#)"&*:7!8&!($#!4&&/!"/0+*0&:!"/!%&#&$%'(!+/!*&$/!'+/#-%9'-"+/!#"/'&!EFFE7!8"#!
%&#&$%'(!($#!)+'9#&:!&#;&'"$**?!+/!-(&!-(&+%"&#!+)!;%+:9'-"+/!<$/$2&<&/-!$#!,&**!$#!;%+A&'-!<$/$2&<&/-=!9/:&%*?"/2!*&$/!'+/#-%9'-"+/7 !
!!A4%,&B&4!<=#,%=#+#'/#(!"#!$!;%+)&##+%!+)!./-&2%$-&:!1&#"2/7!G(&!"#!-(&!8&$:!+)!1&;$%-<&/-!+)!H%'("-&'-9%&!$/:!I1!1&#"2/!$-!D/"0&%#"-?!+)!89::&%#)"&*:7!
8&%!'$%&&%!&/'+<;$##&#!:&#"2/=!$%'("-&'-9%&!$/:!-(&!49"*-!&/0"%+/<&/-=!,"-(!$!)+'9#!+/!<9*-":"#'";*"/$%"-?=!"/-&2%$-"+/!4&-,&&/!:&#"2/!$/:!'+/#-%9'-"+/!-(%+92(!'+**$4+%$-"0&!,+%J"/2!$/:!K.C=!$/:!0$*9&!2&/&%$-"+/!"/!:&#"2/7!
!!
!)$$#-4%&-.!H.(&2$!>4I!J.(.4,B0!".$%,.!K!L$&-.,(&%5!#9!
1'::.,(9&./:!!
.13!"#!$!/&,!"/-&%:"#'";*"/$%?!%&#&$%'(!'&/-%&L*$4+%$-+%?!$-!-(&!D/"0&%#"-?!+)!89::&%#)"&*:7!
>(&!*$4!'+/:9'-#!-(&+%?!4$#&:!$/:!$;;*"&:!%&#&$%'(!2&/&%$**?!"/-+!;%+:9'-!:&#"2/=!$/:!&#;&'"$**?!"/!-(&!49"*-!&/0"%+/<&/-=!;9#("/2!-(&!"<;$'-!+)!:&#"2/!-("/J"/2!$/:!;%$'-"'&!-+!/&,!$%&$#7!.-!'9-#!$'%+##!-(&!$%&$#!+)!$%'("-&'-9%$*!:&#"2/=!'+/#-%9'-"+/!<$/$2&<&/-=!"/-&%"+%!:&#"2/=!/&,!;%+:9'-!:&0&*+;<&/-=!&/2"/&&%"/2=!#+'"$*!#'"&/'&#!$/:!(&$*-('$%&7!
M9%!%&#&$%'(!)+'9#&#!+/!#+*0"/2!%&$*!,+%*:!;%+4*&<#!-(%+92(!:&#"2/!"//+0$-"+/=!<+4"*"#"/2!-(&!9/:&%*?"/2!-(&+%"&#!$#!,&**!$#!-(&!&/$4*"/2!;%+'&##&#!$/:!-&'(/+*+2"&#!/&&:&:!-+!:&*"0&%!0$*9&!-+!9#&%#!$/:!-(&!#+'"&-?!$-!*$%2&7!M9%!%&#&$%'(!"#!:&0&*+;&:!
'*+#&*?!,"-(!:"0&%#&!;94*"'!$/:!;%"0$-&!#&'-+%!+%2$/"#$-"+/#!-+!;%+;+#&!/+0&*!#+*9-"+/#!-+!:&#"2/!'($**&/2&#!$/:!;%+A&'-!4$#&:!;%+4*&<#7!
M!;/24$!<.=./N!>4',&!?#(@./4N!A4%,&B&4!<=#,%=#+#'/#(!!!!
H**!%"2(-#!%&#&%0&:N!/+!;$%-!+)!-("#!;94*"'$-"+/!<$?!4&!%&;%+:9'&:=!#-+%&:!"/!$!%&-%"&0$*!#?#-&<=!+%!-%$/#<"--&:!"/!$/?!)+%<!+%!4?!$/?!<&$/#=!&*&'-%+/"'=!<&'($/"'$*=!;(+-+'+;?"/2=!%&'+%:"/2=!+%!+-(&%,"#&!,"-(+9-!;%"+%!,%"--&/!;&%<"##"+/!+)!-(&!'+;?%"2(-!
+,/&%7!8+,&0&%=!-(&%&!"#!/+!%&#-%"'-"+/!+/!-(&!+/,$%:!'"%'9*$-"+/!+)!-("#!%&;+%-!"/!&*&'-%+/"'!)+%<!;%+0":&:!"-!"#!-%$/#<"--&:!"/!"-#!&/-"%&-?7!B&%<"##"+/!-+!9#&!'+;?%"2(-!<$-&%"$*!($#!4&&/!#+92(-!$/:!+4-$"/&:!,(&%&!;+##"4*&7!O("*&!$**!%&$#+/$4*&!&))+%-#!($0&!4&&/!<$:&!4?!-(&!D/"0&%#"-?!+)!89::&%#)"&*:!-+!-%$'&!$/:!+4-$"/!;&%<"##"+/!)%+<!'+;?%"2(-!(+*:&%#!#+<&!<$-&%"$*!<$?!($0&!4&&/!"/'*9:&:!,(&%&!-("#!($#!;%+0&/!"<;+##"4*&!,"-("/!-(&!-"<&!*"<"-#!$0$"*$4*&7!>(&!D/"0&%#"-?!+)!89::&%#)"&*:!,"**!4&!;*&$#&:!
-+!<$J&!$<&/:#!-+!$/?!#9'(!'+;?%"2(-!(+*:&%#!$-!-(&!&$%*"&#-!;+##"4*&!+;;+%-9/"-?7!B*&$#&!'+/-$'-!49#"/&##P(9:7$'79J7!

4
Table of Contents AUTHORS 3
TABLE OF CONTENTS 4
EXECUTIVE SUMMARY 5
INTRODUCTION 8
DATA COLLECTION 17
FINDINGS 22 OBSERVATIONS 22 FINDINGS FROM HIGHWAYS ENGLAND 34 INTERVIEWS AND TEAM DISCUSSIONS 34 EFFECT OF CI CELLS ON STAFF ENGAGEMENT 39 EFFECT OF CI CELLS ON REDUCING TEAM MEETING DURATIONS 44 EFFECT OF CI CELLS ON MAKING MORE RELIABLE TASK PROMISES 47 FINDINGS FROM THE SUPPLY CHAIN 48 CONSTRUCTION SERVICE SUPPLIER (SCHEME 1) 49 DESIGN SERVICE SUPPLIER (TEAM M) 58 FINDINGS FROM NETWORK RAIL 60
SUGGESTIONS TO IMPROVE THE CURRENT CI CELLS IN THE HIGHWAYS SUPPLY CHAIN 68
SUMMARY AND CONCLUSION 72
ACKNOWLEDGEMENT 73
REFERENCES 74
5
Executive Summary Continuous Improvement (CI) cells have been in effect as part of the Lean process improvement initiative in the highways supply chain since the late 2000s. CI cells have been deployed within a number of teams across Highways England since 2014. Highways England has a headline target of time savings of 5% as a result of the deployment of CI cells within these teams. This Highways England sponsored research report presents CI cell benefits and challenges captured from Highways England, the highways supply chain and Network Rail between July and November 2016. Quantitative and qualitative evidence were found as to the following CI cell benefits. CI cells: Help save team resources
• Solely the reduction of meeting times saves 2.1 - 3.5% of total effective work time for some teams (other benefits come on top of this).
Induce higher team engagement
• Helps Highways England’s outstations deploying CI cells increase their team engagement scores by 165% more on average than the outstations not deploying CI cells. While the mean increase in team engagement scores of the outstations deploying CI cells was 10.7, the mean increase in team engagement scores of the outstations not deploying CI cell remained at 4.05 in the 2014-2015 period.
Facilitate productivity increase
• Leads to better task promises in the supply chain and to an estimated 14% productivity increase in one Highways England team by helping the team maintain a high Percent Plan Complete (PPC) score.
Also, CI cells were found effective in: Team coordination
• Providing structure and focus to team meetings (succinct meetings), • Supporting team coordination, • Simplifying progress reporting and creating meeting minutes, • Supporting teams’ understanding of their clients.
Increasing process transparency
• Exposing team related information (i.e. KPIs, responsibilities) to team members,
• Increasing transparency in team information, • Facilitating better information flow for team members.
Team building and coaching
• Helping with team building, • Presenting an effective coaching mechanism, • Inducing discussions and interaction among team members, • Functioning as a training mechanism for junior and new team members,

6
• Increasing team engagement and morale. Task and resource management
• Facilitating task ownership, • Supporting task planning and control, • Leading to better task promises by team members, • Helping with team resource allocation and levelling (work balancing/
prioritising), • Helping save team resources, • Supporting task delegation, empowerment and employee autonomy.
Continuous improvement
• Regularly prompts people to take the time to think about and review their work, • Helps with early problem identification, • Offers a problem solving and work improvement opportunity.
The main challenges of the CI cells are associated with:
• The lack of systematic data recording, • Not knowing what to measure as to the CI cell benefits; although some teams
have been trying to capture the benefits of the outcomes of their continuous improvement efforts from their CI cell practice, there are no standardised CI cell-specific measures,
• Hardships faced in executing the continuous improvement function of CI cells, • Ad-hoc nature of problem solving and • The low level of standardisation.
Based on those challenges, a detailed set of suggestions is given in the report. Some of the important suggestions to improve the current CI cell practices are; Training
• Basic Lean training (Lean awareness training) should cover the content (the team performance, work tracking and 3C sections – the main work improvement section of CI cells) and mechanism of CI cells in more detail. The CI cell constitutes one of the fundamental blocks of the current Lean implementation in the supply chain with many benefits.
• Systematic problem solving techniques, particularly simple root-cause analysis methods (i.e. Pareto charts, fishbone diagrams, 5 Whys, scatter plots, histograms etc.) can be taught to some team members for them to employ those techniques in the 3C sections of their CI cells for better root cause identification.
Execution • The level of standardisation in CI cell board design and execution should be
increased across the supply chain and in Highways England. Highways England can lead by introducing its standard board template similarly to Network Rail.
• Root causes should be recorded, grouped and classified systematically for further work improvement and analyses. There are many relatively simple “cause and effect” analysis methods that can be employed.

7
• Information on the CI cells should be hierarchically cascaded and aligned. • A complete audit of the existing CI cells for their measured performance figures,
task tracking system and the 3C exercise will be useful.
Benefits recording • A set of measures can be introduced to the teams specifically for their CI cell
benefits and performance; (i) Percent Plan Complete (PPC – on-time tasks realised/total number of tasks planned) in a reporting period (month/week), (ii) number of raised concerns over time, (iii) team meeting attendance figures, (iv) trend graphs in team performance, (v) ratio of total concerns solved/ total concerns raised in a reporting period (month/week), (vi) meeting durations, (vii) monetary amount of resources saved through the CI cells, and (viii) adopted improvements/person/year.
Incentivisation
• In order to keep the teams’ focus on continuous improvement, motivation and incentivisation efforts should be directed more to the continuous improvement part of the CI cells.
• An incentivisation programme between and within the teams can be initiated in the form of an amicable competition.
• Successful CI cell practices and team members should be publicly praised on a praise/success board or in an appreciation area in the offices.
Future research
• Investigating why certain teams are successful and others fail - the critical success factors.
• Researching the benefits in more detail in the form of summative evaluation. • Formative evaluation on how the programme can be improved. • Understanding which factors in CI cells lead to better job satisfaction • Comparing two similar teams, one deploying CI cells and the other not, with
respect to their KPIs and team member engagements will be useful. • Investigating where the teams are allocating the saved resources through their
CI cell practices will present another interesting research opportunity. How the saved resources are being used is not known at the moment.
Highways England is one of the leading organisations driving Lean process improvement through the construction and asset maintenance sector in England. The organisation’s Lean related practices and priorities diffuse in service suppliers as important points on their process improvement agenda. Therefore, it is critical for Highways England to maintain its leading role by continuing supporting innovation and by improving its existing practices such as CI cells.

8
Introduction Continuous Improvement (CI) cells are a work improvement technique, which originated from the concept of Quality Circles (QCs), and their derivative methods Small-Group Activities (SGAs) in the Lean context (Miron et al., 2016). Quality Circles were seen as an effective mean for productivity improvement, cost savings, and work quality improvement (Wood et al., 1983). They provide a platform to enable an organisation to take advantage of the creative intelligence of their employees (Rafaeli, 1985). It is important to determine objectives and expected benefits prior to the deployment of Quality Circles and similar Small-Group Activities and plan an evaluation programme for these (Sherwood et al., 1985). The most frequently stated objectives of Quality Circles in the literature are (Hunt, 1984; Rafaeli, 1985): (i) to reduce errors and enhance quality of products, (ii) to inspire more effective teamwork and job involvement, (iii) to improve company communication, (iv) to promote a problem solving capability, (v) to create an attitude of "right first- time" and problem prevention, (vi) to develop effective relationships between management and workers, and (vii) to increase employee motivation. SGAs for work review and improvement are executed on visual boards and systems, which links them to Visual Management, workplace transparency and creating a visual workplace (Greif, 1991). In fact, deploying visual team performance centres/ areas, in which the team members can collectively review their work performances and perform problem solving and continuous work improvement activities, is recommended as one of the first steps to creating a Lean visual workplace (Suzaki, 1995; Galsworth, 2005). As continuous improvement (kaizen) is one of the fundamental blocks of Lean (Imai, 1997), SGA or CI cell meetings are sometimes referred to as kaizen meetings. Also, because of presenting a systematic performance review and an improvement mechanism, CI cells are part of the performance management of organisations deploying Lean management (Rich et al., 2006) (see Figure 1).
Figure 1. Continuous Improvement cells (CICs) are at the intersection of Small Group Activities, Performance Management and Visual Management.

9
Several benefits have been identified for QCs, including greater output, lower cost, improved communication and harmony in the work environment (Hunt 1984), higher work moral, motivation, reduction in conflict (Wood et al., 1983), financial survival and growth, confidence and certainty among employees that their organisation will be successful, and increased level of quality consciousness amongst employees (Dale and Lees, 1987). Regarding QCs’ quantitative benefits, Hutchins (1985) claims that QCs in Japan contribute 16% of the total profit of manufacturing companies, and that they are responsible for 25% of the profits in one large company. Hence, QCs have a great potential in cost savings. However, Hutchins (1985) did not explain the methodology by which he could measure those benefits and he also did not determine in what stage of the deployment QCs could contribute to profit margins of companies. Indeed, according to Howard (1986), the benefits of SGAs are neither quantifiable nor certain. Miron et al. (2016) compiled the benefits of CI cells as follows: (i) supporting job enrichment for team members, (ii) developing problem solving skills, (iii) goal setting and feedback, (iv) increasing participation and teamwork, and (v) supporting organisational communication. In accordance with the literature (Rother, 2009; Liker and Meier, 2006; Hamel, 2010; Soltero and Boutier, 2012), the key requirements for a successful continuous work improvement and visual performance management system, into which the CI cell can be classified, are:
• An organisational culture and leadership that prompt people to be dissatisfied with the status quo and non-conformances. However, that culture and leadership will not blame people for the experiments and improvement ideas that did not work as intended.
• An active support for continuous improvement. The active support means involving senior management and committing enough resources to systematically train people on continuous improvement techniques and for people to realise their work improvement ideas. Management must be committed to invest into the system (allowing mistakes, concentrate on solutions not hurdles etc.). Success cannot be ordered but supported.
• People should be allowed enough time from their day-to-day duties for continuous improvement.
• A careful selection of performance metrics whose non-conformances can be put through the continuous improvement and problem solving process. Target and actual conditions should be clearly visible.
• Successful continuous improvement efforts and individuals behind them should be openly praised, with success stories being shared with other teams. It is important to make the short term gains widely heard to raise the buy-in and motivation.
• Objective targets to be set (i.e. “decrease the number of accidents by 30%”). • Analytic methods to be used for the “cause and effect” analysis and benefits
capturing. • Visualisation of the problem solving and work improvement process. One
should not rely on plain figures or verbal narratives. The A3 methodology is an effective approach.
• The visual information on work improvement boards should tell a story at a glance.
10
• Problem causes and improvement ideas should be prioritised. Teams should treat one problem cause and work improvement idea at a time.
• The management should attend team meetings and walks through the workplace to check the boards regularly.
• Real work improvement and problem solving cannot be achieved in silos isolated from the rest of the organisation. Improvement efforts by the teams must be vertically (with superintendents) and horizontally (with peers) connected, aligned and feeding each other.
• When an organisational structure is too rigid and bureaucratic for people to experiment with new ideas, the interest for work improvement can get easily lost. The organisational structure should allow people to experiment with new ideas.
• It is critical to render the CI cell and continuous improvement practices an integral part of the organisation’s culture in the long-term.
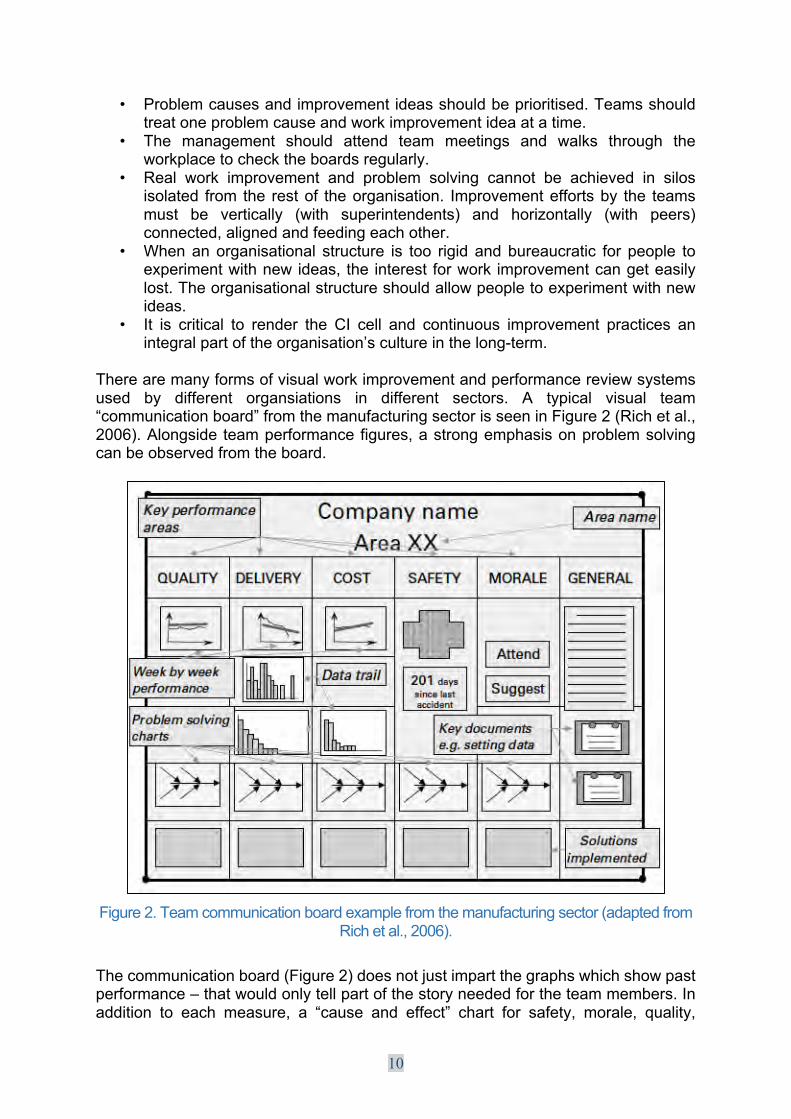
There are many forms of visual work improvement and performance review systems used by different organsiations in different sectors. A typical visual team “communication board” from the manufacturing sector is seen in Figure 2 (Rich et al., 2006). Alongside team performance figures, a strong emphasis on problem solving can be observed from the board.
Figure 2. Team communication board example from the manufacturing sector (adapted from
Rich et al., 2006).
The communication board (Figure 2) does not just impart the graphs which show past performance – that would only tell part of the story needed for the team members. In addition to each measure, a “cause and effect” chart for safety, morale, quality,
11
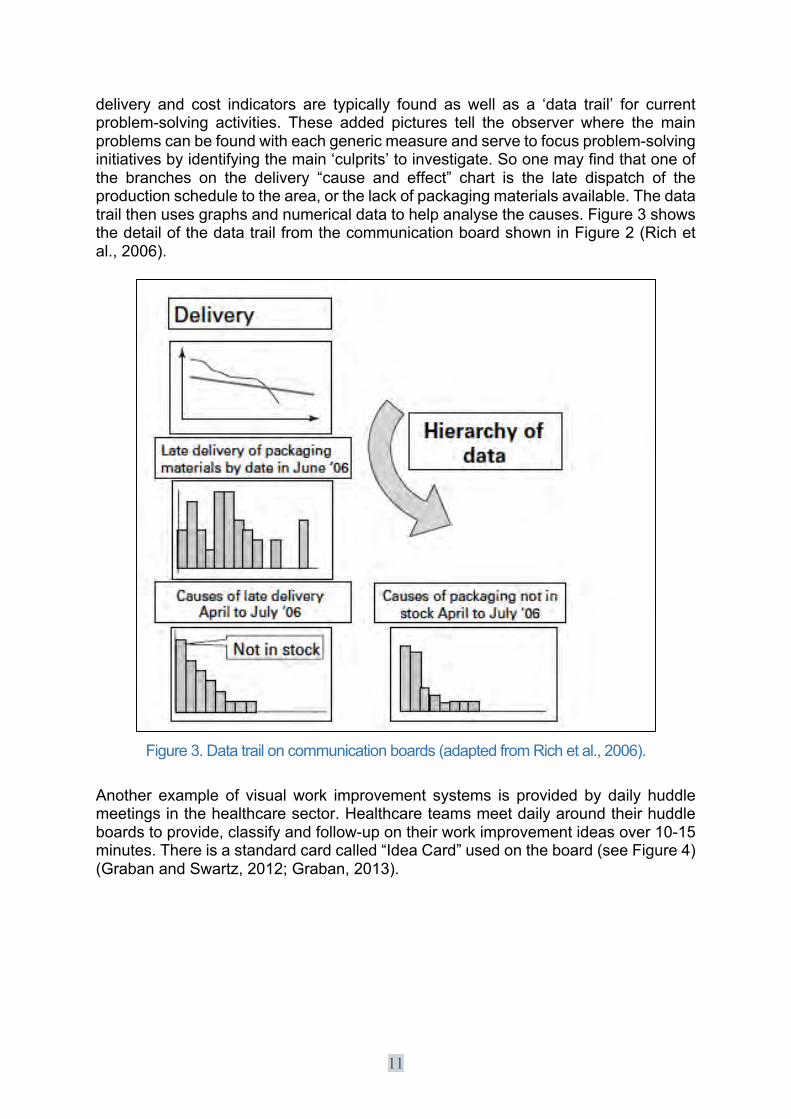
delivery and cost indicators are typically found as well as a ‘data trail’ for current problem-solving activities. These added pictures tell the observer where the main problems can be found with each generic measure and serve to focus problem-solving initiatives by identifying the main ‘culprits’ to investigate. So one may find that one of the branches on the delivery “cause and effect” chart is the late dispatch of the production schedule to the area, or the lack of packaging materials available. The data trail then uses graphs and numerical data to help analyse the causes. Figure 3 shows the detail of the data trail from the communication board shown in Figure 2 (Rich et al., 2006).
Figure 3. Data trail on communication boards (adapted from Rich et al., 2006).
Another example of visual work improvement systems is provided by daily huddle meetings in the healthcare sector. Healthcare teams meet daily around their huddle boards to provide, classify and follow-up on their work improvement ideas over 10-15 minutes. There is a standard card called “Idea Card” used on the board (see Figure 4) (Graban and Swartz, 2012; Graban, 2013).

12
!W"29%&!V7!H!:$"*?!(9::*&!4+$%:!&@$<;*&!)%+<!-(&!(&$*-('$%&!#&'-+%!5$:$;-&:!)%+<!X%$4$/=!
]^EI67!!>(&!(9::*&!;%+'&##!"#!;%&#&/-&:!"/!W"29%&
13
W"29%&![7!1$"*?!(9::*&!;%+'&##!5$:$;-&:!)%+<!X%$4$/=!]^EI67!
./!-(&!&/&%2?!#&'-+%=!$!,+%J!"<;%+0&<&/-!<&-(+:+*+2?!'$**&:!i.<;%+0&<&/-!Y$-$j!)+%!0"#9$*!'+/-"/9+9#!"<;%+0&<&/-!($#!4&&/!&@&'9-&:!+/!HI!#(&&-#!5G+4&J!$/:!G<$**&?=!]^EEN!K"//&%-#=!]^E[67!>(&
14
Figure 6. A3 Improvement Kata from the energy sector (adapted from Binnerts, 2015).
Another generic A3 example from the manufacturing sector is given in Figure 6 (Eaton, 2013). The problem background section provides essential information on the extent and importance of the issue under review and should also detail how, through tackling this project, the organisation will benefit. The current condition section provides a concise summary of the current situation and should include any charts, key statistics, drawings and anything else that will be useful in defining the problem. The measures of success section specifies the expected improvements that will occur by tackling this project. The most common problem for this section is not being specific about the measure; specific measures such as ‘reduce rework by 15%’ or ‘eliminate 95% or more of all packaging within three months’ are useful. The root cause analysis section is concerned with exploring the root cause of the problem in question. The future state section, also sometimes referred to as ‘countermeasures’ on some forms, provides a summary of the changes that will be implemented to enable the improvements to occur. The confirmation of future state section, also sometimes referred to as the ‘effect confirmation section’, covers the work done to study whether or not the implementation of the future state has been effective. The follow-up actions lists the actions that need to be completed to ‘close off’ the future state. This action plan should be managed proactively to close off the actions as quickly as possible. The example A3 sheet given in Figure 7 has been completed up to the point of 30 days after the implementation of changes (Eaton, 2013).

15
Figure 7. A generic A3 example from the manufacturing sector (adapted from Eaton, 2013).
The CI cell has been used in the highways supply chain since the late 2000s. An earlier example of this practice from 2010 was identified from Highways England’s archives (see Figure 8 - 9). It was classified as a Visual Management practice with the recorded benefits such as improved team communication and coordination, serving as a central point where key information is located, providing a forum where all site staff are able to raise and log issues, and a focus on continuous reduction of fixed site costs. This earlier version of the CI cell contains information on team performance figures, and a continuous improvement and problem solving sheet called the 3C, which stands for concerns, causes and countermeasures, a shortened (simplified) form of the PDCA process and the A3. As explained in the subsequent sections, the 3C still constitutes the basis of the systematic continuous improvement and problem solving in the highways supply chain. The research presented in this report aimed at capturing the benefits of CI cells in Highways England, understanding the practical challenges associated with the current use of CI cells and proposing CI cell improvement suggestions for the highways supply chain.

16
!W"29%&!\7!H/!&$%*?!&@$<;*&!+)!U.!'&**!4+$%:#!)%+<!8"2(,$?#!R/2*$/:f#!$%'("0!
!!
!
!W"29%&!F7!IU!:+'9<&/-!h!4$#"#!+)!-(&!'+/-"/9+9#!"<;%+0&<&/-!$/:!;%+4*&<!#+*0"/2!"/!
("2(,$?#!U.!'&**#7!!!

17
Data Collection Data was collected from four organisations; (i) Highways England, (ii) one design service supplier, (iii) one construction service supplier (joint-venture) from the highways supply chain and (iv) Network Rail for benchmarking. From Highways England, alongside the organisation’s archives, 12 CI cells of different Highways England work teams were studied to explore CI cell benefits and improvement opportunities. The cells were identified with the help of Highways England’s Lean process improvement team. The data from the 12 CI cells were collected through interviews with the team members, observations of the CI cell boards, CI cell meeting observation (a research team member observed some teams’ CI cell meetings), discussions with the team members during the CI cell meeting participations and review of some teams’ past data (if available). Also, descriptive and inferential statistical analysis methods were employed on Highways England’s archive data to investigate if there is a statistically significant difference between the Highways England teams deploying and not deploying CI cells in terms of their staff engagement scores. Details of the data collection from Highways England can be seen in Table 1.

18
Table 1. Details of the data collection from Highways England Data
Source General Information Data Collection Methods
CI C
ells
Team Name
Location CI Cell Type*
Virtual or Real CI Cell**
Interviews CI cell Board Observation
CI cell Meeting
Participant Observation
Discussions with Team Members
Review of Team's Past CI Cell Data
for Benefits Identification
Comparative Study against
Similar Team(s) not
using CI Cells
Notes
A Lancashire Type II Virtual Interviews with 2 team members
Yes No Yes No No
B Lancashire Type I Real Interview with 1 team
member
Yes No Yes Yes No
C Lancashire Type II Real Interviews with 2 team members
Yes Yes Yes Yes No
D Lancashire Type I Real Interview with 1 team
member
Yes Yes Yes N/A No
E Lancashire Type I Real Interview with 1 team
member
Yes Yes Yes N/A No
F Lancashire Type I Real No Yes N/A - Team stopped their
CI cell meetings
Yes N/A No Team stopped
executing the CI cell
mechanism and
reverted back to their old meeting regime with a passive
team notice board
G West Yorkshire
Type II Real Interview with 1 Lean
Team member
facilitating
Yes Yes Yes Yes Yes
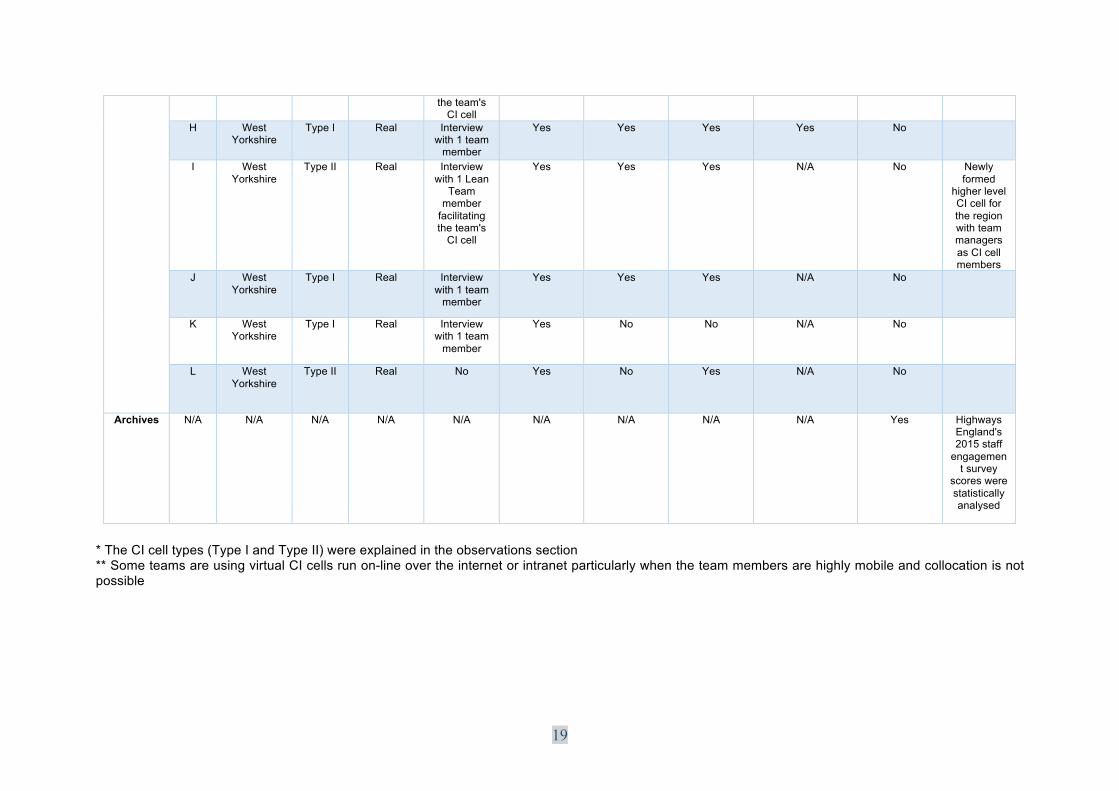
19
the team's CI cell
H West Yorkshire
Type I Real Interview with 1 team
member
Yes Yes Yes Yes No
I West Yorkshire
Type II Real Interview with 1 Lean
Team member
facilitating the team's
CI cell
Yes Yes Yes N/A No Newly formed
higher level CI cell for the region with team managers as CI cell members
J West Yorkshire
Type I Real Interview with 1 team
member
Yes Yes Yes N/A No
K West Yorkshire
Type I Real Interview with 1 team
member
Yes No No N/A No
L West Yorkshire
Type II Real No Yes No Yes N/A No
Archives N/A N/A N/A N/A N/A N/A N/A N/A N/A Yes Highways England's 2015 staff
engagement survey
scores were statistically analysed
* The CI cell types (Type I and Type II) were explained in the observations section ** Some teams are using virtual CI cells run on-line over the internet or intranet particularly when the team members are highly mobile and collocation is not possible

20
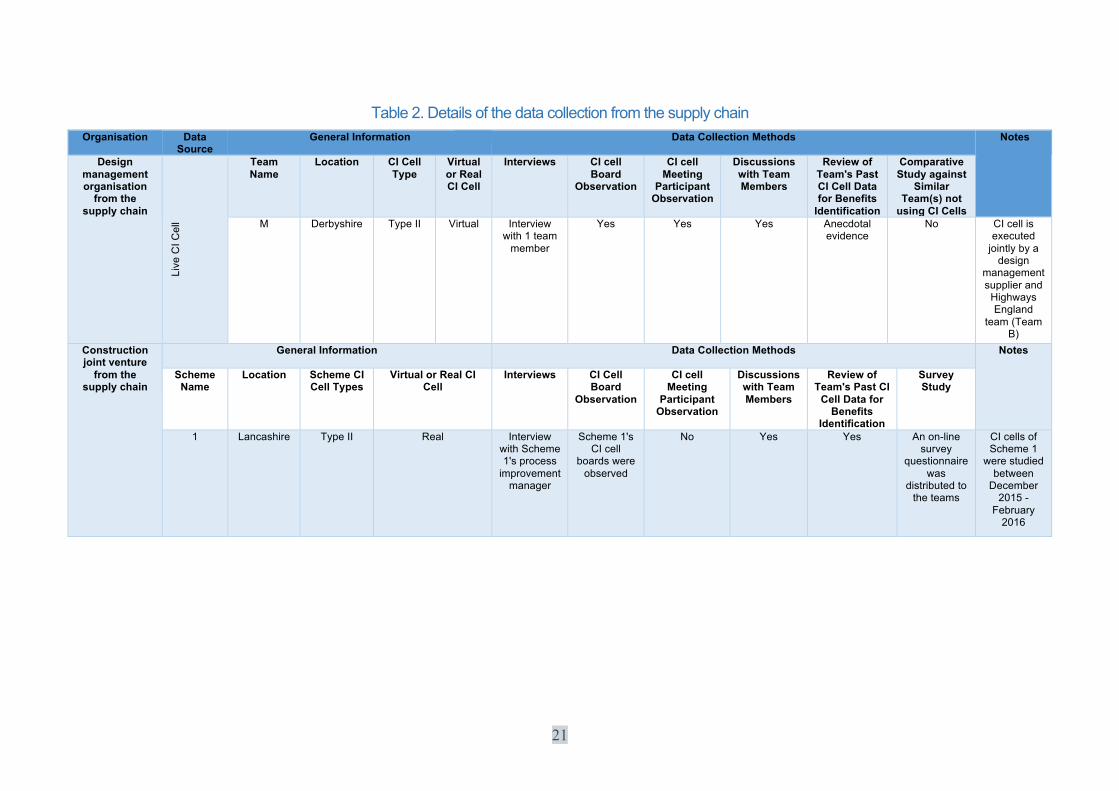
Data collection from the highways supply chain was executed in two organisations.
The first organisation is a Tier 1 (large) joint-venture supplier responsible for the
construction of Scheme 1, a major highways improvement project. The CI cell data
from the joint venture was collected through an in-depth interview with the joint-
venture’s process improvement manager, discussions with the CI cell team members,
observation of the CI cell boards and a survey study among the teams. The second
organisation from the supply chain is a design management service supplier. The data
from the design management supplier was collected through an interview with a
design team member, observation of one of the design team’s CI cell board, attending
a CI cell meeting and discussions with the team members during the meeting
participation. It should be noted that the studied design management team from the
supply chain have been running their CI cell sessions jointly with a Highways England
team (Team B – see Table 1) via an on-line, virtual CI cell mechanism. Details of the
data collection from the supply chain can be seen in Table 2.
21
Table 2. Details of the data collection from the supply chain Organisation Data
Source General Information Data Collection Methods Notes
Design management organisation
from the supply chain
Live
CI C
ell
Team Name
Location CI Cell Type
Virtual or Real CI Cell
Interviews CI cell Board
Observation
CI cell Meeting
Participant Observation
Discussions with Team Members
Review of Team's Past CI Cell Data for Benefits
Identification
Comparative Study against
Similar Team(s) not
using CI Cells M Derbyshire Type II Virtual Interview
with 1 team member
Yes Yes Yes Anecdotal evidence
No CI cell is executed
jointly by a design
management supplier and
Highways England
team (Team B)
Construction joint venture
from the supply chain
General Information Data Collection Methods Notes
Scheme Name
Location Scheme CI Cell Types
Virtual or Real CI Cell
Interviews CI Cell Board
Observation
CI cell Meeting
Participant Observation
Discussions with Team Members
Review of Team's Past CI
Cell Data for Benefits
Identification
Survey Study
1 Lancashire Type II Real Interview with Scheme 1's process
improvement manager
Scheme 1's CI cell
boards were observed
No Yes Yes An on-line survey
questionnaire was
distributed to the teams
CI cells of Scheme 1
were studied between
December 2015 -
February 2016

22
Network Rail has also been investing in a CI cell mechanism as Highways England to better plan and control their work tasks, and to drive continuous improvement within the organisation. Some lessons from Network Rail were captured through an interview with Network Rail’s business improvement and Lean deployment manager and review of the organisation’s documents/archives. Details of the data collection from Network Rail are presented in Table 3.
Table 3. Details of the data collection from Network Rail
Organisation Data Collection Methods
Note
Network Rail • Interview with one business improvement and Lean deployment manager
• Review of the organisation’s records and documents
Networks Rail’s Lean initiative is mostly based on a system, with many similarities to CI cells, that enables its teams to plan/control their daily duties and identify improvement opportunities with problem solving at the work face.
Findings Observations Varying terminology is used to refer to CI cells both within Highways England and its supply chain (i.e. Performance Cells, Visboards, Lean boards, Communication Cells etc.). The reason for this terminological abundance can be attributed to the Lean trainers/practitioners and consultants’ use of different terminology. Depending on that use, a Highways England staff member initially trained by one of those people on Lean and CI cells continues to use the same terminology as his/her trainer, which consequently creates an inflation of terms. In one specific instance for example, it was noted that two Lean practitioners from Highways England were using two separate terms (“CI Cell” and “Performance Cell”) to refer to a team’s CI cell (the same phenomenon) in their e-mail correspondence with the research team. In another instance, the CI cell meeting facilitator of Team M from the supply chain used the term “Communication Cell” to refer to the same thing to which a Highways England staff member referred as “CI Cell”. In practice, a CI cell consists of two elements; (i) a regular meeting ideally attended by all team members and (ii) a physical (real) board or a virtual spreadsheet with different sections that facilitates and visually holds records of the meetings. The CI cell board/spreadsheet presents a live team-work documentation (tracking) and work improvement medium which is updated both during a CI cell meeting and in periods between two CI cell meetings to record a team’s work progress. Three main sources for CI cell initiation were identified; (i) a member of the organisations’ process improvement professionals (i.e. Lean practitioners, Lean Team members etc.) designs
23
and facilitates CI cell meetings/boards for some teams, (ii) after his/her basic Lean awareness or foundation training, which does not cover the content of CI cells in detail, a team member designs his/her team’s CI cell, and (iii) some teams copy from other teams’ CI cell boards and meeting systems without getting much external support as they feel they need to comply with the “good” practice, which is teams having a CI cell in this case, and through observation, they can sense the benefits of CI cells for other teams in the form of better team engagement. After its initial deployment, a CI board/spreadsheet is subject to modifications by the team in due course of their CI cell execution and as per their work context. Therefore, it is hard to find two CI cell boards having exactly the same structure and content. The frequency of CI cell meetings also varies greatly from daily to monthly depending on the teams’ needs and work contexts. It was observed that there are two main types of CI cells currently in use at Highways England and in the supply chain, Type I and Type II cells: Type I cells: Teams’ daily or weekly task management (task planning, task allocation and task control) is emphasised with very little and ad-hoc continuous improvement efforts. Three sections are generally present on a Type I cell board; (i) a section showing the team members’ availability in the week commencing, (ii) a task planning and follow-up section in which the team members visually declare their ownership of tasks and provide updates on the tasks’ completion, and (iii) a notes section displaying key events or success stories. Some teams also go through basic Key Performance Indicators (KPIs) on their Type I boards. A Type I cell is typically initiated and sustained by a team member after some basic training on Lean or through copying from other teams’ boards and meeting mechanisms. Beyond regular task planning and control, the work improvement and problem solving mechanism of the Type I cells is verbal (ad-hoc). The level of standardisation in terms of auxiliary items used (i.e. stationery, post-it note types – large or small or coloured etc.), meeting regularity and board content is lower compared to the Type II cells. Different Type I cells can be seen in Figure 10-15.

24
Figure 10. A Type I CI cell board with the team KPIs on the left, a team member availability matrix at the bottom and a task tracking (overdue, complete, in progress, to do) section on the
right. The post-it notes contain information like task name, task owner and task due date.
Figure 11. A Type I CI cell board with the team KPI on the left, a team member availability matrix on the right and a task tracking (to do and completed), success stories and key dates section in the middle. The post-it notes contain information like task name, task owner and
task due date.

25
Figure 12. A Type I CI cell board with a key dates and challenges section at the top, and the rest of the board for task tracking. The post-it notes are colour coded for each team member
with information like task name and due date. No team KPIs on the board.
Figure 13. A Type I CI cell board with a team member availability matrix at the top, success stories, key dates and important development section in the middle and two task tracking
sections on the right (for daily task control) and at the bottom (for weekly task planning). The tasks are collectively reviewed and planned by the team members. No team KPIs on the
board.

26
Figure 14. A basic Type I CI cell board with a team member availability matrix at the top and a
weekly task planning/control section for each team member in the middle/bottom. The task planning/control section is being updated by the team leader after reviewing the tasks with the task owners. CI cells facilitate collaborative planning and control for the teams. No team KPIs
on the board.

27
Figure 15. Team E is managing two projects and having two Type I CI cell meetings weekly. Even though by the same team, the content of the CI cell boards for the two projects is
different. The focus in both CI cell meetings is on task tracking and team coordination with ad-hoc problem solving and continuous improvement.
Type II cells: Alongside task management, the Type II cells have stronger focus on continuous improvement. The cell boards contain three main sections through which a team go in their CI cell meetings; (i) a section displaying various team KPIs, in which the team members can collectively review and evaluate their performance, (ii) a 3C’s section (Concerns, Causes and Countermeasures), in which the team members can express the actual or near future work issues (concerns) with their possible reasons (causes) and corrective or pre-emptive actions (countermeasures) and (iii) a section showing various Human Resources related information in detail (i.e. team members’ availability, absence statistics, training information etc.). The Type II cell boards were found more detailed and standardised when compared to the Type I cell boards (see Figure 16-23). They are often initiated and facilitated by a Highways England Lean Team member or process improvement staff. The Type II cells can be virtual (executed on-line over the intranet/internet), if it is practically hard for some team members to be co-located. To quote from an interviewee from Team A, who has been actively driving CI cells in different parts of Highways England; “CI cells should ideally have the people, 3C and performance section; however, the hardest bit for people to use is the 3Cs. People do it (continuous improvement) automatically in their heads but do not document it.” The research validated the quoted statement as many teams did not have a 3C section on their boards (Type I cells) and consequently, recording of the 3C data was missing. While investigating, it was found that anecdotal accounts by the team members on various CI cell benefits and work improvement outcomes through their CI cells meetings were common. Different Type II cells can be seen in Figures 16-23.

28
Figure 16. The continuous improvement section of a Type II CI cell board - a distinguishing and discerning content of the Type II CI cell board. The section documents the team’s
problem solving efforts through the 3C (causes, concerns and countermeasures) with best practices. However, the information and problem solving process is heavily verbal without any
visuals. Also, no tracing and classification of the root causes.
Figure 17. The continuous improvement section of another Type II CI cell board. The section prompts the team to think about problem solving and continuous improvement. Again, the
information and problem solving process is heavily verbal without any visuals. Also, no tracing and classification of the root causes.

29
Figure 18. A virtual CI cell spreadsheet (Type II) with the standard performance, continuous improvement and people sections.
Figure 19. A real CI cell board (Type II) with the standard performance, continuous improvement and people sections.

30
Figure 20. A “toblerone” shaped (triangular prism) CI cell board (Type II). The continuous improvement section does not contain the 3C exercise for systematic problem solving and
work improvement.
Figure 21. A CI cell board (Type II) spread over the wall and team notice board. Only a small section on the CI cell board is dedicated to continuous improvement. The continuous
improvement information is brief and limited to a few bullet points.

31
Figure 22. A CI cell board (Type II). Alongside the typical performance, people and continuous improvement section, the board contains an area dedicated to issues – pressing matters and bottlenecks. However, the data recording in CI cells is not very systematic with the problem solving generally being ad hoc. Again, the continuous improvement information
is limited to a few bullet points.
32
Figure 23. Another “toblerone” type (triangular prism) CI cell board (Type II). The continuous improvement section contains the 3C exercise (more systematic) at the bottom on the
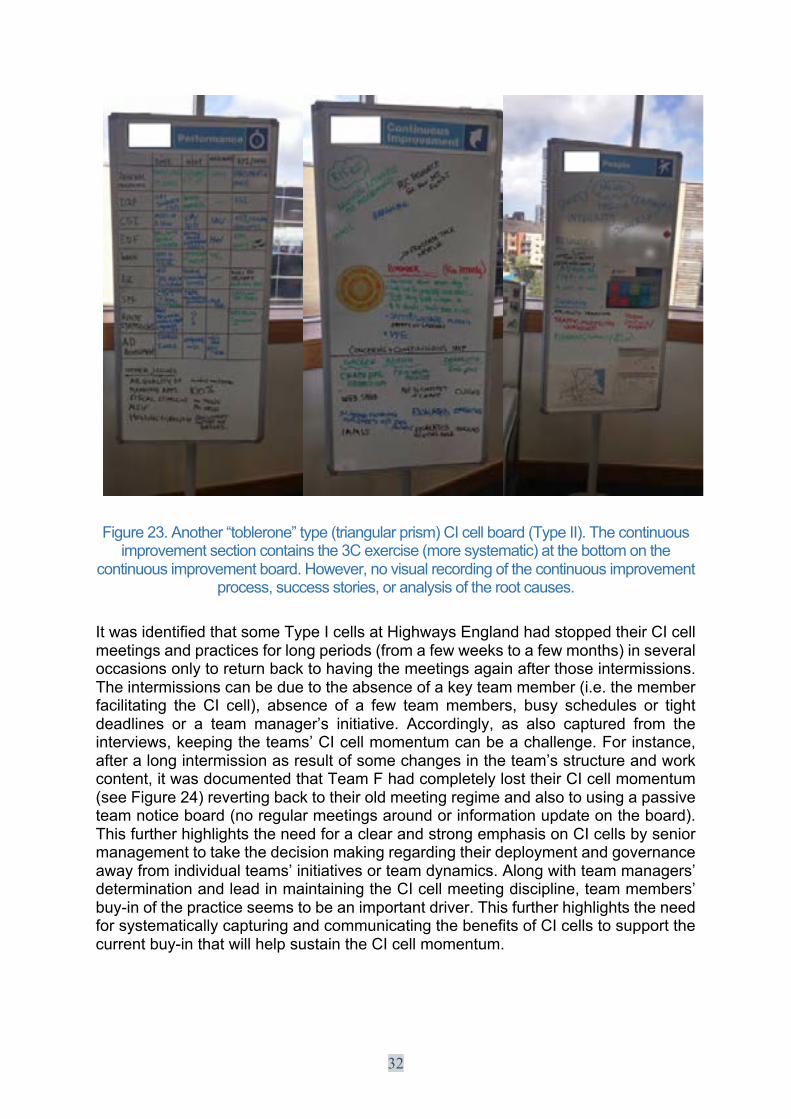
continuous improvement board. However, no visual recording of the continuous improvement process, success stories, or analysis of the root causes.
It was identified that some Type I cells at Highways England had stopped their CI cell meetings and practices for long periods (from a few weeks to a few months) in several occasions only to return back to having the meetings again after those intermissions. The intermissions can be due to the absence of a key team member (i.e. the member facilitating the CI cell), absence of a few team members, busy schedules or tight deadlines or a team manager’s initiative. Accordingly, as also captured from the interviews, keeping the teams’ CI cell momentum can be a challenge. For instance, after a long intermission as result of some changes in the team’s structure and work content, it was documented that Team F had completely lost their CI cell momentum (see Figure 24) reverting back to their old meeting regime and also to using a passive team notice board (no regular meetings around or information update on the board). This further highlights the need for a clear and strong emphasis on CI cells by senior management to take the decision making regarding their deployment and governance away from individual teams’ initiatives or team dynamics. Along with team managers’ determination and lead in maintaining the CI cell meeting discipline, team members’ buy-in of the practice seems to be an important driver. This further highlights the need for systematically capturing and communicating the benefits of CI cells to support the current buy-in that will help sustain the CI cell momentum.

33
Figure 24. Board of the stopped CI cell of Team F.
Some suggestions following the observations are as such: while the Type I cells need to emphasise continuous improvement more, the Type II cells can benefit from better data capturing on the 3C, root cause identification and visualisation of their continuous improvement efforts on their boards. They can also investigate common problem causes for pattern identification for more substantial cause analyses and improvements in the future. The 3C (continuous improvement) was found to be the section the teams are having most trouble with properly executing. It is also generally the first section to be overlooked if the teams go through some work changes, have to expedite their CI cell meetings for some reason or miss a key team member facilitating their CI cell meeting. It was observed that some Highways England teams struggled with issues that require input from other teams and departments, going beyond their internal work domain (reach). Ideally, at the organisational level, the CI cell mechanism should follow a hierarchical order with linked CI cells from the operational work teams all the way up to the senior management to cover the whole organisation. Also, it was repeatedly stated by the teams that it was hard for them to realise substantial changes in Highways England’s processes (top-down change). Highways England has recently started deploying overarching CI cells with different team managers as the CI cells’ members to create higher-level CI cells. One of those higher level CI cells was observed in its early stages of formation (Team I) (see Figure 25). A more advanced case following the same hierarchical CI cell structure from Network Rail will be explained in a subsequent section.

34
Figure 25. Formation of Team I’s (a team with regional managers/ team leaders) CI cell is on-going with discussions around the board content.
The main challenge faced by the research team during the engagement with the work teams deploying CI cells was the lack of recorded data regarding the effect of their CI cell practices that could allow for longitudinal analyses between the teams’ pre-CI cell deployment and post-CI cell deployment conditions. The teams generally keep track of their team-specific KPIs; yet those indicators are often not suitable for reaching conclusions and validating various CI cell benefits outlined in the literature as they do not provide any comparison baseline and they are not intended for measuring CI cell benefits. The teams’ CI cell benefit accounts were mostly anecdotal. Therefore, in order to reveal some CI cell benefits, the research team had to opt for comparing similar teams (i.e. one deploying CI cell and the other not) or going through some specific teams’ past records to be able to make inferences, as much as the available data and research constraints permitted. This was particularly necessary to validate the qualitative findings or anecdotal accounts captured during the discussions with the teams and interviews. Some captured anecdotal benefits, although in need for a robust validation, were also shared in this report to give a guideline for future works on the CI cell benefits. Therefore, it can be argued that there is a need for Highways England to inform and prompt its teams and suppliers deploying CI cells to collect data on their CI cell performances along with their team KPIs. Some CI cell specific indicators that could be collected to further justify and understand the benefits of CI cells are given in the recommendation section.
Findings from Highways England Interviews and Team Discussions A wide range of CI cell benefits and challenges were captured from the interviews and discussions with the Highways England teams. The team members were asked their opinion of the CI cell benefits and issues, and to compare their CI cell practices to their old (conventional) team meeting systems with open-ended questions. The interviews and attended CI cell meetings were recorded and transcribed. While the captured benefits can be used to justify the current CI cell deployment and for future research, the outlined challenges should constitute the foundation for improvement efforts on the current CI cell practices at Highways England. The collected data from each team can be seen in Table 4.
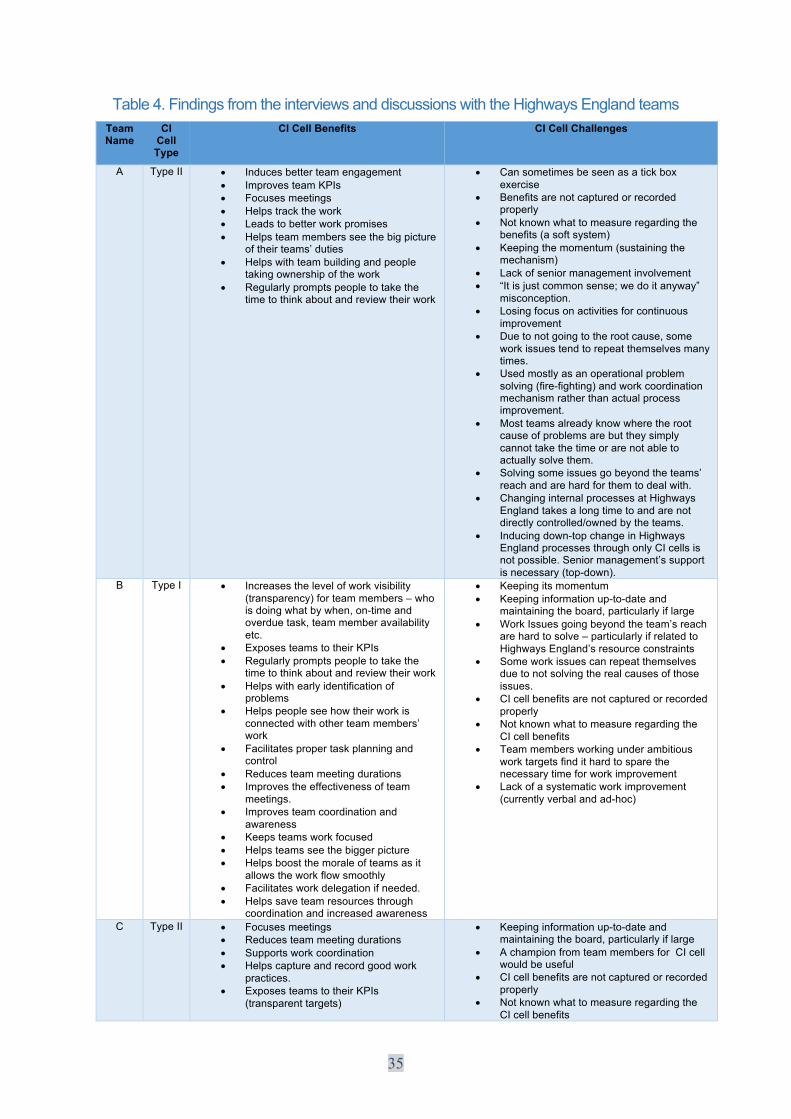
35
Table 4. Findings from the interviews and discussions with the Highways England teams
Team Name
CI Cell Type
CI Cell Benefits CI Cell Challenges
A Type II • Induces better team engagement • Improves team KPIs • Focuses meetings • Helps track the work • Leads to better work promises • Helps team members see the big picture
of their teams’ duties • Helps with team building and people
taking ownership of the work • Regularly prompts people to take the
time to think about and review their work
• Can sometimes be seen as a tick box exercise
• Benefits are not captured or recorded properly
• Not known what to measure regarding the benefits (a soft system)
• Keeping the momentum (sustaining the mechanism)
• Lack of senior management involvement • “It is just common sense; we do it anyway”
misconception. • Losing focus on activities for continuous
improvement • Due to not going to the root cause, some
work issues tend to repeat themselves many times.
• Used mostly as an operational problem solving (fire-fighting) and work coordination mechanism rather than actual process improvement.
• Most teams already know where the root cause of problems are but they simply cannot take the time or are not able to actually solve them.
• Solving some issues go beyond the teams’ reach and are hard for them to deal with.
• Changing internal processes at Highways England takes a long time to and are not directly controlled/owned by the teams.
• Inducing down-top change in Highways England processes through only CI cells is not possible. Senior management’s support is necessary (top-down).
B Type I • Increases the level of work visibility (transparency) for team members – who is doing what by when, on-time and overdue task, team member availability etc.
• Exposes teams to their KPIs • Regularly prompts people to take the
time to think about and review their work • Helps with early identification of
problems • Helps people see how their work is
connected with other team members’ work
• Facilitates proper task planning and control
• Reduces team meeting durations • Improves the effectiveness of team
meetings. • Improves team coordination and
awareness • Keeps teams work focused • Helps teams see the bigger picture • Helps boost the morale of teams as it
allows the work flow smoothly • Facilitates work delegation if needed. • Helps save team resources through
coordination and increased awareness
• Keeping its momentum • Keeping information up-to-date and
maintaining the board, particularly if large • Work Issues going beyond the team’s reach
are hard to solve – particularly if related to Highways England’s resource constraints
• Some work issues can repeat themselves due to not solving the real causes of those issues.
• CI cell benefits are not captured or recorded properly
• Not known what to measure regarding the CI cell benefits
• Team members working under ambitious work targets find it hard to spare the necessary time for work improvement
• Lack of a systematic work improvement (currently verbal and ad-hoc)
C Type II • Focuses meetings • Reduces team meeting durations • Supports work coordination • Helps capture and record good work
practices. • Exposes teams to their KPIs
(transparent targets)
• Keeping information up-to-date and maintaining the board, particularly if large
• A champion from team members for CI cell would be useful
• CI cell benefits are not captured or recorded properly
• Not known what to measure regarding the CI cell benefits

36
• Regularly prompts people to take the time to think about and review their work
• Improves team KPIs • Helps teams see the bigger picture • Helps save team resources • Helps with team building and people
taking ownership of the work • Induces better team engagement • Presents an informal (relaxed)
discussion ground for the “shier” team members to participate in meetings
• Stimulates discussions • Empowers teams
• Amount and variety of data visualization should be increased (rather than tables or plain numbers)
• More emphasis on the 3C (work improvement) should be given. The 3C is not properly utilised at the moment.
• Focus should be given to data recording on the 3C. The improvement data should be recorded more systematically.
• Teams cannot take the time for the 3C due to their busy schedules and ambitious work targets
• Solving some issues go beyond the teams’ reach and are hard for them to deal with.
• Changing internal processes at Highways England takes a long time to and are not directly controlled/owned by the teams.
• Better involvement from senior management • Inducing down-top change in Highways
England processes through only CI cells is not possible. Senior management’s support is necessary (top-down)
D Type I • Focuses meetings
• Helps save team resources • Imposes a discipline in team meeting
attendance and meeting execution (structured meetings)
• Facilitates work delegation if needed. • Helps with team building and task
ownership • Facilitates work allocation and team
resource levelling • Exposes junior team members to senior
team members’ work and helps them prepare for their future work responsibilities. A training mechanism.
• Keeping its momentum (it sometimes slows down and the team loses focus)
• Auditing the CI cell by the Lean Team will be useful
• CI cell benefits are not captured or recorded properly
• Not known what to measure regarding the CI cell benefits
• Further external support the improve the current CI cell practice is needed
• Lack of a systematic work improvement and problem solving (currently verbal and ad-hoc)
• Initiator of the CI cell board and mechanism (the team leader) took an in-house Lean foundation course which did not provide any detail as to the content of CI cell boards.
E Type I • Focuses meetings
• Imposes a discipline in team meeting attendance and meeting execution (structured meetings)
• Reduces team meeting durations • Stimulates discussions • Good at exposing team information to
team members as a team communication mechanism.
• Good visibility of team information • Functions as a task coordination and
control mechanism • Helps with team engagement and
autonomy • Exposes junior team members to senior
team members’ work and helps them prepare for their future work responsibilities. A training mechanism.
• Lack of a systematic work improvement and problem solving (currently verbal and ad-hoc)
• Keeping its momentum • CI cell benefits are not captured or recorded
properly • Not known what to measure regarding the
CI cell benefits • The CI cell board was developed through
copying from other teams • Auditing the CI cell by the Lean Team will
be useful
F Type I • Focuses meetings • Imposes a discipline in team meeting
attendance and meeting execution (structured meetings)
• Stimulates discussions • Facilitates task planning and control • Increases the visibility of team
information (team information transparency)
• Helps with team resource allocation
• Keeping its momentum • CI cell benefits are not captured or recorded
properly • Not known what to measure regarding the
CI cell benefits • Initiator of the CI cell board and mechanism
(the team leader) took an in-house Lean foundation course which did not provide any detail as to the content of CI cell boards.
• Changing internal processes at Highways England takes a long time to and are not directly controlled/owned by the teams.

37
• Lack of a systematic work improvement and problem solving (was verbal and ad-hoc)
G Type II • Focuses meetings
• Reduces team meeting durations • Helps track the work • Provides better visibility of team
information (ie. KPIs, task allocations, attendance, availability, team training situation etc.)
• Supports work coordination • Helps capture and record good work
practices • Gives a structure and discipline to
meetings (helps get the whole team together in the same room)
• Prompts team discussion and interaction • Helps with early identification of
problems • Provides opportunities for work
delegation and autonomy • Helps save team resources • Helps with team building and people
taking ownership of the work • Helps with resource allocation and
levelling
• Solving some issues go beyond the teams’ reach and are hard for them to deal with.
• Changing internal processes at Highways England takes a long time to and are not directly controlled/owned by the teams.
• CI cell benefits are not captured or recorded properly
• Not known what to measure regarding the CI cell benefits
• Some work issues can repeat themselves due to not solving the real causes of those issues.
• More emphasis should be given to the 3C section for systematic problem solving and work improvement
H Type I • Succinct and focused meetings • Good for work progress tracking • Helps with work delegation and
employee autonomy (self-work planning)
• Helps with team building and people taking ownership of the work
• Induces better task promises • Keeps teams work focused • Helps with team engagement and
morale • Imposes a discipline in team meeting
attendance and meeting execution (structured meetings)
• Stimulates discussions • Regularly prompts people to take the
time to think about and review their work
• Further external support to improve the current CI cell practice is needed.
• Initiator of the CI cell board and mechanism (the team leader) took an in-house Lean foundation course which did not provide any detail as to the content of CI cell boards.
• Lack of a systematic work improvement and problem solving (currently verbal and ad-hoc)
• Auditing the CI cell by the Lean Team will be useful
• CI cell benefits are not captured or recorded properly. However, the team keep record of their PPC (Percent Plan Complete) figures that give an indication of their level of task realization.
• Not known what to measure regarding the CI cell benefits
J Type I • Helps teams understand their priorities (gives a sense of priority)
• Increases the level of work visibility (transparency) for team members – who is doing what by when, on-time and overdue task, team member availability etc.
• Focuses meetings • Helps with workload allocation and
levelling • Keeps teams’ work focused • Helps save team resources • Helps with team building and people
taking ownership of the work • Helps new and junior team members
better understand the nature of work
• Further external support to improve the current CI cell practice is needed
• The CI cell board was developed through copying from other teams
• Auditing the CI cell by the Lean Team will be useful
• CI cell benefits are not captured or recorded properly
• Not known what to measure regarding the CI cell benefits
• Teams cannot take the time for the 3C due to their busy schedules and ambitious work targets
• Lack of a systematic work improvement and problem solving (currently verbal and ad-hoc)
38
K Type I • Increases the level of work visibility (transparency) for team members – who is doing what by when, on-time and overdue task, team member availability etc.
• Focuses meetings • Imposes a discipline in team meeting
attendance and meeting execution (structured meetings)
• Reduces team meeting durations • Regularly prompts people to take the
time to think about and review their work • Helps teams see the bigger picture • Improves team coordination and
awareness • Stimulates discussions • Keeps teams work focused
• Lack of a systematic work improvement and problem solving (currently verbal and ad-hoc)
• A champion from team members for CI cell would be useful
• Solving some issues go beyond the teams’ reach and are hard for them to deal with.
• Better involvement from senior management.
• The CI cell board was developed through copying from other teams.
• Further external support the improve the current CI cell practice is needed
• Auditing the CI cell by the Lean Team will be useful
• CI cell benefits are not captured or recorded properly
• Not known what to measure regarding the CI cell benefits
L Type II • Focuses meetings • Imposes a discipline in team meeting
attendance and meeting execution (structured meetings)
• Reduces team meeting durations • Regularly prompts people to take the
time to think about and review their work • Helps with early identification of
problems • Stimulates discussions • Helps teams see the bigger picture • Helps save team resources • Exposes junior team members to senior
team members’ work and helps them prepare for their future work responsibilities. A training mechanism.
• Keeping its momentum • Lack of a systematic work improvement and
problem solving (currently verbal and ad-hoc)
• Solving some issues go beyond the teams’ reach and are hard for them to deal with.
• Changing internal processes at Highways England takes a long time to and are not directly controlled/owned by the teams.
• Further external support the improve the current CI cell practice is needed
• The CI cell board was developed through copying from other teams
• Auditing the CI cell by the Lean Team will be useful
• Better involvement from senior management • Inducing down-top change in Highways
England processes through only CI cells is not possible. Senior management’s support is necessary (top-down)
• CI cell benefits are not captured or recorded properly
• Not known what to measure regarding the CI cell benefits
A summary of the recorded benefits and challenges of CI cells at Highways England is presented in Figure 26.
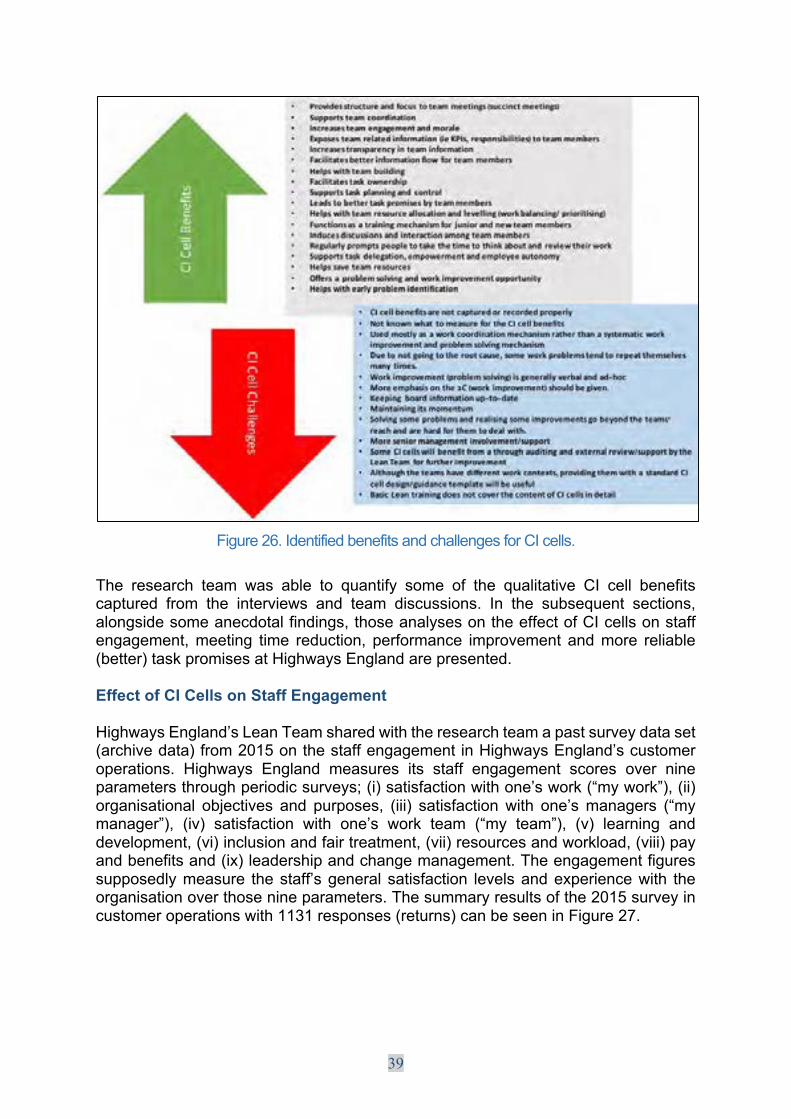
39
Figure 26. Identified benefits and challenges for CI cells.
The research team was able to quantify some of the qualitative CI cell benefits captured from the interviews and team discussions. In the subsequent sections, alongside some anecdotal findings, those analyses on the effect of CI cells on staff engagement, meeting time reduction, performance improvement and more reliable (better) task promises at Highways England are presented. Effect of CI Cells on Staff Engagement Highways England’s Lean Team shared with the research team a past survey data set (archive data) from 2015 on the staff engagement in Highways England’s customer operations. Highways England measures its staff engagement scores over nine parameters through periodic surveys; (i) satisfaction with one’s work (“my work”), (ii) organisational objectives and purposes, (iii) satisfaction with one’s managers (“my manager”), (iv) satisfaction with one’s work team (“my team”), (v) learning and development, (vi) inclusion and fair treatment, (vii) resources and workload, (viii) pay and benefits and (ix) leadership and change management. The engagement figures supposedly measure the staff’s general satisfaction levels and experience with the organisation over those nine parameters. The summary results of the 2015 survey in customer operations with 1131 responses (returns) can be seen in Figure 27.

40
Figure 27. Summary results of the staff engagement parameters in customer operations in 2015.
It can be seen from the shared survey data that as of 2015, there were then 10 Highways England outstations utilising CI cells while 18 outstations had not yet started deploying CI cells. The detailed staff engagement scores from the survey for each outstation were investigated but are not shown here for ethical reasons. However, a summary of the differences in staff engagement scores of all outstations deploying and not-deploying CI cells in 2015 when compared with their staff engagement scores in 2014 can be seen in Table 5. It should be also noted that the teams deploying CI cells constituted 5 of the top 5 teams with highest total engagement scores and 4 of the top 5 teams with highest engagement score improvements.

41
Table 5. Difference in team engagement scores obtained from the 2015 staff engagement survey
Difference (increase(+) or decrease(-)) in the outstations' staff engagement
scores (2014-2015 period)
Number of outstations
(N)
Outstations with CI cell
Outstations w/o CI cell
1 20 9
2 17 -1
3 13 12
4 5 5
5 2 -2
6 18 8
7 11 6
8 17 -3
9 2 -2
10 2 0
11 -1
12 6
13 -1
14 6
15 6
16 4
17 7
18 14
Mean value
10.7 4.05
Standard deviation (sample)
7.07 4.94
Sample variance
50 24.39
The data set allowed for some comparative analyses. With respect to descriptive statistics, the mean of the difference in the staff engagement scores of the outstations deploying CI cells was found as 10.7 while the mean of the difference in the staff engagement scores of the outstations not deploying CI cells remained at 4.05 for the same term. Although both outstation groups displayed a positive difference (improvement) in their mean staff engagement scores, the outstations with CI cells had recorded a far higher mean staff engagement improvement (165% more) than the outstation without CI cells between 2014-2015. To quote from the related Highways England archive file: “Teams in outstations with CI cells are showing twice the engagement improvement rate of their non-CI cell doing colleagues”

42
To test the normality of the engagement differences, the data sets’ Normal Probability Q-Q Plots were drawn (see Figure 28). As the plot scatters are not close to linear (more like S-shaped), one cannot assume that both data groups are normally distributed. Therefore, the non-parametric Mann-Whitney U test was employed on the data set to check whether there is a statistically significant difference in the two groups’ medians (Higgins, 2003; Field, 2013).
Figure 28. Q-Q plots of the engagement difference scores
At 95% (Ptest = 0.05) confidence level, the hypothesis for the Mann-Whitney U test is as follows: H0: The two populations represented by the two outstations have the same distribution in terms of staff engagement difference scores. In other words, there is no difference between the two groups of workstations. The statistics for the Mann-Whitney U test are as such:
-1.5
-1
-0.5
0
0.5
1
1.5
-2 -1 0 1 2
NormalProbablityQ-QPlotoftheEngagementScoreDifferencesforthe
TeamsExecutingCICells
-2-1.5-1
-0.50
0.51
1.52
2.5
-3 -2 -1 0 1 2 3
NormalProbablityQ-QPlotoftheEngagementScoreDifferencesforthe
TeamsnotExecutingCICells

43
Table 6. Mann-Whitney U Test Statistics
Rank values of the outstations’ staff engagement difference
scores for the Mann-Whitney U test
Number of observations
(N)
Outstations with CI cell
Outstations w/o CI cell
1 8 1
2 9 2
3 10 3
4 13 4
5 21 5
6 23 6
7 25 7
8 26 11
9 27 12
10 28 14
11 15
12 16
13 17
14 18
15 19
16 20
17 22
18 24
Rank Sum 190 216
Number of observations
10 18
Uvalue 135 45
Ustatistics 45
Ucritical (10,18) 48
Since the Ustatistics value (45) is smaller than the Ucritical value (48), H0 is rejected. Therefore, with 95% confidence, it is statistically valid to claim that there is a significant difference between the outstations with and without CI cells. Although it is not possible to infer from the data set that the greater staff engagement improvement of the outstations utilising CI cells is only due to their CI cell practices, the Mann-Whitney non parametric test suggests that the outstations utilising CI cells saw statistically significant engagement improvement rates in their staff engagement scores, highlighting a positive effect of CI cells on the outstation staff’s general experience with the organisation.

44
Effect of CI Cells on Reducing Team Meeting Durations Alongside giving meetings a focus, one of the most frequently stated benefits of CI cells by the studied Highways England teams was CI cells’ positive effect on reducing team meeting durations. The recorded quantitative data on this benefit are scarce though. Nonetheless, with the help of Highways England’s Lean Team and the associated teams’ active engagement, the research team managed to identify some related meeting records with Team C for a longitudinal analysis over time and to execute a comparative study with Team G for the effect of CI cells in meeting durations. Also, some evidence on that line was captured from Team B. The CI cell practice has been in effect with Team C since April 2015. Some pre-CI cell (before April 2015) and post-CI cell (after April 2015) weekly meeting durations data were compiled from Team C’s records as seen in Table 7.
Table 7. Meeting duration records of Team C
Meeting Duration Records of Team C
Observed meetings (N)
Meeting durations before the CI cell
(Minutes)
Meeting durations after the CI cell
(Minutes) 1 145 45
2 120 75
3 150 90
4 135 120
5 110 60
6 180 50
7 45
8 75
9 55
10 60
11 65
Mean 140.00 67.27
Standard deviation
24.70 22.29
Variance 610.00 496.82
From the data set’s descriptive statistics, it can be seen that there has been a dramatic reduction in the mean meeting duration (140 vs. 67.27) after the introduction of the CI cell practice. To test the normality of the meeting durations, the data sets’ Normal Probability Q-Q Plots were drawn (see Figure 29). As the plot scatters are close to linear (despite a few outliers), one can assume that both data groups are normally distributed and employ the parametric statistical tests that require data normality.
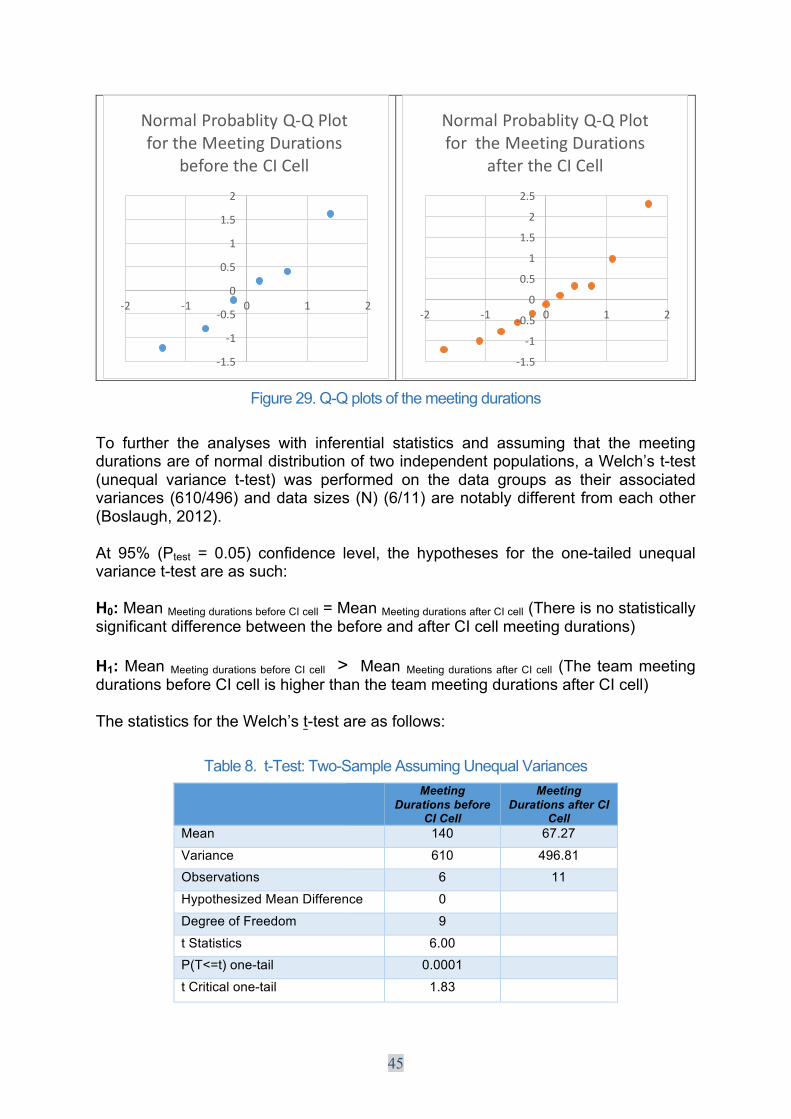
45
Figure 29. Q-Q plots of the meeting durations
To further the analyses with inferential statistics and assuming that the meeting durations are of normal distribution of two independent populations, a Welch’s t-test (unequal variance t-test) was performed on the data groups as their associated variances (610/496) and data sizes (N) (6/11) are notably different from each other (Boslaugh, 2012). At 95% (Ptest = 0.05) confidence level, the hypotheses for the one-tailed unequal variance t-test are as such: H0: Mean Meeting durations before CI cell = Mean Meeting durations after CI cell (There is no statistically significant difference between the before and after CI cell meeting durations)
H1: Mean Meeting durations before CI cell > Mean Meeting durations after CI cell (The team meeting durations before CI cell is higher than the team meeting durations after CI cell) The statistics for the Welch’s t-test are as follows:
Table 8. t-Test: Two-Sample Assuming Unequal Variances
Meeting Durations before
CI Cell
Meeting Durations after CI
Cell Mean 140 67.27
Variance 610 496.81
Observations 6 11
Hypothesized Mean Difference 0
Degree of Freedom 9
t Statistics 6.00
P(T<=t) one-tail 0.0001
t Critical one-tail 1.83
-1.5
-1
-0.5
0
0.5
1
1.5
2
-2 -1 0 1 2
NormalProbablityQ-QPlotfortheMeetingDurations
beforetheCICell
-1.5
-1
-0.5
0
0.5
1
1.5
2
2.5
-2 -1 0 1 2
NormalProbablityQ-QPlotfortheMeetingDurations
aftertheCICell

46
As the t Stat value (6.00) is bigger than the t Critical one-tail value (1.83), H0 is rejected. Therefore, with 95% confidence, it is statistically valid to claim that the meeting durations before the CI cell are significantly longer than the meeting durations after the CI cell. Although it is not possible to infer from the data set that the notable reduction in the meeting durations after the CI cell is only due to the CI cell deployment at Team C, the unequal variance t-test strongly suggests a positive contribution of the CI cell in the reduction of Team C’s meeting duration times. Assuming 2100 minutes of effective weekly work time (7 hours – 5 days), the identified 73 minutes of meeting time saving (140-67) of Team C after their CI cell leads to a minimum of 3.5% of the total effective weekly work time. A comparative study to understand the effect of CI cells on meeting durations was conducted with Team G. Team G are comprised of senior managers who are responsible for the operations of a regional highways network. The team has monthly formal meetings only. Before the introduction of the CI cell, the team members stated they had had monthly meetings that would have lasted for more than 4 fours. According to the team members and the Lean practitioner facilitating the team’s CI cell meetings, after the introduction of CI cell in February 2016, the team has now been gathering around their CI cell boards for their monthly meetings that usually last for 1.5-2 hours. However, the team had no recorded data for the researcher team to validate the meeting-time reduction statement. To test that statement, the research team compared Team G’s meeting duration records with a similar management team’s (Team P) operating in another region with the same number of team members, with similar responsibilities and workload. Team P are not using the CI cell mechanism for their meetings and conducting their meetings in the same conventional fashion as Team G used to conduct their meetings. The recorded meeting durations of Team G and Team P can be seen in Table 9
Table 9. Monthly meeting durations of Team G and Team P
Monthly Meeting Durations
Month (in 2016)
Monthly meeting durations (Minutes) - Team G (with CI cell)
Monthly meeting durations (Minutes) - Team P (w/o CI cell)
September 105 240
October 100 300
November 90 260
Mean 98.33 266.67
Standard Deviation
7.64 30.55
As seen in Table 9, a significant difference between Team G’s and Team P’s mean meeting durations (98.33 vs. 266.67 minutes) exists. In other words, Team P spent 173% more time on their team meetings than Team G. Assuming 8400 minutes of total effective monthly work time (7 hours – 5 days – 4 weeks), the identified 169 minutes of meeting time saving (267-98) corresponds to a minimum of 2.1% of the total effective monthly work time. The analysis of the collected data supports Team G members’ claim that the CI cell practice has reduced their meeting durations when compared to their previous meeting regime.

47
Team B also shared informal evidence with the research team as to the reduction in their team meeting durations after the introduction of their CI cell. According to the team members, Team B used to take more than 2 hours (120 minutes) to complete their team meetings weekly; a major cut into the team’s daily work. Since the introduction of the CI cell, they have had a 10-minute task review meeting 4 times a week and a 15-minute team review meeting once a week around their CI cell board, which accumulate to 55 (4X10+15) minutes spent on the team meetings weekly. This suggests a 55% reduction in Team B’s weekly meeting duration after their CI cell. Assuming 2100 minutes of total effective weekly work time (7 hours – 5 days), the identified 65 minutes of meeting time saving (120-55) corresponds to a minimum of 3.1% of the total effective weekly work time. Effect of CI Cells on Making more Reliable Task Promises While going through their tasks in CI cell meetings, team members openly take ownership for and note of their future tasks along with their due dates on their CI boards. That information remains on the team’s CI board until the following CI cell meeting for all the team members to see. In the following CI cell meeting, realisation of those promises made in the last CI cell meeting is reviewed for each team member. It was indicated by many teams (see Table 4) that the open-to-peers promise making in their CI cell meetings had led them to making more reliable promises and had helped foster a task-follow up culture. This is thought to be due to the peer-pressure and constant visibility induced by the CI cell mechanism. To validate those claims, Team H’s weekly PPC (Percent Plan Complete – the ratio of completed tasks to promised tasks in a meeting period) figures since the introduction of their CI cell (September 2015) were compiled from the team’s available records (see Figure 30). The PPC indicator, which is the percentage of all actual on-time task completions to all promises made for task completion in a week time, is generally used with the Last Planner System, and considered as a good indicator of the reliability of promises made and an effective performance control tool (Ballard and Howell, 1998; Sacks et al, 2010). Team H was the only team whose past task completion/promise data record from the CI cell meetings over a longer period could be obtained. This further highlights the need for a more robust data recording for the CI cell practice at Highways England. Along with the team’s promises and failures data, Team H recorded the reasons for their task completion failures for the same period, which is also a rare practice for the teams. However, no systematic continuous improvement mechanism linked to those failures was identified from Team H’s CI cell practice

48
Figure 30. Team H’s PPC figures after the introduction of the CI cell. Although there are fluctuations, the team managed to sustain a higher PPC level.
With an average team PPC of 94%, Figure 28 suggests a steady increase in Team H’s overall PPC shortly after the introduction of their CI cell with significantly high PPC values over a 1.5-year period (from September 2015 to April 2016). According to Liu et al (2010), there is a statistical relation between the metric of PPC and productivity. Based on their findings, it can be calculated that the increase of average PPC from 50% to 75%, which often happens already in the initial implementation, leads to an improvement of circa 25% in productivity. In this case, there is no before CI cell baseline PPC data to compare against. After their CI cell, the team started at around 80% PPC in their initial weeks, maintaining an average of 94% PPC in time. With a rough assumption based on the findings of Liu et al. (2010), 14% average PPC increase (94%-80%) from the start could yield circa 14% productivity increase for the team. To validate this rough estimate, more data with respect to the team’s past performance (before and after the CI cell) are needed. Although further evidence from other teams on their PPC scores would be useful, the quantitative findings from Team H support one of the Highways England teams’ general remark on the CI cells benefits; enabling team members to make better promises.
Findings from the Supply Chain The CI cell benefits from the supply chain were explored over two organisations; (i) a Joint Venture (JV) construction supplier currently executing a major highways improvement scheme (Scheme 1) and (ii) a design management team (Team M) from a design management service supplier. Scheme 1 was studied by one of the members of the research team between December 2015 – February 2016 in another research project.

49
Construction Service Supplier (Scheme 1) Scheme 1 has been executed in Northern England and is one of the major improvement projects in England’s strategic highways network to be delivered by 2020. It is comprised of 3 individual sections and will cover a corridor approximately 27 kilometres long with 11 junctions and 2, 3 and 4 lane carriageways along the route. A number of cameras, information signs, signals on gantries and additional lighting columns have been installed on the route as part of the project to relieve congestion. The data collection methods in Scheme 1 included an interview with the process improvement manager, site observations, discussions with the teams and a staff survey. The Scheme 1 management wanted to have an integrated visual system to monitor and coordinate their construction project teams’ performance, which are comprised of 140 permanent staff split into 15 teams (i.e. design, technology, engineering, health and safety etc). Also, the management found that the scheme’s meeting routines were inefficient in identifying and solving problems and needed more focusing. Therefore, they decided to deploy CI cells among their teams. The management’s ultimate aspiration was that the senior management team could walk around the office every day and observe or participate in each and every teams stand up meetings where they would discuss the day’s tasks and existing performance. The standard practice for engaging with the teams before the CI cells was via a 2-hour weekly meeting with a loose agenda and follow-up structure. Actions and minutes would be taken and then typed, and circulated 3 to 5 days later. The meetings generally gave no clear indication as to how the teams were performing and what the key issues were. According to the process improvement manager: “…the teams had a “pass the issue over the wall to the management” attitude, the project management wanted to remove. Many problems raised by the teams during their meetings had lingered unsolved. This meant ensuring problems were solved at the lowest level before being pushed up. Also, the teams were split across different site locations on the construction site and without a visual system, it was a challenge for the teams to understand what other teams do and how they are performing as sharing of key information was difficult. A cultural challenge existed to change the current ways of running the team meetings and also to render performance, whether it is ‘good or bad’, visible.” For the implementation, the management set up separate workshops with each individual team. They introduced the CI cell concept and explored some of its uses with the teams showing various practical examples. The process improvement manager then facilitated the teams through a number of exercises; (i) brainstorm key activities the teams undertake, (ii) list how as a team they can measure what the good look like, (iii) what things stop/ prevent the teams from achieving their goal and how these can be measured (iv) design visual boards and discuss how will the visual boards work. As result of the workshops, a generic CI cell board template, around which daily meetings of the teams can be held, was shaped. The generic template includes a task promise section (made in public with the owner, date and status information), an

50
ownership of the task section, a what needs to be done by when section and a team continuous improvement section (see Figure 31-35). Some teams display their KPI figures too. Keeping the basic generic template intact, the boards were kept open to modifications in terms of their content and looks as per some specific needs of the 15 different project teams. Each team stops work daily at 8 a.m. to update their visual boards. The boards are publicly open for everyone to see and a summary of the information extracted from the team boards is shared with all of the project staff on a weekly basis providing a wider understanding of the performance among the teams. Some critical teams’ availability and important task tracking information from their CI cell boards are collected and summarised on a specific “operational board” for the senior management (Figure 36). The CI cell boards are referred to as “Visboards” by the Scheme 1 teams and management.
Figure 31. A generic CI cell board (Type II) at Scheme. The team’s KPIs are shown on the right.

51
Figure 32. The Type II CI cell board (s) of Health and Safety Team. On the left, the team’s availability and task tracking information is shown. On the right, there is a continuous
improvement and problem solving board. However, the continuous improvement is neither systematic nor especially visual.
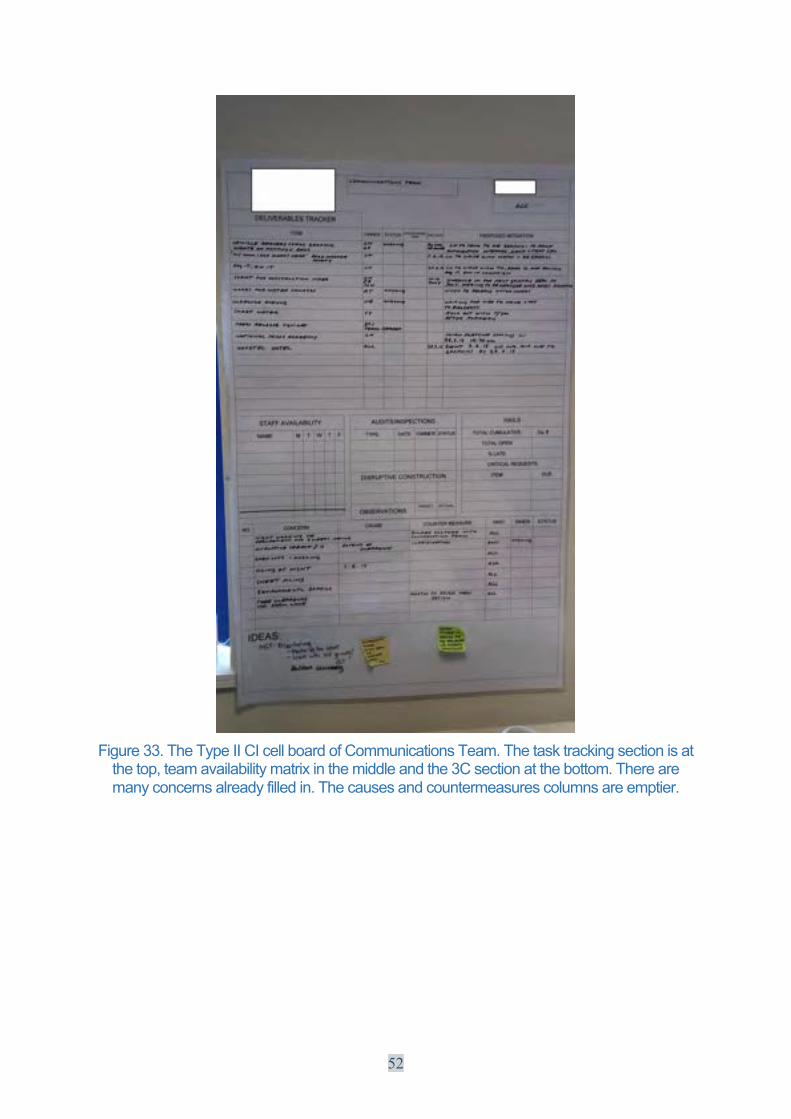
52
Figure 33. The Type II CI cell board of Communications Team. The task tracking section is at the top, team availability matrix in the middle and the 3C section at the bottom. There are many concerns already filled in. The causes and countermeasures columns are emptier.
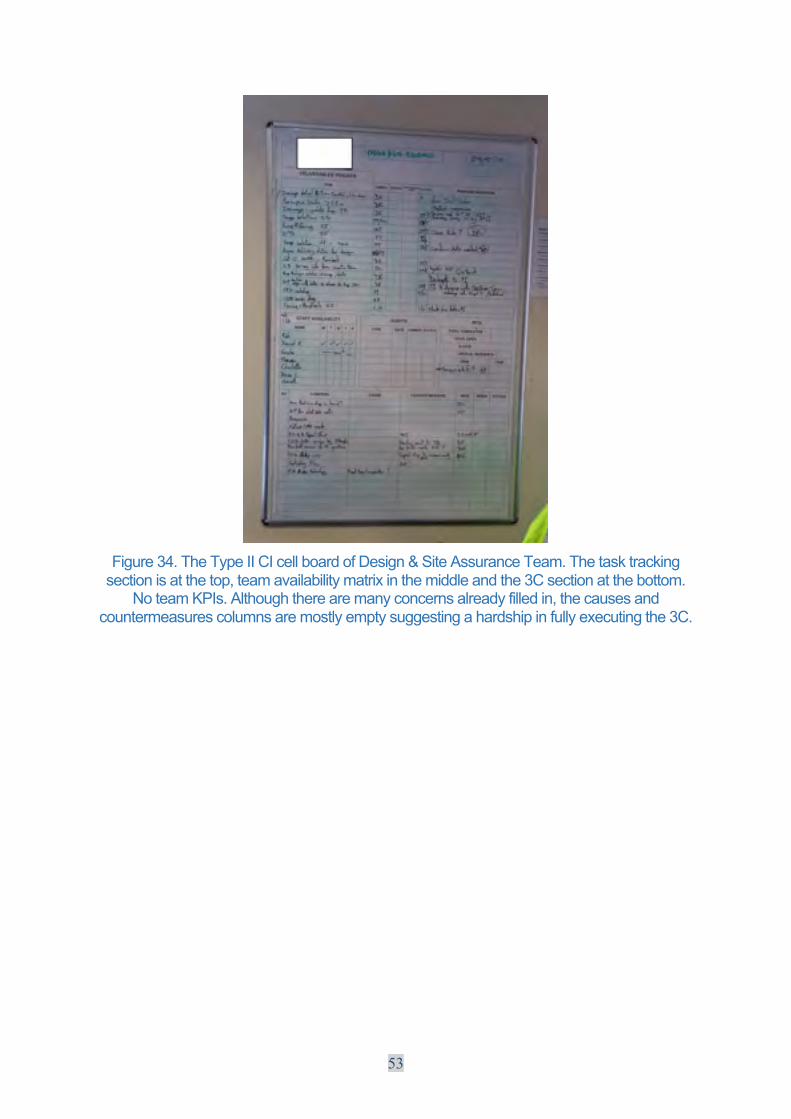
53
Figure 34. The Type II CI cell board of Design & Site Assurance Team. The task tracking section is at the top, team availability matrix in the middle and the 3C section at the bottom.
No team KPIs. Although there are many concerns already filled in, the causes and countermeasures columns are mostly empty suggesting a hardship in fully executing the 3C.

54
Figure 35. Another Type II CI cell board from Scheme 1. The task tracking section is at the top with colour-coded post-its and the 3C section at the bottom. Although there are many
concerns and countermeasures already filled in in the 3C section, many question marks (“?”) were put in the causes column suggesting a hardship in identifying the root cause of
concerns.
Figure 36. The “operational board” summarising key information (i.e. team availability and important tasks) from the CI cell boards for the management.

55
The first benefit recorded after the implementation of the CI cell boards is a reduction in the average duration of the team meetings. According to the process improvement manager: “Previously, the meetings would take around 2 hours (120 minutes) on average per week with minor deviations for each team.” With a more focused and systematic daily meeting approach via the CI cell boards, the total weekly meeting duration was calculated to take approximately 50 minutes on average for the teams (calculated over a 10-week period after the implementation of the visual boards), representing a 59 % reduction in meeting durations and a total of 9800 (140x70) man-minutes saved for the project per week on average. After the implementation of the CI cell mechanism, the overall PPC of the teams has shown a general upward trend in time with an average PPC of 76% (see Figure 37). The upward trend indicates a gradual improvement in the actualization of the promises made by the teams after the implementation of the boards and the meeting system. In other words, the teams started to make more attainable promises or started to pay more attention to the realization of their promises. To capture insights from the team members on the CI cell mechanism, an open-ended questionnaire was distributed online among the teams for improved anonymity. The results obtained from the questionnaire can be seen in Table 10.
Figure 37. Average team PPCs at Scheme 1 showing an upward trend after the introduction of the CI Cells.

56
Table 10. Survey findings from Scheme 1
Response No
What is your work team?
What are the benefits of the
visual performance boards you have in
your office?
Is there any negative sides
or improvement opportunities for the visual performance
boards?
How those visual
boards help you with
your meetings?
How did the boards
affect the task
completion in your teams?
1 Commercial
Gives awareness of what other members of the team are doing Gives reminders of priorities for the week
It's become a little bit of a 'going through the motions' exercise
We've chosen specific headings so we can keep the meetings brief and to the point - less opportunity for waffle
We have started to take our promises more seriously.
2 Technology
See what other members are working on. Tracking actions. Highlighting risk. Tracking people's movements People started to give themselves smarter objectives (better promises)
Difficult to get a daily routine/meeting suitable to all members.
Enables meeting focus/structure and makes them more efficient.
People started to think more carefully before making any promises
3 Operational Support/ Communications
They are engaging and give a solid understanding as to where each of our individual team members are up to with tasks. We can refer to the vis board if a team member is not in the office and we need some information. The boards display dates for upcoming works and act as a simplified programme.
No negative. The only thing I would say for improvement is that there isn't much room for our board in the office, so when we have our meeting it is a little cramped and we have to lean over to reach the board. However, this is only a minor issue.
They are a great platform for the team to engage in conversation and communicate with each other.
4 Health and Safety
Allowing people to know what you are up to and what you have not managed to do and why
No. It is a benefit barring the time taken to go through it on a daily basis.
It allows people to be open and know what everyone is doing and reasons for
As the boards help us see the bottlenecks and unsolved issues with their

57
not doing things
responsible, the provide an urge to take our actions seriously. I sometimes feel though It just shows the time we are being reactive to others poor planning
5 Health and Safety
Communication about what is being achieved, identifying what needs to be changed.
The board could be improved
Focus the discussions
6 Health and Safety
We can see what tasks the team members are carrying out, also we can prioritise tasks which involve input from multiple team members
It is difficult to keep up the momentum daily and ensure attendance from all the team.
It helps us see the whole picture. Improves the team’s coordination.
7 Health and Safety
Visibility of what team members are doing and "Heads Up" information sharing of pressures influencing decisions making.
Members of the team would not always make themselves available for the meeting but were quick to complain that they had not been made aware of what was happening. Not enough was done identify external influences on the failure to complete objectives such as common trends and patterns.
Facilitates team discussions and early identification of the problems.
8 Traffic Management
It focuses attention on the board and the benefits that can be derived from their
Focuses our discussions.
Helps us complete the tasks on-time
58
use and briefing out of the results
9 Traffic Management
It allows people to know what is happening on a daily/weekly basis
People can easily get away from the meeting around the board
It keeps people on the course
Better promises are made now
10 Project Management
Clear, visual management so everyone can see the actions and discussion points
Since they replace formal written minutes, there is an emphasis for the individuals to complete their actions in a timely manner. This needs sufficient challenge at follow up meetings.
They provide a focus for the teams, and accountability for the owners of the actions.
Affected positively.
Some observations as to the execution of the CI cells were recorded. All the teams were proactive in developing their visual boards. However, it can become problematic to drive the teams to regularly use the boards and this requires constant attention. Also, it can be easy for the teams to cancel the meetings around the boards due to other priorities so it is integral for the management to continuously underline that the boards and meetings are important priorities. The senior management has to ensure that the meetings happen daily. Early mornings seemed to work better for most of the teams. It was important to work with the teams while developing the boards to help the teams own the boards. The management allowed the teams to continuously improve their boards through trial and error. Therefore, no board looks the same but they all share a common base structure. It was also observed that interactive handwriting practices and simple physical artefacts such as post-its or magnetic pins positively contribute to the teams’ engagement with the boards. Rather than taking time consuming minutes or notes, which are open to mistakes or omissions during the stand-up meetings, the teams started to simply take photos of the updated boards for their records and the meeting follow-up. Design Service Supplier (Team M) Team M provides Highways England with design management service for a highways scheme. The team have been executing a virtual Type II CI cell jointly with Highways England for around two years (see Figure 38).

59
Figure 38. Virtual Type II CI cell of Team M. The cell is being executed jointly with Highways England.
According to the team members, before the CI cell, the team leader (project manager) used to have two separate weekly meetings with Highways England and the members of Team M, each lasting more than 2 hours for project coordination. By this anecdotal evidence, the past meeting mechanism for the provided design management service took Highways England 2 hours, Team M 2 hours and the team leader 4 hours in total. Since the introduction of their virtual CI cell, Team M and Highways England have been jointly executing the virtual CI cell whose weekly meetings last around 45 minutes for all the three parties (Highways England, Team M and the team leader) (see Figure 39).
Figure 39. Meeting structure of Team M before and after the CI cell.

60
Some benefits and issues associated with Team M’s CI cell practice were recorded through an interview and discussions with the team members. One of the members of the research team attended a CI cell meeting of the team as well. Alongside some similarities with the captured benefits and issues from the Highways England teams and Scheme 1, the joint execution of the virtual CI cell with Highways England (the client) has also an effect on the captured benefits from Team M, highlighting the contributions of the CI cell practice to a better engagement and team building with the client:
CI cell benefits:
• Gives a focus and structure to team meetings (focuses communication) • Reduces team meeting durations • Simplifies progress reporting • Facilitates work coordination and task tracking. • Helps with team building, particularly with the client (Highways England) (two
teams from two different organisations working as a single team). Fosters a good sprit between our team and the client
• The team feel directly linked and more involved with Highways England • Provides an effective coordination mechanism with the client • Supports the team’s understanding of the client • Prompts the team and the client to solve project issues together • Helps with goal setting within the team • Facilitates task ownership • Better team information flow • Helps with early problem identification • Fosters discussions and interaction within the team • Helps document best practices
CI cell issues:
• The 3C section could be executed better • Losing focus on the continuous improvement • Hardships in identifying the root causes of concerns sometimes • Not known what to measure to record the CI cell benefits
Findings from Network Rail Network Rail has been investing in the development of a visual work tracking and problem solving system for its teams since 2013. The initiative is referred to as “Lean visualisation” internally and seen as part of the organisation’s performance management efforts. The Lean visualisation at Network Rail is similar to the CI cells in the highways supply chain. Network Rail teams regularly meet in their control rooms/areas where their whiteboards (or “work boards”) containing information on team KPIs, task tracking and continuous improvement/operational problem solving are located (see Figure 40-43). It is also perceived as a Visual Management (VM) effort and therefore, the boards are sometimes referred to as “Visboards” and the meetings as “Vis meetings”. In this section, the initial findings from Network Rail will be

61
;&"."0#":(*.(*(,"*&0+02(*0:(/"05-6*&'+02(%;;%&#=0+#8(@%&(#-"(34(5",,.(+0(#-"(-+2-$*8.(.=;;,8(5-*+0>((
(
(
X+2=&"(]Z>(!"#$%&'()*+,(#"*6.(6""#+02(*&%=0:(#-"+&($-+#"/%*&:.(*.(;*&#(%@(#-"(%&2*0+.*#+%0A.(B"*0(1+.=*,+.*#+%0(*0:(;"&@%&6*05"(6*0*2"6"0#("@@%&#.>(
(X+2=&"(]Y>(R(5%0#&%,(&%%6(*#(!"#$%&'()*+,(5%0#*+0+02(6*08($%&'(/%*&:.(HG+./%*&:.J>(
(
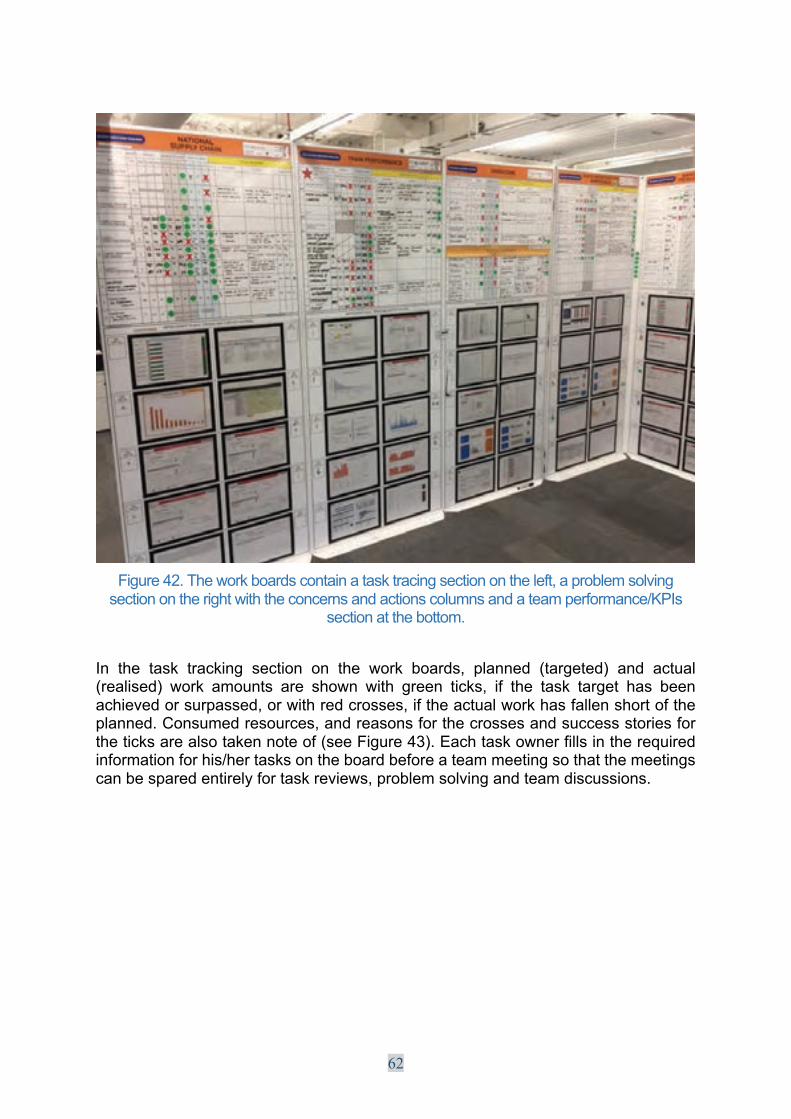
62
(
X+2=&"(]\>(E-"($%&'(/%*&:.(5%0#*+0(*(#*.'(#&*5+02(."5#+%0(%0(#-"(,"@#<(*(;&%/,"6(.%,1+02(."5#+%0(%0(#-"(&+2-#($+#-(#-"(5%05"&0.(*0:(*5#+%0.(5%,=60.(*0:(*(#"*6(;"&@%&6*05"CUI4.(
."5#+%0(*#(#-"(/%##%6>(
40( #-"( #*.'( #&*5'+02( ."5#+%0( %0( #-"( $%&'( /%*&:.<( ;,*00":( H#*&2"#":J( *0:( *5#=*,(H&"*,+.":J( $%&'( *6%=0#.( *&"( .-%$0( $+#-( 2&""0( #+5'.<( +@( #-"( #*.'( #*&2"#( -*.( /""0(*5-+"1":(%&(.=&;*..":<(%&($+#-(&":(5&%..".<(+@(#-"(*5#=*,($%&'(-*.(@*,,"0(.-%&#(%@(#-"(;,*00":>(3%0.=6":(&".%=&5".<(*0:(&"*.%0.(@%&(#-"(5&%..".(*0:(.=55"..(.#%&+".(@%&(#-"(#+5'.(*&"(*,.%(#*'"0(0%#"(%@(H.""(X+2=&"(]FJ>(9*5-(#*.'(%$0"&(@+,,.(+0(#-"(&"K=+&":(+0@%&6*#+%0(@%&(-+.C-"&(#*.'.(%0(#-"(/%*&:(/"@%&"(*(#"*6(6""#+02(.%(#-*#(#-"(6""#+02.(5*0(/"(.;*&":("0#+&",8(@%&(#*.'(&"1+"$.<(;&%/,"6(.%,1+02(*0:(#"*6(:+.5=..+%0.>(((
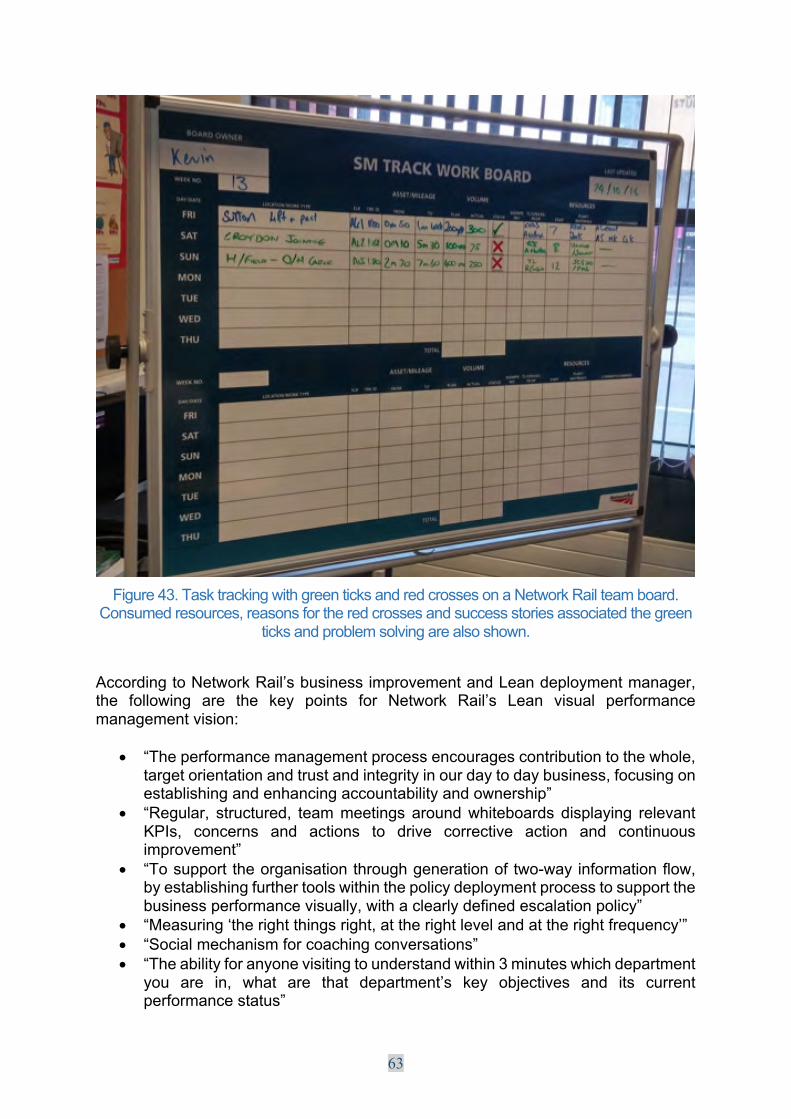
63
Figure 43. Task tracking with green ticks and red crosses on a Network Rail team board.
Consumed resources, reasons for the red crosses and success stories associated the green ticks and problem solving are also shown.
According to Network Rail’s business improvement and Lean deployment manager, the following are the key points for Network Rail’s Lean visual performance management vision:
• “The performance management process encourages contribution to the whole, target orientation and trust and integrity in our day to day business, focusing on establishing and enhancing accountability and ownership”
• “Regular, structured, team meetings around whiteboards displaying relevant KPIs, concerns and actions to drive corrective action and continuous improvement”
• “To support the organisation through generation of two-way information flow, by establishing further tools within the policy deployment process to support the business performance visually, with a clearly defined escalation policy”
• “Measuring ‘the right things right, at the right level and at the right frequency’” • “Social mechanism for coaching conversations” • “The ability for anyone visiting to understand within 3 minutes which department
you are in, what are that department’s key objectives and its current performance status”

64
• “Any manager must be able to very quickly assimilate status and information to make rapid decisions and set priorities”
• “Do not accept non-conformance. Challenge the condition and create positive tension”
• “Non-conformances are valuable opportunities for work improvement” • “Ideal visualisation should not only communicate clearly, but stimulate viewer
engagement, attention and action” • “Well-crafted data visualisation helps uncover trends, realise insights, explore
sources, and tell stories” • “Train the teams for them to come up with effective action plans to resolve their
problems (non-conformance)” • “Senior management’s involvement and leadership are key”
Some principles are followed for the Concerns and Actions (continuous improvement) exercise:
• Problems are solved ‘step by step’, an action at a time. • Each action has clear owner • Each action has clear due date for completion. • When action is completed and confirmed then ‘what is the next action’? • Repeat until the problem is solved.
The following points were stated as the benefits of the Lean visual team performance system at Network Rail:
• Drive ownership and responsibility to all levels in the organisation • Regular dialogue and rigorous Plan, Do, Check, Act. • All employees recognise and own contribution, and understand their portion of
contribution to business performance • The right metrics drive the system, measure what individuals can control and
improve (valid and relevant) • Create the social mechanism for coaching conversations • It enables improved business performance and improved employee
engagement
A key feature of the Lean visual performance system at Network Rail is that the work boards are hierarchically linked with and feeding each other. The senior management determines the functional management’s performance targets while the functional management defines the supervisors and value adding members’ performance targets, cascading the work targets hierarchically downward. On the other hand, alongside their actual performance, the subordinates can reflect work issues and problems going beyond their teams’ reach onto their superintendents for them to solve in their Lean visual performance meetings. However, there is a clear escalation policy set for the teams to follow before reflecting their issues onto their superintendents. The CEO of Network Rail started to use his own performance board in 2015, completing the hierarchical cycle. This cascade and alignment can be seen in Figures 44 – 45.
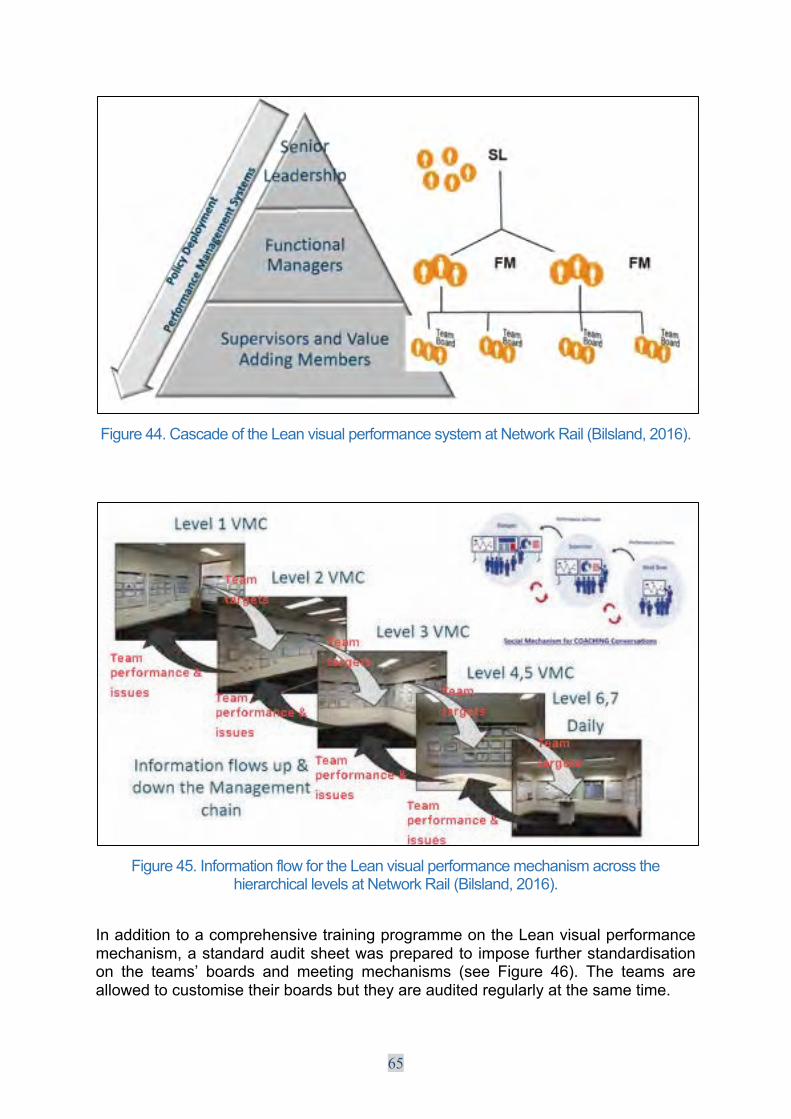
65
X+2=&"(]]>(3*.5*:"(%@(#-"(B"*0(1+.=*,(;"&@%&6*05"(.8.#"6(*#(!"#$%&'()*+,(HV+,.,*0:<(\ZY^J>(
*X+2=&"(][>(40@%&6*#+%0(@,%$(@%&(#-"(B"*0(1+.=*,(;"&@%&6*05"(6"5-*0+.6(*5&%..(#-"(
-+"&*&5-+5*,(,"1",.(*#(!"#$%&'()*+,(HV+,.,*0:<(\ZY^J>(
40(*::+#+%0(#%(*(5%6;&"-"0.+1"(#&*+0+02(;&%2&*66"(%0(#-"(B"*0(1+.=*,(;"&@%&6*05"(6"5-*0+.6<(*(.#*0:*&:(*=:+#(.-""#($*.(;&";*&":(#%(+6;%."(@=&#-"&(.#*0:*&:+.*#+%0(%0( #-"( #"*6.A( /%*&:.( *0:( 6""#+02( 6"5-*0+.6.( H.""( X+2=&"( ]^J>( E-"( #"*6.( *&"(*,,%$":(#%(5=.#%6+."(#-"+&(/%*&:.(/=#(#-"8(*&"(*=:+#":(&"2=,*&,8(*#(#-"(.*6"(#+6">(

66
*X+2=&"(]^>(R=:+#(.-""#(@%&(#-"(;"&@%&6*05"(/%*&:.(*#(!"#$%&'()*+,>(
*E-"(*=:+#(.-""#(5%0#*+0.(@+1"(6*+0(5*#"2%&+".(@%&(H+J(.#*0:*&:(@%&6*#<(H++J(2%1"&0*05"<(H+++J(6""#+02(/"-*1+%=&(*0:(H+1J(,"*:"&.-+;>(E-"(#"*6.(*&"(&"2=,*&,8(*=:+#":(@%&(#-"+&(B"*0(1+.=*,(;"&@%&6*05"(.8.#"6(;&*5#+5".(%1"&(#-%."(@%=&(6*+0(5*#"2%&+".(*0:(#-"+&(.=/O5*#"2%&+".(%0(*(B+'"&#(.5*,"(@&%6(Y(H$"*'J(#%([(H.#&%02J(H.""(X+2=&"(]`J>(

67
*X+2=&"(]`>(R=:+#(.-""#(@%&(#-"(;"&@%&6*05"(/%*&:.(*#(!"#$%&'()*+,($+#-(#-"(@%=&(6*+0(
"1*,=*#+%0(5*#"2%&+".>(
R,.%<(-+2-(;"&@%&6+02( #"*6.(%&(2%%:($%&'( +6;&%1"6"0#("@@%&#.(*&"(&"5%20+.":(*0:(;&*+.":( $+#-( *( .#*&( /*:2"( %0( #-"( /%*&:.( *0:( .%6"( 0%0O6%0"#*&8( ;&+e".( *.(+05"0#+1+.*#+%0.(H.""(X+2=&"(]aJ>((
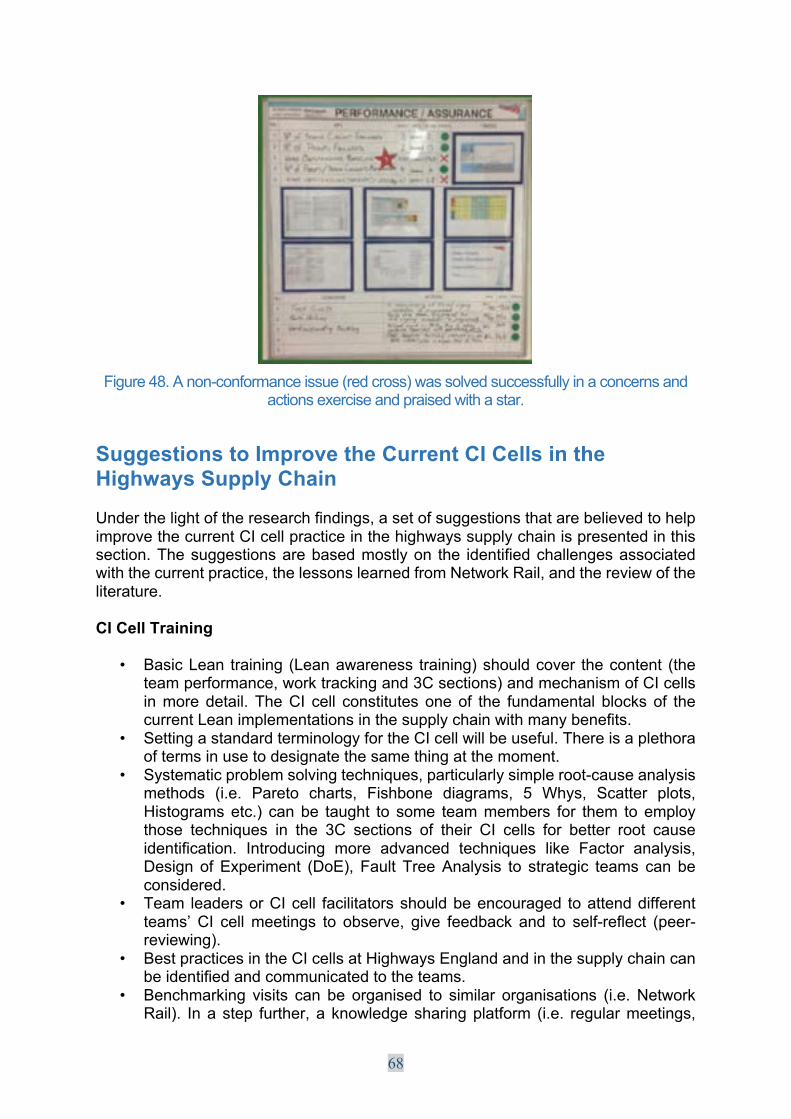
68
(
X+2=&"(]a>(R(0%0O5%0@%&6*05"(+..="(H&":(5&%..J($*.(.%,1":(.=55"..@=,,8(+0(*(5%05"&0.(*0:(*5#+%0.("L"&5+."(*0:(;&*+.":($+#-(*(.#*&>(
@:##.'(&)%'*()*59<")6.*(1.*,:"".%(*,5*,.--'*&%*(1.*K$;'*@:<<-;*,1$&%*
d0:"&(#-"(,+2-#(%@(#-"(&"."*&5-(@+0:+02.<(*(."#(%@(.=22".#+%0.(#-*#(*&"(/",+"1":(#%(-",;(+6;&%1"(#-"(5=&&"0#(34(5",,(;&*5#+5"(+0(#-"(-+2-$*8.(.=;;,8(5-*+0(+.(;&"."0#":(+0(#-+.(."5#+%0>(E-"(.=22".#+%0.(*&"(/*.":(6%.#,8(%0( #-"( +:"0#+@+":(5-*,,"02".(*..%5+*#":($+#-(#-"(5=&&"0#(;&*5#+5"<(#-"(,"..%0.(,"*&0":(@&%6(!"#$%&'()*+,<(*0:(#-"(&"1+"$(%@(#-"(,+#"&*#=&">((,5*,.--*8"$&%&%#**
u( V*.+5(B"*0( #&*+0+02(HB"*0(*$*&"0"..( #&*+0+02J(.-%=,:(5%1"&( #-"(5%0#"0#( H#-"(#"*6(;"&@%&6*05"<($%&'(#&*5'+02(*0:(F3(."5#+%0.J(*0:(6"5-*0+.6(%@(34(5",,.(+0(6%&"(:"#*+,>( E-"(34( 5",,( 5%0.#+#=#".(%0"(%@( #-"( @=0:*6"0#*,( /,%5'.(%@( #-"(5=&&"0#(B"*0(+6;,"6"0#*#+%0.(+0(#-"(.=;;,8(5-*+0($+#-(6*08(/"0"@+#.>(
u( ?"##+02(*(.#*0:*&:(#"&6+0%,%28(@%&(#-"(34(5",,($+,,(/"(=."@=,>(E-"&"(+.(*(;,"#-%&*(%@(#"&6.(+0(=."(#%(:".+20*#"(#-"(.*6"(#-+02(*#(#-"(6%6"0#>((
u( ?8.#"6*#+5(;&%/,"6(.%,1+02(#"5-0+K=".<(;*&#+5=,*&,8(.+6;,"(&%%#O5*=."(*0*,8.+.(6"#-%:.( H+>">( I*&"#%( 5-*&#.<( X+.-/%0"( :+*2&*6.<( [( _-8.<( ?5*##"&( ;,%#.<(7+.#%2&*6.("#5>J( 5*0(/"( #*=2-#( #%( .%6"( #"*6(6"6/"&.( @%&( #-"6( #%("6;,%8(#-%."( #"5-0+K=".( +0( #-"( F3( ."5#+%0.( %@( #-"+&( 34( 5",,.( @%&( /"##"&( &%%#( 5*=."(+:"0#+@+5*#+%0>( 40#&%:=5+02( 6%&"( *:1*05":( #"5-0+K=".( ,+'"( X*5#%&( *0*,8.+.<(D".+20( %@(9L;"&+6"0#( HD%9J<( X*=,#( E&""(R0*,8.+.( #%( .#&*#"2+5( #"*6.( 5*0(/"(5%0.+:"&":>(
u( E"*6( ,"*:"&.(%&(34(5",,( @*5+,+#*#%&.(.-%=,:(/"("05%=&*2":( #%(*##"0:(:+@@"&"0#(#"*6.A(34( 5",,(6""#+02.( #%( %/."&1"<( 2+1"( @"":/*5'( *0:( #%( .",@O&"@,"5#( H;""&O&"1+"$+02J>((
u( V".#(;&*5#+5".(+0(#-"(34(5",,.(*#(7+2-$*8.(902,*0:(*0:(+0(#-"(.=;;,8(5-*+0(5*0(/"(+:"0#+@+":(*0:(5%66=0+5*#":(#%(#-"(#"*6.>(
u( V"05-6*&'+02( 1+.+#.( 5*0( /"( %&2*0+.":( #%( .+6+,*&( %&2*0+.*#+%0.( H+>">(!"#$%&'()*+,J>( 40(*(.#";( @=&#-"&<(*('0%$,":2"(.-*&+02(;,*#@%&6( H+>">( &"2=,*&(6""#+02.<(
69
knowledge sharing groups etc.) between large public organisations and Tier 1 suppliers with respect to the CI cell, and Lean and process improvement in general can be formed.
CI Cell Execution
• Root causes should be recorded, grouped and classified systematically for further work improvement and analyses. There are many relatively simple “cause and effect” analysis methods that can be employed. This classification and grouping should ideally be visual on bar charts or frequency graphs rather than in plain figures. Frequent root causes should be given special attention to and shared with the superintendents for problem solving, if deemed necessary.
• The Type I CI cells should be encouraged to include a systematic problem solving section in their CI cell boards and meetings.
• The Type II CI cells could increase the level of visualisation in their problem solving efforts with visual information presentation. Integrating an A3 problem solving exercise for important concerns into the current 3C system can be considered for improved visualisation. Also, a more robust root-cause analysis using analytic methods seems necessary.
• The level standardisation in CI cell board design and execution should be increased across the supply chain and in Highways England. Highways England can lead by introducing its standard board template similarly to Network Rail.
• Information on the CI cells should be hierarchically cascaded and aligned (see Figure 45). While superintendents are setting the work targets, operational teams should be able to systematically reflect the countermeasures that they are not able to take to solve their work issues alongside their work performances onto their superintendents. The information should flow in two directions between the superintendents’ and work teams’ CI cells. However, there should also be a clear escalation policy to ensure that only relevant issues will be escalated to the superintendents. Establishing that link and cycle for the information flow seems essential to further exploit the CI cell benefits.
• The senior and functional management should start their own CI cells to lead by example and to complete the CI cell information flow.
• The management can be encouraged to organise regular walk-throughs around the CI cell boards to observe the current CI cell execution first-hand and to demonstrate their engagement.
• A complete audit of the existing CI cells for their measured performance figures, task tracking system and the 3C exercise will be useful. The frequency of team meetings can be reviewed alongside the teams’ CI cell boards. Many teams seem to have simply copied the CI cell practices of their peers. Also, the continuous improvement seems to be executed ad-hoc (verbally) and in an unsystematic way within many CI cells.
• Standard CI cell auditing sheets similar to those shown in Figure 46-47 and covering the issues like CI cell governance, board design, team member training level, board location, KPIs etc. can be created to regularly audit the teams’ CI cell efforts. The audit sheet will also act as a standard CI cell template or guide for the teams.
• The follow up of non-conformances in performance should be paid special attention to. The important question here is what do the teams actually do when

70
they find a non-conformance in their performance or task realisation. Non-conformances are valuable opportunities for continuous improvement. The performance review should be truly linked with the continuous improvement.
• Details of different forms of visual continuous work improvement techniques, some of which were outlined in the introduction section of this report, are widely available in the literature. Those techniques (i.e. the data train, daily huddle meeting boards, A3 templates) can be reviewed to expand the current Type I and Type II CI cell mechanisms.
CI Cell Benefit Recording
• Apart from their team KPIs and the 3C outcomes, the teams generally do not know what to measure for their CI cell benefits at the moment.
• A set of measures can be introduced to the teams specifically for their CI cell benefits and performance; (i) Percent Plan Complete (PPC– on-time tasks realised/total number of tasks planned) in a reporting period (month/week), (ii) number of raised concerns over time, (iii) team meeting attendance figures, (iv) trend graphs in team performance, (v) ratio of total concerns solved/ total concerns raised in a reporting period (month/week), (vi) meeting durations, (vii) monetary amount of resources saved through the CI cells, and (viii) adopted improvements/person/year.
• To effectively use the proposed measures, the teams’ associated baseline figures from the current condition and the past team data records should be captured.
• An online CI cell benefit recording mechanism similar to the Lean Tracker at Highways England, in which the teams can summarise and record their CI cell success stories with quantitative proof can be introduced for better knowledge retention and benefits dissemination.
CI Cell Incentivisation
• In order to keep the teams’ focus on continuous improvement, motivation and incentivisation efforts should be directed more to the continuous improvement part of the CI cells
• An incentivisation programme between and within the teams can be initiated in the form of an amicable competition. For the programme, the teams can be ranked by their ratio of concerns/ realised countermeasures, most saved resources, and performance improvement compared to previous terms.
• Dividing a work team into smaller groups of twos or threes can be tried. Those sub-teams’ or groups’ KPIs and improvement efforts can be evaluated over time (for instance, on the number of work improvement suggestion, the number of realised suggestions, the amount of benefits obtained from the suggestions etc.). Successful groups or sub-teams can be offered non-monetary incentives like a star badge (see Figure 48) as at Network Rail or coffee/treat and praised publicly within the team.
• Successful CI cell practices and team members should be publicly praised on a praise/success board or in an appreciation area in the offices.
• It is important to visually demonstrate to the teams that their continuous improvement efforts are making a real difference in the organisation. Internal marketing techniques can be employed for that.
71
• An idea recently gaining popularity in team motivation is game thinking. It is based on using gaming methods to train people, to drive behavioural change, to start friendly competition and to raise motivation in teams. Game thinking concepts can be tried for the CI cells.
Future CI Cell Research
• Investigating why certain teams are successful and others fail - the critical
success factors. • Researching the benefits in more detail in the form of summative evaluation. • Formative evaluation on how the programme can be improved. • Understanding which factors in CI cells lead to better job satisfaction • Comparing two similar teams, one deploying CI cells and the other not, with
respect to their KPIs and team member engagements will be useful. • Investigating where the teams are allocating the saved resources through their
CI cell practices will present another interesting research opportunity. How the saved resources are being used is not known at the moment.
• Instead of doing broader research studies involving many teams, deeper studies focusing on one or a few strategic teams can be preferred.
• Longitudinal studies lasting for extended durations (12-18 months), in which a team deploying CI cells are studied by a team member or a researcher actively engaging with the team are recommended. The study can be executed by a team member or the team can formally appoint one of their members to actively liaise with the researcher to help the researcher collect and analyse the CI cell data as the team member is expected to be more informed of the team’s work context for a better benefits/ challenges evaluation. On the other hand, the researcher can provide the necessary theoretical know-how and support for the data analysis.
• Teams with available past records that will enable setting baselines for the outlined benefits and proposed measures should be preferred for comparative studies.
• Studying teams that have just started deploying CI cells for an extended period of time into their CI cell implementation can also present valuable comparative study opportunities, enabling the analysis of the teams’ pre-CI cell and post-CI cell conditions. However, it is recommended to start the study a few months before the CI cell’s deployment to be able to examine the pre-CI cell condition.
• Comparing two similar teams, one deploying CI cells and the other not, with respect to their KPIs and team member engagements will be useful. However, one should be selective in identifying those comparison bases as not every KPI or team member engagement parameter may be affected by the existence or absence of CI cells.
• Obtaining the teams’ buy-ins for such research studies by clearly explaining the potential benefits of those studies and that the study will not interrupt the team’s work flow or pose a threat for the team members is important. Working with an intrinsically motivated team for such studies will facilitate the research effort.
• Each realised suggestion through the studied team’s CI cell should be translated into resource savings as much as possible and compared to the baseline figures.
72
Summary and Conclusion The research identified many benefits of the deployment of the CI cells at Highways England, in the highways supply chain, and at Network Rail, alongside some challenges and recommendations.
Qualitative benefits Team and supply chain coordination
• Provides structure and focus to team meetings (succinct meetings) • Supports team coordination • Simplifies progress reporting and creating meeting minutes • Supports teams’ understanding of their clients
Process transparency
• Exposes team related information (i.e. KPIs, responsibilities) to team members • Increases transparency in team information • Facilitates better information flow for team members
Team building and coaching
• Helps with team building • Presents an effective coaching mechanism • Induces discussions and interaction among team members • Functions as a training mechanism for junior and new team members • Increases team engagement and morale
Task and resource management
• Facilitates task ownership • Supports task planning and control • Leads to better task promises by team members • Helps with team resource allocation and levelling (work balancing/ prioritising) • Helps save team resources • Supports task delegation, empowerment and employee autonomy
Continuous improvement
• Regularly prompts people to take the time to think about and review their work • Helps with early problem identification • Offers a problem solving and work improvement opportunity
Quantitative benefits Quantitative evidence was also found as to those CI cell benefits:
• Increases team engagement and morale. The statistical analysis of Highways England’s outstations showed that the outstations deploying CI cells had recorded 165% more improvement in their mean staff engagement scores when compared to the outstations not deploying CI cells.
• Reduces meeting durations and consequently, saves team resources. The meeting duration reduction times through CI cells were analysed using the data collected from four Highways England teams. The analysis showed that CI cells
73
saved 3.5% of one team’s total effective weekly work time, 2.1% of another team’s total effective monthly work time, and 3.1% of the last team’s total effective weekly work time. The figures were calculated by proportioning the meeting time savings through the teams’ CI cells to the teams’ total effective weekly or monthly work times. Also, those saving figures do not take the teams’ time and resource savings obtained through their 3C efforts or ad-hoc improvement suggestions during their CI cell meetings into account, due to lack of data. Therefore, the calculated figures should be seen as minimums and higher saving percentages than those amounts should be expected for the teams.
• Leads to better task promises. A 14% productivity increase in one team was estimated based on the team’s PPC records after their CI cell.
Challenges The main challenges of the CI cells are associated with the lack of systematic data recording, not knowing what to measure as to the benefits, hardships faced in executing the continuous improvement section, ad-hoc problem solving and the low level of standardisation.
Recommendations Alongside some future CI cell research recommendations, a detailed set of suggestions to improve the current CI cell training, execution, benefits recording and incentivation practices based on the aforementioned challenges was given. Rather than having isolated CI cells, it is also critically important to hierarchically connect CI cells from the senior management to the work teams for a complete information flow cycle. Along with the Collaborative Planning, the CI cell constitutes one of the most widespread outcomes of the Lean initiative in the highways supply chain. Highways England’s lead in improving and disseminating the CI cell across its teams and the supply chain will be a determining factor for the CI cells’ future condition. The identified benefits and challenges will contribute to the future research and development efforts on CI cells and the discussions on visual performance management systems in general.
Acknowledgement The authors would like to thank Highways England, Network Rail, Craig Wilkinson, Neal Symmons, Lucia Fullalove, Mary Burroughs, Stephen Greenhalgh, Caroline Fox, Katie Jones, John Bilsland, Saeed Talebi, Luciana Miron and all the highways work teams involved in the research for their valuable contributions.
74
References Ballard, G., & Howell, G. (1998). Shielding production: essential step in production control. Journal of Construction Engineering and management, 124(1), 11-17. Bilsland, J. (2016). Visualisation and control rooms. Lean Construction-UK (LCI-UK) Annual Summit, Birmingham, UK. Available at: http://leanconstruction.org.uk/wp-content/uploads/2016/11/Visualisation-and-Control-Rooms-John-Bilsland.pdf. Last accessed: 23/12/2016. Binnerts, D. (2015). The Improvement Kata. Industry Report, Shell Company, Netherlands Boslaugh, S. (2012). Statistics in a nutshell. O'Reilly Media, Inc. Dale, B. G., & Lees, J. (1987). Quality circles: From introduction to integration. Long Range Planning, 20(1), 78-83. Eaton, M. (2013). The Lean Practitioner's Handbook. Kogan Page Publishers. Field, A. (2013). Discovering statistics using IBM SPSS statistics. Sage. Galsworth, G.D. (2005). Work that Makes Sense, Visual- Lean Enterprise Press, USA. Graban, M. (2013). Kaizen & idea boards spotted at Society for Health System Conference. Available at: http://www.leanblog.org/2013/03/kaizen-idea-boards-spotted-at-society-for-health-systems-conference/. Last accessed: 23/12/2016. Graban, M., & Swartz, J. E. (2012). Healthcare kaizen: engaging front-line staff in sustainable continuous improvements. CRC Press. Greif, M. (1991). The Visual Factory: Building Participation through Shared Information, Productivity Press, USA. Hamel, M. R. (2010). Kaizen event fieldbook. Society of Manufacturing Engineers: Dearborn, MI. Higgins, J. (2003). Introduction to Modern Nonparametric Statistics, Duxbury Press. Hirano, H. (1995). 5 Pillars of the Visual Workplace: The Sourcebook for 5S Implementation, Productivity Press, USA. Howard, J. E. (1986). A study of quality circle development. University of Nottingham. Hunt, B. (1984). Quality circles: Square deal for productivity. Engineering Management International, 2(4), 271-278. Hutchins, D. (1985). Quality circles handbook. London: Pitman
75
Imai, M. (1997). Gemba Kaizen: A Commonsense, Low-Cost Approach to Management: A Commonsense, Low-Cost Approach to Management. McGraw Hill Professional. Liker, J., & Meier, D. (2006). The Toyota way fieldbook. McGraw Hill. Liu, M., Ballard, G., & Ibbs, W. (2010). Work flow variation and labor productivity: Case study. Journal of Management in Engineering, 27(4), 236-242. Miron, L., Talebi, S., Koskela, L., & Tezel, A. (2016). Evaluation of continuous improvement programmes, In proceedings of the 24th Annual Conference of the International Group for Lean Construction (IGLC), Boston, USA. Rafaeli, A. (1985). Quality Circles and employee attitudes. Personnel Psychology, 38(3), 603-615. Rich, N., Bateman, N., Esain, A., Massey, L., & Samuel, D. (2006). Lean evolution: lessons from the workplace. Cambridge University Press. Rother, M. (2009). Toyota Kata: managing people for improvement, adaptiveness and superior results. McGraw-Hill Professional. Sacks, R., Radosavljevic, M., & Barak, R. (2010), Requirements for building information modeling based lean production management systems for construction, Automation in Construction, 19(5), 641-655. Sherwood, K. F., Guerrier, Y., & Dale, B. G. (1985). Quality Circles - Can We Evaluate Them? Personnel Review, 14(1), 26-31. Sobek II, D. K., & Smalley, A. (2011). Understanding A3 thinking: a critical component of Toyota's PDCA management system. CRC Press Soltero, C., & Boutier, P. (2012). The 7 Kata: Toyota Kata, TWI, and Lean Training. CRC Press. Wood, R., Hull, F., & Azumi, K. (1983). Evaluating Quality Circles: The American Application. California Management Review, 26(1), 37-53.

Innovative Design Lab (IDL)hud.ac.uk/idl
Innovative Design Lab (IDL)School of Art, Design and ArchitectureUniversity of HuddersfieldQueensgate, HD1 3DHHuddersfield, UK
hud.ac.uk/idl+44(0)1484 422288
ISBN : 978-1-86218-147-2