contextual information retrieval using ontology … information retrieval using ontology based user...
TRANSCRIPT
Contextual Information Retrieval Using Ontology
Based User Profiles By
Vishnu Kanth Reddy Challam
B.Tech. (Computer Science & IT)
Jawaharlal Nehru Technological University, Hyderabad, India.
Submitted to the Department of Electrical Engineering and Computer
Science and the Faculty of the Graduate School of the university of Kansas
in partial fulfillment of the requirements for the degree of Master of
Science in Computer Science.
_______________________________________________
Dr.Susan Gauch, Chairperson
_______________________________________________
Dr. Jerzy W. Grzymala-Busse, Committee Member
_______________________________________________
Dr.David Andrews, Committee Member
______________________
Date accepted
1
Dedicated to my parents Krishna Reddy and Sarvamangala for
their infinite love.
2

Acknowledgements
I would like to extend my sincere and utmost gratitude to Dr. Susan Gauch,
my graduate advisor and committee chairperson for introducing me to the field of
information retrieval and for guiding and inspiring me throughout this research. I
would like to thank Dr. Jerzy W. Grzymala-Busse and Dr.David Andrews for serving
on my committee.
I am grateful to Dr.Arienne Dwyer for giving me an opportunity to work as a
Graduate Research Assistant in the DOBES project and for funding me during the
course of my thesis.
I would like to thank my colleague and friend Mirco Speretta for his valuable
assistance and insight in designing Google wrapper.
I am forever indebted to my parents for their infinite encouragement and
love. I owe all my success to them. I would also like to thank Niveditha, Prasad,
Madhu, Kiran, Hari and Thej for always supporting and motivating me.
A special thanks to my friends Abhinay, Imran, Naveen, Purab, Richard and
Hasitha who have been more than a family to me. I would also like to thank all my
friends who have directly or indirectly helped me with my thesis work.
3

Abstract
The information available on the Internet has become widely used, primarily due to
the ability of search engines to find useful information for users. However, present
day search engines are far from perfect because they return results based on simple
keyword matches without any regard for the concepts in which the user is
interested. In this thesis, we design and evaluate a novel system for contextual
information retrieval using ontology based user profiles. In contrast to long-term
user profiles we construct contextual user profiles that capture what the user is
working on at the time they conduct a search. These profiles are used to provide
personalized results that suit the user’s information needs at a particular instance of
time. Experiments have been done to study the effect of the original versus
conceptual ranking and the use of multiple sources of information to build the user’s
context. A 15 % improvement over Google was achieved in the average rank of the
result clicked by a user when contextual information about queries was used to re-
rank the results.
4

Contents
1.Introduction 1
1.1 Motivation…………………………….…………………………………………1
1.2 Goals……………………………………………………………………………..3
1.3 Overview………………………………………………………………………...3
2. Related Work 5 2.1 Semantic Web…………….……………………………………………………...5
2.2 Ontologies………………………………………………………………………..6
2.3 Construction and Representation of User Profiles…………………………..7
2.4 Document Classification………………………………………………………..8
2.5 Contextual Search……………………………………………………………...10
3. Overview of KeyConcept 11
4. Implementation 14 4.1 Overview……………………………………………………………………….14
4.2 A System to Non-invasively Capture User Activity on Windows 2000, XP
Operating Systems………………………………………………………………...15
4.3 Classifier to Generate User Profiles………………………………………….15
4.4 Personalizing Search Results Using Information from Contextual
Profiles………………………………………………………………………………19
5. Experiments 22
6. Evaluation and Analysis 27
5

6.1 Combining Information from Word Documents and Web Pages to Build
Contextual Profile………………………………………………………………….27
6.2 Using Information from Word Documents and Web Pages Independently
to Build Contextual Profile………………………………………………………..38
6.3 Weighting the Content from Word Documents and Web Pages Differently
to Build Contextual Profile………………………………………………………..50
7. Conclusions and Future Work 54
6
List of Figures Figure 1: KeyConcept Architecture……………………………………………………...11
Figure 2: Sample of Standard Tree Hierarchy….……………………………….……….17
Figure 3: Sample contextual profile with category id’s and category weights…...….19
Figure 4: Screenshot of results from Google………………….……………………...…..24
Figure 5: Screenshot of results from Google Wrapper………………………………….25
7

List of Charts
Chart 1: Comparison between average Google rank and the average conceptual
ranks when varying number of concepts from document profile are considered and
the top 10 concepts from user’s contextual profile are considered for queries from
initial-query group………………………………………………………………...……….28
Chart 2: Comparison between average Google rank and the average conceptual
ranks when varying number of concepts from document profile are considered and
the top 10 concepts from user’s contextual profile are considered for queries from
secondary-query group……………………………………………………………..……..29
Chart 3: Comparison between average Google rank and the average conceptual
ranks when varying number of concepts from document profile are considered and
the top 20 concepts from user’s contextual profile are considered for queries from
initial-query group………………………………………………………………...……….30
Chart 4: Comparison between average Google rank and the average conceptual
ranks when varying number of concepts from document profile are considered and
the top 20 concepts from user’s contextual profile are considered for queries from
secondary-query group……………………………………………………………..……..31
Chart 5: Comparison between average Google rank and the average conceptual
ranks when varying number of concepts from document profile are considered and
the top 30 concepts from user’s contextual profile are considered for queries from
initial-query group…………………………………………………………...…………….32
Chart 6: Comparison between average Google rank and the average conceptual
ranks when varying number of concepts from document profile are considered and
the top 30 concepts from user’s contextual profile are considered for queries from
secondary-query group…………………………………………………………..………..33
Chart 7: Comparison between average Google rank and the average conceptual
ranks when varying number of concepts from document profile are considered and
8

all concepts from user’s contextual profile are considered for queries from initial-
query group……………………………………………………………...………………….34
Chart 8: Comparison between average Google rank and the average conceptual
ranks when varying number of concepts from document profile are considered and
all concepts from user’s contextual profile are considered for queries from
secondary-query group………………………………………………………..…………..35
Chart 9: Average Final Rank Vs Alpha Values for queries from initial-query
group………………………………………………………………………………………...37
Chart 10: Average Final Rank Vs. Alpha Values for queries from secondary-query
group……………………………………………………………………………………..….37
Chart 11: Comparison between average Google rank and average conceptual ranks
when varying number of concepts from document profiles are considered and top 10
concepts from user’s contextual profile built from Word documents are
considered…………………………………………………………...………………………40
Chart 12: Comparison between average Google rank and average conceptual ranks
when varying number of concepts from document profiles are considered and top 20
concepts from user’s contextual profile built from Word documents are
considered……………………………...……………………………………………………41
Chart 13: Comparison between average Google rank and average conceptual ranks
when varying number of concepts from document profiles are considered and top 30
concepts from user’s contextual profile built from Word documents are
considered……………………………………………………………………...……………42
Chart 14: Comparison between average Google rank and average conceptual ranks
when varying number of concepts from document profiles are considered and all
concepts from user’s contextual profile built from Word documents are
considered………………………………………………………………………...…………43
Chart 15: Average final rank Vs. Alpha values when profile is built using content
from Word documents……………………………………………………………………..44
Chart 16: Comparison between average Google rank and average conceptual ranks
when varying number of concepts from document profiles are considered and top 10
9
concepts from user’s contextual profile built from Web documents are
considered…………………………………………………………………………………...45
Chart 17: Comparison between average Google rank and average conceptual ranks
when varying number of concepts from document profiles are considered and top 20
concepts from user’s contextual profile built from Web documents are
considered…………………………………………………………………………...………46
Chart 18: Comparison between average Google rank and average conceptual ranks
when varying number of concepts from document profiles are considered and top 30
concepts from user’s contextual profile built from Web documents are
considered……………………………………………………………………...……………47
Chart 19: Comparison between average Google rank and average conceptual ranks
when varying number of concepts from document profiles are considered and all
concepts from user’s contextual profile built from Web documents are
considered…………………………………………………………………...………………48
Chart 20: Average final rank Vs. Alpha values when profile is built using content
from Web documents……………………….……………………………………………...49
Chart 21: Average final rank Vs. Alpha values for various values of
beta…………………………………………………………………………...………………51
Chart 22: Average final ranks Vs. Alpha Values…………………...…………….……..52
Chart 23: Average final ranks Vs. Beta Values…………………...……………….……..52
10

Chapter 1
Introduction
1.1 Motivation
The huge amount of information available on the Internet is widely shared primarily
due to the ability of Web search engines to find useful information for users. The
following table [1] shows the search statistics of the top Web search engines as of
January 2003.
Search Engine Search Hours
Per Month (in millions)
Search Minutes Per Day
(in millions)
Searches Per Day
(in millions)
Google 18.7 37 112
AOL Search 15.5 31 93
Yahoo 7.1 14 42
MSN Search 5.4 11 32
Ask Jeeves 2.3 5 14
InfoSpace 1.1 2 7
AltaVista 0.8 2 5
Overture 0.8 2 5
Netscape 0.7 1 4
Earthlink 0.4 1 3
Looksmart 0.2 0 1
Lycos 0.2 0 1
Table 1: Search statistics of top Web search engines
As can be seen from the table above, an increasing number of consumers are using
Internet search engines for their information needs. However, present day search
11

engines are far from perfect. Users of search engines are often confronted with too
many irrelevant results. This is due to the fact that the same Word may be associated
with different meanings or concepts in different contexts and simple keyword
matches do not take into consideration the context in which the query was asked or
the concept for which the user is looking. The query “Wild Cats” returns the same
results to a person searching for wild animals and a sports fan searching information
about his favorite team. Given the increasing demand for search engine services,
Web search engines should take into consideration both the concepts and the context
in which the query was asked in order to improve user experience. There is a need
for a “personalization” mechanism that would collect information about the user
and use that information to present custom results to suit the user’s information
needs at that particular instance of time.
Personalization broadly involves the process of gathering user-specific information
during interaction with the user, which is then used to deliver appropriate content
and services tailor-made to the user’s needs [2]. When applied to search,
personalization would involve the following steps:
1. Collecting and representing information about the user, to understand the
user’s interests.
2. Using this information to either filter or re-rank the results returned from the
initial retrieval process, or directly include this information into the search
process itself to present personalized results.
12
Thus the problem of search engine personalization has two broad dimensions:
1. How can accurate information about the user’s interests be collected and
represented with minimal user intervention.
2. How can this information about the user be used to deliver personalized
search results?
1.2 Goals
Personalization is a field of active ongoing research. In this thesis we would like to
investigate and evaluate the performance of search engines when user specific
information, which is non-invasively collected for a variety of sources, is used to
provide contextual information to the users query. We show that there is a 15%
improvement in search engine performance when information about user’s current
context is used in conjunction with keyword matches to identify the search results.
1.3 Overview
In order to collect information about a user’s interests, a system has been developed
that monitors the user’s activity on a Windows PC. This system would collect
content from open Internet Explorer, MS-Word and MSN Chat windows. The
captured content is used to build a contextual profile that represents the user’s
interests at a particular instance of time. The information from this contextual profile
is used to re-rank the results returned by Google using a wrapper program built
using the Google API [3]. An experiment is conducted to collect the results examined
13

by users while completing a task. The rank order of the clicked result from Google
with and without contextual information is evaluated. As detailed in Chapter 6 , we
are able to achieve a 15% improvement in the average rank of the examined url.
The rest of the document first discusses related work in Chapter 2, followed by the
system architecture in chapter 3. Chapter 4 discusses the experiments and
evaluation of the system and Chapter 5 presents conclusions and describes future
work.
14

Chapter 2
Related Work
One way to address the problem discussed above is to explicitly state the meaning of
the content associated with a Web page. Research in this area is discussed in Section
2.1. Section 2.2 discusses ontologies. Since our method of search engine
personalization deals with contextual and document profiles Section 2.3 discusses
various approaches of to build and represent user profiles. Since text classification is
a core component of our system, related work in this area is discussed in Section 2.4.
Finally, Section 2.5 discusses related work in contextual search.
2.1. Semantic Web
One way to provide conceptual search is to explicitly state the meaning of the
content in a Web page. Research in this area tries to address the problem by having
the creators or the authors of the content explicitly specify the meaning associated
with a page using a knowledge representation language. Examples of knowledge
representation languages are Ontobroker [4], RDF [5], OIL [7] and SHOE [7]. Many
efforts are underway to construct domain specific ontologies. One advantage of this
approach however is that the content can be easily processed by machines. However
considering the size and democratic nature of the Web, it is likely that a large
proportion of Web content will be plain HTML.
15

2.2 Ontologies
An ontology is a specification of a conceptualization. Sophisticated ontologies
incorporate logical relationships and membership rules. However, concept
hierarchies can also be used as simple ontologies. The Open Directory Project is the
largest, most comprehensive human-edited directory of the Web. It is constructed
and maintained by a vast, global community of volunteer editors [18]. It can be
viewed as a conceptual tree. This tree is useful for navigating (to find interesting
documents in the leaf nodes) or restricting the search to a certain subset of topics.
An ontology can be used to allow users to navigate and search the Web using their
own hierarchy of concepts. The OBIWAN project at the University of Kansas [19, 20]
uses the Open Directory Project’s concept hierarchy as ontology. This ontology has
been used to represent the content of Websites and as the basis of user profiles. To
enable the use of a personal hierarchy for navigation, four steps were required: 1)
each user created a personal tree featuring his/her own concepts and hierarchy; 2)
sample documents were gathered for each concept in the hierarchy; 3) using a TF-
IDF classifier comparing the user’s sample documents to categories in the reference
ontology, the system is able to map the user’s personal ontology to a reference
ontology (in this case, the Yahoo! ontology); 4) the system can present the user with
Websites organized into the user's ontology.
16

2.3 Construction and Representation of User Profiles
Research in this area is directed towards building user profiles using non- invasive
approaches. These user profiles are a representation of the user’s interests. Most such
as Wisconsin Adaptive Web Assistant (WAWA)[8] try to identify the most relevant
Web pages for a user based on their past histories. Similarly Syskill and Webert [11]
is a software agent that learns to rate pages and decide which pages might be of
interest to the user. The software agent uses the profile developed to either suggest
interesting links to the user from a user-created index page or it can formulate a
Lycos query to help a user find interesting pages anywhere in the WWW. Chan [10]
discusses a similar non-invasive learning approach for constructing Web user
profiles. A user profile consists of two components: a Web Access Graph (WAG) and
a Page Interest Estimator (PIE). The WAG captures the Web page access patterns of a
user. Based on the content of Web pages, a PIE learned from the user’s access
behavior characterizes the interests of the user.
Widyantoro, Ioerger and Yen [9] developed a three-descriptor representation to
monitor user interest dynamics. This model maintains a long-term interest descriptor
to capture user’s general interests and a short-term interest descriptor to keep track
of user’s more recent faster changing interests.
17

Goecks and Shavlik [12] learn user’s interests by looking at more then just the pages
themselves. They also observe and measure user mouse and scrolling activity in
addition to user browsing activity.
2.4. Document Classification
Text classification is an automatic process executed in two phases: Training and
classification. In the training phase, the system is given a series of documents
classified by hand, from which it learns features (generally vocabulary) that
represents each of the categories. In the classification phase, the system receives a
new document and assigns it to a particular category, based on matches between its
features and those extracted from the training data.
Several methods for text classification have been developed. A very complete
survey and comparison of such methods is presented in [13]. A brief explanation of
each method follows.
• SVM (Support Vector Machines): This method represents each document as a
vector and tries to find a boundary (known as a decision surface) that
achieves the best separation between groups of vectors. The system is trained
using positive and negative examples for each category and the boundaries
between categories are calculated. A new document is classified by
calculating its vector and determining the partition of the space the vector
belongs to.
18

• kNN (k-Nearest Neighbor): Given a new document, the system finds the k
nearest neighbors in the training set, that is, the training documents most
similar to the new one in the vector sense. The category of the new document
is determined by weighting the categories of the k neighbors (the categories
of the training documents that are more similar to the new document have a
higher weight).
• LLSF (Linear Least Squares Fit): This approach creates a multivariate
regression from the set of training documents (represented in the vector
space model) and their categories (represented as a binary vector). By solving
a linear least squares fit between these pairs of vectors, a matrix of Word-
category regression coefficients is obtained. This matrix can be multiplied by
a new document vector to get its corresponding category vector.
• NB (Naïve Bayesian)[14]: This approach uses the joint probabilities of Words
co-occurring in the same document and the category training set to assign the
document’s category. The naïve assumption in this method is the
independence of all the joint probabilities.
• Decision trees: This kind of classifier builds a decision tree by doing a
recursive partition of the training documents, until the generated subgroups
contain examples of a single partition class. Each branch in the tree is defined
by a test on some attribute of the document. New documents are walked
down the decision tree by performing the sequence of tests until they arrive
at their final class.
19
• TF-IDF: In this classifier, all the training documents for a certain category are
combined and represented as a vector. A new document is classified by
computing the cosine distance between its vector representation and the pre-
computed category vectors. This is also called a vector space classifier.
• Neural networks: In this approach [15], a neural network is trained with the
sample documents. Once trained, the network is used to determine the
category of new documents.
2.5 Contextual Search
Rather than building long-term user profiles, contextual systems try to adapt to the
user’s current task. Watson [16] monitors users' tasks, anticipates task-based
information needs, and proactively provide users with relevant information. The
user’s tasks are monitored by capturing content from Internet Explorer and
Microsoft Word applications. Stuff I’ve Seen [17] is a system developed at Microsoft
Research for personalized information retrieval. This system indexes the content
seen by a user and uses the index to provide easier access to information already
seen by the user, and also to provide rich contextual information for Web searches.
20

Chapter 3
Overview of KeyConcept
The KeyConcept conceptual search engine being developed at The University of
Kansas. KeyConcept retrieves documents based on a combination of concept and
keyword matches. This is achieved by extending the traditional inverted index to
incorporate mappings between concepts and documents. The extended inverted
index contains both conceptual and keyword based information about a document,
thus making retrieval based on a combination of concept and keywords possible.
Figure 1. Key Concept Architecture
The extended inverted index is built in 2 phases:
1. The classifier is trained to classify a document into categories in the Standard
Tree. The classifier uses the “Centroid Based Classification Algorithm”. In
21

this classification algorithm all the training documents of a particular concept
are merged and indexed to form the centroid vector of that particular
concept. The training inverted index contains the centroid vectors of the
concepts in the standard tree.
2. A vector for the document to be classified is built using the traditional tf-idf
method and the similarity between the centroid vectors in the training
inverted index and the document vector calculated using the dot product of
the two vectors is used to determine the concepts the document belongs to.
The centroid vector(s) which closely match the document vector are the
concepts the document belongs to. A detailed discussion on the performance
of the centroid based document classifier can be found in [22].
During the retrieval phase the information in the extended inverted index is used to
return results based on a combination of concept and keyword matches. The concept
match and keyword match factors are weighted using the formula:
))1(()( scorewordscoreconceptscoreDocument ×−+×= αα
In the above formula when the α factor is 0 only keyword matches are considered,
when the α factor is 1 pure concept matches are considered totally ignoring keyword
matches and when α factor is 0.5 both the keyword and concept matches are
weighted equally. An optimal α value needs to be determined so that both concept
and keyword matches are weighed such that the results returned are the best.
22

In the current state of the project, users have to explicitly specify the concepts they
are searching in and the α factor when submitting the query. The system built and
evaluated in this thesis attempts to automate this process so that users need not
specify the concepts and the α factor explicitly. The system automatically builds a
profile of the user based on his/her activities on their Windows machine, and uses
this profile to provide conceptual information to the query. The optimal α factor is
determined experimentally.
23
Chapter 4
Implementation
4.1 Overview
As stated earlier, the goal of this thesis is to study and evaluate the performance of
Web search engines when user specific information is used to provide contextual
information to queries. In order to accomplish this goal the following components
are necessary:
1. A system to non-invasively monitor user activity on his/her machine by
capturing content from open Internet Explorer and MS-Office and MSN
messenger documents. The information captured from this system can
provide a good estimate about the interests of a user at a particular instance
of time.
2. A classifier to classify the content captured by the system to generate a user-
profile that gives a description of the user’s current context.
3. A system to test and evaluate the performance of the entire system when
contextual information is used in addition to plain keyword matches.
The activity of a user on his machine is continuously monitored by the Windows
application. The content captured during this process is stored on the client machine.
When the user submits a query, the content captured within a specific time is
classified with respect to the ODP ontology. The classifier used in our system is
24
based on the vector space model and the manually associated Web pages in the ODP
collection are used as training data. A detailed discussion on the classifier can be
found in [21]. The classifier represents the user profile for the time window as a
weighted ontology. The weight of a concept in the ontology represents the amount
of information recently viewed or created by the user that was classifies into that
concept. The user profile will be used to personalize/re-rank the results to suit the
users interests. The process of personalizing the results using information from the
user profiles is described in greater detail in the next chapter.
The remainder of the chapter describes each sub-component in greater detail.
4.2 A System to Non-invasively Capture User Activity on Windows-2000, XP
Operating Systems:
A system was developed to capture the user activity on Windows 2000 and XP
Operating Systems. User activity is monitored by capturing content of Web pages
visited by the user and the content of MS-Office documents created or read by the
user. The content that has been captured is stored in files in a special folder on the
user’s machine. Each file is named with the time stamp of that particular file which
indicates the time during which the content was captured. Using these time stamps
the content captured can be analyzed for contextual information in synchronization
with the Web queries given by user.
25
4.3 Classifier to Generate User Profiles.
The classifier used in this system is based on the vector space model and the
manually associated Web pages in the ODP collection are used as training data. As
described in the earlier sections, the classifier classifies a document into a sub-set of
the categories of the Open Directory Project. Figure 2 shows a sample of the
reference ontology.
26

Figure 2: Sample of Standard Tree Hierarchy
The classifier works in 2 phases: training phase, and classification phase.
1. Training Phase: In this phase, the classifier creates an inverted index for the
collection of training documents. The training documents are a collection of
documents that have been classified by subject experts manually into specific
27
categories of the Open Directory Project. All categories that have over 8
training documents are used, and those having less than 8 were removed. All
the documents that belong to a particular category are merged to form a
“super document”. This document is indexed with the vector-space indexer
using the category id of the associated category as the document id. This
creates, for each category a vector of vocabulary terms and weights
associated with the category stored in an inverted file for fast access.
2. Classification Phase: Similar to the processing of the training documents a
term vector is generated for the document to be classified. This vector is
compared with all the vectors in the training inverted index and the category
vectors most similar to the document vector are the categories to which the
document is assigned. The similarity between the vectors is determined by
the dot product of the vectors. This gives a measure of the degree of
similarity of the document with a particular category. The results are sorted
to identify the top matches. A detailed discussion on tuning the various
parameters, such as number of tokens per document, number of categories
per document to be considered etc., to fine tune the performance of the
categorizer can be found in [23].
To generate contextual profiles based on the content captured from the user activity
on his/her machine, each document captured is classified and the top 50 categories
are stored for each document. When a particular category appears in multiple
documents, a very common scenario, the weights of the documents in that category
28
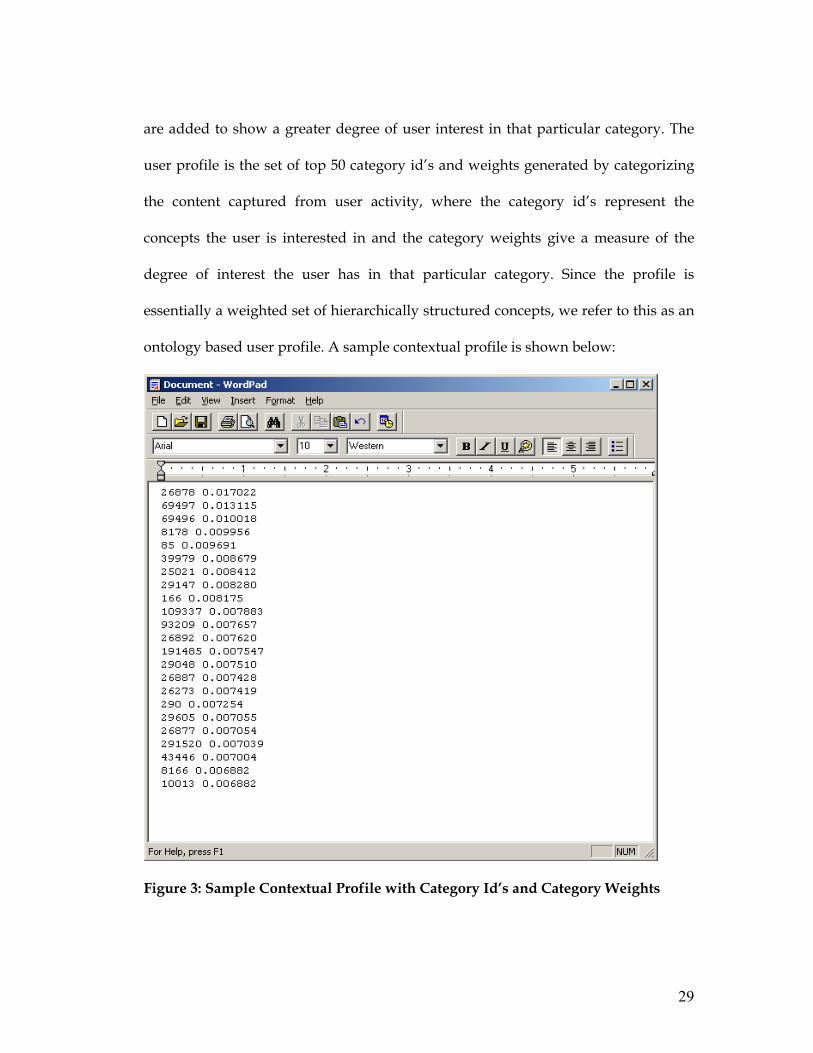
are added to show a greater degree of user interest in that particular category. The
user profile is the set of top 50 category id’s and weights generated by categorizing
the content captured from user activity, where the category id’s represent the
concepts the user is interested in and the category weights give a measure of the
degree of interest the user has in that particular category. Since the profile is
essentially a weighted set of hierarchically structured concepts, we refer to this as an
ontology based user profile. A sample contextual profile is shown below:
Figure 3: Sample Contextual Profile with Category Id’s and Category Weights
29
4.4 Personalizing Search Results Using Information from Contextual Profiles:
When the user issues a query, their recently stored context is classified to create the
user’s contextual profile. This contextual profile built using the content captured
from the user’s activity on his/her machine represents the interests of the user at that
particular instance of time. The contextual profile is uploaded to the server along
with the query. The query is submitted to the search engine and the titles,
summaries and ranks of the top 10 results are obtained. Then the results are re-
ranked using a combination of their original rank and their conceptual similarity to
the user’s contextual profile. The search result titles and summaries are classified to
create a document profile in the same manner as the user’s contextual profile. The
document profile is compared to the user profile to calculate the conceptual
similarity between each document and the user’s context. Then the documents are
re-ranked by their conceptual similarity to produce their conceptual rank.
The final rank of the document is calculated by combining both keyword rank and
conceptual rank using the following weighting scheme.
Final Rank = α * Conceptual Rank + (1-α) * Keyword Rank.
α has a value between 0 and 1. When α has a value of 0, conceptual rank is not given
any weight, and it is equivalent to pure keyword based ranking. If α has a value of 1,
keyword based ranking is ignored and pure conceptual rank is considered. Both the
conceptual and keyword based rankings can be blended by varying the values of α
In the next section, we describe experiments to evaluate the best source of
information for the user’s context, the number of concepts to use for the contextual
30

profile, the number of concepts to use for the document profile and how best to weigh
the original rank versus the conceptual similarity (the value of α).
31
Chapter 5
Experiments
In order to test and evaluate the use of contextual user profiles to personalize results
from Web search engines, a wrapper around the popular Web search engine, Google,
was built using the publicly available Google API [3]. This wrapper program builds
a log of the queries given by a user, the results returned by Google, the result clicked
by the user and the summaries, titles and ranks of the results returned from Google.
This log information was used to evaluate the performance of the system. For all
experiments the wrapper randomized the order of the top 10 Google results before
presenting them to the user so that the user would not be biased by the number one
result.
In oeder to evaluate the system 5 users were asked to use the system to perform
similar tasks. All 5 users were Computer Science graduates and were expert search
engine users. Each was asked to use the system to help them write a small essay on
the following 6 topics:
1. Write a small paragraph about living in Lawrence, with special reference to
cost of living, crime rate, quality of life in terms of available entertainment,
sports etc.
2. Write a small paragraph on the research labs at ITTC.
3. Write a small essay on the relative values of gems (Expensive stones).
32

4. Write a small paragraph on Wildcat species in the world.
5. Write a small paragraph about buying a car. Include details about factors
you think are important while buying a car. E.g. Cost, safety, resale value etc.
6. Write a small paragraph on the fruit mango.
While the users were performing these tasks the program described in section 4.2
was continually running in the background on their Windows machines, and
capturing the content of the Web pages and the content typed into the Word
documents. So that we could establish a context for the users, they were asked to at
least start their essay before issuing any queries to Google wrapper. They were also
asked to look through all the results returned by Google Wrapper before clicking on
any result, since Google Wrapper randomized the results returned by Google to
prevent the users from being biased towards the first result returned by Google. The
following figures show screenshots of the results returned by Google and those from
Google Wrapper. Notice that the results are shown in random order in Google
Wrapper.
33
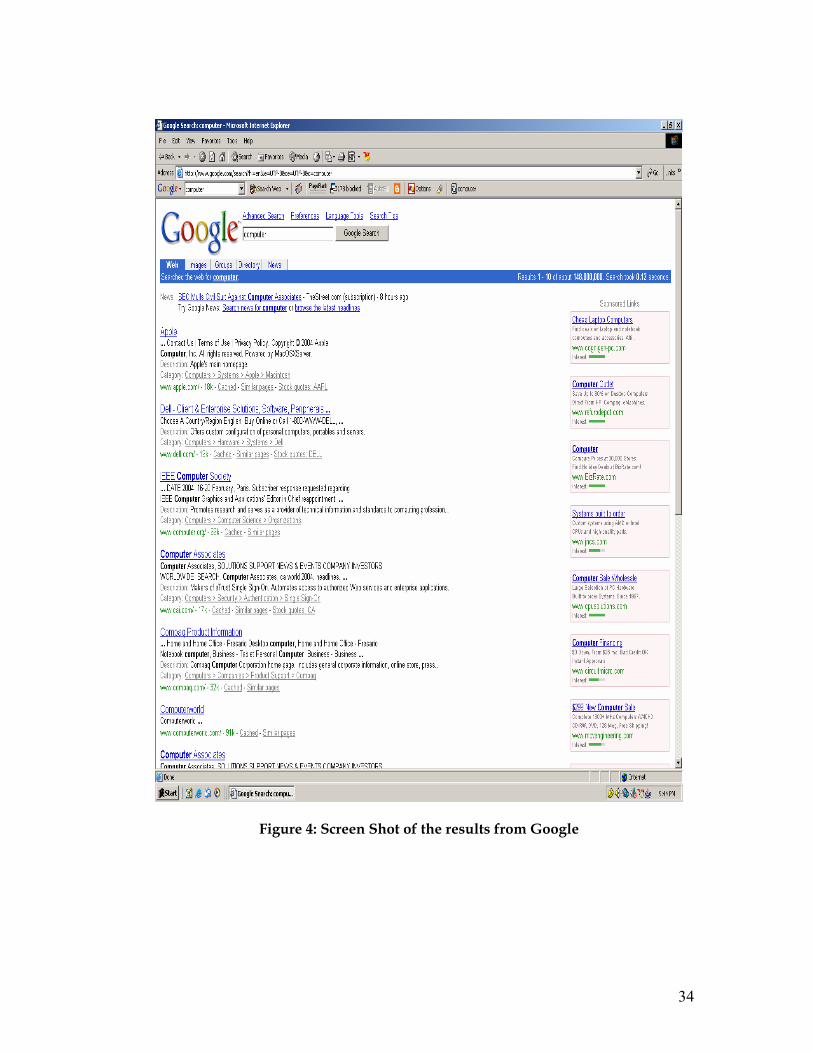
Figure 4: Screen Shot of the results from Google
34

Figure 4: Screen Shot of the results displayed by Google Wrapper
35

Google wrapper recorded which results they clicked on, which we used as a form of
implicit user relevance in our analysis. After the users finished the tasks, the content
captured from the user activity was classified to build contextual profiles for each
query given the user. The content that had to be categorized for each query was
identified manually based on the time stamps. The user profiles and the log
information from Google Wrapper were used to re-rank and evaluate the system.
The re-ranking was done as described in Section 4.4.
After the data was collected, we had a log of 50 queries averaging 10 queries per
user. Of these 50 queries 6 of them had to be removed, either because there were
multiple results clicked, no results clicked or there was no contextual information
available for that particular query. The remaining 44 queries were analyzed and
evaluated. Experiments were conducted to determine the number of concepts to be
considered from the contextual user profile, the number of concepts from the
document profile and the value of α for blending the conceptual rank and the
keyword rank. The results from these experiments are presented in the next chapter.
In each experiment we report the average rank of the user-clicked result for our
baseline system Google and for our conceptual search engine.
36

Chapter 6
Evaluation and Analysis
6.1 Combining Information from Word Documents and Web Pages to Build the
Contextual Profile
The first set of experiments were conducted to test the hypothesis that by using
information from the Word documents the user has created or viewed and the Web
pages the user has browsed, search accuracy can be improved. The number of
concepts for the user’s contextual profile, the number of concepts for the document
profile and the relative contribution of the original rank and the conceptual rank (α
value) are also to be determined.
For evaluating this hypothesis, we split the queries into two groups, initial-query
group that was the set of first queries issued by users while accomplishing each task
and secondary-queries group that was the set of the remaining queries issued while
accomplishing the task. The initial -query group had a set of 21 queries and
secondary-query group had a set of 23 queries. These 2 groups were evaluated
separately. It was expected that the performance of the system would be better in the
secondary-query group since we had more information available to build the
contextual framework for a query in group2.
37
Experiments were done to calculate the conceptual rank of the result documents by
varying the number of concepts to be considered for the contextual profile, the
number of concepts to be considered for the document profile and the value of α.
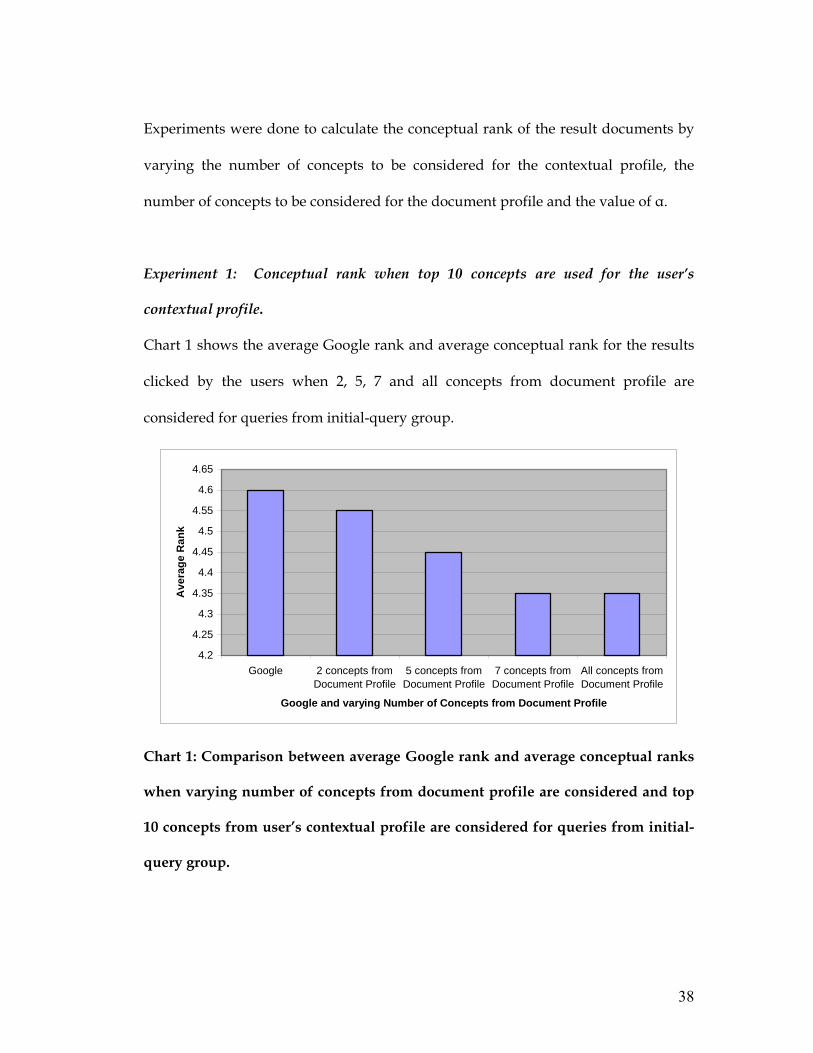
Experiment 1: Conceptual rank when top 10 concepts are used for the user’s
contextual profile.
Chart 1 shows the average Google rank and average conceptual rank for the results
clicked by the users when 2, 5, 7 and all concepts from document profile are
considered for queries from initial-query group.
4.2
4.25
4.3
4.35
4.4
4.45
4.5
4.55
4.6
4.65
Google 2 concepts fromDocument Profile
5 concepts fromDocument Profile
7 concepts fromDocument Profile
All concepts fromDocument Profile
Google and varying Number of Concepts from Document Profile
Ave
rage
Ran
k
Chart 1: Comparison between average Google rank and average conceptual ranks
when varying number of concepts from document profile are considered and top
10 concepts from user’s contextual profile are considered for queries from initial-
query group.
38
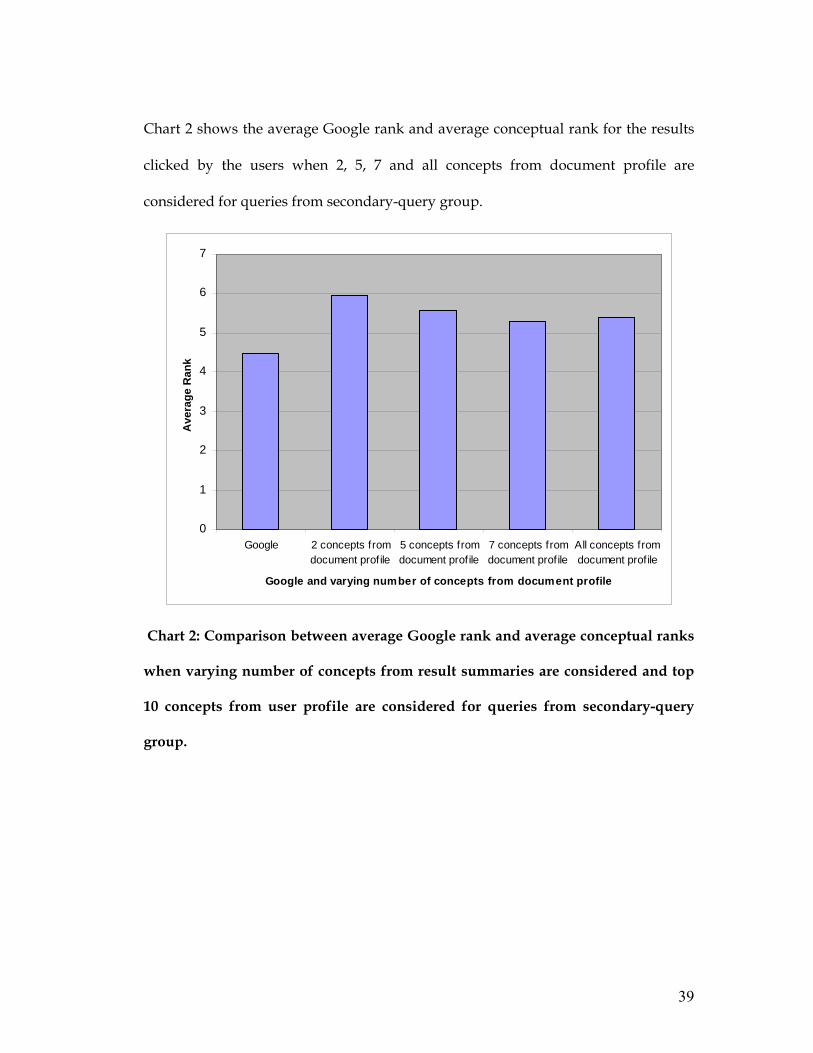
Chart 2 shows the average Google rank and average conceptual rank for the results
clicked by the users when 2, 5, 7 and all concepts from document profile are
considered for queries from secondary-query group.
0
1
2
3
4
5
6
7
Google 2 concepts fromdocument profile
5 concepts fromdocument profile
7 concepts fromdocument profile
All concepts fromdocument profile
Google and varying number of concepts from document profile
Ave
rage
Ran
k
Chart 2: Comparison between average Google rank and average conceptual ranks
when varying number of concepts from result summaries are considered and top
10 concepts from user profile are considered for queries from secondary-query
group.
39

Experiment 2: Conceptual rank when top 20 concepts from the user’s contextual
profile are considered.
Chart 3 shows the average Google rank and average conceptual rank for the results
clicked by the users when 2, 5, 7 and all concepts from document profile and top 20
concepts from user’s contextual profile are considered for queries from Group 1.
3.9
4
4.1
4.2
4.3
4.4
4.5
4.6
4.7
Google 2 concepts fromDocument Profile
5 concepts fromDocument Profile
7 concepts fromDocument Profile
All concepts fromDocument Profile
Google and Varying number of Concepts from Document Profile
Ave
rage
Ran
k
Chart 3: Comparison between average Google rank and average conceptual ranks
when varying number of concepts from document profile are considered and top
20 concepts from user’s contextual profile are considered for queries from initial-
query group.
40

Chart 4 shows the average Google rank and average conceptual rank for the results
clicked by the users when 2, 5, 7 and all concepts from document summaries and top
20 concepts from user’s contextual profile are considered for queries from
secondary-query group.
0
1
2
3
4
5
6
7
Google 2 Concepts fromDocument Profile
5 concepts fromDocument Profile
7 concepts fromDocument Profile
All concepts fromDocument Profiles
Google and Varying Number of Concepts from Document Profile
Ave
rage
Ran
k
Chart 4: Comparison between average Google rank and average conceptual ranks
when varying number of concepts from document profile are considered and top
20 concepts from user’s contextual profile are considered for queries from
secondary-group.
41

Experiment 3: Conceptual rank when top 30 concepts from the user’s contextual
profile are considered.
Chart 5 shows the average Google rank and average conceptual rank for the results
clicked by the users when 2, 5, 7 and all concepts from document summaries and top
30 concepts from user’s contextual profile are considered for queries from initial-
query group.
3.9
4
4.1
4.2
4.3
4.4
4.5
4.6
4.7
Google 2 concepts fromDocument Profile
5 concepts fromDocument Profile
7 concepts fromDocument Profile
All concepts fromDocument Profile
Google and varying number of Concepts from document profile
Ave
rage
Ran
k
Chart 5: Comparison between average Google rank and average conceptual ranks
when varying number of concepts from result summaries are considered and top
30 concepts from user profile are considered for queries from initial-query group.
42
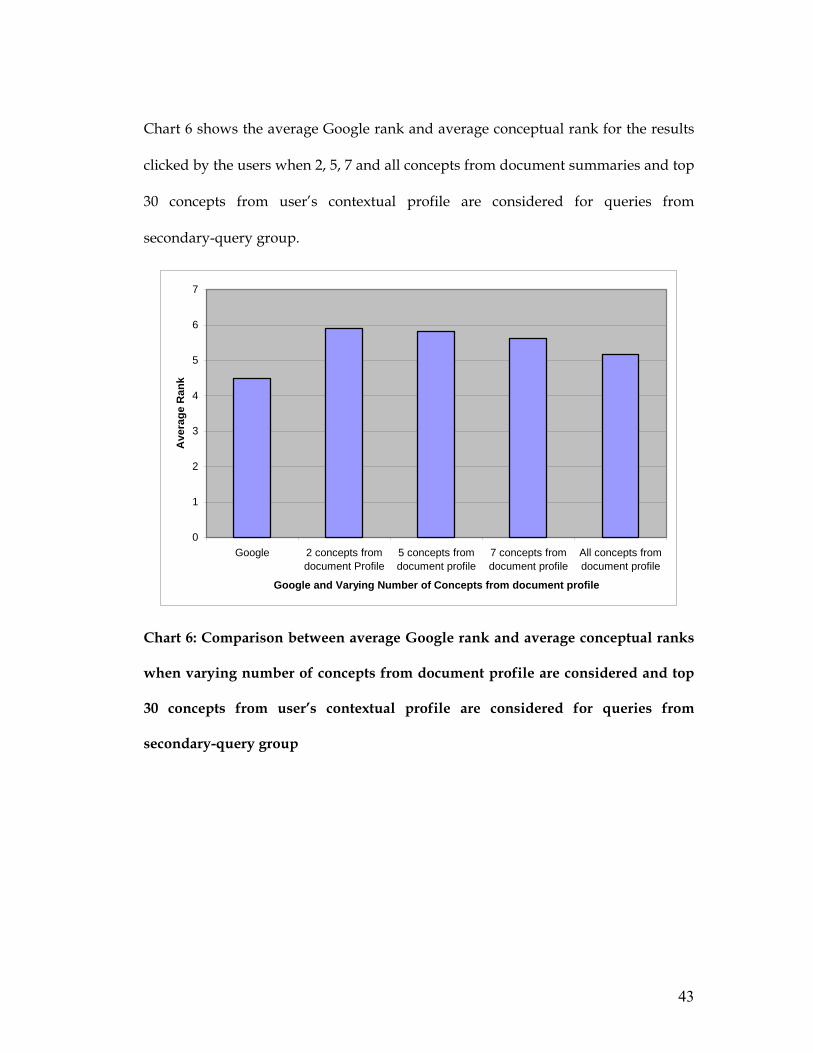
Chart 6 shows the average Google rank and average conceptual rank for the results
clicked by the users when 2, 5, 7 and all concepts from document summaries and top
30 concepts from user’s contextual profile are considered for queries from
secondary-query group.
0
1
2
3
4
5
6
7
Google 2 concepts fromdocument Profile
5 concepts fromdocument profile
7 concepts fromdocument profile
All concepts fromdocument profile
Google and Varying Number of Concepts from document profile
Ave
rage
Ran
k
Chart 6: Comparison between average Google rank and average conceptual ranks
when varying number of concepts from document profile are considered and top
30 concepts from user’s contextual profile are considered for queries from
secondary-query group
43

Experiment 4: Conceptual rank when all concepts from the user profile are
considered.
Chart 7 shows the average Google rank and average conceptual rank for the results
clicked by the users when 2, 5, 7 and all concepts from document profile and all
concepts from user’s contextual profile are considered for queries from initial-query
group.
3.9
4
4.1
4.2
4.3
4.4
4.5
4.6
4.7
Google 2 concepts fromdocument profile
5 concepts fromdocument profile
7 concepts fromdocument profile
All concepts fromdocument profile
Google and varying number of concepts from document profile
Ave
rage
Ran
k
Chart 7: Comparison between average Google rank and average conceptual ranks
when varying number of concepts from document profile are considered and all
concepts from user’s contextual profile are considered for queries from initial-
query group.
44

Chart 8 shows the average Google rank and average conceptual rank for the results
clicked by the users when 2, 5, 7 and all concepts from document profiles and all
concepts from user’s contextual profile are considered for queries from secondary-
query group.
0
1
2
3
4
5
6
7
Google 2 concepts fromdocument profile
5 concepts fromdocument profile
7 concepts fromdocument profile
All concepts fromdocument profile
Google and Varying number of Concepts from document profile
Ave
rage
Ran
k
Chart 8: Comparison between average Google rank and average conceptual ranks
when varying number of concepts from document profile are considered and all
concepts from user’s contextual profile are considered for queries from secondary-
query group.
45

Discussion of the results of experiments 1 through 4:
The best average conceptual rank for queries from initial-query group is 4.15 and
average Google rank for queries from this group is 4.6. The best average conceptual
rank for queries from secondary-query group is 5.17 and the average Google rank is
4.47. The final rank was calculated using the formula :
Final Rank = α * Conceptual Rank + (1-α) * KeyWord Rank.
α has values between 0 and 1.
The final ranks for queries from both groups were calculated using the above
formula. The conceptual rank for each group was calculated using a combination of
the number of top concepts from user profiles and result summaries that gave the
best results in the experiments above.
Charts 9 and 10 plot the average final rank Vs Alpha values for queries from both
groups.
46

Chart 9: Average Final Rank Vs Alpha Values for queries from initial-query group
Chart 10: Average Final Rank Vs Alpha values for queries from secondary-query
group
47

Based on the above experiments it has been observed that the best final rank for
queries from initial-query group was 3.64 and the best final rank for queries from
secondary-query group was 4.43. Conceptual rank for queries from secondary-query
group is higher than those from initial-query group. There is no significant
improvement in the final rank for queries from secondary-query group. This is
against the initial expectation that the conceptual ranks of queries from secondary-
query group would be better than those from initial-query group since there was
additional amount of content available for queries from secondary-query group for
contextual analysis. On further analysis of the log data from Google wrapper and the
data captured from user activity we estimated that since most of the queries in
secondary-query group had information from both Word documents and Web pages
available for contextual analysis, as against mostly Word documents in initial-query
group, content from different sources should be weighted differently when building
the user’s contextual profile. The next series of experiments were done to see the
difference in the performance of the system when profiles were built using only
content from Word documents and content from Web pages separately.
6.2 Using Information from Word Documents and Web Pages Independently to
Build the Contextual Profile
For the purpose of this experiment queries were analyzed by building profiles from
the content of Word documents and Web pages separately.
48
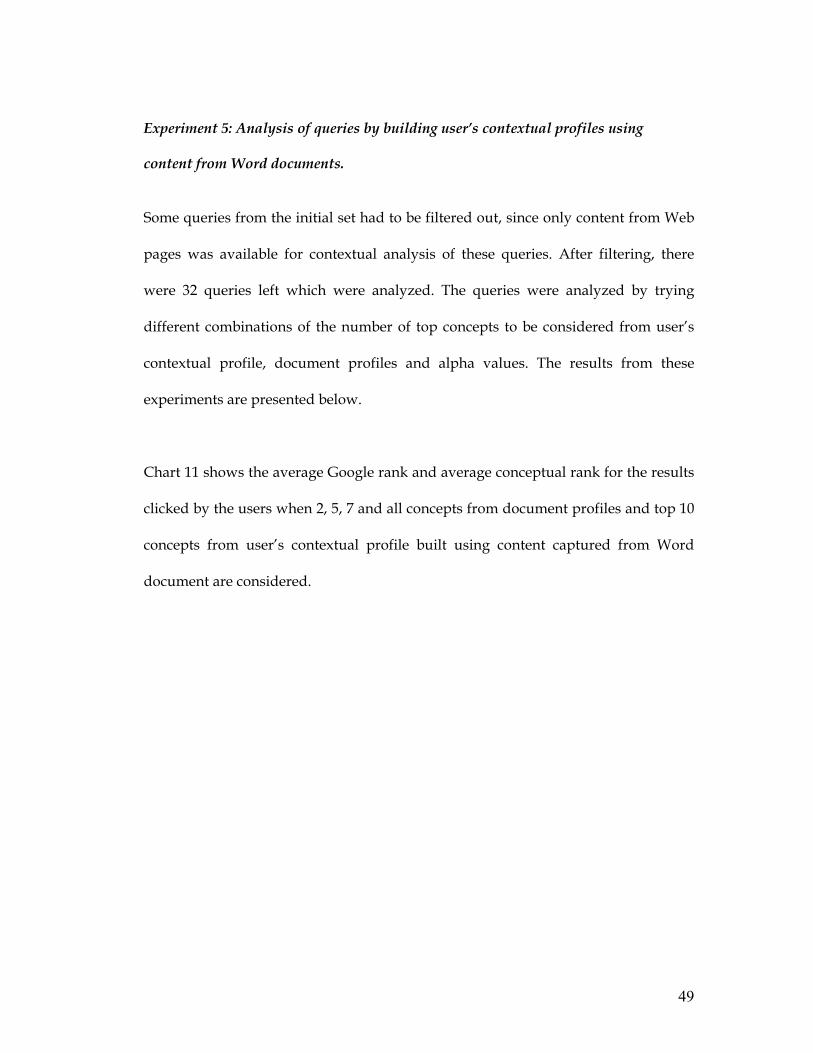
Experiment 5: Analysis of queries by building user’s contextual profiles using
content from Word documents.
Some queries from the initial set had to be filtered out, since only content from Web
pages was available for contextual analysis of these queries. After filtering, there
were 32 queries left which were analyzed. The queries were analyzed by trying
different combinations of the number of top concepts to be considered from user’s
contextual profile, document profiles and alpha values. The results from these
experiments are presented below.
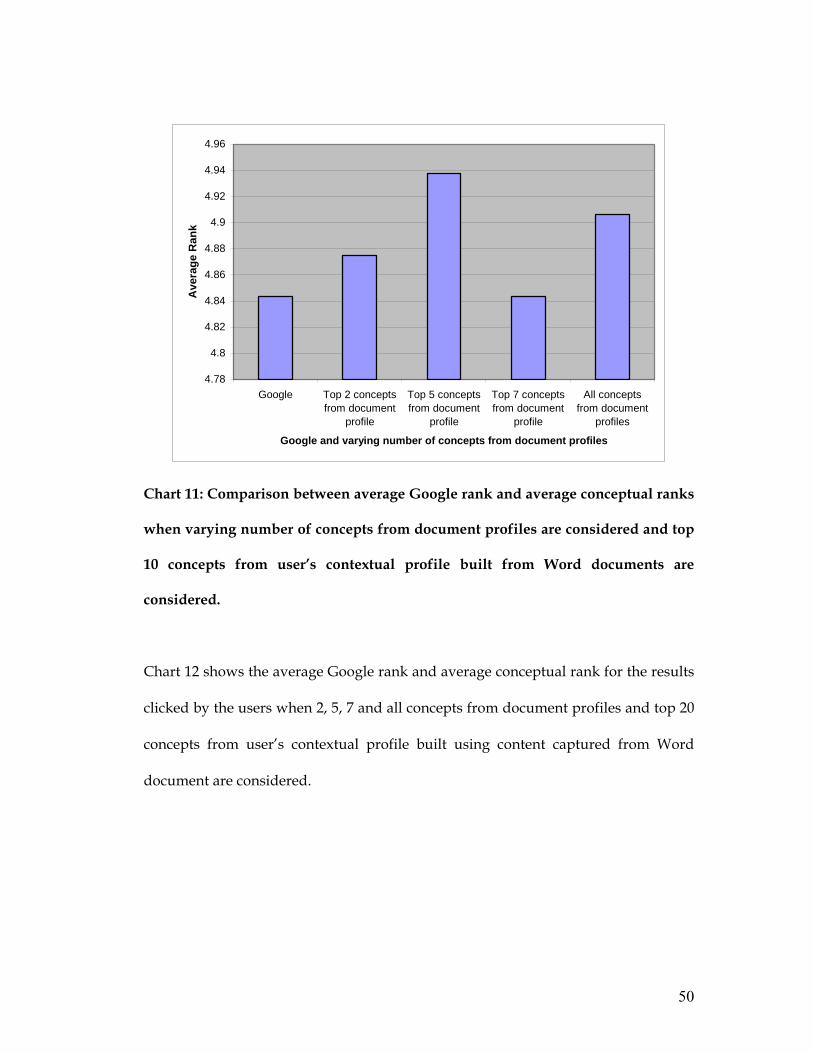
Chart 11 shows the average Google rank and average conceptual rank for the results
clicked by the users when 2, 5, 7 and all concepts from document profiles and top 10
concepts from user’s contextual profile built using content captured from Word
document are considered.
49
4.78
4.8
4.82
4.84
4.86
4.88
4.9
4.92
4.94
4.96
Google Top 2 conceptsfrom document
profile
Top 5 conceptsfrom document
profile
Top 7 conceptsfrom document
profile
All conceptsfrom document
profiles
Google and varying number of concepts from document profiles
Ave
rage
Ran
k
Chart 11: Comparison between average Google rank and average conceptual ranks
when varying number of concepts from document profiles are considered and top
10 concepts from user’s contextual profile built from Word documents are
considered.
Chart 12 shows the average Google rank and average conceptual rank for the results
clicked by the users when 2, 5, 7 and all concepts from document profiles and top 20
concepts from user’s contextual profile built using content captured from Word
document are considered.
50

4.5
4.6
4.7
4.8
4.9
5
5.1
5.2
Google 2 concepts fromdocument profile
5 concepts fromdocument profiles
7 concepts fromdocument profiles
All concepts fromdocument profile
Google and Varying number of concepts from document profile
Ave
rage
Ran
k
Chart 12: Comparison between average Google rank and average conceptual ranks
when varying number of concepts from document profile are considered and top
20 concepts from user’s contextual profile built from Word documents are
considered.
Chart 13 shows the average Google rank and average conceptual rank for the results
clicked by the users when 2, 5, 7 and all concepts from document profile and top 30
concepts from user’s contextual profile built using content captured from Word
document are considered.
51

4.55
4.6
4.65
4.7
4.75
4.8
4.85
4.9
4.95
5
Google 2 concepts fromdocument profile
5 concepts fromdocument profile
7 concepts fromdocument profile
All concepts fromdocument profile
Google and Varying number of Concepts from document profile
Ave
rage
Ran
k
Chart 13: Comparison between average Google rank and average conceptual ranks
when varying number of concepts from document profile are considered and top
30 concepts from user’s contextual profile built from Word documents are
considered.
Chart 14 shows the average Google rank and average conceptual rank for the results
clicked by the users when 2, 5, 7 and all concepts from document profile and all
concepts from user’s contextual profile built using content captured from Word
document are considered.
52

4.6
4.65
4.7
4.75
4.8
4.85
4.9
4.95
Google 2 concepts fromdocument profile
5 concepts fromdocument profile
7 concepts fromdocument profile
All concepts fromdocument profile
Google and Varying Number of Concepts from document profile
Ave
rage
Ran
k
Chart 14: Comparison between average Google rank and average conceptual ranks
when varying number of concepts from document profile are considered and all
concepts from user’s contextual profile built from Word documents are
considered.
Based on the above analysis, it was found that when profiles are built using only the
content from Word documents the best average conceptual rank was obtained when
top 30 concepts from user profile and top 7 concepts from document summaries
were considered .
The final rank was calculated using the formula:
Final Rank = α * Conceptual Rank + (1-α) * KeyWord Rank.
53
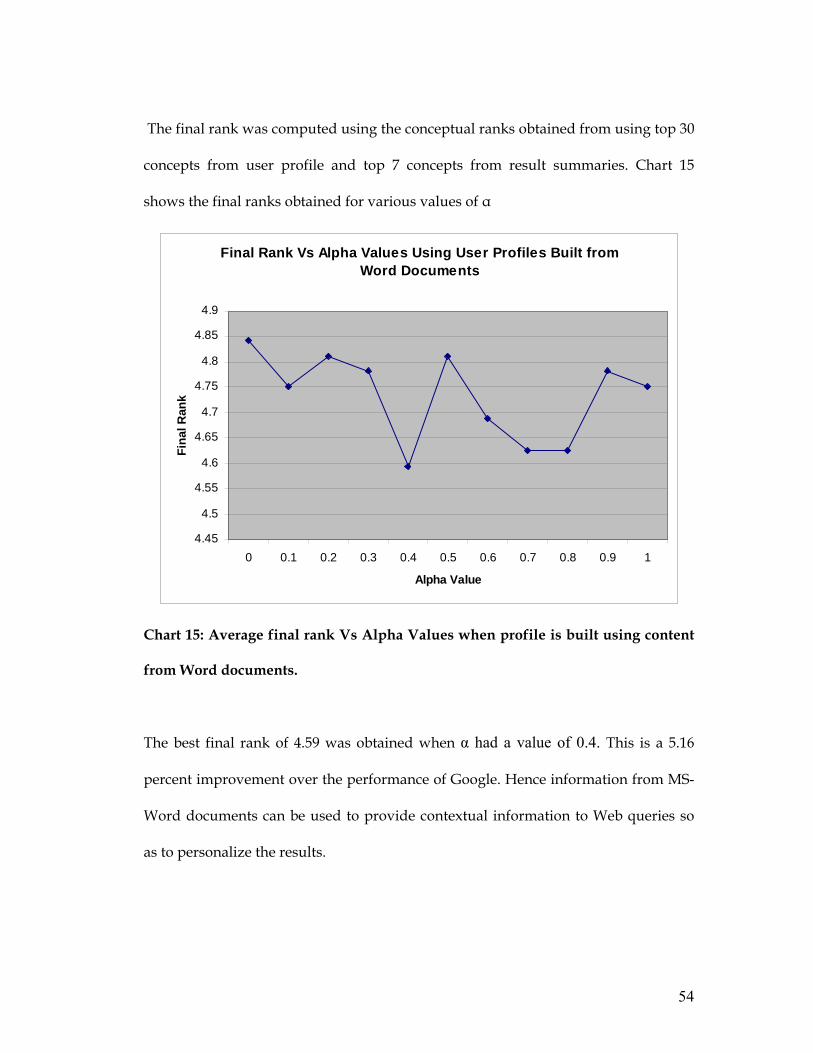
The final rank was computed using the conceptual ranks obtained from using top 30
concepts from user profile and top 7 concepts from result summaries. Chart 15
shows the final ranks obtained for various values of α
Final Rank Vs Alpha Values Using User Profiles Built from Word Documents
4.45
4.5
4.55
4.6
4.65
4.7
4.75
4.8
4.85
4.9
0 0.1 0.2 0.3 0.4 0.5 0.6 0.7 0.8 0.9 1
Alpha Value
Fina
l Ran
k
Chart 15: Average final rank Vs Alpha Values when profile is built using content
from Word documents.
The best final rank of 4.59 was obtained when α had a value of 0.4. This is a 5.16
percent improvement over the performance of Google. Hence information from MS-
Word documents can be used to provide contextual information to Web queries so
as to personalize the results.
54

Experiment 6: Analysis of queries by building user profiles using content from Web
pages.
Some queries from the initial set had to be filtered out, since only content from Web
pages was available for contextual analysis of these queries. After filtering, there
were 31 queries left which were analyzed.
Chart 16 shows the average Google rank and average conceptual rank for the results
clicked by the users when 2, 5, 7 and all concepts from document profile and top 10
concepts from user’s contextual profile built using content captured from Web pages
are considered.
0
1
2
3
4
5
6
Google 2 Concepts fromdocument profile
5 concepts fromdocument profile
7 Concepts fromdocument profiles
All Concepts fromdocument profile
Google and varying number of concpets from document profiles
Ave
rage
Ran
k
Chart 16: Comparison between average Google rank and average conceptual ranks
when varying number of concepts from document profile are considered and top
10 concepts from user’s contextual profile built from Web pages are considered.
55
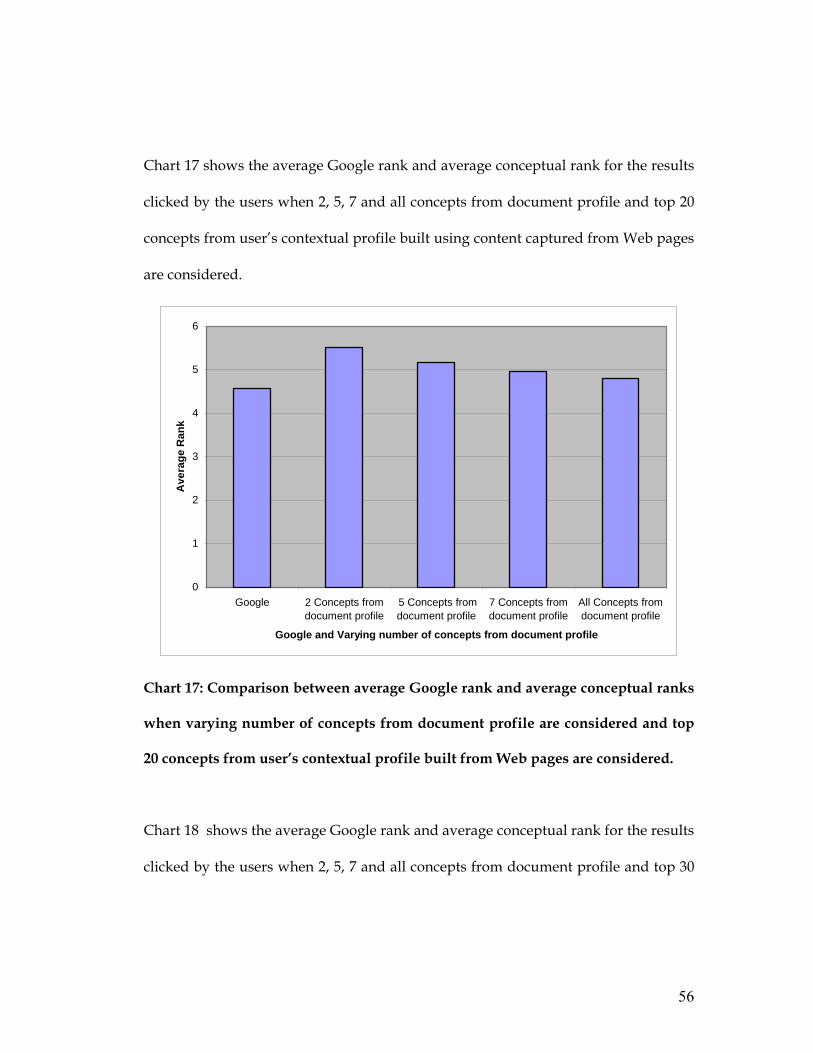
Chart 17 shows the average Google rank and average conceptual rank for the results
clicked by the users when 2, 5, 7 and all concepts from document profile and top 20
concepts from user’s contextual profile built using content captured from Web pages
are considered.
0
1
2
3
4
5
6
Google 2 Concepts fromdocument profile
5 Concepts fromdocument profile
7 Concepts fromdocument profile
All Concepts fromdocument profile
Google and Varying number of concepts from document profile
Ave
rage
Ran
k
Chart 17: Comparison between average Google rank and average conceptual ranks
when varying number of concepts from document profile are considered and top
20 concepts from user’s contextual profile built from Web pages are considered.
Chart 18 shows the average Google rank and average conceptual rank for the results
clicked by the users when 2, 5, 7 and all concepts from document profile and top 30
56

concepts from user’s contextual profile built using content captured from Web pages
are considered.
4
4.2
4.4
4.6
4.8
5
5.2
5.4
5.6
Google 2 Concepts fromdocument profile
5 Concepts fromdocument profile
7 Concepts fromdocument profile
All Conceptsfrom document
profile
Google and Varying Number of concepts from document profile
Ave
rage
Ran
k
Chart 18: Comparison between average Google rank and average conceptual ranks
when varying number of concepts from document profile are considered and top
30 concepts from user’s contextual profile built from Web pages are considered.
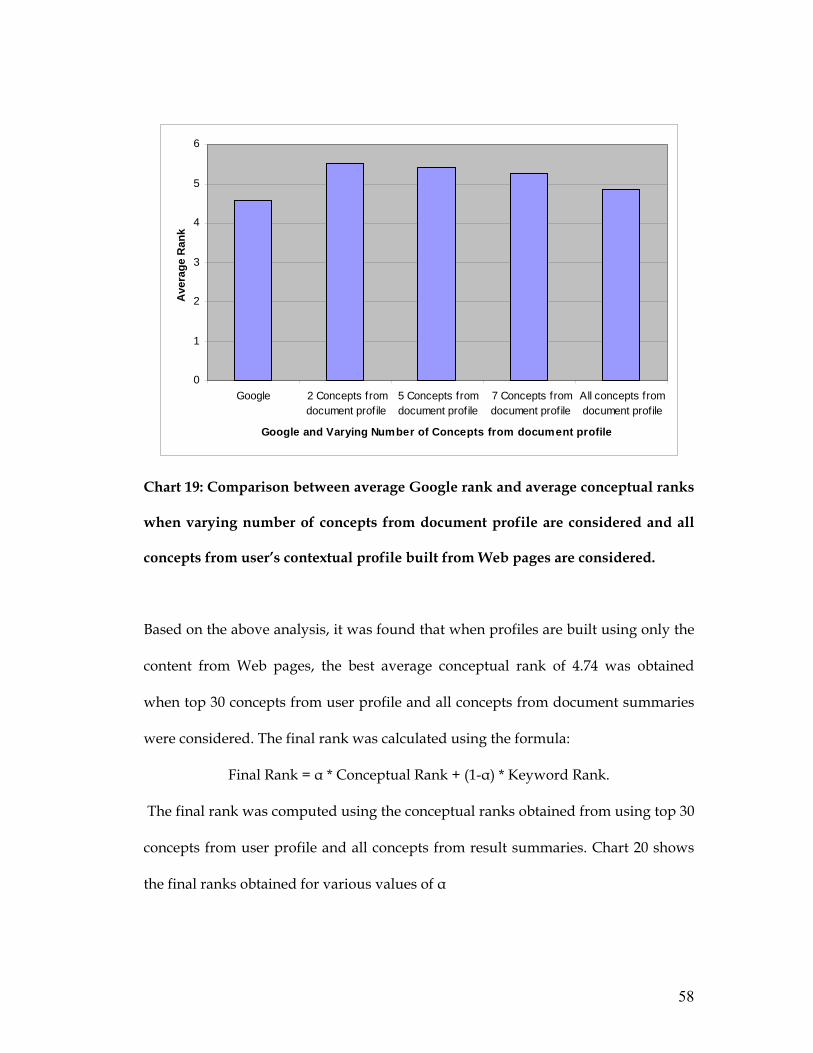
Chart 19 shows the average Google rank and average conceptual rank for the results
clicked by the users when 2, 5, 7 and all concepts from document summaries and all
concepts from user profile built using content captured from Web pages are
considered.
57
0
1
2
3
4
5
6
Google 2 Concepts fromdocument profile
5 Concepts fromdocument profile
7 Concepts fromdocument profile
All concepts fromdocument profile
Google and Varying Number of Concepts from document profile
Ave
rage
Ran
k
Chart 19: Comparison between average Google rank and average conceptual ranks
when varying number of concepts from document profile are considered and all
concepts from user’s contextual profile built from Web pages are considered.
Based on the above analysis, it was found that when profiles are built using only the
content from Web pages, the best average conceptual rank of 4.74 was obtained
when top 30 concepts from user profile and all concepts from document summaries
were considered. The final rank was calculated using the formula:
Final Rank = α * Conceptual Rank + (1-α) * Keyword Rank.
The final rank was computed using the conceptual ranks obtained from using top 30
concepts from user profile and all concepts from result summaries. Chart 20 shows
the final ranks obtained for various values of α
58

Average Rank Vs Alpha Values for User profiles built from Web Pages
3.9
4
4.1
4.2
4.3
4.4
4.5
4.6
4.7
4.8
0 0.1 0.2 0.3 0.4 0.5 0.6 0.7 0.8 0.9 1
Alpha Values
Ave
rage
Ran
k
Chart 20: Average final rank Vs Alpha Values when profile is built using content
from Web pages
The best final rank of 4.22 was obtained when α had a value of 0.4.
The above results show that using information from either Web pages or Word
documents to build user profiles increases the performance of the system. However
the results from section 6.1 show that when they are used in conjunction by giving
each of them the same weight, they do not show the same amount of improvement.
Hence a series of experiments we conducted to analyze the performance of the
system when content from different sources are weighted differently when building
the profile.
59

6.3 Weighting the Content from Word Documents and Web Pages Differently to
Build the Contextual Profile
Experiment 7: Analysis of queries when user profiles are built by weighing content
from Word documents and Web pages differently
For these set of experiments, the final profile was built based on the following
formula:
Final Profile = β *Word Profile + (1 - β) * Web Profile
Where Word Profile is the profile built from Word documents only and Web Profile
is the profile built from Web pages only. β has values between 0 and 1, when β is 0
the final profile is built using content from Web Pages only and when β is 1 the final
profile is built using content from Word documents only. Varying the values of β
will result in content from Web pages and Word documents to be weighted
differently.
For the purpose of this analysis, the initial set of queries had to filtered and only
queries containing both Web pages and Word documents for contextual analysis
were considered. 22 queries were analyzed. As the results from the previous
experiments suggest that the best conceptual rank is obtained when top 30 concepts
from the user profile are considered, and either top 7 or all concepts from the result
summaries are considered, for the purpose of determining the optimal value of β
and α factors we calculate the conceptual rank using top 30 concepts from user
profile and all concepts from the result summaries.
60
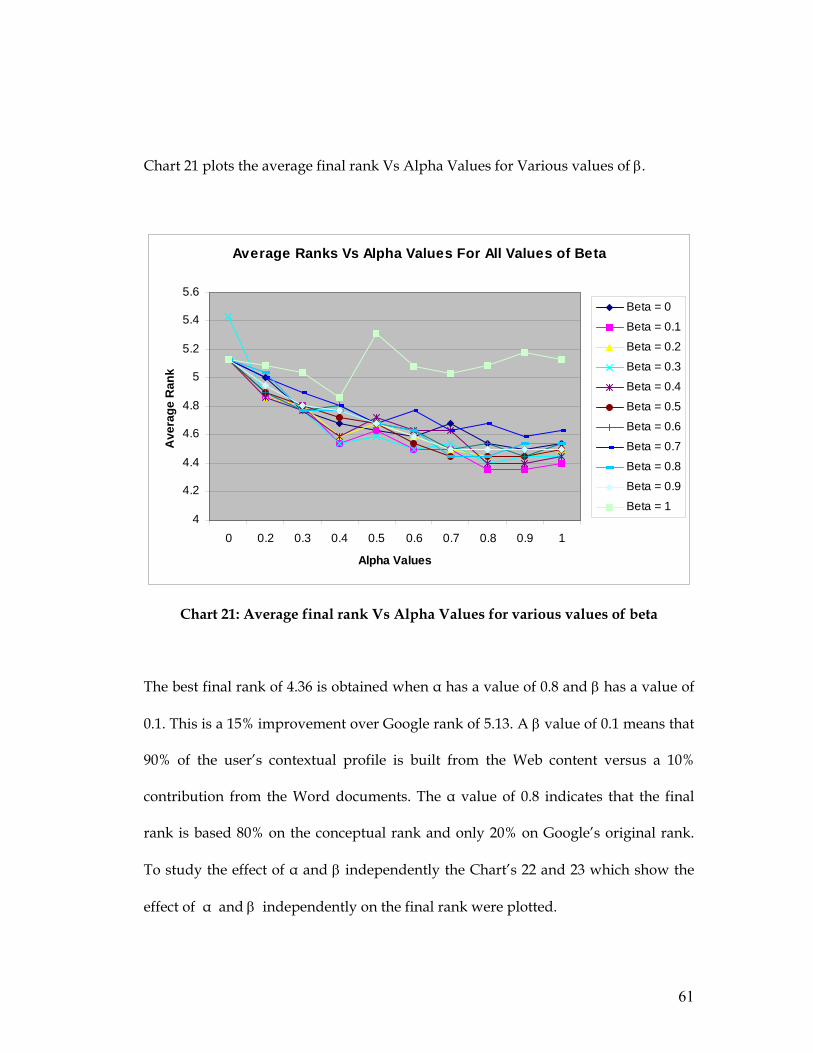
Chart 21 plots the average final rank Vs Alpha Values for Various values of β.
Average Ranks Vs Alpha Values For All Values of Beta
4
4.2
4.4
4.6
4.8
5
5.2
5.4
5.6
0 0.2 0.3 0.4 0.5 0.6 0.7 0.8 0.9 1
Alpha Values
Ave
rage
Ran
k
Beta = 0
Beta = 0.1
Beta = 0.2
Beta = 0.3
Beta = 0.4
Beta = 0.5
Beta = 0.6
Beta = 0.7
Beta = 0.8
Beta = 0.9
Beta = 1
Chart 21: Average final rank Vs Alpha Values for various values of beta
The best final rank of 4.36 is obtained when α has a value of 0.8 and β has a value of
0.1. This is a 15% improvement over Google rank of 5.13. A β value of 0.1 means that
90% of the user’s contextual profile is built from the Web content versus a 10%
contribution from the Word documents. The α value of 0.8 indicates that the final
rank is based 80% on the conceptual rank and only 20% on Google’s original rank.
To study the effect of α and β independently the Chart’s 22 and 23 which show the
effect of α and β independently on the final rank were plotted.
61

Average Rank Vs Alpha Values
4.2
4.3
4.4
4.5
4.6
4.7
4.8
4.9
5
5.1
5.2
0 0.2 0.3 0.4 0.5 0.6 0.7 0.8 0.9 1
Alpha Values
Ave
rage
Ran
k
Chart 22: Average final rank Vs Alpha Values .
Average Rank Vs Beta Values
4.3
4.4
4.5
4.6
4.7
4.8
4.9
5
5.1
5.2
0 0.1 0.2 0.3 0.4 0.5 0.6 0.7 0.8 0.9 1
Beta values
Ave
rage
Ran
k
Chart 23: Average final rank Vs Beta Values .
Other experimental studies have shown that α should have a value of around 0.3
[21]. The high value of α in our experiments indicates that conceptual rank should be
given more weight than the search engine’s ranking. This maybe because we are re-
62

ranking among the top 10 results only, and they may match the user’s query equally
well. The primary distinguishing factor is therefore their conceptual similarity to the
user’s context.
β values between 0.1 and 0.5 produce roughly comparable results, with the best
value occurring with β = 0.1. This maybe because the Word documents created
were very short and although we normalized for length in both cases, they just may
not have contained enough content for accurate profile as compared to more
comprehensive Web pages. If there was more content available for Word documents
the value of β might have moved to a higher value.
63

Chapter 7
Conclusions and Future Work
In this thesis, we demonstrated that content captured from user activity can be used
to build contextual user profiles and that these profiles can be used to improve Web
searches. Experiments were done to study the importance of the content from
various sources, and the importance of conceptual ranking during personalization.
Building a contextual profile using content from Word documents only resulted in a
5.16% improvement over Google and building a contextual profile using content
from Web pages visited by the user resulted in a improvement of 7.86%. We found
that when combining various sources, they should be weighed differently to build a
better profile. When the content from Web pages and Word documents were
weighed differently an improvement of 15% over Google was achieved. We also
found that within the top 10 results of Google, re-ranking should be done giving
more weight to the conceptual similarity between the user’s contextual profile and
the document than the original rank order.
In our experiments, most of the users were expert users of search engines, and the
average query length was around 4. Long queries tend to disambiguate themselves
and result in better initial search results. It is possible that the improvements
produced by the system would be more dramatic with shorter queries more
common on the Web as a whole. In the system built, the contextual profile was built
64
based on the most recent document of each type only. Studies need to be done to
determine the best time window within which documents captured should be
included in the contextual profile. Also, content from various other sources such as
chat transcripts, Excel spreadsheets, Power Point presentations etc. can be used to
build the contextual profile and the effect of the content from these sources needs to
be analyzed. Finally, a combination of the user’s current context and long and short-
term interests should be investigated.
65

References
1. http://www.searchenginewatch.com
2. Monica Bonett, Personalization of Web Services: Opportunities and
Challenges. http://www.ariadne.ac.uk/issue28/personalization/
3. http://api.google.com
4. Stefan Decker, Michael Erdmann, Dieter Fensel, Rudi Studer, Ontobroker:
Ontology based Access to Distributed and Semi-Structured Information.
Proceedings of W3C Query Language Workshop QL'98. (1998)
5. O. Lassila and R. Swick, Resource Description Framework (RDF) Model and
Syntax Specification. World Wide Web Consortium recommendation. 22 February
1999.
6. Dieter Fensel, Frank van Harmelen, Ian Horrocks, Deborah, OIL: An
Ontology Infrastructure for the Semantic Web. IEEE Intelligent Systems, Vol.
16, No. 2, March/April 2001.
7. Heflin, J., Hendler, J., and Luke, S. SHOE: A Knowledge Representation
Language for Internet Applications. Technical Report CS-TR-4078 (UMIACS
TR-99-71), Dept. of Computer Science, University of Maryland at College Park.
1999
8. Jude Shavlik et al : An Instructable, Adaptive Interface for Discovering and
Monitoring Information on the World Wide Web. Proceedings of the 1999
International Conference on Intelligent User Interfaces, pp. 157 - 160, Redondo
Beach, CA.
66

9. Dwi H. Widyantoro, Thomas R.Ioerger and John Yen, Learning User Interest
Dynamics with a Three-Descriptor Representation. Journal of the American
Society for Information Science, 52(3):212-225.
10. Philip Chan: Constructing Web User Profiles: A Non-invasive Learning
Approach. KDD-99 Workshop on Web Usage Analysis and User Profiling, pp. 7-
12, 1999.
11. Michael Pazzani et al : Syskill & Webert : Identifying interesting Web sites.
M. Pazzani, J. Muramatsu, and D. Billsus, "Syskill & Webert: Identifying
interesting Web sites," in Proceedings of the 13th National Conference on Artificial
Intelligence (AAA196), 1996, pp. 54--61.
12. Jeremy Goecks, Jude Shavlik: Automatically Labeling Web Pages Based on
Normal User Actions. In Proceedings of the IJCAI Workshop on Machine Learning
for Information Filtering, Stockholm, Sweden, July 1999.
13. Yiming Yang, Xin Liu. A Re-Examination Of Text Categorization Methods. In
Proceedings of the 22nd Annual International ACM SIGIR Conference on Research
and Development in Information Retrieval, August 1999, pp. 42-49.
14. Charles Elkan, Naïve Bayesian Learning
15. Miguel Ruiz, Padmini Srinivasan. Hierarchial Neural Networks for Text
Categorization. In Proceedings of the 22nd Annual International ACM SIGIR
Conference on Research and Development in Information Retrieval, August 1999,
pp. 281-282.
67

16. Leake, D., Scherle, R., Budzik, J., and Hammond, K. (1999). Selecting Task-
Relevant Sources for Just-in-Time Retrieval. In Proceedings of the AAAI-99
Workshop on Intelligent Information Systems. AAAI Press, Menlo Park, CA, 1999
17. S. T. Dumais, E. Cutrell, E., J. J. Cadiz, G. Jancke, R. Sarin and D. C. Robbins
(2003). Stuff I've Seen: A system for personal information retrieval and re-
use. Proceedings of SIGIR 2003.
18. The Open Directory Project (ODP), http://dmoz.org.
19. Jason Chafee, Susan Gauch. Personal Ontologies for Web Navigation. In
proceedings of the 9th International Conference on Information and Knowledge
Management (CIKM), 2000, pp 227-234.
20. Xiaolan Zhu, Susan Gauch, Lutz Gerhard, Nicholas Kral, Alexander
Pretschner. Ontology-Based Web Site Mapping For Information Exploration.
In Proceedings of the 8th International Conference on Information and Knowledge
Management (CIKM), 1999, pp 188-194.
21. Gauch Susan, Chaffee Jason, and Pretschner Alexander, Ontology Based User
Profiles for Search and Browsing, Web Intelligence and Agent Systems (In
Press).
22. Joana Trajkova, Improving Ontology-based User Profiles. Master’s Thesis
submitted to the EECS Dept., at The University of Kansas.
23. “KeyConcept: Exploiting Concept Hierarchies for Search,” Susan gauch,
Davanad Ravindran, Subhash Induri, Juan Madrid and Sriram Chadalavada,
ACM Trans. On Information Systems (in preparation)
68