context classification for service robots - run.unl.pt · context classification for service robots...
TRANSCRIPT

Setembro, 2014
Fábio Miguel Fitas Miranda
Licenciado em Ciências da Engenharia Electrotécnica
e Computadores
Context Classification for Service Robots
Dissertação para obtenção do Grau de Mestre em
Engenharia Electrotécnica e de Computadores
Orientador: João Paulo Pimentão, Professor Auxiliar, Faculdade de
Ciências e Tecnologias
Co-orientador: Pedro Sousa, Professor Auxiliar, Faculdade de Ciências
e Tecnologias
Júri:
Presidente: Prof. Doutor José António Barata de Oliveira - FCT-UNL
Arguentes:
Prof. Doutor Ricardo Luís Rosa Jardim Gonçalves - FCT-UNL
Vogais:
Prof. Doutor João Paulo Branquinho Pimentão - FCT-UNL


iii
Context Classification for Service Robots
Copyright © Fábio Miguel Fitas Miranda, Faculdade de Ciências e Tecnologia,
Universidade Nova de Lisboa.
A Faculdade de Ciências e Tecnologia e a Universidade Nova de Lisboa têm o
direito, perpétuo e sem limites geográficos, de arquivar e publicar esta disserta-
ção através de exemplares impressos reproduzidos em papel ou de forma digi-
tal, ou por qualquer outro meio conhecido ou que venha a ser inventado, e de a
divulgar através de repositórios científicos e de admitir a sua cópia e distribui-
ção com objectivos educacionais ou de investigação, não comerciais, desde que
seja dado crédito ao autor e editor.


v
«Com organização e tempo, acha-se o segredo de fazer tudo e bem feito»
Pitágoras


vii
Acknowledgements
I would like to express my gratitude to my advisors, Professor João Paulo
Pimentão, Professor Pedro Sousa and Eng. Tiago Cabral Ferreira, whose exper-
tise, understanding, patience and geniality, were crucial for the realization of
this master dissertation. In this scope, I must also acknowledge my friends from
Holos, particularly Nuno Zuzarte for his contagious vitality and João Lisboa for
his debates and exchanges of knowledge. They have surely enriched my gradu-
ate experience.
I would also like to acknowledge my family, for providing necessary sta-
bility at home, unquestioning support and financial resources to complete this
master degree. A special thanks to my father, who encouraged me to follow this
path at the first place, whose spirit continues to watch for me and guide me
constantly.
I also want to express my gratitude to all my college mates that stood by
my side for all these years, without them I certainly wouldn‟t make this accom-
plishment, especially to Jorge Claro, a classmate of the last 20 years!
Finally I would like to thank my friends, specially my best friend João, for
their fellowship. They helped me to stay sane through these difficult years.
In conclusion, I recognize that this research could not be possible without
the financial assistance of QREN and Holos, so I express my gratitude to those
agencies for providing the needed hardware resources.


ix
Resumo
Esta dissertação apresenta uma solução para que um AGV consiga per-
cepcionar o ambiente em que se insere, usando para isso técnicas de fusão sen-
sorial e classificação, com o objectivo final de que o robô consiga alterar e adap-
tar os seus comportamentos conforme os diferentes resultados obtidos pelo sis-
tema de inferência para os diferentes contextos/ambientes.
A título de exemplo, se o robô reconhecer que está num campo ao ar livre,
tem em conta que pode haver solos com areia, em que terá de circular mais len-
tamente. Contrariamente, em ambientes interiores é pouco provável que haja
solos com areia num escritório. Esta pequena hipótese denota a importância de
um sistema ciente do seu contexto para AGVs (Automated Guided Vehicles).
Palavras-chave: Context-aware, fiabilidade, classificação de ambientes, in-
teligência artificial, aprendizagem máquina.

x
Abstract
This dissertation presents a solution for environment sensing using sensor
fusion techniques and a context/environment classification of the surroundings
in a service robot, so it could change his behavior according to the different rea-
soning outputs.
As an example, if a robot knows he is outdoors, in a field environment,
there can be a sandy ground, in which it should slow down. Contrariwise in
indoor environments, that situation is statistically unlikely to happen (sandy
ground). This simple assumption denotes the importance of context-aware in
automated guided vehicles.
Keywords: Context-aware, reliability, environment classification, artificial
intelligence, machine learning.

xi
Contents
1. INTRODUCTION ............................................................................................................. 1
1.1 DEFINITION OF CONTEXT .......................................................................................................... 1
1.2 WHAT IS CONTEXT-AWARENESS? ........................................................................................... 2
1.3 ENVIRONMENT DEFINITION .................................................................................................... 3
1.4 DISSERTATION STRUCTURE ..................................................................................................... 3
2. STATE-OF-THE-ART ANALYSIS ................................................................................. 5
2.1. CONTEXT DATA ACQUISITION METHODS ................................................................................ 5
2.2. CONTEXT MODELS ..................................................................................................................... 6
2.3. CONTEXT FRAMEWORKS .......................................................................................................... 8
2.3.1 CASS ......................................................................................................................................... 9
2.3.2 Hydrogen .............................................................................................................................10
2.3.3 CORTEX .................................................................................................................................12
2.3.4 CoBrA .....................................................................................................................................12
2.3.5 Gaia ........................................................................................................................................13
2.3.6 SOCAM ...................................................................................................................................13
2.3.7 COMANTO ............................................................................................................................14
2.3.8 Summary of the Discussed Approaches .................................................................14
2.4 REASONING ON UNCERTAIN ENVIRONMENTS ..................................................................... 14
2.4.1 Machine Learning ............................................................................................................16
2.5 CONTEXT IN ROBOTICS ............................................................................................................ 22
3. IMPLEMENTATION .................................................................................................... 27
3.1 PROBLEM’S APPROACH ........................................................................................................... 27
3.2 TOOLS AND PLATFORMS ......................................................................................................... 28
3.2.1 Hardware.............................................................................................................................28
3.2.2 Software ...............................................................................................................................34

xii
3.3 ARCHITECTURE OVERVIEW ................................................................................................... 37
3.4 ARCHITECTURE IMPLEMENTATION ...................................................................................... 38
3.4.1 Managing Input Sources .............................................................................................. 38
3.4.2 Fuzzy Logic Membership Functions ....................................................................... 41
3.4.3 Choosing the Classification Model........................................................................... 46
3.4.4 Software hierarchy ......................................................................................................... 51
3.5 FIELD TESTS AND EXPERIMENT RESULTS ............................................................................ 53
4. CONCLUSIONS AND FUTURE WORK ..................................................................... 65
4.1 CONCLUSIONS........................................................................................................................... 65
4.2 FUTURE WORK ........................................................................................................................ 66
SCIENTIFIC CONTRIBUTIONS .............................................................................................. 69
REFERENCES ............................................................................................................................. 71
xiii
Acronyms List
AI - Artificial Intelligence
ANN - Artificial Neural Network
API - Application Programming Interface
ARFF - Attribute-Relation File Format
BPA - Basic Probability Assignment
CAIROW - Context-aware Assisted Interactive Robotic Walker
CAMUS - Context aware middleware for URC systems
CASS - Context-Awareness Sub-Structure
CLI - Command Line Interface
CML - Context Model Language
CoBrA - Context Broker Architecture
COMANTO - Context Management Ontology
CV - Cross Validation
DB - Database
dB SPL - Decibel Sound Pressure Level
DL - Description Logics
DT - Decision Trees

xiv
FCL - Fuzzy Control Language
FLC - Fuzzy Logic Controllers
FN - False Negatives
FP - False Positives
FPR - False Positives Rate
FRBs - Fuzzy Rule Based Systems
GPS - Global Positioning System
GUI - Graphical User Interface
HMM - Hidden Markov Model
I2C - Inter-Integrated Circuit
IDE - Integrated Development Environment
IMU - Inertial Measurement Unit
LADAR - Laser Detection and Ranging
LPG - Liquefied Petrolium Gas
ML - Machine Learning
MRF - Markov Random Field
NN - Nearest Neighbor
ORM - Object-role Modeling
OS - Operating system
OWL - Web Ontology Language
PID - Proportional-Integral-Derivative
PWM - Pulse Width Modulation
PWS - Personal Weather Station
QREN - Strategic Reference National Framework
RH - Relative Humidity
ROC - Receiver Operating Characteristic

xv
ROS - Robot Operating System
SI I & DT - System of Incentives for Research and Technological
Development
SOCAM - Service-oriented Context-Aware Middleware
SVM - Support Vector Machines
TN - Total Negatives
TNR - True Negative Rate
TP - True Positives
TPR - True Positives Rate
UART - Universal Asynchronous Receiver/Transmitter
UDM - Universal Data Model
UML - Unified Modeling Language
URC - Ubiquous Robotic Companion
URL - Uniform Resource Locator
USB - Universal Serial Bus
WEKA - Waikato Environment for Knowledge Analysis
XML - eXtensible Markup Language

xvi
List of Figures
FIGURE 2.1 - LAYERED ARCHITECTURE ....................................................................................................................................... 8
FIGURE 2.2 - SCHEME OF THE CASS ARCHITECTURE [9] ...................................................................................................... 10
FIGURE 2.3 - CASS CONTEXT ARCHITECTURE IN A UML CLASS DIAGRAM[15] ............................................................... 10
FIGURE 2.4 - HYDROGEN ARCHITECTURE [9] ......................................................................................................................... 11
FIGURE 2.5 - HYDROGEN CONTEXT ARCHITECTURE IN A UML CLASS DIAGRAM [16] ..................................................... 12
FIGURE 2.6 – GAIA ARCHITECTURE ........................................................................................................................................... 13
FIGURE 2.7 - THE GROWTH OF SUPERVISED MACHINE LEARNING METHODS IN PUBMED (BIOMEDICAL
LITERATURE)[41] ............................................................................................................................................................. 17
FIGURE 2.8 - STEPS IN SUPERVISED LEARNING [45]. ............................................................................................................ 18
FIGURE 2.9 - BAYESIAN NETWORK GRAPH USING WEKA ....................................................................................................... 20
FIGURE 2.10 - NAIVE BAYES GRAPH USING WEKA .................................................................................................................. 20
FIGURE 2.11 - LINEAR SEPARATING HYPERPLANES [49] ...................................................................................................... 21
FIGURE 2.12 - BASIC FEEDFORWARD NEURAL NETWORK[53] ............................................................................................ 22
FIGURE 3.1 - CONTEXT CLASSIFICATION HIERARCHY ............................................................................................................. 27
FIGURE 3.2 - SERVROBOT ........................................................................................................................................................... 29
FIGURE 3.3 - ARDUINO MEGA 2560 ......................................................................................................................................... 30
FIGURE 3.4 - ARDUINO + WEATHER SHIELD ........................................................................................................................... 30
FIGURE 3.5 - OUTPUT VOLTAGE VS ILUMINANCE [78] ......................................................................................................... 31
FIGURE 3.6 - OPERATING RANGE OF THE HTU21D [79] ..................................................................................................... 31
FIGURE 3.7 - GP-635T ............................................................................................................................................................... 32
FIGURE 3.8 - MQ-2 GAS SENSOR ............................................................................................................................................... 33
FIGURE 3.9 - SENSITIVITY CHARACTERISTICS OF THE MQ-2 [82] ...................................................................................... 33
FIGURE 3.10 - WEKA GUI - CLASSIFIERS, TEST OPTIONS AND OUTPUTS .......................................................................... 36
FIGURE 3.11 - WEKA ATTRIBUTE EVALUATOR ...................................................................................................................... 36
FIGURE 3.12 - RELIABILITY CONTEXT INTEGRATION ARCHITECTURE ................................................................................. 37
FIGURE 3.13 - LIGHT VARIATION IN OUTDOOR AND INDOOR ENVIRONMENTS IN ONE DAY [87]. ................................... 39

xvii
FIGURE 3.14 - MAIN STEPS IN ACQUIRING SENSOR DATA FROM THE AGV - SERVROBOT ............................................... 41
FIGURE 3.15 - FUZZIFIED TEMPERATURE FUNCTION ............................................................................................................. 42
FIGURE 3.16 - FUZZIFIED HUMIDITY FUNCTION ...................................................................................................................... 43
FIGURE 3.17 - FUZZIFIED SOUND FUNCTION ............................................................................................................................ 43
FIGURE 3.18 - FUZZIFIED LIGHT FUNCTION ............................................................................................................................. 45
FIGURE 3.19 - EXAMPLE OF THE FUZZIFY FUNCTIONS IN FCL FILES ................................................................................ 45
FIGURE 3.20 - DATASET SAMPLE USING WEKA ARFF VISUALIZER ........................................................................................ 47
FIGURE 3.21 – MEASURED TEMPERATURE AND HUMIDITY INDOOR FOR 24HOURS ......................................................... 48
FIGURE 3.22 – ALL MEASURED TEMPERATURES FROM INDOOR AND OUTDOOR ................................................................ 49
FIGURE 3.23 – ALL MEASURED AND ANNOUNCED HUMIDITIES ............................................................................................ 50
FIGURE 3.24 - OVERALL SOFTWARE PROJECT HIERARCHY ................................................................................................... 51
FIGURE 3.25 - ROSGRAPH REPRESENTING NODES AND TOPICS ........................................................................................... 52
FIGURE 3.26 - GUI FORM DESIGN .............................................................................................................................................. 53
FIGURE 3.27 – HOLOS INDOOR TESTING PATH ........................................................................................................................ 54
FIGURE 3.28 – HOLOS OUTDOOR TESTING PATH..................................................................................................................... 55
FIGURE 3.29 - ROC CURVE FOR CLASS INDOOR ................................................................................................................... 58
FIGURE 3.30 – BAYES NETWORK .............................................................................................................................................. 59
FIGURE 3.31 – HOLOS MIXED TESTING PATH ........................................................................................................................... 60
FIGURE 3.32 – SERVROBOT PERFORMING A CLASSIFICATION NEAR A TRANSITION ZONE ............................................... 62
FIGURE 3.33 – BAYES NETWORK WITH “PREVIOUS STATE" .................................................................................................. 63


xix
List of Tables
TABLE 2.1- OVERVIEW OF THE FEATURES OF THE EXISTING CONTEXT FRAMEWORKS, ADAPTED FROM [4,27]. ........ 14
TABLE 2.2 - OVERVIEW OF CONTEXT MODELS IN ROBOTIC SYSTEMS THEIR APPLICATION PURPOSE ............................. 25
TABLE 3.1 - FORMALISM OUTPUTS FROM THE MULTIPLE PHYSICAL SENSORS ................................................................... 40
TABLE 3.2 - SOUND SOURCES AND THEIR CORRESPONDING LEVELS[90] ........................................................................... 44
TABLE 3.3 - CLASSIFICATION STATISTICS (CV) ....................................................................................................................... 56
TABLE 3.4 – CONFUSION MATRIX (CV) ................................................................................................................................... 56
TABLE 3.5- CONFUSION MATRIX LABELS .................................................................................................................................. 56
TABLE 3.6- DETAILED PERFORMANCE MEASURES (CV) ........................................................................................................ 56
TABLE 3.7- PROBABILITY DISTRIBUTION TABLE FOR NODE GPS_SAT ............................................................................... 59
TABLE 3.8 – CONFUSION MATRIX FROM THE MIXED TESTING PATH ................................................................................... 61
TABLE 3.9 – DETAILED PERFORMANCE MEASURES ................................................................................................................ 62

1
1. Introduction
Aside from our language and the common understanding of the world
and its operation, what contributes to a much more efficient exchange of
knowledge between human beings, is the notion of context [1]. Humans are
able to add and take into account situational information (context) in a conver-
sation to better understand the subject, retain more information in a more effi-
cient way and to respond appropriately to it, in other words, to increase con-
versational bandwidth as said in [1]. When humans interact with machines or
machines interact with each other, that awareness can be lost and so can the in-
formation richness [2].
1.1 Definition of context
Generally speaking and according to [1]:
“Context is any information that can be used to characterize
the situation of an entity. An entity is a person, a place or an
object that is considered relevant to the interaction between a
user and an application, including the user and the applica-
tion themselves.”
We can also refer to context as a user‟s emotional state, focus of attention,
objects, people around the user‟s environment and also location, orientation,
date and time [3].
2
Context can be low-level (like time and location, tightly coupled with direct da-
ta from the context source) or high level (in a more abstract level but still using
low-level data provided by the source). This context source is related to any de-
vice that can provide context information, typically smartphones, sensors, com-
puters, etc. [4].
1.2 What is context-awareness?
The term „Context-aware‟ was first introduced by Schilit and Theimer [5]
and they proposed “context” as software that “adapts according to its location
of use, the collection of nearby people and objects, as well as changes to those
objects over time”. Context-aware applications need to sense and interpret the
environment around, in order to be adaptive, reactive, responsive, situated,
context-sensitive and environment-directed. The main questions that context-
aware applications must take into account are: who, where, when and what the
user is doing, to understand and classify his situation [1]. There are applications
that just inform an entity about its context and others that dynamically change
and adapt their behavior according to its environment. They are both consid-
ered to be context-aware.
In general, context-aware applications monitor a variety of environment
input sources and reason what is the entity situation, based on previous rules
and guidelines that the developer has established. This can be done using sev-
eral different methods, according to what‟s best suited. The major existing in-
ference methods will later be presented and compared.
Adding context access to machines (computers, robots, etc.) can produce a
more interesting and efficient way to exchange information [2], to build smarter
environments, also to adapt and tailor the relevant data for each situation.
Without knowing its context, applications are “blind” and require more atten-
tion. An old phone can be an example of a “blind” application because it can
ring at any moment without sensing the environment (if it‟s appropriate or
not). One way to solve this can be by sensing where the user is (if it‟s driving,
etc.) or what is the average noise level in the room to change its volume accord-
ingly.
3
Concepts like context and context-aware are connected with pervasive
computing (also called ubiquitous computing) techniques. According to [6], a
pervasive computing environment, is one full of computing and communica-
tion capabilities, but so gracefully integrated with humans, in a way that we
don‟t even perceive it [7], so in [6] they said “the most profound technology is
the one that disappears”. Pervasive computing is seen as an evolution of dis-
tributed systems together with mobile computing, providing, among other fea-
tures, a more dynamic, adaptive and effective use of smart spaces (environment
sensing and reaction).
1.3 Environment Definition
According to the Oxford dictionary [8], environment consists essentially in
the surroundings or conditions in which an entity operates (here it‟s assumed
that this entity isn‟t necessarily a living being). It can also refer to the set of con-
ditions that a particular activity is carried on. In computing, it can refer to the
structure where a program operates (like a “development environment”).
It sums up to anything that is external to an entity. Regarding this docu-
ment, referring to environment stands for the external environment conditions
and surroundings of the robot that affect and influence its operation.
1.4 Dissertation Structure
This dissertation is divided into four chapters.
Chapter 1, introduction, explains the main concepts and definitions relat-
ed with the main subject of this dissertation, enlightening the reader.
Chapter 2, state-of-the-art, reviews the tools and existing background
work in order to make this dissertation possible, enumerating and describing
the different methods that are relevant.
Chapter 3, implementation, relates to the explanation about the architec-
ture of this work, regarding its execution.
Finally, on chapter 4, regards conclusions and future research to be done
on this subject.

4

5
2. State-of-the-art Analysis
In this chapter it will be described how the data is acquired from the con-
text-sources, what are the main techniques used in the context classification sys-
tem, what are the main existing frameworks and architectures for building con-
text applications, how to deal with uncertainty when reasoning higher level in-
formation and finally an overview on how these techniques and concepts are
used in robotic systems.
2.1. Context data acquisition methods
There are different architecture approaches to acquire context information
according to [4,9,10]. The chosen method depends on the required application
and it‟s relevant for the design of the whole system‟s architecture. Sentient ob-
jects (defined below) and centralized or distributed middleware were added on
this dissertation to better classify the different models (described in the next
chapter) regarding data acquisition, although the authors in [4] presented a
good data acquisition tabulation, it seems to be lacking some focus. Thus the
following enumeration tries to bridge that gap, inserting sentient objects and
subtypes of middleware:

6
Direct sensor access – drivers from the sensor feed data directly into the
application. It doesn‟t have processing capability or support for multiple
concurrent sensing.
Sentient objects - may be smart sensors with actuators, which interact
with the environment and can interact with each other. They can make
use of a simple rule engine and perform simple actions like, for example:
a light sensor that is connected to a headlight and turns on the headlight
when it‟s dark [11].
Middleware infrastructure – implemented with a layered architecture
that hides low level data and allows separation between several struc-
ture interfaces. Middleware infrastructures can be distributed or central-
ized:
o Distributed middleware – Inference results can be shared in a dis-
tributed system for various applications.
o Centralized middleware – Where context sources, inference sys-
tem and applications are running only locally and in the same sys-
tem.
2.2. Context Models
There are several approaches to develop the rules which will compose the
context classification system. These rules/deductions/methods establish the
relations between the sensed data and the overall context situation.
Some early approaches refer key-value and markup models for context
applications. Key-value models use simple key-value pairs and define a list of
attributes and their values [12], for example a “color” can be a key and “red” a
value. Markup models use markup languages like XML, tagging data in a hier-
archical way. There are some hybrid models than can be both markup and key-
value since they can store key-value pairs under appropriate tags [12]. These
models have known limitations about reasoning support, timelines and more
complex relations and dependencies [13].
There are also graphical models that use visual implementation such as
UML (Unified Modeling Language) like in [14]. In extension of graphical mod-

7
els there is object-based modeling (like Object-Role Modeling, ORM) techniques
that supports better processing and reasoning to satisfy the more demanding
requirements; CML (Context Model Language) is an example. CML and ORM
emerged from conceptual modeling databases [12]. In [12] it‟s stated that CML
adds some features in ORM like obtaining information from the different con-
text sources and classes (static, sensed, derived, etc.) and distinguish its differ-
ent backgrounds, also capturing history of its fact types, constraints and rela-
tions/dependencies.
There are logic-based models in which context is defined based on a set of
rules, facts and statements. Logic defines the conditions needed to reach a fact
or expression derived from the facts and rules [15].
Finally there are the ontology-based models. Context involves knowledge
and between knowledge representation languages, DL (description logic) has
emerged with a good tradeoff between expressiveness and complexity [12].
They give us a description about the world in terms of concepts (classes), roles
(relationships and properties) and individuals (instances) [16].
In [15] the authors claim that ontology based models are the more expres-
sive and fulfill most of their requirements. Since ontologies consist in descrip-
tions of concepts and their relationships, they are a powerful instrument for
modeling contextual information [4]. A formalism called OWL-DL (web ontol-
ogy language) is frequently used to represent context information distinguished
by categories of objects and objects interrelation [17].
In [18] the authors present some of the guideline requirements for ontolo-
gy models: the relations must be simple (simplicity) to ease the debug process,
they should support adding new relations and elements (flexibility and exten-
sibility), they should not be focused on only one type of context but to support
several (generality) and finally they should be expressive and meaningful in
describing the context details.
Ontologies have a key role and are widely used in many applications
nowadays, such as databases, semantic-web, etc.
There are also hybrid models that combine different formalisms and tech-
niques. In [12] the authors believe this is a promising direction since different

8
models and reasoning tools need to be integrated with each other towards a
better tradeoff between expressiveness, complexity and support for uncertainty.
In that same article, authors also present two existing hybrid approaches. One
that combines a fact-based approach with ontological models [19] and other
that combines markup-model with ontological model [20].
2.3. Context Frameworks
When choosing the design of a context model it should be analyzed what
features are best suited to the required application, regarding the architecture,
inference system and how the data is processed and sensed. Similarly in [4] the
authors evaluate and classify some existing context frameworks and architec-
tures according to their main features and aspects.
According to [4] the most common architectures use layers (similarly to
Figure 2.1), are hierarchical and have one or many centralized components.
There are advantages and disadvantages in using centralized components. One
advantage is that it lightens processor and memory usage which is crucial in
mobile devices. The obvious disadvantage is that it generates one single point
of failure (reduce reliability). Bellow there‟s a typical context-aware applica-
tion‟s layered framework, presented in [4].
Figure 2.1 - Layered Architecture
The bottom layer “Sensors” refers to every data source that can provide
information useful to context classification. They can be physical (hardware
sensors that capture physical data), logical (combine information from physical
and virtual sensors) or virtual (information from software applications or ser-

9
vices). The next layer is “Raw data retrieval” which consists in the drivers and
simple functions to facilitate the access to the low-level data from the sources.
Next there is a “Preprocessing” layer which processes the raw data from the
previous layers, making information more abstract and useful to the application
goals. It‟s where the reasoning and inference methods are implemented. There-
fore, in this layer, the information provided from the various sources is com-
bined to find a more accurate classification, because, most of the times, one sen-
sor value is not enough to reach a conclusion about the entity situation. The
fourth layer “Storage/Management” is where the data is gathered and orga-
nized to be accessed by the application layer (the clients). This access from the
clients can be made by an asynchronous or synchronous method (publish-
subscribe and client-server respectively)[4]. Finally, the “Application” layer is
where the client lies. It‟s also in this layer that a possible reaction to the context
is implemented. It can also exist some minor logic and reasoning required for
the application specifications.
The most relevant examples of context frameworks are presented in the
next section of this dissertation.
2.3.1 CASS
In the Context-Awareness Sub-Structure (CASS) architecture, the middle-
ware contains an interpreter, a context retriever, a rule engine and a sensor lis-
tener. The sensor listener senses for data updates from sensor nodes and stores
that information in the database. The context retriever retrieves the stored data
from the database. That data passes through a rule engine, where it verifies
some required conditions and can also use the interpreter to consider what con-
text type is checked. Out of the middleware there is a client with communica-
tion capabilities to access its data. It can be seen in the scheme below, at the left
side. The client has a change listener where he listens for changes in context
events. Note that the sensor node can also have communication capabilities as it
can also be a mobile device that senses the environment.

10
Figure 2.2 - Scheme of the CASS architecture [9]
The rule engine is the central part of the design diagram.[15]
Figure 2.3 - CASS Context Architecture in a UML class diagram[15]
2.3.2 Hydrogen
The Hydrogen project consists in another layered architecture focused on
mobile devices. In this system instead of a centralized component, they have a

11
distributed system. Hydrogen is capable of exchanging and sharing context in-
formation with a remote client [4]. As it can be seen from Figure 2.4 there are
three layers: Application, Management and Adaptor layer. The adaptor layer is
directly connected to the sensors, obtaining raw data by querying them. The
management layer is where the context-server is located, which stores the data
from the sensors and provide contexts to the application layer. At last, the ap-
plication layer is where the actions will be implemented according to context
changes [4]. There is a context-client in application layer that does the commu-
nication with the context-server, it can query a context, open ports and sub-
scribe to receive updates for a specific context [21].
It is important to note that all communication between layers is based on
the XML protocol, which makes it more multi-platform [4], in the sense that
other platforms can be used, as long as they supply XML-formatted messages
according to the specifications.
Figure 2.4 - Hydrogen Architecture [9]
Hydrogen uses Object-oriented data structures, below, some of the dif-
ferent classes used to classify context types, are presented

12
Figure 2.5 - Hydrogen Context Architecture in a UML class diagram [16]
In the Hydrogen system, applications can also be able to consider the context of
remote devices that are communicating with them. This explains why there is a
“LocalContext” and a “RemoteContext” in Figure 2.5.
The “LocalContext” contains several “ContextObjects”, which own infor-
mation provided by attached sensors. In the standard version of the framework
it has information about time, location, device (identifier and device type), user
and network but new specialized context objects can be added, creating more
context types [21].
2.3.3 CORTEX
The CORTEX project is more oriented to research, cooperation and inter-
action between sentient objects and its environment[11,22] and is still in an ear-
ly stage of development.
2.3.4 CoBrA
CoBrA systems were designed to support context-aware applications in
intelligent spaces (rooms with intelligent systems)[4]. CoBrA has a centralized
context broker that manages and shares information between agents in a par-
ticular environment. In large smart spaces multiple brokers can be grouped and
exchange knowledge, this is the reason why, in Table 2.1, it was classified as a
distributed middleware [10].

13
2.3.5 Gaia
The Gaia project consists in a layered architecture with operating system
concepts. Gaia systems are more focused on the interaction between users and
smart/intelligent spaces like homes, rooms, etc. For the Gaia systems, each
space is self-contained, although interaction may occur between spaces [23,24].
Figure 2.6 – Gaia architecture
The Gaia kernel consists in a component management core (which manip-
ulates all components and applications) and a set of services [24]. Regarding the
Gaia services, they are space repository, event manager, context file system,
presence and context, all presented in Figure 2.6. The event manager is respon-
sible for letting applications learn about system changes, the context service
provides information about context to the applications so that they can adapt to
their environment, the context file system stores files with context information,
in a hierarchical way, the presence service deals with aspects of the active space
resources like presence of an entity (whether physical or digital), finally the
space repository stores information about all hardware and software in the ac-
tive space and its properties [24]. On the top layers there are the application
framework and active space applications. The application framework main ob-
jective is to provide the tools to build or adapt active space applications and
these active space applications that interact to the users using multiple inputs,
outputs and processing devices[24]. The Gaia system implements ontologies to
describe context predicates [23,25].
2.3.6 SOCAM
SOCAM is a service oriented context aware middleware architecture for
mobile services [26]. In the SOCAM architecture, although it is a general ontol-
14
ogy-based model, it is difficult to relate data with different granularity and con-
strain important data to specific contexts[27].
2.3.7 COMANTO
COMANTO (COntext MAnagement oNTOlogy) is more of a semantic vo-
cabulary based on ontologies that can describe generic context types[28]. Ac-
cording to [27] COMANTO lacks the possibility to discard useless contexts, alt-
hough it is a very expressive formal model.
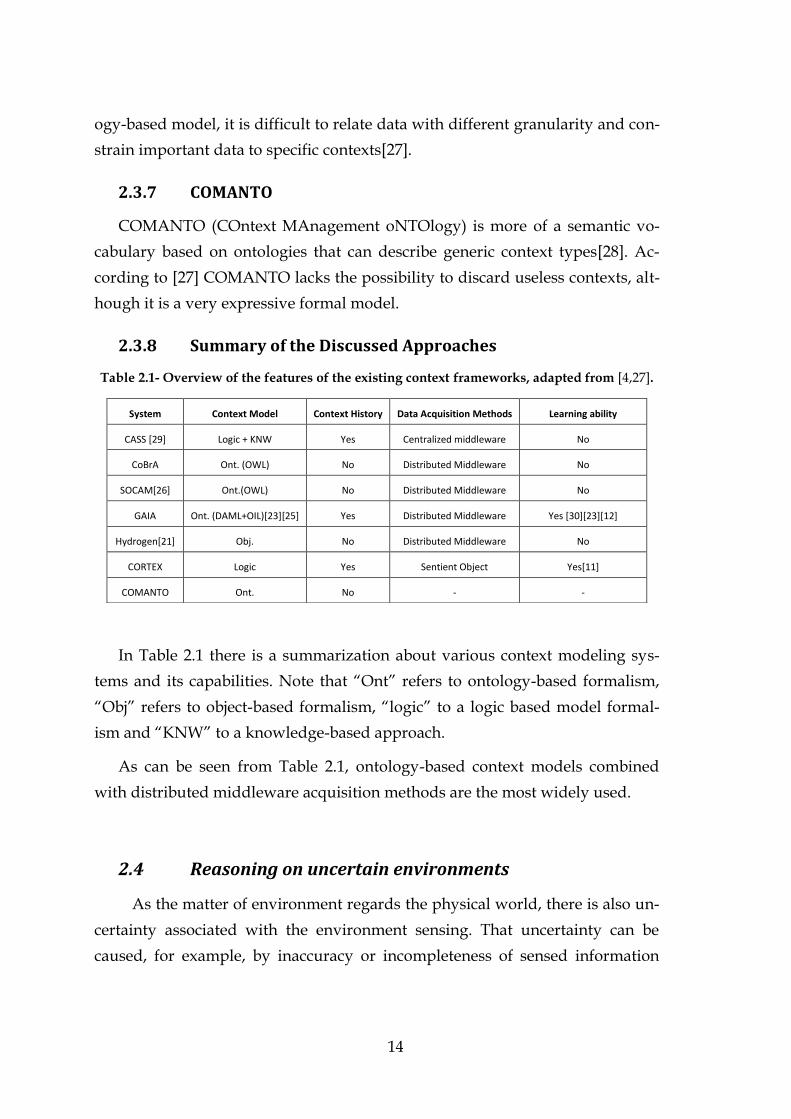
2.3.8 Summary of the Discussed Approaches
Table 2.1- Overview of the features of the existing context frameworks, adapted from [4,27].
In Table 2.1 there is a summarization about various context modeling sys-
tems and its capabilities. Note that “Ont” refers to ontology-based formalism,
“Obj” refers to object-based formalism, “logic” to a logic based model formal-
ism and “KNW” to a knowledge-based approach.
As can be seen from Table 2.1, ontology-based context models combined
with distributed middleware acquisition methods are the most widely used.
2.4 Reasoning on uncertain environments
As the matter of environment regards the physical world, there is also un-
certainty associated with the environment sensing. That uncertainty can be
caused, for example, by inaccuracy or incompleteness of sensed information
System Context Model Context History Data Acquisition Methods Learning ability
CASS [29] Logic + KNW Yes Centralized middleware No
CoBrA Ont. (OWL) No Distributed Middleware No
SOCAM[26] Ont.(OWL) No Distributed Middleware No
GAIA Ont. (DAML+OIL)[23][25] Yes Distributed Middleware Yes [30][23][12]
Hydrogen[21] Obj. No Distributed Middleware No
CORTEX Logic Yes Sentient Object Yes[11]
COMANTO Ont. No - -
15
[31]. There is a need for models that manage and take into account that uncer-
tainty [12].
Fuzzy logic is used to set transitions of an element between membership
and non-membership in a certain group and involves ambiguity [32]. This tran-
sition can be gradual and its boundaries are vague and must be established.
They can be used to describe subjective contexts and perform a multi-sensor
fusion between those contexts. They generally reflect the impression of human
reasoning [33]. As an example: when the temperature is considered to be
“cold”, “hot” or “pleasant” instead of being represented by a numeric value. In
[31] the authors present a Fuzzy Situation Inference technique to deal with un-
certain situations.
Dempster-Shafer theory combines evidences from different sources and
reach a certain level of belief. It‟s suitable to deal with evidence combination
and data fusion [34]. To assign a belief to a hypothesis given the evidences (at-
tributes like symptoms of a disease), Dempster-Shafer theory gives that belief a
number in the interval [0, 1] and the importance of each evidence is represented
by the function of basic probability assignment (bpa). In [35] the authors make
use of the Dempster-Shafer technique as key contribution to fusion data from
multiple sensors with weight attributions.
Knowledge-based learning is a technique that takes into account prior
knowledge of the world, in most cases represented as general first-order logical
statements [36]. They make use of the full power of logical inference, regarding
previous hypothesis and logical statements to construct new ones. According to
[36], knowledge-based learning is suitable for a hierarchical representation of
states.
Hidden Markov Model is used to model situations where the signal
source is unknown (where the states are not observed, but associated with ob-
servable evidences [12]). This model can be used to know about the source na-
ture and/or to make future assumptions regarding the sequence of observa-
tions [37]. According to [36] this technique is more suitable to use with an atom-
ic representation of states, in which each state is indivisible and has no internal
structure (simple A to B relation).

16
Since it is dealt with automated reasoning (a sub-field of Artificial intelli-
gence) and uncertainty, at this step, a bridge will be made to a less seman-
tic/deductive/logic and more numerical/probabilistic concept called machine
learning.
2.4.1 Machine Learning
Below is given a brief overview over some major concepts and a descrip-
tion on the most significant machine learning techniques. Note that topics like
artificial intelligence, machine learning, data mining and statistics are often con-
flated and overlapped concepts. Below, a brief clarification of those terms is
presented.
Artificial intelligence can be seen as “the science and engineering of mak-
ing intelligent machines”[38], said Dr. John McCarthy, one of its founders. To
make these machines doesn‟t always have to involve learning or induction. So it
can be said that machine learning is a large field within artificial intelligence
and implies algorithms that extract information automatically from data, build-
ing knowledge (most of them using the support of statistics and probabilistic
models).
The area of data mining takes inspiration partly from machine learning
(and therefore, statistics) but for the purpose of pattern recognition in, quite of-
ten, large datasets. So it is an interdisciplinary field that involves and intercepts
machine leaning, statistics and artificial intelligence methods. Data mining is
often named of unsupervised machine learning or clustering, this will be stated
further on.
Finally, statistics can be seen as an “old discipline” based on classical
mathematical models (for instance, Bayesian probability).
Machine learning algorithms are used in a wide variety of fields (finances,
computer science, biology, etc.). They use computational methods to learn in-
formation from datasets (most commonly spreadsheets or database tables),
those datasets serve as examples to learn from and give to the algorithm the
ability to generalize and perform future tasks.
In the last decade machine learning has been a strongly addressed subject
and its use has been growing in many fields [39], particularly in the computer

17
science. This phenomenon can be explained by the increase volume of data
available everyday on the web and many other sources and powerful comput-
ers, able to process vast amounts of information. This generates another prob-
lem since only a small amount of data features are crucial for classification and
it is difficult to distinguish the other irrelevant information, compromising the
systems performance [40]. It‟s shown below the growth in popularity of some
well-known supervised machine learning methods (although it is in biomedical
literature, other fields follow this growth tendency, particularly computer sci-
ence).
Figure 2.7 - The growth of supervised machine learning methods in PubMed (biomedical
literature)[41]
A separation in three main categories can be made regarding the applica-
tion purpose of machine learning techniques: Classification, Regression and
Clustering [42].
Classification: uses algorithms like Support Vector Machines
(SVM), Decision Trees, K-Nearest Neighbor, Naïve Bayes, Bayes
Network and Neural Network to assign a class to instances of data
described by a set of attributes [43].

18
Regression: uses algorithms like Linear/Non-Linear Model, Step-
wise Regression and also Decision Trees and Neural Networks to
predict continuous data.
Clustering: uses algorithms like K-Means, Hierarchical Clustering
and Hidden Markov Models to find patterns and group the data
regarding its patterns.
Machine learning algorithms can also be sub-classified in supervised learn-
ing and unsupervised learning (there are other taxonomies, but those two are
essential).
In supervised learning the rules/steps for the classification are generat-
ed automatically from a sample set of examples (training dataset) that al-
ready has the correct class assigned to each data point [43,44] (pre-
classified). The model must generate decent results in presence of new
data. The user must have pre-classified datasets, so classification and re-
gression fields are included in supervised learning.
Figure 2.8 - Steps in Supervised Learning [45].
In unsupervised learning the algorithm must detect patterns in data and
group/cluster the data according to its content. There is no need to input
pre-classified data, so clustering field is included in unsupervised learn-
ing.
Note that the same algorithm can be applied in more than one category of
application, due to its flexibility.
Machine Learning Techniques
As the purpose of this dissertation relies of classification, only classifica-
tion algorithms will be described.

19
Nearest neighbor (NN) is the simplest data association technique and is a
well-known clustering algorithm that selects and groups the most similar val-
ues.
How close the one measurement is to another depends on the employed
distance metric and typically depends on the threshold that is established by
the designer (k-nearest neighbor). The value of “k” specifies how many nearest
neighbors are to be considered when defining the class of an instance. In gen-
eral, the employed criteria could be based on an absolute distance, the Euclide-
an distance, or a statistical function of the distance.
Although this is a very simple technique (its main advantage), it is more
oriented to pattern recognition (clustering), which often requires huge datasets.
Its main disadvantages are the memory limitation, the slow running speed and
the fact that it is easily fooled by irrelevant attributes [46]. Many different tech-
niques have been developed to minimize these disadvantages and are stated by
the authors of [46].
Bayesian networks consist in nodes (variables representing events) and
arcs (representing relationships – conditional dependencies) forming a tree.
Nodes that are not connected represent variables that are conditionally inde-
pendent. Bayesian networks are widely used to process data sets and to deduce
high level information [12], assigning the most likely class to a given observa-
tion, described by a set of attributes [43]. As an example they could relate symp-
toms with diseases and give the most probable disease given the symptoms.
Bayesian networks can be considered a mechanism for automatically applying
Bayes rule complex decisions, that rule is mathematically stated above, which
gives the relationship between the probabilities of A ( ( )) and B ( ( )) and
conditional probabilities of A given B ( ( | )) and A given B ( ( | )).
( | ) ( | ) ( )
( )[47]
According to [36] this technique e best suitable for a factored state repre-
sentation in which a state consists of a vector of attributes.
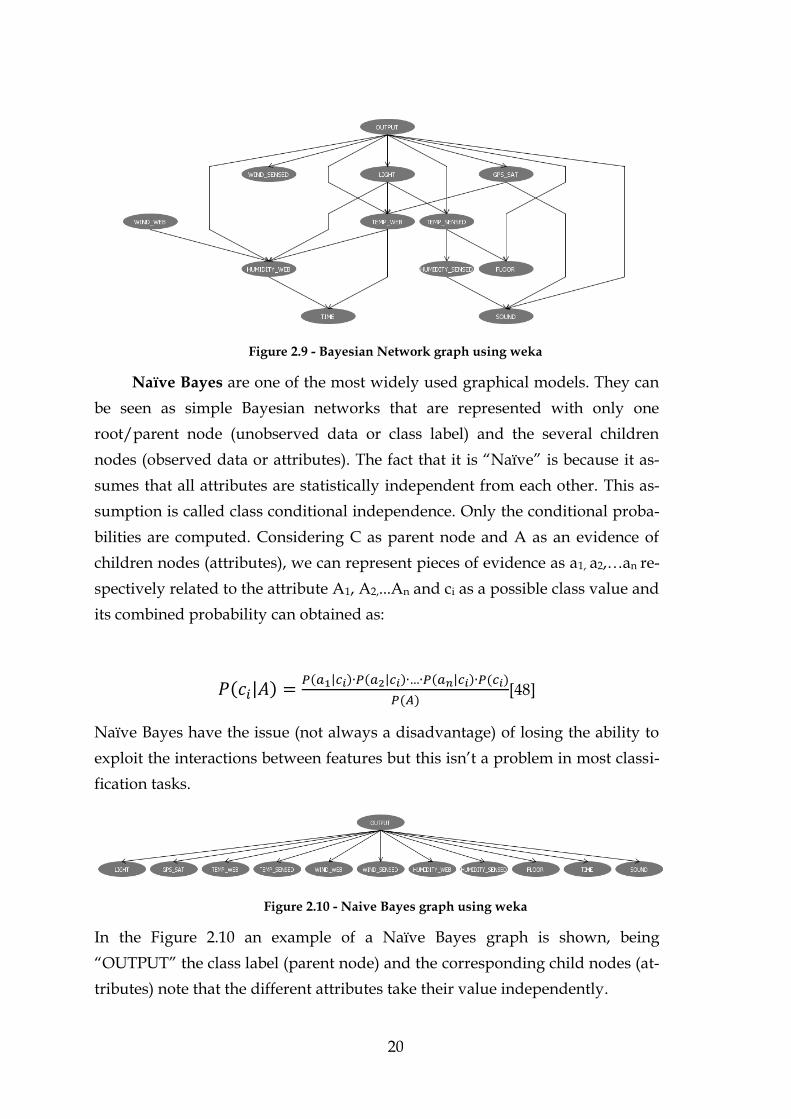
20
Figure 2.9 - Bayesian Network graph using weka
Naïve Bayes are one of the most widely used graphical models. They can
be seen as simple Bayesian networks that are represented with only one
root/parent node (unobserved data or class label) and the several children
nodes (observed data or attributes). The fact that it is “Naïve” is because it as-
sumes that all attributes are statistically independent from each other. This as-
sumption is called class conditional independence. Only the conditional proba-
bilities are computed. Considering C as parent node and A as an evidence of
children nodes (attributes), we can represent pieces of evidence as a1, a2,…an re-
spectively related to the attribute A1, A2,...An and ci as a possible class value and
its combined probability can obtained as:
( | ) ( | ) ( | ) ( | ) ( )
( )[48]
Naïve Bayes have the issue (not always a disadvantage) of losing the ability to
exploit the interactions between features but this isn‟t a problem in most classi-
fication tasks.
Figure 2.10 - Naive Bayes graph using weka
In the Figure 2.10 an example of a Naïve Bayes graph is shown, being
“OUTPUT” the class label (parent node) and the corresponding child nodes (at-
tributes) note that the different attributes take their value independently.
21
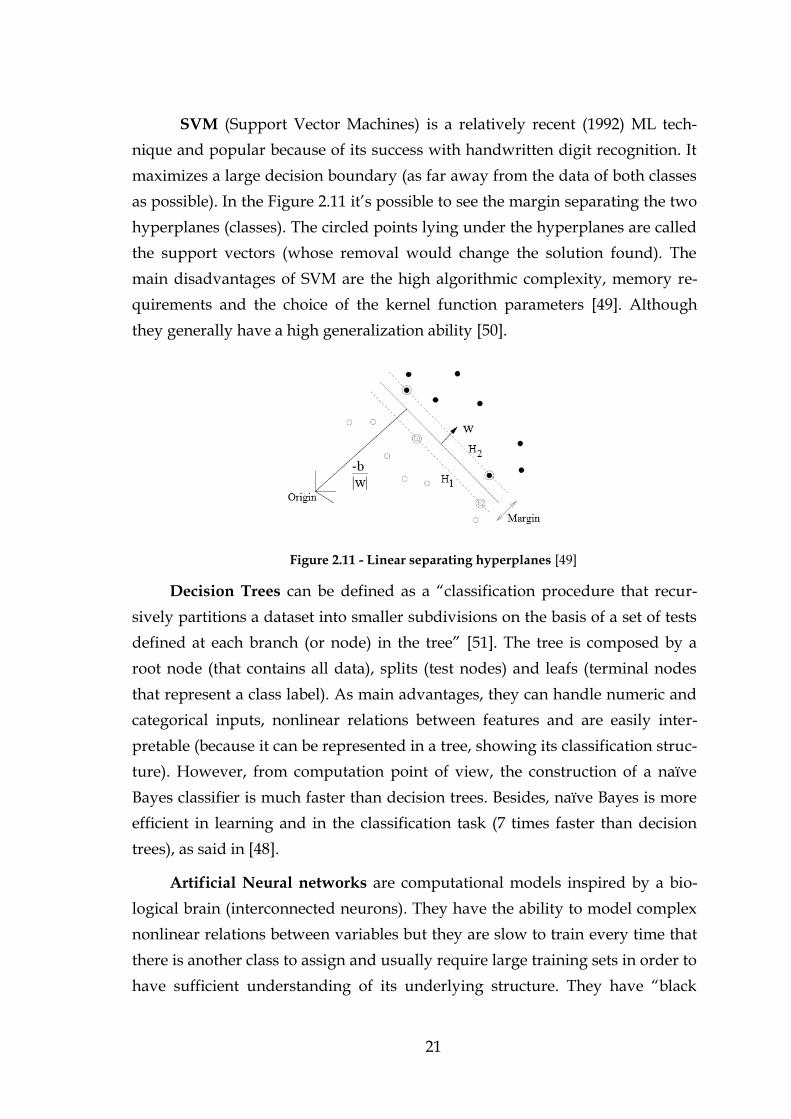
SVM (Support Vector Machines) is a relatively recent (1992) ML tech-
nique and popular because of its success with handwritten digit recognition. It
maximizes a large decision boundary (as far away from the data of both classes
as possible). In the Figure 2.11 it‟s possible to see the margin separating the two
hyperplanes (classes). The circled points lying under the hyperplanes are called
the support vectors (whose removal would change the solution found). The
main disadvantages of SVM are the high algorithmic complexity, memory re-
quirements and the choice of the kernel function parameters [49]. Although
they generally have a high generalization ability [50].
Figure 2.11 - Linear separating hyperplanes [49]
Decision Trees can be defined as a “classification procedure that recur-
sively partitions a dataset into smaller subdivisions on the basis of a set of tests
defined at each branch (or node) in the tree” [51]. The tree is composed by a
root node (that contains all data), splits (test nodes) and leafs (terminal nodes
that represent a class label). As main advantages, they can handle numeric and
categorical inputs, nonlinear relations between features and are easily inter-
pretable (because it can be represented in a tree, showing its classification struc-
ture). However, from computation point of view, the construction of a naïve
Bayes classifier is much faster than decision trees. Besides, naïve Bayes is more
efficient in learning and in the classification task (7 times faster than decision
trees), as said in [48].
Artificial Neural networks are computational models inspired by a bio-
logical brain (interconnected neurons). They have the ability to model complex
nonlinear relations between variables but they are slow to train every time that
there is another class to assign and usually require large training sets in order to
have sufficient understanding of its underlying structure. They have “black

22
box” nature, with only inputs and outputs (the internal working is unknown)
[52] and are typically easy to implement.
Below, in Figure 2.12 there is a basic example of a feedforward neural
network, with M input units and N output units. Each input unit is connected
to each of the output units and each connection has a (adaptive) weight associ-
ated [53].
Figure 2.12 - Basic feedforward neural network[53]
2.5 Context in robotics
Systems like social, cooperative or service robots have to perceive and in-
terpret its surroundings and take into account many variables to make correct
decisions. In [54], the authors made a survey on social interactive robots and
state that they must be able to distinguish other social agents and other objects
in the environment. Most importantly, in order to communicate with humans,
robots must perceive the same things that humans find to be relevant and inter-
act with the environment similarly to living beings [55].
In social interactive robots, perceiving human‟s feedback actions and be-
haviors is also a context concern (by the robot), in order to communicate
properly. Emotions however are also often tightly coupled to social context
(from humans) [54].

23
Still in social interactive robots and facial expressions, the authors in [56]
reinforce the importance of context-awareness in the field of humanoid robot-
ics, particularly the generation of robots facial expressions, selecting appropri-
ate combination of facial cues depending on inner feelings, generated by poly-
nomial classifiers.
In [57] the authors introduce CAMUS (Context Middleware for URC Sys-
tems) which is a framework to support context-aware services for network-
based robots. This article is inserted in a relatively new concept named URC
(Ubiquitous Robotic Companion) which are ubiquitous service robots that pro-
vide services to users, anytime and anywhere in ubiquitous computing envi-
ronments[58].
Returning to [57], this system uses UDM (Universal Data Model) to repre-
sent context information (relations between nodes) and their reasoning system
is based on JENA which is a framework for java that support the use of OWL
(Web Ontology Language). The rule engine is based also on a java environment
called JESS. This robot could provide multiple services like entertainment,
home guard, home monitoring and information.
In [59], the authors use context-awareness to improve vehicle-to-vehicle
applications in terms of its driving safety and efficiency. The techniques used
on this approach, for modeling context and situations, are Context Spaces (a
context-aware architectural framework [60]) combined with the Dempster-
Shafer rule of combination, for situation reasoning.
In [61] the authors presented a machine-understandable representation of
objects (their shapes, functions and usages). They analyzed certain combina-
tions or sets of objects and its features in order to perform context/scene under-
standing and to deduce corresponding possible activities in those scenes. Both
reasoning about object and scene recognition use an ontological representation
(OWL) and relational databases.
Still in object recognition, in [62] the authors present an indoor furniture
and room recognition combined with online sources so that robots can be able
to fluidly collaborate with humans. For solving that, the authors developed a
3D object classifier and use an online database (Wordnet [63]). It is also used a
Markov Random Field (MRF) as a final probabilistic classifier to model object-

24
object and object-scene context. Another work on object recognition to model
context is presented in [64], in which the authors use ontologies to identify ob-
jects in changing and unpredictable environments.
In [65] a context aware fusion is made to overcome the possible failures
that speed limit information systems, like digital maps, can have. So they fused
digital maps speed information with sign recognition system. A Dempster-
Shafer technique is used to implement such system. The conclusion of this work
is that this kind of fusion is able to recognize speed limits when sensors fail and
reduces conflicts between sources of information.
There is also an application of context in robots localization/navigation.
For example, in [66] the authors use a semantic representation and a Bayesian
model for robot localization, measuring the distance relations between known
objects in the environment. The authors named it a topological-semantic dis-
tance map. The data in the methods are represented by means of ontology and
asserted with ontology inference. Sensor reading errors are filtered with the use
of rules and relationships of logical reasoning.
In [67] the authors made a survey emphasizing the need for creating a
standard ontology language for robotic systems and in [68] the authors present
their current results on that same task. There is also a review of some robotic
ontology projects and applications on both references.
The authors in [69] describe the development of an ontology for robots in
the field of urban search and rescue, based on OWL.
There is also an attempt to use ontologies for autonomous vehicle naviga-
tion planning in [70] in order to increase performance of route planning and
improve capabilities of autonomous vehicles.
Context-aware systems are also useful in smart environments. The authors
in [71] presented an ontology-based approach to implement context-awareness
in a smart environment like ambient assist living. The authors also present posi-
tive experiment results in an assist living facility (smart home) and with a mo-
bile robot in an automated building. The main objective is to have reliable in-
formation about what is happening in a smart home, based on its datasets.

25
Similarly, in [72] the authors propose an architecture for context-aware
applications and ubiquitous robotics, where robots navigate in smart environ-
ments. The proposed architecture integrates ontologies with logic approach. It
is also presented some experimental results of a service robots team performing
missions in a hospital environment (transporting biological waste between
floors and patrolling).
The authors in [73] develop CAIROW (Context-aware Assisted Interactive
RObotic Walker) for Parkinson disease patients. They use a Hidden Markov
Model (HMM) to analyze the gait of the patient. Both patient and road condi-
tions contexts are considered. The robot should adjust their speed or direction
according to user gait and road conditions.
A different approach is made by the authors of [74]. This pa-
per presents collaboration techniques between multiple robots welcoming and
guiding visitors through a building. The guiding topics are selected by the ro-
bots according to the participant‟s interests, resulting in personalized tours. It is
used an ontological approach to develop this system.
Table 2.2 - Overview of context models in robotic systems their application purpose
Application Purpose Context Model/Reasoning Technique
Object Recognition Markov Random Field (probabilistic classifi-
er)[62], Ontologies[61], [64]
Safety Dempster-Shafer[59], [65], Ontologies[69]
Human-machine interface Polynomial classifiers[56], Hidden Markov
Model[73]
Localization Ontologies + Bayesian model[66]
Navigation Ontologies[70]
Smart Environments Ontologies + Logic[71][72],
Ontologies[74][57]

26
As it can be understood from Table 2.2, many times ontologies are used to
support machine learning techniques in the robotics field.

27
3. Implementation
3.1 Problem’s Approach
As it was stated before there are several applications for context in the ro-
botics field but context can also be integrated in other applications. The reliabil-
ity field hasn‟t explored context in complete way. Context can and should be
integrated in the reliability field allowing reliability calculation optimization.
Regarding this dissertation, it is proposed a classification hierarchy, dis-
played in the Figure 3.1, in which it is first classified the context as indoor envi-
ronment or outdoor environment and then there will be another computational
model created to sub-classify in more detail the type of environment present.
Figure 3.1 - Context classification hierarchy
The sensor processing module‟s (present in Figure 3.1) main objective is
to remove the noise, outlier values and to abstract the measured data to a high-

28
er level information (for instance to give a “hot” temperature result instead of
33ºC) from the “Sensors” layer.
3.2 Tools and Platforms
In this section it will be presented and described some practical tools (ei-
ther in terms of hardware or software) substantial to this work.
3.2.1 Hardware
ServRobot
ServRobot is an all-terrain service robot created for remote surveillance
and monitoring. It is a project developed by Holos, co-financed by QREN (Stra-
tegic Reference National Framework) and inserted into the System of Incentives
for Research and Technological Development (SI I & DT). The ServRobot
should adapt to different types of usage and environmental conditions and al-
ready has several features: following people, following lines, autonomous navi-
gation, teleoperation, defining paths and cargo transportation [75].
The purpose of this dissertation, inserted on this project, is to add the ca-
pability to detect and classify the environmental context of the robot, when
moving in the several conditions of operation. This will add an important value
when collecting and interpreting sensory information, and then to act autono-
mously over that information.
Also, the result information of the present dissertation would be integrat-
ed in the development of a new reliability and prognostic technique, in order to
improve the robot‟s maintenance, forecasting potential fault zones.
The ServRobot already has included several sensing devices, among them,
there is an xsens MTI IMU (Inertial Measurement Unit) which measures veloci-
ty, orientation and gravitational forces using gyroscopes, accelerometers and
magnetometer. There is also a kinect device for video recording and movement
detection, a Sick 111 LADAR (LAser Detection And Ranging) for obstacle
avoidance and mapping and ultrasonic range finder to support obstacle detec-
tion. There is also an USB camera with infrared lighting used in the line follow
feature. All this sensory devices are connected to an ITX motherboard which
contains an Ubuntu OS (Operating System) and ROS (Robot Operating System).

29
The motors are controlled with a Roboteq ax3500 motor controller together with
a PID (Proportional-Integral-Derivative) controller and connected to a Diamond
Systems Hercules II, which is a data acquisition board to gather information
about the sensors mentioned before as well as encoders, electrical currents and
voltages.
ServRobot is also capable of retrieving the type of the soil that is under
him (concrete, roadway or pavement), using the IMU, frequency spectrums
(Fourier) and a Neural Network.
Figure 3.2 - ServRobot
Added Input Sources (sensors)
In order to sense the environment, several sensors were added to the
ServRobot.
Arduino Platform
For the acquisition board it was chosen the Arduino Mega 2560 R3, which
is a microcontroller board with a ATmega2560, it has 54 digital input/output
pins, 15 PWM outputs, 16 analog inputs, 4 UARTs, 16MHz of clock speed and
256KB of flash memory, which is more than sufficient for our purpose. The
main reason for this selection was that this is an open-source electronics plat-
form, it‟s easy to use for prototyping, it has support for many sensors and the
author was acquainted to this device use, which facilitates the deployment time
[76].

30
Figure 3.3 - Arduino Mega 2560
Weather Shield
At this stage, a weather shield was added to the Arduino, which already
contains several useful sensors, like barometric pressure, relative humidity, lu-
minosity, and temperature. There are also the possibility to connect wind
speed/direction, rain gauge and GPS for location and accurate timing. Unfor-
tunately the wind and rain sensors had inappropriate dimensions to include on
the robot, but the GPS was included. Finally, the weather shield can operate
from 3.3V up to 16V and has built in voltage regulators [77].
Figure 3.4 - Arduino + Weather Shield

31
Luminosity
The weather shield‟s luminosity sensor consists in a ALS-PT19 that can
perceive light from a wavelength from 390nm to 700nm, which is what the hu-
man eye can perceive (visible spectrum). It also has an operating temperature
range from -40ºC to +85ºC [78].
Figure 3.5 - Output Voltage Vs Iluminance [78]
Temperature and Humidity
In order to sense temperature and humidity, the weather shield has a
HTU21D which is a new, reliable, accurate and low power consumption sensor.
Figure 3.6 - Operating range of the HTU21D [79]

32
For the temperature it has a typical accuracy of ±0.3ºC (@25ºC) and for the
humidity is has a typical accuracy of ±2%RH (@25ºC and from 20%RH to
80%RH) [79].
Barometric Pressure
For measure the barometric pressure, the weather shield has a MPL311A2
pressure sensor. This sensor provides accurate pressure, altitude and also tem-
perature data. This sensor can operate from -40ºC up to 85ºC. Its pressure abso-
lute accuracy is ±0.4kPa with a measurement range of 50kPa to 110kPa. The al-
timeter resolution is down to 30cm and the temperature measurement range is
from -40ºC to +85ºC with an accuracy of ±1ºC (@25ºC). This temperature sensor
is used for internal pressure compensation purposes [80]. The HTU21D value
will be used for temperature, since it has superior accuracy.
GPS
For the GPS receiver it is used a GP-635T which is a slim module with -
161dBm tracking sensitivity and only 27 second cold start time. It is based on
uBlox 6 chipset, has 50 channels, an antenna and from 1Hz to 5Hz of update
rate. It has low power consumption (50mA) and similar to the other sensors, it
has an operating range from -40ºC up to +85ºC.
In terms of accuracy, it has horizontal position accuracy of <2.5m, a veloci-
ty accuracy of <0.1m/s (speed), <0.5º (heading) and can perceive altitude until
50000m and a max velocity of 1852 Km/h [81].
Figure 3.7 - GP-635T
33
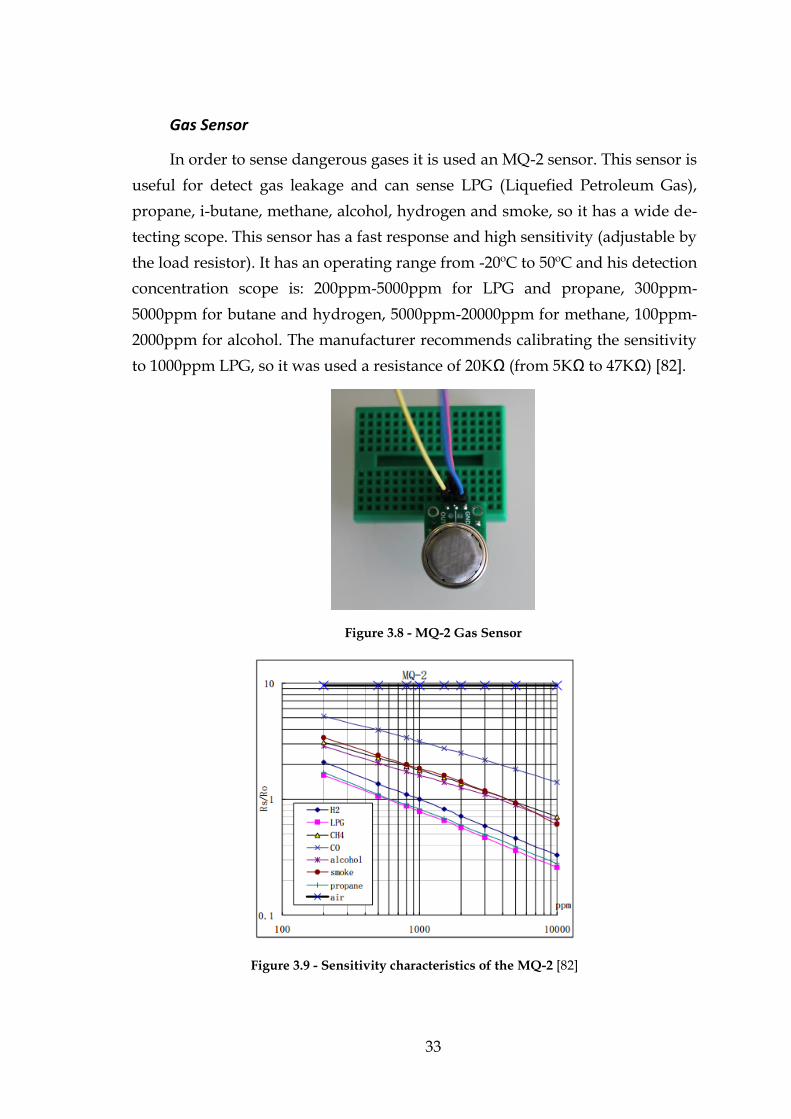
Gas Sensor
In order to sense dangerous gases it is used an MQ-2 sensor. This sensor is
useful for detect gas leakage and can sense LPG (Liquefied Petroleum Gas),
propane, i-butane, methane, alcohol, hydrogen and smoke, so it has a wide de-
tecting scope. This sensor has a fast response and high sensitivity (adjustable by
the load resistor). It has an operating range from -20ºC to 50ºC and his detection
concentration scope is: 200ppm-5000ppm for LPG and propane, 300ppm-
5000ppm for butane and hydrogen, 5000ppm-20000ppm for methane, 100ppm-
2000ppm for alcohol. The manufacturer recommends calibrating the sensitivity
to 1000ppm LPG, so it was used a resistance of 20KΩ (from 5KΩ to 47KΩ) [82].
Figure 3.8 - MQ-2 Gas Sensor
Figure 3.9 - Sensitivity characteristics of the MQ-2 [82]

34
All sensors from weather shield use I2C protocol, which is a computer bus
invented by Phillips used for attaching peripherals (e.g. sensors) to computer
motherboards and embedded systems. The gas sensor use a simple analogic
output.
3.2.2 Software
ROS
The Robot Operating System (ROS) is a flexible, distributed, modular and
powerful framework for developing robot software. It contains a collection of
tools, libraries and conventions that aim to simplify the task of creating com-
plex and robust robot behavior between many different robotic platforms. The
main motivation for its creation was the need for a general purpose robot soft-
ware that deals with a wide variety of environments that need to be managed
when developing these systems. To simplify this task, ROS was built based on
collaborative robotics software development. In this sense, for instance, a group
that is expert in mapping can provide tools for the community to work with
their system and improve its performance and/or add it more features, in a col-
laborative way. Everything is open source and offers support from low level
tasks (like sensor access) to high level tasks (like autonomous navigation).
There is still a recent and rapidly growing community inside ROS. At the time
of writing, the ROS wiki had more than 22,000 wiki pages and more than 30
wiki page edits per day [83].
JFuzzyLogic
jFuzzyLogic is an open source fuzzy logic library aimed to simplify the
development of fuzzy logic systems. It implements a FCL (Fuzzy logic Control
Language) specification and includes the feature of easily plotting the member-
ship functions of the fuzzified variables. It also has a decent support and docu-
mentation to ease its use. This library imports an FCL file with all input and
output variables and linguistic terms configured, then checks the rule block
(how input variables affect output variables). It also provides a parameter op-

35
timization framework, allowing it to learn or refine fuzzy parameters using ma-
chine learning algorithms.
WEKA
WEKA (Waikato Environment for Knowledge Analysis) is a software
“workbench” that incorporates several standard machine learning techniques.
This software has a GUI interface as well as a CLI, both very useful for rapid
prototyping. With WEKA it‟s possible to input a dataset from a data file (arff
recommended), from an URL or even connect directly to a DB. It also has a
wide variety of classifiers to choose from. To choose the more appropriate clas-
sifier there is the possibility to perform several tests on the collected dataset to
see which one gives more accurate results. There are four test options (to vali-
date the model) [84]:
The first is to use a training set to build the classifier based on its train-
ing instances and to use it again in testing purposes. This usually pro-
vides overoptimistic results.
The second consists in supplying a new dataset for testing purposes (af-
ter the model/classifier was made out of the initial training set). This op-
tion gives more accurate results if the data is available.
The third option performs an n-fold cross-validation. This is a well-
known strategy for model selection and evaluation. In this option, the
dataset is split n times (most commonly 5-10 folds) part of the data (the
training sample) is used for training purposes and the remaining data
(validation sample) is used for validation purposes[85]. After that, a
cross validation is made with the various data splits. This technique is
useful when the amount of data is somehow limited.
Finally the fourth option consists in percentage split, in which the user
chooses what percentage of the data will be for training, and the remain-
der will be for testing.

36
Figure 3.10 - WEKA GUI - classifiers, test options and outputs
There is also a useful filter called attribute evaluator to select the most per-
tinent attributes in the dataset considering its consistency and predicting capa-
bilities.
Figure 3.11 - WEKA attribute evaluator
As can be seen, there are a lot of different algorithms to perform attribute
evaluations.

37
There is also a wide variety of visualization capabilities, from the dataset
analysis to the obtained graphical model (to plot decision trees, Bayesian net-
works, etc.).
In the latest developer version of WEKA software (3.7.11), it has a package
manager to install external packages from the different categories (visualiza-
tion, classification, clustering, attribute selection, etc.).
Qt Creator
Qt creator is a cross-platform IDE, focused on the development of Qt ap-
plications (GUI designs, etc.) providing features that increase productivity and
help the new users to Qt applications. Qt creator also provides a code editor, a
visual debugger and a GUI designer and uses mainly C++ programming lan-
guage [86].
3.3 Architecture Overview
Figure 3.12 - Reliability context integration architecture
In Figure 3.12 the reliability context architecture is presented. It will first
receive the sensor inputs and process its signals in order to reduce any noise
and outlier values as well as necessary sensor fusion. In the knowledge base,
the raw information from sensors and sensor fusion is stored. It will be created
a context classifier that will provide contextual information to the reliability cal-
culation. Those classifications will be also stored in a context history module.
This history can be re-fed to the classification module to improve performance.
From that history it will be included the last state attribute to the current classi-
fication.

38
It is believed that the environmental conditions will influence a great deal
the reliability calculation and estimation. The key elements present in the sur-
roundings may be crucial for optimizing reliability assessment, for example if a
mobile robot is working under a very dusty environment it may be more prone
to have mechanical failures thus reducing its reliability.
The soil conditions, atmosphere and the environment of the robot will be
considered. The main objective is to build an accurate tool to classify the robots
context regarding the type of environment, without heavy and energy drain
algorithms like image processing. In some projects only GPS satellites signal is
used to infer outdoor/indoor environment, at first glance it seems obvious but
this approach lacks accuracy and takes too much time.
In [87] the authors propose an approach for indoor/outdoor detection in
mobile devices using light sensor, cellular module and magnetism sensor. Since
many robotic systems also use cellular modules to communicate, it‟s a valid op-
tion to consider monitor its signal strength for possible drops that can indicate a
presence of an indoor environment. This drop is due to building walls that
stand in the line of sight between the cellular module and the cell tower. The
same authors claim that the light signal exhibit different patterns depending on
the source (natural or artificial light) and that the magnetic field varies signifi-
cantly between indoor environments but stays less fluctuated between outdoor
environments (this is due to metal surfaces, electronic appliances, etc. present in
a typical indoor environment).
3.4 Architecture Implementation
3.4.1 Managing Input Sources
Since this project similarly consists in environment classification, although
in different scenarios and for different purposes, some studies and experiments
will be taken into account made by the authors of [87], particularly the variation
of light intensity between indoor and outdoor environments. According to their
study, the light intensity inside buildings it‟s much lower than in outdoor envi-

39
ronments, even in cloudy or rainy days. They observed an interesting phenom-
enon: even if the light sensor is pointing to the ground the previous statement
remains true. This happens because different light sources have different spec-
trums, although sometimes they both look with the same brightness, the sun-
light spectrum has more intensity in visible light than the lighting lamps.
Figure 3.13 - Light variation in outdoor and indoor environments in one day [87].
In the scope of this dissertation, it will also be taken into account the soil
conditions (smooth, concrete, pavement, etc.) and weather conditions.
The main physical sensors taken into account for the first approach archi-
tecture are shown below, in Table 3.1, as well as their sensed information and
type of formalism.
Before modeling the data and managing all the environment information,
it has to be gathered using a flexible and multiplatform tool to ensure support
and compatibility between the different platforms (operating systems, pro-
graming languages, etc.). So, in order to integrate the Arduino (and all these
input sources) seamlessly with the ServRobot, ROS – Robot Operating System is
used.

40
Table 3.1 - Formalism outputs from the multiple physical sensors
Physical Sensor Sensed Information Type of formalism
Camera/Kinect: Color histogram
Object identification and
classification
Predominant color
Presence of objects
Gyro /Accelerometer/Inertial Unevenness
Shake/trepidation
Even/uneven floor
Bumpy soil
Anemometer Wind Speed/direction Low/Moderate/Strong
Thermometer Temperature Hot/Comfortable/Cold
Hygrometer Humidity Humid/Comfortable/Dry
Rain Drops Detector Rain Rainy/Dry
LADAR Edge direction Regular/irregular lines
Photosensor Light High/Medium/Low
Clock Daytime Day/Night
Microphone Audio Loud/Comfortable/Quiet
Gas Detector Gas Dangerous /Non
Wheel Speed Velocity Fast/Moderate/Slow
GPS Position Number of Satellites detected
CellTower Signal Power Weak/Medium/Strong
Wireless APs Signal Power Weak/Medium/Strong
For acquiring the various sensor values, a publish/subscribe method over
ROS is used, firstly by publishing the data in C++ topics and then using
ROSJAVA (which is the first pure Java implementation of ROS) to make it con-
cordant with the Fuzzy logic library.

41
Figure 3.14 - Main steps in acquiring sensor data from the AGV - ServRobot
This “Converter” had to be implemented because ROSJAVA, at the time of
implementation, does not have all the “Sensor_msgs” types, so the “Sen-
sor_msgs” topics had to be converted to “Std_msgs” (which stands for standard
messages), so they can be fully integrated with the fuzzy logic library and, fur-
ther, with the classifier.
3.4.2 Fuzzy Logic Membership Functions
A very brief definition of fuzzy logic theory was previously made in the
section 2.4, here the focus is on describing its use in this dissertation.
Based on fuzzy logic theory, there are Fuzzy Logic Controllers (FLC) that
are FRBSs (Fuzzy Rule Based Systems) with a knowledge base, a fuzzification
module, an inference system and defuzzification module. The knowledge base
relates to the information about the world in the form of control rules, the fuzzi-
fication module transforms the crisp values of the inputs into fuzzy sets, the
inference system intersects the fuzzy sets and the knowledge base performs the
reasoning process and the defuzzification module takes away the results from

42
the inference system and turns them into crisp values for the control purposes
[88].
For the purpose of this dissertation, fuzzy logic was implemented to trans-
form sensed numeric values into linguistic terms (a qualitative semantic), there-
fore, fuzzification was used to aggregate the sensor inputs (sensor fusion). This
will increase the flexibility and modularity of the overall algorithm over the
slight changes in the sensor values (also decreasing its complexity and load).
In order to implement this technique in the project, a very useful java li-
brary, called jFuzzyLogic was used.
Below, some of the membership functions used to fuzzify the attributes
and their linguistic terms are shown.
Figure 3.15 - Fuzzified temperature function
In the temperature function, it‟s observed a membership of 1 for the
“cold” temperature around 0ºC, a membership of 1 for the “comfortable” tem-
perature from around 19ºC to 24ºC, a membership of 1 in temperatures consid-
ered “hot”, around 30ºC and a membership of 1 for “very hot” temperature
from 35ºC to 50ºC. The chosen sets were studied after a research for comfortable
temperatures (although the comfort level varies with humidity) and the reason
why “very hot” temperatures reach 50ºC is that, since this classifier is to be de-
ployed in a service robot, he can move around fires, oil pipelines and other hos-
tile environments. A temperature higher than 50ºC can compromise some com-
ponents of the ServRobot.
In a similar way, below are the membership functions for the humidity,
sound, light and time variables.

43
Figure 3.16 - Fuzzified humidity function
The “very high” humidity from 90%RH to 100%RH was added since it is
common that humidity at night ascend to “high” (at least with the
mediterranean climate) and the “very high” category may be useful to improve
the classification accuracy in some specific environments.
Figure 3.17 - Fuzzified sound function
As for the sound, to achieve this function a research was made in sound
levels and their corresponding sources. As can be ascertained from the refer-
ences [89] and [90], an average car stereo at maximum volume cast about
100dB. The comfort zone it is assigned at around 50dB (average home, conver-
sational speech and quiet library) and the quiet level is below 26dB (quiet bed-
room at night).

44
Table 3.2 - Sound sources and their corresponding levels[90]
Sound sources (noise) Examples with distance
Sound pressure Level Lp dB SPL
Jet aircraft, 50 m away 140
Threshold of pain 130
Threshold of discomfort 120
Chainsaw, 1 m distance 110
Disco, 1 m from speaker 100
Diesel truck, 10 m away 90
Kerbside of busy road, 5 m 80
Vacuum cleaner, distance 1 m 70
Conversational speech, 1 m 60
Average home 50
Quiet library 40
Quiet bedroom at night 30
Background in TV studio 20
Rustling leaves in the distance 10
Hearing threshold 0
Concerning light, another research was made around the lux level of each
source and environment. Unfortunately the available light sensor complicates
its conversion to lux units (the SI unit of illuminance). To measure light level it
was used a simple analog read from 0 to 676. This range is due to the reference
voltage being automatically regulated to 3.3V (1024 for 5V, so
). In order to achieve these fuzzy sets for light function, several tests were
made in indoor and outdoor environments, at different time and weather con-
ditions. So, roughly, from 400 to 600 it is asserted as “very high” light intensity
(outdoor sunny day), from 200 to 430 as “high” light intensity (outdoor shadow
or late afternoon), from 80 to 220 as “medium” (typical office light), from 50 to
110 as “low” and from 0 to 60 as “very low” (indoor low bedroom light at
night)

45
Figure 3.18 - Fuzzified light function
An example of the used code from the .FCL file can be seen below, in Fig-
ure 3.19
Figure 3.19 - Example of the FUZZIFY functions in FCL files
To fuzzify attributes in jFuzzyLogic is as easy as to specify the name of the vari-
able, “temperature_sensed” and “humidity” in the example, then assigning the
linguistic terms of each variable (“cold”, “comfortable”, “hot”, “veryhot”,
“dry”, etc.) and lastly assign the membership functions of each linguistic term.
For example, the term “veryhigh” for the variable humidity is set to a member-
ship of “0” at 88%RH but from 90%RH to 100%RH is set to a membership of 1
(maximum). In this case the functions were chosen with no specific form, but
there are many forms that can be assigned (triangular, trapezoidal, Gaussian,
Bell, sigmoidal, singleton and piece-wise).

46
3.4.3 Choosing the Classification Model
At first glance, it was thought that ontologies could provide the semantic
hierarchy to describe sensors and observations but, at this point, regarding the
multiple physical sensors and its outputs, a change of course was made. Since
ontologies are often specialized to some domain-specific applications (although
they are used for many different purposes), it was preferred not to model the
world around the robot “statically “describing its relations “manually “in the
beginning. Instead, the main interest is in one technique that could learn and
that can adapt to new situations.
A semantic reasoner or rule engine to infer logical consequences from a set
of asserted facts is more difficult to train and adapt to new classification labels
or input sources, as well as to maintain and debug. Since in this project the
main focus is to, initially, classify two classes, it did not justify the use of such
conceptualization, because there is only a few concepts regarded. Perhaps, in
the second step of sub-classification, ontologies will be a much valuable re-
source. At this stage, it was considered using a probabilistic machine learning
technique, that supports supervised learning and that can be updatable.
The environment is partially observable because the robots sensors cannot
give access to all the complete state of the environment at each point in time.
Since its being dealt with a stochastic environment (because there is a lot of un-
certainty when sensing the robot surroundings), it is appropriate to choose a
classifier based on probabilistic methods.
Regarding the activity type, the classification task is a sequential activity,
performing a single classification at a time but considering the previous state.
This activity is performed, clearly, in a dynamic environment, since is changing
constantly as the robot is patrolling within different areas.
For the sake of efficiency, the environment can be considered as discrete,
since it is made an abstraction of the “real world” in a finite number of clearly
defined possible states.
Regarding the type of data present, it was interesting to have a structured
architecture which supports relations between the different entities of an envi-
ronment to better classify it (relational databases, knowledge-based learning,

47
ontologies, etc.). Maybe in the second step of sub-classification this will be use-
ful (future work). Regarding this dissertation, a factored representation is pre-
sent, which support probabilities and uncertainty but doesn‟t support relations
or hierarchy between the set of variables (in order reduce complexity).
In the scope of this master dissertation, the more suitable technique for
classification lies is supervised learning (classification field), more particularly a
Bayes classifier (Bayes network). It seemed to be a good starter since it has good
performances, even with less training data, is highly scalable, can adapt to a
wide variety of classification tasks and is appropriate for a factored representa-
tion of data. It was decided to start with a more basic classifier to get some
sense of the collected data (labeled) and then train it properly.
Step-by-Step Classifier Implementation
There are some basic workflow when working with ML techniques ac-
cording to [45]: Firstly prepare the data, choose an algorithm, fit a model,
choose a validation method, examine fit and update until satisfied and finally
use fitted model for predictions. These steps were very useful and followed
when doing the final classifier.
Preparing the data
When preparing the input data, each row should correspond to an obser-
vation and each column represents a variable (it can also be referred as attrib-
utes or features). Each row of observable data should have a response/output
class to make a pre-classified training set and therefore build the model [45].
Figure 3.20 - Dataset sample using weka arff visualizer
In Figure 3.20 it is presented a sample of our dataset and the chosen at-
tributes can be viewed. It is believed that those are the relevant attributes to this
classification task (light, gps satellites, temperature from webservice, sensed

48
temperature, humidity from webservice, sensed humidity, floor type, time of
the day, sound level and previous state). The reason why there is a temperature
and humidity from a webservice is further discussed. Although it‟s known that
typically temperature and humidity are relatively constant in indoor environ-
ments like home of office (as it was proved by the line chart in Figure 3.21), but
for the purpose of this application this is not useful, since a moving robot typi-
cally doesn‟t stand enough time on the same location to foresee if the tempera-
ture or humidity will remain constant for hours. To solve that problem, the
measured values of temperature and humidity are compared to the values of a
local (nearest) PWS (Personal Weather Station) by the means of a webservice.
Those PWS provide accurate data (humidity, temperature, wind speed, pres-
sure, precipitation, etc.) from time to time (typically 10 in 10 minutes) in an
outdoor environment as close as possible to the robots location. For this disser-
tation, a wunderground nearest station is used to provide outdoor data (using a
wunderground java API). For example, if the measured values match the an-
nounced, the output must be “outdoor” with a lot more confidence.
Figure 3.21 – Measured temperature and humidity indoor for 24hours
0
10
20
30
40
50
60
70
Measured Humidity Indoor(%)
Measured TemperatureIndoor (ºC)
Measured Humidity (indoor) and Measured Temperature (indoor)
0.00h 6:00h 12:00h 21h

49
Figure 3.22 – All measured temperatures from indoor and outdoor
As can be concluded from Figure 3.22, the measured temperature in a
semi-outdoor environment (in an opened window) follows the trend line an-
nounced by the outdoor webservice (green and red, respectively). Still, the
measured temperature indoor remained roughly constant during the entire test.
As obvious, this deviation from indoor to outdoor (in terms of tempera-
ture) is more pronounced during the night. During the day (some days) this
deviation can be too narrow, which means that sometimes this attribute is not
clear.
Concerning humidity, it was noticed in our measures that this attribute is
very unpredictable, and can vary much from the announced value (as can be
seen on Figure 3.23). This is due to the high variation and sensitivity to the spe-
cific local that is measured. At this point it was considered to discard this at-
tribute. Further on, this adjustment will be justified using an attribute evaluator,
from the weka framework).
0
5
10
15
20
25
30
35
Measured TemperatureIndoor (ºC)
Announced Temperature(Outdoor) (ºC)
Measured TemperatureSemi-Out (ºC)
All Measured and Announced Temperatures
0.00h 6:00h 12:00h 21h

50
Figure 3.23 – All measured and announced humidities
The previous state was added because there can be occasions where the
robot leaves an indoor environment and it may take some time for the GPS to
collect satellites data. That can generate mistaken classifications, since typically
there is GPS signal available outdoors.
Unfortunately, it was not possible to include a wind speed sensor (ane-
mometer) in this classification system.
Choosing an algorithm and fitting the model
Next it‟s time to choose the algorithm. As been said in section 3.4.3, a
Bayes network classification was chosen.
In order to fit the model (train the classifier with the dataset), validate it
(test the classifier) and to make predictions, the support from weka framework
was used. The results are shown further, on chapter 3.5.
After getting the model is time to perform a feature selection, using the at-
tribute evaluator from weka, in order to identify how well and which attributes
alone can predict the desired class.
After some GUI tests and model selection, it was implemented the classifi-
er in our project (java code) along with the fuzzy sets, sensors from the Arduino
(ROS nodes) and also from a nearest wunderground weather station.
0
10
20
30
40
50
60
70
80
90
100
Measured Humidity Indoor(%)
Announced Humidity(Outdoor) (%)
Measured Humidity Semi-Out (%)
All Measured and Announced Humidities
0:00h 6:00h 12:00h 21:00h

51
3.4.4 Software hierarchy
Below it is presented the overall software project hierarchy.
Figure 3.24 - Overall software project hierarchy
First, the sensory information is gathered on the Arduino (within
ServRobot ROS node). This node has several topics constantly publishing sen-
sor data. The node Converter was covered in chapter 3.4.1. The next three boxes
refer to a main node that contains the remote weather station information
(Wunderground), Fuzzy Logic and the Classifier. This main node subscribes the
Converter node, performs the classification task and outputs the final context
classification.
The hierarchy concerning ROS nodes and topics, obtained by the com-
mand tool “rqt_graph” is presented in Figure 3.25.
ServRobot (Arduino + ROS cpp)
-Gas
-Temperature
-Humidity
-Light
-GPS
-Pressure
Converter
-ROScpp to ROSJAVA
Wunderground
-JAVA API
Fuzzy Logic
-jFuzzyLogic
Classifier
-WEKA

52
Figure 3.25 - ROSgraph representing nodes and topics
GUI
After the development of the classifier, a GUI was made in order to sim-
plify the management and interaction with the system. This module turned to
be very convenient during the field tests.
In Figure 3.26, a screenshot of the designed GUI is shown and its main fea-
tures are:
Connect to ROS;
Running options (run once or continuously);
Display the predicted label and the number of classified instances
so far;
Choose the training and testing dataset;
Possibility of training the classifier (exporting its model) or testing
the classifier (importing its model);
Log for debug purposes.

53
Figure 3.26 - GUI form design
3.5 Field tests and experiment results
For the initial field tests and data collection, the Madan park corridors (for
indoor tests) and the Madan park exterior (for outdoor tests) were chosen.
In Figure 3.27 it is presented the building‟s plan with the corresponding
path (indoor) performed by the classification system (attached to the
ServRobot).
In this first data collection on the main corridor, all the numbered stages
were correctly classified as indoor. Numbers 1, 2, 7, 8 and 9 are the main trou-
bled spots because there are large windows (very high light intensity and
chance to catch some GPS satellites). This data was collected during the late af-
ternoon (18:50pm) with an average sunlight.

54
Figure 3.27 – Holos indoor testing path
Regarding Figure 3.28, the path from 1 to 9 represents an open space be-
tween walls (outdoor), causing a lot of shadows (especially in the morning).
These walls can also break the line of sight with some GPS satellites. Still, all the
steps were correctly classified as outdoor.

55
Figure 3.28 – Holos outdoor testing path
As expected, the fact from section 3.4.1 was observed during the experi-
ments, even with no direct sunlight (cloudy/rainy day and shadows) the light
measurements outdoor were very high, due to the sunlight spectrum in visible
light.
From the first dataset collected, it was obtained 87.5% of correctly classi-
fied instances, using a 10-fold cross-validation evaluation on the training da-
taset (CV).
Further on, a detailed description of the overall systems accuracy is pre-
sented, obtained with the help of WEKA framework.

56
Table 3.3 - Classification statistics (CV)
Correctly Classified Instances 133 (87.5%)
Incorrectly Classified Instances 19 (12.5%)
Total Number of Instances 152
Table 3.4 – Confusion Matrix (CV)
Indoor Outdoor Classified as
119 2 Indoor
17 14 Outdoor
The confusion matrix represents TP (true positives), FP (false positives),
FN (false negatives) and TN (true negatives) in the following order:
Table 3.5- Confusion matrix labels
TP FN
FP TN
From Table 3.4 and Table 3.5, it can be understood that 119 instances were
correctly classified as “indoor” out of a total of 121 indoor instances (true posi-
tives). A more detailed accuracy table is presented below (Table 3.6).
Table 3.6- Detailed performance measures (CV)
TP Rate FP Rate Precision Specificity F-Measure ROC Area Class
0.983 0.548 0.875 0.452 0.926 0.909 INDOOR
TPR (True Positive Rate) also known as sensitivity (in biomedicine) or recall
(in machine learning). Measures the proportion of positives which are correctly
classified as such and it is calculated by:

57
(1)
FPR (False Positive Rate), also known as false alarm rate or fallout. It‟s the
complementary with the specificity (1-specificity) and can be calculated by:
(2)
Precision (represents the positive predictive values):
(3)
Specificity (also known as TNR – True Negative Rate) measures the pro-
portion of negatives which are correctly identified as such (complementary of
FPR), and it is calculated by:
(4)
F-measure (a combined measure for precision and recall):
(5)
A perfect classifier should be 100% specific and 100% sensitive.
Besides confusion matrix, another way to examine the performance of
classifiers is trough ROC (Receiver Operating Characteristic) analysis. The area
under the ROC curve characterizes the quality of a forecast system by describ-
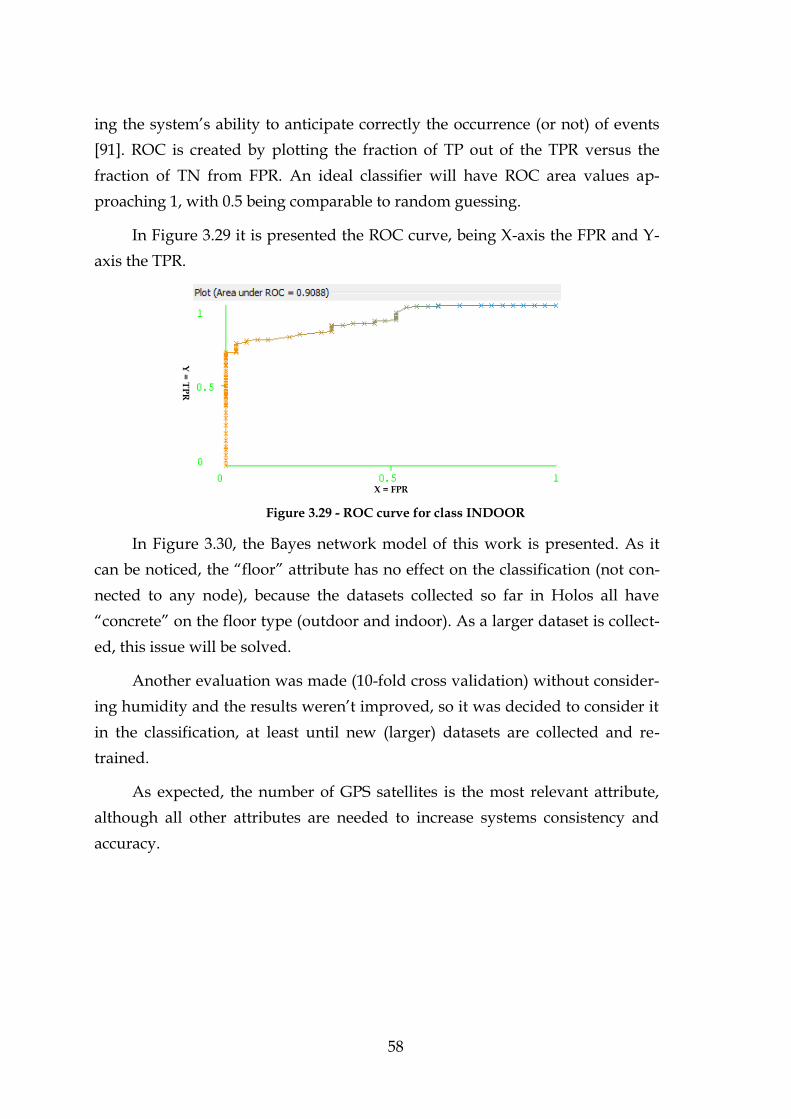
58
ing the system‟s ability to anticipate correctly the occurrence (or not) of events
[91]. ROC is created by plotting the fraction of TP out of the TPR versus the
fraction of TN from FPR. An ideal classifier will have ROC area values ap-
proaching 1, with 0.5 being comparable to random guessing.
In Figure 3.29 it is presented the ROC curve, being X-axis the FPR and Y-
axis the TPR.
Figure 3.29 - ROC curve for class INDOOR
In Figure 3.30, the Bayes network model of this work is presented. As it
can be noticed, the “floor” attribute has no effect on the classification (not con-
nected to any node), because the datasets collected so far in Holos all have
“concrete” on the floor type (outdoor and indoor). As a larger dataset is collect-
ed, this issue will be solved.
Another evaluation was made (10-fold cross validation) without consider-
ing humidity and the results weren‟t improved, so it was decided to consider it
in the classification, at least until new (larger) datasets are collected and re-
trained.
As expected, the number of GPS satellites is the most relevant attribute,
although all other attributes are needed to increase systems consistency and
accuracy.
X = FPR
Y =
TP
R

59
Figure 3.30 – Bayes Network
Table 3.7 exhibits the (conditional) probability distribution table for the
node GPS_SAT (number of GPS satellites). As can be seen, there is a high prob-
ability (93.4%) of “indoor” events that have “none” gps satellites and a “very
low” light. That illustrates a typical indoor environment (e.g. home corri-
dors/rooms).
Table 3.7- Probability distribution table for node GPS_SAT

60
These presented tests don‟t include the “previous state” attribute yet.
Some initial experiments were made later on with this feature and the overall
accuracy (correctly classified instances) was increased to 93.42% (performing a
10-fold cross-validation on the training set).
With all the theoretical tests made and the classifier validated, it‟s time to
test it on a mixed environment, in order to evaluate the system‟s consistency in
its real application scenario. In Figure 3.31, a mixed testing path is presented.
The indoor path is represented in blue color, the outdoor path is represented in
red color and the transition areas are represented in orange.
Figure 3.31 – Holos mixed testing path
These experiments were performed in different daytimes and weather
conditions (mostly cloudy/rainy and sometimes sunny), were traveled in about
8 minutes from step 1 to 26 (11 times) and the previous state attribute was taken
into account. Those were very challenging experiments, since despite the differ-
ent daytimes and weather conditions, the outdoor temperature was always
around the comfortable zone, the floor type was always concrete, the sound

61
level was considered to be constant and there were large windows in the transi-
tion zones (as well as porches, that decrease GPS signal strength), making more
difficult to distinguish indoor from outdoor class.
It was observed that the most troubled zones were in step 5, 6, 17 and 18,
as expected. Next, in Table 3.8, the obtained confusion matrix is presented.
Table 3.8 – Confusion Matrix from the mixed testing path
Indoor Outdoor Classified as
119 19 Indoor
2 146 Outdoor
From Table 3.8 it‟s easily extracted the number of correctly classified in-
stances: from a total of 286 instances classified, which corre-
sponds to 92.66% of overall accuracy. Regarding the incorrectly classified in-
stances: from a total of 286 instances classified, which corresponds
to 7.34%. Of those incorrectly classified instances, the 2 FP cases (“indoor” clas-
sified as “outdoor”, false positives) are located on step 6 of the Figure 3.31 and
they occurred due to the presence of a glass wall in the room. Near the glass
wall, the classifier can be deceived (e.g. with high intensity light and GPS satel-
lites present). Regarding the 19 FN cases (“outdoor” classified as “indoor”, false
negatives), 2 of them occurred on the step 5 of the path (Figure 3.31), which is
the transition step (expected), 6 of them occurred in step 18 (due to the presence
of a porch, which attenuates the light intensity and the GPS signal intensity and
the fact that the GPS attribute is slower to acquire satellites when moving from
indoor to outdoor environments) and the majority of the FN cases (11) occurred
in step 17, which is another transition step. In Figure 3.32, this transition step
(17) from the mixed path is shown.

62
Figure 3.32 – ServRobot performing a classification near a transition zone
Based on the previous formulas (1), (2), (3), (4) and (5) it‟s possible to re-
make all the calculations, this time for the real application scenario. In Table 3.9,
those calculations are presented.
Table 3.9 – Detailed performance measures
TP Rate FP Rate Precision Specificity F-Measure Class
0.862 0.014 0.885 0.986 0.873 INDOOR
Regarding the results from Table 3.9, very good results were achieved in
specificity and sensitivity (TPR) as well as a pronounced decrease in the FPR
(false alarm rate).
Considering the “previous state” attribute in the classification and all the
datasets collected so far, a new Bayes network was generated and presented in
Figure 3.33. As can be seen, the “output” class is directly connected to some of
the most relevant attributes, which now are: “light, “GPS satellites”, “previous
state” and “temperature web”.
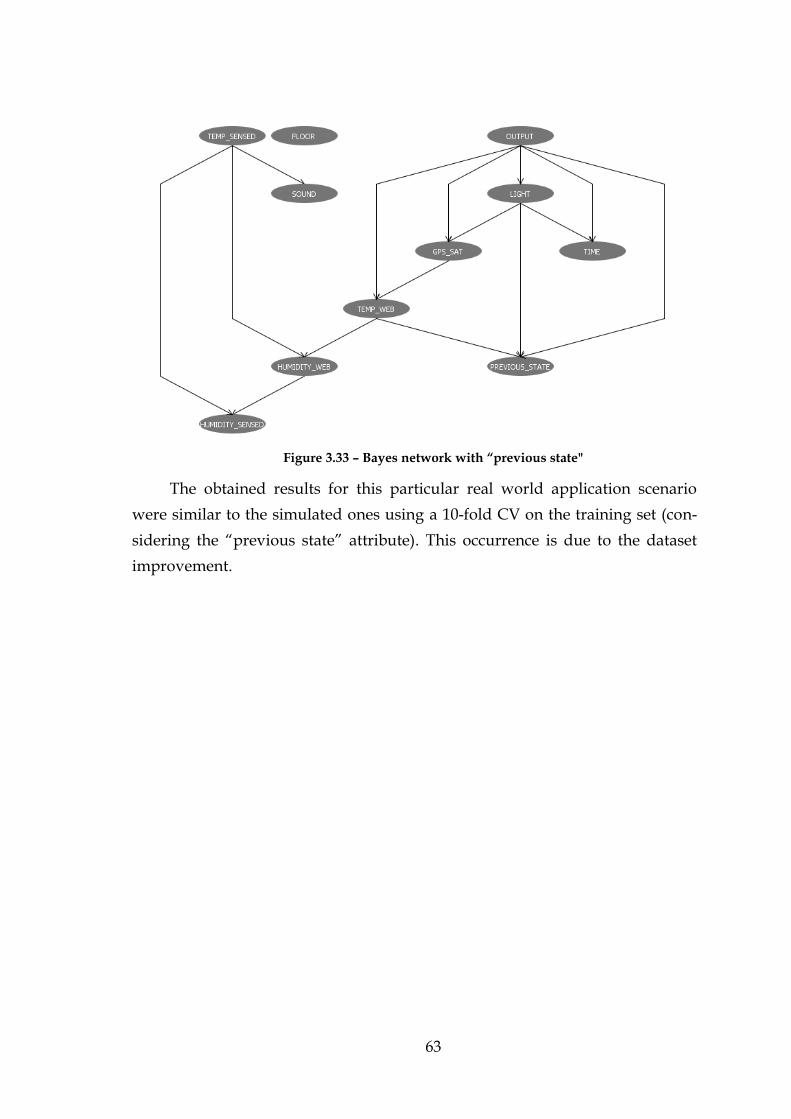
63
Figure 3.33 – Bayes network with “previous state"
The obtained results for this particular real world application scenario
were similar to the simulated ones using a 10-fold CV on the training set (con-
sidering the “previous state” attribute). This occurrence is due to the dataset
improvement.

64

65
4. Conclusions and Future Work
This chapter completes and summarizes the work performed so far along
this dissertation. It also proposes future work that can be done considering this
project to further progress towards the goals.
4.1 Conclusions
Independently of the application, whether it is social, entertainment, ser-
vice, educational, security, etc. robotic systems need to have the notion of its
context in order to behave appropriately and provide useful information to us-
ers and applications that depend on that information. There are several context
models, techniques and frameworks. From all of those possibilities the ones
based on ontologies seem to be the ones with most widespread use (often used
to support ML techniques). From all existing frameworks and for the intent of
this architecture, machine learning techniques, particularly Bayesian networks,
seemed to be the more appropriate method for solving the systems classifica-
tion problem. This assertion was verified by the good results achieved by this
system. Nevertheless, another future experiments should be considered with
more linguistic terms in the fuzzy sets (for example, “morning”, “afternoon”,
“late afternoon“ or “night” instead of just “day” or “night” for the time attrib-
ute). Increasing the attribute information (more levels) can add a valuable im-
provement in the overall performance. However, increasing the number of at-
66
tributes (more sensory information) doesn‟t necessarily improve the systems
accuracy.
In conclusion, it is believed that a good performance level was reached
(92.66%) regarding this system, that compared with the precisions observed
from other systems state of the art was, in some cases better. As stated before,
there is still a lot of room for improvement of this architecture, giving confi-
dence that these good results may be improved.
Although limited to an indoor or outdoor classification, this architecture is
scalable to include a broader range of contexts.
In the robotics field there are, at this point, already some applications but
it seems that context classification can be an added value to others. In this sense
a new application scenario is presented as well as the architecture to support it
in the reliability field.
4.2 Future Work
In the scope of this dissertation, there is more to be done. It is believed that
a good base and starting point was made to a more complex and detailed classi-
fication. As it‟s known if the robot is indoors or outdoors with a very good ac-
curacy, it can now be sub-classified, in more detail, what sub-type of environ-
ment is present (office, manufacture, etc.). To do that, another classifier should
be created and trained with proper datasets (that comprise all the intended en-
vironments to be classified). Once the type of environment and context present
could be classified in more detail, this dissertation will further contribute to a
more accurate reliability assessment.
Since reliability is tightly coupled with the hazard rates of the several
components (constants) and also with influence of variable factors (time, terrain
type, etc.), knowing the robot‟s operating time in different environments will
surely provide a valuable item for its calculations.
Below it is presented the reliability expression considering the two exist-
ing variable factors (time and terrain).
(5)

67
Where is the reliability, is the module hazard rate, is the terrain fac-
tor and is the time. The terrain factor can be calculated by:
(6)
Where is the terrain factor asserted to terrain x and is the total per-
centage of the operating time in terrain x.
Another variable factor will be added to this reliability calculation, regard-
ing the type of context present. The more different context types (more different
factors), the more accurate is the its reliability forecast.

68

69
Scientific Contributions
Some of the concepts covered in the introduction and state of the art of
this document were result of an intensive research that resulted in a publication
and it‟s referenced below:
F.Miranda, T.Ferreira, J.Pimentão, P.Sousa, “Review on Context
Classification in Robotics”, Rough Sets and Intelligent Systems Para-
digms, pp. 269-276, 2014.
Also, part of the implementation steps and experiment results has pro-
duced another paper, referenced below:
T.Ferreira, F.Miranda, P.Sousa, J.Barata, J.Pimentão, “Context Clas-
sifier for Service Robots”, Technological Innovation for Cloud-based
Engineering Systems, Apr .2015.

70

71
References
[1] A. K. Dey and G. D. Abowd, “Towards a Better Understanding of Context and Context-Awareness,” Handheld Ubiquitous Comput., pp. 304–307, 1999.
[2] A. K. Dey, “Understanding and Using Context,” Pers. Ubiquitous Comput., vol. 5, no. 1, pp. 4–7, Feb. 2001.
[3] A. K. Dey, “Context-Aware Computing : The CyberDesk Project,” in AAAI 1998 Spring Symposium on Intelligent Environments, 1998.
[4] M. Baldauf, S. Dustdar, and F. Rosenberg, “A survey on context-aware systems,” J. Int. J. Ad Hoc Ubiquitous Comput., vol. 2, no. 4, pp. 263–277, 2007.
[5] B. N. Schilit, M. M. Theimer, and U. Dept. of Comput. Sci., Columbia Univ., New York, NY, “Disseminating active map information to mobile hosts,” Network, IEEE, vol. 8, no. 5, pp. 22 – 32, 1994.
[6] M. Weiser, “The computer for the 21st Century,” IEEE Pervasive Comput., vol. 1, no. 1, pp. 19–25, Jan. 2002.
[7] M. Satyanarayanan, “Pervasive computing: vision and challenges,” IEEE Pers. Commun., vol. 8, no. 4, pp. 10–17, 2001.
[8] “Oxford Dictionaries - Language Matters.” [Online]. Available: http://www.oxforddictionaries.com. [Accessed: 03-Apr-2014].

72
[9] H. Chen, “An intelligent broker architecture for pervasive context-aware systems,” University of Maryland, Baltimore County, 2004.
[10] H. Chen, T. Finin, and A. Joshi, “An Ontology for Context-Aware Pervasive Computing Environments,” Knowl. Eng. Rev., vol. 18, no. 3, pp. 197 – 207, 2003.
[11] P. Barron, G. Biegel, V. Cahill, and A. Casimiro, “Preliminary definition of CORTEX programming model,” 2003.
[12] C. Bettini, O. Brdiczka, K. Henricksen, J. Indulska, D. Nicklas, A. Ranganathan, and D. Riboni, “A survey of context modelling and reasoning techniques,” Pervasive Mob. Comput., vol. 6, no. 2, pp. 161–180, Apr. 2010.
[13] J. Indulska and R. Robinson, “Experiences in using cc/pp in context-aware systems,” Mob. Data Manag., vol. 2574, pp. 247–261, 2003.
[14] Q. Z. Sheng and B. Benatallah, “ContextUML: a UML-based modeling language for model-driven development of context-aware web services,” Mob. Bus., pp. 206–212, 2005.
[15] T. Strang and C. Linnhoff-Popien, “A context modeling survey,” UbiComp 1st Int. Work. Adv. Context Model. Reason. Manag., pp. 31–41, 2004.
[16] U. Straccia, “Reasoning within fuzzy description logics,” J. Artif. Intell. Res., vol. 14, pp. 137–166, 2011.
[17] I. Horrocks, P. F. Patel-Schneider, and F. van Harmelen, “From SHIQ and RDF to OWL: the making of a Web Ontology Language,” Web Semant. Sci. Serv. Agents World Wide Web, vol. 1, no. 1, pp. 7–26, Dec. 2003.
[18] P. Korpipää and J. Mäntyjärvi, “An ontology for mobile device sensor-based context awareness,” Model. Using Context, pp. 451–458, 2003.
[19] K. Henricksen, S. Livingstone, and J. Indulska, “Towards a hybrid approach to context modelling, reasoning and interoperation,” Adv. Context Model. Reason. Manag., pp. 54–61, 2004.
[20] A. Agostini, C. Bettini, and D. Riboni, “Hybrid reasoning in the CARE middleware for context awareness,” Int. J. Web Eng. Technol., vol. 5, no. 1, pp. 3–23, 2009.
[21] T. Hofer and W. Schwinger, “Context-awareness on mobile devices-the hydrogen approach,” Syst. Sci., vol. 43, no. 7236, 2003.

73
[22] K. Kjær, “A survey of context-aware middleware,” SE’07 Proc. 25th Conf. IASTED Int. Multi-Conference Softw. Eng., pp. 148–155, 2007.
[23] A. Ranganathan and R. Campbell, “A middleware for context-aware agents in ubiquitous computing environments,” Middlew. 2003, vol. 2672, pp. 143–161, 2003.
[24] M. Román, C. Hess, and R. Cerqueira, “A middleware infrastructure for active spaces,” IEEE pervasive …, 2002.
[25] R. McGrath, A. Ranganathan, R. H. Campbell, and M. D. Mickunas, “Use of ontologies in pervasive computing environments,” Knowl. Eng. Rev., vol. 18, no. 3, pp. 209–220, 2003.
[26] T. Gu, H. K. Pung, and D. Q. Zhang, “A middleware for building context-aware mobile services,” Proc. IEEE Veh. Technol. Conf., vol. 5, pp. 2656–2660, 2004.
[27] C. Bolchini, C. A. Curino, E. Quintarelli, F. A. Schreiber, L. Tanca, I. Politecnico, and P. Leonardo, “A Data-oriented Survey of Context Models,” SIGMOD Rec., vol. 36, no. 4, pp. 19–26, 2007.
[28] M. a. Strimpakou, I. G. Roussaki, and M. E. Anagnostou, “A context ontology for pervasive service provision,” Adv. Inf. Netw. Appl., vol. 2, 2006.
[29] P. Fahy and S. Clarke, “CASS–a middleware for mobile context-aware applications,” Work. Context Awareness, MobiSys, 2004.
[30] A. Ranganathan, R. H. Campbell, and A. Muhtadi, “Reasoning about Uncertain Contexts in Pervasive Computing Environments,” IEEE Pervasive Comput., vol. 3, no. 2, pp. 62–70, 2004.
[31] P. Haghighi, S. Krishnaswamy, A. Zaslavsky, and M. M. Gaber, “Reasoning about context in uncertain pervasive computing environments,” Smart Sens. Context, vol. 5279, pp. 112–125, 2008.
[32] Lotfi Zadeh, “Fuzzy Sets,” Inf. Control, vol. 8, no. 3, pp. 338–353, 1965.
[33] N. Deshpande, “Artificial Intelligence,” Second Rev., Technical Publications, 2009, p. 482.
[34] L. A. Zadeh, “A Simple View of the Dempster-Shafer Theory of Evidence and Its Implication for the Rule of Combination,” AI Mag., vol. 7, no. 2, pp. 85–90, 1986.

74
[35] M. Siegel, D. Siewiorek, J. Yang, W. Grimm, and R. B. Corporation, “Sensor Data Fusion for Context - Aware Computing Using Dempster - Shafer Theory,” 2003.
[36] S. Russell, P. Norvig, J. Canny, J. Malik, and D. Edwards, Artificial intelligence: a modern approach, 3rd ed. 2009.
[37] Z. Ghahramani, “An introduction to hidden Markov models and Bayesian networks,” Int. J. Pattern Recognit. Artif. Intell., vol. 15, pp. 9–42, Jun. 2001.
[38] J. McCarthy, “What is Artificial Intelligence?,” 2007.
[39] P. Domingos, “A few useful things to know about machine learning,” Commun. ACM, vol. 55, no. 10, p. 78, Oct. 2012.
[40] A. Blum and P. Langley, “Selection of relevant features and examples in machine learning,” Artif. Intell., 1997.
[41] L. J. Jensen and A. Bateman, “The rise and fall of supervised machine learning techniques.,” Bioinformatics, vol. 27, no. 24, pp. 3331–2, Dec. 2011.
[42] “Mathworks.com,” Machine Learning with MATLAB, 2014. [Online]. Available: http://www.mathworks.com/machine-learning/. [Accessed: 10-Jun-2014].
[43] B. Garg, “Design and Development of Naive Bayes Classifier,” no. June, 2013.
[44] C. McGregor, “Oracle® Text - Application Developer‟s Guide.” Oracle Corporation, 2003.
[45] “MathWorks Documentation Center.” [Online]. Available: http://www.mathworks.com/help/stats/supervised-learning-machine-learning-workflow-and-algorithms.html#bswluhd. [Accessed: 07-Jun-2014].
[46] N. Bhatia, “Survey of Nearest Neighbor Techniques,” Int. J. Comput. Sci. Inf. Secur., vol. 8, no. 2, pp. 302–305, 2010.
[47] F. Jensen and T. Nielsen, Bayesian Networks and Decision Graphs, Second Edi. 2009, p. 463.

75
[48] N. Amor, S. Benferhat, and Z. Elouedi, “Naive bayes vs decision trees in intrusion detection systems,” ACM Symp. Appl. Comput., pp. 420–424, 2004.
[49] C. Burges, “A tutorial on support vector machines for pattern recognition,” Data Min. Knowl. Discov., vol. 43, pp. 1–43, 1998.
[50] C. Cortes and V. Vapnik, “Support-vector networks,” Mach. Learn., vol. 297, pp. 273–297, 1995.
[51] M. A. Friedl and C. E. Brodley, “Decision tree classification of land cover from remotely sensed data,” Remote Sens. Environ., vol. 61, no. 3, pp. 399–409, Sep. 1997.
[52] J. V Tu, “Advantages and disadvantages of using artificial neural networks versus logistic regression for predicting medical outcomes.,” J. Clin. Epidemiol., vol. 49, no. 11, pp. 1225–31, Nov. 1996.
[53] B. YEGNANARAYANA, ARTIFICIAL NEURAL NETWORKS. 2009, p. 476.
[54] T. Fong, I. Nourbakhsh, and K. Dautenhahn, “A survey of socially interactive robots,” Rob. Auton. Syst., vol. 42, no. 3–4, pp. 143–166, Mar. 2003.
[55] J. Zlatev, “The Epigenesis of Meaning in Human Beings , and Possibly in Robots,” Minds Mach., vol. 11, no. 2, pp. 155–195, 2001.
[56] G. Trovato, M. Zecca, T. Kishi, N. Endo, K. Hashimoto, and A. Takanishi, “Generation of Humanoid Robot‟s Facial Expressions for Context-Aware Communication,” Int. J. Humanoid Robot., vol. 10, no. 01, p. 23, Mar. 2013.
[57] H. Kim, M. Kim, K. Lee, Y. Suh, J. Cho, and Y. Cho, “Context-Aware Server Framework for Network-based Service Robots,” 2006 SICE-ICASE Int. Jt. Conf., pp. 2084–2089, 2006.
[58] Y.-G. Ha, J.-C. Sohn, Y.-J. Cho, and H. Yoon, “Towards Ubiquitous Robotic Companion: Design and Implementation of Ubiquitous Robotic Service Framework,” ETRI J., vol. 27, no. 6, pp. 666–676, Dec. 2005.
[59] W. Wibisono, A. Zaslavsky, and S. Ling, “Improving situation awareness for intelligent on-board vehicle management system using context middleware,” IEEE Intell. Veh. Symp., pp. 1109–1114, Jun. 2009.

76
[60] A. Tarlano and W. Kellerer, “Context spaces architectural framework,” in 2004 International Symposium on Applications and the Internet Workshops. 2004 Workshops., 2004, pp. 702–708.
[61] E. Wang, Y. S. Kim, H. S. Kim, J. H. Son, S. Lee, and I. H. Suh, “Ontology Modeling and Storage System for Robot Context Understanding,” Knowledge-Based Intell. Inf. Eng. Syst., vol. 3683, pp. 922–929, 2005.
[62] T. Varvadoukas, E. Giannakidou, J. V. Gomez, and N. Mavridis, “Indoor Furniture and Room Recognition for a Robot Using Internet-Derived Models and Object Context,” Front. Inf. Technol., pp. 122–128, Dec. 2012.
[63] Princeton University, “„About Wordnet,‟” 2010. [Online]. Available: http://wordnet.princeton.edu. [Accessed: 03-Apr-2014].
[64] J. Choi, Y. Park, G. Lim, and S. Lee, “Ontology-Based Semantic Context Modeling for Object Recognition of Intelligent Mobile Robots,” Recent Prog. Robot. Viable Robot. Serv. to Hum., vol. 370, pp. 399–408, 2008.
[65] D. Nienhiiser, T. Gumpp, and J. M. Zollner, “A Situation Context Aware Dempster-Shafer Fusion of Digital Maps and a Road Sign Recognition System,” Intell. Veh. Symp. 2009 IEEE, pp. 1401–1406, 2009.
[66] C. Yi, I. H. Suh, G. H. Lim, and B.-U. Choi, “Bayesian robot localization using spatial object contexts,” 2009 IEEE/RSJ Int. Conf. Intell. Robot. Syst., pp. 3467–3473, Oct. 2009.
[67] T. Haidegger, M. Barreto, P. Gonçalves, M. K. Habib, S. K. V. Ragavan, H. Li, A. Vaccarella, R. Perrone, and E. Prestes, “Applied ontologies and standards for service robots,” Rob. Auton. Syst., vol. 61, no. 11, pp. 1215–1223, Nov. 2013.
[68] E. Prestes, J. L. Carbonera, S. Rama Fiorini, V. a. M. Jorge, M. Abel, R. Madhavan, A. Locoro, P. Goncalves, M. E. Barreto, M. Habib, A. Chibani, S. Gérard, Y. Amirat, and C. Schlenoff, “Towards a core ontology for robotics and automation,” Rob. Auton. Syst., vol. 61, no. 11, pp. 1193–1204, Nov. 2013.
[69] C. Schlenoff and E. Messina, “A robot ontology for urban search and rescue,” Proc. 2005 ACM Work. Res. Knowl. Represent. Auton. Syst. - KRAS ’05, pp. 27–34, 2005.
[70] R. Provine, M. Uschold, S. Smith, B. Stephen, and C. Schlenoff, “Observations on the use of ontologies for autonomous vehicle navigation planning,” Rob. Auton. Syst., 2004.

77
[71] A. Scalmato, A. Sgorbissa, and R. Zaccaria, “Describing and recognizing patterns of events in smart environments with description logic,” IEEE Trans. Cybern., vol. 43, no. 6, pp. 1882–97, Dec. 2013.
[72] F. Mastrogiovanni, a. Sgorbissa, and R. Zaccaria, “Context assessment strategies for Ubiquitous Robots,” 2009 IEEE Int. Conf. Robot. Autom., pp. 2717–2722, May 2009.
[73] W. Mou, M. Chang, and C. Liao, “Context-aware assisted interactive robotic walker for Parkinson‟s disease patients,” Intell. Robot. Syst., pp. 329 – 334, 2012.
[74] A. Hristoskova, C. E., M. Veloso, and F. De, “Heterogeneous Context-Aware Robots Providing a Personalized Building Tour,” Int. J. Adv. Robot. Syst., vol. 10, p. 13, 2013.
[75] Holos SA., “ServRobot,” 2014. [Online]. Available: https://sites.google.com/a/holos.pt/servroboten/. [Accessed: 30-Mar-2014].
[76] Arduino, “Arduino,” 2014. [Online]. Available: http://arduino.cc/. [Accessed: 20-Jul-2014].
[77] N. Seidle, “Weather Shield,” SparkFun Electronics, 2014. [Online]. Available: https://learn.sparkfun.com/tutorials/weather-shield-hookup-guide. [Accessed: 25-Aug-2014].
[78] L. Everlight Electronics Co., “Ambient Light Sensor Surface - Mount ALS-PT19 Datasheet.” 2013.
[79] Measurement Specialties, “HTU21D(F) Sensor Datasheet.” 2013.
[80] Freescale Semiconductor Inc., “MPL3115A2 Precision Altimeter Datasheet.” 2012.
[81] ADH Technology Co. Ltd., “GP-635T Datasheet.” 2012.
[82] HANWEI ELETRONICS CO.LTD, “MQ-2 Gas Sensor Datasheet.” .
[83] Open Source Robotics Foundation, “ROS,” 2014. [Online]. Available: http://www.ros.org/about-ros/. [Accessed: 19-Jun-2014].
[84] R. R. Bouckaert, E. Frank, M. Hall, R. Kirkby, P. Reutemann, A. Seewald, and D. Scuse, “WEKA Manual for Version 3-7-11,” 2014.

78
[85] S. Arlot and A. Celisse, “A survey of cross-validation procedures for model selection,” Stat. Surv., vol. 4, pp. 40–79, 2010.
[86] “Qt Creator 3.2 | Documentation | Qt Project,” 2014. [Online]. Available: http://qt-project.org/doc/qtcreator-3.2/index.html. [Accessed: 03-Sep-2014].
[87] P. Zhou, Y. Zheng, Z. Li, M. Li, and G. Shen, “IODetector: A generic service for indoor outdoor detection,” … Embed. Netw. Sens. …, 2012.
[88] P. Cingolani and J. Alcala-Fdez, “jFuzzyLogic: a robust and flexible Fuzzy-Logic inference system language implementation,” 2012 IEEE Int. Conf. Fuzzy Syst., pp. 1–8, Jun. 2012.
[89] W. HAMBY, “Ultimate Sound Pressure Level Decibel Table,” 2004. [Online]. Available: http://www.makeitlouder.com/Decibel Level Chart.txt. [Accessed: 22-May-2014].
[90] sengpielaudio, “Decibel Table - SPL - Loudness Comparison Chart.” [Online]. Available: http://www.sengpielaudio.com/TableOfSoundPressureLevels.htm. [Accessed: 25-May-2014].
[91] S. Mason and N. Graham, “Areas beneath the relative operating characteristics (ROC) and relative operating levels (ROL) curves: Statistical significance and interpretation,” Q. J. R. …, pp. 2145–2166, 2002.