context, capabilities, constraints, and costs for the
TRANSCRIPT

Context, Capabilities, Constraints, and Costs for the Provision of Ancillary Services by Hydropower AssetsNovember 2019
Stephen Signore Boualem Hadjerioua Brennan Smith Patrick O’Connor
ORNL/SPR-2019/1295

Acknowledgments
Special thanks to the internal and external reviewers that have helped with this report including Steve Wenke and Timothy Magee who provided valuable feedback.

Context, Capabilities, Constraints, and Costs for the Provision of Ancillary Services by Hydropower Assets
Stephen Signore Boualem Hadjerioua Brennan Smith Patrick O’Connor
November 2019
1 Executive Summary
2 The capability of hydropower assets to provide ancillary services are enabled and constrained by 3 facility and unit level attributes. The linkages between attributes, capabilities and ancillary 4 services are explored within. The current state of data availability through which one can discern 5 these attributes, capabilities, and services are also explored. At times, the historical provision of 6 services can be well informed despite the lack of adequate means of establishing the capability of 7 hydropower assets that do not currently participate in the provision of these services. Asset 8 owners and operators understand the means necessary for establishing specific capabilities. The 9 quantification of degradation costs ascribable to specific ancillary services and the installed
10 technology levels required to penetrate the market constrain the number of hydroelectric 11 facilities that choose to participate in the provision of each ancillary service.
iii
1 Acronyms and Abbreviations
2 ACE area control error3 AGC automatic generation control4 AVR automatic voltage regulator5 BES Bulk Electric System6 EIA US Energy Information Administration7 EUCG-HPC Electric Utility Cost Group Hydroelectric Productivity Committee8 FERC Federal Energy Regulatory Commission 9 GADS Generating Availability Data System
10 ISO/RTO independent system operator or regional transmission organization11 M&I municipal and industrial 12 NERC North American Electric Reliability Corporation13 PFR primary frequency response14 PLC programmable logic controller 15 PSH pumped storage hydropower16 RBA runner blade angle17 SCADA supervisory control and data acquisition18 USBR US Bureau of Reclamation19 WGO wicket gate opening20
21 Glossary
22 Black start service: The ability to be started without support from the system or to be designed 23 to remain energized without connection to the remainder of the system, with the ability to 24 energize a bus, meeting the transmission operator’s restoration plan needs for real and reactive 25 power capability, frequency, and voltage control [1].
26 Inertial response: the release or absorption of kinetic energy by the rotating masses of online 27 generation and load within an interconnection [2].
28 Nonspinning reserve: Generating reserve not connected to the system but capable of serving 29 demand within a specified time or interruptible load that can be removed from the system in a 30 specified time, usually 10 minutes, in most ISO/RTOs [1].
31 Primary frequency response: The immediate proportional increase or decrease in real power 32 output provided by generating units/generating facilities and the natural real power dampening 33 response provided by load in response to system frequency deviations. This response acts in a 34 manner consistent with stabilizing frequency [1].

iv
1 Secondary frequency response or AGC: The automatic adjustment of generation in a 2 balancing authority area from a central location to maintain the balancing authority’s interchange 3 schedule plus frequency bias. AGC might also accommodate automatic inadvertent payback and 4 time error correction [1].
5 Spinning reserve: Unloaded generation that is synchronized and ready to serve additional 6 demand within a specified time, usually 10 minutes in most ISO/RTOs [1].
7 Voltage control: An attempt to maintain desired voltage levels irrespective of the reactive power 8 required to do so [3].

v
Contents
Acknowledgments...........................................................................................................................................iExecutive Summary......................................................................................................................................iiiAcronyms and Abbreviations.........................................................................................................................vGlossary .........................................................................................................................................................vFigures...........................................................................................................................................................ix1.0 Energy and Water Context for Hydropower Assets............................................................................1.1
1.1 Power System Evolution as a Driver for Change .....................................................................1.11.2 Comparison of the Timescales of Energy and Water Systems .................................................1.2
1.2.1 Timescales Internal to Hydropower Systems ..............................................................1.41.2.2 Timescales External to Hydropower Systems .............................................................1.4
1.3 Power System Services Defined ...............................................................................................1.52.0 Hydropower Capabilities and Constraints...........................................................................................2.1
2.1 Contextual Attributes and Constraints of Hydropower Assets .................................................2.12.1.1 Local Attributes and Constraints .................................................................................2.42.1.2 Systemic Attributes and Constraints ............................................................................2.7
2.2 Design Attributes and Capabilities of Hydropower Assets ......................................................2.82.2.1 Large Inertial Constant ................................................................................................2.92.2.2 Reactive Power Control .............................................................................................2.102.2.3 Synchronous Condensing Mode ................................................................................2.102.2.4 Flexible Power Dispatch ............................................................................................2.112.2.5 Fast Cold Start-Up .....................................................................................................2.122.2.6 Fast Ramp Rate ..........................................................................................................2.142.2.7 Isolated Unit Start-Up ................................................................................................2.14
3.0 Provision of Power System Services by Hydropower Assets .............................................................3.13.1 Indicators and Metrics of Capabilities and Services .................................................................3.1
3.1.1 Start-Up Timing ...........................................................................................................3.13.1.2 Mileage Indicators .......................................................................................................3.23.1.3 Correlation Analysis of Power Output.........................................................................3.23.1.4 Synchronous Condensing Hours and Events ...............................................................3.23.1.5 Black Start Testing Events...........................................................................................3.3
3.2 Costs of Services Provided by Hydropower .............................................................................3.43.2.1 Hydraulic Impacts from Flexible Operations ..............................................................3.53.2.2 Mechanical Impacts of Flexible Operations ................................................................3.6
3.3 Data Gathering Initiatives .........................................................................................................3.64.0 References ...........................................................................................................................................4.1


vii
Figures
Figure 1. River and hydropower timescales and horizons. .........................................................................1.3Figure 2. System reliability [2]. ..................................................................................................................1.3Figure 3. Primary factors affecting hydropower operations. ......................................................................2.1Figure 4. Distribution of authorized uses for all federal multipurpose hydropower reservoirs..................2.5Figure 5. Cold start speeds for hydropower and natural gas generators (from EIA 860). ..........................3.1Figure 6. Availability trends in hydropower. ..............................................................................................3.3Figure 7. Distribution of black start resources by generation type. ............................................................3.3Figure 8. Distribution of black start units by NERC region. ......................................................................3.4
1.1
1 1.0 Energy and Water Context for Hydropower Assets
2 Operational flexibility is required to operate all grid systems in an economic and economic way 3 and the North American grid is no different. The current Bulk Electric System (BES) requires 4 properly balancing the risks of power outages and the costs of noneconomic operation to assure 5 grid stability and reliability. Flexible operation metrics including minimum and maximum 6 flows, ramp rates, reservoir elevation guidance, unit availability, and plant MW weighted 7 availability allow analysts to identify and quantify the constraints caused by all obligations on 8 hydro assets, whether they be environmental regulations, river network, or power plant 9 equipment capabilities and specifications. River drainage basin wide system forecasting would
10 allow plants to be optimized collectively to maximize the operational flexibility of the fleet as it 11 seeks to meet these more demanding grid objectives.
12 1.1 Power System Evolution as a Driver for Change
13 Power system operators balance supply with demand while meeting the evolving grid 14 opportunities and obligations. Power system challenges have changed over time. Until recent 15 years, when scheduling power generation, the accuracy of load demand for electricity was the 16 primary factor of uncertainty for generation schedules. Nowadays, even as load becomes more 17 controllable, generation has become much more complex with large amounts of variable wind 18 and solar energy, real time market opportunities, environmental requirements, abundant data, and 19 other pressures that increasingly force dispatch decisions into the final hours and minutes.
20 Power system operators need information from river schedulers to know exactly how much 21 hydraulic flexibility they might require in the next weeks, days, hours, minutes, and sometimes 22 seconds before a decision is made to bid this flexibility to the grid. New operational metrics are 23 needed to quantify system-wide operational flexibility because standard measures such as 24 start/stops and capacity factor, or MWh’s paint an incomplete picture. The new metrics can help 25 quantify the amount of operational flexibility for the grid and flexibility provided by each 26 facility.
27 Flexible operation, which includes the ability to quickly adjust the units power output and 28 economically function at off-peak efficiency loading points often involves varying the power 29 output in response to market and electric grid demands in the form of regulation and reserves. 30 Hydroelectric units are used to adjust their production to the remaining residual load profile on 31 the fly, which leads to an underestimation of true hydropower plant value on a day-ahead basis 32 when evaluating based on MW capacity or MWh generated. The future profitability of 33 conventional thermal and hydroelectric power plants has been subject to various studies in the 34 last few years. Some of the most important adverse effects of flexible operation occur because of 35 increased unit start-stops, operating the units at minimum or maximum power levels, and 36 specific to hydroelectric units is the operation of the units in regions of increased cavitation or 37 increased hydraulic instability more than base loaded units [4] [5]. Conventional hydropower 38 units are encountering a changing role in modern society’s energy supply. With increased need 39 for flexible operation, engineers and project managers are faced with challenging decisions to 40 address increased equipment degradation rates [6].

1.2
1 With its ability to manage large positive and negative power variations with very short response 2 times, pumped storage hydropower (PSH) is an energy storage technology capable of stabilizing 3 the BES. It accounts for 95% of total utility-scale electricity storage in the United States [7]. 4 With today’s fast growth of variable energy generation, mainly from wind and solar, the existing 5 PSH capacity is not large enough nor spread geographically enough to adequately provide all 6 ancillary service needs. Therefore, with the absence of additional PSH development to support 7 the growing renewable penetration, conventional hydropower projects could be used to provide 8 additional regulating capacity through modified turbine operation. Since these turbines were not 9 originally designed to operate beyond the design criteria damaging operating modes would
10 precipitate asset replacement costs at levels much sooner than original plant performance 11 expectations.
12 Traditionally, hydropower-generating companies have operated as traditional utilities, and the 13 focus was always the assurance of continued low-cost energy supply and long-term asset 14 management; therefore, the rehabilitation scope of work was often the restoration of mechanical 15 equipment and replacement of components. However, power system operations have changed 16 because of deregulation-privatization, globalization, and environmental requirements. The 17 priorities of electricity-generating companies and plant operation modes have adapted to these 18 new conditions, which in turn has led to modifications in functional requirements for 19 rehabilitation projects. Grid resilience is a major technical issue resulting from changes in the 20 generating mix of the BES and the necessary provision of ancillary services.
21 1.2 Comparison of the Timescales of Energy and Water Systems
22 Energy-water systems involve several interrelated factors that influence hydropower operations 23 and planning and that affect the surrounding ecosystem. Factors outside the control of 24 hydropower operators can be broadly categorized as electric power infrastructure, water 25 management and hydrology, and ecological and environmental factors, and these factors affect 26 the energy-water system across different timescales as shown in Figure 1. Over time, these 27 factors fluctuate as they interact with each other and respond to changing water conditions. 28 Examples include increased energy demand, precipitation and runoff variation, and individual 29 organism response. When considering these factors, it is important to understand the timescales 30 across which they influence or respond to changing water conditions to (1) understand opposing 31 forces that constrain, enable or demand flexibility from hydropower (2) understand the 32 timeframe required before impacts can adequately be measured.

1.3
1
Precipitation, Runoff, and Unregulated Flow Variability
Pool (Elevation) Variability
Temperature and Water Quality Variability
Individual Organism Response & Growth
Population Response & Growth
Community Response
Landscape & Riverscape Adj.
Turbine, Gate, and Flow Dynamics
Power System Dynamics
Water Demand & Competing Use Variability
Automated Controls
Real-Time Scheduling
Short-Term Planning
Long-Term Planning
Hydrologic Variability
Ecological Variability
Equipment & Use Variability
Decision-Making Processes
Regulatory & Policy Evolution?
2 Figure 1. River and hydropower timescales and horizons that impact hydropower operations.
3 To understand with whom the onus for change belongs, it is important to distinguish between the 4 variability internal to hydropower units and facilities, and the external variability from the 5 surrounding power system and surrounding reservoir and habitat. Figure 2 is a representation of 6 the timescales of internal and external sources of variability in hydropower operations, dispatch 7 and planning. The next two subsections will discuss Figures 1 and 2 by distinguishing between 8 the timescales internal and external to hydropower systems.
910 Figure 2. System reliability [8].
1.4
1 1.2.1 Timescales Internal to Hydropower Systems
2 Inertial response and frequency regulation: These short-term response capabilities of 3 conventional generating facilities occur in the subsecond to multisecond range and balance 4 power supply and demand without manual action. Hydropower operators have no option to 5 withhold electromechanical and inertial responses operating in the subsecond range. The 6 operators can vary governor droop settings, but when connected to an independent system 7 operator or regional transmission organization (ISO/RTO), the droop settings are specified so 8 that all units equally share the burden of primary frequency response (PFR).
9 Provision of automatic generation control (AGC) and reserves: Automated controls are 10 set by the utility to help restore the grid to the optimal frequency through load following. The 11 AGC software corrects for area control error (ACE) by sending optimized setpoints to 12 generating resources.
13 Planning processes: Short-term planning for hydropower is focused on meeting 14 multipurpose objectives and maximizing revenue. Long-term planning includes asset 15 rehabilitations, integrated resource plans, and capacity markets.
16 Equipment and use variability: Turbine, gate, and flow dynamics are governed to minimize 17 damaging effects, such as water hammer effects of pulsating flows when opening or closing a 18 gate and cavitation effects resulting from negative pressures. Water demand from competing 19 uses and hydrologic variability impact the availability of water for power generation.
20 Unit Outages: Planned and unplanned outages significantly impact the availability of units 21 to provide to the system and participate in the energy market. Outages that are known in 22 advance impact planning, and outages that occur from a failure in service impact operations.
23 1.2.2 Timescales External to Hydropower Systems
24 Ecological variability: Water demand is constantly evaluated for competing uses such as 25 recreation, navigation, irrigation, water supply and flood control, and fish health. These can 26 drive constraints on reservoir level, flow rate, water temperature, dissolved oxygen content, 27 and total dissolved gas content.
28 Hydrologic variability: Changing hydrologic conditions important to hydropower include 29 reservoir elevation, temperature, and water quality variability both in the reservoir and 30 downstream of the dam. The variability of temperature and water quality metrics must be 31 carefully tracked and give rise to actions including power generation and spill flows. 32 Variability occurs on timescales ranging from seconds—for precipitation and runoff 33 estimates—to decades—for increased frequency of extreme weather events particularly flood 34 and drought periods as a consequence of climate change—and affect the quantity of water 35 available in the hydrologic system [9]. Adjustments to the landscape, riverscape, and planned 36 water releases can impact the sojourn time between reservoirs, which in turn can affect the 37 scheduling process for run-of-river facilities in a shared river system.
38 Protective relays: Located at hydroelectric facilities and other generating sources and 39 transmission facilities, protective relays can cause variability on the power system if they are

1.5
1 triggered by damaging grid conditions. Their response rate represents the smallest timescale 2 because they are designed to break electrical circuits if abnormal conditions are detected. 3 Damaging grid conditions can be responded to within 3-5 ac cycles by fast breakers.
4 Variable energy resource deviations: Power deviations external to the hydropower facility 5 that activate the internal demand response measures of regulation and spinning and 6 nonspinning reserves. Variable energy sources have introduced greater uncertainties into 7 forecasting of energy supply and demand than were previously apparent. Wind and solar 8 generating sources continue to grow their market share, but because they are nondispatchable 9 sources the ISO/RTO’s have required additional spinning and nonspinning reserves to
10 compensate for the increased uncertainty.
11 Area Control Error (ACE): the “mismatch in meeting a Balancing Authority’s internal 12 obligations, along with the small additional “bias” obligation to maintain frequency” [10].
13 Service Restoration: In Figure 2, this refers to black start services that enable system 14 restoration in the event of catastrophic grid events that result in a grid outage.
15 Dispatch and scheduling: Real-time and day-ahead procurement of energy and ancillary 16 services are subject to a variety of attributes that impact the capability of hydropower units to 17 provide services at certain timescales. Though the dispatch and scheduling of hydropower 18 units occurs externally in the greater context of the BES to the hydropower unit, the dispatch 19 of the hydropower unit results in variability at timescales internal to the hydropower unit. 20 Among these are water hammer effects and rough zones that impact the timing of the start-21 stop sequence. External sources of variability such as hydraulic head as a result of 22 uncontrolled reservoir inflows, seasonal flow requirements for non-power benefits, and 23 external constraints of maximum and minimum rates of change on flow and elevation impact 24 demand response and unit dispatch. External to the hydropower system, seasonal changes 25 impart variation on power demand as shown in day-ahead markets where the majority of 26 dispatch decisions are made. Multiple years of demand data are used to determine the 27 required hydraulic and generating capacity. External variation, particularly net demand 28 forecasting errors are realized, and additional generating capacity is dispatched in the hourly 29 markets.
30 System planning: Capacity studies are a yearly exercise to ensure there is adequate 31 generating capacity within each ISO/RTO to meet the peak demand experienced in the 32 previous year [3]. Transmission and distribution planning is a multiyear process that ensures 33 new consumers and new generating facilities are serviced while upgrading current assets to 34 higher voltages to reduce transmission losses. More recently, the multidecade planning 35 efforts to address carbon goals incorporates capacity uprates for existing hydropower 36 facilities and the development of nonpowered dam and new stream reaches for hydropower 37 generation.
38

1.6
1 2.0 Hydropower Capabilities and Constraints
2 Specific hydropower capabilities, as enabled by unit and facility attributes, are necessary to 3 enable the provision of specific grid services. Attributes can either enable a capability or impose 4 a constraint on a capability. Likewise, multipurpose benefits, in the form of water management 5 objectives, can constrain the capabilities of hydroelectric unit operations by limiting the dispatch 6 of the unit or by restricting a facility from providing a specific service altogether. Hydropower 7 operations require careful management to meet power demands while meeting potential 8 multipurpose benefits, particularly the environmental regulation requirements and possible 9 competing water uses that are a part of the plant’s FERC license. The following discussion is
10 meant to aid the reader in making connections between attributes, capabilities, services, and the 11 multipurpose functions of dams.
12 2.1 Contextual Attributes and Constraints of Hydropower Assets
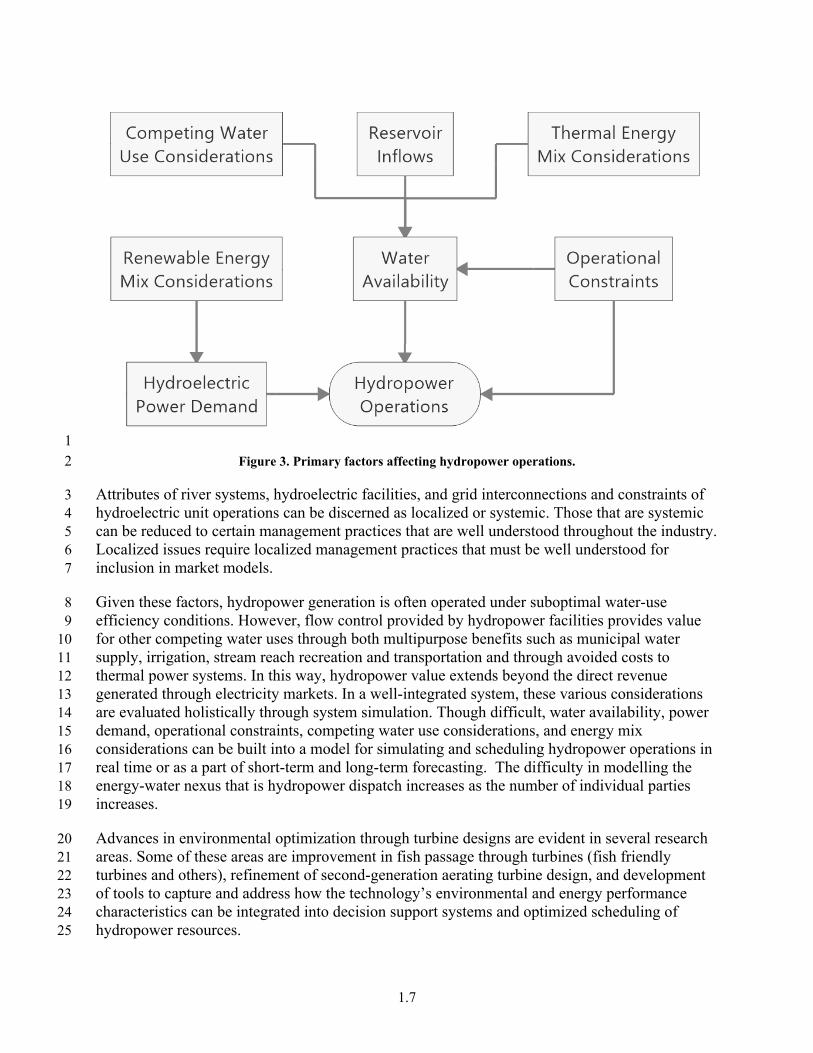
13 Integrated system optimization by grid operators involves the minimization of the total cost to 14 provide power generation (thermal-nuclear-gas-hydro-solar-wind) to meet demand rather than 15 the optimization of the hydro system exclusively. Idealized hydropower operations include 16 optimized reservoir flow releases with a goal of maximizing revenue such as generating power at 17 times of peak demand. The optimal dispatch of hydropower units changes once integrated into 18 the larger grid for various reasons, which could include the factors shown in Figure 3. 19 Competing water use considerations impact the amount of available water in specific seasons. 20 Operational constraints impact the ramp rate of the unit and therefore the changes in water 21 availability. Historically energy mixes that include nuclear, which covers base loads, demand 22 different hydropower operations than those with significant hydropower contributions. More 23 recently the increasing penetration of non-dispatchable renewables demands a different set of 24 hydropower operations as well. These differing local grid mixes result in the reality that even if 25 two hydropower facilities have similar attributes, constraints, and capabilities the hydropower 26 units may be operated quite differently.
1.7
12 Figure 3. Primary factors affecting hydropower operations.
3 Attributes of river systems, hydroelectric facilities, and grid interconnections and constraints of 4 hydroelectric unit operations can be discerned as localized or systemic. Those that are systemic 5 can be reduced to certain management practices that are well understood throughout the industry. 6 Localized issues require localized management practices that must be well understood for 7 inclusion in market models.
8 Given these factors, hydropower generation is often operated under suboptimal water-use 9 efficiency conditions. However, flow control provided by hydropower facilities provides value
10 for other competing water uses through both multipurpose benefits such as municipal water 11 supply, irrigation, stream reach recreation and transportation and through avoided costs to 12 thermal power systems. In this way, hydropower value extends beyond the direct revenue 13 generated through electricity markets. In a well-integrated system, these various considerations 14 are evaluated holistically through system simulation. Though difficult, water availability, power 15 demand, operational constraints, competing water use considerations, and energy mix 16 considerations can be built into a model for simulating and scheduling hydropower operations in 17 real time or as a part of short-term and long-term forecasting. The difficulty in modelling the 18 energy-water nexus that is hydropower dispatch increases as the number of individual parties 19 increases.
20 Advances in environmental optimization through turbine designs are evident in several research 21 areas. Some of these areas are improvement in fish passage through turbines (fish friendly 22 turbines and others), refinement of second-generation aerating turbine design, and development 23 of tools to capture and address how the technology’s environmental and energy performance 24 characteristics can be integrated into decision support systems and optimized scheduling of 25 hydropower resources.

1.8
1 Within a diverse energy-water system, hydropower operations compete with other water 2 demands such as water supply, cooling water for thermoelectric facilities, and lake water levels. 3 An entire river system can be managed by the same or different entities. Managing water 4 resource constraints on the same or adjoining river networks has the potential to adversely affect 5 or positively benefit various aspects of energy and water resources and operation in and along 6 the river drainage system. The spatial and temporal consideration of competing demands for 7 water quantity and quality with imposed constraints at various locations along a river makes for a 8 complex system. Managing the complex nexus of energy, water, and ecological systems to 9 achieve optimized value requires careful planning, forecasting, and coordinated operation. The
10 following subsections describe how hydropower operations within the broad context of a 11 complex and integrated river system are crucial for meeting overall energy-water objectives.
12 Impounding reservoirs that provide energy in storage are often referred to as multipurpose 13 reservoirs because they are consistently and reliably meeting the diverse needs of both 14 competing and complementary stakeholders. Valuation of a multipurpose project as a whole 15 should incoporate quantifiable economic benefits of each purpose. This is most readily achieved 16 for energy-related services. Monetization is achieved through a market-driven pricing 17 mechanism when power is generated and sold in a regulated market. Ancillary service benefits 18 are also clearly identified, as their economic contributions to electric power markets have been 19 isolated and quantified since the Energy Policy Act of 1992. Many nonenergy-related benefits, 20 on the other hand, are often overlooked in the context of hydropower multipurpose reservoir use. 21 When these benefits are monetized, their economic value often surpasses that of power 22 generation, contributing substantially to local economies and affecting millions of people as the 23 Corps estimated a flood damage reduction of $19.6 billion from 1998-2007 [11].
24 Operating policies for multireservoir systems must specify the released flow from each reservoir 25 and the total release flow from the system. Such operating rules usually consider the water 26 balance of the system and the impacts on the various users of water flows and storage volumes. 27 For multireservoir systems, operating policies that define the individual reservoir releases as a 28 function of the existing total system storage volume as well as the individual reservoir storage 29 volumes clearly define the actions to be taken at any time and for any state of the system. System 30 release rules typically indicate the total release to be made from the reservoir system as a 31 function of the water available in the system and the time of year. A comparison of the individual 32 reservoir storage targets to the actual storage volumes in each reservoir identifies which 33 reservoirs should release water and which should not release water to meet the total system 34 release target. Having both system-wide release functions as well as individual reservoir storage 35 volume target functions defines a multireservoir operating policy that permits the coordinated 36 operation of the entire system.
37 At a basic level, hydropower operations must ensure that multiple operational constraints are 38 met. Example constraints can include dam safety requirements, water levels upstream and 39 downstream of a dam, temperature and other water quality metrics within a body of water, 40 minimum or maximum flow releases, and so on. Related to water use, many water bodies service 41 a broad network of energy systems where water services a diverse energy mix including both 42 hydropower and thermal power plants. Since thermal power plants (i.e., nuclear and fossil) 43 require large volumes of cooling water, thermal demands and flow availability might necessitate

1.9
1 hydropower flow releases under suboptimal conditions. The relative scale of hydropower and 2 thermal plant capacities could influence operational priorities for meeting power demand.
3 The daily schedules for water releases from each dam, including the rate and total quantity of 4 water to be released to achieve the multiple purposes of the reservoir system (flood damage 5 reduction, navigation, power production, water quality, water supply, and recreation) are 6 developed using advanced computer models, rainfall, and stream-flow gauges. These schedules 7 consider the total amount of water stored in the reservoir system, the time it takes to move water 8 through the system, and other reservoir-specific factors such as storage capacity and seasonal 9 operating guides.
10 The challenge is that tradeoffs between environmental, water, and energy objectives are often 11 treated within a single reservoir only. Environmental optimization should be aimed at improving 12 the capabilities of entire ecosystem. Environmental benefits and cumulative impacts should be 13 combined and optimized with all the multipurpose functions for a system of reservoirs.
14 2.1.1 Local Attributes and Constraints
15 Localized attributes vary significantly from site to site based on geographic, riverine, and 16 biological conditions. They must be accounted for during the design process so that the best 17 solution can be chosen during the design process. In some cases, local constraints on water 18 availability and water delivery oppose grid needs and constrain economic optimums at 19 hydropower facilities. Throughout the day, adjustments in water release schedules are made in 20 response to ever-changing weather conditions, fluctuations in power demand, and river system 21 nonscheduled emergencies. Releases from multipurpose dams must be adjusted frequently to 22 optimize water use. Although many reservoir systems in the United States are operated within 23 specified zones or pool levels, river operation schedulers are authorized to make the best 24 decision based on up-to-the-minute assessments of current and expected conditions and needs.
25 The requirements that impose constraints on hydropower operations can collectively be referred 26 to as multipurpose benefits. The US federal fleet, composed of the US Army Corps of Engineers, 27 US Bureau of Reclamation (USBR), and the Tennessee Valley Authority, includes 157 powered 28 dams and accounts for nearly half of the total installed hydropower capacity in the United States. 29 Most of these dams and their associated reservoirs are authorized for more than one purpose in 30 addition to hydropower generation (Figure 4, left). These purposes include hydropower, 31 navigation, flood control, recreation, irrigation, and municipal and industrial (M&I) water 32 supply.

1.10
12 Figure 4. Distribution of authorized uses for all federal multipurpose hydropower reservoirs. On the left in a 3 circle at the end of each bar is shown the percentage of multipurpose hydropower reservoirs authorized for each 4 respective additional purpose. On the right is shown the frequency distribution of authorized uses based on installed 5 hydropower capacity [12].
6 Typical river operations of an integrated system with multipurpose hydropower reservoirs and 7 thermal power plants requires vigilance in forecasting, scheduling, and operation of the system to 8 meet all the demands and all the environmental requirements of the entire system. River 9 schedulers monitor weather conditions and water quality data, as well as water availability and
10 power demand. The goal of the operations teams at public hydroelectric utilities is to route water 11 through the river system to provide the most public value given changing weather conditions, 12 water needs, and power demand.
13 The multipurpose benefits attributable to each facility can be mapped to the constraints they 14 impose on hydroelectric facilities, as shown in Table 1. Municipal and Industrial (M&I) water 15 supply and irrigation are water use priority that diverts flows away from power generation and 16 depending on the location of the withdrawal system will require a minimum reservoir pool 17 elevation. Recreation on the upstream reservoir can limit usable reservoir storage as it requires a 18 specific range of pool elevation for access to boat docks. Downstream stream reach recreation 19 can impose constraints on the ramp rate and max flow for fisherman safety. Flood control 20 imposes constraints on the reservoir pool elevation. Navigation imposes minimum reservoir pool 21 elevation and minimum flows to require safe navigation and maximum pool elevation to ensure 22 that the navigational lock is useable. Max ramp rates allow for safe and navigable waters. Fish 23 and wildlife impose constraints on minimum flows to prevent fish from being stranded in certain 24 stream reaches and constraints on ramp rates to maintain wetted areas for spawning habitats. 25 Benefits to thermal power plants are not included in this study but are a function of system 26 operator triage.
27 The multipurpose benefits of hydropower can constrain the facility’s capability to provide 28 specific ancillary services. These relationships are explored in Table 1. Minimum flow 29 requirements impact flexible power dispatch capabilities by providing water constraints in future 30 time horizons that could prevent the ability for a hydro unit to use additional water to deliver its
13%
76%
32%
27%
58%
38%

1.11
1 full capacity. This relationship is not well understood because of the dependencies on reservoir 2 residence time and the predictability of future precipitation events. Maximum ramp rates 3 constraints at facilities are imposed to discourage bank erosion and assist the biota of the river as 4 the depth of the downstream stream reach could rise and fall rapidly if unconstrained. These 5 ramp rate constraints prevent the flexible dispatch by preventing the unit to quickly deliver the 6 capacity that may be needed.
7 Table 1. Constraints on hydropower capabilities from multipurpose benefits
Constraints involved
Multipurpose benefits Water use priorities
Min pool elevation
Max pool elevation
Min flow
Max ramp rate
Max Flow
M&I water supply
Irrigation
Reservoir recreation
Stream reach recreation
Seasonal flood control
Navigation
Fish and wildlife
Capabilities constrained Water use priorities
Min pool elevation
Max pool elevation
Min flow
Max ramp rate
Max Flow
Large inertial constantReactive power control
Synchronous condensing mode
Fast cold start-up
Flexible power dispatch
Fast ramp rate
Isolated Unit start-up
8 well-understood relationship; relationship exists, not well understood; possible relationship.9
10 Localized attributes other than multipurpose benefits include the width of the turbine efficiency 11 band, the water conveyance design, air suppression system, computer-based controls, and on-site 12 diesel generators. Each of these attributes plays an important role in the determination of 13 whether, or to what extent, a hydropower unit has specific capabilities. The multipurpose 14 benefits discussed then impose constraints at the local level. Taking the constraints from Table 1 15 and the attributes from Table 2 to understand the capabilities of hydropower units, one can then 16 determine the extent to which the unit can provide each service to the system operator, as shown 17 in Table 2. Hydropower attributes and
18 Width of the turbine efficiency band: This attribute refers directly to the range of efficient 19 power outputs a unit can provide. Typically, Kaplan turbines with their adjustable blades 20 offer a wider efficiency band than other turbine types. This attribute governs flexible dispatch 21 capability as small turbine efficiency bands incur greater opportunity costs for operating 22 away from peak efficiency.

1.12
1 Water conveyance design: The length of the water conveyance and intake structure directly 2 affects transient pressures that occur during starts, stops, and ramp events. These transient 3 pressures, of which the water hammer effect is the most notable, must be properly managed 4 and offer lower limits to the ramp rate and start-up times. On the timescale of a 10-minute 5 start, the water hammer effects are minimal but must be given time to adequately dissipate.
6 Air suppression system: This unit-level technology enables synchronous condensing 7 capabilities by allowing the unit to suppress the water below the turbine. With closed gates, 8 this allows the turbine to spin with only air friction.
9 Computer-based controls: The ability to control power dispatch with computer-based 10 controls rather than manual operation allows for increased flexible dispatch as it reduces the 11 time spent on the decision-making process. This is key to flexible operation of generating 12 units as it is necessary for multiple services that hydropower can provide. This attribute is not 13 the same as remote operation, which has cost reduction benefits but does not factor in the 14 capabilities discussed herein. Computer-based controls can reduce the time required to make 15 and implement dispatch decisions.
16 On-site diesel generators: This facility-level attribute allows for isolated unit start-up of a 17 single unit at the facility. Once the first unit is restored, it can provide the power necessary to 18 facilitate starting the rest of the units at the facility. Though the number of diesel generators 19 housed at a facility is chosen based on the several requirements, it needs to only include the 20 power requirements to start one unit to enable the facility’s capability. This is independent of 21 which unit of the facility is chosen because it is a facility-level attribute.
22 Table 2. Hydropower attributes and capabilities
Capabilities
AttributesLarge
inertial constant
Reactive power control
Synch. Cond. mode
Flexible power
dispatch
Fast cold start-up
Fast ramp rate
Isolated unit start-
upRated speed
Turbine/generator physical design
parameters
Uni
t-le
vel
desi
gn
Wide efficiency band
Air suppression system
Governor controls
Uni
t-le
vel
Tec
hnol
ogy
Automatic voltage regulator
Energy in storage
Reservoir elevation flexibility
Water conveyance design
Computer-based controls Faci
lity
leve
l
On-site diesel generator
well-understood relationship; relationship exists, not well understood; possible relationship.

1.13
1 2.1.2 Systemic Attributes and Constraints
2 Systemic attributes are imposed on units and facilities and are not easily altered outside of a 3 redesign of the turbine-generator system. When taken in harmony with the local attributes and 4 multipurpose benefits of the facility, operators can determine the capabilities of the unit that 5 enable the provision of system services.
6 Energy in storage: The stored potential energy impounded by a dam, also termed active 7 storage. This affects both the maximum efficient load and maximum sustainable load that 8 must be used instead of nameplate capacity when incorporated into a market structure.
9 Reservoir elevation flexibility: Attribute that can vary seasonally as utilities prepare for 10 winter flood control elevations and summer recreation pool elevations. Quantifying reservior 11 elevation flexibility enables a direct comparison of the ability of a facility to shift power 12 output to the most economical parts of the day. Utilities that manage integrated river systems 13 incorporate reservoir guide curves into the model structure as constraints that inherently limit 14 the available flexibility. The looser the constraints, the more capable the facility is of 15 operating flexibly.
16 Rated speed: The speed at which the unit rotates when synchronized to the grid. This angular 17 velocity is one aspect calculating the kinetic energy of the rotating mass and the total inertia 18 of the generating unit.
19 Physical design parameters: Turbine and generator design parameters, which are crucial in 20 the determination of the unit’s distribution of mass relative to the rotating axis. This has a 21 direct effect on the moment of inertia. Specific turbine types abide by specific geometric 22 distributions of mass, but the generator’s distribution of mass varies only with generator size.
23 Automatic voltage regulator (AVR): Automatically maintains generator voltage output. This 24 attribute enables dynamic reactive power control and synchrounous condensing mode. It is 25 also necessary for isolated unit start-ups and is crucial in providing system stability when 26 units operate in flexible power dispatch.
27 Governor controls: Mechanical, analog or digital electronic controls that convert electrical 28 signals to mechanical attributes which adjust gate openings to provide frequency control and 29 meet power requirements. Governor controls are necessary for a wide variety of capabilities. 30 Poor governor controls can lead to hunting, an unstable condition in which the governor 31 cannot maintain frequency at an acceptable level when operating off-line. Some movement 32 of the wicket gates and frequency wander is normal for a mechanical governor, but if the 33 frequency wander exceeds 0.2 Hz peak to peak or if the automatic synchronizer cannot put 34 the unit online, it is considered excessive.
35 2.2 Design Attributes and Capabilities of Hydropower Assets
36 The services hydropower can provide can be classified as bulk energy services, ancillary 37 services, or grid stabilizing services. Table 3 documents the connection between capabilities and

1.14
1 these services. Unit and facility attributes provide specific capabilities that either enable or lower 2 the cost of the provision of services and products relative to other generating sources. Inherent 3 and installed attributes therefore allow hydropower to be an integral part of the modern electric 4 grid.
5 The capability of hydropower to provide bulk energy services of active power generation and 6 firm capacity is well known, although it is dependent on variations in annual precipitation as 7 discussed in previous case studies and those constraints which have been presented. As such, the 8 focus here is on the ancillary services provided to the electric grid that facilitate and support the 9 continuous flow of electricity to reliably and continuously integrate resources and meet demand.
10 This report covers the capabilities required to provide the inherent “must give” grid stabilizing 11 benefits of inertial response and primary frequency control as well as the ancillary services of 12 secondary frequency response, voltage support, spinning and nonspinning reserves, and black 13 start operations.
14 Hydropower’s long-term availability provides adequate capacity to swiftly back up intermittent 15 power sources. The utility’s and unit’s “ability to react and provide the needed services will 16 determine which technology will primarily act as back-up to variable renewables. In some 17 market this will be done by natural gas-fired generators; however, when available, “hydropower 18 with large storage capacities will be the preferred choice” [13]. Hydropower plants with storage 19 have large volume capability to handle excess wind generation; pumped storage has smaller 20 storage volumes but high-power capacity.
21 Table 3. Hydropower capabilities that enable or assist in the provision of services and products
22 2.2.1 Large Inertial Constant
23 In conventional synchronous generators (i.e. steam turbines, gas turbines, hydro turbines, etc.), 24 inertia is created when the rotating mass gains speed and is a function of how the mass is 25 distributed around the axis of rotation, the mass itself, and the rotational speed of the component.
Services or
products
Large inertial
constant
Reactive power control
Synch. Cond. mode
Flexible power
dispatch
Fast cold start-up
Fast ramp rate
Isolated unit
start-up
Inertial support
Mus
t gi
ve Primary Frequency Response
Voltage control
Secondary Frequency Response
(AGC)
Spinning reserves
Nonspinning reserve C
hose
n to
pro
vide
Black start
well-understood relationship; relationship exists, not well understood; possible relationship.
1.15
1 The kinetic energy in the form of inertia spontaneously compensates for momentary deviations 2 in load, thereby accelerating or decelerating the rotating machinery. Many generating types, 3 excluding solar power, can provide inertia by using the turbine and generator connected through 4 the shaft as the rotating mass.
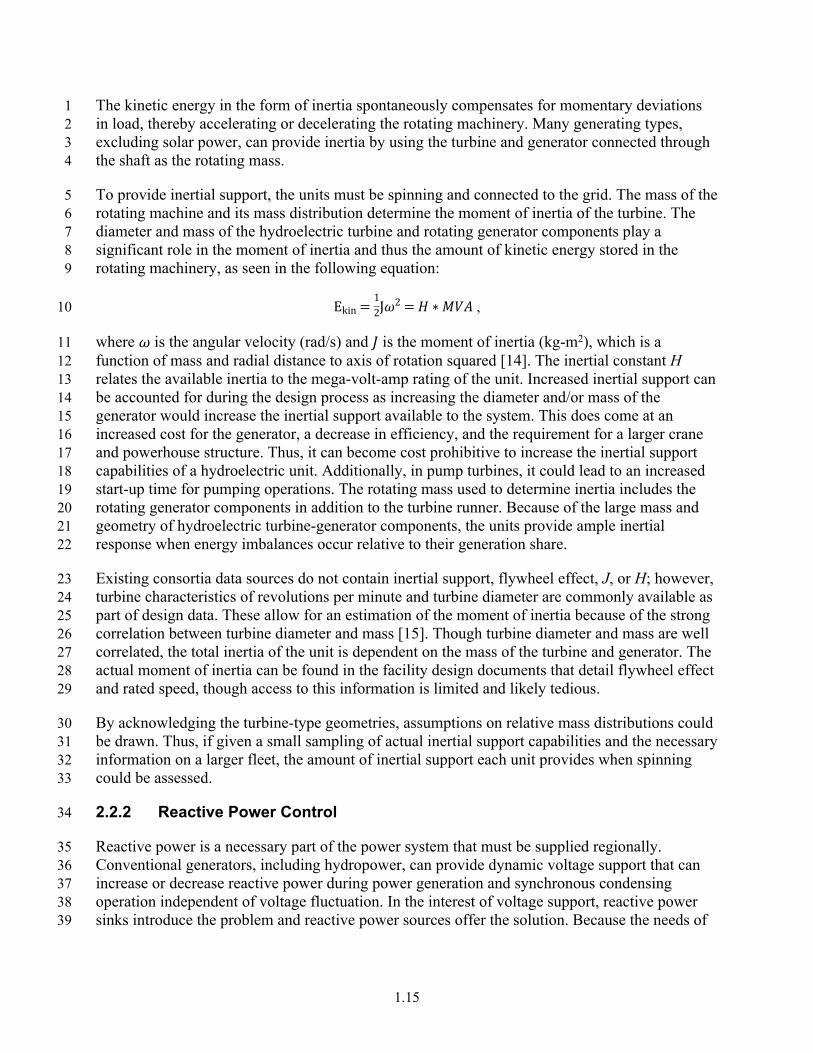
5 To provide inertial support, the units must be spinning and connected to the grid. The mass of the 6 rotating machine and its mass distribution determine the moment of inertia of the turbine. The 7 diameter and mass of the hydroelectric turbine and rotating generator components play a 8 significant role in the moment of inertia and thus the amount of kinetic energy stored in the 9 rotating machinery, as seen in the following equation:
10 ,Ekin =12J𝜔2 = 𝐻 ∗ 𝑀𝑉𝐴
11 where is the angular velocity (rad/s) and is the moment of inertia (kg-m2), which is a 𝜔 𝐽12 function of mass and radial distance to axis of rotation squared [14]. The inertial constant H 13 relates the available inertia to the mega-volt-amp rating of the unit. Increased inertial support can 14 be accounted for during the design process as increasing the diameter and/or mass of the 15 generator would increase the inertial support available to the system. This does come at an 16 increased cost for the generator, a decrease in efficiency, and the requirement for a larger crane 17 and powerhouse structure. Thus, it can become cost prohibitive to increase the inertial support 18 capabilities of a hydroelectric unit. Additionally, in pump turbines, it could lead to an increased 19 start-up time for pumping operations. The rotating mass used to determine inertia includes the 20 rotating generator components in addition to the turbine runner. Because of the large mass and 21 geometry of hydroelectric turbine-generator components, the units provide ample inertial 22 response when energy imbalances occur relative to their generation share.
23 Existing consortia data sources do not contain inertial support, flywheel effect, J, or H; however, 24 turbine characteristics of revolutions per minute and turbine diameter are commonly available as 25 part of design data. These allow for an estimation of the moment of inertia because of the strong 26 correlation between turbine diameter and mass [15]. Though turbine diameter and mass are well 27 correlated, the total inertia of the unit is dependent on the mass of the turbine and generator. The 28 actual moment of inertia can be found in the facility design documents that detail flywheel effect 29 and rated speed, though access to this information is limited and likely tedious.
30 By acknowledging the turbine-type geometries, assumptions on relative mass distributions could 31 be drawn. Thus, if given a small sampling of actual inertial support capabilities and the necessary 32 information on a larger fleet, the amount of inertial support each unit provides when spinning 33 could be assessed.
34 2.2.2 Reactive Power Control
35 Reactive power is a necessary part of the power system that must be supplied regionally. 36 Conventional generators, including hydropower, can provide dynamic voltage support that can 37 increase or decrease reactive power during power generation and synchronous condensing 38 operation independent of voltage fluctuation. In the interest of voltage support, reactive power 39 sinks introduce the problem and reactive power sources offer the solution. Because the needs of

1.16
1 the reactive power sinks vary constantly, reactive power controls are necessary to properly 2 respond to this changing demand.
3 Automatic voltage regulators (AVR) at hydroelectric facilities enable reactive power control. 4 The AVR works in combination with governor speed controls to adjust real and reactive power 5 output to compensate for reactive power needs in the most effective way possible. The capability 6 of hydropower to provide dynamic reactive power controls during synchronous condensing 7 mode also separates it from other conventional generators as this capability is no longer tethered 8 to real power generation.
9 2.2.3 Synchronous Condensing Mode
10 Grid voltage and power quality is regulated through reactive power dispatch in conjunction with 11 active power dispatch. Conventional generators provide reactive power during power generation 12 and synchronous condensing operation. Synchronous condensing operation increases grid 13 stability by providing additional inertial and voltage support without the use of water or other 14 fuel. For hydro units, synchronous condensing operation requires plant modifications including a 15 control system and air compressors that enable the unit to blow down water 3 ft below the 16 turbine runner [16].
17 Since reactive power is a localized issue, support from hydroelectric facilities in remote areas is 18 essential to grid stability. And because hydroelectric units do not typically generate power during 19 all hours of the year, synchronous condensing operation allows hydroelectric units to provide 20 valuable reactive power and inertial support without using water stored in the reservoir.
21 Recent fatigue stress tests of Francis turbines use the number of condensing events rather than 22 the total condensing hours to estimate the incurred degradation [5]. The Generating Availability 23 Data System (GADS) stores this information but the blinded nature of the GADS data allows 24 only for national trends to be ascertained.
25 2.2.4 Flexible Power Dispatch
26 The dispatchability of hydropower is the key capability that traditional variable renewables lack. 27 This is primarily enabled by the energy in storage that hydropower reservoirs provide to 28 hydroelectric facilities. Though wind and solar can be selectively withheld at an economic cost, 29 they cannot be purposefully dispatched to their max capacities as can hydroelectric units. The 30 width of a turbine’s efficiency band increases the flexibility of the hydroelectric unit’s power 31 dispatch by enabling larger ranges of efficient operations that other conventional sources cannot 32 match. Though usually achieved by adjustable blade Kaplan turbines, other turbine types can 33 achieve wider bands if peak efficiency is sacrificed during the design stage.
34 The amount of sustained flexible power dispatch that hydropower facilities can provide is 35 dependent on the current reservoir head, the acceptable range of available head for that reservoir 36 at that time of year, and expected water inflows. Flexibility can be accomplished at run of river 37 facilities through combined optimization with upstream peaking facilities [17]. As a reservoir 38 approaches maximum elevation, inflexible operations occur to prevent spill to provide necessary 39 room for inflows. As the reservoir approaches minimum elevation operations might be 40 constrained to ensure that environmental flows can be met.

1.17
1 Because 74.91% of conventional hydropower facilities report start times of 10 minutes or less, 2 the actual start-stop process including achieving speed-no-load and navigating turbine rough 3 zones rarely constrains unit dispatch. Consequently, hydropower with flexible reservoir elevation 4 goals can follow major variations on multiple timescales with regulation and reserves. As non-5 dispatchable renewables displace higher-cost generation, the responsiveness of hydropower 6 becomes more critical to grid resilience. Penetration of non-dispatchable renewables will shift 7 the mode of operation for base-loaded hydropower to favor flexible operation of the 8 hydroelectric facility whenever possible. This can increase the available spinning reserves by 9 operating in part-load mode even though the reliability impacts are currently unclear [18].
10 In the selection of black start resources, fast-start and isolated-start capabilities are necessary. 11 Flexible power dispatch of hydroelectric units is also integral to system restoration, though not 12 necessarily black start capability as it is necessary for the grid operator to be able to quickly 13 balance power dispatch when restore system services. By increasing the width of the efficiency 14 band, part-load operations become more economical as the range to provide up and down 15 regulation and reserves increases which also benefits the system restoration process. However, if 16 the turbine will be operating below the vortex-free zone of the hill chart increased degradation 17 could occur.
18 To provide AGC, units must be capable of quickly providing both up and down regulation. If the 19 area frequency drops below 59.98 Hz, AGC units will increase output. If the area frequency rises 20 above 60.02 Hz, AGC units will decrease output, providing ±20 mHz of dead-band before 21 regulation sources are activated. The amount of AGC that a unit can provide is governed by the 22 deviation from the current power setting that the owner is able to accommodate. This operating 23 range is largely governed by the rated megawatt capacity of the unit and the width of the turbine 24 efficiency band in percent capacity. Kaplan turbines with adjustable blades offer this larger 25 efficiency band and can provide more fuel-efficiency regulation than Francis units with their 26 larger capacity ratings. Power-head-flow curves, cam curves, and other hierarchical data provide 27 guidance as to this regulating range and information on rough zones that should be avoided to 28 minimize the risk of cavitation damage to the turbine runner. Lastly, the operating point divides 29 the operating range into up-regulation and down-regulation capacity.
30 Provision of reserves is indecipherable from other services, including bulk energy, when 31 restricted to only power output data. Utilities can record a service mode, or ISO/RTOs can 32 provide aggregated reports of ancillary service bids. If provided a comparative analysis of day-33 ahead schedules and actual power output, data can show results but the difference in power 34 outputs can be attributable to PFR, AGC, or reserves. Evaluation using power output data also 35 only registers reserve capacity that is called into service rather than reserve capacity that is 36 obtained by the ISO/RTO.
37 2.2.5 Fast Cold Start-Up
38 USBR guidelines suggest a 10% capacity per minute ramp rate during unit starts, although 39 Nordic utilities routinely operate with 20% capacity per minute. The design ramp rate is 40 established to minimize transient pressures, including the water hammer effect [19] that produces 41 dynamic loads on the gates and valves. The amount of time required to adequately dissipate 42 transient pressures is related to the length of the water intake classification attribute.

1.18
1 The gradual closure of the valve and wicket gates reduces the transient pressures produced 2 compared with an instantaneous closure [20]. Thus, appropriate setting of closing/opening times 3 of the shutoff valve contributes to safer operation in emergency situations [19]. Surge chambers 4 and pressure relief valves are designed to help avoid an excessive rise in pressure and stabilize 5 the flow to reduce the effects of water hammer events. Water hammer events are currently 6 studied using deterministic software models. Analytical and numerical solutions used in water 7 hammer analysis are described in [21]. Alternatively, the minimum local pressure of the water 8 column must not drop below 50 kPa to avoid the consequential large pressure loads from cavity 9 collapse [19].
10 The governor controls the speed and loading of the unit by controlling the flow through the 11 turbine. The flow is controlled by the wicket gate opening. The wicket gate closing time is set as 12 a compromise between maximum overspeed and water hammer design stresses. Specifications 13 for wicket gate opening range from between 8 and 20 seconds for full closure. For adjustable-14 blade Kaplan units, movement through the full range of runner blade angles takes between 20 15 and 60 seconds. These movements impose limits on the rate of governor response when 16 accounting for the unit capacity and the power-flow-efficiency curves. The governor controls 17 respond similarly but in opposing directions to overfrequency and underfrequency events given 18 similar area control error and total area interchange.
19 At the beginning of and throughout most of the 20th century, when hydropower was 20 predominantly used as base load power generation, units had slow start-up rates that reduced 21 transient pressures experienced by the turbine system. As the role of hydropower has changed in 22 the modern electric grid, technological advances have enabled faster ramp rates. Hydropower 23 units with large storage reservoirs can provide peak load power. This changed their reference 24 mission from as few as one start per week to more than two starts per day with regional 25 variations based on the markets in which they participate. Start-stop counts are reported to 26 NERC GADS, though for end users the database is blinded. This allows for trending market 27 changes but denies analysts the ability to identify specific units.
28 Before a start event occurs at a hydroelectric unit, the facility’s utility-wide dispatch center has 29 scheduled the daily, hourly, and possibly the subhourly water and power dispatch for the facility. 30 The facility operator, located at the dispatch center, then chooses how best to dispatch the units 31 at the facility to meet the grid and water management needs-assuming a vertically integrated 32 utility. Depending on the level of staffing and automation, the unit start sequence can occur on-33 site or remotely. The unit start and stop schedules are a predetermined sequence of opening 34 valves and gates to minimize deleterious effects. This involves running “up to nominal speed as 35 quickly and smoothly as possible” [22]. During both the start and stop events, operators aim to 36 avoid spending excessive time in the cavitation zones that typically occur at lower capacity 37 outputs. Newer state-of-the-art turbine runners are commonly made with ASTM A487/A743 38 CA6NM stainless steel [23], which is cavitation resistant. Stress tests can be used to compare the 39 stresses experienced during a unit start with those experienced during normal operation.
40 In spinning reserve mode, the turbine is ready for fast load acceptance and it might also be kept 41 at speed in the no-load state for quite a long time waiting for a full-load order. This mode of 42 operation is sometimes necessary when the owner has commitments to put power on the grid 43 with extremely short notice, but there are consequences from operating in these severe

1.19
1 conditions. In cases where a change in dispatch is required to provide reserves, especially from 2 higher-cost generators, the total cost of providing reserves adds about 2% to the total costs of 3 providing energy [18].
4 2.2.6 Fast Ramp Rate
5 The fast ramp rate of hydropower is a result of multiple attributes working in unison. The energy 6 in storage enables work in unison with governor controls to quickly increase or decrease the 7 power output of a hydroelectric unit. The intake classification imparts constraints based on water 8 hammer and mechanical gate movement speeds on the timescale of seconds to minutes.
9 Operators are not required to report a unit’s ramp rate to industry data consortia but using 10 1-minute data it is possible to discern the physical capability. In a practical sense, ramp rates 11 faster than the 10%/min required for spinning reserve cannot be given additional value by the 12 energy markets as they do not enable any additional provision of services. Current ramp event 13 analyses include mileage calculations and ramp event distributions.
14 Mileage calculations sum the absolute value of the differences in the runner blade angle (RBA), 15 wicket gate opening (WGO), or power output fields. These analyses conflate movement for PFR, 16 AGC, and hourly load following and start-stops. The last two can be screened out if desired but 17 distinguishing between PFR and AGC response in data analysis is impractical if the time step of 18 data is on the scale of minutes rather than seconds.
19 Though governor controls play a significant role in enabling fast ramp rates, there is little 20 information about the currently installed governor technology for hydroelectric units. The 21 hydroAMP database managed by CEATI provides a yes/no field to determine whether the unit is 22 enabled to provide AGC. Since the Electric Utility Cost Group Hydroelectric Productivity 23 Committee (EUCG-HPC) collects facility-level data, the field is numerical and asks how many 24 AGC-enabled units are located at the facility. NERC GADS has a field for “Governor Type” but 25 does not ask specifically about AGC operations.
26 2.2.7 Isolated Unit Start-Up (i.e. Black Start)
27 The ability for a unit to start in isolation is often conflated with the ancillary service of black start 28 capability. Isolated unit start-up is a hydropower capability that is enabled through a functional 29 on-site diesel generator or other independent power source and is a necessary capability to be 30 deemed a black start resource. NERC defines a black start resource as “a generating unit(s) and 31 its associated set of equipment which has the ability to be started without support from the 32 System or is designed to remain energized without connection to the remainder of the System, 33 with the ability to energize a bus, meeting the Transmission Operator’s restoration plan needs for 34 Real and Reactive Power capability, frequency and voltage control, and that has been included in 35 the Transmission Operator’s restoration plan” [1].
36 Individual ISO/RTO’s have established requirements surrounding the dispatch capability 37 requirement for black start service provision, typically on the order of 1 to 2 hours. Hydropower 38 fulfills this requirement and adds resiliency to the grid because of the quick responsiveness of 39 hydropower when black start capabilities are required by the grid. Hydropower facilities need 40 only to size diesel generators to provide enough power to open the gates and excite the magnetic

1.20
1 field in the hydroelectric unit. Facilities with multiple units are favored to ensure against the 2 unavailability of units. There are also geospatial aspects to the distribution of black start–enabled 3 facilities with those close to major load centers being favored, which is counter to the geospatial 4 needs of reactive power control discussed earlier. Therefore, only one unit at each hydroelectric 5 facility is needed to provide black start services, though all units equipped with a diesel generator 6 on-site would be capable.

3.1
1 3.0 Provision of Power System Services by Hydropower 2 Assets
3 3.1 Indicators and Metrics of Capabilities and Services
4 To quantify the share of hydroelectric units capable of providing specific services to the grid, 5 indicators and metrics can prove valuable given specific and reliable data inputs. These 6 indicators and metrics can be reported directly to the US Energy Information Administration 7 (EIA), NERC, or industry consortia or can be calculated using granular operational data.
8 3.1.1 Start-Up Timing
9 A cold start-up time of less than 10 minutes is found abundantly in EIA Form 860 data for 10 hydroelectric units, as shown in Figure 5. This cutoff is chosen since when providing spinning or 11 nonspinning reserve, a cold start-up time of less than 10 minutes allows the full capacity to be 12 bid as reserve capacity when the unit is not in use. With this metric, hydropower compares 13 favorably with natural gas units, even after excluding slower ramping combined cycle facilities, 14 with 74.91% of hydropower units being capable of starting in less than 10 minutes compared 15 with only 23.6% of natural gas units.
1617
18
-
50,000
100,000
150,000
200,000
250,000
300,000
350,000
Hydro
PS Hyd
ro
Steam
-Coal
Nuclear
NG CCNG CT
NG CENG ST
10M 1H 12H OVER
Cold Unit Start Speed by Megawatt Capacity
MW
cap
acity
-
500
1,000
1,500
2,000
2,500
3,000
3,500
4,000
4,500
Hydro
PS Hyd
ro
Steam
-Coal
Nuclear
NG CCNG CT
NG CENG ST
10M 1H 12H OVER
Cold Unit Start Speed by Number of Units
Coun
t of U
nits
19 Figure 5. Cold start speeds for hydropower and natural gas generators (from EIA 860) by MW capacity (left) 20 and unit count (right).
21 Though it is unclear whether these values include specific restrictions, such as the time required 22 for human communications necessary to dispatch the units and any environmental provisions,

3.2
1 this would hamper hydropower units more than natural gas units. Analyses of 1-minute operating 2 data and discussion with system operators revealed that the logistical and communication 3 requirements can take longer than the actual unit ramping at certain facilities. In addition to the 4 ramp rate and cold start speed, the amount of reserve capacity available is dependent on the 5 current operations of other units at the facility and the head-power-flow-efficiency curves that 6 constrain the maximum dispatchable power for the unit.
7 3.1.2 Mileage Indicators
8 Indicators that use actual operating data must be interpreted carefully because they show only 9 what the units were directed to do rather than what they are capable of doing. Mileage
10 calculations describe the total movement of the mechanism and can quantify the amount of time 11 hydropower units follow a regulation signal. Only adjustable-blade turbines, like Kaplan units, 12 are capable of adjusting the runner blade angle to maximize the efficiency of the unit. The WGO 13 controls flow rate and adjusts to increase or decrease the power output based on the frequency 14 response signal provided from the governor. To capture the total RBA mileage, WGO mileage, 15 and Power output mileage, the movement distances are described as sums of the absolute values 16 of the differences in sequential data points. The smaller the time interval, the more accurate the 17 result will be. Power output mileage is used by some markets such that utilities can put a cost on 18 ramping, but utilities still lack the ability to accurately determine the cost of these ramps.
19 ,YRBA,dist = ∑𝑁𝑖 |𝑎𝑖 ― 𝑎𝑖 ― 1|
20 , andYWGO,dist = ∑𝑁𝑖 |𝑦𝑖 ― 𝑦𝑖 ― 1|
21 ,Y𝑃,dist = ∑𝑁𝑖 |𝑃𝑖 ― 𝑃𝑖 ― 1|
22 where N is the total number of samples, a is the RBA, y is the WGO, and P is power output. The 23 importance of highly granular data can be shown by considering the impact of data granularity 24 on mileage as it impacts each unit differently based on the amount of variable operation asked of 25 the unit. Ramp events can alternatively be aggregated by the magnitude of each ramp event as 26 shown in [24]. The results can be shown as a histogram to understand how groups of units 27 compare with others within a utility, ISO/RTO, or with other generating types.
28 3.1.3 Correlation Analysis of Power Output
29 Correlation analysis determines the correlation between the power output of wind power farms 30 and the power output of hydroelectric units. A strong negative correlation, as shown by [25], is 31 indicative of a hydroelectric unit that increases power output as wind power output decreases and 32 decreases power output as wind power output increases. A correlation analysis can determine 33 which units the utility or balancing authority are using to firm up nondispatchable energy 34 sources. This type of analysis can be done at the facility or unit level but can only detect historic 35 correlations rather than predict changes to future power dispatch or capabilities.

3.3
1 3.1.4 Synchronous Condensing Hours and Events
2 Synchronous condensing operations are recorded by NERC in GADS. Utilities report both the 3 total condensing hours and the number of condensing events. The “2017 Hydropower Market 4 Report” [1] trends hydropower availability through GADS where condensing is one of seven 5 operating states. Medium units, 10–100 MW, report the largest share of condensing hours on 6 average, as seen in Figure 6. Due to the blinded nature of GADS, this is only capable of 7 providing fleetwide trending analysis.
89 Figure 6. Availability trends in hydropower. Trends show that the greatest portion of condensing hours are logged
10 by medium-capacity units ranging from 10–100 MW [7].
11 3.1.5 Black Start Testing Events
12 There is little data analysis available regarding the distribution of black start capabilities. Current 13 North American Electric Reliability Corporation (NERC) guidelines require black start testing 14 once every three years. NERC’s Generating Availability Data System (GADS), which is now 15 mandatory reporting for all units of 20 MW or greater, records these testing events with a 16 specific outage code. The number of units that recorded black start testing events in a three-year 17 span, as prescribed by NERC, were summarized for the five generating types with pertinent data 18 shown in Figure 7. When looking at a regional level it is apparent that several NERC regions 19 report zero black start testing across all generating types, suggesting a significant data quality 20 issue.

3.4
1
0
20
40
60
80
100
120
RFC SERC SPP WECC ERCOT FRCC MRO NPCC
Hydro Gas Fossil CC Diesel
NERC Region
Uni
que
Bla
ck S
tart
Uni
ts
2 Figure 7. Distribution of black start units by NERC region.
3 3.2 Costs of Services Provided by Hydropower
4 Each service described has a cost associated with it that must be well understood to ensure 5 profitability. Hydropower’s capability to provide flexible generation, ancillary services, and grid 6 stabilizing services allows it to provide significant value to the grid, and the value of these 7 capabilities increases in markets with high levels of variable energy generation. However, there 8 is also a cost to providing these services and the evolving generation mix where certain 9 generating sources are incapable of providing specific services. The challenge of providing these
10 services with an increased operational flexibility is to (1) quantify the accelerated degradation of 11 components and associated infrastructure and (2) find the best practices and new technologies to 12 both mitigate damage and increase flexibility.
13 The off-design conditions that occur during flexible operating modes can cause adverse effects to 14 the systems and components of hydroelectric units, including turbines and related components; 15 generators and related components; gates and valves; circuit breakers, switchgear, and 16 transformers; instrumentation and controls; and other components and systems [4]. Aggressive 17 participation in the ancillary services market could impact the repair and replacement intervals 18 for these key components that must be accounted for in the cost equations used to bid units to the 19 Bulk Energy System. Before participating in ancillary service markets that would significantly 20 impact the daily load profiles of a utility’s assets, the potential effects and their costs must be 21 considered:
22 Increase in asset maintenance costs due to the implementation of a shorter time interval or 23 expectation to meet condition-based maintenance points more rapidly.
24 Reduction in the asset’s useful life.

3.5
1 Reduction of high economic returns of current hydro project investments.
2 Alteration of the rate of return on new installations.
3 Alternatives to high-frequency start-stop operations include the following:
4 Condensing of units that are not producing electricity for the grid as a way to achieve 5 constant “on/off” capability. Condensing would leave the machine running at speed during 6 off periods, which would maintain operating temperatures, save bearing wear, save generator 7 breaker wear, and keep generators dry.
8 Using electronic controls hardware (like frequency conversion equipment) to achieve on/off 9 capability.
10 To counter the increased degradation of flexible operations, original equipment manufacturers 11 might consider design improvements to the turbine runner, bolting assembly, water hydrostatic 12 bearing, and thrust bracket. Turbine redesigns could reduce the impact of low-load operation by 13 increasing the operating range. Any design alterations that impact efficiency would have to be 14 evaluated for economic tradeoffs. The bolting assembly could be redesigned to reduce fatigue 15 stresses and avoid the unsticking of flanges. Redesigns to the water hydrostatic bearing and 16 thrust bracket could decrease vibrations by increasing rigidity and stiffness.
17 3.2.1 Hydraulic Impacts from Flexible Operations
18 The hydraulic impact from flexible operations is focused on the turbine and water delivery 19 components of the hydroelectric powertrain. Though these impacts occur during set point 20 operation with weekly start-stops, they occur more frequently when a unit operates flexibly to 21 meet the wide variety of ancillary services it might be capable of.
22 Potential impact characteristics include:
23 Turbines and related components: More frequent start-stops increase vibrations and dynamic 24 stresses. These effects reduce the fatigue life of turbines, turbine shafts, wicket gates, 25 headcovers, and headcover bolts and increase the wear of turbine guide bearings, thrust 26 bearings, shear pins, brakes, and wicket gates.
27 Gates and valves: More frequent opening and closing leads to more frequent pressure 28 pulsations, vibrations, and dynamic stresses. These effects potentially reduce the fatigue life 29 of gates and valves and associated studs, bolts, shafts, actuators, penstocks, and penstock 30 rivets and increase wear of gates and valves.
31 The physical phenomena and impacts stemming from partial load are well known because of 32 industry’s previous efforts. Partial load enables increased spinning reserve capacity and greater 33 capability to load-follow. During the sequence of transitioning to low load, power output is 34 reduced by closing the wicked gate angle, giving a reduction in flow while the blade speed is 35 constant that produces a swirl at the runner’s leading edge. Partial-load operation also creates the 36 potential for “deflection,” so the mechanism links could be subject to abnormal stresses, 37 resulting in abnormal shear pin failure.

3.6
1 The change in operating pattern of a turbine towards partial load could cause the occurrence of 2 cracks within a few months or years. When operating with intermittence in such a mode, the 3 lifetime of the equipment is decreased. To minimize and monitor the impact and preserve the 4 fatigue lifetime, typically, some mode of operations and measures should be applied:
5 ` the continuous area of operation to a band centered on optimal discharge. Currently, 6 however, there could be a constraint because of the new grid requirements.
7 Measure the mechanical load by measuring the levels of pressure pulsations.
8 Measure the runner stress level using strain gauges on the runner.
9 Conduct physical scaled or lab model tests.
10 Conduct computational fluid dynamics modeling.
11 3.2.2 Mechanical Impacts of Flexible Operations
12 For mechanical and electrical assets, the largest contributor to degradation of the machine is due 13 to thermal cycling induced by starts and stops. In generator assets, increased cycling leads to 14 increased vibrations, dynamic stresses, and thermal stresses. These effects reduce the fatigue life 15 of rotors, stators, end windings, spider arms, and support brackets; increase the wear of generator 16 guide bearings, thrust bearings, and generator cooling systems; and increase the probability of 17 insulation failure.
18 For electrical assets such as circuit breakers, switchgear, and transformers, the increased cycling 19 leads to increased vibrations, dynamic stresses, and thermal stresses that reduce the life of the 20 asset. For instrumentation and controls assets, the increased cycling leads to increased vibrations. 21 These effects potentially reduce the life of instrumentation and controls.
22 3.3 Data Gathering Initiatives
23 Data gathering for assessing capabilities and constraints of the current hydroelectric fleet would 24 require a comprehensive multipronged effort. This process is benefiting significantly from efforts 25 being undertaken as part of Oak Ridge National Laboratory’s Hydropower Fleet Intelligence 26 project to harmonize availability, cost, and condition data from industry level databases. The 27 additional effort required would be an incorporation of FERC license information and actual 28 installed technology, which would likely require direct utility correspondence. Though several 29 data availability gaps were discussed, it is a slow process to add additional fields at the consortia 30 level.
31 Availability data can most readily be obtained from individual sources because of the 32 blinded nature of NERC GADS data and the difficulty of extracting information through 33 their in-house software. This effort is to include time spent in variable operational modes in 34 addition to RBA, WGO, flow, spill, reservoir elevation, and efficiency data. Black start and 35 condensing operations are to be incorporated as well. Using large amounts of historical 36 timeseries data, it is possible to reconstruct operational rules for flow and reservoir elevation 37 that come from FERC license information.

3.7
1 Cost data is currently well structured by the EUCG-HPC, though access is limited unless 2 obtained directly from the utility. ORNL’s current relationship with the EUCG-HPC enables 3 data access for analytics used in the delivery of an annual report, though utility and facility 4 names are blinded. The importance of cost data is in the insights it can give to the cost of 5 variable operations that enable the provision of services discussed within this document.
6 Condition data across the industry varies in format, though with the USBR and the US 7 Army Corps of Engineers using the hydroAMP methodology, it has a significant advantage 8 over other forms based solely on sample size. Others within the industry have referenced the 9 hydroAMP methodology when developing their own condition indexing methodologies,
10 though not all use a 0–10 scale, which can make data harmonization complicated.
11 FERC license information on flow and reservoir constraints will provide operational 12 constraints to specific capabilities. As mentioned previously, the most easily interpreted are 13 those governing ramp rates, flow rates, and reservoir elevations.
14 Installed technology levels will be difficult to assess. Though GADS, hydroAMP, and 15 EUCG each have specific design data fields, there is little harmonization among them. Key 16 technology upgrades are necessary if a facility or unit is to provide AGC, synchronous 17 condensing, or black start capabilities. A disconnect appears because the current design data 18 fields are meant to provide additional criteria for benchmarking purposes rather than to 19 predict future capabilities.

4.1
4.0 References
[1] NERC, "Glossary of Terms," [Online]. Available: https://www.nerc.com/pa/Stand/Glossary%20of%20Terms/Glossary_of_Terms.pdf.
[2] FERC, "Essential Reliability Services and the Evolving Bulk-Power System-Primary Frequency Response," FERC, 2018.
[3] ISO New England, "Glossary and Acronyms," 2019. [Online]. Available: https://www.iso-ne.com/participate/support/glossary-acronyms.
[4] P. March, "Flexible Operation of Hydropower Plants," EPRI, Palo Alto CA, 2017.
[5] J. Unterluggauer, E. Doujak and C. Bauer, "Fatigue Analysis of a Prototype Francis Turbine Based on Strain Gauge Measurements," in 20th International Seminar on Hydropower Plants, Vienna, Austria, 2018.
[6] G. Osburn, "Start/Stop Costs. Bureau of Reclamation," June 2014. [Online]. Available: https://www.usbr.gov/research/projects/download_product.cfm?id=1218.
[7] R. Uria-Martinez, M. M. Johnson and P. W. O'Connor, "2017 Hydropower Market Report," 2018. [Online]. Available: https://www.energy.gov/eere/water/downloads/2017-hydropower-market-report.
[8] US Department of Energy, "Transforming the Nations Electricity Sector: The Second Installment of the QER," 2017. [Online]. Available: https://www.energy.gov/policy/initiatives/quadrennial-energy-review-qer/quadrennial-energy-review-second-installment.
[9] S.-C. Kao, M. Ashfaq, B. S. Naz, R. Uria Martinez, D. Rastogi, R. Mei, Y. Jager, N. M. Samu and M. J. Sale, "The Second Assessment of hte Effects of Climate Change on Federal Hydropower ORNL/SR-2015/357," Oak Ridge National Laboratory, Oak Ridge, TN, 2015.
[10] North American Electric Reliability Corporation, "Balancing and Frequncy Control," NERC, Princeton NJ, 2011.
[11] U.S. Army Corps of Engineers, "Flood Risk Management: Value to the Nation," [Online]. Available:

4.2
https://www.mvk.usace.army.mil/Portals/58/docs/PP/ValueToTheNation/VTNFloodRiskMgmt.pdf.
[12] M. Bonnet, A. Witt, K. Stewart, B. Hadjerioua and M. Mobley, "The Economic Benefits of Multipurpose Reserviors in the United States-Federal Hydropower Fleet," Oak Ridge National Laboratory, Oak Ridge, TN, 2015.
[13] Eurelectric, "Flexible Generation: Backing up Renewables," EURELECTRIC, 2011.
[14] A. Ulbig, T. S. Borsche and G. Andersson, "Analyzing Rotational Inertia, Grid Topology and their Role for Power System Stability," Science Direct, Zurich, Switzerland, 2015.
[15] US Department of the Interior: Bureau of Reclamation, "Selecting Hydraulic Reaction Turbines," USBR, Washington DC, 1976.
[16] U.S. Department of Energy, "Best Practice Catalog," 2012. [Online]. Available: https://hydropower.ornl.gov/docs/HAP/BestPracticeCatComp.pdf.
[17] R. A. McManamay, C. O. Oigbokie, S.-C. Kao and M. S. Bevelhimer, "Classification of US Hydropower Dams bu their Modes of Operation," River Research and Applications, vol. 32, no. 7, 2016.
[18] M. Hummon, P. Denholm, J. Jorgenson and D. Palchak, "Fundamental Drivers of the Cost and Price of Operating Reserves. Technical Report NREL/TP-6A20-58491," 2013. [Online]. Available: https://www.nrel.gov/docs/fy13osti/58491.pdf.
[19] A. Bergant, B. Karney, S. Pejovic and J. Mazij, "Treatise on Water Hammer in Hydropower Standards and Guidelines," 2014.
[20] J. A. Roberson, J. J. Cassidy and M. H. Chaudhry, Hydraulic Engineering, Danvers MA: John Wiley and Sons, Inc, 1997.
[21] P. G. Provenzano, R. J. Aguerre and F. J. Baroni, "Water Hammer Analysis," in ENPROMER, Costa Verde, Brazil, 2005.
[22] A. Kjolle, "Hydropower in Norway: Mechanical Equipment," Norwegian University of Science and Technology, Trondheim, Norway, 2001.
[23] ORNL, "Hydropower Advancement Project: Compilation of Best Practice Catalog," Department of Energy: Water Power Technologies Office, 2012.

4.3
[24] S. G. Brosig and T. K. Brekken, "Hydrofoundation," 2013. [Online]. Available: http://www.hydrofoundation.org/uploads/3/7/6/1/37618667/brosig_thesis.pdf.
[25] K. A. Lajoie, "An Advanced Study of Wind Power Variability on the Federal Columbia River Power System," Oregon State University, Corvallis, OR, 2014.
[26] S. Turner, N. Voisin, J. Fazio, D. Hua and M. Jourabchi, "Compound Climate Events Transform Electrical Power Shortfall Risk in the Pacific Northwest," Nature Communications, online, Vols. DOI: 10.1038/s41467-018-07894-4, 2019.

HTTPS://WWW.ENERGY.GOV/EERE/WATER/HYDROWIRES-INITIATIVE