contents - university of california, santa barbara · the minerals management service, pacific ocs...
TRANSCRIPT


ii iii
CONTENTSExecutive Summary v
Chapter 1 1-1Introduction
Chapter 2 2-1A Brief History of Oil Development in Southern California
Chapter 3 3-1A Review of Biological and Oceanographic Surveys: Results and Analyses
Chapter 4 4-1A Guide to Ecological and Political Issues Surrounding Oil Platform Decommissioning in California
Chapter 5 5-1Research and Monitoring Recommendations
Acknowledgements and Personal Communications 5-3
References R-1
Tables T-1
Appendices
Appendix 1 A-1
Appendix 2 A-11
Appendix 3 A-13
Appendix 4 A-29
Mexican rockfish at bottom of Platform Gail.
LIN
DA
SN
OO
K
OCS Study MMS 2003-032
Milton S. LoveDonna M. SchroederMary M. Nishimoto
Marine Science InstituteUniversity of CaliforniaSanta Barbara, CA, 93106email address (for M. Love): [email protected]/lovelab
June 2003
Prepared under Cooperative Agreement #1445-CA09-95-0836 between the Biological Resources Division, U. S. Geological Survey, and the Marine Science Institute, Uni-versity of California, Santa Barbara, in cooperation with the Minerals Management Service, Pacific OCS Region.
Front Cover: Background, young-of-the-year rockfishes, Platform Grace (Mary Nishimoto). From upper left: Seastars and mussels, midwater, Platform Holly (Dan Dugan); Platform Irene (Linda Snook); juvenile bocaccio, midwater, Platform Gilda (Donna Schroeder); young-of-the-year yellowtail rockfish, Platform Irene (Rick Starr); flag rockfish, Platform Grace (Donna Schroeder); young-of-the-year cowcod, shell mound, Platform Gail (Milton Love); juvenile vermilion rockfish, bottom, Platform Grace (Donna Schroeder).
Back Cover: Kelp rockfish and club anemones, midwater, Platform Holly (Dan Dugan).
Project CooperationThis research addressed an information need identi-fied by the U. S. Department of the Interior’s Minerals Management Service, Pacific OCS Region, Camarillo, California.
DisclaimerThis research was conducted under a cooperative agree-ment (Agreement 1445-CA09-95-0836) between the U. S. Geological Survey (Biological Resources Division) and the University of California, Santa Barbara. This report was re-viewed and approved for publication by the BRD. Approval does not signify that the contents necessarily reflect the views and policies of the BRD or MMS, nor does mention of trade names or commercial products constitute endorsement or recommendation for use.
Report AvailabilityAvailable for viewing and in PDF at: www.id.ucsb.edu/lovelab
Reprints available at:Milton LoveMarine Science InstituteUniversity of California, Santa BarbaraSanta Barbara, CA 93106(805) 893-2935
Lyman ThorsteinsonWestern Fisheries Research CenterU. S. Geological Survey6505 NE 65th St.Seattle, Washington 98115(206) 526-6569
Minerals Management Service Pacific OCS Region770 Paseo CamarilloCamarillo, CA 99010(805) 389-7800
Suggested CitationLove, M. S., D. M. Schroeder, and M. M. Nishimoto. 2003. The ecological role of oil and gas production platforms and natural outcrops on fishes in southern and central California: a synthesis of information. U. S. Department of the Interior, U. S. Geological Survey, Biological Re-sources Division, Seattle, Washington, 98104, OCS Study MMS 2003-032.
The Ecological Role of Oil and Gas Production Platforms and Natural Outcrops on Fishes in Southern and Central California: A Synthesis of Information

v
EXECUTIVE SUMMARY
Opposite: Juvenile widow rockfish in platform midwater. (Photograph by Lovelab, UC Santa Barbara)
Information NeededProduction of oil and gas from offshore platforms
has been a continual activity along the California coast since 1958. There are 26 oil and gas platforms off Califor-nia, 23 in federal waters (greater than 3 miles from shore) and 3 in state waters. The platforms are located between 1.2 to 10.5 miles from shore and at depths ranging from 11 to 363 m (35–1,198 ft.). Crossbeams and diagonal beams occur about every 30 m (100 ft.), from near the surface to the seafloor. The beams extend both around the perimeter of the jacket and reach inside and across the platform. The beams and vertical pilings (forming the jacket) and the conductors on all platforms are very heav-ily encrusted with invertebrates and provide important habitat for fishes. The seafloor surrounding a platform is littered with mussel shells. This “shell mound” (also called “mussel mound” or “shell hash”) is created when living mussels, and other invertebrates, are dislodged and fall to the seafloor during platform cleaning or storms.
Once an industrial decision is made to cease oil and gas production, managers must decide what to do with the structure, a process known as decommissioning. Plat-form decommissioning can take a number of forms, from leaving much, or all, of the structure in place to complete removal. Along with the platform operator, many federal and state agencies are involved in the decommissioning process. All oil and gas platforms have finite economic lives and by the beginning of the twenty-first century, seven platforms in southern California had been decom-missioned and a number of others appeared to be nearing the end of their economic lives.
Management decisions regarding the decommis-sioning of an oil and gas platform are based on both biological and socioeconomic information. This study addressed the need for resource information and better understanding of how offshore oil/gas platforms con-tributed to the fish populations and fishery productivity in the Santa Maria Basin and Santa Barbara Channel. Prior to our studies, there was almost no biological in-formation on Pacific Coast platform fish assemblages. This necessary research involved broad scale sampling at numerous oil/gas platforms and natural reefs. Research objectives included 1) characterizing the fish assemblages around platforms and natural reefs, 2) examining how oceanography affects patterns of recruitment and com-
munity structure of reef fishes, and 3) describing the spatial and temporal patterns of fish diversity, abundance and size distribution among habitat types (e. g., platforms and natural outcrops).
Research SummaryBetween 1995 and 2001, we studied oil and gas plat-
forms sited over a wide range of bottom depths, ranging between 29 and 224 m (95 and 739 ft.) and sited from north of Point Arguello, central California to off Long Beach, southern California. However, most of the plat-form research occurred in the Santa Barbara Channel and Santa Maria Basin. The Santa Barbara Channel and Santa Maria Basin are situated in a dynamic marine transition zone between the regional flow patterns of central and southern California. The Santa Barbara Channel is about 100 km long by about 50 km wide (60 x 20 miles) and is bordered on the south by the Northern Channel Islands (San Miguel, Santa Rosa, Santa Cruz, and Anacapa). This area is bathed in a complex hydrographic system of cur-rents and water masses. Generally, cool coastal waters from the California Current enter the Santa Barbara Channel through its west entrance at Point Conception. Warm waters from the Southern California Bight flow in the opposite direction into the channel through its eastern entrance. Surface waters are substantially warmer in the Bight than north of Point Conception due to less wind-induced vertical mixing, the solar heating of surface waters, and currents of subtropical waters entering from the south. The convergence of different water masses in the Santa Barbara Channel results in relatively large scale differences in physical parameters (e.g., temperature, sa-linity, oxygen, and nutrient concentrations) and biotic assemblages (e. g., flora and fauna).
Scuba surveys were conducted at shallow depths and submersible surveys, using the research submarine Delta, at greater depths. We also surveyed shallow-water and deeper-water rock outcrops, many in the vicinity of platforms. Nine nearshore, shallow-water rock outcrops, seven on the mainland and two at Anacapa Island, were monitored annually from 1995 to 2000. These natural outcrops are geographically distributed across the Santa Barbara Channel providing opportunities for spatial comparisons. In addition, we surveyed over 80 deeper-water outcrops, in waters between 30 and 360 m (100

vi
EXECUTIVE SUMMARY
vii
EXECUTIVE SUMMARY
and 1,180 ft.) deep, located throughout the Southern California Bight and off Points Conception and Arguello. These sites included a wide range of such habitats as banks, ridges, and carbonate reefs, ranging in size from a few kilometers in length to less than a hectare in area. On these features, we focussed on hard bottom macro-habitats, including kelp beds, boulder and cobble fields, and bedrock outcrops. Most of these deeper-water sites were visited once, a few were surveyed during as many as four years and one outcrop, North Reef, near Platform Hidalgo, was sampled annually.
Most of our oil and gas platform surveys were conducted at nine structures (Platforms Irene, Hidalgo, Harvest, Hermosa, Holly, Gilda, Grace, Gina, and Gail) located in the Santa Barbara Channel and Santa Maria Basin. Between 1995 and 2000, we conducted annual surveys on the shallow portions of these nine platforms. The shallowest of the nine platforms, Gina, was surveyed from surface to bottom depths using scuba techniques. Deep-water surveys conducted between 1995 and 2001, using the research submersible, Delta, studied the same platforms excluding the bottom of Gilda and all of Gina. In 1998, one submersible survey was conducted around Platform Edith, located off Long Beach. In 2000 partial submersible surveys were completed around Platforms C, B, A, Hillhouse, Henry, Houchin, Hogan, and Habitat.
Patterns in Shallow-Water HabitatsRegional and local processes influenced patterns of
outcrop fish assemblages in shallow waters. At regional spatial scales, outcrop fish abundance patterns often shifted abruptly as oceanographic patterns changed, roughly defining a cool-temperate assemblage in the western Santa Barbara Channel, and a warm-temperate assemblage in the eastern Santa Barbara Channel. This distinctive spatial pattern was observed in both oil and gas platform and natural outcrop habitats. In shallow waters, there was greater variability in platform species assemblages and population dynamics compared to natu-ral outcrop assemblages, and this was most likely caused by the greater sensitivity of platform habitats to changing oceanographic conditions. Local processes that affected fish distribution and abundance were related to habitat features, where depth, relief height, and presence of giant kelp all played important roles. On platform habitat, we found that the majority of newly settled rockfish juveniles resided at depths greater than 26 m (86 ft.), although there were differences among species.
Characterization of the Deepwater Platform Fish Assemblages
With the exception of the shallow-water Platform Gina, all of the platforms we surveyed were characterized by three distinct fish assemblages: midwater, bottom, and shell mound. Rockfishes, totaling 42 species, dominated these habitats. Fish densities at most platforms were high-est in the midwater habitat reflecting the depth prefer-ences of young-of-the-year rockfishes. Young-of-the-year rockfishes represented the most abundant size classes in platform midwaters. Platform midwaters were nursery grounds for rockfishes as well as for a few other species, including cabezon and painted greenling. The young-of-the-year of at least 16 rockfish species inhabited these waters. Settlement success was affected by oceanographic conditions. Densities of young-of-the-year varied greatly between years and platforms. Young-of-the-year rockfish densities often varied by an order of magnitude or greater among survey years and platforms. From 1996 through 1998, rockfish settlement was generally higher around the platforms north of Point Conception as compared to platforms in the Santa Barbara Channel. This finding is reflective of the generally colder, more biologically pro-ductive waters in central California during the 1980s and much of the 1990s. Colder waters in 1999 were associated with relatively high levels of rockfish recruitment at all platforms surveyed. In 2000 and 2001, juvenile rockfish recruitment at platforms in the Santa Barbara Channel remained higher than pre-1999 levels, possibly reflecting the oceanographic regime shift to cooler temperatures that may be occurring in southern California.
Subadult and adult rockfishes and several other spe-cies dominated the bottom habitats of platforms. The bottom habitat of some platforms is also important nurs-ery habitat as, in some instances, young-of-the-year rock-fishes were observed in very large numbers. In general, more than 90% of all the fishes around platform bottoms were rockfishes. Bottom depth strongly influenced the number of species, species diversity, and density of fishes living around platform bases. This is distinctly different than the pattern observed in platform midwaters. The platform base provides habitat for not only fishes but also their prey and predators.
Shell mounds supported a rich and diverse fish assemblage. As at other platform habitats, rockfishes comprised the vast majority of the fishes. The many small sheltering sites created by mussels, anemones, and other invertebrates on the shell mounds created a habitat occupied by small fishes. Many of these fishes were the
young-of-the-year and older juveniles of such species as lingcod and copper, flag, greenblotched, and pinkrose rockfishes and cowcod. The adults of these species also inhabited the platform bottom.
Platform versus Reef Fish AssemblagesWe compared the species composition of the fish
assemblages at Platform Hidalgo and at North Reef, an outcrop located about 1,000 m (3,300 ft.) from the platform. The assemblages were quite similar, both were dominated by rockfishes. In general, the distinctions be-tween the platform and outcrop assemblages were based on differences in species densities, rather than species’ presence or absence. Most species were more abundant at Platform Hidalgo. Halfbanded, greenspotted, flag, greenstriped, and canary rockfishes, and all three life stages of lingcod (young-of-the-year, immature, adult) and painted greenling had higher densities around the platform. Five species (pink seaperch, shortspine comb-fish, pygmy, squarespot, and yellowtail rockfishes) were more abundant at the outcrop. Young-of-the-year rock-fishes were found at both Platform Hidalgo (primarily in the midwaters) and at North Reef. Young-of-the-year rockfish densities were higher at the platform than at the outcrop in each of the five years studied. In several years, their densities were more than 100 times greater at Platform Hidalgo compared to North Reef.
Rockfishes numerically dominated the fish assem-blages at almost all of the platform and hard seafloor habitats in our study. Overall species richness was greater at the natural outcrops (94) than at the platforms (85). There was a high degree of overlap in species between platforms and outcrops and differences were primarily due to generally higher densities, of more species, at plat-forms. In general, canary, copper, flag, greenblotched, greenspotted, greenstriped, halfbanded, vermilion rock-fishes, bocaccio, cowcod, and widow rockfish young-of-the-year, painted greenling and all life history stages of lingcod were more abundant at platforms than at all or most of the outcrops studied. Yellowtail rockfish and the dwarf species pygmy, squarespot, and swordspine rock-fishes were more abundant on natural outcrops.
FindingsOur research demonstrates that some platforms may
be important to regional fish production. The higher densities of rockfishes and lingcod at platforms compared to natural outcrops, particularly of larger fishes, support the hypothesis that platforms act as de facto marine ref-
uges. High fishing pressure on most rocky outcrops in central and southern California has led to many habitats almost devoid of large fishes. Fishing pressure around most platforms has been minimal. In some locations, platforms may provide much or all of the adult fishes of some heavily fished species and thus contribute dispro-portionately to those species’ larval production.
Platforms usually harbored higher densities of young-of-the-year rockfishes than natural outcrops and thus may be functionally more important as nurseries. Platforms may be more optimal habitat for juvenile fishes for several reasons. First, because as structure they physically occupy more of the water column than do most natural outcrops; presettlement juvenile or larval fishes, transported in the midwater, are more likely to encounter these tall structures than the relatively low-lying natural rock outcrops. Second, because there are few large fishes in the midwater habitat, predation on young fishes is probably lower. Third, the offshore position and extreme height of platforms may provide greater delivery rates of planktonic food for young fishes. Most of the natural outcrops we found that had high densities of young-of-the-year rockfishes were similar to platforms as they were very high relief structures that thrust their way well into the water column.
Our research, and reviews of existing literature, strongly implies that platforms, like natural outcrops, both produce and attract fishes, depending on species, site, season, and ocean conditions. Platform fish assem-blages around many of the deeper and more offshore platforms probably reflect recruitment of larval and pe-lagic juvenile fishes from both near and distant maternal sources, not from attraction of juvenile or adult fishes from natural outcrops. Annual tracking observations of strong year classes of both flag rockfish and bocaccio imply that fishes may live their entire benthic lives around a single platform. A pilot study showed that young-of-the-year blue rockfish grew faster at a platform than at a natural outcrop indicating that juvenile fishes at platforms are at least as healthy as those around natural outcrops.
Management ApplicationsIn this report, we discuss the ecological and political is-
sues that surround platform decommissioning in California, including the ecological consequences of the four platform decommissioning alternatives: (1) Complete Removal, (2) Partial Removal and Toppling, and (3) Leave-in-Place.
Complete Removal: In complete removal, operators may haul the platform to shore (for recycling, reuse, or disposal) or it can be towed to another site and reefed.

viii
EXECUTIVE SUMMARY
ix
EXECUTIVE SUMMARY
A typical full-removal project begins with well abandon-ment in which the well bores are filled with cement. The topsides, which contain the crew quarters and the oil and gas processing equipment, are cut from the jacket and re-moved and the conductors are removed with explosives. Finally, the piles that hold the jacket to the seabed are severed with explosives and the jacket is removed.
Completely removing a platform for disposal on land will kill all attached invertebrates. If some of the platform structure is hauled to a reef area and replaced in the water, some of these animals may survive, depending on water depth and the length of time the structure is exposed to the air. The explosives used to separate the conductor and jacket from the seafloor kill large numbers of fishes. In a study in the Gulf of Mexico, explosives were placed 5 m (15 ft.) below the seafloor to sever the well conductors, platform anchor pilings and support legs, of a platform in about 30 m (100 ft.) of water. All of the fishes on or near the bottom and most of the adult fishes around the entire platform suffered lethal concussions. Marine mammals and sea turtles may also be indirectly killed by damage to the auditory system.
The use of explosives to remove or topple a platform may also complicate fishery-rebuilding programs. Cow-cod, a species declared overfished by NOAA Fisheries, provides an example. This species is the subject of a fed-eral rebuilding plan that severely limits catches. In 2001, this was 2.4 metric tons or about 600 fish. Based on our research, there are at least 75 adult cowcod on Platform Gail. If explosives are used to remove Gail, all of these fish will be killed. The loss of at least 75 adult cowcod may be sufficiently large to complicate the rebuilding plan.
Partial Removal and Toppling: Under both partial removal and toppling the topsides are removed. In par-tial removal, the jacket is severed to a predetermined depth below the surface and the remaining subsurface structure is left standing. In toppling, the conductors and piles are severed with explosives and the jacket is pulled over and allowed to settle to the seafloor. In both partial removal and toppling, conductors need not be completely removed. Retaining conductors would add habitat complexity to a reefed platform.
While the immediate mortality impact to attached invertebrates of partial removal is greater than leaving the
platform structure in place, mortality risks to both fishes and invertebrates are much lower than in both toppling and total removal. Partial removal causes fewer deaths than does toppling for two reasons. First, because partial removal does not require explosives (as does toppling), there is relatively little fish, marine mammal, sea turtle, and motile invertebrate (such as crab) mortality. In addi-tion, when a platform is partially removed, vertebrate and invertebrate assemblages associated with the remaining structure are likely to be minimally affected. In contrast, when a platform is toppled, the jacket falls to the seafloor, and, depending on bottom depth, many, if not most of the attached invertebrates die.
Both partial removal and toppling would produce reefs with somewhat different fish assemblages than those around intact platforms. With the shallower parts of the platform gone, it is likely that partial removal would result in fewer nearshore reef fishes, such as seaperches, basses, and damselfishes. However, young-of-the-year rockfishes of many species recruit in large numbers to natural out-crops that have crests in about 30 m (100 ft.) of water or deeper. Thus, it is possible that partial removal would result in little or no reduction in young-of-the-year recruitment for many rockfish species. The pelagic stage of some rock-fish species, particularly copper, gopher, black-and-yellow and kelp, may recruit only to the shallowest portions of the platform. For these species, both partial removal and toppling would probably decrease juvenile recruitment, depending on the uppermost depth of the remaining structure. Young-of-the-year rockfishes, which make up the bulk of the fish populations in the platform midwa-ter habitat, would probably be less abundant around a toppled platform compared to a partially removed one. Because most California platforms reside in fairly deep water, toppled platforms might reside at depths below much rockfish juvenile settlement. Thus, toppling might result in lowered species composition and fish density. However, depending on the characteristics of the platform, a toppled structure, with twisted and deformed pilings and beams, might have more benthic complexity than one that is partially removed. This might increase the number of such crevice dwelling fishes as pygmy rockfishes.
It is difficult to catch fishes that live inside the verti-cally standing platform jacket. Our observations demon-strate that many of the rockfishes living at the platform bottom, such as cowcod, bocaccio, flag, greenspotted, and greenblotched rockfishes, dwell in the crevices formed by the bottom-most crossbeam and the seafloor. To a certain extent, these fishes are protected from fishing
gear by the vertical mass of the platform, a safeguard that would persist if the platform were partially removed, particularly if the conductors remained in place. It would be much easier to fish over a toppled platform, as more of the substrate would be exposed to fishing gear.
Coast Guard regulations do not require a minimum depth below the ocean surface to which a decommis-sioned platform must be reduced. The decision on how much of the jacket and conductors is left in place is based on both a Coast Guard assessment and the willingness of the liability holder to pay for the navigational aids required by the Coast Guard. As mussels become rare below about 30 m (100 ft.) on most platforms, the mis-taken assumption that all partially removed platforms must be cut to 24–30 m (80–100 ft.) below the surface has led some to conclude that this will inevitably lead to a severe reduction in the amount of mussels that fall to the bottom and, thus, to a change in or end to, the shell mound community. This is not necessarily the case.
Leave-in-Place: A platform could be left in its original location at the time of decommissioning. The topsides would be stripped of oil and gas processing equipment, cleaned, and navigational aids installed. If a platform were left in place, the effect on platform sea life would be minimal.
Pacific Coast PlatformsIn this report we have also included a brief summary of
information on all of the Pacific Coast platforms (Appendix 1), densities of all fishes observed at each platform during scuba and submersible surveys (Appendix 2 and Appendix 3, respectively), and a list of the 20 most important sites, both platforms and natural outcrops, for the most abun-dant species in our deepwater study (Appendix 4).
Research NeedsOur research demonstrates that additional biological
information is needed in the decommissioning process. These information needs fall into three categories: (1) A comparison of the ecological performance of fishes living at oil platforms and on natural outcrops, (2) A definition of the spatial distribution of economically important species (of all life history stages) within the region of interest and a definition of the connectivity of habitats within this region, and (3) An understanding of how habitat modification of the platform environment (e.g., removal of upper portion or addition of bottom structure) changes associated assemblages of marine life at offshore platforms.Whitespeckled rockfish and white anemones (Metridium sp.).
MA
RY N
ISH
IMO
TO

x
EXECUTIVE SUMMARY
1-1
Chapter 1
INTRODUCTIONMilton S. Love, Donna M. Schroeder, and Mary M. Nishimoto
Major questions remaining to be addressed include:
What Fishes Live Around Platforms and Nearby Natural Reefs?
In order to assess the relative importance of a plat-form to its region, it is essential to conduct basic surveys not only around the platform, but also at nearby reefs. A majority of platforms have not been surveyed.
How Does Fish Production around Platforms Compare to that at Natural Outcrops?
It is possible to compare fish production between habitats by examining (1) fish growth rates, (2) mor-tality rates, and (3) reproductive output. A pilot study compared the growth rates of young-of-the-year blue rockfish at Platform Gilda and Naples Reef and another examining young-of-the-year mortality rates is planned. Additional work is needed to determine larval dispersal patterns and differences in densities at various study sites. For example, we now have enough data to study the rela-tive larval production per hectare of cowcod and bocaccio at Platform Gail versus that on natural outcrops.
What Is the Relative Contribution of Platforms in Supplying Hard Substrate and Fishes to the Region?
This research would put in perspective the relative contribution of platforms in supplying hard substrate and reef fishes to their environment.
First, this requires knowledge of the rocky outcrops in the vicinity of each platform; this is derived from sea-floor mapping. Once the mapping is complete, visual surveys of the outcrops, using a research submersible, will determine the fish assemblages and species densities in these habitats. Knowing the areal extent of both natural and platforms habitats and the densities of each species in both of these habitats, it is then possible to assess the total contribution of each platform to the fish popula-tions and hard substrate in that region.
How Long Do Fishes Reside at Oil/Gas Offshore Platforms?
It is unclear how long fishes are resident to plat-forms. For instance, does the large number of fishes,
has conducted research on the fishes that live around the platforms and on natural rock outcrops. Our goals have been to determine the patterns of fish assemblages around both platforms and outcrops and to identify the processes that may have generated these patterns. In ad-dition, we are attempting to understand the linkages be-tween habitats among different fish life history stages.
Previous ResearchDecommissioning decisions in California will
have a biological as well as socioeconomic and cultural component. Therefore, it is timely to summarize what is known about the biology and ecology of the fauna of these structures. Our emphasis has been on the fish assemblages.
Our research on platforms and outcrops occurred between 1995 and 2001. Before our research began, only a few fish surveys had been conducted around Califor-nia platforms. Most of this work was conducted around platforms Hilda and Hazel, two shallow-water platforms off Summerland, just below Santa Barbara (Carlisle et al. 1964; Allen and Moore 1976; Bascom et al. 1976). Both of these structures were removed in 1996. Carlisle et al. (1964) found an average of about 6,000 fish under each platform. Allen and Moore (1976) estimated an average of about 20,000 fishes, occasionally reaching at least 30,000. Rockfishes, particularly young-of-the-year fishes, and sea perches dominated the assemblages, kelp and barred sand bass were also abundant. Large numbers of young bocac-cio and widow rockfish living around platforms A, B, and C in the Santa Barbara Channel were tagged by the Cali-fornia Department of Fish and Game (Hartmann 1987). Six bocaccio were recovered as adults. All had traveled to natural outcrops, one 148 km (94 miles) away from the platforms. Love and Westphal (1990) compared fishes captured around oil platforms and at two nearby natural outcrops in the Santa Barbara Channel. Rockfishes were the most commonly taken species. Young rockfishes were most abundant at the platforms, rockfishes on natural outcrops tended to be older. A pilot survey of fishes, using a remotely operated vehicle at Platform Hidalgo and nearby natural outcrops (Love et al. 1994), identified large numbers of young rockfishes at the platform and few at natural outcrops. Benthic rockfishes were more abundant at natural outcrops.
Goals and ObjectivesProduction of oil and gas from offshore platforms
has been a continual activity along the California coast since 1958. All oil and gas platforms have finite eco-nomic lives and at the beginning of the twenty-first century, seven platforms in southern California have been decommissioned and a number of others appear to be nearing the end of their economic lives.
Once an industrial decision is made to cease oil and gas production, managers must decide what to do with the structure, a process known as decommissioning. Platform decommissioning can take a number of forms, from leaving much, or all, of the structure in place to complete removal (see Chapter 4, page 4-1). Along with the corporation that owns the platform, federal agencies that are involved in the decommissioning process include the Minerals Management Service (for Outer Continen-tal Shelf platforms), U. S. Coast Guard, U. S. Army Corps of Engineers, National Marine Fisheries Service, U. S. Environmental Protection Agency, U. S. Occupational Safety & Health Administration. California State agen-cies include the California State Lands Commission (for platforms in State waters), California Regional Water Quality Control Districts (for platforms in State waters), California Coastal Commission, and California Fish and Game Commission. At the local level the County Air Pollution Control Districts and agencies such as the County Energy Division would also play a role.
Off California, three platforms, Harry (in 1974), Helen (in 1978), and Herman (in 1978) were decom-missioned through complete removal without a great deal of controversy. Public debate arose over decom-missioning of platforms Hilda, Hazel, Hope, and Heidi when a recreational angler’s group, desiring to continue fishing on these structures, began to lobby for their re-tention. Ultimately, the four platforms were removed in 1996. It appears certain that future decommissioning of California platforms will be controversial because of conflicting desires regarding the fate of platforms on the part of various marine stakeholders (see Chapter 4, page 4-1).
Since 1995, our group, first funded by the Biologi-cal Resources Division of the U. S. Geological Survey, the Minerals Management Service and most recently by the California Artificial Reef Enhancement Program,
particularly such species as the overfished bocaccio and cowcod, remain around the platforms for extended pe-riods? Knowledge of the residence time of these species would allow us to more accurately determine if platforms form optimal habitat for these species.
What are the Effects of Platform Retention or Removal on Fish Populations within a Region?
As an example, what effect would platform retention or removal have on young-of-the-year fish recruitment? Would the young rockfishes that settle out at a platform survive in the absence of that platform? Our surveys dem-onstrate that planktonic juvenile fishes, particularly rock-fishes, often settle to platforms in substantial numbers. If that platform did not exist, would these young fishes have been transported to natural outcrops? Knowing how long it would take rockfish larvae to reach suitable natural outcrops, and what percent of these larvae would likely die before reaching these outcrops, will give a sense of the importance of a platform as a nursery ground.
Similarly, using a synthesis of oceanographic infor-mation, it is possible to model the fate of larvae produced by fishes living at a platform.
How Does Habitat Modification of the Platform Environment (e.g., Removal of Upper Portion or Addition of Bottom Structure) Change Associated Assemblages of Marine Life?
All decommissioning options except leave-in-place involve modification of the current physical structure of offshore platforms. Is it possible to increase fish diversity and density by altering the seafloor or the platform itself? For instance, it would be useful to add complexity, in the form of quarry rock or other structure, to the shell mound around a platform, and follow the changes in fish assemblages.
Descriptive information such as depth distribution and life history information is also useful in determining how decommissioning options affect the environment. Experimental research, using a BACI design or similar ap-proach, can aid in predicting how the biotic community will respond to such structural changes.

1-2
INTRODUCTION
1-3
INTRODUCTION
and fishes. All of the platforms we studied have a crossbeam on the seafloor, although portions of the beam may be either buried in sediment or undercut by currents.
The seafloor surrounding a platform is littered with mussel shells. This “shell mound” (also called “mussel mound” or “shell hash”) is created when living mussels, and other invertebrates, are dislodged during platform cleaning or storms. We observed shell mounds under and around all of the platforms we surveyed. Only a few of the more shallow shell mounds (around platforms Gina, Grace, Henry, and Houchin) have been accurately mapped (Sea Surveyor Inc. 2003). These mounds ranged from 4–6 m (13–19 ft.) high and were either oval or round in shape. Dimensions of these four mounds were: Gina, oval, 45 x 64 m (150 x 210 ft.); Grace, oval, 61 x 118 m (200 x 390 ft.); Henry, round, 76 m (250 ft.) in diameter; Houchin, round, 85 m (280 ft.) in diameter. Current patterns, rate of shell deposition, and age of platform all play a role in the size of shell mounds.
Rock Outcrops
An objective of our research was to compare fish as-semblages and fish productivity at platforms and natural outcrops in central and southern California. Understand-
Our current research began in 1995, preliminary data is found in Love et al. (1999, 2000, 2001) and Schroeder et al. (1999) and we have incorporated that information into this report.
Study Area
Platforms
There are 26 oil and gas platforms off California, 23 in federal waters (greater than 3 miles from shore) and 3 in state waters (Figures 1.1a, b, and c). The platforms are located between 1.2 to 10.5 miles from shore and at depths ranging from 11 to 363 m (35–1,198 ft.). Information regarding location, depth, and other physical features of California’s offshore platforms are described in Appendix 1.
All California platforms are similar in design (Fig-ure 1.2); they primarily vary in size. The above-water
structures, including oil and gas processing equipment and crew living and working quarters are termed the topside (also topside facilities and deck). The vertical pipes that carry the oil and gas are the conductors. The parts of the structure that are embedded in the bottom and protrude through the surface to support the topside structural components form the jacket that includes the crossbeams, legs, and the piles inside the legs. In general, the jackets of California platforms are made of carbon steel and the topsides are composed of steel plate and other structural steel components. Platforms also contain a relatively small amount of cement.
Crossbeams and diagonal beams occur about every 30 m (100 ft.), from near the surface to the seafloor. The beams extend both around the perimeter of the jacket and reach inside and across the platform. This web work of cross beams provides a great deal of habitat for both invertebrates
ing spatial variability and trends in fish populations at these sites is important as it aids in understanding the regional importance of platforms as fish habitat. These sites included a wide range of such mesohabitats as banks, ridges, and carbonate buildups, ranging in size from a few kilometers in length to less than a hectare in area. On these features, we focussed on hard bottom macrohabi-tats, including kelp beds, boulder and cobble fields, and bedrock outcrops following standard, statistically based sampling methods and techniques.
Physical Oceanography and Biogeography of the Platform Study Area
General DescriptionThe study area includes the Santa Barbara Channel
and Santa Maria Basin (Figure 1.1). These oceanographic bodies are situated in a dynamic marine transition zone between the regional flow patterns of central and southern California. The Santa Barbara Channel is about 100 km long by about 50 km wide (60 x 20 miles) and is bordered on the south by the Northern Channel Islands (San Miguel, Santa Rosa, Santa Cruz, and Anacapa). Within the Santa
����
����
����
����
����
�������������
��������
�����
������������
�������
����������������
���������������� ����������
������
�������������
����
����
����������������
��������������
����������
�����
�����
�������
�������
������������
��������������
�������������������
���������
��������
�
���� �
���� �
������������
������������
�������������
��������
�����
������������
�������
����������������
���������������� ����������
������
�������������
��������
�������
��������
��������
����������
������������
��������
����������
��������
����
����
����
��������
��������
�����������������������
�����������
���������������
�����
���������������������
�������� ����������
������
���
����
��
��
��
����������������������
�������
����������
Figure 1.1. Location of oil and gas plat-forms off central and southern California. Figures 1.1a and 1.1c indicate platforms surveyed at least once or at least partially by research submersible (stars). Figure 1-1b indicates platforms (triangles) and natural outcrops (diamonds) surveyed by scuba. Depths of platforms surveyed are also included.
Figure 1.2. A typical oil/gas platform off southern Califor-nia. Adapted from Manago and Williamson (1998).
Figure 1.3. Satellite image of sea surface temperature (SST) and a diagram of the large-scale current patterns off the central and southern California coast. This image shows the predominant, large-scale SST pattern along with smaller scale features such as eddies and fronts (temperature scale, degrees Celsius). The generalized flow of the California Current (CC), the Inshore Countercurrent (IC), and South-ern California Eddy (SCE) overlay the SST image. Plumes of cold, nutrient-rich, upwelled water (represented by dark blue and purple) originate near the coast and are directed offshore (magenta arrows).

1-4
INTRODUCTION
1-5
INTRODUCTION
Barbara Channel is a basin that is about 500 m (1,650 ft.) deep. The predominant large-scale patterns of sea surface temperature distributions off California and smaller scale, but persistent, features such as eddies, fronts (strong tem-perature gradients), and plumes of cold, upwelled water that extend offshore from coastal headlands are depicted in Figure 1.3. The coastal current patterns are embedded in the complex California Current System (CCS) that extends from the Strait of Juan de Fuca at the Canada-US border to the tip of Baja California, Mexico (Hickey 1998). A generalized scheme of the CCS is presented in Figure 1.3. Waters off northern and central California are typically cool because of the southerly flowing California Current offshore the continental shelf and upwelling events generated over the shelf. Upwelling, which is most intense during the spring and summer, is generated by winds that blow toward the south along the coast. Cool coastal waters enter the Santa Barbara Channel through its west entrance at Point Conception. Warm waters from the Southern California Bight flow in the opposite direc-tion into the channel through its eastern entrance. The geographic orientation of the Southern California Bight shelters it from the winds that generate upwelling. Surface waters are substantially warmer in the Bight than north of Point Conception due to less wind-induced vertical mixing, the solar heating of surface waters, and currents of subtropical waters entering from the south (Lynn and Simpson 1987). The convergence of different water masses in the Santa Barbara Channel results in relatively large scale differences in physical parameters (e.g., temperature, salinity, oxygen, and nutrient concentrations) and biotic assemblages (e. g., flora and fauna).
Circulation in the Santa Barbara Channel is complex and highly variable (Hendershott and Winant 1996; Harms and Winant 1998; Winant et al. 1999). Santa Barbara Channel circulation typically is characterized by west-ward flow along the northern boundary of the Channel and eastward flow along its southern boundary (Figure 1.4). The relative strength of these opposing flows varies on scales of days to weeks and seasonally. Two opposing forces drive channel circulation: a wind gradient that is strongest in the west and a pressure gradient that is caused by higher water temperatures in the east. When these forces are balanced, a singular cyclonic (counter-clockwise rotat-ing) eddy forms in the western channel over its central basin. Cyclonic circulation is observed to be the strongest in the summer and weakest in the winter. Unidirectional currents toward
the east or west throughout the Santa Barbara Channel occur predominantly in the winter and tend to be short in duration. Throughout the year, smaller cyclonic and anticyclonic eddies, fronts, and jets are common in the Santa Barbara Channel and may be ephemeral or persis-tent for days to weeks. Circulation within this channel at any particular time is affected by a tendency for cyclonic flow and by the variability in the alongshelf currents that are of a scale larger than the channel.
The complex flow patterns and ocean conditions within the Santa Barbara Channel are affected by larger-scale oceanographic and atmospheric processes associ-ated with intra-annual (e.g., storms and seasonal pat-terns) and inter-annual (e.g., El Niño and La Niña events) variability and interdecadal climate regime shifts. These events are teleconnected to tropical Pacific and Pacific basin-wide atmospheric phenomena. Oceanographic condi-tions within the Santa Barbara Channel and along the California coast at-large changed dramatically between 1997 and 1999. Strong, warm-water El Niño conditions began late in the summer of 1997 and continued into the summer of 1998. Cool-water La Niña conditions manifested in early 1999 (Lynn et al. 1998; Hayward et al. 1999). El Niño events are linked to delayed and re-duced phytoplankton productivity, reduced zooplankton biomass, reduced growth and reproduction of coastal fishes, and increased mortality during their planktonic larval phase (Lenarz et al. 1995; McGowan et al. 1998; Kahru and Mitchell 2000). Our findings indicate that fish populations responded rapidly to the shift from El Niño to La Niña conditions along the coast.
Our observations indicate that, depending on bottom depth, a number of invertebrate species are abundant on the shell mounds. Common mound species include three species of seastars (Pisaster brevispinus, P. giganteus, and P. ochraceus), sunstars (Pycnopodia helianthoides, Rathbunaster sp.), bat stars (Asterina miniata), brittle stars, rock crabs (Cancer anthonyi, C. antennarius, and C. productus), king crabs (Paralithodes rath-buni), opisthobranchs (Pleurobranchaea californica), spot prawns (Pandalus platyceros), octopi (Octopus spp.), and sea anemones (Metridium sp.) (M. Love, unpublished observations).
DA
N D
UG
AN
Rock crab
Mussels and sea anemones
DA
N D
UG
AN
Mussels and sea stars
DA
N D
UG
AN
Club anemone and kelp rockfish
DA
N D
UG
AN
Metridium sp. and galatheid crab
LOV
ELA
B
Metridium sp.
MIL
TON
LO
VE
Spot prawn
Rathbunaster sp.
DO
NN
A S
CH
RO
EDER
LOV
ELA
B
a) Upwelling
Point Arguello
Point Conception
b) Relaxation
Point Arguello
Point Conception
c) Cyclonic
Point Arguello
Point Conception
d) Floods
Point Arguello
Point Conception
Figure 1.4. Generalized circulation patterns in the Santa Barbara Channel. (a) Upwelling; (b) Relaxation; (c) Cyclonic; (d) Flood east (shown) or west. Westward propagating train of cyclonic and anticyclonic eddies have also been observed (not shown). Adapted from Harms and Winant (1998).
The invertebrate communities of the jacket, conductors and shell mounds
The jackets and conductors of all platforms are very heavily encrusted with in-vertebrates. Depth zonation of the invertebrate community is evident. An extremely thick layer of mussels extends from the intertidal zone to depths of at least 30 m (100 ft) (and to at least 44 m, 145 ft., on some platforms). Both Mytilus gallopro-vincialis and M. californianus occur in these upper depths, although M. gallopro-vincialis is more common in the shallower portions of this zone (J. Dugan, personal communication). Although mussels dominate this habitat, other invertebrate taxa are abundant in this upper layer. Common inhabitants include barnacles, seastars (primarily Pisaster giganteus), rock scallops (Crassadoma gigantea), rock oysters and jingle shells (Chama arcana and Pododesmus cepio), sea anemones (Anthopleura xanthogrammica, Metridium sp.), ca-prellid amphipods, rock crabs (Cancer
antennarius), limpets (including Lottia gigantea, Lottia sp., Tectura spp., and Acmaea mitra), gooseneck barnacles (Pollicipes polymerus), and sessile tunicates. With greater depth, the diverse mussel community wanes and tends to be replaced by a blanket of club anemones (Corynactis californi-cus). At greater depths yet, white anemo-nes (Metridium sp.) and sponges begin to dominate these platform structures. These organisms, along with crabs (Munida sp.) and sea stars, characterize the deepest parts of the deepwater platforms we sur-veyed (J. Dugan, personal communication; M. Love, unpublished observations).

1-6
INTRODUCTION
1-7
INTRODUCTION
0–119 ft. depth) and natural outcrops (6–20 m, 20–66 ft.) (Figure 1.6). Typically, we performed three surveys from July to November of each year during 1995 to 2000, although some platforms were sampled less frequently. Fish enumeration methods consisted of fish counts and fish size estimates using both visual and underwater videography methods. Visual surveys recorded fish density and size (total lengths) using underwater plastic sheets and slates. All divers performing visual counts had received training in size estimation. Additional size estimates were obtained using a Hi-8 mm video camera and laser calibration system. The visual estimates of size and relative abundance were used first in data analyses and video size data were occasionally used to supplement visual estimates.
In each platform survey, scuba divers recorded obser-vations while swimming a pattern which incorporated all four corner legs and the major horizontal crossbeams and portions underneath the platform jacket at three different depths (Level 1 range 6–10 m, 20–33 ft.; Level 2 range 12–21m, 40–70 ft.; Level 3 range 25–36 m, 83–119 ft.) (Figure 1.7). Natural reef surveys consisted of diver observations
Superimposed on the inter-annual variability, which include the El Niño and La Niña anomalies, are climate-ocean changes that occur throughout the entire North Pacific Basin on decadal scales. A well documented cli-matic shift occurred rapidly during 1976 to 1977. It was marked by abrupt changes in sea surface temperature patterns and the circulation of a predominant atmo-spheric feature of the northeast Pacific known as the Aleutian Low. Since that time in the northeast Pacific, macrozooplankton biomass and a number of nearshore fish stocks in the California Current system have declined (Roemmich and McGowan 1995). In 1999, a number of physical and biological changes in the northeast Pacific indicated another shift from a warm to cool regime (Bograd et al. 2000). Recruitment of young-of-the-year rockfishes to platforms in the Santa Barbara Channel was exceptionally high in 1999. The permanence of this shift to cool conditions is uncertain.
Small-Scale Oceanographic Variability within the Santa Barbara Channel
Interesting patterns of fish abundance are related to the complexity and dynamics of the hydrography and circulation within the Santa Barbara Channel. Certain aspects of our research are focussed on the biological significance of fronts and eddies to the transport and sur-vival of early juvenile stages of marine fishes. Typically, these features are generated by local-scale interactions of wind, opposing water mass currents, and tides. This is especially true where the coastline is characterized by irregular topography and bathymetry, as is the case in the Santa Barbara Channel and the Southern California Bight (Owens 1980) (Figure 1.1). As mentioned, fronts and eddies affect how fishes are pelagically distributed in the region and may ultimately affect the timing and loca-tion of young-of-the-year settlement. For example, we sampled high densities of pelagic juvenile fishes within an eddy in the Santa Barbara Channel. The location of the eddy was determined by analysis of surface current maps generated from remote-sensing radar (Nishimoto and Washburn 2002). Furthermore, we have discovered that sea surface temperature fronts can be used to identify boundaries that separate reef habitat with high and low levels of juvenile rockfish settlement (Love, Nishimoto, Schroeder, and Caselle 1999). Mesoscale features that are visible in sea surface temperature images and surface current maps potentially can be used along with other oceanographic data to identify areas where benthic re-cruitment is likely.
The Santa Barbara Channel as a biological transition zone
Marine organisms from distinctively different northern and southern biogeographic communities occur in the Santa Barbara Channel as resident popula-tions or as seasonal or occasional visitors making this a rich, biological transition zone (Horn and Allen 1978). A few examples of warm-temperate and subtropical fishes that are more common in southern California (defined as south of Point Conception) than in central California and that we have observed at platforms in the Santa Barbara Channel are Mexican rockfish, kelp bass, yellowtail, and Pacific barracuda. Examples of cool-temperate fishes that have distributions centered from central California to the Pacific Northwest and may occur at platforms include cabezon, kelp green-ling, lingcod, and many rockfishes (e.g., blue, canary, widow, and yelloweye).
MethodsA major research objective of this project was to de-
scribe and compare the spatial and temporal patterns of fish assemblages around platforms and natural rock outcrops. Between 1995 and 2001, we surveyed platforms sited over a wide range of bottom depths, ranging between 29 and 224 m (95 and 739 ft.) and sited from north of Point Arguello to off Long Beach. We also surveyed shallow-water and deep-water rock outcrops, many in the vicinity of platforms. Scuba surveys were conducted at shallow depths (< 36 m, 119 ft.), and submersible surveys at deeper depths.
Most of our platform surveys were conducted at nine structures (Platforms Irene, Hidalgo, Harvest, Hermosa, Holly, Gilda, Grace, Gina, and Gail) located in the Santa Barbara Channel and Santa Maria Basin (Figure 1.1). Be-tween 1995 and 2000, we conducted scuba surveys on the shallow portions of these nine platforms (Figure 1.1b). The shallowest of the nine platforms, Gina, was surveyed from top to bottom using scuba. Deeper-water surveys between 1995 and 2001, using a research submersible, surveyed the same platforms excluding the bottom of Gilda and all of Gina (Figure 1.1a). In 1998, we made one submersible survey around Platform Edith, located off Long Beach (Figure 1.1c) and in 2000 we made partial submersible surveys around platforms C, B, A, Hillhouse, Henry, Houchin, Hogan, and Habitat (Figure 1.1a). Poor
water visibility prevented us from completing the surveys around the latter eight structures. Appendix 1 lists all of the platforms and includes their dimensions, depths, locations, and the years these structures were surveyed.
Nine nearshore, shallow-water rock outcrops, seven on the mainland and two at Anacapa Island were sur-veyed from 1995 to 2000 by scuba (Figure 1.1b). These surveyed natural outcrops are distributed across the Santa Barbara Channel region and are exposed to water masses similar to that of the surveyed oil platforms. In addition, we surveyed over 80 deeper-water outcrops, in waters between 30 and 360 m (100 and 1,180 ft.) deep (Figure 1.5). Most of these deeper-water sites were visited once, a few were surveyed during as many as four years and one outcrop, North Reef near Platform Hidalgo, was sampled annually.
Shallow Portions of Platforms and Nearshore Natural Outcrops
Scuba surveys estimated density (individuals per hectare), mean size (total length), and species composi-tion of reef fishes in shallow portions of platforms (0–36 m,
����
����
����
����
����
��������
����
����
Submersible Dive Sites1995-2001
������������
��������������
�������������
��������������
���������������
����������
����������
����������
���������������
���������������������
����������������
�����������������
��������������������������
�������������
�������������
����������
�������������������������
�������������
�����������
����������������
���������
��������
�������������
����������
�������������
����������
������
������
Figure 1.5. Platform and natural outcrops surveyed by Delta submersible, 1995–2001. Concentric rings denote sites surveyed in more than one year. Stars indicate platforms. See Figure 1.1 for names of platforms.

1-8
INTRODUCTION
1-9
INTRODUCTION
collected along four haphazardly placed 30 m length x 2 m width x 2 m (100 x 7 x 7 ft.) height belt transects, two transects each at approximately 7 m (23 ft.) and 14 m (46 ft.) bottom depths corresponding to the inshore and offshore portions of the reef. Each transect included sampling of three strata: surface, midwater, and bottom portions of the water column, one above the other. Habitat measures using a random point count method (2 points/m) were taken along the same transects for characterization of physical and biological attributes. Quantified habitat features included relief height (0 to 0.1 m, 0.1 to 1 m, 1 to 2 m, and > 2 m), substrate type (sand/mud, cobble, and rock), and percent cover of ses-sile invertebrates and fleshy algae. We also measured the percent cover of surface canopy of giant kelp, Macrocystis pyrifera, and stipe density of large kelps, especially M. pyrifera, Pterygophora californica, and Eisenia arborea, along the transects.
Deeper Portions of Platforms and Deeper Natural Outcrops
Below scuba depths, we surveyed fish assemblages using the Delta submersible, a 4.6 m, 2-person vessel, operated by Delta Oceanographics of Oxnard, Califor-nia (Figure 1.8). Aboard the Delta, we conducted belt transects about two meters from the substrata, while the submarine maintained a speed of about 0.5 knots. At the platforms, transects were made around the bottom of the platform and around each set of cross beams to a mini-mum depth of 20–30 m (66–100 ft.) below the surface (e. g., midwater habitat). The belt transect was also used to sample the shell mounds and natural rock outcrops. The
shell mounds and outcrops were sample in consistently the same fashion as the platform method described above.
Submersible surveys were conducted during daylight hours between one hour after sunrise and two hours before sunset. During each transect, observations were taken from one viewing port on the star-board side of the submersible. An external-ly mounted Hi-8 mm video camera with associated lights filmed the same viewing fields as seen by the observer. The observer identified, counted, and estimated the lengths of all fishes and verbally recorded those data on the video. All fishes within 2 m (7 ft.) of the submarine were counted. Densities were calculated as fish per 100 m2. Fish lengths were estimated using a pair
of parallel lasers mounted on either side of the external video camera. The projected reference points were 20 cm (8 in.) apart and were visible both to the observer and the video camera. An environmental monitoring system aboard the submarine continuously recorded date, time, depth, and altitude of the vessel above the seafloor. The environmental data was overlaid on the original videotape upon completion of each survey.
Transect videos were reviewed aboard the research ves-sel or in the laboratory. Field observations were transcribed into a database. For each fish, we recorded the following
Figure 1.6. A scuba diver surveys fishes around Platform Gina.
Figure 1.7. A schematic illustration of the diver platform surveys.
Figure 1.8. The research submersible Delta. Delta is a 2-person untethered vehicle.
Figure 1.9. Annual midwater trawling and oceanographic surveys, 1995–2000. (a) F/V Gus-D was chartered for research; (b) pelagic juvenile rockfish and other small fishes were sorted from the catch that included euphausiids and various jellies; (c) modified Cobb trawl rolled around spool; (d) deploy-ment of conductivity-tempera-ture-depth profiler.
JAM
ES F
ORT
E

1-10
INTRODUCTION
1-11
INTRODUCTION
information: (1) species (if known); (2) estimated total length; (3) the habitat it occupied (e.g., rock, sand, mud, cobble, boulder); (4) its position relative to the substrate (e. g., in crevice, on reef crest, on slope, above structure); and (5) the distance of the fish from that substrate.
Midwater Trawling and Oceanographic Surveys
Recruitment, the settlement to a benthic habitat of pelagic juveniles or larvae, is an important process in-fluencing the fish assemblages found on platforms and natural outcrops. To better understand spatial and tem-poral patterns of recruitment and sources of recruitment variability, we conducted annual midwater trawling and oceanographic surveys in the vicinity of the Santa Barbara Channel and Santa Maria Basin. Our goal was to describe how regional patterns of circulation and distribution of hydrographic features (such as fronts and eddies) influ-enced the distribution and relative abundance of pelagic juvenile fishes. Our focus on this life stage would allow emphasis on settlement and delineation of nursery habi-tats, including both platforms and natural outcrops.
Annual midwater trawling and oceanographic sur-veys were conducted from 1995 through 2000. Sampling was conducted during June to coincide with the time when the most juveniles of the early spring spawning rockfishes would be present in the water column. A modi-
Figu
re 1
.10.
Ann
ual m
idw
ater
tra
wlin
g su
rvey
s, 1
995–
2000
. Map
of s
tati
ons
whe
re t
raw
l sam
ples
wer
e co
llect
ed. S
urve
ys ty
pica
lly w
ere
cond
ucte
d in
Jun
e an
d in
clud
ed 1
0 ni
ghts
of s
ampl
ing.
-121
.1-1
20.9
-120
.7-1
20.5
-120
.3-1
20.1
-119
.9-1
19.7
-119
.5-1
19.3
-119
.1
33.7
33.8
33.9
34.0
34.1
34.2
34.3
34.4
34.5
34.6
34.7
34.8
34.9
�����
����
��� �����
����
����
���
����
����
���
���
����
����
����
���
���
����
����
����
����
����
����
����
���
���
����
���
����
�
�����
��
������
������
����
����
����
����
������
������
����
����
��
������
������
����
����
��
������
������
����
����
��
������
������
����
����
��
������
������
����
����
��
������
������
����
���
Mid
wat
er T
raw
ling
Su
rvey
sJu
ne-
July
, 199
5–20
00
fied anchovy trawl with a codend of 9 mm mesh was used to collect samples at depths between 20 m and 55 m (66–182 ft.) below the surface (Figure 1.9). Towing speed was about 2 knots, and trawling time was 15 minutes at the targeted depth. All fishing was conducted at night to minimize net avoidance. Fishes were identified to species if possible and measured in the laboratory. The shipboard surveys included vertical profiling of water properties at all trawling stations so that we could associate patterns of fish abundance with local hydrographic conditions. Salinity, potential temperature, and potential density anomaly, and dynamic height were derived from the data collected using a conductivity-temperature-depth (CTD) profiler (SBE-19, SeaBird Electronics). The CTD was lowered to 200 m (660 ft.) or to about 10 m (33 ft.) above the bottom at shallower stations. Daily satellite imagery, hourly sea surface current maps, and underway sea surface temperature observations were used to direct sampling when it was based on the location of surface circulation features such as fronts and eddies. The specific objective of each survey differed from year to year, see Love et al. (1997, 1999, 2001), Nishimoto (2000), and Nishimoto and Washburn (2002) for details. Surveys were conducted throughout the Santa Barbara Channel, in adjacent waters outside of the channel, and around the Northern Channel Islands (Figure 1.10).
Black-and-Yellow rockfish at Platform Holly.
DA
N D
UG
AN

1-12 2-1
Oil and gas seeps, often the result of geological defor-mation of the oil-saturated strata, are a common global occurrence. The famous La Brea tarpits, found near downtown Los Angeles, is just one of many seeps found in California. Offshore, seeps are visible on the ocean surface as oil slicks or gas bubbles. As noted by California Resources Agency (1971), “Some [seeps] remain dormant for extended periods of time and then become reacti-vated, probably by pressure buildup or earth movement. Because of the transient nature of many seeps, an accu-rate count is difficult to obtain; however, it appears that there are probably 50 to 60 seeps and seep areas on the ocean floor between Point Conception in Santa Barbara County and Huntington Beach in Orange County.”
Native Americans in many parts of California, but particularly along the southern California coast, mined those land seeps that contained hard, high-grade as-phaltum. The soft tar derived from offshore seeps and diverted to beaches was rarely, if ever, used. California Native Americans used asphaltum in a variety of ways. Baskets and water bottles were made watertight, arrow-points and hook barbs attached to shafts, broken stone vessels repaired, canoes caulked and sealed and shell decorations were inlaid on various objects. The Chu-mash of coastal southern California melted asphaltum and mixed it with pine resin to create an effective adhesive for many of these uses.
Early European explorers noted the presence of these seeps. “The Spanish explorer Fages, in 1775, said that ‘At a distance of two leagues from this mission [San Luis Obispo] there are as many as eight springs of a bitumen or thick black resin…’ Fr. Pedro Font, in 1776, while near Goleta in Santa Barbara County wrote ‘…much tar which the sea throws up is found on the shores, sticking to the stones and dry. Little balls of fresh tar are also found. Perhaps there are springs of it which flow out into the sea, because yesterday on the way the odor of it was perceptible, and today…the scent was as strong as that perceived in a ship or in a store of tarred ship tackle and rope” (Heizer 1943).
While European settlers in California also utilized asphalt from terrestrial seeps in limited ways, primarily for water proofing and lubrication, there was relatively little interest in oil seeps until about 1850, when it became more widely known that kerosene, an excellent substitute
for whale oil in lamps, could be distilled from crude oil. While Dr. Abraham Gesner, a Canadian geologist, is officially credited with inventing this process in 1849, others may also have stumbled onto this idea. In Cali-fornia, the first person known to use partially refined oil for illumination was General Andreas Pico, the brother of Pio Pico, the last Mexican governor of California. In 1850, General Pico distilled kerosene from oil taken from hand dug pits in Pico Canyon (near Newhall, southern California) and used it for lighting a home. By 1854, miners had excavated into Sulphur Mountain in Ventura County (southern California), were hauling out the oil that seeped into their tunnels and had set up stills to produce kerosene. Throughout the 1850 and 1860s, vari-ous companies mined seeps for petroleum and produced kerosene or kerosene-like products.
In California, the first well (as opposed to hand-dug pit) that was designed to produce oil was a failure. It was drilled in Humboldt County in 1861 and it, along with others in the same county between 1861 and 1864, came up dry. However, the first productive well, drilled in 1865, came in from this county. This was quickly followed up by successful wells in Ventura and other localities. It was not until 1876 that the first truly commercial well was developed in Pico Canyon, the site of General Pico’s first pit mine. The next 20 years saw production rapidly esca-late, with new fields explored and developed in a number of locations in central and southern California.
The first oil production from submarine strata in California occurred in Summerland, a sleepy village south of Santa Barbara formally founded in 1889 as a spiritualist colony. For years, Summerland residents had noted both the heavy scent of oil that frequently hung over the community and the numerous seeps that dotted their coastline. In fact, natural gas was so plentiful that when boys wanted to play baseball at night “…they would drive short pieces of pipe into the ground about four or five inches, and would light them, and there would be a gas flame at least a foot high from the top of the pipe. Fifteen or twenty of these pipes along the edge of the road gave plenty of light for them to play after dark. When they got called in to go to bed, each had a flat board, and they would whack the board down over the flame, and out it would go.” (Lambert 1975).
In the late 1880s and early 1890s, several Summer-
Chapter 2
A BRIEF HISTORY OF OIL DEVELOPMENT IN SOUTHERN CALIFORNIAMilton S. Love
Opposite: Flag rockfish at Platform Harvest. (Photograph by Donna Schroeder)

2-2
A BRIEF HISTORY OF OIL DEVELOPMENT IN SOUTHERN CALIFORNIA
2-3
A BRIEF HISTORY OF OIL DEVELOPMENT IN SOUTHERN CALIFORNIA
land residents had struck oil while digging water wells and at least one would fill barrels from a bucket, haul them by buckboard to Santa Barbara, and sell the oil to laundries. Drilling for oil just back from the ocean commenced shortly after and by 1897 both the beaches and short stretch between ocean and coastal hills were blanketed with drilling rigs. In 1896, W. L. Watts of the California State Mining Bureau reported that “It is also evident that the oil yielding formations extend south into the ocean…At low tide, springs of oil and gas are uncovered on the seashore.” (Rintoul 1990).
True to the prediction, the first pier holding a well was built in 1897. This was perhaps the world’s first well brought in over water, a record also reportedly claimed for the Baki (formerly Baku) (Republic of Azerbaijan) oil fields in the Caspian Sea and by Pennsylvania for drilling into Lake Erie. Within a few years there were 11 piers (harboring over 200 wells), one of them stretching 1,230 feet offshore (Figure 2.1). The Summerland piers continued to produce oil until 1939, when the last well was destroyed by high tides and high surf.
In the 1920s, a series of discoveries along the Santa Barbara Channel, particularly at Rincon (northwest of Ventura) and Ellwood and Capitan (west of Santa Barbara) led to additional offshore drilling. While all of these discoveries were made on land, development
quickly extended onto piers. However, rather than being built of wood, these piers were more heavily constructed of steel pilings and reinforced concrete caissons.
The year 1932 saw the erection of the first oil plat-form off California and perhaps in the world. In that Depression year, the Indian Petroleum Company was faced with a dilemma. Geological evidence implied that productive oil-bearing strata lay offshore of Rincon (just northwest of Ventura). However, the costs of building a pier out to that formation were prohibitive. The company solved the problem by building part of a pier, located about 1,200 feet beyond the end of the nearest pier. Con-structed of steel in 38 feet of water, the aptly named “Steel Island” was eventually home to three wells (Figure 2.2). It lasted until 1 January 1940, when “…mountainous waves battered the platform. The structure went down. There was no loss of life, but equipment was destroyed and wells damaged. Rohl-Connolly Company, marine contractors, removed equipment, derrick and steel pil-ings from the ocean floor; cut off casing at the floor of the ocean; and placed 6-foot cement plugs in the tops of the water strings” (Rintoul 1990).
Later oil and gas discoveries that were of importance to offshore development included those at Huntington Beach, Wilmington and Seal Beach. However, it was not until 1954, that the next step in offshore production oc-
curred with the creation of the first man-made drilling island, “Monterey”, situated 1.5 miles offshore of Seal Beach in 42 feet of water. Construction on the island commenced in 1952, but a lawsuit by the city of Seal Beach prevented drilling until 1954. The circular island “…75 feet in diameter, had an outer rim formed of in-terlocking sheet-steel piling driven into the ocean floor to depths of 15 to 20 feet. The interior was filled with rock and sand barged in from Catalina Island” (Rintoul 1990). In succeeding years five other oil islands (Grissom, White, Freeman, Chaffee, and Esther) were built.
Oil islands were only practical in relatively shallow waters and when industry-led seismic surveys and bot-tom coring discovered potential fields in deeper offshore waters, the stage was set for the development of oil plat-forms. In June 1958, the California State Lands Commis-sion held its first sale of tidelands leases, ending a freeze that had held up offshore drilling on new sites. The first
Figure 2.1. Oil piers off Summerland, California, about 1904 (from Rintoul 1990).
Figure 2.2. Built off Rincon, southern California, in 1932, the “Steel Island” was one of the first oil platforms in the world.
PHO
TO C
OLL
ECTI
ON
/LO
S A
NG
ELES
PU
BLI
C L
IBR
ARY
platform constructed was Platform Hazel, located about two miles offshore of Summerland in 100 feet of water. As noted in Rintoul (1990) regarding Hazel’s construction, “In that same month, Standard [Oil] towed an imposing tower a distance of 210 miles… to the Summerland tract. The tower was 75 feet square and 170 feet high. It was a major component of Platform Hazel and was to serve as the foundation on which the 110-foot square deck would be mounted…The tower was floated to the job site on the four big caissons that formed the bottom portion of the tower’s legs, each 40 feet high and 27 feet in diameter. Each caisson was pressurized to prevent leakage and also ballasted with 90 tons of sand for stability…Once on bot-tom, the caissons were sunk 22 feet into the ocean floor by means of high pressure water and air jets that literally hosed away the bottom sands, allowing the caissons to rest on hard ground. The final anchoring was accom-plished by filling the caissons with 6,000 tons of sand

2-4
A BRIEF HISTORY OF OIL DEVELOPMENT IN SOUTHERN CALIFORNIA
3-1
Stripetail rockfish on shell mound of Platform Gail.
LIN
DA
SN
OO
K
and concrete…The cost of building and installing the platform was $4 million.” In September 1958, Standard Oil began drilling from the newly constructed platform and within one month the first well, bottoming out at 7,531 feet began producing 865 barrels per day. This was followed two years later by the construction of nearby Platform Hilda.
In subsequent years, a number of platforms were in-stalled in both state and (beginning in 1967 with Platform Hogan) federal waters in southern California. However, expansion of offshore oil drilling came to an abrupt halt in 1969, with the disastrous blowout and subsequent oil spill at Platform A (installed in 1968) in the Santa Barbara Channel. And while discussion of both opposition and support for oil development are beyond the scope of this report (see Beamish et al. 1998, Nevarez et al. 1998, and Paulsen et al. 1998 for more information), it is safe to say that the subsequent environmental concerns about the safety of offshore oil exploration, development, and production delayed further drilling for a number of years. It was not until the late 1970s that installation of new platforms resumed. No new platforms have been erected since 1989 (Nevarez et al. 1998).
How do platforms get their names?
On the Pacific Coast, platform names have to con-form to a set of rules promulgated by the U. S. Coast Guard. The Coast Guard created a series of zones (“15-minute quadrangles”) along the Pacific Coast beginning at the U. S. – Mexican border. The names of all platforms in a zone must begin with the same letter. Platforms in the first zone, off San Diego, would begin with “A”. The southern-most platforms (Emmy, Edith etc.) lie off Long Beach, in the “E” zone.
Industry personnel imply that the choice of names have often been made in a disarmingly casual way. For instance, the project engineer for Hermosa ap-parently named that structure after the elementary school attended by his daughter. Ellen and Elly are said to honor the wives of the engineers in charge of those platforms’ construction. Hondo, meaning “big” in Spanish, was so christened because at the time it was the tallest (measured from the seafloor) of the California platforms. One story has it that, because a nearby platform was later installed to tap the same reservoir as Hondo, it was named Harmony. Hogan and Houchin were the surnames of two presidents of Phillips Petroleum.
Why do Platforms A, B and C, despite their loca-tions in the H zone, not have “H” names? These were installed in the days before the Coast Guard regula-
tions were mandatory.
There was no single characteristic fish assemblage that could be described for the oil platforms and natural outcrops of central and southern California. However, we identified a number of patterns in fish diversity and abundance that corresponded to bottom depth, geo-graphic area, and year. Depth played an important role because, in general, rockfishes numerically dominated fish assemblages around platforms and deep natural reefs, and rockfish species segregate themselves according to habitat depth. We also observed biogeographic partitioning in species composition, where northerly platforms show the influence of the Oregonian province and southerly platforms show the influence of the San Diegan province. These zoogeographic patterns were more conspicuous in shallow water fish assemblages. The large inter-an-nual fluctuations in juvenile fish recruitment observed during the studies may have been generated by the large inter-annual variability in oceanographic conditions (e.g., upwelling, El Niño-Southern Oscillation events). Since juveniles of many species inhabited shallow and midwater portions of oil platforms, the greatest temporal variability in fish abundance occurred at these depths.
We present more detailed summaries of fish assem-blages identified by the two different survey methods (scuba and submersible) in the sections below. The common and scientific names of fishes observed in these studies are listed in Table 1.
1. Shallow Water Fish Assemblages: 0–36 m (119 ft.)
Findings at a GlanceA combination of regional and local processes
influenced patterns of reef fish assemblages in shal-low water. At regional scales, composition and rela-tive abundance of reef fishes often shifted abruptly as oceanography changed. This shift delineated a cool-temperate assemblage in the western Santa Barbara Channel, and a warm-temperate assemblage in the eastern Santa Barbara Channel. This distinct spatial pattern was reflected in both platform and natural reef habitats. There was greater variability in platform spe-cies assemblages and population dynamics compared to natural outcrop assemblages and dynamics, and this was most likely caused by the offshore position
and greater sensitivity of platform habitats to chang-ing oceanographic conditions. Local processes which affected fish distribution and abundance were related to habitat features, where depth, relief height, and pres-ence of giant kelp all played important roles. We found that the majority of juvenile rockfish recruits resided at depths greater than 26 m (86 ft.), although there were differences among species.
Except where noted, the following synopsis encom-passes platforms Irene, Hidalgo, Harvest, Hermosa, Holly, Grace, Gilda, Gail, and Gina and are based on diver surveys conducted between 1995 and 2000.
1a. General Patterns
The two primary research objectives were to (1) describe the spatial and temporal variability of shallow water (less than 36 m, 119 ft.) fish assemblages residing on oil/gas production platforms and natural outcrops, and (2) describe the relative importance of regional pro-cesses (e.g., oceanographic patterns) compared to local processes (e.g., habitat features) in generating observed patterns of reef fish assemblages. An understanding of mechanisms which structure marine populations is nec-essary to predict the outcome of resource management decisions related to marine fisheries, platform decommis-sioning, and marine protected areas on fish assemblages within the Santa Barbara Channel region (including the Santa Maria Basin). A list of species observed at each platform is given in Appendix 2.
We find that a combination of regional and local processes influenced patterns of reef fish assemblages in shallow water. At regional scales, composition and rela-tive abundance of reef fishes often shifted abruptly as oceanography changed. This shift delineated a cool-tem-perate assemblage in the western Santa Barbara Channel, and a warm-temperate assemblage in the eastern Santa Barbara Channel. Rockfishes and surfperches domi-nated the cool-temperate assemblage, and damselfishes, wrasses, and sea chubs dominated the warm-temperate assemblage. This distinct spatial pattern was reflected in both platform and natural outcrop habitats.
Within each of the cool- and warm-temperate as-semblages, local habitat features modified patterns of
CHAPTER 3
A REVIEW OF BIOLOGICAL AND OCEANOGRAPHIC SURVEYS: RESULTS AND ANALYSESMilton S. Love, Donna M. Schroeder, and Mary M. Nishimoto

3-2
RESULTS AND ANALYSES
3-3
RESULTS AND ANALYSES
species abundance and distribution. For example, kelp surfperch and giant kelpfish were only observed on rocky outcrops that possessed stands of giant kelp, Macrocys-tis pyrifera. Other factors likely to have been important were outcrop or platform depth and relief height. These local scale features sufficiently decoupled sites within an oceanographic region (cool- or warm-temperate) to make broad generalizations about fish assemblages difficult, especially within platform habitats.
Temporal dynamics of reef fish assemblages also resulted from a complex, dynamic interaction between regional oceanography and local habitat features. The diverse array of oceanographic conditions that occurred during the six-year survey period appeared to strongly influence regional dynamics of fish assemblages. The 1997–1998 El Niño event corresponded to a large increase in juvenile recruitment of spe-cies which dominated the warm-temperate fish assemblage (e.g., blacksmith), while the 1999 La Niña event corresponded to a large increase of juvenile recruitment of species which dominated the cool-temperate fish assemblage (e.g., rockfishes). Severe win-ter storms that accompany El Niño events propagated into small-scale variability at some sites. For example, the scouring effect of severe storm waves depleted red algal turf (a forage base for small crustaceans and fish) on two shallow natural outcrops. This forage base reduction may have been the primary cause of the observed synchronous decline in surfperch abundance at the same outcrops.
1b. Shallow Water Fish Assemblages Surrounding Oil/Gas Production Platforms
As observed on natural outcrops (see Section 1d), shallow water fish assemblages surrounding oil/gas pro-duction platforms show distinct spatial patterns which correspond to oceanographic patterns in the Santa Bar-bara Channel. Rockfishes are numerically dominant in west channel platform fish communities, although 1999 was a strong recruitment year for juvenile rockfish at all platforms. Blacksmith and halfmoon are numerically dominant in east channel platform assemblages. Platform fish assemblages appeared to respond faster and more dramatically to changing oceanographic conditions than natural reef assemblages, perhaps due to their offshore position and higher proportion of juvenile fishes.
There were notable differences among platforms within an oceanographic region. These differences
may be due to water depth in which the platform is positioned, where deeper water can inhibit species such as surfperches from migrating onto platform habitat. Among-platform differences may also be influenced by food availability or other factors. During the 1997–1998 El Niño event, juvenile blacksmith recruited onto all platforms, but did not recruit onto Tarantula Reef, the closest natural reef to west channel platforms surveyed in this study. This observation suggests that platforms may “capture” pelagic stages of some reef fish species that might have otherwise perished.
The fish assemblage observed at Platform Gina (depth 29 m, 95 ft.) is noteworthy because of its very high density of kelp bass and because of the large diversity of rockfishes that recruit to its shell mound
habitat. Anecdotal observations at a nearby shipwreck did not record either of these characteristics in its local fish assemblage. High turnover of fish species diversity has also been noted at Platform Gina (Love, Nishimoto, Schroeder, and Caselle 1999).
1c. Depth Distribution of Juvenile Fish Recruitment on Oil Platforms
For all fishes observed at all Southern California Bight platforms surveyed at shallow depths, approxi-mately 27% were observed in the shallowest portions of platform habitat (6–12 m, 20–40 ft.). Most of these were pelagic fishes, such as anchovy and barracuda. Twenty-seven percent of all fishes were observed at intermediate depths (15–26 m, 50–86 ft.), and 46% were observed at deeper depths (27–36 m, 89–119 ft.). We observed that the majority of juvenile rockfish recruits resided at depths
� �� �� �� ���
����������������
��������������
��������
����������
����������
Sebastomus��������
��������������
����������������
���������
����������
��������
����������
������������
����������
������������������������
�������
�������
�������
Figure 3.1. Percent of juvenile fish density observed during scuba surveys at different depths on offshore platforms during 1995–2000. Depth ranges for each strata: level 1 (6–12 m), level 2 (15–26 m), level 3 (27–36 m).
greater than 26 m (96 ft.) (Figure 3.1), although there were differences among species. The olive-yellowtail group and copper-complex species group (black-and-yellow, copper, gopher, and kelp rockfishes) had the largest percentages residing at shallower depths. Our observations on cop-per-complex rockfishes represent a somewhat different vertical distribution than that described by Holbrook et al. (2000). This disparity may be due to differences in surveyed platforms and program duration (6 platforms within one biogeographic area during 1995–7 versus 9 platforms in 3 biogeographic areas during 1995–2000). This difference underscores the importance of evaluat-ing platforms on a case-by-case basis and in developing monitoring programs over multiple years.
Our results correspond with Holbrook et al. (2000) regarding vertical distribution of midwater juvenile rockfishes (e.g., bocaccio, blue, and widow) where the vast majority of individuals recruited to depths greater than 26 m (86 ft.). The majority of individuals of other rockfish species such as squarespot, treefish, and the Sebastomus subgenus (e.g., rosy, greenspotted, starry
rockfishes, and others) are also found below 26 m (86 ft.). Kelp and painted greenling recruits, two species associated with the cool-temperate fish fauna, mimic the vertical distribution of rockfish recruits, preferring deeper portions. In contrast, garibaldi and blacksmith recruits, two species associated with the warm-temperate fish fauna, favor upper portions of platforms, suggest-ing temperature may play a role in determining depth distribution of juvenile fishes at platforms.
1d. Fish Assemblages on Nearshore Natural Outcrops
The relative importance of spatial versus temporal variability in structuring fish assemblages on shallow natural outcrops differed among sites. Ordination anal-ysis revealed that natural outcrops in the west channel tended to be more sensitive to temporal variability than those outcrops positioned in the east channel. This seems intuitive since west channel outcrops are closer to areas of intense and temporally variable upwelling processes which affect mean water temperature, primary produc-tion, and dispersal processes of larvae.
Kelp bass at a nearshore platform.
JAM
ES F
ORT
E

3-4
RESULTS AND ANALYSES
3-5
RESULTS AND ANALYSES
Similar to platform habitats, the fish assemblages on natural outcrops showed distinct spatial patterns that seemed to correspond to regional oceanographic patterns in the Santa Barbara Channel. Rockfishes and surfperches were important species in west channel fish communi-ties, although 1999 was a strong recruitment year for juvenile rockfishes at most natural outcrops. Blacksmith, garibaldi, sheephead, opaleye, and rock wrasse were im-
������������
���������������
������������
������������
������������
���������������
���������������
������ �������� ������������������
��
��
�
���
��� � �� �� ��
�
���
���
���
���
�
����
����
����
���� � ��� ��� ��� ��� �
�����������
����������������������
���������������������������������
�����������������������
�����������������������
Hidalgo
Irene
Holly
Deep platformspecies
Shallow platformspecies
Grace
Harvest
Gail Hermosa
������������
�������������
������������
���������������������
������
�������� ��������������������������
�������� ������ ���������� ��������������������
����������
�������������
��������������������������
���������������������� ���������
��������� ���������������
�������������
����������������������
������ ������
��
��
Figure 3.2. 3.2a. Canonical Discriminant Analysis of the bottom and shell mound fish assemblages at seven plat-forms, 1996–2001. 3.2b. Canonical Discriminant Analysis of the bottom and shell mound species found around seven platforms, 1996–2001. Two groups, one characteristic of shallow platforms, the other of deeper structures are ap-parent. Black dots represent species that were not strongly associated with either axis.
������������
���������������
������������
������������
������������
���������������
���������������
�������� ��������
�
�
��
�� � � �� ��
�
���
�
����
���� � ��� �
����
����
�����
����
����
����
����
���
�
���������������������������������
����
����
����
����
����
���
�����������������������
Platform Holly species
Holly
����������������������
����
�����������
����������
��������
�����������������
������
�������������
����������
����
���������
���������
������
�����
������
�������������
����������
��������
��������������
��
��
Figure 3.3. 3.3a. Canonical Discriminant Analysis of mid-water fish assemblages at seven platforms, 1996–2001. Note that the Platform Holly fish assemblage is distinct from the others. 3.3b. Canonical Discriminant Analysis of the mid-water species found around seven platforms, 1996–2001. Note that a group of species tends to be more characteristic of Platform Holly than other platforms. Dots represent spe-cies that were not strongly associated with either axis.
Grace, and Gail, based on surveys conducted between 1995 and 2001 from the research submersible Delta.
2a. General Patterns
All of the platforms studied by submersible had three distinct fish assemblages, midwater, bottom, and shell mound (Figure 3.2a). Rockfishes, totaling about 35 species, dominated all three fish assemblages. Fish densities at most platforms tended to be highest in the midwater reflecting the depth preferences of young-of-the-year rockfishes that represented the most abundant size class of fishes.
Midwater assemblages were more similar to each other regardless of platform location and bottom depth. The assemblage at Platform Holly had the only distinct
midwater assemblage (Figure 3.3a). A suite of species (e.g., calico, copper, and gopher rockfishes, pile, and sharpnose seaperches) characterized this particular as-semblage (Figure 3.3b). Holly has the shallowest bottom depth (standing in 64 m, 211 ft.), and it might be that these shallow demersal species were able to occupy these shallow midwater crossbeams. The midwater fish assem-blages around the other platforms showed no systematic depth or geographic relationships.
The composition of platform bottom and shell mound fish assemblages was dependent on the bottom depth of the platform (Figure 3.2a) and certain species are characteristic of either shallow or deep benthic habitats (Figure 3.2b). Platforms Holly and Irene (64 m and 73 m; 211 and 241 ft., respectively) were dominated by brown, calico, copper, and vermilion rockfishes and lingcod. In deeper waters, Platforms Hermosa, Harvest, and Gail (183 m, 205 m, and 224 m; 604, 677, and 739 ft., respectively) were dominated by greenblotched, greenspotted, and greenstriped rockfishes. Platform Hidalgo, and to a certain extent Platform Grace, both at intermediate depths (130 m and 96 m, 429 and 317 ft., respectively), were inhabited by species common to both the shallower and deeper platforms. In general, our data suggests that shell mound fish assemblages most closely resemble the fish assemblages of their adjacent platform bottoms (Figure 3.2a). Fishes living on the shell mounds are generally smaller, and presumably younger, than the same species living around the platform bottom.
portant species in east channel fish communities. Kelp bass, black surfperch, and senorita were abundant at all sites. Because we observed abrupt spatial changes in abundance for many species in the Santa Barbara Channel, it is tempting to attribute these patterns solely to oceanographic processes. However, habitat features may covary with oceanography, and we are currently unable to distinguish between these processes.
Dispersal of pelagic stages does not appear to be the primary factor in structuring fish assemblages. For the eight common species in the warm-temperate as-semblage that have pelagic larvae, six species exhibited very low or no juvenile recruitment onto shallow rocky outcrops in the Santa Barbara Channel. This suggests that dispersal of benthic stages plays a critical role in the dynamics of reef fish communities and local temperature may be an important criterion in habitat selection. Some species important in the warm-temperate fish assemblage (e.g., kelp bass and opaleye) declined in abundance dur-ing the cold La Niña year of 1999. The response of reef fish communities to oceanographic regime shifts may be faster and less persistent than previously thought.
2. Deeper-water Platform Fish Assemblages: 31–224 m (103–739 ft.)
Except where noted, the following synopsis encom-passes platforms Irene, Hidalgo, Harvest, Hermosa, Holly,

3-6
RESULTS AND ANALYSES
3-7
RESULTS AND ANALYSES
The size distribution of fishes differed by habitat type. The midwater assemblages harbored few fishes over 20 cm (8 in.) long (Figure 3.4). Immature, mostly young-of-the-year rockfishes and young painted green-ling dominated midwater depths. In addition, seaperches, blacksmith, and several less abundant species inhabited this zone. In contrast, older and larger rockfishes, lingcod, and several other benthic species, occupied the platform bottom habitat. Rockfishes also dominated the shell mounds. The size frequency of shell mound fishes tended to be intermediate between the two other habitats (Figure 3.4). This apparent partitioning of different size modes
0
50
100
150
200
250
0–30
31–6
0
61–9
0
91–1
20
121–
150
151–
180
181–
210
211–
240
Num
ber
of F
ishe
s pe
r 10
0 m
2
Depth (m)
Figure 3.5. Density of young-of-the-year rockfishes observed from the Delta submersible, by depth, at all platforms sur-veyed, 1995–2001. Note that large numbers of these fishes were also observed by scuba divers in the shallower sections of the platforms.
��������
������
�������
������
�������
����
��������
���
�����������������������
�
���
�����������������������
�
���
���
���
���
���
�
�����
�����
���
���
���
���
���
���
���
���
���
�
�����
���
���
���
���
���
���
���
���
���
�
�����
���
���
���
���
���
���
���
���
���
�
�����
���
���
���
���
���
���
���
���
���
�
�����
���
���
���
���
���
���
���
���
���
�
�����
���
���
���
���
���
���
���
���
���
�
�����
������
�������
������
�������
����
��������
�������
������
������
�������
�������
����
��������
��������
��������
�������
������
������
�������
�������
����
�������
�������
���������
��������
���������
������
�������
����
������������������������
�������
�������
���������
��������
���������
������
������
�������
����
�������
�������
���������
��������
���������
������
�������
����
����� ����� ����� �������
������� �����������
Figure 3.6. Density, with standard error bars, of all fishes in midwater (by 30 m depth zones), bottom and shell mounds, at seven platforms, 1996–2001.
Among platforms, total fish densities typically fell within a relatively small range (Figure 3.6). In general, platforms furthest offshore and in deepest waters had somewhat lower fish densities than did those closer to shore in shallower waters. However, the absolute number of fishes around deeper water platforms may be greater than those in shallower waters, as deeper platforms are much larger than shallower water structures.
2b. Midwater Assemblages
Findings at a Glance Platform midwaters are nursery grounds for rockfish-
es as well as for other marine fish species such as cabezon and painted greenling. The young-of-the-year of at least 15 rockfish species inhabit these midwater habitats.
Benthic settlement success is greatly influenced by oceanographic conditions. During our study, densities of young fishes varied greatly between years and plat-forms. Young-of-the-year rockfish densities often varied
100
0 5 10 15 20 25 30 35 40 45 50 55 60 65 70 75 80 80
25
50
75
100
0 5 10 15 20 25 30 35 40 45 50 55 60 65 70 75
25
50
75
100
0 5 10 15 20 25 30 35 40 45 50 55 60 65 70 75
25
50
75
100
0 5 10 15 20 25 30 35 40 45 50 55 60 65 70 7580 80
25
50
75
100
0 5 10 15 20 25 30 35 40 45 50 55 60 65 70 75 80
25
50
75
100
0 5 10 15 20 25 30 35 40 45 50 55 60 65 70 75 80
25
50
75
100
0 5 10 15 20 25 30 35 40 45 50 55 60 65 70 75 80
25
50
75
Irene Hidalgo
Harvest Hermosa
Grace
Gail
Holly
����������������������
����������������������
����������������������
����������������������
����������������������
����������������������
����������������������
�����������������
����������������������������������
�����������������
�����������������
�����������������
�����������������
��������
������
������������
Figure 3.4. Frequency of occurrence of fishes in 5 cm size classes in midwater, bottom and shell mounds at seven platforms, 1996–2001.
was most evident in the deepest platforms. Around shal-low platforms, there was significant settlement of young-of-the-year rockfishes both in the midwater and at the bottom. This common feature blurred the distinctions between these two habitats.
Young-of-the-year rockfishes showed strong depth preferences around platforms (Figure 3.5). Young-of-the-year were often very abundant in the shallowest portions (above 30 m, 100 ft., depths) of the platform but were also abundant between 31 and 120 m depths (102–396 ft.). They were most abundant at depths between 61 and 90 m (201–297 ft.).

3-8
RESULTS AND ANALYSES
3-9
RESULTS AND ANALYSES
0
100
200
300
400
500
600 0
100
200
300
400
500
600 0
100
200
300
400
500
600
����
����
����
����
����
����
����
����
����
����
����
����
����
����
����
����
����
����
����
����
����
����
����
����
����
����
����
����
����
����
����
����
����
����
����
����
����
����
����
����
����
����
����
����
����
����
����
����
����
����
����
����
����
����
����
����
����
����
����
����
����
����
����
����
����
����
����
����
����
����
����
����
����
����
����
����
����
����
����
����
����
����
����
����
����
����
����
����
����
����
����
����
����
����
����
����
����
����
����
����
����
����
����
����
����
����
����
����
����
����
����
����
����
����
����
����
����
����
����
����
����
����
����
����
����
����
���������
���������
���������
���������
���������
���������
���������
���������
���������
���������
���������
���������
�
��
��
��
��
��
��
��
��
��
�
�� �
��
�� �
�����
������
����
����
������
����
����
�����
��
�����
������
����
����
������
����
����
�����
��
�����
������
����
����
������
����
����
��
�����
����
�����
����
����
�
����
����
����
���
����
����
����
���
������������������������ ������������������������ ������������������������
��
���
����
����
����
����
����
���
����
����
����
���
����
���
����
����
��
����
���
����
����
��
����
���
����
����
��
����
����
����
����
����
�
����
����
����
����
����
�
����
����
����
����
����
�
Figu
re 3
.9. D
ensi
ty o
f all
youn
g-of
-the
-yea
r bo
cacc
io a
nd w
idow
roc
kfis
h an
d al
l YO
Y r
ockf
ishe
s co
mbi
ned
in p
latf
orm
mid
wat
ers,
by
year
and
pla
tfor
m, 1
996–
2001
.
by a factor of 10 or even 100 among survey years at some platforms. From 1996 through 1998, rockfish settlement was generally higher around the platforms north of Point Conception compared to those structures in the Santa Barbara Channel, reflective of generally colder, more productive waters in central California. Colder waters in 1999 were associated with relatively high densities of young-of-the-year rockfish recruitment at all of the plat-forms surveyed. In 2000 and 2001, rockfish recruitment at platforms in the Santa Barbara Channel remained higher than pre-1999 levels. We hypothesize that this was related to the oceanographic regime shift to cooler temperatures that may be occurring in southern California.
Depending on platform location, we observed be-tween 13 and 29 fish species in the midwater habitats below 31 m (102 ft.) depths (Appendix 3). There was no relationship between platform bottom depth and either the number of species or species diversity in the midwater habitat (Figures 3.7 and 3.8). Relatively abundant non-rockfish species included blacksmith, sharpnose seaperch, and juvenile painted greenling. Occasionally, we observed influxes of migratory species such as Pacific sardine, jack mackerel, and Pacific mackerel. However, because our sur-veys are snapshots in time, they do not adequately capture the importance of platform habitats to these and other pelagic species. The most abundant fishes were young-of-the-year and older juvenile rockfishes and blacksmith. These are planktivorous and thus are not dependent on
the platform for food. They utilize these structures for orientation in the water column and as refuge from pre-dation. Less common species, such as seaperches, painted greenling, opaleye, and cabezon do feed on animals or algae living on the platform jacket or conductors.
Our research shows that oil and gas platforms off California provide important nursery grounds for many species of rockfishes. The most conspicuous faunal char-acteristic of the platform midwaters below scuba depth is the dominance of young rockfishes. Over the course of the study, young-of-the-year and older juvenile rockfishes almost always comprised more than 90% of all fishes observed in this habitat (Appendix 3). In some years, young-of-the-year rockfishes were virtually the only fishes present at some platform midwaters (Appendix 3).
The young-of-the-year of at least 16 rockfish spe-cies (bank, blue, copper, darkblotched, flag, gopher, kelp, olive, pygmy, shortbelly, squarespot, widow, yellowtail rockfishes, bocaccio, cowcod, and one or more members of the subgenus Sebastomus) recruited to the midwater habitat. Many of the species that were most abundant (e. g., blue, olive, pygmy, squarespot, widow, and yellowtail rockfishes and bocaccio) are those that are epibenthic or semipelagic as adults. Of these diverse young rockfishes, widow rockfishes were consistently the most abundant species at platforms. Among adult rockfishes, kelp and whitespeckled rockfishes were commonly observed.
���
�
���
�
�
���
����
���
���
��
���
����
���
���
��
����
���
���
��
��������
Platform MidwaterSpecies Diversity
Figure 3.8. Species diversity of fishes in the midwaters of seven platforms, 1996–2001. Platforms are listed from left to right, from shallowest to deepest.
40
30
20
10
0
Hol
lyIr
ene
Gra
ce
Hid
algo
Her
mos
aH
arve
stG
ail
Num
ber
of S
peci
es
Platform
Platform MidwaterNumber of Species
Figure 3.7. Number of species observed in the midwaters of seven platforms, 1996–2001. Platforms are listed from left to right, from shallowest to deepest.

3-10
RESULTS AND ANALYSES
3-11
RESULTS AND ANALYSES
Young-of-the-year and 1-yr old rockfishes of many species (e.g., bank, blue, olive, pygmy, shortbelly, square-spot, widow, and yellowtail rockfishes, and bocaccio) often formed highly mobile schools in the midwater habitat. During years of high abundance, these schools contained many thousands of individuals. Our experi-ence suggests that these schools remained either inside the platform or ventured only a few meters outside it. Schools of young rockfishes tended to more closely asso-ciate with the jacket substrate during years of low recruit-ment or when water visibility was poor. However, when their numbers were high or water clarity was good, young rockfishes, while still living within the platform structure, only loosely associated with the crossbeams and vertical structure. In general, the schools occurred throughout 50 to 100 m or more (150–300 ft.) of the water column. Young copper, gopher, kelp, and flag rockfishes, treefish, and cowcod, as well as cabezon and painted greenling were generally observed either as solitary individuals or in small groups, usually intimately associated with the platform jacket.
Young-of-the-year rockfish settlement (recruitment) to midwater habitats is also strongly influenced by ocean-ographic conditions. The density of these fishes varied greatly inter-annually by location and among platforms (Figure 3.9). Spatial and temporal differences in young-of-the-year rockfish densities often varied by a factor of 10 or even 100. In several instances, a species that was entirely absent from a platform midwater in one year would recruit in great numbers in the following year. Be-tween 1996 and 1998, young-of-the-year rockfish recruit-ment was generally higher around the platforms north of Point Conception in the Santa Maria Basin (Irene, Hidalgo, Harvest, and Hermosa) than at the structures in the Santa Barbara Channel (Holly, Grace, and Gail) (Figure 3.9). In contrast, these three years were a period of low rockfish recruitment for many species south of Point Conception both at platforms (Holly, Grace, and Gail) and natural outcrops. The colder water conditions of 1999 brought with it widespread recruitment for a number of rockfish species in California compared to the previous decades. This was reflected at all of the platforms surveyed (Figure 3.9). We should note that the 2000 data at Platforms A, B, C, Hillhouse, Hogan, Houchin, and Henry (see sidebar) strongly suggest that recruitment for some rockfish species, particularly blue and widow rockfishes, had been very successful in 1999. In 2000 and 2001, recruitment of some rockfish at Plat-forms Gail and Grace remained higher than pre-1999 levels (Figure 3.9). We hypothesize that this represents a successful response to the oceanographic regime shift to cooler temperatures that may be occurring in southern California and the greater northeast Pacific.
The population dynamics of bocaccio exemplifies the annual and geographic variability that occurs in rockfish recruitment at both platforms (Figure 3.9) and natural
outcrops (Figure 3.10). Prior to 1999, young-of-the-year bocaccio were absent at the platforms we surveyed (except Irene in 1996 and 1997). During 1999, large densities of young-of-the-year bocaccio were observed at Platforms Irene and Grace; small numbers of at least a few indi-viduals were observed at most other platforms. Platform Grace provided the most striking example of inter-annual variability. Almost no young-of-the-year bocaccio were observed at Platform Grace prior to 1999. In contrast, dur-ing 1999, the platform harbored the third highest densities (after 1996 and 1999 at Platform Irene) of young bocaccio we observed around either platforms or natural outcrops during the six years of research. It is important to realize that even in years of relatively high rockfish recruitment, the actual process of settlement may result in a patchy distribution of young-of-the-year benthic recruits. Such patchiness was observed in the bocaccio recruitment pattern in 1999 at Platforms Grace and Gail, which are located only 8 km (5 miles) apart. While Platform Grace harbored large numbers of young bocaccio, they were much less abundant at nearby Platform Gail. Further-more, our research has shown that successful rockfish recruitment at platforms does not always translate to
similar high densities of these species at nearby natural outcrops. Using the Delta, in 1999 we also surveyed 12 natural outcrops located in depths suitable for bocaccio recruitment and found little evidence of bocaccio recruit-ment over any of these structures (Figure 3.10).
In 2000, we studied the midwater habitats of Platforms C, B, A, Hillhouse, Henry, Houchin, Hogan, and Habitat. These platforms, located off Summerland east of Santa Barbara (Figure 1.1), were home to many typical midwater reef fishes, including juvenile blue, olive, and widow rockfishes (of the 1999 year class), blacksmith, kelp rockfish, kelp bass, painted greenling, halfmoon, and sharpnose seaperch. Unlike the species assemblage of the further offshore and the more north-erly platforms, both garibaldi and California sheephead were common. In 1998, we surveyed Platform Edith and again found a typical mix of reef fishes, includ-ing blacksmith, halfmoon, opaleye, sheephead, and garibaldi. Complete species assemblages for all of these
platforms are found in Appendix 3.
Figure 3.10. Patterns of young-of-the-year (YOY) bocaccio settlement in 1999, as observed from the Delta submersible surveys.
Pacific sardines, midwaters of Plaform Holly. Young-of-the-year yellowtail rockfish, midwaters of Platform Irene.
Juvenile bocaccio and widow rockfish, midwaters of Platform Grace.
DA
N D
UG
AN
RIC
K S
TAR
R
MA
RY N
ISH
IMO
TO

3-12
RESULTS AND ANALYSES
3-13
RESULTS AND ANALYSES
2c. Bottom Assemblages
Findings at a GlanceThe bottom habitat of platforms is dominated
by subadult and adult rockfishes. Young-of-the-year rockfishes were also abundant around some platform bottoms, occasionally in large numbers. In general, more than 90% of all the fishes found around platform bottoms were rockfishes. The numbers and estimated densities of all fishes in the bottom habitats are shown by platform in Appendix 3. Bottom depth strongly in-fluenced the number of species, species diversity, and density of fishes living around platform bases. This is in direct contrast to the midwater habitat. The presence of young-of-the-year and older aged juveniles indicates that the bottom habitat of some platforms may be im-portant nursery habitat for some species. The platform base appears to be important to many marine species, as it provides both refuge and prey.
Depth strongly influences fish assemblages in plat-form bottom habitat. Species richness varied widely from about 33 species at Platform Holly to 17 species at Plat-form Harvest. Generally, the shallower-water platforms harbored more species than platforms in deeper depths although this trend may have begun to reverse at Gail, the deepest platform (Figure 3.11). Species diversity was high at the shallowest and deepest platforms and lowest among the mid-depth structures (Figure 3.12). Conversely, overall fish densities were much higher at the mid-depth platforms than at the deepest platforms (Figure 3.13).
Diversity and abundance patterns were driven by the depth preferences of a suite of rockfishes that domi-nate the bottom habitats. For instance, brown, calico, copper, and vermilion rockfishes were most abundant around the shallower structures but were absent from the deepest platforms (Figure 3.13). Pile perch, painted greenling, and young-of-the-year lingcod displayed the same pattern. Juvenile lingcod were also abundant at the shallowest platforms, particularly at Platform Irene, but these were also occasional around even the deep-est structures surveyed. Halfbanded rockfish and flag rockfish were typically found at the intermediate-depth platforms. Greenblotched, greenspotted, greenstriped, pinkrose, and stripetail rockfishes were most abundant around the deeper structures (Figure 3.13). The juveniles of many of these species were found in shallower water or on the shell mounds.
Platform structure in the bottom habitats may influ-ence the distribution of fishes. This habitat encompasses that area where the platform jacket and conductors physi-cally meet the seafloor. At all of the platforms surveyed, there is a crossbeam that rests on, or is close to, the bot-tom. Some portions of this crossbeam may be completely buried by sediment or undercut by currents. The plat-form jacket and, in particular, the undercut crossbeam, appears to provide many of the attributes of a natural outcrop, providing high relief and large crevices. Many species, such as canary, flag, vermilion, and widow rock-
40
30
20
10
0
Hol
lyIr
ene
Gra
ce
Hid
algo
Her
mos
aH
arve
stG
ail
Num
ber
of S
peci
es
Platform BottomNumber of Species
Figure 3.11. Number of species observed at the bottom of seven platforms, 1996–2001. Platforms are listed from left to right, from shallowest to deepest.
���
�
���
�
�
���
����
���
���
��
���
����
���
���
��
����
���
���
��
Platform BottomSpecies Diversity
Figure 3.12. Diversity of fishes at the bottom of seven plat-forms, 1996–2001. Platforms are listed from left to right, from shallowest to deepest.
���
����
���
���
��
���
����
���
���
�
���
����
���
�
���
����
���
���
��
���
����
���
���
�
���
����
���
�
���
����
���
���
��
���
����
���
���
�
���
����
���
�
���
����
���
���
��
���
����
���
���
�
���
����
���
�
���
����
���
���
��
���
����
���
���
�
���
����
���
�
���
����
���
���
��
���
����
���
���
�
���
����
���
�
���
����
���
���
��
���
����
���
���
�
���
����
���
�
���
����
���
���
��
���
����
���
���
�
���
����
���
��
���
���
����
���
���
��
���
����
���
���
�
���
����
���
�
���
����
���
���
��
���
����
���
���
�
���
����
���
�
���
����
���
���
��
���
����
���
���
�
���
����
���
����
���
���
��
���
����
���
���
�
���
����
���
����
���
���
��
���
����
���
���
�
���
����
���
�
���
����
���
���
��
���
����
���
���
�
���
����
���
�
���
����
���
���
��
���
����
���
���
�
���
����
���
�
���
����
���
���
��
���
����
���
���
�
���
����
���
�
���
���
�
���
���
���
���
���
�
���
���
���
��
��
�
��
��
��
��
��
�
�
�
�
��
��
�
��
��
��
�
��
��
��
�
�
�
�
�
�
�
�
�
�
�
�
���
���
�
���
���
��
���
���
��
�
�
��
�
����
�
�
�
�
�
����
�
��
�
��
�
�
�
�
��
�
�
�
�
�
�
�
�
�
�
�
��
�
�
��
��
��
�
�
�
��
�
�
��
��
�
�
�
�
�
�
�
�
�����
����
�����
�����
����
����
����
�����
�����
����
���
�����
����
�����
�����
����
����
����
�����
�����
����
���
All Fishes
Calico Rockfish
BrownRockfish
VermilionRockfish
All Rockfishes CopperRockfish
Pile Perch Painting Greenling
Halfbanded Rockfish
Greenspotted Rockfish Greenstriped Rockfish
Flag Rockfish
Lingcod(juvenile)
Lingcod(YOY)
GreenblotchedRockfish
Pinkrose Rockfish
Figure 3.13. Densities (with standard error bars) of all fishes, all rockfishes and the most important species at the bottom of seven platforms, years combined, 1996–2001.

3-14
RESULTS AND ANALYSES
3-15
RESULTS AND ANALYSES
0510 050100010203040500
500
1000
������������������������
������������������������
������������������������
������������������������
������������������������
������������������������
������������������������
������������������������
������������������������
������������������������
������������������������
������������������������
������������������������
������������������������
������������������������
������������������������
������������������������
������������������������
������������������������
������������������������
������������������������
������������������������
������������������������
������������������������
������������������������
������������������������
������������������������
������������������������
��������� ���������
���������
��������� ���������
���������
���������
���������
���������
���������
���������
���������
���������
���������
���������
���������
���������
���������
���������
���������
���������
���������
���������
��
�
��
�
��
��
��
��
��
��
��
�
��
��
��
��
�
��
��
��
��
��
�����
�������
�������
�������
�����
�����
����
�����
�������
�������
�������
�����
�����
����
�����
�������
�������
�������
�����
�����
����
�����
�������
�������
�������
�����
�����
����
����
����
���
�����
�
����
����
����
���
���
����
����
����
����
��
���
����
����
����
����
������������������������
Figu
re 3
.14a
. Den
siti
es o
f sel
ecte
d sp
ecie
s at
the
bott
om o
f sev
en p
latf
orm
s, b
y pl
atfo
rm, b
y ye
ar, 1
996–
2001
.
0510152025012345 01020 01020
������������������������
������������������������
������������������������
������������������������
������������������������
������������������������
������������������������
������������������������
������������������������
������������������������
������������������������
������������������������
������������������������
������������������������
������������������������
������������������������
������������������������
������������������������
������������������������
������������������������
������������������������
������������������������
������������������������
������������������������
������������������������
������������������������
������������������������
������������������������
���������
���������
���������
���������
���������
���������
��������� ������������������
���������
���������
���������
���������
���������
���������
���������
���������
���������
���������
���������
���������
���������
��
��
��
��
��
����
���
��
��
�����
����
��
��
��
���
����
�
�����
��
���
��
�����
�������
�������
�������
�����
�����
����
�����
�������
�������
�������
�����
�����
����
�����
�������
�������
�������
�����
����
�����
�����
�������
�������
�������
�����
�����
����
�����������
������
����������������������
�������������
������������������������
Figu
re 3
.14b
. Den
siti
es o
f sel
ecte
d sp
ecie
s at
the
bott
om o
f sev
en p
latf
orm
s, b
y pl
atfo
rm, b
y ye
ar, 1
996–
2001
.

3-16
RESULTS AND ANALYSES
3-17
RESULTS AND ANALYSES
fishes, bocaccio, pile perch, and painted greenling closely associate themselves with the platform jacket, particularly with the crossbeam. Similarly, larger copper, greenspotted, greenblotched, and pinkrose rockfishes and cowcod tend to shelter in-side or immediately next to the platform. These fishes were particularly abundant where a space formed between the low-est crossbeam and the seafloor. Calico and greenstriped rockfishes and various life stages of lingcod were less closely as-sociated with the structure. While most species rarely ascend more than a meter or two above the seafloor, bocaccio and halfbanded rockfish often rose as much as 5 m (17 ft.) above the bottom.
Most platform bottom species are either solitary or shelter in small groups. The exceptions are young-of-the-year rockfishes, juvenile and subadult brown, copper, halfbanded, and vermilion rockfishes, and bocaccio. On a number of occasions, we observed aggregations of tens
and hundreds of brown, copper, and vermilion rockfishes and bocaccio and large schools of halfbanded rockfish comprised of thousands of individuals.
Compared to midwater habitats, the fish species compositions at platform bottoms were relatively stable over time (Figures 3.14a, b). The dominant spe-
cies varied little between years at any platform. Thus a platform, such as Gail, that was dominated by adult greenspotted and greenblotched rockfishes, bocaccio, and cowcod in one year tended to be inhabited by these same species in all years in about the same abundances. Similar patterns were observed for such common spe-cies as painted greenling (Platforms Irene and Holly), greenspotted rockfish (Platforms Hidalgo and Hermosa), copper rockfish (Platforms Irene and Holly), and flag rockfish (Platform Hidalgo). It is likely that we were observing some of the same individuals each year. This constancy would be expected as these assemblages are at least partially composed of subadult and adult stages of relatively sedentary and long-lived rockfishes. Thus, the composition of the bottom assemblages is not de-termined by the year-to-year fluctuations in year-class success that is characteristic of the platform midwaters. However, the densities of a few important species, par-ticularly halfbanded rockfish, varied annually. In some years halfbanded rockfish were essentially absent from a platform bottom, only to be extremely abundant the following year. Schools of this species are highly mobile and may have been present but not in the vicinity of the submersible when the survey was made.
Our observations indicate that the bottom habitat of some platforms may be particularly important for certain species. For example, young-of-the-year lingcod densities were much higher at Platform Irene and Hidalgo than at any natural outcrop during any year of the survey (Appendix 4).
Unlike most of the fishes living in the platform mid-water, it is likely that the majority of the platform bottom-dwelling species feed on platform-associated prey. Many of these species, such as brown, copper, and flag rockfishes, eat a variety of crustaceans, molluscs, and small fishes, many of which live in and around the jacket, conductors, and shell mound. Other species, such as lingcod, cowcod, and bocaccio are opportunistic feeders, preying on a very wide range of organisms, including benthic and water col-umn fishes, molluscs, and crustaceans (Love et al. 2002). Thus, for many benthic fishes, the platform base provides not only shelter but also an abundant source of food.
We conducted one survey, in 1998, around the base of Platform Edith. We found that California scorpionfish, sharpnose seaperch, blacksmith, and blackeye goby were the most abundant species. See Appendix 3 for a complete species list.
2d. Shell Mound Assemblages
Findings at a GlanceShell mounds support a rich and diverse fish as-
semblage. As at other platform habitats, rockfishes comprise the vast majority of the fishes. The many small sheltering sites created by mussels, anemones, and other invertebrates on the shell mounds provided structure in a habitat dominated by small fishes. Many of these fishes are the young-of-the-year and older-aged juveniles of lingcod and copper, flag, greenblotched, and pinkrose rockfishes and cowcod. The adults of these species inhabit the platform bottom.
Depending on platform, we observed between 17 and 30 species living on this habitat. In the shell mound habitat, the patterns of species numbers, diversity, and fish densities were similar to those observed around the platform bottoms. Species numbers generally decreased with increasing depth (Figure 3.15) although it increased sharply at the Platform Gail, the deepest structure. This increase was due to the occurrence of a number of deeper water species (e. g., rex sole, blackgill rockfish, and Califor-nia smoothtongue) that were absent from other platforms. As in the platform bottom habitat, species diversity was highest at the shallowest and deepest platforms compared to shell mounds in intermediate depths (Figure 3.16).
The shell mounds surrounding all platforms pro-vided habitat and refuge for a diverse assemblage of fishes. Fish densities were highest on the intermediate-depth platform shell mounds (Figure 3.17). However, as in the platform midwater and bottom, a majority of these fishes are rockfishes; between 53% and 98% of all fishes living on the shell mounds are rockfishes (Appendix 3). Furthermore, when highly migratory and non-resident species, such as Pacific hake and Pacific sardine, are eliminated from the analysis, rockfishes comprise more than 80% of the shell mound fauna at each of the seven platforms surveyed. Those species most characteristic of the shell mounds exhibited distinct depth preferences (Figure 3.17) and the abundance of some of these fishes was responsible for the higher densities in the intermedi-ate bottom depths. The dominant species of the shallow water shell mounds were vermilion, copper, and calico rockfishes, young-of-the-year and immature lingcod, and painted greenling. A few species, such as greenspotted and halfbanded rockfishes, were most common in the in-termediate bottom depths. It was primarily the very high densities of halfbanded rockfish that were responsible for the overall high densities at intermediate-depth shell mounds. Greenstriped, pinkrose, and stripetail rockfishes
Bocaccio, bottom of Platform Gail. Subadult vermilion rockfish, bottom of Platform Grace.
Cowcod, bottom of Platform Gail. Lingcod, bottom of Platform Gail.
MIL
TON
LO
VE
DO
NN
A S
CH
RO
EDER
LIN
DA
SN
OO
K
MIL
TON
LO
VE
Mexican and greenspotted rockfishes, bottom of Platform Gail.
LIN
DA
SN
OO
K

3-18
RESULTS AND ANALYSES
3-19
RESULTS AND ANALYSES
were most abundant at the deepest platforms surveyed.The mosaic of small refuge sites created by mussels,
anemones, and other invertebrates are occupied by small fishes. Many of these fishes are the juveniles of such species as lingcod and copper, flag, greenblotched, and pinkrose rockfishes and cowcod, whose adults inhabit the adjacent platform bottom. Small sheltering sites are rarely found at the platform bottom. In part, this explains why fishes tend to be smaller on a shell mound than on the associated plat-form bottom (Table 2). This also explains why the shell mound assemblage so closely resembles its counterpart around the adjacent platform bottom. Painted greenling, calico, and halfbanded rockfishes, shortspine combfish, blackeye goby, and the poachers are among the dwarf spe-cies occupying the shell mound. Juveniles of the species characteristic of platform midwaters, such as blue and widow rockfishes, are rare over the shell mounds.
Most shell mound species are solitary fishes, living just above the seafloor or nestled among the shell debris or around anemones, seastars, and other large inverte-brates. The only schooling species is the halfbanded rockfish that often forms highly mobile schools of 100 to 1,000 or more individuals.
It is likely that many of the fishes, including most of the rockfishes, combfishes, painted greenling, and other benthic species are resident to the shell mound habitat. Highly mobile and migratory species, such as northern anchovy, Pacific sardine, and juvenile Pacific hake, that were observed over the shell mounds probably spend only a relatively short period associated with this habitat.
Shell mound surveys were conducted around
Platform Edith in 1998 and around Platform C in 2000. Young vermilion rockfish, as well as halfbanded and calico rockfish, were the most abundant species around Platform C. These species were also character-istic of the shell mound at Platform Holly, which lies in a similar depth. California scorpionfish and blackeye goby dominated the shell mound around platform Edith. Edith lies a few miles southeast of Long Beach and near a known California scorpionfish spawning grounds (Love et al. 1987). California scorpionfish are relatively uncommon in the Santa Barbara Channel and are rare north of Point Conception. This distribu-tion explains the near absence of this species from other shell mounds we surveyed.
40
30
20
10
0
Hol
lyIr
ene
Gra
ce
Hid
algo
Her
mos
aH
arve
stG
ail
Num
ber
of S
peci
esPlatform Shell Mound
Number of Species
Figure 3.15. Number of fish species observed on the shell mounds of seven platforms, 1996–2001. Platforms listed left to right from shallowest to deepest.
���
�
���
�
�
���
����
���
���
��
���
����
���
���
��
����
���
���
��
Platform Shell MoundSpecies Diversity
Figure 3.16. Diversity of all fishes observed on the shell mounds of seven platforms, 1996–2001. Platforms are listed left to right from shallowest to deepest.
����������
�����
�������
�������
�������
����
����������
�����
�������
�������
�������
����
����������
�����
�������
�������
�������
����
����������
�����
�������
�������
�������
����
����������
�����
�������
�������
�������
����
����������
�����
�������
�������
�������
����
����������
�����
�������
�������
�������
����
����������
�����
�������
�������
�������
����
����������
�����
�������
�������
�������
����
����������
�����
�������
�������
�������
����
����������
�����
�������
�������
�������
����
����������
�����
�������
�������
�������
����
����������
�����
�������
�������
�������
����
����������
�����
�������
�������
�������
����
���
��� �
���
���
��� �
� � ��� � � �
�� � ����� � � �
�� �� ����� �� � �
�� �� ����� � � �
�� � ����� � � �
� � � �
�� � ����� � � �
���
��� �����
���
��� �� �
� � � �
� � ��� � � �
� � ��� � � �
� � � �
���
������������������������ ������������������������ ������������������������
All
Fish
esA
ll Ro
ckfi
shes
Pain
ted
Gre
enlin
gCo
pper
Roc
kfis
hCa
lico
Rock
fish
Ling
cod
(YO
Y)
Stri
peta
ilRo
ckfi
sh
Ling
cod
(juve
nile
)V
erm
ilion
Roc
kfis
hH
alfb
ande
d Ro
ckfi
shG
reen
spot
ted
Rock
fish
Gre
enst
ripe
d Ro
ckfi
shPi
nkro
se R
ockf
ish
Gre
enbl
otch
edRo
ckfi
sh
Figu
re 3
.17.
Den
sity
(w
ith
stan
dard
err
or b
ars)
of a
ll fi
shes
, all
rock
fish
es, a
nd th
e m
ost a
bund
ant s
hell
mou
nd fi
sh s
peci
es fo
und
arou
nd s
even
pla
tfor
ms,
19
96–2
001.
Pla
tfor
ms
are
liste
d le
ft to
rig
ht fr
om s
hallo
wes
t to
deep
est.

3-20
RESULTS AND ANALYSES
3-21
RESULTS AND ANALYSES
����
�������
����
��������
����
�������� ����
����
����
����
���
���
���
���
���
���
���
���
���
���
���
���
���
�����������������������������������������������������������������������������������������������������������������������������������������������������������������������������������������������������������������������������������������
�������������������������������
��∞������
��∞������
��∞������
��∞�
�����
��∞�
����� ���∞������ ���∞������
���∞������
���∞������ ���∞������
����������
���∞����� ���∞����� ���∞�����
��∞�����
��∞�����
� � � � �� � � � � � � � � � � �
������������
�������������� �������
������ ������������������������
�������
������
��������������������������
�����������������������
�����
�����
�����
�����
�����
�����
�����
����������
�����
� � � �� �� � � ���� �� � � �
��������
������������
� �� �����
��� � ��� ��� ��� ��������������
���� � ���� �������������
�������������
��������������������������������������������������������������
�����������������
������������������������������������������������������������������������������������
NORTH REEF
HIDALGO
��������������������������������������������������
Figure 3.18. Locations of Platform Hidalgo and North Reef. Seafloor characterization by Gary Greene, Moss Landing Marine Laboratory.
96.6% of all fishes at Platform Hidalgo and North Reef, respectively. We observed a minimum of 34 fish spe-cies at each location. A few species were unique to each structure. Copper and stripetail rockfishes and California scorpionfish were found only at Platform Hidalgo, while blackeye goby, bluebarred prickleback, Pacific argentine, speckled sanddab, and an unidentified cuskeel were pres-ent only at North Reef. None of these species were major constituents of their respective fish communities.
However, when taking into consideration the fish assemblages of the three habitats (midwater, bottom, and shell mounds) at Platform Hidalgo, each was somewhat distinct from that of North Reef (Figure 3.19). To char-
acterize and distinguish between the species assemblages at Platform Hidalgo and North Reef, we compared only the benthic assemblages of the platform bottom and shell mound and North Reef. Canonical discriminant analysis showed that species assemblages at the bottom of Platform Hidalgo and its shell mound were some-what different from each other and from the North Reef assemblages (Figure 3.20a). The platform bottom assemblage was characterized by a suite of rockfishes, in-cluding bocaccio and cowcod, flag, vermilion, and widow rockfishes and lingcod. The shell mound assemblage was similar to and overlapped with the platform bottom, but was characterized by smaller fishes, such as swordspine,
3. A Comparison of Fish Assemblages at a Deeper Platform and a Nearby Natural Outcrop: Hidalgo and North Reef
Findings at a GlanceThe species composition at Platform Hidalgo and
North Reef are quite similar as both structures are domi-nated by rockfishes. In general, the distinctions between the platform and reef assemblages were based on differ-ences in species densities (rather than species presence or absence). Most species were more abundant at Platform Hidalgo than at North Reef. Halfbanded, greenspotted, flag, greenstriped, and canary rockfishes, all three life stages of lingcod (young-of-the-year, immature, adult), and painted greenling all had higher densities around the platform. Five species (i. e., pink seaperch, shortspine combfish, pygmy, squarespot, and yellowtail rockfishes) were more abundant at the reef. The dominance of small fishes at North Reef probably reflects fishing pressure that has cropped larger individuals. Young-of-the-year
rockfishes were found at both Platform Hidalgo (pri-marily in the midwaters) and at North Reef. In each of five years, young-of-the-year rockfish density was higher at the platform than at the reef. In several years, densities of these young fishes were more than 100 times greater at Platform Hidalgo than at North Reef.
We surveyed the fish assemblages at Platform Hidal-go and a nearby natural outcrop, North Reef, for the pe-riod 1996–2001. North Reef was compared with Platform Hidalgo because it is close to the platform (about 1,000 m, 3,300 ft., north of the platform) (Figure 3.18), and its depth (112 m, 370 ft.) is comparable to the platform’s 130 m (430 ft.). North Reef is a hard carbonate scarp, which is 1–4 m (3–13 ft.) high, 3,353 m2 in area and contains numerous boulders, caves, and crevices.
The species composition at Platform Hidalgo and North Reef are very similar (Table 3). Both habitats are dominated by rockfishes; they comprised 98.3% and
Pinkrose rockfish, shell mound of Platform Gail.
MIL
TON
LO
VE
Greenspotted and flag rockfishes, shell mound of Platform Gail.
MIL
TON
LO
VE
Young-of-the-year cowcod on shell mound of Platform Gail.
LOV
ELA
B, U
C S
AN
TA B
AR
BA
RA
Halfbanded rockfish, shell mound of Platform Hidalgo.
MIL
TON
LO
VE

3-22
RESULTS AND ANALYSES
3-23
RESULTS AND ANALYSES
4
3.75
3.5
3.25
3
2.75
2.5
2.25
2
1.75
1.5
1.25
1
.75
.5
.25
0
0
100
200
300
400
500
0
10
20
30
Gre
enbl
otch
edRo
ckfi
sh
Pain
ted
Gre
enlin
g
Gre
enst
ripe
dRo
ckfi
sh
Verm
ilion
Rock
fish
Ling
cod
(juve
nile
s)
Cana
ryRo
ckfi
sh
Ling
cod
(YO
Y)
Ling
cod
(adu
lts)
Squa
resp
otRo
ckfi
sh
Shor
tspi
neCo
mbf
ish
Pink
Seap
erch
Yello
wta
ilRo
ckfi
sh
Rock
fish
YO
Y
Hal
fban
ded
Rock
fish
All
fish
es(P
latf
orm
bott
om o
nly)
All
fish
es(P
latf
orm
bot
tom
and
mid
wat
er)
Flag
Rock
fish
Gre
ensp
otte
dRo
ckfi
sh
Pygm
yRo
ckfi
sh
�����
��������
����������������
����������
���
��������������������
����
��������������������
�
���
��������������������
�
Figure 3.21. Mean densities (with standard error bars) of the common species or species assemblages at Platform Hidalgo and North Reef, 1996–2001. Species or species assemblages are grouped by abundance.
5
-5
0
-5 0 5 10Canonical Discriminant 1 (19.21%)
Cano
nica
l Dis
crim
inan
t 2
Platform Hidalgobottom
Platform Hidalgoshell mound
PlatformHidalgo
midwater
North Reef
�
�
�
�
��
��
��
�� �� �� � � � � �
���
���
���
���
�
����
����
����
���� ���� ���� � ��� ��� ��� ���
����
�������
������
����
������������
���������������������������������
������������
��������
���
�����������������������
Platform Hidalgobottom
Platform Hidalgoshell mound
Shell moundspecies
North Reef
Platform bottom speciesNorth Reef species���������������
���������������� ���������
��������������
������������������ ���������
������ ����������������
����
���������
���������������������������
������������
�������
����������
�����������������������
��
��
Figure 3.20. 3.20a. Canonical Discriminant Analysis of fish assemblages at Platform Hidalgo bottom and shell mound habitats and North Reef, 1996–2001. Each yearly survey at North Reef was comprised of 2–3 transects and thus each year’s survey is represented by more than one cross. 3.20b. Canonical Discriminant Analysis of the species found around Platform Hidalgo, bottom and shell mound and North Reef, 1996–2001. Dots represent species that were not strongly associated with either axis.
Figure 3.19. Canonical Discriminant Analysis of fish as-semblages at Platform Hidalgo, midwater, bottom, and shell mound habitats and North Reef, 1996–2001.
greenstriped and halfbanded rockfishes, painted green-ling, and juvenile lingcod (Figure 3.20b).
In general, the distinctions between the platform and reef assemblages were based on differences in species densities rather than species presence and absence. The densities of a range of species varied between the two sites (Figure 3.21) and most exhibited higher densities at Platform Hidalgo than at North Reef (Figure 3.21). Halfbanded, greenspotted, flag, greenstriped, canary rockfishes, all three life stages of lingcod (young-of-the-year, immature, adult), and painted greenling were among the species that were more abundant around the platform. Five species (pink seaperch, shortspine comb-fish, pygmy, squarespot, and yellowtail rockfishes) were more abundant at the reef.
Young-of-the-year rockfishes were common at both Platform Hidalgo (primarily in the midwaters) and at North Reef, although species differences were observed. From our submersible surveys, we identified at least seven species of young-of-the-year rockfishes at Hidalgo (e.g., blue, bocaccio, olive, pygmy, squarespot, widow, and yel-lowtail). Our scuba surveys around that platform also noted young-of-the-year of the “copper complex,” composed of black-and-yellow, copper, gopher, and kelp rockfishes. Most of the young-of-the-year rockfishes at North Reef appeared to be pygmy, squarespot, and widow rockfishes.
The mean density of young-of-the-year rockfishes in the midwater habitat of Platform Hidalgo was higher than at North Reef (Figure 3.21). This probably reflects greater rockfish recruitment to the platform. This has important implications with respect to platform habitat values regarding settlement and fish production around

3-24
RESULTS AND ANALYSES
3-25
RESULTS AND ANALYSES
������������
���������������
������������
������������
�������������
������������
���������������
���������������
������ ������������������
��
�
��
���
��� � �� �� �� ��
�
���
���
���
���
�
����
����
�������� � ��� ��� ��� ��� �
�����������
��������������������
�
��������������������������������
�����������������������
�����������������������
Hidalgo
Irene
Holly
Deep platform species
Intermediate-depth platform species
Shallow platform species
������������
�������������������������
���������
����
��������������
��������
����������
����������
����������
���������
�������������
��������������
����������
���������
�������������������
����������������
����������������
�����
������
��
��
Figure 3.23. 3.23a. Canonical Discriminant Analysis of fish assemblages at seven platforms, bottom and shell mound, and all natural outcrops, 1996–2001. Each cross represents more than one natural outcrop. 3.23b. Canonical Discri-minant Analysis of the species found at seven platforms, bottom and shell mounds, and all natural reefs, 1996–2001. Crosses represent species that were not strongly associated with either axis.
�
���
���
���
���
���
���
���
���
��
��
��
��
���
���
���
���
���
���
���
���� ���� ���� ���� ���� ����
��
���
��
���
��
�
���
���
��
�
���
�
���
������
������
����
����
���
�
����
����������������
����������
Figure 3.22. Mean densities of young-of-the-year rockfishes, all species combined, at Platform Hidalgo midwater and North Reef, 1996–2001.
these structures. This recruitment pattern was repeated in each year of our surveys as young-of-the-year rockfish densities were always greater at the platform than at the outcrop (Figure 3.22). In some years, densities were more than 100 times greater at the platform.
4. A Comparison of Fish Assemblages of Platforms and Natural Outcrops off Central and Southern California
Findings at a Glance Based on surveys of seven platforms and over 80
natural outcrops, rockfishes dominate almost all of the platform and hard seafloor habitats. A greater number of species was observed at the natural outcrops (94) than at the platforms (85). There is a high degree of overlap in species composition and differences are primarily
due to generally higher densities for more species at platforms. In particular, widow rockfish young-of-the-year, canary, copper, flag, greenblotched, greenspotted, greenstriped, halfbanded, and vermilion rockfishes, bocaccio, painted greenling and all life history stages of lingcod were more abundant at platforms. Yellowtail rockfish and the dwarf species pygmy, squarespot, and swordspine rockfishes were more abundant on natural outcrops. Some of these differences can be explained by recruitment (settlement) processes and the greater chance for survival at the platform habitats. We believe that as fish size increases with age the platforms act as de facto marine reserves because fishing pressure is light or nonexistent. Platforms can be characterized as having higher densities of young-of-the-year rock-fishes than natural outcrops.
We compared the fish assemblages from the deeper parts of seven platforms (below about 30 m, 100 ft.) with those of similar depth natural outcrops. Analyses were based on platform surveys and on 133 dives at over 80 natural outcrops throughout southern California and off Point Conception and Point Arguello (Figure 1.5).
We observed at least 85 species at platforms and 94 species at outcrops (Table 4). Rockfishes dominated both habitats, comprising 89.7% of all fishes at platforms and 92.5% at outcrops. Platform fish assemblages were some-what different from those of natural outcrops (Figures 3.23a, b). However, these differences were due almost entirely to the generally greater numbers, of more spe-cies, of fishes around platforms, rather than differences in species composition between platforms and outcrops.
There was a distinct assemblage of fishes at the two shallow platforms, Holly and Irene, and another com-posed of species occupying the deeper platforms. Differ-
ences among platform bottom assemblages were more extreme than differences among shell mounds. This, too, was largely a function of greater fish abundance around platform bottoms than over the shell mounds. Intermediate-depth and deepest platforms were less distinct from each other than from shallow platforms. With or without the two shallow platforms (Holly and Irene) in our comparative analysis, the fish assemblages at the platforms still tended to be different from those at the natural outcrops (Figures 3.24a, b). These differ-ences were primarily due to most fish species being more abundant at platforms than at outcrops (Figure 3.25). Widow rockfish young-of-the-year, canary, copper, flag, greenblotched, greenspotted, greenstriped, halfbanded, and vermilion rockfishes, bocaccio, painted greenling, and all life history stages of lingcod were more abundant at platforms. Species that were more abundant at natu-ral outcrops than platforms included pygmy, squarespot, swordspine, and yellowtail rockfishes.
Platforms tended to harbor higher densities of young-of-the-year rockfishes than did natural outcrops. Young-of-the-year rockfishes primarily occurred in the platform midwaters. Thirteen of the 20 highest young-of-the-year rockfish densities were observed at Platforms Grace, Har-vest, Hermosa, Hidalgo, Holly, and Irene (Table 5). The highest young-of-the-year rockfish densities over natural outcrops were usually at high relief sites well away from the mainland. The California Current, which is centered

3-26
RESULTS AND ANALYSES
3-27
RESULTS AND ANALYSES
0
10
20
30
40
50
60
70
80
90
100
Co
pp
er R
ock
fish
Lin
gco
d (
YO
Y)
Pain
ted
Gre
enlin
g
Flag
Ro
ckfi
sh
Hal
fban
ded
Ro
ckfi
sh
Ver
mili
on
Ro
ckfi
sh
Bo
cacc
io (
YO
Y)
Gre
enst
rip
ed R
ock
fish
Lin
gco
d (
Juve
nile
)
Gre
ensp
ott
ed R
ock
fish
Lin
gco
d (
Ad
ult
)
Gre
enb
lotc
hed
Ro
ckfi
sh
Wid
ow
Ro
ckfi
sh (
YO
Y)
Can
ary
Ro
ckfi
sh
Bo
cacc
io (
Juve
nile
)
Pin
k Pe
rch
Bo
cacc
io (
Ad
ult
)
Squ
ares
po
t R
ock
fish
Yel
low
tail
Ro
ckfi
sh (
Ad
ult
)
Pyg
my
Ro
ckfi
sh
Swo
rdsp
ine
Ro
ckfi
sh
Perc
ent
of
Top
20
Site
s
Platform Reef
Figure 3.25. The relative importance of seven platforms (Irene, Hidalgo, Harvest, Hermosa, Holly, Grace, and Gail) and about 80 natural outcrops off central and southern California as habitat for common reef fish species. Densities of these species were computed for each year, at each location (platform midwater, bottom and shell mound, and natural outcrops) and ranked from highest to lowest. This figure displays the percentage that platforms or natural outcrops comprised of the top 20 densi-ties for each species (or species’ life history stage). For example, of all sites where copper rockfish were observed, the highest 20 densities were at various platforms, in a number of years. Similarly, the highest 20 densities of swordspine rockfish were all at natural outcrops. See Appendix 4 for underlying data.
���������������
������������
�������������
������������
���������������
���������������
������ ������������������
��
�
���
�
��
���
��� ��� � �� �� ��
���
���
���
���
�
����
����
����
�������� � ��� ��� ��� ��� �
�����������
��������������������
�
��������������������������������
�����������������������
�����������������������
Hidalgo
Hermosa
Grace
Gail
Harvest
Deep platform species
Intermediate-depth platform species
������������
�������������������������
���������
����
��������
������
����������
����������
����������
���������
�������������
��������
��������������
��������
����������������
������
������� ��������������
��
��
Figure 3.24. 3.24a. Canonical Discriminant Analysis of fish assemblages at five platforms (shallower platforms Holly and Irene deleted), bottom and shell mound, and all natu-ral outcrops, 1996–2001. Each cross represents more than one natural outcrop. 3.24b. Canonical Discriminant Analy-sis of the species found at five platforms (shallower plat-forms Holly and Irene deleted), bottom and shell mound, and all natural outcrops, 1996–2001. Crosses represent species that were not strongly associated with either axis.
offshore of the coastal shelf, influences these locations (e.g., San Nicolas and San Miguel islands) more than the mainland sites we surveyed. Furthermore, our observa-tions strongly imply that the midwaters of many platforms bear a striking resemblance to some of the relatively shal-low and steep-sided outcrops (such as those on Hidden Reef) that dot the outer continental shelf of southern California. In both cases, the assemblages are dominated by young rockfishes and larger fish predators are relatively uncommon. Thus, survivorship of young fishes may be higher in both habitats due to lowered predation rates.
The role that some platforms play as defacto marine refuges is supported by evidence of greater densities of rockfishes, particularly the larger size classes, at platforms compared to natural outcrops. As an example, densities tended to be higher at some platforms than at natural outcrops for: (1) all rockfishes regardless of size, (2) all
rockfishes greater than or equal to 30 cm (12 in.), (3) adult bocaccio, and (4) adult cowcod (Figures 3.26–3.29). Our experience is that rockfishes are most susceptible to being caught by both recreational and commercial gear when they reach about 30 cm (12 in.); thus, densities of fishes of this or larger sizes would be an indication of fish-ing pressure. Adult bocaccio and cowcod are overfished species with population sizes at levels less than 10% of unfished stock. These fishes at one time were abundant in southern California.
Rockfishes were observed at all of the platforms and outcrops we surveyed, with the exception of two sites on Piggy Bank (Figure 3.26). The highest rockfish densities (500 rockfishes or more per 100 m2) occurred at four platforms and at five natural outcrops; all of these structures were nursery grounds for young-of-the-year rockfishes. The assemblages of most of the other plat-forms and outcrops that harbored relatively high rockfish densities also were primarily composed of small rock-fishes, both immature individuals and dwarf species. This can be clearly seen when we focussed on rockfishes 30 cm (12 in.) or larger (Figure 3.27). The paucity of rock-fishes 30 cm (12 in.) or larger is evident even at the most productive sites (Figure 3.27). Highest densities of large rockfishes (10 rockfishes or more per 100 m2) occurred at three platforms and two natural outcrops. Many sites harbored no or only a few larger rockfishes.
Almost all of the natural outcrops we studied should have harbored large numbers of larger rockfishes. Their absence or rarity is almost certainly attributable at least
in part to fishing pressure. These sites were comprised of boulders or other structures that were suitable shelter sites for larger sized rockfishes. A few outcrops, such as sites near the Potato and Osborn Banks, were composed of cobble, a habitat that is less likely to harbor large rockfishes. Adult bocaccio were only abundant around Platform Gail and were relatively common at Platform Hidalgo, Reef “D” near that platform and a few sites around the northern Channel Islands (Figure 3.28). Even at these natural out-
crops, many shelter structures contained no or few adult bocaccio. Cowcod densities were also depressed (Figure 3.29). Relatively few rock outcrops surveyed contained adults, and platform Gail harbored the highest densities, although even here numbers were low. In general, the highest densities of adult bocaccio and cowcod occurred at platforms or at those outcrops that were protected from harvest by distance from ports or by being situated in areas susceptible to poor weather conditions.

3-28
RESULTS AND ANALYSES
3-29
RESULTS AND ANALYSES
���
����
����������
������
����
����
���
������
������
��� �
����
��
����
����
����
���
����
�
����
���
����
��
���
����
����
����
����
���
X
�����
����
���
�����
���������
�����
����
����
�����������
���
��������
����
���
������
����
����
����
����
����
����
����
�����
����
������������
��������������
�������������
�������������
���������� �����������
��������������
�������������
�����
������
����������������
���������
��������
������
����
������
����
������
����
�����
�����
�����
���������������������
�
�
�������������
����������
�������������
����������
�����
����
���
���
����
����
����
����
����
��
Figu
re 3
.26
. Den
sity
of a
ll ro
ckfis
hes,
rega
rdle
ss o
f siz
e, a
s obs
erve
d fr
om th
e D
elta
subm
ersi
ble
on p
latf
orm
s and
nat
ural
out
crop
s, 19
95–2
001.
Fis
h de
nsit
ies
for
Pla
tfor
ms I
rene
, Hid
algo
, Har
vest
, Her
mos
a, H
olly
, Gra
ce a
nd G
ail,
Nor
th R
eef a
nd r
eefs
“A”,
“B”,
“C”
and
“D”
in th
e vi
cini
ty o
f Pla
tfor
m H
idal
go r
epre
-se
nt m
eans
of y
ears
.
���
��������������
���������≥�����
���������
��������
������
� �
��
��������
�������
�������
���������
�������
��������������≥������
���������
X
������������
��������������
���������
����
��������������
��������
�������
������
����
��������
��������
��������
���������
������������
��������������
�������������
�������������
���������� �����������
��������������
�������������
�����
������
����������������
���������
��������
������
����
������
����
������
����
�����
�����
�����
���������������������
�
�
��
�
��
�
�
�� � ��
�
�
��
� �
�
�
�
��
�
�������������
����������
�������������
����������
�����
����
���
���
����
����
����
����
����
���≥
����
�
Figu
re 3
.27.
Den
sity
of a
ll ro
ckfi
shes
larg
er th
an o
r eq
ual t
o 30
cm
as
obse
rved
from
the
Del
ta s
ubm
ersi
ble
on p
latf
orm
s an
d na
tura
l out
crop
s, 1
995–
2001
. Fi
sh d
ensi
ties
for
Pla
tfor
ms
Iren
e, H
idal
go, H
arve
st, H
erm
osa,
Hol
ly, G
race
and
Gai
l are
from
pla
tfor
m b
otto
ms
and
dens
itie
s fo
r th
ese
seve
n pl
atfo
rms
and
for
Nor
th R
eef a
nd r
eefs
“A”
, “B
”, “C
” an
d “D
” in
the
vici
nity
of P
latf
orm
Hid
algo
rep
rese
nt m
eans
of y
ears
. Pla
tfor
ms
C, B
, A, H
illho
use,
Hog
an,
Hou
chin
, and
Hen
ry w
ere
not i
nclu
ded
beca
use
they
wer
e no
t com
plet
ely
surv
eyed
.

3-30
RESULTS AND ANALYSES
3-31
RESULTS AND ANALYSES
����
��������
�������
�������
�������
����
�����
������
���������������
���
�����������
�����������
���������
��������
����
��� �
X
������������
��������������
���������
����
��������������
��������
�������
������
����
��������
��������
��������
���������
����
�������
�������
�����
���
��������
�����
�������������
���
����
��� �����
����
����������������
�������������
�����
������
����������������
���������
��������
������
����
������
����
������
����
�����
�����
�����
���������������������
XX
XX
XXX X X
X
XX
XX
XX
X X
X X
�� �
�
�� �
� �
�
�
��� � �
� �
�
�
�
�
� �
��� �
�
��
�
�
�
�
�
�
��
��
�
�
��
�
�
�������������
����������
�������������
����������
�����
����
���
���
����
����
���
����
����
���
Figu
re 3
.28.
Den
sity
of a
dult
boc
acci
o (d
efin
ed a
s fi
sh la
rger
than
35
cm to
tal l
engt
h) a
s ob
serv
ed fr
om th
e D
elta
sub
mer
sibl
e on
pla
tfor
ms
and
natu
ral
outc
rops
, 199
5–20
01. B
ocac
cio
dens
itie
s fo
r P
latf
orm
s Ir
ene,
Hid
algo
, Har
vest
, Her
mos
a, H
olly
, Gra
ce a
nd G
ail a
re fr
om p
latf
orm
bot
tom
s an
d de
nsit
ies
for
thes
e se
ven
plat
form
s an
d fo
r N
orth
Ree
f and
ree
fs “
A”, “
B”,
“C”
and
“D”
in th
e vi
cini
ty o
f Pla
tfor
m H
idal
go r
epre
sent
mea
ns o
f yea
rs. P
latf
orm
s C
, B,
A, H
illho
use,
Hog
an, H
ouch
in, a
nd H
enry
wer
e no
t inc
lude
d be
caus
e th
ey w
ere
not c
ompl
etel
y su
rvey
ed.
���
��������
�������
����
������������������������
��������������
������
���
���������
��������������
� �
X
������������
��������������
�������������
��������������
��������
�������
������
����
����������������
�����������������
������������
��������������
�������������
�������������
���������� �����������
��������������
�������������
�����
������
����������������
���������
��������
������
����
����
����
��
����
����
��
����
��
����
�����
����
����
����
����
����
�
X
XX
XX
XX
XX X
XXX
X X XX X
XX
XX
XX
X
X X
X X
XX
XX
XX
X
XXX XX
X XX
X
XXX � ��
� � �
��
�
�
�
��
��
�
�
� �
��� �
�
��
�
�
�
�
�
�
�
��
�� �
� � �
��
��
� �� �
������
����
���
����
����
��
����
����
�����
���
����
���
�����
����
���
���
����
����
���
����
����
�
Figu
re 3
.29.
Den
sity
of a
dult
cow
cod
(def
ined
as
fish
larg
er th
an 4
5 cm
TL)
as
obse
rved
from
the
Del
ta s
ubm
ersi
ble
on p
latf
orm
s an
d na
tura
l out
crop
s,
1995
–200
1. C
owco
d de
nsit
ies
for
Pla
tfor
ms
Iren
e, H
idal
go, H
arve
st, H
erm
osa,
Hol
ly, G
race
and
Gai
are
from
pla
tfor
m b
otto
ms
and
dens
itie
s fo
r th
ese
seve
n pl
atfo
rms
and
for
Nor
th R
eef a
nd r
eefs
“A”
, “B
”, “C
” an
d “D
” in
the
vici
nity
of P
latf
orm
Hid
algo
rep
rese
nt m
eans
of y
ears
. Pla
tfor
ms
C, B
, A, H
ill-
hous
e, H
ogan
, Hou
chin
, and
Hen
ry w
ere
not i
nclu
ded
beca
use
they
wer
e no
t com
plet
ely
surv
eyed
.

3-32
RESULTS AND ANALYSES
3-33
RESULTS AND ANALYSES
Why platforms support higher densities of young rockfishes than do nearby natural outcrops.
Platforms are important nursery habitat for many species of rockfishes. This research demonstrates that, in gen-
eral, platforms may be more important nursery habitats than nearby natural outcrops or, indeed, most other outcrops
surveyed in central and southern California. Why is this? First, platforms occupy more of the water column than do
most natural outcrops. Presettlement juvenile rockfishes, swimming in the midwater, are much more likely to encounter
these tall structures than the relatively low-lying natural rock outcrops. It is interesting to note that most of the natural
outcrops we found that had high densities of young-of-the-year rockfishes (e.g., Hidden Reef and outcrops around
islands) were very high relief features that thrust their way well into the water column.
In addition, there are also relatively fewer large predators in the platform midwaters. By comparison, even on
heavily fished outcrops there tend to be at least a few larger fishes. Many of the major predators of young rockfishes
are species that live close to the bottom, such as lingcod, copper and vermilion rockfishes, cowcod and large bocaccio.
In general, these species do not ascend the platform jacket. Thus, even when they are abundant at the bottom of a
platform, they are absent from the platform midwaters. In this respect, platforms are similar to some of the offshore
pinnacles on the southern California continental shelf. Predatory species, such as cowcod, lingcod, and greenblotched
rockfishes are also not abundant around the steep, smooth sides of offshore outcrops.
At most of the platforms, we observed both harbor seals and California sea lions, both resting on the platforms
and swimming in the water column among the jackets and conductors. Based on the known food habits of these
animals, it is likely that they feed on platform fishes, but their low numbers probably have little effect on the abundance
of young rockfishes. We also observed both harbor seals and California sea lions swimming over natural outcrops and
it likely that here, too, predation on young rockfishes occurs.
Platforms as defacto marine refuges
The role that some platforms play as defacto marine refuges is supported by evidence of greater densities of
rockfishes, particularly the larger size classes, at platforms than at natural outcrops. The role that platforms may play
as de facto reserves should not be underestimated at a time when many fish populations are in decline on natural
outcrops. A number of benthic fishes, including such economically important species as bocaccio, cowcod, copper,
and vermilion rockfishes and lingcod find refuge within the platforms and this is probably a factor in their relatively
high densities compared to most natural outcrops. Schroeder and Love (2002) compared the rockfish assemblages at
three deeper-water areas subjected to variable fishing pressures. Two were natural outcrops, one outcrop open to all
fishing and one open only to recreational fishing, and the third was Platform Gail, acting as a de facto marine refuge.
The outcrop allowing open fishing had the highest densities of rockfishes (7,212 fish/ha); however, the assemblage
was dominated by dwarf species. The recreational fishing area had the lowest rockfish density (423 fish/ha) and this
assemblage was also dominated by small fishes. Platform Gail possessed a relatively high density (5,635 fish/ha), and
the fishes tended to be larger than individuals at either of the fished sites. Two federally listed overfished species,
cowcod and bocaccio, had 32- and 408-fold higher densities, respectively, at Platform Gail than the recreational site,
and 8- and 18-fold higher densities, respectively, than the all-fishing area.
There is some fishing effort around most platforms in the Southern California Bight and Santa Maria Basin. The
relative amount of fish pressure among platforms is dependent on ease of access and local ocean conditions. Platforms
in the Santa Maria Basin are located in an area that is far from ports, usually windy, and unprotected from weather. It
is difficult to fish around the bottom of platforms, especially the deeper ones, because of the threat to gear imposed
by the large number of crossbeams, other platform structural elements, conductors, and strong currents. Many anglers
also believe that operators do not welcome fishing near their platforms.
Some platforms are important fishing areas for recreational anglers. Historically, commercial passenger fishing
vessels and small private vessels fished around some of the shallower platforms in the Santa Barbara Channel (Love
and Westphal 1990). Platforms Hilda and Hazel were targeted for kelp bass. During years with strong rockfish recruit-
ment, large numbers of juvenile bocaccio, blue, olive, and widow rockfishes were caught at Platforms Holly, A, B, C
and Hillhouse. In all of these instances, fishing effort was directed at surface or midwaters, rather than at the platform
bottom. The removal of Hilda and Hazel and the poor rockfish recruitment of the 1980s and much of the 1990s
reduced the overall fishing effort at oil/gas platforms. Some recreational fishing continues around Platform Gina, and
there is minimal effort around a few other structures in the Santa Barbara Channel.
Overfishing has drastically altered the species composition of many outcrops off central and southern California
(Yoklavich et al. 2000; M. Love, unpublished data). Over most moderate-depth and deep outcrops in central and south-
ern California, many, or sometimes all, of the larger predatory fishes, such as lingcod, cowcod, bocaccio, yelloweye,
and canary rockfishes are gone. In contrast, surveys made over an unfished outcrop in central California showed very
high densities of large predatory fishes, including lingcod, cowcod, bocaccio, and yelloweye rockfish (Yoklavich et al.
2000). At many natural outcrops, these larger individuals have been replaced by very large numbers of dwarf species,
particularly pygmy, swordspine, and squarespot rockfishes. Fish assemblages at platforms, such as Gail, Hidalgo, and
Irene, with relatively high densities of many economically important species and low numbers of dwarf species, may
more closely resemble unfished assemblages than those at many natural outcrops.
Bocaccio.
LOV
ELA
B, U
C S
AN
TA B
AR
BA
RA

3-34
RESULTS AND ANALYSES
3-35
RESULTS AND ANALYSES
Figure 3.30. A typical rockfish life history cycle using the cowcod as an example.
5. The Origins of Platform Fishes: Production and Attraction
Finding at a Glance Our research suggests that platforms, like natural
outcrops, both produce and attract fishes, depending on species and location. Platform fish assemblages around the deeper and further offshore platforms may be generated primarily from the recruitment of larval and pelagic juvenile fishes, not from attraction of fishes from natural outcrops. Some fishes may live their entire lives around a single platform but their movement patterns are poorly known. A pilot study comparing growth rates showed that young-of-the-year blue rockfish grew faster at a platform than at a natural outcrop.
In recent years, public attention has been drawn to artificial reefs and their function in the marine environ-ment. While a variety of issues have been raised, much of the discussion has centered around the question of whether artificial reefs are producers or attractors of marine life (Carr and Hixon 1997; Lindberg 1997). Some researchers suggest this question is biologically simplistic, because it “imposes an unrealistic either-or-dichotomy…” (Lindberg 1997). Nevertheless, this issue continues to arise in the context of the importance of platforms as fish habitat off California (Carr and Ste-phens 1998; Krop 1998).
Attraction suggests the net movement of juvenile and adult fishes away from natural outcrops to platforms. While there is not complete agreement on the definition of production, most researchers agree that it involves larval or pelagic juvenile settlement at a structure and the survival and growth of these organisms in this habi-tat (Carr and Hixon 1997).The attraction/production debate is framed around three questions (Carr and Stephens 1998; Krop 1998): (1) Do larval and juvenile fishes settle onto platforms from the plankton, or do fishes move from other structures to platforms as older juveniles or adults? (2) If a species does settle onto a platform, are growth and survivorship at least as good as on a natural outcrop? (3) If a species does grow and survive well around a platform, did the structure take away larvae or pelagic juveniles that would have settled onto natural outcrops?
5a. Do Fishes Settle from the Plankton onto Plat-forms or Do They Swim There from Other Structures as Juveniles or Adults?
A large number of fish species settled out of the plankton and took up residence around platforms. We observed young-of-the-year of about 46 fish species at these structures (Table 6) and, including species ob-served by other researchers (Carlisle et al. 1964), at least 50 fish settle on to platforms from the plankton. During some years, the midwaters of many platforms had very high densities of juvenile rockfishes. Young-of-the-year blacksmith, kelp and painted greenlings, and cabezon also were abundant in this habitat at times. Young-of-the-year rockfishes, lingcod, and other species were abundant around platform bottoms and shell mounds. With a few exceptions, species that settled on the bot-tom and shell mound were different from those found in the midwaters.
Juveniles of some species were rarely or never ob-served around platforms. For instance, young-of-the-year kelp bass were rarely seen around any platform, although adults were very abundant at one platform. Young sea-perches also were rare or absent. In these cases, older ju-veniles or adults immigrated to the platforms or juveniles settled there at times other than our surveys.
5b. The Biological Influence of Oceanographic Conditions on Recruitment Success at Platforms and Natural Outcrops in the Santa Barbara Channel and Santa Maria Basin
Most coastal fishes and invertebrates, including those inhabiting platforms, are planktonic during early stages of their life histories. These life stages, which may last from weeks to months, can begin as fertilized eggs (e.g., lingcod, cabezon, and garibaldi) or larvae (e.g., rock-fishes). Some fishes, including rockfishes, continue to develop in the pelagic environment until they transform to the juvenile stage (Figure 3.30).
Pelagic life stages are at risk from starvation and predation and transport away from the specific habitats required for their growth and survival. Therefore, the type of water mass an animal finds itself may have a profound effect on its survival. There are a number of water masses in our study area, including waters from the Southern California Bight, the central California coast, upwelling from Point Conception, and from more distant places such as Baja California. How these waters enter, circulate and mix in the Santa Barbara Channel and Santa Maria Basin affects marine populations and community diversity on both platforms and natural habitats.
Upwelling processes, the wind-induced pulling of deeper, colder water to the surface and displacement of warmer waters offshore, is a major factor in larval and pelagic juvenile survival. During years when upwelling coincides with larval fish production, fish survival may be enhanced. Because deep waters are nutrient-rich, upwelling increases reproduction of phytoplankton and encourages the growth of zooplankton, providing food for larval and pelagic juvenile fishes. Upwelling may also increase survivorship of some species by moving larvae and pelagic juveniles somewhat offshore, away from high densities of nearshore predators. Conversely, the offshore transport that accompanies upwelling can be detrimental to the survival of larvae and pelagic ju-veniles. Wind-induced turbulence in surface waters can make it difficult for larvae to come into contact with prey. Larvae risk being swept well offshore by strong upwell-ing and far removed from suitable habitat. Spatial and
temporal variability in circulation, however, can provide some larvae and pelagic juveniles with conditions that enhance survivorship including delivery to optimum settlement.
The timing, location, intensity, and duration of up-welling events may have a large effect on rockfish settle-ment. For instance, recruitment may be hampered at sites constantly exposed to newly upwelled water. Through much of the late-spring and summer when presettle-ment-stage rockfishes are in the pelagic environment, upwelling from the mainland at Point Conception im-pacts the west channel. Our summer oceanographic data confirm that the upwelling plume can extend across the western portion of the Northern Channel Islands (Love et al. 1999). We found that pelagic juvenile rockfishes were relatively rare in this newly upwelled water (Fig-ure 3.31) (Nishimoto 2000). As an example, when cool upwelled waters moved into an area off the south side

3-36
RESULTS AND ANALYSES
3-37
RESULTS AND ANALYSES
����
����
����
����
����
����
����
����
����
����
������ ������ ������ ������ ������ ������ ������
������ ������ ������ ������ ������ ������ ������
��������������
����������������������������
�����������
��������������
����������������������������
�����������
��
�
������������������
��������������������������������������
����
��������
���������
����������������
�����������
�����������
�������
���
Figure 3.31. The abundance of late-larval stage and pelagic juvenile rockfishes decreases off the south side of Santa Cruz Island when one water mass replaced another between two sampling periods, June–July 1996. Temperature and salinity properties were used to identify four water masses: Upwelled water, Southside Island water, Northside Island water, and Southern California Bight water. Hauls are represented by colored circles. Fish abundance was estimated using the mean collected in midwater trawl hauls within a water mass. Bars illustrate the relative abundances among the water masses. Zeros indicate that no rock-fishes were collected in the hauls within a water mass.
Figure 3.32. The strong correspondence between exposure to cool water and young-of-the-year rockfish density. A shift in position of the thermal front on the north shore of Santa Cruz Island (SCI) in 1996 and 1997 corresponded with a striking spatial shift in juvenile rockfish densities (see sampling sites, Pelican Bay (PB) and Scorpion Anchorage (SA)). Numbers overlaid on images represent mean densities of juvenile rockfishes (number/60 m2) that recruited to giant kelp canopy at sites within the survey area.
Figure 3.33. The strong link between eddy circulation and the distribution of pelagic young-of-year rockfishes. A persis-tent eddy about 30 km (19 mi.) wide was evident in satellite sea surface temperature imagery and in surface current mapping generated from coastal-based high frequency radar observations. The abundance of fishes were extraordinarily high in the center of the eddy (red bars represent the mean number of late-stage larval and pelagic juvenile rockfishes in midwater trawl samples from different areas).
of Santa Cruz Island, the fish assemblage changed from one with relatively abundant pelagic juvenile rockfishes to one where these fishes were almost absent. We sus-pect that the upwelled water, the coldest and most saline water mass that we identified, was recently brought to the surface from depths where few larval and juvenile rockfishes reside.
Inter-annual oceanographic conditions, including the intensity of seasonal, coastal upwelling, are highly variable and this affects year class success and population variability. A shift from El Niño to La Niña conditions between 1998 and 1999 was marked by abrupt changes in the marine ecosystem off southern and central Cali-fornia. Our survey data of young-of-the-year rockfishes in 1999 indicates an increase in rockfish recruitment.
The number of several juvenile rockfishes and other fish species observed on oil/gas production platforms and rocky outcrops in 1999 far exceeded those of 1998 and previous years. This increased recruitment coincided with intense coastal upwelling off Central California (among the strongest events in 50 years) in spring 1999 followed by high phyto- and zooplankton production (Lynn et al. 1998; Hayward et al. 1999). High produc-tivity in the region likely contributed to the increased survivorship of the fishes including those that recruited to the platforms and natural outcrops.
Relatively transitory phenomena, such as fronts and eddies, may also play an important role in fish settlement and year-class success. Fronts, the zones where different wa-ter masses collide and mix, may prevent weak-swimming
planktonic animals from swimming between these masses (Moser and Smith 1993; Wing et al. 1998). The strength of recruitment to a platform or outcrop may be determined in part by the habitat’s exposure to those fronts carrying ready-to-settle fish larvae and juveniles. Our research at Santa Cruz and Anacapa islands indicates that the recruitment of near-shore rockfishes was sparse on outcrops separated from cool, fish-rich waters by a frontal boundary (Figure 3.32) (Love, Nishimoto, Schroeder, and Caselle 1999).
Eddies, cyclonic currents that can concentrate and retain plankton, may retain fishes and affect the dispersal of larval and juvenile fishes to outcrops and platforms. For instance, in summer 1998 we sampled a stationary and persistent cold-core cyclonic eddy in the western Santa Barbara Channel. In this feature, we found very high con-centrations of small fishes, including late-stage larval and pelagic juvenile rockfishes (Figure 3.33). Eddies may also be very transitory. During the summer of 1999, we observed a much different circulation pattern of shorter-lived, propa-gating eddies and collected few young rockfishes.
We suspect that the high levels of recruitment of young-of-the-year rockfishes at some platforms were as-sociated, in part, with eddies and fronts retaining larvae that had been locally produced at either platforms or natural outcrops. For instance, Platform Irene is located to the north of the frontal boundary of the upwelling plume that extends off Point Conception. The platform is also situated in an area where a semi-persistent eddy is frequently observed during spring and summer (L.Washburn, personal communication). Similarly, both fronts and eddies were observed at Platforms Gail and Grace in the eastern channel north of Anacapa. As noted previously, Platform Gail harbors important habitat for adult bocaccio in the Santa Barbara Channel. Local reten-tion of bocaccio larvae produced at Platform Gail would explain the high levels of bocaccio settlement at nearby platform Grace and Gilda.
The variability of oceanographic conditions in the Santa Barbara Channel between 1995 and 2001 appears to have strongly influenced settlement as young-of-the-year recruitment to platforms and natural outcrops was highly variable both temporally and spatially. For instance, while the 1997–1998 El Niño corresponded with a large increase in juvenile recruitment of species that dominate the warm-temperate fish assemblage (such as blacksmith), the 1999 La Niña corresponded to a strong settlement of cool-temperate species, such as rockfishes. While settlement of many rockfish species to platforms was generally higher north of Point Conception than in

3-38
RESULTS AND ANALYSES
3-39
RESULTS AND ANALYSES
��� ��� ��� ��� ��� ��� ��� ��� ���
�
�
�
�
��
��
����
����
����
����
����
����
�
������������������������������������������
����������������������������
����������������������
Figure 3.34. A comparison of daily growth rates of young-of-the-year blue rockfish collected at Platform Gilda and Naples Reef in 1999. Fish from Platform Gilda grew at a statistically faster rate than did those from the natural outcrop.
Figure 3.35. Flag rockfish at the bottom of Platform Grace, 2001. These fish recruited to the platform as pelagic juveniles in 1999 and moved to the bottom in 2000.
� � �� �� �� �� �� �� ��
������
����
��������
��������
��������
��������
��������
����
����
����
����
����
����
��������������������
����������������
���������������������������
���
����
����
����
���
����
�
������������������������������������
� � �� �� �� �� �� �� ��
������������
����������
����������
����������
����������
����������
����
����
����
����
����
����
��������������������
���������������������������
���
����
����
����
���
����
�
������������������������������������������
Figure 3.36. Size structure of young bocaccio observed at Platform Gail and flag rockfish observed at Platform Grace, 1996 to 2001. Black line denotes persistence of the successful 1999 year class.
the Santa Barbara Channel during 1996 through 1998, the cooler waters of 1999 brought with it a relatively good year for cool-temperate rockfish recruitment throughout the channel.
The timing of this upsurge in young-of-the-year rockfish settlement in the Santa Barbara Channel also coincided with what may have been a Northeast Pacific oceanographic regime shift from warm to cool waters that overlaid the El Niño and La Niña events. This may have been reflected in the 2000 and 2001 rockfish recruit-ment at platforms in the eastern channel, which remained higher than pre-1999 levels. We should note that the last cold water regime off southern California oc-curred in the 1970s, a period that saw heavy settlement of young-of-the-year blue, olive, and widow rockfishes and bocaccio to some of the platforms near Santa Barbara (Love and Westphal 1990).
5c. If a Species Does Settle around a Plat-form, How Well Does It Grow and Survive, Particularly Compared to the Same Species on a Natural Outcrop?
While our studies in this area are prelimi-nary, they are sufficiently compelling that we can begin to draw some conclusion regarding production of fishes at platforms. On many platforms, we believe that larval and pelagic ju-venile recruitment is a major force in shaping platform fish assemblages. We have observed young-of-the-year of about 46 species at the
platforms. Of these species, at least 35 were observed as adults at the same structures (Table 7). Adults of some species, such as pygmy, widow, and yellowtail rockfishes, are relatively uncommon around platforms suggesting different habitat requirements. Conversely, adults of many more species, including blacksmith, bocaccio, ca-bezon, cowcod, lingcod, painted greenling, shortspine and longspine combfishes, and calico, copper, flag, green-blotched, greenspotted, greenstriped, halfbanded, kelp, and pinkrose rockfishes are abundant at the platforms.
Pilot research suggests that at least some juvenile fishes may be growing as well or better at the platforms than at natural outcrops. In 1999, we collected young-of-the-year blue rockfish from Platform Gilda and from Naples Reef (Figure 1.1). Daily growth rates derived from these fishes from otoliths (ear bones) indicated that the platform fish grew at a statistically faster rate than did those from the natural outcrop (F-test, F = 2.96, p = 0.0006) (Figure 3.34).
Recruitment patterns of flag rockfish at Platform Grace and bocaccio at Platform Gail in 1999 and sub-sequent annual monitoring of year classes at these sites is providing important new information about the pro-duction value of platform habitats. In 2000, and again in 2001, we observed the 1999 year classes of these species at the bottoms of the platforms (Figures 3.35 and 3.36). Length-frequency data indicate substantial survival of the 1999 year classes at the platforms (Figure 3.36). Flag rockfish mature at about six years of age (M. Love and M. Yoklavich, unpublished data) and bocaccio at four or five years (A. MacCall, personal communication). Thus,
it is conceivable that these fishes will mature at the plat-forms. This would be strong evidence of production at these structures. [Added in proof: We again observed these fishes during our 2002 surveys of Platforms Gail and Grace.]
5d. Both Attraction and Production Play Important Roles in Shaping Fish Assemblages at Platforms
Our research suggests that populations of fishes at platforms far removed from natural outcrops, as is true for Platforms Gail and Grace, are most likely dependent on larval and juvenile recruitment from the plankton. Our research is developing information about recruit-ment and residence of fishes at platforms and we have provided evidence of fishes not only settling out at platforms but also maturing there. Recruitment process
is highly variable at all habitats from year to year. Adult abundance, at least for some species, is dependent on the strength of recruitment in previous years. Furthermore, recruitment variability may contribute to the year class success (i.e., demographics) of platform and outcrop species such as flag rockfish and bocaccio.
While the movement patterns of some deeper-water rockfishes are unknown, it is likely that many benthic species, such as greenspotted, greenblotched, pinkrose, and cowcod are residential (Starr et al. 2001; Love et al. 2002). Certainly many are restricted to hard substrata seafloors and probably rarely traverse large expanses of soft sediment (Love et al. 2002). Thus, it is likely that the high densities of many platform rockfishes, as well as such species as combfishes, painted greenling, and perhaps lingcod, are due to successful settlement from
DO
NN
A S
CH
RO
EDER
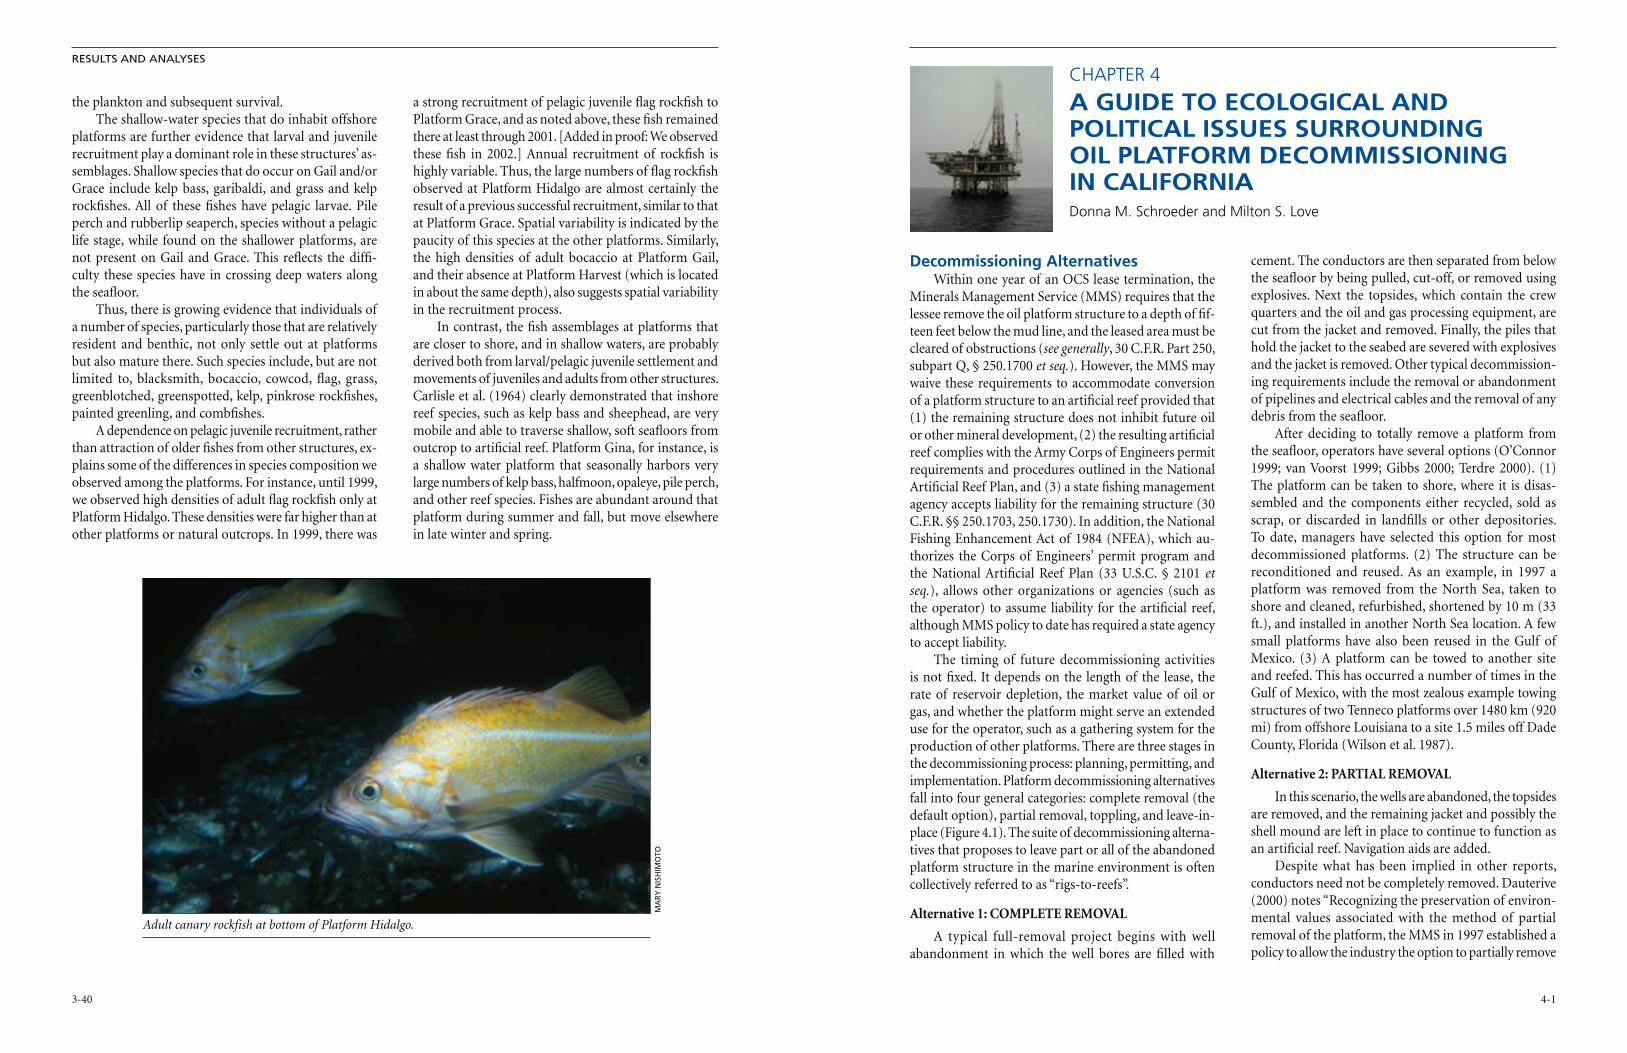
3-40
RESULTS AND ANALYSES
4-1
CHAPTER 4
A GUIDE TO ECOLOGICAL AND POLITICAL ISSUES SURROUNDING OIL PLATFORM DECOMMISSIONING IN CALIFORNIADonna M. Schroeder and Milton S. Love
the plankton and subsequent survival. The shallow-water species that do inhabit offshore
platforms are further evidence that larval and juvenile recruitment play a dominant role in these structures’ as-semblages. Shallow species that do occur on Gail and/or Grace include kelp bass, garibaldi, and grass and kelp rockfishes. All of these fishes have pelagic larvae. Pile perch and rubberlip seaperch, species without a pelagic life stage, while found on the shallower platforms, are not present on Gail and Grace. This reflects the diffi-culty these species have in crossing deep waters along the seafloor.
Thus, there is growing evidence that individuals of a number of species, particularly those that are relatively resident and benthic, not only settle out at platforms but also mature there. Such species include, but are not limited to, blacksmith, bocaccio, cowcod, flag, grass, greenblotched, greenspotted, kelp, pinkrose rockfishes, painted greenling, and combfishes.
A dependence on pelagic juvenile recruitment, rather than attraction of older fishes from other structures, ex-plains some of the differences in species composition we observed among the platforms. For instance, until 1999, we observed high densities of adult flag rockfish only at Platform Hidalgo. These densities were far higher than at other platforms or natural outcrops. In 1999, there was
a strong recruitment of pelagic juvenile flag rockfish to Platform Grace, and as noted above, these fish remained there at least through 2001. [Added in proof: We observed these fish in 2002.] Annual recruitment of rockfish is highly variable. Thus, the large numbers of flag rockfish observed at Platform Hidalgo are almost certainly the result of a previous successful recruitment, similar to that at Platform Grace. Spatial variability is indicated by the paucity of this species at the other platforms. Similarly, the high densities of adult bocaccio at Platform Gail, and their absence at Platform Harvest (which is located in about the same depth), also suggests spatial variability in the recruitment process.
In contrast, the fish assemblages at platforms that are closer to shore, and in shallow waters, are probably derived both from larval/pelagic juvenile settlement and movements of juveniles and adults from other structures. Carlisle et al. (1964) clearly demonstrated that inshore reef species, such as kelp bass and sheephead, are very mobile and able to traverse shallow, soft seafloors from outcrop to artificial reef. Platform Gina, for instance, is a shallow water platform that seasonally harbors very large numbers of kelp bass, halfmoon, opaleye, pile perch, and other reef species. Fishes are abundant around that platform during summer and fall, but move elsewhere in late winter and spring.
Decommissioning AlternativesWithin one year of an OCS lease termination, the
Minerals Management Service (MMS) requires that the lessee remove the oil platform structure to a depth of fif-teen feet below the mud line, and the leased area must be cleared of obstructions (see generally, 30 C.F.R. Part 250, subpart Q, § 250.1700 et seq.). However, the MMS may waive these requirements to accommodate conversion of a platform structure to an artificial reef provided that (1) the remaining structure does not inhibit future oil or other mineral development, (2) the resulting artificial reef complies with the Army Corps of Engineers permit requirements and procedures outlined in the National Artificial Reef Plan, and (3) a state fishing management agency accepts liability for the remaining structure (30 C.F.R. §§ 250.1703, 250.1730). In addition, the National Fishing Enhancement Act of 1984 (NFEA), which au-thorizes the Corps of Engineers’ permit program and the National Artificial Reef Plan (33 U.S.C. § 2101 et seq.), allows other organizations or agencies (such as the operator) to assume liability for the artificial reef, although MMS policy to date has required a state agency to accept liability.
The timing of future decommissioning activities is not fixed. It depends on the length of the lease, the rate of reservoir depletion, the market value of oil or gas, and whether the platform might serve an extended use for the operator, such as a gathering system for the production of other platforms. There are three stages in the decommissioning process: planning, permitting, and implementation. Platform decommissioning alternatives fall into four general categories: complete removal (the default option), partial removal, toppling, and leave-in-place (Figure 4.1). The suite of decommissioning alterna-tives that proposes to leave part or all of the abandoned platform structure in the marine environment is often collectively referred to as “rigs-to-reefs”.
Alternative 1: COMPLETE REMOVAL
A typical full-removal project begins with well abandonment in which the well bores are filled with
cement. The conductors are then separated from below the seafloor by being pulled, cut-off, or removed using explosives. Next the topsides, which contain the crew quarters and the oil and gas processing equipment, are cut from the jacket and removed. Finally, the piles that hold the jacket to the seabed are severed with explosives and the jacket is removed. Other typical decommission-ing requirements include the removal or abandonment of pipelines and electrical cables and the removal of any debris from the seafloor.
After deciding to totally remove a platform from the seafloor, operators have several options (O’Connor 1999; van Voorst 1999; Gibbs 2000; Terdre 2000). (1) The platform can be taken to shore, where it is disas-sembled and the components either recycled, sold as scrap, or discarded in landfills or other depositories. To date, managers have selected this option for most decommissioned platforms. (2) The structure can be reconditioned and reused. As an example, in 1997 a platform was removed from the North Sea, taken to shore and cleaned, refurbished, shortened by 10 m (33 ft.), and installed in another North Sea location. A few small platforms have also been reused in the Gulf of Mexico. (3) A platform can be towed to another site and reefed. This has occurred a number of times in the Gulf of Mexico, with the most zealous example towing structures of two Tenneco platforms over 1480 km (920 mi) from offshore Louisiana to a site 1.5 miles off Dade County, Florida (Wilson et al. 1987).
Alternative 2: PARTIAL REMOVAL
In this scenario, the wells are abandoned, the topsides are removed, and the remaining jacket and possibly the shell mound are left in place to continue to function as an artificial reef. Navigation aids are added.
Despite what has been implied in other reports, conductors need not be completely removed. Dauterive (2000) notes “Recognizing the preservation of environ-mental values associated with the method of partial removal of the platform, the MMS in 1997 established a policy to allow the industry the option to partially remove
Adult canary rockfish at bottom of Platform Hidalgo.
MA
RY N
ISH
IMO
TO
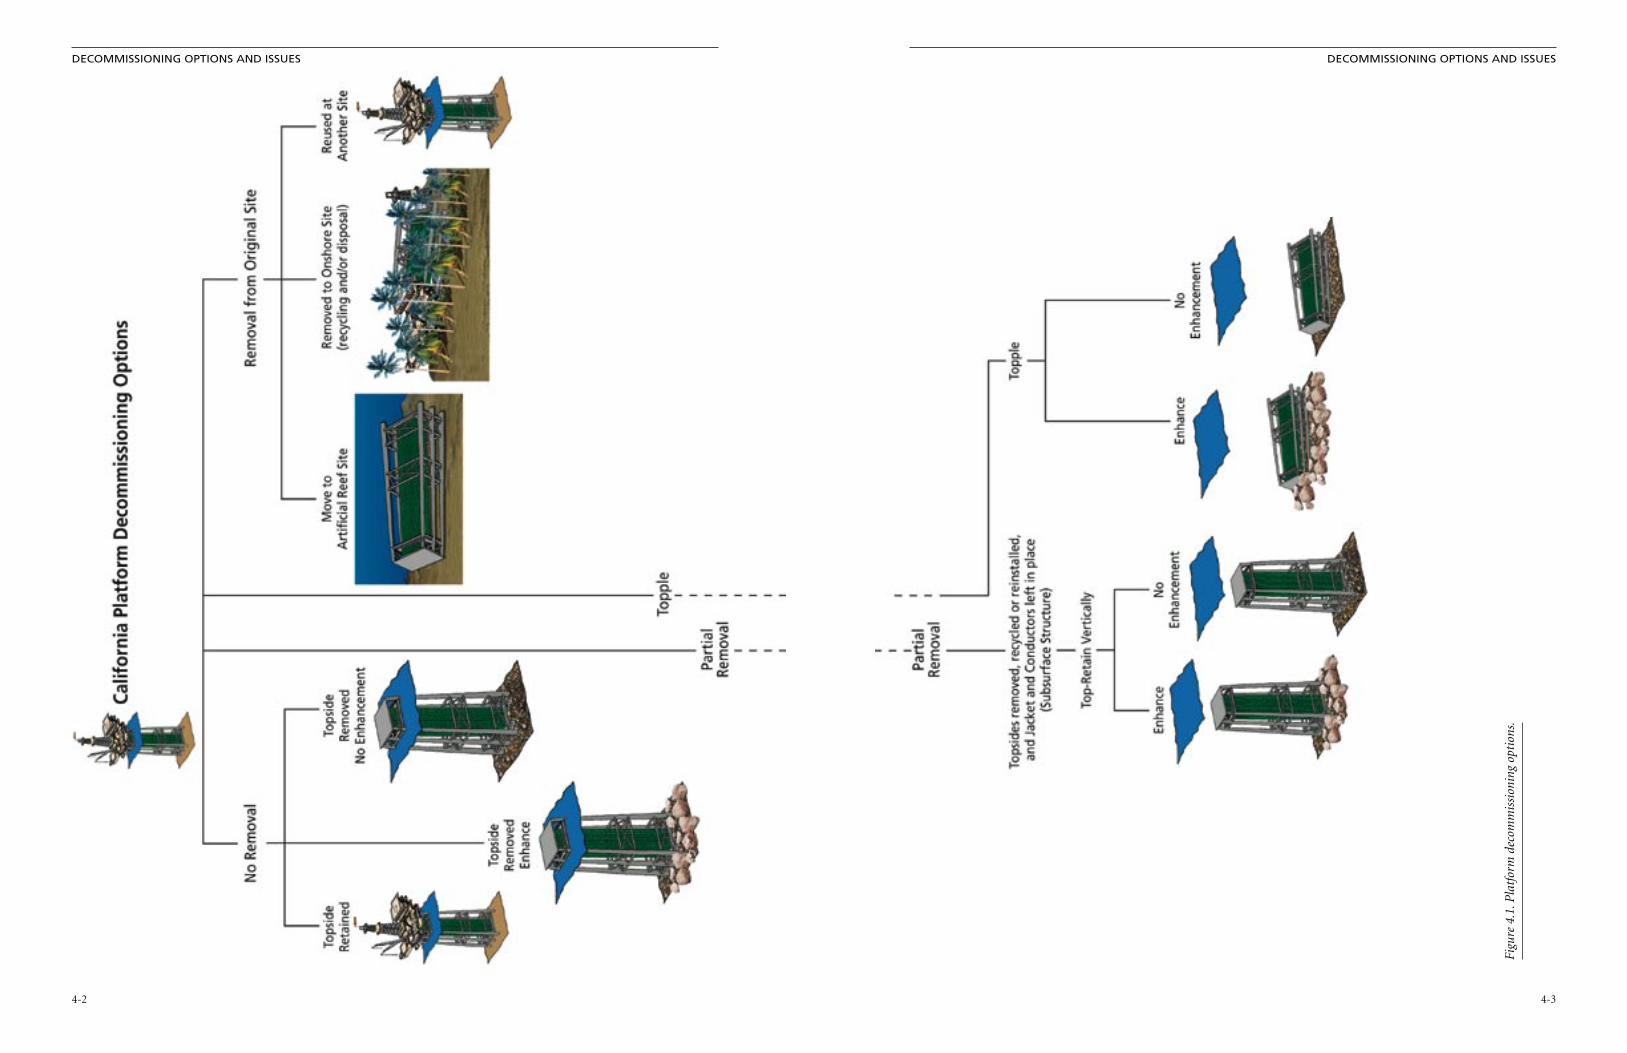
4-2
DECOMMISSIONING OPTIONS AND ISSUES
4-3
DECOMMISSIONING OPTIONS AND ISSUES
Figu
re 4
.1. P
latf
orm
dec
omm
issi
onin
g op
tion
s.

4-4
DECOMMISSIONING OPTIONS AND ISSUES
4-5
DECOMMISSIONING OPTIONS AND ISSUES
Jacket and conductor removal: the role of the U. S. Coast Guard in decommissioning
Local United States Coast Guard districts are respon-sible for the safety of vessel traffic in their respective geographic areas and have the authority to dictate aids to navigation for obstacles in the water (14 U.S.C. §85; 43 U.S.C. § 1333(d); 33 C.F.R. Part 67). Therefore, in instanc-es where some part or all of a platform is to be reefed, the Coast Guard will specify the necessary navigational aids. Discussions regarding decommissioning of platforms off California have often erroneously assumed that the Coast Guard will require that the jacket be removed to about 26 m (85 ft.) below the surface. However, decommission-ing experience in the Gulf of Mexico demonstrates that there is no set removal depth. Indeed, the Coast Guard decision-making process appears to be quite flexible; it reviews each decommissioning on a case-by-case basis. For instance, in the decommissioning of the mile-long Freeport-McMoRan sulfur mine platform and bridge off Louisiana, the Coast Guard required piles to be cut 9 m (30 ft.) beneath the surface (Kasprzak 1999).
Generally, the requirements for aids to navigation be-come more restrictive (and therefore more expensive) the closer to the surface the obstacle lies. As an example, here is a generic set of conditions for decommissioned plat-forms in the Gulf of Mexico based on recent Coast Guard decisions (G. Steinbach, personal communication): • If the obstacle is greater than 61 m (200 ft.) in depth:
no requirement for aids to navigation • If the obstacle is from 61 m to 26 m (200 ft. to 85
ft.) in depth: unlighted buoys are required • If the obstacle is 26 m to 11 m (85 ft. to 35 ft.) in
depth: lighted buoys are required • If the obstacle is from 11 m (35 ft.) to protruding
through the surface: lights or lighted buoys and fog-horns are required.
In the rigs-to-reefs programs in the Gulf of Mexico, the states are responsible for aids to navigation on reefed platforms. The costs of these aids are paid for from the funds created by the industry’s donations. As a cost sav-ings measure, these states generally have selected greater water clearances. The requirements for California waters may be different from those in the Gulf of Mexico. The lo-cal Coast Guard District will determine these requirements
based on vessel traffic and other local conditions.
The question of liability for a reefed platform off California
Liability, who retains responsibility for a reefed plat-form, is a major issue in the decommissioning process. MMS policy states the “The MMS supports and encour-ages the reuse of obsolete offshore petroleum structures as artificial reefs in U. S. Waters.” Current MMS regulations provide that a platform operator may be released from removal obligations in the federal lease instrument if a state agency responsible for managing fisheries resources will accept liability (30 C.F.R. § 250.1730). However, in situations where reefs are not managed by a state agency, another organization or agency must assume liability, as provided in the National Fishing Enhancement Act of 1984 (Stone 1985). In such cases, liability could possibly be re-tained by the oil company, transferred to a private entity, or handled in some other manner as long as MMS approval is received (G. Steinbach, personal communication).
An extensive body of policy and research outlines proper procedures for siting and deploying artificial reefs, and this information bears upon liability of such structures. The National Artificial Reef Plan (NARP) states “When a reef has been properly located, marked on navigation charts if necessary, and any required surface markers affixed, there should be very little potential for liability” (Stone 1985). Regarding accidents, which may occur during recreational activities near artificial reefs, the NARP further declares, “Diving accidents may occur with use by recreational divers. In this respect, an artificial reef is like a public park — there are dangers in those parks, guardrails and fences cannot be placed everywhere, and everyone who visits the park assumes some risk of injury. A warning could be placed on nautical charts and posted in local dive shops to warn of these dangers. However, each case would probably involve determination of comparative negligence” (Stone 1985). Parker (1999) notes that no lawsuits have ever been filed against the California Department of Fish and Game with respect to their artificial reef program.
Regardless of which decommissioning alternative is selected, the federal government cannot be held liable. Regarding State liability, the NARP notes, “If the permit holder is a State government, it may have sovereign im-munity from liability. It is unclear whether the National Fishing Enhancement Act affects any State‘s claim of sovereign immunity.” (Stone 1985)
the well conductors at the same depth below the water line (WL) at which the industry had proposed to remove the platform jacket.” Retaining platform conductors has two consequences. First, it adds additional complexity to remaining structure. Second, explosives are usually used to remove the conductors and retaining these pipes eliminates the need for explosives (Dauterive 2000).
After cleaning, disposition of topsides may be han-dled in a couple of ways. It can be moved to a new plat-form and reinstalled, or it can be taken onshore, where the steel and other valuable components are recycled and other material sent to landfills. Certain parts of the topsides, such as the cleaned deck, have occasionally be used in forming artificial reefs.
Alternative 3: TOPPLING
As in partial removal, the wells are abandoned and the topsides are removed. The shell mounds may be either removed or left in place. The primary difference between partial removal and toppling is that, in toppling, explo-sives are used to sever the jacket from the seabed and then a derrick barge or pull barge drags the jacket over and it is allowed to settle to the seafloor (Twachtman 1997). Navigational aids, if necessary, are then put in place.
Alternative 4: NO REMOVAL (LEAVE-IN-PLACE)
A platform and its surrounding shell mound could be left in its original location at the time of decommis-sioning. The topside would be stripped and cleaned and navigational aids installed.
In the Gulf of Mexico this scenario has been dis-cussed on a number of occasions, although it has not been attempted. For instance, a platform in the Flower Garden Banks National Marine Sanctuary was studied as a possible research laboratory. However, the cost of maintaining cathodic protection and navigational aids (together running to $300,000 per year) proved too high (L. Dauterive, personal communication). Other creative suggestions offered by stakeholders for decommissioned, left-in-place platforms include wind and aquaculture farms, meteorological stations, hospitals, hotels, gam-bling casinos, and penal institutions.
Agencies Responsible for the Decommissioning Process
By law, various coastal states and the federal gov-ernment share the administration of submerged lands, subsoils and seabeds off the United States. Thus, depend-ing on where platforms are positioned, responsibility for mineral extraction, including oil and gas development, is either under state or federal jurisdiction. Similarly, deci-sions regarding the decommissioning of platforms fall under either state or federal control, although the final decisions are based on consultation and mutual agree-ments among a number of agencies.
Responsibility for the fate of platforms in federal waters rests with the MMS (33 U.S.C. § 1331 et seq.) Federal agencies that are consulted in the decommis-sioning process include the Environmental Protection Agency (33 U.S.C. §§ 1311(a), 1342), Army Corps of Engineers (33 U.S.C. §§ 403,1344), National Oceanic and Atmospheric Administration (NOAA) Fisheries (16 U.S.C. § 1801 et seq.), and Coast Guard (14 U.S.C. § 85: 43 U.S.C. § 1333(d)). State agencies, such as the California Department of Fish and Game do not have jurisdiction in federal waters but may comment in the decision making process. Under the federal Coastal Zone Management Act (16 U.S.C. § 1451 et seq.), MMS decisions on platform decommissioning that will affect coastal resources are also reviewed by the appropriate state agency for consistency with the state’s coastal zone management program. In California, the California Coastal Commission conducts review for consistency with the state program. In turn, state agency consistency decisions can be appealed to the U. S. Department of Commerce (16 U.S.C. § 1456(c)(3)(A), (c)(3)(B)(iii); 15 C.F.R. Part 930, subpart H).
Decisions regarding the decommissioning of plat-forms in California state waters are the province of the State Lands Commission (CAL. PUB. RES. CODE § 6216), along with such agencies as the California Coastal Com-mission (CAL. PUB. RES. CODE § 30330), Department of Fish and Game (CAL. FISH & GAME CODE § 1602), local Air Pollution Control Districts (CAL. HEALTH & SAFETY CODE 40000), U. S. Army Corps of Engineers (33 U.S.C. §§ 403, 1344), and the U. S. Coast Guard (14 U.S.C. § 85).

4-6
DECOMMISSIONING OPTIONS AND ISSUES
4-7
DECOMMISSIONING OPTIONS AND ISSUES
National Artificial Reef Plan Decommissioning options other than complete
removal must be consistent with the National Artificial Reef Plan (33 U.S.C. § 2104(a)(4)). The National Fish-ing Enhancement Act of 1984 directed the development of a long-term National Artificial Reef Plan (NARP) to provide guidance and criteria on planning, construction, and evaluating artificial reef use, as well as introducing liability and mitigation issues (33 U.S.C. § 2103). Goals of the NARP seek to enhance fishing and fishery resources and minimize user conflicts and environmental risks without creating unreasonable obstruction to navigation (33 U.S.C. § 2102). In 1998, the NARP was supplemented by the Coastal Artificial Reef Planning Guide, which in-corporates new language from relevant federal and state agencies, fishing interests, and the general public.
California Department of Fish and Game Rigs-to-Reef Guidelines
“These guidelines stipulate that the project must benefit living marine resources, habitat, and user groups; that disposal or use of contaminated materials is not permitted; that wherever possible the subsurface structure of the platform should remain in place; that where possible subsurface structure that must be removed could be relocated to the base of the rig or other appropriate sites; and that the remaining structure be augmented by rocks or other materials to assure that the site functions as a diverse and productive reef habitat. To replace the biotic pro-ductivity from that part of the platform removed for navigational purposes, rock or concrete reefs should be placed in nearshore locations. A rigs-to-reef project sponsor must provide sufficient funds to the Depart-ment to evaluate the benefits to biotic productivity, user groups, and the overall management of fishery resources.” (Holbrook et al. 2000)
Social Values in Platform Decommissioning
Defining the social and ecological goals of decom-missioned platforms as artificial reefs will be critical in evaluating the efficacy of any potential rigs-to-reef program and the current and future performance of any artificial reef. Therefore, it is likely that various stakeholder groups will vie in defining the goals (and therefore the usefulness) of decommissioned platforms as artificial reefs. In this report, we sort the multitude of
stakeholder viewpoints regarding a rigs-to-reef program into three groups, each of which is primarily defined by one concern: community membership, resource ac-cessibility and environmental (marine life) issues. Of course, an individual may be influenced by more than one social value, and others may use arguments from multiple categories to promote a desired decommis-sioning outcome.
The first group consists of stakeholders who are concerned about community membership, and either oppose or support local presence of the oil industry. Those that wish to promote a community without the oil industry often view reefing alternatives as bundled together with all oil industry activities (e.g., continued exploration and production), the whole of which should be locally opposed (although they may not be opposed to oil industry activities in the Gulf of Mexico). For ex-ample, Camozzi (1998a) states that complete removal should be the preferred alternative in decommissioning because, after decades of fighting oil development on the California Coast, it acts as a “catharsis” for the local com-munity. Camozzi (1998b) reiterates this point by stating that, in regard to mussel mound removal, “Sending a message to oil companies that they must clean up our coast when they are done extracting their profits is the most vital issue in this case.” Individuals who wish to encourage or maintain the presence of the oil industry in the local community, presumably for economic reasons, favor some sort of reefing option because reefing is less expensive than complete removal (Pulsipher et al. 2000). Further information regarding local community views on the oil industry in California can be found in Lima (1994) and Smith and Garcia (1995).
The second group of stakeholders is primarily concerned with resource accessibility. A heterogeneous group, these citizens will either favor or oppose de-commissioning alternatives depending on how these alternatives aid or inhibit their ability to access a par-ticular resource. For example, commercial trawlers in the Southern California Bight favor complete removal because fishing gear may snag on platform structure or shell mounds (Southern California Trawlers Association 1998; McCorkle 1999). Other commercial fishers benefit from oil industry activities. Shrimp trawlers in the Gulf of Mexico drag within 0.4 km (0.25 mi) of platform structures, reporting that these fishing grounds tend to be more productive (Wilson et al. 1987). The rocky habitat associated with Rincon Oil Island in California provides excellent lobster fishing grounds and trap fish-ers would oppose seeing this habitat removed (Miller
1999). Recreational fishers often dominate the debate surrounding platform decommissioning, and they have driven the formation of artificial reef policy at both state and federal levels (Stone 1985; Wilson et al. 1987). Many recreational fishers favor a reefing alternative in decommissioning because catch per unit effort is often high at offshore platforms for targeted fish species such as kelp bass (Love and Westphal 1990; McCrea 1998). In the Gulf of Mexico, Reggio (1987) estimates that 70% of fishing excursions target oil platform habitats. Citizens participating in non-consumptive activities also pos-sess a variety of viewpoints regarding decommissioning alternatives. Many scuba divers find that underwater portions of oil platforms provide outstanding diving and underwater photographic opportunities, and favor decommissioning alternatives that preserve such oppor-tunities, (Vallette 1999). Other members of the public may view the topside structure of platforms as denying them access to unobstructed, scenic ocean views, and consequently they oppose the leave-in-place decommis-sioning option (Wiseman 1999).
The third stakeholder group makes decisions regard-ing decommissioning based on their perception of how certain marine populations or environmental ideals fare under the various decommissioning alternatives. It is this last group that is most likely to use ecological information in making decisions regarding platform decommission-ing. A decommissioning option that involves reefing may be supported if a substantial net benefit to the marine environment can be demonstrated (Chabot 1999). Others support complete removal because this option is the only one which promotes a wilderness ideal, that is, a marine environment which fails to retain a visible mark of human activities. If there is a lack of scientific evidence regarding ecological consequences, or if they are unaware of such consequences, these stakehold-ers may use another social value, such as community membership, in choosing a preferred decommissioning alternative (Chabot 1999).
Economic incentives interact and overlap with social values. In past rigs-to-reefs activities, industry and state entities have equally shared the cost-savings resulting from partial removal or toppling alternatives. Partial re-moval of deep water platforms will generate estimated savings of one to two orders of magnitude greater than the amount saved in decommissioning smaller platforms. The cost of maintaining navigational equipment (if any is needed) at these reefed platforms will not increase in the same proportion as the increase in cost-savings, and may actually decrease. These additional financial resources
may be used to develop or enhance projects of interest to stakeholders, and may be a sufficient incentive to alter the preferred decommissioning option for some groups.
The Interaction of Science, Scale, and Social Values
State and federal regulatory agencies involved in the decommissioning process are required to protect the public interest when managing natural resources. In the face of strongly conflicting viewpoints among stakeholder groups, resource managers may try to convert a controversial issue into a technical one. For instance, they may give preference to the protection of marine life resources, thereby avoiding the appearance of favoring one group’s economic concerns over another’s. Additionally, legislation such as the Endangered Species Act and the Marine Mammal Protection Act, among others, often give environmental concerns priority over social and economic concerns. In combination, these issues give ecological information a prominent role in the decommissioning process.
Impacts to the environment may be measured at short or long time scales, or within a local or regional context. As time and space scales increase, so does sci-entific uncertainty about predicting consequences of various management alternatives (due to an increasing number of unknown variables and propagation of error associated with imprecise assumptions or model param-eters). When there is greater scientific uncertainty, social values and political or economic factors often become more important in the decision-making process. This phenomenon may result in stakeholders advocating that ecological performance of reefed platforms be evaluated at scales which enhance the possibility of their preferred decommissioning alternative, even if ecological data are irrelevant to their concerns.
For example, proponents of regional ecological assessment at long time intervals may be individu-als who oppose the local presence of the oil industry. Since regional assessment is difficult and expensive to accomplish, social values (e.g., antagonistic views of oil industry) will increase in importance. Significantly, these same individuals have not stipulated that other artificial reefs which are similar to reefed platforms, such as steel hulled ships, undergo the same rigorous ecological as-sessment. Further, the assured instantaneous and lethal effects of explosives are not considered in arguments about marine life effects.
Proponents of small scale ecological assessment tend to be recreational anglers, who often state their support for rigs-to-reef programs in terms of benefits to the

4-8
DECOMMISSIONING OPTIONS AND ISSUES
4-9
DECOMMISSIONING OPTIONS AND ISSUES
environment. They maintain that the local presence of abundant marine life at a platform is sufficient evidence of satisfactory ecological performance. But this support for a rigs-to-reef alternative often evaporates if artificial reefs are designated no-take areas.
Ecological information greatly aids the deci-sion-making process if explicit management goals are specified. The rebuilding of depleted fish stocks might be one goal, the preservation and expansion of marine wilderness might be another. Determination and rank-ing of ecological goals reflects cultural values. Thus, controversies surrounding platform decommissioning cannot easily be translated into technical issues by giving priority to ecological goals because we lack agreement on the space and time scales in which ecological im-pacts should be measured. Therefore, the scale at which ecological impacts are measured (local or regional) and considered (short or long term) becomes paramount in the decommissioning process. To date, such specific space and time scales have not been designated by any state or federal government agency.
Decommissioning Activities in the Gulf of Mexico
To date, almost all platform decommissioning and reefing in the world has occurred in the Gulf of Mexico. Because large-scale offshore drilling first took place in the Gulf of Mexico, it was in this region that the issue of what to do with unwanted platforms first arose. Below, we give a brief summary of the history of decommissioning in the Gulf of Mexico; additional details are found in Lukens (1997), Kasprzak (1998), and Dauterive (2000).
Kerr-McGee erected the first offshore oil and gas platform in the Gulf of Mexico off Louisiana in 1947. Despite its primitive structure and placement in waters only 6 m (18 ft.) deep, oil was struck 22 days after drill-ing began, presaging a veritable tidal wave of offshore
drilling. In 2001, there were over 4,000 platforms in the Gulf of Mexico, the vast majority occurring off Louisi-ana, followed by Texas, Mississippi and Alabama (Lukens 1997; Moritis 1997; Kasprzak 1998, 1999; Dauterive 2000). Platforms provide a considerable amount of the hard substrate in the north-central Gulf of Mexico, and surveys indicate that 20%–50% more fish live around platforms than on surrounding soft seafloors (Gallaway and Lewbel 1982; Driesen 1985). Because recreational and commercial fishers target fish residing near these structures, they are of considerable economic value (Dimitroff 1982; Reggio 1987; Kasprzak 1998).
By the late 1970s, it was apparent that the economic life span of many of these structures was nearing an end. During that decade, about 150 platforms were removed to shore and scrapped. The first reefing of an oil and gas structure occurred in 1979 when a subsea production system was towed from Louisiana to an artificial reef site off the Panhandle of Florida. In 1982, an obsolete plat-form jacket was moved from Louisiana to a Dade County, Florida site and over the next few years several additional structures were moved to various artificial reef sites.
Responding to this new activity, Congress passed the National Fishing Enhancement Act (NFEA) in 1984 (33 U.S.C. § 2101 et seq.). The NFEA mandated the creation of a “long-term plan for siting, constructing, permit-ting, installing, monitoring, managing, and maintaining artificial reefs within and seaward of state jurisdictions” (Kasprzak 1998). This document, later called the National Artificial Reef Plan, was published in 1985. In response to NFEA, several Gulf of Mexico states have now passed laws to take advantage of platform decommissioning to help preserve complex habitat in the northern Gulf of Mexico, for example, the Louisiana Fishing Enhancement Act of 1986 (LA. REV. STAT. § 56:639.1 et seq.) [Act 100] and the Texas Artificial Reef Act of 1989 (TEX. PARKS & WILDLIFE CODE § 89.001 et seq.). As an example, Act 100 created a process by which ownership of and liability for uneco-nomical platforms could be transferred from operators to the state of Louisiana. As noted by Kasprzak (1998), “Act 100 established the State of Louisiana as the permittee for artificial reefs developed under the program’s jurisdiction and appointed the Department of Wildlife and Fisheries as agent for the state. The state assumes responsibility for the reefs upon placement within the established reef permit area…Act 100 does not authorize state general funds for the artificial reef program but does establish the Louisiana Artificial Reef Trust Fund. Oil and gas compa-nies that donate structures to the program are asked to contribute half of the disposal savings realized through
program participation to the trust fund.” A similar pro-gram exists in Texas (Texas Parks and Recreation 1999).
A significant amount of money has been collected in rigs-to-reef programs in both Louisiana and Texas. As of 2001, there was about $15 million in the Louisiana fund and at least $4 million in Texas. Contrary to what has been reported (McGinnis et al. 2001), major artificial reef programs of several states, including Louisiana and Texas, receive neither state nor federal funding, they are fully underwritten by the interest paid on their respective rigs-to-reef accounts (J. Culbertson, personal commu-nication; R. Kasprzak, personal communication). The Louisiana Department of Wildlife and Fisheries and Texas Parks and Wildlife Department describe their rigs-to-reefs programs at http://www.wlf.state.la.us (under “Marine Fisheries”) and http://www.tpwd.state.tx.us/fish/reef/artreef.htm, respectively.
Since 1942, over 188 Gulf of Mexico platforms have been reefed, primarily off Louisiana and Texas. This rep-resents about 8.4% of all decommissioned platforms (L. Dauterive, personal communication). The reasons for this early low reefing rate were economic. Most of the platforms thus far decommissioned were in shallow wa-ter, and it was more cost effective to haul them onshore for salvage or reuse rather then tow them to reefing sites. In the future, it is likely that a higher proportion of plat-forms will be reefed as more offshore structures become obsolete. Of the platforms that have been reefed, about 60% have been removed from a site and towed to a new location. Contrary to what was stated by Krop (1998), some decommissioned platform structures have been left in place. Thus far, 30% have been toppled in place and the remainder have been partially removed and left standing (Dauterive 2000). As larger platforms in deeper waters are decommissioned, L. Dauterive (personal communica-tion) has noted a trend towards partial removal, rather than towing or toppling. In all but a few instances, only the platform jacket has been used as reef material.
The Future: Ecological Consequences of Offshore Platform Decommissioning in California
Complete Removal (Total Removal) of Platform
The immediate impact of removing and hauling an entire platform to shore is that all attached animals die. If some of the platform structure is hauled to a reef area and replaced in the water, some of these animals may survive, depending on water depth and the length of time the structure is exposed to the air.
Using explosives to separate the jacket from the seafloor kills large numbers of fishes, although limited research makes it difficult to predict how many deaths will occur. Marine mammals and sea turtles may also be indirectly killed by damage to the auditory system. In a study in the Gulf of Mexico (Bull and Kendall 1994), explosives were placed 5 m (15 ft.) below the seafloor to sever the well conductors, platform anchor pilings and support legs, of a platform in about 30 m (100 ft.) of water. All of the fishes on or near the bottom and most of the adult fishes around the entire platform suffered lethal concussion.
Some shallow-water platforms can be removed without explosives. However, “The oil and gas industry has attempted to find alternatives to the use of explo-sives, such as cryogenic cutting, hydraulic abrasive cutting, mechanical cutting, and torch cutting. Most of these techniques either have proven to be ineffective or are successful only in limited situations. At present, the industry maintains that the use of explosives is by far the safest, most reliable, and most cost-effective method of platform removal” (Kasprzak 1998). A recent assessment of techniques for removing platforms (NRC 1996) found that it is unlikely that any techniques or devices now known will significantly reduce fish kills during removal operations that use explosives.
Shell Mounds at the Base of Platform
The jackets and conductors of all platforms off southern and central California are heavily encrusted with invertebrates, including mussels, barnacles, seastars, rock scallops, rock oysters and jingle shells, sea anemo-nes, caprellid amphipods, rock crabs, limpets, gooseneck barnacles, and sessile tunicates. An extremely thick layer of mussels extends from the intertidal zone to depths of at least 30 m (100 ft.) (and deeper on some platforms). The seafloor surrounding the platforms is covered with mussel shells. This “shell mound” or “mussel mound” is created when mussels, and other invertebrates, are dis-lodged during platform cleaning or heavy swells. Our observations show that, depending on bottom depth, a number of species of invertebrates, including many species of seastars, brittle stars, and rock crabs, as well as king crabs, opisthobranchs, shrimps, octopi, and sea anemones are abundant on the shell mounds. Substantial number of fishes, primarily the juvenile stages of various rockfishes, adult stages of dwarf rockfish species, as well as lingcod, poachers, painted greenling, and other benthic species also inhabit shell mounds.
MIL
TON
LO
VE
Juvenile cowcod on pipeline.
4-10
DECOMMISSIONING OPTIONS AND ISSUES
4-11
DECOMMISSIONING OPTIONS AND ISSUES
Around four platforms in shallow water locations (+/- about 33 m, 109 ft., water depth), the shell mounds were found to be many meters thick, and were found to cover accumulations of drilling muds and cuttings. In-vestigations of the shell mounds around deep-water plat-forms have not been completed. Nevertheless, because of the potential for environmental harm, this issue must be addressed for all platforms regardless of the decom-missioning option pursued. The level of contamination, while localized, has been shown to vary from platform to platform. Therefore, any remedial actions taken during the decommissioning process will likely be determined on a case-by-case basis. Although the regulatory require-ments are still evolving, the alternatives being discussed include leaving the shell mounds undisturbed, smooth-ing and shaping them to allow for trawling, capping the shell mounds with an impervious material, adding material to the mounds for enhancement, or completely removing the shell mounds.
The removal of shell mounds may have a number of consequences to marine life by (1) removing habitat and (2) the potential for releasing toxins into the water column during the removal process. The biological con-sequences of either removing, altering, or leaving the shell mounds in-place must be given appropriate attention in the decommissioning process.
Partial Removal of Platform
Since partial removal reduces or eliminates shallow water habitat from the platform structure, this alterna-tive would likely result in lower species composition and diversity than at the start of decommissioning process. Response of biotic communities will depend upon how much of the upper portion is removed. Depending on the platform, fewer nearshore reef fishes, such as surfperches, basses, and damselfishes may occur. Invertebrates that only reside or recruit to shallow water habitat would also be absent. Since the majority of mussels are located at shallow depths, shell mound replenishment will be reduced or absent, and affect the persistence of that community.
Since partial removal does not require the use of explosives, there is relatively little marine mammal, sea turtle, fish and invertebrate mortality compared to com-plete removal. Vertebrate and invertebrate assemblages associated with the remaining platform structure are assumed to be minimally affected.
A number of misunderstandings surround predic-tions regarding the potential ecological consequences of partial removal.
(1) Some stakeholders and policy analysts have er-roneously assumed that Coast Guard regulations require a minimum depth below the ocean surface to which a reefed platform must be reduced. However, as noted earlier, the decision on how much of the jacket and con-ductors is left in place is based on both a Coast Guard assessment and the willingness of the liability holder to pay for the requisite navigational aids. As mussels become rare below 30 m (100 ft.) on most platforms, the mis-taken assumption that all topped platforms must be cut to 24–30 m (80–100 ft.) below the surface has led some to conclude that partial removal will inevitably lead to a severe reduction in the amount of mussels that fall to the bottom and, thus, to a change in or end to the shell mound community. This is not necessarily the case.
(2) Some reports suggest that partial removal will lead to a large decrease in juvenile rockfish densities; our research does not support this supposition. On the offshore platforms in the Santa Barbara Channel region, the juveniles of most rockfish species (particularly blue, bocaccio, halfbanded, olive, pygmy, squarespot, starry, widow, and yellowtail) are uncommon in waters shal-lower than 26 m (85 ft.). Partial removal could reduce fish densities if pelagic juvenile stages of these rockfishes first encounter a platform in shallow surface waters, then swim downwards below the 26 m range, causing pelagic juveniles to “miss” a platform. However, young-of-the-year rockfishes of many of these species recruit from the plankton in large numbers both to natural outcrops in nearshore waters and to those coming out of deeper waters that have crests in about 30 m (100 ft.) of water. This indicates that emergent structure is not necessary for these juveniles to locate suitable habitat.
On the other hand, the pelagic stage of a few rockfish species, particularly copper, gopher, black-and-yellow, and kelp may prefer to recruit shallower portions of the platform than other rockfish species (Holbrook et al. 2000; this report). These species recruit to nearshore rocky outcrops and kelp beds and do not appear to settle in deeper waters (Larson 2002a,b). For these species, partial removal of a platform would probably decrease juvenile recruitment, depending on the uppermost depth of the remaining structure.
(3) Errors regarding factors affecting juvenile fish mortality have also lead to confusion. McGinnis et al. (2001), in describing the history of artificial reef research in California, states that “Research has shown that high relief, open structures serve best to attract fish, and bet-ter enable fishery exploitation, while low relief, complex structured reefs provide better nurseries and afford more
diverse assemblages of fish and other organisms”. Mc-Ginnis et al. (2001) also cite an anonymous California Department of Fish and Game biologist who notes that “a drawback to rigs as reefs is that they are high relief, which works against survival of young-of-the-year fish, suggesting they may not be a source of production but rather simply an attraction site.”
We know of no research that can support the above claims, and the authors do not cite any specific studies. Predators are the main source of juvenile fish mortality in marine systems; death due to starvation or exposure is rare. Thus, variation in habitat structure would modify juvenile fish survivorship by modifying the success rate of predators. Presently, no studies have assessed compara-tive performance in survivorship rates between platforms and natural habitats. Alternatively, we may begin to infer potential predator vulnerability between habitats by ex-amining the ratio of juvenile fishes to piscivorous fishes. In the shallow portion of Platform Irene, the ratio of juvenile rockfishes to piscivorous fish is about 25:1 and at nearby Tarantula Reef it is 3:1 (Appendix 2; Schroeder, unpublished data). Conversely, in the east Santa Barbara Channel, at Platform Gina the ratio is 1:5, and at Portu-guese Rock, Anacapa Island it is 1:1.4.
Toppling of Platform
Toppling would produce reefs with somewhat differ-ent fish assemblages than what has been observed around intact platforms. Consequences of removal of shallow water habitat would be similar to that of partial removal. In California, because most platforms reside in fairly deep water, toppled platforms would also harbor fewer young-of-the-year rockfishes, just as the reefs adjacent to Platform Hidalgo harbor fewer of these animals. De-pending on the characteristics of the platform, a toppled structure, with twisted and deformed pilings and beams, might have more complexity than an upright one. This might increase the number of such crevice dwelling fishes as pygmy rockfishes.
No Removal (Leave-in-Place) of Platform
The no-removal option would allow the platform and shell mound to continue to function as they had when the structure was occupied. Decommissioning activities would result in small mortality impacts to resident marine populations.
What is the Life Span of a Reefed Platform?
How long can a decommissioned steel platform survive in the marine environment before rusting away? Operating steel platforms are protected by sacrificial anodes, often made of aluminum or zinc, which preferentially corrode before steel, thus preserv-ing the jackets’ integrity. This cathodic protection lasts as long as the anodes are intact, usually for a number of decades. It is assumed that, once a platform is reefed, there will be no additional replacement of the sacrificial anodes, although the issue has yet to be addressed for platforms off California. While cor-rosion rates vary in seawater, depending on water temperature, biofouling and other factors, it is esti-mated that the life span of a cathodically unprotected platform will range from a minimum of 100 to more than 300 years (Quigle and Thorton 1989; Mishael 1997; Voskanian and Byrd 1998).
Pipelines Associated with Platforms
Pipelines run from all platforms either to shore or to other platforms that collect the oil or gas and then ship it to shore. McGinnis et al. (2001), note that “Both Federal and California regulations allow decom-missioned OCS pipelines to be abandoned in place so long as they do not constitute a hazard to navigation, commercial fishing or unduly interfere with other uses of the OCS.” (See also 30 C.F.R. § 250.1750; CA. PUB. RES. CODE § 6873.) In the Gulf of Mexico, few pipe-lines have been completely removed in the course of decommissioning (Breaux et al. 1997).
In 2001, using the research submersible Delta, we conducted pilot surveys of a pipeline between Platforms Gail and Grace. We found this pipe to be heavily encrusted with such invertebrates as anemo-nes, crinoids, basket stars, and seastars. We also noted relatively large numbers of fishes, particularly juvenile or dwarf fishes, including cowcod, flag, blackgill, striped, and vermilion rockfishes, along with poach-ers and flatfishes. Both fish and invertebrate densities were much higher than found on the surrounding mud bottom.

4-12
DECOMMISSIONING OPTIONS AND ISSUES
5-1
Resource Management Issues Associated with Decommissioning
Habitat Enhancement of Reefed Platform Structure
The California Department of Fish and Game has issued guidelines for rigs-to-reef projects that call for enhancing the remaining structure using quarry rocks or other material (Parker 1998). Adding such material would increase the number of crevices and hiding places suitable for smaller sized fish. Thus, species which are rare or absent from observed platform fish assemblages, such as pygmy rockfish, may then occur. The ecological community response may depend on the type of habitat enhancement and has not been examined.
Marine Protected Areas
To a certain extent, the platforms in the Santa Bar-bara Channel and Santa Maria Basin currently act as de facto marine protected areas (Schroeder and Love 2002). Fishing pressure around many of these platforms is rela-tively low because (1) some platforms are relatively far from harbors and thus from fishing vessels, (2) four plat-forms (Irene, Hidalgo, Harvest, and Hermosa) are located near Point Conception in waters that are extremely rough for much of the year, and (3) it is difficult to fish close to operating platforms because tying up to these structures is discouraged by platform operators.
Clearly, many reefed platforms would be a target for recreational anglers or commercial fishermen because platforms often host sizable local populations of sought-after fish species. Off Florida, Shinn and Wicklund (1989) suggest that patterns of large fish at Tenneco platforms may be in part determined by fishing activities. Thus, in California, it has been proposed that reefed structures be designated as no-take areas (California senate bill in-troduced by D. Alpert). In addition, it may be possible to modify the architecture of reefed platforms to make them difficult to fish. For instance, because most of the target species are found inside the bottom of platform any structure above the bottom would prevent gear from reaching the seafloor, thus inhibiting the capture of many fishes.
Decommissioning Alternatives in Relation to National Marine Fishery Service’s Fishery Rebuilding Plans
The use of explosives to remove or topple a platform may compromise fishery-rebuilding programs. Cowcod provide one example. This species has been declared overfished by NOAA Fisheries (formerly known as the National Marine Fisheries Service) and is the subject of a federal rebuilding plan. The Pacific Fisheries Manage-ment Council has approved a cowcod rebuilding plan that limits fishery impacts to 1% per year (about 2.4 metric tons for 2001), as part of a 95-year rebuilding period, and the use of spatial closures south of Point Conception to reduce bycatch mortality. As noted earlier, our observations around Platform Gail indicate it has the highest density of adult cowcod and bocaccio of any natural or artificial structure surveyed. We can make an estimate of the number of cowcod at the bottom of Gail by multiplying the density of cowcod observed by the area of the platform’s footprint (the area underneath the platform). For instance, in the last two years of the survey, 1999 and 2000, observed cowcod densities were 0.015 and 0.0183 fish per m2, respectively. As Gail’s footprint is 5,327 m2 (Holbrook et al. 2000), extrapolation for 1999 and 2000 gives estimates of 79 and 97 individuals respectively. This conservative estimate does not include juveniles we have observed living on the shell mound or on the adjacent pipeline. The current rebuilding plan calls for both a quota on commercial and recreational fisher-ies combined of 2.4 metric tons, equal to about 600 fish (T. Barnes, personal communication). Assuming that Platform Gail has 75 or more cowcod living under it, and if, as seems likely from all known research, explosives used to remove or topple a platform will kill all of them, that loss may be sufficiently large to complicate the re-building plan (T. Barnes, personal communication).
CHAPTER 5
RESEARCH AND MONITORING RECOMMENDATIONS
When Governor Davis vetoed SB 1, a bill that would have allotted some of the savings derived from reefing plat-forms to California, he wrote, “ There is no conclusive evi-dence that converted platforms enhance marine species or produce net benefits to the environment…it is premature to establish this program until the environmental benefits of such conversions are widely accepted by the scientific and environmental communities.” And, with respect to assessing the effect of different decommissioning options on marine populations, Holbrook et al. (2000) state that the key marine ecological question is, “What is the effect of each decommissioning alternative on regional stocks of reef-associated species in general, or of particular targeted species?” Clearly, in the decommissioning process, there is a need for additional information.
Below we list examples of research that would be useful in addressing these issues. Many of these examples have been suggested by various resource managers. The first two tasks are necessary to resolve issues regarding attraction or production of platform and natural habitats as well as helping to define essential fish habitat. In addi-tion to aiding in the platform decommissioning process, these three tasks will also aid in future coastal zoning and mapping that would occur in any future boundary expansion of the Channel Islands Marine Sanctuary.
Compare ecological performance between oil platforms and natural outcrops and determine if any oil platforms serve as Essential Fish Habitat for focal species.
What fishes live around platforms and nearby natural reefs?
In order to assess the relative importance of a plat-form to its region, it is essential to conduct basic surveys not only around the platform, but also at nearby reefs. A majority of platforms have not been well surveyed or have not been surveyed at all. Both scuba and submers-ible surveys must be conducted.
How does fish production around platforms com-pare to that at natural outcrops?
Fish production can be assessed and compared between habitats by examining a number of ecological yardsticks. These include (1) fish growth rates, (2) mor-tality rates, and (3) reproductive output. As an example, we conducted a pilot study comparing the growth rates of young-of-the-year blue rockfish at Platform Gilda and Naples Reef. More research needs to be conducted in all of these areas. For instance, mortality rates can be estimated by sequential surveys of the densities of young fishes at a specific platform or natural outcrop. Reproductive output (larval production in the case of rockfishes) can be quantified by first estimating the size frequency and density of a species at a platform or natural outcrop. Then, using size-fecundity relationships from the literature, the potential annual larval production for that species can be calculated.
How does trophic structure around platforms compare to that at natural outcrops?
How do platforms and natural outcrops compare in terms of habitat value?
A relatively new measure called Habitat Value (HV) allows comparisons between habitats, incorporating fish density, fish length, and fish regularity of occurrence. In Stephens et al. (1999), we presented a preliminary analysis of nine platforms and found that platform HVs tended to be much higher than those for open coastal soft substrate, higher than low relief deep rock outcrop and in the same range as wetlands and kelp/rock natural outcrops. An analysis of all of the platforms and as many outcrops as possible should be conducted.
Can we identify areas that are Essential Fish Habitat? All of the above studies contribute to answering
this question.
Spotted ratfish on shell mound at Platform Gail.
LOV
ELA
B, U
C S
AN
TA B
AR
BA
RA

5-2
RESEARCH AND MONITORING RECOMMENDATIONS
5-3
ACKNOWLEDGEMENTS AND PERSONAL COMMUNICATIONS
Define the spatial distribution of economically important species (all life history stages) within the region of interest and define connectivity of habitats within this region.
What is the relative contribution of platforms in supplying hard substrate and fishes to the region?
This research would put in perspective the relative contribution of platforms in supplying hard substrate and reef fishes to their environment.
First, this requires an assessment of the rocky out-crops in the vicinity of each platform; this is derived from seafloor mapping. Much of the seafloor in the vicinity of platforms remains to be characterized. Once the map-ping is complete, visual surveys of the outcrops, using a research submersible, will determine the fish assemblages and species densities in these habitats. Knowing the ar-eal extent of both natural and platforms habitats and the densities of each species in both of these habitats, it is then possible to assess the total contribution of each platform to the fish populations and hard substrate in that region.
How long do fishes reside at platforms? It remains unclear how long fishes are resident
around a platform. For instance, do the large numbers of fishes, such as the overfished bocaccio and cowcod, remain around the platforms for extended periods? One settled on a platform, how long do young-of-the-year fishes remain there? A knowledge of the residence time of these species would allow for a more accurate deter-mination if platforms form optimal habitat for these spe-cies and if they are indeed acting as long-term marine reserves. Residence time can be determined through the use of both tagging studies and observations of a year class through time.
Acoustic tags are one way to determine fish residency. In a pilot study, Dr. Christopher Lowe, at California State University, Long Beach, captured and acoustically tagged rockfishes at Platform Gail and, after one year has de-termined that all have remained around the platform. Broader studies, covering additional platforms, outcrops, and species are needed.
What are the effects of platform retention or removal on fish populations within a region?
As an example, what effect would platform retention or removal have on fish recruitment? For instance, would the young rockfishes that settle out at a platform survive
in the absence of that platform? Our surveys demonstrate that planktonic juvenile fishes, particularly rockfishes, often settle out of the plankton to a platform in sub-stantial numbers. If that platform did not exist, would these young fishes have found, and settled upon, natural outcrops? In a pilot project, we are using radar-derived (CODAR) current data to estimate where the young rockfishes that settled at Platform Irene would have gone if Irene had not existed. We identify the direction and distance of pathways from the platform to natural outcrops. A directional histogram of radar-derived tra-jectories will show the degree to which surface currents potentially carry larvae in any given direction from the platform site. Knowing how long it would take rockfish larvae to reach suitable natural outcrops, and what percent of these larvae would likely die before reaching these outcrops, will give a sense of the importance of a platform as a nursery ground. Similarly, using a synthesis of oceanographic information, it is possible to model the drift direction of larvae produced by fishes living at a platform.
It would be useful to understand the natal origins of fishes residing at platforms and natural outcrops. Both genetic and otolith microchemistry techniques might aid in determining the degree of dispersal of fishes produced at platforms and natural outcrops.
Understand how habitat modification of platform environment (e.g., removal of upper portion or addition of bottom structure) changes associated assemblages of marine life at offshore platforms.
All decommissioning options except leave-in-place involve modification of the current physical structure of offshore platforms. Is it possible to increase fish diversity and density by altering the seafloor or the platform itself? For instance, it would be useful to add complexity, in the form of quarry rock or other structure, to the shell mound around a platform, and follow the changes in fish assemblages.
Descriptive information such as depth distribution and life history information is also useful in determining how decommissioning options affect the environment. Experimental research, using a BACI design or similar ap-proach, can aid in predicting how the biotic community will respond to such structural changes.
ACKNOWLEDGEMENTSThis research was funded by the Biological Resources Division, U. S. Geological Survey (National Offshore Envi-
ronmental Studies Program 1445-CA-0995-0386) based on an information need identified by the Minerals Manage-ment Service’s Pacific OCS Region, as well as by the Minerals Management Service and the California Artificial Reef Enhancement Program (CARE). We would like to thank Lyman Thorsteinson for his unflagging support for this research. Ann Bull and Lyman Thorsteinson carefully reviewed the first draft and we wish to express our sincerest thanks. George Steinbach reviewed our discussion of the platform decommissioning process and options and made very constructive comments.
We greatly appreciate the efforts of Roberta Bloom, UCSB Artworks, who was responsible for the layout and many of the graphics. Also, we would like to thank the following companies for granting us permission to survey their plat-forms: Arguello Associates, Chevron Texaco, Nuevo Energy Company, Pacific Operators Offshore, Torch Operating Company, and Venoco Incorporated.
We thank the pilots of the submersible Delta, Chris Ijames and Dave Slater, for their very professional handling of the technical aspects of that survey, as well as the crews of the R/V Cavalier, R/V McGaw and R/V Valero. Linda Snook managed the deep-water survey data. We thank Craig Syms for his masterful analyses of the deep-water survey data. Frank Donohue, skipper of the F/V Gus D, was an essential part of our pelagic fish surveys. Dr. Edward Brothers compared daily growth rates of blue rockfish. Dr. Mark Carr provided advice and field assistance early in the research program. Dr. Libe Washburn assisted us in planning the biological oceanographic surveys and in subsequently interpreting data from those surveys. Many thanks to the scuba divers who helped us collect data, including Arnold Ammann, Scott Clark, Becky Frodsham, Lise Goddard, William Golden, Jeff Harding, Eric Hessell, Janine Kido, Laird MacDonald, Scott Mau, Melissa Meeker, Michelle Paddack, Chris Thompson, and Jordan Watson. We thank Edwin Beckenbach, Christy Herren, Matt Knope, Elan Love, Kurt McClure, Karina Mendiola, Martin Moreti, Dawn Outram, Maria Petueli, Toni Ross, David Salazar, Clara Svedlund, Melinda Simmons, Eric Simons and others for all manners of assistance in the field and laboratory. Frank Manago and Fred Piltz were always very supportive of our research. We received much useful information about platforms and platform decommissioning from Lee Bafalon, Rob Campbell-Taylor, John Deacon, Tom Dunoway, Rod Eason, Mike Edwards, Jim Galloway, David Gebauer, Jeff Goddard, Rick Kasprzak, Herb Leidy, Jim Lima, Michael Mitchell, Greg Pelka, Karen Robertson-Fall, David Rose, George Steinbach, and Marina Voskanian. Glenn Shackell provided the ROV platform inspection tapes. Linda Nelson drew one of the cowcod images for one of the figures. The California Department of Fish and Game provided the net for the midwater trawling surveys. Finally, we offer apologies to anyone we may have inadvertently forgotten to acknowledge.
PERSONAL COMMUNICATIONSTom Barnes, California Department of Fish and Game, La Jolla, California.
Jan Culbertson, Texas Department of Park and Wildlife, Houston, Texas.
Lester Dauterive, Minerals Management Service, New Orleans, Louisiana.
Jennifer Dugan, Marine Science Institute, University of California, Santa Barbara.
Rick Kasprzak, Louisiana Department of Wildlife and Fisheries, Baton Rouge, Louisiana.
Alec MacCall, National Marine Fisheries Service, Santa Cruz, California.
George Steinbach, Ojai, California.
Libe Washburn, Department of Geography, University of California, Santa Barbara.

R-1
REFERENCESAllen, M. J. and M. D. Moore. 1976. Fauna of offshore structures, p. 179–186. South. Calif. Coastal Water Res. Proj. Ann. Rept. Bascom, W., A. J. Mearns, and M. D. Moore. 1976. A biological survey of oil platforms in the Santa Barbara Channel.
J. Pet. Tech. Vol.24:1280–1284.Beamish, T. D., H. Molotch, P. Shapiro, and R. Bergstrom. 1998. Petroleum extraction in San Luis Obispo County,
California: an industrial history. U. S. Dept. Int., Minerals Management Service, OCS Study MMS 98-0049.Bograd, S. J., P. M. DiGiacomo, R. Durazo, T. Hayward, K. D. Hyrenbach, R. J. Lynn, A. W. Mantyla, F. B. Schwing, W.
J. Sydeman, T. Baumgartner, B. Lavaniegos, and C. S. Moore. 2000. The state of the California Current, 1999–2000: forward to a new regime. CalCOFI Rept. 41:26–52.
Breaux, K., K. Cheramie, J. Macklin, R. Mars, and D. Davis. 1997. Abandoning pipelines working group regulatory is-sues, 65–71. In A. Pulsipher (ed.), Proceedings of an International Workshop on Offshore Lease Abandonment and Platform Disposal: Technology, Regulation, and Environmental Effects. Center For Energy Studies, Louisiana State University, Baton Rouge, LA.
Bull, A. S. and J. J. Kendall, Jr. 1994. An indication of the process: offshore platforms as artificial reefs in the Gulf of Mexico. Bull. Mar. Sci. 55:1086–1098.
California Department of Fish and Game. Review guidance, conversion of offshore oil platforms to artificial reefs. Unpublished Document.
California Resources Agency. 1971. The offshore petroleum resource. California Department of Conservation.Camozzi, N. 1998a. Platform abandonment and the Santa Barbara Channel, 173–174. In F. Manago and B. Williamson
(eds.), Decommissioning and removal of oil and gas facilities offshore California: recent experiences and future deepwater challenges. OCS Study MMS 98-0023.
Camozzi, N. 1998b. Shell mounds, p.175–176. In F. Manago and B. Williamson (eds.), Decommissioning and removal of oil and gas facilities offshore California: recent experiences and future deepwater challenges. OCS Study MMS 98-0023.
Carlisle, J. G. Jr., C. H. Turner, and E. E. Ebert. 1964. Artificial habitat in the marine Environment. Calif. Dept. Fish Game, Fish. Bull. 124.
Carr, M. H. and M. A. Hixon. 1997. Artificial reefs: the importance of comparisons with natural reefs. Fisheries 22:28–33.Carr, M. and J. Stephens. 1998. Disposition session: summary and recommendations, p. 145–147. In F. Manago and B.
Williamson (eds.), Decommissioning and removal of oil and gas facilities offshore California: recent experiences and future deepwater challenges. OCS Study MMS 98-0023.
Chabot, W. 1999. California State Lands Commission Rigs-to-Reefs Workshop, December 3, 1999. Los Angeles, California. http://www.slc.ca.gov/Division_Pages/MRM/RigsToReefs.htm. Coastal Artificial Reef Planning Guide. 1998. The Joint Artificial Reef Technical Committee of the Atlantic and Gulf States Fisheries Commissions. December 1998.
Dauterive, L. 2000. Rigs-to-reefs policy, progress, and perspective. Minerals Management Service, OCS Report MMS 2000-073.
Dimitroff, F. 1982. Survey of snapper and grouper fishermen of northwest Florida coast, p. 56–60. In Proceedings Third Annual Gulf of Mexico Information Transfer Meeting. Minerals Management Service, New Orleans, LA.
Driesen, P. K. 1985. Oil platforms as reefs: oil and fish can mix. Proc. Fourth Symp. Coast. Ocean Manag. 2:1417–1439.Fernandez, L. and S. Hitz. 2001. Costs and benefits of options for California OCS oil and gas platforms, 27–57. In M.
V. McGinnis, L. Fernandez and C. Pomeroy. The politics, economics, and ecology of decommissioning offshore oil and gas structures. MMS OCS Study 2001–006. Coastal Research Center, Marine Science Institute, University of California, Santa Barbara, California. MMS Cooperative Agreement Number 14-35-0001-30761.
Gallaway, B. J. and G. S. Lewbel. 1982. The ecology of petroleum platforms in the northwestern Gulf of Mexico: a com-munity profile. U. S. Fish Wildl. Serv. FWS 10BS-82/87.
Gibbs, B. 2000. Offshore structure abandonment: solutions for an aging industry. Sea. Tech. 41(4):25–32.Harms, S. and C. D. Winant. 1998. Characteristic patterns of the circulation in the Santa Barbara Channel. J. Geophys.
Res. 103:3041–3065.Hartmann, A. R. 1987. Movement of scorpionfishes (Scorpaenidae: Sebastes and Scorpaena) in the Southern California
Bight. Calif. Fish Game 73:68–79.Hayward, T. L., T. R. Baumgartner, D. M. Checkley, R. Durazo, G. Gaxiola-Castro, K. D. Hyrenbach, A. W. Mantyla, M.
M. Mullin, T. Murphree, F. B. Schwing, P. E. Smith, and M. J. Tegner. 1999. The state of the California Current in 1998–1999: transition to cool-water conditions. Calif. Coop. Ocean. Fish. Invest. Rep. 40:29–62.
Opposite: Tons o’invertebrates on the Gail-Grace pipeline. (Photograph by Milton Love)

R-2
REFERENCES
R-3
REFEERENCES
Heizer, R. F. 1943. Aboriginal use of bitumen by the California Indians, p. 74. In O. P. Jenkins (ed.), Geologic formations and economic development of the oil and gas fields of California. California Department of Natural Resources, Division of Mines.
Hendershott, M. C. and C. D. Winant. 1996. Surface circulation in the Santa Barbara Channel. Oceanography 9:114–121.Hickey, B. M. 1998. Coastal oceanography of western North America from the tip of Baja California to Vancouver Island,
p. 345–393. In A. R. Robinson and K. H. Brink (eds.), The Sea. Vol. 11. John Wiley and Sons, New York.Holbrook, S. J., R. F. Ambrose, L. Botsford, M. H. Carr, P. T. Raimondi, and M. J. Tegner. 2000. Ecological issues related
to decommissioning of California’s offshore production platforms. Report to the University of California Marine Council by the Select Scientific Advisory Committee on Decommissioning, University of California.
Horn, M. H. and L. G. Allen. 1978. A distributional analysis of California coastal marine fishes. J. Biogeog. 5:23–42.Kahru, M. and B. G. Mitchell. 2000. Influence of the 1997–98 El Niño on the surface chlorophyll in the California
Current. Geophys. Res. Lett. 27:2937–2940.Kasprzak, R. A. 1998. Use of oil and gas platforms as habitat in Louisiana’s artificial reef program. Gulf Mex. Sci. 16:37–45.Kasprzak, R. A. 1999. Neither gone nor forgotten. Louisiana Conservationist 51(4):4–7.Krop, L. 1998. Environmental user group representative, disposition panel, p. 172. In F. Manago and B. Williamson
(eds.), Decommissioning and removal of oil and gas facilities offshore California: recent experiences and future deepwater challenges. OCS Study MMS 98-0023.
Lambert, M. 1975. Growing up with Summerland. Carpinteria Valley Historical Society.Larson, R. 2002a. Sebastes atrovirens, p. 126–128. In M. S. Love, M. Yoklavich, and L. Thorsteinson. The Rockfishes of
the Northeast Pacific. University of California Press, Berkeley, California. Larson, R. 2002b. Sebastes carnatus and Sebastes chrysomelas, p. 140–143. In M. S. Love, M. Yoklavich, and L. Thorstein-
son. The Rockfishes of the Northeast Pacific. University of California Press, Berkeley, California. Lenarz, W. H., D. A. Ventresca, W. M. Graham, F. B. Schwing, and F. Chavez. 1995. Explorations of El Niño events and as-
sociated biological population dynamics off central California. Calif. Coop. Ocean. Fish. Invest. Rep. 36:106–119.Lima, James T. 1994. The Politics of Offshore Energy Development. Ph.D. Dissertation, University of California, Santa
Barbara.Lindberg, W. J. 1997. Can science resolve the attraction-production issue? Fisheries 22:10–13.Love, M. 2002. Sebastes caurinus, p. 144–147. In M. S. Love, M. Yoklavich, and L. Thorsteinson. The Rockfishes of the
Northeast Pacific. University of California Press, Berkeley, California. Love, M. S., J. Caselle, and L. Snook. 1999. Fish assemblages on mussel mounds surrounding seven oil platforms in the
Santa Barbara Channel and Santa Maria Basin. Bull. Mar. Sci. 65:497–513.Love, M. S., B. Axell, P. Morris, R. Collins, and A. Brooks. 1987. Life history and fishery of the California scorpionfish,
Scorpaena guttata, within the Southern California Bight. Fish. Bull. 85:99–116.Love, M. S., A. Brooks, and J. R. R. Ally. 1996. An analysis of commercial passenger fishing vessel fisheries for kelp bass
and barred sand bass in the southern California Bight. Calif. Fish Game 82:105–121.Love, M. S., J. Caselle, and L. Snook. 2000. Fish assemblages around seven oil platforms in the Santa Barbara Channel
area. Fish. Bull. 98:96–117.Love, M. S., M. Nishimoto, and D. Schroeder. 2001. The ecological role of natural reefs and oil and gas production
platforms on rocky reef fishes in Southern California. U. S. Geological Survey, OCS Study MMS 2001-028.Love, M. S., M. Nishimoto, D. Schroeder, and J. Caselle. 1999. The ecological role of natural reefs and oil and gas pro-
duction platforms on rocky reef fishes in southern California. U. S. Geological Survey, OCS Study MMS 99-0015.Love, M. S., M. Nishimoto, D. Schroeder, A. Gharrett, and A. Gray. 1997. The ecological role of natural reefs and oil and
gas production platforms on rocky reef fishes in southern California. U. S. Geological Survey, BRD/CR 0007.Love, M. S. and W. Westphal. 1990. Comparison of fishes taken by a sportfishing party vessel around oil platforms and
adjacent natural reefs near Santa Barbara, California. Fish. Bull. 88:599–605.Love, M. S., M. Yoklavich, and L. Thorsteinson. 2002. The rockfishes of the northeast Pacific. University of California
Press, Berkeley, CA.Love, M. S., J. Hyland, A. Ebeling, T. Herrlinger, A. Brooks, and E. Imamura. 1994. A pilot study of the distribution
and abundances of rockfishes in relation to natural environmental factors and an offshore oil and gas production platform off the coast of southern California. Bull. Mar. Sci. 55:1062–1085.
Lukens, R. R. (project coordinator). 1997. Guidelines for marine artificial reef materials. Gulf States Marine Fisheries Commission, Number 38.
Lynn, R. J., T. Baumgartner, J. Garcia, C. A. Collins, T. A. Hayward, K. D. Hyrenbach, W. Mantyla, T. Murphree, A. Shankle, F. B. Schwing, K. M. Sakuma, and M. J. Tegner. 1998. The state of the California Current, 1997–1998: transition to El Niño conditions. Calif. Coop. Ocean. Fish. Invest. Rep. 39:25–49.
Lynn, R. J. and J. J. Simpson. 1987. The California Current System: the seasonal variability of its physical characteristics. J. Geophys. Res. 92:12947–12966.
Manago, F. and B. Williamson (eds.). 1998. Proceedings: public workshop, decommissioning and removal of oil and gas facilities offshore California: recent experiences and future deepwater challenges, September 1997. MMS OCS Study 90-0023.
McCorkle, M. 1999. California State Lands Commission Rigs-to-Reefs Workshop, December 3, 1999. Los Angeles, California. http://www.slc.ca.gov/Division_Pages/MRM/RigsToReefs.htm.
McCrea, M. 1998. Position with respect to the decommissioning of offshore oil platforms, p. 178–180. In F. Manago and B. Williamson (eds.), Decommissioning and removal of oil and gas facilities offshore California: recent experiences and future deepwater challenges. OCS Study MMS 98-0023.
McGinnis, M. V., L. Fernandez, and C. Pomeroy. 2001. The politics, economics, and ecology of decommissioning offshore oil and gas structures. MMS OCS Study 2001-006. Coastal Research Center, Marine Science Institute, University of California, Santa Barbara, California. MMS Cooperative Agreement Number 14-35-0001-30761.
McGowan, J. A., D. R. Cayan, and L. M. Dorman. 1998. Climate-ocean variability and ecosystem response in the north-east Pacific. Science 281:210–217.
Miller, C. 1999. California State Lands Commission Rigs-to-Reefs Workshop, December 3, 1999. Los Angeles, California. http://www.slc.ca.gov/Division_Pages/MRM/RigsToReefs.htm.
Mishael, S. J. 1997. Platform decommissioning corrosion estimate. Chevron Corporation, Unpublished Report.Moritis, G. 1997. Industry tackles offshore decommissioning. Oil Gas J.:33–36.Moser, H. G. and P. E. Smith. 1993. Larval fish assemblages of the California Current region and their horizontal and
vertical distributions across a front. Bull. Mar. Sci. 53:645–691.Nevarez, L., H. Molotch, P. Shapiro, and R. Bergstrom 1998. Petroleum extraction in Santa Barbara County, California:
an industrial history. U. S. Dept. Int., Minerals Management Service, OCS Study MMS 98-0048.NRC (National Research Council). 1996. As assessment of techniques for removing offshore structures. National
Academy Press, Washington, D. C.Nishimoto, M. M. 2000. Distributions of late-larval and pelagic juvenile rockfishes in relation to water masses around
the Santa Barbara Channel Islands in early summer, 1996, p. 483–491. In Proceedings of the Fifth California Islands Symposium, March 29–April 1, 1999. U. S. Dept. Int., Santa Barbara, CA.
Nishimoto, M. M. and L. Washburn. 2002. Patterns of coastal eddy circulation and abundance of pelagic juvenile fish in the Santa Barbara Channel, California, USA. Mar. Ecol. Prog. Ser. 241:183–189.
O’Connor, P. E. 1998. Case studies of platform re-use in the Gulf of Mexico. In The Re-use of Offshore Production Fa-cilities, Proceedings of an International Conference on the Reuse of Offshore Production Facilities, Netherlands.
Owen, R. W. 1980. Eddies of the California Current system: physical and ecological characteristics, p. 237–263. In D. M. Powers (ed.), The California Islands: Proceedings of a Multidisciplinary Symposium. Santa Barbara Museum of Natural History, Santa Barbara, CA.
Parker, D. O. 1998. Enhancement of platforms as artificial reefs, p. 122–123. In F. Manago and B. Williamson eds.), Proceedings: public workshop, decommissioning and removal of oil and gas facilities offshore California: recent experiences and future deepwater challenges, September 1997.
Parker, D. 1999. California State Lands Commission Rigs-to-Reefs Workshop, December 3, 1999. Los Angeles, California. OCS Study MMS 98-0023. http://www.slc.ca.gov/Division_Pages/MRM/RigsToReefs.htm.
Paulsen, K., H. Molotch, P. Shapiro, and R. Bergstrom. 1998. Petroleum extraction in Ventura County, California: an industrial history. U. S. Dept. Int., Minerals Management Service, OCS Study MMS 98-0047.
Pulsipher, A. G. and W. B. Daniel. 2000. Onshore disposition of offshore oil and gas platforms: Western politics and inter-national standards. Ocean Coast. Mgmt. 43(12):973-995 2000
Quigel, J. C. and W. L. Thorton. 1989. Rigs to reefs – a case history, p. 77–83. In V. C. Reggio Jr. (ed.), Petroleum struc-

R-4
REFERENCES
T-1
tures as artificial reefs: a compendium. OCS Study MMS-89-0021.Reggio, V. I. Jr. 1987. Rigs to reefs: the use of obsolete petroleum structures as artificial reefs. OCS Rept. MMS 87-0015.Rintoul, W. 1990. Drilling through time. California Department of Conservation, Division of Oil and Gas.Roemmich, D., and J. McGowan. 1995. Climate warming and the decline of zooplankton in the California Current.
Science 267:1324–1326.Schroeder, D. M., A. J. Ammann, J. A. Harding, L. A. MacDonald, and W. T. Golden. 1999. Relative habitat value of oil
and gas production platforms and natural reefs to shallow water fish assemblages in the Santa Maria Basin and Santa Barbara Channel, California. Proc. Fifth Calif. Islands Symp, pp. 493–498.
Schroeder, D. M. and M. S. Love. 2002. Recreational fishing and marine fish population in California. CalCOFI Rept. 43:Schwing, F. B., C. S. Moore, S. Ralston, and K. M. Sakuma. 2000. Record coastal upwelling in the California Current in
1999. Calif. Coop. Ocean. Fish. Invest. Rep. 41:148–160.Sea Surveyor Inc. 2003. Final Report. An assessment and physical characterization of shell mounds associated with outer
continental shelf platforms located in the Santa Barbara Channel and Santa Maria Basin, California. Prepared for Minerals Management Service by MEC Analytical Systems Inc. and Sea Surveyor, Inc., MMS Contract No. 1435-01-02-CT-85136.
Shinn, E. A. and R. I. Wicklund. 1987. Artificial reef observations from a manned submersible off Southeast Florida. Bull. Mar. Sci. 44:1041–1050.
Smith, E. R. and S. R. Garcia. 1995. Evolving California opinion on offshore oil development. Ocean Coast. Mgmt. 26 (1): 41-56.
Southern California Trawlers Association. 1998. Southern California Trawlers Association perspective, p. 182–183. In F. Manago and B. Williamson (eds.), Decommissioning and removal of oil and gas facilities offshore California: recent experiences and future deepwater challenges. OCS Study MMS 98-0023.
Starr, R. M., J. N. Heine, J. M. Felton, and G. M. Cailliet. 2001. Movements of bocaccio (Sebastes paucispinis) and greenspotted (S. chlorostictus) rockfishes in a Monterey submarine canyon: implications for the design of marine reserves. Fish. Bull. 100:324–337.
Stephens, J., D. Schroeder, and M. Love. 1999. Estimating the habitat importance values of oil platform structures to the fish assemblage of southern and central California. In: M. Love, M. Nishimoto, D. Schroeder, and J. Caselle, The ecological role of natural reefs and oil and gas production platforms on rocky reef fishes in southern California, final interim report. USGS/BRD/CR-1999-0007, OCS Study MMS 99-0015.
Stone, R. B. 1985. National Artificial Reef Plan. NOAA Technical Memorandum NMFS-OF-6. Washington, D.C.; NOAA, NMFS, U. S. Department of Commerce. 82 pp.
Terdre, N. 2000. Reuse in focus as decommissioning market develops slowly. Petroleum Review 54(645): 22–23.Texas Parks and Recreation. 1999. Artificial reefs in Texas. Texas Park and Wildlife, PWD BRV3400-123A.Twachtman, R. 1997. Offshore-platform decommissioning perceptions change. Oil Gas J. 95(49):38–41.Vallete, K. 1999. California State Lands Commission Rigs-to-Reefs Workshop, December 3, 1999. Los Angeles, California.
http://www.slc.ca.gov/Division_Pages/MRM/RigsToReefs.htm.van Voorst, O. 1999. Offshore facility re-use - a viable option. Petroleum Review 53(632):38–39.Voskanian, M., and R. Byrd. 1998. Technical session: summary and recommendations, p. 137–139. In F. Manago and
B. Williamson (eds.), Proceedings: public workshop,decommissioning and removal of oil and gas facilities offshore California: recent experiences and future deepwater challenges, September 1997. MMS OCS Study 90-0023.
Wilson, C. A., V. R. Van Sickle, and D. L. Pope. 1987. Louisiana Artificial Reef Plan. Louisiana Department of Wildlife and Fisheries Technical Bulletin No. 41. Louisiana Sea Grant College Program. 51 pp.
Winant, C. D., D. J. Alden, E. P. Dever, K. A. Edwards, and M. C. Hendershott. 1999. Near-surface trajectories off central and southern California. J. Geophys. Res.-Oceans. 104:15713–15726.
Wing, S. R., L. W. Botsford, S. V. Ralston, and J. L. Largier. 1998. Meroplanktonic distribution and circulation in a coastal retention zone of the northern California upwelling system. Limnol. Oceanog. 43:1710–1721.
Wiseman, J. 1999. Rigs-to-reefs siting and design study for offshore California: addressing the issues raised during the MMS/CSLC September workshop, p. 503–509. Proceedings of the Fifth California Island Symposium. Minerals Management Service and Santa Barbara Natural History Museum. OCS Study MMS 99-0038.
Yoklavich, M. M., H. G. Greene, G. M. Cailliet, D. E. Sullivan, R. N. Lea, and M. S. Love. 2000. Habitat associations of deep-water rockfishes in a submarine canyon: an example of a natural refuge. Fish. Bull. 98:625–641.
Common Name Scientific NameGreenspotted rockfish Sebastes chlorostictusGreenstriped rockfish Sebastes elongatusHalfbanded rockfish Sebastes semicinctusHalfblind goby Lethops connectensHalfmoon Medialuna californiensisHoneycomb rockfish Sebastes umbrosusHornshark Heterodontus francisciHornyhead turbot Pleuronicthys verticalisIsland kelpfish Alloclinus holderiJack mackerel Trachurus symmetricusKelp bass Paralabrax clathratusKelp goby Lethops connectensKelp greenling Hexagrammos decagrammusKelp gunnel Ulvicola sanctaerosaeKelp rockfish Sebastes atrovirens Kelp perch Brachyistius frenatusLavender sculpin Leiocottus hirundoLeopard shark Triakis semifasciataLingcod Ophiodon elongatusLongnose skate Raja rhinaMexican rockfish Sebastes macdonaldiMola Mola molaMussel blenny Hypsoblennius jenkinsiNorthern anchovy Engraulis mordaxOcean sunfish Mola molaOcean whitefish Caulolatilus princepsOlive rockfish Sebastes serranoidesOpaleye Girella nigricansPacific argentine Argentina sialisPacific barracuda Sphyraena argenteaPacific electric ray Torpedo californicaPacific hagfish Eptatretus stoutiPacific hake Merluccius productusPacific mackerel Scomber japonicusPacific pompano Peprilus simillimusPacific sanddab Citharichthys pacificusPacific sardine Sardinops sagaxPainted greenling Oxylebius pictusPhanerodon sp. White seaperch, Phanerodon furcatus or sharpnose seaperch, P. atripesPile perch Rhacochilus vacaPink rockfish Sebastes eosPink seaperch Zalembius rosaceusPinkrose rockfish Sebastes simulator Plainfin midshipman Porichthys notatus Pygmy rockfish Sebastes wilsoni
Common Name Scientific NameBank rockfish Sebastes rufusBarred sand bass Paralabrax nebuliferBarred surfperch Amphistichus argenteusBat ray Myliobatis californicaBearded eelpout Lyconema barbatumBig skate Raja binoculataBlack-and-yellow rockfish Sebastes chrysomelasBlackeye goby Rhinogobius nicholsiBlackgill rockfish Sebastes melanostomusBlack rockfish Sebastes melanopsBlacksmith Chromis punctipinnisBlack perch Embiotoca jacksoniBluebanded goby Lythrypnus dalliBluebarred prickleback Plectobranchus evidesBlue rockfish Sebastes mystinusBluntnose sixgill shark Hexanchus griseusBocaccio Sebastes paucispinisBrown rockfish Sebastes auriculatusBull sculpin Enophrys taurinaCabezon Scorpaenichthys marmoratusCalico rockfish Sebastes dalliCalifornia halibut Paralichthys californicusCalifornia lizardfish Synodus luciocepsCalifornia scorpionfish Scorpaena guttata California sheephead Semicossyphus pulcherCalifornia smoothtongue Leuroglossus stilbiusCalifornia tonguefish Symphurus atricaudaCanary rockfish Sebastes pinnigerChilipepper Sebastes goodei C-O turbot Pleuronichthys coenosus Copper rockfish Sebastes caurinusCowcod Sebastes levisDarkblotched rockfish Sebastes crameriDover sole Microstomus pacificusDwarf perch Micrometrus minimusEmbiotoca sp. Black perch, Embiotoca jacksoni or striped perch, E. lateralisFantail sole Xystreurys liolepisFlag rockfish Sebastes rubrivinctusFreckled rockfish Sebastes lentiginosusGaribaldi Hypsypops rubicundaGiant kelpfish Heterostichus rostratusGopher rockfish Sebastes carnatusGrass rockfish Sebastes rastrelligerGray smoothhound Mustelus californicusGreenblotched rockfish Sebastes rosenblatti
TABLESTABLE 1. Common and scientific names of fishes observed in these studies.

T-2
TABLES
T-3
TABLES
Common Name Scientific NameRainbow surfperch Hypsurus caryiRathbunella sp. Unidentified ronquilRedbanded rockfish Sebastes babcockiRex sole Glyptocephalus zachirusRock wrasse Halichoeres semicinctusRosy rockfish Sebastes rosaceusRoughback sculpin Chitonotus pugetensisRubberlip seaperch Rhacochilus toxotesSarcastic fringehead Neoclinus blanchardiSargo Anisotremus davidsoniSebastomus sp. Unidentified member of rockfish subgenus SebastomusSenorita Oxyjulis californicaSharpchin rockfish Sebastes zacentrusSharpnose seaperch Phanerodon atripesShiner perch Cymatogaster aggregataShortbelly rockfish Sebastes jordaniShortspine combfish Zaniolepis frenataShortspine thornyhead Sebastolobus alascanusSilver surfperch Hyperprosopon ellipticumSlender sole Eopsetta exilisSpeckled sanddab Citharichthys stigmaeusSpotted cuskeel Chilara tayloriSpotted ratfish Hydrolagus collieiSpotted sand bass Paralabrax maculatofasciatusSquarespot rockfish Sebastes hopkinsiStarry rockfish Sebastes constellatusStriped seaperch Embiotoca lateralisStripetail rockfish Sebastes saxicolaSwell shark Cephaloscyllium ventriosum
Common Name Scientific NameSwordspine rockfish Sebastes ensiferThornback Platyrhinoidis triseriataThreadfin bass Pronotogrammus multifasciatusTreefish Sebastes serricepsTube-snout Aulorhynchus flavidusVermilion rockfish Sebastes miniatusWalleye surfperch Hyperprosopon argenteumWhite seabass Atractoscion nobilisWhite surfperch Phanerodon furcatusWhitespeckled rockfish Sebastes moseri Widow rockfish Sebastes entomelasWolf-eel Anarrhichthys ocellatusYelloweye rockfish Sebastes ruberrimusYellowtail Seriola lalandiYellowtail rockfish Sebastes flavidusZebra goby Lythrypnus zebraZebraperch Hermosilla azureaUnidentified blennies Family BlenniidaeUnidentified gunnel Family PholidaeUnidentified kelpfishes Family ClinidaeUnidentified pipefishes Syngnathus spp.Unidentified poachers Family AgonidaeUnidentified rockfish Sebastes spp. juveniles Unidentified ronquils Family BathymasteridaeUnidentified sanddabs Citharichthys spp.Unidentified sculpins Family Cottidae Unidentified silversides Family AtherinidaeUnidentified fish species
TABLE 1. (cont.) Common and scientific names of fishes observed in these studies. TABLE 2. Mean length of selected species at platform bottoms and shell mounds, 1996–2001.
Species Location Holly Irene Grace Hidalgo Hermosa Harvest Gail LINGCOD bottom — 22.6 30.4 34.7 — 32.7 — shell mound — 19.1 30.2 22.2 — 28.8 — t — 7.04 0.15 7.57 — 2.24 — d.f. — 869 124 222 — 49 — significant@α=.05 — *
— * —
* —
PAINTED bottom — 15.6 — 12.7 — — — GREENLING shell mound — 13.5 — 11.9 — — — t — 3.35 — 0.93 — — — d.f. — 175 — 80 — — — significant@α=.05 —
* — — — — —
STRIPED bottom — — — 17.8 — 22.1 21.3 ROCKFISH shell mound — — — 14.4 — 21.3 17.4 t — — — 3.11 — 1.75 5.08 d.f. — — — 82 — 341 119 significant@α=.05 — — — *
— — *
COPPER bottom 22.2 20.7 — — — — —
ROCKFISH shell mound 20 18.4 — — — — — t 22.23 5.95 — — — — — d.f. 327 1,400 — — — — — significant@α=.05 * *
— — — — —
PINKROSE bottom — — — — — — 20.2 ROCKFISH shell mound — — — — — — 14.2 t — — — — — — 141.2 d.f. — — — — — — 278 significant@α=.05 — — — — — — *GREENBLOTCHED bottom — — — — — — 26.0 ROCKFISH shell mound — — — — — — 17.5 t — — — — — — 8.86 d.f. — — — — — — 432 significant@α=.05 — — — — — — * FLAG bottom — — 17.4 — — — — ROCKFISH shell mound — — 13.7 — — — — t — — 3.23 — — — — d.f. — — 136 — — — — significant@α=.05 — — *
— — — —
HALFBANDED bottom 12.5 11.6 16.2 12.3 13.5 — — ROCKFISH shell mound 7.0 7.0 14.9 10.4 11.7 — — t 7.23 35.6 32.8 32.33 31.37 — — d.f. 438 6,356 15,230 13,158 10,288 — — significant@α=.05 * * * * * * *

T-4
TABLES
T-5
TABLES
TABLE 3. Total numbers and densities (fishes per 100m2) of all fishes observed at Platform Hidalgo and North Reef, 1996–2001.
PLATFORM HIDALGO NORTH REEF Species Total Density Species Total DensityUnidentified rockfish YOY 13,462 103 Unidentified rockfish YOY 4,786 54Halfbanded rockfish 13,194 101 Pygmy rockfish 1,684 19Widow rockfish YOY 828 6 Widow rockfish YOY 886 10Greenspotted rockfish 617 5 Halfbanded rockfish 575 7Flag rockfish 266 2 Greenspotted rockfish 370 4Lingcod 224 2 Sebastomus group 187 2Painted greenling 218 2 Yellowtail rockfish 118 1Widow rockfish 95 <1 Vermilion rockfish 100 1Bocaccio YOY 91 <1 Squarespot rockfish 72 <1Greenstriped rockfish 84 <1 Shortspine combfish 69 <1Greenblotched rockfish 69 <1 Greenstriped rockfish 61 <1Bocaccio 56 <1 Unidentified rockfish 52 <1Rosy rockfish 56 <1 Lingcod 49 <1Vermilion rockfish 44 <1 Blackeye goby 43 <1Canary rockfish 41 <1 Unidentified fish 40 <1Squarespot rockfish 33 <1 Pink surfperch 39 <1Swordspine rockfish 27 <1 Starry rockfish 38 <1Sebastomus sp. 27 <1 Canary rockfish 38 <1Pacific sanddab 17 <1 Greenblotched rockfish 38 <1Pygmy rockfish 16 <1 Rosy rockfish 34 <1Sharpchin rockfish 16 <1 Unidentified combfish 27 <1Unidentified combfish 14 <1 Pacific argentine 23 <1Cowcod 12 <1 Swordspine rockfish 19 <1Yelloweye rockfish 12 <1 Flag rockfish 18 <1Kelp greenling 10 <1 Bocaccio 16 <1Unidentified rockfish 9 <1 Cowcod 12 <1Unidentified sanddab 7 <1 Widow rockfish 10 <1Starry rockfish 7 <1 Unidentified flatfishes 10 <1Shortspine combfish 6 <1 Unidentified ronquils 5 <1Unidentified poacher 5 <1 Speckled rockfish 4 <1Yellowtail rockfish 5 <1 Yelloweye rockfish 4 <1Unidentified fishes 5 <1 Unidentified sanddab 3 <1Pink surfperch 4 <1 Bank rockfish 3 <1Bank rockfish 2 <1 Unidentified poacher 2 <1Unidentified ronquil 2 <1 Ratfish 2 <1Unidentified sculpin 1 <1 Olive rockfish 2 <1Ratfish 1 <1 Unidentified Cusk-eel 1 <1Copper rockfish 1 <1 Kelp greenling 1 <1Stripetail rockfish 1 <1 Painted greenling 1 <1California scorpionfish 1 <1 Bluebarred prickleback 1 <1Longspine combfish 1 <1 Sharpchin rockfish 1 <1 Longspine combfish 1 <1 TOTAL 29,587 226 TOTAL 9,445 108Minimum number of species 34 Minimum number of species 34 Total rockfish YOY 14,381 109 Total rockfish YOY 5,672 65Total rockfishes 29,071 217 Total rockfishes 9,128 99Rockfish YOY comprised 48.6% of all fishes surveyed. Rockfish YOY comprised 60% of all fishes surveyed.All rockfishes comprised 98.3% of all fishes surveyed. All rockfishes comprised 96.6% of all fishes surveyed.Species observed only at Platform Hidalgo: California scorpionfish, copper and stripetail rockfishes.Species observed only at North Reef: Blackeye goby, bluebarred prickleback Pacific argentine, speckled sanddab.
TABLE 4. Total numbers of all fishes observed at the deeper, below 30 m, depths at seven platforms and 80 natural outcrops, 1996–2001.
ALL PLATFORMS Species Total Species Total Species TotalUnident. rockfish YOY 47,973 Pile perch 235 Splitnose rockfish 22Halfbanded rockfish 46,831 Blackeye goby 222 Gopher rockfish 19Widow rockfish YOY 10,902 Pacific sanddab 215 Pygmy rockfish 17Shortbelly rockfish 7,443 Unidentified combfish 210 Yelloweye rockfish 16Squarespot rockfish 3,834 Yellowtail rockfish 198 C-O turbot 15Pacific sardine 3,308 Whitespeckled rockfish 196 Senorita 14Blacksmith 2,796 Halfmoon 189 Darkblotched rockfish 14Widow rockfish 2,540 Unidentified rockfish 184 Unidentified Rathbunella 12Vermilion rockfish 2,288 Kelp rockfish 171 Cabezon 12Blue rockfish 2,063 Rosy rockfish 167 California smoothtongue 11Stripetail rockfish 2,037 Northern anchovy 159 Starry rockfish 11Bocaccio YOY 1,910 Brown rockfish 142 Bank rockfish 11Copper rockfish 1,836 Unidentified fishes 131 Speckled rockfish 7Painted greenling 1,738 Chilipepper 122 Spotted ratfish 6Greenspotted rockfish 1,595 Canary rockfish 113 Hornyhead turbot 5Widow/squarespot rockfish1,575 Unidentified flatfish 103 Unidentified cuskeel 4Lingcod 1,486 Cowcod 98 Phanerodon sp. 4Calico rockfish 1,311 Unidentified seaperch 95 Unidentified skate 4Shiner perch 1,161 Swordspine rockfish 73 Wolf-eel 3Bocaccio 742 Kelp greenling 66 Unidentied eelpout 3Flag rockfish 735 Kelp bass 55 Rex sole 2Sharpnose seaperch 621 California sheephead 53 Bluebanded goby 2Greenblotched rockfish 600 Longspine combfish 43 California halibut 2Unidentified sanddab 576 Dover sole 41 Redbanded rockfish 2Greenstriped rockfish 572 Opaleye 38 Pink rockfish 2California scorpionfish 560 Garibaldi 36 Pacific electric ray 2Pacific hake 531 Honeycomb rockfish 35 Mola 1Sebastomus sp. 371 Spotted cuskeel 33 White seaperch 1Jack mackerel 348 Treefish 33 Whitespeckled rockfish/ Sharpchin rockfish 346 Unidentified ronquil 30 Chilipepper 1Pinkrose rockfish 331 Rubberlip seaperch 30 Bocaccio/chilipepper 1Olive rockfish 312 Pacific mackerel 30 Shortspine thornyhead 1Pink seaperch 308 Blackgill rockfish 28 California tonguefish 1Unidentified poacher 296 Unidentified sculpin 26 Shortspine combfish 245 Mexican rockfish 25
TOTAL 155,973 Minimum number of species 85 Total rockfishes 139,855 All rockfishes comprised 89.7% of all fishes surveyed.

T-6
TABLES
T-7
TABLES
TABLE 4. (cont.) Total numbers of all fishes observed at the deeper, below 30 m, depths at seven platforms and 80 natural outcrops, 1996–2001.
ALL NATURAL OUTCROPS Species Total Species Total Species TotalWidow rockfish YOY 87,238 Splitnose rockfish 214 Black perch 12Squarespot rockfish 41,344 Pile perch 202 Calico rockfish 12Pygmy rockfish 36,036 Greenblotched rockfish 167 Pacific hake 9Shortbelly rockfish 35,439 Cowcod 146 Rubberlip seaperch 9Halfbanded rockfish 26,169 Bocaccio YOY 146 Kelp rockfish 9Swordspine rockfish 11,733 White seaperch 137 California halibut 7Sebastomus spp. 7,648 Rathbunella sp 128 Unidentified prickleback 6Widow rockfish YOY 6,635 Canary rockfish 127 Spotted cuskeel 4Widow rockfish 6,245 Painted greenling 125 Dover sole 4Blacksmith 4,744 Unidentified flatfish 123 Redbanded rockfish 4Pink seaperch 4,495 Honeycomb rockfish 118 California lizardfish 4Senorita 3,831 Copper rockfish 112 Jack mackerel 4Rosy rockfish 2,459 Unidentified seaperch 111 Wolf-eel 3Blue rockfish 2,274 Stripetail rockfish 106 Slender sole 3Blackeye goby 2,123 Unidentified poacher 104 Bluntnose sixgill shark 3Pacific sardine 2,070 Pacific argentine 104 Hornyhead turbot 3Bank rockfish 1,781 Unidentified sanddab 104 Longnose skate 3Pinkrose rockfish 1,433 Unidentified ronquil 85 White seabass 2Speckled rockfish 1,285 Olive rockfish 85 Roughback sculpin 2Greenspotted rockfish 1,094 Unidentified sculpin 73 Northern anchovy 2Vermilion rockfish 945 Freckled rockfish 65 Rex sole 2Unidentified rockfish 863 Yelloweye rockfish 65 Kelp greenling 2Bocaccio 861 Treefish 64 Halfmoon 2Unidentified combfish 728 Sharpchin rockfish 59 Unidentified pholid 2Shortspine combfish 663 Shortspine thornyhead 49 English sole 2Pinkrose rockfish 585 Swell shark 48 Unidentified turbot 2Lingcod 580 Brown rockfish 40 Unidentified skate 2Yellowtail rockfish 494 Darkblotched rockfish 38 Pacific electric ray 2Greenspotted rockfish 462 Unidentified eelpout 36 Pacific sanddab 1Starry rockfish 440 Gopher rockfish 35 Rainbow surfperch 1Unidentified fish 381 Longspine combfish 31 California smoothtongue 1Chilipepper 373 Island kelpfish 27 Bearded eelpout 1Sharpnose seaperch 325 Blackgill rockfish 26 Unidentified cuskeel 1Flag rockfish 309 Ocean whitefish 23 Phanerodon sp 1Spotted ratfish 296 Threadfin bass 21 Bluebarred prickleback 1California sheephead 237 Pink rockfish 17 C-O turbot 1California scorpionfish 222 Pacific hagfish 14 Big skate 1Whitespeckled rockfish 221 Bronzespotted rockfish 13
GRAND TOTAL 298,379 Minimum number of species 94 Total rockfishes 276,034 All rockfishes comprised 92.5% of all fishes surveyed.
TABLE 5. Twenty highest densities of rockfish young-of-the-year juveniles, 1996–2001 as ob-served from the Delta submersible. Platforms are listed in blue, natural outcrops in red. Density of Habitat Rockfish YOYSite Year Type (fish per 100m2)
Hidden Reef 1999 Natural 1249.2Platform Hermosa 1999 Midwater 993. 6Platform Irene 1998 Midwater 935.4Platform Harvest 1999 Midwater 555.1Platform Irene 1999 Midwater 524.3San Miguel Island 1995 Natural 520.5Platform Grace 2001 Midwater 486.5Platform Hidalgo 1997 Midwater 385.2Potato Bank 1996 Natural 367.7Platform Irene 1997 Bottom 363.8Platform Grace 2000 Midwater 346.2Platform Irene 1997 Midwater 344.1North Reef 1995 Natural 338.7Platform Holly 1999 Bottom 326.1Platform Hidalgo 1999 Midwater 314.6Platform Irene 2001 Midwater 306.2San Nicolas Island 1996 Natural 302.9San Miguel Island 1995 Natural 262.1Santa Rosa Island 1995 Natural 227.1Platform Harvest 1997 Midwater 225.6
TABLE 6. Fish species observed as young-of-the-year juveniles at California oil/gas platforms.
Common Name Common NameBank rockfish Kelp bass* Black rockfish Kelp greenling*Blackeye goby* Kelp rockfish*Blackgill rockfish Lingcod*Blacksmith* Olive rockfishBlue rockfish* Pacific hakeBluebanded goby* Painted greenling*Bocaccio* Pinkrose rockfish*Brown rockfish* Pygmy rockfish*Cabezon* Rosy rockfish*Calico rockfish* Sharpchin rockfishCanary rockfish* Shortbelly rockfish*Copper rockfish* Splitnose rockfishCowcod* Squarespot rockfish*Flag rockfish* Starry rockfish*Garibaldi* Stripetail rockfish*Gopher/Black-and-Yellow rockfish* TreefishGreenblotched rockfish* Vermilion rockfish*Greenspotted rockfish* Widow rockfish*Greenstriped rockfish* Yelloweye rockfish*Halfbanded rockfish* Yellowtail rockfishHalfmoon* Unidentified combfishes (Zaniolepis spp.)*
We also observed adult sarcastic fringehead, as well as unidentified blennies (Hypsoblennius spp.) and sculpins. Given the cryptic and sed-entary nature of these species, we believe they arrived at platforms via larval recruitment.
In addition, Carlisle et al. (1964) observed young-of-the-year black perch, pile perch, rubberlip seaperch, and white surfperch at Platform Hazel (removed in 1996).
*These species were observed as both new-ly settled juveniles and adults at platforms.

A-1
APPENDICESAPPENDIX 1. Platform Synopses
In this section, we give a brief summary of each of the California platforms. The platforms are listed from the most northwest, Irene, off Point Arguello, to Emmy in the southeast off Long Beach.
Wherever possible, we have included the following information on each platform: (1) the original operator; (2) the current operator of record; (3) the date the platform was installed; (4) the first production date; (5) the platform’s distance from shore (including whether it is in state or outer continental shelf [OCS] waters); (6) the bottom depth of the platform; (7) the number of wells; (8) what the platform produces (oil and/or gas); (9) the platform jacket dimen-sions (generally at the seafloor [bottom]); (10) the size of the shell mound surrounding the platform; (11) the size of the platform’s footprint. This data was taken from California Resources Agency (1971), Manago and Williamson (1998), Holbrook et al. (2000), and Sea Surveyor Inc. (2001). We have also included a photograph of most of the platforms and their locations including latitude and longitude.
We follow this with a synopsis of the fish assemblages around each platform. When these summaries are based on our scuba and submersible surveys we include the years these surveys were conducted. Scuba surveys are midwater surveys except at the shallow water Platform Gina. Because of funding limitations, a number of platforms were surveyed only once and in a number of instances poor water visibility prevented complete coverage. Neither ExxonMobil nor Aera gave us permission to survey their platforms. In some instances, we were able to review videos that were taken during mandatory platform inspections. From these, we made a qualitative estimate of platform bottom fish assemblages for those platforms we were unable to survey. IRENE
Original operator: Union; current operator of record: Nuevo Energy; date installed: 1985; first production: 1987; distance from shore (miles): 4.7 (OCS); water depth: 73 m (242 ft.); number of well slots 72; produces: oil and gas; plat-form jacket dimensions: 47 x 56 m (155 x 185 ft.) (bottom); platform footprint (m2): 2,633; location: 120o43.45’N, 34o36.37’W.
Dates and types of surveys:Scuba: 1995–2000Submersible: Midwater Bottom Shell Mound1995 x1996 x x x 1997 x x x1998 x x x1999 x x x2000 x x x2001 x x x
Platform Irene’s midwaters consistently harbored large numbers of YOY (young-of-the-year) and older juvenile rockfishes. Bocaccio, blue, shortbelly, squarespot, treefish, and widow rock-fishes, and the complex comprised of young black-and-yellow, copper, gopher, and kelp rockfishes, were abundant. Densities of these fishes were usually among the highest we observed around either platforms or natural outcrops. Young painted greenling, living on the jacket, were also quite abundant. During the 1998 El Niño, YOY blacksmith settled on the platform in large numbers. However, they were gone by the following year. Kelp greenling recruited as young-of-the-year in 1999; they swam to the platform bottom during the next year and were there through 2001.Two pelagic species, jack mackerel and Pacific sardine, were also occasionally seen in high numbers. The platform bottom had particularly high densities of halfbanded rockfish and YOY rockfishes, as well as subadult and adult copper, vermilion, calico, and brown rockfishes. Juvenile lingcod, pile perch and painted greenling were also very abundant and Pacific sanddab, canary and yellowtail rockfishes were frequently seen. On the shell mound, halfbanded and copper rockfish, as well as young lingcod were very common. Platform Irene is particularly noteworthy as it harbored far higher densities of young lingcod than did any other site (platform or natural outcrop) that we surveyed.
Opposite: Vermilion rockfish and assorted invertebrates at the bottom of Platform Grace. (Photograph by Donna Schroeder)

A-2
APPENDIIX 1
A-3
APPENDIIX 1
HIDALGO Original operator: Chevron; current operator of record: Arguello Inc.; date installed: 1986; first production: 1991;
distance from shore (miles): 5.9 (OCS); water depth: 130 m (430 ft.); number of well slots: 56; produces: oil and gas; platform jacket dimensions: 78 x 53 m (257 x 176 ft.) (bottom); platform footprint (m2): 4,154; location: 34°29’N, 120°42’W.
Dates and types of surveys:Scuba: 1996–2000 Submersible: Midwater Bottom Shell Mound1996 x x x1997 x x x1998 x x x1999 x x x2000 x x x2001 x x x
We observed high densities of YOY and older juvenile rockfishes in the midwaters of Platform Hidalgo. A number of rockfishes, including blue, copper, gopher, kelp, olive, rosy, squarespot, and widow rockfishes and bocaccio were abundant. Halfmoon and young painted greenling were also common. Large numbers of YOY blacksmith recruited to the platform during 1998 and remained there through 2001. Similarly, kelp greenling young settled during 1999, and some remained through 2001. Jack mackerel and northern anchovy were occasional visitors. The bottom of this platform was dominated by halfbanded, greenspotted, and flag rockfishes, YOY rockfishes, and lingcod. Flag rockfish density was higher than at any natural outcrop or other platform. Other important species included canary, greenstriped, vermilion, and widow rockfishes and painted greenling. On the shell mounds, we noted extremely large numbers of halfbanded rockfish. Both juvenile and adult lingcod were also abundant.
HARVESTOriginal operator: Texaco; current operator of record: Arguello Inc.; date installed: 1985; first production: 1991;
distance from shore (miles): 6.7 (OCS); water depth: 205 m (675 ft.); number of well slots: 50; produces: oil and gas; platform jacket dimensions: 61 x 97 m (200 x 319 ft.) (bottom); platform footprint (m2): 5,859; location: 34°28’N, 120°40’W.
Dates and types of surveys:Scuba: 1996–2000 Submersible: Midwater Bottom Shell Mound1996 x1997 x x x1998 x x x1999 x x x2000 x x x2001
As on most of the other platforms we surveyed, YOY and somewhat older rockfishes characterized the midwaters of Platform Harvest. Of these, bocaccio, as well as blue, olive, squarespot, and widow rockfishes were most abundant. Young painted greenling , as well as halfmoon, also were seen frequently. Blacksmith were abundant, they had recruited in 1998 as YOY and remained at the platform through 2001. Large numbers of kelp greenling settled from the plankton in 1999. Pelagic species, such as northern anchovy and Pacific sardine, were occasional visitors. In the deeper midwa-ters, we saw many sharpchin and whitespeckled rockfishes. Stripetail, greenstriped, greenspotted, and greenblotched rockfishes and lingcod were commonly seen on the bottom. Stripetail, greenstriped and sharpchin rockfishes were most abundant on the shell mounds.
HERMOSAOriginal operator: Chevron; current operator of record: Arguello Inc.; date installed: 1985; first production: 1991;
distance from shore (miles): 6.8 (OCS); water depth: 183 m (603 ft.); number of well slots: 48; produces: oil and gas; platform jacket dimensions: 61 x 85 m (200 x 280 ft.) (bottom); platform footprint (m2): 5,142; location: 34°27’N, 120°38’W.
Dates and types of surveys:Scuba: 1996–2000 Submersible: Midwater Bottom Shell Mound
1996 x x 1997 x x x1998 x x x1999 x x x2000 x x x 2001
Platform Hermosa’s midwaters are noteworthy as rockfish nursery grounds. They harbored the second highest densities of YOY rockfishes of any site we surveyed (second only to Hidden Reef) (Table 5). Bocaccio, blue, olive, squarespot, widow, and whitespeckled rockfishes, as well as painted greenling were very abundant. Blacksmith and halfmoon were also typical species. As at many other platforms, in 1999 kelp greenling settled out of the plankton at Platform Hermosa. Jack mackerel and northern anchovy were also common. While halfbanded rockfish dominated the bottom assemblage, greenspotted rockfish were also abundant. Halfbanded rockfish also were the most abundant species on the shell mound.
HONDOOriginal operator: Exxon; current operator of record: ExxonMobil; date installed: 1976; first production: 1981;
distance from shore (miles): 5.1 (OCS); water depth: 255 m (842 ft.); number of well slots: 28; produces: oil and gas; platform jacket dimensions: 68 x 68 m (225 x 225 ft.) (bottom); platform footprint (m2): 4,649; location: 34°23’N, 120°07’W.
Exxon and ExxonMobil did not allow us to survey this platform. However, we were able to review part of an inspec-tion tape made at and near the bottom of Platform Hondo (Divecon International, 3 August 2002). Based on this, a number of rockfishes, including bank, darkblotched, pinkrose, widow and probably blackgill, live around the bottom of Platform Hondo. Darkblotched rockfish appeared to be particularly abundant.
HARMONYOriginal operator: Exxon; current operator of record: ExxonMobil; date installed: 1989; first production: 1993;
distance from shore (miles): 6.4 (OCS); water depth: 363 m (1,198 ft.); number of well slots: 60; produces: oil and gas; platform jacket dimensions: 91 x 117 m (300 x 385 ft.) (bottom); platform footprint (m2): 10,606; location: 34°22’N, 120°10’W.
Exxon and ExxonMobil did not allow us to survey this platform.
HERITAGEOriginal operator: Exxon; current operator of record: ExxonMobil; distance from shore (miles): 8.2 (OCS); water
depth: 326 m (1,075 ft.); number of well slots: 60; produces: oil and gas; location: 34°21’N, 120°16’W.Exxon and ExxonMobil did not allow us to survey this platform. We reviewed part of an ROV inspection of this
platform (Divecon International, 2 August 2002) and noted blackgill, darkblotch, pinkrose, and widow rockfish at or near the bottom.

A-4
APPENDIIX 1
A-5
APPENDIIX 1
HOLLYOriginal operator: Atlantic Richfield, current operator of record: Venoco, date installed: 1966; first production: 1966; dis-
tance from shore (miles): 1.8 (state); water depth: 64 m (211 ft.); number of well slots: 30; produces: oil and gas; platform jacket dimensions: 18 x 30 m (60 by 100 ft.) (surface), 36 x 48 m (119 by 158 ft.) (bottom); location: 34°22’N, 119° 52’W.
Dates and types of surveys:Scuba: 1995–2000 Submersible: Midwater Bottom Shell Mound 1995 x1996 x x 1997 x x x1998 x x x1999 x20002001 x x x
The midwaters around Platform Holly were populated by large numbers of blue, copper, kelp, olive, squarespot, and widow rockfishes and bocaccio. With the exception of kelp rockfishes, most of these fishes were juveniles. Black-smith, halfmoon, kelp bass, painted greenling, pile perch, and sharpnose seaperch were also abundant. Schools of jack mackerel and Pacific sardines were also noted. The platform bottom fish assemblage was characterized by YOY widow rockfish, calico, vermilion, halfbanded, and copper rockfishes, sharpnose seaperch and blackeye goby. Most of the vermilion and copper rockfishes were juveniles and subadults. Calico, vermilion, and copper rockfishes were the most abundant species on the shell mound. C
Original operator: Union Oil; current operator of record: Nuevo Energy; date installed: 1977; first production: 1977; distance from shore (miles): 5.7 (OCS); water depth: 58 m (192 ft); number of well slots: 60; produces: oil and gas; platform jacket dimensions: 40 x 48 m (133 x 158 ft.) (bottom); platform footprint (m2): 1,930; location: 34°19’N, 119°37’W.
Dates and types of surveys: Submersible: Midwater Bottom Shell Mound2000 x (partial) x
Only part of the platform midwater was surveyed and olive
rockfish were most abundant. On the shell mound, vermilion, halfbanded, and calico rockfishes were most common, and black-eye goby, copper rockfish and painted greenling were also frequently encountered. A platform inspection video made on 23 September 1999 (Stolt Comex Seaway) around the platform bottom showed large numbers of juvenile blue, brown, copper, olive, vermilion, and widow rockfishes and lingcod. Both juvenile and adult calico, gopher, halfbanded and kelp rockfishes and painted greenling were also present.
BOriginal operator: Union Oil; current operator of record: Nuevo
Energy; date installed: 1968; first production: 1969; distance from shore (miles): 5.7 (OCS); water depth: 58 m (190 ft.); number of well slots: 63; produces: oil and gas; platform jacket dimensions: 40 x 48 m (133 x 158 ft.) (bottom); platform footprint (m2): 1,930; location: 34°19’N, 119°37’W.
Dates and types of surveys: Submersible: Midwater Bottom Shell Mound2000 x
Juvenile widow rockfish, which had probably settled from the plankton in 1999, were abundant in the platform midwaters in 2000. Blacksmith, young blue, olive and kelp rockfishes, senorita and painted greenling were also common. We reviewed a video of a platform inspection (Stolt Comex Seaway, 21 September 1999) and noted large numbers of juvenile lingcod, blue, flag, and vermilion rockfishes as well as many juvenile and adult calico, gopher, halfbanded, kelp and rosy rockfishes and painted greenling. A
Original operator: Union Oil; current operator of record: Nuevo Energy; date installed: 1968; first production: 1969; distance from shore (miles): 5.8 (OCS); water depth: 57 m (188 ft.); number of well slots: 57; produces: oil and gas; platform jacket dimensions: 40 x 48 m (133 x 158 ft.) (bottom); platform footprint (m2): 1,930; location: 34°19’N, 119°36’W.
Dates and types of surveys: Submersible: Midwater Bottom Shell Mound2000 x
Blacksmith, blue and olive rockfishes were most abundant in the platform midwaters during 2000. Halfmoon, kelp bass and painted greenling were also common. Due to poor visibility, we were unable to survey the bottom and shell mound of Platform A during 2000. However, we reviewed a 2001 platform inspection video tape (Divecon International 2001) conducted with a remotely operated vehicle. That tape showed that there were large numbers of fishes, primarily rockfishes, around the platform bottom. These included many subadult vermilion and copper rockfishes, as well as blue, calico, gopher, kelp, and juvenile widow rockfishes, lingcod and painted greenling.
HILLHOUSE
Original operator: Sun Oil; current operator of record: Nuevo Energy; date installed: 1969; first production: 1970; distance from shore (miles): 5.5 (OCS); water depth: 58 m (190 ft.); number of well slots: 60; produces: oil and gas; platform jacket dimensions: 49 x 40 m (163 x 133 ft.) (bottom); location: 34°19’N, 119°36’W.
Dates and types of surveys: Submersible: Midwater Bottom Shell Mound 2000 x
Blacksmith and painted greenling were the most abundant species in the platform midwaters. Poor water visibility prevented us from surveying the platform bottom and shell mound. We reviewed a videotape made during an ROV platform inspection survey (Divecon International, 26 August 2001) and, although this too was conducted during poor visibility, noted juvenile copper, flag, and vermilion rockfishes, as well as painted greenling and pile perch.

A-6
APPENDIIX 3
A-7
APPENDIIX 3
HENRYCurrent operator of record: Nuevo Energy; date installed:
1979; first production: 1980; distance from shore (miles): 4.3 (OCS); water depth: 52 m (173 ft.); number of well slots: 24; produces: oil and gas; platform jacket dimensions: 45 x 33 m (149 x 110 ft.) (bottom); size of shell mound: 9 m (19 ft) high, circular and 76 m (250 ft.) in diameter; platform footprint (m2): 1,505; location: 34°19’N, 119°33’W.
Dates and types of surveys: Submersible: Midwater Bottom Shell Mound2000 x
Halfmoon, blacksmith and kelp bass were common in the midwaters of Platform Henry.
HOUCHINOriginal operator: Phillips Petroleum/Continental Oil/
Cities Services Oil; current operator of record: Pacific Opera-tors Offshore; date installed: 1968; first production: 1969; dis-tance from shore (miles): 4.1 (OCS); water depth: 49 m (163 ft.); number of well slots: 60; produces: oil and gas; platform jacket dimensions: 38 x 38 m (125 x 125 ft.) (bottom); size of shell mound: 6 m (21 ft.) high, circular and 85 m (280 ft.) in diameter; 1,435; location: 34°20’N, 119°33’W.
Dates and types of surveys: Submersible: Midwater Bottom Shell Mound2000 x
Painted greenling and halfmoon were the most abundant species in the platform midwaters.
HOGANOriginal operator: Phillips Petroleum/Continental Oil/Cities Services Oil; current operator of record: Pacific
Operators Offshore; date installed: 1967; first production: 1968; distance from shore (miles): 3.7 (OCS); water depth: 47 m (154 ft.); number of well slots: 66; produces: oil and gas; platform jacket dimensions: 38 x 38 m (125 x 125 ft.) (bottom); platform footprint (m2): 1,435; location: 34°20’N, 119°32’W.
Dates and types of surveys: Submersible: Midwater Bottom Shell Mound2000 x
The midwaters around Platform Hogan were important habitat for a diverse fish assemblage. Blacksmith, blue and olive rockfishes, painted greenling, sharpnose seaperch, pile perch and California sheephead were all common species.
HABITATOriginal operator: Texaco; current operator of record: Nue-
vo Energy; date installed: 1981; first production: 1993; distance from shore (miles): 7.8 (OCS); water depth: 88 m (290 ft.); number of well slots: 24; produces: gas; platform jacket dimen-sions: 60 x 38 m (199 x 125 ft.) (bottom); platform footprint (m2): 2,284; location: 34°17’N, 119°35’W.
Dates and types of surveys: Submersible: Midwater Bottom Shell Mound1995 x (partial)2000 x
YOY widow rockfish, blacksmith, and one-year-old widow rockfish dominated the midwater at Platform Habitat. Blue and kelp rockfishes and painted greenling were also common species.
GRACEOriginal operator: Standard Oil; current operator of record: Venoco; date installed: 1979; first production: 1980;
distance from shore (miles): 10.5 (OCS); water depth: 96 m (318 ft.); number of well slots: 48; produces: Grace is a non-producing platform; platform jacket dimensions (at surface and at bottom): 27 x 44 m (90 by 145 ft.) (surface), 48 x 65 m (158 x 213 ft.) (bottom); size of shell mound: 4 m (13 ft.) high, oval, 61 x 118 m (200 x 390 ft.), oriented in a northwest-southeast direction; platform footprint (m2): 3,090; location: 34°10’N, 119°28’W.
Dates and types of surveys:Scuba: 1996–2000 Submersible: Midwater Bottom Shell Mound1996 x x1997 x x x1998 x x1999 x x x2000 x x x2001 x x x
The midwaters around Platform Grace contained very large numbers of young rockfishes. Most of these rockfishes recruited between 1999 and 2001.YOY widow rockfish and bocaccio, juve-nile squarespot, blue and widow rockfishes, bocaccio and juve-nile and adult blacksmith were very common. Painted greenling, sharpnose seaperch, jack mackerel and young flag rockfish were also frequently encountered. Halfbanded rockfish were the most abundant species around the platform bottom. Juvenile widow, vermilion, and flag rockfishes and bocaccio were also abundant. Many of these individuals had settled out of the plankton at the platform in 1999 and had remained there. Squarespot and greenspotted rockfishes, young lingcod, and sanddabs were also common. Over the shell mounds, halfbanded rockfish and shiner perch were the most abundant species. Pink seaperch, sanddabs, YOY bocaccio, young lingcod, juvenile greenspotted, flag and vermilion rockfishes were also characteristic species.

A-8
APPENDIIX 1
A-9
APPENDIIX 1
GILDAOriginal operator: Union Oil; Current operator of record:
Nuevo Energy; date installed: 1981; first production: 1981; dis-tance from shore (miles): 8.8 (OCS); water depth: 62 m (205 ft.); number of well slots: 96; produces: oil and gas; platform jacket dimensions: 45 x 52 m (150 x 170 ft.) (bottom); platform footprint (m2): 2,342.location: 34°10’N, 119°25’W.
Dates and types of surveys:Scuba: 1995–2000 Submersible: Midwater Bottom Shell Mound2000 x
Blacksmith, halfmoon, kelp bass, opaleye, senorita, as well as YOY and juvenile blue, olive, squarespot and widow rockfishes and bocaccio were abundant in the midwater of this platform. Many of these rockfishes recruited from the plankton as YOYs during 1999. Due to poor visibility, we were unable to survey the bottom and shell mound of Platform Gilda during 2000. However, we reviewed a 2001 platform inspection video tape (Divecon International 2001) conducted with a remotely operated vehicle. That tape showed high densities of calico and juvenile vermilion rockfishes, as well as blue, brown, copper, halfbanded, olive, and widow rockfishes. Kelp greenling, lingcod, Pacific sanddab, and painted greenling were also noted.
GAIL
Original operator: Standard Oil; current operator of record: Venoco; date installed: 1987; first production: 1988; distance from shore (miles): 9.9 (OCS); water depth: 224 m (739 ft.); number of well slots: 36; produces: oil and gas; platform jacket dimensions: 21 x 52 m (70 x 170 ft.) (surface), 60 x 90 m (197 x 297 ft.) (bottom); platform footprint (m2): 5,327; location: 34°07’N, 119°24’W.
Dates and types of surveys:Scuba: 1996–2000 Submersible: Midwater Bottom Shell Mound1996 x x1997 x x x1998 x1999 x x x2000 x x x2001 x x x
Blacksmith, halfmoon, kelp bass and a variety of young rockfishes, including bocaccio, blue, flag, olive, and widow, characterized the midwaters of this platform. Most of the young rockfishes settled from the plankton in 1999. The platform bottom fish assemblage was dominated by adult bocaccio, greenblotched, greenspotted, stripetail and pinkrose rockfishes. Of particular interest, we observed higher densities of both adult cowcod and bocaccio at the bottom of Platform Gail than at any natural outcrop or other platform. The shell mound at Platform Gail was characterized by stripetail, pinkrose, greenblotched and greenstriped rockfishes. On one occasion, large numbers of juvenile hake were observed, on another northern anchovies were abundant.
GINAOriginal operator: Union Oil; current operator of record: Nuevo Energy; date installed:1980; first production: 1982;
distance from shore (miles): 3.7 (OCS); water depth: 29 m (95 ft.); number of well slots: 15; produces: oil and gas; plat-form jacket dimensions: 28 x 20 m (94 x 65 ft.) (bottom); shell mound: 4 m (13 ft.) high, oval, 45 x 64 m (150 x 210 ft.), oriented in a northwest-southeast direction; platform footprint (m2): 561; location: 34°07’N, 119°16’W.
Dates and types of surveys:Scuba: 1995–2000
Platform Gina had the highest species richness (47) of any platform surveyed using scuba. Blacksmith dominated the assemblage, comprising 38% of all fishes observed. A close second was kelp bass, which counted for 31% of all fishes observed. Platform Gina had the highest number and density of surfperches of any platform, and was the only site where rubberlip surfperch formed part of the assemblage. The shell mound habitat at this platform provided excellent habitat for many species of recruiting rockfishes, where 13 species were observed. However, despite being present at every other surveyed platform, no widow or bocaccio juveniles were observed at Platform Gina. Pelagic species that characterized this assemblage include yellowtail, barracuda, and jackmackerel. EDITH
Original operator: Standard Oil; current operator of record: Nuevo Energy; date installed: 1983; first production: 1984; distance from shore (miles): 8.5 (OCS); water depth: 49 m (161 ft.); number of well slots: 72; produces: oil and gas; platform jacket dimensions: 58 x 50 m (190 x 165 ft.) (bottom); platform footprint (m2): 2,879; location: 33°35’N, 118°08’W.
Dates and types of surveys: Submersible: Midwater Bottom Shell Mound1998 x x x
Blacksmith, halfmoon, opaleye, sheephead and garibaldi characterized the midwater fish assemblage at Platform Edith. Very high densities of California scorpionfish, along with sharpnose seaperch, blacksmith and blackeye goby were found at the platform bottom. California scorpionfish were also extremely abundant on the shell mound.
ELLENOriginal operator: Shell Oil; current operator of record: Aera Energy; date installed: 1980; first production: 1981;
distance from shore (miles): 8.6 (OCS); water depth: 80 m (265 ft.); number of well slots: 80; produces: oil and gas; platform jacket dimensions: 45 x 56 m (147 x 186 ft.) (bottom); platform footprint (m2): 2,511; location: 33°34’N, 118°07’W.
Aera did not allow us to survey this platform. We reviewed a tape of a platform inspection carried out with a remotely op-erated vehicle (Divecon International, 7 September 2001) and observed very high densities of flag, halfbanded, squarespot and honeycomb rockfishes. We also saw a number of young vermilion rockfish. In the platform midwater, from about 61 m (200 ft) and deeper, there were very large numbers of young rockfishes, including both squarespots and widows.

A-10
APPENDIIX 1
A-11
ELLYOriginal operator: Shell Oil; current operator of record: Aera Energy;
date installed: 1980; first production: n/a; distance from shore (miles): 8.6 (OCS); water depth: 77 m (255 ft.); number of well slots: n/a; produces: Elly is a processing facility for Ellen and Eureka; platform jacket dimen-sions: 48 x 61 m (159 x 202 ft.) (bottom); platform footprint (m2): 2,949; location: 33°35’N, 118°07’W.
Aera did not allow us to survey this platform. We reviewed a tape of a platform inspection carried out with a remotely operated vehicle (Divecon International, 9 September 2001) and observed high densities of young vermilion and young widow rockfishes, as well as many flag, honeycomb, olive, and squarespot rockfishes, and lingcod.
EUREKAOriginal operator: Shell Oil; current operator of record: Aera
Energy; date installed: 1984; first production: 1985; distance from shore (miles): 9.0 (OCS); water depth: 212 m (700 ft.); number of well slots: 60; produces: oil and gas; platform jacket dimensions: 54 x 85 m (179 x 282 ft.) (bottom); platform footprint (m2): 4,635; location: 33°33’N, 118°06’W.
Aera did not allow us to survey this platform. We reviewed a tape of a platform inspection carried out with a remotely operated vehicle (Divecon International, 5 September 2001) and observed large numbers of pink-rose and juvenile darkblotched rockfishes, as well as juvenile and subadult bocaccio and widow rockfish. Also present were flag, greenblotched and greenspotted, and perhaps speckled, rockfishes and lingcod.
EVAOriginal operator: Union Oil Company; current operator of
record: Nuevo Energy; date installed: 1964; first production: 1966; distance from shore (miles): 1.8 (state); water depth: 17 m (57 ft.); number of well slots: 39; produces: oil and gas; location: 33°39’N, 118°03’W.
EMMYOriginal operator: Signal Oil and Gas Company; current operator
of record: Aera Energy; date installed: 1963; first production: 1963; distance from shore (miles): 1.2 (state); water depth: 14 m (47 ft.); number of well slots: 53; produces: oil and gas; location: 33°39N, 118°02’W.
Aera did not allow us to survey this platform.
APPENDIX 2 Density of fishes observed during the oil/gas platform scuba surveys off central and southern California. Platforms
are listed from northwest to southeast. Density is in fish per 100 m2, “<” means “less than.”
Common name Irene Hidalgo Harvest Hermosa Holly Grace Gilda Gail GinaBarred sand bass 0.8Black rockfish <0.1 <0.1 <0.1 <0.1Black-and-yellow rockfish <0.1 <0.1 <0.1 Blackeye goby <0.1 <0.1 <0.1 0.2 4.0Blacksmith 1.6 16.2 20.0 8.5 20.9 71.3 57.4 77.4 51.3Blue rockfish 32.3 3.8 18.9 7.5 36.3 5.3 9.8 3.9 1.3Bluebanded goby <0.1Bocaccio 9.5 0.1 3.7 0.8 36.6 2.7 5.0 5.9 Brown rockfish <0.1 <0.1 <0.1 <0.1Bull sculpin <0.1Cabezon 0.1 0.1 0.2 0.2 0.1 <0.1 0.1 <0.1 1.1 Calico rockfish <0.1 0.6 California barracuda 0.4 <0.1 0.8 California scorpionfish <0.1 <0.1 0.1 California sheephead <0.1 <0.1 0.1 <0.1 0.3 C-O turbot <0.1 Copper rockfish 0.2 0.2 0.1 0.1 0.8 0.1 <0.1 <0.1 <0.1 Copper 6.1 4.7 3.1 1.5 0.7 0.8 0.4 0.1 0.2 -complex juv. rockfishes Garibaldi <0.1 0.1 <0.1 0.1 Giant kelpfish <0.1 Gopher rockfish <0.1 <0.1 <0.1 <0.1 0.1 <0.1 <0.1 <0.1 <0.1 Grass rockfish <0.1 <0.1 <0.1 0.2 <0.1 Halfbanded rockfish 0.6 Halfmoon <0.1 1.3 0.3 0.9 3.1 2.2 16.7 13.7 2.4Jackmackerel 69.3 22.1 8.0 34.5 6.1 6.3 0.2 9.6Kelp bass <0.1 0.5 6.1 1.8 42.9Kelp greenling 0.1 0.4 0.6 0.4 0.1 0.1 0.1 0.1 <0.1Kelp rockfish <0.1 0.7 0.2 0.1 3.7 1.5 0.6 0.4 0.4Lingcod <0.1 0.1 <0.1 0.2Mussel blenny <0.1 Northern anchovy 6.3 7.4 7.4 Ocean sunfish <0.1 Ocean whitefish 0.0 0.8Olive rockfish 0.6 0.7 4.5 3.8 2.5 0.3 1.6 0.9 0.2Opaleye <0.1 2.4 0.1 2.5Pacific butterfish <0.1 Pacific mackerel <0.1 Painted greenling 3.4 1.6 1.5 2.9 1.9 1.0 0.5 1.7Pile perch 0.1 0.7 0.2 3.4Rock wrasse 0.1 0.1Rosy rockfish <0.1 0.5 <0.1 <0.1 <0.1 0.1Rubberlip seaperch 0.6Sarcastic fringehead <0.1 Sardine 7.1 0.2 169.3 36.4 1.2 6.8 Senorita 3.6 0.2 Sharpnose seaperch 1.9 0.7 2.3

A-12
APPENDIIX 2
A-13
Common name Irene Hidalgo Harvest Hermosa Holly Grace Gilda Gail GinaShortbelly rockfish 57.0 Spotted sand bass <0.1Squarespot rockfish 4.7 8.4 3.3 49.0 5.4 13.3 0.2 4.2Starry rockfish <0.1Stripetail rockfish 1.2Treefish 0.4 0.1 0.2 <0.1 0.1 0.2 0.1 0.1 0.1Unidentified Atherinidae 12.3 Unidentified Blenniidae <0.1 <0.1 <0.1 Unidentified Bothidae <0.1Unidentified Clinidae <0.1 Unidentified Cottidae <0.1 <0.1 <0.1 <0.1 <0.1 <0.1 <0.1 <0.1Unidentified fish species <0.1 <0.1 <0.1 <0.1 <0.1 <0.1 <0.1Unidentified 4.9 8.6 1.2 0.1 1.6 0.5 0.2 0.1 0.6 rockfish juvenilesVermilion rockfish 0.1White seaperch <0.1 <0.1 <0.1 1.5Widow rockfish 141.4 10.8 46.9 15.5 54.9 2.7 1.5 <0.1 Wolf eel <0.1 <0.1Yellowtail 0.1
APPENDIX 3 Number and density of fishes observed in the midwaters, bottoms and shell mounds of oil/gas platforms off cen-
tral and southern California. Platforms are listed geographically, from northwest to southeast. Species are ranked by number observed. YOY means “young-of-the-year”, those are fish that are less than one year old. Density is in fish per 100 m2, “<” means “less than”.
PLATFORM MIDWATERSBecause we could not estimate the lengths of the transects around Platforms Habitat and Gilda, no fish densities are pre-
sented.
PLATFORM IRENE (Surveyed 1995–2001) PLATFORM HIDALGO (Surveyed 1996–2001)Species Number Density Species Number DensityShortbelly rockfish YOY 7,300 378 Unidentified rockfish YOY 13,134 186Unidentified rockfish YOY 4,133 214 Widow rockfish YOY 794 11Widow rockfish YOY 2,310 120 Painted greenling 136 2Pacific sardine 1,600 83 Bocaccio YOY 87 1Bocaccio YOY 989 51 Halfbanded rockfish 34 <1Widow rockfish 372 19 Widow rockfish 26 <1Yellowtail rockfish 133 7 Flag rockfish 6 <1Blacksmith 120 6 Kelp greenling 5 <1Painted greenling 26 1 Yellowtail rockfish 5 <1Copper rockfish 24 1 Squarespot rockfish 5 <1Pile surfperch 11 <1 Pygmy rockfish 3 <1Blue rockfish 5 <1 Unidentified fish 3 <1Unidentified rockfish 2 <1 Greenspotted rockfish 2 <1Kelp greenling 1 <1 Unidentified sculpin 1 <1Lingcod 1 <1 Copper rockfish 1 <1Olive rockfish 1 <1 Cabezon 1 <1
TOTAL 17,028 880 TOTAL 14,243 200Minimum number of species 14 Minimum number of species 13 Total rockfish YOY 14,732 763 Total rockfish YOY 14,015 198Total rockfishes 15,269 790 Total rockfishes 14, 097 198Rockfish YOY comprised 86.5% of all fishes surveyed. Rockfish YOY comprised 98.3% of all fishes surveyed.All rockfishes comprised 89.7% of all fishes surveyed. All rockfishes comprised 98.9% of all fishes surveyed.
Cabezon in the midwater of Platform Holly.
DA
N D
UG
AN

A-14
APPENDIIX 3
A-15
APPENDIIX 3
PLATFORM MIDWATERS, cont.
PLATFORM HARVEST (Surveyed 1996–2000) PLATFORM HERMOSA (Surveyed 1996–2000)Species Number Density Species Number DensityUnidentified rockfish YOY 5,000 54 Unidentified rockfish YOY 17,242 199Widow rockfish YOY 1,474 16 Widow rockfish YOY 1,140 16Squarespot rockfish 1,246 14 Painted greenling 480 7Painted greenling 289 3 Blue rockfish 436 5Sharpchin rockfish 171 2 Widow rockfish 256 3Whitespeckled rockfish 134 1 Squarespot rockfish 148 2Widow rockfish 113 1 Whitespeckled rockfish 47 <1Chilipepper 50 <1 Sebastomus sp. 42 <1Sebastomus sp. 47 <1 Blacksmith 30 <1Bocaccio YOY 43 <1 Bocaccio YOY 29 <1Flag rockfish 26 <1 Unidentified rockfish 22 <1Unidentified rockfish 23 <1 Pacific hake 19 <1Unidentified fish 22 <1 Greenspotted rockfish 12 <1Greenspotted rockfish 21 <1 Halfbanded rockfish 10 <1Blue rockfish 18 <1 Flag rockfish 8 <1Blacksmith 13 <1 Copper rockfish 5 <1Kelp rockfish 5 <1 Cowcod 5 <1Cabezon 2 <1 Unidentified fish 4 <1Kelp greenling 2 <1 Unidentified sculpin 3 <1Pacific sardine 2 <1 Cabezon 3 <1Rosy rockfish 2 <1 Lingcod 3 <1Shortbelly rockfish 2 <1 Sharpchin rockfish 3 <1Blackeye goby 1 <1 Chilipepper 2 <1Bocaccio 1 <1 Stripetail rockfish 2 <1Calico rockfish 1 <1 Treefish 2 <1Halfbanded rockfish 1 <1 Yelloweye rockfish 2 <1Pygmy rockfish 1 <1 Shortspine combfish 1 <1 TOTAL 19,955 232Starry rockfish 1 <1 Minimum number of species 21 Treefish 1 <1 Total rockfish YOY 18,411 215Wolf-eel 1 <1 Total rockfishes 19,413 225Yellowtail rockfish 1 <1 Rockfish YOY comprised 92.2% of all fishes surveyed. All rockfishes comprised 97.3% of all fishes surveyed.TOTAL 8,715 91 Minimum number of species 26 Total rockfish YOY 6,517 70 Total rockfishes 8,382 88 Rockfish YOY comprised 74.8% of all fishes surveyed. All rockfishes comprised 96.2% of all fishes surveyed.
PLATFORM MIDWATERS, cont.
PLATFORM HOLLY (Surveyed 1995–1998, 2001) PLATFORM A (Surveyed 2000)Species Number Density Species Number DensityPacific sardine 1,506 78 Blacksmith 421 28Squarespot rockfish 315 16 Blue rockfish 336 22Jack mackerel 287 15 Olive rockfish 126 8Unidentified rockfish YOY 129 6 Halfmoon 25 2Painted greenling 120 6 Kelp bass 17 1Kelp rockfish 43 2 Painted greenling 11 <1Copper rockfish 31 2 Unidentified seaperch 9 <1Sharpnose seaperch 31 1 Sharpnose seaperch 9 <1Yellowtail rockfish 22 1 Kelp rockfish 8 <1Blacksmith 8 <1 Garibaldi 7 <1Pile perch 7 <1 Unidentified rockfish YOY 6 <1Brown rockfish 7 <1 Pile perch 5 <1Calico rockfish 6 <1 California sheephead 4 <1Gopher rockfish 6 <1 Blackeye goby 3 <1Unidentified rockfish 6 <1 Unidentified fish 1 <1Sebastomus sp. 4 <1 Unidentified rockfish 1 <1Treefish 3 <1 Unidentified sculpin 2 <1 TOTAL 989 61Widow rockfish 2 <1 Minimum number of species 13 Blue rockfish 2 <1 Total rockfish YOY 6 <1Bocaccio YOY 2 <1 Total rockfishes. 477 30Unidentified fish 2 <1 Rockfish YOY comprised <1% of all fishes surveyed.Lingcod 1 <1 All rockfishes comprised 48.2% of all fishes surveyed.Olive rockfish 1 <1 Rubberlip seaperch 1 <1 Widow rockfish YOY 1 <1 Unidentified seaperch 1 <1 TOTAL 2,546 127 Minimum number of species 22 Total rockfish YOY 122 6 Total rockfishes 580 27
Including the one time occurrence of Pacific sardine, YOY rockfishes comprised 4.8%, and all rockfishes comprised 22.8% of all fishes surveyed.
Excluding Pacific sardines, YOY rockfishes comprised 11.7%, and all rockfishes comprised 55.8% of all fishes surveyed.

A-16
APPENDIIX 3
A-17
APPENDIIX 3
PLATFORM MIDWATERS, cont.
PLATFORM B (Surveyed 2000) PLATFORM C (Partially Surveyed 2000) Species Number Density Species Number DensityWidow rockfish 180 12 Olive rockfish 13 3Blacksmith 124 8 Kelp rockfish 7 2Blue rockfish 44 3 Pile perch 4 <1Olive rockfish 26 2 Blue rockfish 4 <1Kelp rockfish 16 1 Phanerodon sp. 3 <1Senorita 13 <1 Vermilion rockfish 2 <1Painted greenling 13 <1 Unidentified rockfish 2 <1California sheephead 9 <1 Lingcod 1 <1Kelp bass 6 <1 Unidentified fish 1 <1Sharpnose seaperch 6 <1 Unidentified rockfish YOY 1 <1Halfmoon 5 <1 Pile perch 4 <1 TOTAL 38 5Bluebanded goby 2 <1 Minimum number of species 7 Cabezon 1 <1 Total rockfish YOY 1 <1Copper rockfish 1 <1 Total rockfishes 27 5Gopher rockfish 1 <1 All rockfishes comprised 71.1% of all fishes surveyed.Lingcod 1 <1 Unidentified rockfish YOY 1 <1 TOTAL 453 26 Minimum number of species 17 Total rockfish YOY 1 <1 Total rockfishes 269 18 Rockfish YOY comprised <1.0% of all fishes surveyed. All rockfishes comprised 59.4% of all fishes surveyed. PLATFORM HILLHOUSE (Surveyed 2000) PLATFORM HENRY (Surveyed 2000)Species Number Density Species Number DensityBlacksmith 23 2 Halfmoon 57 6Painted greenling 22 2 Blacksmith 20 2Kelp bass 7 <1 Kelp bass 12 1Olive rockfish 7 <1 Painted greenling 8 <1Pile perch 3 <1 Kelp rockfish 1 <1Kelp rockfish 1 <1 Unidentified rockfish YOY 1 <1Lingcod 1 <1 Phanerodon sp. 1 <1 TOTAL 99 9Unidentified rockfish 1 <1 Minimum number of species 5 Total rockfish YOY 1 <1TOTAL 66 4 Total rockfishes 2 <1Minimum number of species 8 Rockfish YOY comprised 1% of all fishes surveyed.Total rockfishes 9 <1 All rockfishes comprised 2% of all fishes surveyed. All rockfishes comprised 13.6% of all fishes surveyed.
PLATFORM MIDWATERS, cont.
PLATFORM HOUCHIN (Surveyed 2000) PLATFORM HOGAN (Surveyed 2000)Species Number Density Species Number DensityPainted greenling 41 4 Blacksmith 75 7Halfmoon 12 1 Blue rockfish 72 6Kelp rockfish 9 <1 Olive rockfish 41 3Blacksmith 4 <1 Painted greenling 28 3Unidentified rockfish YOY 4 <1 Sharpnose seaperch 26 2Garibaldi 3 <1 Pile perch 16 1Pile perch 2 <1 California sheephead 15 1California sheephead 1 <1 Kelp rockfish 4 <1Olive rockfish 1 <1 Unidentified rockfish YOY 4 <1Sharpnose seaperch 1 <1 Garibaldi 1 <1Unidentified sculpin 1 <1 Kelp bass 1 <1 Rubberlip seaperch 1 <1TOTAL 99 6 Minimum number of species 10 TOTAL 293 23Total rockfish YOY 4 <1 Minimum number of species 11 Total rockfishes 14 <1 Total rockfish YOY 4 <1Rockfish YOY comprised 4% of all fishes surveyed. Total rockfishes 121 9All rockfishes comprised 14% of all fishes surveyed. Rockfish YOY comprised 1.4% of all fishes surveyede All rockfishes comprised 41.3% of all fishes surveyed. PLATFORM HABITAT (Partially Surveyed 1995, Surveyed 2000) Species Number DensityWidow rockfish YOY 470 Blacksmith 122 Widow rockfish 111 Unidentified rockfish YOY 41 Blue rockfish 25 Painted greenling 14 Kelp rockfish 14 Bocaccio YOY 12 Flag rockfish 7 Halfmoon 5 Olive rockfish 5 Copper rockfish 4 Garibaldi 4 Kelp bass 1 Sebastomus sp. 1 TOTAL 836 Minimum number of species 13 Total rockfish YOY 523 Total rockfishes 690 Rockfish YOY comprised 62.6% of all fishes surveyed. All rockfishes comprised 82.5% of all fishes surveyed.

A-18
APPENDIIX 3
A-19
APPENDIIX 3
PLATFORM MIDWATERS, cont.
PLATFORM GRACE (Surveyed 1996–2001) PLATFORM GILDA (Surveyed 2000)Species Number Density Species Number DensityUnidentified rockfish YOY 5,454 79 Widow rockfish 650 Widow rockfish YOY 2,768 40 Blue rockfish 23 Squarespot rockfish 1,554 22 Olive rockfish 15 Blue rockfish 1,029 15 Kelp bass 6 Widow rockfish 633 9 Kelp rockfish 6 Bocaccio YOY 396 6 Painted greenling 5 Blacksmith 313 4 Squarespot rockfish 3 Bocaccio 142 2 Blacksmith 2 Painted greenling 86 1 Bocaccio 2 Sharpnose seaperch 54 <1 Lingcod 1 Jack mackerel 54 <1 Mola 1 Flag rockfish 46 <1 Opaleye 1 Kelp rockfish 35 <1 Pile perch 1 Olive rockfish 30 <1 Senorita 1 Pacific mackerel 30 <1 Sharpnose seaperch 1 Unidentified rockfish 28 <1 Halfmoon 26 <1 TOTAL 718 Chilipepper 25 <1 Minimum number of species 15 Sebastomus sp. 15 <1 Total rockfishes 699 Brown rockfish 10 <1 All rockfishes comprised 97.4% of all fishes surveyed.Copper rockfish 10 <1 Lingcod 7 <1 Whitespeckled rockfish 5 <1 Unknown fish 4 <1 Unknown sculpin 3 <1 Greenspotted rockfish 3 <1 Rosy rockfish 2 <1 Swordspine rockfish 2 <1 Treefish 2 <1 Calico rockfish 1 <1 Cowcod 1 <1 Kelp greenling 1 <1 Pink seaperch 1 <1 Vermilion rockfish 1 <1 White seaperch 1 <1 Unidentified seaperch 1 <1 TOTAL 12,773 178 Minimum number of species 29 Total rockfish YOY 8,618 125 Total rockfishes 12,192 173 Rockfish YOY comprised 67.5% of all fishes surveyed. All rockfishes comprised 95.5% of all fishes surveyed.
PLATFORM MIDWATERS, cont.
PLATFORM GAIL (Surveyed 1996–2001) PLATFORM EDITH (Surveyed 1998)Species Number Density Species Number DensityUnidentified rockfish YOY 2,371 24 Blacksmith 1,241 265Blacksmith 241 2 Halfmoon 59 13Flag rockfish YOY 102 1 Opaleye 37 8Widow rockfish YOY 93 <1 Sheephead 23 5Painted greenling 46 <1 Garibaldi 20 4Bocaccio YOY 28 <1 Sharpnose seaperch 8 1Unidentified fish 23 <1 Kelp bass 5 1Pinkrose rockfish 12 <1 Painted greenling 4 1Widow rockfish 8 <1 Squarespot rockfish 7 <1 TOTAL 1,397 298Whitespeckled rockfish 6 <1 Minimum number of species 8 Bank rockfish 4 <1 No rockfishes observed.Unidentified rockfish 4 <1 Greenblotched rockfish 3 <1 Blue rockfish 2 <1 Cabezon 2 <1 Greenspotted rockfish 2 <1 Olive rockfish 2 <1 Bocaccio 1 <1 Chilipepper 1 <1 Kelp greenling 1 <1 Pacific hake 1 <1 Sebastomus sp. 1 <1 Swordspine rockfish 1 <1 TOTAL 2,962 26 Minimum number of species 19 Total rockfish YOY 2,593 25 Total rockfishes 2,648 25 Rockfish YOY comprised 87.5% of all fishes surveyed. All rockfishes comprised 89.4% of all fishes surveyed.

A-20
APPENDIIX 3
A-21
APPENDIIX 3
PLATFORM BOTTOMS
PLATFORM IRENE (Surveyed 1996–2001) PLATFORM HIDALGO (Surveyed 1996–2001)Species Number Density Species Number DensityHalfbanded rockfish 5,393 217 Halfbanded rockfish 9,664 305Unidentified rockfish YOY 1,411 57 Greenspotted rockfish 587 19Copper rockfish 1,187 47 Unidentified rockfish YOY 307 10Vermilion rockfish 799 40 Flag rockfish 256 8Lingcod 468 19 Lingcod 97 3Calico rockfish 381 15 Greenblotched rockfish 69 2Widow rockfish YOY 335 13 Widow rockfish 69 2Pile perch 115 5 Greenstriped rockfish 60 2Painted greenling 105 4 Bocaccio 56 2Pacific sanddab 96 4 Painted greenling 47 1Brown rockfish 78 3 Vermilion rockfish 43 1Yellowtail rockfish 30 1 Canary rockfish 39 1Canary rockfish 28 1 Rosy rockfish 36 1Blue rockfish 25 1 Widow rockfish YOY 34 1Rosy rockfish 21 <1 Squarespot rockfish 28 <1Kelp greenling 20 <1 Sebastomus sp. 26 <1Rubberlip seaperch 19 <1 Sharpchin rockfish 15 <1Bocaccio YOY 17 <1 Pygmy rockfish 12 <1Sebastomus sp. 12 <1 Yelloweye rockfish 12 <1Olive rockfish 8 <1 Swordspine rockfish 10 <1Unidentified seaperch 5 <1 Cowcod 8 <1Gopher rockfish 5 <1 Unidentified rockfish 8 <1Sharpnose seaperch 4 <1 Starry rockfish 6 <1Squarespot rockfish 4 <1 Unidentified combfish 6 <1Widow rockfish 4 <1 Kelp greenling 5 <1Unidentified fish 4 <1 Bocaccio YOY 4 <1Greenspotted rockfish 3 <1 Shortspine combfish 2 <1Unidentified rockfish 3 <1 Bank rockfish 1 <1Bocaccio 2 <1 Stripetail rockfish 1 <1Flag rockfish 2 <1 Unidentified poacher 1 <1Kelp rockfish 2 <1 Honeycomb rockfish 1 <1 TOTAL 11,509 358Yelloweye rockfish 1 <1 Minimum number of species 24 Unidentified ronquil 1 <1 Total rockfish YOY 345 11Unidentified sanddab 1 <1 Total rockfishes 11, 351 354Unidentified flatfish 1 <1 Rockfish YOY comprised 3.0% of all fishes surveyed. All rockfishes comprised 98.6% of all fishes surveyed.TOTAL 10,591 427 Minimum number of species 29 Total rockfish YOY 1,766 70 Total rockfishes 9,748 395 Rockfish YOY comprised 16.7% of all fishes surveyed. All rockfishes comprised 92% of all fishes surveyed.
PLATFORM BOTTOMS, cont.
PLATFORM HARVEST (Surveyed 1997–2000) PLATFORM HERMOSA (Surveyed 1996–2000)Species Number Density Species Number DensityStripetail rockfish 250 10 Halfbanded rockfish 6,718 262Greenstriped rockfish 207 8 Greenspotted rockfish 321 13Greenspotted rockfish 78 3 Flag rockfish 42 2Greenblotched rockfish 67 3 Sebastomus sp. 26 1Sharpchin rockfish 44 2 Lingcod 24 1Lingcod 35 1 Unidentified rockfish YOY 9 <1Sebastomus sp. 24 <1 Pinkrose rockfish 7 <1Flag rockfish 17 <1 Shortspine combfish 7 <1Unidentified rockfish 12 <1 Cowcod 6 <1Unidentified combfish 10 <1 Greenstriped rockfish 6 <1Unidentified rockfish YOY 6 <1 Greenblotched rockfish 5 <1Chilipepper 5 <1 Shortbelly rockfish 4 <1Halfbanded rockfish 4 <1 Unidentified rockfish YOY 4 <1Shortspine combfish 4 <1 Pacific hake 2 <1Unidentified flatfish 3 <1 Ratfish 2 <1Cowcod 2 <1 Swordspine rockfish 2 <1Pinkrose rockfish 2 <1 Unidentified rockfish 2 <1Unidentified poacher 2 <1 Bocaccio YOY 1 <1Bank rockfish 1 <1 Canary rockfish 1 <1Bocaccio 1 <1 Darkblotched rockfish 1 <1Swordspine rockfish 1 <1 Pink seaperch 1 <1 Sharpchin rockfish 1 <1TOTAL 775 27 Starry rockfish 1 <1Minimum number of species 17 Whitespeckled rockfish 1 <1Total rockfish YOY 6 <1 Widow rockfish 1 <1Total rockfishes 721 26 Unidentified combfish 1 <1Rockfish YOY comprised <1% of all fishes surveyed. Unidentified fish 1 <1All rockfishes comprised 93.0% of all fishes surveyed. Unidentified flatfish 1 <1 Unidentified poacher 1 <1 TOTAL 7,195 279 Minimum number of species 23 Total rockfish YOY 14 <1 Total rockfishes 7,159 278 Rockfish YOY comprised <1% of all fishes surveyed. All rockfishes comprised 99.5% of all fishes surveyed.

A-22
APPENDIIX 3
A-23
APPENDIIX 3
PLATFORM BOTTOMS, cont.
PLATFORM HOLLY (Surveyed 1996–1999, 2001) PLATFORM GRACE (Surveyed 1996, 1997, 1999–2001)Species Number Density Species Number DensityWidow rockfish YOY 1,028 49 Halfbanded rockfish 11,078 408Calico rockfish 726 35 Widow rockfish 413 15Vermilion rockfish 444 21 Squarespot rockfish 220 8Sharpnose seaperch 407 19 Vermilion rockfish 205 8Halfbanded rockfish 405 19 Bocaccio YOY 203 7Copper rockfish 285 13 Bocaccio 183 7Squarespot rockfish 221 10 Shiner perch 130 5Blackeye goby 67 3 Flag rockfish 103 4Unidentified seaperch 66 3 Unidentified sanddab 79 3Unidentified rockfish YOY 54 3 Greenspotted rockfish 66 2Pink seaperch 53 3 Lingcod 41 2Painted greenling 51 2 Painted greenling 29 1Rosy rockfish 43 2 Unidentified rockfish YOY 28 1Brown rockfish 38 2 Chilipepper 26 <1Pile perch 37 2 Sebastomus sp. 24 <1Lingcod 36 2 Rosy rockfish 21 <1Widow rockfish 29 1 Pink seaperch 19 <1Flag rockfish 24 1 Unidentified flatfish 12 <1Sebastomus sp. 24 1 Blue rockfish 9 <1Unidentified flatfish 20 <1 Kelp greenling 9 <1Honeycomb rockfish 19 <1 Copper rockfish 8 <1Canary rockfish 18 <1 Unidentified rockfish 8 <1Unidentified rockfish 13 <1 Canary rockfish 7 <1Blue rockfish 12 <1 Unidentified fish 6 <1Unidentified ronquil 10 <1 Treefish 5 <1Rubberlip seaperch 9 <1 Greenblotched rockfish 4 <1Treefish 9 <1 Unidentified combfish 4 <1Kelp rockfish 8 <1 Whitespeckled rockfish 3 <1Olive rockfish 8 <1 Widow rockfish 3 <1Gopher rockfish 7 <1 Shortspine combfish 3 <1Kelp greenling 5 <1 Yellowtail rockfish 2 <1Unidentified fish 4 <1 Pink rockfish 1 <1California scorpionfish 3 <1 Rathbunella sp. 1 <1Bocaccio YOY 2 <1 Yelloweye rockfish 1 <1Rathbunella sp. 2 <1 Unidentified sculpin 1 <1Yellowtail rockfish 2 <1 Unidentified combfish 2 <1 TOTAL 12,955 471Cowcod 1 <1 Minimum number of species 28 Greenspotted rockfish 1 <1 Total rockfish YOY 231 8Shortspine combfish 1 <1 Total rockfishes 12,621 460Shortspine thornyhead 1 <1 Rockfish YOY comprised 1.8% of all fishes surveyed. All rockfishes comprised 97.4% of all fishes surveyed.TOTAL 4,195 191 Minimum number of species 33 Total rockfish YOY 1,084 52 Total rockfishes 3,421 157 Rockfish YOY comprised 25.8% of all fishes surveyed. All rockfishes comprised 81.5% of all fishes surveyed.
PLATFORM BOTTOMS, cont.
PLATFORM GAIL (Surveyed 1996, 1997, 1999–2001) PLATFORM EDITH (Surveyed 1998)Species Number Density Species Number DensityGreenblotched rockfish 369 12 California scorpionfish 274 63Bocaccio 328 11 Sharpnose seaperch 71 16Greenspotted rockfish 278 9 Blacksmith 35 8Stripetail rockfish 200 7 Blackeye goby 22 5Pinkrose rockfish 168 6 Treefish 9 2Sebastomus sp. 63 2 Unidentified seaperch 8 2Greenstriped rockfish 61 2 Painted greenling 6 1Cowcod 34 1 Unidentified rockfish YOY 5 1Mexican rockfish 22 <1 Pile perch 3 <1Lingcod 17 <1 Cabezon 3 <1Unidentified rockfish 14 <1 Unidentified fish 3 <1Flag rockfish 11 <1 Honeycomb rockfish 2 <1Chilipepper 7 <1 Squarespot rockfish 1 <1Unidentified rockfish YOY 5 <1 Sebastomus sp. 1 <1Unidentified poachers 4 <1 California sheephead 1 <1Swordspine rockfish 3 <1 Unidentified rockfish 1 <1Dover sole 2 <1 Unidentified fish 2 <1 TOTAL 445 98Unidentified flatfish 2 <1 Minimum number of species 12 Bank rockfish 1 <1 Total rockfish YOY 5 <1Bocaccio YOY 1 <1 Total rockfishes 19 Darkblotched rockfish 1 <1 Rockfish YOY comprised 1.1% of all fishes surveyed.Northern anchovy 1 <1 All rockfishes comprised 1% of all fishes surveyed.Painted greenling 1 <1 Pink rockfish 1 <1 Redbanded rockfish 1 <1 Sharpchin rockfish 1 <1 Widow rockfish 1 <1 Unidentified combfish 1 <1 TOTAL 1,600 50 Minimum number of species 23 Total rockfish YOY 5 <1 Total rockfishes 1,570 50 Rockfish YOY comprised <1% of all fishes surveyed. All rockfishes comprised 98.2% of all fishes surveyed.

A-24
APPENDIIX 3
A-25
APPENDIIX 3
PLATFORM SHELL MOUNDS
PLATFORM IRENE (SURVEYED 1996–2001) PLATFORM HIDALGO (SURVEYED 1996–2001)Species Number Density Species Number DensityHalfbanded rockfish 965 45 Halfbanded rockfish 3,496 124Lingcod 404 19 Lingcod 127 4Copper rockfish 215 10 Painted greenling 35 1Pacific sanddab 92 4 Greenspotted rockfish 28 <1Vermilion rockfish 76 4 Greenstriped rockfish 24 <1Painted greenling 72 3 Unidentified rockfish YOY 21 <1Calico rockfish 32 2 Rosy rockfish 20 <1Pile perch 18 <1 Pacific sanddab 17 <1Rosy rockfish 9 <1 Swordspine rockfish 17 <1Kelp greenling 8 <1 Unidentified combfish 8 <1Unidentified rockfish YOY 8 <1 Unidentified sanddab 7 <1Olive rockfish 5 <1 Cowcod 4 <1Unidentified fish 5 <1 Flag rockfish 4 <1Canary rockfish 3 <1 Pink seaperch 4 <1Unidentified flatfish 3 <1 Shortspine combfish 4 <1Unidentified sanddab 3 <1 Unidentified poacher 4 <1Bocaccio YOY 2 <1 Canary rockfish 2 <1Brown rockfish 2 <1 Unidentified fish 2 <1Sebastomus sp. 2 <1 Bank rockfish 1 <1Widow rockfish 2 <1 Longspine combfish 1 <1Wolf-eel 2 <1 Pygmy rockfish 1 <1Yellowtail rockfish 2 <1 Ratfish 1 <1Unidentified ronquil 2 <1 Rathbunella sp. 1 <1Flag rockfish 1 <1 Sebastomus sp. 1 <1Pink seaperch 1 <1 Sharpchin rockfish 1 <1Unidentified rockfish 1 <1 Starry rockfish 1 <1Unidentified sculpin 1 <1 Vermilion rockfish 1 <1 Unidentified rockfish 1 <1TOTAL 1,936 87 Unidentified ronquil 1 <1Minimum number of species 23 Total rockfish YOY 8 <1 TOTAL 3,835 129Total rockfishes 1,341 61 Minimum number of species 22 Rockfish YOY comprised <1% of all fishes surveyed. Total rockfish YOY 21 <1All rockfishes comprised 69.3% of all fishes surveyed. Total rockfishes 3,623 124 Rockfish YOY comprised <1% of all fishes surveyed. All rockfishes comprised 94.5% of all fishes surveyed.
PLATFORM SHELL MOUNDS, cont.
PLATFORM HARVEST (Surveyed 1997–2000) PLATFORM HERMOSA (Surveyed 1997–2000)Species Number Density Species Number DensityStripetail rockfish 373 14 Halfbanded rockfish 3,572 188Greenstriped rockfish 136 5 Shortbelly rockfish 114 6Sharpchin rockfish 91 3 Stripetail rockfish 64 3Greenspotted rockfish 41 2 Shortspine combfish 38 2Unidentified poacher 18 <1 Greenspotted rockfish 27 1Sebastomus sp. 17 <1 Greenstriped rockfish 14 <1Lingcod 16 <1 Unidentified sanddab 11 <1Greenblotched rockfish 9 <1 Lingcod 9 <1Unidentified rockfish 8 <1 Unidentified combfish 9 <1Unidentified flatfish 7 <1 Flag rockfish 6 <1Shortspine combfish 7 <1 Sebastomus sp. 6 <1Unidentified combfish 6 <1 Cowcod 4 <1Pinkrose rockfish 5 <1 Unidentified poacher 3 <1Unidentified rockfish YOY 5 <1 Greenblotched rockfish 3 <1Halfbanded rockfish 4 <1 Unidentified fish 3 <1Unidentified fish 3 <1 Longspine combfish 2 <1Chilipepper 2 <1 Pink seaperch 2 <1Bank rockfish 1 <1 Rosy rockfish 2 <1Cowcod 1 <1 Unidentified rockfish YOY 2 <1Flag rockfish 1 <1 Blackeye goby 1 <1Pacific hake 1 <1 Ratfish 1 <1Ratfish 1 <1 Widow rockfish 1 <1Rathbunella sp. 1 <1 Unidentified rockfish 1 <1Swordspine rockfish 1 <1 Unidentified sanddab 1 <1 TOTAL 3,895 200 Minimum number of species 17 TOTAL 756 24 Total rockfish YOY 2 <1Minimum number of species 18 Total rockfishes 3,814 Total rockfish YOY 5 <1 Rockfish YOY comprised <1% of all fishes surveyed.Total rockfishes 695 24 All rockfishes comprised 97.9% of all fishes surveyed.Rockfish YOY comprised <1% of all fishes surveyed. All rockfishes comprised 91.9% of all fishes surveyed.

A-26
APPENDIIX 3
A-27
APPENDIIX 3
PLATFORM SHELL MOUNDS, cont.
PLATFORM HOLLY (Surveyed 1997, 1998, 2001) PLATFORM C (Surveyed 2000)Species Number Density Species Number DensityPacific sardine 200 25 Vermilion rockfish 153 74Calico rockfish 129 16 Halfbanded rockfish 59 29Vermilion rockfish 64 8 Calico rockfish 33 16Copper rockfish 44 5 Olive rockfish 19 9Halfbanded rockfish 35 4 Blackeye goby 16 8Blackeye goby 31 4 Copper rockfish 15 7Squarespot rockfish 21 3 Painted greenling 10 5Pink seaperch 18 2 Kelp rockfish 9 4Lingcod 14 2 Lingcod 8 4Honeycomb rockfish 13 2 Brown rockfish 1 <1Painted greenling 13 2 Canary rockfish 1 <1Flag rockfish 11 1 Widow rockfish 1 <1Rosy rockfish 9 1 Yellowtail rockfish 1 <1Canary rockfish 8 <1 Brown rockfish 6 <1 TOTAL 326 156Kelp greenling 6 <1 Minimum number of species 13 Pile perch 6 <1 Total rockfishes 292 139Unidentified fish 6 <1 All rockfishes comprised 89.5% of all fishes surveyed.Rathbunella sp. 5 <1 Sebastomus sp. 5 <1 Unidentified flatfish 4 <1 Unidentified ronquil 4 <1 Olive rockfish 3 <1 Pacific hake 3 <1 Unidentified combfish 3 <1 Unidentified rockfish 2 <1 California halibut 1 <1 California scorpionfish 1 <1 Sharpnose seaperch 1 <1 Treefish 1 <1 Widow rockfish 1 <1 Sebastomus sp. 1 <1 Unidentified seaperch 1 <1 Unidentified rockfish YOY 1 <1 TOTAL 670 75 Minimum number of species 26 Total rockfish YOY 1 <1 Total rockfishes 354 40 Including the one-time observation of Pacific sardine, YOY rockfishes comprised <1%, and all rockfishes comprised 52.8% of all fishes surveyed. Excluding sardines, YOY rockfishes comprised <1%, and all rockfish comprised 75.3% of all fishes.
PLATFORM SHELL MOUNDS, cont.
PLATFORM GRACE (Surveyed 1997–2001) PLATFORM GAIL (Surveyed 1997, 1999–2001)Species Number Density Species Number DensityHalfbanded rockfish 4,154 144 Pacific hake 470 15Shiner perch 1,031 36 Stripetail rockfish 242 8Pink seaperch 171 6 Northern anchovy 158 5Unidentified sanddab 148 5 Pinkrose rockfish 112 4Bocaccio YOY 91 3 Greenblotched rockfish 65 2Lingcod 88 3 Greenstriped rockfish 60 2Unidentified rockfish YOY 80 3 Unidentified poacher 46 2Greenspotted rockfish 38 1 Unidentified combfish 29 <1Flag rockfish 35 1 Swordspine rockfish 25 <1Vermilion rockfish 34 1 Shortbelly rockfish 23 <1Shortspine combfish 27 <1 Sharpchin rockfish 18 <1Unidentified combfish 26 <1 Darkblotched rockfish 12 <1Hornyhead turbot 15 <1 Dover sole 11 <1Painted greenling 10 <1 Unidentified fish 11 <1Blue rockfish 8 <1 Sebastomus sp. 9 <1Sebastomus sp. 5 <1 Unidentified rockfish 9 <1Bocaccio 4 <1 Pacific sanddab 8 <1Canary rockfish 4 <1 Unidentified rockfish YOY 8 <1Swordspine rockfish 4 <1 Unidentified sculpin 8 <1California scorpionfish 2 <1 Greenspotted rockfish 8 <1Copper rockfish 2 <1 Jack mackerel 7 <1Kelp greenling 2 <1 Blackgill rockfish 5 <1Rathbunella sp. 2 <1 Chilipepper 4 <1Rosy rockfish 2 <1 Unidentified flatfish 4 <1Unidentified flatfish 2 <1 Cowcod 3 <1Greenstriped rockfish 1 <1 Flag rockfish 3 <1Hornyhead turbot 1 <1 Mexican rockfish 3 <1Squarespot rockfish 1 <1 Pacific electric ray 2 <1Treefish 1 <1 Unidentified ronquil 2 <1Unidentified fish 1 <1 Bocaccio 1 <1Unidentified rockfish 1 <1 California smoothtongue 1 <1Unidentified seaperch 1 <1 California tonguefish 1 <1 Halfbanded rockfish 1 <1TOTAL 5,992 203 Redbanded rockfish 1 <1Minimum number of species 25 Rex sole 1 <1Total rockfish YOY 171 6 Total rockfishes 4,464 153 TOTAL 1,371 38Rockfish YOY comprised <1% of all fishes surveyed. Minimum number of species 30 All rockfishes comprised 74.5% of all fishes surveyed. Total rockfish YOY 8 <1 Total rockfishes 603 16 Rockfish YOY comprised <1% of all fishes surveyed. All rockfishes comprised 44.0% of all fishes surveyed.

A-28
APPENDIIX 3
A-29
PLATFORM SHELL MOUNDS, cont.
PLATFORM EDITH (Surveyed 1998) Species Number DensityCalifornia scorpionfish 280 67Blackeye goby 81 19Unidentified fish 3 <1Unidentified rockfish YOY 3 <1Unidentified seaperch 3 <1Calico rockfish 2 <1Sharpnose seaperch 2 <1Painted greenling 1 <1Pile seaperch 1 <1Unidentified flatfish 1 <1TOTAL 377 0.86Minimum number of species 8 Total rockfish YOY 3 <1Total rockfishes 5 <1Rockfish YOY comprised <1% of all fishes surveyed.All rockfishes comprised <1% of all fishes surveyed.
APPENDIX 4Densities, at the top 20 sites, of some of the most abundant species in our deepwater surveys. Platforms are listed in
blue, natural outcrops in red.
Species Site Year Habitat Type Density(Fish per 100 m2)Lingcod (adult) Hidalgo 1996 Bottom 3.2 Irene 1997 Bottom 1.7 Irene 1997 Shell Mound 1.5 Hermosa 1996 Bottom 1.0 Footprint 2001 Natural 1.0 Hermosa 1997 Bottom 0.9 Reef “A” 1997 Natural 0.8 Reef “A” 1998 Natural 0.7 Hermosa 1999 Bottom 0.7 Gail 2001 Bottom 0.7 Santa Monica Bay 2001 Natural 0.7 Santa Cruz I. 2000 Natural 0.6 Santa Monica Bay 2001 Natural 0.5 Hermosa 2000 Bottom 0.5 Gail 1996 Bottom 0.5 Gail 1997 Bottom 0.5 Gail 1999 Bottom 0.5 GAIL 2000 Bottom 0.5 Irene 1998 Bottom 0.5 Irene 2000 Bottom 0.5 Irene 2001 Bottom 0.5Lingcod (juvenile) Irene 1996 Bottom 18.8 Holly 1999 Bottom 6.1 Grace 2000 Shell Mound 5.4 Grace 2001 Platform pipe 4.6 14 Mile Bank 2001 Natural 4.5 Grace 2000 Bottom 3.8 Hidalgo 1999 Shell mound 3.6 Platform “C” 2000 Shell mound 3.4 Grace 2001 Shell mound 3.2 Irene 2001 Bottom 2.7 Hidalgo 1997 Bottom 2.7 Grace 1999 Shell Mound 2.3 Harvest 2000 Bottom 2.2 Grace 2001 Bottom 2.2 Irene 1999 Bottom 2.2 Hidalgo 2000 Bottom 2.1 Harvest 1999 Bottom 1.9 More Mesa 1995 Natural 1.9 Irene 1997 Shell Mound 1.9 12 Mile Reef 2000 Natural 1.8Lingcod YOY Irene 1998 Shell Mound 31.5 Irene 2001 Shell Mound 29.2 Irene 2001 Bottom 24.1 Irene 1998 Bottom 19.6 Irene 1996 Bottom 17.9 Irene 2000 Shell Mound 12.0 Irene 1997 Shell Mound 10.9 Irene 2000 Bottom 10.6
An invertebrate tossed salad at the bottom of Platform Grace.
DO
NN
A S
CH
RO
EDER

A-30
APPENDIIX 4
A-31
APPENDIIX 4
Species Site Year Habitat Type Density(Fish per 100 m2)Lingcod YOY (cont.) Irene 1999 Shell Mound 9.7 Irene 1999 Bottom 7.5 Hidalgo 1999 Shell Mound 4.6 Hidalgo 2000 Shell Mound 4.3 Hidalgo 2000 Bottom 3.0 Irene 1997 Bottom 2.9 Hidalgo 2001 Shell Mound 2.6 Hidalgo 1998 Shell Mound 1.9 Hidalgo 1997 Shell Mound 1.8 Grace 1999 Shell Mound 1.2 Hidalgo 1998 Bottom 1.1 Hidalgo 1999 Bottom 1.1Painted greenling Holly 1998 Midwater 18.0 Harvest 1999 Midwater 9.9 Harvest 1997 Midwater 9.9 Holly 2001 Midwater 8.2 Hermosa 1997 Midwater 8.1 Irene 1997 Bottom 8.0 Hermosa 1998 Midwater 6.9 Hermosa 1999 Midwater 5.5 Houchin 2000 Midwater 5.3 Irene 1997 Shell Mound 5.3 Irene 2000 Shell Mound 5.1 Irene 1996 Bottom 4.8 Harvest 1999 Midwater 4.7 Holly 1998 Shell Mound 4.6 Irene 2000 Bottom 4.6 Irene 2000 Midwater 4.5 Platform “C” 2000 Shell Mound 4.4 Hermosa 2000 Midwater 4.4 Irene 2001 Bottom 4.4 Hidalgo 2000 Midwater 4.2Greenspotted rockfish Hermosa 1996 Bottom 30.3 Hidalgo 2000 Bottom 21.8 Gail 1996 Bottom 21.3 Hidalgo 1996 Bottom 20.6 Hidalgo 1999 Bottom 19.9 Hidalgo 1998 Bottom 19.1 Hidalgo 1997 Bottom 17.6 Hidalgo 2001 Bottom 12.1 Gail 1997 Bottom 10.8 Hermosa 1997 Bottom 10.6 North Reef 1997 Natural 9.8 Gail 2000 Bottom 9.3 Hermosa 1998 Bottom 9.1 Hermosa 2000 Bottom 5.8 Reef “A” 1997 Natural 5.0 North Reef 1998 Natural 5.0 Reef “C” 1999 Natural 4.9
Species Site Year Habitat Type Density(Fish per 100 m2)Greenspotted rockfish Reef “A” 2000 Natural 4.8(cont.) Hermosa 1999 Bottom 4.3 Grace 1996 Bottom 4.0Copper rockfish Irene 2000 Bottom 88.5 Irene 1996 Bottom 71.6 Irene 1997 Bottom 53.6 Irene 2001 Bottom 40.8 Irene 2000 Shell Mound 27.1 Holly 1997 Bottom 21.8 Holly 1999 Bottom 21.5 Irene 1999 Bottom 21.5 Holly 1998 Shell Mound 12.0 Holly 1996 Bottom 11.4 Irene 2001 Shell Mound 10.4 Irene 1998 Bottom 10.4 Holly 1997 Shell Mound 9.3 Holly 2001 Bottom 8.4 Platform “C” 2000 Shell Mound 7.3 Irene 1997 Shell Mound 5.2 Irene 1999 Shell Mound 4.5 Holly 1998 Bottom 4.4 Irene 2001 Midwater 3.9 Irene 2000 Midwater 3.7Swordspine rockfish 14 Mile Bank 1996 Natural 94.4 14 Mile Bank 1996 Natural 47.4 14 Mile Bank 2001 Natural 45.8 Footprint 2000 Natural 41.0 Footprint 2000 Natural 39.6 Footprint 1999 Natural 29.7 Osborn Bank 2000 Natural 27.5 Footprint 2001 Natural 24.9 Catalina I. 1996 Natural 22.4 Santa Monica Bay 2001 Natural 21.9 Tanner Bank 1997 Natural 20.1 Footprint 2000 Natural 20.1 Santa Barbara I. 2000 Natural 18.3 Footprint 2001 Natural 15.3 Footprint 2000 Natural 14.2 Cortes Bank 1997 Natural 12.8 Santa Monica Bay 1998 Natural 10.6 Footprint 2001 Natural 9.9 Footprint 2000 Natural 8.3 Footprint 1999 Natural 8.2Greenstriped rockfish Harvest 2000 Bottom 14.7 Harvest 1999 Bottom 9.2 Gail 2000 Bottom 7.5 Harvest 1997 Shell Mound 7.1 Harvest 1997 Shell Mound 6.1 Harvest 2000 Shell Mound 5.9

A-32
APPENDIIX 4
A-33
APPENDIIX 4
Species Site Year Habitat Type Density(Fish per 100 m2)Greenstriped rockfish Harvest 1998 Bottom 5.2(cont.) Harvest 1999 Shell Mound 4.3 Harvest 1997 Bottom 3.6 Harvest 1998 Shell Mound 3.5 Hidalgo 1998 Bottom 3.4 Hidalgo 2000 Bottom 3.4 Reef “A” 2000 Natural 3.3 Gail 1997 Shell Mound 2.6 Reef “A” 1997 Natural 2.5 Gail 1999 Shell Mound 2.4 Hidalgo 2001 Bottom 2.3 Gail 2000 Shell Mound 2.2 Santa Rosa Passage 1995 Natural 2.2 Hidalgo 1998 Shell Mound 2.1Widow rockfish (YOY) Irene 1998 Midwater 344.0 Irene 1996 Midwater 253.3 Holly 1999 Bottom 252.9 Harvest 1999 Midwater 188.9 Grace 2000 Midwater 175.7 Irene 1997 Midwater 173.6 San Nicholas I. 1996 Natural 173.5 Catalina I. 1996 Natural 116.8 Irene 1998 Bottom 79.1 Grace 2001 Midwater 73.8 San Nicolas I. 1996 Natural 68.1 Grace 1997 Bottom 66.3 Cortes Bank 1997 Natural 66.0 Santa Cruz I. 2000 Natural 65.4 North Reef 1999 Natural 63.6 Hidalgo 1998 Midwater 52.9 Footprint 1995 Natural 45.9 Hermosa 2000 Midwater 44.4 Footprint 2001 Natural 40.3 Grace 1999 Midwater 39.6Squarespot rockfish Santa Cruz I. 2000 Natural 282.5 Santa Barbara I. 2000 Natural 263.0 Santa Monica Bay 1998 Natural 196.4 Harvest 1999 Midwater 180.0 Cortes Bank 1997 Natural 149.6 Grace 2001 Midwater 130.6 San Miguel I. 1995 Natural 122.1 Footprint 1998 Natural 94.6 San Nicolas I. 1996 Natural 93.9 Anacapa Passage 1999 Natural 88.8 Santa Monica Bay 1998 Natural 85.0 Hidden Reef 1999 Natural 72.6 San Nicolas I. 1996 Natural 69.7 Guano Bank 1995 Natural 69.6 Footprint 2000 Natural 61.8
Species Site Year Habitat Type Density(Fish per 100 m2)Squarespot rockfish Osborn Bank 2000 Natural 54.9(cont.) Osborn Bank 2000 Natural 51.9 Anacapa Passage 1995 Natural 50.5 Santa Monica Bay 2001 Natural 44.3 Santa Rosa I. 1995 Natural 43.4Vermilion rockfish Platform “C” 2000 Shell Mound 74.5 Holly 2001 Bottom 58.1 Irene 2000 Bottom 55.2 Irene 1996 Bottom 47.8 Irene 1997 Bottom 32.8 Grace 2001 Platform pipe 30.8 Irene 1999 Bottom 30.4 Anacapa Passage 1995 Natural 30.1 Grace 2001 Bottom 29.9 Holly 1999 Bottom 23.8 Holly 1996 Bottom 22.0 Irene 2001 Bottom 14.0 Irene 1998 Bottom 12.5 Holly 2001 Shell Mound 11.9 Irene 2000 Shell Mound 10.6 Grace 2001 Bottom 8.8 Holly 1998 Shell Mound 8.3 Irene 2001 Shell Mound 6.1 Santa Cruz I. 2000 Natural 5.2 Holly 1997 Bottom 4.5Bocaccio (adult) Gail 1997 Bottom 18.2 Gail 1999 Bottom 11.0 Gail 1996 Bottom 10.8 Gail 2000 Bottom 6.2 Gail 2001 Bottom 3.5 Hidalgo 2001 Bottom 3.0 Hidalgo 1996 Bottom 2.7 Reef “A” 1997 Natural 1.9 Reef “D” 1999 Natural 1.6 Hidalgo 1997 Bottom 1.3 Santa Rosa Passage 1995 Natural 1.2 Footprint 1995 Natural 1.1 Hidalgo 1998 Bottom 0.9 Footprint 2001 Natural 0.9 Footprint 2001 Natural 0.9 Footprint 2000 Natural 0.8 Footprint 2000 Natural 0.7 Catalina I. 1996 Natural 0.6 Footprint 1999 Natural 0.6 San Nicolas I. 1996 Natural 0.6Bocaccio (juvenile) Grace 2000 Bottom 39.6 Grace 2000 Midwater 13.0 Santa Cruz I. 2000 Natural 5.6 14 Mile Bank 2001 Natural 5.1

A-34
APPENDIIX 4
A-35
APPENDIIX 4
Species Site Year Habitat Type Density(Fish per 100 m2)Bocaccio (juvenile) Santa Barbara I. 2000 Natural 2.5(cont.) Santa Monica Bay 2001 Natural 2.4 Gail 2001 Bottom 2.3 Osborn Bank 2000 Natural 2.3 12 Mile Reef 2000 Natural 2.0 Gail 2000 Bottom 1.8 Footprint 2000 Natural 1.2 Grace 2001 Platform pipe 0.9 Reef“A” 1997 Natural 0.9 Footprint 2000 Natural 0.8 Hidalgo 2000 Bottom 0.8 Gail 1997 Bottom 0.7 Footprint 2000 Natural 0.6 Grace 2000 Shell Mound 0.6 Hidalgo 1996 Bottom 0.6 Hidalgo 2001 Bottom 0.6Bocaccio (YOY) Irene 1999 Midwater 166.4 Irene 1996 Midwater 91.8 Grace 1999 Bottom 44.9 Grace 1999 Midwater 24.1 Irene 1997 Midwater 17.2 Grace 1999 Shell Mound 15.9 Hidalgo 1996 Midwater 5.6 Harvest 1999 Midwater 4.0 Grace 2001 Midwater 3.0 Hidden Reef 1999 Natural 2.3 Irene 1999 Bottom 2.2 Grace 2001 Midwater 1.5 Harvest 1999 Midwater 1.3 Santa Barbara I. 1996 Natural 1.3 Irene 1997 Bottom 1.2 Harvest 1997 Midwater 1.1 Grace 2000 Midwater 1.0 Hidalgo 1997 Midwater 0.9 Santa Monica Bay 2001 Natural 0.9 Hidalgo 2000 Bottom 0.8Canary rockfish Irene 2001 Bottom 5.5 Holly 2001 Bottom 3.4 Hidalgo 1999 Bottom 1.9 Holly 2001 Shell Mound 1.7 Hidalgo 1998 Bottom 1.7 North Reef 1999 Natural 1.7 Reef “D” 1999 Natural 1.6 Hidalgo 1996 Bottom 1.3 Reef “A” 1999 Natural 1.2 Irene 1997 Bottom 1.2 Reef “B” 1997 Natural 1.1 Hidalgo 1997 Bottom 0.9 Hidalgo 2001 Bottom 0.9
Species Site Year Habitat Type Density(Fish per 100 m2) Grace 2000 Bottom 0.9 Holly 1996 Bottom 0.8 North Reef 2000 Natural 0.7 Reef “C” 1998 Natural 0.7 Irene 2001 Shell Mound 0.7 Reef “A” 1998 Natural 0.5 Grace 1998 Shell Mound 0.5Greenblotched rockfish Gail 1997 Bottom 17.7 Gail 1999 Bottom 13.7 Gail 2001 Bottom 11.3 Hidalgo 2001 Bottom 10.6 Gail 1996 Bottom 9.7 Gail 2000 Bottom 9.2 Gail 1997 Shell Mound 5.9 Harvest 1999 Bottom 4.6 Harvest 1998 Bottom 3.8 Gail 1999 Shell Mound 3.3 Harvest 1997 Bottom 1.6 San Miguel I. 1995 Natural 1.4 Hidalgo 1999 Bottom 1.3 North Reef 1997 Natural 1.0 Footprint 2001 Natural 1.0 Reef “A” 1999 Natural 0.9 Reef “B” 1997 Natural 0.8 Hidalgo 2000 Bottom 0.8 North Reef 2001 Natural 0.7 Gail 2001 Shell Mound 0.7Flag rockfish Hidalgo 1997 Bottom 15.5 Hidalgo 1996 Bottom 11.0 Hidalgo 1999 Bottom 7.2 Grace 1996 Bottom 6.6 Grace 2001 Bottom 5.7 Hidalgo 1998 Bottom 5.5 Hidalgo 2000 Bottom 5.1 Grace 2000 Bottom 4.4 Hidalgo 2001 Bottom 3.8 Holly 2001 Bottom 3.1 Grace 2001 Bottom 3.1 Santa Barbara Point 1995 Natural 3.0 Hermosa 1996 Bottom 2.7 Grace 1999 Midwater 2.6 Gail 1999 Midwater 2.5 Hermosa 2000 Bottom 2.2 Grace 2001 Shell Mound 2.2 Santa Rosa Passage 1995 Natural 2.0 Holly 1998 Shell Mound 1.8 Holly 2001 Shell Mound 1.7

A-36
APPENDIIX 4
A-37
APPENDIIX 4
Species Site Year Habitat Type Density(Fish per 100 m2)Halfbanded rockfish Hidalgo 2000 Bottom 907.1 Grace 1997 Bottom 800.5 Anacapa I. 1999 Natural 703.1 Irene 1999 Bottom 621.2 Irene 1998 Bottom 595.9 Hidalgo 2000 Shell Mound 461.0 Grace 1999 Shell Mound 415.1 Hermosa 2000 Shell Mound 406.9 Grace 2000 Bottom 405.2 Hermosa 2000 Bottom 398.1 Grace 1996 Bottom 395.1 Hermosa 1997 Bottom 381.4 Grace 1999 Bottom 344.2 Hidalgo 2001 Bottom 318.4 Hermosa 1999 Bottom 313.2 E. End Anacapa I. 1995 Natural 284.9 Hidalgo 1999 Bottom 275.8 Grace 2001 Bottom 266.4 Grace 2001 Shell Mound 259.1 Grace 2001 Bottom 237.7Pygmy rockfish Hidden Reef 1999 Natural 263.7 San Nicolas I. 1996 Natural 236.9 Footprint 2001 Natural 125.7 Cortes Bank 1997 Natural 119.7 North Reef 2000 Natural 93.8 Santa Monica Bay 1998 Natural 93.7 San Miguel I. 1995 Natural 87.3 Santa Monica Bay 2001 Natural 84.1 Cortes Bank 1997 Natural 76.7 Footprint 2000 Natural 72.2 Santa Cruz I. 2000 Natural 71.9 Osborn Bank 2000 Natural 71.2 San Nicolas I. 1996 Natural 64.6 14 Mile Bank 2001 Natural 64.5 San Nicolas I. 1996 Natural 64.2 Santa Rosa I. 1995 Natural 60.6 Footprint 2000 Natural 54.6 Reef “D” 1999 Natural 47.0 Footprint 1999 Natural 42.3 Santa Monica Bay 2001 Natural 38.3Pink seaperch Santa Monica Bay 1998 Natural 304.5 Grace 1998 Shell Mound 39.2 Holly 1998 Shell Mound 11.1 Holly 1999 Bottom 9.1 Catalina I. 1996 Natural 4.0 Grace 1997 Shell Mound 2.9 Grace 1997 Bottom 2.7 Holly 1996 Bottom 1.8
Species Site Year Habitat Type Density(Fish per 100 m2)Pink seaperch Reef “D” 1999 Natural 1.7(cont. Santa Monica Bay 1997 Natural 1.3 Holly 1997 Bottom 1.3 Catalina I. 1996 Natural 1.2 Holly 1997 Shell Mound 1.2 Santa Monica Bay 1997 Natural 1.2 Santa Rosa I. 1995 Natural 1.2 Grace 2000 Bottom 1.1 Grace 2001 Platform pipe 1.0 Reef“A” 1997 Natural 0.9 Santa Cruz I. 1996 Natural 0.8 North Reef 1998 Natural 0.8Yellowtail rockfish Reef “B” 1995 Natural 3.9(adult) San Miguel I. 1995 Natural 3.5 North Reef 1996 Natural 2.8 North Reef 1995 Natural 2.1 Santa Rosa I. 1995 Natural 2.1 San Miguel I. 1995 Natural 1.9 San Miguel I. 1995 Natural 1.7 Reef “D” 1999 Natural 1.6 North Reef 2000 Natural 1.5 Reef “A” 2000 Natural 1.0 San Miguel I. 1995 Natural 0.7 Reef “A” 1998 Natural 0.7 Reef “B” 1997 Natural 0.5 North Reef 1999 Natural 0.5 Santa Rosa I. 1995 Natural 0.4 Reef “A” 1997 Natural 0.3 North Reef 1997 Natural 0.3 Santa Rosa I. 1995 Natural 0.2 North Reef 1998 Natural 0.2
Young-of-the-year rockfish in the platform midwater.
LOV
ELA
B U
C, S
AN
TA B
AR
BA
RA