contents page - hang seng bank...5 financial performance attributable profit rose by 8% to...
TRANSCRIPT


CONTENTS Page
Results in Brief 1
Chairman’s Statement * 2
Chief Executive’s Report * 4
Financial Review 7
Risk and Capital Management (unaudited) 17
- Risk Management
- Capital Management
Condensed Consolidated Financial Statements (unaudited) 32
- Condensed Consolidated Income Statement 32
- Condensed Consolidated Statement of Comprehensive Income 33
- Condensed Consolidated Balance Sheet 34
- Condensed Consolidated Statement of Changes in Equity 35
- Condensed Consolidated Cash Flow Statement 37
Notes on the Condensed Consolidated Financial Statements (unaudited) 39
Review Report 64
Additional Information 65
* Where possible, percentages in this section have been rounded to the nearest percentage
point to facilitate easy reading. Percentage-based indicators remain at 1 or 2 decimal places as
appropriate.
The abbreviations ‘HK$m’ and ‘HK$bn’ represent millions and billions of Hong Kong dollars
respectively.

RESULTS IN BRIEF
30 June 30 June
2019 2018
For the half-year ended
HK$m HK$m
Profit attributable to shareholders 13,656 12,647
Profit before tax 15,894 14,864
Operating profit 15,561 14,662
Operating profit excluding change in expected credit
losses and other credit impairment charges 16,071 14,900
Net operating income before change in expected credit losses
and other credit impairment charges 22,409 20,649
% %
Return on average ordinary shareholders' equity 17.0 17.4
Cost efficiency ratio 28.2 27.7
HK$ HK$
Earnings per share 6.98 6.62
Dividends per share 2.80 2.60
At 30 June At 31 December
2019 2018
At period-end
HK$m HK$m
Shareholders' equity 172,721 162,082
Total assets 1,656,652 1,571,297
% %
Capital ratios
- Common Equity Tier 1 ("CET1") Capital Ratio 16.4 16.6
- Tier 1 Capital Ratio 18.2 17.8
- Total Capital Ratio 20.4 20.2
Liquidity ratios
- Liquidity coverage ratio 224.5 214.7
- Net stable funding ratio 152.5 154.0
1

2
CHAIRMAN’S STATEMENT
In a challenging operating environment, Hang Seng maintained good business momentum in the first
half of 2019. We continued with transformative initiatives to enhance the customer experience. More
investments in technology, operational infrastructure and our people supported the launch of new in-
branch service models and the expanding functionality of our digital platforms, particularly our mobile
banking app.
We continue to move closer to our vision for a fully integrated multi-channel service that allows
customers to manage their banking in a way that best suits their lifestyle and needs. Our progress is
enabling us to better leverage our existing competitive strengths, take advantage of new business
opportunities and advance our market leadership for innovation in the banking industry, which is
undergoing rapid change.
The Bank’s solid first-half results affirm the soundness of our strategy.
Attributable profit increased by 8% to HK$13,656m. Earnings per share rose by 5% to HK$6.98 per
share. Compared with the second half of 2018, attributable profit and earnings per share were up 18%
and 19% respectively.
Return on average ordinary shareholders’ equity was 17.0%, compared with 17.4% and 14.9% for the
first and second halves of 2018. Return on average total assets was 1.7%, compared with 1.7% and
1.5% for the first and second halves of the previous year.
The Directors have declared a second interim dividend of HK$1.40 per share. This brings the total
distribution for the first half of 2019 to HK$2.80 per share, compared with HK$2.60 per share for the
same period in 2018.
Economic Outlook
Signs of a global slowdown have begun to emerge and the world’s major central banks have adopted
an increasingly dovish stance in the face of continuing uncertainties over international trade and other
geopolitical factors.
With its highly open economy, Hong Kong is susceptible to these developments. After reaching a
seven-year high of 4.6% in the first quarter of 2018, the city’s economic growth has since slowed to
just 0.6% in the first and second quarters this year. With unemployment continuing to hold steady at a
multi-year low, the tightness of the labour market will help to support the domestic economy, but
downshifts in retail sales and trade growth signal that the economic environment will remain
challenging. We forecast full-year GDP growth of between 1% and 1.5% for 2019, down from the 3%
recorded for 2018.
Mainland China’s economic expansion averaged 6.3% in the first half of the year, compared with 6.6%
for 2018. While trade and manufacturing activity have softened, reflecting the impact of developments
in the external environment, retail sales growth has been relatively stable. As the Mainland’s economy
shifts towards a greater reliance on services, private spending will continue to play an important role in
driving broader growth. At the same time, the government is likely to maintain its programme of
economic stimulus policies. We anticipate full-year GDP growth of between 6.2% and 6.4% for 2019,
compared with 6.6% for 2018.

3
In a fluid operating environment, we will continue to face new challenges. Our strategy for sustainable
growth is simple: we will deliver customer-centric service excellence through investment and
innovation to further leverage and amplify the competitive strengths that make us a market leader.
These strengths include our large customer base, extensive network of service touchpoints, Greater Bay
Area expertise and the trusted Hang Seng brand. By being innovative and steadfast in equal measure,
we will expand and deepen relationships with new and existing customers and create long-term value
for shareholders.
Raymond Ch’ien
Chairman
5 August 2019

4
CHIEF EXECUTIVE’S REPORT Hang Seng put in a robust performance in challenging operating conditions during the first six months
of 2019. Central to the story of our solid first-half results is a sharp focus on the customer experience,
our ability to respond quickly to the changing needs of our clients and the continuing investments we
are making in technology and our people.
We are rolling out new service concepts at our branches and making major changes to our workplace
environment that go beyond design and aesthetics. They are part of a broader and deeper transformation
in how we provide banking services. We are steadily moving towards an integrated and interactive
online-offline offering that enables customers to conduct banking through a wide choice of channels –
anytime, anywhere. Customers enjoy easier, faster and more convenient banking, while continuing to
benefit from the strong wealth management capabilities, security and excellent service that have long
been hallmarks of the Hang Seng brand.
Our initiatives to transform our business are delivering positive results. Year on year, we increased net
operating income before change in expected credit losses and other credit impairment charges by 9%
and profit before tax by 7%, despite the more favourable market environment that prevailed in the first
half of 2018. Compared with the second half of last year, which was weakened by the US-China trade
dispute, profit before tax was up by an even stronger 17%.
Technology is enabling us to serve customers better. It is also helping us to amplify the advantages of
our existing competitive strengths, capitalise more effectively on new business opportunities and
enhance our leading market position as our industry evolves.
Supported by improved data analytics, we leveraged our large customer base and deep understanding
of local businesses to acquire new deposits and prudently expand lending, resulting in an 11% increase
in net interest income on the back of good balance sheet growth.
Benefitting from our in-house investment expertise, time-to-market capability and agile business
infrastructure, we responded swiftly to shifts in customer focus, providing more fixed-income products
and tailored insurance solutions to maintain solid growth momentum in non-interest income as investors
grew more cautious.
We supported commercial clients by rolling out new and enhanced services that enable them to capture
more business opportunities in fast-moving market conditions and improve the efficiency of their
operations with faster transaction and processing times. For example, we extended One Collect – our
all-in-one digital payment collection solution – to online as well as offline merchants and introduced
greater support for FPS payments. We are proud that both One Collect and BERI, our AI chatbot for
commercial customers, have been recognised with service innovation awards.
The close connectivity of our Hong Kong and mainland China operations and our in-depth
understanding of local industry sectors underpin our attractive cross-border proposition, which delivers
seamless solutions for a wide array of cross-border banking needs. This competitive strength has us
well positioned to win more business on the Mainland, particularly in the economically dynamic Greater
Bay Area.
Our proposition is reflected in a strong first half for Hang Seng China, which achieved a 50% increase
in operating profit that was driven by balanced double-digit growth in both net interest income and non-
interest income. Compared with the second half of last year, operating profit was up 174%.
Our ongoing initiatives to put the customer experience at the centre of what we do will ensure our
business continues to thrive in a wide variety of market conditions. The strength of this strategy is
reflected in our key financials for the first half.

5
Financial Performance
Attributable profit rose by 8% to HK$13,656m and earnings per share were up 5% at HK$6.98 per
share. Profit before tax increased by 7% to HK$15,894m. Compared with the second half of 2018,
attributable profit and earnings per share rose by 18% and 19% respectively, and profit before tax grew
by 17%.
Operating profit increased by 6% to HK$15,561m. Operating profit excluding change in expected credit
losses and other credit impairment charges grew by 8% to HK$16,071m. Compared with the second
half of 2018, operating profit rose by 17% and operating profit excluding change in expected credit
losses was up 14%.
Net operating income increased by 7% to HK$21,899m. Compared with the second half of 2018, net
operating income rose by 11%.
Net interest income grew by 11% to HK$15,853m, due mainly to the 6% increase in average interest-
earning assets, improved deposit spreads and increased contribution from net-free funds. Compared
with the second half of 2018, net interest income was broadly unchanged. The net interest margin
increased by 11 basis points to 2.21% compared with a year earlier.
Non-interest income rose by 2% to HK$6,556m. Insurance income increased, reflecting successful
efforts to leverage our diverse range of products and improved investment returns from the life
insurance portfolio. Growing investor caution in response to financial markets volatility led to declines
in income from stockbroking and related services and retail investment fund sales. Overall, wealth
management income grew by 7%. Compared with the second half of 2018, non-interest income grew
by 38% and wealth management income was up 54%.
We continued to actively manage our lending portfolio to maintain a high level of overall asset quality.
Change in expected credit losses and other credit impairment charges was HK$510m, compared with
HK$238m and HK$758m for the first and second halves of 2018. The year-on-year increase in expected
credit losses reflects portfolio growth as well as increased provisions in light of the increasingly
complex economic outlook.
Operating expenses rose by 11% year on year to HK$6,328m, reflecting higher investments in people,
technology and services enhancement. Compared with the second half of 2018, operating expenses were
down 2%.
Our cost efficiency ratio was 28.2%, compared with 27.7% and 31.3% for the first and second halves
of last year.
At 30 June 2019, our common equity tier 1 capital ratio was 16.4% and our tier 1 capital ratio was
18.2%, compared with 16.6% and 17.8% respectively at 31 December 2018. Our total capital ratio was
20.4%, compared with 20.2% at the end of last year.
Transforming the Future of Banking for Customers
Turning to the outlook for the rest of the year, the operating environment will remain challenging. There
are growing signs of a slowdown in the global economy, with continuing uncertainty over international
trade policies and geopolitical developments. Financial market and interest rate volatility have the
potential to cause companies to reassess their business investment plans and affect consumer spending
activity.
At the same time, the banking and financial services industry is undergoing significant change. An
exciting future lies ahead with innovative new product and service propositions in the pipeline.
6
Technology is enabling us to integrate the best of online and offline banking to meet the varying needs
of our customers. We will continue to transform in this direction, drawing on our partnerships with
fintech innovators to strengthen our digital capabilities, create new business opportunities, benefit from
early exposure to new technological advances, and support our efforts to spearhead the development of
customer-centred banking services. For example, our collaboration with Hong Kong Science and
Technology Parks Corporation includes developing an experimental ‘branch of the future’ to explore
how banking could evolve as a way to drive innovation in our industry.
Service excellence for customers remains the keystone of our business. Our goal is to continue making
it easier for people to manage their day-to-day banking needs, plan for major life milestones and achieve
their long-term aspirations.
Backed by the expertise and experience of our employees and the reassurance of the Hang Seng brand,
we will focus on initiatives that give customers greater control and choice over when and where they
manage their financial needs, with customised services that are efficient, convenient and easy to use.
Underlining all of this, our professional and qualified team will provide the personal touch and in-depth
market expertise needed to build deep relationships with customers and deliver wealth management
propositions that are closely tailored to their priorities and objectives. To unlock the full potential of
our people, we are investing in their personal development as well as providing a more comfortable and
agile workplace to support them in performing at their best. We are delighted that Hong Kong’s working
population has recognised our efforts by naming Hang Seng the Most Attractive Employer in the
Banking and Financial sector this year.
I wish to thank my colleagues for their valuable contributions to our business in the first half of 2019,
and for demonstrating creativity, commitment and a willingness to embrace the change that will be key
to remaining competitive in the new era of banking. We will step up our efforts to ensure they continue
to thrive in a working environment where they feel valued, involved and inspired.
With our dynamic team and forward-thinking strategy, we will drive sustainable growth and bright
futures for the markets and people we serve to the sustained benefit of our customers, shareholders and
the wider community.
Louisa Cheang
Vice-Chairman and Chief Executive
5 August 2019

7
FINANCIAL REVIEW
FINANCIAL PERFORMANCE
Income Analysis
Summary of financial performance
Half-year ended Half-year ended
Figures in HK$m 30 June
2019
30 June
2018
Total operating income 33,800 29,595
Operating expenses 6,328 5,722
Operating profit 15,561 14,662
Profit before tax 15,894 14,864
Profit attributable to shareholders 13,656 12,647
Earnings per share (in HK$) 6.98 6.62
First half of 2019 compared with first half of 2018
Under challenging operating conditions, Hang Seng Bank Limited (‘the Bank’) and its subsidiaries (‘the
Group’) reported profit attributable to shareholders of HK$13,656m for first half of 2019, a rise of 8%
over the same period last year. Profit before tax was up 7% at HK$15,894m. Operating profit excluding
change in expected credit losses and other credit impairment charges increased by 8% to
HK$16,071m and operating profit rose by 6% to HK$15,561m, driven by higher net interest income and
stable growth in non-interest income. Wealth management business income increased by 7% when
compared with same period last year with the increase in insurance business-related income partly offset
by decreases in income from securities broking-related services and retail investment funds.
Net interest income increased by HK$1,625m, or 11%, to HK$15,853m, benefitting from the increase in
average interest-earning assets and improvement in net interest margin.
Half-year ended Half-year ended
30 June 30 June
Figures in HK$m 2019 2018
Net interest income/(expense) arising from:
- financial assets and liabilities that are not at fair value
through profit and loss 16,442 15,093
- trading assets and liabilities 128 90
- financial instruments designated and otherwise
mandatorily measured at fair value (717 ) (955 )
15,853 14,228
Average interest-earning assets 1,445,615 1,367,995
Net interest spread 2.02 % 1.97 %
Net interest margin 2.21 % 2.10 %
Average interest-earning assets rose by HK$78bn, or 6%, when compared with the first half of 2018.
Average customer lending increased by 7%, with notable growth in corporate and commercial and
mortgage lending. Average financial investments grew by 8% while average interbank placements
decreased by 14%.

8
Net interest margin improved by 11 basis points to 2.21%, mainly from the widening of customer deposits
spreads and higher contribution from net free funds as market interest rates rose in the first half of 2019.
Average loan spread on customer lending reduced, notably in corporate and commercial term lending. The
adverse effects of the yield curve flattening and credit spread tightening have limited opportunities for
growing revenue from deploying the new and maturing balance sheet management portfolios. However,
these adverse effects were partly offset by the Bank’s effective balance sheet management, including steps
to proactively defend the interest margin and achieve yield enhancement.
The HSBC Group reports interest income and interest expense arising from financial assets and financial
liabilities held for trading and income arising from financial instruments designated at fair value through
profit and loss as ‘Net income from financial instruments measured at fair value’ (other than for debt
securities in issue and subordinated liabilities, together with derivatives managed in conjunction with
them).
The table below presents the net interest income of Hang Seng Bank, as included in the HSBC Group
accounts:
Half-year ended Half-year ended
30 June 30 June
Figures in HK$m 2019 2018
Net interest income and expense reported
as ‘Net interest income’
- Interest income 20,912 16,967
- Interest expense (4,493 ) (1,882 )
- Net interest income 16,419 15,085
Net interest income and expense reported
as ‘Net income from financial instruments
measured at fair value’
(566 ) (857 )
Average interest-earning assets 1,401,690 1,318,550
Net interest spread 2.17 % 2.21 %
Net interest margin 2.36 % 2.31 %
Net fee income fell by HK$504m, or 13%, to HK$3,485m. Net fee income excluding income from
securities broking-related services and retail investment funds maintained growth momentum, rising by
4% with notable increases in fee income from credit facilities and insurance business. In challenging
market conditions for investment services, income from retail investment funds fell by 24% from the high
level achieved in the same period last year. With greater investor caution on the back of the less favourable
equities markets, income from securities broking-related services fell by 32%, in line with the market-
wide fall in securities turnover for Hong Kong during the first half of the year.
9
Net income from financial instruments measured at fair value increased by HK$1,040m, or 105%, to
HK$2,035m.
Net trading income and net income from financial instruments designated at fair value together decreased
by HK$168m, or 15%, to HK$972m. Foreign exchange income was lower, affected by subdued customer
activity levels as market volatility was low. There was also a decrease in funding swaps income and an
unfavourable revaluation of foreign currency swaps. Income from debt securities, equities and other
trading activities was up when compared with same period last year.
In 2018, the Bank considered market practices for the presentation of certain financial liabilities that contain both deposit and
derivative components and determined a change in accounting policy and presentation with respect to ‘trading liabilities -
structured deposits and structured debt securities in issue’ to better align with the presentation of similar financial instruments
by the industry. Accordingly, rather than classifying ‘trading liabilities - structured deposits and structured debt securities in
issue’ as held for trading, such financial liabilities are now designated as at fair value through profit or loss since they are
managed and their performance is evaluated on a fair-value basis.
Net income from assets and liabilities of insurance business measured at fair value recorded a gain of
HK$1,064m compared with a loss of HK$145m for the same period last year. Investment returns on
financial assets supporting insurance liabilities contracts improved when compared with first half of 2018
as a result of positive movements in the equities and upward commercial property markets. To the extent
that these investment returns were attributable to policyholders, there was an offsetting movement reported
under ‘net insurance claims and benefits paid and movement in liabilities to policyholders’ or ‘movement in
present value of in-force long-term insurance business (‘PVIF’)’ under other operating income.

10
Analysis of income from wealth management business
Half-year ended Half-year ended
30 June 30 June
Figures in HK$m 2019 2018
(restated)
Investment services income:
- retail investment funds 810 1,064
- structured investment products 256 348
- securities broking and related services 701 1,028
- margin trading and others 42 43
1,809 2,483
Insurance income:
- life insurance:
- net interest income and fee income 1,919 1,856
- investment returns on life insurance funds
(including share of associate’s profit and
surplus on property revaluation
backing insurance contracts)
1,250
(326 )
- net insurance premium income 9,224 8,732
- net insurance claims and benefits paid
and movement in liabilities to policyholders (11,391 ) (8,946 )
- movement in present value of in-force
long-term insurance business 2,744 1,379
3,746 2,695
- general insurance and others 137 141
3,883 2,836
Total 5,692 5,319
Income from retail investment funds and securities broking and related services are net of fee expenses. Income from structured
investment products includes income reported under net fee income on the sales of third-party structured investment products. It
also includes profits generated from the selling of structured investment products in issue, reported under net income from
financial instruments measured at fair value.
Wealth management income increased by 7% when compared with same period last year. Investment
services income decreased by 27% while insurance business income increased by 37%.
Net interest income and fee income from life insurance business rose by 3%. Investment returns on the
life insurance portfolio recorded a gain of HK$1,250m compared with a loss of HK$326m for the same
period last year mainly reflecting favourable movements in equities markets. To the extent that these
investment returns were attributable to policyholders, there was an offsetting movement in ‘net insurance
claims and benefits paid and movement in liabilities to policyholders’ or ‘movement in PVIF’ under other
operating income.
Net insurance premium income increased by 6%, reflecting higher new premiums attributable to the
success of the Bank’s total-solution retirement planning propositions as well as an increase in renewal
premiums.
Riding on the Hong Kong Government’s initiatives to increase voluntary retirement saving by individuals,
the Bank’s new deferred annuity plan – which qualifies as a tax-deductible deferred annuity policy under
new regulations – was well received by customers.
11
Net insurance claims and benefits paid and movement in liabilities to policyholders increased by 27%. The
increase was mainly due to regular review of discount rate reflecting the lower prevalent interest rate. This
would have an offsetting impact of increasing PVIF and overall profit or loss impact was insignificant.
The movement in PVIF increased by 99%, attributable mainly to the lower discount rate on insurance
contract liabilities described above, which was partly offset by the adjustment to PVIF accounting for
sharing of investment returns attributable to policyholders.
General insurance income was broadly in line with the same period last year.
Change in expected credit losses and other credit impairment charges increased by HK$272m, or 114%,
to HK$510m.
Hong Kong Financial Reporting Standard (‘HKFRS’) 9 ‘Financial Instruments’ requires the recognition
of impairment earlier in the lifecycle of a financial asset, taking forward-looking information into
consideration. As a result, measurement involves more complex judgement with impairment likely to be
more volatile as the economic outlook changes.
Change in expected credit losses (‘ECL’) and other credit impairment charges for unimpaired credit
exposures (stage 1 & 2) recorded a net charge of HK$232m, compared with a net release of HK$112m in
the first half of 2018, attributable mainly to change in the size of the loans portfolio and a less favourable
forward-looking macroeconomic forecast for Hong Kong during the updating of key macroeconomic
variables in the ECL assessment model. Increase in ECL charges for stage 1 & 2 amounted to HK$344m.
Retail Banking and Wealth Management (‘RBWM’) accounted for HK$79m and the remaining HK$265m
was related to Commercial Banking (‘CMB’) and Global Banking and Markets (‘GBM’).
ECL charges for impaired credit exposures (stage 3 & purchased or originated credit-impaired) decreased by
HK$72m. The downgrading of several CMB customers in first half of 2018 did not reoccur in the first half
of 2019, although the positive impact of this was partly offset by higher charges on credit card and personal
loan portfolios under RBWM.
Gross impaired loans and advances were down by HK$137m, or 6%, to HK$2,023m against 2018 year-end.
Gross impaired loans and advances as a percentage of gross loans and advances to customers stood at 0.22%
at the end of June 2019, compared with 0.25% at the end of December 2018 and 0.31% at the end of June
2018. Overall credit quality remained robust.
The Bank’s senior management will continue to closely monitor market developments and shifts in the
economic environment in its management and assessment of the credit performance of financial assets.
Operating expenses increased by HK$606m, or 11%, to HK$6,328m, due mainly to the Bank’s continued
investment in people, technology and operational infrastructure to drive service enhancement and business
development in Hong Kong and the Mainland in support of long-term sustainable growth. Staff costs were
up 9%, due primarily to the salary increment and higher performance-related pay expenses.
Depreciation charges increased by 45%, due mainly to higher depreciation charges on business premises
following the upward commercial property revaluation at last year-end. Depreciation charges for the first
half of 2019 also include depreciation of right-of-use assets amounting to HK$251m following the adoption
of HKFRS 16 ‘Leases’, which came into effect on 1 January 2019. Correspondingly, there was a similar
decrease in rental expenses under general and administrative expenses.
General and administrative expenses increased by 2%. Further investment in systems and the development
of distribution channels to advance the Group’s growth initiatives and an increase in processing fee led to
higher technology costs. These were partly offset by lower marketing and advertising expense and rental
expenses as stated in the previous paragraph.

12
The Group continued to focus on enhancing operational efficiency while maintaining growth momentum.
The cost efficiency ratio was 28.2%, one of the lowest among banks in Hong Kong.
At 30 June At 30 June
Full-time equivalent staff numbers by region 2019 2018
Hong Kong and others 8,614 8,365
Mainland 1,757 1,727
Total 10,371 10,092
Half-year ended Half-year ended
30 June 30 June
2019 2018
Cost efficiency ratio 28.2 % 27.7 %
Operating profit rose HK$899m, or 6%, to HK$15,561m compared with the first half of 2018.
Net surplus on property revaluation increased by HK$109m, or 140%, to HK$187m.
Share of profits of associates increased by HK$22m, or 18%, to HK$146m, mainly reflecting higher
revaluation surplus of a property investment company.
First half of 2019 compared with second half of 2018
The Group recorded a strong performance against the second half of 2018. Attributable profit grew by
HK$2,092m, or 18%. Operating profit rose by HK$2,276m, or 17%, reflecting the combined effect of higher
non-interest income, lower ECL charges and reduced operating expenses. Operating profit excluding
changes in expected credit losses and other credit impairment charges rose by HK$2,028m, or 14%.
Net interest income was broadly in line with the second half of 2018. The favourable impact of the increase
in average interest-earning assets and increased contribution from net free funds was mostly offset by the
change in liability mix as rising market interest rates prompted customers to shift from current and savings
accounts to time deposits, the narrowing of the net interest margin as a result of lower market interest rate
level in the first quarter of 2019 and more calendar days in the second half of 2018.
Non-interest income grew by HK$1,809m or 38%. With the Bank’s diverse portfolio of products and well-
established reputation for service excellence, wealth management business remained a core income driver.
In challenging operating conditions for investment business, the Bank leveraged its strong life insurance
proposition to achieve a 54% increase in wealth management income. Credit facilities fee income grew by
90%, due mainly to higher fees from corporate lending.
Operating expenses decreased by HK$118m, or 2%, with savings in general and administrative expenses
and premises and equipment outweighing the increase in staff costs. ECL charges decreased by HK$248m,
or 33%, due mainly to additional ECL charges on impaired customer loans and the downgrading of several
CMB customers in the second half of 2018.
13
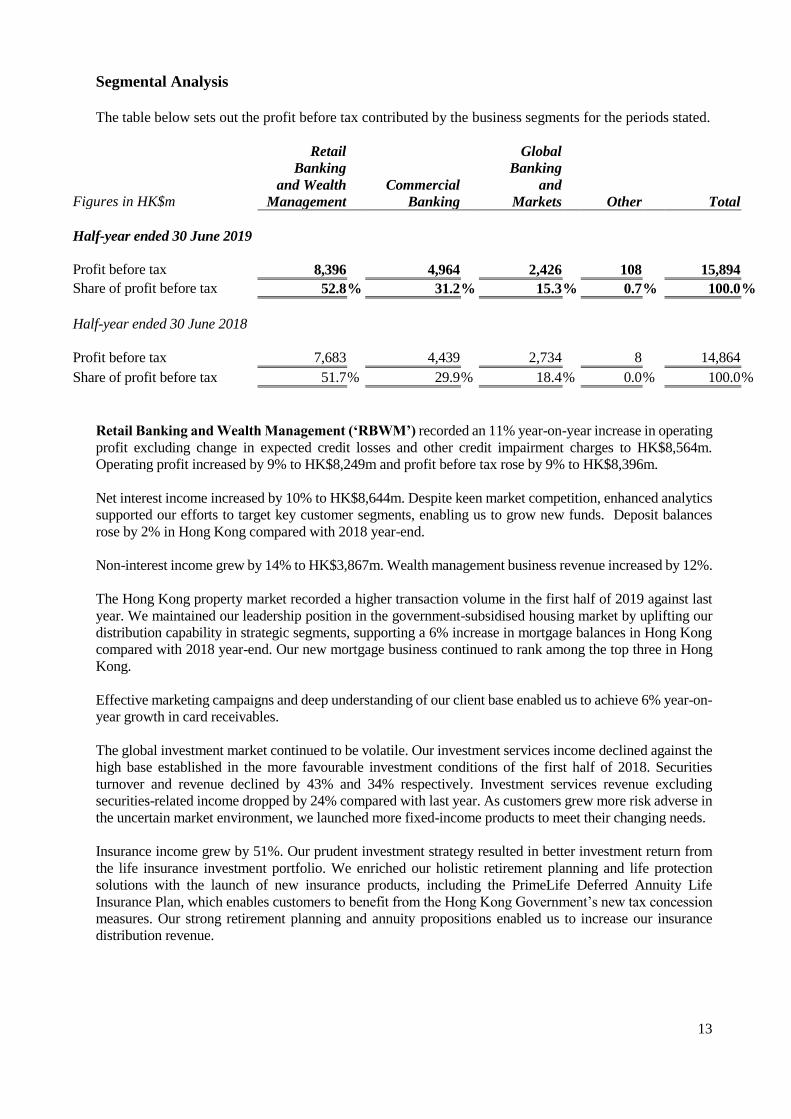
Segmental Analysis The table below sets out the profit before tax contributed by the business segments for the periods stated.
Retail
Banking
Global
Banking
and Wealth Commercial and
Figures in HK$m Management Banking Markets Other Total
Half-year ended 30 June 2019
Profit before tax 8,396 4,964 2,426 108 15,894
Share of profit before tax 52.8 % 31.2 % 15.3 % 0.7 % 100.0 %
Half-year ended 30 June 2018
Profit before tax 7,683 4,439 2,734 8 14,864
Share of profit before tax 51.7 % 29.9 % 18.4 % 0.0 % 100.0 %
Retail Banking and Wealth Management (‘RBWM’) recorded an 11% year-on-year increase in operating
profit excluding change in expected credit losses and other credit impairment charges to HK$8,564m.
Operating profit increased by 9% to HK$8,249m and profit before tax rose by 9% to HK$8,396m.
Net interest income increased by 10% to HK$8,644m. Despite keen market competition, enhanced analytics
supported our efforts to target key customer segments, enabling us to grow new funds. Deposit balances
rose by 2% in Hong Kong compared with 2018 year-end.
Non-interest income grew by 14% to HK$3,867m. Wealth management business revenue increased by 12%.
The Hong Kong property market recorded a higher transaction volume in the first half of 2019 against last
year. We maintained our leadership position in the government-subsidised housing market by uplifting our
distribution capability in strategic segments, supporting a 6% increase in mortgage balances in Hong Kong
compared with 2018 year-end. Our new mortgage business continued to rank among the top three in Hong
Kong.
Effective marketing campaigns and deep understanding of our client base enabled us to achieve 6% year-on-
year growth in card receivables.
The global investment market continued to be volatile. Our investment services income declined against the
high base established in the more favourable investment conditions of the first half of 2018. Securities
turnover and revenue declined by 43% and 34% respectively. Investment services revenue excluding
securities-related income dropped by 24% compared with last year. As customers grew more risk adverse in
the uncertain market environment, we launched more fixed-income products to meet their changing needs.
Insurance income grew by 51%. Our prudent investment strategy resulted in better investment return from
the life insurance investment portfolio. We enriched our holistic retirement planning and life protection
solutions with the launch of new insurance products, including the PrimeLife Deferred Annuity Life
Insurance Plan, which enables customers to benefit from the Hong Kong Government’s new tax concession
measures. Our strong retirement planning and annuity propositions enabled us to increase our insurance
distribution revenue.

14
Enhancements to our customer segmentation strategy and strengthened analytics, powered by machine
learning, enabled us to deepen relationships with our clients and provides more timely needs-based financial
products and services. In the Prestige Banking segment, we leveraged our high-value proposition and
premium wealth management solutions to drive new business. We grew our Prestige Signature customer
base by 14% year-on-year in Hong Kong. On the Mainland, we grew the number of Prestige customers by
5% year-on-year.
We are committed to investing in fintech and building a robust digital infrastructure to better engage our
customers. We continued to uplift our mobile banking and e-Banking user experiences to provide our clients
with smarter, easier and more relevant banking services. We upgraded the mobile banking user interface to
allow greater personalisation. We expanded the capabilities and features of our AI chatbot, HARO, which
now allows customers to conduct foreign exchange services and transfers and foreign exchange ATM
location enquiries using the conversational interface. We continued to roll out new online products and
services, including new insurance products, a credit card activation service and mobile e-statements. Year-
on-year, the number of Personal e-Banking customers increased by 8% in Hong Kong and the number of
active mobile users increased by 40%.
Commercial Banking (‘CMB’) achieved a 13% increase in operating profit excluding change in expected
credit losses and other credit impairment charges to HK$5,120m. Operating profit and profit before tax rose
by 12% to HK$4,964m.
Net interest income rose by 20% to HK$5,195m, reflecting good growth in loan and deposit balances, as
well as the rise in market interest rates.
Non-interest income declined by 12% to HK$1,552m, due mainly to the downturn in investment sentiment
and uncertainties arising from the US-China trade dispute. Amid the challenging external environment, we
remained active in the syndicated loan market, resulting in a 22% increase in credit facilities fee income.
We launched further initiatives to improve customer experience in transactional banking. To support the
launch of the Faster Payment System (‘FPS’), we enhanced our bill payment services to accept FPS QR
codes. We extended One Collect, our integrated point-of-sale terminal, from offline merchants to online
merchants and introduced support for payments by FPS. In addition, we significantly enhanced the speed
and accuracy of trade transactions with the adoption of new optical character recognition technology and the
automation of the vessel-checking process.
Riding on the Bank’s strategic alliance with Hong Kong Science and Technology Parks Corporation, we
launched ‘Inno Booster’, a tailor-made banking and finance solution for eligible innovation and technology
companies that allows them to enjoy pre-approved loans and other preferential banking service offers.
We continued to expand our digital capabilities to make services faster, easier and more convenient for
customers. We upgraded the functionality of digital foreign exchange services to allow for orders to be
executed automatically upon hitting the designated exchange rate. We took steps to cut waiting times with
initiatives such as the launch of an online business loan application form. Our virtual customer service
assistant, BERI, was enhanced to support more general enquiries.
To further improve the customer experience, we upgraded our Tsim Sha Tsui Business Banking Centre to
provide a more spacious and comfortable service environment.
We continued to be proactive and vigilant in managing our credit risk and uphold good overall credit quality.
Our digital innovations have received positive recognition in the industry. We received rewards from The
Assets for One Collect (‘Most Innovative Corporate Payment Project’) and our AI Chatbot (‘Most Innovative
Emerging Digital Technologies Project’). We were also named ‘Best Payment Bank in Hong Kong’ and
received the ‘Best Automated Advisory/ Chatbot Initiative, Application or Programme’ award at The Asian
Banker Transaction Banking Awards.
15
Global Banking and Markets (‘GBM’) reported 9% decline in operating profit excluding change in
expected credit losses and other credit impairment charges to HK$2,465m and an 11% decrease in both
operating profit and profit before tax to HK$2,426m.
Global Banking (‘GB’) reported a 14% growth in operating profit excluding change in expected credit
losses and other credit impairment charges to HK$1,160m. Operating profit and profit before tax were
both up 9% at HK$1,123m.
Net interest income increased by 12% to HK$1,219m. In a challenging market environment, we achieved
an enhanced lending portfolio mix and better deposit returns, reflecting the strong trust we have established
with large corporate clients as well as improvements to our cash management capabilities.
Key drivers included successful steps to grow the deposit base, which was increased by 18% compared
with 2018 year-end, and good growth in non-interest income, which rose by 17% compared with a year
earlier. Compared with the second half of 2018, non-interest income grew by 34%.
Global Markets (‘GM’) reported a 23% decrease in operating profit excluding change in expected credit
losses and other credit impairment charges to HK$1,305m. Operating profit and profit before tax both
decreased by 24% to HK$1,303m.
Net interest income decreased by 5% to HK$1,037m. The adverse effects of the yield curve flattening and
tightening credit spreads limited the revenue gained from deploying new and maturing balance sheet
management portfolios. The balance sheet management team continued to manage interest rate risk
effectively, taking steps to proactively defend the interest margin and achieve yield enhancement while
upholding prudent risk management standards.
Non-interest income decreased by 33% to HK$565m. Uncertainty related to the US-China trade dispute
and low foreign exchange volatility decreased customer demand for foreign exchange products. Together
with the unfavourable flattening yield curve environment, this resulted in a decline in non-fund income
from sales and trading activities. We continued with initiatives to deepen GM product penetration among
Bank customers through close collaboration with the RBWM, CMB and GB teams.

16
Balance Sheet Analysis
Assets
Total assets increased by HK$85bn, or 5%, to HK$1,657bn compared with last year-end, with the Group
maintaining good business momentum and advancing its strategy of enhancing profitability through
sustainable growth.
Cash and sight balances at central banks decreased by HK$6bn, or 39%, to HK$10bn, reflecting the
redeployment of the commercial surplus. Placing with banks increased by HK$20bn, or 25%, to HK$99bn
and trading assets rose by HK$3bn, or 5%, to HK$50bn.
Customer loans and advances (net of ECL allowances) grew by HK$45bn, or 5%, to HK$920bn against
2018 year-end. Loans for use in Hong Kong increased by 5%, mainly reflecting growth in lending to the
property development and investment sector, manufacturers and working capital financing for certain large
corporate customers. Lending to individuals increased by 5%. The Group continued to maintain its market
share for mortgage business, with residential mortgages and Government Home Ownership
Scheme/Private Sector Participation Scheme/Tenants Purchase Scheme lending growing by 6% and 9%
respectively. Trade finance lending grew by 8%. Loans and advances for use outside Hong Kong increased
by 7%, due mainly to the combined effect of the increase in lending granted by the Hong Kong office and
the Group’s Mainland banking subsidiary.
Financial investments increased by HK$21bn, or 5%, to HK$450bn, mainly reflecting funds redeployment
of the issued Additional Tier 1 (‘AT1’) capital instruments and the non-capital loss-absorbing capacity
debt instruments to meet regulatory requirements and further optimise the Bank’s capital and funding
structure. There was also an increase in the insurance financial instruments portfolio.
Liabilities and equity
Customer deposits, including certificates of deposit and other debt securities in issue, increased by
HK$49bn, or 4%, to HK$1,241bn against last year-end. Rising market interest rates resulted in higher
growth in time deposits. At 30 June 2019, the advances-to-deposits ratio was 74.1%, compared with 73.4%
at 31 December 2018.
The Bank issued subordinated liabilities amounting to HK$19.5bn during the first half of 2019 to meet loss-
absorbing capacity requirements and further strengthen the Bank’s financial resilience.
At 30 June 2019, shareholders’ equity was up HK$11bn, or 7%, at HK$173bn against last year-end. Retained
profits grew by HK$4bn, or 3%, reflecting profit accumulation partly offset by the payment of the 2018
fourth interim dividend and the 2019 first interim dividend. Other equity instruments, specifically AT1
capital instruments, increased by HK$5bn, or 68% as the Bank has cancelled and repaid the AT1 capital
instrument of US$900m and issued new AT1 capital instruments of US$1,500m to further optimise its capital
structure and comply with regulatory requirements. The premises revaluation reserve increased by HK$0.4bn,
or 2%, reflecting the upward trend in the commercial property market. Financial assets at fair value through
other comprehensive income reserve increased by HK$1.3bn, or 86%, mainly reflecting the fair value
movement of the Group’s investments in financial assets measured at fair value.

Risk and Capital Management
(Figures expressed in millions of Hong Kong dollars unless otherwise indicated)
(unaudited)
Risk Management
Principal risks and uncertainties
Key developments in the first half of 2019
•
•
•
Update on the nature of our Ibor risks
(a) Credit Risk
Maximum exposure to credit risk before collateral held or other credit enhancements
At 30 June At 31 December
2019 2018
Cash and sight balances at central banks 10,082 16,421
Placings with and advances to banks 99,066 79,400
Trading assets 49,720 47,148
Financial assets designated and otherwise mandatorily measured at fair value 1,397 1,331
Derivative financial instruments 6,310 8,141
Loans and advances to customers 919,845 874,456
Financial investments 444,079 424,388
Other assets 24,470 27,019
Financial guarantees and other credit related contingent liabilities 4,079 4,167
Loan commitments and other credit related commitments 586,062 594,457
2,145,110 2,076,928
The impact of the replacement of interbank offered rates ("Ibors") with alternative risk-free rates on our products and services
remains a key area of focus. The programme to coordinate our transition activities is significant in terms of scale and complexity
and will impact all global businesses and jurisdictions as well as multiple products, currencies, systems and processes. In addition
to the consequent execution risks, the process of adopting new reference rates exposes the Group to a wide range of material
conduct, operational and financial risks. We continue to engage with industry participants, the official sector and our clients to
support an orderly transition and the mitigation of the risks resulting from the transition.
Our credit exposure is spread across a broad range of asset classes, including those measured at amortised cost and fair value,
and off-balance sheet financial instruments. The following table presents the maximum exposure to credit risk from balance
sheet and off-balance sheet financial instruments, before taking account of any collateral held or other credit enhancements
(unless such credit enhancements meet accounting offsetting requirements). For financial assets recognised on the balance
sheet, the maximum exposure to credit risk equals their carrying amount; for financial guarantees and similar contracts
granted, it is the maximum amount that we would have to pay if the guarantees were called upon. For loan commitments and
other credit-related commitments, it is generally the full amount of the committed facilities.
The Group continuously monitors and identifies risks. Our principal risks are credit risk, liquidity and funding risk, market risk,
operational risk, regulatory compliance risk, financial crime risk, reputational risk, pension risk, sustainability risk and insurance
risk. The description of principal risks and a summary of our current policies and practices regarding the management of risk is set
out in the "Risk Management" section of the Annual Report 2018.
Credit risk is the risk of financial loss if a customer or counterparty fails to meet an obligation under a contract. Credit risk
arises principally from direct lending, trade finance and leasing business, but also from certain other products, such as
guarantees and derivatives.
There were no material changes to the policies and practices for the management of risk, as described in the Annual Report 2018,
in the first half of 2019 except for the following:
We continued to strengthen our approach to managing operational risk, as set out in the operational risk management
framework. The framework sets out our governance and appetite. It provides a single view of non-financial risks that matter
the most and associated controls. It incorporates a risk management system to enable active risk management.
We continued to strengthen our management of conduct and embed conduct considerations as a key part of risk management
across the Group. We set out clear expectations and guidance for all our people, illustrating the link between our values and
good conduct. Our goal is for good conduct, through our people’s behaviour and decision making, to deliver fair outcomes for
customers and preserve market integrity.
The Global Standards programme continued to integrate the final elements of our capabilities for Anti-Money Laundering
("AML") and sanctions into our day to day operations throughout the first half of 2019. We continue to enhance our financial
crime risk management capabilities and the effectiveness of our financial crime controls, and we are maintaining our
investment in the next generation of tools to fight financial crime through the application of advanced analytics and artificial
intelligence.
17
Risk and Capital Management (continued)
Risk Management (continued)
(a) Credit Risk (continued)
Summary of credit risk
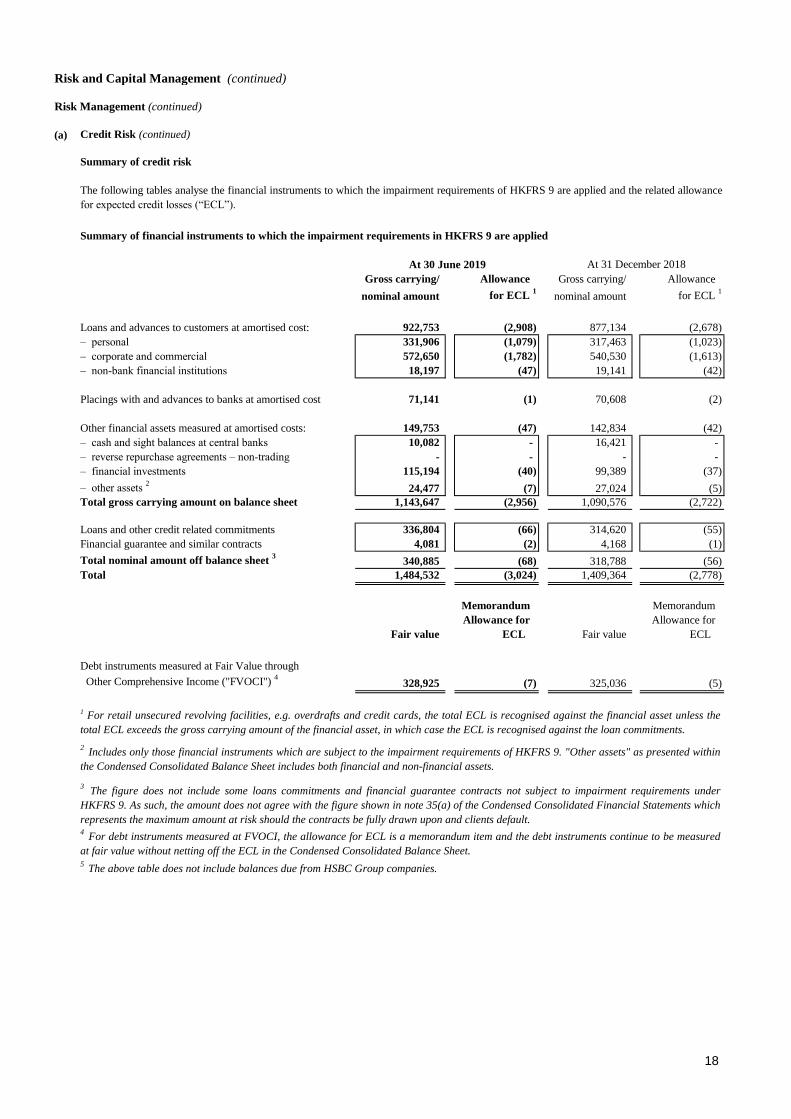
Summary of financial instruments to which the impairment requirements in HKFRS 9 are applied
Gross carrying/ Allowance Gross carrying/ Allowance
nominal amount for ECL 1
nominal amount for ECL 1
Loans and advances to customers at amortised cost: 922,753 (2,908) 877,134 (2,678)
– personal 331,906 (1,079) 317,463 (1,023)
– corporate and commercial 572,650 (1,782) 540,530 (1,613)
– non-bank financial institutions 18,197 (47) 19,141 (42)
Placings with and advances to banks at amortised cost 71,141 (1) 70,608 (2)
Other financial assets measured at amortised costs: 149,753 (47) 142,834 (42)
– cash and sight balances at central banks 10,082 - 16,421 -
– reverse repurchase agreements – non-trading - - - -
– financial investments 115,194 (40) 99,389 (37)
– other assets 2
24,477 (7) 27,024 (5)
Total gross carrying amount on balance sheet 1,143,647 (2,956) 1,090,576 (2,722)
Loans and other credit related commitments 336,804 (66) 314,620 (55)
Financial guarantee and similar contracts 4,081 (2) 4,168 (1)
Total nominal amount off balance sheet 3
340,885 (68) 318,788 (56)
Total 1,484,532 (3,024) 1,409,364 (2,778)
Memorandum Memorandum
Allowance for Allowance for
Fair value ECL Fair value ECL
Debt instruments measured at Fair Value through
Other Comprehensive Income ("FVOCI") 4
328,925 (7) 325,036 (5)
The following tables analyse the financial instruments to which the impairment requirements of HKFRS 9 are applied and the related allowance
for expected credit losses (“ECL”).
3The figure does not include some loans commitments and financial guarantee contracts not subject to impairment requirements under
HKFRS 9. As such, the amount does not agree with the figure shown in note 35(a) of the Condensed Consolidated Financial Statements which
represents the maximum amount at risk should the contracts be fully drawn upon and clients default.
5 The above table does not include balances due from HSBC Group companies.
1 For retail unsecured revolving facilities, e.g. overdrafts and credit cards, the total ECL is recognised against the financial asset unless the
total ECL exceeds the gross carrying amount of the financial asset, in which case the ECL is recognised against the loan commitments.
2Includes only those financial instruments which are subject to the impairment requirements of HKFRS 9. "Other assets" as presented within
the Condensed Consolidated Balance Sheet includes both financial and non-financial assets.
4For debt instruments measured at FVOCI, the allowance for ECL is a memorandum item and the debt instruments continue to be measured
at fair value without netting off the ECL in the Condensed Consolidated Balance Sheet.
At 30 June 2019 At 31 December 2018
18

Risk and Capital Management (continued)
Risk Management (continued)
(a) Credit Risk (continued)
Measurement uncertainty and sensitivity analysis of ECL estimates
Methodology
The Upside and Downside scenarios are generated at year end and are only updated during the year if economic
conditions change significantly. The Central scenario is generated every quarter.
The Group recognises that the Consensus Economic Scenario approach using three scenarios will be insufficient in
certain economic environments. Additional analysis may be requested at management’s discretion, including the
production of extra scenarios. For instance, the recent continued escalation of trade and tariff-related tensions started
from 2018 resulted in management modelling deeper effects of a trade war scenario than currently captured by the
consensus Downside scenario for key Asia-Pacific economies. This additional trade war scenario models the effects
of a significant escalation in global tensions, stemming from trade disputes but going beyond increases in tariffs to
affect non-tariff barriers, cross-border investment flows and threatens the international trade architecture. This
scenario assumes actions that lie beyond currently enacted and proposed tariffs and has been modelled as an addition
to the three consensus-driven scenarios for these economies.
The conditions that resulted in departure from the consensus economic forecasts will be reviewed regularly as
economic conditions change in future to determine whether these adjustments continue to be necessary.
The recognition and measurement of expected credit loss ("ECL") is highly complex and involves the use of
significant judgement and estimation. This includes the formulation and incorporation of multiple forward-looking
economic conditions into the ECL estimates to meet the measurement objective of HKFRS 9.
Impairment is calculated in three stages and financial instruments are allocated into one of the three stages where the
transfer mechanism depends on whether there is a significant increase/decrease in credit risk in the relevant reporting
period. After the allocation, the measurement of expected credit loss (“ECL”), which is the product of probability of
default (“PD”), loss given default (“LGD”) and exposure at default (“EAD”), will reflect the change in risk of default
occurring over the remaining life of the instruments. The model monitoring on ECL parameters will be performed
quarterly.
For most portfolios, the Group has adopted the use of three economic scenarios. They represent a "most likely
outcome", (the Central scenario) and two, less likely, "outer" scenarios on either side of the Central, referred to as an
"Upside" and a "Downside" scenario respectively.
There were no material changes to economic scenarios in the first half of 2019 except for the update of key economic
assumptions.
19

Risk and Capital Management (continued)
Risk Management (continued)
(a) Credit Risk (continued)
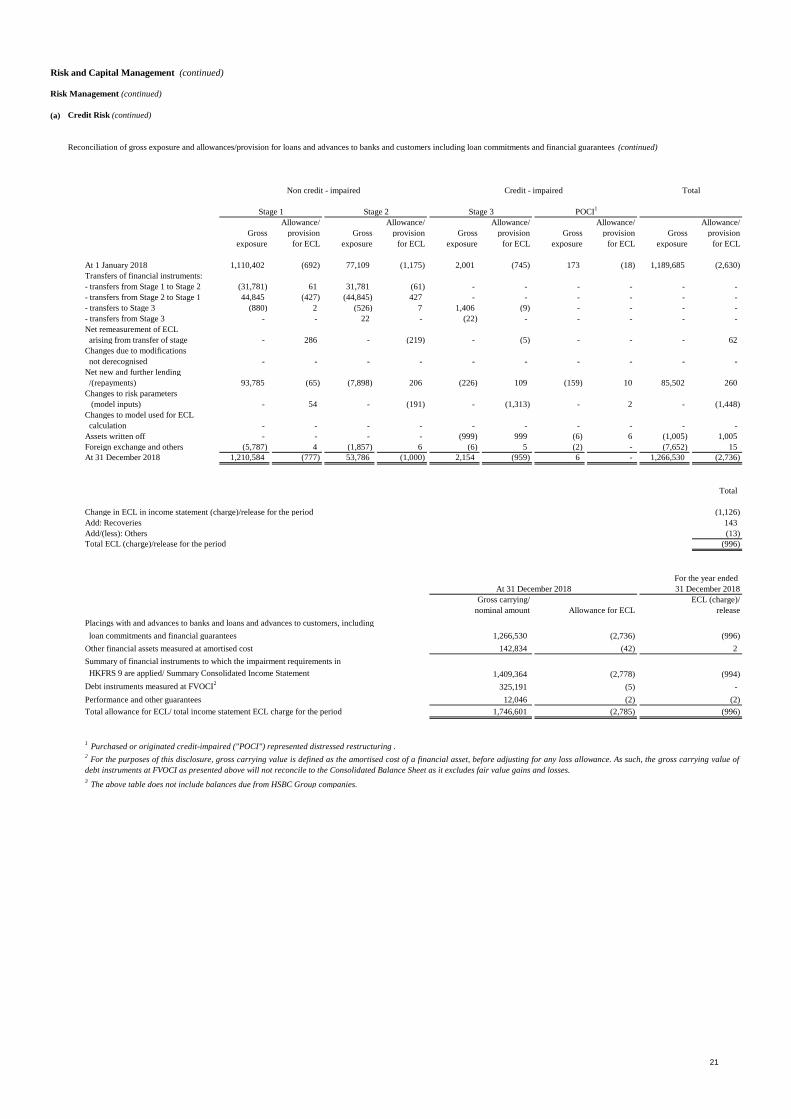
Reconciliation of gross exposure and allowances/provision for loans and advances to banks and customers including loan commitments and financial guarantees
Allowance/ Allowance/ Allowance/ Allowance/ Allowance/
Gross provision Gross provision Gross provision Gross provision Gross provision
exposure for ECL exposure for ECL exposure for ECL exposure for ECL exposure for ECL
At 1 January 2019 1,210,584 (777) 53,786 (1,000) 2,154 (959) 6 - 1,266,530 (2,736)
Transfers of financial instruments:
- transfers from Stage 1 to Stage 2 (17,487) 44 17,487 (44) - - - - - -
- transfers from Stage 2 to Stage 1 22,410 (218) (22,410) 218 - - - - - -
- transfers to Stage 3 (106) - (111) 10 217 (10) - - - -
- transfers from Stage 3 - - 17 (1) (17) 1 - - - -
Net remeasurement of ECL
arising from transfer of stage - 128 - (141) - (2) - - - (15)
Changes due to modifications
not derecognised - - - - - - - - - -
Net new and further lending
/(repayments) 71,156 (55) (2,467) 117 (22) 113 - - 68,667 175
Changes to risk parameters
(model inputs) - (67) - (213) - (435) - - - (715)
Changes to model used for ECL
calculation - - - - - - - - - -
Assets written off - - - - (314) 314 - - (314) 314
Foreign exchange and others (191) - (22) - (1) - - - (214) -
At 30 June 2019 1,286,366 (945) 46,280 (1,054) 2,017 (978) 6 - 1,334,669 (2,977)
Total
Change in ECL in income statement (charge)/release for the period (555)
Add: Recoveries 58
Add/(less): Others (6)
Total ECL (charge)/release for the period (503)
For the half-year ended
30 June 2019
ECL (charge)/
Placings with and advances to banks and loans and advances to customers, including
loan commitments and financial guarantees
Other financial assets measured at amortised cost
Forward asset purchases
Summary of financial instruments to which the impairment requirements in
HKFRS 9 are applied/ Summary Condensed Consolidated Income Statement
Debt instruments measured at FVOCI2
Performance and other guarantees
Total allowance for ECL/ total ECL charge for the period
3 The above table does not include balances due from HSBC Group companies.
1 Purchased or originated credit-impaired ("POCI") represented distressed restructuring .
2For the purposes of this disclosure, gross carrying value is defined as the amortised cost of a financial asset, before adjusting for any loss allowance. As such, the gross carrying value of
debt instruments at FVOCI as presented above will not reconcile to the Condensed Consolidated Balance Sheet as it excludes fair value gains and losses.
4 The financial information included in this table forms part of the Condensed Consolidated Financial Statements which have been reviewed by PricewaterhouseCoopers.
1,829,924 (3,033) (510)
17,166 (2) -
328,226 (7) (2)
1,484,532 (3,024) (508)
110 - -
149,753 (47) (5)
1,334,669 (2,977) (503)
nominal amount Allowance for ECL release
At 30 June 2019
Gross carrying/
Stage 1 Stage 2 Stage 3 POCI1
Non credit - impaired Credit - impaired Total
20
Risk and Capital Management (continued)
Risk Management (continued)
(a) Credit Risk (continued)
Reconciliation of gross exposure and allowances/provision for loans and advances to banks and customers including loan commitments and financial guarantees (continued)
Allowance/ Allowance/ Allowance/ Allowance/ Allowance/
Gross provision Gross provision Gross provision Gross provision Gross provision
exposure for ECL exposure for ECL exposure for ECL exposure for ECL exposure for ECL
At 1 January 2018 1,110,402 (692) 77,109 (1,175) 2,001 (745) 173 (18) 1,189,685 (2,630)
Transfers of financial instruments:
- transfers from Stage 1 to Stage 2 (31,781) 61 31,781 (61) - - - - - -
- transfers from Stage 2 to Stage 1 44,845 (427) (44,845) 427 - - - - - -
- transfers to Stage 3 (880) 2 (526) 7 1,406 (9) - - - -
- transfers from Stage 3 - - 22 - (22) - - - - -
Net remeasurement of ECL
arising from transfer of stage - 286 - (219) - (5) - - - 62
Changes due to modifications
not derecognised - - - - - - - - - -
Net new and further lending
/(repayments) 93,785 (65) (7,898) 206 (226) 109 (159) 10 85,502 260
Changes to risk parameters
(model inputs) - 54 - (191) - (1,313) - 2 - (1,448)
Changes to model used for ECL
calculation - - - - - - - - - -
Assets written off - - - - (999) 999 (6) 6 (1,005) 1,005
Foreign exchange and others (5,787) 4 (1,857) 6 (6) 5 (2) - (7,652) 15
At 31 December 2018 1,210,584 (777) 53,786 (1,000) 2,154 (959) 6 - 1,266,530 (2,736)
Total
Change in ECL in income statement (charge)/release for the period (1,126)
Add: Recoveries 143
Add/(less): Others (13)
Total ECL (charge)/release for the period (996)
For the year ended
31 December 2018
ECL (charge)/
Placings with and advances to banks and loans and advances to customers, including
loan commitments and financial guarantees
Other financial assets measured at amortised cost
Summary of financial instruments to which the impairment requirements in
HKFRS 9 are applied/ Summary Consolidated Income Statement
Debt instruments measured at FVOCI2
Performance and other guarantees
Total allowance for ECL/ total income statement ECL charge for the period
3 The above table does not include balances due from HSBC Group companies.
1 Purchased or originated credit-impaired ("POCI") represented distressed restructuring .
2For the purposes of this disclosure, gross carrying value is defined as the amortised cost of a financial asset, before adjusting for any loss allowance. As such, the gross carrying value of
debt instruments at FVOCI as presented above will not reconcile to the Consolidated Balance Sheet as it excludes fair value gains and losses.
1,746,601 (2,785) (996)
12,046 (2) (2)
325,191 (5) -
1,409,364 (2,778) (994)
142,834 (42) 2
1,266,530 (2,736) (996)
nominal amount Allowance for ECL release
At 31 December 2018
Gross carrying/
Stage 1 Stage 2 Stage 3 POCI1
Non credit - impaired Credit - impaired Total
21
Risk and Capital Management (continued)
Risk Management (continued)
(a) Credit Risk (continued)
Debt securities
and other bills
12-month Basel Internal 12-month
External Internal probability of credit probability-
Credit Quality classification credit rating credit rating default % rating weighted PD %
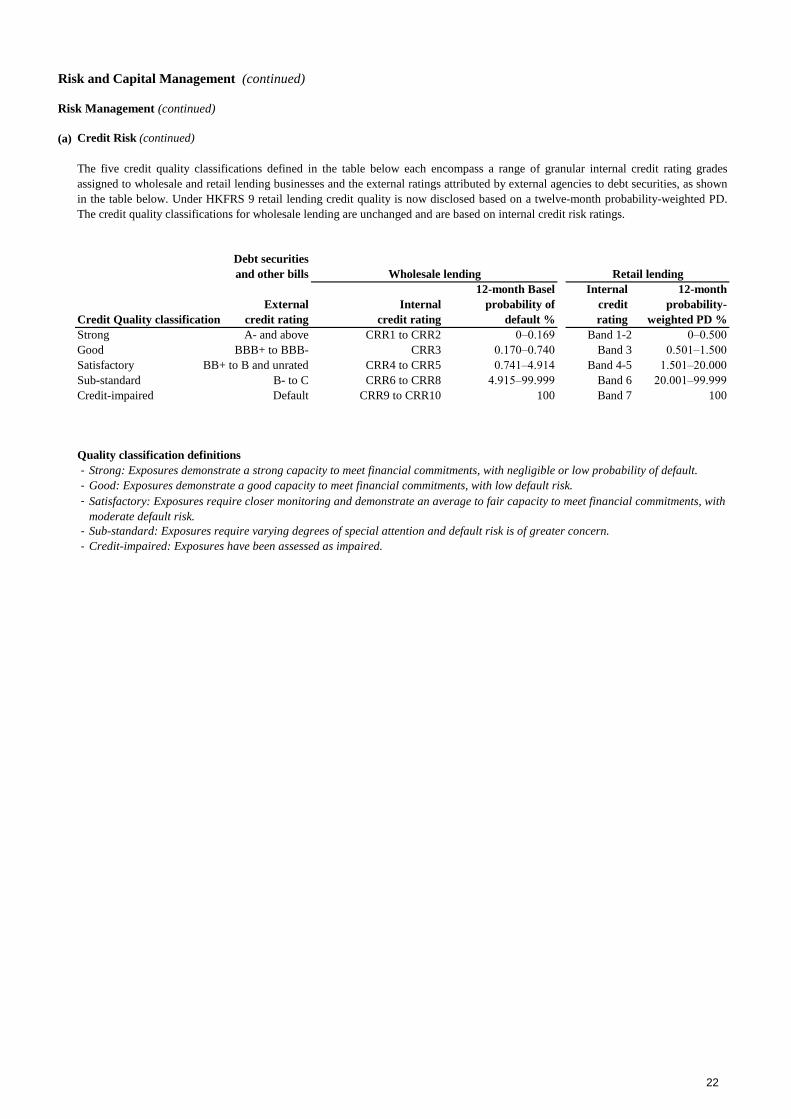
Strong A- and above CRR1 to CRR2 0–0.169 Band 1-2 0–0.500
Good BBB+ to BBB- CRR3 0.170–0.740 Band 3 0.501–1.500
Satisfactory BB+ to B and unrated CRR4 to CRR5 0.741–4.914 Band 4-5 1.501–20.000
Sub-standard B- to C CRR6 to CRR8 4.915–99.999 Band 6 20.001–99.999
Credit-impaired Default CRR9 to CRR10 Band 7 100
Quality classification definitions
- Strong: Exposures demonstrate a strong capacity to meet financial commitments, with negligible or low probability of default.
- Good: Exposures demonstrate a good capacity to meet financial commitments, with low default risk.
-
- Sub-standard: Exposures require varying degrees of special attention and default risk is of greater concern.
- Credit-impaired: Exposures have been assessed as impaired.
Satisfactory: Exposures require closer monitoring and demonstrate an average to fair capacity to meet financial commitments, with
moderate default risk.
100
Wholesale lending Retail lending
The five credit quality classifications defined in the table below each encompass a range of granular internal credit rating grades
assigned to wholesale and retail lending businesses and the external ratings attributed by external agencies to debt securities, as shown
in the table below. Under HKFRS 9 retail lending credit quality is now disclosed based on a twelve-month probability-weighted PD.
The credit quality classifications for wholesale lending are unchanged and are based on internal credit risk ratings.
22

Risk and Capital Management (continued)
Risk Management (continued)
(a) Credit Risk (continued)
Credit quality of financial instruments
Gross carrying / notional amount
Sub- Credit Allowance
Strong Good Satisfactory standard impaired Total for ECL Net
Placings with and advances
to banks at amortised cost 70,037 1,101 3 - - 71,141 (1) 71,140
– stage 1 70,037 1,101 3 - - 71,141 (1) 71,140
– stage 2 - - - - - - - -
– stage 3 - - - - - - - -
– POCI - - - - - - - -
Loans and advances to
customers at amortised cost 442,197 248,710 225,480 4,343 2,023 922,753 (2,908) 919,845
– stage 1 440,461 237,394 197,197 1,190 - 876,242 (887) 875,355
– stage 2 1,736 11,316 28,283 3,153 - 44,488 (1,043) 43,445
– stage 3 - - - - 2,017 2,017 (978) 1,039
– POCI - - - - 6 6 - 6
Other financial assets
measured at amortised cost 122,070 18,869 8,810 4 - 149,753 (47) 149,706
– stage 1 121,954 18,193 8,715 - - 148,862 (41) 148,821
– stage 2 116 676 95 4 - 891 (6) 885
– stage 3 - - - - - - - -
– POCI - - - - - - - -
Loan and other credit-
related commitments 2
273,460 43,525 19,535 284 - 336,804 (66) 336,738
– stage 1 273,460 42,978 18,669 143 - 335,250 (56) 335,194
– stage 2 - 547 866 141 - 1,554 (10) 1,544
– stage 3 - - - - - - - -
– POCI - - - - - - - -
Financial guarantees and
similar contracts 2
558 2,805 712 6 - 4,081 (2) 4,079
– stage 1 558 2,765 518 2 - 3,843 (1) 3,842
– stage 2 - 40 194 4 - 238 (1) 237
– stage 3 - - - - - - - -
– POCI - - - - - - - -
At 30 June 2019 908,322 315,010 254,540 4,637 2,023 1,484,532 (3,024) 1,481,508
Debt instruments at FVOCI 1
– stage 1 325,291 2,935 - - - 328,226 (7) 328,219
– stage 2 - - - - - - - -
– stage 3 - - - - - - - -
– POCI - - - - - - - -
At 30 June 2019 325,291 2,935 - - - 328,226 (7) 328,219
Distribution of financial instruments to which the impairment requirements in HKFRS 9 are applied, by credit quality and stage
allocation
3 The above table does not include balances due from HSBC Group companies.
1For the purposes of this disclosure gross carrying value is defined as the amortised cost of a financial asset, before adjusting for any loss
allowance. As such the gross carrying value of debt instruments at FVOCI as presented above will not reconcile to the figure shown in Condensed
Consolidated Financial Statements as it excludes fair value gains and losses.
2Figures do not include commitments and financial guarantee contracts not subject to impairment requirements under HKFRS 9. As such, the
amounts do not agree with the figures shown in note 35(a) of the Condensed Consolidated Financial Statements.
4The financial information included in this table forms part of the Condensed Consolidated Financial Statements which have been reviewed by
PricewaterhouseCoopers.
23

Risk and Capital Management (continued)
Risk Management (continued)
(a) Credit Risk (continued)
Gross carrying / notional amount
Sub- Credit Allowance
Strong Good Satisfactory standard impaired Total for ECL Net
Placings with and advances
to banks at amortised cost 69,493 1,111 4 - - 70,608 (2) 70,606
– stage 1 69,421 984 4 - - 70,409 (2) 70,407
– stage 2 72 127 - - - 199 - 199
– stage 3 - - - - - - - -
– POCI - - - - - - - -
Loans and advances to
customers at amortised cost 434,917 217,902 219,602 2,553 2,160 877,134 (2,678) 874,456
– stage 1 432,339 206,471 186,749 633 - 826,192 (732) 825,460
– stage 2 2,578 11,431 32,853 1,920 - 48,782 (987) 47,795
– stage 3 - - - - 2,154 2,154 (959) 1,195
– POCI - - - - 6 6 - 6
Other financial assets
measured at amortised cost 118,380 16,721 7,731 1 1 142,834 (42) 142,792
– stage 1 117,878 16,384 7,627 - - 141,889 (34) 141,855
– stage 2 502 337 104 1 - 944 (8) 936
– stage 3 - - - - 1 1 - 1
– POCI - - - - - - - -
Loan and other credit-
related commitments 2
256,094 32,083 25,954 489 - 314,620 (55) 314,565
– stage 1 256,094 30,267 23,494 263 - 310,118 (42) 310,076
– stage 2 - 1,816 2,460 226 - 4,502 (13) 4,489
– stage 3 - - - - - - - -
– POCI - - - - - - - -
Financial guarantees and
similar contracts 2
745 2,845 568 10 - 4,168 (1) 4,167
– stage 1 745 2,765 355 - - 3,865 (1) 3,864
– stage 2 - 80 213 10 - 303 - 303
– stage 3 - - - - - - - -
– POCI - - - - - - - -
At 31 December 2018 879,629 270,662 253,859 3,053 2,161 1,409,364 (2,778) 1,406,586
Debt instruments at FVOCI 1
– stage 1 324,037 1,154 - - - 325,191 (5) 325,186
– stage 2 - - - - - - - -
– stage 3 - - - - - - - -
– POCI - - - - - - - -
At 31 December 2018 324,037 1,154 - - - 325,191 (5) 325,186
3 The above table does not include balances due from HSBC Group companies.
1For the purposes of this disclosure gross carrying value is defined as the amortised cost of a financial asset, before adjusting for any loss
allowance. As such the gross carrying value of debt instruments at FVOCI as presented above will not reconcile to the figure shown in
Consolidated Financial Statements as it excludes fair value gains and losses.
2Figures do not include commitments and financial guarantee contracts not subject to impairment requirements under HKFRS 9. As such, the
amounts do not agree with the figures shown in note 45 of the Consolidated Financial Statements in Annual Report 2018.
Distribution of financial instruments to which the impairment requirements in HKFRS 9 are applied, by credit quality and stage allocation
(continued)
24

Risk and Capital Management (continued)
Risk Management (continued)
(b) Liquidity and funding risk
Liquidity information
Quarter
ended
30 June
2019
Quarter
ended
31 March
2019
Quarter
ended
30 June
2018
Quarter
ended
31 March
2018
198.5% 210.8% 209.6% 207.0%
30 June
2019
31 March
2019
30 June
2018
31 March
2018
Level 1 assets 305,849 309,073 262,800 265,754 Level 2A assets 12,539 11,577 11,615 12,866 Level 2B assets 550 548 551 552
Total weighted amount of HQLA 318,938 321,198 274,966 279,172
Quarter
ended
30 June
2019
Quarter
ended
31 March
2019
Quarter
ended
30 June
2018
Quarter
ended
31 March
2018
152.5% 150.3% 153.6% 152.9%
A summary of the Group's current policies and practices for the management of liquidity and funding risk is set out in "Liquidity and
funding risk" section on pages 69 to 73 of the Group's Annual Report 2018.
The Group has an internal liquidity and funding risk management framework which aims to allow it to withstand very severe liquidity
stresses. It is designed to be adaptable to changing business models, markets and regulations.
Liquidity risk is the risk that the Group does not have sufficient financial resources to meet its obligations as they fall due, or will have to
do so at an excessive cost. Funding risk is the risk that funding considered to be sustainable, and therefore used to fund assets, is not
sustainable over time.
Weighted amount (average value) at quarter ended
There is no material change to the policies and practices for the management of liquidity and funding risk in the first half of 2019.
The liquidity position of the Group remained strong for the first half of 2019. The average LCR were 198.5% and 210.8% for the quarters
ended 30 June and 31 March 2019 respectively, compared with 209.6% and 207.0% for the quarters ended 30 June and 31 March 2018
respectively.
During 2019, the Group is required to calculate NSFR on a consolidated basis and maintain a NSFR of not less than 100% in accordance
with the BLR.
To comply with the Banking (Disclosure) Rules, the details of liquidity information can be found in the Regulatory Disclosures section of
our website www.hangseng.com.
The funding position of the Group remained strong and stable for the first half of 2019. The period end NSFR were 152.5% and 150.3%
for the quarters ended 30 June and 31 March 2019 respectively, compared with 153.6% and 152.9% for the quarters ended 30 June and 31
March 2018 respectively.
Net Stable Funding Ratio
The NSFR at the reportable quarter-end are as follows:
In accordance with rule 11(1) of the Banking (Liquidity) Rules ("BLR"), the Group is required to calculate its Liquidity Coverage Ratio
(“LCR”) on a consolidated basis. From 1 January 2019, the Group is required to maintain a LCR of not less than 100%.
The LCR for the reportable periods are as follows:
Average Liquidity Coverage Ratio
The composition of the Group's high quality liquid assets ("HQLA") as defined under Schedule 2 of the BLR is shown as below. The
majority of the HQLA held by the Group are Level 1 assets which consist mainly of government debt securities.
25

Risk and Capital Management (continued)
Risk Management (continued)
(c) Market risk
Value at risk ("VaR")
Risk not in VaR ("RNIV") framework
The RNIV framework aims to manage and capitalise material market risks that are not adequately covered in the VaR model. In
such instances the RNIV framework uses stress tests to quantify the capital requirement. RNIV is not viewed as being a
material component of the Group’s market risk capital requirement. For the average of the first half of 2019, the capital
requirement derived from these stress tests represented 2.7% of the total internal model-based market risk requirement.
The Group’s VaR model is designed to capture significant basis risks such as asset swap spreads and cross-currency basis.
Other basis risks which are not completely covered in VaR, such as the LIBOR tenor basis, are complemented by RNIV
calculations and are integrated into the capital framework.
Market risk is the risk that movements in market factors, including foreign exchange rates and commodity prices, interest rates,
credit spreads and equity prices, will reduce our income or the value of our portfolios.
There is no material change to the Group's policies and practices for the management of market risk for the first half of 2019.
A summary of the Group's current policies and practices for the management of market risk is set out in "Market Risk" section
on pages 74 to 81 of the Group's Annual Report 2018.
VaR is a technique that estimates the potential losses on risk positions as a result of movements in market rates and prices over
a specified time horizon and to a given level of confidence. The use of VaR is integrated into market risk management and is
calculated for all trading positions regardless of how the Group capitalises those exposures. Where there is no approved internal
model, the Group uses the appropriate local rules to capitalise exposures.
In addition, the Group calculates VaR for non-trading portfolios in order to have a complete picture of market risk. Where VaR
is not calculated explicitly, alternative tools are used.
Standard VaR is calculated at a 99% confidence level for a one-day holding period while stressed VaR uses a 10-day holding
period and a 99% confidence interval based on a continuous one-year historical significant stress period. The VaR models used
by the Group are based predominantly on historical simulation. These models derive plausible future scenarios from past series
of recorded market rates and prices, taking into account inter-relationships between different markets and rates such as interest
rates and foreign exchange rates. The models also incorporate the effect of option features on the underlying exposures.
Risk factors are reviewed on a regular basis and either incorporated directly in the VAR models, where possible, or quantified
through the VaR-based RNIV approach or a stress test approach within the RNIV framework. The severity of the scenarios is
calibrated to be in line with the capital adequacy requirements.
• Standard VaR is calculated to a 99% confidence level and use a one-day holding period scaled to 10 days.
The historical simulation models used incorporate the following features:
• historical market rates and prices are calculated with reference to foreign exchange rates and commodity prices, interest rates,
equity prices and the associated volatilities;
• potential market movements utilised for VaR are calculated with reference to those historical data; and
26
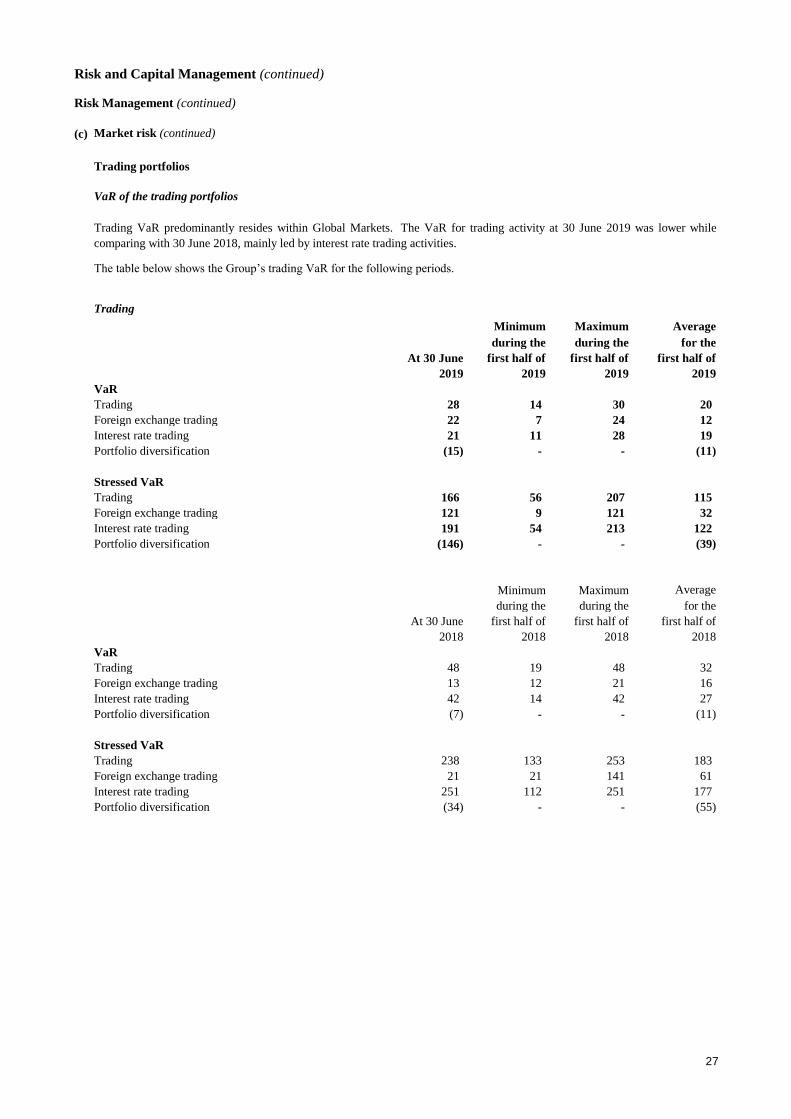
Risk and Capital Management (continued)
Risk Management (continued)
(c) Market risk (continued)
Trading portfolios
VaR of the trading portfolios
Trading
Minimum Maximum Average
during the during the for the
At 30 June first half of first half of first half of
2019 2019 2019 2019
VaR
Trading 28 14 30 20
Foreign exchange trading 22 7 24 12
Interest rate trading 21 11 28 19
Portfolio diversification (15) - - (11)
Stressed VaR
Trading 166 56 207 115
Foreign exchange trading 121 9 121 32
Interest rate trading 191 54 213 122
Portfolio diversification (146) - - (39)
Minimum Maximum Average
during the during the for the
At 30 June first half of first half of first half of
2018 2018 2018 2018
VaR
Trading 48 19 48 32
Foreign exchange trading 13 12 21 16
Interest rate trading 42 14 42 27
Portfolio diversification (7) - - (11)
Stressed VaR
Trading 238 133 253 183
Foreign exchange trading 21 21 141 61
Interest rate trading 251 112 251 177
Portfolio diversification (34) - - (55)
Trading VaR predominantly resides within Global Markets. The VaR for trading activity at 30 June 2019 was lower while
comparing with 30 June 2018, mainly led by interest rate trading activities.
The table below shows the Group’s trading VaR for the following periods.
27
Risk and Capital Management (continued)
Risk Management (continued)
(c) Market risk (continued)
Backtesting
Non-trading portfolios
Foreign exchange exposures
Equities exposures
Non-traded interest rate risk is the risk of an adverse impact to earnings or capital due to changes in market interest rates. The
risk arises from timing mismatches in the re-pricing of non-traded assets and liabilities and is the potential adverse impact of
changes in interest rates on earnings and capital.
While comparing the daily VaR measures to the actual and hypothetical profit and loss for the backtesting in the Group, one
loss side exception and one profit side exception were observed in the first half of 2019 for both of the actual and hypothetical
profit and loss at the Group consolidated level, which were due to exceptional market volatility.
In its management of the risk, the Group aims to mitigate the impact of future interest rate movements which could reduce
future net interest income, while balancing the cost of hedging activities to the current revenue stream. Monitoring the
sensitivity of projected net interest income under varying interest rate scenarios is a key part of this.
In order to manage structural interest rate risk, non-traded assets and liabilities are transferred to Balance Sheet Management
("BSM") based on their re-pricing and maturity characteristics. For assets and liabilities with no defined maturity or re-pricing
characteristics, behaviouralisation is used to assess the interest rate risk profile. BSM manages the banking book interest rate
positions transferred to it within the approved limits. The Asset, Liability and Capital Management Committee ("ALCO") is
responsible for monitoring and reviewing its overall structural interest rate risk position. Interest rate behaviouralisation policies
have to be formulated in line with the Group’s behaviouralisation policies and approved at least annually by ALCO.
The Group’s equities exposures in the first half of 2019 and for the year 2018 are mainly long-term equity investments which
are reported as "Financial investments". Equities held for trading purpose are included under "Trading assets" and subject to
trading limit and risk management control procedures and other market risk regime.
The Group’s foreign exchange exposures mainly comprise foreign exchange dealing by Global Markets and currency exposures
originated by its banking business. The latter are transferred to Global Markets where they are centrally managed within foreign
exchange position limits approved by the Group's Chief Risk Officer, noting the support of Risk Management Meeting. The net
options position is calculated on the basis of delta-weighted positions of all foreign exchange options contracts.
For details of the Group's non-structural and structural foreign currency positions, please refer to the Banking Disclosure
Statement that is available in the "Regulatory Disclosure" section of the Bank's website.
The Group’s structural foreign exchange exposures, monitored by using sensitivity analysis, represents the Group’s foreign
currency investments in subsidiaries, branches and associates, and the fair value of the Group’s long-term foreign currency
equity investments. The Group’s structural foreign exchange exposures are managed by the Group’s ALCO with the primary
objective of ensuring, where practical, that the Group’s and the Bank’s capital ratios are largely protected from the effect of
changes in exchange rates.
The Group’s foreign exchange exposures are prepared in accordance with the HKMA “Return of Foreign Currency Position -
(MA(BS)6)”.
28

Risk and Capital Management (continued)
Risk Management (continued)
(d) Insurance risk
(e) Operational risk
The Group’s Operational Risk Management Framework ("ORMF") is our overarching approach for managing operational risk. The
approach sets out the governance, appetite and provides a single view of non-financial risks that matter the most, and associated
controls. A centralised database is used to record the results of the operational risk management process. The delivery of the
framework provides us with a platform to further improve our operational risk management capability across the Group.
A summary of the Group's current policies and practices for the management of operational risk is set out in "Operational Risk"
section on pages 89 to 90 of the Group's Annual Report 2018.
Responsibility for minimising operational risk lies with the Group's management and staff. All staff are required to manage the
operational risks of the business and operational activities for which they are responsible.
The majority of the risk in the Group's insurance business derives from manufacturing activities and can be categorised as
financial risk and insurance risk. Financial risks include market risk, credit risk and liquidity risk. Insurance risk is the risk, other
than financial risk, of loss transferred from the holder of the insurance contract to the insurer.
There is no material change to the Group's policies and practices for the management of risk arising in our insurance operations. A
summary of the Group's policies and practices regarding the risk management of our insurance operations, insurance model and the
main insurance contracts we manufacture are provided on pages 81 to 88 of the Group's Annual Report 2018.
29

Risk and Capital Management (continued)
Capital Management
Capital Base
At 30 June At 31 December
2019 2018
Common Equity Tier 1 ("CET1") Capital
Shareholders' equity 138,263 133,990
- Shareholders' equity per Condensed Consolidated Balance Sheet 172,721 162,082
- Additional Tier 1 ("AT1") perpetual capital instruments (11,744) (6,981)
- Unconsolidated subsidiaries (22,714) (21,111)
Non-controlling interests - -
- Non-controlling interests per Condensed Consolidated Balance Sheet 117 25
- Non-controlling interests in unconsolidated subsidiaries (117) (25)
Regulatory deductions to CET1 capital (32,318) (32,266)
- Cash flow hedging reserve (34) 4
- Changes in own credit risk on fair valued liabilities (12) (12)
- Property revaluation reserves* (27,160) (26,543)
- Regulatory reserve (4,112) (4,982)
- Intangible assets (725) (463)
- Defined benefit pension fund assets (15) (11)
- Deferred tax assets net of deferred tax liabilities (113) (111)
- Valuation adjustments (147) (148)
Total CET1 Capital 105,945 101,724
AT1 Capital
Total AT1 capital before and after regulatory deductions 11,744 6,981
- Perpetual capital instruments 11,744 6,981
Total AT1 Capital 11,744 6,981
Total Tier 1 ("T1") Capital 117,689 108,705
Tier 2 ("T2") Capital
Total T2 capital before regulatory deductions 14,973 15,517
- Property revaluation reserves* 12,222 11,944
- Impairment allowances and regulatory reserve eligible
for inclusion in T2 capital 2,751 3,573
Regulatory deductions to T2 capital (915) (915)
- Significant capital investments in unconsolidated financial sector entities (915) (915)
Total T2 Capital 14,058 14,602
Total Capital 131,747 123,307
* Includes the revaluation surplus on investment properties which is reported as part of retained profits and related
adjustments made in accordance with the Banking (Capital) Rules issued by the HKMA.
The following tables show the capital base, risk-weighted assets and capital ratios as contained in the "Capital Adequacy Ratio"
return required to be submitted to the Hong Kong Monetary Authority ("HKMA") by the Bank on a consolidated basis that is
specified by the HKMA under the requirements of section 3C(1) of the Banking (Capital) Rules. The basis is different from that
for accounting purposes. Further information on the regulatory consolidation basis is set out in the Banking Disclosure Statement
that is available in the Regulatory Disclosures section of our website www.hangseng.com.
The Group uses the advanced internal ratings-based approach to calculate its credit risk for the majority of its non-securitisation
exposures. For market risk, the Group uses an internal models approach to calculate its general market risk for the risk categories
of interest rate and foreign exchange (including gold) exposures and the standardised (market risk) approach for calculating other
market risk positions. For operational risk, the Group uses the standardised (operational risk) approach to calculate its operational
risk.
The following table sets out the composition of the Group's capital base under Basel III at 30 June 2019 and 31 December 2018. A
more detailed breakdown of the capital position and a full reconciliation between the Group’s accounting and regulatory balance
sheets can be viewed in the Banking Disclosure Statement in the Regulatory Disclosures section of our website
www.hangseng.com.
We closely monitor and consider future regulatory change and continue to evaluate the impact upon our capital requirements of
regulatory developments. This includes the Basel III reforms package, over which there remains a significant degree of uncertainty
due to the number of national discretions within Basel's reforms. It remains premature to provide details of an impact although we
currently anticipate the potential for an increase in risk-weighted assets.
30

Risk and Capital Management (continued)
Capital Management (continued)
Risk-weighted assets by risk type
At 30 June At 31 December2019 2018
Credit risk 574,999 541,542 Market risk 8,522 11,020 Operational risk 63,546 59,323
Total 647,067 611,885
Capital ratios (as a percentage of risk-weighted assets)
The capital ratios on a consolidated basis calculated in accordance with the Banking (Capital) Rules are as follows:
At 30 June At 31 December2019 2018
CET1 capital ratio 16.4% 16.6%Tier 1 capital ratio 18.2% 17.8%Total capital ratio 20.4% 20.2%
Pro-forma Pro-formaAt 30 June At 31 December
2019 2018
CET1 capital ratio 16.0% 15.5%Tier 1 capital ratio 17.8% 16.6%Total capital ratio 20.0% 19.0%
Loss-absorbing capacity requirements
Dividend policy
Objective
Considerations
• financial results;
• level of distributable reserves;
• general business conditions and strategies;
• regulatory requirements;
• strategic business plan and capital plan;
• statutory and regulatory restrictions on dividend payment;
• any other factors the Board may deem relevant.
Phasing and Timing
In addition, the capital ratios of all tiers as of 30 June 2019 would be reduced by approximately 0.4 percentage point after the
prospective second interim dividend payment for 2019. The following table shows the pro-forma basis position of the capital
ratios after the prospective interim dividend.
Under normal circumstances and if the Board determines to declare a dividend at its discretion, dividends would be declared on a
quarterly basis. The phasing of dividends would be planned on a prudent basis to allow for any unforeseen events, which might
arise towards the end of an accounting period. Phasing of dividends would also take account of the volatility of the Bank's profits.
During the period, the HKMA has classified the Bank as a material subsidiary of HSBC's Asian resolution group and required the
Bank to comply with internal loss-absorbing capacity requirements under the Financial Institutions (Resolution) (Loss-absorbing
Capacity Requirements – Banking Sector) Rules, with phased implementation periods starting from 1 July 2019. To meet the
requirements, the Bank has cancelled and repaid the perpetual capital instrument of US$900m, issued new perpetual capital
instruments of US$1,500m and non-capital loss-absorbing capacity debt instruments totalling HK$19,503m to its immediate
holding company in the first half of 2019.
The Bank's medium to long term dividend objective is to maintain steady dividends in light of profitability, regulatory
requirements, growth opportunities and the operating environment. Its roadmap is designed to generate increasing shareholders'
value through strategic business growth. The Bank would balance solid yields with the longer-term reward of sustained share
price appreciation.
The declaration of dividends is made at the discretion of the Board, which will take into account all relevant factors including the
following:
31

CONDENSED CONSOLIDATED FINANCIAL STATEMENTSunaudited
(Expressed in millions of Hong Kong dollars)
Condensed Consolidated Income Statement Half-year Half-year
ended ended
30 June 30 June
2019 2018
note
Interest income 4 21,373 17,363
Interest expense 5 (5,520) (3,135)
Net interest income 15,853 14,228
Fee income 4,808 5,247
Fee expense (1,323) (1,258)
Net fee income 6 3,485 3,989
Net income from financial instruments measured at fair value 7 2,035 995
Gains less losses from financial investments 8 1 24
Dividend income 9 136 6
Net insurance premium income 9,224 8,732
Other operating income 10 3,066 1,621
Total operating income 33,800 29,595
Net insurance claims and benefits paid and
movement in liabilities to policyholders (11,391) (8,946)
Net operating income before change in expected
credit losses and other credit impairment charges 22,409 20,649
Change in expected credit losses and
other credit impairment charges 11 (510) (238)
Net operating income 21,899 20,411
Employee compensation and benefits (3,118) (2,866)
General and administrative expenses (2,173) (2,133)
Depreciation expenses (967) (668)
Amortisation of intangible assets (70) (55)
Operating expenses 12 (6,328) (5,722)
Impairment loss on intangible assets (10) (27)
Operating profit 15,561 14,662
Net surplus on property revaluation 187 78
Share of profits of associates 146 124
Profit before tax 15,894 14,864
Tax expense 13 (2,248) (2,227)
Profit for the period 13,646 12,637
Attributable to:
Shareholders of the company 13,656 12,647
Non-controlling interests (10) (10)
(Figures in HK$)
Earnings per share - basic and diluted 14 6.98 6.62
Details of dividends payable to shareholders of the Bank attributable to the profit for the half year are set out in note 15.
The notes on pages 39 to 63 form part of these Condensed Consolidated Financial Statements.
32
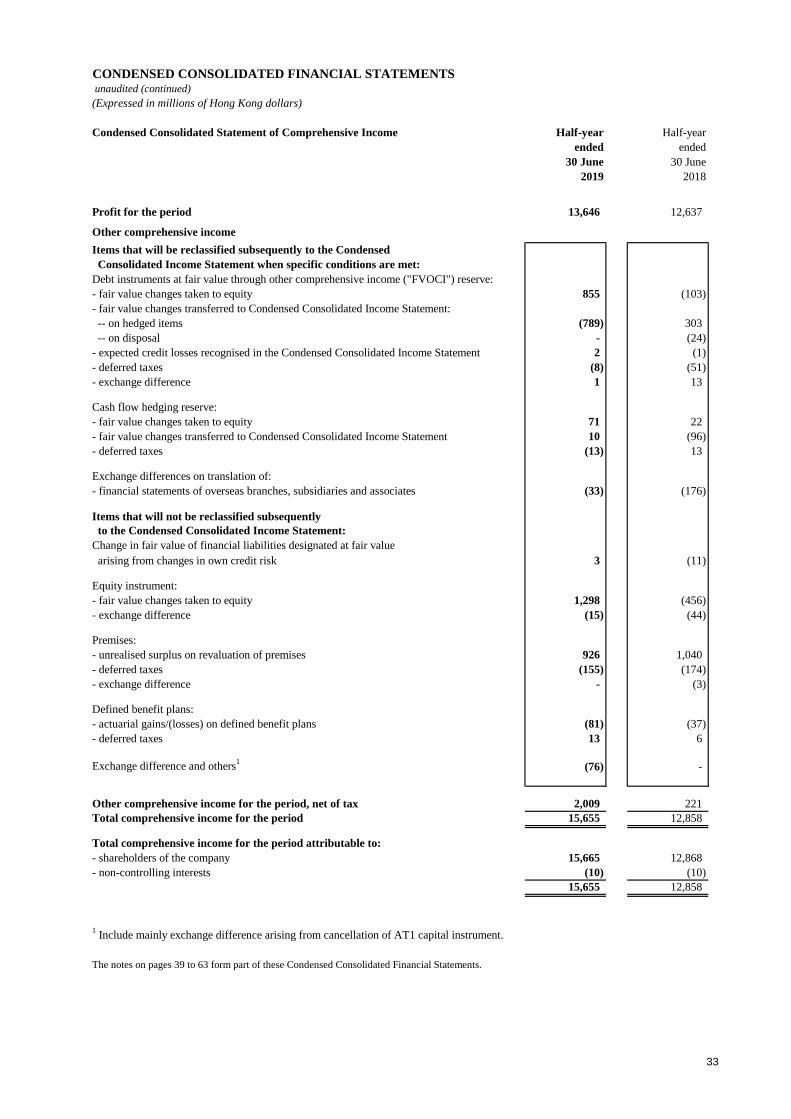
CONDENSED CONSOLIDATED FINANCIAL STATEMENTS unaudited (continued)
(Expressed in millions of Hong Kong dollars)
Condensed Consolidated Statement of Comprehensive Income Half-year Half-year
ended ended
30 June 30 June
2019 2018
Profit for the period 13,646 12,637
Other comprehensive income
Items that will be reclassified subsequently to the Condensed
Consolidated Income Statement when specific conditions are met:
Debt instruments at fair value through other comprehensive income ("FVOCI") reserve:
- fair value changes taken to equity 855 (103)
- fair value changes transferred to Condensed Consolidated Income Statement:
-- on hedged items (789) 303
-- on disposal - (24)
- expected credit losses recognised in the Condensed Consolidated Income Statement 2 (1)
- deferred taxes (8) (51)
- exchange difference 1 13
Cash flow hedging reserve:
- fair value changes taken to equity 71 22
- fair value changes transferred to Condensed Consolidated Income Statement 10 (96)
- deferred taxes (13) 13
Exchange differences on translation of:
- financial statements of overseas branches, subsidiaries and associates (33) (176)
Items that will not be reclassified subsequently
to the Condensed Consolidated Income Statement:
Change in fair value of financial liabilities designated at fair value
arising from changes in own credit risk 3 (11)
Equity instrument:
- fair value changes taken to equity 1,298 (456)
- exchange difference (15) (44)
Premises:
- unrealised surplus on revaluation of premises 926 1,040
- deferred taxes (155) (174)
- exchange difference - (3)
Defined benefit plans:
- actuarial gains/(losses) on defined benefit plans (81) (37)
- deferred taxes 13 6
Exchange difference and others1
(76) -
Other comprehensive income for the period, net of tax 2,009 221
Total comprehensive income for the period 15,655 12,858
Total comprehensive income for the period attributable to:
- shareholders of the company 15,665 12,868
- non-controlling interests (10) (10)
15,655 12,858
1 Include mainly exchange difference arising from cancellation of AT1 capital instrument.
The notes on pages 39 to 63 form part of these Condensed Consolidated Financial Statements.
33
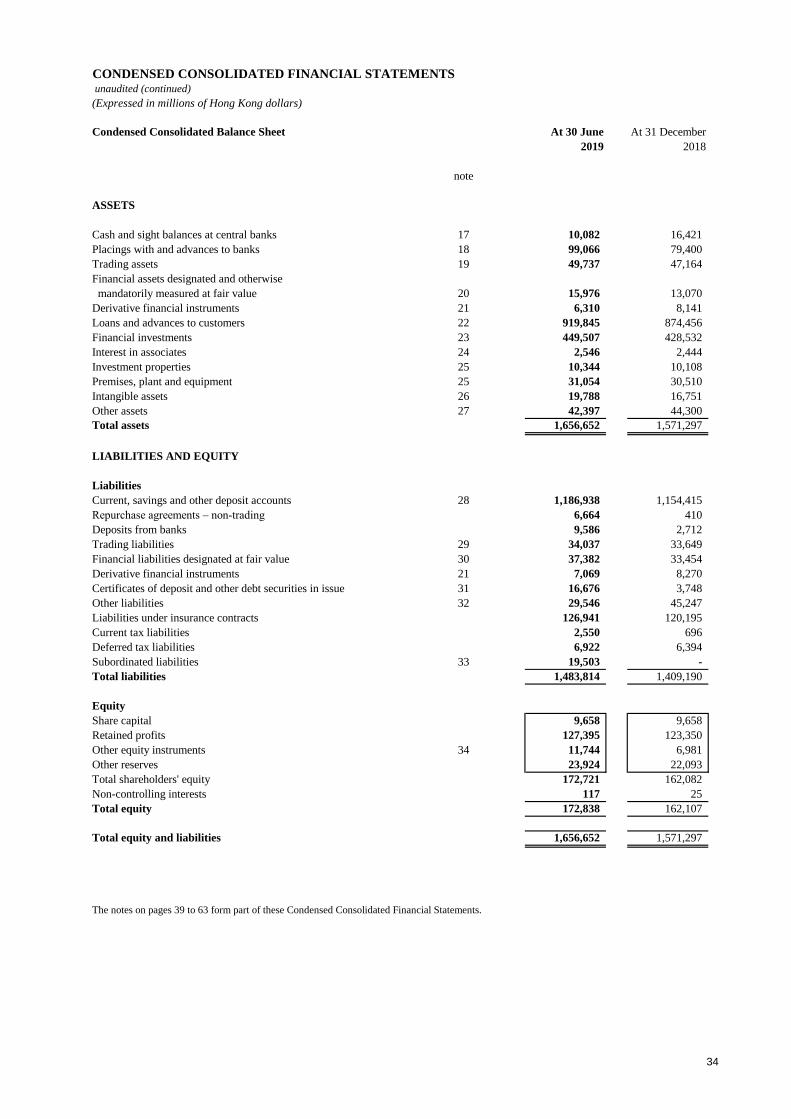
CONDENSED CONSOLIDATED FINANCIAL STATEMENTS unaudited (continued)
(Expressed in millions of Hong Kong dollars)
Condensed Consolidated Balance Sheet At 30 June At 31 December
2019 2018
note
ASSETS
Cash and sight balances at central banks 17 10,082 16,421
Placings with and advances to banks 18 99,066 79,400
Trading assets 19 49,737 47,164
Financial assets designated and otherwise
mandatorily measured at fair value 20 15,976 13,070
Derivative financial instruments 21 6,310 8,141
Loans and advances to customers 22 919,845 874,456
Financial investments 23 449,507 428,532
Interest in associates 24 2,546 2,444
Investment properties 25 10,344 10,108
Premises, plant and equipment 25 31,054 30,510
Intangible assets 26 19,788 16,751
Other assets 27 42,397 44,300
Total assets 1,656,652 1,571,297
LIABILITIES AND EQUITY
Liabilities
Current, savings and other deposit accounts 28 1,186,938 1,154,415
Repurchase agreements – non-trading 6,664 410
Deposits from banks 9,586 2,712
Trading liabilities 29 34,037 33,649
Financial liabilities designated at fair value 30 37,382 33,454
Derivative financial instruments 21 7,069 8,270
Certificates of deposit and other debt securities in issue 31 16,676 3,748
Other liabilities 32 29,546 45,247
Liabilities under insurance contracts 126,941 120,195
Current tax liabilities 2,550 696
Deferred tax liabilities 6,922 6,394
Subordinated liabilities 33 19,503 -
Total liabilities 1,483,814 1,409,190
Equity
Share capital 9,658 9,658
Retained profits 127,395 123,350
Other equity instruments 34 11,744 6,981
Other reserves 23,924 22,093
Total shareholders' equity 172,721 162,082
Non-controlling interests 117 25
Total equity 172,838 162,107
Total equity and liabilities 1,656,652 1,571,297
The notes on pages 39 to 63 form part of these Condensed Consolidated Financial Statements.
34

CONDENSED CONSOLIDATED FINANCIAL STATEMENTS unaudited (continued)
(Expressed in millions of Hong Kong dollars)
Condensed Consolidated Statement of Changes in Equity
Financial
Other Premises assets at Cash flow Foreign Total Non-
Share equity Retained revaluation FVOCI hedge exchange shareholders' controlling Total
capital instruments2
profits3
reserve reserve reserve reserve Others1 equity interests equity
At 1 January 2019 9,658 6,981 123,350 19,822 1,570 (11) 42 670 162,082 25 162,107
Profit for the period - - 13,656 - - - - - 13,656 (10) 13,646
Other comprehensive income (net of tax) - - (144) 771 1,344 68 (33) 3 2,009 - 2,009
Debt instruments at fair value through
other comprehensive income - - - - 61 - - - 61 - 61
Equity instruments at fair value through
other comprehensive income - - - - 1,283 - - - 1,283 - 1,283
Cash flow hedges - - - - - 68 - - 68 - 68
Change in fair value of financial liabilities designated
at fair value arising from changes in own credit risk - - - - - - - 3 3 - 3
Property revaluation - - - 771 - - - - 771 - 771
Actuarial losses on defined benefit plans - - (68) - - - - - (68) - (68)
Exchange differences and others4
- - (76) - - - (33) - (109) - (109) -
Total comprehensive income for the period - - 13,512 771 1,344 68 (33) 3 15,665 (10) 15,655
Cancellation and repayment of AT1 capital instrument - (6,981) - - - - - - (6,981) - (6,981)
Issue of new AT1 capital instruments - 11,744 - - - - - - 11,744 - 11,744
Dividends paid5
- - (9,560) - - - - - (9,560) - (9,560)
Coupon paid to holder of AT1 capital instrument - - (232) - - - - - (232) - (232)
Movement in respect of share-based payment arrangements - - - - - - - 3 3 - 3
Others - - - - - - - - - 102 102
Transfers - - 325 (325) - - - - - - -
At 30 June 2019 9,658 11,744 127,395 20,268 2,914 57 9 676 172,721 117 172,838
1
2
3
4
5
6
The notes on pages 39 to 63 form part of these Condensed Consolidated Financial Statements.
Include mainly exchange difference arising from cancellation of AT1 capital instrument.
Dividend paid in the first half of 2019 represented the payment of fourth interim dividend of 2018 and the first interim dividend of 2019 amounted to HK$6,883m and HK$2,677m respectively.
Other reserves
Other reserves comprise share-based payment reserve and own credit reserve. The share-based payment reserve is used to record the corresponding amount of share options granted by ultimate holding company to the Group’s employees and other
cost of share-based payment arrangement. The own credit reserve is for the change in fair value of financial liabilities designated at fair value upon initial recognition arising from changes in own credit risk.
In the first half of 2019, the Bank has cancelled and repaid the AT1 capital instrument of US$900m and issued new AT1 capital instruments of US$1,500m.
To satisfy the provisions of the Hong Kong Banking Ordinance and local regulatory requirements for prudential supervision purposes, the Group has earmarked a "regulatory reserve" directly from retained profits. As at 30 June 2019, the effect of
this requirement is to restrict the amount of reserves which can be distributed by the Group to shareholders by HK$4,112m (31 December 2018: HK$4,982m).
There was no purchase, sale or redemption by the Bank, or any of its subsidiaries, of the Bank’s listed securities during the first half of 2019.
35

CONDENSED CONSOLIDATED FINANCIAL STATEMENTS unaudited (continued)
(Expressed in millions of Hong Kong dollars)
Condensed Consolidated Statement of Changes in Equity (continued)
Financial
Other Premises assets at Cash flow Foreign Total Non-
Share equity Retained revaluation FVOCI hedge exchange shareholders' controlling Total
capital instruments profits reserve reserve reserve reserve Others1 equity interests equity
At 1 January 2018 9,658 6,981 112,870 18,379 2,038 (99) 706 643 151,176 49 151,225
Profit for the period - - 12,647 - - - - - 12,647 (10) 12,637
Other comprehensive income (net of tax) - - (31) 863 (363) (61) (176) (11) 221 - 221
Debt instruments at fair value through
other comprehensive income - - - - 137 - - - 137 - 137
Equity instruments at fair value through
other comprehensive income - - - - (500) - - - (500) - (500)
Cash flow hedges - - - - - (61) - - (61) - (61)
Change in fair value of financial liabilities designated
at fair value arising from changes in own credit risk - - - - - - - (11) (11) - (11)
Property revaluation - - - 863 - - - - 863 - 863
Actuarial losses on defined benefit plans - - (31) - - - - - (31) - (31)
Exchange differences and others - - - - - - (176) - (176) - (176) - -
Total comprehensive income for the period - - 12,616 863 (363) (61) (176) (11) 12,868 (10) 12,858
Dividends paid - - (8,412) - - - - - (8,412) - (8,412)
Coupon paid to holder of AT1 capital instrument - - - - - - - - - - -
Movement in respect of share-based payment arrangements - - (3) - - - - 6 3 - 3
Others - - - - - - - - - - -
Transfers - - 289 (289) - - - - - - -
At 30 June 2018 9,658 6,981 117,360 18,953 1,675 (160) 530 638 155,635 39 155,674
At 1 July 2018 9,658 6,981 117,360 18,953 1,675 (160) 530 638 155,635 39 155,674
Profit for the period - - 11,564 - - - - - 11,564 (13) 11,551
Other comprehensive income (net of tax) - - (556) 1,172 (105) 149 (488) 7 179 - 179
Debt instruments at fair value through
other comprehensive income - - - - 120 - - - 120 - 120
Equity instruments at fair value through
other comprehensive income - - - - (225) - - - (225) - (225)
Cash flow hedges - - - - - 149 - - 149 - 149
Change in fair value of financial liabilities designated
at fair value arising from changes in own credit risk - - - - - - - 7 7 - 7
Property revaluation - - - 1,172 - - - - 1,172 - 1,172
Actuarial losses on defined benefit plans - - (556) - - - - - (556) - (556)
Exchange differences and others - - - - - - (488) - (488) - (488)
Total comprehensive income for the period - - 11,008 1,172 (105) 149 (488) 7 11,743 (13) 11,730
Dividends paid - - (4,970) - - - - - (4,970) - (4,970)
Coupon paid to holder of AT1 capital instrument - - (418) - - - - - (418) - (418)
Movement in respect of share-based payment arrangements - - (2) - - - - 25 23 - 23
Others - - 69 - - - - - 69 (1) 68
Transfers - - 303 (303) - - - - - - -
At 31 December 2018 9,658 6,981 123,350 19,822 1,570 (11) 42 670 162,082 25 162,107
The notes on pages 39 to 63 form part of these Condensed Consolidated Financial Statements.
Other reserves
36

CONDENSED CONSOLIDATED FINANCIAL STATEMENTS unaudited (continued)
(Expressed in millions of Hong Kong dollars)
Condensed Consolidated Cash Flow Statement Half-year Half-year
ended ended
30 June 30 June
2019 2018
Profit before tax 15,894 14,864
Adjustments for non-cash items:
Depreciation expenses 967 668
Amortisation of intangible assets 70 55
Net interest income (15,853) (14,228)
Dividend income (136) (6)
Gains less losses from financial investments (1) (24)
Share of profits in associates (146) (124)
Net surplus on property revaluation (187) (78)
Change in expected credit losses and other credit impairment charges 510 238
Impairment loss on intangible assets 10 27
Loans and advances written off net of recoveries (256) (365)
Movement in present value of in-force long-term insurance business ("PVIF") (2,744) (1,379)
Interest received 18,267 14,550
Interest paid (5,054) (2,852)
Elimination of exchange differences and other non-cash items (2,341) (657)
Changes in operating assets and liabilities
Change in financial assets designated at fair value (2,906) (3,150)
Change in trading assets (2,404) 693
Change in derivative financial instruments 630 4
Change in reverse repurchase agreements - non-trading - (3,172)
Change in placings with and advances to banks maturing after one month (13,780) 5,229
Change in loans and advances to customers (46,687) (49,335)
Change in other assets 2,046 (7,840)
Change in current, savings and other deposit accounts 32,523 41,940
Change in deposits from banks 6,874 1,876
Change in repurchase agreements - non-trading 6,254 3,407
Change in certificates of deposit and other debt securities in issue 12,928 (600)
Change in financial liabilities designated at fair value 3,928 45,002
Change in trading liabilities 388 (46,349)
Change in liabilities under insurance contracts 6,746 3,186
Change in other liabilities (14,401) 4,013
Interest received from financial investments 3,046 2,800
Dividends received from financial investments 138 15
Tax paid (20) (9)
Net cash from operating activities 4,303 8,399
Purchase of financial investments (353,735) (285,382)
Proceeds from sale or redemption of financial investments 314,018 273,163
Repayment of shareholders' loan from an associated company - 74
Purchase of property, plant and equipment and intangible assets (excluding PVIF) (696) (647)
Net cash inflow from the sales of loan portfolio 1,066 798
Net cash from investing activities (39,347) (11,994)
Principal and interest elements of lease payments (266) -
Dividends paid (9,560) (8,412)
Coupon paid to holder of AT1 capital instrument (232) -
Cancellation and repayment of AT1 capital instrument (7,058) -
Proceeds from issuance of new AT1 capital instruments 11,744 -
Proceeds from issuance of subordinated liabilities 19,503 -
Net cash from financing activities 14,131 (8,412)
Net decrease in cash and cash equivalents (20,913) (12,007)
Cash and cash equivalents at 1 January 108,844 110,673
Exchange differences in respect of cash and cash equivalents 103 (357)
Cash and cash equivalents at 30 June 88,034 98,309
The notes on pages 39 to 63 form part of these Condensed Consolidated Financial Statements.
37
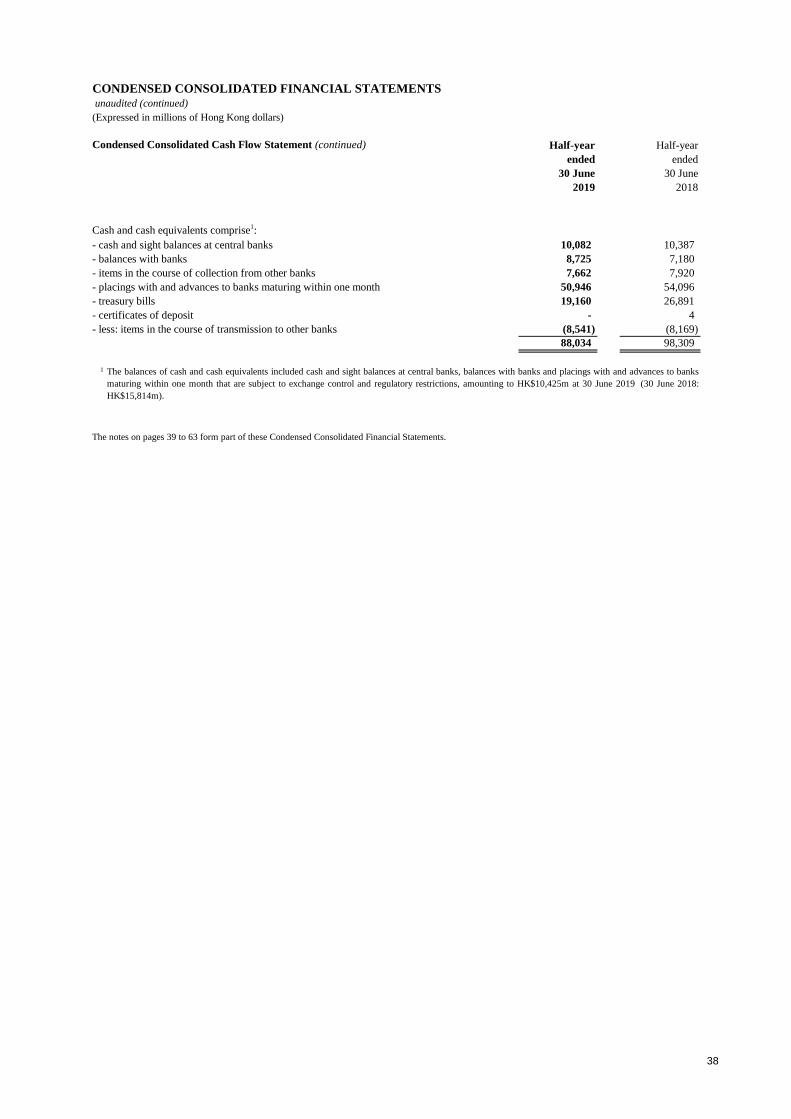
CONDENSED CONSOLIDATED FINANCIAL STATEMENTS unaudited (continued)
(Expressed in millions of Hong Kong dollars)
Condensed Consolidated Cash Flow Statement (continued) Half-year Half-year
ended ended
30 June 30 June
2019 2018
Cash and cash equivalents comprise1:
- cash and sight balances at central banks 10,082 10,387
- balances with banks 8,725 7,180
- items in the course of collection from other banks 7,662 7,920
- placings with and advances to banks maturing within one month 50,946 54,096
- treasury bills 19,160 26,891
- certificates of deposit - 4
- less: items in the course of transmission to other banks (8,541) (8,169)
88,034 98,309
1
The notes on pages 39 to 63 form part of these Condensed Consolidated Financial Statements.
The balances of cash and cash equivalents included cash and sight balances at central banks, balances with banks and placings with and advances to banks
maturing within one month that are subject to exchange control and regulatory restrictions, amounting to HK$10,425m at 30 June 2019 (30 June 2018:
HK$15,814m).
38

39
NOTES ON THE CONDENSED CONSOLIDATED FINANCIAL STATEMENTS (unaudited)
(Figures expressed in millions of Hong Kong dollars unless otherwise indicated)
1 Basis of preparation
The Condensed Consolidated Financial Statements of Hang Seng Bank Limited (“the Bank”) and all its
subsidiaries (“the Group”) have been prepared in accordance with the applicable disclosure provisions
of the Rules Governing the Listing of Securities on The Stock Exchange of Hong Kong Limited and in
compliance with Hong Kong Accounting Standard (“HKAS”) 34, Interim Financial Reporting, issued
by the Hong Kong Institute of Certified Public Accountants (“HKICPA”). The Condensed Consolidated
Financial Statements were reviewed by the Audit Committee. The Board of Directors of the Bank has
approved the Condensed Consolidated Financial Statements on 5 August 2019.
The Condensed Consolidated Financial Statements should be read in conjunction with the consolidated
financial statements for the year ended 31 December 2018, which have been prepared in accordance
with Hong Kong Financial Reporting Standard (“HKFRS”).
The preparation of the Condensed Consolidated Financial Statements in conformity with HKAS 34
requires management to make judgements, estimates and assumptions that affect the application of
policies and reported amounts of assets and liabilities, income and expenses on a year to date basis.
Actual results may differ from these estimates. In preparing the Condensed Consolidated Financial
Statements, the significant judgements made by management in applying the Group’s accounting
policies and the key sources of estimation uncertainty were the same as those that applied to the
consolidated financial statements for the year ended 31 December 2018.
The following disclosures in the Risk and Capital Management sections form an integral part of the
Condensed Consolidated Financial Statements:
- Reconciliation of gross exposure and allowances/provision for loans and advances to banks and
customers including loan commitments and financial guarantees; and
- Distribution of financial instruments to which the impairment requirements in HKFRS 9 are applied,
by credit quality and stage allocation
In accordance with the Group’s policy to provide disclosures that help stakeholders to understand the
Group’s performance, financial position and changes thereto, the information provided in the Notes on
the Condensed Consolidated Financial Statements and the risk disclosures in the Risk and Capital
Management sections goes beyond the minimum levels required by accounting standards, statutory and
regulatory requirements.
The Condensed Consolidated Financial Statements are unaudited, but has been reviewed by
PricewaterhouseCoopers (“PwC”) in accordance with Hong Kong Standard on Review Engagements
2410, Review of Interim Financial Information Performed by the Independent Auditor of the Entity,
issued by HKICPA. PwC’s independent review report to the Board of Directors is included on page 64.
2 Accounting policies
Except as described below, the accounting policies applied in preparing this Condensed Consolidated
Financial Statements are the same as those applied in preparing the consolidated financial statements
for the year ended 31 December 2018, as disclosed in the Annual Report for 2018.

40
NOTES ON THE CONDENSED CONSOLIDATED FINANCIAL STATEMENTS
(unaudited)(continued)
2 Accounting policies (continued)
Standards applied during the half-year ended 30 June 2019
HKFRS 16 “Leases”
On 1 January 2019, the Group adopted the requirements of HKFRS 16 and recognised lease liabilities
in relation to leases which had previously been classified as “operating leases” in accordance with
HKAS 17 “Leases”. These liabilities were measured at the present value of the remaining lease
payments, discounted at the lessee’s incremental borrowing rate as at 1 January 2019. The associated
right of use (“ROU”) assets were measured at the amount equal to the lease liability, adjusted by the
amount of any prepaid or accrued lease payments recognised on balance sheet at 31 December 2018. In
addition, the practical expedients permitted by the standard was applied where operating leases with a
remaining lease term of less than 12 months as at 1 January 2019 were treated as short-term leases.
The differences between HKAS 17 and HKFRS 16 are summarised in the table below:
HKAS 17 HKFRS 16
Leases were classified as either finance or
operating leases. Payments made under operating
leases were charged to profit or loss on a straight-
line basis over the period of the lease.
Leases are recognised as a ROU asset and a
corresponding liability at the date at which the
leased asset is made available for use. Lease
payments are allocated between the liability and
finance cost. The finance cost is charged to profit
or loss over the lease term so as to produce a
constant period rate of interest on the remaining
balance of the liability. The ROU asset is
depreciated over the shorter of the ROU asset’s
useful economic life and the lease
term on a straight-line basis.
In determining lease term, the Group considers
all facts and circumstances that create an
economic incentive to exercise an extension
option or not exercise a termination option over
the planning horizon of five years.
In general, it is not expected that the discount rate
implicit in the lease is available so the lessee’s
incremental borrowing rate is used. This is the
rate that the lessee would have to pay to borrow
the funds necessary to obtain an asset of a similar
value in a similar economic environment with
similar terms and conditions. The rates are
determined for each economic environment in
which the Group operates by adjusting swap rates
with funding spreads (OCS) and cross currency
basis where appropriate.
41
NOTES ON THE CONDENSED CONSOLIDATED FINANCIAL STATEMENTS
(unaudited)(continued)
2 Accounting policies (continued)
The Group adopted the requirements of HKFRS 16 retrospectively, with the cumulative effect of
initially applying the standard recognised as an adjustment to the opening balance of retained earnings
at that date. Comparatives were not restated. In relation to the operating lease that were under HKAS17
“Leases”, the adoption of the standard increased assets by HK$1.4bn and increased financial liabilities
by the same amount with no effect on net assets or retained earnings.
Amendment to HKAS 12 “Income Taxes”
An amendment to HKAS 12 was issued in February 2018 as part of the Annual Improvement Cycle.
The amendment clarifies that an entity should recognise the tax consequences of dividends where the
transactions or events that generated the distributable profits are recognised. This amendment was
applied on 1 January 2019 to the income tax consequences of distributions recognised on or after the
beginning of the earliest comparative period. As a consequence, income tax related to distributions on
perpetual subordinated loans will be presented in profit or loss rather than equity. As a result of its
application, the impact on profit after tax in the six months to 30 June 2019 was immaterial (six months
to 30 June 2018: nil) with no effect on equity.
Future accounting developments
HKFRS 17 “Insurance contracts” was issued in January 2018 and sets out the requirements that an
entity should apply in accounting for insurance contracts it issues and reinsurance contracts it holds.
HKFRS 17 is effective from 1 January 2021. However, HKICPA is considering delaying the mandatory
implementation date by one year and may make additional changes to the standard. The Group is in
the process of implementing HKFRS 17. Industry practice and interpretation of the standard is still
developing and there may be changes to implementation decisions as practice evolves, therefore the
likely impact of its implementation remains uncertain.

NOTES ON THE CONDENSED CONSOLIDATED FINANCIAL STATEMENTS (unaudited) (continued)
3 Basis of consolidation
4 Interest income
Half-year Half-year
ended ended
30 June 30 June
2019 2018
Interest income arising from:
- financial assets that are not at fair value through profit and loss 20,912 16,967
- trading assets 436 373
- financial assets designated and otherwise mandatorily measured at fair value 25 23
21,373 17,363
of which:
- interest income from impaired financial assets 18 28
5 Interest expense
Half-year Half-year
ended ended
30 June 30 June
2019 2018
Interest expense arising from:
- financial liabilities that are not at fair value through profit and loss 4,470 1,874
- trading liabilities 308 283
- financial liabilities designated at fair value 742 978
5,520 3,135
of which:
- interest expense from debt securities in issue maturing after five years - -
- interest expense from customer accounts maturing after five years - -
- interest expense from subordinated liabilities 47 -
These Condensed Consolidated Financial Statements cover the consolidated position of the Group, unless otherwise stated, and include the
attributable share of the results and reserves of its associates. For regulatory reporting, the basis of consolidation is different from the basis
of consolidation for accounting purposes. They are disclosed under the “Risk and Capital Management” section.
42

NOTES ON THE CONDENSED CONSOLIDATED FINANCIAL STATEMENTS (unaudited) (continued)
6 Net fee income
Half-year Half-year
ended ended
30 June 30 June
2019 2018
- securities broking and related services 718 1,049
- retail investment funds 816 1,070
- insurance 336 310
- account services 252 255
- remittances 262 307
- cards 1,520 1,468
- credit facilities 448 364
- trade services 232 223
- other 224 201
Fee income 4,808 5,247
Fee expense (1,323) (1,258)
3,485 3,989
of which:
Net fee income, other than amounts included in determining the
effective interest rate, arising from financial assets or financial
liabilities that are not held for trading nor designated at fair value 1,259 1,177
- fee income 2,463 2,319
- fee expense (1,204) (1,142)
Net fee income on trust and other fiduciary activities where the
Group holds or invests on behalf of its customers 413 497
- fee income 446 526
- fee expense (33) (29)
7 Net income from financial instruments measured at fair value
Half-year Half-year
ended ended
30 June 30 June
2019 2018
Net trading income 936 709
- trading income 935 701
- other trading income - hedging ineffectiveness
- on cash flow hedges - -
- on fair value hedges 1 8
Net income from financial instruments designated at fair value 36 431
Net income/(expense) from assets and liabilities of insurance businesses measured at fair value 1,064 (145)
- financial assets held to meet liabilities under insurance and investment contracts 1,082 (138)
- liabilities to customers under investment contracts (18) (7)
Changes in fair value of other financial instruments mandatorily measured at fair value (1) -
2,035 995
43

NOTES ON THE CONDENSED CONSOLIDATED FINANCIAL STATEMENTS (unaudited) (continued)
8 Gains less losses from financial investments
Half-year Half-year
ended ended
30 June 30 June
2019 2018
1 -
Net gains from disposal of debt securities measured at fair value through other comprehensive income - 24
1 24
9 Dividend income
Half-year Half-year
ended ended
30 June 30 June
2019 2018
Dividend income:
- listed investments 130 -
- unlisted investments 6 6
136 6
10 Other operating income
Half-year Half-year
ended ended
30 June 30 June
2019 2018
Rental income from investment properties 172 166
Movement in present value of in-force long-term insurance business 2,744 1,379
Net losses from disposal of fixed assets (3) (3)
Net losses from the derecognition of loans and advances to
customers measured at amortised cost (2) (2)
Others 155 81
3,066 1,621
11 Change in expected credit losses and other credit impairment charges
Half-year Half-year
ended ended
30 June 30 June
2019 2018
Loans and advances to banks and customers 491 251
- new allowances net of allowance releases 543 323
- recoveries of amounts previously written off (58) (72)
- other movements 6 -
Loan commitments and guarantees 12 (8)
Other financial assets 7 (5)
510 238
Net gains from disposal of debt securities measured at amortised cost
44

NOTES ON THE CONDENSED CONSOLIDATED FINANCIAL STATEMENTS (unaudited) (continued)
12 Operating expenses
Half-year Half-year
ended ended
30 June 30 June
2019 2018
Employee compensation and benefits:
- salaries and other costs 2,876 2,656
- retirement benefit costs
- defined benefit scheme 97 85
- defined contribution scheme 145 125
3,118 2,866
General and administrative expenses:
- rental expenses 59 304
- other premises and equipment 758 536
- marketing and advertising expenses 184 241
- other operating expenses 1,172 1,052
2,173 2,133
Depreciation of premises, plant and equipment (note 25) 716 668
Depreciation of right-of-use assets 251 N/A
Amortisation of intangible assets 70 55
6,328 5,722
13 Tax expense
Taxation in the Condensed Consolidated Income Statement represents:
Half-year Half-year
ended ended
30 June 30 June
2019 2018
Current tax - provision for Hong Kong profits tax
Tax for the period 1,856 1,988
Current tax - taxation outside Hong Kong
Tax for the period 29 19
Deferred tax
Origination and reversal of temporary differences 363 220
Total tax expense 2,248 2,227
14 Earnings per share - basic and diluted
The current tax provision is based on the estimated assessable profit for the first half of 2019, and is determined for the Bank and its
subsidiaries operating in the Hong Kong SAR by using the Hong Kong profits tax rate of 16.5 per cent (2018: 16.5 per cent). For
subsidiaries and branches operating in other jurisdictions, the appropriate tax rates prevailing in the relevant countries are used. Deferred
tax is calculated at the tax rates that are expected to apply in the period when the liability is settled or the asset is realised.
The calculation of basic and diluted earnings per share for the first half of 2019 is based on earnings of HK$13,347m (HK$12,647m for the
first half of 2018), adjusted for the AT1 capital instrument related deductions and on the weighted average number of ordinary shares in
issue of 1,911,842,736 shares (unchanged from the first half of 2018).
45

NOTES ON THE CONDENSED CONSOLIDATED FINANCIAL STATEMENTS (unaudited) (continued)
15 Dividends/Distribution
(a) Dividends to ordinary shareholders
Half-year Half-year
ended ended
30 June 2019 30 June 2018
per share per share
HK$ HK$m HK$ HK$m
First interim 1.40 2,677 1.30 2,485
Second interim 1.40 2,677 1.30 2,485
2.80 5,354 2.60 4,970
(b) Distribution to holder of AT1 capital instrument classified as equity
Half-year Half-year
ended ended
30 June 2019 30 June 2018
Coupon paid on AT1 capital instrument 232 -
16 Segmental analysis
-
-
-
-
On 5 August 2019, the Directors of the Bank declared a second interim dividend in respect of the year ending 31 December 2019 of
HK$1.40 per ordinary share (HK$2,677m). This distribution will be paid on 5 September 2019. No Liability is recognised in the
Condensed Consolidated Financial Statements in respect of this dividend.
Coupon of HK$232m was paid in the first half of 2019 upon the cancellation and repayment of the US$900m AT1 capital instrument.
Coupon of HK$418m on the aforesaid AT1 capital instrument for full year 2018 was paid in the second half of 2018.
For the purpose of segmental analysis, the allocation of revenue reflects the benefits of capital and other funding resources allocated to the
business segments by way of internal capital allocation and fund transfer-pricing mechanisms. Cost of central support services and
functions are allocated to business segments based on cost drivers which reflect or correlate with the use of services. Bank-owned premises
are reported under the "Other" segment. When these premises are utilised by business segments, notional rent will be charged to the
relevant business segments with reference to market rates.
Hong Kong Financial Reporting Standard 8 ("HKFRS 8") requires segmental disclosure to be based on the way that the Group’s chief
operating decision maker regards and manages the Group, with the amounts reported for each reportable segment being the measures
reported to the Group’s chief operating decision maker for the purpose of assessing segmental performance and making decisions about
operating matters. To align with the internal reporting information, the Group has presented the following four reportable segments.
(a) Segmental result
Retail Banking and Wealth Management offers a broad range of products and services to meet the personal banking, consumer
lending and wealth management needs of individual customers. Personal banking products typically include current and savings
accounts, time deposits, mortgages and personal loans, credit cards, insurance and wealth management;
Commercial Banking offers a comprehensive suite of products and services to corporate, commercial and small and medium-sized
enterprises ("SME") customers – including corporate lending, trade and receivable finance, payments and cash management, treasury
and foreign exchange, general insurance, key-person insurance, investment services and corporate wealth management;
Global Banking and Markets provides tailored financial solutions to major corporate and institutional clients. Undertaking a long-
term relationships management approach, its services include general banking, corporate lending, interest rates, foreign exchange,
money markets, structured products and derivatives, etc. Global Banking and Markets also manages the funding and liquidity positions
of the Bank and other market risk positions arising from banking activities;
Other mainly represents the Bank’s holdings of premises, investment properties, equity shares and subordinated debt funding as well
as central support and functional costs with associated recoveries.
46

NOTES ON THE CONDENSED CONSOLIDATED FINANCIAL STATEMENTS (unaudited) (continued)
16 Segmental analysis (continued)
(a) Segmental result (continued)
Retail
Banking Global
and Wealth Commercial Banking
Management Banking and Markets Other Total
Half-year ended 30 June 2019
Net interest income/(expense) 8,644 5,195 2,256 (242) 15,853
Net fee income 2,076 1,095 185 129 3,485
Net income/(loss) from financial instruments
measured at fair value 1,272 216 580 (33) 2,035
Gains less losses from financial investments 1 - - - 1
Dividend income - - - 136 136
Net insurance premium income 7,953 1,271 - - 9,224
Other operating income/(loss) 2,869 57 (1) 141 3,066
Total operating income 22,815 7,834 3,020 131 33,800
Net insurance claims and benefits paid
and movement in liabilities to policyholders (10,304) (1,087) - - (11,391)
Net operating income before
change in expected credit losses
and other credit impairment charges 12,511 6,747 3,020 131 22,409
Change in expected credit losses and
other credit impairment charges (315) (156) (39) - (510)
Net operating income 12,196 6,591 2,981 131 21,899
Operating expenses * (3,947) (1,627) (555) (199) (6,328)
Impairment loss on intangible assets - - - (10) (10)
Operating profit/(loss) 8,249 4,964 2,426 (78) 15,561
Net surplus on property revaluation - - - 187 187
Share of profits/(losses) of associates 147 - - (1) 146
Profit before tax 8,396 4,964 2,426 108 15,894
Share of profit before tax 52.8% 31.2% 15.3% 0.7% 100.0%
Operating profit/(loss) excluding change in
expected credit losses and
other credit impairment charges 8,564 5,120 2,465 (78) 16,071
* Depreciation/amortisation included
in operating expenses (12) (2) - (1,023) (1,037)
At 30 June 2019
Total assets 501,349 406,036 702,219 47,048 1,656,652
Total liabilities 956,713 312,712 188,355 26,034 1,483,814
Interest in associates 2,545 - - 1 2,546
Half-year ended 30 June 2019
Net fee income by segment
- securities broking and related services 616 87 15 - 718
- retail investment funds 804 12 - - 816
- insurance 260 44 32 - 336
- account services 158 91 3 - 252
- remittances 34 208 20 - 262
- cards 701 801 18 - 1,520
- credit facilities 13 340 95 - 448
- trade services - 212 20 - 232
- other 37 44 18 125 224
Fee income 2,623 1,839 221 125 4,808
Fee expense (547) (744) (36) 4 (1,323)
Net fee income 2,076 1,095 185 129 3,485
47

NOTES ON THE CONDENSED CONSOLIDATED FINANCIAL STATEMENTS (unaudited) (continued)
16 Segmental analysis (continued)
(a) Segmental result (continued)
Retail
Banking Global
and Wealth Commercial Banking
Management Banking and Markets Other Total
Half-year ended 30 June 2018
Net interest income/(expense) 7,873 4,329 2,184 (158) 14,228
Net fee income 2,631 1,097 156 105 3,989
Net income/(loss) from financial instruments
measured at fair value (115) 274 830 6 995
Gains less losses from financial investments - - 24 - 24
Dividend income - - - 6 6
Net insurance premium income 7,982 750 - - 8,732
Other operating income 1,254 236 3 128 1,621
Total operating income 19,625 6,686 3,197 87 29,595
Net insurance claims and benefits paid
and movement in liabilities to policyholders (8,356) (590) - - (8,946)
Net operating income before
change in expected credit losses
and other credit impairment charges 11,269 6,096 3,197 87 20,649
Change in expected credit losses and
other credit impairment charges (169) (80) 11 - (238)
Net operating income 11,100 6,016 3,208 87 20,411
Operating expenses * (3,539) (1,577) (474) (132) (5,722)
Impairment loss on intangible assets - - - (27) (27)
Operating profit/(loss) 7,561 4,439 2,734 (72) 14,662
Net surplus on property revaluation - - - 78 78
Share of profits of associates 122 - - 2 124
Profit before tax 7,683 4,439 2,734 8 14,864
Share of profit before tax 51.7% 29.9% 18.4% 0.0% 100.0%
Operating profit/(loss) excluding change in
expected credit losses and
other credit impairment charges 7,730 4,519 2,723 (72) 14,900
* Depreciation/amortisation included
in operating expenses (12) (2) (2) (707) (723)
At 31 December 2018
Total assets 475,964 382,359 661,736 51,238 1,571,297
Total liabilities 931,201 307,798 163,123 7,068 1,409,190
Interest in associates 2,442 - - 2 2,444
Half-year ended 30 June 2018
Net fee income by segment
- securities broking and related services 930 106 13 - 1,049
- retail investment funds 1,059 11 - - 1,070
- insurance 229 48 33 - 310
- account services 153 99 3 - 255
- remittances 53 236 18 - 307
- cards 672 780 16 - 1,468
- credit facilities 11 278 75 - 364
- trade services - 211 12 - 223
- other 38 35 18 110 201
Fee income 3,145 1,804 188 110 5,247
Fee expense (514) (707) (32) (5) (1,258)
Net fee income 2,631 1,097 156 105 3,989
48
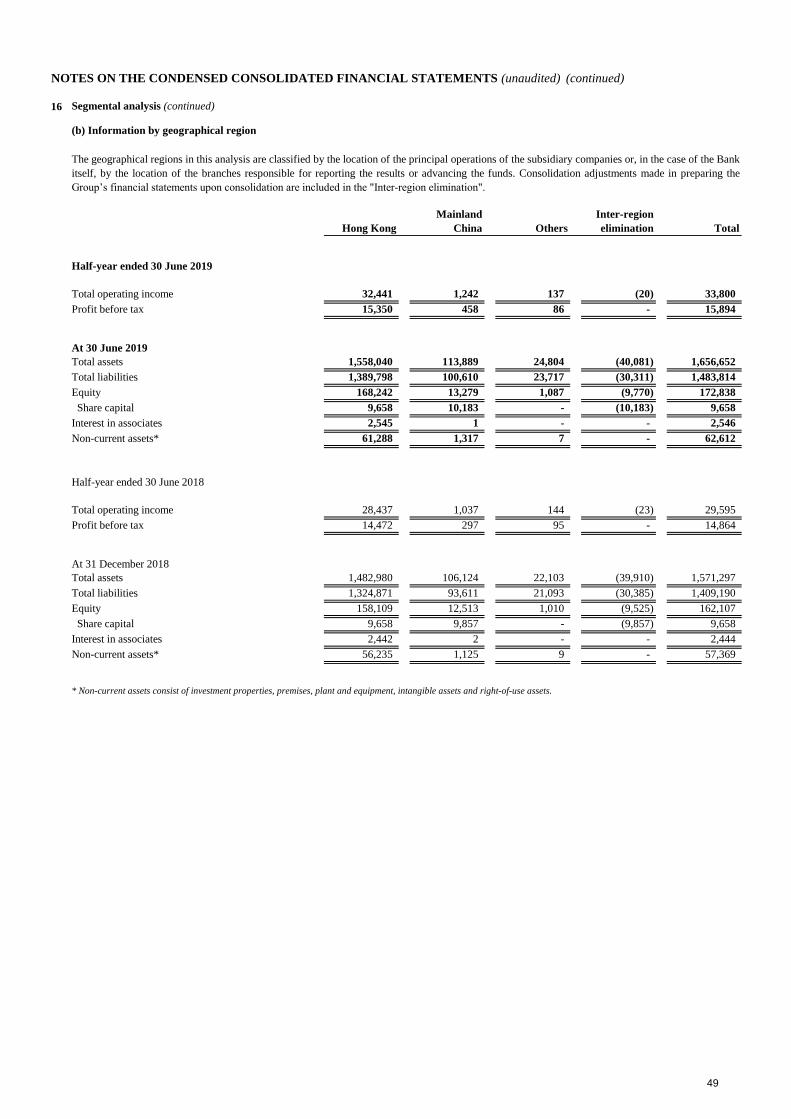
NOTES ON THE CONDENSED CONSOLIDATED FINANCIAL STATEMENTS (unaudited) (continued)
16 Segmental analysis (continued)
(b) Information by geographical region
Mainland Inter-region
Hong Kong China Others elimination Total
Half-year ended 30 June 2019
Total operating income 32,441 1,242 137 (20) 33,800
Profit before tax 15,350 458 86 - 15,894
At 30 June 2019
Total assets 1,558,040 113,889 24,804 (40,081) 1,656,652
Total liabilities 1,389,798 100,610 23,717 (30,311) 1,483,814
Equity 168,242 13,279 1,087 (9,770) 172,838
Share capital 9,658 10,183 - (10,183) 9,658
Interest in associates 2,545 1 - - 2,546
Non-current assets* 61,288 1,317 7 - 62,612
Half-year ended 30 June 2018
Total operating income 28,437 1,037 144 (23) 29,595
Profit before tax 14,472 297 95 - 14,864
At 31 December 2018
Total assets 1,482,980 106,124 22,103 (39,910) 1,571,297
Total liabilities 1,324,871 93,611 21,093 (30,385) 1,409,190
Equity 158,109 12,513 1,010 (9,525) 162,107
Share capital 9,658 9,857 - (9,857) 9,658
Interest in associates 2,442 2 - - 2,444
Non-current assets* 56,235 1,125 9 - 57,369
* Non-current assets consist of investment properties, premises, plant and equipment, intangible assets and right-of-use assets.
The geographical regions in this analysis are classified by the location of the principal operations of the subsidiary companies or, in the case of the Bank
itself, by the location of the branches responsible for reporting the results or advancing the funds. Consolidation adjustments made in preparing the
Group’s financial statements upon consolidation are included in the "Inter-region elimination".
49

NOTES ON THE CONDENSED CONSOLIDATED FINANCIAL STATEMENTS (unaudited) (continued)
17 Cash and sight balances at central banks
At 30 June At 31 December
2019 2018
Cash in hand 7,639 7,816
Sight balances at central banks 2,443 8,605
10,082 16,421
18 Placings with and advances to banks
At 30 June At 31 December
2019 2018
Balances with banks 8,725 7,765
Placings with and advances to banks maturing within one month 50,946 46,021
Placings with and advances to banks maturing after one month but less than one year 38,055 24,302
Placings with and advances to banks maturing after one year 1,341 1,314
Less: Expected credit losses (1) (2)
99,066 79,400
of which:
Placings with and advances to central banks 8,143 9,155
19 Trading assets
At 30 June At 31 December
2019 2018
Treasury bills 26,936 26,700
Other debt securities 22,784 20,448
Debt securities 49,720 47,148
Investment funds 17 16
49,737 47,164
20 Financial assets designated and otherwise mandatorily measured at fair value
At 30 June At 31 December
2019 2018
Debt securities 2 6
Equity shares 6,688 5,472
Investment funds 7,891 6,267
Other 1,395 1,325
15,976 13,070
50

NOTES ON THE CONDENSED CONSOLIDATED FINANCIAL STATEMENTS (unaudited) (continued)
21 Derivative financial instruments
Use of derivatives
Trading Hedging Total Trading Hedging Total Trading Hedging Total
Exchange rate 1,046,122 16,362 1,062,484 3,758 181 3,939 4,005 312 4,317
Interest rate 432,406 61,340 493,746 1,869 215 2,084 1,850 640 2,490
Equity and other 27,157 - 27,157 287 - 287 262 - 262
At 30 June 2019 1,505,685 77,702 1,583,387 5,914 396 6,310 6,117 952 7,069
Trading Hedging Total Trading Hedging Total Trading Hedging Total
Exchange rate 830,511 22,468 852,979 5,265 254 5,519 5,197 542 5,739
Interest rate 388,463 62,699 451,162 1,741 591 2,332 1,766 185 1,951
Equity and other 34,795 - 34,795 290 - 290 580 - 580
At 31 December 2018 1,253,769 85,167 1,338,936 7,296 845 8,141 7,543 727 8,270
Notional contract amount Fair value - Assets Fair value - Liabilities
Notional contract amount Fair value - Assets Fair value - Liabilities
The Group transacts derivatives for three primary purposes: to create risk management solutions for clients, to manage the portfolio risk arising from client business, and to manage and
hedge the Group’s own risks. Derivatives (except for derivatives which are designated as effective hedging instruments) are held for trading. Within the held for trading classification
are two types of derivative instruments: those used in sales and trading activities, and those used for risk management purposes but which for various reasons do not meet the qualifying
criteria for hedge accounting. The second category includes derivatives managed in conjunction with financial instruments designated at fair value.
The Group’s derivative activities give rise to significant open positions in portfolios of derivatives. These positions are managed constantly to ensure that they remain within acceptable
risk levels. When entering into derivative transactions, the Group employs the same credit risk management framework to assess and approve potential credit exposures that it uses for
traditional lending.
The following table shows the notional contract amounts and fair value of assets and liabilities by each class of derivatives.
51

NOTES ON THE CONDENSED CONSOLIDATED FINANCIAL STATEMENTS (unaudited) (continued)
22 Loans and advances to customers
At 30 June At 31 December
2019 2018
Gross loans and advances to customers 922,753 877,134
Less: Expected credit losses (2,908) (2,678)
919,845 874,456
% %
Expected credit losses as a percentage of gross loans and advances to customers 0.32 0.31
Gross impaired loans and advances 2,023 2,160
% %
Gross impaired loans and advances as a percentage of gross loans and advances to customers 0.22 0.25
23 Financial investments
At 30 June At 31 December
2019 2018
Financial investments measured at fair value through other comprehensive income
- treasury bills 202,226 217,636
- debt securities 126,699 107,400
- equity shares 5,428 4,144
334,353 329,180
Debt instruments measured at amortised cost
- treasury bills 500 1,842
- debt securities 114,694 97,547
Less: Expected credit losses (40) (37)
115,154 99,352
449,507 428,532
24 Interest in associates
At 30 June At 31 December
2019 2018
Share of net assets 2,546 2,444
There were no overdue financial investments at 30 June 2019 and 31 December 2018 for the Group. The Group did not hold any asset-
backed securities, mortgage-backed securities and collateralised debt obligations.
52

NOTES ON THE CONDENSED CONSOLIDATED FINANCIAL STATEMENTS (unaudited) (continued)
25 Property, plant and equipment
Movement of property, plant and equipment
Investment Plant and
Premises properties equipment Total
Cost or valuation:
At 1 January 2019 29,344 10,108 5,368 44,820
Additions 114 - 206 320
Disposals - - (58) (58)
Elimination of accumulated depreciation on revalued premises (507) - - (507)
Surplus on revaluation:
- credited to premises revaluation reserve 926 - - 926
- credited to income statement - 257 - 257
Transfer 21 (21) - -
Exchange adjustments and other (1) - 1 -
At 30 June 2019 29,897 10,344 5,517 45,758
Accumulated depreciation:
At 1 January 2019 - - (4,202) (4,202)
Charge for the period (note 12) (507) - (209) (716)
Disposals - - 55 55
Elimination of accumulated depreciation on revalued premises 507 - - 507
Exchange adjustments and other - - (4) (4)
At 30 June 2019 - - (4,360) (4,360)
Net book value at 30 June 2019 29,897 10,344 1,157 41,398
Representing:
- measure at cost - - 1,157 1,157
- measure at valuation 29,897 10,344 - 40,241
29,897 10,344 1,157 41,398
53

NOTES ON THE CONDENSED CONSOLIDATED FINANCIAL STATEMENTS (unaudited) (continued)
25 Property, plant and equipment (continued)
Movement of property, plant and equipment (continued)
Investment Plant and
Premises properties equipment Total
Cost or valuation:
At 1 January 2018 27,157 10,166 5,241 42,564
Additions 60 278 171 509
Disposals - - (35) (35)
Elimination of accumulated depreciation on revalued premises (458) - - (458)
Surplus on revaluation:
- credited to premises revaluation reserve 1,040 - - 1,040
- credited to income statement - 71 - 71
Transfer 657 (657) - -
Exchange adjustments and other (13) - (6) (19)
At 30 June 2018 28,443 9,858 5,371 43,672
Accumulated depreciation:
At 1 January 2018 - - (3,899) (3,899)
Charge for the period (note 12) (458) - (210) (668)
Disposals - - 32 32
Elimination of accumulated depreciation on revalued premises 458 - - 458
Exchange adjustments and other - - 5 5
At 30 June 2018 - - (4,072) (4,072)
Net book value at 30 June 2018 28,443 9,858 1,299 39,600
Representing:
- measure at cost - - 1,299 1,299
- measure at valuation 28,443 9,858 - 38,301
28,443 9,858 1,299 39,600
Cost or valuation:
At 1 July 2018 28,443 9,858 5,371 43,672
Additions - - 90 90
Disposals - - (72) (72)
Elimination of accumulated depreciation on revalued premises (478) - - (478)
Surplus on revaluation:
- credited to premises revaluation reserve 1,418 - - 1,418
- credited to income statement - 250 - 250
Transfer - - - -
Exchange adjustments and other (39) - (21) (60)
At 31 December 2018 29,344 10,108 5,368 44,820
Accumulated depreciation:
At 1 July 2018 - - (4,072) (4,072)
Charge for the period (478) - (217) (695)
Disposals - - 70 70
Elimination of accumulated depreciation on revalued premises 478 - - 478
Exchange adjustments and other - - 17 17
At 31 December 2018 - - (4,202) (4,202)
Net book value at 31 December 2018 29,344 10,108 1,166 40,618
Representing:
- measure at cost - - 1,166 1,166
- measure at valuation 29,344 10,108 - 39,452
29,344 10,108 1,166 40,618
54

NOTES ON THE CONDENSED CONSOLIDATED FINANCIAL STATEMENTS (unaudited) (continued)
26 Intangible assets
At 30 June At 31 December
2019 2018
Present value of in-force long-term insurance business 18,654 15,910
Internally developed software 725 434
Acquired software 80 78
Goodwill 329 329
19,788 16,751
27 Other assets
At 30 June At 31 December
2019 2018
Items in the course of collection from other banks 7,662 7,236
Bullion 3,591 5,257
Prepayments and accrued income 4,372 4,276
Acceptances and endorsements 7,509 6,868
Less: Expected credit losses (7) (5)
Reinsurers' share of liabilities under insurance contracts 8,432 8,788
Settlement accounts 3,887 4,796
Cash collateral 2,007 1,838
Right-of-use assets 1,426 N/A
Other accounts 3,518 5,246
42,397 44,300
28 Current, savings and other deposit accounts
At 30 June At 31 December
2019 2018
Current, savings and other deposit accounts:
- as stated in Condensed Consolidated Balance Sheet 1,186,938 1,154,415
- structured deposits reported as financial liabilities designated as fair value (note 30) 29,962 28,594
1,216,900 1,183,009
By type:
- demand and current accounts 106,638 106,096
- savings accounts 693,201 707,158
- time and other deposits 417,061 369,755
1,216,900 1,183,009
29 Trading liabilities
At 30 June At 31 December
2019 2018
Short positions in securities 34,037 33,649
Other accounts included "Assets held for sale" of HK$12m (31 December 2018: HK$18m). It also included "Retirement benefit assets" of
HK$18m (31 December 2018: HK$13m).
55

NOTES ON THE CONDENSED CONSOLIDATED FINANCIAL STATEMENTS (unaudited) (continued)
30 Financial liabilities designated at fair value
At 30 June At 31 December
2019 2018
Certificates of deposit in issue (note 31) 2,022 2,008
Structured deposits (note 28) 29,962 28,594
Other structured debt securities in issue (note 31) 4,956 2,404
Liabilities to customers under investment contracts 442 448
37,382 33,454
31 Certificates of deposit and other debt securities in issue
At 30 June At 31 December
2019 2018
Certificates of deposit and other debt securities in issue:
- as stated in Condensed Consolidated Balance Sheet 16,676 3,748
- certificates of deposit in issue designated at fair value (note 30) 2,022 2,008
- other structured debt securities in issue
reported as financial liabilities designated at fair value (note 30) 4,956 2,404
23,654 8,160
By type:
- certificates of deposit in issue 18,698 5,756
- other debt securities in issue 4,956 2,404
23,654 8,160
32 Other liabilities
At 30 June At 31 December
2019 2018
Items in the course of transmission to other banks 8,541 10,053
Accruals 4,096 4,190
Acceptances and endorsements 7,509 6,868
Retirement benefit liabilities 958 834
Settlement accounts 2,723 17,213
Cash collateral 255 995
Lease liabilities 1,387 N/A
Other 4,077 5,094
29,546 45,247
At 30 June 2019, the accumulated loss in fair value attributable to changes in own credit risk for financial liabilities designated at fair value was
HK$5m (31 December 2018: accumulated loss of HK$1m).
56
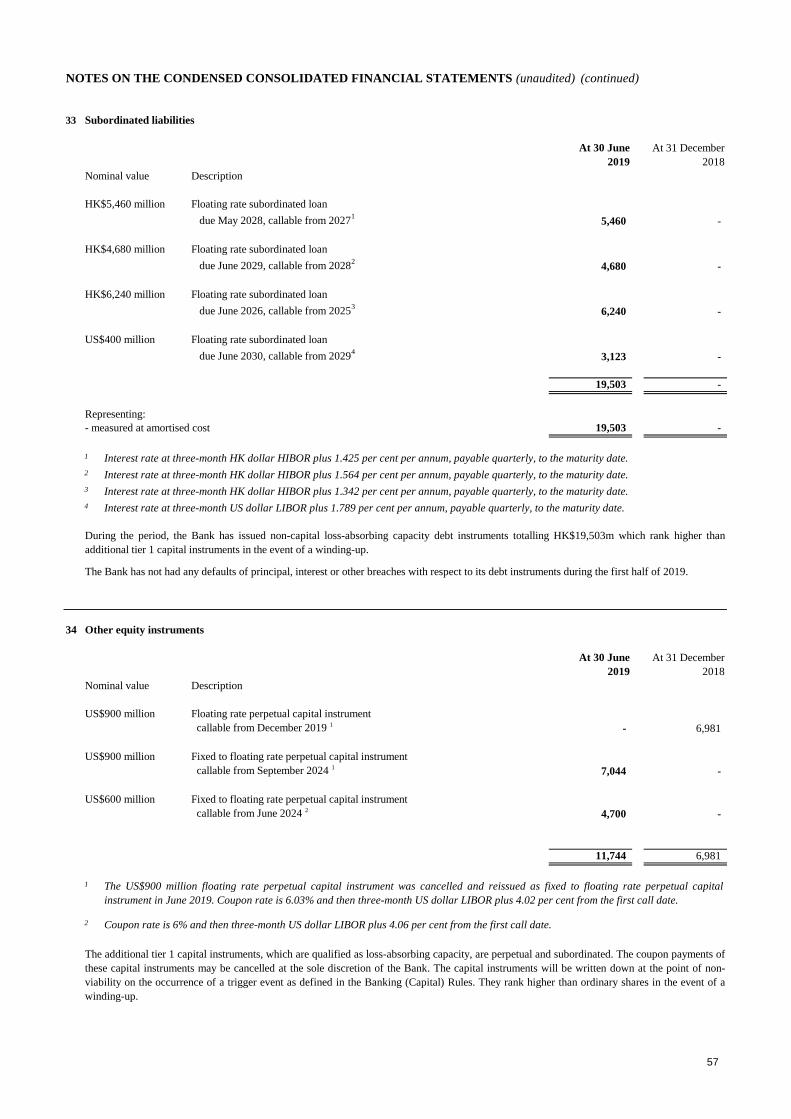
NOTES ON THE CONDENSED CONSOLIDATED FINANCIAL STATEMENTS (unaudited) (continued)
33 Subordinated liabilities
At 30 June At 31 December
2019 2018
Nominal value Description
HK$5,460 million Floating rate subordinated loan
due May 2028, callable from 20271
5,460 -
HK$4,680 million Floating rate subordinated loan
due June 2029, callable from 20282
4,680 -
HK$6,240 million Floating rate subordinated loan
due June 2026, callable from 20253
6,240 -
US$400 million Floating rate subordinated loan
due June 2030, callable from 20294
3,123 -
19,503 -
Representing:
- measured at amortised cost 19,503 -
1
2
3
4
34 Other equity instruments
At 30 June At 31 December
2019 2018
Nominal value Description
US$900 million Floating rate perpetual capital instrument
callable from December 2019 1- 6,981
US$900 million Fixed to floating rate perpetual capital instrument
callable from September 2024 17,044 -
US$600 million Fixed to floating rate perpetual capital instrument
callable from June 2024 24,700 -
11,744 6,981
1
2
Interest rate at three-month HK dollar HIBOR plus 1.342 per cent per annum, payable quarterly, to the maturity date.
Interest rate at three-month US dollar LIBOR plus 1.789 per cent per annum, payable quarterly, to the maturity date.
Interest rate at three-month HK dollar HIBOR plus 1.425 per cent per annum, payable quarterly, to the maturity date.
Interest rate at three-month HK dollar HIBOR plus 1.564 per cent per annum, payable quarterly, to the maturity date.
During the period, the Bank has issued non-capital loss-absorbing capacity debt instruments totalling HK$19,503m which rank higher than
additional tier 1 capital instruments in the event of a winding-up.
The Bank has not had any defaults of principal, interest or other breaches with respect to its debt instruments during the first half of 2019.
Coupon rate is 6% and then three-month US dollar LIBOR plus 4.06 per cent from the first call date.
The US$900 million floating rate perpetual capital instrument was cancelled and reissued as fixed to floating rate perpetual capital
instrument in June 2019. Coupon rate is 6.03% and then three-month US dollar LIBOR plus 4.02 per cent from the first call date.
The additional tier 1 capital instruments, which are qualified as loss-absorbing capacity, are perpetual and subordinated. The coupon payments of
these capital instruments may be cancelled at the sole discretion of the Bank. The capital instruments will be written down at the point of non-
viability on the occurrence of a trigger event as defined in the Banking (Capital) Rules. They rank higher than ordinary shares in the event of a
winding-up.
57

NOTES ON THE CONDENSED CONSOLIDATED FINANCIAL STATEMENTS (unaudited) (continued)
35 Contingent liabilities and commitments
(a) Off-balance sheet contingent liabilities and commitments
At At 30 June 31 December
2019 2018
Contingent liabilities and financial guarantee contracts
Guarantee and irrevocable letters of credit pledged as collateral security 21,247 16,216
Other contingent liabilities 180 172
21,427 16,388
Commitments
Documentary credits and short-term trade-related transactions 2,131 3,310
Forward asset purchases and forward forward deposits placed 3,992 2,895
Undrawn formal standby facilities, credit lines and other commitments to lend 476,659 461,480
482,782 467,685
(b) Contingencies
36 Material related-party transactions
Except on the above, all related party transactions that took place in the half-year to 30 June 2019 were similar in nature to those disclosed in the 2018 Annual Report. There were
no changes in the related party transactions described in the 2018 Annual Report that have had a material effect on the financial position or performance of the Group in the half-
year to 30 June 2019.
During the first half of 2019, the Hong Kong Monetary Authority has classified the Bank as a material subsidiary of HSBC's Asian resolution group and required the Bank to
comply with internal loss-absorbing capacity requirements under the Financial Institutions (Resolution) (Loss-absorbing Capacity Requirements – Banking Sector) Rules. To
meet the requirements, the Bank has refinanced the perpetual capital instrument of US$900m, issued additional perpetual capital instruments of US$600m and non-capital loss-
absorbing capacity debt instruments of HK$19,503m to its immediate holding company. The Bank has also paid coupon on the existing perpetual capital instrument amounting to
HK$232m to its immediate holding company upon cancellation.
The above table discloses the nominal principal amounts of commitments (excluding capital commitments), guarantees and other contingent liabilities, which represents the
amounts at risk should contracts be fully drawn upon and clients default. As a significant portion of guarantees and commitments is expected to expire without being drawn
upon, the total of the nominal principal amounts is not indicative of future liquidity requirements.
There is no material litigation expected to result in a significant adverse effect on the financial position of the Group, either collectively or individually. Management believes
that adequate provisions have been made in respect of such litigation.
58

NOTES ON THE CONDENSED CONSOLIDATED FINANCIAL STATEMENTS (unaudited) (continued)
37 Fair value of financial instruments
(a) Fair value of financial instruments carried at fair value
With
Quoted Using significant Amounts
market observable unobservable Third with
price inputs inputs party HSBC
Level 1 Level 2 Level 3 total entities * Total
Recurring fair value measurements
At 30 June 2019
Assets
Trading assets 43,699 6,038 - 49,737 - 49,737
Financial assets designated and otherwise mandatorily measured at fair value 9,918 1,399 4,659 15,976 - 15,976
Derivative financial instruments 379 4,275 7 4,661 1,649 6,310
Financial investments 279,282 53,124 1,947 334,353 - 334,353
Liabilities
Trading liabilities 34,037 - - 34,037 - 34,037
Financial liabilities designated at fair value - 26,913 10,469 37,382 - 37,382
Derivative financial instruments 42 4,560 1 4,603 2,466 7,069
At 31 December 2018Assets
Trading assets 44,591 2,573 - 47,164 - 47,164 Financial assets designated and otherwise mandatorily measured at fair value 6,386 2,595 4,089 13,070 - 13,070 Derivative financial instruments 386 5,804 24 6,214 1,927 8,141 Financial investments 284,696 43,197 1,287 329,180 - 329,180
Liabilities
Trading liabilities 33,649 - - 33,649 - 33,649 Financial liabilities designated at fair value - 21,140 12,314 33,454 - 33,454 Derivative financial instruments 29 6,026 71 6,126 2,144 8,270
Transfers between Level 1 and Level 2 fair values
Financial assets
designated and
otherwise Financial
mandatorily liabilities
Financial Trading measured at Trading designated
Investments Assets fair value Derivatives Liabilities at fair value Derivatives
At 30 June 2019
Transfer from Level 1 to Level 2 - - - - - - -
Transfer from Level 2 to Level 1 - - 1,268 - - - -
At 31 December 2018
Transfer from Level 1 to Level 2 - - - - - - -
Transfer from Level 2 to Level 1 55,329 7,217 - - - - -
Liabilities
Transfers between levels of the fair value hierarchy are deemed to occur at the end of each quarterly reporting period. Transfers into and out of levels of the fair value
hierarchy are primarily attributable to changes in observability of valuation inputs and price transparency.
The accounting policies, control framework and hierarchy used to determine fair values at 30 June 2019 are consistent with those applied for the Annual Report 2018. The
following table provides an analysis of financial instruments carried at fair value and bases of valuation:
Fair value hierarchy
* Included structured instruments and derivative contracts transacted with HSBC entities which were mainly classified within Level 2 of the valuation hierarchy.
Assets
59
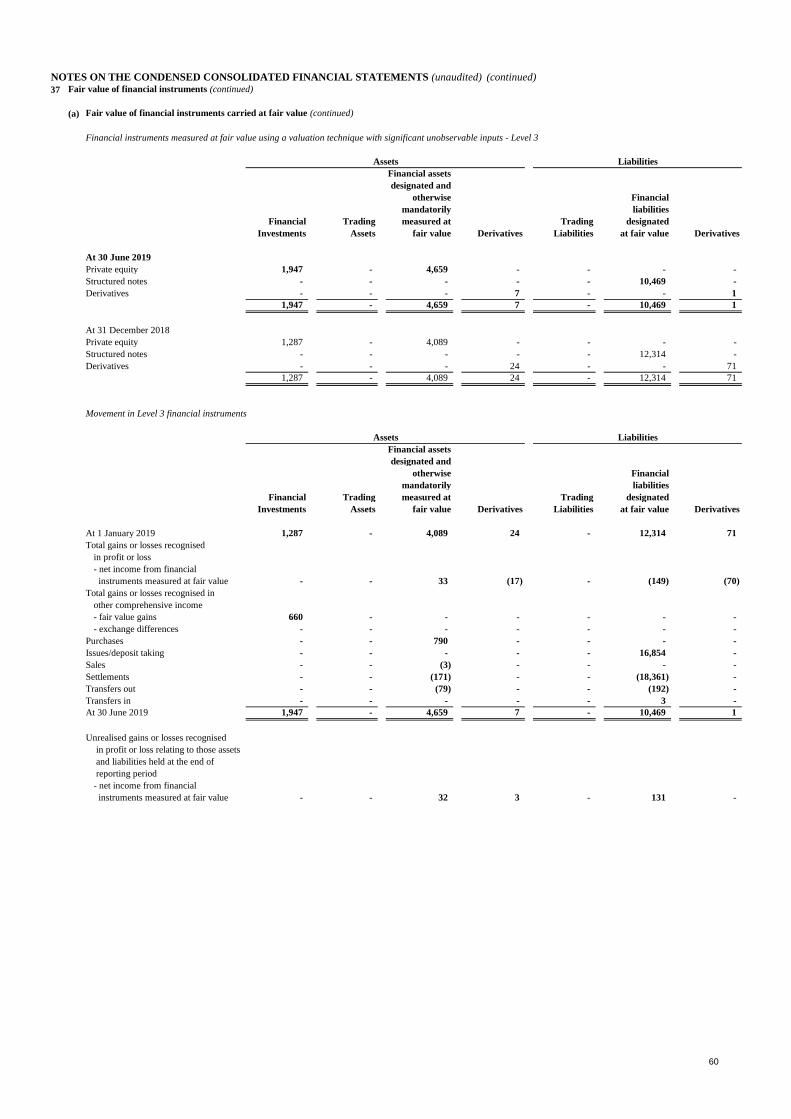
NOTES ON THE CONDENSED CONSOLIDATED FINANCIAL STATEMENTS (unaudited) (continued)
37 Fair value of financial instruments (continued)
(a) Fair value of financial instruments carried at fair value (continued)
Financial instruments measured at fair value using a valuation technique with significant unobservable inputs - Level 3
Financial assets
designated and
otherwise Financial
mandatorily liabilities
Financial Trading measured at Trading designated
Investments Assets fair value Derivatives Liabilities at fair value Derivatives
At 30 June 2019
Private equity 1,947 - 4,659 - - - -
Structured notes - - - - - 10,469 -
Derivatives - - - 7 - - 1
1,947 - 4,659 7 - 10,469 1
At 31 December 2018
Private equity 1,287 - 4,089 - - - -
Structured notes - - - - - 12,314 -
Derivatives - - - 24 - - 71
1,287 - 4,089 24 - 12,314 71
Movement in Level 3 financial instruments
Financial assets
designated and
otherwise Financial
mandatorily liabilities
Financial Trading measured at Trading designated
Investments Assets fair value Derivatives Liabilities at fair value Derivatives
At 1 January 2019 1,287 - 4,089 24 - 12,314 71
Total gains or losses recognised
in profit or loss
- net income from financial
instruments measured at fair value - - 33 (17) - (149) (70)
Total gains or losses recognised in
other comprehensive income
- fair value gains 660 - - - - - -
- exchange differences - - - - - - -
Purchases - - 790 - - - -
Issues/deposit taking - - - - - 16,854 -
Sales - - (3) - - - -
Settlements - - (171) - - (18,361) -
Transfers out - - (79) - - (192) -
Transfers in - - - - - 3 -
At 30 June 2019 1,947 - 4,659 7 - 10,469 1
Unrealised gains or losses recognised
in profit or loss relating to those assets
and liabilities held at the end of
reporting period
- net income from financial
instruments measured at fair value - - 32 3 - 131 -
Assets Liabilities
Assets Liabilities
60

NOTES ON THE CONDENSED CONSOLIDATED FINANCIAL STATEMENTS (unaudited) (continued)
37 Fair value of financial instruments (continued)
(a) Fair value of financial instruments carried at fair value (continued)
Movement in Level 3 financial instruments (continued)
Financial assets
designated and
otherwise Financial
mandatorily liabilities
Financial Trading measured at Trading designated
Investments Assets fair value Derivatives Liabilities at fair value Derivatives
At 1 January 2018 1,455 - 1,832 8 392 - 3
Total gains or losses recognised
in profit or loss
- net income from financial
instruments measured at fair value - - 95 17 6 (131) (2)
Total gains or losses recognised in
other comprehensive income
- fair value gains 59 - - - - - -
- exchange differences - - - - - - -
Purchases - - 1,690 - - - -
Issues/deposit taking - - - - - 1,660 -
Settlements - - (201) - - (47) -
Transfers out (32) - - (7) (398) (33) (1)
Transfers in - - 32 - - 72 -
At 30 June 2018 1,482 - 3,448 18 - 1,521 -
Unrealised gains or losses recognised
in profit or loss relating to those assets
and liabilities held at the end of
reporting period
- net income from financial
instruments measured at fair value - - 95 18 - 132 -
Financial assets
designated and
otherwise Financial
mandatorily liabilities
Financial Trading measured at Trading designated
Investments Assets fair value Derivatives Liabilities at fair value Derivatives
At 1 July 2018 1,482 - 3,448 18 - 1,521 -
Total gains or losses recognised
in profit or loss
- net income from financial
instruments measured at fair value - - 239 9 - 182 11
Total gains or losses recognised in
other comprehensive income
- fair value losses (229) - - - - - -
- exchange differences - - - - - - -
Purchases 34 - 770 - - 1 -
Issues/deposit taking - - - - - 7,656 -
Settlements - - (368) - - (1,111) -
Transfers out - - - (10) - (131) (4)
Transfers in - - - 7 - 4,196 64
At 31 December 2018 1,287 - 4,089 24 - 12,314 71
Unrealised gains or losses recognised
in profit or loss relating to those assets
and liabilities held at the end of
reporting period
- net income from financial
instruments measured at fair value - - 334 24 - 54 71
Assets
Assets Liabilities
For the first half of 2019, the transfer out/in of Level 3 financial liabilities designated at fair value reflected the change in observability of equity volatility for pricing the
instrument. The transfer out of Level 3 financial assets designated and otherwise mandatorily measured at fair value reflected the change in observability of valuation inputs
and price transparency.
Liabilities
61
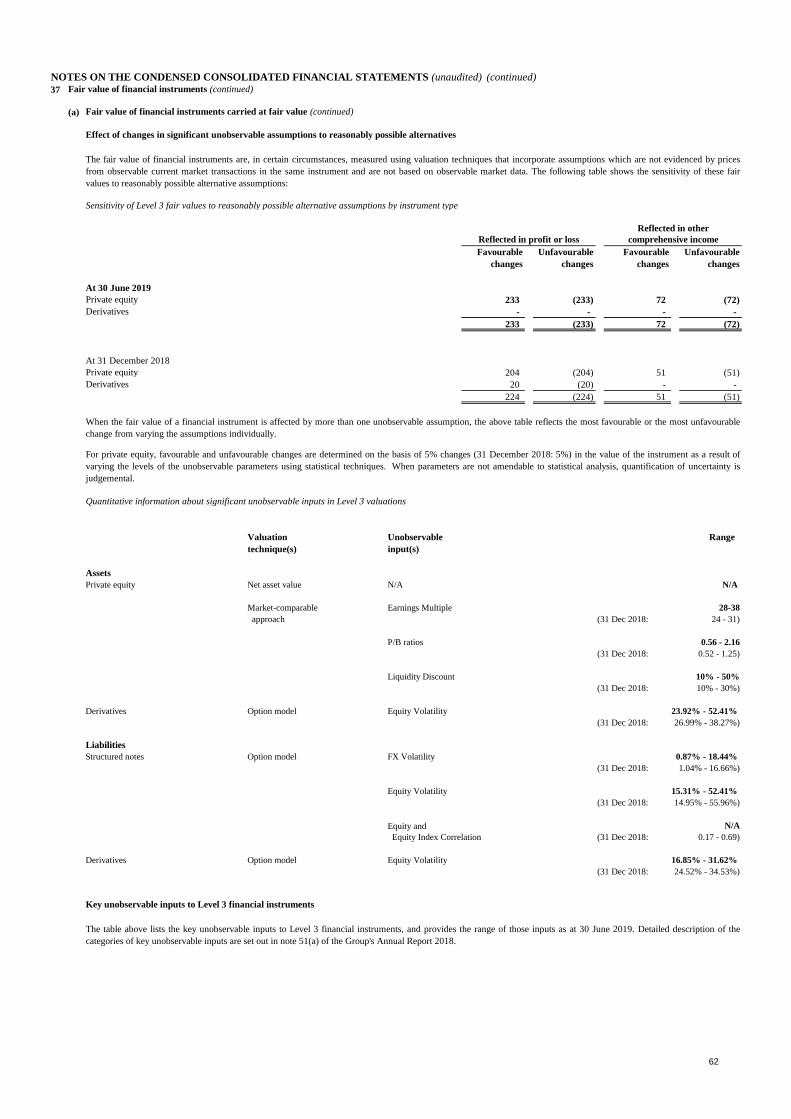
NOTES ON THE CONDENSED CONSOLIDATED FINANCIAL STATEMENTS (unaudited) (continued)
37 Fair value of financial instruments (continued)
(a) Fair value of financial instruments carried at fair value (continued)
Effect of changes in significant unobservable assumptions to reasonably possible alternatives
Sensitivity of Level 3 fair values to reasonably possible alternative assumptions by instrument type
Favourable Unfavourable Favourable Unfavourable
changes changes changes changes
At 30 June 2019
Private equity 233 (233) 72 (72)
Derivatives - - - -
233 (233) 72 (72)
At 31 December 2018
Private equity 204 (204) 51 (51)
Derivatives 20 (20) - -
224 (224) 51 (51)
Quantitative information about significant unobservable inputs in Level 3 valuations
Valuation Unobservable Range
technique(s) input(s)
Assets
Private equity Net asset value N/A N/A
Market-comparable Earnings Multiple 28-38
approach (31 Dec 2018: 24 - 31)
P/B ratios 0.56 - 2.16
(31 Dec 2018: 0.52 - 1.25)
Liquidity Discount 10% - 50%
(31 Dec 2018: 10% - 30%)
Derivatives Option model Equity Volatility 23.92% - 52.41%
(31 Dec 2018: 26.99% - 38.27%)
Liabilities
Structured notes Option model FX Volatility 0.87% - 18.44%
(31 Dec 2018: 1.04% - 16.66%)
Equity Volatility 15.31% - 52.41%
(31 Dec 2018: 14.95% - 55.96%)
Equity and N/A
Equity Index Correlation (31 Dec 2018: 0.17 - 0.69)
Derivatives Option model Equity Volatility 16.85% - 31.62%
(31 Dec 2018: 24.52% - 34.53%)
Key unobservable inputs to Level 3 financial instruments
For private equity, favourable and unfavourable changes are determined on the basis of 5% changes (31 December 2018: 5%) in the value of the instrument as a result of
varying the levels of the unobservable parameters using statistical techniques. When parameters are not amendable to statistical analysis, quantification of uncertainty is
judgemental.
The table above lists the key unobservable inputs to Level 3 financial instruments, and provides the range of those inputs as at 30 June 2019. Detailed description of the
categories of key unobservable inputs are set out in note 51(a) of the Group's Annual Report 2018.
When the fair value of a financial instrument is affected by more than one unobservable assumption, the above table reflects the most favourable or the most unfavourable
change from varying the assumptions individually.
The fair value of financial instruments are, in certain circumstances, measured using valuation techniques that incorporate assumptions which are not evidenced by prices
from observable current market transactions in the same instrument and are not based on observable market data. The following table shows the sensitivity of these fair
values to reasonably possible alternative assumptions:
Reflected in other
Reflected in profit or loss comprehensive income
62

NOTES ON THE CONDENSED CONSOLIDATED FINANCIAL STATEMENTS (unaudited) (continued)
37 Fair value of financial instruments (continued)
(b) Fair value of financial instruments not carried at fair value
Carrying Fair Carrying Fair
Amounts Value Amounts Value
Financial Assets
Placings with and advances to banks 99,066 98,984 79,400 79,345
Loans and advances to customers 919,845 920,848 874,456 875,505
Financial investments - at amortised cost 115,154 119,172 99,352 99,260
Financial Liabilities
Current, savings and other deposit accounts 1,186,938 1,186,883 1,154,415 1,154,216
Repurchase agreements – non-trading 6,664 6,664 410 410
Deposits from banks 9,586 9,586 2,712 2,712
Certificates of deposit and other debt securities in issue 16,676 16,782 3,748 3,748
Subordinated liabilities 19,503 19,862 - -
38 Condensed Consolidated Financial Statements and statutory financial statements
39 Immediate and ultimate holding companies
40 Comparative figures
The immediate and ultimate holding companies of the Bank are The Hongkong and Shanghai Banking Corporation Limited (incorporated in Hong Kong) and HSBC Holdings plc
(incorporated in England) respectively.
Certain comparative figures in the Condensed Consolidated Financial Statements have been reclassified to conform with current period’s presentation.
The auditor has reported on those statutory financial statements for the year ended 31 December 2018. The auditor's report was unqualified; did not include a reference to any
matters to which the auditor drew attention by way of emphasis without qualifying its report; and did not contain a statement under sections 406(2), 407(2) or (3) of the Hong
Kong Companies Ordinance (Cap. 622).
The Banking Disclosure Statement, together with the disclosures in the Group’s Interim Report, contained all the disclosures required by the Banking (Disclosure) Rules issued
by the HKMA. The disclosures as required under the Banking (Disclosures) Rules can be viewed in the Banking Disclosure Statement that is available in the Regulatory
Disclosures section of the Bank’s website (www.hangseng.com).
The financial information relating to the year ended 31 December 2018 that is included in these Condensed Consolidated Financial Statements does not constitute the Bank's
statutory financial statements for that year but is extracted from those financial statements which have been delivered to the Registrar of Companies as required by section 662(3)
of, and Part 3 of Schedule 6 to, the Hong Kong Companies Ordinance (Cap. 622) and to the Hong Kong Monetary Authority.
The Annual Report for the year ended 31 December 2018, which includes the statutory financial statements, can be obtained from the Bank's website (www.hangseng.com) and
the website of HKEX (www.hkexnews.hk).
Details of how the fair values of financial instruments that are not carried at fair value on the balance sheet are calculated are set out in note 51(b) of the Group’s Annual
Report 2018.
Other financial instruments not carried at fair value are typically short-term in nature or reprice to current market rates frequently. Accordingly, their carrying amounts are
reasonable approximations of their fair values.
The following table provides an analysis of the fair value of financial instruments not measured at fair value on the Condensed Consolidated Balance Sheet. For all other
instruments, the fair value is equal to the carrying value.
At 30 June 2019 At 31 December 2018
63
64
REPORT ON REVIEW OF CONDENSED CONSOLIDATED FINANCIAL STATEMENTS TO THE BOARD OF DIRECTORS OF HANG SENG BANK LIMITED (incorporated in Hong Kong with limited liability)
Introduction We have reviewed the condensed consolidated financial statements set out on pages 32 to 63, which comprises the condensed consolidated balance sheet of Hang Seng Bank Limited (the “Bank”) and its subsidiaries (together, the “Group”) as at 30 June 2019 and the condensed consolidated income statement, the condensed consolidated statement of comprehensive income, the condensed consolidated statement of changes in equity and the condensed consolidated cash flow statement for the six-month period then ended, and a summary of significant accounting policies and other explanatory notes1. The Rules Governing the Listing of Securities on The Stock Exchange of Hong Kong Limited require the preparation of a report on condensed consolidated financial statements to be in compliance with the relevant provisions thereof and Hong Kong Accounting Standard 34 “Interim Financial Reporting” issued by the Hong Kong Institute of Certified Public Accountants. The directors of the Bank are responsible for the preparation and presentation of these condensed consolidated financial statements in accordance with Hong Kong Accounting Standard 34 “Interim Financial Reporting”. Our responsibility is to express a conclusion on these condensed consolidated financial statements based on our review and to report our conclusion solely to you, as a body, in accordance with our agreed terms of engagement and for no other purpose. We do not assume responsibility towards or accept liability to any other person for the contents of this report. 1As described in Note 1 on the condensed consolidated financial statements, certain other disclosures have been presented elsewhere in the Interim Report 2019, rather than in the notes on the condensed consolidated financial statements. These are cross-referenced from the condensed consolidated financial statements and are identified as reviewed.
Scope of Review We conducted our review in accordance with Hong Kong Standard on Review Engagements 2410, “Review of Interim Financial Information Performed by the Independent Auditor of the Entity” issued by the Hong Kong Institute of Certified Public Accountants. A review of condensed consolidated financial statements consists of making inquiries, primarily of persons responsible for financial and accounting matters, and applying analytical and other review procedures. A review is substantially less in scope than an audit conducted in accordance with Hong Kong Standards on Auditing and consequently does not enable us to obtain assurance that we would become aware of all significant matters that might be identified in an audit. Accordingly, we do not express an audit opinion. Conclusion Based on our review, nothing has come to our attention that causes us to believe that the condensed consolidated financial statements of the Group are not prepared, in all material respects, in accordance with Hong Kong Accounting Standard 34 “Interim Financial Reporting”. PricewaterhouseCoopers Certified Public Accountants Hong Kong, 5 August 2019
65
ADDITIONAL INFORMATION
The Code for Securities Transactions by Directors The Bank has adopted a Code for Securities Transactions by Directors on terms no less exacting than
the required standards as set out in the Model Code for Securities Transactions by Directors of Listed
Issuers (as set out in Appendix 10 to the Rules Governing the Listing of Securities on The Stock
Exchange of Hong Kong Limited (“Listing Rules”)). Specific enquiries have been made with all
Directors who have confirmed that they have complied with the Bank’s Code for Securities
Transactions by Directors throughout the six months ended 30 June 2019.
Changes in Directors’ Details Changes in Directors’ details since the date of the Annual Report 2018 of the Bank or (as the case may
be) the date of announcement for the appointment of Director issued by the Bank subsequent to the
date of the Annual Report 2018, and up to the date of release of the interim results of the Bank which
are required to be disclosed pursuant to Rule 13.51(2) and Rule 13.51B(1) of the Listing Rules, are set
out below.
Ms Irene LEE Yun Lien
Cessation of appointments
Cathay Pacific Airways Limited( 1 ) (Independent Non-executive Director; Chairman of Audit
Committee; Chairman of Remuneration Committee)
Dr Eric LI Ka Cheung GBS, OBE, JP
Cessation of appointments
Home Affairs Bureau (Member of the Board of Trustees of the Sir Edward Youde Memorial Fund)
The Financial Reporting Council (Member of Honorary Advisory Panel)
Dr Vincent LO Hong Sui GBM, JP
Cessation of appointment
Hong Kong Trade Development Council (Chairman)
Mr Kenneth NG Sing Yip
New appointment
Ping An Insurance (Group) Company of China, Ltd.( 1 ) (Independent Non-executive Director)
Mr Peter WONG Tung Shun JP
Cessation of appointment
Bank of Communications Co., Ltd.( 1 ) (Vice Chairman and Non-executive Director)
Notes:
(1) The securities of these companies are listed on a securities market in Hong Kong or overseas.
(2) Updated biographical details of the Bank’s Directors are also available on the website of the
Bank.
Other than those disclosed above, there is no other information required to be disclosed pursuant to
Rule 13.51B(1) of the Listing Rules.

66
Directors’ and Alternate Chief Executives’ Interests As at 30 June 2019, the interests of the Directors and Alternate Chief Executives in the shares,
underlying shares of equity derivatives and debentures of the Bank and its associated corporations (all
within the meaning of Part XV of the Securities and Futures Ordinance (“SFO”)) disclosed in
accordance with the Listing Rules were detailed below.
Interests in shares
Personal
Interests
(held as
beneficial
owner)
Family
Interests
(interests
of spouse
or child
under 18)
Corporate
Interests
(interests of
controlled
corporation)
Other
Interests
Total
Interests
Total
Interests
as % of
the
relevant
shares in
issue/
issued
share
capital
Number of ordinary shares
in the Bank
Directors:
Dr John C C Chan 1,000(1) - - - 1,000 0.00
Ms Margaret W H Kwan 65 - - - 65 0.00
Number of ordinary shares
of US$0.50 each in HSBC
Holdings plc
Directors:
Dr Raymond K F Ch’ien 59,799 - - - 59,799 0.00
Ms Louisa Cheang 468,284 - - 187,464(2) 655,748 0.00
Dr John C C Chan 24,605(1) - - - 24,605 0.00
Mr Nixon L S Chan 143,054 - - 12,073(2) 155,127 0.00
Ms Kathleen C H Gan 255,649 - - 55,332(2) 310,981 0.00
Ms Margaret W H Kwan 58,199 10,041 - 20,009(2) 88,249 0.00
Ms Irene Y L Lee 11,456 - - - 11,456 0.00
Dr Eric K C Li - 62,362 - - 62,362 0.00
Mr Kenneth S Y Ng 440,465 - - - 440,465 0.00
Mr Peter T S Wong 2,334,725 26,405 - 980,781(2) 3,341,911 0.02
Alternate Chief
Executives:
Mrs Eunice L C Y Chan 16,474 - - 11,767(2) 28,241 0.00
Mr Donald Y S Lam 145,378 - - 23,694(2) 169,072 0.00
Mr Andrew W L Leung 17,910 - - 20,037(2) 37,947 0.00
Notes:
(1) 1,000 shares in the Bank and 4,371 shares in HSBC Holdings plc were jointly held by Dr John C
C Chan and his wife.
(2) These included interests in conditional awards of ordinary shares of US$0.50 each in HSBC
Holdings plc under the HSBC Share Plans made in favour of Directors and Alternate Chief
Executives.

67
Conditional Awards of Shares
As at 30 June 2019, the interests of the Directors and Alternate Chief Executives in the conditional
awards of ordinary shares of US$0.50 each in HSBC Holdings plc made in favour of them under
various HSBC Share Plans were as follows:
Awards
held as at
1 January 2019
Awards made
during
the Director’s/
Alternate
Chief Executive’s
term of office in
the first half of
the year
Awards released
during
the Director’s/
Alternate
Chief Executive’s
term of office in
the first half of
the year
Awards
held as at
30 June
2019
Directors:
Ms Louisa Cheang 199,074 112,656 128,051 187,464(1)
Mr Nixon L S Chan 11,773 - - 12,073(1)
Ms Kathleen C H Gan 55,332(2) - - 55,332(1)
Ms Margaret W H Kwan 14,224 28,240 22,604 20,009(1)
Mr Kenneth S Y Ng 7,474 - 7,665 -
Mr Peter T S Wong 718,038 263,343 562,525 434,246(1)
Alternate Chief
Executives:
Mrs Eunice L C Y Chan 11,883 6,251 6,670 11,767(1)
Mr Donald Y S Lam 19,824 27,231 23,649 23,694(1)
Mr Andrew W L Leung 17,448 13,019 10,874 20,037(1)
Notes:
(1) This included additional shares arising from scrip dividends.
(2) This represented the awards held by Ms Kathleen C H Gan on 10 May 2019 when she was
appointed as a Non-executive Director of the Bank.
During the first half of 2019, Ms Kathleen C H Gan, Mrs Eunice L C Y Chan and Mr Donald Y S Lam
also acquired and were awarded ordinary shares of HSBC Holdings plc under the HSBC International
Employee Share Purchase Plan. Their interests in ordinary shares of HSBC Holdings plc under this
plan have been included in their “Personal Interests” disclosed in the table under “Interests in shares”.
All the interests stated above represented long positions. As at 30 June 2019, no short positions were
recorded in the Register of Directors’ and Alternate Chief Executives’ Interests and Short Positions
required to be kept under section 352 of the SFO.
No right to subscribe for equity or debt securities of the Bank has been granted by the Bank to, nor
have any such rights been exercised by, any person during the six months ended 30 June 2019.

68
Substantial Interests in Share Capital The register maintained by the Bank pursuant to the SFO recorded that, as at 30 June 2019, the
following corporations had interests or short positions in the shares or underlying shares (as defined in
the SFO) in the Bank set opposite their respective names:
Name of Corporation
Number of Ordinary Shares
in the Bank
(Percentage of total)
The Hongkong and Shanghai Banking
Corporation Limited (“HBAP”)
1,188,057,371 (62.14%)
HSBC Asia Holdings Limited 1,188,057,371 (62.14%)
HSBC Holdings plc 1,188,057,371 (62.14%)
The Hongkong and Shanghai Banking Corporation Limited is a wholly-owned subsidiary of HSBC
Asia Holdings Limited, which in turn is a wholly-owned subsidiary of HSBC Holdings plc.
Accordingly, the interests of The Hongkong and Shanghai Banking Corporation Limited are recorded
as the interests of HSBC Asia Holdings Limited and HSBC Holdings plc.
The Directors regard HSBC Holdings plc to be the beneficial owner of 1,188,057,371 ordinary shares
in the Bank (62.14%).
All the interests stated above represented long positions. As at 30 June 2019, no short positions were
recorded in the Register of Interests in Shares and Short Positions required to be kept under section
336 of the SFO.
Purchase, Sale or Redemption of the Bank’s Listed Securities There was no purchase, sale or redemption by the Bank, or any of its subsidiaries, of the Bank’s listed
securities during the first half of 2019.
Remuneration and Staff Development There have been no material changes to the information disclosed in the Annual Report 2018 in
respect of the remuneration of employees, remuneration policies and staff development.
Corporate Governance Principles and Practices The Bank is committed to maintaining and upholding high standards of corporate governance with a
view to safeguarding the interests of shareholders, customers, employees and other stakeholders. The
Bank has followed the module on “Corporate Governance of Locally Incorporated Authorised
Institutions” under the Supervisory Policy Manual issued by the Hong Kong Monetary Authority. The
Bank has also fully complied with all the code provisions and most of the recommended best practices
set out in the Corporate Governance Code contained in Appendix 14 of the Listing Rules throughout
the six months ended 30 June 2019. Further, the Bank constantly reviews and enhances its corporate
governance framework, by making reference to market trend as well as guidelines and requirements
issued by regulatory authorities, to ensure that it is in line with international and local corporate
governance best practices.
The Audit Committee of the Bank has reviewed the results of the Bank for the six months ended 30
June 2019.
2019 Second Interim Dividend Announcement date 5 August 2019
Ex-dividend date 16 August 2019
Book close and record date 20 August 2019
Payment date 5 September 2019

69
Register of Shareholders The Register of Shareholders of the Bank will be closed on Tuesday, 20 August 2019, during which
no transfer of shares can be registered. To qualify for the second interim dividend, all transfers,
accompanied by the relevant share certificates, must be lodged with the Bank’s Registrar,
Computershare Hong Kong Investor Services Limited, at Shops 1712-1716, 17th Floor, Hopewell
Centre, 183 Queen’s Road East, Wanchai, Hong Kong, for registration not later than 4:30 pm on
Monday, 19 August 2019.

70
Board and Committees
Board
Independent Non-executive Chairman
Raymond CH’IEN Kuo Fung
Executive Directors
Louisa CHEANG (Vice-Chairman and Chief Executive)
Margaret KWAN Wing Han
Non-executive Directors
Nixon CHAN Lik Sang
Kathleen GAN Chieh Huey
Vincent LO Hong Sui
Kenneth NG Sing Yip
Peter WONG Tung Shun
Independent Non-executive Directors
John CHAN Cho Chak
CHIANG Lai Yuen
Irene LEE Yun Lien
Eric LI Ka Cheung
Michael WU Wei Kuo
Committees
Executive Committee
Louisa CHEANG (Chairman)
Eunice CHAN
Ivy CHAN Shuk Pui
Crystal CHEUNG Pui Sze
Liz CHOW Tan Ling
Margaret KWAN Wing Han
Donald LAM Yin Shing
Gilbert LEE Man Lung
Andrew LEUNG Wing Lok
Godwin LI Chi Chung
Ryan SONG Yue Sheng
Elaine WANG Yee Ning
Daphne WAT Wing Kam
WONG May Kay
Katie YIP Kay Chun
Audit Committee
Eric LI Ka Cheung (Chairman)
CHIANG Lai Yuen
Irene LEE Yun Lien
Remuneration Committee
John CHAN Cho Chak (Chairman)
CHIANG Lai Yuen
Raymond CH’IEN Kuo Fung
71
Risk Committee
Irene LEE Yun Lien (Chairman)
Eric LI Ka Cheung
NG Sing Yip, Kenneth
Michael WU Wei Kuo
Nomination Committee
Raymond CH’IEN Kuo Fung (Chairman)
John CHAN Cho Chak
Louisa CHEANG
Peter WONG Tung Shun
Michael WU Wei Kuo
Notes:
(1) Terms of Reference of the Bank’s Audit Committee, Remuneration Committee, Risk Committee
and Nomination Committee are available on the websites of the Bank and Hong Kong Exchanges
and Clearing Limited (“HKEx”).
(2) List of Directors identifying their role and function is available on the websites of the Bank and
HKEx.

72
Registered Office 83 Des Voeux Road Central, Hong Kong
Website: www.hangseng.com
Email: [email protected]
Stock Code The Stock Exchange of Hong Kong Limited: 11
Registrar Computershare Hong Kong Investor Services Limited
Shops 1712-1716, 17th Floor, Hopewell Centre
183 Queen’s Road East, Wanchai, Hong Kong
Depositary* BNY Mellon Shareowner Services
PO Box 505000
Louisville, KY 40233-5000
USA
Website: www.mybnymdr.com
Email: [email protected]
* The Bank offers investors in the United States a Sponsored Level-1 American Depositary Receipts
Programme through The Bank of New York Mellon Corporation.
Interim Report 2019 This Interim Report 2019 in both English and Chinese is now available in printed form and on the
Bank’s website (www.hangseng.com) and the website of HKEx (www.hkexnews.hk).
Shareholders who:
A) browse this Interim Report 2019 on the Bank’s website and wish to receive a printed copy; or
B) receive this Interim Report 2019 in either English or Chinese and wish to receive a printed copy in
the other language version,
may send a request form, which can be obtained from the Bank’s Registrar or downloaded from the
Bank’s website (www.hangseng.com) or HKEx’s website (www.hkexnews.hk), to the Bank’s
Registrar:
Computershare Hong Kong Investor Services Limited
17M Floor, Hopewell Centre
183 Queen’s Road East
Wanchai, Hong Kong
Facsimile: (852) 2529 6087
Email: [email protected]
If shareholders who have chosen (or are deemed to have chosen) to read this Interim Report 2019 on
the Bank’s website, have difficulty in reading or gaining access to this Interim Report 2019 via the
Bank’s website for any reason, the Bank will promptly send this Interim Report 2019 in printed form
free of charge upon the shareholders’ request.
Shareholders may change their choice of means of receipt or language of the Bank’s future corporate
communications at any time, free of charge, by giving the Bank c/o the Bank’s Registrar reasonable
notice in writing or by email to [email protected].