contents journal of hydrology: regional...
TRANSCRIPT

Journal of Hydrology: Regional Studies 4 (2015) 108–122
Contents lists available at ScienceDirect
Journal of Hydrology: RegionalStudies
j ournal homepage: www.elsev ier .com/ locate /e j rh
Effects of land cover change onevapotranspiration and streamflow of smallcatchments in the Upper Xingu River Basin,Central Brazil
Lívia Cristina Pinto Diasa,∗, Márcia N. Macedob,Marcos Heil Costaa, Michael T. Coeb, Christopher Neill c
a The Federal University of Vic osa, Vic osa, MG 36570-900, Brazilb The Woods Hole Research Center, 149 Woods Hole Rd, Falmouth, MA 02540, USAc The Ecosystems Center, Marine Biological Laboratory, 7 MBL Street, Woods Hole, MA 02543, USA
a r t i c l e i n f o
Article history:Received 26 December 2014Received in revised form 7 May 2015Accepted 11 May 2015
Keywords:EvapotranspirationStreamflowModelingXingu BasinAmazonCerrado
a b s t r a c t
Study region: Upper Xingu River Basin, southeastern Amazonia.Study focus: This study assessed the influence of land cover changes on evapo-transpiration and streamflow in small catchments in the Upper Xingu RiverBasin (Mato Grosso state, Brazil). Streamflow was measured in catchments withuniform land use for September 1, 2008 to August 31, 2010. We used mod-els to simulate evapotranspiration and streamflow for the four most commonland cover types found in the Upper Xingu: tropical forest, cerrado (savanna),pasture, and soybean croplands. We used INLAND to perform single point sim-ulations considering tropical rainforest, cerrado and pasturelands, and AgroIBISfor croplands.New hydrological insights for the region: Converting natural vegetation toagriculture substantially modifies evapotranspiration and streamflow in smallcatchments. Measured mean streamflow in soy catchments was about threetimes greater than that of forest catchments, while the mean annual amplitudeof flow in soy catchments was more than twice that of forest catchments. Simu-lated mean annual evapotranspiration was 39% lower in agricultural ecosystems(pasture and soybean cropland) than in natural ecosystems (tropical rainforestand cerrado). Observed and simulated mean annual streamflows in agriculturalecosystems were more than 100% higher than in natural ecosystems. The accu-racy of the simulations was improved by using field-measured soil hydraulicproperties. The inclusion of local measurements of key soil parameters is likelyto improve hydrological simulations in other tropical regions.
© 2015 The Authors. Published by Elsevier B.V. This is an open access articleunder the CC BY-NC-ND license (http://creativecommons.org/licenses/
by-nc-nd/4.0/).
∗ Corresponding author. Tel.: +55 31 3899 1902.E-mail addresses: [email protected] (L.C.P. Dias), [email protected] (M.N. Macedo), [email protected] (M.H. Costa),
[email protected] (M.T. Coe), [email protected] (C. Neill).
http://dx.doi.org/10.1016/j.ejrh.2015.05.0102214-5818/© 2015 The Authors. Published by Elsevier B.V. This is an open access article under the CC BY-NC-ND license(http://creativecommons.org/licenses/by-nc-nd/4.0/).
L.C.P. Dias et al. / Journal of Hydrology: Regional Studies 4 (2015) 108–122 109
1. Introduction
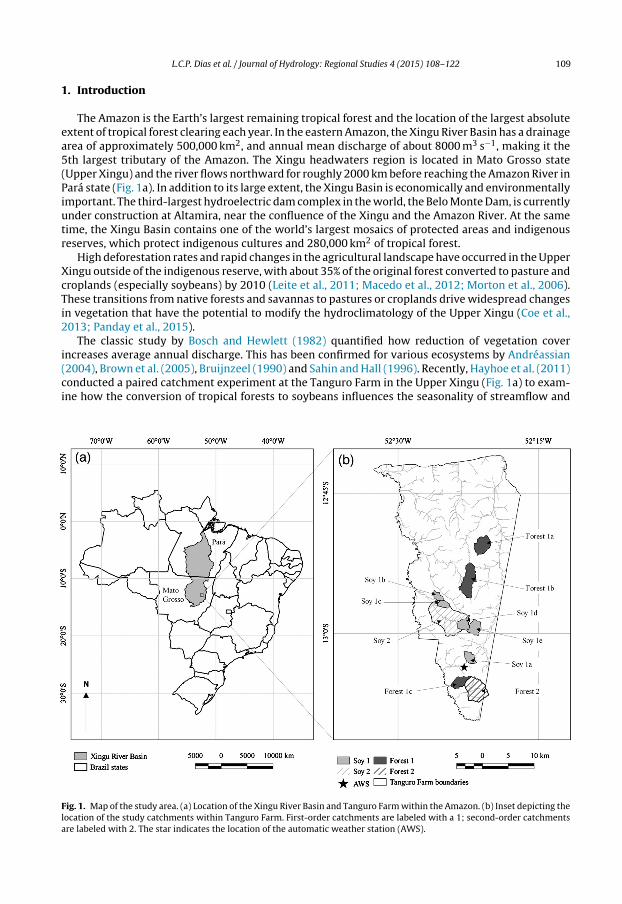
The Amazon is the Earth’s largest remaining tropical forest and the location of the largest absoluteextent of tropical forest clearing each year. In the eastern Amazon, the Xingu River Basin has a drainagearea of approximately 500,000 km2, and annual mean discharge of about 8000 m3 s−1, making it the5th largest tributary of the Amazon. The Xingu headwaters region is located in Mato Grosso state(Upper Xingu) and the river flows northward for roughly 2000 km before reaching the Amazon River inPará state (Fig. 1a). In addition to its large extent, the Xingu Basin is economically and environmentallyimportant. The third-largest hydroelectric dam complex in the world, the Belo Monte Dam, is currentlyunder construction at Altamira, near the confluence of the Xingu and the Amazon River. At the sametime, the Xingu Basin contains one of the world’s largest mosaics of protected areas and indigenousreserves, which protect indigenous cultures and 280,000 km2 of tropical forest.
High deforestation rates and rapid changes in the agricultural landscape have occurred in the UpperXingu outside of the indigenous reserve, with about 35% of the original forest converted to pasture andcroplands (especially soybeans) by 2010 (Leite et al., 2011; Macedo et al., 2012; Morton et al., 2006).These transitions from native forests and savannas to pastures or croplands drive widespread changesin vegetation that have the potential to modify the hydroclimatology of the Upper Xingu (Coe et al.,2013; Panday et al., 2015).
The classic study by Bosch and Hewlett (1982) quantified how reduction of vegetation coverincreases average annual discharge. This has been confirmed for various ecosystems by Andréassian(2004), Brown et al. (2005), Bruijnzeel (1990) and Sahin and Hall (1996). Recently, Hayhoe et al. (2011)conducted a paired catchment experiment at the Tanguro Farm in the Upper Xingu (Fig. 1a) to exam-ine how the conversion of tropical forests to soybeans influences the seasonality of streamflow and
Fig. 1. Map of the study area. (a) Location of the Xingu River Basin and Tanguro Farm within the Amazon. (b) Inset depicting thelocation of the study catchments within Tanguro Farm. First-order catchments are labeled with a 1; second-order catchmentsare labeled with 2. The star indicates the location of the automatic weather station (AWS).

110 L.C.P. Dias et al. / Journal of Hydrology: Regional Studies 4 (2015) 108–122
to quantify the discharge of small catchments under these two types of vegetation cover. The authorsfound that water yield in soybean catchments was approximately fourfold that of forest catchmentsand that stormflows contributed less than 13% of the annual discharge, while baseflow accounted fornearly 90% of annual streamflow in both forest and soybean catchments.
The Upper Xingu is an ideal study area for examining the effects of land cover change on hydrologybecause it spans the transition between evergreen tropical forest in the north and cerrado (Brazil-ian savanna) in the south. This transition zone provides a unique opportunity to study four types ofland cover (tropical forest, cerrado, pasture and soybean) under similar climatological and edaphicconditions.
Land surface models (LSM) have been used to simulate the behavior of the hydrological system atvarious scales in central Brazil (Coe et al., 2011; Panday et al., 2015; Pongratz et al., 2006) and Ama-zonia (Coe et al., 2009; Costa and Foley, 1997). These models describe the flow of water between soil,vegetation, and atmosphere and allow researchers to investigate land surface processes (evapotrans-piration, runoff and drainage), as well as the historical and potential future consequences of climateand deforestation for the regional water balance.
Since the first LSM was developed in the late 1960s, LSMs have been iteratively refined and theycan be classified into generations according to the processes included, as described by Sellers et al.(1997). After the second generation, several important hydrological processes were included, such asbiophysical control of evapotranspiration, precipitation interception, and soil moistures availability.Third- and fourth-generation models include improvements in carbon assimilation and dynamic veg-etation, respectively, and are the most common models used in previous land use change studies inBrazil.
Costa and Foley (1997) used a modified version of the Land Surface Transfer Scheme (LSX; third-generation model; Pollard and Thompson, 1995) to analyze the water balance in the Amazon Basin.This study demonstrated that forest clearing decreases annual evapotranspiration by 12% in the Ama-zon Basin. Pongratz et al. (2006) used the Simple Biosphere Model (SiB2; third-generation model;Sellers et al., 1996a,b), to study the surface energy and water balance in Mato Grosso. Their resultsindicated that forest clearing increases the daily temperature range and that conversion of evergreenforest to C3 croplands decreases the latent heat flux by 21% during the wet season. The IntegratedBiosphere Simulator (IBIS; Foley et al., 1996; Kucharik et al., 2000), a fourth-generation model, hasbeen extensively used to study the influence of deforestation on the discharge of the Amazon Riverand its tributaries (Coe et al., 2011, 2009; Lima et al., 2014; Panday et al., 2015; Stickler et al., 2013).The authors found that large-scale historical deforestation has increased discharge by as much as 20%in large watersheds of the southeastern Amazon.
Independent of the model chosen, the accuracy of simulated results is fundamentally dependenton the parameters chosen. Parameters representing soil hydrological properties such as porosity, fieldcapacity, wilting point and saturated hydraulic conductivity are particularly important because theyinfluence soil water retention, the amount of water available for evapotranspiration (Cuenca et al.,1996; Delire et al., 1997; Marthews et al., 2014), and the resulting water cycle.
This study presents a combination of field measurements and model simulation results for theUpper Xingu focused around three main goals: (1) analysis of water yield data collected in tropi-cal forest and soybean catchments to understand the effects of land cover change on regional waterdynamics; (2) determination of the best set of soil hydrological properties for simulating the partition-ing of annual precipitation into evapotranspiration and discharge in forest and soybean catchments;and (3) investigation of the differences in annual evapotranspiration and streamflow in tropical forest,cerrado, pasture and soybean catchments in the Upper Xingu.
2. Materials and methods
2.1. Site description
The study is centered on the 80,000 ha Tanguro Farm, a large soybean farm located in the UpperXingu Basin, in Mato Grosso, Brazil (Fig. 1). This region is located in the Brazilian Central Plateau,characterized by a generally flat topography and dominated by oxisols with a mean soil texture of
L.C.P. Dias et al. / Journal of Hydrology: Regional Studies 4 (2015) 108–122 111
55% sand, 2% silt, and 43% clay (Hayhoe et al., 2011; Scheffler et al., 2011). Tanguro was originallycovered by transitional tropical forests, with an average canopy height of 20 m and relatively lowspecies diversity compared to the wetter tropical forests occurring further north and west (Balch et al.,2008). During the 1980s, about 32,000 ha were cleared and converted to pasture grasses, consistingmostly of Brachiaria sp. (Scheffler et al., 2011). Between 2004 and 2008, these pasturelands wereconverted to mechanized soy production. This land use history is typical of much of the Upper Xinguregion.
During the study period (2007–2010), soybean was planted near the onset of the rainy season(usually in November). In general, in the first year after conversion, only a single crop of soybeans wasplanted in the field (without crop rotation), and the soil remained exposed between growing seasons.After the first year, typically a single soybean crop was planted in November (using a no-till plantingsystem) and harvested around March, when a cover crop (usually millet) was planted to protect thesoils between growing seasons.
2.2. Discharge and meteorological data
Discharge was measured in twelve headwater catchments located entirely on the Tanguro Farmfrom September 2007 to December 2010. The study catchments included seven soybean (six first-orderand one second-order) and five forested (four first-order and one second-order) streams. Because tenof these catchments were also studied by Hayhoe et al. (2011), we named them following Hayhoeet al. (2011) to facilitate comparison of results between these studies (Fig. 1b). Our study differs fromHayhoe et al. (2011) because it includes two additional catchments (one in forest and one in soybean),an 18-month longer time series, and updated rating curves.
Discharge was estimated based on hourly water level data, following the methods described inHayhoe et al. (2011). Briefly, each basin was gauged with a staff gauge and Onset HOBO U20 WaterLevel data logger, which monitored hourly barometric pressure. Pressure data was converted to waterlevel (depth) using reference air pressure data (logged with an identical unit in a nearby field labo-ratory) and calibrated using the permanent staff gauges at each site. Finally, the entire water leveltime series, including the catchments and time periods reported by Hayhoe et al. (2011), was con-verted to discharge using updated rating curves. The depth-to-discharge relationships were developedfor each catchment based on periodic discharge measurements using a Marsh McBirney Flo-Mate2000 electromagnetic flow meter. Catchment boundaries were delineated based on vegetation-corrected Shuttle Radar Topography Mission (SRTM) data, using standard hydrology tools in ESRIArcGIS 10.2.
Hourly temperature, humidity, wind speed, rainfall, and incoming solar radiation data were mea-sured by an automatic weather station (AWS, Fig. 1b) located inside the Tanguro Farm (Latitude:13◦37′16′′ S; Longitude: 52◦22′55,68′′ W; altitude: 358 m), between January 2007 and December 2011.Where necessary (typically before September 2008) we used the PERSIANN (Precipitation Estimationfrom Remotely Sensed Information using Artifical Neural Networks; Hsu et al., 1997; Sorooshian and Hsu,2000) 0.25◦ global precipitation dataset to fill gaps in the rainfall time series. Missing values for theother variables were filled following the same behavior of the previous adjacent data points.
Incident longwave radiation (Lin) is an input variable required to run the INLAND and Agro-IBISmodels (described in Section 2.3). Although it was not measured directly by the Tanguro AWS, Lin canbe estimated from other measured meteorological variables using previously published equations(Brutsaert, 1975; Idso and Jackson, 1969; Idso, 1981; Prata, 1996; Satterlund, 1979), which are onlyvalid for clear sky conditions. Here, we estimated Lin for all days of the simulation period according tothe empirical equation proposed by Idso (1981), which uses the Stefan–Boltzmann constant (�), airtemperature (T) in Kelvin and water vapor pressure (e) in kPa:
Lin = [0.7 + 5.95 × 10⁻⁵(e exp(1500/T))]�T4
We assume that the errors associated with Lin estimation influenced all simulations equally,enabling analysis of the relative differences in the behavior of the simulated water balance. We

112 L.C.P. Dias et al. / Journal of Hydrology: Regional Studies 4 (2015) 108–122
chose the Idso (1981) equation because it showed the best agreement with measurements of incidentlongwave radiation in pasture and forest sites in southwestern Amazonia (Aguiar et al., 2011).
2.3. Numerical experiment
The Integrated Model of Land Surface Processes (INLAND; Costa et al., manuscript in preparation)is a fifth-generation model that has been developed by Brazilian researchers as part of the Brazil-ian Earth System Model project. This model is an evolution of the IBIS. One of the main goals of theINLAND project is to better represent biomes and important processes in Brazil (such as agriculture).To include agriculture, the Dynamic Model of Agroecosystems (AgroIBIS) is being incorporated intoINLAND. AgroIBIS is a modified version of IBIS capable of simulating phenological and physiologi-cal characteristics of crops (Kucharik and Twine, 2007; Kucharik, 2003). Because the integration ofthese two models was underway when we performed the simulations in this study, we elected touse INLAND version 1.0 and AgroIBIS separately. Because both models are modifications of IBIS, theyshare most water balance equations and their results are directly comparable in the context appliedhere.
These models simulate the exchanges of energy, water, carbon and momentum in thesoil–vegetation–atmosphere system. They represent two layers of vegetation with 12 plant functionaltypes, as well as six soil layers of variable thickness, representing a total of 8 m in depth. Water infil-tration in soil is modeled using Darcy’s equation and soil moisture is based on the flow of Richards’sequation. Plant transpiration is governed by stomatal conductance coupled to photosynthesis (Ballet al., 1987). Total evapotranspiration is the sum of bare soil evaporation, plant transpiration and evap-oration from precipitation intercepted by the canopy (Pollard and Thompson, 1995). Water uptake byplants is a function of atmospheric demand, soil physical properties, root distribution and water inthe soil profile (Kucharik et al., 2000). Finally, surface and subsurface runoff are explicitly simulatedas a function of the water not evapotranspired to the atmosphere (i.e. the difference between rainfalland total evapotranspiration), soil characteristics, vegetation and climate.
We performed single point simulations for tropical forest, cerrado, and pasture land uses in theINLAND model and soybean cropland in the AgroIBIS model. Although we ran the models for the periodfrom January 1, 2007 to December 31, 2011, we analyzed simulation results only for two hydrologicalyears (September 1, 2008 to August, 31 2010). Hourly meteorological data from the AWS at TanguroFarm served as model input data and we considered it representative for all catchments in the study.We used fixed vegetation for the natural ecosystems (cerrado and forest) and pastureland simulations.We specified November 1st as the planting date for single-cropped soybeans and assumed that soilsremained exposed in the periods between plantings. We used fixed concentrations of CO2 at 390 ppmin all simulations.
2.4. Soil hydrological properties
Soil properties in INLAND and AgroIBIS are based on soil texture, and the soil at Tanguro Farm isclassified as sandy clay according to the USDA soil texture triangle. Here, we considered three potentialdata sources to describe the hydrological properties of sandy clay soils: the mean values describedby Campbell and Norman (1998), the pedotransfer functions proposed by Cosby et al. (1984) andobserved data for Tanguro Farm described by Scheffler et al. (2011).
INLAND and AgroIBIS currently use values for porosity (�s), field capacity (�fc), wilting point(�wp), Campbell‘s “b” exponent (b), air entry potential (� ad) and saturated hydraulic conductivity(KS), as recommended by Campbell and Norman (1998). Recently, however, hydrologic properties ofsoils estimated using pedotransfer functions based on soil texture, proposed by Cosby et al. (1984),have been used by the Large-Scale Biosphere-Atmosphere Experiment in Amazonia Data Model Inter-comparison Project (LBA-DMIP; De Gonc alves et al., 2013). In addition, Scheffler et al. (2011) measuredin situ values of KS under forest, pasture and soybean covers on Tanguro Farm.
For each land cover (forest, cerrado, pasture, and soybean), we assessed four sets of soil hydraulicparameters to identify the combination that provides the smallest difference between simulated data
L.C.P. Dias et al. / Journal of Hydrology: Regional Studies 4 (2015) 108–122 113
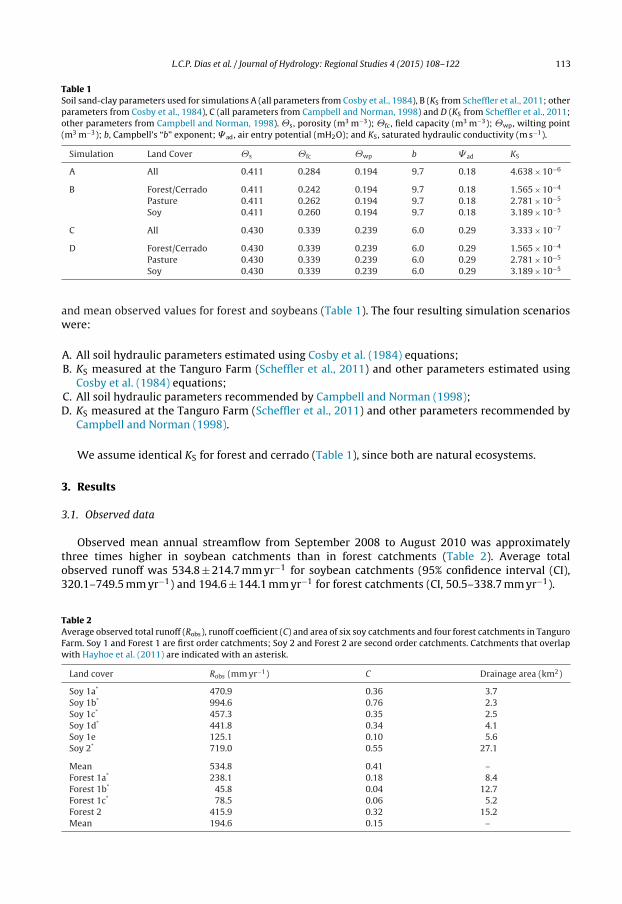
Table 1Soil sand-clay parameters used for simulations A (all parameters from Cosby et al., 1984), B (KS from Scheffler et al., 2011; otherparameters from Cosby et al., 1984), C (all parameters from Campbell and Norman, 1998) and D (KS from Scheffler et al., 2011;other parameters from Campbell and Norman, 1998). �s, porosity (m3 m−3); �fc, field capacity (m3 m−3); �wp, wilting point(m3 m−3); b, Campbell’s “b” exponent; � ad, air entry potential (mH2O); and KS, saturated hydraulic conductivity (m s−1).
Simulation Land Cover �s �fc �wp b � ad KS
A All 0.411 0.284 0.194 9.7 0.18 4.638 × 10⁻⁶
B Forest/Cerrado 0.411 0.242 0.194 9.7 0.18 1.565 × 10⁻⁴
Pasture 0.411 0.262 0.194 9.7 0.18 2.781 × 10⁻⁵
Soy 0.411 0.260 0.194 9.7 0.18 3.189 × 10⁻⁵
C All 0.430 0.339 0.239 6.0 0.29 3.333 × 10⁻⁷
D Forest/Cerrado 0.430 0.339 0.239 6.0 0.29 1.565 × 10⁻⁴
Pasture 0.430 0.339 0.239 6.0 0.29 2.781 × 10⁻⁵
Soy 0.430 0.339 0.239 6.0 0.29 3.189 × 10⁻⁵
and mean observed values for forest and soybeans (Table 1). The four resulting simulation scenarioswere:
A. All soil hydraulic parameters estimated using Cosby et al. (1984) equations;B. KS measured at the Tanguro Farm (Scheffler et al., 2011) and other parameters estimated using
Cosby et al. (1984) equations;C. All soil hydraulic parameters recommended by Campbell and Norman (1998);D. KS measured at the Tanguro Farm (Scheffler et al., 2011) and other parameters recommended by
Campbell and Norman (1998).
We assume identical KS for forest and cerrado (Table 1), since both are natural ecosystems.
3. Results
3.1. Observed data
Observed mean annual streamflow from September 2008 to August 2010 was approximatelythree times higher in soybean catchments than in forest catchments (Table 2). Average totalobserved runoff was 534.8 ± 214.7 mm yr−1 for soybean catchments (95% confidence interval (CI),320.1–749.5 mm yr−1) and 194.6 ± 144.1 mm yr−1 for forest catchments (CI, 50.5–338.7 mm yr−1).
Table 2Average observed total runoff (Robs), runoff coefficient (C) and area of six soy catchments and four forest catchments in TanguroFarm. Soy 1 and Forest 1 are first order catchments; Soy 2 and Forest 2 are second order catchments. Catchments that overlapwith Hayhoe et al. (2011) are indicated with an asterisk.
Land cover Robs (mm yr−1) C Drainage area (km2)
Soy 1a* 470.9 0.36 3.7Soy 1b* 994.6 0.76 2.3Soy 1c* 457.3 0.35 2.5Soy 1d* 441.8 0.34 4.1Soy 1e 125.1 0.10 5.6Soy 2* 719.0 0.55 27.1
Mean 534.8 0.41 –Forest 1a* 238.1 0.18 8.4Forest 1b* 45.8 0.04 12.7Forest 1c* 78.5 0.06 5.2Forest 2 415.9 0.32 15.2Mean 194.6 0.15 –

114 L.C.P. Dias et al. / Journal of Hydrology: Regional Studies 4 (2015) 108–122
Fig. 2. Precipitation and mean daily total runoff for forest and soybean catchments in the Upper Xingu (time period September2008 and August 2010).
During this period, the average rainfall was 1301 mm yr−1. The ratio between the average annualtotal runoff and average annual rainfall (runoff coefficient, C) was 0.41 (standard deviation, SD = 0.20)in soybean catchments and 0.15 (SD = 0.11) in forest catchments (Table 2).
The dry and wet seasons were well separated, with the wet season occurring between Septemberand April and the dry season between May and August (Fig. 2). Mean precipitation during the wetand dry months was 5.9 and 0.1 mm day−1, respectively. The average maximum streamflows in thetwo hydrological years was 1.8 mm day−1 for soybean catchments and 0.6 mm day−1 for forest catch-ments. The mean annual amplitude of the flow (the mean difference between maximum and minimumstreamflows) in soybean catchments (0.7 mm day−1) was more than twice that of forest catchments(0.3 mm day−1).
3.2. Simulated results
The difference between mean total precipitation (Fig. 3 dashed line) and the sum of the threesimulated components of the water balance (evapotranspiration, surface runoff and subsurface runoff)was the mean net change in groundwater storage (Fig. 3). The mean annual groundwater storage termwas negative for all simulated sets of parameters and land covers, except for soybeans in simulation C.Negative groundwater storage meant that there was a net removal of water stored in the soil duringthe analyzed period. The simulated annual discharge (total runoff) was the sum of simulated annualsurface and subsurface runoffs.
Simulation B predicted the smallest difference between simulated data and the mean observedvalues for both forest and soybeans (Fig. 4). Moreover, for soybean catchments, simulations A, B, and Cpredict simulated total runoff within the range of observed discharge, but only simulation B predictstotal runoff within the observed range for forest catchments. Therefore, simulation B was used toanalyze the effect of land cover change on evapotranspiration and streamflow in the Upper XinguBasin. Unless otherwise noted, henceforth all simulated results refer to simulation B.
Simulated evapotranspiration was 39% lower (Table 3) in agricultural ecosystems (pasture andsoybean) compared with natural ecosystems (tropical forest and cerrado). Simulated mean annualtotal runoff for soybean cover was twice that of forest cover. Considering the four types of land use,the mean annual simulated streamflow in agricultural ecosystems (pasture and soybeans) was 114%higher than in natural ecosystems (forest and cerrado).

L.C.P. Dias et al. / Journal of Hydrology: Regional Studies 4 (2015) 108–122 115
Fig. 3. Simulated water balance with different soil hydraulic parameters. The difference between mean total precipitation(1301 mm yr−1, dashed line) and the sum of the three simulated components of the water balance is the mean net change ingroundwater storage. Simulations with (A) all parameters estimated using Cosby et al. (1984); (B) KS measured at Tanguro Farmby Scheffler et al. (2011) and the other parameters estimated using Cosby et al. (1984); (C) the values of Campbell and Norman(1998) were used for all parameters; and (D) KS measured at Tanguro Farm by Scheffler et al. (2011) and Campbell and Norman(1998) values in the other parameters.

116 L.C.P. Dias et al. / Journal of Hydrology: Regional Studies 4 (2015) 108–122
Fig. 4. Mean annual discharges observed (Robs), mean of Robs (R) for each land cover, and mean annual discharge simulated (Rs)for each land cover and four sets of soil hydraulic parameters for sandy clay soil. Small letters define catchments with forest orsoy (Fig. 1 and Table 1) and capital letters define the different set of soil hydraulic parameters. Error bars indicate the confidenceinterval at 95%.
Table 3Water balance predicted by simulation B (KS from Scheffler et al., 2011; other parameters from Cosby et al., 1984) for the periodfrom September 2008 and August 2010 (mm yr−1). The mean precipitation in this period was 1301 mm yr−1.
Evapotranspiration Surface runoff Subsurface runoff Total runoff Net change ingroundwater storage
Forest 1024.7 0.2 322.3 322.5 −46.7Cerrado 1009.5 0.2 324.9 325.1 −34.1Mean 1017.1 0.2 323.6 323.8 −40.4Pasture 567.3 5.5 744.2 749.7 −16.6Soy 678.5 43.3 594.3 637.6 −15.6Mean 622.9 24.4 669.3 693.7 −16.1
Simulated surface runoff was greater in agricultural ecosystems than in natural ecosystems(Table 3). Subsurface runoff represented 99% of the total runoff in the simulation with forest cover,compared to 93% for soybean cover. Considering all simulated land uses, subsurface runoff repre-sented 96% of total runoff in agricultural ecosystems and approximately 100% of total runoff in naturalecosystems. Although the simulated surface runoff was slightly greater in agricultural ecosystemsthan in natural ecosystems, most of the increase in mean annual discharge was due to an increase ingroundwater flow. The runoff coefficients for forest, cerrado, pasture and soybeans catchments were0.25, 0.25, 0.58 and 0.49, respectively.
4. Discussion
By combining field measurements in paired catchments with numerical modeling, our resultsprovide insights into how the conversion of tropical forest or cerrado to pasture or soybean alters the

L.C.P. Dias et al. / Journal of Hydrology: Regional Studies 4 (2015) 108–122 117
partitioning of rainfall into evapotranspiration and streamflow. We found that replacement of nativevegetation with other land covers substantially increased water yield, which supports the results ofseveral previous studies (Andréassian, 2004; Bosch and Hewlett, 1982; Brown et al., 2005; Bruijnzeel,1990; Hayhoe et al., 2011; Sahin and Hall, 1996; Tomasella et al., 2009). Mean annual observed stream-flow was three times larger in soybean catchments than in forest catchments, primarily because ofdecreased evapotranspiration. The lower leaf area index (LAI), shallower root depth, higher albedo,lower surface roughness and lower transfer of energy and momentum all contribute to reducing evapo-transpiration in soybean areas (Bonan et al., 1992; Costa and Foley, 2000; Costa et al., 2007; Pongratzet al., 2006; Sampaio et al., 2007).
The variability in observed discharge among Upper Xingu catchments of comparable land use can-not be fully explained by stream slope or catchment area (Hayhoe et al., 2011). Based on our simulatedresults, which examined the impact of different KS on forest discharge, and field measurements of dis-charge in the Forest 1a and 1b catchments, we conclude that soil properties alone cannot explainthe discharge variability between sites. Total simulated runoff decreased exponentially with increas-ing KS in forest sites, converging to roughly 300 mm yr−1. A simulation using KS 100-times smallerthan that measured in situ resulted in a simulated discharge only twice as high that under simula-tion B conditions. Although these results suggest that flow should vary significantly with changesin KS, Scheffler et al. (2011) reported no significant difference in KS at the Forest 1a and 1b catch-ments. Despite similar soil hydraulic characteristics, Forest 1a discharge was fivefold that of Forest1b (Table 2).
Having eliminated KS, stream slope, and catchment area as major contributing factors, we con-clude that other factors account for the large difference in discharge. Possible causes of this variabilityinclude measurement errors, underflow beneath the monitored streams and flow between the basins(Hayhoe et al., 2011). This phenomenon is possible in flat landscapes with deep well-drained soils(Bruijnzeel, 1990) like those found in the Upper Xingu, but we were unable to refute or confirm it in thisstudy.
The partitioning of total runoff into surface and sub-surface components was considerably alteredwith measured KS. The Campbell and Norman (1998) and Cosby et al. (1984) pedotransfer equa-tions underestimate KS compared to the field measurements reported by Scheffler et al. (2011). Thisis likely because these equations were developed to predict temperate soil properties and poorlyrepresent the behavior of tropical soils. Unlike temperate soils, tropical oxisols are highly leached,are predominantly 1:1 clay minerals and have high concentrations of aluminum and iron oxides(Barros and van Lier, 2014). Aluminum and iron oxides are the primary stabilizing agents for soilaggregates and well-aggregated soils are well-drained. Because the two indirect sources of soil prop-erties data used in this study did not represent the well-drained sandy clay soils typical of ourstudy area, the simulations relying exclusively on using only Campbell and Norman (1998) or Cosbyet al. (1984) resulted in a greater difference between simulated data and observed runoff, com-pared with simulations that partially included field measurements of soil characteristics. SimulationB included the measured KS and better represented the water balance components for the UpperXingu.
In simulation B, evapotranspiration was 1025 mm yr−1 for forest and 1010 mm yr−1 cerrado. Theforests at Tanguro Ranch occur at the transition between the Cerrado and Amazon biomes and arecharacterized by shorter stature and lower LAI than the dense forests found in northern Amazonia(Balch et al., 2008). Studies of similar transitional forests in Sinop (Costa et al., 2010; Vourlitis et al.,2008, 2002) estimated evapotranspiration rates ranging from 822 to 1300 mm yr−1. For dense cer-rado physiognomies (cerradão) and cerrado sensu stricto, tree-dominant savannahs expected along theAmazon-Cerrado ecotone, previous studies suggest evapotranspiration ranging from approximately800 to 1442 mm yr−1 (Giambelluca et al., 2009; Oliveira et al., 2005). Our simulated evapotranspirationfor both forest and cerrado was well within the range of those previously reported in the literature.
Our simulation results indicate that evapotranspiration was similar in forest and cerrado catch-ments. This is consistent with previous findings, which suggest that transitional forests and cerradoscan have similar evapotranspiration if surface soil water availability is sufficient (Rodrigues et al.,2014). Tropical forests and cerrados thus exhibit similar evapotranspiration in transitional areas, giventhat both were constrained by the same climate and water availability during our simulations.

118 L.C.P. Dias et al. / Journal of Hydrology: Regional Studies 4 (2015) 108–122
Fig. 5. Observed precipitation and simulated evapotranspiration, surface runoff and sub-surface runoff seasonality for (a)tropical forest, (b) cerrado, (c) pasture, and (d) soybeans in mm month-1. The difference between monthly precipitation (solidline) and the sum of the three simulated components of the water balance (vertical bars) is equal to the net change in soil waterstorage (positive numbers represent soil water recharge; negative numbers represent soil water depletion).

L.C.P. Dias et al. / Journal of Hydrology: Regional Studies 4 (2015) 108–122 119
Our simulated pasture evapotranspiration (567 mm yr−1) was lower than values previouslyreported in the literature for this region, which range from 822 to 982 mm yr−1 for Mato Grosso(Lathuillière et al., 2012; Priante-Filho et al., 2004). Measured evapotranspiration for soybean areasin Mato Grosso were unavailable, but Lathuillière et al. (2012) conducted an indirect measurementexperiment with remote sensing products and crop modeling. Their estimates suggest that mean soy-bean evapotranspiration in Mato Grosso (540 mm yr−1 or 4.4 mm day−1, over the growing season)was lower than our simulated evapotranspiration for soybean (679 mm yr−1). Our simulated soybeanevapotranspiration may be higher than that of Lathuillière et al. (2012) because we included transpi-ration by soybeans during the growing season and evaporation throughout the year. Our simulatedpasture and soybean evapotranspiration corresponded to 44% and 52%, respectively, of the meanprecipitation.
Simulated evapotranspiration in agricultural ecosystems (pasture and soybean catchments) wasabout 39% lower than in natural ecosystems (forest and cerrado catchments). This is comparable toobserved evapotranspiration reductions of about 36% following deforestation and pasture establish-ment in an area of Maranhão state (Oliveira et al., 2014).
Between April and August each year, the amount of precipitation was lower than the sum of evapo-transpiration and total runoff (Fig. 5), indicating that vegetation was under water stress during thisperiod. Unlike wet equatorial forests, where solar radiation availability is an important factor con-trolling evapotranspiration, seasonally dry tropical forests are largely controlled by seasonal trends inrainfall and the biotic response of plants to water stress (Costa et al., 2010; Vourlitis et al., 2008). Thedry season was an equally important control on evapotranspiration in forest and cerrado ecosystems,consistent with previous studies (Biudes et al., 2015; Da Rocha et al., 2009; Rodrigues et al., 2014;Vourlitis et al., 2014). Evapotranspiration in perennial vegetation (forest, cerrado, and pasture) wassomewhat greater during the dry season than the wet season, in response to the larger vapor pressuredeficit, as previously reported by Costa et al. (2010). For soybeans, the growing season from Novemberto February had greater evapotranspiration than the dry season.
Both observed and simulated results agree that the replacement of natural vegetation by agricultureincreases streamflow by more than 100% in the Upper Xingu. Simulated mean annual total runoff forsoybeans was twice that of forests (638 and 323 mm yr−1).
Simulated subsurface runoff was 96% of annual total runoff in agricultural ecosystems and nearly100% of annual total runoff in the natural ecosystems. These findings were consistent with the resultsreported by Hayhoe et al. (2011), who found that baseflow represented 96% of the discharge in for-est and 94% of the discharge in soybean catchments in the Upper Xingu. However, the simulatedsubsurface runoff was highly seasonal, and reduced to near zero during the dry season (Fig. 5).
Agricultural ecosystems are generally expected to have larger surface runoff than natural ecosys-tems, which may cause environmental problems such as erosion and the loss of soil nutrients. However,the soil infiltrability and saturated hydraulic conductivity in this region were very high even after con-version of the landscape to agriculture. As a result, large soil infiltration and groundwater recharge –not increases in surface runoff – were the primary factor accounting for observed increases in totalrunoff in agricultural ecosystems. It is unclear whether other environmental problems may result fromthese increases in surface runoff. As noted by Neill et al. (2013), we do not yet know the full extent ofareas with erosion nor the potential for increased erosion if a prolonged period of agriculture were toincrease soil compaction in this region.
5. Conclusions
Observed and simulated results show that converting natural vegetation to agriculture sub-stantially modifies the water balance components in small catchments in the Upper Xingu. Fieldobservations indicated that mean streamflow in soy catchments was about three times greater thanthat of forest catchments, while the mean annual amplitude of observed flow was more than twotimes larger in soy than in forest areas.
Modeled results showed about 40% less evapotranspiration in agricultural ecosystems (pasture andsoybean catchments) than in natural ecosystems (forest and cerrado catchments), whereas average

120 L.C.P. Dias et al. / Journal of Hydrology: Regional Studies 4 (2015) 108–122
total discharge was about 100% higher in agricultural ecosystems than in natural ecosystems in theUpper Xingu.
Our study is a first step toward understanding the evapotranspiration and streamflow for fourtypes of land cover in the study region. Future studies can investigate whether the consequencesof increased water yield in headwater catchments can be detected in higher-order watersheds andhow these cumulative disturbances might compromise the economic and environmental health of theXingu River Basin. In situ data on soil parameters was essential to simulating the hydrologic behaviorof this region. Therefore, future research should also focus on improving estimates of soil hydraulicproperties in tropical soils, given the importance of these soil parameters for accurately simulatingthe water balance.
Conflict of interest
No conflict of interest.
Acknowledgments
We would like to acknowledge the Amazon Environmental Research Institute (IPAM) for weatherstation data and assistance with field data collection, as well as Grupo A. Maggi for providing accessto the study site. We thank Shelby Riskin (nee Hayhoe), Richard McHorney, and Suzanne Spitzerfor contributing and compiling streamflow data from Tanguro. This study was supported by the USNational Science Foundation (DEB-0949996, DEB-0743703), the Gordon and Betty Moore Foundation,and the Conselho Nacional de Desenvolvimento Científico e Tecnológico (CNPq, process 135648/2011-4).
References
Aguiar, L.J.A., Costa, J.M.N., Fischer, G.R., Aguiar, R.G., Costa, A.C.L., Ferreira, W.P.M., 2011. Estimativa da radiac ão de onda longaatmosférica em áreas de floresta e de pastagem no sudoeste da Amazônia. Rev. Bras. Meteorol. 26, 215–224.
Andréassian, V., 2004. Waters and forests: from historical controversy to scientific debate. J. Hydrol. 291, 1–27,http://dx.doi.org/10.1016/j.jhydrol.2003.12.015.
Balch, J.K., Nepstad, D.C., Brando, P.M., Curran, L.M., Portela, O., de Carvalho, O., Lefebvre, P., 2008. Negative fire feed-back in a transitional forest of southeastern Amazonia. Glob. Chang. Biol. 14, 2276–2287, http://dx.doi.org/10.1111/j.1365-2486.2008.01655.x.
Ball, J.T., Woodrow, I.E., Berry, J.A., 1987. A model predicting stomatal conductance and its contribution to the control of photo-synthesis under different light conditions. In: Biggins, J. (Ed.), Progress in Photosynthetic Research. Springer, Netherlands,Dordrecht, pp. 221–224.
Barros, A.H.C., van Lier, Q.J., 2014. Pedotransfer functions for Brazilian soils. In: Teixeira, W.G., Ceddia, M.B., Ottoni, M.V., Don-nagema, G.K. (Eds.), Application of Soil Physics in Environmental Analyses. Springer International Publishing, pp. 131–162,http://dx.doi.org/10.1007/978-3-319-06013-2 6.
Biudes, M.S., Vourlitis, G.L., Machado, N.G., de Arruda, P.H.Z., Neves, G.A.R., de Almeida Lobo, F., Neale, C.M.U., de Souza Nogueira,J., 2015. Patterns of energy exchange for tropical ecosystems across a climate gradient in Mato Grosso. Brazil. Agric. For.Meteorol. 202, 112–124, http://dx.doi.org/10.1016/j.agrformet.2014.12.008.
Bonan, G.B., Polard, D., Tompson, S.L., 1992. Effects of boreal forest vegetation on global climate. Nature 359, 716–718.Bosch, J.M., Hewlett, J.D., 1982. A review of catchment experiments to determine the effect of vegetation changes on water yield
and evapotranspiration. J. Hydrol. 55, 3–23.Brown, A.E., Zhang, L., McMahon, T.A., Western, A.W., Vertessy, R.A., 2005. A review of paired catchment studies for
determining changes in water yield resulting from alterations in vegetation. J. Hydrol. 310, 28–61, http://dx.doi.org/10.1016/j.jhydrol.2004.12.010.
Bruijnzeel, L.A., 1990. Hydrology of Moist Forest and the Effects of Conversion: A State of Knowledge Review. UNESCO, Parisand Amsterdam.
Brutsaert, W., 1975. On a derivable formula for long-wave radiation from clear skies. Water Resour. Res. 11, 742–744.Campbell, G.S., Norman, J.M., 1998. An Introduction to Environmental Biophysics, 2nd. ed. Springer, New York, NY,
http://dx.doi.org/10.1007/978-1-4612-1626-1.Coe, M.T., Costa, M.H., Soares-Filho, B.S., 2009. The influence of historical and potential future deforestation on the stream
flow of the Amazon River – Land surface processes and atmospheric feedbacks. J. Hydrol. 369, 165–174, http://dx.doi.org/10.1016/j.jhydrol.2009.02.043.
Coe, M.T., Latrubesse, E.M., Ferreira, M.E., Amsler, M.L., 2011. The effects of deforestation and climate variability on the stream-flow of the Araguaia River. Brazil. Biogeochem. 105, 119–131, http://dx.doi.org/10.1007/s10533-011-9582-2.
Coe, M.T., Marthews, T.R., Costa, M.H., Galbraith, D.R., Greenglass, N.L., Imbuzeiro, H.M.A., Levine, N.M., Malhi, Y., Moor-croft, P.R., Muza, M.N., Powell, T.L., Saleska, S.R., Solorzano, L.A., Wang, J., 2013. Deforestation and climate feedbacks

L.C.P. Dias et al. / Journal of Hydrology: Regional Studies 4 (2015) 108–122 121
threaten the ecological integrity of south-southeastern Amazonia. Philos. Trans. R. Soc. Lond. B. Biol. Sci. 368, 20120155,http://dx.doi.org/10.1098/rstb.2012.0155.
Cosby, B.J., Hornberger, G.M., Clapp, R.B., Ginn, T.R., 1984. A statistical exploration of the relationships of soil moisture charac-teristics to the physical properties of soils. Water Resour. Res. 20, 682–690, http://dx.doi.org/10.1029/WR020i006p00682.
Costa, M.H., Biajoli, M.C., Sanches, L., Malhado, A.C.M., Hutyra, L.R., Da Rocha, H.R., Aguiar, R.G., De Araújo, A.C., 2010. Atmosphericversus vegetation controls of Amazonian tropical rain forest evapotranspiration: Are the wet and seasonally dry rain forestsany different? J. Geophys. Res. Biogeosci. 115, 1–9, http://dx.doi.org/10.1029/2009JG001179.
Costa, M.H., Foley, J.A., 1997. Water balance of the Amazon Basin: dependence on vegetation cover and canopy conductance. J.Geophys. Res. 102, 23973–23989.
Costa, M.H., Foley, J.A., 2000. Combined effects of deforestation and doubled atmospheric CO2 concentrations on the climate ofAmazonia. J. Clim. 13, 18–34.
Costa, M.H., Yanagi, S.N.M., Souza, P.J.O.P., Ribeiro, A., Rocha, E.J.P., 2007. Climate change in Amazonia caused bysoybean cropland expansion, as compared to caused by pastureland expansion. Geophys. Res. Lett. 34, L07706,http://dx.doi.org/10.1029/2007GL029271.
Cuenca, R.H., Ek, M., Mahrt, L., 1996. Impact of soil water property parameterization on atmospheric boundary layer simulation.J. Geophys. Res. 101, 7269–7277, http://dx.doi.org/10.1029/95JD02413.
Da Rocha, H.R., Manzi, A.O., Cabral, O.M., Miller, S.D., Goulden, M.L., Saleska, S.R., R.-Coupe, N., Wofsy, S.C., Borma, L.S., Artaxo,P., Vourlitis, G., Nogueira, J.S., Cardoso, F.L., Nobre, A.D., Kruijt, B., Freitas, H.C., von Randow, C., Aguiar, R.G., Maia, J.F., 2009.Patterns of water and heat flux across a biome gradient from tropical forest to savanna in Brazil. J. Geophys. Res. 114,G00B12, http://dx.doi.org/10.1029/2007JG000640.
De Goncalves, L.G.G., Borak, J.S., Costa, M.H., Saleska, S.R., Baker, I., Restrepo-Coupe, N., Muza, M.N., Poulter, B., Verbeeck,H., Fisher, J.B., Arain, M.A., Arkin, P., Cestaro, B.P., Christoffersen, B., Galbraith, D., Guan, X., van den Hurk, B.J.J.M., Ichii,K., Imbuzeiro, H.M.A., Jain, A.K., Levine, N., Lu, C., Miguez-Macho, G., Roberti, D.R., Sahoo, A., Sakaguchi, K., Schaefer,K., Shi, M., Shuttleworth, W.J., Tian, H., Yang, Z.-L., Zeng, X., 2013. Overview of the Large-Scale Biosphere–AtmosphereExperiment in Amazonia Data Model Intercomparison Project (LBA-DMIP). Agric. For. Meteorol. 182–183, 111–127,http://dx.doi.org/10.1016/j.agrformet.2013.04.030.
Delire, C., Calvet, J., Noilhan, J., 1997. Physical properties of Amazonian soils: a modeling study using the Anglo-BrazilianAmazonian climate observation study data. J. Geophys. Res. 102, 119–130.
Foley, J.A., Prentice, I.C., Ramankutty, N., Levis, S., Pollard, D., Sitch, S., Haxeltine, A., 1996. An integrated biosphere model of landsurface processes, terrestrial carbon balance, and vegetation dynamics. Global Biogeochem. Cycles 10, 603–628.
Giambelluca, T.W., Scholz, F.G., Bucci, S.J., Meinzer, F.C., Goldstein, G., Hoffmann, W.a., Franco, A.C., Buchert, M.P., 2009. Evapo-transpiration and energy balance of Brazilian savannas with contrasting tree density. Agric. For. Meteorol. 149, 1365–1376,http://dx.doi.org/10.1016/j.agrformet.2009.03.006.
Hayhoe, S.J., Neill, C., Porder, S., McHorney, R., Lefebvre, P., Coe, M.T., Elsenbeer, H., Krusche, A.V., 2011. Conversion to soy onthe Amazonian agricultural frontier increases streamflow without affecting stormflow dynamics. Glob. Chang. Biol. 17,1821–1833, http://dx.doi.org/10.1111/j.1365-2486.2011.02392.x.
Hsu, K., Gao, X., Sorooshian, S., Gupta, H., 1997. Precipitation estimation from remotely sensed information using artificial neuralnetworks. J. Appl. Meteorol. 36, 1176–1190.
Idso, S.B., 1981. A set of equations for full spectrum and 8 to 14 �m and 10.5 to 12.5 �m thermal radiation from cloudless skies.Water Resour. Res. 17, 295–304.
Idso, S.B., Jackson, R.D., 1969. Thermal radiation from the atmosphere. J. Geophys. Res. 74, 5397–5403.Kucharik, C.J., 2003. Evaluation of a Process-Based Agro-Ecosystem Model (Agro-IBIS) across the U.S. Corn Belt:
Simulations of the Interannual Variability in Maize Yield. Earth Interact. 7, 1–33, http://dx.doi.org/10.1175/1087-3562(2003)007<0001:EOAPAM>2.0.CO;2.
Kucharik, C.J., Foley, J.A., Delire, C., Fisher, V.A., Coe, M.T., Lenters, J.D., Young-Molling, C., Ramankutty, N., Norman, J.M., Gower,S.T., 2000. Testing the performance of a dynamic global ecosystem model: water balance, carbon balance, and vegetationstructure. Global Biogeochem. Cycles 14, 795–825, http://dx.doi.org/10.1029/1999GB001138.
Kucharik, C.J., Twine, T.E., 2007. Residue, respiration, and residuals: Evaluation of a dynamic agroecosystem modelusing eddy flux measurements and biometric data. Agric. For. Meteorol. 146, 134–158, http://dx.doi.org/10.1016/j.agrformet.2007.05.011.
Lathuillière, M.J., Johnson, M.S., Donner, S.D., 2012. Water use by terrestrial ecosystems: temporal variability in rain-forest and agricultural contributions to evapotranspiration in Mato Grosso. Brazil. Environ. Res. Lett. 7, 1–12,http://dx.doi.org/10.1088/1748-9326/7/2/024024.
Leite, C.C., Costa, M.H., de Lima, C.A., Ribeiro, C.A.A.S., Sediyama, G.C., 2011. Historical reconstruction of land use in the BrazilianAmazon (1940–1995). J. Land Use Sci. 6, 33–52, http://dx.doi.org/10.1080/1747423X.2010.501157.
Lima, L.S., Coe, M.T., Soares Filho, B.S., Cuadra, S.V., Dias, L.C.P., Costa, M.H., Lima, L.S., Rodrigues, H.O., 2014. Feedbacks betweendeforestation, climate, and hydrology in the Southwestern Amazon: Implications for the provision of ecosystem services.Landsc. Ecol. 29, 261–274, http://dx.doi.org/10.1007/s10980-013-9962-1.
Macedo, M.N., DeFries, R.S., Morton, D.C., Stickler, C.M., Galford, G.L., Shimabukuro, Y.E., 2012. Decoupling of deforesta-tion and soy production in the southern Amazon during the late 2000s. Proc. Natl. Acad. Sci. U. S. A. 109, 1341–1346,http://dx.doi.org/10.1073/pnas.1111374109.
Marthews, T.R., Quesada, C.A., Galbraith, D.R., Malhi, Y., Mullins, C.E., Hodnett, M.G., Dharssi, I., 2014. High-resolution hydraulic parameter maps for surface soils in tropical South America. Geosci. Model Dev. 7, 711–723,http://dx.doi.org/10.5194/gmd-7-711-2014.
Morton, D.C., DeFries, R.S., Shimabukuro, Y.E., Anderson, L.O., Arai, E., del Bon Espirito-Santo, F., Freitas, R., Morisette, J., 2006.Cropland expansion changes deforestation dynamics in the southern Brazilian Amazon. Proc. Natl. Acad. Sci. U. S. A. 103,14637–14641, http://dx.doi.org/10.1073/pnas.0606377103.
Neill, C., Coe, M.T., Riskin, S.H., Krusche, A.V., Elsenbeer, H., Macedo, M.N., McHorney, R., Lefebvre, P., Davidson, E.A., Scheffler,R., Figueira, A.M.S., Porder, S., Deegan, L.A., 2013. Watershed responses to Amazon soya bean cropland expansion andintensification. Philos. Trans. R. Soc. Lond. B. Biol. Sci. 368, 20120425, http://dx.doi.org/10.1098/rstb.2012.0425.

122 L.C.P. Dias et al. / Journal of Hydrology: Regional Studies 4 (2015) 108–122
Oliveira, P.T.S., Nearing, M.A., Moran, M.S., Goodrich, D.C., Wendland, E., Gupta, H.V., 2014. Trends in water balance componentsacross the Brazilian Cerrado. Water Resour. Res., http://dx.doi.org/10.1002/2013WR015202.
Oliveira, R.S., Bezerra, L., Davidson, E.A., Pinto, F., Klink, C.A., Nepstad, D.C., Moreira, A., 2005. Deep root func-tion in soil water dynamics in cerrado savannas of central Brazil. Funct. Ecol. 19, 574–581, http://dx.doi.org/10.1111/j.1365-2435.2005.01003.x.
Panday, P.K., Coe, M.T., Macedo, M.N., Lefebvre, P., Castanho, A.D.D.A., 2015. Deforestation offsets water balance changesdue to climate variability in the Xingu River in eastern Amazonia. J. Hydrol. 523, 822–829, http://dx.doi.org/10.1016/j.jhydrol.2015.02.018.
Pollard, D., Thompson, S.L., 1995. Use of a land-surface-transfer scheme (LSX) in a global climate model: the response to doublingstomatal resistance. Glob. Planet. Change 10, 129–161, http://dx.doi.org/10.1016/0921-8181(94)00023-7.
Pongratz, J., Bounoua, L., DeFries, R.S., Morton, D.C., Anderson, L.O., Mauser, W., Klink, C.A., 2006. The impact of land cover changeon surface energy and water balance in Mato Grosso. Brazil. Earth Interact. 10, 1–17, http://dx.doi.org/10.1175/EI176.1.
Prata, A.J., 1996. A new long-wave formula for estimating downward clear-sky radiation at the surface. Q. J. R. Meteorol. Soc.122, 1127–1151.
Priante-Filho, N., Vourlitis, G.L., Hayashi, M.M.S., Nogueira, J.D.S., Campelo, J.H., Nunes, P.C., Souza, L.S.E., Couto, E.G., Hoeger,W., Raiter, F., Trienweiler, J.L., Miranda, E.J., Priante, P.C., Fritzen, C.L., Lacerda, M., Pereira, L.C., Biudes, M.S., Suli, G.S.,Shiraiwa, S., Paulo, S.R.Do, Silveira, M., 2004. Comparison of the mass and energy exchange of a pasture and a maturetransitional tropical forest of the southern Amazon Basin during a seasonal transition. Glob. Chang. Biol. 10, 863–876,http://dx.doi.org/10.1111/j.1529-8817.2003.00775.x.
Rodrigues, T.R., Vourlitis, G.L., Lobo, F.D.A., De Oliveira, R.G., Nogueira, J.D.S., 2014. Seasonal variation in energy balance andcanopy conductance for a tropical savanna ecosystem of south central Mato Grosso. Brazil. J. Geophys. Res. Biogeosci. 119,1–13, http://dx.doi.org/10.1002/2013JG002472.
Sahin, V., Hall, M.J., 1996. The effects of afforestation and deforestation on water yields. J. Hydrol. 178, 293–309,http://dx.doi.org/10.1016/0022-1694(95)02825-0.
Sampaio, G., Nobre, C., Costa, M.H., Satyamurty, P., Soares-Filho, B.S., Cardoso, M., 2007. Regional climate changeover eastern Amazonia caused by pasture and soybean cropland expansion. Geophys. Res. Lett. 34, L17709,http://dx.doi.org/10.1029/2007GL030612.
Satterlund, D.R., 1979. An improved equation for estimating long-wave radiation from the atmosphere. Water Resour. Res. 15,1649–1650.
Scheffler, R., Neill, C., Krusche, A.V., Elsenbeer, H., 2011. Soil hydraulic response to land-use change associatedwith the recent soybean expansion at the Amazon agricultural frontier. Agric. Ecosyst. Environ. 144, 281–289,http://dx.doi.org/10.1016/j.agee.2011.08.016.
Sellers, P.J., Dickinson, R.E., Randall, D.A., Betts, A.K., Hall, F.G., Berry, J.A., Collatz, G.J., Denning, A.S., Mooney, H.A., Nobre, C.A.,Sato, N., Field, C.B., Henderson-Sellers, A., 1997. Modeling the exchanges of energy, water, and carbon between continentsand the atmosphere. Science 275, 502–509, http://dx.doi.org/10.1126/science.275.5299.502.
Sellers, P.J., Los, S.O., Tucker, C.J., Justice, C.O., Dazlich, D.A., Collatz, G.J., Randall, D.A., 1996a. A revised land surface parame-terization (SiB2) for atmospheric GCMs. Part II: The generation of global fields of terrestrial biophysical parameters fromsatellite data. J. Clim., http://dx.doi.org/10.1175/1520-0442(1996)009<0706:ARLSPF>2.0.CO;2.
Sellers, P.J., Randall, D.A., Collatz, G.J., Berry, J.A., Field, C.B., Dazlich, D.A., Zhang, C., Collelo, G.D., Bounoua, L.,1996b. A revised land surface parameterization (SiB2) for atmospheric GCMs. Part I: Model formulation. J. Clim.,http://dx.doi.org/10.1175/1520-0442(1996)009<0676:ARLSPF>2.0.CO;2.
Sorooshian, S., Hsu, K., 2000. Evaluation of PERSIANN system satellite-based estimates of tropical rainfall. Bull. Am. Meteorol.Soc. 81, 2035–2046.
Stickler, C.M., Coe, M.T., Costa, M.H., Nepstad, D.C., McGrath, D.G., Dias, L.C.P., Rodrigues, H.O., Soares-Filho, B.S., 2013. Depend-ence of hydropower energy generation on forests in the Amazon Basin at local and regional scales. Proc. Natl. Acad. Sci. U.S. A. 110, 9601–9606, http://dx.doi.org/10.1073/pnas.1215331110.
Tomasella, J., Neill, C., Figueiredo, R., Nobre, A.D., 2009. Water and chemical budgets at the catchment scale including nutrientexports from intact forests and disturbed landscapes. In: Keller, M., Bustamante, M., Gash, J., Silva Dias, P. (Eds.), Amazoniaand Global Change. American Geophysical Union, Washington, pp. 505–524.
Vourlitis, G.L., de Souza Nogueira, J., de Almeida Lobo, F., Pinto, O.B., 2014. Variations in evapotranspiration and cli-mate for an Amazonian semi-deciduous forest over seasonal, annual, and El Nino cycles. Int. J. Biometeorol.,http://dx.doi.org/10.1007/s00484-014-0837-1.
Vourlitis, G.L., De Souza Nogueira, J., De Almeida Lobo, F., Sendall, K.M., De Paulo, S.R., Antunes Dias, C.A., Pinto, O.B., De Andrade,N.L.R., 2008. Energy balance and canopy conductance of a tropical semi-deciduous forest of the southern Amazon Basin.Water Resour. Res. 44, 1–14, http://dx.doi.org/10.1029/2006WR005526.
Vourlitis, G.L., Priante-Filho, N., Hayashi, M.M.S., Nogueira, J.S., Caseiro, F.T., Campelo Jr., J.H., 2002. Seasonal variations in theevapotranspiration of a transitional tropical forest of Mato Grosso. Brazil. Water Resour. Res. 38, 1094.