contents · · 2018-02-10in chf million 2013 2012 2011 2010 2009 ... india, south africa) and ......
TRANSCRIPT

Contents

Contents
Key Figures 4
Management Report 5
Group Financial Statements 9
Financial Statements Hilti Corporation 77
Corporate Governance 91
Investor Information 95
Key Figures
Hilti Financial Report 2013 | 4
Key Figu res
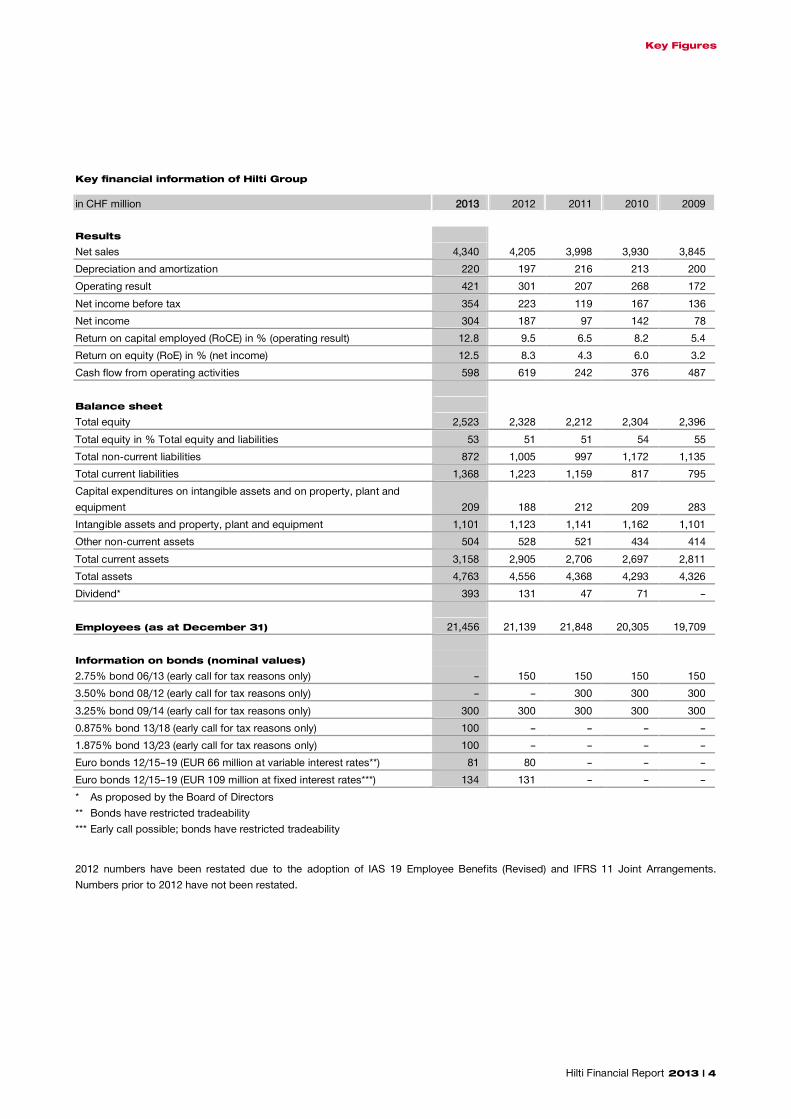
Key financial information of Hilti Group Key Figu res in CHF million 2013 2012 2011 2010 2009 Results
Net sales 4,340 4,205 3,998 3,930 3,845 Depreciation and amortization 220 197 216 213 200 Operating result 421 301 207 268 172 Net income before tax 354 223 119 167 136 Net income 304 187 97 142 78 Return on capital employed (RoCE) in % (operating result) 12.8 9.5 6.5 8.2 5.4 Return on equity (RoE) in % (net income) 12.5 8.3 4.3 6.0 3.2 Cash flow from operating activities 598 619 242 376 487
Balance sheet Total equity 2,523 2,328 2,212 2,304 2,396 Total equity in % Total equity and liabilities 53 51 51 54 55 Total non-current liabilities 872 1,005 997 1,172 1,135 Total current liabilities 1,368 1,223 1,159 817 795 Capital expenditures on intangible assets and on property, plant and equipment 209 188 212 209 283 Intangible assets and property, plant and equipment 1,101 1,123 1,141 1,162 1,101 Other non-current assets 504 528 521 434 414 Total current assets 3,158 2,905 2,706 2,697 2,811 Total assets 4,763 4,556 4,368 4,293 4,326 Dividend* 393 131 47 71 –
Employees (as at December 31) 21,456 21,139 21,848 20,305 19,709
Information on bonds (nominal values) 2.75% bond 06/13 (early call for tax reasons only) – 150 150 150 150 3.50% bond 08/12 (early call for tax reasons only) – – 300 300 300 3.25% bond 09/14 (early call for tax reasons only) 300 300 300 300 300 0.875% bond 13/18 (early call for tax reasons only) 100 – – – – 1.875% bond 13/23 (early call for tax reasons only) 100 – – – – Euro bonds 12/15–19 (EUR 66 million at variable interest rates**) 81 80 – – – Euro bonds 12/15–19 (EUR 109 million at fixed interest rates***) 134 131 – – – * As proposed by the Board of Directors ** Bonds have restricted tradeability *** Early call possible; bonds have restricted tradeability
2012 numbers have been restated due to the adoption of IAS 19 Employee Benefits (Revised) and IFRS 11 Joint Arrangements. Numbers prior to 2012 have not been restated.
Management Report
Hilti Financial Report 2013 | 5
Another substantial improvement of profitability and capital efficiency Mana ge ment Rep ort
Management Report
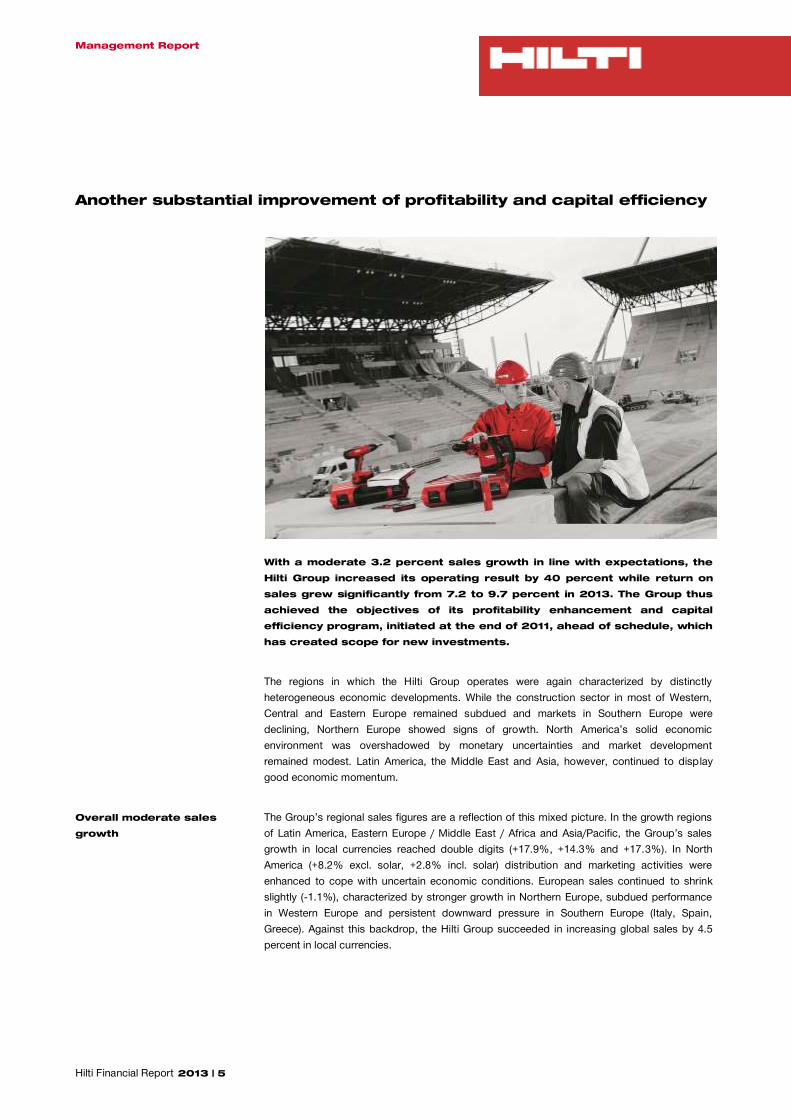
With a moderate 3.2 percent sales growth in line with expectations, the Hilti Group increased its operating result by 40 percent while return on sales grew significantly from 7.2 to 9.7 percent in 2013. The Group thus achieved the objectives of its profitability enhancement and capital efficiency program, initiated at the end of 2011, ahead of schedule, which has created scope for new investments.
The regions in which the Hilti Group operates were again characterized by distinctly heterogeneous economic developments. While the construction sector in most of Western, Central and Eastern Europe remained subdued and markets in Southern Europe were declining, Northern Europe showed signs of growth. North America’s solid economic environment was overshadowed by monetary uncertainties and market development remained modest. Latin America, the Middle East and Asia, however, continued to display good economic momentum.
Overall moderate sales growth
The Group’s regional sales figures are a reflection of this mixed picture. In the growth regions of Latin America, Eastern Europe / Middle East / Africa and Asia/Pacific, the Group’s sales growth in local currencies reached double digits (+17.9%, +14.3% and +17.3%). In North America (+8.2% excl. solar, +2.8% incl. solar) distribution and marketing activities were enhanced to cope with uncertain economic conditions. European sales continued to shrink slightly (-1.1%), characterized by stronger growth in Northern Europe, subdued performance in Western Europe and persistent downward pressure in Southern Europe (Italy, Spain, Greece). Against this backdrop, the Hilti Group succeeded in increasing global sales by 4.5 percent in local currencies.

Management Report
Hilti Financial Report 2013 | 6
While business in general developed in line with expectations, sales to the solar industry showed an unsatisfying picture. Asia (in particular Japan) enjoyed substantial growth, but the US solar market was a challenge and sales continued to drop significantly in Europe. The Hilti Group expects that the European solar market will stabilize at a low level in the long run as a result of the cut in public subsidies such as in Germany. In response to this development, the Group has resorted to structural adjustments and partial write-offs reflecting the dampened business potential. On the exchange rate front, several regions were marked by weakening currencies against the Swiss Franc, which was partly due to the monetary signals sent out by the US Fed (with secondary impacts on Brazil, India, South Africa) and protective devaluation measures such as in Japan. The exchange rate effect diminished the Group’s sales growth by -1.3 percent. In Swiss Francs, sales have grown by 3.2 percent to CHF 4.3 billion.
Substantial enhancement of profitability
The Hilti Group achieved the objectives of its profitability enhancement and capital efficiency program, launched at the end of 2011, ahead of schedule in 2013. Additional actions to reduce product costs and enhanced distribution productivity as well as structural adjustments at Corporate Headquarters and in slow-growth markets have resulted in a gratifying improvement of the operating profit margin (ROS) from 7.2 to 9.7 percent. Like sales, the operating result was also negatively affected by exchange rates, as reflected by the reduction of ROS by -0.6 percent.
Strong cash flow and improved capital efficiency
Capital efficiency was improved further thanks to a new internal steering and management compensation system. Average days sales outstanding (DSO) for receivables and inventory range were again brought down by more than three days (6 and 3 percent, respectively). As a consequence, net working capital relative to sales was reduced from 22 to 21 percent. Operating cash flow was again high at CHF 598 million and free cash flow reached the excellent level of CHF 354 million. Return on capital employed (ROCE) improved from 9.5 to 12.8 percent.
Sound balance sheet structure
Cash and cash equivalents increased to CHF 1,538 million. Financial debt amounted to CHF 879 million at the end of 2013. Short-term bank borrowings stood at CHF 125 million (-16 million compared to 2012), while long-term bank borrowings were CHF 40 million (-25 million). Thanks to the sound Group’s balance sheet structure, it was decided that the two bonds maturing in 2013 and 2014 (CHF 150 million and 300 million, respectively) would only be partially replaced by a new CHF 200 million bond issued in 2013. The new issue came in two tranches, five and ten years, and was met with great demand. With coupons of 0.875 percent and 1.875 percent, respectively, the Hilti Group managed to offer attractive conditions for bondholders. Net liquidity rose to CHF 659 million. The equity ratio improved to 53 percent at year-end and continues to be very satisfactory. For 2013, the Board of Directors proposes an ordinary dividend payment of CHF 153 million (2012: CHF 131 million).

Management Report
Hilti Financial Report 2013 | 7
Over the next few years and in line with business results, the Hilti Group intends to make use of its strong cash flow position to gradually repay excess liquidity – which it held throughout the recent period of macroeconomic turbulence – to its owner. Having reviewed the company’s strategy last year, the Group has come to the conclusion that Hilti’s well-established and sound business profile no longer calls for this reserve and that the repayment of excess liquidity will not compromise the company’s flexibility. The Hilti Group continues to hold high liquidity reserves to secure the company’s independence even in more challenging times. Furthermore, the Group’s sole shareholder, the Martin Hilti Family Trust, owns sufficient liquidity for contingency financing. Therefore, the Board of Directors proposes the payment of a special dividend of CHF 240 million, which will bring up the aggregate dividend payout to CHF 393 million.
Outlook Economic forecasters seem to agree that the business climate will be similar to or moderately better than last year in most markets. At the same time, scope for additional investments in new products and distribution facilities could emerge earlier than anticipated as a result of positive profitability and cash flow trends. Hence, the Hilti Group is confident about the prospects for 2014 and expects growth in local currencies to be slightly above 2013 levels. On the other hand, exchange rate markets will probably remain volatile. The Group’s profitability and capital efficiency enhancement initiatives will continue to be effective in 2014 and are expected to create more added value.

Management Report
Hilti Financial Report 2013 | 8

Hilti Financial Report 2013 | 9
Group Financial Statements Group Financial Statements

Group Financial Statements
Hilti Financial Report 2013 | 10
Consolidated balance sheet
in CHF million Note 31.12.2013 31.12.2012 01.01.2012 Restated* Restated*
ASSETS
Intangible assets 7 340.0 371.3 394.4 Property, plant and equipment 8 760.8 751.4 750.1 Investment property 9 2.2 2.2 6.8 Deferred income tax assets 11 126.5 142.6 123.9 Other financial investments 12 13.4 14.4 14.2 Trade and other receivables 14 362.4 349.1 312.0 Derivative financial instruments 16 – 19.2 43.5 Total non-current assets 1,605.3 1,650.2 1,644.9
Inventories 13 548.5 563.4 625.5 Trade and other receivables 14 943.2 899.2 930.0 Current income taxes receivable 26 11.4 8.3 14.4 Accrued income and prepayments 15 50.3 83.0 47.7 Derivative financial instruments 16 33.8 9.0 8.2 Financial assets at fair value through profit or loss 17 32.1 35.9 26.4 Cash and cash equivalents 18 1,538.3 1,306.6 1,065.3 Total current assets 3,157.6 2,905.4 2,717.5 TOTAL ASSETS 4,762.9 4,555.6 4,362.4 * See note 2.2
The notes on pages 16 to 73 are an integral part of these Group financial statements.

Group Financial Statements
Hilti Financial Report 2013 | 11
in CHF million Note 31.12.2013 31.12.2012 01.01.2012 Restated* Restated*
EQUITY AND LIABILITIES
Non-controlling interests 9.3 14.3 13.0 Equity attributable to equity holders of the parent 2,513.5 2,313.8 2,245.5 Total equity 20 2,522.8 2,328.1 2,258.5
Provisions 21 57.5 49.9 47.4 Employee benefits 22 308.4 329.0 309.1 Deferred income tax liabilities 11 26.0 28.6 29.8 Bonds 23 414.7 510.3 447.8 Long-term bank borrowings 24 39.5 64.3 81.2 Trade and other payables 25 24.9 22.0 24.7 Derivative financial instruments 16 1.0 0.9 1.4 Total non-current liabilities 872.0 1,005.0 941.4
Provisions 21 75.3 68.1 48.3 Employee benefits 22 8.7 48.9 3.6 Trade and other payables 25 342.7 318.7 279.5 Current income taxes payable 26 89.5 92.2 98.5 Accrued liabilities and deferred income 27 424.9 399.8 305.0 Bonds 23 299.8 149.7 299.8 Short-term bank borrowings 28 125.3 141.7 113.8 Derivative financial instruments 16 1.9 3.4 14.0 Total current liabilities 1,368.1 1,222.5 1,162.5 Total liabilities 2,240.1 2,227.5 2,103.9 TOTAL EQUITY AND LIABILITIES 4,762.9 4,555.6 4,362.4 * See note 2.2
The notes on pages 16 to 73 are an integral part of these Group financial statements.

Group Financial Statements
Hilti Financial Report 2013 | 12
Consolidated income statement
in CHF million Note 2013 2012 Restated*
Net sales 29 4,340.2 4,204.6 Other operating revenues 29 92.3 83.3 Total operating revenues 4,432.5 4,287.9
Change in inventory 30 1.2 (57.5) Material costs 30 (1,317.9) (1,274.4) Personnel expenses 31 (1,702.9) (1,692.4) Depreciation and amortization 32 (220.3) (197.2) Other operating expenses 33 (771.5) (765.2) Total operating expenses (4,011.4) (3,986.7) Operating result 421.1 301.2
Other revenues and expenses (net) 34 (16.0) (22.0) Finance costs 35 (51.0) (56.3)
Net income before income tax expense 354.1 222.9
Income tax expense 36 (50.0) (35.6)
Net income 304.1 187.3
Attributable to:
Equity holders of the parent 305.5 185.8 Non-controlling interests (1.4) 1.5 * See note 2.2
The notes on pages 16 to 73 are an integral part of these Group financial statements.

Group Financial Statements
Hilti Financial Report 2013 | 13
Consolidated statement of comprehensive income
in CHF million Note 2013 2012 Restated*
Net income 304.1 187.3
Net movement on cash flow hedges 16 0.4 3.5 Deferred tax on net movement on cash flow hedges 20 (0.1) (0.4) Foreign currency translation differences 20 (21.2) (6.7) Items that may be subsequently reclassified to the income statement
(20.9) (3.6)
Remeasurements on employee benefits 22 47.6 (78.3) Deferred tax on remeasurements on employee benefits 20 (5.5) 12.5 Items that will never be reclassified to the income statement
42.1 (65.8)
Other comprehensive income (OCI) 21.2 (69.4) Total comprehensive income 325.3 117.9
Attributable to:
Equity holders of the parent 326.9 116.8 Non-controlling interests (1.6) 1.1 * See note 2.2
The notes on pages 16 to 73 are an integral part of these Group financial statements.

Group Financial Statements
Hilti Financial Report 2013 | 14
Consolidated statement of changes in equity
in CHF million Share and participation certificate capital
Capital reserves
Foreign currency translation reserve
Cash flow hedging reserve
Retained earnings
Equity attributable to equity holders of the parent
Non-controlling interests
Total equity
Equity at January 1, 2013 126.7 17.4 (336.5) 0.9 2,505.3 2,313.8 14.3 2,328.1 Change in non-controlling interests – – (0.2) – 3.5 3.3 (3.4) (0.1) Dividend paid – – – – (130.5) (130.5) – (130.5) Total comprehensive income – – (21.0) 0.3 347.6 326.9 (1.6) 325.3 Equity at December 31, 2013 126.7 17.4 (357.7) 1.2 2,725.9 2,513.5 9.3 2,522.8
in CHF million Share and participation certificate capital
Capital reserves
Foreign currency translation reserve
Cash flow hedging reserve
Retained earnings
Equity attributable to equity holders of the parent
Non-controlling interests
Total equity
Equity at December 31, 2011 126.7 17.4 (330.2) (2.2) 2,387.2 2,198.9 13.0 2,211.9 Effect of changes in accounting
policies* – – – – 46.6 46.6 – 46.6 Equity at January 1, 2012* 126.7 17.4 (330.2) (2.2) 2,433.8 2,245.5 13.0 2,258.5 Change in non-controlling interests – – – – (1.6) (1.6) 0.2 (1.4) Dividend paid – – – – (46.9) (46.9) – (46.9) Total comprehensive income – – (6.3) 3.1 120.0 116.8 1.1 117.9 Equity at December 31, 2012* 126.7 17.4 (336.5) 0.9 2,505.3 2,313.8 14.3 2,328.1 * Restated, see note 2.2 For further details on transactions with non-controlling interests see note 5 and on equity see note 20.
The notes on pages 16 to 73 are an integral part of these Group financial statements.

Group Financial Statements
Hilti Financial Report 2013 | 15
Consolidated cash flow statement
in CHF million Note 2013 2012 Restated*
Net income 304.1 187.3 Depreciation and amortization 32 220.3 197.2 (Gains)/loss on foreign currencies and cash flow hedging instruments 34 19.4 18.3 (Gain)/loss on disposal of investments (4.6) (9.4) Valuation of financial liabilities under amortized cost basis 0.8 1.3 Income tax expense (excluding deferred tax) 36 48.4 45.7 Interest (income)/expense 34, 35 52.8 58.2 (Increase)/decrease in inventories 30 (1.2) 57.5 (Increase)/decrease in trade receivables (18.7) 55.1 Increase/(decrease) in trade payables 25.1 22.8 (Increase)/decrease in other net operating assets 51.2 81.5 Cash flow from operating activities before interest and tax 697.6 715.5 Interest received 5.3 5.5 Interest paid (51.0) (56.3) Income tax paid (53.9) (45.6) Cash flow from operating activities 598.0 619.1
Capital expenditure on intangible assets 7 (79.1) (61.9) Capital expenditure on property, plant and equipment 8 (130.1) (126.1) (Increase)/decrease in financial investments 6.7 (11.0) Disposal of intangible assets – 2.0 Disposal of property, plant and equipment 6.9 5.2 (Increase)/decrease in finance lease receivables (48.5) (61.7) Cash flow from investing activities (244.1) (253.5)
Proceeds from long-term bank borrowings 2.8 0.4 Repayment of long-term bank borrowings (18.8) (12.7) Proceeds from long-term loans 0.9 1.0 Repayment of long-term loans (2.3) (1.2) Proceeds from/(repayment of) short-term bank borrowings (19.7) 27.0 Proceeds from issuance of bonds 200.0 210.9 Repayment of bonds (150.0) (300.0) Increase/(decrease) in liability to shareholder 42 0.2 – Dividend paid 20 (130.5) (46.9) Cash flow from financing activities (117.4) (121.5)
Effects of exchange rate changes on cash and cash equivalents (4.8) (2.8)
Total increase/(decrease) in cash and cash equivalents 231.7 241.3
Cash and cash equivalents at January 1 1,306.6 1,065.3 Cash and cash equivalents at December 31 1,538.3 1,306.6 * See note 2.2
The notes on pages 16 to 73 are an integral part of these Group financial statements.

Notes to the Consolidated Financial Statements
Hilti Financial Report 2013 | 16
Notes to t he Co nsoli date d Fi nanci al State me nts (1) Gen eral i nfo rma tion (2) Sum mary of si gnific ant acc oun ting policie s
(1) General information The Hilti Group (the Group) comprises the Hilti Corporation and its domestic and foreign subsidiaries. The Group supplies the worldwide construction industry with technologically leading products, systems and services that provide construction professionals with innovative solutions and superior added value. Its product range includes equipment and systems covering drilling and demolition, direct fastening, diamond and anchoring, fire stop and foam, installation, measuring, screw fastening, and cutting and sanding. The Hilti Corporation is a limited liability company incorporated and domiciled in the Principality of Liechtenstein. The Group’s headquarters and the address of its registered office are at Feldkircherstrasse 100, 9494 Schaan, Liechtenstein. The Group’s principal production and research and development location is Liechtenstein with further production and research and development locations worldwide. The Group operates in over 120 countries and has some 21,000 employees worldwide. These consolidated financial statements were approved for issue by the Board of Directors on March 10, 2014.
(2) Summary of significant
accounting policies The principal accounting policies applied in the preparation of these consolidated financial statements are set out below. These policies have been consistently applied to both years presented, unless otherwise stated.
(2.1) Basis of preparation These consolidated financial statements have been prepared in accordance with International
Financial Reporting Standards (IFRS). Preparation of the financial statements in accordance with IFRS meets the requirements of Liechtenstein’s corporations law, the Personen- und Gesellschaftsrecht (PGR). The consolidated financial statements have been prepared under the historical cost convention, as modified by the revaluation of certain financial assets and financial liabilities (including derivative instruments) at fair value through profit or loss. The preparation of financial statements in conformity with IFRS can require the use of certain critical accounting estimates. It also requires management to exercise its judgment in the process of applying the Group’s accounting policies. The accounting estimates and udgments reflected in the 01 consolidated financial statements that are critical in the context of the Group’s financial position and financial performance are explained in note 3.

Notes to the Consolidated Financial Statements
Hilti Financial Report 2013 | 17
(2.2) Changes in accounting
policies and estimates
Changes in accounting policies
Adoption of IAS 19 Employee Benefits (Revised) IAS 19 Employee Benefits (Revised) (IAS 19R) was adopted as of January 1, 2013. This has resulted in the restatement of the prior period information. The material impacts of IAS 19R on the Group’s financial statements are as follows: Calculation of pension costs: The previous practice of separately recognizing the
expected return on plan assets and the interest expense on the defined benefit obligation is now replaced by the recognition of net interest on either the net defined benefit liability or the net defined benefit asset (as applicable).
Risk sharing: The new provision on sharing risk between the employees and employer has reduced the defined benefit liability and impacts service costs measurements.
Disclosure requirements: Additional disclosures have been provided. The Group’s financial statements were not affected by the new requirements in IAS 19R to prohibit deferred recognition of past service costs and certain actuarial gains and losses (‘corridor approach’). Both practices had not previously been adopted by the Group. As a consequence of changes due to the adoption of IAS 19R, classification changes were also made to other employee-related obligations: Employee-related obligations for ‘post-employment benefits’ and ‘other long-term employee benefits’ are now classified as ‘employee benefits’. Previously ‘employee benefit obligations excluding pension and termination benefit obligations’ were classified as ‘provisions’. In addition, assets of certain investment funds are no longer allocated to ‘other financial investments’. Instead they are allocated to plan assets.
Adoption of IFRS 11 Joint Arrangements IFRS 11 Joint Arrangements was adopted as of January 1, 2013. The Group has rights to the assets and obligations for the liabilities of each of the four joint arrangements in which it has ownership interests (see note 44). Previously these have been classified as ‘investments in oint ventures’ and were accounted for under the equity method. In accordance with IFRS 11, the investments have been reclassified as joint operations and are now accounted for by directly recognizing the relevant shares of assets, liabilities, revenues and expenses. Prior period information has been restated accordingly. However, since the transactions of the joint operations are mostly intragroup transactions, the impact on the Group’s financial statements of the changes arising from the adoption of IFRS 11 is immaterial.
Summary of impacts The following tables summarize the impacts resulting from the above changes in accounting policies on relevant positions of the Group’s financial position, comprehensive income and cash flows.

Notes to the Consolidated Financial Statements
Hilti Financial Report 2013 | 18
Consolidated balance sheet as at January 1, 2012
in CHF million Reported Adjustment IAS 19
Adjustment IFRS 11
Restated
ASSETS
Property, plant and equipment 746.4 – 3.7 750.1 Investments in associates and joint ventures 12.1 – (12.1) – Deferred income tax assets 130.4 (6.6) 0.1 123.9 Other financial investments 16.6 (2.4) – 14.2 Total non-current assets 1,662.2 (9.0) (8.3) 1,644.9
Inventories 615.9 – 9.6 625.5 Trade and other receivables 930.6 – (0.6) 930.0 Accrued income and prepayments 47.6 – 0.1 47.7 Cash and cash equivalents 1,062.5 – 2.8 1,065.3 Total current assets 2,705.6 – 11.9 2,717.5 TOTAL ASSETS 4,367.8 (9.0) 3.6 4,362.4
EQUITY AND LIABILITIES
Equity attributable to equity holders of the parent 2,198.9 46.4 0.2 2,245.5 Total equity 2,211.9 46.4 0.2 2,258.5
Provisions 108.7 (61.3) – 47.4 Employee benefits 303.2 5.9 – 309.1 Total non-current liabilities 996.8 (55.4) – 941.4
Provisions 51.4 (3.6) 0.5 48.3 Employee benefits – 3.6 – 3.6 Trade and other payables 278.0 – 1.5 279.5 Current income taxes payable 98.4 – 0.1 98.5 Accrued liabilities and deferred income 304.8 – 0.2 305.0 Short-term bank borrowings 112.7 – 1.1 113.8 Total current liabilities 1,159.1 – 3.4 1,162.5 Total liabilities 2,155.9 (55.4) 3.4 2,103.9 TOTAL EQUITY AND LIABILITIES 4,367.8 (9.0) 3.6 4,362.4

Notes to the Consolidated Financial Statements
Hilti Financial Report 2013 | 19
Consolidated balance sheet as at December 31, 2012
in CHF million Reported Adjustment IAS 19
Adjustment IFRS 11
Restated
ASSETS
Property, plant and equipment 748.5 – 2.9 751.4 Investments in associates and joint ventures 13.3 – (13.3) – Deferred income tax assets 147.0 (4.5) 0.1 142.6 Other financial investments 17.2 (2.8) – 14.4 Total non-current assets 1,667.8 (7.3) (10.3) 1,650.2
Inventories 555.3 – 8.1 563.4 Trade and other receivables 897.5 – 1.7 899.2 Accrued income and prepayments 82.9 – 0.1 83.0 Financial assets at fair value through profit or loss 35.8 – 0.1 35.9 Cash and cash equivalents 1,302.7 – 3.9 1,306.6 Total current assets 2,891.5 – 13.9 2,905.4 TOTAL ASSETS 4,559.3 (7.3) 3.6 4,555.6
EQUITY AND LIABILITIES
Equity attributable to equity holders of the parent 2,282.3 31.3 0.2 2,313.8 Total equity 2,296.6 31.3 0.2 2,328.1
Provisions 80.0 (30.1) – 49.9 Employee benefits 337.5 (8.5) – 329.0 Total non-current liabilities 1,043.6 (38.6) – 1,005.0
Provisions 116.8 (48.9) 0.2 68.1 Employee benefits – 48.9 – 48.9 Trade and other payables 315.6 – 3.1 318.7 Accrued liabilities and deferred income 399.7 – 0.1 399.8 Total current liabilities 1,219.1 – 3.4 1,222.5
Total liabilities 2,262.7 (38.6) 3.4 2,227.5 TOTAL EQUITY AND LIABILITIES 4,559.3 (7.3) 3.6 4,555.6

Notes to the Consolidated Financial Statements
Hilti Financial Report 2013 | 20
Consolidated statement of changes in equity
in CHF million Reported Adjustment IAS 19
Adjustment IFRS 11
Restated
Equity at January 1, 2012 2,211.9 46.4 0.2 2,258.5 Change in non-controlling interests (1.4) – – (1.4) Dividend paid (46.9) – – (46.9) Total comprehensive income 133.0 (15.1) – 117.9 Equity at December 31, 2012 2,296.6 31.3 0.2 2,328.1
Consolidated income statement for the year ending December 31, 2012
in CHF million Reported Adjustment IAS 19
Adjustment IFRS 11
Restated
Net sales 4,203.6 – 1.0 4,204.6 Other operating income 83.3 – – 83.3 Total operating revenues 4,286.9 – 1.0 4,287.9
Change in inventory (56.1) – (1.4) (57.5) Material costs (1,282.1) – 7.7 (1,274.4) Personnel expenses (1,688.1) (1.4) (2.9) (1,692.4) Depreciation and amortization (196.2) – (1.0) (197.2) Other operating expenses (763.9) – (1.3) (765.2) Total operating expenses (3,986.4) (1.4) 1.1 (3,986.7) Operating result 300.5 (1.4) 2.1 301.2
Share of profit/(loss) of equity-accounted associates and joint ventures 1.4 – (1.4) – Other revenues and expenses (net) (15.7) (6.3) – (22.0) Finance costs (56.2) – (0.1) (56.3)
Net income before income tax 230.0 (7.7) 0.6 222.9
Income tax expense (36.0) 1.0 (0.6) (35.6)
Net income 194.0 (6.7) – 187.3
Attributable to:
Equity holders of the parent 192.5 (6.7) – 185.8 Non-controlling interests 1.5 – – 1.5
Notes to the Consolidated Financial Statements
Hilti Financial Report 2013 | 21
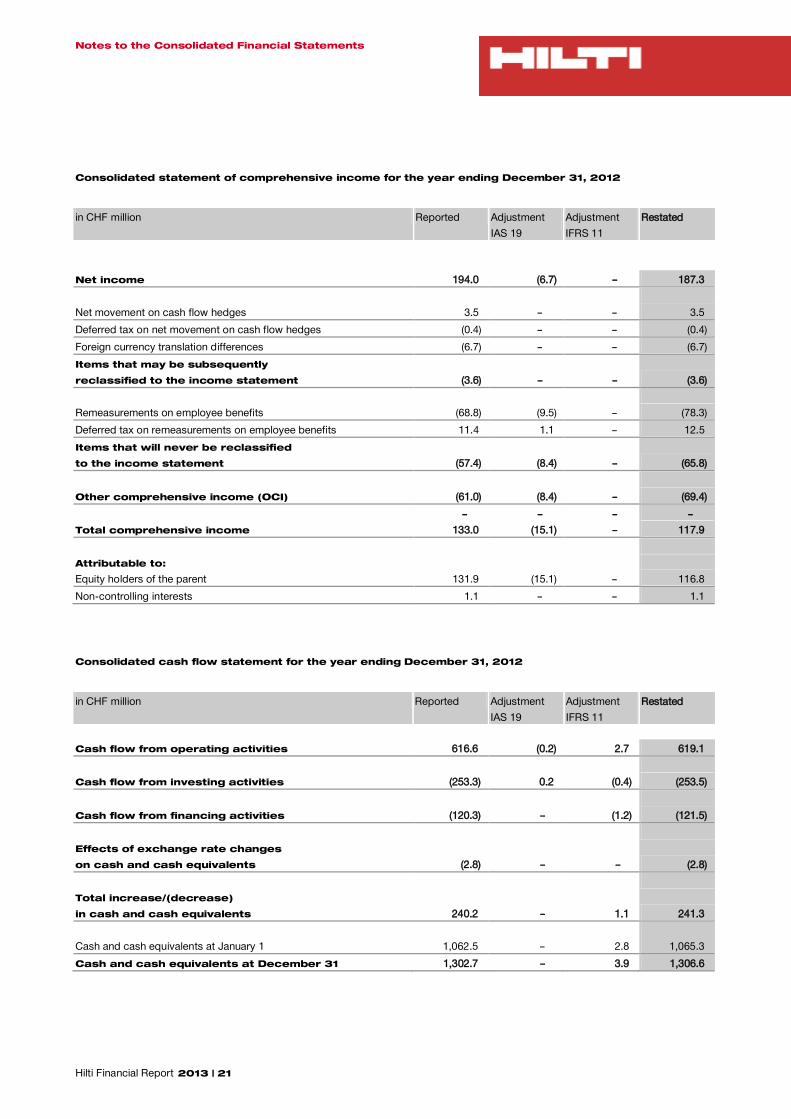
Consolidated statement of comprehensive income for the year ending December 31, 2012
in CHF million Reported Adjustment IAS 19
Adjustment IFRS 11
Restated
Net income 194.0 (6.7) – 187.3
Net movement on cash flow hedges 3.5 – – 3.5 Deferred tax on net movement on cash flow hedges (0.4) – – (0.4) Foreign currency translation differences (6.7) – – (6.7) Items that may be subsequently reclassified to the income statement (3.6) – – (3.6)
Remeasurements on employee benefits (68.8) (9.5) – (78.3) Deferred tax on remeasurements on employee benefits 11.4 1.1 – 12.5 Items that will never be reclassified to the income statement (57.4) (8.4) – (65.8) Other comprehensive income (OCI) (61.0) (8.4) – (69.4) – – – – Total comprehensive income 133.0 (15.1) – 117.9
Attributable to:
Equity holders of the parent 131.9 (15.1) – 116.8 Non-controlling interests 1.1 – – 1.1
Consolidated cash flow statement for the year ending December 31, 2012
in CHF million Reported Adjustment IAS 19
Adjustment IFRS 11
Restated
Cash flow from operating activities 616.6 (0.2) 2.7 619.1 Cash flow from investing activities (253.3) 0.2 (0.4) (253.5) Cash flow from financing activities (120.3) – (1.2) (121.5) Effects of exchange rate changes on cash and cash equivalents (2.8) – – (2.8) Total increase/(decrease) in cash and cash equivalents 240.2 – 1.1 241.3
Cash and cash equivalents at January 1 1,062.5 – 2.8 1,065.3 Cash and cash equivalents at December 31 1,302.7 – 3.9 1,306.6

Notes to the Consolidated Financial Statements
Hilti Financial Report 2013 | 22
Further changes With effect from January 1, 2013, the following new IFRS standards/amendments were applied: IAS 1 – Presentation of Items of Other Comprehensive Income – Amendments to IAS 1 IAS 27 – Separate Financial Statements (Revised) IAS 28 – Investments in Associates and Joint Ventures (Revised) IFRS 7 – Financial Instruments: Disclosure – Offsetting Financial Assets and Financial
Liabilities IFRS 10 – Consolidated Financial Statements IFRS 12 – Disclosure of Interests in Other Entities IFRS 13 – Fair Value Measurement The application of all the above standards had no material impact on the Group’s financial position, comprehensive income and cash flows.
Changes in accounting estimates
In 2013, the Group reviewed the useful life of capitalized development costs based on updated information concerning product lifecycles. As a result, the amortization period for the majority of capitalized development costs has been extended from three to five years. The new amortization period was applied prospectively from January 1, 2013. The increase in the amortization period has resulted in an increase of 2013 net income by CHF 26 million (see note 7) and is expected to result in an increase of 2014 net income by CHF 15–18 million.
(2.3) Method of consolidation
Subsidiaries Subsidiaries are all entities over which the Group has control. The Group controls an entity when the Group is exposed to, or has rights to, variable returns from its involvement with the entity and has the ability to affect those returns through its power over the entity. Subsidiaries are fully consolidated from the date on which control is transferred to the Group. They are deconsolidated from the date that control ceases. The Group applies the acquisition method to account for business combinations. The consideration transferred for the acquisition of a subsidiary is the fair values of the assets transferred, the liabilities incurred to the former owners of the acquiree and the equity interests issued by the Group. The consideration transferred includes the fair value of any asset or liability resulting from a contingent consideration arrangement. Identifiable assets acquired and liabilities and contingent liabilities assumed in a business combination are measured initially at their fair values at the acquisition date. The Group recognizes any non-controlling interest in the acquiree at the non-controlling interest’s proportionate share of the recognized amounts of acquiree’s identifiable net assets. Acquisition-related costs are expensed as incurred. The excess of the consideration transferred, the amount of any non-controlling interest in the acquiree and the acquisition-date fair value of any previous equity interest in the acquiree over the fair value of the identifiable net assets acquired is recorded as goodwill. If the total of consideration transferred, non-controlling interest recognized and previously held interest measured is less than the fair value of the net assets of the subsidiary acquired in the case of a bargain purchase, the difference is recognized directly in the income statement. Intercompany transactions, balances and unrealized gains on transactions between Group companies are eliminated. Unrealized losses are also eliminated. Accounting policies of subsidiaries are changed, where necessary, to ensure consistency with the policies adopted by the Group.

Notes to the Consolidated Financial Statements
Hilti Financial Report 2013 | 23
Changes in ownership interests in subsidiaries without change in control
Transactions with non-controlling interests that do not result in loss of control are accounted for as equity transactions – that is, as transactions with the owners in their capacity as owners. The difference between fair value of any consideration paid and the relevant share acquired of the carrying value of net assets of the subsidiary is recorded in equity. Gains or losses on disposals to non-controlling interests are also recorded in equity.
Disposal of subsidiaries When the Group ceases to have control, any retained interest in the entity is remeasured to its fair value at the date when control is lost, with the change in carrying amount recognized in ‘other revenues and expenses (net)’ in profit or loss. The fair value is the initial carrying amount for the purposes of subsequently accounting for the retained interest as an associate, joint venture or financial asset. In addition, any amounts previously recognized in ‘other comprehensive income (OCI)’ in respect of that entity are accounted for as if the Group had directly disposed of the related assets or liabilities. This may mean that amounts previously recognized in ‘other comprehensive income (OCI)’ are reclassified to ‘other revenues and expenses (net)’ in profit or loss.
Associates Associates are all entities over which the Group has significant influence but not control, generally accompanying a shareholding of between 20% and 50% of the voting rights. Investments in associates are accounted for by the equity method of accounting and are initially recognized at cost. The Group’s investments in associates include goodwill (net of any accumulated impairment loss) identified on acquisition. The Group’s share of its associates’ post-acquisition profits or losses is recognized in the income statement. The cumulative post-acquisition movements are adjusted against the carrying amount of the investment. When the Group’s share of losses in an associate equals or exceeds its interest in the associate, including any other unsecured receivables, the Group does not recognize further losses, unless it has incurred obligations or made payments on behalf of the associate. Unrealized gains on transactions between the Group and its associates are eliminated to the extent of the Group’s interest in the associates. Unrealized losses are also eliminated unless the transaction provides evidence of an impairment of the asset transferred. Accounting policies of associates are changed, where necessary, to ensure consistency with the policies adopted by the Group.
Joint arrangements Under IFRS 11 investments in joint arrangements are classified as either joint operations or joint ventures depending on the contractual rights and obligations of each investor. Joint operations are joint arrangements whereby the parties that have joint control of the arrangement have rights to the assets, and obligations for the liabilities, relating to the arrangement. Joint control is the contractually agreed sharing of control of an arrangement, which exists only when decisions about the relevant activities require unanimous consent of the parties sharing control. The Group as a joint operator accounts for the assets, liabilities, revenues and expenses in relation to its interest in a joint operation in accordance with the IFRSs applicable to the particular assets, liabilities, revenues and expenses. The Group’s oint operations are engaged in developing, manufacturing and selling products for the construction industry. The majority of their output is sold to the parties of the joint operation. The products are sold at a price to ensure that the joint operations operate at break-even level. For their cash flows, the joint operations fully depend on the Group and the joint operation partner. Intercompany transactions, balances and unrealized gains on transactions between the Group and its oint operations are eliminated to the extent of the Group’s interest in the oint

Notes to the Consolidated Financial Statements
Hilti Financial Report 2013 | 24
operation. Unrealized losses are also eliminated. Accounting policies of joint arrangements are changed, where necessary, to ensure consistency with the policies adopted by the Group. Joint ventures are joint arrangements whereby the parties that have joint control of the arrangement have rights to the net assets of the joint arrangement. Joint control is the contractually agreed sharing of control of an arrangement, which exists only when decisions about the relevant activities require unanimous consent of the parties sharing control. Investments in joint ventures are accounted by using the equity method of accounting (refer to section associates above).
(2.4) Segment reporting Operating segments are reported in a manner consistent with the internal reporting provided
to the chief operating decision-maker. The chief operating decision-maker, who is responsible for allocating resources and assessing performance of the operating segments, has been identified as the Executive Board (EB) that makes strategic decisions. With the Group’s Multi-Channel-Service (MCS) approach, all products and services are relevant for all customers and the EB steers the business on Group level as one unit. In accordance with IFRS 8 Operating Segments, paragraph 5, the Group therefore operates in only one single operating segment. The single operating segment disclosure is accordingly set out in the balance sheet, income statement, statement of comprehensive income, statement of changes in equity and the cash flow statement. Breakdown of the segment information in terms of products, services and geographical areas is provided in note 37.
(2.5) Foreign currency translation
Functional and presentation currency
Items included in the financial statements of each of the Group’s companies are measured using the currency of the primary economic environment in which the entity operates (the functional currency). The consolidated financial statements are presented in Swiss francs, which is the functional and presentation currency of the Hilti Corporation.
Transactions and balances
Foreign currency transactions are translated into the functional currency using the exchange rates prevailing at the dates of the transactions. Foreign exchange gains and losses resulting from the settlement of such transactions and from the translation at year-end exchange rates of monetary assets and liabilities denominated in foreign currencies, excluding long-term intercompany accounts receivables and payables, are recognized in the income statement. Foreign exchange gains and losses relating to long-term intercompany foreign currency loans are regarded as part of the net investment in the foreign entity and are recognized in ‘other comprehensive income’ (OCI). Translation differences on non-monetary items, such as equities held at fair value through profit or loss, are reported as part of the fair value gain or loss. Translation differences on non-monetary items, such as equities classified as available-for-sale financial assets, are included in ‘other comprehensive income’ (OCI).
Translation on consolidation
The results and financial position of all the Group’s companies that have a functional currency different from the Group’s presentation currency are translated on consolidation into the Group’s presentation currency as follows: assets and liabilities at the closing spot exchange rates at the balance sheet date (closing
rate); and income and expense items at year-to-date sales-weighted average exchange rates
(average rate) (to provide a reasonable approximation of the cumulative effect of the rates prevailing on the transaction dates).

Notes to the Consolidated Financial Statements
Hilti Financial Report 2013 | 25
Gains and losses arising from the following impacts of the translation of the financial statements of foreign operations are recognized in ‘other comprehensive income’ (OCI): the difference between the average rate and the closing rate on income and expense
items; the difference between the closing rate of the previous year and the closing rate of the
current year on opening net investments; and the difference between the transaction date rate and the closing rate on the change in
net investments during the year. On the foreign operation’s disposal, applicable exchange differences are reclassified to the income statement and recognized as part of the gain or loss on disposal. When a foreign operation is acquired, any applicable goodwill and fair value adjustments are treated as assets and liabilities of the foreign entity and are translated at the closing rate. The following exchange rates of principal currencies were applied for translation into Swiss francs:
in CHF Average rates Closing rates 2013 2012 2013 2012
1 CAD 0.901 0.939 0.837 0.919 1 EUR 1.231 1.205 1.228 1.207 1 GBP 1.449 1.484 1.472 1.488 100 JPY 0.949 1.175 0.848 1.059 100 RUB 2.903 3.019 2.709 2.996 1 USD 0.927 0.938 0.890 0.915
(2.6) Intangible assets Goodwill is considered to have an indefinite useful life and is accordingly not amortized.
Goodwill is tested annually for impairment and recognized at cost less any accumulated impairment losses. Impairment losses on goodwill are not reversed. Gains and losses on the disposal of an entity include the carrying amount of any goodwill relating to the entity sold. Development costs are recognized as an asset only when the prerequisite criteria under IAS 38 Intangible Assets are met. In substance, these criteria include the condition that there be probable future benefits that are directly attributable to the costs. In practice, only costs on certain product development projects that are subjected to a stringent review process meet this condition. Such assets are normally amortized on a straight-line basis over a five-year period. All other development costs are recognized directly as an expense when incurred. Other intangible assets consist mainly of database and application software, as well as manufacturing patents. These assets are recognized at historical cost less accumulated amortization and accumulated impairment losses, if any. They are amortized on a straight-line basis over their estimated useful lives which are mostly periods of between three and five years. Other periods may be used where specific contractual conditions apply.
(2.7) Property, plant and
equipment Land is valued at historical cost less accumulated impairment losses, if any. Other property, plant and equipment are recognized at historical cost less accumulated depreciation and accumulated impairment losses, if any. Historical cost includes expenditure that is directly attributable to the acquisition of the items. Historical cost may also include transfers from equity of any gains/losses on qualifying cash flow hedges of foreign currency purchases of tangible fixed assets.

Notes to the Consolidated Financial Statements
Hilti Financial Report 2013 | 26
Subsequent costs are included in an asset’s carrying amount or recognized as a separate asset, as appropriate, only when it is probable that future economic benefits associated with the item will flow to the Group and the cost of the item can be measured reliably. All other subsequent costs represent repairs and maintenance and are recognized in the income statement in the period they are incurred. Depreciation is calculated using the straight-line method to allocate the historical costs of assets, less their residual values, over their estimated useful lives. The estimated useful lives of depreciable property, plant and equipment are: Buildings 30 to 40 years Plant and machinery 5 to 15 years Other operating assets 2 to 7 years The residual values and estimated useful lives of assets are reviewed and adjusted, if appropriate, at each balance sheet date. Gains and losses on disposal are determined by comparing disposal proceeds with carrying amount. These are recognized in the income statement in the period of disposal.
(2.8) Investment property Investment property comprises land and/or buildings held to earn rentals or for capital
appreciation. Investment property is measured on the same basis as land and buildings included in property, plant and equipment. The Group has elected not to take the option in IAS 40 Investment Property to recognize its investment property at fair value. Investment property is disclosed separately from property, plant and equipment in accordance with IAS 1 Presentation of Financial Statements.
(2.9) Impairment of
intangible assets, property, plant and equipment, and investment property
Intangible assets that have an indefinite useful life or intangible assets not ready to use are not subject to amortization and are tested annually for impairment. Other intangible assets, property, plant and equipment, and investment property are reviewed for impairment whenever events or changes in circumstances indicate that the carrying amount may not be recoverable. An impairment loss is recognized for the amount by which an asset’s carrying amount exceeds its recoverable amount. The recoverable amount is the higher of an asset’s fair value less costs of disposal and its value in use. For the purposes of assessing impairment, assets are grouped at the lowest levels for which there are largely independent cash flows (cash-generating units).
(2.10) Financial assets For the purposes of identifying accounting policies applied, financial assets are classified into
the following categories: financial assets at fair value through profit or loss; loans and receivables; and available-for-sale financial assets. The classification depends on the purpose for which the financial assets were acquired. Management determines the classification of its financial assets at initial recognition and re-evaluates this designation at each reporting date.
Financial assets at fair value through profit or loss
This category has two subcategories: financial assets held for trading and those designated at fair value through profit or loss at inception. A financial asset is classified in this category if acquired principally for the purpose of selling in the short term or if so designated by management. Derivatives are also categorized as held for trading unless they are designated as hedges. Assets in this category are classified as current assets if they are either held for trading or are expected to be realized within 12 months of the balance sheet date.

Notes to the Consolidated Financial Statements
Hilti Financial Report 2013 | 27
Loans and receivables Loans and receivables are non-derivative financial assets with fixed or determinable payments that are not quoted in an active market. They arise when the Group provides money, goods or services directly to a debtor with no intention of trading the receivable. They are included in current assets, except for maturities greater than 12 months after the balance sheet date. These are classified as non-current assets. Loans and receivables are included in ‘trade and other receivables’ and ‘cash and cash equivalents’ in the balance sheet (see notes 2.12 and 2.13).
Available-for-sale financial assets
Available-for-sale financial assets are non-derivative financial assets that are either designated in this category or not classified in any of the other categories. They are included in non-current assets unless management intends to dispose of the investment within 12 months of the balance sheet date.
Accounting policies applied to financial assets
The accounting policies applied to financial assets are as follows: For all classes of financial assets, purchases and sales are recognized on trade date (the date on which the Group commits to purchase or sell the asset). Financial assets at fair value through profit or loss are initially recognized at fair value with applicable transaction costs immediately recognized in the income statement. All other financial assets are initially recognized at fair value plus transaction costs. Financial assets are derecognized when the rights to receive cash flows from the assets have expired or have been transferred and the Group has transferred substantially all risks and rewards of ownership. Available-for-sale financial assets and financial assets at fair value through profit or loss are subsequently recognized at fair value. Loans and receivables and held-to-maturity investments are recognized at amortized cost determined using the effective interest method. Realized and unrealized gains and losses arising from changes in the fair value of the ‘financial assets at fair value through profit or loss’ category are recognized in the income statement in the period they arise. Unrealized gains and losses arising from changes in the fair value of non-monetary securities classified as available-for-sale financial assets are recognized in ‘other comprehensive income’ (OCI). When these securities are sold or impaired, the accumulated fair value adjustment is reclassified to the income statement and recognized as part of gains and losses from investment securities. Financial assets and liabilities are offset and the net amount reported in the balance sheet when there is a legally enforceable right to offset the recognized amounts and there is an intention to settle on a net basis or realize the asset and settle the liability simultaneously. The fair values of quoted investments are based on current bid prices. If current bid prices are not available, fair value is determined using other information such as that derived from the market prices of other similar instruments, discounted cash flow analysis and option pricing models refined to reflect the issuer’s specific circumstances. The Group assesses at each balance sheet date whether there is objective evidence that a financial asset or a group of financial assets is impaired. In the case of equity securities classified as available-for-sale financial assets, a significant or prolonged decline in the fair value of the security below its cost is considered in determining whether the securities are impaired. If any such evidence exists for available-for-sale financial assets, the cumulative loss recognized in ‘other comprehensive income’ (OCI) (measured as the difference between the acquisition cost and the current fair value, less any impairment loss on that financial asset previously recognized in profit or loss) is reclassified to the income statement.
Notes to the Consolidated Financial Statements
Hilti Financial Report 2013 | 28
(2.11) Inventories Inventories are stated at the lower of cost and net realizable value. Cost is determined using
the standard cost method with variances capitalized at acquisition and production and recognized in the income statement together with the standard cost of inventory at time of sale. Standard costs are annually reviewed and updated in the light of current conditions. Cost determined under this method approximates cost determined under the weighted average method. The cost of finished goods and work in progress comprises design costs, raw materials, direct labor, other direct costs and related production overheads (based on normal operating capacity) and other costs incurred in bringing the inventories to their present location and condition. Net realizable value is the estimated selling price in the ordinary course of business, less costs of completion and direct selling expenses.
(2.12) Trade receivables Trade receivables (see loans and receivables category of financial assets in note 2.10 above)
are recognized initially at fair value and subsequently measured at amortized cost using the effective interest method, less an adjustment for impairment. The amount of the adjustment for impairment is based on both an individual assessment according to known circumstances of specific trade receivables and a collective assessment using an aging calculation applied to all trade receivables, excluding those individually assessed, that are ‘past due’ more than 31 days. When there is objective evidence that a trade receivable is determined to be uncollectible, it is written off against the adjustment for impairment account. Examples of such objective evidence are significant financial difficulties of debtors, probability that debtors will enter bankruptcy or financial reorganization and default or delinquency in payments. Changes in the adjustment for impairment account as well as any subsequent recoveries of amounts previously written off are recognized in the income statement.
(2.13) Cash and cash
equivalents Cash and cash equivalents include cash in hand, deposits held at call with banks and other short-term highly liquid investments with original maturities of three months or less.
(2.14) Share capital Incremental costs directly attributable to the issue of new shares or options are shown in
equity as a deduction, net of tax, from the proceeds. Where any Group entity purchases the Hilti Corporation’s equity share capital (treasury shares), the consideration paid, including any directly attributable incremental costs (net of income taxes), is deducted from equity attributable to the Group’s equity holders until the shares are canceled, re-issued or disposed of. Where such shares are subsequently sold or re-issued, any consideration received, net of any directly attributable incremental transaction costs and the related income tax effects, is included in equity attributable to the Group’s equity holders.
(2.15) Borrowings Borrowings are recognized initially at fair value net of transaction costs incurred. Borrowings
are subsequently stated at amortized cost; any difference between the amount at initial recognition and the redemption value is recognized in the income statement over the period of the borrowings using the effective interest method. Borrowings are classified as current liabilities unless the Group has an unconditional right to defer settlement of the liability for at least 12 months after the balance sheet date. The Group capitalizes borrowing costs directly attributable to the acquisition, construction or production of a qualifying asset as part of the cost of that asset.

Notes to the Consolidated Financial Statements
Hilti Financial Report 2013 | 29
(2.16) Income taxes The tax expense for the period comprises current and deferred tax. Tax is recognized in the
income statement, except to the extent that it relates to items recognized in ‘other comprehensive income (OCI)’ or directly in equity. In this case, the tax is also recognized in ‘other comprehensive income (OCI)’ or directly in equity, respectively.
Current income taxes The current income tax charge is calculated on the basis of the tax laws enacted or substantively enacted at the balance sheet date in the countries where the company and its subsidiaries operate and generate taxable income. Management periodically evaluates positions taken in tax returns with respect to situations in which applicable tax regulation is subject to interpretation. It establishes provisions where appropriate on the basis of amounts
expected to be paid to the tax authorities. Income taxes payable and refundable relating to the current or prior years are classified, respectively, as current income taxes payable and current income taxes receivable.
Deferred income taxes Deferred income taxes are provided in full, using the liability method, on temporary differences arising between the tax bases of assets and liabilities and their carrying amounts in the consolidated financial statements. However, if the deferred income tax arises from initial recognition of an asset or liability in a transaction other than a business combination that at the time of the transaction affects neither accounting nor taxable profit or loss, it is not accounted for. Deferred income tax is determined using tax rates that have been legally enacted or substantially enacted by the balance sheet date and are expected to apply when the related deferred income tax asset is realized or the deferred income tax liability is settled. Deferred income tax assets are recognized to the extent that it is probable that future taxable profit will be available against which the temporary differences can be utilized. Deferred income tax is provided on temporary differences arising on investments in subsidiaries, associates and joint arrangements except where the timing of the reversal of a temporary difference is controlled by the Group and it is probable that the temporary difference will not reverse in the foreseeable future.
(2.17) Employee benefits
Pension obligations Group companies operate various post-employment schemes, including both defined benefit and defined contribution pension plans. The schemes are generally funded through payments to insurance companies or trustee-administered funds, determined by periodic (one to three years) actuarial valuations. A defined contribution plan is a pension plan under which the Group pays fixed contributions into a separate entity and has no legal or constructive obligations to pay further contributions if the fund does not hold sufficient assets to pay all employees the benefits relating to employee service in the current and prior periods. A defined benefit plan is either a pension plan that predefines the amount of pension benefit that an employee will receive on retirement (usually dependent on one or more factors such as age, years of service and compensation) or a pension plan under which the Group has a legal or constructive obligation to pay further contributions if the fund cannot meet its employee service benefit obligations. The liability recognized in the balance sheet in respect of defined benefit pension plans is the present value of the defined benefit obligation at the end of the reporting period less the fair value of plan assets. The defined benefit obligation is calculated at least every three years by independent actuaries using the projected unit credit method. The present value of the defined benefit obligation is determined by discounting the estimated future cash outflows using interest rates of high-quality corporate bonds that are denominated in the currency in which

Notes to the Consolidated Financial Statements
Hilti Financial Report 2013 | 30
the benefits will be paid, and that have terms to maturity approximating to the terms of the related pension obligation. In countries where there is no deep market in such bonds, the market rates on government bonds are used. Actuarial gains and losses arising from experience adjustments and changes in actuarial assumptions are recognized in ’other comprehensive income’ (OCI) in the period in which they arise. Past-service costs are recognized immediately in the income statement. For defined contribution plans, the Group pays contributions to publicly or privately administered pension insurance plans on a mandatory, contractual or voluntary basis. The Group has no further payment obligations once the contributions have been paid. The contributions are recognized as employee benefit expense when they are due. Prepaid contributions are recognized as an asset to the extent that a cash refund or a reduction in the future payments is available.
Termination benefits Termination benefits are payable when employment is terminated by the Group before the normal retirement date, or whenever an employee accepts voluntary redundancy in exchange for these benefits. The Group recognizes termination benefits at the earlier of the following dates: (a) when the Group can no longer withdraw the offer of those benefits; and (b) when the entity recognizes costs for a restructuring that is within the scope of IAS 37 and involves the payment of termination benefits. In the case of an offer made to encourage voluntary redundancy, the termination benefits are measured based on the number of employees expected to accept the offer. Benefits falling due more than 12 months after the end of the reporting period are discounted to their present value.
Long-service benefits Some Group companies provide jubilee and other similar long-service benefits. The entitlement to these benefits is usually conditional on the completion of a minimum service period. The expected costs of these benefits are accrued over the period of employment using an accounting methodology similar to that used for defined benefit pension plans.
Variable compensation The Group recognizes a liability and an expense for variable compensation based on changes in key financial results, such as sales, operating profit, net income and capital employed as specified in the employment contracts.
(2.18) Provisions The Group recognizes a provision when:
the Group has a present legal or constructive obligation as a result of a past event; it is probable that an outflow of resources will be required to settle the obligation; and the amount of the obligation can be reliably estimated. Major types of provisions recognized by the Group include provisions for warranty service costs, restructuring costs, product liability and legal claims. Provisions for restructuring costs mostly comprise expected lease termination penalties and employee termination benefit payments. Provisions are not recognized for future operating losses. Where provisions relate to a number of similar obligations, such as provisions for warranty service costs, the likelihood that an outflow will be required in settlement is determined by considering the class of obligations as a whole. A provision is then recognized even if the likelihood of an outflow with respect to any one item included in the same class of obligations may be small.
(2.19) Trade and other
payables Trade and other payables are recognized initially at fair value and subsequently measured at amortized cost using the effective interest method.

Notes to the Consolidated Financial Statements
Hilti Financial Report 2013 | 31
(2.20) Revenue recognition Revenue from the sale of goods is recognized in the income statement when the significant
risks and rewards of ownership have been transferred to the buyer, the revenue can be measured reliably and the payment can be reasonably assured. Revenue from services rendered is recognized by reference to the stage of completion of the transaction at the balance sheet date. Revenue from sales of goods under finance leases is recognized in the periods the leases commence and the applicable interest income is recognized on an actuarial basis over the lease terms. All revenues from sales of goods and services rendered are recognized at normal selling price less applicable trade discounts and rebates. Revenue from operating leases is recognized on a straight-line basis over the lease terms.
(2.21) Dividend distributions Dividend distributions to the Hilti Corporation’s shareholders are recognized as liabilities in the
Group’s financial statements in the periods in which the dividends are approved by the Corporation’s shareholders.
(2.22) Financial risk
management The Group’s activities expose it to a variety of financial risks: market risk (including currency risk, interest rate risk and other price risk), credit risk and liquidity risk. The Group’s overall risk management program focuses on the unpredictability of financial markets and seeks to minimize potential adverse effects on the Group’s financial performance. The Group uses derivative financial instruments to hedge certain risk exposures. Risk management is carried out by a central treasury department (Corporate Treasury) under policies approved by the Board of Directors. Corporate Treasury identifies, evaluates and hedges certain financial risks in close co-operation with the Group’s operating units. The Board provides written principles for overall risk management, as well as written policies covering specific areas, such as the use of derivative and non-derivative financial instruments, managing market risk, credit risk and investing excess liquidity.
Market risk Currency risk The Group operates globally and is exposed to risk arising from various currency exposures, primarily with respect to the euro and the US dollar. Currency risk arises from future commercial transactions, recognized assets and liabilities and net investments in foreign operations, when future commercial transactions and recognized assets and liabilities are denominated in a currency that is not the entity’s functional currency. Currency risk arising from future operating transactions (sales and purchases of goods and services) and recognized assets and liabilities is managed by Corporate Treasury using hedging instruments, primarily forward contracts, cross-currency swaps and currency options. Corporate Treasury’s risk management practice is to hedge between 50% and 100% of the Group’s anticipated net cash in- or outflows in each major foreign currency for the subsequent 12 months. For hedge accounting purposes, forward contracts are designated against the relevant amounts of projected intercompany sales by the parent company and 100% (2012: 100%) of projected sales qualify as ‘highly probable’ forecast transactions. The four categories of recognized financial assets and liabilities having the largest currency translation risk exposure are trade and other receivables, cash and cash equivalents, trade and other payables and bonds. The currency denominations at the balance sheet date of the carrying amounts of these items are shown in notes 14, 18, 23 and 25 respectively. These items represent the largest portions of the balances underlying the Group’s investments in foreign operations.

Notes to the Consolidated Financial Statements
Hilti Financial Report 2013 | 32
Currency exposures arising from open balances with third parties and/or Group companies in trade and other receivables, trade and other payables, and bonds are reduced through the natural hedging (currency matching) of these items as well as managed using hedging instruments. Currency exposures arising from cash and cash equivalents are reduced by limiting non-Swiss franc denominated investments to the main currencies of the operative business of the Group (primarily euro and US dollar) and by limiting the proportions of investments in these currencies. At December 31, if the Swiss franc had strengthened/weakened by 10% against the US dollar/euro with all other variables held constant, net income for the year would have been affected as follows:
in CHF million Swiss franc
strengthened (+10%) Swiss franc
weakened (–10%) 2013 2012 2013 2012
USD (2.6) (2.8) 2.6 2.8 EUR 3.4 (0.2) (3.4) 0.2
These effects result from the translation of trade receivables, trade payables, loans, cash and cash equivalents and derivative contracts held in foreign currencies.
At December 31, if the Swiss franc had strengthened/weakened by 10% against the US dollar/euro with all other variables held constant, ‘other comprehensive income’ (OCI) would have been affected as follows:
in CHF million Swiss franc
strengthened (+10%) Swiss franc
weakened (–10%) 2013 2012 2013 2012
USD (1.4) (1.7) 1.4 1.7 EUR (8.9) (8.0) 8.9 8.0
These effects result from (i) the translation of foreign currency long-term intercompany loans treated as equity and (ii) changes in the values (due to the respective Swiss franc movements) of CHF derivative contracts held to hedge foreign currency risk. However, these effects exclude the impacts of exchange differences arising on Group entity financial instruments that are covered by the retranslation adjustments of net investments in foreign operations (see note 2.5, 4th and 5th bullet points under subheading ‘Translation on Consolidation’).
Interest rate risk
The Group has significant investments in interest-bearing assets, mainly deposits, and significant long-term borrowings, mostly consisting of bonds the Group itself has issued. Interest-bearing assets and borrowings subject to variable rates or held for trading expose the Group to cash flow interest rate risk. Interest-bearing assets and borrowings subject to fixed rates and not held for trading expose the Group to fair value interest rate risk.
Virtually all the Group’s interest-bearing assets are subject to variable rates or are reported at fair value through profit or loss because they are held for trading. All the Group’s bond liabilities are reported at amortized cost. The interest-bearing assets are denominated primarily in Swiss franc and euro investments (see note 18) and the bond liabilities are effectively denominated in a combination of Swiss franc and euro. Interest rate risk arising from long-term financing (banking and capital market) liabilities is managed by Corporate Treasury by using hedging instruments, primarily interest rate swaps. Corporate Treasury’s risk management practice is to hedge between 40% and 60% of the Group’s relevant interest exposure.

Notes to the Consolidated Financial Statements
Hilti Financial Report 2013 | 33
Based on December 31 levels of borrowings subject to variable rates and interest-bearing assets subject to variable rates or held for trading, an increase/decrease of ten basis points would have affected net income as follows:
in CHF million Increase of ten
basis points Decrease of ten
basis points 2013 2012 2013 2012
All currencies 1.2 0.9 (1.2) (0.9)
Separate simulations of the impact of interest rate changes on each of the Swiss franc, euro and US dollar investment holdings have not been completed since an increase/decrease of ten basis points is considered reasonably possible for each of the three currencies.
Due to interest rate derivatives, ‘other comprehensive income’ (OCI) would have been impacted as follows:
in CHF million Increase of ten
basis points Decrease of ten
basis points 2013 2012 2013 2012
CHF (0.5) – 0.5 –
Other price risk
The Group is exposed to some securities price risk because of investments held by the Group which are at fair value through profit or loss. However, the impact of adverse price changes would be minor since the Group’s investments in equities are relatively small. At the balance sheet date, the carrying value of such investments is CHF 7.7 million (2012: CHF 16.4 million). Accordingly, no sensitivity analysis has been undertaken.
Credit risk Credit risk is managed on a Group basis. Virtually all credit risk arises from cash and cash equivalents (which primarily consist of demand deposits with first-class financial institutions and a deposit with an investment company owned by the shareholder) and from trade receivables (which represent credit exposures to customers). The Group has significant concentrations of credit risk arising from its investments in cash and cash equivalents. These concentrations relate to demand deposits with banking institutions and to a deposit with an investment company owned by the shareholder (see note 42). Relevant credit information about the largest banking institution counterparties at the balance sheet date is given in note 18. A minimum credit rating of ‘A’ applies to all counterparty banking institutions. For trade receivables, the Group has policies in place to ensure that credit sales of products are made to customers with appropriate credit histories. In addition, an active credit management focus is maintained in all the Group’s market organizations to ensure that the impact of credit risk is minimized. Details of the impairment estimates of trade receivables are given in note 14. The Group has no significant concentrations of corresponding credit risk with trade receivables.
Liquidity risk Cash flow forecasting is performed in the operating companies of the Group and aggregated by Corporate Treasury. Corporate Treasury monitors rolling forecasts of the Group’s liquidity requirements to ensure it has sufficient cash to meet operational needs while maintaining sufficient headroom on its undrawn established borrowing facilities at all times so that the Group does not breach borrowing limits or covenants (where applicable) on any of its

Notes to the Consolidated Financial Statements
Hilti Financial Report 2013 | 34
borrowing facilities. Such forecasting takes into consideration the Group’s debt financing plans, covenant compliance, compliance with internal balance sheet ratio targets and, if applicable, external regulatory or legal requirements – for example currency restrictions. Surplus cash held by the operating companies over and above balance required for working capital management is transferred to Corporate Treasury. Corporate Treasury invests surplus cash in interest-bearing current accounts and time deposits, choosing instruments with appropriate maturities or sufficient liquidity to provide sufficient headroom as determined by the above-mentioned forecasts. At the reporting date, the Group held liquid funds of CHF 1,538.3 million (2012: CHF 1,306.6 million) that are expected to readily generate cash inflows for managing liquidity risk. The table below analyzes the Group’s non-derivative financial liabilities into relevant maturity groupings based on the periods from the balance sheet date to the contractual maturity date. The amounts disclosed in the table are the contractual undiscounted cash flows including future interest payments:
in CHF million Less than 1
year Between 1 and 2 years
Between 2 and 5 years
Over 5 years
At December 31, 2013
Borrowings 447.6 70.2 261.6 159.6 Finance lease liabilities 0.1 0.6 0.6 – Trade and other payables 342.6 6.9 4.0 12.8
in CHF million Less than 1 year
Between 1 and 2 years
Between 2 and 5 years
Over 5 years
At December 31, 2012*
Borrowings (excluding finance lease liabilities) 316.4 356.3 200.9 50.8 Finance lease liabilities 0.2 0.7 0.5 – Trade and other payables 318.5 0.8 6.8 13.2 * Restated, see note 2.2
All of the non-trading Group’s gross settled derivative financial instruments are in hedge relationships and are due to settle within 12 months of the balance sheet date. These contracts require undiscounted contractual cash inflows of CHF 519.0 million (2012: CHF 548.4 million) and undiscounted contractual cash outflows of CHF 481.1 million (2012: CHF 524.3 million). All of the non-trading Group’s derivative financial instruments are in hedge relationships and are disclosed in note 16.
The Group has an outstanding cross currency swap which is due in April 2014. This gross settled derivative financial instrument generates undiscounted contractual cash inflows of CHF 95.8 million (2012: CHF 98.9 million) and undiscounted contractual cash outflows of CHF 73.9 million (2012: CHF 79.6 million).
(2.23) Capital structure risk
management The Group’s primary ob ective when managing capital is to add sustainable value for investors while ensuring the independence of the Group. In order to maintain or adjust the capital structure, the Group maintains a flexible dividend policy within the limits of its overall finance policies. The Group monitors capital on the basis of the equity ratio measured as equity in percentage of total equity and liabilities. The Group views a high equity ratio as the basis for ensuring security, capability of taking risk, independence, flexibility and creditworthiness. The Group’s

Notes to the Consolidated Financial Statements
Hilti Financial Report 2013 | 35
objective is to maintain a sufficiently high equity ratio primarily to ensure independence from the influence of external creditors as well as to maintain a high external credit rating to help minimize the cost of debt if and when further debt is issued. The Group’s policy is to maintain a minimum equity ratio of 50% on a mid-term basis. Following is equity ratio information at the balance sheet date:
in CHF million 2013 2012*
Total equity 2,522.8 2,328.1 Total equity and liabilities 4,762.9 4,555.6 Total equity in % Total equity and liabilities 53.0 51.1 * Restated, see note 2.2
The Group’s credit rating as assessed by the Credit Suisse Banking Group during 01 on the basis of the Group’s 01 Financial Report is ‘High A stable’ (2012: ‘High A stable’) (see Credit Suisse: Swiss Corporate Credit Handbook September 2013).
(2.24) Fair value estimation The table below analyzes financial instruments carried at fair value, by valuation method. The
different levels have been defined as follows: Quoted prices (unadjusted) in active markets for identical assets or liabilities (level 1). Inputs other than quoted prices included within level 1 that are observable for the asset or
liability, either directly (that is, as prices) or indirectly (that is, derived from prices) (level 2). Inputs for the asset or liability that are not based on observable market data (that is,
unobservable inputs) (level 3). The following table presents the Group’s assets and liabilities that are measured at fair value:
in CHF million Level 1 Level 2 Level 3 Total
At December 31, 2013 Assets
Financial assets at fair value through profit and loss 32.1 – – 32.1 Derivatives used for hedging – 33.8 – 33.8 Liabilities Derivatives used for hedging – 2.9 – 2.9
in CHF million Level 1 Level 2 Level 3 Total
At December 31, 2012* Assets Financial assets at fair value
through profit and loss 35.9 – – 35.9 Derivatives used for hedging – 28.2 – 28.2 Liabilities Derivatives used for hedging – 4.3 – 4.3 Restated, see note 2.2
There were no transfers between levels 1 and 2 during the year.

Notes to the Consolidated Financial Statements
Hilti Financial Report 2013 | 36
The fair value of financial instruments traded in active markets is based on quoted market prices at the balance sheet date. A market is regarded as active if quoted prices are readily and regularly available from an exchange, dealer, broker, industry group, pricing service or regulatory agency, and those prices represent actual and regularly occurring market transactions on an arm’s-length basis. The quoted market price used for financial assets held by the Group is the current bid price. These instruments are included in level 1.
The fair value of financial instruments that are not traded in an active market (for example, over-the-counter derivatives) is determined by using valuation techniques. These valuation techniques maximize the use of observable market data where it is available and rely as little as possible on entity-specific estimates. If all significant inputs required to determine the fair value of an instrument are observable, the instrument is included in level 2.
If one or more of the significant inputs is not based on observable market data, the instrument is included in level 3. Specific factors relevant to the valuation of financial instruments include:
Quoted market prices or dealer quotes for similar instruments. The fair value of interest rate swaps is calculated as the present value of the estimated
future cash flows based on observable yield curves. The fair value of forward foreign exchange contracts is determined using forward
exchange rates at the balance sheet date, with the resulting value discounted back to present value.
Other techniques, such as discounted cash flow analysis, are used to determine fair value for the remaining financial instruments.
The carrying values of trade receivables and payables are assumed to approximate their fair values. The carrying value of trade receivables is the total balance that is contractually receivable less the applicable impairment adjustment (see loans and receivables category of financial assets in note 2.10 above). The fair value of financial liabilities for disclosure purposes is estimated by discounting the future contractual cash flows at the current market interest rate that is available to the Group for similar financial instruments.
(2.25) Accounting for
derivative financial instruments and hedging activities
Derivatives are initially recognized at fair value on the date a derivative contract is entered into and are subsequently remeasured at their fair value. The method of recognizing the resulting gain or loss depends on whether the derivative is designated as a hedging instrument, and if so, the nature of the item being hedged. The Group designates certain derivatives as one of: hedges of the fair value of recognized assets or liabilities or a firm commitment (fair value
hedges); hedges of highly probable forecast transactions (cash flow hedges); and hedges of net investments in foreign operations (net investment hedges). At the inception of the transaction the Group documents the relationship between hedging instruments and hedged items, as well as its risk management objective and strategy for undertaking various hedge transactions. The Group also documents its assessment, both at hedge inception and at each external reporting date, of whether the derivatives that are used in hedging transactions are highly effective in offsetting changes in fair values or cash flows of hedged items.
Fair value hedges Changes in the fair value of derivatives that are designated and qualify as fair value hedges are recognized in the income statement, together with any changes in the fair value of the hedged asset or liability that are attributable to the hedged risk.

Notes to the Consolidated Financial Statements
Hilti Financial Report 2013 | 37
Cash flow hedges The effective portion of changes in the fair value of derivatives that are designated and qualify as cash flow hedges are recognized in ‘other comprehensive income’ (OCI). The gain or loss relating to the ineffective portion is recognized immediately in the income statement. Amounts recognized in the ‘cash flow hedging reserve’ are reclassified to the income statement in the periods when the hedged item will affect profit or loss (for example, when the hedged forecast sale takes place). When a hedging instrument expires or is sold, or when a hedge no longer meets the criteria for hedge accounting, any cumulative gain or loss recognized in equity at that time remains in equity and is reclassified to the income statement when the forecast transaction is ultimately recognized in the income statement. However, when a forecast transaction is no longer expected to occur, the applicable cumulative gain or loss recognized in the ‘cash flow hedging reserve’ is immediately reclassified to the income statement.
Net investment hedges Hedges of net investments in foreign operations are accounted for similarly to cash flow hedges. Any gain or loss on the hedging instrument relating to the effective portion of the hedge is recognized in the ‘cash flow hedging reserve’. The gain or loss relating to the ineffective portion is recognized immediately in the income statement. Gains and losses recognized in the ‘cash flow hedging reserve’ are reclassified to the income statement when the foreign operation is disposed of.
Derivatives that do not qualify for hedge accounting
Certain derivative instruments do not qualify for hedge accounting. Changes in the fair value of any derivative instruments that do not qualify for hedge accounting are recognized immediately in the income statement. The fair values of various derivative instruments used for hedging purposes are disclosed in note 16.
Notes to the Consolidated Financial Statements
Hilti Financial Report 2013 | 38
(3) Critical accounting estimates and judgments Estimates and judgments are continually evaluated and are based on historical experience and other factors, including expectations of future events that are believed to be reasonable under the circumstances. The Group makes estimates and assumptions concerning the future. The resulting accounting estimates will, by definition, seldom equal the related actual results. The estimates and assumptions that have a significant risk of causing a material adjustment to the carrying amounts of assets and liabilities within the next financial year are discussed below.
(3.1) Trade receivables Losses on trade receivables are recognized when they are incurred, which requires management’s best estimate of probable losses. Such estimate requires consideration of historical loss experience, adjusted for current conditions, and judgments about the probable effects of relevant observable data, including financial health of specific customers and market sectors or collateral values . Detailed information concerning trade receivables is given in note 14.
(3.2) Inventories Write-downs of inventories are recognized for particular items when net realizable value falls below cost. The determination of net realizable value is made using a valuation process based on the aging of items with aging parameters set based on estimates o f historical loss experience. This process assumes a linear realizable value reduction based on age which might not always be reflective of market behavior. Detailed information concerning inventories is given in note 13.
(3.3) Goodwill The Group tests annually whether goodwill has suffered any impairment, in accordance with the accounting policies stated in notes 2.6 and 2.9. The recoverable amounts of cash-generating units are determined based on value-in-use calculations which require medium- and long-term estimates. They comprise internal planning data (cash flows, growth rates, etc.) as well as parameters based on external data (e.g. discount rates). Detailed information concerning the annual goodwill impairment test is given in note 7.
(3.4) Employee benefits The status of various defined benefit plans depends on long-term actuarial assumptions that may differ from actual future developments. The calculation of the discount rate, future increases in salaries/wages and pensions, and mortality are important assumptions in actuarial valuations. Detailed information concerning the defined benefit plans is given in note 22.
(3.5) Income taxes The measurement of current and deferred income tax liabilities or assets is dependent on the interpretation of income tax laws and regulations in the respective countries. Additionally, in tax audits the judgment made by management and tax consultants is finally checked and adapted. As a consequence deviations between the initial assumptions and the final determination of income taxes may lead to material changes to current or deferred income tax expense of the period in which income tax is definite. Furthermore, the recognition of deferred tax assets on tax loss carryforwards depends on the probability of future taxable profits of Group companies. Several internal and external factors are used in the estimation of such future profits. (3.6) Other critical accounting estimates and judgments In the ordinary course of business, the company is or may be involved in lawsuits, claims, investigations and proceedings, including product liability, commercial, environmental, health and safety matters, etc. The company is currently not aware of any such matter that either individually or in the aggregate could likely have a material adverse effect on the company’s future f inancial position or results of operations.

Notes to the Consolidated Financial Statements
Hilti Financial Report 2013 | 39
(4) Early adoption of IFRS requirements During 2013, the Group has not early adopted the requirements of the following IFRS standards, which at December 31, 2013, have been issued but are not effective for the 2013 Group financial statements:
Standard/ Amendment to Standard
Effective date Content Importance for the Group
IAS 32 Financial Instruments – Presentation (Amendments)
January 1, 2014
These amendments clarify some of the requirements for offsetting financial assets and financial liabilities on the balance sheet.
No significant impact expected.
IAS 36 Impairment of Assets - Recoverable amount disclosures (Amendment)
January 1, 2014
This amendment addresses the disclosure of information about the recoverable amount of impaired assets if that amount is based on fair value less cost of disposal.
No significant impact expected.
IAS 39 Financial Instruments – Novation of derivatives (Amendments)
January 1, 2014
These amendments provide relief from discontinuing hedge accounting when novation of a derivative designated as a hedging instrument meets certain criteria.
No significant impact expected.
IFRS 10, IFRS 12 and IAS 27 Investment Entities (Amendments)
January 1, 2014
These amendments provide an exception to the consolidation requirement for entities that meet the definition of an investment entity under IFRS 10. The exception to consolidation requires investment entities to account for subsidiaries at fair value through profit or loss.
It is not expected that this amendment would be relevant for the Group, since none of the entities in the Group would qualify to be an investment entity under IFRS 10.
IFRIC 21 Levies January 1, 2014
IFRIC 21 clarifies that an entity recognizes a liability for a levy when the activity that triggers payment, as identified by the relevant legislation, occurs. For a levy that is triggered upon reaching a minimum threshold, the interpretation clarifies that no liability should be anticipated before the minimum threshold is reached.
No significant impact expected.
IFRS 9 Financial Instruments
Not yet published
The standard addresses the classification, measurement and derecognition of financial assets, financial liabilities and hedge accounting.
The potential impact on the Group’s Financial Statements is currently being assessed.

Notes to the Consolidated Financial Statements
Hilti Financial Report 2013 | 40
(5) Business combinations and transactions with non-controlling interests (5.1) Business combinations There were no business combinations during the reporting period.
(5.2) Transactions with non-controlling interests On January 1, 2013, the Group acquired an additional 24% interest in Hilti Saudi Arabia for Construction Tools LLC, Saudi Arabia, at a net consideration of CHF 0.1 million increasing its ownership interest to 75%. The Group derecognized non-controlling interests of CHF 3.4 million and recorded an increase in equity attributable to equity holders of the parent of CHF 3.3 million. On August 14, 2012, the Group acquired the remaining 49% interest in Hilti Tendon Technologies Pty. Ltd., Australia, at a contingent consideration of CHF 1.4 million. The carrying amount of the non-controlling interests in Hilti Tendon Technologies Pty. Ltd. on the date of acquisition was CHF (0.2) million. The Group derecognized non-controlling interests of CHF (0.2) million and recorded a decrease in equity attributable to equity holders of the parent of CHF 1.6 million. The effect of these changes in ownership interests on the equity attributable to equity holders of the parent is summarized in the table below: in CHF million 2013 2012
Carrying amount of non-controlling interests acquired 3.4 (0.2) Net consideration to non-controlling interests (0.1) (1.4) Net effect on equity attributable to equity holders of the parent 3.3 (1.6)
(6) Financial assets and liabilities Financial assets and liabilities listed according to the measurement categories identified under IAS 39 Financial Instruments : Recognition and Measurement and the corresponding balance sheet items are as follows: in CHF million Corresponding balance sheet item(s) 2013 2012*
Financial assets
Financial assets at fair value through profit or loss
Financial assets at fair value through profit or loss, derivative financial instruments 62.9 61.4
Derivatives used for hedging Derivative financial instruments 3.0 2.7
Loans and receivables Cash and cash equivalents, other financial investments, trade and other receivables 2,857.3 2,569.3
Available-for-sale financial assets – – Total financial assets 2,923.2 2,633.4
Financial liabilities
Financial liabilities at fair value through profit or loss Derivative financial instruments 1.3 2.6 Derivatives used for hedging Derivative financial instruments 1.6 1.7 Financial liabilities measured at amortized cost
Bonds, long-term bank borrowings, trade and other payables, short-term bank borrowings 1,246.9 1,206.7
Total financial liabilities 1,249.8 1,211.0 * Restated, see note 2.2

Notes to the Consolidated Financial Statements
Hilti Financial Report 2013 | 41
(7) Intangible assets in CHF million Goodwill Develop-
ment costs Other intangible assets
Total
Cost 2013
Opening balance at January 1, 2013 86.6 524.6 195.5 806.7 Currency translation adjustment (2.4) – (1.5) (3.9) Change in scope of consolidation – – – – Additions – 74.0 5.1 79.1 Disposals – (80.8) (4.5) (85.3) Other transfers – – – – Closing balance at December 31, 2013 84.2 517.8 194.6 796.6 Accumulated amortization 2013 Opening balance at January 1, 2013 – (302.0) (133.4) (435.4) Currency translation adjustment 1.9 – 1.0 2.9 Change in scope of consolidation – – – – Additions – (37.8) (19.7) (57.5) Impairment losses (46.8) (3.4) (1.7) (51.9) Disposals – 80.8 4.5 85.3 Other transfers – – – – Closing balance at December 31, 2013 (44.9) (262.4) (149.3) (456.6) Net book values at December 31, 2013 39.3 255.4 45.3 340.0 in CHF million Goodwill Develop-
ment costs Other intangible assets
Total
Cost 2012 Opening balance at January 1, 2012* 88.5 470.0 194.6 753.1
Currency translation adjustment (1.9) – (1.1) (3.0) Change in scope of consolidation – – – – Additions – 56.8 5.1 61.9 Disposals – (2.1) (3.2) (5.3) Other transfers – (0.1) 0.1 – Closing balance at December 31, 2012* 86.6 524.6 195.5 806.7
Accumulated amortization 2012 Opening balance at January 1, 2012* – (248.5) (110.2) (358.7)
Currency translation adjustment – – 0.7 0.7 Change in scope of consolidation – – – – Additions – (51.9) (25.1) (77.0) Impairment losses – (1.8) (1.9) (3.7) Disposals – 0.2 3.1 3.3 Other transfers – – – – Closing balance at December 31, 2012* – (302.0) (133.4) (435.4)
Net book values at December 31, 2012 86.6 222.6 62.1 371.3 * Restated, see note 2.2

Notes to the Consolidated Financial Statements
Hilti Financial Report 2013 | 42
Of intangible assets, only development costs are internally generated; all other intangible assets are acquired. Other intang ible assets consist mainly of patents, brands, customer lists and database/application software licenses. Additions to accumulated amortization and impairment losses are included in ‘depreciation and amortization’ (see note 32). The amortization period for the majority of development costs has been extended from three to five years in 2013 (see note 2.2). The goodwill of CHF 84.2 million (2012: CHF 86.6 million) arises from the acquisition of Unirac Inc. in 2010. In accordance with IAS 36, goodwill is tested annually for impairment. Based on the assessment made in 2013, an impairment loss has been recognized in the Group’s 01 financial statements of CHF 46.8 million. Details are described below. For impairment testing purposes, goodwill is solely allocated to the Group’s worldwide solar business as the cash-generating unit (CGU). To test for possible impairment of goodwill, the discounted value of the estimated future cash flows of the CGU (its ‘value in use’) is compared with its carrying amount. The future cash flows are estimated on the basis of the business plan approved by management in general covering a three-year forecast period – 2014 to 2016 (2012: 2013 to 2015) – and a constant growth rate assumption of 1.0% (2012: 2.0%) for the terminal value beyond 2016 (2012: beyond 2015). The value in use of the CGU is based on a discount rate of 9.9% before tax (2012: 10.7%) and was determined to be below its carrying amount. The value in use of the CGU was used as the recoverable amount since the fair value less cost of disposal was determined to be even lower. The recoverable amount of the solar CGU amounts to CHF 92 million as at December 31, 2013. The calculation of the value in use is most sensitive to the following assumptions: Market outlook: The impairment loss results principally from significant structural changes in the solar business. Deterioration in
subsidy conditions reduced the market volume, especially in the European market, and at the same time led to a significant reduction in prices as well as an increased competition. The projected cash flows have been updated to reflect these market developments and are based on the assumption that cost reductions resulting from efficiency increases can be accomplished. Should the projected annual cash flows be lowered by 10% the impairment loss would increase by CHF 9 million.
Discount rate: The discount rate used reflects specific risks to the CGU solar and is derived from its weighted average cost of capital (WACC). Should the post-tax discount rate be raised by 1.0% the impairment loss would increase by CHF 13 million.
Long-term growth rate: The long-term growth rate used for the relevant countries and markets is based upon management’s expectations for the solar market as well as future projections, which are corroborated by external information sources. The growth rate employed does not exceed the long-term average growth rate customarily used for the relevant countries and markets. Should the long-term growth rate be decreased to 0% the impairment loss would increase by CHF 10 million.

Notes to the Consolidated Financial Statements
Hilti Financial Report 2013 | 43
(8) Property, plant and equipment in CHF million Land and
buildings Plant and machinery
Other operating assets
Assets under con- struction
Total
Cost 2013
Opening balance at January 1, 2013 764.2 782.9 534.6 53.5 2,135.2 Currency translation adjustment (2.3) 3.9 (7.0) 0.1 (5.3) Change in scope of consolidation – – – – – Additions 4.3 19.5 40.5 65.8 130.1 Disposals (8.9) (22.4) (58.7) – (90.0) Transfers to investment properties – – – – – Other transfers 3.3 19.4 6.8 (29.5) – Closing balance at December 31, 2013 760.6 803.3 516.2 89.9 2,170.0 Accumulated depreciation 2013 Opening balance at January 1, 2013 (381.1) (586.4) (416.3) – (1,383.8) Currency translation adjustment 0.6 (3.3) 4.5 – 1.8 Change in scope of consolidation – – – – – Additions (18.2) (44.6) (45.9) – (108.7) Impairment losses – (2.2) – – (2.2) Disposals 8.0 21.5 54.2 – 83.7 Transfers to investment properties – – – – – Other transfers – – – – – Closing balance at December 31, 2013 (390.7) (615.0) (403.5) – (1,409.2) Net book values at December 31, 2013 369.9 188.3 112.7 89.9 760.8

Notes to the Consolidated Financial Statements
Hilti Financial Report 2013 | 44
in CHF million Land and buildings
Plant and machinery
Other operating assets
Assets under con- struction
Total
Cost 2012
Opening balance at January 1, 2012* 751.9 752.2 534.8 41.1 2,080.0 Currency translation adjustment (6.6) (1.1) (3.1) 0.5 (10.3) Change in scope of consolidation – – – – – Additions 11.2 29.1 37.9 47.9 126.1 Disposals (2.2) (13.6) (44.8) – (60.6) Transfers to investment properties – – – – – Other transfers 9.9 16.3 9.8 (36.0) – Closing balance at December 31, 2012* 764.2 782.9 534.6 53.5 2,135.2 Accumulated depreciation 2012 Opening balance at January 1, 2012* (366.4) (555.6) (407.9) – (1,329.9) Currency translation adjustment 3.0 1.1 2.8 – 6.9 Change in scope of consolidation – – – – – Additions (19.7) (45.0) (50.6) – (115.3) Impairment losses – – – – – Disposals 2.0 13.1 39.4 – 54.5 Transfers to investment properties – – – – – Other transfers – – – – – Closing balance at December 31, 2012* (381.1) (586.4) (416.3) – (1,383.8) Net book values at December 31, 2012* 383.1 196.5 118.3 53.5 751.4 * Restated, see note 2.2 Other operating assets consist mainly of office equipment, testing instruments, leasehold improvements and vehicles. Capital expenditure, shown as additions to cost, relates primarily to manufacturing facilities enhancements, extensions of sales organizations and the construction of the innovation center at corporate headquarters. Additions to accumulated depreciation are included in ‘depreciation and amortization’ (see note 32). Assets held under finance leases are included in plant and machinery and other operating assets at a net book value of CHF 2.5 million ( 01 : CHF . million). The liabilities arising from finance leases are detailed in note 25. Land and buildings with a book value of CHF 0. million ( 01 : CHF 0. million) serve as security for other payables (see note 25) with the total amount of CHF 2.4 million (2012: CHF 2.1 million).

Notes to the Consolidated Financial Statements
Hilti Financial Report 2013 | 45
(9) Investment property in CHF million 2013 2012
Cost
Opening balance at January 1 27.0 33.0 Currency translation adjustment – – Change in scope of consolidation – – Additions – – Disposals (19.5) (6.0) Transfers – – Closing balance at December 31 7.5 27.0 Accumulated depreciation Opening balance at January 1 (24.8) (26.2) Currency translation adjustment – – Change in scope of consolidation – – Additions – (0.2) Impairment losses – (1.0) Disposals 19.5 2.6 Transfers – – Closing balance at December 31 (5.3) (24.8) Net book values at December 31 2.2 2.2 Fair value of investment property at December 31 4.9 5.6 The fair value of investment property as at December 31 is determined as follows: The land component is determined by appraisal based on comparable property land values in the corresponding areas. The building component is determined as the estimated depreciated replacement cost of the applicable buildings. A valuation has not been undertaken by an independent surveyor since total investment property is insignificant. The fair values are within level 2 of the fair value hierarchy. There are no restrictions on the realizability of investment property. The following amounts related to investment property have been recognized in the income statement: in CHF million 2013 2012
Rental income 0.1 0.1 Direct operating expenses arising from investment properties that generated rental income – (0.1) Direct operating expenses arising from investment properties that did not generate rental income – –
(10) Investments in associates and joint ventures The Group has no ownership interests in associates and joint ventures during the reporting period.

Notes to the Consolidated Financial Statements
Hilti Financial Report 2013 | 46
(11) Deferred income taxes Deferred income tax assets and liabilities are offset when there is a legally enforceable right to offset current tax assets against current tax liabilities and when the deferred income taxes relate to the same fiscal authority. The net book values are as follows: in CHF million 2013 2012*
Recovery of deferred tax balances
More than 1 year 0.3 16.8 Less than 1 year 100.2 97.2 Total 100.5 114.0
Components of deferred tax balances
Inventories 54.6 53.3 Fixed and intangible assets 26.9 22.2 Provisions and employee benefits 57.6 61.5 Receivables (93.9) (85.4) Tax losses 27.5 31.4 Other 27.8 31.0 Total 100.5 114.0 of which recognized as deferred tax assets 126.5 142.6 of which recognized as deferred tax liabilities (26.0) (28.6) * Restated, see note 2.2 The movements in net deferred tax assets (liabilities) during the reporting period are as follows: in CHF million Inventories Fixed and
intangible assets
Provisions and employee benefits
Receivables Tax losses
Other Total
Net deferred income tax assets/(liabilities)
Opening balance at January 1, 2013 53.3 22.2 61.5 (85.4) 31.4 31.0 114.0 Changes in scope of consolidation – – – – – – – (Charged)/credited to income statement 3.8 4.6 2.7 (6.8) (3.8) (1.5) (1.0) (Charged)/credited to OCI – – (5.5) – – – (5.5) Currency translation adjustment (2.5) 0.1 (1.1) (1.7) (0.1) (1.7) (7.0) Closing balance at December 31, 2013 54.6 26.9 57.6 (93.9) 27.5 27.8 100.5 Opening balance at January 1, 2012* 48.2 17.3 52.8 (72.8) 26.6 22.0 94.1 Changes in scope of consolidation – – – – – – – (Charged)/credited to income statement 6.0 5.3 (3.1) (13.0) 4.8 9.7 9.7 (Charged)/credited to OCI – – 12.5 – – – 12.5 Currency translation adjustment (0.9) (0.4) (0.7) 0.4 – (0.7) (2.3) Closing balance at December 31, 2012* 53.3 22.2 61.5 (85.4) 31.4 31.0 114.0 * Restated, see note 2.2 The category inventories includes the tax effects of temporary differences arising on unrealized intercompany profits as well as those arising on differences between tax and accounting treatment regarding inventory measurements at the legal entity. The category fixed and intangible assets includes the tax effects of temporary differences arising both on intangible assets and on property, plant and equipment. The category provisions and employee benefits includes items charged/credited to OCI which are tax effects of temporary differences arising on remeasurements on defined benefit pension plans. The category receivables includes tax effects on temporary

Notes to the Consolidated Financial Statements
Hilti Financial Report 2013 | 47
differences arising on fleet management sales/receivables due to the different treatment in some tax legislations (operating lease) and IFRS (finance lease) as well as on differences between tax and accounting treatment regarding receivable measurements at the legal entity. The category ‘other’ mainly includes tax effects on temporary differences arising on accruals and financial instruments. Deferred income tax assets are recognized for tax loss carryforwards to the extent that the realization of the related tax benefit through the future taxable profits is probable. Details are as follows: in CHF million 2013 2012
Tax loss carryforwards recognized in deferred tax 193.1 231.1 Unused tax loss carryforwards 112.8 127.0 Total tax loss carryforwards 305.9 358.1 Expiration of unused tax loss carryforwards:
Expiration < 1 year 6.3 4.9 Expiration 1 to <= 5 years 6.2 7.6 Expiration > 5 years or no expiration date 100.3 114.5 Tax effect of unused tax loss carryforwards 31.8 36.3 Unremitted earnings subject to withholding tax or other taxes 278.5 263.4 Deferred income tax liabilities have not been recognized for the withholding tax and other taxes that would be payable on the unremitted earnings of certain subsidiaries totaling CHF 278.5 million (2012: CHF 263.4 million). Such amounts are permanently re-invested.
(12) Other financial investments in CHF million 2013 2012*
Maturity
1 to < 2 years 1.9 1.7 2 to < 3 years 0.1 0.1 3 to < 4 years 1.4 – 4 to < 5 years – 1.5 >= 5 years 10.0 11.1 Total other financial investments 13.4 14.4
Further information Fair values 13.4 14.4
Average effective interest rates (in %)
1.6 1.7 * Restated, see note 2.2 Other financial investments are recognized at amortized cost. These comprise mainly long-term loans granted to third parties, deposits (e.g. in respect of rented premises) and other investments in equities.
(13) Inventories in CHF million 2013 2012*
Raw materials 56.8 69.2 Work in progress 9.0 8.8 Finished goods 482.7 485.4 Total inventories 548.5 563.4 * Restated, see note 2.2

Notes to the Consolidated Financial Statements
Hilti Financial Report 2013 | 48
The change in inventories includes a currency translation adjustment which reduces the inventories by CHF 16.1 million in 2013. This is due to the change in closing rates in 2013 compared to those in 2012. Allowance made for possible inventory losses due to age and obsolescence totals CHF 48.2 million (2012: CHF 55.1 million). The change in the allowance recognized in the income statement is CHF 5.7 million (2012: CHF 1.8 million). This change is included in the line ‘change in inventory’. Inventories totaling CHF 114.6 million (2012: CHF 113.7 million) serve as security for bank borrowings of CHF 25.1 million (2012: CHF 27.5 million) (see notes 24 and 28).
(14) Trade and other receivables in CHF million 2013 2012*
Trade receivables 1,298.6 1,241.7 Less adjustment for impairment of trade receivables (114.8) (99.8) Trade receivables net 1,183.8 1,141.9 Other receivables 121.8 106.4 Total trade and other receivables 1,305.6 1,248.3 Current portion 943.2 899.2 Non-current portion 362.4 349.1 Total trade and other receivables 1,305.6 1,248.3
Further information
Average effective interest rates (in %) 4.4 4.0
Maturity of non-current portion
1 to < 2 years 189.1 188.5 2 to < 3 years 100.5 102.5 3 to < 4 years 48.9 42.3 4 to < 5 years 10.4 8.4 >= 5 years 13.5 7.4 Total non-current trade and other receivables 362.4 349.1
Past due aging of gross trade receivables not determined to be impaired
Past due 1–31 days 86.3 90.4 Aging of gross trade receivables individually determined to be impaired Not due 2.2 3.0 Past due 1–90 days 5.9 5.1 Past due 91–180 days 8.3 5.7 Past due 181–360 days 16.7 12.4 Past due > 360 days 42.9 22.5 Uncollectible notes 6.1 6.8 Total aging of gross trade receivables individually determined to be impaired 82.1 55.5 * Restated, see note 2.2

Notes to the Consolidated Financial Statements
Hilti Financial Report 2013 | 49
in CHF million 2013 2012
Movements in the adjustment for the impairment of trade receivables Opening balance of adjustment for the impairment of trade receivables at January 1 99.8 105.4
Additional impairment adjustment charged to income statement during year 47.9 33.7 Write-offs of trade receivables charged to impairment adjustment account during year (32.9) (39.3) Closing balance of adjustment for the impairment of trade receivables at December 31 114.8 99.8
Currency denominations of the carrying amounts of trade and other receivables EUR 630.4 609.3
USD 123.9 123.9 Other 551.3 515.1 Total trade and other receivables 1,305.6 1,248.3 * Restated, see note 2.2 The change in trade and other receivables includes a currency translation adjustment which reduces the trade and other receivables by CHF 27.8 million in 2013. This is due to the change in closing rates in 2013 compared to those in 2012. The net change in the adjustment for the impairment of trade receivables is recognized in the income statement in the line ‘other operating expenses’. Receivables totaling CHF 174.6 million (2012: CHF 166.8 million) serve as security for bank borrowings of CHF 93.9 million (2012: CHF 95.1 million) (see notes 24 and 28). Other receivables primarily consist of VAT and tax refunds receivables totaling CHF 50.8 million (2012: CHF 35.2 million), deposits totaling CHF 17.7 million (2012: CHF 17.7 million), advances totaling CHF 11.3 million (2012: CHF 9.6 million) and vendors wi th debit balances totaling CHF 11.1 million (2012: CHF 11.5 million). Details of the finance lease receivables included in trade receivables are as follows: in CHF million 2013 2012
Gross investment in the lease
Unearned finance income
Net investment in the lease
Gross investment in the lease
Unearned finance income
Net investment in the lease
< 1 year 323.5 45.2 278.3 269.9 40.2 229.7 1 to < 5 years 383.6 36.0 347.6 377.1 32.2 344.9 >= 5 years 0.1 – 0.1 0.1 – 0.1 Total at December 31 707.2 81.2 626.0 647.1 72.4 574.7
Unguaranteed residual values
–
– Accumulated allowance for uncollectible finance lease receivables (40.4) (34.8) Contingent rents recognized as income from financial lease – –
(15) Accrued income and prepayments Accrued income and prepayments cover mainly prepayments for property, plant and equipment and prepaid operating expenditure to be allocated as expense in the next accounting period.

Notes to the Consolidated Financial Statements
Hilti Financial Report 2013 | 50
(16) Derivative financial instruments (16.1) Derivative contracts to hedge the foreign currency risks The Group enters into derivative contracts to hedge the foreign currency risks arising from forecast foreign currency sales and purchases transactions and foreign currency investment positions. The applicable derivative contracts are designated as cash flow and fair value hedges, respectively. The accounting treatment is described in the accounting policies, notes 2.24 and 2.25. Details of derivative contracts outstanding at balance sheet date are as follows: in CHF million USD EUR Other Total
2013
Contract face amounts
Foreign currency forward contracts 101.1 42.9 275.8 419.8 Foreign currency options 6.8 – – 6.8 Cross-currency swap 92.9 – – 92.9 Total 200.8 42.9 275.8 519.5
Contract values
Foreign currency forward contracts 3.7 0.1 6.4 10.2 Foreign currency options – – – – Cross-currency swap 20.8 – – 20.8 Total 24.5 0.1 6.4 31.0
Recognition of contract values
Contract values recognized in income statement during current and prior years 24.2 0.1 4.4 28.7 Contract values recognized in the cash flow hedging reserve in equity 0.3 – 2.0 2.3 Total 24.5 0.1 6.4 31.0
Movements of contract values recognized in the cash flow hedging reserve in equity
Opening balance at January 1 0.3 – 1.5 1.8 Gains/(losses) on cash flow hedges taken to equity 0.3 – 2.0 2.3 (Gains)/losses on cash flow hedges reclassified from equity to income statement (0.3) – (1.5) (1.8) Closing balance at December 31 0.3 – 2.0 2.3 There was no ineffectiveness to be recognized in the income statement. All contracts have a maturity of less than 12 months.

Notes to the Consolidated Financial Statements
Hilti Financial Report 2013 | 51
in CHF million USD EUR Other Total
2012
Contract face amounts Foreign currency forward contracts 185.1 (3.8) 248.0 429.3
Foreign currency options – – – – Cross-currency swap 92.9 – – 92.9 Total 278.0 (3.8) 248.0 522.2
Contract values Foreign currency forward contracts 2.0 – 2.8 4.8
Foreign currency options – – – – Cross-currency swap 19.2 – – 19.2 Total 21.2 – 2.8 24.0
Recognition of contract values Contract values recognized in income statement during current and prior years 20.9 – 1.3 22.2
Contract values recognized in the cash flow hedging reserve in equity 0.3 – 1.5 1.8 Total 21.2 – 2.8 24.0
Movements of contract values recognized in the cash flow hedging reserve in equity
Opening balance at January 1 (0.2) – (1.1) (1.3) Gains/(losses) on cash flow hedges taken to equity 0.3 – 1.5 1.8 (Gains)/losses on cash flow hedges reclassified from equity to income statement 0.2 – 1.1 1.3 Closing balance at December 31 0.3 – 1.5 1.8

Notes to the Consolidated Financial Statements
Hilti Financial Report 2013 | 52
(16.2) Derivative contracts to hedge interest rate risks The Group enters into derivative contracts to hedge the interest rate risks arising from loans with variable interest rates. The applicable derivative contracts are designated as cash flow or fair value hedges. Gains and losses recognized in the cash flow hedging reserve in equity on interest rate swap contracts will be continuously released to the income statement until the repayment of the bank borrowings. The accounting treatment is described in the accounting policies, notes 2.24 and 2.25. Details of derivative contracts outstanding at balance sheet date are as follows: in CHF million CHF USD EUR Total
2013
Outstanding interest rate swaps
Contract face amounts 60.0 141.8 14.3 216.1 Recognition of contract values
Contract values recognized in income statement during current and prior years – 0.9 (0.1) 0.8 Contract values recognized in the cash flow hedging reserve in equity (0.5) (0.4) – (0.9) Total (0.5) 0.5 (0.1) (0.1)
Movements of contract values recognized in the cash flow hedging reserve in equity
Opening balance at January 1 – (0.8) – (0.8) Gains/(losses) on cash flow hedges taken to equity (0.7) – – (0.7) (Gains)/losses on cash flow hedges reclassified from equity to income statement 0.2 0.4 – 0.6 Closing balance at December 31 (0.5) (0.4) – (0.9)
in CHF million CHF USD EUR Total
2012
Outstanding interest rate swaps Contract face amounts – 111.2 23.1 134.3
Recognition of contract values
Contract values recognized in income statement during current and prior years – 1.1 (0.4) 0.7 Contract values recognized in the cash flow hedging reserve in equity – (0.8) – (0.8) Total – 0.3 (0.4) (0.1)
Movements of contract values recognized in the cash flow hedging reserve in equity
Opening balance at January 1 – (1.2) – (1.2) Gains/(losses) on cash flow hedges taken to equity – 0.4 – 0.4 (Gains)/losses on cash flow hedges reclassified from equity to income statement – – – – Closing balance at December 31 – (0.8) – (0.8) The fixed interest rates vary from 1.3% to 4.9% (2012: 1.3% to 4.9%) and the main floating rates are EURIBOR and LIBOR.

Notes to the Consolidated Financial Statements
Hilti Financial Report 2013 | 53
(16.3) Reconciliations in CHF million Foreign
currency risks
Interest rate risks
Total
2013
Current assets 32.5 1.3 33.8 Non-current assets – – – Current liabilities (1.5) (0.4) (1.9) Non-current liabilities – (1.0) (1.0) Total net book value derivative financial instruments at December 31 31.0 (0.1) 30.9
Cash flow hedging reserve in equity 2.3 (0.9) 1.4 Gains/(losses) on cash flow hedges taken to equity 2.3 (0.7) 1.6 (Gains)/losses on cash flow hedges reclassified from equity to income statement (1.8) 0.6 (1.2)
in CHF million Foreign currency risks
Interest rate risks
Total
2012
Current assets 7.9 1.1 9.0 Non-current assets 19.2 – 19.2 Current liabilities (3.1) (0.3) (3.4) Non-current liabilities – (0.9) (0.9) Total net book value derivative financial instruments at December 31 24.0 (0.1) 23.9
Cash flow hedging reserve in equity 1.8 (0.8) 1.0 Gains/(losses) on cash flow hedges taken to equity 1.8 0.4 2.2 (Gains)/losses on cash flow hedges reclassified from equity to income statement 1.3 – 1.3 The cash flow hedging reserve in equity net of tax amounts to CHF 1.2 million (2012: CHF 0.9 million). The Group enters into derivative financial instruments with various counterparties, principally financial institutions with i nvestment grade credit ratings of at least A– according to Standard & Poor’s.
(17) Financial assets at fair value through profit or loss All financial assets at fair value through profit or loss are classified as held for trading. Financial assets under this heading comprise: investments in deposits, bonds and equities restricted to (1) the funding of losses arising from damages to assets and losses
arising from product-related obligations, and (2) the funding of a deferred compensation plan for employees; and other investments in equities. These financial assets are all classified as current assets because they are expected to be traded within 12 months of the ba lance sheet date. However, their contractual maturities mostly differ from this position.

Notes to the Consolidated Financial Statements
Hilti Financial Report 2013 | 54
(18) Cash and cash equivalents Cash includes cash on hand and demand deposits. The movement in cash and cash equivalents is shown in detail in the cash flow statement. The Group has legal or economic restrictions on the ability of subsidiaries to transfer funds to the parent in the amount of CHF 30.5 million (2012: CHF 39.3 million). Following are the currency denominations of the carrying amounts of cash and cash equivalents: in CHF million 2013 2012*
CHF 991.5 809.7 EUR 239.3 265.2 USD 73.5 58.6 CNY 35.2 36.4 Other 198.8 136.7 Total cash and cash equivalents 1,538.3 1,306.6 * Restated, see note 2.2 The table below shows the rating and balance of the major counterparties at the balance sheet date: in CHF million Rating Balance
2013
Credit Suisse A 350.0 UBS Investment Bank A 162.3 LGT Bank Liechtenstein A+ 109.5
2012
Credit Suisse A+ 272.3 UBS Investment Bank A 116.5 LGT Bank Liechtenstein A+ 108.0 The bank ratings 2013 are the latest prepared and published by Standard & Poor’s on their website (2012: bank ratings have been made and published by Standard & Poor’s). Management does not expect any losses from non-performance by these counterparties. Cash and cash equivalents include a deposit of CHF 479.5 million (2012: CHF 477.1 million) with an investment company owned by the shareholder (see note 42).
(19) Assets classified as held for sale At balance sheet date 2013 and 2012 no assets are classified as held for sale.
(20) Equity The share capital consists of 176,000 registered shares with a par value of CHF 500 each, and the participation capital consists of 774,400 participation certificates with a par value of CHF 50 each. The participation capital has no voting rights. All the capital is fully paid in and is entitled to dividends. The capital reserve contains the share premium from capital increases and capital accruing from mergers in previous years. A dividend in respect of the year ended December 31, 2013, of CHF 155 per participation certificate and of CHF 1,550 per share, amounting to a total of CHF 392.8 million (financial year 2012: CHF 130.5 million), is to be proposed at the 2013 annual general meeting. This future proposed dividend is not recognized in these financial statements.

Notes to the Consolidated Financial Statements
Hilti Financial Report 2013 | 55
The disaggregation of changes of other comprehensive income by each type of reserve in equity is shown below: in CHF million Foreign
currency translation reserve
Cash flow hedging reserve
Retained earnings
Non-controlling interests
Total
2013 Gains/(losses) on cash flow hedges taken to equity – 1.6 – – 1.6 Deferred tax on gains/losses on cash flow hedges taken to equity – (0.2) – – (0.2) (Gains)/losses on cash flow hedges reclassified from equity to income statement – (1.2) – – (1.2) Deferred tax on gains/losses on cash flow hedges reclassified from equity to income statement – 0.1 – – 0.1 Foreign currency translation differences (21.6) – – (0.2) (21.8) Reclassification adjustments relating to disposals of foreign operations 0.6 – – – 0.6 Items that may be subsequently reclassified to the income statement (21.0) 0.3 – (0.2) (20.9)
Remeasurements on employee benefits – – 47.6 – 47.6 Deferred tax on remeasurements on employee benefits – – (5.5) – (5.5) Items that will never be reclassified to the income statement – – 42.1 – 42.1 Total other comprehensive income 2013 (21.0) 0.3 42.1 (0.2) 21.2
in CHF million Foreign currency translation reserve
Cash flow hedging reserve
Retained earnings
Non-controlling interests
Total
2012* Gains/(losses) on cash flow hedges taken to equity – 2.2 – – 2.2
Deferred tax on gains/losses on cash flow hedges taken to equity – (0.2) – – (0.2) (Gains)/losses on cash flow hedges reclassified from equity to income statement – 1.3 – – 1.3 Deferred tax on gains/losses on cash flow hedges reclassified from equity to income statement – (0.2) – – (0.2) Foreign currency translation differences (6.3) – – (0.4) (6.7) Reclassification adjustments relating to disposals of foreign operations – – – – – Items that may be subsequently reclassified to the income statement (6.3) 3.1 – (0.4) (3.6)
Remeasurements on employee benefits – – (78.3) – (78.3) Deferred tax on remeasurements on employee benefits – – 12.5 – 12.5 Items that will never be reclassified to the income statement – – (65.8) – (65.8) Total other comprehensive income 2012* (6.3) 3.1 (65.8) (0.4) (69.4) * Restated, see note 2.2

Notes to the Consolidated Financial Statements
Hilti Financial Report 2013 | 56
(21) Provisions in CHF million Restructuring Warranty Product
liability Other Total
Opening balance at January 1, 2013 3.7 80.9 4.3 29.1 118.0 Additions 2.7 90.8 12.2 8.6 114.3 Amounts used (3.7) (78.8) (1.2) (9.3) (93.0) Unused reversals – (2.3) (0.9) (1.4) (4.6) Currency translation adjustment – (1.8) – (0.1) (1.9) Closing balance at December 31, 2013 2.7 88.8 14.4 26.9 132.8
in CHF million Restructuring Warranty Product liability
Other Total
Opening balance at January 1, 2012* 1.3 67.7 4.9 21.8 95.7 Additions 3.4 72.9 1.9 14.4 92.6 Amounts used (0.6) (53.0) (1.6) (6.2) (61.4) Unused reversals (0.4) (6.2) (0.9) (0.9) (8.4) Currency translation adjustment – (0.5) – – (0.5) Closing balance at December 31, 2012* 3.7 80.9 4.3 29.1 118.0 * Restated, see note 2.2
in CHF million 2013 2012*
Current portion of total provisions 75.3 68.1 Non-current portion of total provisions 57.5 49.9 Total provisions at December 31 132.8 118.0 * Restated, see note 2.2 Restructuring provisions mainly relate to reorganization projects of certain sales organizations. Warranty provisions cover normal and extended service warranties on sold products. Outlays in respect of such warranties are expected on an ongoing basis. Additions to this provision follow the sales development and the amounts are used with a time lag of around one to two years. Product liability provisions are the estimated obligations arising from additional product-related exposures and legal claims that are not covered by the normal and extended service warranties. Outlays and settlements are expected over a deferred period. Certainty concerning the timing and level of outflows is low. The estimates are based on past incidents, which provide the best basis to estimate current exposure. For exposures covered by the product liability provisions of CHF 14.4 million (2012: CHF 4.3 million), claims for recovery have been made and the Group has recognized corresponding reimbursement assets of CHF 5.5 million (2012: CHF 0.6 million) in ‘accrued income and prepayments’. Other provisions are amongst others built up for obligations regarding legal claims and job accidents.

Notes to the Consolidated Financial Statements
Hilti Financial Report 2013 | 57
(22) Employee benefits Employee benefits creating obligations of the Group to its employees comprise defined benefit plans, other long-term employee benefits and short-term employee benefits. The Group also provides employee benefits through defined contribution plans.
Defined benefit plans Swiss pension plan The Group’s largest defined benefit pension plan is located in Switzerland: It covers employees of the parent company as well as of the Swiss and other Liechtenstein-based Group companies (the ‘Swiss pension plan’). The Swiss pension plan accounts for 78.9% ( 01 : 79.7%) of the Group’s total defined benefit obligation and 85.8% ( 01 : 85.7%) of the Group’s plan assets. The Swiss pension plan is funded through a legally separate trustee-administered pension fund. The pension plan is overseen by a regulator as well as by a state supervisory body. The pension plan’s most senior governing body (Board of Trustees) must be composed of equal numbers of employee and employer representatives. The Board of Trustees is responsible for the investment of the assets. When defining the investment strategy, it takes account of the pension fund’s ob ectives, benefit obligations and risk capacity. The investment strategy is defined in the form of a long-term target asset structure (investment policy). The Board of Trustees delegates the implementation of the investment policy – in accordance with the investment strategy – to an Investment Committee. The cash funding of the plan is designed to ensure that present and future contributions should be sufficient to meet future liabilities. Further on, the Board of Trustees is able to adapt the contributions and benefits. There is a stop-loss insurance which covers the risk from a certain excess amount (e.g. for disability or death). The Swiss pension plan contains a cash balance benefit formula, accounted for as a defined benefit plan. Employer and employee contributions are defined in the pension fund rules in terms of an age-related sliding scale of percentages of remuneration. Under Swiss law, the pension fund guarantees the vested benefit amount as confirmed annually to members. Interest may be added to member balances at the discretion of the Board of Trustees (i.e. 1.5% in 2013 and 1.0% in 2012). At retirement date, members have the right to take their retirement benefit as a lump sum, an annuity or part as a lump sum with the remaining balance converted to a fixed annuity at the rates defined in the fund rules. The Board of Trustees may change the conversion rate at their discretion subject to the plan’s funded status and the requirements of the Swiss Federal Law on Occupational Retirement, Survivors’ and Disability Pension Plans (BVG). Other defined benefit plans The remaining defined benefit plans are located in Austria, Germany, Great Britain, Italy, Taiwan, France, Japan and Korea. Only the last three plans listed are still open for new plan participants.
Other long-term employee benefits Other long-term employee benefits comprise jubilee and other long-service benefits, a long-term incentive and other long-term employee benefits. The relevant period for the long-term incentive is 2013–2015 (2012: 2010–2012) with payment to be made in 2016 (2012: 2013). Historically the level of outflows concerning other long-term employee benefits (excluding long-term incentive) has been constant each year.
Short-term employee benefits Short-term employee benefits such as short-term variable compensation are included in ‘accrued liabilities and deferred income’ (see note 27).
Defined contribution plans The employer’s contribution totals CHF 23.0 million (2012: CHF 20.4 million).

Notes to the Consolidated Financial Statements
Hilti Financial Report 2013 | 58
(22.1) Employee benefit obligations (defined benefit plans and other long-term benefits) in CHF million 2013 2012* Funded Unfunded Total Funded Unfunded Total
Switzerland
Fair value of plan assets 726.2 – 726.2 702.5 – 702.5 Present value of defined benefit obligation (863.9) – (863.9) (882.4) – (882.4) Net defined benefit (liability)/asset at December 31 (137.7) – (137.7) (179.9) – (179.9)
Other plans
Fair value of plan assets 120.0 – 120.0 117.0 – 117.0 Present value of defined benefit obligation (186.6) (44.3) (230.9) (186.1) (38.6) (224.7) Net defined benefit (liability)/asset at December 31 (66.6) (44.3) (110.9) (69.1) (38.6) (107.7)
Total
Fair value of plan assets 846.2 – 846.2 819.5 – 819.5 Present value of defined benefit obligation (1,050.5) (44.3) (1,094.8) (1,068.5) (38.6) (1,107.1) Net defined benefit (liability)/asset at December 31 (204.3) (44.3) (248.6) (249.0) (38.6) (287.6)
Present value of other employee benefits – (68.5) (68.5) – (90.3) (90.3) Total net book value employee benefits at December 31 (204.3) (112.8) (317.1) (249.0) (128.9) (377.9) * Restated, see note 2.2
in CHF million 2013 2012*
Current portion of total net book value employee benefits (8.7) (48.9) Non-current portion of total net book value employee benefits (308.4) (329.0) Total net book value employee benefits (317.1) (377.9) * Restated, see note 2.2
(22.2) Reconciliation of fair value of plan assets in CHF million 2013 2012* Switzerland Other plans Total Switzerland Other plans Total
Opening balance at January 1 702.5 117.0 819.5 638.7 111.9 750.6 Interest income on plan assets 14.0 4.5 18.5 17.6 5.0 22.6 Return on plan assets excluding interest income 13.4 1.6 15.0 42.4 4.5 46.9 Contributions by employer 24.9 7.1 32.0 35.9 6.6 42.5 Contributions by plan participants 15.7 0.8 16.5 16.6 0.9 17.5 Benefits paid (44.3) (10.7) (55.0) (48.7) (9.3) (58.0) Settlements – (0.1) (0.1) – (4.4) (4.4) Currency translation adjustment – (0.2) (0.2) – 1.8 1.8 Closing balance at December 31 726.2 120.0 846.2 702.5 117.0 819.5 * Restated, see note 2.2

Notes to the Consolidated Financial Statements
Hilti Financial Report 2013 | 59
(22.3) Reconciliation of present value of defined benefit obligation in CHF million 2013 2012* Switzerland Other plans Total Switzerland Other plans Total
Opening balance at January 1 (882.4) (224.7) (1,107.1) (785.4) (203.5) (988.9) Current service cost (24.6) (8.8) (33.4) (22.1) (7.0) (29.1) Interest expense on defined benefit obligation (17.6) (7.9) (25.5) (21.5) (8.6) (30.1) Actuarial gains/(losses) 34.8 (2.2) 32.6 (102.3) (22.9) (125.2) Contributions by plan participants (15.7) (0.7) (16.4) (16.6) (0.8) (17.4) Benefits paid 44.3 13.0 57.3 48.7 13.4 62.1 Past service cost (2.7) (0.4) (3.1) 16.8 0.1 16.9 Settlements – – – – 5.5 5.5 Currency translation adjustment – 0.8 0.8 – (0.9) (0.9) Closing balance at December 31 (863.9) (230.9) (1,094.8) (882.4) (224.7) (1,107.1) * Restated, see note 2.2
(22.4) Components of defined benefit costs recognized in the income statement in CHF million 2013 2012* Switzerland Other plans Total Switzerland Other plans Total
Current service cost (24.6) (8.8) (33.4) (22.1) (7.0) (29.1) Past service cost (2.7) (0.4) (3.1) 16.8 0.1 16.9 Gains/(losses) on settlements – (0.1) (0.1) – 1.1 1.1 Total service cost (27.3) (9.3) (36.6) (5.3) (5.8) (11.1) Interest income on plan assets 14.0 4.5 18.5 17.6 5.0 22.6 Interest expense on defined benefit obligation (17.6) (7.9) (25.5) (21.5) (8.6) (30.1) Net interest income/(expense) on defined benefit plans (3.6) (3.4) (7.0) (3.9) (3.6) (7.5) Total defined benefit costs recognized in the income statement (30.9) (12.7) (43.6) (9.2) (9.4) (18.6) * Restated, see note 2.2 In the income statement, the various components of the defined benefit costs are included as follows: Total service cost – in ‘personnel expenses’ (see note 1); and Interest income and expense – in ‘other revenues and expenses (net)’ (see note 4).
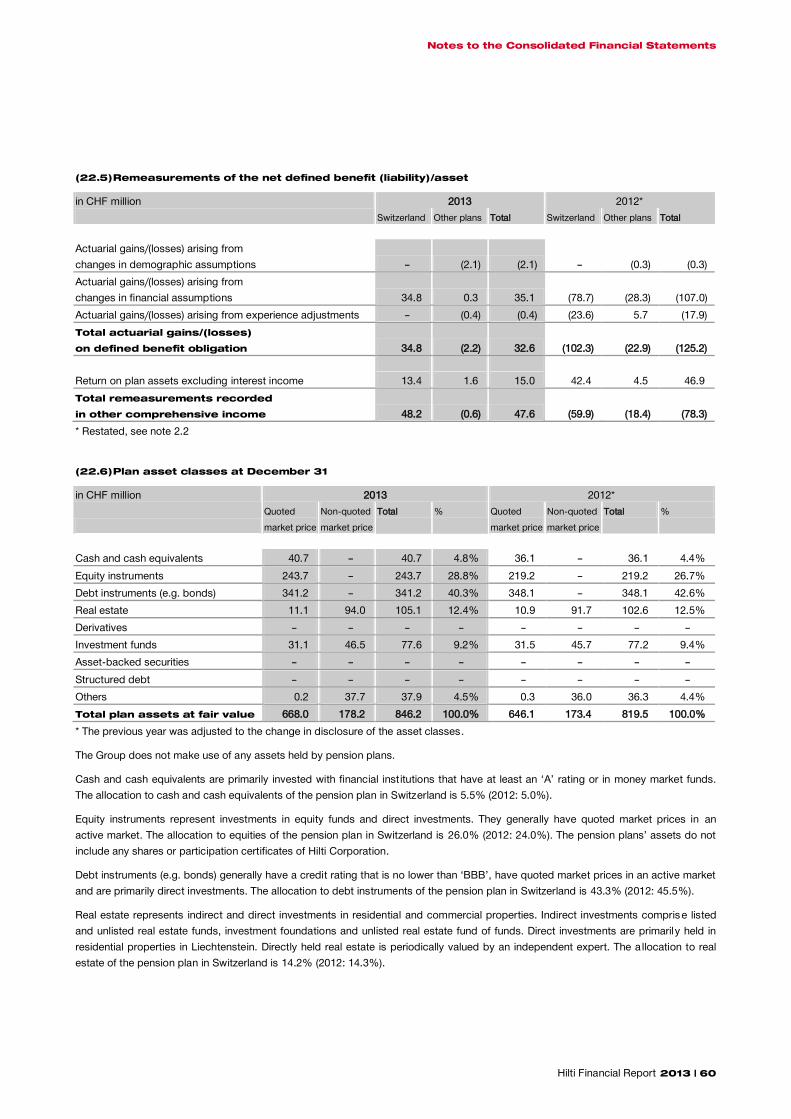
Notes to the Consolidated Financial Statements
Hilti Financial Report 2013 | 60
(22.5) Remeasurements of the net defined benefit (liability)/asset in CHF million 2013 2012* Switzerland Other plans Total Switzerland Other plans Total
Actuarial gains/(losses) arising from changes in demographic assumptions – (2.1) (2.1) – (0.3) (0.3) Actuarial gains/(losses) arising from changes in financial assumptions 34.8 0.3 35.1 (78.7) (28.3) (107.0) Actuarial gains/(losses) arising from experience adjustments – (0.4) (0.4) (23.6) 5.7 (17.9) Total actuarial gains/(losses) on defined benefit obligation 34.8 (2.2) 32.6 (102.3) (22.9) (125.2)
Return on plan assets excluding interest income 13.4 1.6 15.0 42.4 4.5 46.9 Total remeasurements recorded in other comprehensive income 48.2 (0.6) 47.6 (59.9) (18.4) (78.3) * Restated, see note 2.2
(22.6) Plan asset classes at December 31 in CHF million 2013 2012*
Quoted market price
Non-quoted market price
Total % Quoted market price
Non-quoted market price
Total %
Cash and cash equivalents 40.7 – 40.7 4.8% 36.1 – 36.1 4.4% Equity instruments 243.7 – 243.7 28.8% 219.2 – 219.2 26.7% Debt instruments (e.g. bonds) 341.2 – 341.2 40.3% 348.1 – 348.1 42.6% Real estate 11.1 94.0 105.1 12.4% 10.9 91.7 102.6 12.5% Derivatives – – – – – – – – Investment funds 31.1 46.5 77.6 9.2% 31.5 45.7 77.2 9.4% Asset-backed securities – – – – – – – – Structured debt – – – – – – – – Others 0.2 37.7 37.9 4.5% 0.3 36.0 36.3 4.4% Total plan assets at fair value 668.0 178.2 846.2 100.0% 646.1 173.4 819.5 100.0% * The previous year was adjusted to the change in disclosure of the asset classes. The Group does not make use of any assets held by pension plans. Cash and cash equivalents are primarily invested with financial inst itutions that have at least an ‘A’ rating or in money market funds. The allocation to cash and cash equivalents of the pension plan in Switzerland is 5.5% (2012: 5.0%). Equity instruments represent investments in equity funds and direct investments. They generally have quoted market prices in an active market. The allocation to equities of the pension plan in Switzerland is 26.0% (2012: 24.0%). The pension plans’ assets do not include any shares or participation certificates of Hilti Corporation. Debt instruments (e.g. bonds) generally have a credit rating that is no lower than ‘BBB’, have quoted market prices in an active market and are primarily direct investments. The allocation to debt instruments of the pension plan in Switzerland is 43.3% (2012: 45.5%). Real estate represents indirect and direct investments in residential and commercial properties. Indirect investments comprise listed and unlisted real estate funds, investment foundations and unlisted real estate fund of funds. Direct investments are primarily held in residential properties in Liechtenstein. Directly held real estate is periodically valued by an independent expert. The a llocation to real estate of the pension plan in Switzerland is 14.2% (2012: 14.3%).

Notes to the Consolidated Financial Statements
Hilti Financial Report 2013 | 61
Investment funds represent investments with an insurance company and a mandate with a bank which invests in alternative asset classes (e.g. hedge funds and commodities). In case of investment funds, no quoted market prices in an active market are usually available. The allocation to investment funds of the pension plan in Switzerland is 5.9% (2012: 6.1%). The position ‘others’ primarily includes private equity investments, mezzanine investments and insurance-linked securities, among others. Leveraging and short selling is prohibited. No quoted market prices in an active market are usually available. The al location to ‘others’ of the pension plan in Switzerland is 5.2% (2012: 5.1%).
(22.7) Plan members at December 31 financial amounts in CHF million 2013 2012 Active Deferred Retired Total Active Deferred Retired Total
Plan members 5,871 880 1,496 8,247 5,919 880 1,491 8,290 Defined benefit obligation (571.5) (52.8) (470.5) (1,094.8) (574.1) (55.1) (477.9) (1,107.1) Share in % 52.2% 4.8% 43.0% 100.0% 51.8% 5.0% 43.2% 100.0% Average weighted duration in years 19.9 23.6 12.4 16.8 20.0 23.8 12.4 16.8 The employer’s best estimate of contributions expected to be paid to defined benefit plans for the financial year 2014 is CHF 30.0 million.
(22.8) Actuarial assumptions Actuarial assumptions are based on long-term economic factors in the respective countries. Each item of ‘other plans’ is a weighted average in relation to the relevant underlying component. The significant assumptions are as follows: 2013 2012 Switzerland Other plans Total Switzerland Other plans Total
Discount rate 2.3% 3.8% 2.6% 2.0% 3.6% 2.3% Future salary increase 1.5% 2.9% 1.8% 1.5% 2.8% 1.8% Future pension increase – 1.8% 0.4% – 1.6% 0.3% Life expectancy is reflected in the defined benefit obligations by using mortality tables of the country in which the plan is located. The generational tables BVG/LPP 2010 have been used for Switzerland. In general, the present value of the defined benefit obligations is determined annually by independent actuaries using the projected unit credit method. Actuarial assumptions are required for this purpose. The discount rate, future salary increase and life expectancy were identified as significant actuarial assumptions. The following impacts on the defined benefit obligation are to be expected: A 0.25% increase/decrease in the discount rate would lead to a decrease/increase of 4.0% in the defined benefit obligation. A 0.25% increase/decrease in expected future salaries would lead to an increase/decrease of 0.7% in the defined benefit
obligation. A one year increase/decrease in life expectancy would lead to an increase/decrease of 0.8% in the defined benefit obligation. The sensitivity analysis is based on realistically possible changes as of the end of the reporting period. Each change in a significant actuarial assumption was analyzed separately as part of the test. Interdependencies were not taken into account.
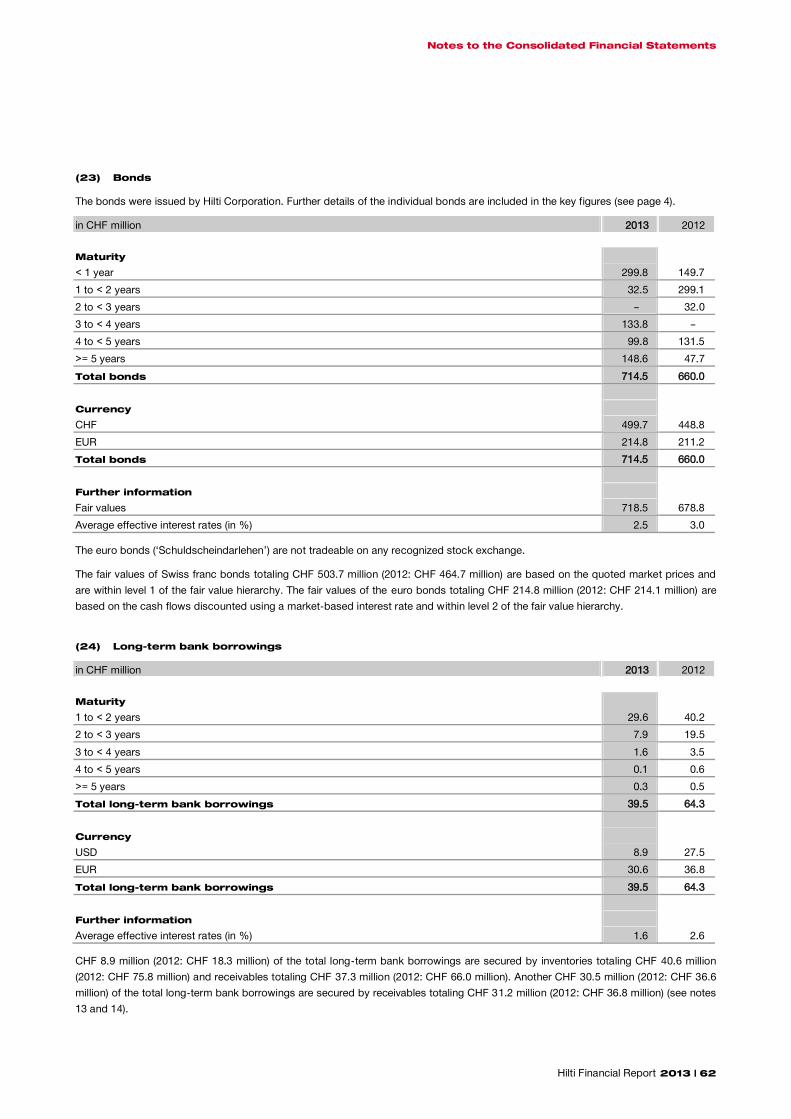
Notes to the Consolidated Financial Statements
Hilti Financial Report 2013 | 62
(23) Bonds The bonds were issued by Hilti Corporation. Further details of the individual bonds are included in the key figures (see page 4). in CHF million 2013 2012
Maturity
< 1 year 299.8 149.7 1 to < 2 years 32.5 299.1 2 to < 3 years – 32.0 3 to < 4 years 133.8 – 4 to < 5 years 99.8 131.5 >= 5 years 148.6 47.7 Total bonds 714.5 660.0
Currency
CHF 499.7 448.8 EUR 214.8 211.2 Total bonds 714.5 660.0
Further information
Fair values 718.5 678.8 Average effective interest rates (in %) 2.5 3.0 The euro bonds (‘Schuldscheindarlehen’) are not tradeable on any recognized stock exchange. The fair values of Swiss franc bonds totaling CHF 503.7 million (2012: CHF 464.7 million) are based on the quoted market prices and are within level 1 of the fair value hierarchy. The fair values of the euro bonds totaling CHF 214.8 million (2012: CHF 214.1 million) are based on the cash flows discounted using a market-based interest rate and within level 2 of the fair value hierarchy.
(24) Long-term bank borrowings in CHF million 2013 2012
Maturity
1 to < 2 years 29.6 40.2 2 to < 3 years 7.9 19.5 3 to < 4 years 1.6 3.5 4 to < 5 years 0.1 0.6 >= 5 years 0.3 0.5 Total long-term bank borrowings 39.5 64.3
Currency
USD 8.9 27.5 EUR 30.6 36.8 Total long-term bank borrowings 39.5 64.3
Further information
Average effective interest rates (in %) 1.6 2.6 CHF 8.9 million (2012: CHF 18.3 million) of the total long-term bank borrowings are secured by inventories totaling CHF 40.6 million (2012: CHF 75.8 million) and receivables totaling CHF 37.3 million (2012: CHF 66.0 million). Another CHF 30.5 million (2012: CHF 36.6 million) of the total long-term bank borrowings are secured by receivables totaling CHF 31.2 million (2012: CHF 36.8 million) (see notes 13 and 14).

Notes to the Consolidated Financial Statements
Hilti Financial Report 2013 | 63
(25) Trade and other payables in CHF million 2013 2012*
Trade payables 212.6 189.5 Other payables 155.0 151.2 Total trade and other payables 367.6 340.7
Current portion 342.7 318.7 Non-current portion 24.9 22.0 Total trade and other payables 367.6 340.7 Further information
Average effective interest rates (in %) 0.1 0.1 Maturity of non-current portion 1 to < 2 years 7.5 1.5 2 to < 3 years 1.4 1.7 3 to < 4 years 1.2 1.4 4 to < 5 years 2.0 4.2 >= 5 years 12.8 13.2 Total non-current trade and other payables 24.9 22.0
Currency denominations of the carrying amounts of trade and other payables
EUR 157.9 150.0 CHF 74.3 72.4 USD 21.1 30.1 Other 114.3 88.2 Total trade and other payables 367.6 340.7 * Restated, see note 2.2 The change in trade and other payables includes a currency translation adjustment which reduces trade and other payables by CHF 5.2 million in 2013. This is due to the change in closing rates in 2013 compared to those in 2012. Other payables primarily consist of liabilities for personnel expenses totaling CHF 6.6 million (2012: CHF 7.8 million), liabilities for social contributions totaling CHF 27.6 million (2012: CHF 26.1 million), liabilities for source-deducted taxes and VAT totaling CHF 69.3 million (2012: CHF 58.8 million) and customers with credit balances totaling CHF 22.7 million (2012: CHF 34.3 million). CHF 2.4 million (2012: CHF 2.1 million) of other payables are secured by mortgages over land and buildings totaling CHF 0.2 million (2012: CHF 0.2 million) (see note 8). Details of the finance lease liabilities included in other payables are as follows: in CHF million 2013 2012
Minimum lease payments
Interest Principal Minimum lease payments
Interest Principal
< 1 year 0.1 – 0.1 0.2 – 0.2 1 to < 5 years 1.2 0.2 1.0 1.2 0.1 1.1 >= 5 years – – – – – – Total at December 31 1.3 0.2 1.1 1.4 0.1 1.3

Notes to the Consolidated Financial Statements
Hilti Financial Report 2013 | 64
Details of the assets held under finance leases are included in note 8. Under the terms of the finance lease agreements, no contingent rents are payable. No sublease payments on finance leases are expected to be received. The commitments arising from operating lease contracts are detailed in note 39.
(26) Current income taxes payable and receivable Current income taxes payable and receivable consist of income taxes payable and refundable relating to the current or prior years. Details concerning deferred income tax liabilities and assets are shown in note 11.
(27) Accrued liabilities and deferred income Accrued liabilities and deferred income comprise short-term liabilities, which include estimates, short-term expense accruals and deferrals of income already received but attributable to subsequent accounting periods.
(28) Short-term bank borrowings in CHF million 2013 2012
Currency
EUR 54.9 64.8 USD 18.0 29.1 MXN 11.5 9.7 JPY 8.5 10.6 BRL 7.5 – Other 24.9 27.5 Total short-term bank borrowings 125.3 141.7
Further information
Average effective interest rates (in %) 3.5 3.2 CHF 16.2 million (2012: CHF 9.2 million) of the total short-term bank borrowings are secured by inventories totaling CHF 74.0 million (2012: CHF 37.9 million) and receivables totaling CHF 67.8 million (2012: CHF 33.0 million). CHF 38.3 million (2012: CHF 31.0 million) of the total short-term bank borrowings are secured by receivables totaling CHF 38.3 million (2012: CHF 31.0 million) (see notes 13 and 14).
(29) Operating revenues Categories of operating revenues are as follows: in CHF million 2013 2012*
Net sales of goods 4,190.1 4,067.4 Net sales of services 150.1 137.2 Total net sales 4,340.2 4,204.6 Other operating revenues 92.3 83.3 Total operating revenues 4,432.5 4,287.9 * Restated, see note 2.2 The above categories ‘net sales of goods’ and ‘net sales of services’ in terms of IAS 18 Revenue represent, respectively, revenue from sales of goods and revenue from rendering of services. Other operating revenues, amongst others, consist of finance lease interests including related risk premiums. A breakdown of net sales by geographical areas and by major countries is given in note 37.
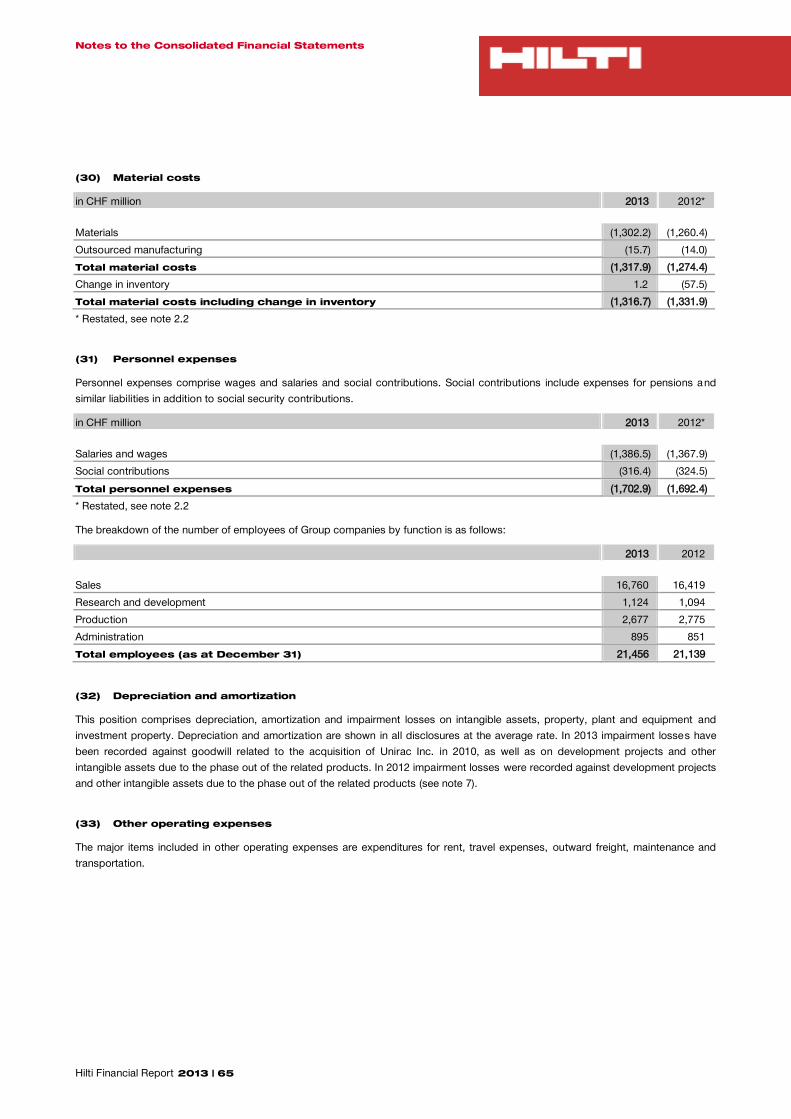
Notes to the Consolidated Financial Statements
Hilti Financial Report 2013 | 65
(30) Material costs in CHF million 2013 2012*
Materials (1,302.2) (1,260.4) Outsourced manufacturing (15.7) (14.0) Total material costs (1,317.9) (1,274.4) Change in inventory 1.2 (57.5) Total material costs including change in inventory (1,316.7) (1,331.9) * Restated, see note 2.2
(31) Personnel expenses Personnel expenses comprise wages and salaries and social contributions. Social contributions include expenses for pensions and similar liabilities in addition to social security contributions. in CHF million 2013 2012*
Salaries and wages (1,386.5) (1,367.9) Social contributions (316.4) (324.5) Total personnel expenses (1,702.9) (1,692.4) * Restated, see note 2.2 The breakdown of the number of employees of Group companies by function is as follows: 2013 2012
Sales 16,760 16,419 Research and development 1,124 1,094 Production 2,677 2,775 Administration 895 851 Total employees (as at December 31) 21,456 21,139
(32) Depreciation and amortization This position comprises depreciation, amortization and impairment losses on intangible assets, property, plant and equipment and investment property. Depreciation and amortization are shown in all disclosures at the average rate. In 2013 impairment losses have been recorded against goodwill related to the acquisition of Unirac Inc. in 2010, as well as on development projects and other intangible assets due to the phase out of the related products. In 2012 impairment losses were recorded against development projects and other intangible assets due to the phase out of the related products (see note 7).
(33) Other operating expenses The major items included in other operating expenses are expenditures for rent, travel expenses, outward freight, maintenance and transportation.
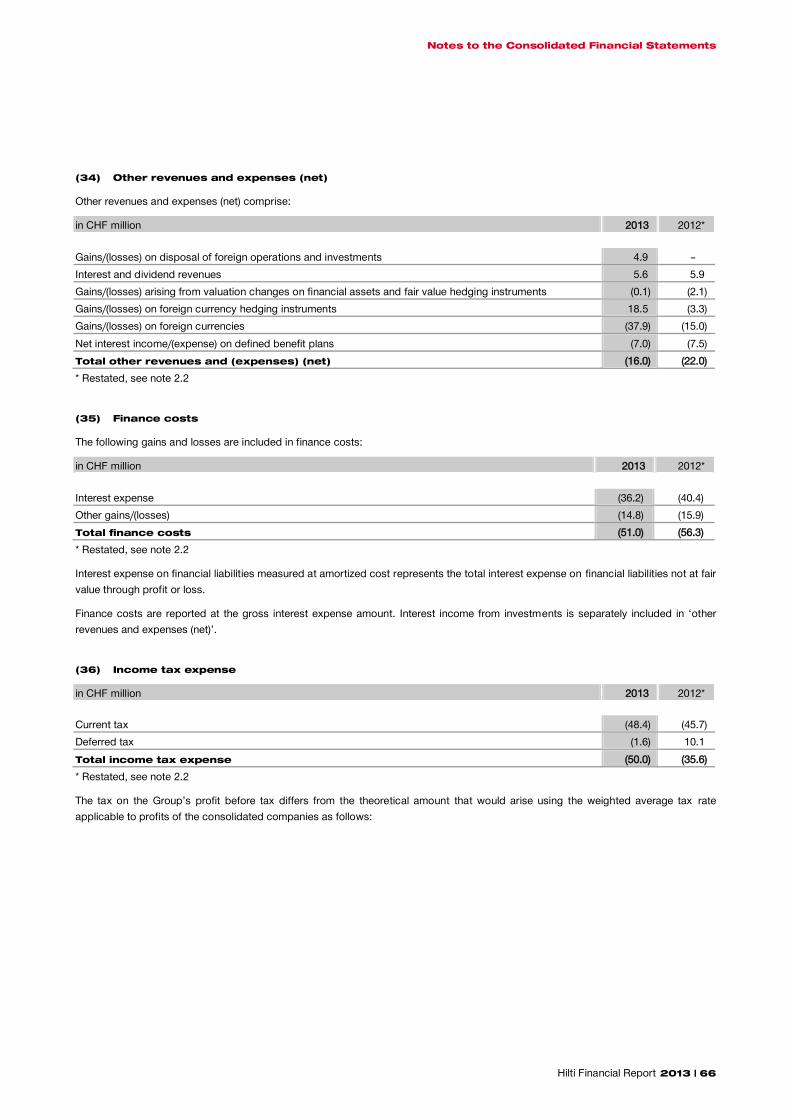
Notes to the Consolidated Financial Statements
Hilti Financial Report 2013 | 66
(34) Other revenues and expenses (net) Other revenues and expenses (net) comprise: in CHF million 2013 2012*
Gains/(losses) on disposal of foreign operations and investments 4.9 – Interest and dividend revenues 5.6 5.9 Gains/(losses) arising from valuation changes on financial assets and fair value hedging instruments (0.1) (2.1) Gains/(losses) on foreign currency hedging instruments 18.5 (3.3) Gains/(losses) on foreign currencies (37.9) (15.0) Net interest income/(expense) on defined benefit plans (7.0) (7.5) Total other revenues and (expenses) (net) (16.0) (22.0) * Restated, see note 2.2
(35) Finance costs The following gains and losses are included in finance costs: in CHF million 2013 2012*
Interest expense (36.2) (40.4) Other gains/(losses) (14.8) (15.9) Total finance costs (51.0) (56.3) * Restated, see note 2.2 Interest expense on financial liabilities measured at amortized cost represents the total interest expense on financial liabilities not at fair value through profit or loss. Finance costs are reported at the gross interest expense amount. Interest income from investments is separately included in ‘other revenues and expenses (net)’.
(36) Income tax expense in CHF million 2013 2012*
Current tax (48.4) (45.7) Deferred tax (1.6) 10.1 Total income tax expense (50.0) (35.6) * Restated, see note 2.2 The tax on the Group’s profit before tax differs from the theoretical amount that would arise using the weighted average tax rate applicable to profits of the consolidated companies as follows:

Notes to the Consolidated Financial Statements
Hilti Financial Report 2013 | 67
in CHF million 2013 2012*
Net income before income tax 354.1 222.9
Tax calculated at domestic tax rates applicable to profits in the respective countries (31.8) (37.9) Income not subject to tax 4.6 5.8 Expenses not deductible for tax purposes (27.6) (17.9) Utilization of previously unrecognized tax losses 5.4 5.0 Tax losses for which no deferred tax asset has been recognized (3.0) (2.7) Tax attributable to prior years 5.6 10.1 Other effects (3.2) 2.0 Income tax expense (50.0) (35.6)
Weighted average applicable tax rate (in %) 9.0 17.0 * Restated, see note 2.2 The 01 increase in ‘expenses not deductible for tax purposes’ is caused by a non-tax deductible goodwill impairment of CHF 46.8 million (see note 7). The amount in ‘other effects’ is mainly due to changes in tax rates, as well as expense/income subject to different tax rates.
(37) Segment information In accordance with IFRS 8 Operating Segments, paragraph 5, the Group operates in only one single operating segment. Additiona l information concerning products, services and geographical areas is as follows:
(37.1) Net sales information about products and services in CHF million 2013 2012*
Electric Tools & Accessories Products 1,966.8 1,955.1 Electric Tools & Accessories Services 121.5 109.4 Total Electric Tools & Accessories 2,088.3 2,064.5 Fastening & Protection Systems Products 2,223.3 2,112.3 Fastening & Protection Systems Services 28.6 27.8 Total Fastening & Protection Systems 2,251.9 2,140.1 Total Group 4,340.2 4,204.6 * Restated, see note 2.2
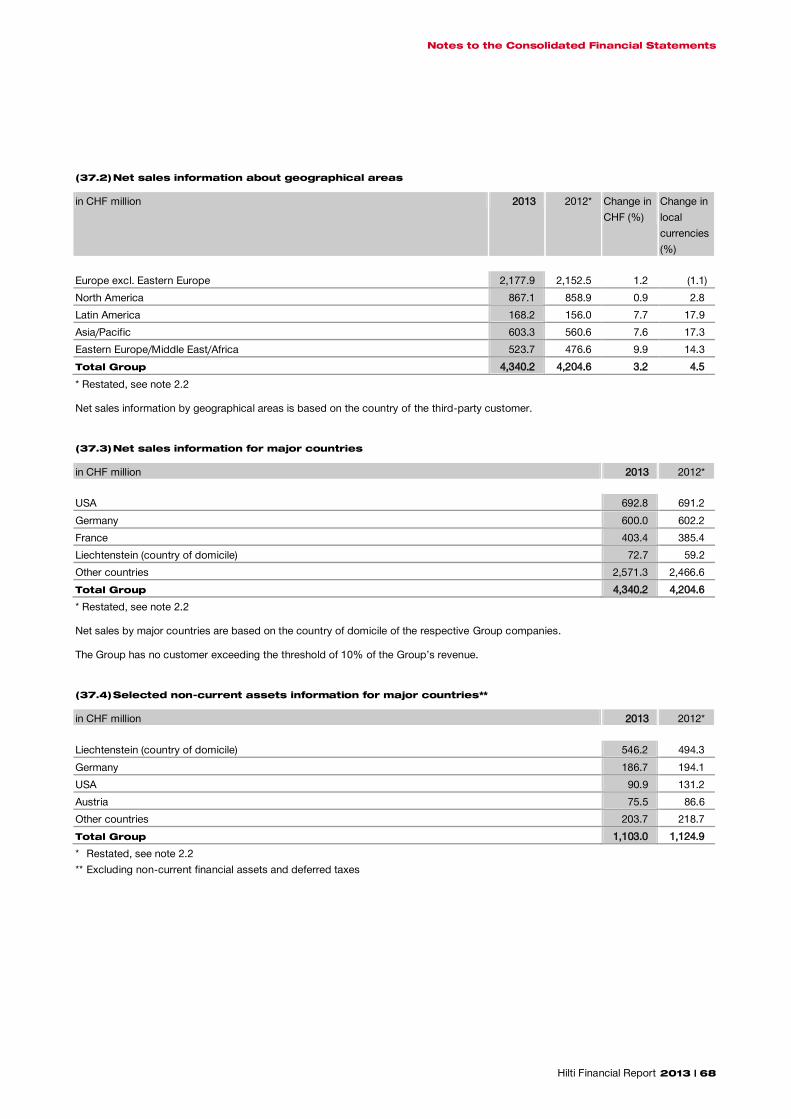
Notes to the Consolidated Financial Statements
Hilti Financial Report 2013 | 68
(37.2) Net sales information about geographical areas in CHF million 2013 2012* Change in
CHF (%) Change in local currencies (%)
Europe excl. Eastern Europe 2,177.9 2,152.5 1.2 (1.1) North America 867.1 858.9 0.9 2.8 Latin America 168.2 156.0 7.7 17.9 Asia/Pacific 603.3 560.6 7.6 17.3 Eastern Europe/Middle East/Africa 523.7 476.6 9.9 14.3 Total Group 4,340.2 4,204.6 3.2 4.5 * Restated, see note 2.2 Net sales information by geographical areas is based on the country of the third-party customer.
(37.3) Net sales information for major countries in CHF million 2013 2012*
USA 692.8 691.2 Germany 600.0 602.2 France 403.4 385.4 Liechtenstein (country of domicile) 72.7 59.2 Other countries 2,571.3 2,466.6 Total Group 4,340.2 4,204.6 * Restated, see note 2.2 Net sales by major countries are based on the country of domicile of the respective Group companies. The Group has no customer exceeding the threshold of 10% of the Group’s revenue.
(37.4) Selected non-current assets information for major countries** in CHF million 2013 2012*
Liechtenstein (country of domicile) 546.2 494.3 Germany 186.7 194.1 USA 90.9 131.2 Austria 75.5 86.6 Other countries 203.7 218.7 Total Group 1,103.0 1,124.9 * Restated, see note 2.2 ** Excluding non-current financial assets and deferred taxes

Notes to the Consolidated Financial Statements
Hilti Financial Report 2013 | 69
(38) Contingent liabilities in CHF million 2013 2012
Guarantees 7.5 7.6 Other contingent liabilities 1.9 2.4 Total contingent liabilities 9.4 10.0 Management considers the possibility of any outflow in settlement to be remote.
(39) Other commitments Payment commitments arising from non-cancelable operating lease contracts are as follows: in CHF million 2013 2012
< 1 year 90.6 86.1 1 to < 5 years 136.5 135.1 >= 5 years 36.5 16.9 Total at December 31 263.6 238.1
Future minimum sublease payments expected to be received – – Sublease payments received in current period – – Contingent rent expense for operating leases 0.1 0.1 Capital commitments contracted for at the end of the reporting period but not yet incurred are as follows: in CHF million 2013 2012
Intangible assets 0.4 1.0 Property, plant and equipment 41.4 10.5 Total at December 31 41.8 11.5
(40) Financial assets pledged as collateral Details of receivables pledged as collateral for recognized liabilities are given in note 14. There are no other financial assets pledged as collateral for recognized liabilities or for contingent liabilities.
(41) Research and development expenditure Expenditure on research and development in the reporting period amounted to CHF 188.5 million (2012: CHF 174.5 million), thereof CHF 74.0 million (2012: CHF 56.8 million) were recognized as intangible assets (see development costs in note 7).
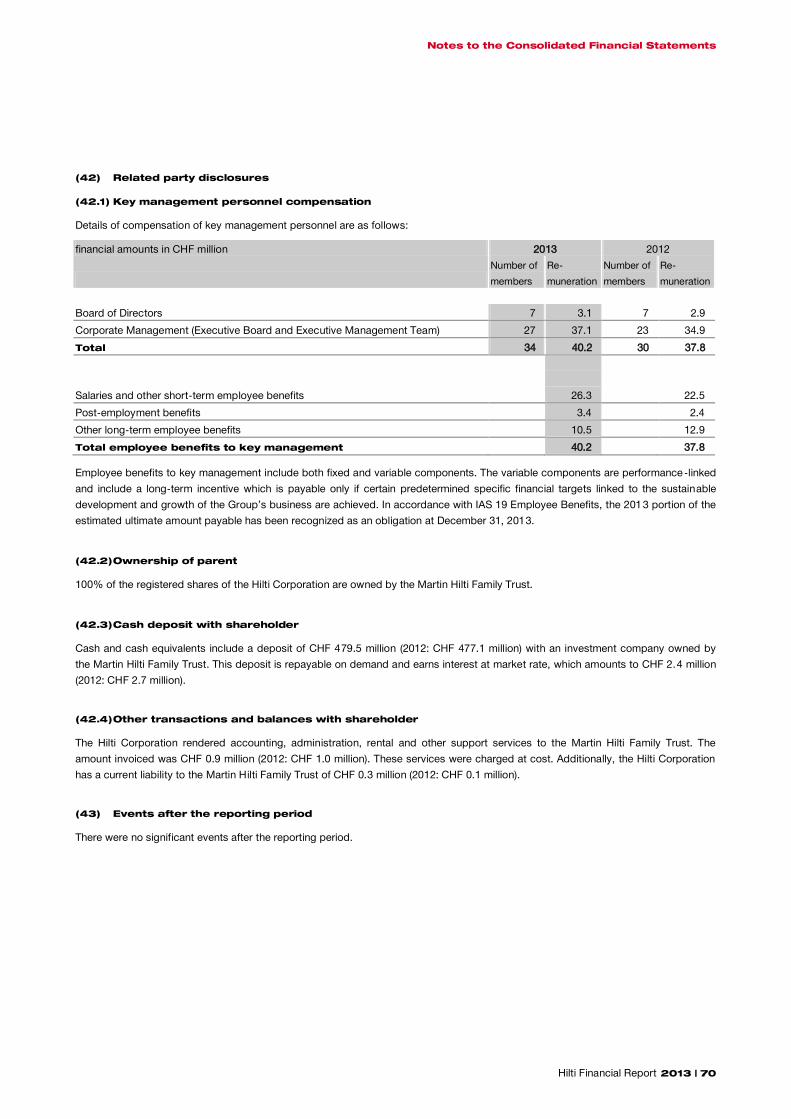
Notes to the Consolidated Financial Statements
Hilti Financial Report 2013 | 70
(42) Related party disclosures (42.1) Key management personnel compensation Details of compensation of key management personnel are as follows: financial amounts in CHF million 2013 2012
Number of members
Re- muneration
Number of members
Re- muneration
Board of Directors 7 3.1 7 2.9 Corporate Management (Executive Board and Executive Management Team) 27 37.1 23 34.9 Total 34 40.2 30 37.8
Salaries and other short-term employee benefits 26.3 22.5 Post-employment benefits 3.4 2.4 Other long-term employee benefits 10.5 12.9 Total employee benefits to key management 40.2 37.8 Employee benefits to key management include both fixed and variable components. The variable components are performance-linked and include a long-term incentive which is payable only if certain predetermined specific financial targets linked to the sustainable development and growth of the Group’s business are achieved. In accordance with IAS 19 Employee Benefits, the 01 3 portion of the estimated ultimate amount payable has been recognized as an obligation at December 31, 2013.
(42.2) Ownership of parent 100% of the registered shares of the Hilti Corporation are owned by the Martin Hilti Family Trust.
(42.3) Cash deposit with shareholder Cash and cash equivalents include a deposit of CHF 479.5 million (2012: CHF 477.1 million) with an investment company owned by the Martin Hilti Family Trust. This deposit is repayable on demand and earns interest at market rate, which amounts to CHF 2.4 million (2012: CHF 2.7 million). (42.4) Other transactions and balances with shareholder The Hilti Corporation rendered accounting, administration, rental and other support services to the Martin Hilti Family Trust. The amount invoiced was CHF 0.9 million (2012: CHF 1.0 million). These services were charged at cost. Additionally, the Hilti Corporation has a current liability to the Martin Hilti Family Trust of CHF 0.3 million (2012: CHF 0.1 million). (43) Events after the reporting period There were no significant events after the reporting period.

Notes to the Consolidated Financial Statements
Hilti Financial Report 2013 | 71
(44) Group companies and joint arrangements Country Company name and location Activity
S = sales R = research D = development P = production Se = services H = holding
Parent company Liechtenstein Hilti Corporation, Feldkircherstrasse 100, P.O. Box 333, 9494 Schaan,
Tel. +423 234 2111, www.hilti.com S, R, D, P, Se, H
100% owned consolidated Group companies (subsidiaries – including production plants and market organizations) Albania Hilti Albania sh.p.k., Tirana S
Algeria Hilti Construction Equipements EURL, Alger S Argentina Hilti Argentina S.R.L., Buenos Aires S Australia Hilti (Aust.) Pty. Ltd., Rhodes New South Wales S Austria Hilti Austria Gesellschaft m.b.H., Wien S Hilti Holding GmbH, Wien H Hilti Aktiengesellschaft Zweigniederlassung Thüringen, Thüringen P Eurofox GmbH, Lanzenkirchen S, P, D Belarus Hilti BY FLLC, Minsk S Belgium Hilti Belgium N.V., Asse-Zellik S Hilti Belgium Finance CVBA, Asse Se Bosnia-Herzegovina Hilti Systems BH d.o.o. Sarajevo, Sarajevo S Brazil Hilti do Brasil Comercial Ltda., São Paulo S Bulgaria Hilti (Bulgaria) EOOD, Sofia S Canada Hilti (Canada) Corporation, Mississauga, Ontario S Unirac (Canada) Corporation, Toronto S Chile Hilti Chile Limitada, Santiago de Chile S China Hilti (China) Ltd., Zhanjiang P, D Hilti (China) Distribution Ltd., Shanghai S Hilti (Shanghai) Ltd., Shanghai P, D Colombia Hilti Colombia S A S, Bogota D.C. S Croatia Hilti Croatia d.o.o., Sesvete S Czech Republic Hilti ČR spol. s r.o., Průhonice S Denmark Hilti Danmark A/S, Rødovre-Copenhagen S Estonia Hilti Eesti OÜ, Tallinn S Finland Hilti (Suomi) OY, Vantaa S France Hilti France S.A., Versailles S Germany Hilti Deutschland AG (Liechtenstein), Zweigniederlassung Deutschland S Hilti GmbH Industriegesellschaft für Befestigungstechnik, Kaufering P Hilti Entwicklungsgesellschaft mbH, Kaufering D Hilti Kunststofftechnik GmbH, Nersingen P Hilti Deutschland Dienstleistung GmbH, Kaufering Se Hilti Deutschland Logistik GmbH, Oberhausen Se

Notes to the Consolidated Financial Statements
Hilti Financial Report 2013 | 72
Great Britain Hilti (Great Britain) Ltd., Manchester S Hilti Invest Ltd., Jersey, St. Helier Se Greece Hilti Hellas S.A., Eastern Attiki S Hong Kong Hilti Asia Ltd., Kowloon, Hong Kong H, Se Hilti (Hong Kong) Ltd., Kowloon, Hong Kong S Hungary Hilti (Hungária) Szolgáltató Kft., Budapest S Hilti Szerszám Kft., Kecskemét P, D India Hilti India Private Ltd., New Delhi S Hilti Manufacturing India Private Limited, Mumbai P, D Indonesia P.T. Hilti Nusantara, Jakarta S Ireland Hilti (Fastening Systems) Ltd., Dublin S Israel Hilti (Israel) Ltd., Petach Tiqva S Italy Hilti Italia S.p.A., Sesto San Giovanni S Japan Hilti (Japan) Ltd., Yokohama S Kazakhstan Hilti Kazakhstan LLP, Almaty S Korea Hilti (Korea) Ltd., Seoul S Latvia Hilti Services Limited, Riga S Liechtenstein Hilti Deutschland AG, Schaan S Hilti Equipment Corporation, Schaan H
Hilti Finanz AG, Schaan Se
Hilti (International) Services, Ltd., Schaan Se
IVV-Internationale Vertrieb- und Verbund-Aktiengesellschaft, Schaan S Hilti (Schweiz) AG, Adliswil, Zweigniederlassung Schaan S Lithuania Hilti Complete Systems UAB, Vilnius S Luxembourg Hilti Belgium S.A. "Succursale", Luxembourg S Hilti Luxembourg Holding S.a.r.l.; Luxembourg H Malaysia Hilti (Malaysia) Sdn. Bhd., Petaling Jaya S Hilti Asia IT Services Sdn. Bhd., Petaling Jaya Se Mexico Hilti Mexicana, S.A. de C.V., Mexico City, Tlalnepantla S Hilti Operaciones de Mexico, S.A. de C.V., Matamoros P Montenegro Hilti Montenegro doo Podgorica, Podgorica S Morocco Hilti Maroc S.A., Casablanca S Netherlands Hilti Nederland B.V., Berkel en Rodenrijs S Hilti International Finance B.V., Amsterdam H, Se New Zealand Hilti (New Zealand) Limited, Auckland S Panama Hilti International Holding S.A., Panama Se Hilti Latin America S.A., Panama S, Se Transportes Continentales S.A., Panama Se Philippines Hilti (Philippines) Inc., Metropolitan Manila S Poland Hilti (Poland) Sp. z o.o., Warsaw S Portugal Hilti (Portugal) – Produtos e Serviços Lda., Porto S Puerto Rico Hilti Caribe LLC, San Juan, Hato Rey S Romania Hilti Romania SRL, Otopeni S Russian Federation Hilti Distribution Ltd., Moscow S Serbia Hilti SMN d.o.o. Beograd, Belgrade S Singapore Hilti Far East Private Ltd., Singapore S, H Slovakia Hilti Slovakia spol. s r.o., Bratislava S Slovenia Hilti Slovenija d.o.o., Ljubljana S South Africa Hilti (South Africa) (Pty) Ltd., Johannesburg/Midrand S

Notes to the Consolidated Financial Statements
Hilti Financial Report 2013 | 73
Spain Hilti Española, S.A., Madrid S Sweden Hilti Svenska AB, Arlöv-Malmö S Switzerland Hilti (Schweiz) AG, Adliswil S Hilti Befestigungstechnik AG, Buchs Se Hilti-Finanz GmbH, Chur H, Se Syria Hilti Syria LLC, Damascus S Taiwan Hilti Taiwan Co., Ltd., Taipei S Thailand Hilti (Thailand) Ltd., Bangkok S Turkey Hilti Inşaat Malzemeleri Ticaret A.Ş., Istanbul S Ukraine Hilti (Ukraine) Ltd., Kiev S United Arab Emirates Hilti Middle East FZE, Jebel Ali-Free Zone, Dubai S, Se USA Hilti Inc., Tulsa, Oklahoma S Hilti of America, Inc., Delaware H Hilti Holdings Limited, Delaware H Diamond B., Inc., California P Hilti Solar North America, Delaware H Unirac Inc., Albuquerque S, P, D Venezuela Hilti Venezuela S.A., Caracas S Vietnam Hilti Vietnam Company Limited, Ho Chi Minh City S
Less than 100% owned consolidated Group companies (subsidiaries) Bahrain Hilti Bahrain Co. W.L.L., Manama (49%) S Qatar Hilti Qatar W.L.L., Doha (49%) S Saudi Arabia Hilti Saudi Arabia for Construction Tools LLC, Riyadh (75%) S United Arab Emirates Hilti Emirates LLC, Abu Dhabi (49%) S Although the Group owns less than half of the voting rights of Hilti Bahrain Co. W.L.L., Hilti Qatar W.L.L. and Hilti Emirates LLC, management has determined that the Group controls these three companies. The Group has control, as contractual agreements grant the Group the right to appoint and remove management responsible for directing the relevant activities. In addition, the Group is entitled to appoint, remove and substitute a majority of members of the Companies’ Board of Directors.
Joint operations China Panasonic Eco Solutions Power Tools (Shanghai) Company Limited (49%) P Germany HILLOS GmbH, Jena (50% participation) P Taiwan Racing Point Ltd., Taipei (49%) P USA Intelligent Construction Tools LLC, Delaware (50%) P, D

Auditors’ Report on the Consolidated Financial Statements
Hilti Financial Report 2013 | 74
Audito rs’ Rep or t on the Cons olida ted Fina ncial Sta te ment s
Report of the Group auditors to the General Meeting of Hilti Aktiengesellschaft, Schaan
Report of the statutory auditor on the consolidated financial statements As statutory auditor, we have audited the consolidated financial statements of Hilti Aktiengesellschaft, which comprise the balance sheet, income statement, statement of comprehensive income, cash flow statement, statement of changes in equity and notes (pages 16 to 73), and the consolidated management report on pages 5 to 7 for the year ended December 31, 2013.
Board of Directors’ responsibility The Board of Directors is responsible for the preparation and fair presentation of the consolidated financial statements in accordance with the International Financial Reporting Standards (IFRS) and the requirements of Liechtenstein law. This responsibility includes designing, implementing and maintaining an internal control system relevant to the preparation and fair presentation of consolidated financial statements that are free from material misstatement, whether due to fraud or error. The Board of Directors is further responsible for selecting and applying appropriate accounting policies and making accounting estimates that are reasonable in the circumstances.
Auditor’s responsibility Our responsibility is to express an opinion on these consolidated financial statements based on our audit. We conducted our audit in accordance with Liechtenstein law as well as the International Standards on Auditing. Those standards require that we plan and perform the audit to obtain reasonable assurance whether the consolidated financial statements are free from material misstatement. An audit involves performing procedures to obtain audit evidence about the amounts and disclosures in the consolidated financial statements. The procedures selected depend on the auditor’s judgment, including the assessment of the risks of material misstatement of the consolidated financial statements, whether due to fraud or error. In making those risk assessments, the auditor considers the internal control system relevant to the entity’s preparation and fair presentation of the consolidated financial statements in order to design audit procedures that are appropriate in the circumstances, but not for the purpose of expressing an opinion on the effectiveness of the entity’s internal control system. An audit also includes evaluating the appropriateness of the accounting policies used and the reasonableness of accounting estimates made, as well as evaluating the overall presentation of the consolidated financial statements. We believe that the audit evidence we have obtained is sufficient and appropriate to provide a basis for our audit opinion.

Auditors’ Report on the Consolidated Financial Statements
Hilti Financial Report 2013 | 75
Opinion
In our opinion, the consolidated financial statements for the year ended December 31, 2013, give a true and fair view of the financial position, the results of operations and the cash flows in accordance with the International Financial Reporting Standards (IFRS) and comply with Liechtenstein law.
The consolidated management report is in accordance with the consolidated financial statements.
We recommend that the consolidated financial statements submitted to you be approved.
PricewaterhouseCoopers AG
René Rausenberger Ralf Zwick Auditors in charge St. Gallen, March 10, 2014

Auditors’ Report on the Consolidated Financial Statements
Hilti Financial Report 2013 | 76

Hilti Financial Report 2013 | 77
Financial Statements Hilti Corporation (including branches) Financial Statements Hilti Corporation

Financial Statements Hilti Corporation
Hilti Financial Report 2013 | 78
Balance sheet
in CHF million Note 2013 2012 ASSETS Intangible assets 4 30.2 37.2 Property, plant and equipment 5 353.6 330.4 Financial investments 6 2,040.2 2,473.9 Total non-current assets 2,424.0 2,841.5 Inventories 7 168.1 177.3 Trade and other receivables 8 501.0 540.7 Accrued income and prepayments 51.6 63.9 Cash and cash equivalents 608.8 481.9 Total current assets 1,329.5 1,263.8 TOTAL ASSETS 3,753.5 4,105.3 EQUITY AND LIABILITIES Share capital 88.0 88.0 Participation capital 38.7 38.7 Legal reserves 108.4 108.4 Foreign currency translation reserve (10.1) (10.9) Retained earnings brought forward 781.9 960.5 Net income 747.8 (48.1) Total equity 9 1,754.7 1,136.6 Provisions 10 41.4 43.3 Borrowings, payables and other liabilities 11 1,821.8 2,809.6 Accrued liabilities and deferred income 135.6 115.8 Total liabilities 1,998.8 2,968.7 TOTAL EQUITY AND LIABILITIES 3,753.5 4,105.3

Financial Statements Hilti Corporation
Hilti Financial Report 2013 | 79
Income statement
in CHF million Note 2013 2012 Net sales 2,073.8 1,817.6 Change in inventory of finished goods and work in progress 1.0 (1.6) Capitalized own production 4.0 4.5 Other operating revenues 16.8 8.5 Total operating revenues 2,095.6 1,829.0 Material costs 12 (1,097.8) (1,002.7) Personnel expenses 13 (322.0) (337.4) Depreciation and amortization 14 (50.1) (54.1) Other operating expenses (470.0) (411.8) Total operating expenses (1,939.9) (1,806.0) Operating result 155.7 23.0 Financial revenues 15 669.6 8.7 Financial expenses 16 (72.2) (78.7) Financial result 597.4 (70.0) Net income before tax expense 753.1 (47.0) Tax expense 17 (5.3) (1.1) Net income 747.8 (48.1) Financial Statements Hilti Corporation Notes to the Financial Statements

Notes to the Financial Statements
Hilti Financial Report 2013 | 80
(1) General information Hilti Corporation is a limited liability company incorporated and domiciled in the Principality of Liechtenstein. Its registe red office is at Feldkircherstrasse 100, 9494 Schaan, Liechtenstein. Hilti Corporation is the parent and main operating company of the Hilti Group. The shareholders and holders of participation certificates have an interest in the Group through their interest in Hilti Corporation. The accompanying Group’s consolidated financial statements are the most significant indicator of the Group’s financial position and financial performance.
(2) Accounting policies (2.1) Overview In contrast to the Group’s consolidated financial statements, which have been prepared in accordance with International Financial Reporting Standards (IFRS), the financial statements of Hilti Corporation have been prepared in accordance with Liechtenstein ’s corporations law, the Personen- und Gesellschaftsrecht (PGR). As a result, there are significant differences between treatments in the financial statements of Hilti Corporation and treatments in the Group’s consolidated financial statements. The significant measurement, recognition and presentation differences are listed below. Apart from these differences, the accounting policies adopted for the measurement, recognition and presentation of financial statement items in both sets of financial statements are substantially the same.
(2.2) Differences in accounting policies to those of the Group The following table identifies the relevant financial statement items and the corresponding treatments where the accounting policies adopted for the measurement and recognition of items in the financial statements of Hilti Corporation are significantly different from those adopted in the Group’s consolidated financial statements. Relevant financial statement item Treatment in financial statements of
Hilti Corporation Treatment in Group financial statements
Valuation of property, plant and equipment and inventories
In accordance with taxation rules pursuant to Article 1086 of the PGR
At lower of market value and historical cost subject to adjustment for depreciation or obsolescence based on economic esti-mates
Valuation of investments in associated companies and joint ventures
At historical cost In accordance with the equity method of accounting
Valuation of provisions Based on business risk criteria In accordance with the best estimate of the amounts required to satisfy existing obliga-tions
Reporting of derivative financial instru-ments hedging anticipated operating transactions (cash flow hedges)
Recognized at fair value with value changes reported directly in the income statement
Recognized at fair value with value changes reported as part of equity and reclassified to the income statement when the anticipated operating transactions occur
Reporting of development costs All immediately expensed For qualifying new product developments, capitalized during the development phases and subsequently amortized over the sales lives of the new products while other development costs are immediately expensed
Measurement of pension plan obligation Treated as defined contribution plan Treated as defined benefit plan with cumu-lative remeasurements recognized directly in equity

Notes to the Financial Statements
Hilti Financial Report 2013 | 81
The following table identifies the significant presentation differences relating to items in the financial statements of Hilt i Corporation and the corresponding items in the Group’s consolidated financial statements. Relevant financial statement item Presentation in financial statements of
Hilti Corporation Presentation in Group financial statements
Investments in deposits, bonds and equi-ties restricted to the funding of losses arising from damages to assets and losses arising from product-related obligations
Included in ‘financial investments’ Included in ‘financial assets at fair value through profit or loss’ under current assets heading
Recognized values of derivative financial instruments
Included in ‘accrued income and prepay-ments’ or ‘accrued liabilities and deferred income’ as applicable
Presented as a separate line item ‘derivative financial instruments’ under each of the current and non-current assets and liabili-ties headings
Short-term tax obligations Included in ‘provisions’ Presented as a separate line item ‘current income taxes payable’ under current liabili-ties heading
(2.3) Changes in accounting policies There have been no material changes in accounting policies in the 2013 financial statements of Hilti Corporation from those adopted in 2012.
(3) Exchange rates For details of foreign exchange rates of principal currencies that have been applied for translation into Swiss francs, see note 2.5 of the Group’s consolidated financial statements.
(4) Intangible assets in CHF million Rights Other
intangible assets
Total
Cost Opening balance at January 1, 2013 12.9 77.8 90.7 Currency translation differences – – – Additions – 3.6 3.6 Disposals – (1.3) (1.3) Transfers – 30.7 30.7 Closing balance at December 31, 2013 12.9 110.8 123.7
Accumulated amortization
Opening balance at January 1, 2013 (9.3) (44.2) (53.5) Currency translation differences – – – Additions (1.0) (9.5) (10.5) Disposals – 1.2 1.2 Transfers – (30.7) (30.7) Closing balance at December 31, 2013 (10.3) (83.2) (93.5)
Net book values at December 31, 2013 2.6 27.6 30.2 Net book values at December 31, 2012 3.6 33.6 37.2

Notes to the Financial Statements
Hilti Financial Report 2013 | 82
(5) Property, plant and equipment in CHF million Land and
buildings Plant and machinery
Other operating equipment
Prepayments or assets under construction
Total
Cost Opening balance at January 1, 2013 371.0 459.0 144.0 39.1 1,013.1 Currency translation differences 1.1 1.5 0.4 0.1 3.1 Additions 0.7 13.0 9.8 49.6 73.1 Disposals (25.6) (16.7) (22.1) - (64.4) Transfers 0.1 7.2 0.5 (7.8) – Closing balance at December 31, 2013 347.3 464.0 132.6 81.0 1,024.9
Accumulated depreciation
Opening balance at January 1, 2013 (164.0) (405.0) (113.7) – (682.7) Currency translation differences (0.4) (1.0) (0.3) – (1.7) Additions (4.5) (24.4) (10.7) – (39.6) Disposals 18.6 14.7 19.4 – 52.7 Transfers - – - – – Closing balance at December 31, 2013 (150.3) (415.7) (105.3) – (671.3)
Net book values at December 31, 2013 197.0 48.3 27.3 81.0 353.6 Net book values at December 31, 2012 207.0 54.0 30.3 39.1 330.4 The insurance value of property, plant and equipment at the balance sheet date is CHF 827.6 million (2012: CHF 779.6 million).
(6) Financial investments in CHF million Share-
holdings Loans to Group companies
Other financial investments
Total
Cost Opening balance at January 1, 2013 2,404.0 64.5 35.1 2,503.6 Currency translation differences – (0.5) – (0.5) Additions 204.6 – 6.8 211.4 Disposals (619.7) (1.1) (11.4) (632.2) Closing balance at December 31, 2013 1,988.9 62.9 30.5 2,082.3
Accumulated valuation allowance
Opening balance at January 1, 2013 (29.7) – – (29.7) Currency translation differences – – – – Additions (12.4) – – (12.4) Disposals – – – – Closing balance at December 31, 2013 (42.1) – – (42.1)
Net book values at December 31, 2013 1,946.8 62.9 30.5 2,040.2 Net book values at December 31, 2012 2,374.3 64.5 35.1 2,473.9

Notes to the Financial Statements
Hilti Financial Report 2013 | 83
A list of Group companies, directly or indirectly held by Hilti Corporation, is included on pages 71 to 73 of this Financial Report. Pursuant to Article 1094 (3) of the PGR, some details relating to investments in Group companies have not been disclosed in this list.
(7) Inventories in CHF million 2013 2012 Raw materials 27.4 35.7 Consumables 9.6 10.2 Production in progress 7.1 6.1 Finished products and goods held for resale 124.0 125.3 Total inventories 168.1 177.3
(8) Trade and other receivables in CHF million 2013 2012 Trade receivables from third parties 19.2 17.2 Trade receivables from Group companies 457.0 410.7 Total trade receivables 476.2 427.9 Other receivables from third parties 24.5 20.7 Other receivables from Group companies 0.3 92.1 Total other receivables 24.8 112.8 Total trade and other receivables 501.0 540.7
(9) Equity in CHF million Share and
PC capital Legal reserves
Foreign currency translation reserve
Retained earnings
Total
Equity at January 1, 2013 126.7 108.4 (10.9) 912.4 1,136.6 Dividend paid – – – (130.5) (130.5) Foreign currency translation differences – – 0.8 – 0.8 Net income – – – 747.8 747.8 Equity at December 31, 2013 126.7 108.4 (10.1) 1,529.7 1,754.7 The share capital consists of 176,000 registered shares with a par value of CHF 500 each and the participation capital consis ts of 774,400 participation certificates with a par value of CHF 50 each. The participation capital has no voting rights. All the capital is fully paid in and is entitled to dividends. The currency translation differences arise from the inclusion of the income statement and balance sheet items of Plant Thüringen, Austria, which are denominated in euro. The foreign currency translation reserve comprises the accumulated foreign currency gains and losses recognized in equity since 2003.

Notes to the Financial Statements
Hilti Financial Report 2013 | 84
(10) Provisions in CHF million 2013 2012 Provisions for employee benefits 22.0 34.1 Tax obligations 2.9 – Other provisions 16.5 9.2 Total provisions 41.4 43.3 Other provisions relate mainly to product liability.
(11) Borrowings, payables and other liabilities in CHF million 2013 2012 Short-term Long-term Total Short-term Long-term Total 2.75% bond 2006/2013 – – – 149.7 – 149.7 3.25% bond 2009/2014 299.8 – 299.8 – 299.1 299.1 Euro bonds 2012/2015–2019 (EUR 175 million) – 214.8 214.8 – 211.2 211.2 0.875% bond 2013/2018 – 99.8 99.8 – – – 1.875% bond 2013/2023 – 100.1 100.1 – – – Total bonds 299.8 414.7 714.5 149.7 510.3 660.0 Bank borrowings – – – 0.4 – 0.4 Trade payables third parties 114.1 – 114.1 93.5 – 93.5 Trade payables Group companies 93.9 – 93.9 74.3 – 74.3 Total trade payables 208.0 – 208.0 167.8 – 167.8 Other liabilities owing to third parties 20.0 3.3 23.3 17.7 4.6 22.3 Other liabilities owing to Group companies 38.8 837.2 876.0 48.4 1,910.7 1,959.1 Total other liabilities 58.8 840.5 899.3 66.1 1,915.3 1,981.4
Total borrowings, payables and other liabilities
566.6
1,255.2
1,821.8
384.0
2,425.6
2,809.6 The contractual maturity of short-term liabilities is less than one year and for long-term liabilities over one year. Long-term liabilities to the Hilti Foundation in Thüringen, Austria, are secured by a mortgage on the property in Thüringen for CHF 0. million (2012: CHF 0.3 million).
(12) Material costs in CHF million 2013 2012 Raw materials, consumables and bought-in goods for resale (1,085.6) (991.9) Outsourced manufacturing (12.2) (10.8) Total material costs (1,097.8) (1,002.7)

Notes to the Financial Statements
Hilti Financial Report 2013 | 85
(13) Personnel expenses in CHF million 2013 2012 Wages and salaries (275.3) (281.0) Pension contributions (35.1) (36.2) Other social contributions (11.6) (20.2) Total personnel expenses (322.0) (337.4)
(14) Depreciation and amortization This position comprises depreciation and amortization on intangible assets and property, plant and equipment.
(15) Financial revenues in CHF million 2013 2012 Financial investment revenues from third parties – 2.6 Financial investment revenues from Group companies 666.3 3.6 Total revenues from financial investments 666.3 6.2 Revenues from cash and marketable securities invested with third parties 3.3 2.5 Revenues from cash and marketable securities invested with Group companies – – Total revenues from cash and marketable securities 3.3 2.5 Total financial revenues 669.6 8.7
(16) Financial expenses in CHF million 2013 2012 Depreciation on financial assets (12.3) (1.6) Interest and similar expenses incurred to third parties (21.9) (29.4) Interest and similar expenses incurred to Group companies (30.5) (34.9) Total interest and similar expenses (52.4) (64.3) Operating currency and hedge gains/(losses) (7.5) (12.8) Total financial expenses (72.2) (78.7)
(17) Tax expense For income tax purposes, dividends received are tax-exempt.

Notes to the Financial Statements
Hilti Financial Report 2013 | 86
(18) Derivative financial instruments Hilti Corporation enters into derivative contracts to hedge mainly foreign currency risks arising from forecast foreign currency sales and purchases transactions. Derivative contracts are recognized when the applicable forecast transactions occur. Until then they remain off-balance sheet. Recognized (i.e. on-balance sheet) derivative contracts are reported at fair value. Changes in the fair value of recognized derivative contracts are reported in the income statement. In accordance with Article 1093 of the PGR, details of the on- and off-balance sheet derivative contracts outstanding at balance sheet date are as follows: in CHF million 2013 2012 Contract face amounts Foreign currency forward contracts 419.8 429.3 Foreign currency options 6.8 – Interest rate swaps 201.8 111.2 Cross-currency swaps 92.9 92.9 Total contract face amounts 721.3 633.4 Contract values Foreign currency forward contracts 10.2 4.8 Foreign currency options – – Interest rate swaps – 0.3 Cross-currency swaps 20.8 19.2 Total contract values 31.0 24.3 Reporting of contract values Contract values recognized (on-balance sheet) 31.0 24.3 Contract values unrecognized (off-balance sheet) – – Total contract values 31.0 24.3
(19) Segment information Pursuant to Article 1094 (2) of the PGR, a breakdown of net sales has not been disclosed.
(20) Contingent liabilities in CHF million 2013 2012 Credit facilities guarantees – – Other guarantees 13.2 13.9 Total contingent liabilities 13.2 13.9
(21) Commitments Payment commitments arising from operating lease contracts and service contracts are as follows: in CHF million 2013 2012 Expiring within 1 year 0.7 0.5 Expiring between 1 and 5 years 1.1 0.6 Total commitments 1.8 1.1

Notes to the Financial Statements
Hilti Financial Report 2013 | 87
(22) Remuneration of the Board of Directors and the Corporate Management For details of the remuneration of the Board of Directors and the Corporate Management, see note 4 of the Group’s consolidated financial statements.
(23) Number of employees The breakdown of employees by nationality is as follows: Country 2013 % 2012 % Austria 850 45 883 45 Germany 380 20 391 20 Liechtenstein 172 9 187 9 Switzerland 216 12 241 12 Other countries 274 14 271 14 Total employees 1,892 100 1,973 100
(24) Management report Pursuant to Article 1121 (3) of the PGR, the management report of Hilti Corporation has been combined with the consolidated management report. The consolidated management report is on pages 5 to 7 of this Financial Report.
(25) Appropriation of retained earnings in CHF million 2013 2012 Profit brought forward 781.9 960.5 Net income 747.8 (48.1) At the disposal of the General Meeting 1,529.7 912.4 Proposal by the Board of Directors Dividend of CHF 1,550 (2012: CHF 515) per share 272.8 90.6 CHF 155 (2012: CHF 51.5) per participation certificate 120.0 39.9 Appropriation to other reserves – – Balance carried forward 1,136.9 781.9 Total 1,529.7 912.4

Auditors’ Report on the Financial Statements
Hilti Financial Report 2013 | 88
Audito rs’ Rep or t on the Fina ncial St ate ment s
Report of the statutory auditors to the General Meeting of Hilti Aktiengesellschaft, Schaan
As statutory auditors, we have audited the accounting records and the financial statements (balance sheet, income statement and notes) on pages 78 to 87 and the management report of Hilti Aktiengesellschaft on pages 5 to 7 for the year ended December 31, 2013. These financial statements and the management report are the responsibility of the Board of Directors. Our responsibility is to express an opinion on these financial statements based on our audit. We confirm that we meet the legal requirements concerning professional qualification and independence. Our audit was conducted in accordance with auditing standards promulgated by the profession in Liechtenstein, which require that an audit be planned and performed to obtain reasonable assurance about whether the financial statements and the management report are free from material misstatement. We have examined on a test basis evidence supporting the amounts and disclosures in the financial statements. We have also assessed the accounting principles used, significant estimates made and the overall financial statement presentation. We believe that our audit provides a reasonable basis for our opinion. In our opinion, the financial statements give a true and fair view of the financial position, the results of operations and the cash flows in accordance with the Liechtenstein law. Further-more, the accounting records and financial statements and the management report and the proposed appropriation of available earnings comply with Liechtenstein law and the company’s articles of incorporation. The management report is in accordance with the financial statements. We recommend that the financial statements submitted to you be approved. PricewaterhouseCoopers AG René Rausenberger Ralf Zwick Auditors in charge St. Gallen, March 10, 2014

Hilti Financial Report 2013 | 89

Hilti Financial Report 2013 | 90

Hilti Financial Report 2013 | 91
Corporate Governance
Corporate Governance

Corporate Governance
Hilti Financial Report 2013 | 92
Election and term of office for the members of the Board of Directors
The members of the Board of Directors of Hilti Corporation are elected by the Annual General Meeting for three years. As a rule, directors serve up to four terms, but no longer than until the end of the business year in which they reach the age of 70.
Allocation of responsibilities and duties of the Board of Directors
In addition to its legally defined duties, the Board of Directors specifically takes decisions on the basic strategic direction of the Group, its long-term and annual strategic planning, important business decisions, as well as the succession planning of the Board of Directors itself and the succession planning and the appointment of the Executive Board. In the last business year, the Board of Directors supervised the activities of the Executive Board and supported it in a consultative capacity. The Board of Directors took a strategic focus and was actively involved in projects concerning Group strategy. In several multiday Board meetings and visits to major operating units of the Group, as well as on the basis of written and oral reports of the Executive Board, the Board of Directors dealt intensively with the economic situation, day-to-day running of the business as well as with its corporate policy, financial planning, risk management and basic questions of corporate development. Furthermore, the Board of Directors was kept fully informed by the statutory auditors on the results of the audit of the annual accounts.
Audit Committee The Audit Committee assists the Board of Directors in fulfilling its supervisory responsibilities with respect to the accounting and financial reporting practices of Hilti Corporation and its subsidiaries, compliance with legal and regulatory requirements, the internal and external audit processes as well as with its oversight of the risk management. The overall responsibility for the tasks delegated to the Audit Committee remains with the Board of Directors. In 2013, the Audit Committee consisted of Dr. Michael Jacobi (Chairman of the Audit Committee) and Dr. Tis Prager, who were appointed by the Board of Directors for a term of one year.
Internal audit The internal audit department, Corporate Audit, supports the Board of Directors by monitoring the internal control status within Group companies. To achieve this, Corporate Audit conducts audits focused on controls within major transaction cycles as well as on processes for management of selected corporate risks. Corporate Audit’s ob ective is to provide transparency over the Group’s control environment and enable security to be provided over the Group’s resources.
Risk management The Group maintains an enterprise-wide risk management process which involves a complete risk inventory with different risk owners assigned to manage all known strategic, financial and occurrence-oriented risks of the Group. The risk owners are responsible for their respective risks to evaluate, implement, review and monitor compliance with the corresponding risk mitigation measures. For financial and occurrence-oriented risks, the Corporate Risk Manager is responsible for the risk reporting process and to ensure the reported content and identified measures regarding the identified risks are plausible. Corporate Audit undertakes reviews of selected risks as part of their internal control reviews in Group companies (see above) and in corporate functions managed by the respective risk owners. For strategic risks, Corporate Development runs annual strategy review workshops with the Executive Board. The risk management reporting is regularly reviewed by the Board of Directors.

Corporate Governance
Hilti Financial Report 2013 | 93
Compensation to the Board of Directors and Corporate Management
Members of the Board of Directors are paid a fixed annual compensation plus a lump sum for expenses. There is no additional compensation for the performance of an Audit Committee function by a Director. Former members of the Board of Directors do not receive any remuneration. The members of Corporate Management (the Executive Management Team, including the Executive Board) receive an annual base salary and a variable compensation linked to performance. Members of the Executive Board normally retire at the age of 56. They receive a severance payment in addition to their statutory pension fund entitlement. Former members of the Executive Management Team do not receive any additional compensation other than their statutory pension fund entitlement. Total compensation is detailed in the Group financial statements (see note 42).
Shareholders’ participation rights
Details of share and participation capital are given in the Group financial statements (see note 20). Resolutions of shareholder meetings are generally decided by an absolute majority of represented votes. A majority of at least three quarters of represented votes is necessary to change the articles of incorporation, or for resolutions concerning changes to share and participation capital, subscription rights, expansion or restriction of business scope as well as mergers, transformation or liquidation of the company.
Auditors The examinations of the Group financial statements and the financial statements of Hilti Corporation are conducted by PricewaterhouseCoopers Ltd., St. Gallen (leading auditor). The company was reappointed in March 2013 for the 2013 year. The auditor-in-charge has been responsible for the mandate from 2012 following a partner rotation after the 2011 year. In respect of the 2013 year, audit fees of the leading auditor amount to CHF 1.5 million whereas the non-audit-related fees amount to CHF 0.2 million. Total audit fees of the Group including audits not performed by the leading auditor amount to CHF 2.2 million.

Corporate Governance
Hilti Financial Report 2013 | 94

Investor Information
Hilti Financial Report 2013 | 95
Investor Information Invest or In for ma tion
Contact information
Investor relations Dr. Jens Schulte Executive Vice President Finance & Controlling Hilti Corporation Feldkircherstrasse 100 9494 Schaan Liechtenstein Phone +423 234 2737 E-mail: [email protected] www.hilti.com
Media relations Matthias Hassler Media Officer Hilti Corporation Feldkircherstrasse 100 9494 Schaan Liechtenstein Phone +423 234 4949 E-mail: [email protected] www.hilti.com
Key dates Interim financial information January to April 2014 Interim financial information January to August 2014 Publication of the 2014 Financial Report Annual results media conference
May 16, 2014 September 26, 2014 March 13, 2015 March 13, 2015

Investor Information
Hilti Financial Report 2013 | 96