content content page chairman’s message 1 new product launches 2-3 awards and accolades 4 mrf...
TRANSCRIPT


CONTENT
Page
Chairman’s Message 1
New Product Launches 2-3
Awards and Accolades 4
MRF Motorsport Tyres 5
APRC/ MRF Challenge 6
Speciality Coatings 7
Online Retailing 8
ICC T-20 9
Racing Ahead 10-11
Board of Directors 12
Board’s Report 13
Page
Annexures I-IV to the Board’s Report 18
Management Discussion and Analysis 35
Corporate Governance 40
Business Responsibility Report 52
Auditor’s Report 58
Balance Sheet 64
Statement of Profit and Loss 65
Cash Flow Statement 66
Notes Forming Part of the Financial Statements 67
Consolidated Financial Statements 121
Form AOC-1 180

1
CHAIRMAN’S MESSAGEDear Shareholder,
The Indian Tyre Industry went through a very turbulent year with economic volatility, further compounded by initiatives like demonetization and changeover from BS III to BS IV norms.
India continues to be one of the favourable economies in the world, in terms of growth and investment opportunities. A near normal monsoon in 2016/17, especially in the North and West has resulted in a healthy upswing in the agrarian economy, which should augur well in the coming year. The year 2017 will see new taxation and commercial reforms which will add to the growth of the economy.
MRF's total income for the financial year ended 31.03.2017 is Rs. 15,078.01 crores. We have been market leaders for an unprecedented 30 years. However, competition has become stronger with tyre companies increasing their manufacturing capacities. Your company will continue to strive to be the customers’ preferred brand in the market by constantly improving product superiority, widening distribution network and ensuring brand dominance across all segments.
MRF continues to earn accolades. Your company has been recognized as the 3rd fastest growing company during the period 2011-2016 by Business World Magazine published in April 2017 among companies with a turnover of more than Rs. 10,000 crores. The MRF brand has also figured for the second time in the prestigious list of India’s most valuable brands - BRANDZ TOP 50.
Looking ahead, our initiatives in the new plants coupled with enhancement of our existing production capabilities, will be helpful in not only safeguarding our leadership position but also in increasing our global footprint. We, at MRF, have a deep understanding of the country, its people, its roads, its culture and its market - and this is the critical differentiator which gives us the advantage over our competitors. Coupled with innovative business solutions and multiple modernization initiatives, MRF will be ready for whatever the future may hold.
K.M. MAMMENChairman & Managing Director
1

NEW PRODUCT LAUNCHES
OTR:Musclerok E4 tyres meant for dump trucks, found its first ever bias fitment on the giant Komatsu 100 ton dump truck.
TWO WHEELER TYRES:Masseter by MRF has been engineered for performance and delivers excellent grip and superior control on any road, even at advanced lean angles.
TWO WHEELER TYRES:Masseter by MRFdelivers excellent grip and superior control on any road, even at advanced lean angles.
2

NEW PRODUCT LAUNCHES
3
S1R4 Plus 295/80 R 22.5 is an all-wheel position tyre for premium buses capable of delivering comfort at high speeds. The tyre has been approved
by Volvo, Mercedes-Benz and Scania as OE fitment on their buses.
TRUCK RADIALS:S1F4 10 R 20 is a high mileage steer axle fitment option for trucks and an all-wheel fitment for buses. This product delivers superior tread life compared to the best premium rib tyres in the market today.

AWARDS AND ACCOLADES
MRF was for the second year in a row listed in the prestigious BRANDZ Top 50 Most Valuable Indian Brands listing. The only tyre company to figure in this select list.
MRF was listed in Business World Magazine as one of India’s fastest growing companies. The article highlighted the product designing capability of MRF
thanks to its team of 300 engineers and scientists.
MRF was for the second year in a row listed in the prestigious BRANDZ Top 50 Most Valuable Indian Brands listing. The only tyre company to figure in this select list.
4

MRF MOTORSPORT TYRES
MRF participated in the prestigious Autosport International Exhibition in Birmingham, UK to showcase its range of MRF Motorsport Tyres, a precursor to entering the competitive European tyre market in the near future.
5

APRC / MRF CHALLENGE
The MRF Challenge, India’s fastest racing series, is now in its 5th season and features a faster and improved MRF F2000 car. The event was held in Formula 1 grade circuits at Bahrain, Dubai and New Delhi, with the season finale in
Chennai during February 2017.
Team MRF created rallying history by winning the FIA Asia Pacific Rally Championship (APRC) title for the 8th time, the only Indian tyre brand to have achieved this singular honour.
6

SPECIALITY COATINGS
MRF AquaFresh Cool is an acrylic paint for roofs designed to reflect IR radiations, facilitating reduction in the transfer of heat from the roof to the interiors of the building. This single pack water based paint (available in white) continuously reflects the sun’s rays in the visible and near infra-red wavelengths back to the atmosphere, preventing heat build-up on the roof. This paint, with high solar reflectance helps to reduce the heat penetrating into the building especially in summers and ensures greater comfort for the occupants. The temperature difference between the coated and uncoated roof can range between 5
oC to 12
oC, depending on the ambient temperature.
The higher the temperature of the surroundings, the greater will be the reduction in the temperature.
7

ONLINE RETAILING
With e-commerce booming in India, MRF decided to step into the digital world with its own e-commerce service. The online portal’s simple to use interface provides a hassle-free experience for customers to buy tyres and tyre-related services with ease. This unique initiative provides customers convenience in purchase as well as ensures that the services are provided by our own world-class network of T&S Franchisees. This facility is available in select cities.
8
ICC T-20
9
The International Cricket Council (ICC) and MRF announced a four-year partnership with MRF Tyres as a Global Partner for ICC events from 2016-19.
The first major ICC tournament in 2016 was the ICC World Twenty20 which was held in India. A resounding success, the tournament had a cumulative in-home TV viewership of 730 million in India. MRF brand ambassador, Virat Kohli, was the unanimous choice for the ‘Player of the Tournament’ Award.
Association with T-20 has helped MRF promote its brand, connect with consumers and remain top-of-mind in a highly competitive market.

1010
PROFIT BEFORE TAXATION(` In crores)
*For the 18 months period ended 31.03.2016
RESERVES(` In crores)
RACING AHEAD
260.96 211.39398.48
534.66
893.65 833.12
1226.801338.89
3605.95
2066.37
‘07Sep
‘08Sep
‘09Sep
‘10Sep
‘11Sep
‘12Sep
‘13Sep
‘14Sep
‘16*
Mar‘17Mar
981.91 1116.55 1357.18
1686.44
2293.53
2853.56
3640.90
4513.40
7156.97
8540.18
‘07Sep
‘08Sep
‘09Sep
‘10Sep
‘11Sep
‘12Sep
‘13Sep
‘14Sep
‘16*
Mar‘17Mar

1111
SALES(` In crores)
*For the 18 months period ended 31.03.2016
NET WORTH(` In crores)
RACING AHEAD
986.15 1120.791361.42
1690.68
2297.77
2857.80
3645.14
4517.64
7161.21
8544.42
‘07Sep
‘08Sep
‘09Sep
‘10Sep
‘11Sep
‘12Sep
‘13Sep
‘14Sep
‘16*
Mar‘17Mar
5036.755715.52 6141.94
8080.45
10637.03
13054.03 13444.75
14640.94
22030.91
14651.24
‘07Sep
‘08Sep
‘09Sep
‘10Sep
‘11Sep
‘12Sep
‘13Sep
‘14Sep
‘16*
Mar‘17Mar

BOARD OF DIRECTORS
K.M. MAMMENChairman & Managing Director
ARUN MAMMENVice Chairman & Managing Director
RAHUL MAMMEN MAPPILLAIManaging Director
Dr. K C. MAMMEN
ASHOK JACOB
V. SRIDHAR
VIJAY R. KIRLOSKAR
N. KUMAR
RANJIT I. JESUDASEN
Dr. SALIM JOSEPH THOMAS
JACOB KURIAN
M. MEYYAPPAN
Dr. CIBI MAMMEN
AMBIKA MAMMEN
Company Secretary
RAVI MANNATHAuditors
SASTRI & SHAH, ChennaiSCA AND ASSOCIATES, Mumbai
Registered Office:
No.114, Greams Road,Chennai - 600 006.
12
(AS ON 4TH MAY, 2017)

13
BOARD’S REPORT
Your Directors have pleasure in presenting to you the Fifty Sixth Annual Report and the Audited Financial Statements for the financial year ended 31st March, 2017.
Financial Results ` in Crores
1st April, 2016 to 31st March, 2017
[12 months period]
1st October, 2014 to 31st March, 2016
[18 months period]Total Income 15078 22483Profit before tax 2066 3606Provision for taxation 615 1132Profit for the year 1451 2474
In accordance with the notification issued by the Ministry of Corporate Affairs, the Company has adopted Indian Accounting Standards (referred to as “IND AS”) notified under the Companies (Indian Accounting Standards) Rules, 2015 with effect from 1st April, 2016. The financial statements have been prepared in accordance with IND AS as prescribed under Section 133 of the Companies Act, 2013 and rules thereunder.
The current financial statements are for a period of 12 months i.e., 1st April, 2016 to 31st March, 2017. The figures for the previous financial year is for a period of 18 months i.e., 1st October, 2014 to 31st March, 2016 and hence the figures for the period under review are not comparable with the previous period.
Performance Overview
During the financial year ended 31st March, 2017, your Company’s total income was ` 15,078 crore as against ` 22,483 crore in the previous 18 months period ended 31st March, 2016. The net profit for the financial year was ` 1,451 crore as against ` 2,474 crore in the previous period. Across the board there was an overall increase in all segments adding up to a 10% increase in total tyre production.
The Company’s exports stood at ̀ 1,316 crore for the financial year ended 31st March, 2017 as against ̀ 1,856 crore for the 18 months period ended 31st March, 2016.
As required under regulation 34 of the SEBI (Listing Obligations and Disclosure Requirements) Regulations, 2015, the management discussion and analysis report is attached and forms part of this Annual Report.
Dividend
Two interim dividends of ` 3 each per share (30% each) for the financial year ended 31st March, 2017 were declared by the Board of Directors on 27th October, 2016 and on 03rd February, 2017. The Board of Directors is now pleased to recommend a final dividend of ` 54/- per share (540%) on the paid up equity share capital of the Company, for consideration and approval of the shareholders at the Annual General Meeting of the Company. With this, the total dividend for the financial year ended
*The Company has opted for historical cost of property, plant and equipment/intangible assets as per Indian GAAP, as the deemed cost.
Ten Year Financial Summary 2017 2014-16 2014 2013 2012 2011 2010 2009 2008 2007` in Crores Sales 14651.24 22030.91 14640.94 13444.75 13054.03 10637.03 8080.45 6141.94 5715.52 5036.75
Other Income 426.77 452.30 73.47 37.40 39.73 33.14 29.13 34.40 40.83 24.17Total Income 15078.01 22483.21 14714.41 13482.15 13093.76 10670.17 8109.58 6176.34 5756.35 5060.92
Profit before Taxation 2066.37 3605.95 1338.89 1226.80 833.12 893.65 534.66 398.48 211.39 260.96Provision for Taxation 615.29 1132.05 441.00 424.59 260.76 274.23 180.68 145.45 66.83 89.18
Profit after Taxation 1451.08 2473.90 897.89 802.21 572.36 619.42 353.98 253.03 144.56 171.78Share Capital 4.24 4.24 4.24 4.24 4.24 4.24 4.24 4.24 4.24 4.24
Reserves 8540.18 7156.97 4513.40 3640.90 2853.56 2293.53 1686.44 1357.18 1116.55 981.91Net Worth 8544.42 7161.21 4517.64 3645.14 2857.80 2297.77 1690.68 1361.42 1120.79 986.15
Fixed Assets Gross 7560.09 6306.56* 6954.43 5834.14 5477.16 4874.07 3865.62 3020.57 2866.24 2289.77

14
31st March, 2017 works out to ` 60/- per share (600%). The total amount of dividends aggregates to ` 25.45 crore.
The Directors recommend that after making provision for taxation, debenture redemption reserve and dividend, an amount of ` 1,769.41 crore be transferred to general reserve. With this, the Company’s Reserves and Surplus stands at ` 8,540.18 crore.
Industrial Relations
Overall, the industrial relations in all our manufacturing units had been harmonious as well as cordial, except in Thiruvottiyur unit wherein long-term wage settlement is pending. Efforts are being made to resolve the issue. Both production and productivity were maintained at the desired levels throughout the year under review.
Prospects for the Current Year
The outlook for the domestic tyre industry looks stable in the short to medium term on the back of favourable demand in both the domestic and export markets. The issue of raw material cost escalation especially of natural rubber is here to stay for some time which will affect operational margins for a while in the foreseeable future. Good monsoons and investments in the core and infrastructure segments, sectoral growth in the economy coupled with a 7.2% annual growth in GDP are likely to have very many positive benefits for the tyre industry in the short to medium term. The positive sentiment shown by the infrastructure and rural sectors in recent months will definitely have an impact on the demand in the tyre industry, both for the original equipment and the replacement markets. However, the days of higher industry profit margins are most likely behind us and the expected hardening of raw material prices coupled with excess capacity in the industry will see competition intensifying in the market place.
Performance of SubsidiariesThe consolidated financial statements of the Company and its subsidiaries, prepared in accordance with the Companies Act, 2013 and applicable accounting standards form part of the Annual Report. The consolidated financial statements include the financial results of its subsidiary Companies.
Pursuant to the provisions of section 136 of the Companies Act, 2013, the financial statements, consolidated financial statements along with the relevant documents and audited accounts of subsidiaries are available on the website of the Company.
A statement in Form AOC-1, containing the salient features of the financial statements of the Company’s subsidiaries is attached with the financial statements. The statement also provides details of performance and financial position of the subsidiaries.
The Contribution of the subsidiaries to the overall performance of the company is given in note 27(f) of the consolidated financial statement.
Directors’ Responsibility Statement
As required under section 134(3)(c) of the Companies Act, 2013, your Directors state that:
a) In the preparation of the annual accounts, the applicable Accounting Standards have been followed and that there are no material departures;
b) They have, in selection of the accounting policies, consulted the Statutory Auditors and applied them consistently, making judgments and estimates that are reasonable and prudent so as to give a true and fair view of the state of affairs of the Company at the end of the financial year and of the profit and loss of the Company for that period;
c) Proper and sufficient care has been taken for the maintenance of adequate accounting records in accordance with the provisions of the Companies Act, 2013 for safeguarding the assets of the Company and for preventing and detecting fraud and other irregularities;
d) Annual accounts have been prepared on a going concern basis;
e) Internal financial controls had been laid down and followed by the Company and such internal financial controls are adequate and were operating effectively; and
f) Proper systems to ensure compliance with the provisions of all applicable laws have been devised and such systems were adequate and operating effectively.

15
Risk Management
The Company has developed and implemented a risk management policy for the Company including identification therein of elements of risk, if any, which in the opinion of the Board may threaten the existence of the Company. The Board and the Audit Committee periodically undertake a review of the major risks affecting the Company’s business and also the policies/measures evolved to mitigate these risks.
Adequacy of Internal Financial Control
The Company has adequate internal financial control procedures commensurate with its size and nature of business. These controls include well documented procedures, covering financial and operational functions. The internal financial controls of the Company are adequate to ensure the accuracy and completeness of accounting records, timely preparation of reliable financial information, prevention and detection of frauds and errors and safeguard against any losses or unauthorized use or disposal of assets. These controls are assessed on a regular basis by Internal Audit.
Conservation of Energy, Technology Absorption and Foreign Exchange Earnings and Outgo
Information as required to be given under section 134(3)(m) read with rule 8(3) of the Companies (Accounts) Rules, 2014 is provided in Annexure I, forming part of this Report.
Corporate Social Responsibility
As required under section 135 of the Companies Act, 2013, the CSR Policy was formulated by the CSR Committee and thereafter approved by the Board. CSR Policy is available on the Company’s website http://www. mrftyres.com/downloads/download.php filename csr-Policy.pdf.
The details of the CSR initiatives undertaken during the financial year ended 31st March, 2017 and other details required to be given under section 135 of the Companies Act, 2013 read with rule 8(1) of the Companies (Corporate Social Responsibility Policy) Rules, 2014 are given in Annexure II forming part of this Report.
Board
Mr Arun Mammen who was Managing Director has been appointed as Vice Chairman by the Board and consequently re-designated as Vice Chairman and Managing Director of the Company with effect from 04.05.2017.
Mr Rahul Mammen Mappillai who has been the Whole time Director of the Company since 2010 has been appointed by the Board as Managing Director of the Company for a period of 5 years commencing from 04.05.2017.
As required by section 152 of the Companies Act, 2013, Dr K C Mammen, Director of the Company, retires by rotation at the ensuing Annual General Meeting and is eligible for re-appointment.
The Company has received notices in writing from members along with deposit of requisite amount under section 160 of the Companies Act, 2013, proposing the candidature of Mr Samir Thariyan Mappillai and Mr varun Mammen for the office of Director of the Company. Both the proposals mentioned above, are subject to approval of the shareholders under section 149(1) of the Companies Act, 2013, for increasing the number of Directors of the Company. On the recommendations of the Nomination and Remuneration Committee, the Board of Directors has decided to recommend to the shareholders their appointment as Directors of the Company, liable to retirement by rotation. The Board has also approved the appointment of Mr Samir Thariyan Mappillai and Mr Varun Mammen as Whole-time Directors for a period of 5 years commencing from 04.08.2017, subject to approval of the shareholders. A brief profile of Mr Samir Thariyan Mappillai and Mr Varun Mammen is given in the notice to the Annual General Meeting.
The notice convening the Annual General Meeting includes the proposal for the above appointments/re-appointment.
The Company has received declaration of independence from all the Independent Directors confirming that they meet the criteria of independence as prescribed under Section 149(6) of the Companies Act, 2013 and SEBI (Listing Obligations and Disclosure Requirements) Regulations, 2015.

16
Performance evaluation of the Board, its Committees and Directors
The Board of Directors has made a formal annual evaluation of its own performance and that of its committees pursuant to the provisions of the Companies Act, 2013 and SEBI (Listing Obligations and Disclosure Requirements) Regulation, 2015. The evaluation was done based on the evaluation criteria formulated by Nomination and Remuneration Committee which includes criteria such as fulfilment of specific functions prescribed by the regulatory framework, adequacy of board meetings, attendance and effectiveness of the deliberations etc.
The Board and the Nomination and Remuneration Committee also carried out an evaluation of the performance of the individual Directors (excluding the director who was evaluated) based on their attendance, participation in deliberations, understanding the Company’s business and that of the industry and in guiding the Company in decisions affecting the business and additionally in case of Independent Directors based on the roles and responsibilities as specified in Schedule Iv of the Companies Act, 2013.
Corporate Governance
In accordance with Regulation 34 of the SEBI (Listing Obligations and Disclosure Requirements) Regulations, 2015, a Report on Corporate Governance along with the Auditors’ Certificate confirming compliance is attached and forms part of this Annual Report.
The information pertaining to the number of Board meetings held, the constitution of the Audit Committee, Remuneration Policy of the Company, criteria under section 178(3) of the Companies Act, 2013, Related Party Transactions and the Vigil Mechanism as required under the various provisions of the Companies Act, 2013, have been disclosed in the Corporate Governance Report which forms part of this report.
Business Responsibility Report
Business Responsibility Report as per Regulation 34 of the SEBI (Listing Obligations and Disclosure Requirements) Regulations, 2015, detailing the various initiatives taken by the Company on the environment, social and governance aspects of business, forms part of this report.
Particulars of Employees
The disclosures pertaining to remuneration and other details of directors and employees as required under section 197(12) of the Companies Act, 2013 read with rule 5 of the Companies (Appointment and Remuneration of Managerial Personnel) Rules, 2014 have been provided in the appendix forming part of this report. Having regard to the provisions of Section 136(1) read with relevant provisions of the Companies Act, 2013, the Annual Report excluding the aforesaid information is being sent to the members of the Company. The said information is available for inspection at the Registered Office of the Company during working hours and any member interested in obtaining such information may write to the Company Secretary and the same will be furnished to the members.
The Company has put in place a formal policy in line with The Sexual Harassment of Women at Workplace (Prevention, Prohibition and Redressal) Act, 2013. During the financial year under review, the Company has not received any complaint under the Act.
Deposits
Your Company has not accepted any deposits during the financial year ended 31st March, 2017. Three deposits aggregating ` 0.09 crore remain unclaimed as at the close of the financial year ended 31st March, 2017.
There were no defaults in respect of repayment of any deposits or payment of interest thereon during the financial year under review.
Awards received during the year
Your Company has been awarded the “Top Export Award” by the Chemical And Allied Products Export Promotion Council, India (CAPEXIL) and “Highest Export Award” by the All India Rubber Industries Association (AIRIA).
Auditors
As per the Companies Act, 2013, auditors are permitted to hold office for a maximum period of 10 years continuously. In order to meet the statutory mandate, during the current year, Messrs. Sastri & Shah, Chartered Accountants, Statutory Auditors of the Company will not

17
seek re-appointment and will retire. The Board of Directors, on the recommendations of the Audit Committee, at the meeting held on 4th May, 2017, have decided to recommend to the shareholders, the appointment of Messrs. Mahesh, Virender & Sriram, Chartered Accountants (Firm Regn. No. 001939S), as the Joint Statutory Auditor of the Company for a period of 5 years from the conclusion of the Fifty sixth Annual General Meeting until the conclusion of the Sixty first Annual General Meeting of the Company, subject to ratification annually by shareholders, if required by law. Messrs. Mahesh, Virender & Sriram, Chartered Accountants, have given their consent to act as Joint Statutory Auditors and have also confirmed that their appointment, if made, will be in accordance with the provisions of the Companies Act, 2013.
The Board recommends to the Shareholders the ratification of the appointment of Messrs. SCA AND ASSOCIATES (Firm Regn. No. 101174W), the Joint Statutory Auditors of the Company, pursuant to the approval of the members at the 55th Annual General Meeting, to hold office from the conclusion of the forthcoming Annual General Meeting of the Company until the conclusion of the next Annual General Meeting of the Company, on a remuneration to be fixed by the Board.
Cost Audit
The Board of Directors, on the recommendations of the Audit Committee, has approved the re-appointment of Mr C. Govindan Kutty, Cost Accountant (Mem. No. 2881), as Cost Auditor of the Company for the financial year ending 31st March, 2018, under section 148 of the Companies Act, 2013, and recommends ratification of his remuneration by the shareholders at the ensuing Annual General Meeting of the Company.
Secretarial Audit
Pursuant to provisions of Section 204 of the Companies Act, 2013 read with rule 9 of the Companies (Appointment and Remuneration of Managerial Personnel) Rules, 2014, your Company engaged the services of Mr K Elangovan, Elangovan Associates, Company Secretaries, Chennai
to conduct the Secretarial Audit of the Company for the financial year ended 31st March, 2017. The Secretarial Audit Report (in Form MR-3) is attached as Annexure-III, to this Report. The Secretarial Auditor’s Report to the shareholders does not contain any qualification.
Extract of Annual Return
An extract of Annual Return in Form MGT-9 as on 31st March, 2017 is attached as Annexure-IV to this Report.
Other Matters
There are no material changes and commitments affecting the financial position of the Company between the financial year ended 31st March, 2017 and the date of this report.
During the period under review, there were no material and significant orders passed by the regulators or courts or tribunals impacting the going concern status and the Company’s operations in future. Details of loans, guarantees and investments as required under the Companies Act, 2013 are given in the Notes to the financial statements (Note 3 and 28).
Appreciation
Your Directors place on record their appreciation of the invaluable contribution made by the Company’s employees which made it possible for the Company to achieve these results. They would also like to take this opportunity to thank customers, dealers, suppliers, bankers, financial institutions, business associates and valued shareholders for their continued support and encouragement.
On behalf of the Board of Directors,
Chennai K M MAMMEN4th May, 2017 Chairman & Managing Director

18
ANNEXURE I TO THE BOARD’S REPORT
A. CONSERVATION OF ENERGYConservation of energy is a key focus area in operations and we have an ongoing program to reduce specific consumption of fuel and power. Benchmarking of best performance of previous year and identification of losses is used in setting targets. Energy management systems are being introduced in plants. Focus on renewable energy and alternate sources of energy are being explored. Several power saving projects and fuel saving projects have been undertaken. Some of the key initiatives are given below:(i) Steps taken or impact on energy conservation:
The following measures were implemented to reduce specific fuel consumption:
a) Identification of the areas of energy loss in steam consuming areas and immediate corrective measures.
b) Parallel deployment of energy management system in various units to monitor & benchmark steam consumption at sub plant and equipment level.
c) Parallel deployment of all the successful energy saving projects across all units of the Company.
d) Ensuring the quality of steam generated by boiler. e) Reduced steam consumption by modifying the process
parameters. f) Increased productivity ensured in curing by modifying
the existing curing presses. g) Usage of improved insulation to reduce the radiation losses. The following measures were implemented to reduce specific
power consumption: a) Identification of areas of energy loss in power consuming
areas and taking immediate corrective measures. b) LED/Induction lamp fittings are being used at plants. c) Specific power consumption reduction in compressed air. d) Introduction of compressor energy management system
to trim down the energy consumption further. (ii) Steps taken by the company for utilizing alternate source of
energy: In order to reduce its carbon footprint your Company is
continuously exploring and using alternate or renewable sources of power:
a) Power purchase from open access using power exchanges ensures significant portion of power drawn from renewable hydroelectric and wind based power.
b) Usage of skylight in structures ensures reduction of day time lighting consumption.
c) Rain water harvesting ponds planned in all units to conserve water.
d) Recycling of waste water for the process by introducing second pass reverse osmosis plant to reduce water consumption.
e) During the year a 500 KW Solar Power Plant has been installed. Feasibility studies are being done to increase generation of Solar power.
(iii) Capital investment on energy conservation project: Investments have been carried out for implementing energy
conservation proposals which have long term saving impact and reduction of losses in the system.
Key projects initiated during the year are listed below: a) Improved insulation for steam line networks. b) Process changes resulting in reduction of consumption
of steam and power c) use of energy efficient lighting system. d) Optimisation and rationalisation of pumps and motors. e) Introduction of small solar plants for power generation. Key on-going proposals are as listed below: i) Increasing the insulation coverage area. ii) Study and critical analysis of power and fuel
consumption data. iii) Rationalisation of processes to optimise energy
consumption.B. TECHNOLOGY ABSORPTION, ADAPTATION AND INNOVATIONS 1. Efforts made towards technology absorption, adaptation and
innovation a) Evaluation of new generation materials New generation materials were evaluated and adapted
in our formulations to achieve special properties to meet the specific requirements of the customers and environmental concerns. In a step towards making

19
the tyre production sustainable, we started R&D trails on using raw materials derived from environmentally sustainable sources such as biomass and waste materials. This is in partnership with a reputed Indian industry. We are also exploring the feasibility of making tyre production sustainable using Nanomaterials and other smart materials.
b) New product development With the broad vision of making tyre production
sustainable, your Company has initiated several projects on developing low rolling resistance (RR) tyres.
c) New process development New process techniques have been adapted to reduce
energy consumption, increase productivity and improve consistency of the process.
d) Modernization of machinery Modernization of machinery is done to achieve
higher level of accuracy and to improve productivity. Manufacturing process is being automated to reduce manual intervention and to improve quality.
2. Benefits derived as a result of the above efforts a) Product improvement A low RR tyre, being fuel efficient, emits less CO2 to
the environment thus contributing to mitigating Global Warming. Our low RR tyres are in regular use by multinational majors.
b) Cost reduction
Usage of alternate raw material and new material sources has helped in reducing the cost. Alternate materials are used to improve process efficiency.Improvements achieved in power & fuel consumption, higher machine utilization and reduction in waste loss have yielded cost reduction.
c) New product development Development of new design and usage of advanced
materials have resulted in development of new products to meet the stringent customer requirements.
d) Import substitution Usage of indigenous materials and process equipments
might help in replacing imported materials and result in substantial cost savings.
e) Manpower optimization usage of modified process and modern machineries has
helped in optimizing manpower usage in factories. 3. Details of imported technology (Imported during last 3 years
reckoned from the beginning of the financial year): N.A 4. Expenditure incurred on Research and Development:
` in Crores1st April, 2016 to 31st March, 2017
[12 months period]
1st October, 2014 to 31st March, 2016[18 months period]
R & D Expenses (a) Capital 158.92 6.34(b) Recurring 40.76 48.55Total 199.68 54.89
C. FOREIGN EXCHANGE EARNINGS & OUTGO ` in Crores1st April, 2016 to 31st March, 2017
[12 months period]Foreign Exchange Earnings:FOB Value of Exports 1,151.31Freight & Insurance 11.66Dividend 0.11Others 4.07
1,167.15Foreign Exchange Outgo: 3,105.27
On behalf of the Board of Directors,
Chennai K M MAMMEN4th May, 2017 Chairman & Managing Director

20
ANNEXURE II TO THE BOARD’S REPORT
ANNUAL REPORT ON CORPORATE SOCIAL RESPONSIBILITY (CSR) ACTIVITIES
1. A brief outline of the Company’s CSR policy, including overview of projects or programs proposed to be undertaken and a reference to the web-link to the CSR policy and projects or programs:The CSR activities carried out by the Company are in accordance with the CSR Policy, as formulated by the CSR Committee and approved by the Board. The broad objectives, as stated in the CSR Policy, includes supporting causes concerning healthcare, education, rural development, skill development, sports training and environment protection. During the year, the CSR Policy was amended to enlarge the scope of the CSR activities that can be pursued by the Company. The CSR policy is available on the Company’s website and the web-link is: http: //www.mrftyres.com/download.php filename csrpolicy. pdf.
2. The Composition of the CSR Committee:Mr. K M Mammen – ChairmanMr. Arun Mammen – MemberMr. Rahul Mammen Mappillai – MemberMr. Ranjit I Jesudasen – Member
3. Average net profit of the Company for last three financial years : ` 1,961.88 Crore.4. Prescribed CSR expenditure (two per cent of the average net profit of the last three financial years): ` 39.24 Crore.5. Details of CSR spent during the financial year ended 31.03.2017:
(a) Total amount spent for the financial year ended 31.03.2017: ` 7.73 Crore. (b) Amount unspent, if any; ` 31.51 Crore. (c) Manner in which the amount spent during the financial year ended 31.03.2017 is detailed below:
` in CroresSl.
No.CSR Project or activity identified
Sector in which the project is covered
Projects or programs (1) Local area or other(2) Specify the state and
district where projects or programs was undertaken
Amount outlay(budget) project or programs wise
Amount spent on the project or programsSub heads:(1) Direct expenditure on
project or programs(2) Overheads
Cumulative expenditure upto the reporting period
Amount spent: Direct or through implementing agency
1 Providing training for development of pace bowlers through MRF Pace Foundation
Training to promote sports Chennai (Tamil Nadu)
5.98 4.26 4.26 Direct
2 Training for under privileged youngsters to become commercial vehicle drivers through MRF Institute of Driver Development.
Vocational Skills Chennai (Tamil Nadu)
1.15 0.97 0.97 Direct

21
` in CroresSl.
No.CSR Project or activity identified
Sector in which the project is covered
Projects or programs (1) Local area or other(2) Specify the state and
district where projects or programs was undertaken
Amount outlay(budget) project or programs wise
Amount spent on the project or programsSub heads:(1) Direct expenditure on
project or programs(2) Overheads
Cumulative expenditure upto the reporting period
Amount spent: Direct or through implementing agency
3 Construction of additional floor in the undergraduate girls hostel at Pondicherry Institute of Medical Sciences [PIMS].
Promotion ofeducation
Pondicherry 2.00 2.00 2.00 Through implementingagency - Madras Medical Mission
4 Contribution to train young children in tennis and table tennis.
Training to promote sports Chennai (Tamil Nadu)
0.05 0.05 0.05 Through implementingagency -Mylapore Sports Trust
5 Tree plantation in nearby schools under “Massive Tree Plantation Campaign” in Puducherry.
Rural development project Puducherry 0.0175 0.010 0.010 Through implementingagency –Sutru Soozhal Kalvi Kazhagam, Puducherry
6 Desilting of Arkonam Big Tank channels project.
Rural development project Vellore District(Tamil Nadu)
0.07 0.07 0.07 Through implementingagency – The Collector, Vellore District
7 Providing walkers’ track in Government Boys Higher Secondary School at Arkonam in Vellore District
Rural development project Vellore District(Tamil Nadu)
0.075 0.075 0.075 Through implementingagency – The Collector, Vellore District
8 Providing support to International Antartica Expedition -2041 and spreading environmental awareness.
Environmental sustainability, ecological balance etc.,
Chennai(Tamil Nadu)
0.02 0.02 0.02 Direct
9 Completion of Panchayathbuilding of Usgao Panchayat near our Goa Factory.
Rural developmentproject
Goa 0.135 0.135 0.135 Direct
22
` in CroresSl.
No.CSR Project or activity identified
Sector in which the project is covered
Projects or programs (1) Local area or other(2) Specify the state and
district where projects or programs was undertaken
Amount outlay(budget) project or programs wise
Amount spent on the project or programsSub heads:(1) Direct expenditure on
project or programs(2) Overheads
Cumulative expenditure upto the reporting period
Amount spent: Direct or through implementing agency
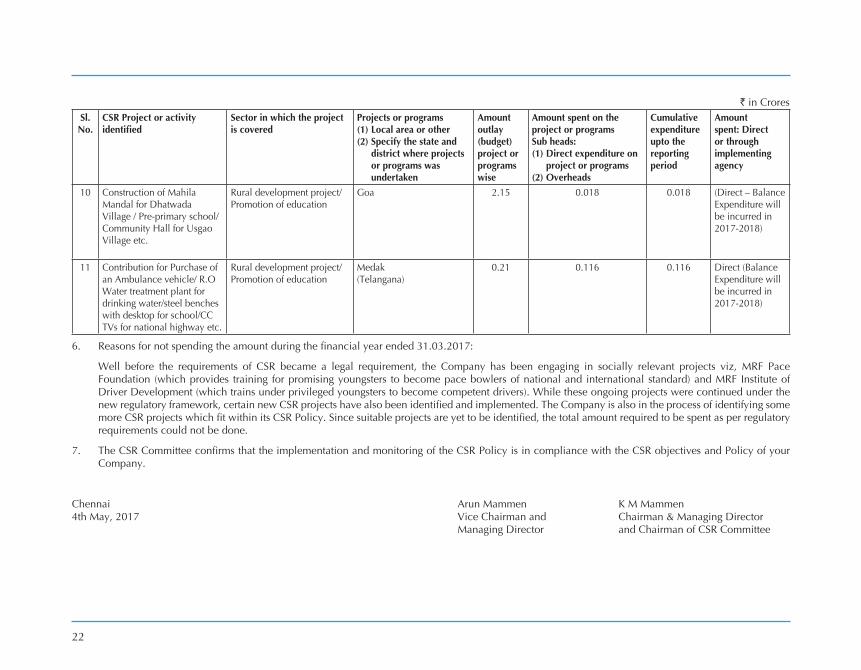
10 Construction of Mahila Mandal for Dhatwada Village / Pre-primary school/ Community Hall for Usgao Village etc.
Rural development project/ Promotion of education
Goa 2.15 0.018 0.018 (Direct – Balance Expenditure will be incurred in 2017-2018)
11 Contribution for Purchase of an Ambulance vehicle/ R.O Water treatment plant for drinking water/steel benches with desktop for school/CC TVs for national highway etc.
Rural development project/ Promotion of education
Medak(Telangana)
0.21 0.116 0.116 Direct (Balance Expenditure will be incurred in 2017-2018)
6. Reasons for not spending the amount during the financial year ended 31.03.2017:
Well before the requirements of CSR became a legal requirement, the Company has been engaging in socially relevant projects viz, MRF Pace Foundation (which provides training for promising youngsters to become pace bowlers of national and international standard) and MRF Institute of Driver Development (which trains under privileged youngsters to become competent drivers). While these ongoing projects were continued under the new regulatory framework, certain new CSR projects have also been identified and implemented. The Company is also in the process of identifying some more CSR projects which fit within its CSR Policy. Since suitable projects are yet to be identified, the total amount required to be spent as per regulatory requirements could not be done.
7. The CSR Committee confirms that the implementation and monitoring of the CSR Policy is in compliance with the CSR objectives and Policy of your Company.
Chennai Arun Mammen K M Mammen4th May, 2017 Vice Chairman and Chairman & Managing Director Managing Director and Chairman of CSR Committee

23
ANNEXURE III TO THE BOARD’S REPORT
FORM NO. MR - 3
SECRETARIAL AUDIT REPORTFOR THE FINANCIAL YEAR ENDED 31ST MARCH, 2017
(Pursuant to section 204(1) of the Companies Act, 2013 and rule 9 of the Companies (Appointment and Remuneration of
Managerial Personnel) Rules, 2014)To,The Members,MRF LIMITED, Chennai - 600 006.I have conducted the secretarial audit of the compliance of applicable statutory provisions and the adherence to good corporate practices by MRF LIMITED (CIN: L25111TN1960PLC004306) (hereinafter called the Company). Secretarial Audit was conducted in a manner that provided me a reasonable basis for evaluating the corporate conducts/statutory compliances and expressing my opinion thereon.Based on my verification of MRF LIMITED‘s books, papers, minutes books, forms and returns filed and other records maintained by the company and also the information provided by the company, its officers, agents and authorized representatives during the conduct of secretarial audit, I hereby report that in my opinion, the Company has, during the audit period covering the financial year ended 31st March, 2017 has proper Board-processes and compliance mechanism in place to the extent, in the manner and subject to the reporting made hereunder.I have examined the books, papers, minutes books, forms and returns filed and other records maintained by MRF LIMITED for the financial year ended 31st March, 2017 according to the provisions of:(i) The Companies Act, 2013 (the Company) and rules made thereunder;(ii) The Securities Contracts (Regulation) Act, 1956 and the rules made
thereunder;(iii) The Depositories Act, 1996 and the Regulations and bye-laws
framed thereunder;(iv) Foreign Exchange Management Act, 1999 and the rules and
regulations made thereunder to the extent of Foreign Direct Investment, Overseas Direct Investment and external commercial borrowings;
(v) The following Regulations and Guidelines prescribed under the Securities and Exchange Board of India Act, 1992:
a) The Securities and Exchange Board of India (Substantial Acquisition of Shares and Takeovers) Regulations, 2011;
b) The Securities and Exchange Board of India (Prohibition of Insider Trading) Regulations, 2015;
c) The Securities and Exchange of Board of India (Issue of Capital and Disclosure Requirements) Regulations, 2009;
d) The Securities and Exchange Board of India (Issue and Listing of Debt Securities) Regulations, 2008;
e) The Securities and Exchange Board of India (Registrars to an Issue and Share Transfer Agents) Regulations, 1993 regarding the Companies Act and dealing with client;
f) The Securities and Exchange Board of India (Delisting of Equity Shares) Regulations, 2009; and
g) The Securities and Exchange Board of India (Buy Back of Securities) Regulations, 1998.
I have also examined compliance with the applicable clauses of the following:
1. Secretarial Standards issued by the Institute of Company Secretaries of India;
2. The Listing Agreements entered into by the Company with Bombay Stock Exchange Ltd. and National Stock Exchange Ltd.;
3. The Securities and Exchange Board of India (Listing Obligations and Disclosure Requirements) Regulations, 2015.
During the period under review, the Company has complied with the provisions of the Act, Rules, Regulations, Guidelines, Standards etc., mentioned above.
I have reviewed the systems and mechanisms established by the Company for ensuring compliance under applicable Acts, Rules, Regulations and other legal requirements of the Central, State and other Government and local authorities concerning the business and affairs of the Company categorized under the following major heads/groups, and report that there are adequate system and processes in the Company, commensurate with the size and operations of the Company to monitor and ensure compliance with applicable laws, rules, regulations and guidelines:1. Factories Act, 1948;2. Labour laws and other incidental laws related to labour and employees
appointed by the Company including those on contractual basis as

24
relating to wages, gratuity, prevention of sexual harassment, dispute resolution, welfare, provident fund, insurance, compensation etc.;
3. Industries (Development & Regulation) Act, 1991;4. Acts relating to consumer protection;5. Acts and Rules prescribed under prevention and control of pollution;6. Acts and Rules relating to environmental protection and energy
conservation;7. Acts and Rules relating to hazardous substances and chemicals;8. Acts and Rules relating to electricity, fire, petroleum, motor vehicles,
explosives, boilers etc.;9. Acts relating to protection of IPR;10. Acts and Rules relating to the industry to which this Company belongs.11. Land revenue laws; and12. Other local laws as applicable to various plants and offices.I further report that -The Board of Directors of the Company is duly constituted with proper balance of executive directors, non-executive directors, independent directors and woman director. No change in the Composition of the Board of Directors took place during the period under review.Adequate notice is given to all directors to schedule the Board Meetings, agenda and detailed notes on agenda were sent at least seven days in advance, and a system exists for seeking and obtaining further information and clarification on the agenda items before the meeting and for meaningful participation at the meeting. All decisions are carried out unanimously as recorded in the minutes of the Meeting.I further report that there are adequate systems and processes in the Company commensurate with the size and operations of the Company to monitor and ensure compliance with applicable laws, rules, regulations and guidelines.I further report that during the audit period the Company has passed special resolution by way of postal ballot to issue secured/unsecured redeemable non-convertible debentures for an amount not exceeding ` 500 Crores on a private placement basis. I further report that during the audit period the Company has, in due compliance of the provisions of Regulation 39 (4) read with Schedule VI of SEBI (Listing Obligations and Disclosure Requirements) Regulations, 2015, transferred the unclaimed shares, lying in possession of the Company, to MRF - Unclaimed Suspense Account.
K. ELANGOVANPlace: Chennai Company Secretary in PracticeDate: 4th May, 2017 FCS No.1808, CP No. 3552
This report is to be read with my testimony of even date which is annexed as Annexure A and forms an integral part of this report.
Annexure A
To,
The Members,MRF LIMITED, Chennai - 600 006.
Our report of even date is to be read along with this letter.
1. Maintenance of secretarial records is the responsibility of the management of the Company. Our responsibility is to express an opinion on these secretarial records based on our audit.
2. We have followed the audit practices and processes as were appropriate to obtain reasonable assurance about the correctness of the contents of the secretarial records. The verification was done on test basis to ensure that correct facts are reflected in secretarial records. We believe that the processes and practices we followed provide a reasonable basis for our opinion.
3. We have not verified the correctness and appropriateness of financial records and books of account of the Company.
4. Wherever required, we have obtained the management representation about the compliance of laws, rules and regulations and happening of events etc.
5. The compliance of the provisions of corporate and other applicable laws, rules, regulations, standards is the responsibility of management. Our examination was limited to the verification of procedures on test basis.
6. The secretarial audit report is neither an assurance as to the future viability of the Company nor of the efficacy or effectiveness with which the management has conducted the affairs of the Company.
K. ELANGOVANPlace: Chennai Company Secretary in PracticeDate: 4th May, 2017 FCS No.1808, CP No. 3552

25
ANNEXURE IV TO THE BOARD’S REPORT
FORM NO. MGT 9 EXTRACT OF ANNUAL RETURN
for the financial year ended 31 03 2017[Pursuant to Section 92 (3) of the Companies Act, 2013 and Rule 12(1) of the Companies (Management & Administration) Rules, 2014.]
I REGISTRATION & OTHER DETAILSi CIN L25111TN1960PLC004306 ii Registration Date 5th November, 1960iii Name of the Company MRF LIMITEDiv Category/Sub-category of
the CompanyPublic Company / Limited by Shares
v Address of the Registered Office & contact details
No. 114, Greams Road, Chennai - 600 006 Tel: 044-28292777, Fax: 044-28295087 e-mail: [email protected]
vi Whether listed Company Yesvii Name, Address & contact
details of the Registrar & Transfer Agent, if any.
IN HOUSE SHARE REGISTRYMRF LimitedNo. 114, Greams Road, Chennai - 600 006 Tel: 044-28292777, Fax: 044-28295087, e-mail: [email protected]
II PRINCIPAL BUSINESS ACTIVITIES OF THE COMPANYAll the business activities contributing 10% or more of the total turnover of the company shall be stated:Sl. No.
Name & Description of main products/services
NIC Code of the Product /service % to total turnover of the Company
1 Manufacture and sale of Automotive Tyres, Tubes, Flaps etc.,
221 100%
III PARTICULARS OF HOLDING, SUBSIDIARY & ASSOCIATE COMPANIESSl. No.
Name & Address of the Company
CIN/GLN Holding/Subsidiary/ Associate
% of Shares held
Applicable Section
1 MRF Corp Ltd. U65929TN1985PLC012156 Wholly Owned Subsidiary 100% 2(87)2 MRF International Ltd. U25111TN1992PLC023695 Subsidiary Company 95% 2(87)3 MRF Lanka (P) Ltd. Company Incorporated Outside India Wholly Owned Subsidiary 100% 2(87)4 MRF SG Pte Ltd. Company Incorporated Outside India Wholly Owned Subsidiary 100% 2(87)

26
IV SHAREHOLDING PATTERN (Equity Share capital breakup as % of total equity)(i) Category-wise ShareholdingCategory of Shareholder’s No of Shares held as on 01-0 -201 No of Shares held as on 31-03-2017 % change during
the financial year ended 31 03 2017
Demat Physical Total % of Total Shares
Demat Physical Total % of Total Shares
A. Promoters(1) Indiana) Individual/HUF 552955 34 552989 13.04 548652 - 548652 12.94 -0.10b) Central Govt. / State Govt.(s) - - - - - - - - -c) Bodies Corporates 590996 - 590996 13.93 593213 - 593213 13.98 0.05d) Banks/FI - - - - - - - - -e) Any other - - - - - - - - -SUB-TOTAL: (A) (1) 1143951 34 1143985 26.97 1141865 - 1141865 26.92 -0.05(2) Foreigna) NRI- Individuals 22095 - 22095 0.52 19107 - 19107 0.45 -0.07b) Other Individuals - - - - - - - - -c) Bodies Corporates - - - - - - - - -d) Banks/FI - - - - - - - - -e) Any other - - - - - - - - -SUB-TOTAL: (A) (2) 22095 - 22095 0.52 19107 - 19107 0.45 -0.07Total Shareholding of Promoter 1166046 34 1166080 27.49 1160972 - 1160972 27.37 -0.12(A) (A)(1) (A)(2)B. Public Shareholding(1) Institutionsa) Mutual Funds/UTI 305844 100 305944 7.21 268846 100 268946 6.34 -0.87b) Banks/FI 6798 1533 8331 0.20 3213 1495 4708 0.11 -0.09c) Central Govt. - - - - - - - - -d) State Govt.(s) - - - - - - - - -e) Venture Capital Funds - - - - - - - - -f) Insurance Companies 147513 - 147513 3.48 142193 142193 3.35 -0.13g) FII’s 360060 100 360160 8.49 457266 100 457366 10.78 2.29h) Foreign Venture Capital Funds - - - - - - - - -i) Others (specify) - - - - - - - - -SUB-TOTAL (B)(1): 820215 1733 821948 19.38 871518 1695 873213 20.59 1.21(2) Non-Institutionsa) Bodies Corporatei) Indian 368432 663567 1031999 24.33 378942 663324 1042266 24.58 0.25ii) Overseas - - - - - - - - -b) Individualsi) Individual shareholders holding nominal
share capital upto `1 lakh676418 169003 845421 19.93 673467 130530 803997 18.96 -0.97
ii) Individual shareholders holding nominal share capital in excess of ` 1 lakh
15000 360695 375695 8.86 360695 360695 8.50 -0.36
c) Others (specify) - - - - - - - - -SUB-TOTAL (B)(2) 1059850 1193265 2253115 53.13 1052409 1154549 2206958 52.04 -1.09Total Public Shareholding 1880065 1194998 3075063 72.51 1923927 1156244 3080171 72.63 0.12(B) (B)(1) (B)(2)C. Shares held by Custodian for GDRs & ADRs - - - - - - - - -Grand Total (A B C) 3046111 1195032 4241143 100.00 3084899 1156244 4241143 100.00 0

27
(ii) Shareholding of PromotersSl. No.
Shareholder’s Name Shareholding as on 01-0 -201 Shareholding as on 31-03-2017 % change in shareholding during
the financial year ended 31 03 2017
No. of shares % of total shares of the Company
% of shares pledged/ encumbered to total
shares
No. of shares % of total shares of the Company
% of shares pledged/ encumbered to total
shares1 Mr. K M MAMMEN 16048 0.38 - 16048 0.38 - -2 Mrs. AMBIKA MAMMEN 2489 0.06 - 2489 0.06 - -3 Mr. RAHUL MAMMEN MAPPILLAI 4538 0.11 - 4538 0.11 - -4 Mr. SAMIR THARIYAN MAPPILLAI 4470 0.11 - 4470 0.11 - -5 Mrs. MEERA MAMMEN 15840 0.37 - 15840 0.37 - -6 Mr. VARUN MAMMEN 8706 0.21 - 8706 0.21 - -7 Mrs. ADITI MAMMEN 4741 0.11 - 4741 0.11 - -8 Mr. ARUN MAMMEN 27560 0.65 - 27560 0.65 - -9 Mrs. CIBI MAMMEN 500 0.01 - 500 0.01 - -10 Mrs. RAMANI JOSEPH 2509 0.06 - 2509 0.06 - -11 Mr. KIRAN JOSEPH 2100 0.05 - 2100 0.05 - -12 Mr. JOSEPH K S 905 0.02 - 905 0.02 - -13 Mrs. ANNU KURIEN 12640 0.30 - 12640 0.30 - -14 Mrs. MARY KURIEN 10839 0.26 - 10839 0.26 - -15 Mrs. SARAH THOMAS 12664 0.30 - 12664 0.30 - -16 Mrs. ANNAMMA PHILIP 13793 0.33 0.13 12700 0.30 0.13 -0.0317 Mr. MAMMEN PHILIP 13906 0.33 - 11000 0.26 - -0.0718 Mr. PETER PHILIP 2352 0.06 - 2352 0.06 - -19 Mrs. MEERA PHILIP 33627 0.79 - 33627 0.79 - -20 Mr. ADITH POULOSE MAMMEN 1635 0.04 - 1635 0.04 - -21 Ms. RADHIKA MARIA MAMMEN 100 0.00 - 100 0.00 - -22 Mr. ROHAN MATHEW MAMMEN 1635 0.04 - 1635 0.04 - -23 Mrs. THANGAM MAMMEN 5981 0.14 - 5981 0.14 - -24 Mr. CHALAKUZHY POULOSE MAMMEN 1030 0.02 - 1030 0.02 - -25 Mr. PHILIP MATHEW 11762 0.28 - 11762 0.28 - -26 Mrs. BINA MATHEW 1568 0.04 - 1568 0.04 - -27 Mr. AMIT MATHEW 4520 0.11 - 4520 0.11 - -28 Mr. RIYAD MATHEW 4520 0.11 - 4520 0.11 - -29 Ms. SHREYA JOSEPH 5120 0.12 - 5120 0.12 - -30 Mr. MAMMEN MATHEW 11015 0.26 - 11015 0.26 - -31 Mrs. PREMA MAMMEN MATHEW 10881 0.26 - 10881 0.26 - -32 Mr. JAYANT MAMMEN MATHEW 2190 0.05 - 2190 0.05 - -33 Ms. MARIAM MAMMEN MATHEW 100 0.00 - 100 0.00 - -34 Mr. JACOB MATHEW 20977 0.49 - 20977 0.49 - -35 Mrs. AMMU MATHEW 2650 0.06 - 2650 0.06 - -36 Mr. HARSHA MATHEW 1250 0.03 - 1250 0.03 - -37 Ms. MALINI MATHEW 1800 0.04 - 1800 0.04 - -38 COMPREHENSIVE INVESTMENT AND FINANCE COMPANY PVT. LTD. 438414 10.34 - 438914 10.35 - 0.0139 PENINSULAR INVESTMENTS PRIVATE LIMITED 123497 2.91 - 123497 2.91 - -40 Mr. MAMMEN EAPEN 4128 0.10 - 4128 0.10 - -41 Mrs. OMANA MAMMEN 4703 0.11 - 4703 0.11 - -42 Ms. SHILPA MAMMEN 4660 0.11 - 4410 0.10 - -0.0143 Ms. SHIRIN MAMMEN 5900 0.14 - 5900 0.14 - -44 Mrs. SARA LUKOSE 4168 0.10 - 4168 0.10 - -45 Mrs. GEETHA ZACHARIAH 4029 0.09 - 4029 0.09 - -46 Mrs. MEERA NINAN 4081 0.10 - 4081 0.10 - -47 Mrs. SUSY THOMAS 5278 0.12 - 5278 0.12 - -48 Ms. ANNA THOMAS CHACKO 2541 0.06 - 1291 0.03 - -0.0349 Mr. MAMMEN VARGHESE 14700 0.35 - 0 0.00 - -0.3550 Mrs. ASWATHY VARGHESE 6150 0.15 - 9450 0.22 - 0.0751 Ms. ROSHIN VARGHESE 3779 0.09 - 6679 0.16 - 0.0752 Mrs. SUSAN KURIAN 7450 0.18 - 10350 0.24 - 0.0653 Ms. HANNAH KURIAN 600 0.01 - 600 0.01 - -54 Mrs. TARA JOSEPH 100 0.00 - 2800 0.07 - 0.0755 Ms. REBECCA JOSEPH 350 0.01 - 350 0.01 - -
28
Sl. No.
Shareholder’s Name Shareholding as on 01-0 -201 Shareholding as on 31-03-2017 % change in shareholding during
the financial year ended 31 03 2017
No. of shares % of total shares of the Company
% of shares pledged/ encumbered to total
shares
No. of shares % of total shares of the Company
% of shares pledged/ encumbered to total
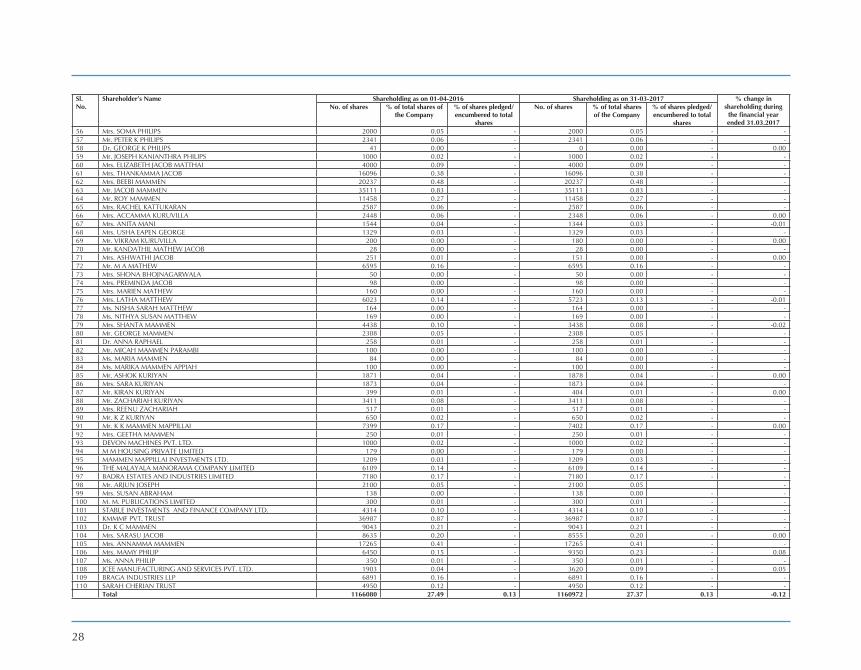
shares56 Mrs. SOMA PHILIPS 2000 0.05 - 2000 0.05 - -57 Mr. PETER K PHILIPS 2341 0.06 - 2341 0.06 - -58 Dr. GEORGE K PHILIPS 41 0.00 - 0 0.00 - 0.0059 Mr. JOSEPH KANIANTHRA PHILIPS 1000 0.02 - 1000 0.02 - -60 Mrs. ELIZABETH JACOB MATTHAI 4000 0.09 - 4000 0.09 - -61 Mrs. THANKAMMA JACOB 16096 0.38 - 16096 0.38 - -62 Mrs. BEEBI MAMMEN 20237 0.48 - 20237 0.48 - -63 Mr. JACOB MAMMEN 35111 0.83 - 35111 0.83 - -64 Mr. ROY MAMMEN 11458 0.27 - 11458 0.27 - -65 Mrs. RACHEL KATTUKARAN 2587 0.06 - 2587 0.06 - -66 Mrs. ACCAMMA KURUVILLA 2448 0.06 - 2348 0.06 - 0.0067 Mrs. ANITA MANI 1544 0.04 - 1344 0.03 - -0.0168 Mrs. USHA EAPEN GEORGE 1329 0.03 - 1329 0.03 - -69 Mr. VIKRAM KURUVILLA 200 0.00 - 180 0.00 - 0.0070 Mr. KANDATHIL MATHEW JACOB 28 0.00 - 28 0.00 - -71 Mrs. ASHWATHI JACOB 251 0.01 - 151 0.00 - 0.0072 Mr. M A MATHEW 6595 0.16 - 6595 0.16 - -73 Mrs. SHONA BHOJNAGARWALA 50 0.00 - 50 0.00 - -74 Mrs. PREMINDA JACOB 98 0.00 - 98 0.00 - -75 Mrs. MARIEN MATHEW 160 0.00 - 160 0.00 - -76 Mrs. LATHA MATTHEW 6023 0.14 - 5723 0.13 - -0.0177 Ms. NISHA SARAH MATTHEW 164 0.00 - 164 0.00 - -78 Ms. NITHYA SUSAN MATTHEW 169 0.00 - 169 0.00 - -79 Mrs. SHANTA MAMMEN 4438 0.10 - 3438 0.08 - -0.0280 Mr. GEORGE MAMMEN 2308 0.05 - 2308 0.05 - -81 Dr. ANNA RAPHAEL 258 0.01 - 258 0.01 - -82 Mr. MICAH MAMMEN PARAMBI 100 0.00 - 100 0.00 - -83 Ms. MARIA MAMMEN 84 0.00 - 84 0.00 - -84 Ms. MARIKA MAMMEN APPIAH 100 0.00 - 100 0.00 - -85 Mr. ASHOK KURIYAN 1871 0.04 - 1878 0.04 - 0.0086 Mrs. SARA KURIYAN 1873 0.04 - 1873 0.04 - -87 Mr. KIRAN KURIYAN 399 0.01 - 404 0.01 - 0.0088 Mr. ZACHARIAH KURIYAN 3411 0.08 - 3411 0.08 - -89 Mrs. REENU ZACHARIAH 517 0.01 - 517 0.01 - -90 Mr. K Z KURIYAN 650 0.02 - 650 0.02 - -91 Mr. K K MAMMEN MAPPILLAI 7399 0.17 - 7402 0.17 - 0.0092 Mrs. GEETHA MAMMEN 250 0.01 - 250 0.01 - -93 DEVON MACHINES PVT. LTD. 1000 0.02 - 1000 0.02 - -94 M M HOUSING PRIVATE LIMITED 179 0.00 - 179 0.00 - -95 MAMMEN MAPPILLAI INVESTMENTS LTD. 1209 0.03 - 1209 0.03 - -96 THE MALAYALA MANORAMA COMPANY LIMITED 6109 0.14 - 6109 0.14 - -97 BADRA ESTATES AND INDUSTRIES LIMITED 7180 0.17 - 7180 0.17 - -98 Mr. ARJUN JOSEPH 2100 0.05 - 2100 0.05 -99 Mrs. SUSAN ABRAHAM 138 0.00 - 138 0.00 - -100 M. M. PUBLICATIONS LIMITED 300 0.01 - 300 0.01 - -101 STABLE INVESTMENTS AND FINANCE COMPANY LTD. 4314 0.10 - 4314 0.10 - -102 KMMMF PVT. TRUST 36987 0.87 - 36987 0.87 - -103 Dr. K C MAMMEN 9043 0.21 - 9043 0.21 - -104 Mrs. SARASU JACOB 8635 0.20 - 8555 0.20 - 0.00105 Mrs. ANNAMMA MAMMEN 17265 0.41 - 17265 0.41 - -106 Mrs. MAMY PHILIP 6450 0.15 - 9350 0.23 - 0.08107 Ms. ANNA PHILIP 350 0.01 - 350 0.01 - -108 JCEE MANUFACTURING AND SERVICES PVT. LTD. 1903 0.04 - 3620 0.09 - 0.05109 BRAGA INDUSTRIES LLP 6891 0.16 - 6891 0.16 - -110 SARAH CHERIAN TRUST 4950 0.12 - 4950 0.12 - -
Total 11 0 0 27 0 13 11 0 72 27 37 0 13 -0 12

29
(iii) Change in Promoters’ ShareholdingSl. No.
Name of the Shareholder Shareholding as on 01-0 -201 Increase/Decrease in Shareholding
Cumulative Shareholding during the financial year ended 31-03-2017No. of Shares % of total Shares of the Company No. of Shares % of total Shares of the Company
1 Mrs. ACCAMMA KURUVILLA 2448 0.06 - - -Date wise increase / decrease with reason 27.09.2016 - TRANSFER - - -100 2348 0.06
2 Mrs. ANITA MANI 1544 0.04 - - -Date wise increase / decrease with reason03.10.2016 - TRANSFER - - -200 1344 0.03
3 Ms. ANNA THOMAS CHACKO 2541 0.06 - - -Date wise increase / decrease with reason16.01.2017 - TRANSFER - - -1250 1291 0.03
4 Mrs. ANNAMMA PHILIP 13793 0.33 - - -Date wise increase / decrease with reason06.03.2017 - TRANSFER - - -479 13314 0.3110.03.2017- TRANSFER - - -214 13100 0.3114.03. 2017 - TRANSFER - - -200 12900 0.3021.03. 2017 - TRANSFER - - -200 12700 0.30
5 Mrs. ASHWATHI JACOB 251 0.00Date wise increase / decrease with reason23.02.2017 - TRANSFER - - -100 151 -
6 Mrs. ASWATHY VARGHESE 6150 0.15 - - -Date wise increase / decrease with reason01.06.2016 - GIFT - - 3300 9450 0.22
7 COMPREHENSIVE INVESTMENT AND FINANCE COMPANY PVT. LTD. 438414 10.34 - - -Date wise increase / decrease with reason26.12.2016 - TRANSFER - - 176 438590 10.3427.12.2016 - TRANSFER - - 324 438914 10.35
8 Dr GEORGE K PHILIPS 41 0.00 - - -Date wise increase / decrease with reason29.08.2016 - TRANSFER - - -41 0 -
9 JCEE MANUFACTURING AND SERVICES PVT. LTD. 1903 0.04 - - -Date wise increase / decrease with reason04.10.2016 - TRANSFER - - 500 2403 0.0618.11.2016 - TRANSFER - - 217 2620 0.0621.11.2016 - TRANSFER - - 1000 3620 0.09
10 Mrs.LATHA MATTHEW 6023 0.14 - - -Date wise increase / decrease with reason 07.10.2016 - TRANSFER - - -300 5723 0.13
11 Mr.MAMMEN PHILIP 13906 0.33 - - -Date wise increase / decrease with reason 14.03.2017 - TRANSFER - - -694 13212 0.1315.03.2017- TRANSFER - - -512 12700 0.3021.03.2017- TRANSFER - - -200 12500 0.2922.03.2017- TRANSFER - - -50 12450 0.2923.03.2017- TRANSFER - - -375 12075 0.2824.03.2017- TRANSFER - - -50 12025 0.2827.03.2017- TRANSFER - - -175 11850 0.2829.03.2017- TRANSFER - - -375 11475 0.2730.03.2017- TRANSFER - - -475 11000 0.26

30
Sl. No.
Name of the Shareholder Shareholding as on 01-0 -201 Increase/Decrease in Shareholding
Cumulative Shareholding during the financial year ended 31-03-2017No. of Shares % of total Shares of the Company No. of Shares % of total Shares of the Company
12 Mr.MAMMEN VARGHESE 14700 0.35 - - -Date wise increase / decrease with reason01.06.2016- GIFT - - -3300 11400 0.2706.06.2016 - GIFT - - -2700 8700 0.2111.06.2016 - GIFT - - -2900 5800 0.1422.06.2016 - GIFT - - -2900 2900 0.0728.06.2016 - GIFT - - -2900 0 0.00
13 Mrs.MAMY PHILIP 6450 0.15 - - -Date wise increase / decrease with reason22.06.2016- GIFT - - 2900 9350 0.23
14 Ms. ROSHIN VARGHESE 3779 0.09 Date wise increase / decrease with reason 11.06.2016 - GIFT - - 2900 6679 0.16
15 Mrs.SARASU JACOB 8635 0.20 - - -Date wise increase / decrease with reason26.09. 2016 - TRANSFER - - -80 8555 0.20
16 Mrs.SHANTA MAMMEN 4438 0.10Date wise increase / decrease with reason 04.03.2017 - GIFT - - 1000 3438 0.08
17 Ms.SHILPA MAMMEN 4660 0.11 - - -Date wise increase / decrease with reason 11.11.2016 - TRANSFER - - -250 4410 0.10
18 Mrs.SUSAN KURIAN 7450 0.18 - - -Date wise increase / decrease with reason28.06.2016- GIFT - - 2900 10350 0.24
19 Mrs.TARA JOSEPH 100 0.00Date wise increase / decrease with reason06.06.2016- GIFT - - 2700 2800 0.07
20 Mr. VIKRAM KURUVILLA 200 0.00 - - -Date wise increase / decrease with reason20.01.2017- TRANSFER - - 10 190 0.0017.03.2017- TRANSFER 10 180 0.00
21 Mr.ASHOK KURIYAN 1871 0.04Date wise increase / decrease with reason 10.02.2017 to 24.03.2017 - TRANSFER 7 1878 0.04
22 Mr.KIRAN KURIYAN 399 0.01Date wise increase / decrease with reason10.02.2017 to 10.03.2017- TRANSFER 5 404 0.01
23 Mr.MAMMEN MAPPILLAI 7399 0.17Date wise increase / decrease with reason10.03.2017 to 31.03.2017 - TRANSFER 3 7402 0.17
Note: Except for the above, there is no change in the holding of the Promoters during the financial year ended 31.03.2017.

31
(iv) Shareholding Pattern of top ten Shareholders (other than Direcors, Promoters & Holders of GDRs & ADRs)
Sl. No
For each of the top 10 shareholders Shareholding as on 01-0 -201
Cumulative Shareholding during the financial year ended 31-03-2017
No.of shares % of total shares of the company
No of shares % of total shares of the company
1 Birla Sun Life Trustee Company Private Limited 57258 1.35 - -Transaction [Transfers] from 01.04.2016 to 31.03.2017 -13842 -0.33 43416 1.02As on 31.03.2017 - - 43416 1.02
2 Enam Securities Pvt Ltd 222487 5.25 - -Transaction [Transfers] from 01.04.2016 to 31.03.2017 -23497 -0.55 198990 4.70As on 31.03.2017 - - 198990 4.70
3 Goldman SACHS 5741 0.13 - -Transaction [Transfers] from 01.04.2016 to 31.03.2017 36422 0.86 42163 0.99As on 31.03.2017 - - 42163 0.99
4 HDFC Trustee Company Limited 46900 1.11 - -Transaction [Transfers] from 01.04.2016 to 31.03.2017 3340 0.08 50240 1.19As on 31.03.2017 - - 50240 1.19
5 ACADIAN EMERGING MARKETS 70372 1.66 - -Transaction [Transfers] from 01.04.2016 to 31.03.2017 2361 0.05 72733 1.71As on 31.03.2017 - - 72733 1.71
6 MOWI [P] Limited 507984 11.98 - -Transaction [Transfers] from 01.04.2016 to 31.03.2017 - - - -As on 31.03.2017 - - 507984 11.98
7 MSWF [P] Limited 126855 2.99 - -Transaction [Transfers] from 01.04.2016 to 31.03.2017 - - - -As on 31.03.2017 - - 126855 2.99
8 New India Assurance Co. Ltd 94157 2.22 - -Transaction [Transfers] from 01.04.2016 to 31.03.2017 -3300 -0.08 90857 2.14As on 31.03.2017 - - 90857 2.14
9 General Insurance Corporation of India 42200 1.00 - -Transaction [Transfers] from 01.04.2016 to 31.03.2017 - - 42200 1.00As on 31.03.2017 - - 42200 1.00
10 Unit Trust of India 89412 2.11 - -Transaction [Transfers] from 01.04.2016 to 31.03.2017 -9884 -0.23 79528 1.88As on 31.03.2017 - - 79528 1.88
Notes:1. The shares of the Company are traded on daily basis. Hence the date wise increase/decrease in the shareholding of the above shareholders is consolidated
based on the Permanent Account Number [PAN] of the shareholder. In case of mutual funds, all the sub-accounts have been consolidated on PAN basis.2. Top ten shareholders is as on 31.03.2017.

32
(v) Shareholding of Directors & Key Managerial PersonnelSl. No.
For each of the Directors & KMP Shareholding as on 01-0 -201
Increase/ Decrease in shareholding
Cumulative Shareholding during the financial year ended 31-03-2017
No. of Shares % of total Shares of the Company
No. of Shares % of total Shares of the Company
1 Mr. K M MAMMEN 16048 0.38 - - -Date wise increase / decrease with reason - - - 16048 0.38
2 Mr. ARUN MAMMEN 27560 0.65 - - -Date wise increase / decrease with reason - - - 27560 0.65
3 Mr. RAHUL MAMMEN MAPPILLAI 4538 0.11 - - -Date wise increase / decrease with reason - - - 4538 0.11
4 Dr. K C MAMMEN 9043 0.21 - - -Date wise increase / decrease with reason - - - 9043 0.21
5 Mr. ASHOK JACOB 1856 0.04 - - -Date wise increase / decrease with reason - - - 1856 0.04
6 Mr. V SRIDHAR - - - - -Date wise increase / decrease with reason - - - - -
7 Mr. VIJAY R KIRLOSKAR 355 0.01 - - -Date wise increase / decrease with reason - - - 355 0.01
8 Mr. N KUMAR 928 0.02 - - -Date wise increase / decrease with reason - - -12.01.2017- TRANSFER - - -450 478 0.0113.01.2017 - TRANSFER - - -478 - 0.00
9 Mr. RANJIT I JESUDASAN - - - - -Date wise increase / decrease with reason - - - - -
10 Dr. SALIM JOSEPH THOMAS - - - - -Date wise increase / decrease with reason - - - - -
11 Mr. JACOB KURIAN 123 0.00 - - -Date wise increase / decrease with reason - - - 123 0.00
12 Mr. M MEYYAPPAN 20 0.00 - - -Date wise increase / decrease with reason - - - 20 -
13 Dr [Mrs.] CIBI MAMMEN 500 0.01 - - 0.00Date wise increase / decrease with reason - - - 500 0.01
14 Mrs. AMBIKA MAMMEN 2489 0.06 - - -Date wise increase / decrease with reason - - - 2489 0.06
15 Mr. RAVI MANNATH - - - - -Date wise increase / decrease with reason - - - - -
16 Mr. MADHU P NAINAN 4 0.00 - - -Date wise increase / decrease with reason - - - 4 0.00

33
V INDEBTEDNESS Indebtedness of the Company including interest outstanding/accrued but not due for payment ` in Crores
Secured Loans excluding deposits
Unsecured Loans
Deposits Total Indebtedness
Indebtedness at the beginning of the financial year (as on 01.04.2016)i) Principal Amount 1126.22 933.35 7.18 2066.75ii) Interest due but not paid - - - -iii) Interest accrued but not due 49.35 21.78 0.14 71.27Total (i ii iii) 1175.57 955.13 7.32 2138.02Change in Indebtedness during the financial year - Principal OnlyAdditions 84.91 - - 84.91Reduction (55.93) (21.71) (1.97) (79.61)Net Change 28.98 (21.71) (1.97) 5.30Indebtedness at the end of the financial year (as on 31.03.2017)i) Principal Amount 1155.20 911.64 5.21 2072.05ii) Interest due but not paid - - - -iii) Interest accrued but not due 46.98 21.36 0.16 68.50Total (i ii iii) 1202.18 933.00 5.37 2140.55
VI REMUNERATION OF DIRECTORS AND KEY MANAGERIAL PERSONNEL
A. Remuneration to Managing Director, Whole-time Directors and/or Manager (In `)
Sl. No.
Particulars of Remuneration Mr K M Mammen (Chairman
& Managing Director)
Mr Arun Mammen (Vice Chairman and Managing
Director)
Mr Rahul Mammen Mappillai
(Managing Director)
Total Amount
1 Gross Salarya) Salary as per Provisions contained in Section 17(1) of the Income
Tax Act, 196188583500 81559010 66928393 237070903
b) Value of Perquisites u/s 17(2) of Income Tax Act, 1961 39667540 7844395 7227668 54739603c) Profits in lieu of Salary under Section 17(3) of Income Tax Act, 1961 - - - -
2 Stock Option - - - -3 Sweat Equity - - - -4 Commission 87300000 79020000 65376000 2316960005 Others Please Specify - - - -
Total 215551040 168423405 139532061 523506506Ceiling as per the Act (` in Crore) ` 184.33 Crore (Being 10% of the net profits of the Company calculated as
per Section 198 of the Companies Act, 2013)

34
B. Remuneration to Other Directors (In `)
C. Remuneration to Key Managerial Personnel other than MD/Manager/WTD (In `)
Sl. No. Particulars of Remuneration
Key Managerial PersonnelMr. Ravi Mannath Mr. Madhu P Nainan Total
Amount(Company Secretary) (Vice President Finance) 1 Gross Salary
a) Salary as per Provisions contained in Section 17(1) of the Income Tax Act, 1961 16279742 12331648 28611390b) Value of Perquisites u/s 17(2) of Income Tax Act, 1961 1859017 900727 2759744c) Profits in lieu of Salary under Section 17(3) of Income Tax Act, 1961 - - -
2 Stock Option - - -3 Sweat Equity - - -4 Commission - - -5 Others - - -Total 18138759 13232375 31371134
VII. Penalties/Punishment/Compounding of OffencesThere were no penalties, punishment or compounding of offence during the financial year ended 31st March, 2017.
Particulars of Remuneration Name of Director Total AmountIndependent Directors Mr. Ashok
JacobMr. V
SridharMr. Vijay R Kirloskar
Mr. N Kumar
Mr. Ranjit I Jesudasen
Dr. Salim Joseph Thomas
Mr. Jacob Kurien
Mr. M Meyyappan
Fees for Attending Board /Committee Meetings
20000 180000 40000 80000 210000 60000 170000 60000 820000
Commission - - - - - - - - -Others - - - - - - - - -Total (1) 20000 180000 40000 80000 210000 60000 170000 60000 820000Other Non-Executive Directors
Dr. K C Mammen
Dr. (Mrs.) Cibi
Mammen
Mrs. Ambika
MammenFees for Attending Board /Committee Meetings
60000 80000 80000 220000
Commission - - - -Others - - - -Total (2) 60000 80000 80000 220000Total (B) (1 2) - - - 1040000Total Managerial Remuneration (A B)
524546506
Ceiling as per the Act Only Sitting fees are being paid to the Directors within the limit prescribed under the Companies Act, 2013.

35
MANAGEMENT DISCUSSION AND ANALYSIS
(Within the limits set by the Company’s competitive position)
Your Company has now entered its fourth decade of leadership in the Indian Tyre Industry and is ranked among the worlds’ top 20 Tyre Manufacturers. The past year saw a range of economic upheavals, both favourable and unfavourable and made the year rather unpredictable. There were unexpected economic reforms, changing socio-political conditions and an uncertain global market. The inexorable trend of globalization now seems to be in retreat as evidenced by unforeseen events such as BREXIT, and the increasingly protectionist economic and nationalist agenda being seen in Europe and North America. The Indian Tyre Industry revenues grew at a very moderate pace both due to the impact of demonetization as well as subdued realisations. Realisations were lower due to relatively weak pricing power in the face of sharp escalation in raw material costs. Despite all this, the Indian economy continued to be a beacon of high growth among the major global markets.
The discussion below summarizes the key issues and challenges that your Company faced in the year ended 31st March, 2017.
Economic & Industry Overview
The year 2016-2017 started off on a very positive note with a normal monsoon, relatively low inflation and a modest budgetary support to drive consumption growth. Anticipation of higher Government spending on infrastructure also boosted growth expectations. GDP growth in 2016-17 was estimated to be around 7.1%. CPI inflation was contained at 4.7% in fiscal 2017 but will be driven by rising global oil and other commodity prices if demand picks up in the future. However, the Union Budget was a prudent one and does tend to cap upside pressures on inflation. This is further entrenched by the fact that the Government achieved the fiscal deficit target of 3.5% of GDP in fiscal 2017 rather easily due to the windfall gains from the Income Declaration Scheme. The outlook on the Rupee is projected to be from stable to strong and the Government’s Tax collection projections seem reasonable despite anticipated short term disruptions in the next fiscal on account of GST implementation.
The demonetization initiative of the Government in November 2016 caused a ripple effect across the business value-chain and the brunt of the impact was felt by sections of the trade and customers in smaller markets. While it is true that substantial lost ground was recovered by end January 2017, but lingering after effects continue to be seen till the end of fiscal 2017 and likely for some more time. However, given the government’s plans
on various fronts plus the growth initiatives unveiled in the last budget, most of the macro-economic parameters are under control. The economy is expected to progress at a steady growth rate and barring unforeseen international developments, continue to hold its stellar position among the major economies with a predicted growth rate of 7.2% plus in fiscal 2018.
The tyre industry is a classic derived demand business and is directly affected by the performance of the automotive manufacturing sector, growth in which, in turn, is clearly a function of the overall growth in the economy. The Indian tyre industry grew by a modest 3.6% and is estimated to be around ` 55,000 Crore in 2016-17. It is dominated largely by the Commercial Vehicle segment consisting of Heavy, Light and Small Commercial Vehicles. The next largest segment is Passenger Vehicles constituted by Cars, Sports Utility Vehicle (SUV), Motorcycles and Scooters. The Farm & Off-The-Road (OTR) segments consisting of the Tractor Front and Rear tyres, Tractor trailers and large tyres for earth moving and other construction and mining related equipment, are the other important segments in the domestic market.
Traditionally tyres are classified as Cross-ply (Bias) and Radial based on the technology deployed in their manufacture. In India, the commercial tyre segment continues to be dominated by cross-ply tyres due to road conditions, loading patterns and the high initial cost of Radials. There is, however, a steady growth in radialisation across segments in recent years with the highest in Passenger Cars (almost 100%) followed by Heavy Commercial Vehicles at 38% and Light Commercial Vehicles at 40% during the year 2016-17.
The tyre industry consists of three distinct markets namely Replacement, Institutional/Original Equipment Manufacturer (OEM) and Exports. By value, Replacement Market accounts for approximately 60% of the Industry with Institutional/OEM and Exports making upto 22% and 18% respectively. While in the Commercial and Farm segments, replacement sales form a major chunk, both Institutional/OEM and Replacement sales play an almost equal role in the Passenger segment. Of the total tyres produced in India, the top eleven tyre companies account for more than 90% of the volume. The tyre industry provides direct and indirect employment to more than a million people, comprising of dealers, re-treaders and truck operators. The trucking transportation business is somewhat scattered and is driven by small operators numbering nearly 2.6 million. This business, has historically transacted in cash and will face difficulties going forward in a digital era with increasing pressure to use alternate, and modern methods of payments viz. in Digital / Cheques / NEFT etc., to reduce cash dependence.

36
The Indian Automotive sector registered a reasonable growth in fiscal 2016-17 on the back of a healthy 10.6% growth in Sales in the Passenger Vehicle Industry. This was creditable as it was achieved despite the uncertainty caused by demonetization, ban on diesel cars in NCR and the changeover in emission norms. This growth in the Passenger cars segment was largely driven by the significant increase in sales of utility vehicles for which there was healthy demand in the new launches segment, while domestic sales of passenger cars rose far more modestly in fiscal 2016-17. The exports sector also continued to be buoyant with a healthy 16.2% increase. The two wheeler industry has bounced back on the back of a good monsoon, invigorated rural market and softening interest rates. Estimates early in the year, expected the segment to hit double digit growth by year end but demand softened in the post demonetization scenario. In the change-over from BS-III to BS-IV, most major players managed the transition process rather well, although there were reports of old inventory being disposed-off with aggressive promotional offers towards the close of the March 2017 quarter. While, the overall two wheeler industry grew between 6-8% in the current fiscal, scooter tyres registered much faster growth at 13% albeit on a lower base, while motorcycle tyres grew at a more modest 4% during the same period. The Small Commercial Vehicles (SCV) category has seen its previously high numbers take a fall over the years which was further hit during the year by the demonetization exercise, as this segment is totally dependent on cash for day-to-day running. However, the SCV segment is expected to grow in the future due to zoning and traffic regulations, creating greater access restrictions in urban areas for the bigger vehicles. The boost provided by the logistics and transport needs of the e-Commerce sector’s growth, will have a spin off and a positive impact on this segment in the near future. Three Wheeler demand for passenger autos will likely remain steady at the previous year’s levels. The Light Commercial vehicle (LCv) segment remained stagnant for most part of the year and there was some effect of demonetization too in the overall sales figures. The trend here was the drop in production, though it is consistent with what has been seen in this segment in recent years. The Heavy Commercial Vehicles (HCV) and Medium Commercial Vehicles (MCV) segment showed signs of a cyclical three year dip till the end of the third quarter, but there was significant upward movement in the fourth quarter which could clearly be attributed to the BS-IV roll-out which had all the major manufacturers scurrying to liquidate their inventory. The tractors & farm equipment industry saw double digit growth in sales volume, despite the effects of demonetization, at a robust 18% over the previous fiscal, driven largely by a good monsoon and a boost to rural incomes. The Earth Moving, Construction and Mining
sector too has revived over the last two fiscals, after a sluggish phase mid decade, on the news of significant investments in the infrastructure sector planned by the government over the next 5 years.The fiscal 2016-17, saw the Industry commissioning ` 11,500 Crore worth of projects and is expected to commission ` 21,000 Crore worth projects over the next 4 years. For the first time in years, the tyre industry witnessed a situation of excess supply when compared to demand and this will almost certainly lead to intense competition in the market with escalating discounts and promotion wars, precisely when the margins in the industry are under significant pressure due to the recent spikes in rubber and oil commodity prices. It is also likely that the headroom for passing on costs to consumers in such a competitive scenario will be increasingly limited putting a very high pressure on industry margins.
Natural Rubber continues to be one of the core raw materials for the Indian tyre industry as against Synthetic Rubber which is the norm in the rest of the world. The high Customs duty on Natural rubber, which makes it one of the highest duty structures on Natural Rubber anywhere in the world, continued to adversely impact the cost structure. Further, the overall availability of natural rubber was also affected by the floods in Thailand in early 2017.
Opportunities and Threats
The Indian tyre Industry grew at a moderate pace during the year but the demonetization exercise had its own impact on different segments, though unevenly. The Passenger car segment did show a short term decline due to negative consumer sentiment in the aftermath of the policy change.
The Passenger Car segment had minimal impact of the BS-III to BS-IV transition as most models were already compliant with the new protocol, while the two wheeler segment suffered adversely along with the LCV and tractor segments, where purchases are largely made on cash and were hence deferred. There was a positive impact on the HCV/ MCV segment, which suddenly saw cheap Chinese tyres disappearing from the market due to the currency shortage negatively impacting the unorganized segment, cash driven imports of Chinese tyres into the country, at least in the short term. Despite this, it is estimated that the overall tyre imports into India is estimated to have grown in revenue terms by 10 to 12% in fiscal 2017. In the medium to longer term, with the united States International Trade Commission’s favorable ruling in the case of Chinese Tyre imports into the US, it is expected that Chinese exports to the US will revive and this will somewhat bring down the imports of cheap tyres into

37
India. On the pricing front, it is expected that with global Natural Rubber (NR) ruling at a premium over domestic NR prices, the price differentials between Indian made tyres and imported tyres will reduce further.
The growth in two wheeler tyres segment is expected to be positive on the back of the buoyant scooter tyres segment which is expected to continue its double digit growth trajectory. It must be noted that the flurry of new entrants in this category is bound to see a slight realignment in terms of absolute numbers/ shares for each player. The passenger vehicles tyres segment is also set to grow with vehicle sales projected at 8.7% growth, in fiscal 2018. This will be driven by the spate of new launches planned by the auto majors especially in the Compact SUV segment that will likely to see double digit growth, anticipated to be as high as 16.5% by some sources. Added to this, the sales to taxi aggregators, a newly emerging segment, has also been a great growth driver in the last year.
All of this will be supported by implementation of the 7th Pay Commission recommendations and its positive impact on disposable income in urban areas, factors like lower borrowing costs and pent up demand after demonetization’s full impact is played out. Higher budgetary allocation for rural areas and the government’s focus on increasing farm based income is also expected to augur well for passenger vehicle demand in the new year. A good Rabi crop is also expected to bolster rural demand.
The introduction of the GST from July 2017 is expected to have an impact on passenger vehicles and cab operators as indeed it will on all other segments of the tyre industry. The opportunity in the Tractors Tyre segment is anticipated to be reasonably good with a 10% growth expected during 2017-18. Even if the predicted monsoon is patchy, it is expected that a resilient farm sector will still do quite well on the back of several attendant reforms and create a new benchmark in the category. With the government’s focus on infrastructure growth backed by huge allocations of funds, building and construction activity has gained momentum with big growth seen in road building and construction equipment manufacturers. This bodes well for the growth of the large OTR tyres segment.
The MCV & HCV production numbers were stagnant during the early part of the year but the last quarter saw a boost driven by the fuel norm transition enforced by the Supreme Court Judgment on BS-III and BS-IV transition. The proposed roll-out of the cap on the age of commercial vehicles, will have a significant impact on the segment’s radialisation drive. The New Motor Vehicles Act is also expected to be passed and if it does, it will have significant impact on over loading of vehicles and how
tyres and vehicles are configured in the industry to meet geographical peculiarities of the logistics business. In the short term, the surge of purchases in the commercial vehicle sector in late 2016-17, largely with a view to avoid price rise on account of the BS-IV implementation, will hamper sales in early fiscal 2018. However, it could have a positive effect on the replacement market later in the year, as those vehicles would have come up for their replacement cycles in due course. Demand may pick up from September 2017, after GST implementation, when there is clarity on vehicle pricing and the expected seamless movement of trucks across the country becomes routine.
A permanent solution for the inverted tax / duty structure on Natural Rubber imports has still not been found, thereby creating a situation which will precipitate to alarming proportions, considering the increasing prices of Natural Rubber. Vigorous representation to the Government on this will need to be pressed continually, as the situation is exacerbated by the cost push inflation likely due to the rising prices of both synthetic rubber and oil and its derivatives.
Segment wise and Product wise Performance
During the financial year 2016-17, your Company achieved a turnover of ` 14,743 Crore as against ` 22,162 Crore for the previous 18 months period ended 31st March 2016. Across the board there was an overall increase in all segments adding up to a 10 % increase in total tyre production. In the Heavy Commercial Vehicle segment, the overall increase was 3% over the previous year while Truck Radial production saw a growth of nearly 11%. Light Commercial Vehicle tyres increased by 11%. Passenger & Sports Utility Vehicle (SUV) segment showed a 5% growth. The two wheeler segment saw your Company outpace the industry with a 12% growth in Motorcycle and a very creditable 22% increase in Scooter tyres. The Farm segment grew at a commendable 5%. The OTR segment also saw a 9% growth.
Exports
The current financial year ended 31st March,2017, saw a tumultuous series of events hit the global scene. The transition in scenario from the previous “Globalized economy” to a likely accelerating trend of “De-globalization” was accentuated with events like BREXIT and protectionist policies proposed and implemented by many countries across the world. Driven by strong growth across product segments, overall export volumes from the country grew by approximately 15% with Agriculture, Construction and Truck and Bus tyres leading the mix. The growth projections in export

38
markets is expected to be around 6 to 8% over the next three years led by the increasing acceptance of Indian tyres in the overseas market.
Through all this, there was buoyant demand for your Company’s commercial tyres and passenger vehicle tyres in the Far-east and Asia Pacific. While import regulations and newly imposed quotas have hampered our drive to increase our global footprint in select countries like Indonesia and the Philippines, certain delays in getting the required mandatory certifications in time, hindered our growth in the Arabian Gulf region. The Chinese tyres continue to play the same low price game which we see in our domestic markets with their cheap tyres, even in the export markets, which results in pushing down prices and squeezing margins. Overall your Company’s exports turnover for the 12 months ended 31st March 2017 stood at ` 1316 Crore as compared to ` 1856 Crore for the previous 18 months period ended 31st March, 2016.
Over the past year, your Company has undertaken several initiatives to stabilize its strong markets and broaden our reach outside India. It is also planned to come out with market specific products and price-solutions to be able to reach out to the end-consumer across geographies in a more concerted fashion.
Discussion on Financial Performance with respect to Operational Performance
` in Crores
April 2016 to March 2017 (12 months)
October 2014 to March 2016
(18 months)Revenue from operations (Gross)Other IncomeTotal IncomeProfit before taxProvision for taxProfit after tax
14743 335
22162 321
15078 22483 2066 615
3606 1132
1451 2474
The revenue from operations of the Company for the year ended 31st March 2017 stood at 14743 Crore against ` 22162 Crore for the previous 18 months period ended 31st March 2016. During the current year ending 31st March 2017, the earnings before interest and depreciation (EBIDTA) amounted to ` 2921 Crore as against ` 4686 Crore in the previous 18
months period ending 31st March, 2016. After providing for depreciation and interest, the profit before tax for the year ended 31st March 2017 is ` 2066 Crore as compared to ` 3606 Crore in the previous 18 months period ended 31st March 2016. After making provision for income tax, the net profit for the year ended 31 March 2017 is ` 1451 Crore, as compared to ` 2474 Crore in the previous 18 months period ended 31st March 2016.
The prices of natural rubber and crude linked derivatives continued to be low in the first three quarters, resulting in lower raw material cost. However, in the last Quarter there was a steep increase in prices of Raw materials.
Outlook
The outlook for the domestic tyre industry looks stable in the short to medium term on the back of favourable demand in both the domestic and export markets. The issue of raw material cost escalation especially of natural rubber is here to stay for some time and will reduce operational margins for a while in the foreseeable future. With good monsoons and investments in the core and infrastructure segments, sectoral growth in the economy is a given and the domino effects of a 7.2% p.a growth of GDP are likely to have many positive benefits for the tyre industry in the short to medium term. The positive sentiment shown by the infrastructure and rural sectors in recent months will definitely have an impact on the demand in the tyre industry, both in the OE and the Replacement markets. However the days of higher industry profit margins are most likely to be behind us and the expected hardening of raw materials prices coupled with excess capacity in the industry will see intensifying competition in the market place. It is therefore critical for your Company to protect its turf in the commercial tyres and the two wheeler segments, which will be under severe pressure in the years ahead.
A mostly normal monsoon is predicted for the new season in 2017-18, and it is believed that this will help the farm sector to show stronger performance in the coming years, with an attendant spike in rural demand that will, hopefully, help drive an all-round recovery in the next fiscal. With the exception of the HCV / MCV segment where certain doubts may remain about key factors playing themselves out fully in the new fiscal year, it is expected that fiscal 2018, will prove to be a better year for the tyre industry in volume terms, while in margin terms, the outlook remains stressed.
Internal Control Systems and their Adequacy
The Company has adequate internal control systems in place, and also has reasonable assurance on authorising, recording and reporting transactions

39
of its operations. The Company has in place well-documented procedures, covering financial and operational functions. The Company through its own Internal Audit department carries out periodical Audits at all locations and functions based on the Plan as approved by the Audit Committee. Some of the salient features of the Internal control systems in vogue are:-(i) A robust ERP system connecting all Plants, Sales Offices and HO. The
systems are constantly reviewed from Internal Control stand point.(ii) Preparation of annual Budget for operations and services and
monitoring the same against the actuals at periodic intervals. (iii) All assets are properly recorded and system put in place to safeguard
against any losses or unauthorized use or disposal.(iv) Periodic physical verification of fixed assets and all Inventories.(v) Observations arising out of the Internal Audit are reviewed at the
Audit Committee meeting and follow up action taken.(vi) Periodic Presentations made to the Audit Committee on various
operations and financial risks faced by the Company and action proposed to mitigate such risks.
Risks and ConcernsAs per Automotive Tyre Manufacturers Association’s (ATMA) report, India’s GDP growth was about 7.1% during the year 2016-17 and GDP growth is expected to be about 7.2% for Financial year 2017 -18. Thus we cannot expect major change in the economy in the coming year. ATMA has also reported about an investments in the order of USD 5.5 Billion (about 36,000 Crs ) in additional capacity creations. This increase in Capacity, coupled with growing Imports may lead to under-utilisation of Capacities in various segments. In the last Quarter of this year, we have witnessed sharp increase in Raw-material prices, and this trend of volatility in the Raw material prices could continue in future. Due to Competitive pressures, coupled with Cheaper imported Tyre, under–utilisation of Capacities, the price increase in Raw material could not be fully passed on to Customers immediately.
Human ResourcesYour Company continues its thrust and focus on human resources as it believes it is the catalyst for its continued success. Your Company’s people have helped to meet the daunting challenges of its business, by providing quality products to the customers across the length and breadth of the country as well as overseas.
In order to provide depth to the talent pool and help the Company face the challenges of the future, the focus has been to hire, retain and develop its existing talent pool and attract the best available talent. As a part of the talent strategy and process, acquisition of top talent from premier institutes to build a leadership talent tool remains a key focus area. This talent pool would be responsible to drive growth for your Company in the coming future. The Company continues to invest significantly in developing the research and development and sales & marketing talent pool which drives its product and market leadership.The talent management strategy is in tune with the Company’s growth needs and the Company focuses intensively on developing internal resources for critical positions with need based recruitment for specific lateral positions. The employee development philosophy is aligned with the Company’s mission to drive leadership in technology & excellence in manufacturing. All the training programs are need based. Each program is designed and tailor made as per the Company’s specific requirement. Training effectiveness measurement is an integral part of the learning and development strategy. Your Company has introduced e-learning as part of its learning & development road map.The Company continued imparting teambuilding and collaboration training to its workmen to enhance the team cohesiveness. Leadership training for union leaders and opinion makers also continued through the year, thereby keeping with its commitment of shaping the future of its plantsThe total employee strength as on 31st March, 2017 was 15,774.The Company maintained cordial and harmonious industrial relations in all its manufacturing units. Several HR and industrial relations initiatives implemented by the Company have significantly helped in improving the work culture, enhancing productivity and enriching the quality of life of the workforce and maintaining your Company’s supremacy in the market. Cautionary StatementStatements in the Management Discussion and Analysis describing the Company’s objectives, expectations or forecast may be forward looking within the meaning of applicable laws and regulations. Actual results may differ materially from those expressed in the statement. Important factors that could influence the Company’s operations include global and domestic supply and demand conditions affecting selling prices of finished goods, input availability and prices, changes in government regulations, tax laws, economic developments within the country and other factors such as litigation and industrial relations.

40
REPORT ON CORPORATE GOVERNANCE
1. Company’s Philosophy on Code of Governance
Your Company has always adhered to good corporate governance practices and maintained the highest levels of fairness, transparency, accountability, ethics and values in all facets of its operations.Your Company’s Corporate Governance practices emanate from its commitment towards accountability, transparency and fairness. Timely and accurate disclosure on all material matters including the financial situation, performance and regulatory requirements, is an important facet of the corporate governance philosophy.Your Company believes that good corporate governance is essential for achieving long-term corporate goals of the Company and for meeting the needs and aspirations of its stakeholders, including shareholders.
2. Board of Directors
(a) Composition of the Board: The Board comprises of 14 Directors which includes a
Chairman & Managing Director, a Vice Chairman and Managing Director, a Managing Director, 3 Non-Executive Directors and 8 Independent Directors. None of the Directors on the Board is a member of more than 10 committees or act as Chairman of more than 5 committees across all Listed Companies and Unlisted Public Limited Companies in which he/she is a Director.
(b) Attendance of Directors at Board Meetings during the financial year ended 31 03 2017 and at the last Annual General Meeting, outside directorships and board committee memberships and number of shares held as on 31 03 2017:
Name Category No. of Directorships
in other Public Ltd Companies
No. of Board Meetings attended during the financial
year ended31 03 2017
No. of Committee Memberships
in other Public Limited
Companies
Attended last AGM held on
11 0 201
No. of Shares held
Mr. K M Mammen Chairman & Managing Director
Promoter Executive Director
4 4 Nil Yes 16048
Mr. Arun Mammen*Vice Chairman and Managing Director
Promoter Executive Director
3 4 1 – Chairman Yes 27560
Mr. Rahul MammenMappillai# Managing Director
Promoter Executive Director
Nil 3 Nil Yes 4538
Dr. K C Mammen Promoter Non- Executive
Director
3 3 Nil Yes 9043
Mr. Ashok Jacob IndependentDirector
Nil 1 Nil Yes 1856
Mr. V Sridhar IndependentDirector
Nil 4 Nil Yes Nil
Mr. Vijay RKirloskar
IndependentDirector
4 2 1 Yes 355
Mr. N Kumar IndependentDirector
8 4 4 – Chairman2 – Member
No Nil
Mr. Ranjit I Jesudasen
IndependentDirector
Nil 4 Nil Yes Nil
Dr. Salim JosephThomas
IndependentDirector
Nil 3 Nil Yes Nil
Mr. Jacob Kurian IndependentDirector
Nil 4 Nil Yes 123
Mr. M Meyyappan IndependentDirector
Nil 3 Nil Yes 20
Dr. (Mrs.) CibiMammen
Promoter Non- Executive
Director
2 4 Nil Yes 500
Mrs. AmbikaMammen
Promoter Non- Executive
Director
2 4 Nil Yes 2489
* Appointed as Vice Chairman of the Company and consequently re-designated as Vice Chairman and Managing Director of the Company w.e.f. 04.05.2017.
# Appointed as Manging Director of the Company w.e.f. 04.05.2017.
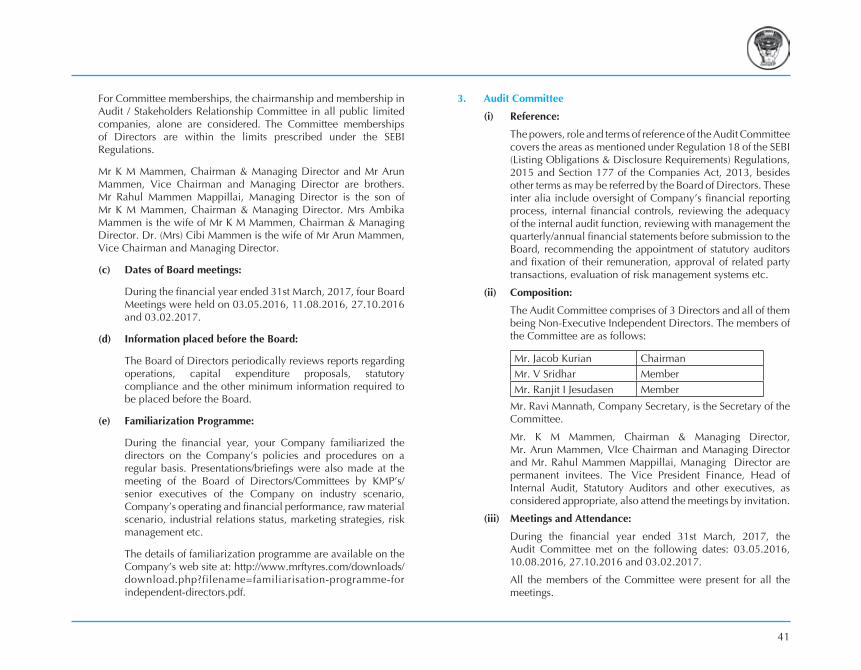
41
For Committee memberships, the chairmanship and membership in Audit / Stakeholders Relationship Committee in all public limited companies, alone are considered. The Committee memberships of Directors are within the limits prescribed under the SEBI Regulations.
Mr K M Mammen, Chairman & Managing Director and Mr Arun Mammen, Vice Chairman and Managing Director are brothers. Mr Rahul Mammen Mappillai, Managing Director is the son of Mr K M Mammen, Chairman & Managing Director. Mrs Ambika Mammen is the wife of Mr K M Mammen, Chairman & Managing Director. Dr. (Mrs) Cibi Mammen is the wife of Mr Arun Mammen, Vice Chairman and Managing Director.
(c) Dates of Board meetings:
During the financial year ended 31st March, 2017, four Board Meetings were held on 03.05.2016, 11.08.2016, 27.10.2016 and 03.02.2017.
(d) Information placed before the Board:
The Board of Directors periodically reviews reports regarding operations, capital expenditure proposals, statutory compliance and the other minimum information required to be placed before the Board.
(e) Familiarization Programme:
During the financial year, your Company familiarized the directors on the Company’s policies and procedures on a regular basis. Presentations/briefings were also made at the meeting of the Board of Directors/Committees by KMP’s/senior executives of the Company on industry scenario, Company’s operating and financial performance, raw material scenario, industrial relations status, marketing strategies, risk management etc.
The details of familiarization programme are available on the Company’s web site at: http://www.mrftyres.com/downloads/download.php filename familiarisation-programme-for independent-directors.pdf.
3. Audit Committee
(i) Reference:
The powers, role and terms of reference of the Audit Committee covers the areas as mentioned under Regulation 18 of the SEBI (Listing Obligations & Disclosure Requirements) Regulations, 2015 and Section 177 of the Companies Act, 2013, besides other terms as may be referred by the Board of Directors. These inter alia include oversight of Company’s financial reporting process, internal financial controls, reviewing the adequacy of the internal audit function, reviewing with management the quarterly/annual financial statements before submission to the Board, recommending the appointment of statutory auditors and fixation of their remuneration, approval of related party transactions, evaluation of risk management systems etc.
(ii) Composition:
The Audit Committee comprises of 3 Directors and all of them being Non-Executive Independent Directors. The members of the Committee are as follows:
Mr. Jacob Kurian ChairmanMr. V Sridhar MemberMr. Ranjit I Jesudasen Member
Mr. Ravi Mannath, Company Secretary, is the Secretary of the Committee.
Mr. K M Mammen, Chairman & Managing Director, Mr. Arun Mammen, VIce Chairman and Managing Director and Mr. Rahul Mammen Mappillai, Managing Director are permanent invitees. The Vice President Finance, Head of Internal Audit, Statutory Auditors and other executives, as considered appropriate, also attend the meetings by invitation.
(iii) Meetings and Attendance:
During the financial year ended 31st March, 2017, the Audit Committee met on the following dates: 03.05.2016, 10.08.2016, 27.10.2016 and 03.02.2017.
All the members of the Committee were present for all the meetings.

42
Nomination and emuneration Committee
(i) Reference:
In accordance with Section 178 of the Companies Act, 2013 and Regulation 19 of the SEBI (Listing Obligations & Disclosure Requirements) Regulations, 2015, the terms of reference of the Committee include the following namely formulation of criteria for determining qualifications, positive attributes and independence of director, recommending to the Board a policy relating to remuneration of directors, key managerial personnel and other employees, formulation of criteria for evaluation of directors performance, devising a policy on Board diversity, identifying persons who are qualified to become directors and who may be appointed in senior management positions in accordance with the criteria laid down and recommend to the Board their appointment and removal.
(ii) Composition:
The Committee comprises of 3 Non-Executive Independent Directors and an Executive Director. The Chairman is a Non- Executive Independent Director. The Committee comprises of:
Mr. Ranjit I Jesudasen ChairmanMr. V Sridhar MemberMr. Jacob Kurian MemberMr. K M Mammen Member
Mr. Ravi Mannath, Company Secretary, is the Secretary of the Committee.
(iii) Meetings and Attendance:
During the financial year ended 31st March, 2017, the Committee met on 03.05.2016. All the members of the Committee were present for the meeting.
Criteria for determining the qualifications, positive attributes and Independence of a Director
Candidates for the position of a Director, shall be a person of integrity and possesses requisite education, experience and
capability to make a significant contribution to the deliberations of the Board of Directors. Apart from the above, the Board candidate should be of the highest moral and ethical character. The candidate must exhibit independence, objectivity and be capable of serving as a representative of the stakeholder. The candidate should have the personal qualities to be able to make an active contribution to Board deliberations. These qualities include intelligence, inter-personal skills, independence, communication skills and commitment. The Board candidate should not have any subsisting relationships with any organization which is a competitor to the Company. The Board candidate should be able to develop a good working relationship with other Board members. This apart, the Directors must satisfy the qualification requirements laid down under the Companies Act, 2013, the SEBI Listing Regulations and any other applicable law and in case of Independent Directors, the criteria of independence as laid down in those laws.
Performance evaluation of Independent Directors
The criteria for evaluation of the Independent Directors will be attendance, participation in deliberations, understanding the Company’s business and that of the industry and guiding the Company in decisions affecting the business and additionally based on the roles and responsibilities as specified in Schedule Iv of the Companies Act, 2013.
The Board carried out evaluation of the performance of the Independent Directors on the basis of the criteria laid down. The evaluation was done by the Board of Directors except the Director who was evaluated.
7 emuneration of Directors
a. Remuneration Policy:
A Policy on remuneration of Directors, Key Managerial Personnel (“KMP”) and Senior Management and other staff was put in place by Nomination and Remuneration Committee on 23.07.2014 and approved by the Board of Directors at its meeting held on 30.10.2014.

43
The Policy provides as follows :
(i) Non-Executive Directors:
The Non-Executive Directors (including Independent Directors) may be paid remuneration by way of sitting fees for attending meetings of Board or Committee thereof.
The Directors may also be reimbursed any expenses in connection with attending the meetings of the Board or Committee or in connection with the business of the Company.
The quantum of fees shall be determined, from time to time, by the Board subject to ceiling / limits as provided under Companies Act, 2013 and rules made thereunder.
(ii) Chairman & Managing Director, Managing Director(s) / Whole-time Director(s):
The level and composition of remuneration will be reasonable and sufficient to attract, retain and motivate directors of the quality to run the Company successfully. The remuneration package should adequately compensate them for the high level of responsibilities shouldered by them and sensitivity of the position held. The level of remuneration shall take into consideration the professional expertise, past credentials and potential of the person concerned. The compensation package may comprise of a fixed compensation package in the nature of monthly and annual payout, provision of perquisites, contribution to retirement benefits, health and insurance and any other benefits (including provision of loans on such terms as to interest, repayment and security as determined by the Board) and commission on profits, in such proportion and quantum as decided from time to time based on the Company’s business needs and requirements and prevailing practices in industry.
Besides the above, the remuneration to be paid to Chairman & Managing Director, Managing Director(s) and Whole-time Director(s) shall be governed by the
provisions of the Companies Act, 2013 and rules made thereunder or any other enactment for the time being in force.
(iii) KMP’s (other than MD’s and WD’s), Senior Management Personnel and other Staff:
The level and composition of remuneration will be reasonable and sufficient to attract, retain and motivate persons of the quality required to handle appropriate management roles in the Company successfully. The level of remuneration may be based on the qualification, experience and expertise and potential of the person concerned and also the responsibilities to be shouldered, criticality of the job to the Company’s business and any other criteria as considered appropriate. The compensation package may comprise of a fixed compensation package in the nature of monthly and annual payout, provision of perquisites, contribution to retirement benefits, health and insurance and any other benefits (including provision of loans on such terms as to interest, repayment and security as determined by the Board) and variable pay (having a clear relationship to performance which will meet appropriate benchmarks relevant to the working of the Company and its goals), in such proportion and quantum as decided from time to time based on the Company’s business needs and requirements and prevailing practices in industry.
(iv) Directors and Officers’ Insurance:
Where any insurance is taken by the Company on behalf of its Directors, KMP’s / Senior Management Personnel, Staff etc., for indemnifying them against any liability, the premium paid on such insurance shall not be treated as part of the remuneration payable to any such personnel.
b Details of emuneration to all the Directors for the financial year ended 31 03 2017:
(i) The aggregate value of salary and perquisites and commission paid to the Chairman and Managing

44
Director/Vice Chairman and Managing Dirrector and Managing Director for the financial year ended 31.03.2017 are as follows:
(a) Name (b) Designation (c) Salary and perquisites (`) (d) Commission (`) (e) Total (`)
(a) Mr. K M Mammen (b) Chairman & Managing Director (c) 128251040 (d) 87300000 (e) 215551040 (a) Mr Arun Mammen (b) Vice Chairman and Managing Director (c) 89403405 (d) 79020000 (e) 168423405 (a) Mr Rahul Mammen Mappillai (b) Managing Director (c) 74156061 (d) 65376000 (e) 139532061.
Note: Salary and perquisites include all elements of remuneration i.e., salary, allowances and benefits. The Company has not issued any stock options to any of the directors. The Chairman and Managing Director/ Vice Chairman and Managing Director/ Managing Director are appointed by shareholders for a period of five years at a time.
(ii) The sitting fees paid for the financial year ended 31.03.2017 to Non-Executive Directors are as follows:
(a) Name (b) Sitting fees (`)
(a) Dr. K C Mammen (b) 60000; (a) Mr Ashok Jacob (b) 20000; (a) Mr V Sridhar (b) 180000; (a) Mr Vijay R Kirloskar (b) 40000; (a) Mr N Kumar (b) 80000; (a) Mr Ranjit I Jesudasen (b) 210000; (a) Dr. Salim Joseph Thomas (b) 60000; (a) Mr Jacob Kurian (b) 170000; (a) Mr M Meyyappan (b) 60000; (a) Dr. (Mrs) Cibi Mammen (b) 80000; (a) Mrs Ambika Mammen (b) 80000.
Sitting fees are paid to Non-Executive Directors within the limits prescribed under the Companies Act, 2013.
There were no material pecuniary relationships or transactions by Non-Executive Directors vis-à-vis the Company as per the materiality threshold laid down in SEBI (Listing Obligations and Disclosure Requirements) Regulations, 2015 and also as per the Policy on
Materiality of Related Party Transactions framed pursuant to the said Regulations.
Sta eholders elationship Committee
(i) Reference:
The Committee looks into redressal of grievances of the investors namely shareholders and fixed deposit holders and other security holders. The Committee deals with grievances pertaining to transfer of shares, non-receipt of annual report, non-receipt of dividend, dematerialisation / rematerialisation of shares, complaint letters received from Stock Exchanges, SEBI, non-receipt of interest warrants, repayment of fixed deposit issues etc. The Board of Directors have delegated the power of approving transfer/transmission of shares to a share transfer committee.
(ii) Composition:
The Committee comprises of 3 Directors. The Chairman of the Committee is a Non-Executive Independent Director.
The members of the Committee are :
Mr. V Sridhar Chairman
Mr. Ranjit I Jesudasen Member
Mr. K M Mammen Member
Mr Ravi Mannath, Company Secretary, is the Secretary of the Committee.
(iii) Meetings and Attendance:
During the financial year ended 31st March, 2017, the Stakeholders’ Relationship Committee met on 03.05.2016. All the members of the Committee were present for the meeting.
11 investor complaints were received during the financial year ended 31.03.2017. All the complaints were redressed and no queries on the same were pending for the period under review.
Mr S Dhanvanth Kumar, Asst Company Secretary is the compliance officer of the Company.

45
9. General Body Meetings
(a) The Company held its last 3 Annual General Meetings as under:
AGM for the Year
Date Time Venue
2012-2013 06-02-2014 11.00 A.M. TTK Auditorium, ‘The Music Academy’ No.168,TTK Road, Chennai - 600 014
2013-2014 12-02-2015 11.00 A.M. - do -2014-2016 11-08-2016 11.00 A.M. - do -
(b) Details of Special resolution passed during the last 3 Annual General Meetings:
Date of AGM Particulars of Special Resolution passed
06-02-2014 (i) Payment of revised remuneration to Mrs Meera Mammen, a relative of some of the Directors of the Company, w.e.f. 01-04-2014 under Section 314(1B) of the Companies Act, 1956 and Section 188(1) of the Companies Act, 2013.
(ii) Appointment and payment of revised remuneration to Mr Samir Thariyan Mappillai, a relative of some of the Directors of the Company, w.e.f. 01-04-2014 under Section 314(1B) of the Companies Act, 1956 and Section 188(1) of the Companies Act, 2013.
12-02-2015 (i) To increase the borrowing powers of the Company.
(ii) To provide security in connection with the borrowings of the Company.
11-08-2016 No Special Resolution was passed.
(c) Postal Ballot:
During the financial year, the Board sought the consent of the shareholders of the Company for passing Special Resolution to issue Secured/Unsecured Redeemable Non- Convertible debentures for an amount not exceeding ` 500 Crores on a private placement basis through postal ballot as per the notice to the shareholders dated 3rd February, 2017.
Mr N C Sarabeswaran, Chartered Accountant, was appointed as Scrutinizer for conducting the postal ballot voting process in a fair and transparent manner.
The above special resolution was passed with requisite majority with the percentage of votes cast in favour for the resolution mentioned above being 99.98% of the total number of valid votes.
Voting Pattern of the special resolution passed through postal ballot, are as follows:
Particulars Physical E-Voting TotalNumber of Postal Ballots received
478 405 883
Total number of valid votes
2125401 773592 2898993
Votes cast in favour of the Resolution
2125100 773386 2898486
Votes cast against the Resolution
301 206 507
Number of invalid Postal Ballots
5 - 5
Number of invalid votes 349 - 349
The procedures prescribed under Section 110 of the Companies Act, 2013 read with Rule 22 of the Companies (Management and Administration) Rules, 2014, as amended and applicable provisions of the SEBI (Listing Obligations and Disclosure Requirements) Regulations, 2015, were duly followed for conducting the postal ballot process during the year for approving the special resolution mentioned above.
46
As on the date of this report, the Company do not propose to pass any special resolution by way of Postal Ballot.
10 Means of Communication
Quarterly/half yearly results are disclosed to Stock Exchanges and also published in daily newspapers viz., Business Standard (all over India) and Makkal Kural (Vernacular). As per the requirements of Regulation 46 of the SEBI (Listing Obligations and Disclosure Requirements) Regulations, 2015, the quarterly/half yearly results and the press release issued annually are displayed on the Company’s website www.mrftyres.com. The Company provides information to the Stock Exchanges as per the requirements of the SEBI (Listing Obligations and Disclosure Requirements) Regulations, 2015. No presentations were made to institutional investors / analysts. The Company has a designated e-mail address viz., [email protected] exclusively for investor servicing.
11. Dividend Distribution Policy
Pursuant to Regulation 43A of the Securities and Exchange Board of India (Listing Obligations and Disclosure Requirements) Regulations, 2015, the Company is required to formulate a dividend distribution policy which shall be disclosed in its annual report and on its website.
The objective of this policy is to provide the dividend distribution framework to the stakeholders of the Company. A decision of the Board of Directors to recommend / declare dividend would be based on the financial parameters and the internal and external factors namely current year’s profits after tax of the Company, Operating cash flows and treasury position keeping in view total debt to equity ratio, accumulated reserves, future capital expenditure/ expansion, strategic investments and working capital requirements, providing for unforeseen events and contingencies with financial implications, overall macro-economic scenario / regulatory environment, future business prospects and industry outlook, past dividend trends, any other financial parameter or factor as considered relevant or appropriate by the Board of Directors.
Based on the decision of the Board of Directors, from time to time, the retained earnings will be utilised to meet the Company’s long term financial requirements (including capital expenditure, debt service obligations, other liabilities etc.), improve financial ratios, declaration of dividend, issue of bonus shares, buy-back of shares and any other purpose permitted by the Companies Act, 2013. Based on the financial parameters and other factors mentioned above, the shareholders may/may not expect dividend for any year.
The Board of Directors may declare interim dividend(s) as and when they consider it fit, and recommend final dividend to the shareholders for their approval in the general meeting of the Company. Presently, the authorised capital of the Company comprises of only one class of shares. In the event of the Company issuing any other class of shares, this policy would be suitably amended.
The dividend distribution shall be in accordance with the applicable provisions of the Companies Act, 2013 and rules framed thereunder, Securities and Exchange Board of India (Listing Obligations and Disclosure Requirements) Regulations, 2015 and other legislations governing dividend, as in force from time to time.
12. General Shareholder Information
a) Annual General Meeting:
Date and Time : 04.08.2017, 11.00 A.MVenue : TTK Auditorium
‘The Music Academy’No. 168, TTK Road,Chennai - 600 014
b) Financial Year : 1st April to 31st March.c) Dividend payment date:
Interim Dividend : 18.11.2016` 3 per share (30%)
II Interim Dividend : 23.02.2017` 3 per share (30%)
Final Dividend : 11.08.2017, ` 54/- per share (540%), (subject to approval of shareholders)

47
d) Listing on Stock Exchanges at:
1. National Stock Exchange of India Ltd., (NSE) Exchange Plaza, 5th Floor, Plot No. C/1, 5 G Block, Bandra-Kurla Complex, Bandra (E), Mumbai 400 051.
2. Bombay Stock Exchange Ltd., (BSE) Phiroze Jeejeebhoy Towers, 25th Floor, Dalal Street, Mumbai 400 001.
Equity ISIN : INE883A01011
Listing fees upto the year ending 31st March, 2018 have been paid to the above mentioned Stock Exchanges.
e) Stock Code:
Bombay Stock Exchange Code 500290 National Stock Exchange Symbol MRF
f) Market Price Data:
Month Bombay Stock Exchange [BSE] National Stock Exchange [NSE]High(`)
Low(`)
No. of Shares
High(`)
Low(`)
No. of Shares
April-2016 38299.00 33550.05 24913 38249.95 33555.45 117043May-2016 34850.00 31031.80 34202 34944.35 31002.00 162770June-2016 33900.00 30464.25 29497 33879.00 30101.00 120754July-2016 35900.00 33033.95 26664 35840.05 33050.00 122734August-2016 38100.00 33507.15 33331 38087.95 33650.00 217073September-2016 51486.90 36950.00 59441 51515.45 37099.50 504722October-2016 54600.65 46202.00 60425 54650.00 46199.95 419800November-2016 53950.00 46450.00 44547 53940.00 46451.00 363747December-2016 53500.00 47577.50 27738 53448.00 47512.30 236549January-2017 55924.95 48780.65 30296 55945.00 48799.75 276098February-2017 52814.95 49600.00 27983 52840.00 49577.00 244975March-2017 61100.00 51166.50 53310 61220.00 51086.70 477389
g) Stock Performance: (Monthly Closing Price) Performance in comparison to BSE Sensex
SHARE PRICE SENSEX
Apr
-16
Jun-
16
May
-16
Jul-1
6
Aug-
16
Sep-
16
Oct
-16
Nov
-16
Dec
-16
Jan-
17
Feb-
17
Mar
-17 1000
6000
11000
16000
21000
26000
31000
36000
1000
11000
21000
31000
41000
51000
61000
71000
h) Registrars and Transfer Agents: In-house Share Transfer MRF Limited No. 114, Greams Road, Chennai - 600 006 In terms of SEBI Circular No. O&CC/FITTC/CIR-15/2002
dated 27th December, 2002, your Company is carrying out both physical transfer work as well as electronic connectivity, in-house.
In-house Investor relations department provides various services viz., dematerialisation and rematerialisation of shares, Share transfers/transmissions, disbursement of dividend, Issue of duplicate share certificates, dissemination of information and fixed deposit related activities.
Members are therefore requested to communicate pertaining to both physical and electronic connectivity to Secretarial Department, MRF Limited, No. 114, Greams Road, Chennai 600 006.
i) Share Transfer System: The average time taken for processing and registration of
share transfer requests received is less than 12 days. All dematerialisation requests are processed within 10 days.

48
) Distribution of shareholding: (as at 31 3 2017)
Shareholding No. of Shareholders
% No. of Shares
%
Upto 500 38365 98.92 707074 16.67501 - 1000 149 0.38 107291 2.531001 - 2000 84 0.22 126009 2.972001 - 3000 37 0.10 91465 2.163001 - 4000 20 0.05 68363 1.614001 - 5000 18 0.05 80759 1.905001 - 10000 48 0.12 343636 8.1010001 and above 62 0.16 2716546 64.06TOTAL 3 7 3 100 00 2 11 3 100 00
k) Dematerialization of Shares and Liquidity:
72.74% of total equity capital is held in dematerialized form with NSDL and CDSL upto 31st March, 2017. All requests for dematerialization of shares were carried out within the stipulated time period and no share certificates were pending for dematerialization.
Trading in equity shares of the Company is permitted only in dematerialized form w.e.f. 17-01-2000 as per notification issued by the Securities and Exchange Board of India (SEBI).
Physical Form115624427.26%
Electronic FormCDSL, 45659610.76%
Electronic FormNSDL, 262830361.98%
l) Outstanding GDR/Warrants/any other convertible instruments:
The Company do not have any outstanding GDR / Warrants / any other convertible instruments.
m) Debenture Trustee: Axis Trustee Services Limited, 2nd Floor, Wadia International Centre, Pandurang Budhkar Marg, Worli, Mumbai – 400 025.
n) Commodity price risk / foreign exchange risk and hedging:
Natural Rubber which is one of the key commodities used for the company’s manufacturing operations is an agricultural commodity and subject to price volatility and production concerns both in the domestic and in the international front. Moreover, the price of natural rubber is controlled by external environment. The Company has not taken any hedging contracts for commodity price risks during the financial year ended 31/3/2017.
Foreign exchange risks for the Company arise from (a) payment obligations arising from imports of raw materials/ capital goods, services availed from overseas service providers and foreign currency loans, (b) export transactions and (c) dividend receipts. The Company’s policy on hedging foreign currency risks is enumerated in the accounting policy annexed to the financial statement.
o) Plant Locations: 1. Tiruvottiyur — Tiruvottiyur, Chennai, Tamil Nadu. 2. Kottayam — Vadavathoor, Kottayam, Kerala. 3. Goa — Usgao, Ponda, Goa. 4. Arkonam — Ichiputhur, Arkonam, Tamil Nadu. 5. Medak — Sadasivapet, Medak, Telangana. 6. Puducherry — Eripakkam Village, Nettapakkam
Commune, Puducherry. 7. Ankanpally — Sadasivapet, Medak, Telangana. 8. Perambalur — Naranamangalam Village & Post,
Alathur Taluk, Perambalur District (near Trichy), Tamil Nadu.

49
p) Address for Correspondence: MRF Limited No. 114, Greams Road, Chennai – 600 006. Tel : (044) 28292777 Fax : (044) 28295087 E-mail : [email protected]. Other Disclosures
(a) As required under applicable SEBI Regulations, your Company has adopted a policy on related party transactions and also a policy on materiality of related party transactions and the same have been approved by the Board of Directors and uploaded on the Company’s Web site: http://www.mrftyres.com/downloads/download.php filename policy-for-determination-of-materiality.pdf.,http://www.mrftyres.com/downloads/download.php filename policy-on-materiality-of-related-party-transaction.pdf. Requisite approvals from the Audit Committee / Board have been obtained for the transactions as stipulated under applicable law. The details of related party transactions during the financial year ended 31st March, 2017 are given in the financial statements. These related party transactions are not material as per the materiality thresholds laid down and hence no details are furnished in Form AOC-2 of the Companies (Accounts) Rules, 2014.
(b) The Company has complied with the requirements of the Stock Exchanges/SEBI and statutory authority on all matters related to capital markets during the last three years. No penalties, strictures were imposed on the Company by the Stock Exchange/SEBI or any other statutory authority in respect of the same.
(c) The Company has established a vigil mechanism pursuant to the requirements of Section 177(9) of the Companies Act, 2013 and Regulation 22 of the SEBI (Listing Obligations and Disclosure Requirements) Regulations, 2015. No personnel have been denied access to the chairman of the Audit Committee to report genuine concerns. Establishment of vigil mechanism is hosted on the web site of the Company under the web link: http://www.mrftyres.com/downloads/download. php filename vigil-Mechanism.pdf.
(d) The Company has complied with the mandatory requirements of Corporate Governance prescribed in Schedule II, Part A to D of the SEBI (Listing Obligations and Disclosure Requirements) Regulations, 2015.
(e) The Company has complied with all the applicable mandatory requirements specified in Regulations 17 to 27 and Clauses (b) to (i) of sub-regulation (2) of Regulation 46 of the SEBI (Listing Obligations & Disclosure Requirements) Regulations, 2015.
(f) The Board has laid down a Code of Conduct for all Directors and senior management staff of the Company. The code suitably incorporates for the Independent Directors their duties as Independent Directors as laid down in Schedule IV of the Companies Act, 2013. The code of conduct is available on the website: www.mrftyres.com. All Directors and members of the senior management have affirmed their compliance with the code of conduct.
Your Company has also adopted a Code of Conduct to regulate, monitor and report trading by insiders as per Securities and Exchange Board of India (Prohibition of Insider Trading) Regulations, 2015. All Directors and designated persons who could have access to unpublished price sensitive information of the Company are governed by the Code. An annual disclosure was taken from the Directors and designated persons, as at the end of the year.
(g) The Audit Committee reviews the financial statements of the unlisted Subsidiary Companies. The minutes of the Board Meetings of the unlisted subsidiary companies are placed at the Board meeting of the Company.
Your Company has formulated a policy on material subsidiary as required under Regulation 16 of the SEBI (Listing Obligations & Disclosure Requirements) Regulations, 2015 and the policy is hosted on the website of the Company under the web link:http://www.mrftyres.com/downloads/download. php filename material-subsidary-policy.pdf. The Company does not have any material unlisted subsidiary Company.

50
(h) The Company has issued a formal letter of appointment to all the Independent Directors. The terms and conditions of their appointment have been disclosed on the Company’s web site under the web link: http://www.mrftyres.com/downloads/download.php filename Terms-and-Condiions-of-Appointment-of-Independent-Directors.pdf.
During the year, a meeting of the Independent Directors was held as prescribed under applicable SEBI Regulations and the Companies Act, 2013.
1 Discretionary requirements as specified in Part E of Schedule II of SEBI [Listing Obligations and Disclosure Requirements]
egulations, 201 :
a Maintaining Non-Executive Chairman s Office:
Not Applicable as the Chairman is an Executive Director.
b. Shareholder Rights:
The Company’s quarterly and half yearly results are published in the newspapers and also uploaded on its website www.mrftyres.com and in Stock Exchange websites namely www.connect2nse.com and http://listing.bseindia.com. Therefore, no individual communications are sent to the shareholders in this regard.
c Audit Qualification:
There are no qualifications in the Auditors’ Report on the accounts for the financial year ended 31.03.2017.Adoption of other non-mandatory requirements are being reviewed from time to time.
1 CEO CFO Certification
Mr. Arun Mammen, Vice Chairman and Managing Director and Mr. Madhu P Nainan, vice President Finance, have certified to the Board regarding the financial statements for the financial year ended 31st March, 2017 in accordance with Regulation 17(8) of SEBI (Listing Obligations and Disclosure Requirements) Regulations, 2015.
1 Equity shares in M F - Unclaimed Suspense Account:
As required by the provisions of Regulation 39 (4) read with Schedule VI of SEBI (Listing Obligations and Disclosure Requirements) Regulations, 2015, the Company has transferred the unclaimed shares, lying in possession of the Company, to MRF - Unclaimed Suspense Account. The status of unclaimed shares lying in MRF - Unclaimed Suspense Account as on 31.03.2017 are as under :-
Particulars Number of Members
Number of Shares
Aggregate number of shareholders and the outstanding shares lying in the suspense account
989 26606
Number of shareholders who approached the Company for transfer of the shares from suspense account during the FY 2016-17
7 171
Shareholders to whom shares were transferred from the suspense account during the year
7 171
Aggregate number of shareholders and the outstanding shares lying in the suspense account as on 31.03.2017
982 26435
The voting rights on these shares shall remain frozen till the rightful owner of such shares claims the shares.
17 Declaration
As required by Para D of Schedule V to the SEBI (Listing Obligations and Disclosure Requirements) Regulations, 2015, it is hereby confirmed and declared that all the members of the Board and senior management have affirmed compliance with the Code of Conduct of the Company for the financial year ended 31st March, 2017.
On behalf of the Board of Directors
Place: Chennai K M MAMMENDate: 4th May, 2017 Chairman & Managing Director

51
CERTIFICATE
To the Members of
MRF LimitedNo. 114, Greams Road,Chennai - 600 006.
We have examined the compliance of conditions of Corporate Governance by MRF Limited, for the year ended on 31st March, 2017, as stipulated in Schedule V(C) of the Securities and Exchange Board of India (Listing Obligations and Disclosure Requirements) Regulations, 2015 pursuant to the Listing Agreement of the said Company with Stock Exchanges.
The compliance of conditions of Corporate Governance is the responsibility of the management. Our examination was limited to procedures and implementation thereof, adopted by the Company for ensuring the compliance of the conditions of the Corporate Governance. It is neither an audit nor an expression of opinion on the financial statements of the Company.
In our opinion and to the best of our information and according to the explanations given to us, we certify that the Company has complied with the conditions of Corporate Governance as stipulated in Schedule V(C) of the Securities and Exchange Board of India (Listing Obligations and Disclosure Requirements) Regulations, 2015 pursuant to the Listing Agreement of the said Company with Stock Exchanges.
We further state that such compliance is neither an assurance as to the future viability of the Company nor the efficiency or effectiveness with which the management has conducted the affairs of the Company.
For and on behalf of
For SASTRI & SHAH For SCA AND ASSOCIATESChartered Accountants Chartered AccountantsFirm Regn. No. 003643S Firm Regn. No. 101174W
C R Kumar Shivratan AgarwalPartner PartnerMem. No. 26143 Mem. No. 104180
Chennai, Dated 4th May, 2017

52
BUSINESS RESPONSIBILITY REPORT (BRR)
Section A: General information about the Company
1. Corporate Identity Number (CIN) L25111TN1960PLC004306
2. Name of the Company MRF LIMITED
3. Registered address 114, Greams Road, Chennai 600006
4. Website www.mrftyres.com
5. E-mail Id [email protected]
6. Financial year reported 1st April 2016 to 31st March 2017
7. Your Company is engaged in (industrial activity code-wise)
Group* Description
221 Manufacture and sale of Automotive tyres, Tubes, Flaps etc.
*As per National Industrial Classification – Ministry of Statistics and Programme Implementation
8. The key products that your Company manufactures (as per Balance Sheet) are:
Automotive tyres, tubes, flaps etc.
9. Total number of locations where business activity is undertaken by your Company: (On a standalone basis)
i. Number of International locations – 3
ii. Number of National Locations – 176
10. Markets served by your Company:
Local State National International
Section B: Financial details of the Company
1. Paid up Capital : ` 4,24,11,430
2. Total Turnover : ` 14,743 Crores
3. Total profit after taxes : ` 1,451 Crores
4. Total spending on corporate social responsibility (CSR) as percentage of profit after tax (PAT) (%): Your Company’s total spending on CSR for the financial year April 2016 to March 2017 is ` 7.73 crores which is 0.53% of PAT.
5. Some of the areas for which expenditure in 4 above has been incurred: Sports Training, developing vocational skills, promotion of education and rural development projects.
Section C: Other details
1. Does the Company have any Subsidiary Company/ Companies? Yes
2. Do the Subsidiary Company/Companies participate in the BR Initiatives of the parent company? If yes, then indicate the number of such subsidiary company(s): The subsidiary companies being unlisted companies have not yet commenced any such activities.
3. Do any other entity/entities (e.g. suppliers, distributors etc.) that the Company does business with, participate in the BR initiatives of the Company? If yes, then indicate the percentage of such entity/entities? [Less than 30%, 30-60%, More than 60%]: No
Section D: Business Responsibility Information
1. Details of Director/Directors responsible for BR
a. Details of the Directors responsible for implementation of the BR policy
a) K M Mammen (DIN : 00020202), Chairman & Managing Director, Tel. No. : 91 44 2829 2777, E-mail Id : [email protected]
b) Arun Mammen (DIN : 00018558), Vice Chairman and Managing Director, Tel. No. : 91 44 2829 2777, E-mail Id : [email protected]
b. Details of the BR head
Same as above.

53
2. Principle-wise [as per National Voluntary Guidelines (NVGs)] BR Policy/policies (Reply in Y/N)
MRF has always adhered to good business practices in all facets of its operations. The Company adopts sound corporate governance processes and procedures. The Company has been an ISO certified organisation for several years. All the manufacturing locations of MRF are certified for Environment (OHSAS& EMS) & Quality Management System (TS16949) by TUV –Nord (certifying body).
The Board of Directors has also adopted a Business Responsibility Policy (“BR Policy”) addressing the principles set out in the National Voluntary Guidelines on Social, Environmental and Economic Responsibilities of Business (NVGs). This policy is operationalized and supported by various other policies, procedures, guidelines and manuals.
(a) Details of compliance (Reply in Y/N)
Sr. No. Questions P1 P2 P3 P4 P5 P6 P7 P8 P9
1 Do you have a policy/policies for Y Y Y Y Y Y Y Y Y
2 Has the Policy been formulated in consultation with the relevant stakeholders? Y Y Y Y Y Y Y Y Y
3 Does the policy conform to any national/ international standards?b Y Y Y Y Y Y Y Y Y
4 Has the policy been approved by the Board? If yes, has it been signed by MD/owner/CEO/ appropriate Board Director?
Y Y Y Y Y Y Y Y Y
5 Does the Company have a specified committee of the Board/Director/ Official to oversee the implementation of the policy?
Y Y Y Y Y Y Y Y Y
6 Indicate the link for the policy to be viewed online? www.mrftyres.com/shareholder-info-policies
7 Has the policy been formally communicated to all relevant internal and external stakeholders?
Y Y Y Y Y Y Y Y Y
8 Does the Company have in-house structure to implement the policy/policies Y Y Y Y Y Y Y Y Y
9 Does the Company have a grievance redressal mechanism related to the policy/policies to address stakeholders’ grievances related to the policy/policies
Y Y Y Y Y Y Y Y Y
10 Has the Company carried out independent audit/evaluation of the working of this policy by an internal or external agency?
Y Y Y Y Y Y Y Y Y
Notes: a. P1 - Ethics etc., P2 - Product Responsibility, P3 - Employee Wellbeing, P4 - Stakeholder Engagement, P5 - Human Rights, P6 - Environment,
P7 - Public Policy, P8 - CSR, P9 - Customer Relations. b. The policies have been formulated taking into consideration statutory requirements (which are modelled based on national and international
conventions/standards) and applicable standards of ISO 9001, ISO 14001, OHSAS 18001. (b) If answer to the question at serial number (a) against any pirncipal, is ‘No’, please explain why: Not applicable.
3. Governance related to BR

54
Indicate the frequency with which the Board of Directors, Committee of the Board or CEO meet to assess the BR performance of the Company. Within 3 months, 3-6 months, Annually, More than 1 year:
The Board of Directors of the Company, annually reviews the various initiatives forming part of the BR performance of the Company. The CSR Committee reviews the implementation of the projects/ programmes/activities once in about 6 months. The Chairman & Managing Director and the Vice Chairman and Managing Director deliberate on issues relating to the BR when the respective functional review is done (1-6 months).
Does the Company publish a BR or a Sustainability Report? What is the hyperlink for viewing this report? How frequently it is published?
The Company publishes the information on BR which forms part of the Annual Report of the Company. The Annual Report is uploaded on the website of the Company – www.mrftyres.com/financial-results.
Section E: (Principle-wise Performance)
Principle 1
1. Does the policy relating to ethics, bribery and corruption cover only the company? Yes/ No. Does it extend to the Group/Joint Ventures/ Suppliers/Contractors/NGOs /Others?
Yes. The Company has laid down a Code of Conduct as per the SEBI Regulations. This covers issues, inter alia, related to ethics etc. It extends to all dealings between the Company and its stakeholders.
2. How many stakeholder complaints have been received in the past financial year and what percentage was satisfactorily resolved by the management? If so, provide details thereof, in about 50 words or so.
During the financial year 2016-17, 11 complaints were received from the shareholders, which have been attended to. The complaints are in the nature non receipt of dividend, share transmission and demat rejections. The Stakeholders’ Relationship Committee at its meetings reviews the complaints and the status of their resolution.
Principle 2
1. List upto 3 of your products or services whose design has incorporated social or environmental concerns, risks and/or opportunities.
a. With the broad vision of making tyre production sustainable, MRF has initiated several projects on developing low rolling resistance (RR) tyres. A low RR tyre, being fuel efficient, emits less CO2 to the environment thus mitigating global warming. Our low RR tyres are in regular use by an OE customer.
b. In yet another project to make tyre production sustainable, we started R&D trails on using raw materials derived from environmentally sustainable sources. This is in partnership with a reputed Indian industry. We are also exploring the feasibility of making tyre production sustainable using advanced materials.
c. In striving for continuous excellence in technology and product performance, we started several innovative projects with institutions of national importance in India and universities abroad. The projects involve development of new designs, patterns, NVH and tyre simulations with a view to reduce the rolling resistance and noise of tyres.
2. Does the company have procedures in place for sustainable sourcing (including transportation)? (a) If yes, what percentage of your inputs was sourced sustainably? Also, provide details thereof, in about 50 words or so.
Yes. The Company has suitable procedures as part of the vendor selection and vendor management process to promote sustainable sourcing. The Company strives to enlist vendors who have been certified to be compliant with environmental / social standards. Contractual obligations are stipulated regarding adherence with various regulatory requirements encompassing environment protection, etc.
About 83% of our manufactured inputs (i.e. raw materials) are sourced from vendors who have been certified to be compliant with environmental / social standards.
Transportation and logistics optimization is an on-going activity which helps to reduce related environmental impact.

55
3. Has the company taken any steps to procure goods and services from local & small producers, including communities surrounding their place of work? (a) If yes, what steps have been taken to improve their capacity and capability of local and small vendors?
Company has taken initiatives to source engineering consumables and spares through local traders and manufacturers. During development process, local vendors are supported through mutual exchange of expertise.
4. Does the company have a mechanism to recycle products and waste? If yes what is the percentage of recycling of products and waste (separately as <5%, 5-10%, >10%). Also, provide details thereof, in about 50 words or so.
The solid waste that is generated (including product rejects) are systematically segregated and sold to scrap vendors who either recycle the same or find alternative uses for it. Almost all of the solid waste is disposed in this manner.
Principle 3
1. Please indicate the total number of employees: 15774 Permanent employees.
2. Please indicate the total number of employees hired on temporary/contractual/casual basis: 10369
3. Please indicate the number of permanent women employees: 43
4. Please indicate the number of permanent employees with disabilities: 59
5. Do you have an employee association that is recognized by management: Yes
6. What percentage of your permanent employees is members of this recognized employee association? 100% of workmen are members of Unions. 74% of the unionised employees are members of recognised unions.
7. Please indicate the number of complaints relating to child labour, forced labour, involuntary labour, sexual harassment in the last financial year and pending, as on the end of the financial year.
No. Category No of complaints filed during the financial
year
No of complaints pending as on end of
the financial year
1 Child labour / forced labour / involuntary labour
Nil Nil
2 Sexual harassment Nil Nil3 Discriminatory employment Nil Nil
8. What percentage of your under mentioned employees were given safety & skill up-gradation training in the last year? (a) Permanent Employees - 73% (b) Permanent Women Employees - 14% (c)Casual/Temporary/Contractual Employees - 43% (d) Employees with Disabilities - 10%
Principle
1. Has the company mapped its internal and external stakeholders? Yes
2. Out of the above, has the company identified the disadvantaged, vulnerable and marginalized stakeholders - Underprivileged rural youth
3. Are there any special initiatives taken by the company to engage with the disadvantaged, vulnerable and marginalized stakeholders. If so, provide details thereof, in about 50 words or so.
The MRF Institute of Driver Development (MIDD), a pioneering institute providing driver training in light and heavy commercial vehicles, has a track record of about 3 decades. Right from its inception, the institute epitomized a mission far nobler than merely training drivers. The objective was of moulding rural youngsters who were deprived of opportunities, into competent and cultured professionals, contributing immensely to the road transport industry and the society at large. The institute has turned out 320 drivers during the year 2016-17, which includes 184 drivers who have done a refresher course. Immediately after training, placement assistance is provided for all needy drivers, with reputed transporters and fleet operators.

56
Principle 5
1. Does the policy of the company on human rights cover only the company or extend to the Group/Joint Ventures/Suppliers/Contractors/NGOs/Others While the Company’s human resource policies are intended to ensure adherence with applicable labour laws governing work place practices, contractual obligations are also stipulated in engagements with suppliers and contractors on compliance with applicable regulations.
2. How many stakeholder complaints have been received in the past financial year and what per cent was satisfactorily resolved by the management? Nil
Principle
1. Does the policy related to Principle 6 cover only the Company or extends to the Group/Joint Ventures/Suppliers/Contractors/NGOs/others. Your Company’s EHS Policy covers all manufacturing plants of the company and includes employees (including contract employees). The policy addresses compliance with legal, statutory, regulatory and customer specific requirements related to health, safety and environment.
2. Does the company have strategies/ initiatives to address global environmental issues such as climate change, global warming, etc? Y/N. If yes, please give hyperlink for webpage etc. Yes. Green House Gases (GHG) emissions have been identified, quantified and initiatives have been taken to reduce GHG emissions. Weblink: www.mrftyres.com/shareholder-info-policies.
3. Does the company identify and assess potential environmental risks? Yes. As part of Environmental Management System (EMS), the environmental risks are identified, assessed and environmental management programs (EMP) have been initiated.
4. Does the company have any project related to Clean Development Mechanism? If so, provide details thereof, in about 50 words or so. Also, if yes, whether any environmental compliance report is filed No
5. Has the company undertaken any other initiatives on – clean technology, energy efficiency, renewable energy, etc. Y/N. If yes, please give hyperlink for web page etc.
Several Projects on clean technology, energy efficiency, renewable energy were taken up and completed in our plants. Details are provided in Annexure I to the Board’s Report. Weblink: www.mrftyres.com/financial-results.
6. Are the Emissions/Waste generated by the company within the permissible limits given by CPCB/SPCB for the financial year being reported?
Your Company’s manufacturing processes are designed to operate in a manner that emissions/waste generated by the company are within the permissible limits given by CPCB/SPCB.
7. Number of show cause/ legal notices received from CPCB/SPCB which are pending (i.e. not resolved to satisfaction) as on end of financial year.
Nil
Principle 7
1. Is your Company a member of any trade and chamber or association? If Yes, name only those major ones that your business deals with:
(a) Association of Tyre Manufacturers Association
(b) Confederation of Indian Industry
(c) Federation of Indian Chambers of Commerce and Industry
2. Have you advocated/lobbied through above associations for the advancement or improvement of public good?
We initiate our own welfare programs. With the above associations, we have ventured into skill development of rubber growers. We, on our own run, a driver’s training institute not only to meet the shortage of drivers but also to inculcate good ethical practices amongst these drivers. This program provides an opportunity for underprivileged youth to become competent and cultured professionals in the road transport industry.

57
Principle 1. Does the company have specified programmes/initiatives/projects
in pursuit of the policy related to Principle 8? If yes, details thereof. The Company has constituted a Corporate Social Responsibility
Committee. Based on the CSR Committee’s recommendation, the Board has approved a CSR policy. Details of the policy and the programmes undertaken are given in the CSR Report. (Annexure II to the Board’s Report).
2. Are the programmes/projects undertaken through in-house team/own foundation/external NGO/government structures/any other organization?
In-house team / external NGO / government structures.3. Have you done any impact assessment of your initiative? The CSR Committee reviews the implementation of the projects
undertaken. Reports are sought from the implementing agencies to understand the impact of the initiatives. Likewise in case of in-house projects, the same is reviewed and monitored.
4. What is your company’s direct contribution to community development projects- Amount in INR and the details of the projects undertaken.
Details are given in the CSR Report. (Annexure II to the Board’s Report)
5. Have you taken steps to ensure that this community development initiative is successfully adopted by the community? Please explain in 50 words, or so.
The Company’s CSR projects have been primarily focussed on sports training, skill development, health care projects, education and rural development projects. All these projects have achieved their objectives in terms of adoption by the community.
Principle 9
1. What percentage of customer complaints/consumer cases are pending as on the end of financial year
0.56% of customer complaints are pending as at the end of the financial year.
2. Does the Company display product information on the product label, over and above what is mandated as per local laws? Yes/No/N.A./Remarks(additional information) –
No/NA as only passenger and some select motorcycle tyres carry labels.
3. Is there any case filed by any stakeholder against the company regarding unfair trade practices, irresponsible advertising and/or anti-competitive behaviour during the last five years and pending as on end of financial year. If so, provide details thereof, in about 50 words or so.
A proceeding is pending before the Competition Commission of India in respect of automotive tyres. The proceeding has been initiated against major manufacturers of these products and pertains to product pricing. A writ petition has been filed regarding this and the High Court of Judicature at Madras has restrained the Competition Commission of India from taking any final decision in this matter until disposal of the writ petition.
4. Did your company carry out any consumer survey/ consumer satisfaction trends?
Yes
58
INDEPENDENT AUDITOR’S REPORT TO THE MEMBERS OF MRF LIMITED
1. REPORT ON THE STANDALONE IND AS FINANCIAL STATEMENTS
1.1 We have audited the accompanying standalone Ind AS financial statements of MRF LIMITED (“the Company”), which comprise the Balance Sheet as at 31st March, 2017, the Statement of Profit and Loss (including other comprehensive income), the Cash Flow Statement and the statement of changes in Equity for the year then ended, and a summary of the significant accounting policies and other explanatory information.
2. MANAGEMENT’S RESPONSIBILITY FOR THE STANDALONE FINANCIAL STATEMENTS.
2.1 The Company’s Board of Directors is responsible for the matters stated in Section 134(5) of the Companies Act, 2013 (“the Act”) with respect to the preparation of these standalone Ind AS financial statements that give a true and fair view of the state of affairs (financial position), profit or loss (financial performance including other comprehensive income), cash flows and changes in equity of the Company in accordance with the accounting principles generally accepted in India, including the Indian Accounting Standards (Ind AS) prescribed under Section 133 of the Act.
2.2 This responsibility also includes maintenance of adequate accounting records in accordance with the provisions of the Act for safeguarding the assets of the Company and for preventing and detecting frauds and other irregularities; selection and application of appropriate accounting policies; making judgments and estimates that are reasonable and prudent; and design, implementation and maintenance of adequate internal financial controls, that were operating effectively for ensuring the accuracy and completeness of the accounting records, relevant to the preparation and presentation of the Standalone Ind AS financial statements that give a true and fair view and are free from material misstatement, whether due to fraud or error.
3. AUDITOR’S RESPONSIBILITY 3.1 Our responsibility is to express an opinion on these standalone
Ind AS financial statements based on our audit. We have
taken into account the provisions of the Act, the accounting and auditing standards and matters which are required to be included in the audit report under the provisions of the Act and the Rules made thereunder.
3.2 We conducted our audit of the Standalone Ind AS financial statements in accordance with the Standards on Auditing specified under Section 143(10) of the Act. Those Standards require that we comply with ethical requirements and plan and perform the audit to obtain reasonable assurance about whether the Standalone Ind AS financial statements are free from material misstatement.
3.3 An audit involves performing procedures to obtain audit evidence about the amounts and the disclosures in the Standalone Ind AS financial statements. The procedures selected depend on the auditor’s judgment, including the assessment of the risks of material misstatement of the standalone Ind AS financial statements, whether due to fraud or error. In making those risk assessments, the auditor considers internal financial control relevant to the Company’s preparation of the Standalone Ind AS financial statements that give a true and fair view in order to design audit procedures that are appropriate in the circumstances. An audit also includes evaluating appropriateness of the accounting policies used and the reasonableness of the accounting estimates made by the Company’s Directors, as well as evaluating the overall presentation of the Standalone Ind AS financial statements.
3.4 We believe that the audit evidence we have obtained is sufficient and appropriate to provide a basis for our audit opinion on the standalone Ind AS financial statements.
4. OPINION 4.1 In our opinion and to the best of our information and according
to the explanations given to us, the aforesaid standalone Ind AS financial statements give the information required by the Act in the manner so required and give a true and fair view in conformity with the accounting principles generally accepted in India including the Ind AS, of the state of affairs (financial position) of the Company as at 31st March, 2017, its profit (financial performance including other comprehensive income), its cash flows and the changes in equity for the year ended on that date.

59
5. OTHER MATTERS 5.1 The comparative financial information of the company for
the period ended 31st March, 2016 and the transition date opening balance sheet as at 1st October, 2014 prepared in accordance with Ind AS included in these standalone Ind AS financial statements have been audited by a predecessor auditor who had jointly audited the financial statements for the relevant periods. The report of the predecessor auditor on the comparative financial information and the opening balance sheet dated 25th March 2017, expressed an unmodified opinion.
Our Opinion on the standalone Ind AS financial statement and our report on other legal and regulatory requirements is not modified in respect of these matters.
6. REPORT ON OTHER LEGAL AND REGULATORY REQUIREMENTS 6.1 As required by the Companies (Auditor’s Report) Order,
2016(“the Order”) issued by the Central Government in terms of Section 143 (11) of the Act, we give in “Annexure A” - a statement on the matters specified in paragraphs 3 and 4 of the Order.
6.2 As required by Section 143 (3) of the Act, we report that: a) We have sought and obtained all the information and
explanations which to the best of our knowledge and belief were necessary for the purposes of our audit.
b) In our opinion, proper books of account as required by law have been kept by the Company so far as it appears from our examination of those books.
c) The Balance Sheet, the Statement of Profit and Loss, the Cash Flow Statement and Statement of Changes in Equity dealt with by this Report are in agreement with the books of account.
d) In our opinion, the aforesaid standalone Ind AS financial statements comply with the Indian Accounting Standards prescribed under Section 133 of the Act.
e) On the basis of the written representations received from the directors as on 31st March, 2017 taken on record by the Board of Directors, none of the directors is disqualified as on 31st March, 2017 from being
appointed as a director in terms of Section 164 (2) of the Act.
f) With respect to the adequacy of the internal financial controls over financial reporting of the Company and the operating effectiveness of such controls, refer to our separate Report in “Annexure B”.
g) With respect to the other matters to be included in the Auditor’s Report in accordance with Rule 11 of the Companies (Audit and Auditors) Rules, 2014, in our opinion and to the best of our information and according to the explanations given to us:
i. The Company has disclosed the impact of pending litigations on its financial position in its Standalone Ind AS financial statements – Refer Note 28 (v) (iii) to the Standalone Ind AS financial statements;
ii. The Company has long-term contracts including derivative contracts for which there were no material foreseeable losses.
iii. There has been no delay in transferring amounts, required to be transferred to the Investor Education and Protection Fund by the company during the year ended 31st March, 2017.
iv. The Company has provided requisite disclosures in its Ind AS financial statements as to holdings as well as dealings in Specified Bank Notes during the period from 8th November, 2016 to 30th December, 2016 and these are in accordance with the books of accounts maintained by the Company.
For SASTRI & SHAH For SCA AND ASSOCIATESChartered Accountants Chartered AccountantsFirm Regn. No. 003643S Firm Regn. No. 101174W
(C R Kumar) (Shivratan Agarwal)Partner PartnerMem. No. 26143 Mem. No. 104180
Chennai, Dated May 04, 2017

60
ANNEXURE ”A” TO THE INDEPENDENT AUDITOR’S REPORT OF EVEN DATE ON THE STANDALONE IND AS FINANCIAL STATEMENTS OF MRF LIMITED
i) In respect of its Fixed Assets:
a) The Company has maintained proper records showing full particulars, including quantitative details and situation of Fixed Assets;
b) As explained to us, the Assets have been physically verified by the management in accordance with a phased programme of verification, which in our opinion is reasonable, considering the size and the nature of its business. The frequency of verification is reasonable and no material discrepancies have been noticed on such physical verification;
c) According to the information and explanations given to us and on the basis of our examination of the records of the Company the title deeds of immovable properties are held in the name of the Company.
ii) The inventory has been physically verified by the management during the year. In our opinion, the frequency of verification is reasonable. No material discrepancies were noticed on such physical verification. As regards materials lying with third parties, confirmations have been obtained;
iii) The Company has not granted any loans, secured or unsecured during the year to companies, firms, limited liability partnerships or other parties covered in the register maintained under section 189 of the Act. Accordingly the clauses 3(iii) (a), (b) and (c) of the Order are not applicable to the Company.
iv) In our opinion and according to the information and explanations given to us, the Company has complied with the provisions of Section 185 and 186 of the Act, with respect to loans and making investments.
v) The Company has complied with the directives issued by Reserve Bank of India and the Provisions of Section 73 to 76 of the Act, and the rules framed thereunder with regard to deposits accepted from the public. We are informed by the management that no order has
been passed by the Company Law Board or National Company Law Tribunal or Reserve Bank of India or any court or any other Tribunal on the Company.
vi) We have broadly reviewed the books of account maintained by the Company pursuant to the rules made by the Central Government for the maintenance of cost records under section 148 (1) of the Act, and are of the opinion that prima facie, the prescribed accounts and records have been made and maintained.
vii) a) The Company is regular in depositing undisputed statutory dues, including Provident Fund, Employees’ State Insurance, Income Tax, Sales-Tax, Service Tax, duty of customs, duty of excise, value added tax, cess and any other statutory dues with appropriate authorities, where applicable. According to the information and explanations given to us, there are no undisputed amounts payable in respect of such statutory dues which have remained outstanding as at 31st March, 2017 for a period of more than six months from the date they became payable.
b) According to the records of the Company, the dues outstanding of income-tax, sales-tax, service tax, duty of customs, duty of excise and value added tax on account of any dispute, are as follows:
Statute and nature of dues
Financial year to which the matter
pertains
Forum where the dispute is
pending
` in
CroresCENTRAL SALES TAX ACT, 1956 & VAT LAWSSales tax / VAT and penalty
2000-01 to 2016-17 Appellate Commissioner
4.14
1997-98 to 2010-11 & 2013-14 to 2016-17
Appellate Tribunal
13.87
1996-97, 2006-07 to 2016-17
High Court 20.45
1996-97, 2000-01 & 2002-03
Supreme Court 0.01

61
Statute and nature of dues
Financial year to which the matter
pertains
Forum where the dispute is
pending
` in
CroresCUSTOMS ACT, 1962Customs Duty and penalty
1992-93 to 1994-95 High Court 74.89
CENTRAL EXCISE ACT, 1944Excise duty and penalty 1997-98 & 2006-07 Appellate
Commissioner 0.09
1993-94, 1999-2000 to 2001-2002 & 2014-15
Appellate Tribunal
1.03
2001-02 Supreme Court 0.06INCOME TAX, 1961Income Tax 2001-02, 2003-04,
2007-08, 2009-10, 2010-11 & 2011-12
High Court 66.04
viii) The Company has not defaulted in repayment of its loans or borrowings to banks and debenture holders.
ix) The Company has not raised any moneys by way of Initial public offer or further Public offer (Including debt instruments), during the year. Moneys raised by way of Term Loan were applied for the purpose for which those are raised.
x) On the basis of our examination and according to the information and explanations given to us, no fraud by the Company or any material fraud on the company by its officers or employees has been noticed or reported during the year, nor have we been informed of any such case by the management.
xi) The managerial remuneration has been paid/provided in accordance with the requisite approvals mandated by the provisions of Section 197 read with Schedule V to the Act.
xii) The Company is not a nidhi Company and accordingly provisions of clause (xii)of Para 3 of the order are not applicable to the Company.
xiii) On the basis of our examination and according to the information and explanations given to us, we report that all the transaction with the related parties are in compliance with Section 177 and 188 of the Act, and the details have been disclosed in the Financial statements in Note no.28 (m) as required by the applicable Ind AS.
xiv) The Company has not made any preferential allotment or private placement of share or fully or partly convertible debentures during the year and accordingly provisions of clause (xiv) of Para 3 of the Order are not applicable to the Company.
xv) According to the information and explanations given to us and based on our examination of the records of the Company, the Company has not entered into any non-cash transactions with directors or persons connected with him. Accordingly provisions of clause (xv) of Para 3 of the Order are not applicable to the company.
xvi) The Company is not required to be registered under section 45-IA of the Reserve Bank of India Act,1934 and accordingly, provisions clause (xvi) of Para 3 of the Order are not applicable to the Company.
For SASTRI & SHAH For SCA AND ASSOCIATESChartered Accountants Chartered AccountantsFirm Regn. No. 003643S Firm Regn. No. 101174W
(C R Kumar) (Shivratan Agarwal)Partner PartnerMem. No. 26143 Mem. No. 104180
Chennai, Dated May 04, 2017

62
“ANNEXURE B” TO THE INDEPENDENT AUDITOR’S REPORT OF EVEN DATE ON THE STANDALONE IND AS FINANCIAL STATEMENTS OF MRF LIMITED.
1. REPORT ON THE INTERNAL FINANCIAL CONTROLS UNDER CLAUSE (I) OF SUB-SECTION 3 OF SECTION 143 OF THE COMPANIES ACT, 2013 (“THE ACT”)
We have audited the internal financial controls over financial reporting of MRF LIMITED (“the Company”) as of March 31, 2017 in conjunction with our audit of the standalone Ind AS financial statements of the Company for the year ended on that date.
2. MANAGEMENT’S RESPONSIBILITY FOR INTERNAL FINANCIAL CONTROLS
The Company’s management is responsible for establishing and maintaining internal financial controls based on the internal control over financial reporting criteria established by the Company considering the essential components of internal control stated in the Guidance Note on Audit of Internal Financial Controls Over Financial Reporting issued by the Institute of Chartered Accountants of India. These responsibilities include the design, implementation and maintenance of adequate internal financial controls that were operating effectively for ensuring the orderly and efficient conduct of its business, including adherence to Company’s policies, the safeguarding of its assets, the prevention and detection of frauds and errors, the accuracy and completeness of the accounting records, and the timely preparation of reliable financial information, as required under the Companies Act, 2013.
3. AUDITORS’ RESPONSIBILITY
Our responsibility is to express an opinion on the Company’s internal financial controls over financial reporting based on our audit. We conducted our audit in accordance with the Guidance
Note on Audit of Internal Financial Controls Over Financial Reporting (the “Guidance Note”) and the Standards on Auditing, issued by Institute of Chartered accountants of India and deemed to be prescribed under section 143(10) of the Companies Act, 2013, to the extent applicable to an audit of internal financial controls, both applicable to an audit of Internal Financial Controls and, both issued by the Institute of Chartered Accountants of India. Those Standards and the Guidance Note require that we comply with ethical requirements and plan and perform the audit to obtain reasonable assurance about whether adequate internal financial controls over financial reporting was established and maintained and if such controls operated effectively in all material respects.
Our audit involves performing procedures to obtain audit evidence about the adequacy of the internal financial controls system over financial reporting and their operating effectiveness. Our audit of internal financial controls over financial reporting included obtaining an understanding of internal financial controls over financial reporting, assessing the risk that a material weakness exists, and testing and evaluating the design and operating effectiveness of internal control based on the assessed risk. The procedures selected depend on the auditor’s judgement, including the assessment of the risks of material misstatement of the financial statements, whether due to fraud or error.
We believe that the audit evidence we have obtained is sufficient and appropriate to provide a basis for our audit opinion on the Company’s internal financial controls system over financial reporting.
4. MEANING OF INTERNAL FINANCIAL CONTROLS OVER FINANCIAL REPORTING
A Company’s internal financial control over financial reporting is a process designed to provide reasonable assurance regarding the

63
reliability of financial reporting and the preparation of financial statements for external purposes in accordance with generally accepted accounting principles. A Company’s internal financial control over financial reporting includes those policies and procedures that (1) pertain to the maintenance of records that, in reasonable detail, accurately and fairly reflect the transactions and dispositions of the assets of the company; (2) provide reasonable assurance that transactions are recorded as necessary to permit preparation of financial statements in accordance with generally accepted accounting principles, and that receipts and expenditures of the Company are being made only in accordance with authorisations of management and directors of the Company; and (3) provide reasonable assurance regarding prevention or timely detection of unauthorised acquisition, use, or disposition of the company’s assets that could have a material effect on the financial statements.
5. INHERENT LIMITATIONS OF INTERNAL FINANCIAL CONTROLS OVER FINANCIAL REPORTING
Because of the inherent limitations of internal financial controls over financial reporting, including the possibility of collusion or improper management override of controls, material misstatements due to error or fraud may occur and not be detected. Also, projections of any evaluation of the internal financial controls over
financial reporting to future periods are subject to the risk that the internal financial control over financial reporting may become inadequate because of changes in conditions, or that the degree of compliance with the policies or procedures may deteriorate.
6. OPINION
In our opinion, the Company has, in all material respects, an adequate internal financial controls system over financial reporting and such internal financial controls over financial reporting were operating effectively as at March 31, 2017, based on the internal control over financial reporting criteria established by the Company considering the essential components of internal control stated in the Guidance Note issued by the Institute of Chartered Accountants of India.
For SASTRI & SHAH For SCA AND ASSOCIATESChartered Accountants Chartered AccountantsFirm Regn. No. 003643S Firm Regn. No. 101174W
(C R Kumar) (Shivratan Agarwal)Partner PartnerMem. No. 26143 Mem. No. 104180
Chennai, Dated May 04, 2017

64
MRF LIMITED, CHENNAIBALANCE SHEET AS AT 31ST MARCH, 2017 ` in Crores Particulars Note As at 31.03.2017 As at 31.03.2016 As at 01.10.2014ASSETSNon-Current Assets Property, Plant and Equipment 2 (a) 5474.35 4584.74 3421.65 Capital Work-in-Progress 2 (b) 846.96 1058.40 626.67 Other Intangible Assets 2 (c) 13.23 9.06 7.04 Financial Assets: Investments 3 1080.57 1044.64 192.54 Loans 4 3.68 10.05 11.82 Others financial assets 5 14.13 12.16 7.48 Other non-current assets 6 339.22 226.06 243.89 Current Assets Inventories 7 2392.92 1879.74 1799.70 Financial Assets: Investments 3 2313.78 2102.75 1086.00 Trade Receivables 8 1959.95 1831.72 1708.47 Cash and cash Equivalents 9 178.35 77.36 255.09 Bank balances other than cash and cash equivalents 10 96.07 3.09 452.58 Other financial assets 5 10.08 10.39 24.37 Other current assets 6 236.33 319.59 151.22 TOTAL ASSETS 14959.62 13169.75 9988.52 EQUITY AND LIABILITIESEquity Equity Share Capital SOCE 4.24 4.24 4.24 Other Equity SOCE 8540.18 7156.97 4730.94 TOTAL EQUITY 8544.42 7161.21 4735.18 LIABILITIESNon-Current Liabilities Financial Liabilities Borrowings 11 1238.32 1486.45 1190.83 Provisions 12 137.26 125.13 87.49 Deferred Tax Liabilities (Net) 13 535.67 351.79 250.61 Other non-current liabilities 14 27.74 36.24 12.65 Current Liabilities Financial Liabilities Borrowings 11 573.34 488.43 616.25 Trade Payables 15 1677.08 1528.82 1130.34 Other Financial Liabilities 16 550.85 442.26 310.60 Other Current Liabilities 14 1491.62 1455.86 1423.76 Provisions 12 120.88 89.65 103.55 Current Tax Liabilities (Net) 62.44 3.91 127.26 Total Liabilities 6415.20 6008.54 5253.34 TOTAL EQUITY AND LIABILITIES 14959.62 13169.75 9988.52 Significant Accounting Policies 1The Notes are an integral part of these financial statements.This is the Balance Sheet referred to in our report of even date.
For SASTRI & SHAH For SCA AND ASSOCIATESChartered Accountants Chartered Accountants
Firm Regn. No. 003643S Firm Regn. No. 101174W JACOB KuRIAN
C R Kumar Shivratan Agarwal MADHu P NAINAN RAvI MANNATH V SRIDHAR K M MAMMENPartner Partner Vice President Finance Company Secretary Directors Chairman & Managing Director
Mem. No. 26143 Mem. No. 104180Chennai, Dated 4th May, 2017

65
MRF LIMITED, CHENNAISTATEMENT OF PROFIT & LOSS FOR THE YEAR ENDED 31ST MARCH, 2017 ` in Crores Particulars Note Year ended 31.03.2017 Period ended 31.03.2016INCOME Revenue from Operations 17 14742.99 22162.04 Other Income 18 335.02 321.17 Total Income 15078.01 22483.21 EXPENSES Cost of materials consumed 19 7679.19 11162.91 Purchases of Stock-in-Trade 28 (b) 42.38 38.89 Changes in inventories of Finished Goods, Stock-in-Trade and Work-in-Progress 20 (222.08) (14.95) Employee Benefits expense 21 983.14 1258.91 Finance Costs 22 245.52 345.44 Depreciation and Amortisation expense 2 (a) & (c) 609.15 734.76 Excise Duty 1497.18 2274.80 Other Expenses 23 2177.16 3076.50 Total Expenses 13011.64 18877.26 PROFIT BEFORE TAX 2066.37 3605.95 TAX EXPENSE Current Tax 457.00 1019.00 MAT Credit Entitlement (34.50) - Deferred Tax 192.79 113.05 Total Tax Expense 615.29 1132.05 PROFIT FOR THE YEAR 1451.08 2473.90 OTHER COMPREHENSIVE INCOME Items that will not be reclassified to Profit or Loss Remeasurements of Defined benefit plans (17.70) (25.02) Income Tax relating to items that will not be reclassified to Profit or Loss 6.13 8.66 Items that may be reclassified to Profit or Loss Designated Cash Flow Hedges (8.06) (9.29) Income tax relating to items that may be reclassified to Profit or Loss 2.79 3.21 TOTAL OTHER COMPREHENSIVE INCOME FOR THE YEAR, NET OF TAX (16.84) (22.44)TOTAL COMPREHENSIVE INCOME FOR THE YEAR 1434.24 2451.46 EARNINGS PER EQUITY SHARE 28 (g)Basic 3421.44 5833.10 Diluted 3421.44 5833.10 Significant Accounting Policies 1The Notes are an integral part of these financial statements.This is the statement of Profit and Loss referred to in our report of even date.
For SASTRI & SHAH For SCA AND ASSOCIATESChartered Accountants Chartered Accountants
Firm Regn. No. 003643S Firm Regn. No. 101174W JACOB KuRIAN
C R Kumar Shivratan Agarwal MADHu P NAINAN RAvI MANNATH V SRIDHAR K M MAMMENPartner Partner Vice President Finance Company Secretary Directors Chairman & Managing Director
Mem. No. 26143 Mem. No. 104180Chennai, Dated 4th May, 2017

66
MRF LIMITED, CHENNAICASH FLOW STATEMENT FOR THE YEAR ENDED 31ST MARCH, 2017 ` in Crores
Particulars Year ended 31.03.2017 Period ended 31.03.2016A. CASH FLOW FROM OPERATING ACTIVITIES:
NET PROFIT BEFORE TAX 2066.37 3605.95 Adjustment for :Depreciation 609.15 734.76 Provision for Impairment of Assets - 23.93 Reversal of Impairment of Assets (1.62) - Unrealised Exchange (Gain) / Loss 0.58 2.60 Provision for Doubtful debts 0.45 - Finance Cost (including fair value change in financial instruments) 215.91 273.05 Dividend Income (0.22) (0.22)Loss / (Gain) on Sale / Disposal of Fixed Assets 3.50 6.54 Fair Value changes in Investments (277.30) (173.66)Loss / (Gain) on Sale of Investments (0.01) 550.44 (74.25) 792.75 OPERATING PROFIT/(LOSS) BEFORE WORKING CAPITAL CHANGES 2616.81 4398.70 Trade receivables (130.18) (128.95)Loans (Financial assets) 5.84 3.37 Other receivables 78.77 (186.04)Inventories (513.18) (80.04)Trade Payable and Provisions 168.29 401.88 Other liabilities (30.70) (421.16) 159.37 169.59 CASH GENERATED FROM OPERATIONS 2195.65 4568.29 Direct Taxes paid (399.62) (1161.06)NET CASH FROM OPERATING ACTIvITIES 1796.03 3407.23
B. CASH FLOW FROM INVESTING ACTIVITIESPurchase of Fixed Assets (1364.76) (2303.15)Proceeds from sale of Fixed Assets 1.18 3.33 Purchase of Investments - (2342.14)Proceeds from sale of Investments 30.35 727.26 Investment in Subsidiary Companies - (6.06)Fixed Deposits with Banks (92.20) 449.57 Interest Income 25.48 64.75 Dividend income 0.22 0.22 NET CASH uSED IN INvESTING ACTIvITIES (1399.73) (3406.22)
C. CASH FLOW FROM FINANCING ACTIVITIES(Repayments) / Proceeds from Working Capital Facilities (Net) 84.91 (127.82)(Repayments)/proceeds from Term Loans (Net) (73.90) 472.87 Repayment of Debentures - (135.00)(Repayments) / Proceeds from Fixed Deposits (Net) (1.97) (28.24)Sales Tax Deferral (11.40) (6.72)Deferred payment Credit (0.38) (12.50)Interest paid (241.54) (314.63)Dividend and Corporate Dividend Tax (51.03) (26.70)NET CASH FROM FINANCING ACTIvITIES (295.31) (178.74)NET INCREASE/(DECREASE) IN CASH AND CASH EQuIvALENTS 100.99 (177.73)CASH AND CASH EQuIvALENTS AS AT 31ST MARCH, 2016 77.36 255.09 CASH AND CASH EQuIvALENTS AS AT 31ST MARCH, 2017 178.35 77.36
Note: The above Cash Flow Statement has been prepared under the Indirect Method.This is the Cash Flow statement referred to in our report of even date.
For SASTRI & SHAH For SCA AND ASSOCIATESChartered Accountants Chartered Accountants
Firm Regn. No. 003643S Firm Regn. No. 101174W JACOB KuRIAN
C R Kumar Shivratan Agarwal MADHu P NAINAN RAvI MANNATH V SRIDHAR K M MAMMENPartner Partner Vice President Finance Company Secretary Directors Chairman & Managing Director
Mem. No. 26143 Mem. No. 104180Chennai, Dated 4th May, 2017

67
NOTES FORMING PART OF THE STANDALONE FINANCIAL STATEMENTS FOR THE YEAR ENDED 31ST MARCH, 2017
Note 1 - Standalone Accounting Policies under IND AS
A) General Information
MRF Limited (the “Company”) is a limited company, incorporated on 5th November, 1960 in India, whose shares are publicly traded.
The Company is India’s largest tyre manufacturer and ranked amongst the Top 20 Global Manufacturers, with 9 state-of-the-art factories across India. It is also India’s largest Original Equipment Manufacturer (OEM) tyre supplier with an expansive tyre range from two-wheelers to fighter aircrafts.
The Registered Office is located at No.114, Greams Road, Chennai-600 006.
The Company is the ultimate parent of MRF Limited Group.
B) Basis of preparation of financial statements
The principal accounting policies applied in the preparation of these financial statements are set out below. These policies have been consistently applied to all the years presented.
The Company has adopted the Indian Accounting Standards (Índ AS’) in accordance with Ind AS 101 – First Time Adoption of Indian Accounting Standards. The Company has transited from its previous GAAP as defined in Ind AS 101 with the necessary disclosures relating to reconciliation of Shareholders equity under Previous GAAP and Ind AS and of the net profit as Previous GAAP and Total Comprehensive Income under Ind AS. Refer Note 24 (a), (b), (c).
i. Statement of Compliance
In accordance with the notification issued by the Ministry of Corporate Affairs, the Company has adopted Indian Accounting Standards (referred to as “IND AS”) notified under the Companies (Indian Accounting Standards) Rules, 2015 with effect from April 1, 2016. These financial statements have been prepared in accordance with IND AS as prescribed under Section 133 of the Companies Act, 2013 read together
with the Companies (Indian Accounting Standards) Rules, 2015 and subsequent amendments thereto.
The Financial Statement for the year ended 31st March, 2017 is the first Financial Statement, the Company has prepared in accordance with IND AS. (Refer Para D below for the details of first-time adoption exemptions availed by the Company.)
ii. Basis of preparation and presentation
The financial statements have been prepared on historical cost basis considering the applicable provisions of Companies Act 2013, except for the following items that have been measured at fair value as required by relevant IND AS. Historical cost is generally based on the fair value of the consideration given in exchange for goods and services at the time of initial recognition.
a) Certain financial assets/liabilities measured at fair value (refer accounting policy regarding financial instruments) and
b) Any other item as specifically stated in the accounting policy.
The Financial Statement are presented in INR and all values are rounded off to Rupees Crores unless otherwise stated.
The financial statements of the Company for the year ended 31st March, 2017 were authorised for issue in accordance with a resolution of the directors on 4th May, 2017.
iii. Comparative Reporting Period
In view of the requirement of Companies Act, 2013, regarding uniform financial year for all Companies, the Company changed its financial year end from 30th September to 31st March. The company had reported for 18 months from 1st October 2014 to 31st March 2016 under previous GAAP. Therefore, the comparative reporting period for the company is of 18 months from 1st October 2014 to 31st March 2016. In view of the reporting period of current year and
68
comparative period not being same, the financial statements are not entirely comparable.
iv. Use of Estimate and judgment
In the application of accounting policy which are described in Para C below, the management is required to make judgment, estimates and assumptions about the carrying amount of assets and liabilities, income and expenses, contingent liabilities and the accompanying disclosures that are not readily apparent from other sources. The estimates and associated assumptions are based on historical experience and other factors that are considered to be relevant and are prudent and reasonable. Actual results may differ from those estimates. The estimates and underlying assumptions are reviewed on ongoing basis. Revisions to accounting estimates are recognised in the period in which the estimates are revised if the revision affects only that period, or in the period of revision and future periods if the revision affects both current and future period.
The few critical estimations and judgments made in applying accounting policies are:
Property, Plant and Equipment:
Useful life of Property, Plant and Equipment and Intangible Assets are as specified in Schedule II to the Companies Act, 2013 and on certain assets based on technical advice which considered the nature of the asset, the usage of the asset, expected physical wear and tear, the operating conditions of the asset, anticipated technological changes, manufacturers warranties and maintenance support.
Inventories:
Inventory obsolescence is based on assessment of the future uses. In all cases, inventory is carried at the lower of historical cost and net realisable value.
Lease:
Lease accounting after evaluating the right to use the underlying assets, substance of the transactions including legally enforceable arrangements and other significant terms
and conditions of the arrangement to conclude whether the arrangements meet the criteria under IND AS 17.
Impairment of Non-financial Assets:
The Company assesses at each reporting date whether there is an indication that an asset may be impaired. If any indication exists, or when annual impairment testing for an asset is required, the Company estimates the asset’s recoverable amount. An asset’s recoverable amount is the higher of an asset’s or CGU’s fair value less costs of disposal and its value in use. It is determined for an individual asset, unless the asset does not generate cash inflows that are largely independent of those from other assets or groups of assets. Where the carrying amount of an asset or CGU exceeds its recoverable amount, the asset is considered impaired and is written down to its recoverable amount. In assessing value in use, the estimated future cash flows are discounted to their present value using a pre-tax discount rate that reflects current market assessments of the time value of money and the risks specific to the asset. In determining fair value less costs of disposal, recent market transactions are taken into account. If no such transactions can be identified, an appropriate valuation model is used. These calculations are corroborated by valuation multiples or other available fair value indicators.
Impairment of Financial Assets:
The impairment provisions for financial assets are based on assumptions about risk of default and expected loss rates. The Company uses judgement in making these assumptions and selecting the inputs to the impairment calculation, based on Company’s past history, existing market conditions as well as forward looking estimates at the end of each reporting period.
Defined Benefit Plans:
The cost of the defined benefit plan and other post-employment benefits and the present value of such obligations are determined using actuarial valuations. An actuarial valuation involves making various assumptions that may differ from actual developments in the future. These include

69
the determination of the discount rate, future salary increases, mortality rates and attrition rate. Due to the complexities involved in the valuation and its long-term nature, a defined benefit obligation is highly sensitive to changes in these assumptions. All assumptions are reviewed at each reporting date.
Fair Value Measurement of Financial Instruments:
When the fair values of financial assets and financial liabilities recorded in the balance sheet cannot be measured based on quoted prices in active markets, their fair value is measured using valuation techniques including the Discounted Cash Flow (DCF) model. The inputs to these models are taken from observable markets where possible, but where this is not feasible, a degree of judgement is required in establishing fair values. Judgments include considerations of inputs such as liquidity risk, credit risk and volatility. Changes in assumptions about these factors could affect the reported fair value of financial instruments.
C) Summary of Significant Accounting Policies:
1) Property, Plant and Equipment (PPE)
For transition to Ind AS, the Company has elected to continue with the carrying value of Property, Plant and Equipment (‘PPE’) recognized as of 1st October, 2014 (transition date) measured as per the Previous GAAP and use that carrying value as its deemed cost of the PPE as on the transition date.
Property, Plant and Equipment are stated at cost less accumulated depreciation and accumulated impairment losses except for freehold land which is not depreciated. Cost includes purchase price after deducting trade discount / rebate, import duties, non-refundable taxes, cost of replacing the component parts, borrowing costs and other directly attributable cost of bringing the asset to its working condition in the manner intended by the management.
Spares parts procured along with the Plant and Equipment or subsequently which meets the definition and recognition criteria of PPE considering the concept of materiality are capitalized and added to the carrying amount of such items. The carrying amount of those spare parts that are replaced is derecognized when no future economic benefits are expected from their use or upon disposal. Other machinery spares are treated as ‘stores and spares’ forming part of the inventory. If the cost of the replaced part is not available, the estimated cost of similar new parts is used as an indication of what the cost of the existing part was when the item was acquired.
An item of PPE is derecognised on disposal or when no future economic benefits are expected from use or disposal. Any gain or loss arising on derecognition of an item of property, plant and equipment is determined as the difference between the net disposal proceeds and the carrying amount of the asset and is recognized in Statement of Profit and Loss when asset is derecognised.
Expenditure on acquisition of PPE for Research and Development (R&D) is included in PPE and depreciation thereon is provided as applicable.
The depreciable amount of an asset is determined after deducting its residual value. Where the residual value of an asset increases to an amount equal to or greater than the asset’s carrying amount, no depreciation charge is recognised till the asset’s residual value decreases below the asset’s carrying amount. Depreciation of an asset begins when it is available for use, i.e., when it is in the location and condition necessary for it to be capable of operating in the intended manner. Depreciation of an asset ceases at the earlier of the date that the asset is classified as held for sale in accordance with IND AS 105 and the date that the asset is derecognised. Depreciation on all assets except Renewable Energy Saving Devices is provided on straight line basis whereas depreciation on renewable energy saving devices is provided on reducing balance basis.

70
Description of the Asset Estimated Useful lifeTangible:Land - Leasehold Primary period of leaseBuilding – Factory 30 Years – Other than factory
buildings60 Years
Plant and Equipment 10 YearsMoulds 6 YearsFurniture and Fixtures 5 YearsComputer Servers 5 YearsComputers 3 YearsOffice Equipment 5 YearsOther Assets, viz., Electrical Fittings, Fire Fighting/Other Equipments and Canteen Utensils
10 Years
Renewable Energy Saving Device - Windmills
22 Years
Vehicles 5 YearsIntangible: Software 5 Years
Depreciation on the Property, Plant and Equipment, except for Plant and Machinery, Moulds, Vehicles, Furniture and Fixtures and Computer Servers is provided over the useful life of assets on straight line method as specified in Schedule II to the Companies Act, 2013. Plant and Machinery, Moulds, Vehicles, Furniture and Fixtures and Computer Servers are depreciated based on management estimate of the useful life of the assets, which considered the nature of the asset, the usage of the asset, expected physical wear and tear, the operating conditions of the asset, anticipated technological changes, manufacturers warranties and maintenance support.
Further, the Company has identified and determined separate useful life for each major component of fixed assets, if they are materially different from that of the remaining assets, for providing depreciation in compliance with Schedule II of the Companies Act, 2013.
Depreciation on fixed assets added/disposed off during the period is provided on pro-rata basis with reference to the date of addition/disposal.
The assets’ residual values, useful lives and methods of depreciation are reviewed at each financial year end and adjusted prospectively, if appropriate.
Leasehold Land is amortised over the primary period of the lease.
2) Intangible Assets
Intangible assets acquired separately are measured on initial recognition at cost. After initial recognition, intangible assets are carried at cost less any accumulated amortisation and accumulated impairment losses.
Software (not being an integral part of the related hardware) acquired for internal use are treated as intangible assets.
An item of Intangible asset is derecognised on disposal or when no future economic benefits are expected from its use or disposal. Any profit or loss arising from derecognition of an intangible asset are measured as the difference between the net disposal proceeds and the carrying amount of the asset and are recognised in the Statement of Profit and Loss when the asset is derecognised.
Intangible Assets are amortised over 5 years on straight-line method over the estimated useful economic life of the assets.
3) Impairment of tangible (PPE) and intangible assets
At the end of each reporting period, the Company reviews the carrying amounts of its PPE and other intangible assets to determine whether there is any indication that these assets have suffered an impairment loss. If any such indication exists, the recoverable amount of the asset is estimated in order to determine the extent of the impairment loss. Where it is not possible to estimate the recoverable amount of an individual asset, the Company estimates the recoverable amount of the cash-generating unit (CGU) to which the asset belongs. When the carrying amount of an asset or CGU exceeds its recoverable

71
amount, the asset is considered impaired and is written down to its recoverable amount. The resulting impairment loss is recognised in the Statement of Profit and Loss
Recoverable amount is the higher of fair value less costs to sell and value in use. In assessing value in use, the estimated future cash flows are discounted to their present value using a pre-tax discount rate that reflects current market assessments of the time value of money and the risks specific to the asset. In determining fair value less costs of disposal, recent market transactions are taken into account. If no such transactions can be identified, an appropriate valuation model is used.
Where an impairment loss subsequently reverses, the carrying amount of the asset or CGU is increased to the revised estimate of its recoverable amount, but so that the increased carrying amount does not exceed the carrying amount that would have been determined had no impairment loss been recognised for the asset or CGU in prior years. A reversal of an impairment loss is recognised in the Statement of Profit and Loss.
4) Inventories
Inventories consisting of stores and spares, raw materials, work in progress, stock in trade and finished goods are valued at lower of cost and net realisable value. However, materials held for use in production of inventories are not written down below cost, if the finished products are expected to be sold at or above cost.
The cost is computed on FIFO basis except for stores and spares which are on daily moving Weighted Average Cost basis and is net of credits under CENvAT/vAT Schemes.
Goods and materials in transit include materials, duties and taxes (other than those subsequently recoverable from tax authorities) labour cost and other related overheads incurred in bringing the inventories to their present location and condition.
Traded goods includes cost of purchase and other costs incurred in bringing the inventories to their present location and condition.
Net realisable value is the estimated selling price in the ordinary course of business, less estimated cost of completion and estimated cost necessary to make the sale.
Obsolete and slow moving items are subjected to continuous technical monitoring and are valued at lower of cost and estimated net realisable value.
5) Leases
The determination of whether an arrangement is (or contains) a lease is based on the substance of the arrangement at the inception of the lease. The arrangement is (or contains) a lease, if fulfillment of the arrangement is dependent on the use of a specific asset or assets and the arrangement conveys a right to use the asset or assets, even if that right is not explicitly specified in an arrangement.
Finance leases that transfer substantially all the risks and benefits incidental to ownership of the leased item (i.e. PPE), are generally capitalized at the inception of the lease at the fair value of the leased assets or, if lower, at the present value of minimum lease payments. Lease payments are apportioned between finance charges and a reduction in lease liability so as to achieve a constant rate of interest on the remaining balance of the liability. Finance charges are recognized in finance costs in the Statement of Profit and Loss.
Leases in which a significant portion of the risks and rewards of ownership are not transferred to the Company as lessee are classified as operating leases. Payments made under operating leases are charged to Statement of Profit and Loss over the period of lease on straight line basis other than those cases where the escalations are linked to expected general inflation in which case they are charged on contractual terms.
6) Government Grants
Government grants are recognized when there is reasonable assurance that the Company will comply with the conditions attached to them and that the grants will be received.
72
Grants related to income are recognized as income over the periods necessary to match them with the costs for which they are intended to compensate on a systematic basis. Government grants that are receivable as compensation for expenses or losses already incurred or for the purpose of providing immediate financial support with no future related costs are recognized in the Statement of Profit and Loss in the period in which they become receivable. Grants related to income are presented under other income in the Statement of Profit and Loss except for grants received in the form of rebate or exemption which are deducted in reporting the related expense.
The benefit of a government loan at a below-market rate of interest is treated as a government grant, measured as the difference between proceeds received and the fair value of the loan based on prevailing market interest rates.
7) Provisions, Contingent Liabilities and Contingent Assets
Provisions are recognised when there is a present legal or constructive obligation as a result of a past event and it is probable (i.e. more likely than not) that an outflow of resources embodying economic benefits will be required to settle the obligation and a reliable estimate can be made of the amount of the obligation. Such provisions are determined based on management estimate of the amount required to settle the obligation at the balance sheet date. When the Company expects some or all of a provision to be reimbursed, the reimbursement is recognised as a standalone asset only when the reimbursement is virtually certain.
If the effect of the time value of money is material, provisions are discounted using a current pre-tax rate that reflects, the risks specific to the liability. When discounting is used, the increase in the provision due to the passage of time is recognised as a finance cost.
Present obligations arising under onerous contracts are recognised and measured as provisions. An onerous contract is considered to exist when a contract under which the unavoidable costs of meeting the obligations exceed the economic benefits expected to be received from it.
Contingent liabilities are disclosed on the basis of judgment of management / independent experts. These are reviewed at each balance sheet date and are adjusted to reflect the current management estimate.
Provisions for warranty-related costs are recognized when the product is sold to the customer. Initial recognition is based on scientific basis as per past trends of such claims. The initial estimate of warranty-related costs is revised annually.
Contingent Assets are not recognized, however, disclosed in financial statement when inflow of economic benefits is probable.
8) Foreign Currency Transactions
The financial statements of Company are presented in INR, which is also the functional currency. In preparing the financial statements, transactions in currencies other than the entity’s functional currency are recognised at the rates of exchange prevailing at the dates of the transactions. At the end of each reporting period, monetary items denominated in foreign currencies are translated at the rates prevailing at that date. Non-monetary items denominated in foreign currency are reported at the exchange rate ruling on the date of transaction.
9) Share Capital and Share Premium
Ordinary shares are classified as equity, incremental costs directly attributable to the issue of new shares are shown in equity as a deduction net of tax from the proceeds. Par value of the equity share is recorded as share capital and the amount received in excess of the par value is classified as share premium.
10) Dividend Distribution to equity shareholders
The Company recognizes a liability to make cash distributions to equity holders when the distribution is authorized and the distribution is no longer at the discretion of the Company. A distribution is authorized when it is approved by the shareholders. A corresponding amount is recognized directly in other equity along with any tax thereon.

73
11) Cash Flows and Cash and Cash Equivalents
Statement of cash flows is prepared in accordance with the indirect method prescribed in the relevant IND AS. For the purpose of presentation in the statement of cash flows, cash and cash equivalents includes cash on hand, cheques and drafts on hand, deposits held with Banks, other short-term, highly liquid investments with original maturities of three months or less that are readily convertible to known amounts of cash and which are subject to an insignificant risk of changes in value, and book overdrafts. However, Book overdrafts are shown within borrowings in current liabilities in the balance sheet for the purpose of presentation.
12) Revenue Recognition
Revenue is recognized to the extent that it is probable that the economic benefits will flow to the Company and the revenue can be reliably measured, regardless of when the payment is being made. Revenue is measured at the fair value of the consideration received or receivable, taking into account contractually defined terms of payment and excluding taxes or duties collected on behalf of the government.
Sale of Goods
Revenue from sale of goods is recognized, when all significant risks and rewards are transferred to the buyer, as per the terms of the contracts and no significant uncertainty exists regarding the amount of the consideration that will be derived from the sale of goods. It includes excise duty and excludes value added tax/sales tax. It is measured at fair value of consideration received or receivable, net of returns and allowances, trade discounts and volume rebates.
Rendering of Services
Revenue from rendering of services is recognized as per the terms of the contract with customers when related services are performed and when the outcome of the transactions involving rendering of services can be estimated reliably.
Dividend Income
Dividend Income is accounted for when the right to receive the same is established, which is generally when shareholders approve the dividend.
Interest Income
Interest Income on financial assets measured at amortised cost is recognised on a time-proportion basis using the effective interest method.
13) Borrowing costs
Borrowing cost includes interest, commitment charges, brokerage, underwriting costs, discounts / premiums, financing charges, exchange difference to the extent they are regarded as interest costs and all ancillary / incidental costs incurred in connection with the arrangement of borrowing.
Borrowing costs which are directly attributable to acquisition / construction of qualifying assets that necessarily takes a substantial period of time to get ready for its intended use are capitalized as a part of cost pertaining to those assets. All other borrowing costs are recognised as expense in the period in which they are incurred.
14) Employee Benefits
a) Short Term Employee Benefits
All employee benefits payable wholly within twelve months of rendering services are classified as short term employee benefits. Benefits such as salaries, wages, short-term compensated absences, performance incentives etc., are recognized during the period in which the employee renders related services and are measured at undiscounted amount expected to be paid when the liabilities are settled.
b) Long Term Employee Benefits
The cost of providing long term employee benefit such as earned leave is measured as the present value of expected future payments to be made in respect of

74
services provided by employees upto the end of the reporting period. The expected costs of the benefit is accrued over the period of employment using the same methodology as used for defined benefits post employment plans. Actuarial gains and losses arising from the experience adjustments and changes in actuarial assumptions are charged or credited to the Statement of Profit and Loss in which they arise except those included in cost of assets as permitted. The benefit is valued annually by independent actuary.
c) Post Employment Benefits
The Company provides the following post employment benefits:
i) Defined benefit plans such as gratuity, trust managed Provident Fund and post-retirement medical benefit (PRMB); and
ii) Defined contributions plans such as provident fund, pension fund and superannuation fund.
d) Defined benefits Plans
The cost of providing benefits on account of gratuity and post retirement medical benefits / obligations are determined using the projected unit credit method on the basis of actuarial valuation made at the end of each balance sheet date, which recognises each period of service as given rise to additional unit of employees benefit entitlement and measuring each unit separately to build up the final obligation. The yearly expenses on account of these benefits are provided in the books of accounts.
The net interest cost is calculated by applying the discount rate to the net balance of the defined benefit obligation and the fair value of plan assets. This cost is included in employee benefit expense in the Statement of Profit and Loss except those included in cost of assets as permitted.
Re-measurements comprising of actuarial gains and losses arising from experience adjustments and change in actuarial assumptions, the effect of change in assets ceiling (if applicable) and the return on plan asset (excluding net interest as defined above) are recognized in other comprehensive income (OCI) except those included in cost of assets as permitted in the period in which they occur. Re-measurements are not reclassified to the Statement of Profit and Loss in subsequent periods.
Service cost (including current service cost, past service cost, as well as gains and losses on curtailments and settlements) is recognized in the Statement of Profit and Loss except those included in cost of assets as permitted in the period in which they occur.
Eligible employees of the company receive benefits from a provident fund trust which is a defined benefit plan. Both the eligible employee and the company make monthly contributions to the provident fund plan equal to a specified percentage of the covered employees salary. The Company contributes a part of the contribution to the provident fund trusts. The trusts invests in specific designated instruments as permitted by Indian Law. The remaining portion is contributed to the Government Administered Pension Fund. The rate at which the annual interest is payable to the beneficiaries by the trusts is administered by the Government. The Company has obligation to make good the shortfall, if any, between the return from investments of the Trusts and the notified interest rate. However, as at the year end no shortfall remains unprovided for.
e) Defined Contribution Plans
Payments to defined contribution retirement benefit plans, viz., Provident Fund for certain eligible employees, Pension Fund and Superannuation benefits are recognized as an expense when employees have rendered the service entitling them to the contribution.

75
15) Taxes on Income
Income tax expense represents the sum of tax currently payable and deferred tax. Tax is recognized in the Statement of Profit and Loss, except to the extent that it relates to items recognized directly in equity or in other comprehensive income.
a) Current Tax
Current tax includes provision for Income Tax computed under Special provision (i.e., Minimum alternate tax) or normal provision of Income Tax Act. Tax on Income for the current period is determined on the basis on estimated taxable income and tax credits computed in accordance with the provisions of the relevant tax laws and based on the expected outcome of assessments/appeals.
b) Deferred Tax
Deferred tax is recognised on temporary differences between the carrying amounts of assets and liabilities in the balance sheet and the corresponding tax bases used in the computation of taxable profit. Deferred tax liabilities are generally recognised for all taxable temporary differences. Deferred tax assets are generally recognised for all deductible temporary differences, unabsorbed losses and unabsorbed depreciation to the extent that it is probable that future taxable profits will be available against which those deductible temporary differences, unabsorbed losses and unabsorbed depreciation can be utilised.
The carrying amount of deferred tax assets is reviewed at each balance sheet date and reduced to the extent that it is no longer probable that sufficient taxable profits will be available to allow all or part of the asset to be recovered.
Deferred tax assets and liabilities are measured at the tax rates that are expected to apply in the period in which the liability is settled or the asset realised, based on tax rates (and tax laws) that have been enacted or substantively enacted by the balance sheet date. The measurement of deferred tax
liabilities and assets reflects the tax consequences that would follow from the manner in which the Company expects, at the reporting date, to recover or settle the carrying amount of its assets and liabilities.
Deferred tax assets and liabilities are offset when there is a legally enforceable right to set off current tax assets against current tax liabilities and when they relate to income taxes levied by the same taxation authority and the Company intends to settle its current tax assets and liabilities on a net basis.
16) Earnings per Share
Basic earnings per share is calculated by dividing the profit from continuing operations and total profit, both attributable to equity shareholders of the Company by the weighted average number of equity shares outstanding during the period.
17) Current versus non-current classification
The Company presents assets and liabilities in the Balance Sheet based on current/non-current classification.
a) An asset is current when it is:
- Expected to be realized or intended to be sold or consumed in the normal operating cycle,
- Held primarily for the purpose of trading,
- Expected to be realised within twelve months after the reporting period, or
- Cash or cash equivalent unless restricted from being exchanged or used to settle a liability for at least twelve months after the reporting period.
All other assets are classified as non-current.
b) A liability is current when:
- It is expected to be settled in the normal operating cycle,

76
- It is held primarily for the purpose of trading,
- It is due to be settled within twelve months after the reporting period, or
- There is no unconditional right to defer the settlement of the liability for at least twelve months after the reporting period.
All other liabilities are classified as non-current.
c) Deferred tax assets and liabilities are classified as non-current assets and liabilities.
The operating cycle is the time between the acquisition of assets for processing and their realization in cash and cash equivalents. The Company has identified twelve months as its operating cycle.
18) Fair value measurement
Fair value is the price that would be received to sell an asset or paid to transfer a liability in an orderly transaction between market participants at the measurement date, regardless of whether that price is directly observable or estimated using another valuation technique. In estimating the fair value of an asset or a liability, the Company takes into account the characteristics of asset and liability if market participants would take those into consideration. Fair value for measurement and / or disclosure purposes in these financial statements is determined in such basis except for transactions in the scope of Ind AS 2, 17 and 36. Normally at initial recognition, the transaction price is the best evidence of fair value.
The fair value of an asset or a liability is measured using the assumptions that market participants would use when pricing the asset or liability, assuming that market participants act in their economic best interest. A fair value measurement of a non-financial asset takes into account a market participant’s ability to generate economic benefits by using the asset in its highest and best use or by selling it to another market participant that would use the asset in its highest and best use.
The Company uses valuation techniques that are appropriate in the circumstances and for which sufficient data are available to measure fair value, maximizing the use of relevant observable inputs and minimizing the use of unobservable inputs.
All financial assets and financial liabilities for which fair value is measured or disclosed in the financial statements are categorized within the fair value hierarchy, described as follows, based on the lowest level input that is significant to the fair value measurement as a whole:
Level 1 — Quoted (unadjusted) market prices in active markets for identical assets or liabilities.
Level 2 — Valuation techniques for which the lowest level input that is significant to the fair value measurement is directly or indirectly observable.
Level 3 — Valuation techniques for which the lowest level input that is significant to the fair value measurement is unobservable.
Financial assets and Financial liabilities that are recognized at fair value on a recurring basis, the Company determines whether transfers have occurred between levels in the hierarchy by re-assessing categorization at the end of each reporting period.
19) Financial Instruments
A financial instrument is any contract that gives rise to a financial asset of one entity and a financial liability or equity instrument of another entity. The Company recognizes a financial asset or financial liability in its balance sheet only when the entity becomes party to the contractual provisions of the instrument.
a) Financial Assets
A financial asset inter-alia includes any asset that is cash, equity instrument of another entity or contractual obligation to receive cash or another financial asset or to exchange financial asset or financial liability under condition that are potentially favourable to the Company.
77
Investments in subsidiaries
Investments in equity shares of subsidiaries are carried at cost less impairment. Impairment is provided for on the basis explained in Para C (3) above.
Financial assets other than investment in subsidiaries
Financial assets of the Company comprise trade receivable, cash and cash equivalents, Bank balances, Investments in equity shares of companies other than in subsidiaries, investment other than equity shares, loans/advances to employee / related parties / others, security deposit, claims recoverable etc.
Initial recognition and measurement
All financial assets are recognized initially at fair value plus, in the case of financial assets not recorded at fair value through profit or loss, transaction costs that are attributable to the acquisition of the financial asset. Transaction costs of financial assets carried at fair value through profit or loss are expensed in Statement of Profit and Loss. Where transaction price is not the measure of fair value and fair value is determined using a valuation method that uses data from observable market, the difference between transaction price and fair value is recognized in Statement of Profit and Loss and in other cases spread over life of the financial instrument using effective interest method.
Subsequent measurement
For purposes of subsequent measurement financial assets are classified in three categories:
- Financial assets measured at amortized cost
- Financial assets at fair value through OCI
- Financial assets at fair value through profit or loss
Financial assets measured at amortized cost
Financial assets are measured at amortized cost if the financials asset is held within a business model whose objective is to hold financial assets in order to collect contractual cash flows and the contractual terms of the financial asset give rise on specified dates to cash flows that are solely payments of principal and interest on the principal amount outstanding. These financials assets are amortized using the effective interest rate (EIR) method, less impairment. Amortized cost is calculated by taking into account any discount or premium on acquisition and fees or costs that are an integral part of the EIR. The EIR amortization is included in finance income in the statement of profit and loss. The losses arising from impairment are recognized in the statement of profit and loss in finance costs.
Financial assets at fair value through OCI (FVTOCI)
Financial assets are measured at fair value through other comprehensive income if the financial asset is held within a business model whose objective is achieved by both collecting contractual cash flows and selling financial assets and the contractual terms of the financial asset give rise on specified dates to cash flows that are solely payments of principal and interest on the principal amount outstanding. At initial recognition, an irrevocable election is made (on an instrument-by-instrument basis) to designate investments in equity instruments other than held for trading purpose at FVTOCI. Fair value changes are recognized in the other comprehensive income (OCI). However, the Company recognizes interest income, impairment losses and reversals and foreign exchange gain or loss in the income statement. On derecognition of the financial asset other than equity instruments, cumulative gain or loss previously recognised in OCI is reclassified to income statements.

78
Financial assets at fair value through profit or loss (FVTPL)
Any financial asset that does not meet the criteria for classification as at amortized cost or as financial assets at fair value through other comprehensive income, is classified as financial assets at fair value through profit or loss. Further, financial assets at fair value through profit or loss also include financial assets held for trading and financial assets designated upon initial recognition at fair value through profit or loss. Financial assets are classified as held for trading if they are acquired for the purpose of selling or repurchasing in the near term. Financial assets at fair value through profit or loss are fair valued at each reporting date with all the changes recognized in the Statement of profit and loss.
Derecognition
The Company derecognises a financial asset only when the contractual rights to the cash flows from the asset expire, or when it transfers the financial asset and substantially all the risks and rewards of ownership of the asset to another entity. If the Company neither transfers nor retains substantially all the risks and rewards of ownership and continues to control the transferred asset, the Company recognizes its retained interest in the asset and an associated liability for amounts it may have to pay.
Impairment of financial assets
The Company assesses impairment based on expected credit loss (ECL) model on the following:
- Financial assets that are measured at amortised cost.
- Financial assets measured at fair value through other comprehensive income (FVTOCI).
ECL is measured through a loss allowance on a following basis:-
- The 12 month expected credit losses (expected credit losses that result from those default events on the financial instruments that are possible within 12 months after the reporting date)
- Full life time expected credit losses (expected credit losses that result from all possible default events over the life of financial instruments)
The Company follows ‘simplified approach’ for recognition of impairment on trade receivables or contract assets resulting from normal business transactions. The application of simplified approach does not require the Company to track changes in credit risk. However, it recognises impairment loss allowance based on lifetime ECLs at each reporting date, from the date of initial recognition.
For recognition of impairment loss on other financial assets, the Company determines whether there has been a significant increase in the credit risk since initial recognition. If credit risk has increased significantly, lifetime ECL is provided. For assessing increase in credit risk and impairment loss, the Company assesses the credit risk characteristics on instrument-by-instrument basis.
ECL is the difference between all contractual cash flows that are due to the Company in accordance with the contract and all the cash flows that the entity expects to receive (i.e., all cash shortfalls), discounted at the original EIR.
Impairment loss allowance (or reversal) recognized during the period is recognized as expense/income in the statement of profit and loss.
b) Financial Liabilities
The Company’s financial liabilities include loans and borrowings including book overdraft, trade payable, accrued expenses and other payables.
79
Initial recognition and measurement
All financial liabilities at initial recognition are classified as financial liabilities at amortized cost or financial liabilities at fair value through profit or loss, as appropriate. All financial liabilities are recognized initially at fair value and, in the case of loans and borrowings and payables, net of directly attributable transaction costs. Any difference between the proceeds (net of transaction costs) and the fair value at initial recognition is recognised in the Statement of Profit and Loss or in the “Expenditure Attributable to Construction” if another standard permits inclusion of such cost in the carrying amount of an asset over the period of the borrowings using the effective rate of interest.
Subsequent measurement
The subsequent measurement of financial liabilities depends upon the classification as described below:-
Financial Liabilities classified as Amortised Cost:
Financial Liabilities that are not held for trading and are not designated as at FVTPL are measured at amortised cost at the end of subsequent accounting periods. Amortised cost is calculated by taking into account any discount or premium on acquisition and fees or costs that are an integral part of the Effective Interest Rate. Interest expense that is not capitalised as part of costs of assets is included as Finance costs in the Statement of Profit and Loss.
Financial Liabilities at Fair value through profit and loss (FVTPL)
FvTPL includes financial liabilities held for trading and financial liabilities designated upon initial recognition as FvTPL. Financial liabilities are classified as held for trading if they are incurred for the purpose of repurchasing in the near term. Financial liabilities have not been designated upon initial recognition at FVTPL.
Derecognition
A financial liability is derecognised when the obligation under the liability is discharged / cancelled / expired. When an existing financial liability is replaced by another from the same lender on substantially different terms, or the terms of an existing liability are substantially modified, such an exchange or modification is treated as the de recognition of the original liability and the recognition of a new liability. The difference in the respective carrying amounts is recognized in the statement of profit and loss.
Offsetting of financial instruments
Financial assets and Financial liabilities are offset and the net amount is reported in the balance sheet if there is a currently enforceable legal right to offset the recognised amounts and there is an intention to settle on a net basis, to realise the assets and settle the liabilities simultaneously.
c) Derivatives
Derivative instruments are initially recognized at fair value on the date a derivative contract is entered into and are subsequently re-measured to their fair value at the end of each reporting period. The accounting for subsequent changes in fair value depends on whether the derivative is designated as a hedging instrument, and if so, the nature of the item being hedged and the type of hedge relationship designated. The resulting gain or loss is recognized in the Statement of Profit and Loss immediately unless the derivative is designated and effective as a hedging instrument and is recognized in Other Comprehensive Income (OCI). Cash flow hedges shall be reclassified to profit or loss as a reclassification adjustment in the same period or periods during which the hedged expected future cash flows affect profit or loss.

80
Embedded Derivatives
Derivative embedded in host contract are separated only if the economic characteristics and risk of the embedded derivatives are not closely related to economic characteristics and risks of the host and are measured at fair value through profit or loss. Embedded derivatives closely related to the host contracts are not separated.
D) First time adoption of IND AS – Mandatory exceptions / Optional exemptions
Overall principle
The Company has prepared the opening balance sheet as per Ind AS as of 1st October, 2014 (the transition date) by recognizing all assets and liabilities whose recognition is required by Ind AS, not recognizing items of assets or liabilities which are not permitted by Ind AS, by reclassifying certain items from Previous GAAP to Ind AS as required under the Ind AS, and applying Ind AS in the measurement of recognized assets and liabilities. However, this principle is subject to certain mandatory exceptions and certain optional exemptions availed by the Company as detailed below:
- Derecognition of financial assets and financial liabilities
The Company has applied the de-recognition requirements of financial assets and financial liabilities prospectively for transactions occurring on or after 1st October, 2014 (the transition date).
- Classification of debt instruments
The Company has determined the classification of debt instruments in terms of whether they meet the amortised cost criteria or the fair value through other comprehensive income (FVTOCI) criteria based on the facts and circumstances that existed as of the transition date.
- Impairment of financial assets
The Company has applied the impairment requirements of Ind AS 109 retrospectively; however, as permitted by Ind AS 101, it has used reasonable and supportable information that is available without undue cost or effort to determine the credit risk at the date that financial instruments were initially recognized in order to compare it with the credit risk at the transition date. Further, the Company has not undertaken an exhaustive search for information when determining, at the date of transition to Ind AS whether there have been significant increases in credit risk since initial recognition, as permitted by Ind AS 101.
- Deemed cost for PPE, CWIP and Intangible assets
The Company has opted for historical cost of Property, Plant and Equipment / intangible assets as per Indian GAAP as the deemed cost on the opening balance sheet date. The carrying amount of those assets are given below:
` in CroresSl. No.
Class of Property, Plant and Equipment
As at 31.03.2017
1 Land – Freehold 344.482 Land – Leasehold 2.463 Buildings 739.904 Plant and Equipment 1234.025 Furniture and Fixtures 54.796 Vehicles 1.847 Office Equipments 2.268 Computers 1.949 Moulds 4.9810 Other Assets 42.5511 Computer Software 1.89
Total 2431.11

81
- Determining whether an arrangement contains a lease
The Company has applied Appendix C of Ind AS 17 for determining whether an arrangement contains a Lease at the transition date on the basis of facts and circumstances existing at that date.
- Assessment of embedded derivatives
The Company has assessed whether an embedded derivative is required to be separated from the host contract and accounted for as a derivative on the basis of the conditions that existed at the later of the date if first became a party to the contract and the date when there has been a change in the terms of the contract that significantly modifies the cash flows that otherwise would be required under the contract.
- Investment in subsidiaries
The Company has elected to continue with the carrying value of all its investments in subsidiaries recognized as of 1st October, 2014 (transition date) measured as per previous GAAP and use that carrying value as its deemed cost as of the transition date.
E) Recent accounting pronouncements
Standards issued but not yet effective
In March 2017, the Ministry of Corporate Affairs issued the Companies (Indian Accounting Standards) (Amendments) Rules, 2017, notifying amendment to Ind AS 7, ‘Statement of cash flows’. This amendment is in accordance with the recent amendments made by International Accounting Standards Board (IASB) to IAS 7, ‘Statement of cash flows’. The amendment is applicable to the Company from April 1, 2017.
Amendments to Ind AS 7
The amendments to Ind AS 7 requires the entities to provide disclosures that enable users of financial statements to evaluate changes in liabilities arising from financing activities, including both changes arising from cash flows and non-cash changes, suggesting inclusion of a reconciliation between the opening and closing balances in the Balance Sheet for liabilities arising from financing activities, to meet the disclosure requirement.
The amendment has no impact either on the financial performance or financial position of the Company.

82
NOTES TO THE FINANCIAL STATEMENTS AS AT 31ST MARCH, 2017
` in CroresNote 2 (c):INTANGIBLESNOTE 2 (a): PROPERTY, PLANT AND EQUIPMENT
Particulars Land Buildings Plant and equipment
Furniture and fixtures
Vehicles Office equipment
Computers Moulds Other Assets
Total Computer SoftwareFreehold Leased
Gross BlockAt Deemed cost as at 01/10/2014 345.57 2.69 815.41 1982.97 6.40 13.79 8.91 13.12 139.74 93.05 3421.65 7.04 Additions 144.45 - 282.41 1286.04 3.84 9.08 8.74 8.34 112.07 49.14 1904.11 5.63 Disposals - - (10.18) (37.82) (0.59) (1.70) (0.91) (1.16) (25.43) (12.48) (90.27) - At cost as at 31/03/2016 490.02 2.69 1087.64 3231.19 9.65 21.17 16.74 20.30 226.38 129.71 5235.49 12.67 Additions 35.29 81.84 347.87 789.95 4.28 7.72 6.66 10.41 102.40 111.27 1497.69 8.30 Disposals (1.09) - (1.59) (25.19) (0.47) (3.62) (0.81) (1.13) (3.33) (3.79) (41.02) - At cost as at 31/03/2017 524.22 84.53 1433.92 3995.95 13.46 25.27 22.59 29.58 325.45 237.19 6692.16 20.97 Depreciation BlockAs at 01/10/2014 - - - - - - - - - - - - Depreciation/Amortisation for the period - 0.14 46.89 548.47 4.14 6.90 5.99 9.72 67.81 41.09 731.15 3.61 Disposals - - (3.66) (36.94) (0.52) (1.46) (0.86) (1.15) (25.30) (12.19) (82.08) - Impairment - - - 0.39 0.32 0.49 - - - 0.48 1.68 - Accumulated depreciation / amortisation as at 31/03/2016
- 0.14 43.23 511.92 3.94 5.93 5.13 8.57 42.51 29.38 650.75 3.61
Depreciation / Amortisation for the year - 0.23 40.20 456.14 2.90 5.38 4.57 7.09 57.82 30.69 605.02 4.13 Disposals - - (0.35) (23.28) (0.40) (3.38) (0.80) (1.14) (3.25) (3.68) (36.28) - (Reversal of Impairment) - - - (0.39) (0.32) (0.49) - - - (0.48) (1.68) - Accumulated depreciation / Amortisation as at 31/03/2017 - 0.37 83.08 944.39 6.12 7.44 8.90 14.52 97.08 55.91 1217.81 7.74
Net BlockAs at 01/10/2014 345.57 2.69 815.41 1982.97 6.40 13.79 8.91 13.12 139.74 93.05 3421.65 7.04 As at 31/03/2016 490.02 2.55 1044.41 2719.27 5.71 15.24 11.61 11.73 183.87 100.33 4584.74 9.06 As at 31/03/2017 524.22 84.16 1350.84 3051.56 7.34 17.83 13.69 15.06 228.37 181.28 5474.35 13.23
NOTE 2(b): CAPITAL WORK-IN-PROGRESSAs at 01/10/2014 626.67 As at 31/03/2016 1058.40 As at 31/03/2017 846.96 Note: 1. Freehold land includes agricultural land - ` 0.12 Crore (31-03-2016 - ` 0.12 Crore and 01-10-2014 - ` 0.12 Crore). 2. Other assets represents Electrical Fittings, Fire Fighting/Other Equipments and Canteen Utensils. 3. The amount of Borrowing Cost capitalised during the year ended 31-03-2017 - ` 10.01 Crore (Period ended 31-03-2016 - ` 45.18 Crore.) 4. The Company has classified the leasehold land as a finance lease, after exercise of judgement based on evaluation of facts and circumstances and
considering the indicators envisaged in Para 10 and 11 of Ind AS 17 “Leases”.

83
Note 3 : INVESTMENTS
ParticularsNo. of Shares / Units (in Nos.) ` in Crores
Face Value (`)
As at 31.03.2017
As at 31.03.2016
As at 01.10.2014
As at 31.03.2017
As at 31.03.2016
As at 01.10.2014
Non Current InvestmentsFully Paid-upQuoted - Non TradeEquity Shares (at fair value through Profit or Loss )Equity Shares in ICICI Bank Ltd. 2 116665 116665 23333 3.23 2.76 3.35Equity Shares in EIH Associated Hotels Ltd. 10 2000 2000 2000 0.07 0.06 0.04Equity Shares in Housing Development Finance Corporation Ltd. 2 4000 4000 4000 0.60 0.44 0.42Equity Shares in JK Tyres & Industries Ltd.- ` 21,772 (31.03.2016- ` 13,893 and 01.10.2014 - ` 16,144)
2 165 165 33 - - -
Equity Shares in Bengal & Assam Company Limited-` 3,421 (31.03.2016 - ` 950 and 01.10.2014- ` 909)
10 2 2 2 - - -
Equity Shares in HDFC Bank Ltd. 2 2000 2000 2000 0.29 0.22 0.18
Aggregate Amount of Quoted Investments 4.19 3.48 3.99
Unquoted - In Mutual Fund Units: (at fair value through Profit or Loss )Income Plan: Growth OptionFranklin India Short-term Income Plan Institutional 1000 - - 82485 - - 18.13HDFC High Interest Fund- Short Term Plan- Regular Plan 10 37492354 37492354 2720037 122.63 111.15 7.10HDFC Short Term Plan - Regular Plan 10 5946232 5946232 5946232 19.27 17.59 15.23HDFC FMP 1128D September 2014 (1) Series 32 - Regular Plan 10 - 10000000 10000000 - 11.51 10.01HDFC FMP 1134D September 2014 (1) Series 32 - Regular Plan 10 - 16000000 16000000 - 18.58 16.04HDFC FMP 370D October 2013(5) Series 28 - Regular Plan 10 - - 5000000 - - 5.41HDFC FMP 371D November 2013 (1) Series 28 - Regular plan 10 - - 5000000 - - 5.40Birla Sun life Dynamic Bond Fund - Direct Plan 10 8765778 8765778 - 26.05 23.48 -Birla Sun life Dynamic Bond Fund - Regular Plan 10 29525827 29525827 16991455 85.72 77.77 37.89Birla Sun life Fixed term plan-Series IW (368 days) - Regular Plan 10 - - 5000000 - - 5.39Birla Sun Life Fixed Term Plan - Series LX (1099 days) - Regular Plan 10 - 3000000 3000000 - 3.45 3.00Reliance Short Term Fund - Growth Plan Growth Option - STGP 10 6095089 6095089 6095089 18.78 17.24 15.09ICICI Prudential Institutional Short term Plan - Cumulative Option 10 2717258 2717258 2717258 9.59 8.70 7.59ICICI Prudential FMP Series 75-1100 Days Plan J Cumulative 10 - 10000000 10000000 - 11.45 10.01Sundaram Fixed Term Plan GK 1120 days Regular 10 - 5000000 5000000 - 5.72 5.01Sundaram Fixed Term Plan GY-Direct Plan 10 30000000 30000000 - 34.86 31.88 -L& T FMP Series 9- Plan D 10 - - 5000000 - - 5.39IDFC Ultra Short Term Fund-( Regular Plan) 10 1866670 1866670 - 4.30 3.96 -SBI SHF Ultra Short Term Debt Fund - Regular Plan 1000 61558 61558 - 12.93 11.99 -
NOTES TO THE FINANCIAL STATEMENTS AS AT 31ST MARCH, 2017

84
Note 3 : INVESTMENTS
ParticularsNo. of Shares / Units (in Nos.) ` in Crores
Face Value (`)
As at 31.03.2017
As at 31.03.2016
As at 01.10.2014
As at 31.03.2017
As at 31.03.2016
As at 01.10.2014
HDFC High Interest Fund- Dynamic Plan - Direct - Growth Option 10 1935998 1935998 - 11.34 10.14 -HDFC Medium Term Opportunities Fund- Direct Plan- Growth Option 10 24691641 24691641 - 44.88 40.83 -Birla Sun life Short Term Fund - Direct Plan 10 2045716 2045716 - 12.79 11.67 -Birla Sun life Short Term Fund - Regular Plan 10 5618909 5618909 - 34.99 31.96 -Birla Sun life Short Term Opportunities Fund - Regular Plan 10 4718438 4718438 - 12.80 11.70 -Birla Sun life Treasury Optimizer Plan - Direct Plan 100 617679 617679 - 12.99 11.74 -Birla Sun life Treasury Optimizer Plan - Regular Plan 100 1744625 1744625 - 36.32 32.92 -Birla Sun life Floating Rate Fund Long Term - Regular Plan 100 779493 779493 - 15.50 14.19 -Birla Sun life Short Term Opportunities Fund - Direct Plan 10 13067518 13067518 - 36.29 32.94 -IDFC Super Saver Income Fund- Medium Term Plan - Regular Plan 10 36400615 36400615 - 100.93 92.23 -IDFC Ultra Short Term Fund- Direct Plan 10 6413102 6413102 - 14.85 13.67 -DHFL Pramerica Fixed Maturity Plan - Series 77 - Regular Plan 10 - 7000000 - - 8.04 -DHFL Pramerica Short Maturity Fund 10 7504245 7504245 - 22.36 20.41 -TATA Short Term Bond Fund-Regular Plan 10 10896570 10896570 - 33.31 30.69 -UTI Short Term Income Fund- Institutional Option-Direct Plan 10 5763855 5763855 - 11.71 10.62 -UTI Short Term Income Fund- Institutional Option 10 60766664 60766664 - 121.16 110.39 -UTI- Treasury Advantage Fund-Institutional Plan 1000 68805 68805 - 15.42 14.19 -ICICI Prudential Short Term Option Plan 10 26480287 26480287 - 90.36 81.97 -HDFC High Interest Fund - Dynamic Plan - Regular Plan 10 6073551 6073551 - 34.40 30.97 -HDFC Floating Rate Income Fund- Short term plan whole sale option - Regular Plan
10 2421650 2421650 - 6.85 6.31 -
Sundaram Ultra Short Term Fund Regular 10 7089864 7089864 - 15.79 14.66 -Sundaram Select Debt Short Term Asset Plan Regular 10 12622926 12622926 - 35.49 32.73 -Non-Trade - UnquotedOthers: (at fair value through Profit or Loss)Equity Shares in Mammen Mappillai Investments Pvt. Ltd. 10 65000 65000 65000 0.07 0.07 0.07Equity Shares in M M Research Company Pvt. Ltd. 10 - - 100000 - - 0.10Ordinary Shares in MRF Employees Co-operative Society Ltd. - ` 40000 (31.03.2016 and 01.10.2014 - ` 40000)
25 1600 1600 1600 - - -
Ordinary Shares in The Ranipet Leather Finishing Servicing Industrial Co-operative Society Ltd. ̀ 5000 (31.03.2016 and 01.10.2014 -` 5000)
100 50 50 50 - - -
Equity Shares in Chennai Willingdon Corporate Foundation - ` 50 (31.03.2016 and 01.10.2014 - ` 50)
10 5 5 5 - - -
Note: The Company had invested in Co-operative Societies and in certain other companies towards the corpus. These are non participative shares and normally no dividend is accrued. The Company has carried these investments at it transaction value considering it to be its fair value.
(Contd.)
NOTES TO THE FINANCIAL STATEMENTS AS AT 31ST MARCH, 2017
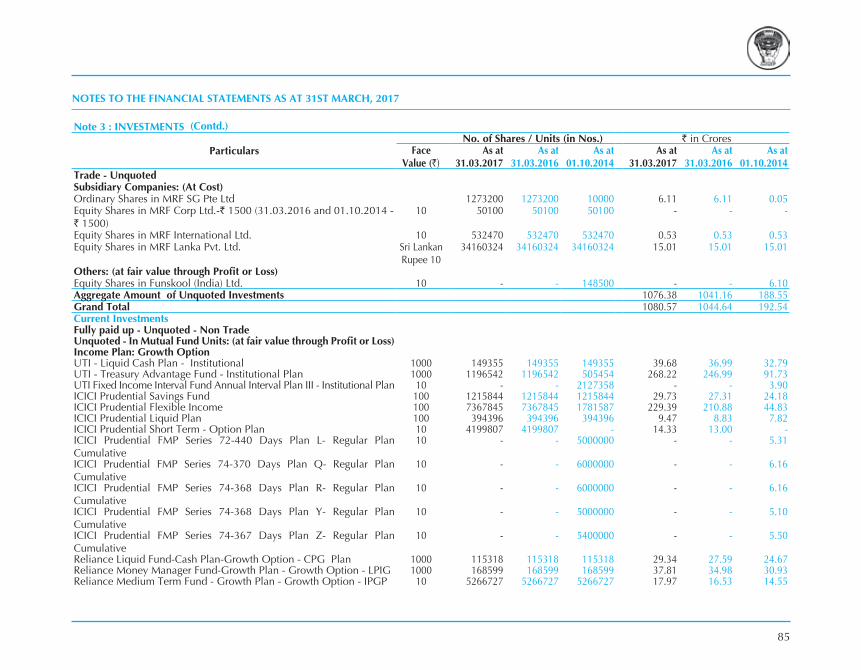
85
Note 3 : INVESTMENTS
ParticularsNo. of Shares / Units (in Nos.) ` in Crores
Face Value (`)
As at 31.03.2017
As at 31.03.2016
As at 01.10.2014
As at 31.03.2017
As at 31.03.2016
As at 01.10.2014
Trade - UnquotedSubsidiary Companies: (At Cost)Ordinary Shares in MRF SG Pte Ltd 1273200 1273200 10000 6.11 6.11 0.05Equity Shares in MRF Corp Ltd.-` 1500 (31.03.2016 and 01.10.2014 - ` 1500)
10 50100 50100 50100 - - -
Equity Shares in MRF International Ltd. 10 532470 532470 532470 0.53 0.53 0.53Equity Shares in MRF Lanka Pvt. Ltd. Sri Lankan
Rupee 1034160324 34160324 34160324 15.01 15.01 15.01
Others: (at fair value through Profit or Loss)Equity Shares in Funskool (India) Ltd. 10 - - 148500 - - 6.10Aggregate Amount of Unquoted Investments 1076.38 1041.16 188.55Grand Total 1080.57 1044.64 192.54Current InvestmentsFully paid up - Unquoted - Non TradeUnquoted - In Mutual Fund Units: (at fair value through Profit or Loss)Income Plan: Growth OptionUTI - Liquid Cash Plan - Institutional 1000 149355 149355 149355 39.68 36.99 32.79UTI - Treasury Advantage Fund - Institutional Plan 1000 1196542 1196542 505454 268.22 246.99 91.73UTI Fixed Income Interval Fund Annual Interval Plan III - Institutional Plan 10 - - 2127358 - - 3.90ICICI Prudential Savings Fund 100 1215844 1215844 1215844 29.73 27.31 24.18ICICI Prudential Flexible Income 100 7367845 7367845 1781587 229.39 210.88 44.83ICICI Prudential Liquid Plan 100 394396 394396 394396 9.47 8.83 7.82ICICI Prudential Short Term - Option Plan 10 4199807 4199807 - 14.33 13.00 -ICICI Prudential FMP Series 72-440 Days Plan L- Regular Plan Cumulative
10 - - 5000000 - - 5.31
ICICI Prudential FMP Series 74-370 Days Plan Q- Regular Plan Cumulative
10 - - 6000000 - - 6.16
ICICI Prudential FMP Series 74-368 Days Plan R- Regular Plan Cumulative
10 - - 6000000 - - 6.16
ICICI Prudential FMP Series 74-368 Days Plan Y- Regular Plan Cumulative
10 - - 5000000 - - 5.10
ICICI Prudential FMP Series 74-367 Days Plan Z- Regular Plan Cumulative
10 - - 5400000 - - 5.50
Reliance Liquid Fund-Cash Plan-Growth Option - CPG Plan 1000 115318 115318 115318 29.34 27.59 24.67Reliance Money Manager Fund-Growth Plan - Growth Option - LPIG 1000 168599 168599 168599 37.81 34.98 30.93Reliance Medium Term Fund - Growth Plan - Growth Option - IPGP 10 5266727 5266727 5266727 17.97 16.53 14.55
(Contd.)
NOTES TO THE FINANCIAL STATEMENTS AS AT 31ST MARCH, 2017

86
Note 3 : INVESTMENTS
ParticularsNo. of Shares / Units (in Nos.) ` in Crores
Face Value (`)
As at 31.03.2017
As at 31.03.2016
As at 01.10.2014
As at 31.03.2017
As at 31.03.2016
As at 01.10.2014
Reliance Liquid Fund - Treasury Plan - Growth Plan - Growth Option - LFIG
1000 13684 13684 13684 5.41 5.04 4.47
Reliance Fixed Horizon Fund-XXvI-Series 33- Plan-X7GP 10 - - 6000000 - - 6.11Reliance Fixed Horizon Fund-XXv-Series 6- Plan-WAGP 10 - - 5000000 - - 5.39Reliance Fixed Horizon Fund-XXv-Series 19- Plan-WOGP 10 - - 5000000 - - 5.31HDFC Cash Management Fund - Treasury - Advantage plan - Wholesale - Regular Plan
10 16607563 16607563 16607563 59.89 54.96 48.57
HDFC Short Term Plan - Regular Plan 10 4393376 4393376 - 14.24 13.00 -HDFC Liquid Fund - Regular Plan - Premium Plan 1000 93198 93198 93198 30.37 28.30 25.05HDFC Floating Rate Income Fund - Short Term Plan - Wholesale Option -Regular Plan
10 97124594 97124594 39131624 274.57 252.95 89.60
HDFC Liquid Fund - Regular Plan 1000 29580 29580 29580 9.46 8.83 7.82HDFC FMP 366D May 2014 (2) Series 31 - Regular 10 - - 6000000 - - 6.16HDFC FMP 370 D June 2014 (1) Series 31 - Regular 10 - - 6000000 - - 6.16HDFC FMP 371D December 2013 (1) Series 28 - Regular Plan 10 - 5000000 5000000 - 6.08 5.38HDFC FMP 371 D June 2014 (1) Series 31 - Regular Plan 10 - - 7000000 - - 7.17HDFC FMP 453D February 2014 (1) Series 29-Regular Plan 10 - - 5000000 - - 5.30HDFC FMP 540D December 2013 (1) Series 28-Regular-Plan 10 - - 5000000 - - 5.38HDFC FMP 370D October 2013 (5) Series 28-Regular - Plan 10 - 5000000 - - 6.13 -HDFC FMP 371D November 2013 (1) Series 28-Regular-Plan 10 - 3655457 - - 4.46 -Birla Sun Life Floating Rate Fund Short Term Plan - Regular Plan 100 1406187 1406187 1406187 30.41 28.32 25.07Birla Sun Life Cash Manager- Institutional Plan 100 1891226 1891226 1891226 52.00 48.14 42.69Birla Sun Life Floating Rate Fund Long Term - Regular Plan 100 7844428 7844428 727224 155.94 142.78 11.64Birla Sun Life Cash Plus - Regular Plan 100 364072 364072 364072 9.48 8.84 7.83Birla Sun Life Treasury Optimizer Plan - Regular Plan 100 2259785 2259785 1411779 47.05 42.64 23.01Birla Sun Life Savings Fund - Regular Plan 100 5358593 5358593 - 170.75 156.93 -Birla Sun Life Short Term Opportunities Fund - Regular Plan 10 5242908 5242908 - 14.23 13.00 -Birla Sun Life Fixed Term Plan- Series JE (368 days)-Regular Plan 10 - - 5000000 - - 5.38Birla Sun Life Fixed Term Plan- Series JY (367 days)-Regular Plan 10 - - 5000000 - - 5.32Birla Sun Life Fixed Term Plan- Series LO (369 days)-Regular Plan 10 - - 5000000 - - 5.13Birla Sun Life Fixed Term Plan- Series LQ (368 days)-Regular Plan 10 - - 6000000 - - 6.11Franklin India Ultra Short Bond Fund Super Institutional Plan 10 - - 59218499 - - 104.70Franklin India Treasury Management Account Super Institutional Plan 1000 - - 39170 - - 7.83Kotak Flexi Debt Regular Plan - Regular 10 12983092 12983092 31453743 27.25 24.50 51.94Kotak Floater Short Term 1000 - - 114046 - - 25.05Kotak Liquid Regular Plan - Regular 1000 28752 28752 28752 9.46 8.82 7.82
(Contd.)
NOTES TO THE FINANCIAL STATEMENTS AS AT 31ST MARCH, 2017

87
Note 3 : INVESTMENTS
ParticularsNo. of Shares / Units (in Nos.) ` in Crores
Face Value (`)
As at 31.03.2017
As at 31.03.2016
As at 01.10.2014
As at 31.03.2017
As at 31.03.2016
As at 01.10.2014
SBI SHF- Ultra Short Term Fund - Institutional Plan 1000 207399 207399 207399 44.33 41.09 36.22SBI Ultra Short Term Debt Fund - Regular Plan 1000 307774 307774 369333 64.65 59.93 63.39SBI Premier Liquid Fund - Regular Plan 1000 37116 37116 37116 9.45 8.82 7.81SBI - Debt Fund Series - A28-367 Days - Regular Plan 10 - - 5000000 - - 5.13SBI - Debt Fund Series - A 2 15 Months - Regular Plan 10 - - 5000000 - - 5.31IDFC Ultra Short Term Fund -(Direct Plan) 10 66879275 66879275 - 154.84 142.57 -IDFC Ultra Short Term Fund-(Regular Plan) 10 20165731 20165731 22032401 46.44 42.82 41.19IDFC Cash Fund - (Regular Plan) 1000 47988 47988 47988 9.46 8.82 7.81IDFC Fixed Term Plan Series 50 Regular Plan 10 - 5000000 5000000 - 6.07 5.38IDFC Fixed Term Plan Series 51 Regular Plan 10 - - 5000000 - - 5.38IDFC Fixed Term Plan Series 97 Regular Plan (788 Days) 10 - - 7000000 - - 7.19IDFC Fixed Term Plan Series 99 Regular Plan- (368 Days) 10 - - 5750000 - - 5.89IDFC Super Saver Income Fund-Medium Term Plan-(Regular Plan) 10 5130715 5130715 - 14.23 13.00 -Sundaram Ultra Short-Term Fund Regular Plan 10 71203949 71203949 - 158.52 147.32 -Tata Liquid Plan Fund Regular plan 1000 31599 31599 31599 9.44 8.81 7.81TATA Fixed Maturity Plan Series 47 Scheme N - Plan A 10 - - 5000000 - - 5.14TATA Ultra Short term Fund Regular Plan 1000 616955 616955 - 152.09 140.57 -L&T FMP-Series 9 - Plan J - 1141 Days 10 - - 5000000 - - 5.37L& T FMP Series 9- Plan D- 1131 Days 10 - 5000000 - - 6.11 -L&T FMP Series 10 - Plan H - 1155 Days 10 - - 5000000 - - 5.30DWS Fixed Maturity Plan Series 43-Regular Plan 10 - - 5000000 - - 5.37DWS Fixed Maturity Plan- Series 45-Regular Plan 10 - - 5000000 - - 5.29Birla Sun Life Fixed Term Plan - Series LX (1099 days) - Regular 10 3000000 - - 3.75 - -DHFL Pramerica Fixed Maturity Plan - Series 77 - Regular 10 7000000 - - 8.83 - -HDFC FMP 1128D September 2014 (1) Series 32 - Regular 10 10000000 - - 12.48 - -HDFC FMP1134D September 2014 (1) Series 32 - Regular 10 16000000 - - 20.23 - -ICICI Prudential FMP Series 75-1100 Days Plan J Cummulative 10 10000000 - - 12.37 - -Sundaram Fixed Term Plan GK 1120 days Regular 10 5000000 - - 6.22 - -
2313.78 2102.75 1086.00
NOTES TO THE FINANCIAL STATEMENTS AS AT 31ST MARCH, 2017

88
NOTE 4 : LOANS ` in Crores
ParticularsNon-current Current
As at 31.03.2017
As at 31.03.2016
As at 01.10.2014
As at 31.03.2017
As at 31.03.2016
As at 01.10.2014
Unsecured, Considered Gooda. Loans to a subsidiary Company (Refer Note - 28 (m)) - 6.72 10.19 - - - b. Loans and Advances to employees 3.68 3.33 1.63 - - -
3.68 10.05 11.82 - - -
NOTE 5 : OTHER FINANCIAL ASSETS ` in Crores
ParticularsNon-current Current
As at 31.03.2017
As at 31.03.2016
As at 01.10.2014
As at 31.03.2017
As at 31.03.2016
As at 01.10.2014
Bank deposits with more than 12 months maturity 0.01 1.31 1.31 - - - Others:Security Deposits 0.99 1.54 0.15 - - - Interest Accrued on Loans and Deposits - - - 4.09 3.24 4.37 Salary and wage advance - - 5.99 7.10 6.84 Share/Mutual Fund Application Monies - - - - - 13.06 Others - - - - 0.05 0.10 Deposits - Rent 13.13 9.31 6.02 - - -
14.13 12.16 7.48 10.08 10.39 24.37 NOTE 6 : OTHER ASSETS ` in Crores
ParticularsNon-current Current
As at 31.03.2017
As at 31.03.2016
As at 01.10.2014
As at 31.03.2017
As at 31.03.2016
As at 01.10.2014
Capital Advances 170.31 100.10 162.35 - - - Advances other than capital advances; Security Deposits 49.12 46.09 34.86 - - - Advances to subsidiaries (Refer Note - 28 (m)) - - - 0.59 3.27 Advances to Employees - - - 35.83 23.79 7.63
219.43 146.19 197.21 35.83 24.38 10.90 Others Advance payment of Income Tax / Tax Deducted
at Source (after adjusting provision) 65.33 64.18 45.47 - - -
MAT Credit Entitlement 34.50 - - - - - Balance with excise authorities - - - 62.78 78.55 27.38 Advances recoverable in cash or kind 19.96 15.69 1.21 116.26 195.56 91.62 Prepaid Expenses - - - 21.46 21.10 21.32
119.79 79.87 46.68 200.50 295.21 140.32 339.22 226.06 243.89 236.33 319.59 151.22
NOTES TO THE FINANCIAL STATEMENTS AS AT 31ST MARCH, 2017

89
NOTE 7 : INVENTORIES ` in Crores
Particulars As at 31.03.2017
As at 31.03.2016
As at 01.10.2014
Raw Materials 925.29 708.19 635.12 Raw Materials in transit 88.15 31.05 126.30 Work-in-progress 221.86 148.20 179.41 Finished goods 857.49 717.88 651.11 Stock-in-trade 28.36 17.71 14.85 Stores and spares 271.77 256.71 192.91
2,392.92 1,879.74 1,799.70
NOTE 8 : TRADE RECEIVABLES ` in Crores
Particulars As at 31.03.2017
As at 31.03.2016
As at 01.10.2014
Trade receivables Secured, considered good 1155.16 1101.34 1043.82 Unsecured, considered good 804.79 730.38 664.65 Doubtful 2.71 2.26 2.26 Less: Impairment provision on Expected Credit Loss Model (2.71) (2.26) (2.26)
1959.95 1831.72 1708.47 Of the above, trade receivables due by a subsidiary Company (Refer Note 28 (m) ) - - 0.05Note: The Company has used a practical expedient for computing expected credit loss allowance for trade receivables, taking into account historical credit
loss experience and accordingly, provisions are made for expected credit loss for amounts due from customers where necessary.
NOTES TO THE FINANCIAL STATEMENTS AS AT 31ST MARCH, 2017

90
NOTE 9 : CASH AND CASH EQUIVALENTS (as per cash o statement) ` in Crores
Particulars As at 31.03.2017
As at 31.03.2016
As at 01.10.2014
Balances with Banks (of the nature of cash and cash equivalents) 132.59 28.85 209.53 Cheques, drafts on hand; and 44.91 47.68 45.51 Cash on hand 0.85 0.83 0.05
178.35 77.36 255.09 In terms of Ministry of Corporate Affairs (MCA) notification no. G.S.R. 308 (E) dated 30.03.2017, the details of Specified Bank Notes (SBN) held and transacted during the period form 08th November 2016 to 30th December 2016 is as under:
ParticularsSBNs* Other
Denomination notesTotal
Closing Cash in hand as on 08th Nov.2016 0.65 0.15 0.80 (+) Permitted receipts 0.01 1.81 1.82 (-) Permitted payments 0.02 1.40 1.42 (-) Amount deposited in Banks 0.64 0.02 0.66 Closing Cash in hand as on 30th Dec 2016 - 0.54 0.54 * Bank notes of denominations of existing series of the value of ` 500 and ` 1,000 (MoF Notification No. S.O 3407(E) dated 08th November 2016).
NOTE 10 : BANK BALANCES OTHER THAN CASH AND CASH EQUIVALENTS ` in Crores Particulars As at
31.03.2017As at
31.03.2016As at
01.10.2014Deposits with original maturity of more than 3 months 93.58 1.38 450.95 Others: Unclaimed Dividend Account 2.49 1.71 1.63
96.07 3.09 452.58
NOTES TO THE FINANCIAL STATEMENTS AS AT 31ST MARCH, 2017

91
STATEMENT OF CHANGES IN EQUITY (SOCE) FOR THE YEAR ENDED 31ST MARCH, 2017 ` in Crores
EQUITY SHARE CAPITAL As at 31.03.2017
As at 31.03.2016
As at 01.10.2014
Number Amount Amount Amount
Authorised Share Capital 9000000 9.00 9.00 9.00
"Issued Share Capital (Excludes 71 bonus shares not issued and not alloted on non-payment of call monies)"
4241143 4.24 4.24 4.24
Subscribed Share Capital 4241143 4.24 4.24 4.24
Fully Paid-up Share Capital 4241143 4.24 4.24 4.24
Balance at the beginning of the year 4241143 4.24 4.24 4.24
Changes in equity share capital during the year: - - - -
Balance at the end of the reporting year 4241143 4.24 4.24 4.24
Rights, preferences and restrictions attaching to each class of shares including restrictions on the distribution of dividends and the repayment of capital
The company has one class of equity shares having a par value of `10 per share. Each shareholder is eligible for one vote per share held. The dividend proposed by the Board of Directors is subject to the approval of the shareholders in the ensuing Annual General Meeting, except in case of interim dividend. In the event of liquidation, the equity shareholders are eligible to receive the remaining assets of the Company after distribution of all preferential amounts, in proportion to their shareholding.
"The Company has declared two interim dividends aggregating to ` 2.54 Crores (Previous period ` 2.54 Crores) which has already been distributed during the FY 2016-17. The proposed final dividend for FY 2016-17 amounts to ` 22.90 Crores will be recognised as distribution to owners during the financial year 2017-18 on its approval by Shareholders. The proposed final dividend per share amounts to ` 54.
Shares in the Company held by each shareholder holding more than five per cent shares
As at 31.03.2017 As at 31.03.2016 As at 01.10.2014
No. % No. % No. %
Comprehensive Investment and Finance Company Private Limited 438914 10.35% 438414 10.34% 437243 10.31%
MOWI (P) Limited 507984 11.98% 507984 11.98% 507984 11.98%
Enam Shares and Securities Private Ltd. - - 222487 5.25% 267626 6.31%

92
` in Crores
OTHER EQUITY Reserves and Surplus Other Comprehensive Income(OCI)
TOTAL
Securities Premium
General Reserve
Debenture redemption
reserve
Retained Earnings
Effective portion of Cash Flow
Hedges
Remeasurements
of Defined Benefit Plans
Balance at the beginning of the comparative reporting period - 1st Oct 2014
9.42 4422.21 81.77 212.36 5.18 - 4730.94
Profit for the Comparative Period ending 31st March 2016 - - - 2473.90 - - 2473.90 Other Comprehensive Income for the Comparative Period ending 31st March 2016
- - - - (6.08) (16.36) (22.44)
Total Comprehensive Income for the Comparative Period - - - 2473.90 (6.08) (16.36) 2451.46 Transactions with owners in their capacity as owners: Dividends and Dividend Distribution Tax; - - Interim Dividends (` 6 per share) - - - (2.54) - - (2.54)- Final Dividend (` 44 per share) - - - (18.66) - - (18.66)- Dividend Distribution Tax - - - (4.23) - - (4.23)Transfer to General Reserve - 2284.62 - (2284.62) - - - Transfer (from) / to Debenture Redemption Reserve - - (7.93) 7.93 - - - Balance at the end of the comparative reporting period ending 31st March 2016
9.42 6706.83 73.84 384.14 (0.90) (16.36) 7156.97
Profit for the Current Reporting year ending 31st March, 2017 - - - 1451.08 - - 1451.08 Other Comprehensive Income for the Current Reporting year ending 31st March, 2017
- - - - (5.27) (11.57) (16.84)
Total Comprehensive Income for the year - - 1451.08 (5.27) (11.57) 1434.24 Transactions with owners in their capacity as owners: Dividends and Dividend Distribution Tax; - - Interim Dividends (Rs.6 per share) - - - (2.54) - - (2.54)- Final Dividend (Rs.94 per share) - - - (39.87) - - (39.87)- Dividend Distribution Tax - - - (8.62) - - (8.62) Transfer to General Reserve - 1769.41 - (1769.41) - - - Transfer from / (to) Debenture Redemption Reserve - - 14.78 (14.78) - - - Balance at the end of the reporting year ending 31st March, 2017 9.42 8476.24 88.62 - (6.17) (27.93) 8540.18 Note: No reclassification from OCI to Profit and Loss was required during the reporting period and hence no disclosures reconciling the reclassification adjustments have
been detailed relating to each component of OCI.
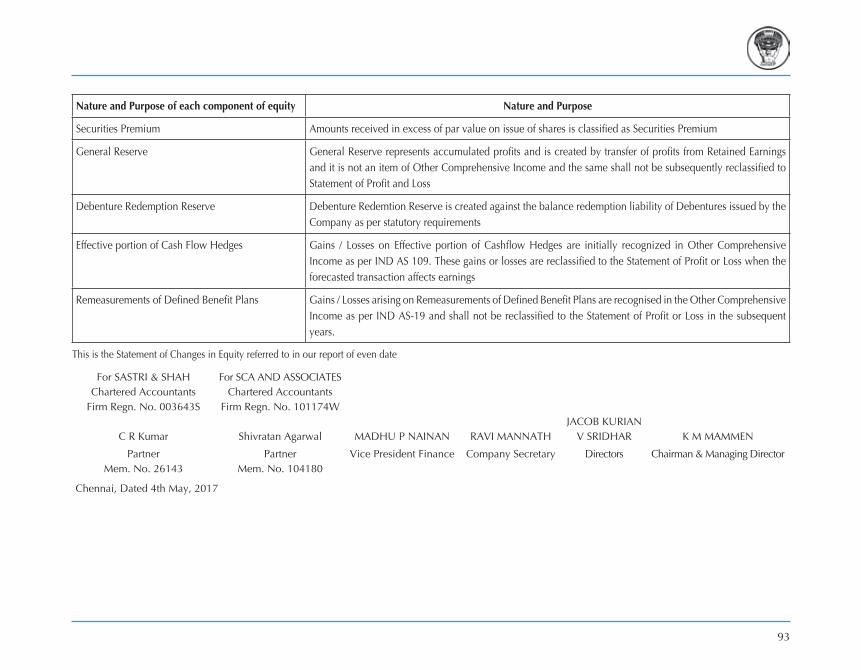
93
Nature and Purpose of each component of equity Nature and Purpose
Securities Premium Amounts received in excess of par value on issue of shares is classified as Securities Premium
General Reserve General Reserve represents accumulated profits and is created by transfer of profits from Retained Earnings and it is not an item of Other Comprehensive Income and the same shall not be subsequently reclassified to Statement of Profit and Loss
Debenture Redemption Reserve Debenture Redemtion Reserve is created against the balance redemption liability of Debentures issued by the Company as per statutory requirements
Effective portion of Cash Flow Hedges Gains / Losses on Effective portion of Cashflow Hedges are initially recognized in Other Comprehensive Income as per IND AS 109. These gains or losses are reclassified to the Statement of Profit or Loss when the forecasted transaction affects earnings
Remeasurements of Defined Benefit Plans Gains / Losses arising on Remeasurements of Defined Benefit Plans are recognised in the Other Comprehensive Income as per IND AS-19 and shall not be reclassified to the Statement of Profit or Loss in the subsequent years.
This is the Statement of Changes in Equity referred to in our report of even date
For SASTRI & SHAH For SCA AND ASSOCIATESChartered Accountants Chartered Accountants
Firm Regn. No. 003643S Firm Regn. No. 101174W JACOB KuRIAN
C R Kumar Shivratan Agarwal MADHu P NAINAN RAvI MANNATH V SRIDHAR K M MAMMEN
Partner Partner Vice President Finance Company Secretary Directors Chairman & Managing DirectorMem. No. 26143 Mem. No. 104180
Chennai, Dated 4th May, 2017

94
NOTE 11 : BORROWINGS ` in Crores
Particulars As at 31.03.2017
As at 31.03.2016
As at 01.10.2014
NON CURRENTSecuredDebentures: 9.07% Secured Redeemable Non Convertible (700 Debentures of ̀ 10,00,000/- each.) - - 70.00 10.09% Secured Redeemable Non Convertible (5000 Debentures of ̀ 10,00,000/- each) 500.00 500.00 500.00 Term loans from Banks; - External Commercial Borrowings (ECB) 13.65 69.58 196.70 UnsecuredTerm loans from Banks; - External Commercial Borrowings (ECB) 687.65 721.54 184.93 - Buyers Line of Credit - 139.75 145.20 Fixed Deposits 3.57 5.23 27.53 Sales tax deferral scheme 27.25 43.72 55.12 OthersDeferred payment liabilities 6.20 6.63 11.35
1238.32 1486.45 1190.83
CURRENTSecuredLoans repayable on demand - from banks 573.34 488.43 616.25
573.34 488.43 616.25 1811.66 1974.88 1807.08
Note: Security and terms of repayment in respect of above borrowings are detailed in Note 28(t)
NOTES TO THE FINANCIAL STATEMENTS AS AT 31ST MARCH, 2017

95
Note 12 : PROVISIONS ` in Crores
ParticularsNon-Current Current
As at 31.03.2017
As at 31.03.2016
As at 01.10.2014
As at 31.03.2017
As at 31.03.2016
As at 01.10.2014
Provision for employee benefits 34.48 29.92 21.13 43.32 11.01 40.06 Others: - Warranty and others 102.78 95.21 66.36 77.56 78.64 63.49
137.26 125.13 87.49 120.88 89.65 103.55
Note 13 : DEFERRED TAX LIABILITIES - (NET) ` in Crores
Particulars As at 31.03.2017
As at 31.03.2016
As at 01 Oct 2014
Deferred Tax Liabilities (Net); - Arising on account of difference in carrying amount and tax base of PPE and Intangibles 461.38 329.92 260.95 - Unrealised (gain)/loss on FVTPL debt Mutual Funds 125.28 52.38 12.56 - on fair valuation of Derivatives - - 2.74 - Other adjustments 14.59 9.68 - Deferred Tax Asset: - Accrued Expenses allowable on Actual Payments (47.05) (31.06) (25.64) - Net gain on remeasurements of defined benefit plans (14.79) (8.66) - - on fair valuation of Derivatives (3.27) (0.47) - - Others (0.47) - -
535.67 351.79 250.61
NOTES TO THE FINANCIAL STATEMENTS AS AT 31ST MARCH, 2017

96
Note 14 : OTHER LIABILITIES ` in Crores
ParticularsNon-Current Current
As at 31.03.2017
As at 31.03.2016
As at 01.10.2014
As at 31.03.2017
As at 31.03.2016
As at 01.10.2014
Revenue received in advance - - - 34.77 29.71 36.58 Others; Dealers' Security Deposit - - - 1237.26 1188.48 1128.90 Retention Money 23.30 32.11 6.58 - - - Statutory Dues - - - 189.26 220.59 244.51 Liabilities for expenses - - - 30.33 17.08 13.77 Others 4.44 4.13 6.07 - - -
27.74 36.24 12.65 1491.62 1455.86 1423.76
Note 15 : TRADE PAYABLES ` in Crores
Particulars As at 31.03.2017
As at 31.03.2016
As at 01 Oct 2014
Outstanding due of Micro and Small Enterprises 13.88 11.16 1.11 Outstanding due of Creditors other than Micro and Small Enterprises 1663.20 1517.66 1129.23
1677.08 1528.82 1130.34 Of the above; - Acceptances 345.32 251.24 340.06 - Payable to Subsidiary Companies (Refer Note 28 (m)) 287.92 414.10 0.10
Note 16 : OTHER FINANCIAL LIABILITIES ` in CroresCurrent
Particulars As at 31.03.2017
As at 31.03.2016
As at 01.10.2014
Current maturities of long-term debt 260.39 91.86 87.78 Interest accrued 68.51 71.27 46.18 Unclaimed dividends 2.49 1.71 1.63 Unclaimed matured deposits and interest accrued thereon 0.09 0.12 0.02 Interim Dividend Payable - - 1.27 Others : Employee benefits 135.09 126.07 47.14 Liabilities for expenses 71.71 139.07 109.58 Derivatives(Net) 4.52 5.00 10.98 Others 8.05 7.16 6.02
550.85 442.26 310.60
NOTES TO THE FINANCIAL STATEMENTS AS AT 31ST MARCH, 2017

97
NOTE 17 : REVENUE FROM OPERATIONS ` in Crores
Particulars Year Ended 31.03.2017
Period Ended 31.03.2016
Sale Of Products 14651.24 22030.91 Sale Of Services; and 32.42 36.01 Other Operating Revenues: Export Incentives 20.67 17.09 Miscellaneous 0.20 8.90 Scrap Sales 38.46 69.13
14742.99 22162.04
NOTE 18 : OTHER INCOME ` in Crores
Particulars Year Ended 31.03.2017
Period Ended 31.03.2016
Interest Income 31.02 68.15 Dividend Income 0.22 0.22 Net gain on sale of Investments classified as FvTPL 0.01 74.25 Net gains on fair value changes on financial assets classified as FvTPL 277.31 173.66 Other Non-Operating Income; Miscellaneous Income 26.46 4.89
335.02 321.17
NOTE 19 : COST OF MATERIALS CONSUMED ` in Crores
Particulars Year Ended 31.03.2017
Period Ended 31.03.2016
Opening Stock of Raw Materials 739.24 761.42 Purchases during the year 7953.39 11140.73 Closing Stock of Raw Materials (1013.44) (739.24)
7679.19 11162.91
NOTES TO THE FINANCIAL STATEMENTS FOR THE YEAR ENDED 31ST MARCH, 2017

98
NOTE 20 : CHANGES IN INVENTORIES OF FINISHED GOODS, WORK-IN-PROGRESS AND STOCK-IN-TRADE ` in Crores
Particulars Year Ended 31.03.2017
Period Ended 31.03.2016
Closing Stock: Finished Goods 857.49 717.88 Work-in-Progress 221.86 148.20 Stock-in-Trade 28.36 17.71
1107.71 883.79 Less: Opening Stock: Finished Goods 717.88 651.11 Work-in-Progress 148.20 179.41 Stock-in-Trade 17.71 14.85
883.79 845.37 Differential Excise Duty on Opening and Closing stock of Finished Goods 1.84 23.47
(222.08) (14.95)
NOTE 21 : EMPLOYEE BENEFITS EXPENSE ` in Crores
Particulars Year Ended 31.03.2017
Period Ended 31.03.2016
Salaries and Wages 805.04 1,042.59 Contribution to provident and other funds 81.85 86.79 Staff welfare expenses 96.25 129.53
983.14 1,258.91
NOTE 22 : FINANCE COSTS ` in Crores
Particulars Year Ended 31.03.2017
Period Ended 31.03.2016
Interest on Loans and Deposits 185.97 251.19 Interest on Debentures 50.45 85.64 Interest on Deferred Payment Credit 0.81 1.46 Other Borrowing Costs:Unwinding of discount relating to Long Term Liabilities 8.29 7.15
245.52 345.44
NOTES TO THE FINANCIAL STATEMENTS FOR THE YEAR ENDED 31ST MARCH, 2017

99
NOTE 23 : OTHER EXPENSES ` in Crores
Particulars Year Ended 31.03.2017
Period Ended 31.03.2016
Stores and Spares Consumed 301.51 458.83 Power and Fuel 580.32 842.05 Processing Expenses 180.53 240.58 Rent 55.50 69.50 Rates and Taxes 13.80 16.74 Insurance 16.46 16.63 Printing and Stationery 6.77 8.93 Repairs and Renewals: Buildings 18.47 27.13 Plant and Machinery 89.33 118.06 Other Assets 44.78 51.53 Travelling and Conveyance 43.10 59.48 Communication Expenses 6.64 10.98 Vehicle Expenses 5.80 7.46 Auditors’ Remuneration:As Auditors: Audit fee 0.41 0.41 Tax Audit fee 0.07 0.14 Other Services 0.31 0.16 Reimbursement of Expenses 0.17 0.26
0.96 0.97 Cost Auditors Remuneration: Audit fee 0.06 0.06 Directors’ Fees 0.10 0.16 Directors’ Travelling Expenses 4.21 5.56 Advertisement 256.82 357.16 Warranty 2.46 31.12 Sales tax absorbed by the company 0.10 0.54 Bad debts written off 0.08 - Commission 3.10 8.70 Freight and Forwarding (Net) 424.99 562.62 Loss on Sale of Fixed Asset 3.50 6.54 Net Loss on Foreign Currency Transactions 16.86 53.80 Bank Charges 4.32 6.44 Provision for Impairment of Assets (other than Financial Assets) - 23.93 Provision for Impairment of Financial Assets 0.45 - Miscellaneous Expenses 96.14 91.00
2177.16 3076.50
NOTES TO THE FINANCIAL STATEMENT FOR THE YEAR ENDED 31ST MARCH, 2017

100
NOTE 24 (a) - RECONCILIATION OF EQUITY AS AT 1ST OCTOBER, 2014 (DATE OF TRANSITION) ` in Crores Particulars Foot Notes Previous GAAP * Adjustments Ind ASASSETSNon-current assetsProperty, Plant and Equipment 3421.65 - 3421.65 Capital Work-in-Progress 626.67 - 626.67 Other Intangible Assets 7.04 - 7.04 Financial Assets: Investments 24 (d) (i) 147.00 45.54 192.54 Loans 24 (d) (vii) 15.24 (3.42) 11.82 Others financial assets 24 (d) (vii) 10.43 (2.95) 7.48 Other non-current assets 24 (d) (viii) 245.47 (1.58) 243.89 Current assetsInventories 1799.70 - 1799.70 Financial Assets: Investments 24 (d) (i) 936.15 149.85 1086.00 Trade Receivables 1708.47 - 1708.47 Cash and cash Equivalents 255.09 - 255.09 Bank balances other than cash and cash equivalents 452.58 - 452.58 Others financial assets 24.37 - 24.37 Other current assets 24 (d) (vii) 147.10 4.12 151.22 Total Assets 9796.96 191.56 9988.52 EQUITY AND LIABILITIESEquity Equity share capital 4.24 - 4.24 Other equity 4513.40 217.54 4730.94 Equity attributable to owners 4517.64 217.54 4735.18 Non-controlling interest - - -Total Equity 4517.64 217.54 4735.18 LIABILITIESNon-current liabilitiesFinancial liabilities Borrowings 24 (d) (ii) 1198.75 (7.92) 1190.83 Provisions 24 (d) (vii) 91.85 (4.36) 87.49 Other Non-Current Liabilities 24 (d) (vii) 15.95 (3.30) 12.65 Deferred Tax Liabilities (Net) 24 (d) (vi) 235.31 15.30 250.61 Total non-current liabilities 1541.86 (0.28) 1541.58 Financial liabilities Borrowings 616.25 - 616.25 Trade payables 1130.34 - 1130.34 Other financial liabilities 24 (d) (iii) & (vii) 332.57 (21.97) 310.60 Provisions 24 (d) (iii) & (vii) 107.28 (3.73) 103.55 Current Tax Liabilities (Net) 127.26 - 127.26 Other current liabilities 1423.76 - 1423.76 Total current liabilities 3737.46 (25.70) 3711.76 Total liabilities 5279.32 (25.98) 5253.34 Total Equity and Liabilities 9796.96 191.56 9988.52 * The previous GAAP figures have been reclassified to conform to Ind AS presentation requirements for the purposes of this note.
NOTES TO THE FINANCIAL STATEMENT FOR THE YEAR ENDED 31ST MARCH, 2017

101
NOTE 24 (b) - RECONCILIATION OF EQUITY AS AT 31ST MARCH, 2016 ` in Crores Particulars Foot Notes Previous GAAP * Adjustments Ind ASASSETSNon-current assetsProperty, Plant and Equipment 4584.74 - 4584.74 Capital Work-in-Progress 1058.40 - 1058.40 Other Intangible Assets 9.06 - 9.06 Financial Assets: Investments 24 (d) (i) 940.13 104.51 1044.64 Loans 24 (d) (vii) 13.29 (3.24) 10.05 Others financial assets 24 (d) (vii) 14.03 (1.87) 12.16 Other non-current assets 24 (d) (viii) 227.75 (1.69) 226.06 Current assets - Inventories 1879.74 - 1879.74 Financial Assets: Investments 24 (d) (i) 1844.16 258.59 2102.75 Trade Receivables 1831.72 - 1831.72 Cash and cash Equivalents 77.36 - 77.36 Bank balances other than cash and cash equivalents 3.09 - 3.09 Others financial assets 10.39 - 10.39 Other current assets 24 (d) (vii) 315.25 4.34 319.59 Total Assets 12809.11 360.64 13169.75 EQUITY AND LIABILITIESEquity Equity share capital 4.24 - 4.24 Other equity 6790.09 366.88 7156.97 Equity attributable to owners 6794.33 366.88 7161.21 Non-controlling interestTotal Equity 6794.33 366.88 7161.21 LIABILITIESNon-current liabilitiesFinancial liabilities Borrowings 24 (d) (ii) 1485.08 1.37 1486.45 Provisions 24 (d) (vii) 128.97 (3.84) 125.13 Other Non-Current Liabilities 24 (d) (vii) 38.65 (2.41) 36.24 Deferred Tax Liabilities (Net) 24 (d) (vi) 298.86 52.93 351.79 Total non-current liabilities 1951.56 48.05 1999.61 Financial liabilities Borrowings 488.43 - 488.43 Trade payables 1528.82 - 1528.82 Other financial liabilities 24 (d) (iii) & (vii) 488.43 (46.17) 442.26 Provisions 24 (d) (iii) & (vii) 97.77 (8.12) 89.65 Current Tax Liabilities (Net) 3.91 - 3.91 Other current liabilities 1455.86 - 1455.86 Total current liabilities 4063.22 (54.29) 4008.93 Total liabilities 6014.78 (6.24) 6008.54 Total Equity and Liabilities 12809.11 360.64 13169.75 * The previous GAAP figures have been reclassified to conform to Ind AS presentation requirements for the purposes of this note.
NOTES TO THE FINANCIAL STATEMENT FOR THE YEAR ENDED 31ST MARCH, 2017
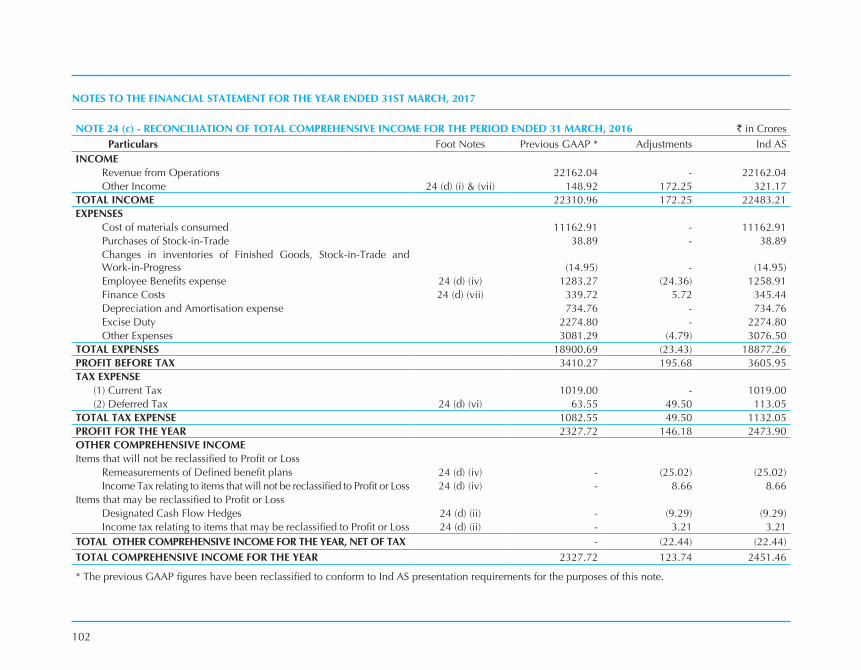
102
NOTE 24 (c) - RECONCILIATION OF TOTAL COMPREHENSIVE INCOME FOR THE PERIOD ENDED 31 MARCH, 2016 ` in Crores Particulars Foot Notes Previous GAAP * Adjustments Ind ASINCOME Revenue from Operations 22162.04 - 22162.04 Other Income 24 (d) (i) & (vii) 148.92 172.25 321.17 TOTAL INCOME 22310.96 172.25 22483.21 EXPENSES Cost of materials consumed 11162.91 - 11162.91 Purchases of Stock-in-Trade 38.89 - 38.89 Changes in inventories of Finished Goods, Stock-in-Trade and
Work-in-Progress (14.95) - (14.95) Employee Benefits expense 24 (d) (iv) 1283.27 (24.36) 1258.91 Finance Costs 24 (d) (vii) 339.72 5.72 345.44 Depreciation and Amortisation expense 734.76 - 734.76 Excise Duty 2274.80 - 2274.80 Other Expenses 3081.29 (4.79) 3076.50 TOTAL EXPENSES 18900.69 (23.43) 18877.26 PROFIT BEFORE TAX 3410.27 195.68 3605.95 TAX EXPENSE (1) Current Tax 1019.00 - 1019.00 (2) Deferred Tax 24 (d) (vi) 63.55 49.50 113.05 TOTAL TAX EXPENSE 1082.55 49.50 1132.05 PROFIT FOR THE YEAR 2327.72 146.18 2473.90 OTHER COMPREHENSIVE INCOME Items that will not be reclassified to Profit or Loss Remeasurements of Defined benefit plans 24 (d) (iv) - (25.02) (25.02) Income Tax relating to items that will not be reclassified to Profit or Loss 24 (d) (iv) - 8.66 8.66 Items that may be reclassified to Profit or Loss Designated Cash Flow Hedges 24 (d) (ii) - (9.29) (9.29) Income tax relating to items that may be reclassified to Profit or Loss 24 (d) (ii) - 3.21 3.21 TOTAL OTHER COMPREHENSIVE INCOME FOR THE YEAR, NET OF TAX - (22.44) (22.44)TOTAL COMPREHENSIVE INCOME FOR THE YEAR 2327.72 123.74 2451.46
* The previous GAAP figures have been reclassified to conform to Ind AS presentation requirements for the purposes of this note.
NOTES TO THE FINANCIAL STATEMENT FOR THE YEAR ENDED 31ST MARCH, 2017

103
NOTE 24 (d) - FOOTNOTES TO THE RECONCILIATION OF EQUITY AS AT 1ST OCTOBER, 2014 AND 31ST MARCH, 2016 AND TOTAL COMPREHENSIVE INCOME FOR THE PERIOD ENDED 31ST MARCH, 2016
i) FVTPL Financial Assets:
Under previous GAAP, the Company accounted for non-current/current investments in quoted equity shares and unquoted mutual funds units at cost less provision for other than temporary diminution in the value of investments and at lower of cost and share value respectively. Under Ind-AS, the investments are required to be classified and measured subsequently at fair value through profit or loss. At the date of transition to Ind-AS, difference between the fair value and GAAP carrying amount of ` 195.39 Crores has been recognised in the retained earnings. The impact of ` 167.71 Crores as at 31st March, 2016 has been recognised in the statement of profit and loss.
ii) Derivatives:
Under previous GAAP, the company recognised derivatives if the fair value of the derivative resulted in loss in the Statement of Profit or Loss. Derivatives resulting in gains in the Statement of Profit and Loss were not recognised. Ind AS requires all derivatives to be recognised whether they result in loss or gain. All derivatives have been recognised at fair value. The effective portion of the changes in fair value of interest rate swaps designated as hedging instrument under cash flow hedge relating to risk being hedged is recognised in Other Comprehensive Income. The changes in fair value of undesignated derivatives are recognised in retained earnings on the date of transition and in finance costs after the date of transition. However, none of the derivatives designated as hedge, were ineffective during the reporting period. The impact on account of recognition of derivatives in the Other Comprehensive Income for the period ended 31 March 2016 is ` 6.08 Crores (Net of Tax of ` 3.21 Crores) and ` 5.18 Crores (Net of Tax of ` 2.74 Crores) as at the date of transition.
iii) Other Payables:
Under previous GAAP, proposed dividend including Dividend
Distribution Tax are recognised as a liability in the period to which they relate, irrespective of when they are declared. Under Ind-AS, dividend is recognised as a liability in the period in which it is declared by the company (usually when approved by shareholders in a general meeting).
Accordingly, the liability of ` 22.39 Crores for the year ended on 30th September, 2014 recorded for proposed dividend has been derecognised against retained earnings on 1st October, 2014. The proposed dividend for the period ended on 31st March 2016 of ` 47.99 Crores recognised under Indian GAAP was reduced from other payables and with a corresponding impact in the retained earnings.
iv) Defined Benefit Obligation:
Both under previous GAAP and Ind-AS, the Group recognised costs related to its post-employment defined benefit plan on an actuarial basis. Under Indian GAAP, the entire cost, including actuarial gains and losses, are charged to statement of profit and loss. under Ind-AS, re-measurements comprising of actuarial gains and losses arising from experience adjustments and changes in actuarial assumptions, the effect of change in asset ceiling (if applicable) and the return on plan assets (excluding net interest) are recognised immediately in the balance sheet with a corresponding debit or credit to retained earnings through Other Comprehensive Income (OCI). Thus, the employee benefit cost is reduced by ` 16.36 Crores (Net of Tax of ` 8.66 Crores) as at 31st March, 2016 and re-measurement losses on defined benefit plans has been recognised in the Other Comprehensive Incomes (net of tax)
v) Other Comprehensive Income:
Under previous GAAP, the Company has not presented Other Comprehensive Income (OCI) separately. Hence, it has reconciled previous GAAP profit to profit as per Ind-AS. Further, Indian GAAP profit is reconciled to total comprehensive income as per Ind-AS.
NOTES TO THE FINANCIAL STATEMENT FOR THE YEAR ENDED 31ST MARCH, 2017

104
vi) Deferred Tax
Under previous GAAP, the deferred tax was calculated on income statement approach whereas Ind AS requires deferred tax to be recognised on balance sheet liability method. This change in the concept of recognition and measurement has resulted in an increase of deferred tax liability of ` 15.30 Crores on transition date with corresponding decrease in retained earnings. Further, the impact during the previous period ended 31 March 2016 was net decrease in the total comprehensive income for the period of ` 37.63 Crores
vii) Other IND AS Adjustments (Non Current Financial Assets / liabilities and provisions)
Under previous GAAP, the Company accounted for non-current Financial Assets / liabilities and provisions at undiscounted values. In contrast, the IND AS requires that where the effect of time value of money is material, the amount of Non Current Financial Assets / liabilities and provisions should be the present value of expenditure / income expected to be required to settle the obligations / received upon maturity. This impact is recognised as an Interest Income or as other borrowing cost.
viii) Non Current Assets
The Company has elected to measure certain advances at fair value at the date of transition to IND AS. Accordingly, at the date of transition to IND AS on 1st October 2014 a decrease of ` 1.58 Crores and ` 0.11 Crores for the period ended 31st March 2016 has been recognised as an expenses on de-recognition of the asset.
NOTE 25 :
A. Capital Management
For the purpose of Company’s Capital Management, capital includes Issued Equity Capital, Securities Premium, and all other Equity Reserves attributable to the Equity Holders of the Company. The primary objective of the Company’s Capital Management is to maximise the Share Holder Value.
The Company manages its capital structure and makes adjustments in the light of changes in economic conditions and requirements of the financial covenants and to continue as a going concern. The Company monitors using a gearing ratio which is net debts divided by total capital plus net debt. The company includes within net debt, interest bearing loans and borrowings, less cash and short term deposit.
` in CroresParticulars 31st March, 2017 31st March, 2016
Interest bearing Loans and Borrowings 2028.33 2010.25 Less: Cash and Short Term Deposits (274.42) (80.45)Net Debt 1753.91 1929.80
Equity 4.24 4.24 Other Equity 8540.18 7156.97 Total Capital 8544.42 7161.21 Capital and Net Debt 10298.33 9091.01 Gearing Ratio % 17.03% 21.23%
B. Financial Risk Management
The Company’s principal financial liabilities comprise loans and borrowings, trade and other payables. The main purpose of these financial liabilities is to finance the operations of the Company. The principal financial assets include trade and other receivables, investments in mutual funds and cash and short term deposits.
The Company has assessed market risk, credit risk and liquidity risk to its financial liabilities.
i) Market Risk
Is the risk of loss of future earnings, fair values or cash flows that may result from a change in the price of a financial instrument, as a result of interest rates, foreign exchange rates and other price risks. Financial instruments affected by market risks, primarily include loans & borrowings, investments and foreign currency receivables, payables and borrowings.
NOTES TO THE FINANCIAL STATEMENT FOR THE YEAR ENDED 31ST MARCH, 2017

105
In order to optimise and manage the company’s interest rate risk, the treasury performs a comprehensive risk management policy by balancing the portion of fixed rate and floating rate financial instruments in its total portfolio. The Company due to its AAA rated status commands one of the cheapest source of funding. Interest rate is fixed for the tenor of the term loans availed by the Company. Interest on borrowings subject to floating interest rate are repriced regularly. The sensitivity analysis detailed below have been determined based on the exposure to variable interest rates on the average outstanding amounts due to bankers over a year.
If the interest rates had been 1% higher / lower and all other variables held constant, the company’s profit for the year ended 31st March, 2017 would have been decreased/increased by ` 2.48 crores.
The Company is not exposed to significant risk with regard to foreign currency borrowing and payables.
The foreign currency loans are designated as cash flow hedges and are fully covered for the tenor of the loan. As regards foreign currency trade transactions, net exposure on a month on month basis, is fully covered.
The Company is affected by the price stability of certain commodities. Due to the significantly increased volatility of certain commodities like Natural Rubber, Synthetic Rubber and other Chemicals, the Company enters into purchase contracts on a short term and forward foreign exchange contracts(matching the purchase contracts) are entered into to minimise price fluctuations.
ii) Credit Risk
Is the risk that a counterparty will default on its contractual obligations resulting in a financial loss to the Company. It arises from cash and cash equivalents, investments as well as credit exposure to customers.
The Company holds cash and cash equivalents with banks which are having highest safety rankings and hence has a low credit risk.
Investments in mutual funds are primarily debt funds, which have high safety ratings and are monitored on a monthly basis and the Company is of the opinion that its mutual fund investments have low credit risk.
The Company’s marketing policies are well structured and all replacement sales are predominantly through dealers and the outstanding are secured by dealer deposits. As regards sales to O.E. and other institutional sales, the Company carries out periodic credit checks and also limits the exposure by establishing maximum payment period for customers and by offering prompt payment discounts, etc. The outstanding trade receivables due for a period exceeding 180 days as at the year ended 31 March 2017 is 0.35% of the total trade receivables.
iii) Liquidity Risk
The Company manages liquidity risk by maintaining adequate surplus, banking facilities and reserve borrowings facilities by continuously monitoring forecasts and actual cash flows.
The Company has a system of forecasting rolling three months cash inflow and outflow and all liquidity requirements are planned.
All Long term borrowings are for a fixed tenor and generally these cannot be foreclosed.
The Company has access to various source of Short term funding and debit maturing within 12 months can be rolled over with existing lenders/new lenders, or repaid based on short term requirements.
Trade and other payables are plugged into the three months rolling cash flow forecast to ensure timely funding, if required.
All payments are made along due dates and requests for early payments are entertained after due approval and availing early payment discounts.
NOTES TO THE FINANCIAL STATEMENT FOR THE YEAR ENDED 31ST MARCH, 2017

106
NOTE 26 : FAIR VALUES AND HIERARCHY` in Crores
Set out below, is a comparison by class of the carrying amounts and fair value of the Company’s financial instruments, other than those with carrying amounts that are reasonable approximations of fair values:
ParticularsHierarchy Carrying Value Fair Value
As at 31.03.2017
As at 31.03.2016
As at 01.10.2014
As at 31.03.2017
As at 31.03.2016
As at 01.10.2014
Financial Assets - Investments Level One 3,117.04 2,784.29 1,083.15 3,394.35 3,147.39 1,278.54 Financial Liabilities - Borrowings Level Two 1,230.26 1,485.08 1,198.75 1,238.32 1,486.45 1,190.83
The management assessed that cash and cash equivalents, trade receivables, trade payables, bank overdrafts and other current liabilities approximate their carrying amounts largely due to the short-term maturities of these instruments.
The Fair value of financial assets and liabilities included is the amount at which the instrument could be exchanged in a current transaction between willing parties. The following methods and assumptions were used to estimate the fair value.
1. The Fair values of Mutual Funds and Quoted Equities are based on NAv / Quoted Price at the reporting date. Further, the Company had invested in Co-operative Societies and in certain other companies towards the corpus. These are non participative shares and normally no dividend is accrued. The Company has carried these investments at it transaction value considering it to be its fair value.
2. The Company enters into Derivative financial instruments with counterparties principally with Banks with investment grade credit ratings. The Interest Rate swaps, foreign exchange forward contracts are valued using valuation techniques which employs the use of market observable inputs namely, Marked-to-Market.
NOTE 27 : RECONCILIATION OF TAX EXPENSE AND THE ACCOUNTING PROFIT MULTIPLIED BY INDIA’S DOMESTIC TAX RATE ` in Crores
Particulars As at 31.03.2017
Accounting Profit before Income Tax 2066.37 At India’s statutory income tax rate of 34.608% (31 March 2016: 34.608%) 715.13 Additional deduction on Research and Development expense (102.93)Effect of non-deductible expenses 3.09
615.29 The details for the previous period comprising of eighteen months relates to two separate assessment years and hence the same are not provided.
NOTES TO THE FINANCIAL STATEMENTS AS AT 31ST MARCH, 2017

107
NOTE 28 ADDITIONAL/EXPLANATORY INFORMATION FORMING PART OF THE FINANCIAL STATEMENT FOR THE YEAR ENDED 31ST MARCH, 2017
` in Crores
ParticularsYear Ended 31.03.2017 Period Ended 31.03.2016% of total
ConsumptionValue % of total
ConsumptionValue
a) Value of imported/indigenous raw material/stores and spares consumed:Raw Materials Imported at landed cost 41.08 3,154.23 47.81 5,337.16 Indigenous 58.92 4,524.96 52.19 5,825.75
100.00 7,679.19 100.00 11,162.91 Stores and Spares Imported at landed cost 9.71 29.27 8.36 38.37 Indigenous 90.29 272.24 91.64 420.46
100.00 301.51 100.00 458.83
` in CroresYear Ended 31.03.2017
Period Ended 31.03.2016
b) Details of Purchase of Traded Goods under broad heads:T and S Equipments 32.61 30.41Sports Goods 6.76 4.54Others 3.01 3.94
42.38 38.89c) CIF Value of Imports: a. Raw Materials 2,710.64 4,057.97 b. Components and Spare Parts 63.60 99.30 c. Capital Goods 246.16 740.17
d) Earnings in Foreign Exchange:FOB Value of Exports 1,151.31 1,666.49 Freight and Insurance 11.66 20.67 Dividend 0.11 0.05 Others 4.07 2.99
Note: FOB value of Exports excludes export sales in Indian Rupee.
NOTES TO THE FINANCIAL STATEMENTS AS AT 31ST MARCH, 2017

108
Particulars Year Ended 31.03.2017
Period Ended 31.03.2016
e) Expenditure in Foreign Currency paid or payable by the Company: a. Interest and Finance Charges 2.75 6.75
b. Professional and Consultation Fees 7.09 5.46 c. Commission and Discount - 0.05 d. Travelling 4.24 5.81 e. Advertisements 51.93 59.67 f. Traded goods 6.57 0.31 g. Insurance 2.80 2.33 h. Product warranty claims 2.38 5.87 i. Others 7.11 9.04
f. The amount due and paid during the year to “Investor Education and Protection Fund” is ` 0.05 Crores (Previous Period - ` 0.30 Crores).
g. Earnings Per Share
Particulars Year Ended 31.03.2017
Period Ended 31.03.2016*
Profit after taxation ` Crores 1,451.08 2,473.90 Number of equity shares (Face value ` 10/-) Nos. 4,241,143 4,241,143 Earnings per share ` 3,421.44 5,833.10
* Not Annualised
h. Cash Flow HedgeForeign Exchange forward Contracts on External Commercial borrowings are measured at fair value through OCI on being designated as Cash Flow Hedges.The Company also enters into foreign exchange forward contracts with the intention to minimise the foreign exchange risk of expected purchases, these contracts are not designated in hedge relationships and are measured at fair value through profit or loss.The outstanding position and exposures are as under :
i) Foreign Currency forward contracts designated as Hedge Instruments Particulars Currency Amount ` Crores Nature Cross Currency
Currency/Interest Rate Swap USD 151.50 Million 937.55 ECB Loan /Buyer’s Line of Credit
INR (166.49) Million (1,009.00)
The terms of the foreign currency forward contracts match the terms of the transactions. As a result, no hedge ineffectiveness arises requiring recognition through profit and loss. The net unrealised loss of ` 5.27 Crores (Previous period - ` 6.08 Crores), net of deferred tax asset of ` 2.79 Crores (Previous period - ` 3.21 Crores) is included in OCI.
Figures in brackets are in respect of previous period
NOTES TO THE FINANCIAL STATEMENTS AS AT 31ST MARCH, 2017
` in Crores

109
i. Forward Contract Outstanding as on 31st March 2017:- Particulars Currency Amount ` Crores Nature Cross CurrencyForward Contract USD 42.97 Million 286.95 Buyer’s Line of Credit INR
(24.98) Million (169.66)Forward Contract USD 35.66 Million 241.03 Import purchase INR
(17.06) Million (116.63)
Un-hedged foreign currency exposure is ` 29.12 Crores, net receivable (Previous Period - ` 22.17 Crores, net receivable).Figures in brackets are in respect of Previous Period
j. Particulars in respect of loans and advances in the nature of loans as required by the Securities and Exchange Board of India (Listing Obligations and Disclosure Requirements) Regulations,2015:
` in CroresBalance Maximum Balance during the
Particulars As at 31.03.2017
As at 31.03.2016
As at 01.10.2014
Year Ended 31.03.2017
Period Ended 31.03.2016
Subsidiary Company
MRF Corp Limited - 6.72 10.19 6.72 10.19
Note: 1 Loans to employees have been considered to be outside the purview of disclosure requirements. 2 Investment by Loanee in the shares of the Parent company- Nil ( Previous Period- Nil)
k. The Company’s leasing arrangements are in respect of operating leases for premises (residential, office and godowns). The leasing arrangements, which are not non-cancellable, range between eleven months and three years generally, and are usually renewable by mutual consent on agreed terms. The aggregate lease rentals payable are charged as rent.
l. Movement in provisions as required by IND AS - 37 - “Provisions, Contingent Liabilities and Contingent Asset” ` in Crores
Particulars As at 31.03.2016
Provided during the year
Used during the year
Reversed during the year
Unwinding discounts
As at 31.03.2017
(i) Warranty 109.04 169.53 166.29 - 2.36 114.64 (78.47) (249.42) (215.01) - (3.84) (109.04)
(ii) Litigation and related disputes 64.81 4.23 2.83 0.52 65.69 (55.53) (10.18) (0.90) - (64.81)
Notes :(i) Cash outflow towards warranty provision would generally occur during the next two years. Such claims are netted off from sales.(ii) Litigation and related disputes represents estimates mainly for probable claims arising out of litigation/disputes pending with authorities under
various statutes (i.e. Service Tax, Excise and Customs Duty, Electricity/Fuel Surcharge, Cess). The probability and the timing of the outflow with regard to these matters will depend on the final outcome of the litigations/disputes.
(iii) Figures in brackets are in respect of Previous period.
NOTES TO THE FINANCIAL STATEMENTS AS AT 31ST MARCH, 2017

110
m. Related party disclosures:(a) Names of related parties and nature of relationship where control exists are as under:
Subsidiary Companies: i) MRF Corp Ltdii) MRF International Ltdiii) MRF Lanka (Private) Ltd.iv) MRF SG Pte Ltd
(b) Names of other related parties and nature of relationship:Key Management Personnel: i) Mr. K.M. Mammen, Chairman and Managing Director
ii) Mr. K.M. Philip, Whole-time Director( upto 31.03.2015)iii) Mr. Arun Mammen, Managing Director (Vice Chairman and Managing Director w.e.f. 04.05.2017)iv) Mr. Rahul Mammen Mappillai ,Whole-time Director (Managing Director w.e.f. 04.05.2017)v) Mr. Ravi Mannath, Company Secretaryvi) Mr. Madhu P Nainan, vice President Finance
Relatives of Key Management i) Mrs. Ambika Mammen (Wife of Chairman and Managing Director), (Director w.e.f. 23rd Apr,2015)Personnel: ii) Dr.(Mrs) Cibi Mammen (Wife of Managing Director), ( Director w.e.f. 12th February, 2015)
iii) Mr. Samir Thariyan Mappillai (Son of Chairman and Managing Director)
Companies in which Directors are interested: Badra Estate & Industries Limited, Devon Machines Pvt Ltd, Coastal Rubber Equipments Pvt LtdComprehensive Investments & Finance Co.Pvt Ltd, Kirloskar Electric co Ltd, Braga Industries, Braga Industries LLP, Funskool India Ltd , Pandalur Plantations Pvt Ltd, Gokul Rubber & Tea Plantations Ltd, VPC Freight Forwarders Pvt Ltd.
Other Related Parties Mr.Jacob Kurian- Director, MRF Ltd Executives Provident Fund Trust, MRF Management Staff Gratuity Scheme, MRF Employees Gratuity Scheme, MRF Managers’ Superannuation Scheme.
NOTES TO THE FINANCIAL STATEMENTS AS AT 31ST MARCH, 2017

111
(c) Transactions with related parties (excluding reimbursements) ` in CroresNature of Transactions
i) Subsidiary Companies: MRF Lanka (Private) Ltd. MRF Corp Limited MRF SG Pte Ltd.Year Ended 31.03.2017
Period Ended
31.03.2016
As at 01.10.2014
Year Ended 31.03.2017
Period Ended
31.03.2016
As at 01.10.2014
Year Ended 31.03.2017
Period Ended
31.03.2016
As at 01.10.2014
Investment in Equity Capital - - - - - 6.06 Share Application Money Paid - - - - - - Sale of Materials - 0.04 - - - - Purchase of Materials - 0.01 2.87 2.48 950.46 1,273.42 Sale of Finished Goods 1.11 2.23 - - - - Dividend Received 0.11 0.05 0.10 0.10 - - Interest received - - - - - - Lease Rent received - - 0.13 0.19 - - Outstanding: Investments 15.01 15.01 15.01 - - - 6.11 0.05 Loan Receivable - - - 6.72 13.19 - - Trade Receivable - - 0.05 - - - - - Other Receivables - 0.05 0.75 0.59 0.37 - - Trade Payable - - 0.18 0.17 0.10 287.74 413.93 Corporate Guarantee - - 1.85 - - - - - 309.00
ii) Compensation of Key Management Personnel: ` in CroresSitting Fees Remuneration* Commission Payable
Year Ended 31.03.2017
Period Ended 31.03.2016
Year Ended 31.03.2017
Period Ended 31.03.2016
Year Ended 31.03.2017
Period Ended 31.03.2016
As at 01.10.2014
Short Term Employee Benefit Paid - - 55.48 70.51 - - - Commission Payable - - - - 23.17 29.81 14.81
iii) Compensation to Relatives of Key 0.02 0.02 0.62 0.75 - - -Management Personnel:
* Remuneration does not include provisions made for Gratuity and Leave benefits as they are determined on an actuarial basis for the Company as a whole.
NOTES TO THE FINANCIAL STATEMENTS AS AT 31ST MARCH, 2017

112
iv) Companies in which Directors are interested: Purchase of Raw Materials/
Components/MachineryCoastal Rubber Equipments Pvt Ltd - ` 56.19 Crores (Previous Period - ` 101.78 Crores), Devon Machines Pvt Ltd - ̀ 20.82 Crores (Previous Period - ̀ 28.37 Crores), Braga Industries - ̀ 84.76 Crores (Previous Period - ` 107.10 Crores), and Others - ` 0.01 Crores (Previous Period - ` 3.00 Crores).
Selling & Distribution Expenses Funskool India Ltd - ` 1.05 Crores. (Previous Period - ` 1.06 Crores). Payment towards Services VPC Freight Forwarders Pvt Ltd - ` 5.94 Crores (Previous Period - ` 13.66 Crores), Coastal Rubber
Equipments Pvt Ltd - ` 1.39 Crores (Previous Period - ` 1.67 Crores) and Braga Industries LLP - ` 0.60 Crores (Previous Period - ` 0.01 Crores).
Sale of Investments Comprehensive Investments & Finance Co Pvt Ltd - ` NIL (Previous Period - ` 6.10 Crores). Sale of Materials Funskool India Ltd ` 0.03 Crores (Previous Period - ` 0.03 Crores).Balance Outstanding: Payable Devon Machines Pvt Ltd - ` Nil (31.03.16 - ` 0.22 Crores), Coastal Rubber Equipment Pvt Ltd -
` Nil (31.03.2016 - ` 2.72 Crores) and Braga Industries - ` 11.76 Crores (31.03.2016 - ` 5.87 Crores). Receivable Devon Machines Pvt Ltd - ` 0.05 Crores (31.03.16 - ` Nil), Coastal Rubber Equipment Pvt Ltd -
` 2.65 Crores (31.03.2016 - ` Nil) and Braga Industries - ` 11.76 Crores (31.03.2016 - ` 5.87 Crores).v) Other Related Parties:
Professional Charges Mr. Jacob Kurien - ` 0.16 Crores (Previous Period - ` 0.17 Crores). Contributions MRF Ltd Executives Provident Fund Trust - ` 8.47 Crores (Previous Period - ` 10.27 Crores), MRF
Management Staff Gratuity Scheme - ̀ 5.23 Crores (Previous Period - ̀ 30.75 Crores), MRF Employees Gratuity Scheme - ` 0.77 Crores (Previous Period - ` 34.30 Crores), MRF Managers’ Superannuation Scheme - ` 11.89 Crores (Previous Period - ` 13.95 Crores).
Balance Outstanding: Contributions Payable MRF Ltd Executives Provident Fund Trust - ` 0.74 Crores (31.03.2016 - ` 0.62 Crores), MRF
Management Staff Gratuity Scheme - ` 17.76 Crores (31.03.2016 - ` 5.74 Crores), MRF Employees Gratuity Scheme - ` 19.59 Crores (31.03.2016 - ` 0.52 Crores).
d) Terms and conditions of transactions with related parties:The transactions with related parties are made on terms equivalent to those that prevail in arm’s length transactions. Outstanding balances at the year-end are unsecured and interest free and settlement occurs in cash. There have been no guarantees provided or received for any related party receivables or payables. For the year ended 31 March, 2017, the Company has not recorded any impairment of receivables relating to amounts owed by related parties (31 March, 2016: ` Nil). This assessment is undertaken each financial year through examining the financial position of the related party and the market in which the related party operates.
NOTES TO THE FINANCIAL STATEMENTS AS AT 31ST MARCH, 2017

113
n. Disclosures under Ind AS 108 - ”Operating Segment” - (Refer Note below)(i) Entity wide disclosure required by Ind AS 108 are as detailed below: ` in Crores
Year ended 31.03.2017
Period ended 31.03.2016
Automobile Tyres 13019.27 19619.11 Automobile Tubes 1167.01 1724.87 Others 464.96 686.93
14651.24 22030.91 (ii) Revenue from External Customers: India 13332.52 20169.54 Outside India 1318.72 1861.37
14651.24 22030.91 (iii) Non Current Assets: India 7772.11 6945.09 Outside India 0.03 0.03 (iv) There are no transactions with single external customer which amounts to 10% or more of the Company’s revenue.
Note:-The Company is engaged interalia in the manufacture of Rubber Products such as Tyres, Tubes, Flaps, Tread Rubber and Conveyor Belt. These in the context of Ind AS 108 “Operating Segment” are considered to constitute one single primary segment. The Company’s operations outside India do not exceed the quantitative threshold for disclosure envisaged in the Accounting Standard. Non-reportable segments have not been disclosed as unallocated reconciling item in view of their materiality. In view of the above, primary and secondary reporting disclosures for business/geographical segment are not applicable.
o. Disclosures under The Micro, Small and Medium Enterprises Development Act, 2006 (‘MSMED’):The details of liabilities to Micro and Small Enterprises, to the extent information available with the Company are given under: ` in Crores
31.03.2017 31.03.2016 01.10.2014
(i) Principal amounts remaining unpaid to suppliers as at the end of the accounting year 13.88 11.16 1.11(ii) Interest accrued and due to suppliers on above amount, unpaid 0.08 0.32 0.19(iii) The amount of interest paid by the buyer in terms of Section16 of the MSMED Act,2006,along
with the amounts of the payment made to the Supplier beyond the appointed day during the accounting year - - -
(iv) The amount of interest due and payable for the period of delay in making payment(which have been paid but beyond the appointed day during the year) but without adding the interest specified under MSMED Act,2006 0.02 0.04 0.03
(v) The amount of interest accrued and remaining unpaid at the end of the accounting year 0.10 0.36 0.22 (vi) The amount of further interest remaining due and payable even in succeeding years, until
such date when the interest dues are actually paid to the small enterprise for the purpose of disallowance as a deductible expenditure under section 23 of MSMED Act, 2006 0.82 0.96 0.60
NOTES TO THE FINANCIAL STATEMENTS AS AT 31ST MARCH, 2017
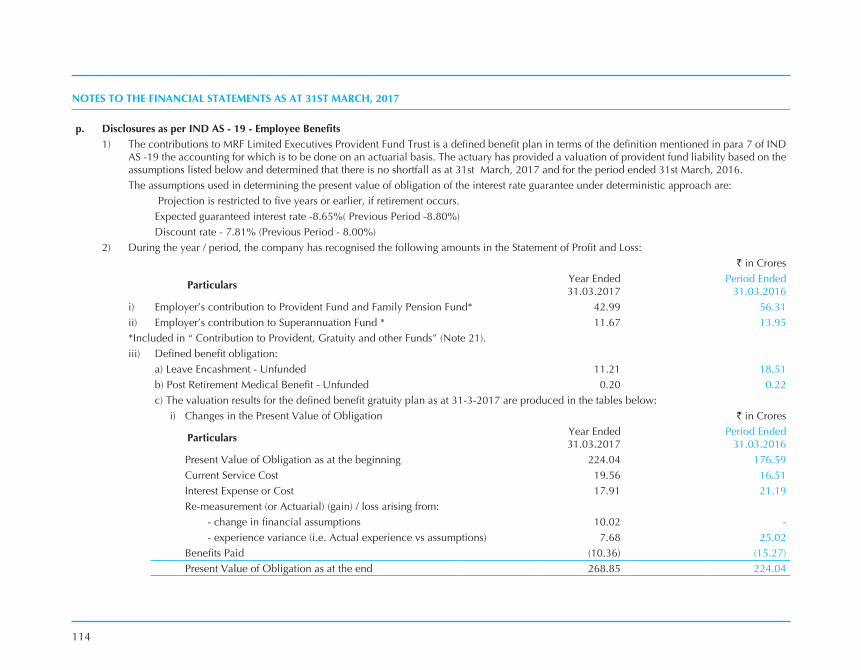
114
p. Disclosures as per IND AS - 1 - Employee Benefits1) The contributions to MRF Limited Executives Provident Fund Trust is a defined benefit plan in terms of the definition mentioned in para 7 of IND
AS -19 the accounting for which is to be done on an actuarial basis. The actuary has provided a valuation of provident fund liability based on the assumptions listed below and determined that there is no shortfall as at 31st March, 2017 and for the period ended 31st March, 2016.The assumptions used in determining the present value of obligation of the interest rate guarantee under deterministic approach are: Projection is restricted to five years or earlier, if retirement occurs. Expected guaranteed interest rate -8.65%( Previous Period -8.80%) Discount rate - 7.81% (Previous Period - 8.00%)
2) During the year / period, the company has recognised the following amounts in the Statement of Profit and Loss:` in Crores
Particulars Year Ended 31.03.2017
Period Ended 31.03.2016
i) Employer’s contribution to Provident Fund and Family Pension Fund* 42.99 56.31ii) Employer’s contribution to Superannuation Fund * 11.67 13.95*Included in “ Contribution to Provident, Gratuity and other Funds” (Note 21).iii) Defined benefit obligation:
a) Leave Encashment - Unfunded 11.21 18.51b) Post Retirement Medical Benefit - unfunded 0.20 0.22c) The valuation results for the defined benefit gratuity plan as at 31-3-2017 are produced in the tables below: i) Changes in the Present Value of Obligation ` in Crores
Particulars Year Ended 31.03.2017
Period Ended 31.03.2016
Present Value of Obligation as at the beginning 224.04 176.59 Current Service Cost 19.56 16.51 Interest Expense or Cost 17.91 21.19 Re-measurement (or Actuarial) (gain) / loss arising from: - change in financial assumptions 10.02 - - experience variance (i.e. Actual experience vs assumptions) 7.68 25.02 Benefits Paid (10.36) (15.27) Present Value of Obligation as at the end 268.85 224.04
NOTES TO THE FINANCIAL STATEMENTS AS AT 31ST MARCH, 2017

115
ii) Changes in the Fair Value of Plan Assets ` in Crores
Particulars Year Ended 31.03.2017
Period Ended 31.03.2016
Fair Value of Plan Assets as at the beginning 217.78 139.75 Investment Income 18.08 28.25 Employer’s Contribution 6.00 65.05 Benefits Paid (10.36) (15.27) Fair Value of Plan Assets as at the end 231.50 217.78
iii) Expenses Recognised in the Income Statement
Particulars Year Ended 31.03.2017
Period Ended 31.03.2016
Current Service Cost 19.56 16.51 Net Interest Cost / (Income) on the Net Defined Benefit Liability / (Asset) (0.17) (7.05) Recovery from a subsidiary company (0.75) (0.59) Expenses Recognised in the Income Statement 18.64 8.87
iv) Other Comprehensive Income Year Ended 31.03.2017
Period Ended 31.03.2016
Particulars Actuarial (gains) / losses - change in financial assumptions 10.02 - - experience variance (i.e. Actual experience vs assumptions) 7.68 25.02 Components of defined benefit costs recognised in other comprehensive income 17.70 25.02 v) Major categories of Plan Assets (as percentage of Total Plan Assets)
Particulars As at 31.03.2017
As at 31.03.2016
Funds managed by Insurer 100% 100% - In the absence of detailed information regarding Plan assets which is funded with Insurance Company, the composition of each
major category of Plan assets, the percentage or amount for each category to the fair value of Plan assets has not been disclosed. - The group gratuity Policy with LIC includes employees of MRF Corp Ltd, a Subsidiary Company
NOTES TO THE FINANCIAL STATEMENTS AS AT 31ST MARCH, 2017

116
vi) Actuarial Assumptions a. Financial Assumptions The principal financial assumptions used in the valuation are shown in the table below: Particulars As at 31.03.2017 As at 31.03.2016 Discount rate (per annum) 7.60% 8.00% Salary growth rate (per annum) 5.50% 5.50%
b. Demographic Assumptions Particulars As at 31.03.2017 As at 31.03.2016 Mortality Rate (% of IALM 06-08) 100% 100% Withdrawal rates, based on age: (per annum) Up to 30 years 3.00% 3.00% 31 - 44 years 2.00% 2.00% Above 44 years 1.00% 1.00% years 0.00% 0.00% years 0.00% 0.00% years 0.00% 0.00%
vii) Amount, Timing and Uncertainty of Future Cash Flows a. Sensitivity Analysis Significant actuarial assumptions for the determination of the defined benefit obligation are discount rate, expected salary
increase and mortality. The sensitivity analysis below have been determined based on reasonably possible changes of the assumptions occurring at the end of the reporting period, while holding all other assumptions constant. The results of sensitivity analysis is given below:
Particulars As at 31.03.2017 As at 31.03.2016 Defined Benefit Obligation (Base) 268.85 224.04
Particulars31.03.2017 31.03.2016
Decrease Increase Decrease Increase Discount Rate (- / + 1%) 296.96 244.82
Not Available
(% change compared to base due to sensitivity) 10.50% -8.90% Salary Growth Rate (- / + 1%) 244.20 296.70 (% change compared to base due to sensitivity) -9.20% 10.40% Attrition Rate (- / + 50%) 266.77 270.74 (% change compared to base due to sensitivity) -0.80% 0.70% Mortality Rate (- / + 10%) 268.31 269.40 (% change compared to base due to sensitivity) -0.20% 0.20%
NOTES TO THE FINANCIAL STATEMENTS AS AT 31ST MARCH, 2017

117
b. Asset Liability Matching Strategies The scheme is managed on funded basis. c. Effect of Plan on Entity’s Future Cash Flows
- Funding arrangements and Funding Policy The scheme is managed on funded basis. - Expected Contribution during the next annual reporting period ` in Crores
The Company’s best estimate of Contribution during the next year 21.52 - Maturity Profile of Defined Benefit Obligation Weighted average duration (based on discounted cash flows) 10 years - Expected cash flows over the next (valued on undiscounted basis): ` in Crores
1 year 29.81 2 to 5 years 74.88 6 to 10 years 123.50 More than 10 years 454.28
iv) Other Long Term Employee Benefits: Particulars As at
31.03.2017As at
31.03.2016Present value of obligation as at 31st March, 2017
Leave Encashment 33.79 28.64 Post Retirement Medical Benefits 5.28 5.11
NOTES TO THE FINANCIAL STATEMENTS AS AT 31ST MARCH, 2017
q. Corporate Social ResponsibilityAs per Section 135 of the Companies Act,2013, a Company, meeting the applicability threshold, needs to spend at least 2% of its average net profit for the immediately preceeding three financial years on corporate social responsibility (CSR) Activities. A CSR Committee has been formed by the Company as per the Act. The funds were primarily allocated to the activities which are specified in the Schedule vII of the Companies Act, 2013.a) Gross amount required to be spent by the company during the 12 months period is ` 39.24 Crores (Previous Period ` 22.55 Crores).b) Amount spent during the year on: ` in Crores
Particulars In cash yet to be paid in cash Total1 Construction/acquisition of any asset - - -
(-) (-) (-) 2 On purposes other than (1) above 7.70 0.03 7.73
(9.07) (0.02) (9.09)Previous period figures are in brackets

118
r. (i) Revenue expenditure on Research and Development activities during the year ended 31st March, 2017: ` in CroresYear Ended 31.03.2017
Period Ended 31.03.2016
1) Salaries, Wages and Other Benefits 21.26 25.772) Repairs and Maintenance 2.60 3.043) Power 1.66 2.334) Travelling and Vehicle Running 3.73 5.545) Cost of Materials/Tyres used for Rallies / Test Purpose 3.11 4.206) Other R & D Expenses 8.40 7.67
40.76 48.55
(ii) Capital Expenditure on research and development during the year / period, as certified by the management is ` 158.92 Crores (Previous Period - ` 6.34 Crores).This information complies with the terms of the R & D recognition granted upto 31st March, 2018 for the Company’s in-house Research and Development activities by the Department of Scientific and Industrial Research, Ministry of Science and Technology, Government of India, vide their Letter No.Tu/Iv-RD/118/2014 dated 06th June, 2014.
s. Disclosures required under Section 186(4) of the Companies Act,2013:(i) The Company has given Corporate guarantees to bankers on behalf of Subsidiary Companies for general business purposes in the earlier year
amounting to ` 854.85 Crores. The said guarantees have been cancelled during the period ended 31st March, 2016.(ii) Refer Note 3 for Investments
t. Terms of Repayment and Security Description of Borrowings:a) Current Borrowings Loans repayable on demand from banks are secured by hypothecation of Inventories and book debts and carries interest rates at the rate of
8.25% to 9.75% (Previous period 9.35% to 10.50 %) Buyer’s Line of Credit is repayable within a year and carries interest at the rate of LIBOR plus 15bps to LIBOR plus 25bps (Previous period LIBOR
plus 25bps and LIBOR plus 40bps)b) Non Current Borrowings i) ECB from The Bank of Tokyo - Mitsubishi uFJ, Ltd. availed in December 2011-uSD 40 Million is secured by a first charge on Plant and
Machinery situated at Puduchery Unit. Interest is payable at a rate equal to the 6 months BBA LIBOR plus margin of 1.55% (31.03.2016 and 01.10.2014- 6 months BBA LIBOR plus margin of 1.55%) payable half-yearly. The said loan is fully hedged and is repayable in three equal annual instalments at the end of the fourth, fifth and sixth year beginning October, 2015.
ii) The principal amount of Debentures, interest, remuneration to Debenture Trustees and all other costs, charges and expenses payable by the company in respect of Debentures are secured by way of a legal mortgage of Company’s land at Taluka Kadi, District Mehsana, Gujarat and hypothecation by way of a first charge on Plant and Machinery at the company’s plants at Perambalur, near Trichy, Tamil Nadu, equivalent to the outstanding amount.
NOTES TO THE FINANCIAL STATEMENTS AS AT 31ST MARCH, 2017

119
The NCD’s are to be redeemed at par in three instalments as stated below;
Debenture Series 10.09% NCD’s (Previous Period 10.09%)
` in Crores
Dates of Redemption
Series I 160.00 27/05/2019Series II 160.00 27/05/2020Series III 180.00 27/05/2021
500.00
iii) ECB(Unsecured) from the Bank of Tokyo- Mitsubishi UFJ, Ltd a) USD 15 Million availed in October,2013 is for capital expenditure. Interest is payable at a rate equal to the six months USD LIBOR
plus margin of 1.50%(31.03.2016 and 01.10.2014- six months USD LIBOR plus margin of 1.50%) payable half yearly. The said Loan is fully hedged and is repayable in three equal annual instalments at the end of fourth, fifth and sixth year beginning October,2017.
b) USD 20 Million availed in May,2015 is for capital expenditure. Interest is payable at a rate equal to the six months USD LIBOR plus margin of 1.00%(31.03.2016-six months USD LIBOR plus margin of 1.00%) payable half yearly. The said Loan is fully hedged and is repayable in three equal annual instalments at the end of fourth, fifth and sixth year beginning May,2019.
iv) ECB(Unsecured) from the Mizuho Bank, Ltd a) USD 15 Million availed in January,2014 is for capital expenditure. Interest is payable at a rate equal to the six months USD LIBOR
plus margin of 1.50%(31.03.2016 and 01.10.2014- six months USD LIBOR plus margin of 1.50%) payable half yearly. The said Loan is fully hedged and is repayable in three equal annual instalments at the end of fourth, fifth and sixth year beginning January,2018.
b) USD 25 Million availed in February,2015 is for capital expenditure. Interest is payable at a rate equal to the six months USD LIBOR plus margin of 1.00%(31.03.2016- six months USD LIBOR plus margin of 1.00%) payable half yearly. The said Loan is fully hedged and is repayable in three equal annual instalments at the end of fourth, fifth and sixth year beginning February,2019.
v) ECB(Unsecured) from the CITI Bank availed in January,2015 amounting to USD 20 Million is for capital expenditure. Interest is payable at a rate equal to the six months BBA LIBOR plus margin of 1.30% (31.03.2016- six months BBA LIBOR plus margin of 1.30%) payable half yearly. The said Loan is fully hedged and is repayable in three equal annual instalments at the end of fourth, fifth and sixth year beginning January, 2019.
vi) ECB(Unsecured) from the HSBC Bank availed in October,2015 amounting to USD 20 Million is for capital expenditure. Interest is payable at a rate equal to the six months BBA LIBOR plus margin of 1.25% (31.03.2016- six months BBA LIBOR plus margin of 1.25%) payable half yearly. The said Loan is fully hedged and is repayable in three equal annual instalments at the end of fourth, fifth and sixth year beginning October,2019.
vii) Buyers Line of Credit (Unsecured) of USD 24.82 Million availed from CITI Bank for Capital Expenditure is repayable after 2 years and 364 days beginning in March 2017 at varied interest rates as applicable on different drawdown dates. The said Loan is fully hedged.
viii) Interest free Unsecured Loan availed under Sales tax Deferral Scheme is repayable yearly and to end on 1st April, 2019. ix) Deferred payment credit is repayable along with interest( at varying rates) in 240 consecutive monthly instalments ending in March 2026. x) Fixed Deposits are Unsecured and are repayable as per the terms with interest rates of 8.50% to 9.50%.(Previous year 8.50% to 9.50%)
NOTES TO THE FINANCIAL STATEMENTS AS AT 31ST MARCH, 2017
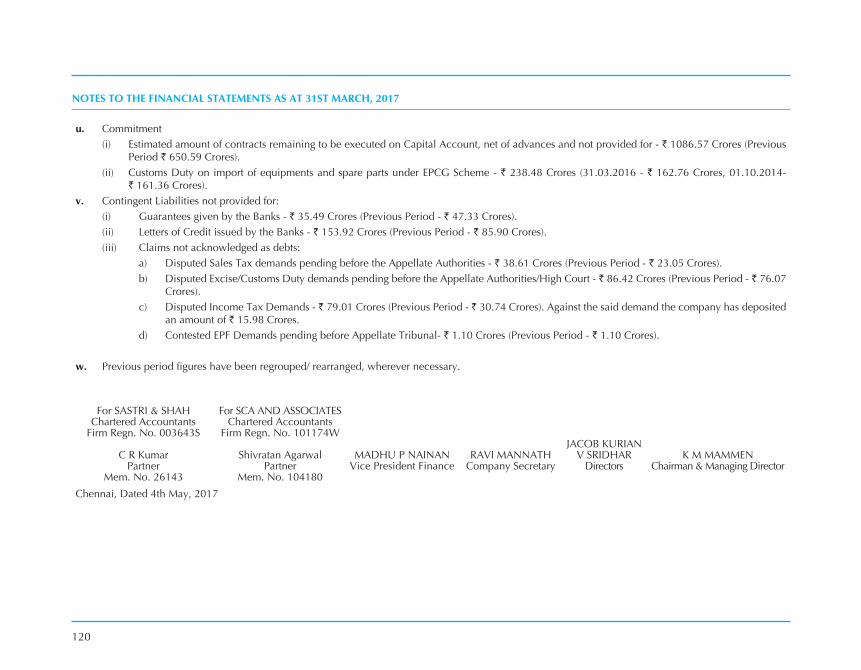
120
u. Commitment(i) Estimated amount of contracts remaining to be executed on Capital Account, net of advances and not provided for - ` 1086.57 Crores (Previous
Period ` 650.59 Crores).(ii) Customs Duty on import of equipments and spare parts under EPCG Scheme - ` 238.48 Crores (31.03.2016 - ` 162.76 Crores, 01.10.2014-
` 161.36 Crores).v. Contingent Liabilities not provided for:
(i) Guarantees given by the Banks - ` 35.49 Crores (Previous Period - ` 47.33 Crores).(ii) Letters of Credit issued by the Banks - ` 153.92 Crores (Previous Period - ` 85.90 Crores).(iii) Claims not acknowledged as debts:
a) Disputed Sales Tax demands pending before the Appellate Authorities - ` 38.61 Crores (Previous Period - ` 23.05 Crores).b) Disputed Excise/Customs Duty demands pending before the Appellate Authorities/High Court - ` 86.42 Crores (Previous Period - ` 76.07
Crores).c) Disputed Income Tax Demands - ` 79.01 Crores (Previous Period - ` 30.74 Crores). Against the said demand the company has deposited
an amount of ` 15.98 Crores.d) Contested EPF Demands pending before Appellate Tribunal- ` 1.10 Crores (Previous Period - ` 1.10 Crores).
w. Previous period figures have been regrouped/ rearranged, wherever necessary.
For SASTRI & SHAH For SCA AND ASSOCIATESChartered Accountants Chartered Accountants
Firm Regn. No. 003643S Firm Regn. No. 101174W JACOB KuRIAN
C R Kumar Shivratan Agarwal MADHu P NAINAN RAvI MANNATH V SRIDHAR K M MAMMENPartner Partner Vice President Finance Company Secretary Directors Chairman & Managing Director
Mem. No. 26143 Mem. No. 104180Chennai, Dated 4th May, 2017
NOTES TO THE FINANCIAL STATEMENTS AS AT 31ST MARCH, 2017

Consolidated FinanCial statements

122
INDEPENDENT AUDITOR’S REPORT TO THE MEMBERS OF MRF LIMITED
1. REPORT ON THE CONSOLIDATED IND AS FINANCIAL STATEMENTS
1.1 We have audited the accompanying consolidated Ind AS financial statements of MRF Limited (“the Holding Company”) and its subsidiaries (collectively referred to as “the Company” or “the Group”), which comprise the consolidated balance sheet as at 31st March 2017, the consolidated statement of profit and loss (including other comprehensive income), the consolidated statement of cash flows and the consolidated statement of changes in equity for the year then ended and a summary of the significant accounting policies and other explanatory information (hereinafter referred to as “the consolidated Ind AS financial statements”).
2. MANAGEMENT’S RESPONSIBILITY FOR THE CONSOLIDATED IND AS FINANCIAL STATEMENTS
2.1 The Holding Company’s Board of Directors is responsible for the preparation of these consolidated Ind AS financial statements in terms of the requirements of the Companies Act, 2013 (hereinafter referred to as “the Act”) that give a true and fair view of the consolidated financial position, consolidated financial performance including other comprehensive income, consolidated cash flows and consolidated changes in equity of the Group in accordance with the accounting principles generally accepted in India, including the Accounting Standards (Ind AS) prescribed under Section 133 of the Act read with relevant rules issued thereunder.
2.2 The respective Board of Directors of the companies included in the Group are responsible for maintenance of adequate accounting records in accordance with the provisions of the Act for safeguarding the assets of the Group and for preventing and detecting frauds and other irregularities; selection and application of appropriate accounting policies; making judgments and estimates that are reasonable and prudent; and design, implementation and maintenance of adequate internal financial controls, that were operating effectively for ensuring the accuracy and completeness of the accounting records, relevant to the preparation and presentation of the consolidated Ind AS financial statements that give a true and fair view and are free from material misstatement, whether due to fraud or error, which have been used for the purpose of preparation of the consolidated Ind AS financial statements by the Directors of the Holding Company, as aforesaid.
3. AUDITOR’S RESPONSIBILITY
3.1 Our responsibility is to express an opinion on these consolidated Ind AS financial statements based on our audit. While conducting the audit, we have taken into account the provisions of the Act, the accounting and auditing standards and matters which are required to be included in the audit report under the provisions of the Act and the Rules made thereunder.
3.2 We conducted our audit in accordance with the Standards on Auditing specified under section 143(10) of the Act. Those standards require that we comply with ethical requirements and plan and perform the audit to obtain reasonable assurance about whether the consolidated Ind

123
AS financial statements are free from material misstatement.
3.3 An audit involves performing procedures to obtain audit evidence about the amounts and the disclosures in the consolidated Ind AS financial statements. The procedures selected depend on the auditor’s judgment, including the assessment of the risks of material misstatement of the consolidated Ind AS financial statements, whether due to fraud or error. In making those risk assessments, the auditor considers internal financial control relevant to the Holding Company’s preparation of the consolidated Ind AS financial statements that give a true and fair view in order to design audit procedures that are appropriate in the circumstances. An audit also includes evaluating the appropriateness of the accounting policies used and the reasonableness of the accounting estimates made by the Holding Company’s Board of Directors, as well as evaluating the overall presentation of the consolidated Ind AS financial statements.
3.4 We believe that the audit evidence obtained by us and the audit evidence obtained by other auditors in terms of their reports referred to in paragraph 5 of the other matters referred below, is sufficient and appropriate to provide a basis for our audit opinion on the consolidated Ind AS financial statements.
4. OPINION
4.1 In our opinion and to the best of our information and according to the explanations given to us, the aforesaid consolidated Ind AS financial statements give the information required by the Act in the manner so required and give a true and fair view in conformity with the accounting principles generally accepted in India including the Ind AS, of the
consolidated financial position of the Group, as at 31st March 2017 and its consolidated financial performance including other comprehensive income, its consolidated cash flows and the consolidated changes in equity for the year then ended.
5. OTHER MATTERS
5.1 We did not audit the financial statements of certain subsidiaries included in the Ind AS consolidated financial statements of the group, whose financial statements reflect total assets of `433.21 Crore as at 31st March, 2017, total revenues of `1134.25 Crore, total net profit after tax of `30.63 Crore and total comprehensive profit of ̀ 30.36 Crore for the year ended on that date, as considered in the Ind AS consolidated financial statements. These financial statements have been audited by other auditors whose reports have been furnished to us by the Management and our opinion, on the Statement, in so far as it relates to the amounts and disclosures included in respect of these subsidiaries, is based solely on the reports of the other auditors.
5.2 The comparative financial information of the Group for the year ended 31st March, 2016 and the transition date opening balance sheet as at 1st October, 2014 included in these consolidated Ind AS financial statements, prepared in accordance with the Companies (Accounting Standard) Rules, 2006 audited by other auditors whose reports expressed an unmodified opinion have been restated to comply with Ind AS. Adjustments made to the previously issued said statutory financial information for the differences in accounting principles adopted by the Group on transition to Ind AS have been audited by other auditors and our

124
opinion on the statement, in so far as it relates to the amounts and disclosures included in respect of these subsidiaries, is based solely on the report of the other auditors.
Our opinion on the consolidated Ind AS financial statements and our report on Other Legal and Regulatory Requirements below, is not modified in respect of the above matters with respect to our reliance on the work done and the reports of the other auditors.
6. REPORT ON OTHER LEGAL AND REGULATORY REQUIREMENTS
6.1 As required by Section 143 (3) of the Act, we report that:
a) We have sought and obtained all the information and explanations which to the best of our knowledge and belief were necessary for the purposes of our audit of the aforesaid consolidated Ind AS financial statements.
b) In our opinion, proper books of account as required by law relating to preparation of the aforesaid consolidated Ind AS financial statements have been kept so far as it appears from our examination of those books.
c) The consolidated balance sheet, the consolidated statement of profit and loss, the consolidated statement of cash flows and the consolidated statement of changes in equity dealt with by this Report are in agreement with the relevant books of account maintained for the purpose of preparation of the consolidated Ind AS financial statements.
d) In our opinion, the aforesaid consolidated Ind AS financial statements comply with the Accounting
Standards specified under Section 133 of the Act, read with relevant rules issued thereunder.
e) On the basis of the written representations received from the directors of the Holding Company as on 31st March 2017 taken on record by the Board of Directors of the Holding Company and the reports of the statutory auditors of its subsidiary companies incorporated in India, none of the Directors of the Group companies incorporated in India is disqualified as on 31 March 2017 from being appointed as a Director of that Company in terms of Section 164(2) of the Act.
f) With respect to the adequacy of the internal financial controls over financial reporting of the Group and the operating effectiveness of such controls, refer to our separate report in “Annexure A”; and
g) With respect to the other matters to be included in the Auditor’s Report in accordance with Rule 11 of the Companies (Audit and Auditors) Rules, 2014, in our opinion and to the best of our information and according to the explanations given to us:
i. The consolidated Ind AS financial statements disclose the impact of pending litigations on the consolidated financial position of the Group. Refer Note 27 (j) (iii) to the consolidated Ind AS financial statements;
ii. The Group has long-term contracts including derivative contracts for which there were no material foreseeable losses;

125
iii. There has been no delay in transferring amounts, required to be transferred, to the Investor Education and Protection Fund by the Holding Company and its subsidiary companies incorporated in India; and
iv. The holding Company and its Indian subsidiaries has provided requisite disclosures in its Ind AS financial statements as to holdings as well as dealings in Specified Bank Notes during the period from 8th November, 2016 to 30th December,
2016 and these are in accordance with the books of accounts maintained by the Company.
For SASTRI & SHAH For SCA AND ASSOCIATESChartered Accountants Chartered AccountantsFirm Regn. No. 003643S Firm Regn. No. 101174W
(C R Kumar) (Shivratan Agarwal)Partner PartnerMem. No. 26143 Mem. No. 104180
Chennai, Dated May 04, 2017

126
ANNEXURE “A” TO THE INDEPENDENT AUDITOR’S REPORT OF EVEN DATE ON THE CONSOLIDATED IND AS FINANCIAL STATEMENTS OF MRF LIMITED.
1. REPORT ON THE INTERNAL FINANCIAL CONTROLS UNDER CLAUSE (I) OF SUB-SECTION 3 OF SECTION 143 OF THE COMPANIES ACT, 2013 (“THE ACT”)
In conjunction with our audit of the consolidated Ind AS financial statements of the Company as of and for the year ended 31st March, 2017, we have audited the internal financial controls over financial reporting of MRF LIMITED (“the Holding Company”) and its subsidiary companies which are companies incorporated in India, as of that date.
2. MANAGEMENT’S RESPONSIBILITY FOR INTERNAL FINANCIAL CONTROLS
The Respective Board of Directors of the Holding Company and its subsidiary companies incorporated in India, are responsible for establishing and maintaining internal financial controls based on the internal control over financial reporting criteria established by the Company considering the essential components of internal control stated in the Guidance Note on Audit of Internal Financial Controls over Financial Reporting issued by the Institute of Chartered Accountants of India (“ICAI”). These responsibilities include the design, implementation and maintenance of adequate internal financial controls that were operating effectively for ensuring the orderly and efficient conduct of its business, including adherence to company’s policies, the safeguarding of its assets, the prevention and detection of frauds and errors, the accuracy and completeness of the accounting records, and the timely preparation of reliable financial information, as required under the Companies Act, 2013.
3. AUDITORS’ RESPONSIBILITY
Our responsibility is to express an opinion on the Company’s internal financial controls over financial reporting based on our audit. We conducted our audit in accordance with the Guidance Note on Audit of Internal Financial Controls over Financial Reporting (the “Guidance Note”) issued by ICAI and the Standards on Auditing, issued by ICAI and deemed to be prescribed under section 143(10)
of the Companies Act, 2013, to the extent applicable to an audit of internal financial controls, both issued by the Institute of Chartered Accountants of India. Those Standards and the Guidance Note require that we comply with ethical requirements and plan and perform the audit to obtain reasonable assurance about whether adequate internal financial controls over financial reporting was established and maintained and if such controls operated effectively in all material respects.
Our audit involves performing procedures to obtain audit evidence about the adequacy of the internal financial controls system over financial reporting and their operating effectiveness. Our audit of internal financial controls over financial reporting included obtaining an understanding of internal financial controls over financial reporting, assessing the risk that a material weakness exists, and testing and evaluating the design and operating effectiveness of internal control based on the assessed risk. The procedures selected depend on the auditor’s judgment, including the assessment of the risks of material misstatement of the financial statements, whether due to fraud or error.
We believe that the audit evidence we have obtained and the audit evidence obtained by other auditors of a subsidiary company incorporated in India, in terms of their report referred to in other matters paragraph below, is sufficient and appropriate to provide a basis for our audit opinion on the Company’s internal financial controls system over financial reporting.
4. MEANING OF INTERNAL FINANCIAL CONTROLS OVER FINANCIAL REPORTING
A Company’s internal financial control over financial reporting is a process designed to provide reasonable assurance regarding the reliability of financial reporting and the preparation of financial statements for external purposes in accordance with generally accepted accounting principles. A Company’s internal financial control over financial reporting includes those policies and procedures that (1) pertain to the maintenance of records that, in reasonable detail, accurately and fairly reflect the transactions and dispositions of the assets of the Company; (2) provide reasonable assurance that transactions are recorded as necessary to permit
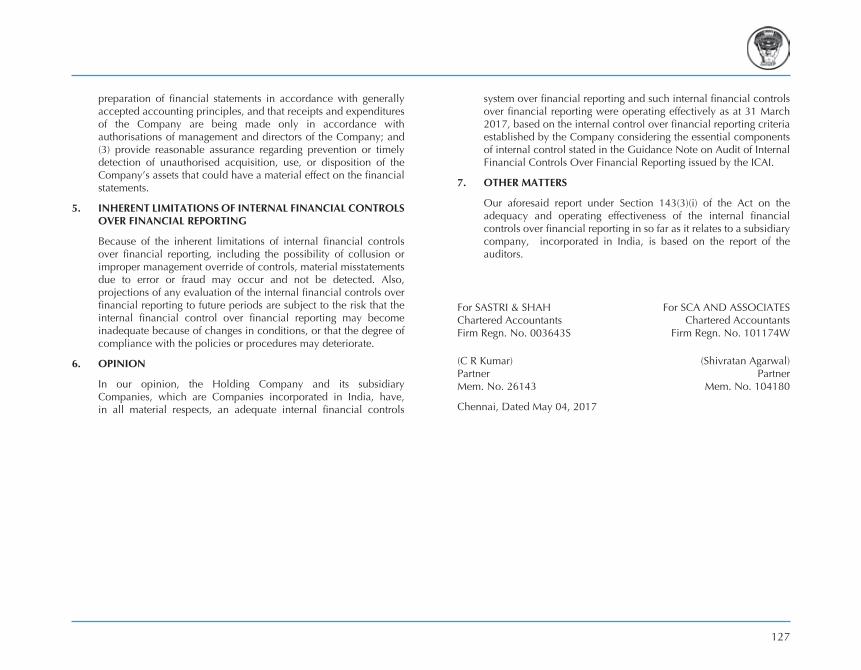
127
preparation of financial statements in accordance with generally accepted accounting principles, and that receipts and expenditures of the Company are being made only in accordance with authorisations of management and directors of the Company; and (3) provide reasonable assurance regarding prevention or timely detection of unauthorised acquisition, use, or disposition of the Company’s assets that could have a material effect on the financial statements.
5. INHERENT LIMITATIONS OF INTERNAL FINANCIAL CONTROLS OVER FINANCIAL REPORTING
Because of the inherent limitations of internal financial controls over financial reporting, including the possibility of collusion or improper management override of controls, material misstatements due to error or fraud may occur and not be detected. Also, projections of any evaluation of the internal financial controls over financial reporting to future periods are subject to the risk that the internal financial control over financial reporting may become inadequate because of changes in conditions, or that the degree of compliance with the policies or procedures may deteriorate.
6. OPINION
In our opinion, the Holding Company and its subsidiary Companies, which are Companies incorporated in India, have, in all material respects, an adequate internal financial controls
system over financial reporting and such internal financial controls over financial reporting were operating effectively as at 31 March 2017, based on the internal control over financial reporting criteria established by the Company considering the essential components of internal control stated in the Guidance Note on Audit of Internal Financial Controls Over Financial Reporting issued by the ICAI.
7. OTHER MATTERS
Our aforesaid report under Section 143(3)(i) of the Act on the adequacy and operating effectiveness of the internal financial controls over financial reporting in so far as it relates to a subsidiary company, incorporated in India, is based on the report of the auditors.
For SASTRI & SHAH For SCA AND ASSOCIATESChartered Accountants Chartered AccountantsFirm Regn. No. 003643S Firm Regn. No. 101174W
(C R Kumar) (Shivratan Agarwal)Partner PartnerMem. No. 26143 Mem. No. 104180
Chennai, Dated May 04, 2017

128
MRF LIMITED, CHENNAICONSOLIDATED BALANCE SHEET AS AT 31ST MARCH, 2017 ` in Crores Particulars Note As at 31.03.2017 As at 31.03.2016 As at 01.10.2014ASSETSNon-Current Assets Property, Plant and Equipment 2 (a) 5489.01 4599.21 3428.78 Capital Work-in-Progress 2 (b) 847.93 1059.28 627.54 Other Intangible Assets 2 (c) 13.23 9.08 7.09 Financial Assets: Investments 3 1059.39 1023.36 176.96 Loans 4 3.87 3.58 1.95 Others financial assets 5 16.10 14.17 9.45 Deferred Tax Asset (Net) 6 0.31 - 0.94 Other non-current assets 7 339.49 226.14 244.05 Current Assets Inventories 8 2425.27 1899.81 1826.25 Financial Assets: Investments 3 2322.71 2114.54 1094.86 Trade Receivables 9 1969.00 1838.72 1715.36 Cash and cash Equivalents 10 246.54 121.14 273.17 Bank balances other than cash and cash equivalents 11 96.07 3.09 452.58 Others financial assets 5 10.15 10.35 18.33 Other current assets 7 243.90 331.34 150.51 TOTAL ASSETS 15082.97 13253.81 10027.82 EQUITY AND LIABILITIESEquity Equity Share Capital SOCE 4.24 4.24 4.24 Other Equity SOCE 8636.52 7220.10 4755.25 Total Equity 8640.76 7224.34 4759.49 Non Controlling Interest 0.12 0.12 0.11 LIABILITIESNon-Current Liabilities Financial Liabilities Borrowings 12 1238.32 1486.45 1190.83 Provisions 13 137.49 125.32 87.64 Deferred Tax Liabilities (Net) 14 536.50 352.52 250.77 Other non-current liabilities 15 27.74 36.24 12.65 Current Liabilities Financial Liabilities Borrowings 12 834.13 885.59 616.25 Trade Payables 16 1408.37 1126.15 1140.87 Other Financial Liabilities 17 576.05 458.19 310.63 Other Current Liabilities 15 1496.42 1459.27 1427.06 Provisions 13 121.62 89.65 103.94 Current Tax Liabilities (Net) 65.45 9.97 127.58 Total Liabilities 6442.09 6029.35 5268.22 TOTAL EQUITY AND LIABILITIES 15082.97 13253.81 10027.82 Significant Accounting Policies 1The Notes are an integral part of these financial statements.This is the Balance Sheet referred to in our report of even date.
For SASTRI & SHAH For SCA AND ASSOCIATESChartered Accountants Chartered Accountants
Firm Regn. No. 003643S Firm Regn. No. 101174W JACOB KuRIAN
C R Kumar Shivratan Agarwal MADHu P NAINAN RAvI MANNATH v SRIDHAR K M MAMMENPartner Partner vice President Finance Company Secretary Directors Chairman & Managing Director
Mem. No. 26143 Mem. No. 104180Chennai, Dated 4th May, 2017

129
MRF LIMITED, CHENNAICONSOLIDATED STATEMENT OF PROFIT & LOSS FOR THE YEAR ENDED 31ST MARCH, 2017 ` in Crores Particulars Note Year ended 31.03.2017 Period ended 31.03.2016INCOME Revenue from Operations 18 14922.80 22491.02 Other Income 19 337.38 323.59 Total Income 15260.18 22814.61 EXPENSES Cost of materials consumed 20 7679.95 11249.13 Purchases of Stock-in-Trade 42.85 39.76 Changes in inventories of Finished Goods, Stock-in-Trade and Work-in-Progress 21 (227.71) (14.48) Employee Benefits expense 22 1000.36 1285.22 Finance Costs 23 251.47 352.56 Depreciation and Amortisation expense 2 (a) & (c) 610.58 737.12 Excise Duty 1516.98 2310.78 Other Expenses 24 2276.33 3198.62 Total Expenses 13150.81 19158.71 PROFIT BEFORE TAX 2109.37 3655.90 TAX EXPENSE Current Tax 465.06 1032.45 MAT Credit Entitlement (34.50) - Deferred Tax 192.59 114.02 Total Tax Expense 623.15 1146.47 PROFIT FOR THE YEAR 1486.22 2509.43 NON-CONTROLLING INTEREST - (0.01)OTHER COMPREHENSIVE INCOME Items that will not be reclassified to Profit or Loss Remeasurements of Defined benefit plans (18.09) (24.92) Income Tax relating to items that will not be reclassified to Profit or Loss 6.13 8.66 Items that may be reclassified to Profit or Loss Designated Cash Flow Hedges (8.06) (9.29) Income tax relating to items that may be reclassified to Profit or Loss 2.79 3.21 TOTAL OTHER COMPREHENSIVE INCOME FOR THE YEAR, NET OF TAX (17.23) (22.34)TOTAL COMPREHENSIVE INCOME FOR THE YEAR 1468.99 2487.08 EARNINGS PER EQUITY SHARE 27 (b) Basic 3504.29 5916.87 Diluted 3504.29 5916.87 Significant Accounting Policies 1The Notes are an integral part of these financial statements.This is the statement of Profit and Loss referred to in our report of even date.
For SASTRI & SHAH For SCA AND ASSOCIATESChartered Accountants Chartered Accountants
Firm Regn. No. 003643S Firm Regn. No. 101174W JACOB KuRIAN
C R Kumar Shivratan Agarwal MADHu P NAINAN RAvI MANNATH v SRIDHAR K M MAMMENPartner Partner vice President Finance Company Secretary Directors Chairman & Managing Director
Mem. No. 26143 Mem. No. 104180Chennai, Dated 4th May, 2017
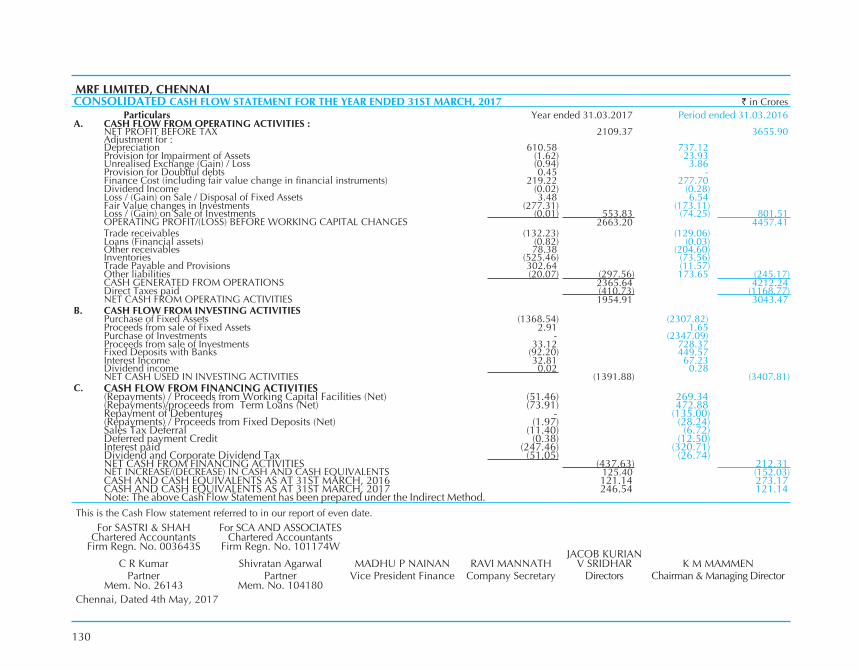
130
MRF LIMITED, CHENNAICONSOLIDATED CASH FLOW STATEMENT FOR THE YEAR ENDED 31ST MARCH, 2017 ` in Crores Particulars Year ended 31.03.2017 Period ended 31.03.2016A. CASH FLOW FROM OPERATING ACTIVITIES :
NET PROFIT BEFORE TAX 2109.37 3655.90 Adjustment for :Depreciation 610.58 737.12 Provision for Impairment of Assets (1.62) 23.93 unrealised Exchange (Gain) / Loss (0.94) 3.86 Provision for Doubtful debts 0.45 - Finance Cost (including fair value change in financial instruments) 219.22 277.70 Dividend Income (0.02) (0.28)Loss / (Gain) on Sale / Disposal of Fixed Assets 3.48 6.54 Fair value changes in Investments (277.31) (173.11)Loss / (Gain) on Sale of Investments (0.01) 553.83 (74.25) 801.51 OPERATING PROFIT/(LOSS) BEFORE WORKING CAPITAL CHANGES 2663.20 4457.41 Trade receivables (132.23) (129.06)Loans (Financial assets) (0.82) (0.03)Other receivables 78.38 (204.60)Inventories (525.46) (73.56)Trade Payable and Provisions 302.64 (11.57)Other liabilities (20.07) (297.56) 173.65 (245.17)CASH GENERATED FROM OPERATIONS 2365.64 4212.24 Direct Taxes paid (410.73) (1168.77)NET CASH FROM OPERATING ACTIvITIES 1954.91 3043.47
B. CASH FLOW FROM INVESTING ACTIVITIESPurchase of Fixed Assets (1368.54) (2307.82)Proceeds from sale of Fixed Assets 2.91 1.65 Purchase of Investments - (2347.09)Proceeds from sale of Investments 33.12 728.37 Fixed Deposits with Banks (92.20) 449.57 Interest Income 32.81 67.23 Dividend income 0.02 0.28 NET CASH uSED IN INvESTING ACTIvITIES (1391.88) (3407.81)
C. CASH FLOW FROM FINANCING ACTIVITIES(Repayments) / Proceeds from Working Capital Facilities (Net) (51.46) 269.34 (Repayments)/proceeds from Term Loans (Net) (73.91) 472.88 Repayment of Debentures - (135.00)(Repayments) / Proceeds from Fixed Deposits (Net) (1.97) (28.24)Sales Tax Deferral (11.40) (6.72)Deferred payment Credit (0.38) (12.50)Interest paid (247.46) (320.71)Dividend and Corporate Dividend Tax (51.05) (26.74)NET CASH FROM FINANCING ACTIvITIES (437.63) 212.31 NET INCREASE/(DECREASE) IN CASH AND CASH EQuIvALENTS 125.40 (152.03)CASH AND CASH EQuIvALENTS AS AT 31ST MARCH, 2016 121.14 273.17 CASH AND CASH EQuIvALENTS AS AT 31ST MARCH, 2017 246.54 121.14 Note: The above Cash Flow Statement has been prepared under the Indirect Method.
This is the Cash Flow statement referred to in our report of even date.For SASTRI & SHAH For SCA AND ASSOCIATES
Chartered Accountants Chartered AccountantsFirm Regn. No. 003643S Firm Regn. No. 101174W
JACOB KuRIANC R Kumar Shivratan Agarwal MADHu P NAINAN RAvI MANNATH v SRIDHAR K M MAMMEN
Partner Partner vice President Finance Company Secretary Directors Chairman & Managing DirectorMem. No. 26143 Mem. No. 104180
Chennai, Dated 4th May, 2017

131
NOTES TO THE CONSOLIDATED FINANCIAL STATEMENTS FOR THE YEAR ENDED 31ST MARCH, 2017
NOTE 1 – BASIS OF CONSOLIDATION AND CONSOLIDATED ACCOUNTING POLICIES UNDER IND AS
A) General Information
The consolidated financial statements comprise financial statements of MRF Limited (the company) and its subsidiaries (collectively, the Group) for the year ended 31 March 2017.
The Group, except for MRF Corp Ltd., a subsidiary company, is engaged interalia in the manufacture of Rubber Products such as Tyres, Tubes, Flaps, Tread Rubber, Conveyor Belt and trading in rubber. MRF Corp Ltd., is engaged in the manufacture of speciality coatings.
B) Principles of Consolidation
The consolidated financial statements comprise of the financial statements of the Company and the following subsidiaries as on March 31st, 2017:
Name Country of incorporation
Proportion of ownership interest
Financial Statement as on
Accounting Period covered for consolidation
MRF Corp Ltd.
India 100% March 31, 2017
April 1st, 2016 – March 31st, 2017
MRF International Ltd.
India 94.66% March 31, 2017
April 1st, 2016 – March 31st, 2017
MRF Lanka Pvt. Ltd.
Sri Lanka 100% March 31, 2017
April 1st, 2016 – March 31st, 2017
MRF SG Pte Ltd.
Singapore 100% March 31, 2017
April 1st, 2016 – March 31st, 2017
The consolidated financial statements comprise the financial statements of the Company and its subsidiaries as at 31 March 2017. Control is
achieved when the Group is exposed, or has rights, to variable returns from its involvement with the investee and has the ability to affect those returns through its power over the investee. Specifically, the Group controls an investee if and only if the Group has:
- Power over the investee (i.e. existing rights that give it the current ability to direct the relevant activities of the investee)
- Exposure, or rights, to variable returns from its involvement with the investee, and
- The ability to use its power over the investee to affect its returns
Generally, there is a presumption that a majority of voting rights result in control. To support this presumption and when the Group has less than a majority of the voting or similar rights of an investee, the Group considers all relevant facts and circumstances in assessing whether it has power over an investee, including:
- The contractual arrangement with the other vote holders of the investee
- Rights arising from other contractual arrangements
- The Group’s voting rights and potential voting rights
- The size of the group’s holding of voting rights relative to the size and dispersion of the holdings of the other voting rights holders
The Group re-assesses whether or not it controls an investee if facts and circumstances indicate that there are changes to one or more of the three elements of control. Consolidation of a subsidiary begins when the Group obtains control over the subsidiary and ceases when the Group loses control of the subsidiary. Assets, liabilities, income and expenses of a subsidiary acquired or disposed of during the year are included in the consolidated financial statements from the date the Group gains control until the date the Group ceases to control the subsidiary.
132
Consolidated financial statements are prepared using uniform accounting policies for like transactions and other events in similar circumstances. If a member of the group uses accounting policies other than those adopted in the consolidated financial statements for like transactions and events in similar circumstances, appropriate adjustments, if material, are made to that group member’s financial statements in preparing the consolidated financial statements to ensure conformity with the group’s accounting policies.
The financial statements of all entities used for the purpose of consolidation are drawn up to same reporting date as that of the parent company, i.e., year ended on 31 March.
Consolidation procedure
a) Combine like items of assets, liabilities, equity, income, expenses and cash flows of the parent with those of its subsidiaries. For this purpose, income and expenses of the subsidiary are based on the amounts of the assets and liabilities recognised in the consolidated financial statements at the acquisition date.
b) Offset (eliminate) the carrying amount of the parent’s investment in each subsidiary and the parent’s portion of equity of each subsidiary.
c) Eliminate in full intragroup assets and liabilities, equity, income, expenses and cash flows relating to transactions between entities of the group (profits or losses resulting from intragroup transactions that are recognised in assets, such as inventory and fixed assets, are eliminated in full). Intragroup losses may indicate an impairment that requires recognition in the consolidated financial statements. Ind AS 12 Income Taxes applies to temporary differences that arise from the elimination of profits and losses resulting from intragroup transactions.
Profit or loss and each component of other comprehensive income (OCI) are attributed to the equity holders of the parent of the Group and to the non-controlling interests, even if this results in the non-controlling interests having a deficit balance. When necessary, adjustments are made to the financial statements of subsidiaries
to bring their accounting policies into line with the Group’s accounting policies. All intra-group assets and liabilities, equity, income, expenses and cash flows relating to transactions between members of the Group are eliminated in full on consolidation.
A change in the ownership interest of a subsidiary, without a loss of control, is accounted for as an equity transaction. If the Group loses control over a subsidiary, it:
- Derecognises the assets (including goodwill) and liabilities of the subsidiary
- Derecognises the carrying amount of any non-controlling interests
- Derecognises the cumulative translation differences recorded in equity
- Recognises the fair value of the consideration received
- Recognises the fair value of any investment retained
- Recognises any surplus or deficit in profit or loss
- Reclassifies the parent’s share of components previously recognised in OCI to profit or loss or retained earnings, as appropriate, as would be required if the Group had directly disposed of the related assets or liabilities
C) Basis of preparation of financial statements
The principal accounting policies applied in the preparation of these consolidated financial statements are set out below. These policies have been consistently applied to all the years / periods presented.
The Group has adopted all the Indian Accounting Standards (‘Ind AS’) in accordance with Ind AS 101 – First Time Adoption of Indian Accounting Standards. The Group has transited from its previous GAAP as defined in Ind AS 101 with the necessary disclosures relating to Shareholders equity under Previous GAAP and Ind AS and of the net profit as per Previous GAAP and Total Comprehensive Income under Ind AS. Refer Note 25 (a), (b), (c).

133
i. Statement of Compliance
In accordance with the notification issued by the Ministry of Corporate Affairs, the Group has adopted Indian Accounting Standards (referred to as “IND AS”) notified under the Companies (Indian Accounting Standards) Rules, 2015 with effect from April 1, 2016. These consolidated financial statements have been prepared in accordance with IND AS as prescribed under Section 133 of the Companies Act, 2013 read together with the Companies (Indian Accounting Standards) Rules, 2015 and subsequent amendments thereto.
The Financial Statement for the year ended 31st March, 2017 is the first Consolidated Financial Statement, the Group has prepared in accordance with IND AS. (Refer Para E below for the details of first-time adoption exemptions availed by the Group.)
ii. Basis of preparation and presentation
The consolidated financial statements have been prepared on historical cost basis considering the applicable provisions of Companies Act 2013, except for the following items that have been measured at fair value as required by relevant IND AS. Historical cost is generally based on the fair value of the consideration given in exchange for goods and services at the time of initial recognition.
a) Certain financial assets/liabilities measured at fair value (refer accounting policy regarding financial instruments.) and
b) Any other item as specifically stated in the accounting policy.
The Consolidated Financial Statement are presented in INR and all values are rounded off to Rupees Crores unless otherwise stated.
The Consolidated Financial Statements of the Group for the year ended 31st March, 2017 were authorised for issue in accordance with a resolution of the directors on 4th May, 2017.
iii. Comparative Reporting Period
In view of the requirement of Companies Act, 2013, regarding uniform financial year for all companies, the group (except for MRF Corp Ltd.) changed its financial year end from 30th September to 31st March. The group (except for MRF Corp Ltd.) had reported for 18 months from 1st October 2014 to 31st March 2016 under previous GAAP. Therefore, the comparative reporting period for the Group (except for MRF Corp Ltd.) is of 18 months from 1st October 2014 to 31st March 2016. In view of the reporting period of current year and comparative period not being same, the consolidated financial statements are not entirely comparable.
iv. Use of Estimate and judgment
In the application of accounting policy which are described in Para D below, the management is required to make judgment, estimates and assumptions about the carrying amount of assets and liabilities, income and expenses, contingent liabilities and the accompanying disclosures that are not readily apparent from other sources. The estimates and associated assumptions are based on historical experience and other factors that are considered to be relevant and are prudent and reasonable. Actual results may differ from those estimates. The estimates and underlying assumptions are reviewed on ongoing basis. Revisions to accounting estimates are recognised in the period in which the estimates are revised if the revision affects only that period or in the period of revision and future periods if the revision affects both current and future period.
The few critical estimations and judgments made in applying accounting policies are:
Property, Plant and Equipment
useful life of Property, Plant and Equipment and Intangible Assets are as specified in Schedule II to the Companies Act, 2013 and on certain assets based on technical advice which considered the nature of the asset, the usage of the asset, expected physical wear and tear, the operating conditions of the asset, anticipated technological changes, manufacturers warranties and maintenance support.

134
Inventories
Inventory obsolescence is based on assessment of the future uses. In all cases, inventory is carried at the lower of historical cost and net realisable value.
Lease
Lease accounting after evaluating the right to use the underlying assets, substance of the transactions including legally enforceable arrangements and other significant terms and conditions of the arrangement to conclude whether the arrangements meet the criteria under IND AS 17.
Impairment of Non-financial Assets
The Group assesses at each reporting date whether there is an indication that an asset may be impaired. If any indication exists, or when annual impairment testing for an asset is required, the Group estimates the asset’s recoverable amount. An asset’s recoverable amount is the higher of an asset’s or CGu’s fair value less costs of disposal and its value in use. It is determined for an individual asset, unless the asset does not generate cash inflows that are largely independent of those from other assets or groups of assets. Where the carrying amount of an asset or CGu exceeds its recoverable amount, the asset is considered impaired and is written down to its recoverable amount. In assessing value in use, the estimated future cash flows are discounted to their present value using a pre-tax discount rate that reflects current market assessments of the time value of money and the risks specific to the asset. In determining fair value less costs of disposal, recent market transactions are taken into account. If no such transactions can be identified, an appropriate valuation model is used. These calculations are corroborated by valuation multiples or other available fair value indicators.
Impairment of Financial Assets
The impairment provisions for financial assets are based on assumptions about risk of default and expected loss rates. The Group uses judgement in making these assumptions and
selecting the inputs to the impairment calculation, based on Group’s past history, existing market conditions as well as forward looking estimates at the end of each reporting period.
Defined Benefit Plans
The cost of the defined benefit plan and other post-employment benefits and the present value of such obligations are determined using actuarial valuations. An actuarial valuation involves making various assumptions that may differ from actual developments in the future. These include the determination of the discount rate, future salary increases, mortality rates and attrition rate. Due to the complexities involved in the valuation and its long-term nature, a defined benefit obligation is highly sensitive to changes in these assumptions. All assumptions are reviewed at each reporting date.
Fair value Measurement of Financial Instruments
When the fair values of financial assets and financial liabilities recorded in the balance sheet cannot be measured based on quoted prices in active markets, their fair value is measured using valuation techniques including the Discounted Cash Flow (DCF) model. The inputs to these models are taken from observable markets where possible, but where this is not feasible, a degree of judgements is required in establishing fair values. Judgements include considerations of inputs such as liquidity risk, credit risk and volatility. Changes in assumptions about these factors could affect the reported fair value of financial instruments.
D) Summary of Significant Accounting Policies
1) Property, Plant and Equipment (PPE)
For transition to Ind AS, the Group (except for MRF Corp Ltd.) has elected to continue with the carrying value of Property, Plant and Equipment (‘PPE’) recognized as of 1st October, 2014 (transition date for MRF Corp Ltd., being 1st April, 2015) measured as per the Previous GAAP and use that carrying value as its deemed cost of the PPE as on the transition date.

135
Property, Plant and Equipment are stated at cost less accumulated depreciation and accumulated impairment losses except for freehold land which is not depreciated. Cost includes purchase price after deducting trade discount / rebate, import duties, non-refundable taxes, cost of replacing the component parts, borrowing costs and other directly attributable cost of bringing the asset to its working condition in the manner intended by the management.
Spares parts procured along with the Plant and Equipment or subsequently which meets the definition and recognition criteria of PPE considering the concept of materiality are capitalized and added to the carrying amount of such items. The carrying amount of those spare parts that are replaced is derecognized when no future economic benefits are expected from their use or upon disposal. Other machinery spares are treated as ‘stores and spares’ forming part of the inventory. If the cost of the replaced part is not available, the estimated cost of similar new parts is used as an indication of what the cost of the existing part was when the item was acquired.
An item of PPE is derecognised on disposal or when no future economic benefits are expected from use or disposal. Any gain or loss arising on derecognition of an item of property, plant and equipment is determined as the difference between the net disposal proceeds and the carrying amount of the asset and is recognized in Consolidated statement of profit and loss when asset is derecognised.
Expenditure on acquisition of PPE for Research and Development (R&D) is included in PPE and depreciation thereon is provided as applicable.
The depreciable amount of an asset is determined after deducting its residual value. Where the residual value of an asset increases to an amount equal to or greater than the asset’s carrying amount, no depreciation charge is recognised till the asset’s residual value decreases below the asset’s carrying amount. Depreciation of an asset begins when it is available for use, i.e., when it is in the location and condition necessary for it to be capable of operating in the intended
manner. Depreciation of an asset ceases at the earlier of the date that the asset is classified as held for sale in accordance with IND AS 105 and the date that the asset is derecognised. Depreciation on all assets except Renewable Energy Saving Devices is provided on straight line basis whereas depreciation on renewable energy saving devices is provided on reducing balance basis.
Description of the Asset Estimated Useful lifeTangible:Land - Leasehold Primary period of leaseBuilding – Factory 30 Years – Other than factory
buildings60 Years
Plant and Equipment 10 YearsMoulds 6 YearsFurniture and Fixtures 5 YearsComputer Servers 5 YearsComputers 3 YearsOffice Equipment 5 YearsOther Assets, viz., Electrical Fittings, Fire Fighting/Other Equipments and Canteen utensils
10 Years
Renewable Energy Saving Device - Windmills
22 Years
vehicles 5 YearsIntangible: Software 5 Years
Depreciation on the Property, Plant and Equipment, except for Plant and Machinery, Moulds, vehicles, Furniture and Fixtures and Computer Servers is provided over the useful life of assets on straight line method as specified in Schedule II to the Companies Act, 2013. Plant and Machinery, Moulds, vehicles, Furniture and Fixtures and Computer Servers are depreciated based on management estimate of the useful life of the assets, which considered the nature of the asset,

136
the usage of the asset, expected physical wear and tear, the operating conditions of the asset, anticipated technological changes, manufacturers warranties and maintenance support.
Further, the Group has identified and determined separate useful life for each major component of fixed assets, if they are materially different from that of the remaining assets, for providing depreciation in compliance with Schedule II of the Companies Act, 2013.
In respect of fixed assets of MRF Lanka Pvt. Ltd. and MRF SG Pte Ltd. depreciation is provided on straight line method based on management estimate of useful life of assets based on internal technical evaluation, except for certain fixed assets namely Building, Plant & Machinery, Moulds and Equipments of MRF Lanka Pvt Ltd, which are depreciated on Written Down value method. The proportion of depreciation of the subsidiary to the total depreciation of the group is not material.
Depreciation on fixed assets added/disposed off during the period is provided on pro-rata basis with reference to the date of addition/disposal. The assets’ residual values, useful lives and methods of depreciation are reviewed at each financial year end and adjusted prospectively, if appropriate.
Leasehold Land is amortised over the primary period of the lease.
2) Intangible Assets
Intangible assets acquired separately are measured on initial recognition at cost. After initial recognition, intangible assets are carried at cost less any accumulated amortisation and accumulated impairment losses.
Software (not being an integral part of the related hardware) acquired for internal use are treated as intangible assets.
An item of Intangible asset is derecognised on disposal or when no future economic benefits are expected from its use or disposal. Any profit or loss arising from derecognition of an
intangible asset are measured as the difference between the net disposal proceeds and the carrying amount of the asset and are recognised in the Consolidated statement of profit and loss when the asset is derecognised.
Intangible Assets are amortised over 5 years on straight-line method over the estimated useful economic life of the assets.
3) Impairment of tangible (PPE) and intangible assets
At the end of each reporting period, the Group reviews the carrying amounts of its PPE and other intangible assets to determine whether there is any indication that these assets have suffered an impairment loss. If any such indication exists, the recoverable amount of the asset is estimated in order to determine the extent of the impairment loss. Where it is not possible to estimate the recoverable amount of an individual asset, the Group estimates the recoverable amount of the cash-generating unit (CGu) to which the asset belongs. When the carrying amount of an asset or CGu exceeds its recoverable amount, the asset is considered impaired and is written down to its recoverable amount. The resulting impairment loss is recognised in the Consolidated statement of profit and loss.
Recoverable amount is the higher of fair value less costs to sell and value in use. In assessing value in use, the estimated future cash flows are discounted to their present value using a pre-tax discount rate that reflects current market assessments of the time value of money and the risks specific to the asset. In determining fair value less costs of disposal, recent market transactions are taken into account. If no such transactions can be identified, an appropriate valuation model is used.
Where an impairment loss subsequently reverses, the carrying amount of the asset or CGu is increased to the revised estimate of its recoverable amount, but so that the increased carrying amount does not exceed the carrying amount that would have been determined had no impairment loss been recognised for the asset or CGu in prior years. A reversal of an impairment loss is recognised in the Consolidated statement of profit and loss.

137
4) Inventories
Inventories consisting of stores and spares, raw materials, work in progress, stock in trade and finished goods are valued at lower of cost and net realisable value. However, materials held for use in production of inventories are not written down below cost, if the finished products are expected to be sold at or above cost.
The cost is computed on FIFO basis except for stores and spares which are on daily moving Weighted Average Cost basis and is net of credits under CENvAT/vAT Schemes.
Goods and materials in transit include materials, duties and taxes (other than those subsequently recoverable from tax authorities) labour cost and other related overheads incurred in bringing the inventories to their present location and condition.
Traded goods includes cost of purchase and other costs incurred in bringing the inventories to their present location and condition.
Net realisable value is the estimated selling price in the ordinary course of business, less estimated cost of completion and estimated cost necessary to make the sale.
Obsolete and slow moving items are subjected to continuous technical monitoring and are valued at lower of cost and estimated net realisable value.
5) Leases
The determination of whether an arrangement is (or contains) a lease is based on the substance of the arrangement at the inception of the lease. The arrangement is (or contains) a lease, if fulfillment of the arrangement is dependent on the use of a specific asset or assets and the arrangement conveys a right to use the asset or assets, even if that right is not explicitly specified in an arrangement.
Finance leases that transfer substantially all the risks and benefits incidental to ownership of the leased item (i.e. PPE), are generally capitalized at the inception of the lease at the fair value of the leased assets or, if lower, at the present value
of minimum lease payments. Lease payments are apportioned between finance charges and a reduction in lease liability so as to achieve a constant rate of interest on the remaining balance of the liability. Finance charges are recognized in finance costs in the Consolidated statement of profit and loss.
Leases in which a significant portion of the risks and rewards of ownership are not transferred to the Group as lessee are classified as operating leases. Payments made under operating leases are charged to Consolidated statement of profit and loss over the period of lease on straight line basis other than those cases where the escalations are linked to expected general inflation in which case they are charged on contractual terms.
6) Government Grants
Government grants are recognized when there is reasonable assurance that the Group will comply with the conditions attached to them and that the grants will be received.
Grants related to income are recognized as income over the periods necessary to match them with the costs for which they are intended to compensate on a systematic basis. Government grants that are receivable as compensation for expenses or losses already incurred or for the purpose of providing immediate financial support with no future related costs are recognized in the Consolidated statement of profit and loss in the period in which they become receivable. Grants related to income are presented under other income in the Consolidated statement of profit and loss except for grants received in the form of rebate or exemption which are deducted in reporting the related expense.
The benefit of a government loan at a below-market rate of interest is treated as a government grant, measured as the difference between proceeds received and the fair value of the loan based on prevailing market interest rates.
7) Provisions, Contingent Liabilities and Contingent Assets
Provisions are recognised when there is a present legal or constructive obligation as a result of a past event and

138
it is probable (i.e. more likely than not) that an outflow of resources embodying economic benefits will be required to settle the obligation and a reliable estimate can be made of the amount of the obligation. Such provisions are determined based on management estimate of the amount required to settle the obligation at the balance sheet date. When the Group expects some or all of a provision to be reimbursed, the reimbursement is recognised as a standalone asset only when the reimbursement is virtually certain.
If the effect of the time value of money is material, provisions are discounted using a current pre-tax rate that reflects, the risks specific to the liability. When discounting is used, the increase in the provision due to the passage of time is recognised as a finance cost.
Present obligations arising under onerous contracts are recognised and measured as provisions. An onerous contract is considered to exist when a contract under which the unavoidable costs of meeting the obligations exceed the economic benefits expected to be received from it.
Contingent liabilities are disclosed on the basis of judgment of management / independent experts. These are reviewed at each balance sheet date and are adjusted to reflect the current management estimate.
Provisions for warranty-related costs are recognized when the product is sold to the customer. Initial recognition is based on scientific basis as per past trends of such claims. The initial estimate of warranty-related costs is revised annually.
Contingent Assets are not recognized, however, disclosed in financial statement when inflow of economic benefits is probable.
8) Foreign Currency Transactions
The financial statements of Group are presented in INR, which is also the functional currency. In preparing the financial statements, transactions in currencies other than the entity’s functional currency are recognised at the rates of exchange prevailing at the dates of the transactions. At the end of each reporting period, monetary items denominated in foreign
currencies are translated at the rates prevailing at that date. Non-monetary items denominated in foreign currency are reported at the exchange rate ruling on the date of transaction.
9) Share Capital and Share Premium
Ordinary shares are classified as equity, incremental costs directly attributable to the issue of new shares are shown in equity as a deduction net of tax from the proceeds. Par value of the equity share is recorded as share capital and the amount received in excess of the par value is classified as share premium.
10) Dividend Distribution to equity shareholders
The Group recognizes a liability to make cash distributions to equity holders when the distribution is authorized. A distribution is authorized when it is approved by the shareholders. A corresponding amount is recognized directly in other equity along with any tax thereon.
11) Cash Flows and Cash and Cash Equivalents
Statement of cash flows is prepared in accordance with the indirect method prescribed in the relevant IND AS. For the purpose of presentation in the statement of cash flows, cash and cash equivalents includes cash on hand, cheques and drafts on hand, deposits held with Banks, other short-term, highly liquid investments with original maturities of three months or less that are readily convertible to known amounts of cash and which are subject to an insignificant risk of changes in value, and book overdrafts. However, Book overdrafts are shown within borrowings in current liabilities in the balance sheet for the purpose of presentation.
12) Revenue Recognition
Revenue is recognized to the extent that it is probable that the economic benefits will flow to the Group and the revenue can be reliably measured, regardless of when the payment is being made. Revenue is measured at the fair value of the consideration received or receivable, taking into account contractually defined terms of payment and excluding taxes or duties collected on behalf of the government.

139
Sale of Goods
Revenue from sale of goods is recognized, when all significant risks and rewards are transferred to the buyer, as per the terms of the contracts and no significant uncertainty exists regarding the amount of the consideration that will be derived from the sale of goods. It includes excise duty and excludes value added tax/sales tax. It is measured at fair value of consideration received or receivable, net of returns and allowances, trade discounts and volume rebates.
Rendering of Services
Revenue from rendering of services is recognized as per the terms of the contract with customers when related services are performed and when the outcome of the transactions involving rendering of services can be estimated reliably.
Dividend Income
Dividend Income is accounted for when the right to receive the same is established, which is generally when shareholders approve the dividend.
Interest Income
Interest Income on financial assets measured at amortised cost is recognised on a time-proportion basis using the effective interest method.
13) Borrowing costs
Borrowing cost includes interest, commitment charges, brokerage, underwriting costs, discounts / premiums, financing charges, exchange difference to the extent they are regarded as interest costs and all ancillary / incidental costs incurred in connection with the arrangement of borrowing.
Borrowing costs which are directly attributable to acquisition/ construction of qualifying assets that necessarily takes a substantial period of time to get ready for its intended use are capitalized as a part of cost pertaining to those assets. All other borrowing costs are recognised as expense in the period in which they are incurred.
14) Employee Benefits
a) Short term Employee Benefits
All employee benefits payable wholly within twelve months of rendering services are classified as short term employee benefits. Benefits such as salaries, wages, short-term compensated absences, performance incentives etc., are recognized during the period in which the employee renders related services and are measured at undiscounted amount expected to be paid when the liabilities are settled.
b) Long Term Employee Benefits
The cost of providing long term employee benefit such as earned leave is measured as the present value of expected future payments to be made in respect of services provided by employees upto the end of the reporting period. The expected costs of the benefit is accrued over the period of employment using the same methodology as used for defined benefits post employment plans. Actuarial gains and losses arising from the experience adjustments and changes in actuarial assumptions are charged or credited to the Consolidated statement of profit and loss in which they arise except those included in cost of assets as permitted. The benefit is valued annually by independent actuary.
c) Post Employment Benefits
The Group provides the following post employment benefits:
i) Defined benefit plans such as gratuity, trust managed Provident Fund and post-retirement medical benefit (PRMB); and
ii) Defined contributions plans such as provident fund, pension fund and superannuation fund.
d) Defined benefits Plans
The cost of providing benefits on account of gratuity

140
and post retirement medical benefits / obligations are determined using the projected unit credit method on the basis of actuarial valuation made at the end of each balance sheet date, which recognises each period of service as given rise to additional unit of employees benefit entitlement and measuring each unit separately to build up the final obligation. The yearly expenses on account of these benefits are provided in the books of accounts.
The net interest cost is calculated by applying the discount rate to the net balance of the defined benefit obligation and the fair value of plan assets. This cost is included in employee benefit expense in the Consolidated statement of profit and loss except those included in cost of assets as permitted.
Re-measurements comprising of actuarial gains and losses arising from experience adjustments and change in actuarial assumptions, the effect of change in assets ceiling (if applicable) and the return on plan asset (excluding net interest as defined above) are recognized in other comprehensive income (OCI) except those included in cost of assets as permitted in the period in which they occur. Re-measurements are not reclassified to the Consolidated statement of profit and loss in subsequent periods.
Service cost (including current service cost, past service cost, as well as gains and losses on curtailments and settlements) is recognized in the Consolidated statement of profit and loss except those included in cost of assets as permitted in the period in which they occur.
Eligible employees of the Group receive benefits from a provident fund trust which is a defined benefit plan. Both the eligible employee and the Group make monthly contributions to the provident fund plan equal to a specified percentage of the covered employees salary. The Group contributes a part of the contribution to the provident fund trusts. The trusts invests in specific designated instruments as permitted by Indian Law. The
remaining portion is contributed to the Government Administered Pension Fund. The rate at which the annual interest is payable to the beneficiaries by the trusts is administered by the Government. The Group has obligation to make good the shortfall, if any, between the return from investments of the Trusts and the notified interest rate. However, as at the year end no shortfall remains unprovided for.
e) Defined Contribution Plans
Payments to defined contribution retirement benefit plans, viz., Provident Fund for certain eligible employees, Pension Fund and Superannuation benefits are recognized as an expense when employees have rendered the service entitling them to the contribution.
15) Taxes on Income
Income tax expense represents the sum of tax currently payable and deferred tax. Tax is recognized in the Consolidated statement of profit and loss, except to the extent that it relates to items recognized directly in equity or in other comprehensive income.
a) Current Tax
Current tax includes provision for Income Tax computed under Special provision (i.e., Minimum alternate tax) or normal provision of Income Tax Act. Tax on Income for the current period is determined on the basis on estimated taxable income and tax credits computed in accordance with the provisions of the relevant tax laws and based on the expected outcome of assessments/appeals.
b) Deferred Tax
Deferred tax is recognised on temporary differences between the carrying amounts of assets and liabilities in the balance sheet and the corresponding tax bases used in the computation of taxable profit. Deferred tax liabilities are generally recognised for all taxable

141
temporary differences. Deferred tax assets are generally recognised for all deductible temporary differences, unabsorbed losses and unabsorbed depreciation to the extent that it is probable that future taxable profits will be available against which those deductible temporary differences, unabsorbed losses and unabsorbed depreciation can be utilised.
The carrying amount of deferred tax assets is reviewed at each balance sheet date and reduced to the extent that it is no longer probable that sufficient taxable profits will be available to allow all or part of the asset to be recovered.
Deferred tax assets and liabilities are measured at the tax rates that are expected to apply in the period in which the liability is settled or the asset realised, based on tax rates (and tax laws) that have been enacted or substantively enacted by the balance sheet date. The measurement of deferred tax liabilities and assets reflects the tax consequences that would follow from the manner in which the Group expects, at the reporting date, to recover or settle the carrying amount of its assets and liabilities.
Deferred tax assets and liabilities are offset when there is a legally enforceable right to set off current tax assets against current tax liabilities and when they relate to income taxes levied by the same taxation authority and the Group intends to settle its current tax assets and liabilities on a net basis.
16) Earnings per Share
Basic earnings per share is calculated by dividing the profit from continuing operations and total profit, both attributable to equity shareholders of the Group by the weighted average number of equity shares outstanding during the period.
17) Current versus non-current classification
The Group presents assets and liabilities in the Balance Sheet based on current/non-current classification.
a) An asset is current when it is:
- Expected to be realized or intended to be sold or consumed in the normal operating cycle,
- Held primarily for the purpose of trading,
- Expected to be realised within twelve months after the reporting period, or
- Cash or cash equivalent unless restricted from being exchanged or used to settle a liability for at least twelve months after the reporting period.
All other assets are classified as non-current.
b) A liability is current when:
- It is expected to be settled in the normal operating cycle,
- It is held primarily for the purpose of trading, - It is due to be settled within twelve months after the
reporting period, or - There is no unconditional right to defer the
settlement of the liability for at least twelve months after the reporting period.
All other liabilities are classified as non-current.
c) Deferred tax assets and liabilities are classified as non-current assets and liabilities.
The operating cycle is the time between the acquisition of assets for processing and their realization in cash and cash equivalents. The Group has identified twelve months as its operating cycle.
18) Fair value measurement
Fair value is the price that would be received to sell an asset or paid to transfer a liability in an orderly transaction between market participants at the measurement date, regardless of whether that price is directly observable or estimated using another valuation technique. In estimating the fair value of an asset or a liability, the Group takes into account the
142
characteristics of asset and liability if market participants would take those into consideration. Fair value for measurement and / or disclosure purposes in these financial statements is determined in such basis except for transactions in the scope of Ind AS 2, 17 and 36. Normally at initial recognition, the transaction price is the best evidence of fair value.
The fair value of an asset or a liability is measured using the assumptions that market participants would use when pricing the asset or liability, assuming that market participants act in their economic best interest. A fair value measurement of a non-financial asset takes into account a market participant’s ability to generate economic benefits by using the asset in its highest and best use or by selling it to another market participant that would use the asset in its highest and best use.
The Group uses valuation techniques that are appropriate in the circumstances and for which sufficient data are available to measure fair value, maximizing the use of relevant observable inputs and minimizing the use of unobservable inputs.
All financial assets and financial liabilities for which fair value is measured or disclosed in the financial statements are categorized within the fair value hierarchy, described as follows, based on the lowest level input that is significant to the fair value measurement as a whole:
Level 1 — Quoted (unadjusted) market prices in active markets for identical assets or liabilities.
Level 2 — valuation techniques for which the lowest level input that is significant to the fair value measurement is directly or indirectly observable.
Level 3 — valuation techniques for which the lowest level input that is significant to the fair value measurement is unobservable.
Financial assets and financial liabilities that are recognized at fair value on a recurring basis, the Group determines whether transfers have occurred between levels in the hierarchy by re-assessing categorization at the end of each reporting period.
19) Financial Instruments
A financial instrument is any contract that gives rise to a financial asset of one entity and a financial liability or equity instrument of another entity. The Group recognizes a financial asset or financial liability in its balance sheet only when the entity becomes party to the contractual provisions of the instrument.
a) Financial Assets
A financial asset inter-alia includes any asset that is cash, equity instrument of another entity or contractual obligation to receive cash or another financial asset or to exchange financial asset or financial liability under condition that are potentially favourable to the Group.
Financial assets other than investment in subsidiaries
Financial assets of the Group comprise trade receivable, cash and cash equivalents, Bank balances, Investments in equity shares of companies other than in subsidiaries, investment other than equity shares, loans/advances to employee / related parties / others, security deposit, claims recoverable etc.
Initial recognition and measurement
All financial assets are recognized initially at fair value plus, in the case of financial assets not recorded at fair value through profit or loss, transaction costs that are attributable to the acquisition of the financial asset. Transaction costs of financial assets carried at fair value through profit or loss are expensed in Consolidated statement of profit and loss. Where transaction price is not the measure of fair value and fair value is determined using a valuation method that uses data from observable market, the difference between transaction price and fair value is recognized in Consolidated statement of profit and loss and in other cases spread over life of the financial instrument using effective interest method.

143
Subsequent measurement
For purposes of subsequent measurement financial assets are classified in three categories:
- Financial assets measured at amortized cost - Financial assets at fair value through OCI - Financial assets at fair value through profit or loss
Financial assets measured at amortized cost
Financial assets are measured at amortized cost if the financial asset is held within a business model whose objective is to hold financial assets in order to collect contractual cash flows and the contractual terms of the financial asset give rise on specified dates to cash flows that are solely payments of principal and interest on the principal amount outstanding. These financials assets are amortized using the effective interest rate (EIR) method, less impairment. Amortized cost is calculated by taking into account any discount or premium on acquisition and fees or costs that are an integral part of the EIR. The EIR amortization is included in finance income in the consolidated statement of profit and loss. The losses arising from impairment are recognized in the consolidated statement of profit and loss in finance costs.
Financial assets at fair value through OCI (FvTOCI)
Financial assets are measured at fair value through other comprehensive income if the financial asset is held within a business model whose objective is achieved by both collecting contractual cash flows and selling financial assets and the contractual terms of the financial asset give rise on specified dates to cash flows that are solely payments of principal and interest on the principal amount outstanding. At initial recognition, an irrevocable election is made (on an instrument-by-instrument basis) to designate investments in equity instruments other than held for trading purpose at
FvTOCI. Fair value changes are recognized in the other comprehensive income (OCI). However, the Group recognizes interest income, impairment losses and reversals and foreign exchange gain or loss in the income statement. On derecognition of the financial asset other than equity instruments, cumulative gain or loss previously recognised in OCI is reclassified to income statements.
Financial assets at fair value through profit or loss (FvTPL)
Any financial asset that does not meet the criteria for classification as at amortized cost or as financial assets at fair value through other comprehensive income, is classified as financial assets at fair value through profit or loss. Further, financial assets at fair value through profit or loss also include financial assets held for trading and financial assets designated upon initial recognition at fair value through profit or loss. Financial assets are classified as held for trading if they are acquired for the purpose of selling or repurchasing in the near term. Financial assets at fair value through profit or loss are fair valued at each reporting date with all the changes recognized in the Consolidated statement of profit and loss
Derecognition
The Group derecognises a financial asset only when the contractual rights to the cash flows from the asset expire, or when it transfers the financial asset and substantially all the risks and rewards of ownership of the asset to another entity. If the Group neither transfers nor retains substantially all the risks and rewards of ownership and continues to control the transferred asset, the Group recognizes its retained interest in the asset and an associated liability for amounts it may have to pay.
Impairment of financial assets
The Group assesses impairment based on expected credit loss (ECL) model on the following:

144
- Financial assets that are measured at amortised cost.
- Financial assets measured at fair value through other comprehensive income (FvTOCI).
ECL is measured through a loss allowance on a following basis:-
- The 12 month expected credit losses (expected credit losses that result from those default events on the financial instruments that are possible within 12 months after the reporting date)
- Full life time expected credit losses (expected credit losses that result from all possible default events over the life of financial instruments)
The Group follows ‘simplified approach’ for recognition of impairment on trade receivables or contract assets resulting from normal business transactions. The application of simplified approach does not require the Group to track changes in credit risk. However, it recognises impairment loss allowance based on lifetime ECLs at each reporting date, from the date of initial recognition.
For recognition of impairment loss on other financial assets, the Group determines whether there has been a significant increase in the credit risk since initial recognition. If credit risk has increased significantly, lifetime ECL is provided. For assessing increase in credit risk and impairment loss, the Group assesses the credit risk characteristics on instrument-by-instrument basis.
ECL is the difference between all contractual cash flows that are due to the Group in accordance with the contract and all the cash flows that the entity expects to receive (i.e., all cash shortfalls), discounted at the original EIR.
Impairment loss allowance (or reversal) recognized during the period is recognized as expense/income in the consolidated statement of profit and loss.
b) Financial Liabilities
The Group’s financial liabilities include loans and borrowings including book overdraft, trade payable, accrued expenses and other payables.
Initial recognition and measurement
All financial liabilities at initial recognition are classified as financial liabilities at amortized cost or financial liabilities at fair value through profit or loss, as appropriate. All financial liabilities are recognized initially at fair value and, in the case of loans and borrowings and payables, net of directly attributable transaction costs. Any difference between the proceeds (net of transaction costs) and the fair value at initial recognition is recognised in the Consolidated statement of profit and loss or in the “Expenditure Attributable to Construction” if another standard permits inclusion of such cost in the carrying amount of an asset over the period of the borrowings using the effective rate of interest.
Subsequent measurement
The subsequent measurement of financial liabilities depends upon the classification as described below:-
Financial Liabilities classified as Amortised Cost
Financial Liabilities that are not held for trading and are not designated as at FvTPL are measured at amortised cost at the end of subsequent accounting periods. Amortised cost is calculated by taking into account any discount or premium on acquisition and fees or costs that are an integral part of the Effective Interest Rate. Interest expense that is not capitalised as part of costs of assets is included as Finance costs in the Consolidated statement of profit and loss.
145
Financial Liabilities at Fair value through profit and loss (FvTPL)
FvTPL includes financial liabilities held for trading and financial liabilities designated upon initial recognition as FvTPL. Financial liabilities are classified as held for trading if they are incurred for the purpose of repurchasing in the near term. Financial liabilities have not been designated upon initial recognition at FvTPL.
Derecognition
A financial liability is derecognised when the obligation under the liability is discharged / cancelled / expired. When an existing financial liability is replaced by another from the same lender on substantially different terms, or the terms of an existing liability are substantially modified, such an exchange or modification is treated as the derecognition of the original liability and the recognition of a new liability. The difference in the respective carrying amounts is recognized in the consolidated statement of profit and loss.
Offsetting of financial instruments
Financial assets and financial liabilities are offset and the net amount is reported in the balance sheet if there is a currently enforceable legal right to offset the recognised amounts and there is an intention to settle on a net basis, to realise the assets and settle the liabilities simultaneously.
c) Derivatives
Derivative instruments are initially recognized at fair value on the date a derivative contract is entered into and are subsequently re-measured to their fair value at the end of each reporting period. The accounting for subsequent changes in fair value depends on whether the derivative is designated as a hedging instrument,
and if so, the nature of the item being hedged and the type of hedge relationship designated. The resulting gain or loss is recognized in the Consolidated statement of profit and loss immediately unless the derivative is designated and effective as a hedging instrument and is recognized in Other Comprehensive Income (OCI). Cash flow hedges shall be reclassified to profit or loss as a reclassification adjustment in the same period or periods during which the hedged expected future cash flows affect profit or loss.
Embedded Derivatives
Derivative embedded in host contract are separated only if the economic characteristics and risk of the embedded derivatives are not closely related to economic characteristics and risks of the host and are measured at fair value through profit or loss. Embedded derivatives closely related to the host contracts are not separated.
E) First time adoption of IND AS – Mandatory exceptions / Optional exemptions
Overall principle
The Group has prepared the opening balance sheet as per Ind AS as of 1st October, 2014 (the transition date for MRF Corp Ltd., being 1st April, 2015) by recognizing all assets and liabilities whose recognition is required by Ind AS, not recognizing items of assets or liabilities which are not permitted by Ind AS, by reclassifying certain items from Previous GAAP to Ind AS as required under the Ind AS, and applying Ind AS in the measurement of recognized assets and liabilities. However, this principle is subject to certain mandatory exceptions and certain optional exemptions availed by the Group as detailed below:
- Derecognition of financial assets and financial liabilities
The Group has applied the de-recognition requirements of financial assets and financial liabilities prospectively for transactions occurring on or after 1st October, 2014 (the transition date for MRF Corp Ltd., being 1st April, 2015).

146
- Classification of debt instruments
The Group has determined the classification of debt instruments in terms of whether they meet the amortised cost criteria or the fair value through other comprehensive income (FvTOCI) criteria based on the facts and circumstances that existed as of the transition date.
- Impairment of financial assets
The Group has applied the impairment requirements of Ind AS 109 retrospectively; however, as permitted by Ind AS 101, it has used reasonable and supportable information that is available without undue cost or effort to determine the credit risk at the date that financial instruments were initially recognized in order to compare it with the credit risk at the transition date. Further, the Group has not undertaken an exhaustive search for information when determining, at the date of transition to Ind AS whether there have been significant increases in credit risk since initial recognition, as permitted by Ind AS 101.
- Deemed cost for PPE, CWIP and Intangible assets
The Group has opted for historical cost of Property, Plant and Equipment / intangible assets as per Indian GAAP as the deemed cost on the opening balance sheet date. The carrying amount of those assets are given below:
` in CroresSl. No.
Class of Property, Plant and Equipment
As at 31.03.2017
1 Land – Freehold 344.482 Land – Leasehold 2.463 Buildings 740.474 Plant and Equipment 1237.135 Furniture and Fixtures 54.896 vehicles 1.917 Office Equipments 2.318 Computers 1.979 Moulds 5.0010 Other Assets 43.7511 Computer Software 1.89
2436.26
- Determining whether an arrangement contains a lease
The Group has applied Appendix C of Ind AS 17 for determining whether an arrangement contains a Lease at the transition date on the basis of facts and circumstances existing at that date.
- Assessment of embedded derivatives
The Group has assessed whether an embedded derivative is required to be separated from the host contract and accounted for as a derivative on the basis of the conditions that existed at the later of the date if first became a party to the contract and the date when there has been a change in the terms of the contract that significantly modifies the cash flows that otherwise would be required under the contract.
F) Recent accounting pronouncements
Standards issued but not yet effective
In March 2017, the Ministry of Corporate Affairs issued the Companies (Indian Accounting Standards) (Amendments) Rules, 2017, notifying amendment to Ind AS 7, ‘Statement of cash flows’. This amendment is in accordance with the recent amendments made by International Accounting Standards Board (IASB) to IAS 7, ‘Statement of cash flows’. The amendment is applicable to the Company from April 1, 2017.
Amendments to Ind AS 7
The amendments to Ind AS 7 requires the entities to provide disclosures that enable users of financial statements to evaluate changes in liabilities arising from financing activities, including both changes arising from cash flows and non-cash changes, suggesting inclusion of a reconciliation between the opening and closing balances in the Balance Sheet for liabilities arising from financing activities, to meet the disclosure requirement.
The amendment has no impact either on the financial performance or financial position of the Company.

147
` in CroresNote 2 (c):INTANGIBLESNOTE 2 (a): PROPERTY, PLANT AND EQUIPMENT
Particulars Land Buildings Plant and equipment
Furniture and fixtures
Vehicles Office equipment
Computers Moulds Other Assets
Total Computer SoftwareFreehold Leased
Gross BlockAt Deemed cost as at 01/10/2014 345.57 2.69 816.08 1986.74 6.90 13.93 9.03 13.24 139.82 94.78 3428.78 7.09 Additions 146.67 - 284.34 1290.23 4.15 9.16 8.85 8.52 112.18 49.67 1913.77 5.63 Disposals - - (10.18) (37.82) (0.59) (1.70) (0.90) (1.16) (25.43) (12.48) (90.26) - At cost as at 31/03/2016 492.24 2.69 1090.24 3239.15 10.46 21.39 16.98 20.60 226.57 131.97 5252.29 12.72 Additions 35.29 81.84 347.89 791.14 4.32 7.83 6.73 10.42 102.40 111.46 1499.32 8.30 Disposals (1.09) - (1.60) (25.38) (0.47) (3.62) (0.81) (1.13) (3.33) (3.79) (41.22) - At cost as at 31/03/2017 526.44 84.53 1436.53 4004.91 14.31 25.60 22.90 29.89 325.64 239.64 6710.39 21.02 Depreciation BlockAs at 01/10/2014 - - - - - - - - - - - - Depreciation/Amortisation for the period - 0.14 47.16 549.23 4.56 7.01 6.07 9.87 67.89 41.55 733.48 3.64 Disposals - - (3.66) (36.94) (0.52) (1.46) (0.86) (1.15) (25.30) (12.19) (82.08) - Impairment - - - 0.39 0.32 0.49 - - - 0.48 1.68 - Accumulated depreciation / amortisation as at 31/03/2016
- 0.14 43.50 512.68 4.36 6.04 5.21 8.72 42.59 29.84 653.08 3.64
Depreciation / Amortisation for the year - 0.23 40.42 456.69 3.03 5.43 4.62 7.16 57.88 30.97 606.43 4.15 Disposals - - (0.35) (23.45) (0.40) (3.38) (0.80) (1.14) (3.25) (3.68) (36.45) - (Reversal of Impairment) - - - (0.39) (0.32) (0.49) - - - (0.48) (1.68) - Accumulated depreciation / Amortisation as at the 31/03/2017
- 0.37 83.57 945.53 6.67 7.60 9.03 14.74 97.22 56.65 1221.38 7.79
Net BlockAs at 01/10/2014 345.57 2.69 816.08 1986.74 6.90 13.93 9.03 13.24 139.82 94.78 3428.78 7.09As at 31/03/2016 492.24 2.55 1046.74 2726.47 6.10 15.35 11.77 11.88 183.98 102.13 4599.21 9.08As at 31/03/2017 526.44 84.16 1352.96 3059.38 7.64 18.00 13.87 15.15 228.42 182.99 5489.01 13.23
NOTE 2(b): CAPITAL WORK-IN-PROGRESSAs at 01/10/2014 627.54 As at 31/03/2016 1059.28 As at 31/03/2017 847.93
NOTES TO THE CONSOLIDATED FINANCIAL STATEMENTS AS AT 31ST MARCH, 2017
Note: 1. Freehold land includes agricultural land - ` 0.12 Crore (31-03-2016 - ` 0.12 Crore and 01-10-2014 - ` 0.12 Crore). 2. Other assets represents Electrical Fittings, Fire Fighting/Other Equipments and Canteen utensils. 3. The amount of Borrowing Cost capitalised during the year ended 31-03-2017 - `10.01 Crore (Period ended 31-03-2016 - `45.18 Crore). 4. The Company has classified the leasehold land as a finance lease, after exercise of judgement based on evaluation of facts and circumstances and
considering the indicators envisaged in Para 10 and 11 of Ind AS 17 “Leases”.

148
NOTE 3: INVESTMENTS
Particulars
No. of Shares / Units (in Nos.) ` in CroresFace Value
`
As at 31.03. 2017
As at 31.03. 2016
As at 01.10. 2014
As at 31.03. 2017
As at 31.03 2016
As at 01.10. 2014
Non-Current InvestmentsFully Paid-up Quoted - Non TradeEquity Shares (at fair value through Profit or Loss)Equity Shares in ICICI Bank Ltd. 2 116665 116665 23333 3.23 2.76 3.35 Equity Shares in EIH Associated Hotels Ltd. 10 2000 2000 2000 0.07 0.06 0.04 Equity Shares in Housing Development Finance Corporation Ltd. 2 4000 4000 4000 0.60 0.44 0.42 Equity Shares in JK Tyres & Industries Ltd. - ` 21772 (31.03.2016 - ` 13893 and 01.10.2014 - ` 16144)
2 165 165 33 - - -
Equity Shares in Bengal & Assam Company Limited - ` 3421 (31.03.2016 - ` 950 and 01.10.2014 - ` 909)
10 2 2 2 - - -
Equity Shares in HDFC Bank Ltd. 2 2000 2000 2000 0.29 0.22 0.18 Equity Shares in Akzo Nobel India Ltd (01.10.2014 - ` 2688) 10 50 50 50 0.01 0.01 - Equity Shares in Asian Paints Ltd 1 3840 3840 3840 0.41 0.33 0.01 Equity Shares in Bakelite Hylam Ltd - ` 500 (31.03.2016 - ` 500 & 01.10.2014 - ` 2912) 10 50 50 50 - - - Equity Shares in Baroda Rayon Corporation Ltd - ` 50 (31.03.2016 - ` 50 & 01.10.2014 - ` 2875)
10 5 5 5 - - -
Equity Shares in Bayer CropScience Ltd (01.10.2014 - ` 4175) 10 50 50 50 0.02 0.02 - Equity Shares in Camphor & Allied Products Ltd (31.03.2016 - ` 700 & 01.10.2014 - ` 4175) 10 70 70 70 0.01 - - Equity Shares in Century Enka Ltd - ` 21370 (31.03.2016 - ` 8655 & 01.10.2014 -` 13500) 10 50 50 50 - - - Equity Shares in Forbes & Co Ltd (31.03.2016- ` 500 & 01.10.2014 - ` 12250) 10 50 50 50 0.01 - - Equity Shares in Gujarat Carbon & Industries Ltd - ` 43 (31.03.16 - ` 500 & 01.10.2014 - ` 2787)
10 50 50 50 - - -
Equity Shares in J K Synthetics Ltd - ` 150 (31.03.2016 - ` 150 & 01.10.2014 - ` 5050) 10 15 15 15 - - - Equity Shares in Nirlon Ltd - ` 10,198 (31.03.2016 -` 500 & 01.10.2014 - ` 1088) 10 50 50 50 - - - Equity Shares in NOCIL - ` 9385 (31.03.2016 - ` 4610 & 01.10.2014 - ` 6825) 10 100 100 100 - - - Equity Shares in Philips Carbon Black Ltd - ` 16500 (31.03.2016 - ` 4773 & 01.10.2014 - ` 1775)
10 50 50 50 - - -
Equity Shares in SRF Ltd ( 01.10.2014 - ` 1725) 10 50 50 50 0.01 0.01 - Equity Shares in Synthetics & Chemicals Ltd - ` 500 (31.03.2016 - ` 500 & 01.10.2014 - ` 2562)
10 50 50 50 - - -
Equity Shares in Tata Steel Ltd - ` 9653 (31.03.2016 - ` 6390 & 01.10.2014 - ` 11700) 10 20 20 20 - - - Aggregate Amount of Quoted Investments 4.66 3.85 4.00
NOTES TO THE CONSOLIDATED FINANCIAL STATEMENTS AS AT 31ST MARCH, 2017

149
NOTE 3: INVESTMENTS
Particulars
No. of Shares / Units (in Nos.) ` in CroresFace Value
`
As at 31.03. 2017
As at 31.03. 2016
As at 01.10. 2014
As at 31.03. 2017
As at 31.03 2016
As at 01.10. 2014
Unquoted - In Mutual Fund Units: (at fair value through Profit or Loss)Income Plan: Growth OptionFranklin India Short-term Income Plan Institutional 1,000 - - 82485 - - 18.12 HDFC High Interest Fund- Short Term Plan- Regular Plan 10 37492354 37492354 2720037 122.63 111.15 7.10 HDFC Short Term Plan - Regular Plan 10 5946232 5946232 5946232 19.27 17.59 15.23 HDFC FMP 1128D September 2014 (1) Series 32 - Regular Plan 10 - 10000000 10000000 - 11.51 10.01 HDFC FMP 1134D September 2014 (1) Series 32 - Regular Plan 10 - 16000000 16000000 - 18.58 16.04 HDFC FMP 370D October 2013(5) Series 28 - Regular Plan 10 - - 5000000 - - 5.41 HDFC FMP 371D November 2013 (1) Series 28 - Regular plan 10 - - 5000000 - - 5.40 Birla Sun life Dynamic Bond Fund - Direct Plan 10 8765778 8765778 - 26.05 23.48 - Birla Sun life Dynamic Bond Fund - Regular Plan 10 29525827 29525827 16991455 85.72 77.77 37.89 Birla Sun life Fixed term plan-Series IW (368 days) - Regular Plan 10 - - 5000000 - - 5.39 Birla Sun Life Fixed Term Plan - Series LX (1099 days) - Regular Plan 10 - 3000000 3000000 - 3.45 3.00 Reliance Short Term Fund - Growth Plan Growth Option - STGP 10 6095089 6095089 6095089 18.78 17.24 15.09 ICICI Prudential Institutional Short term Plan - Cumulative Option 10 2717258 2717258 2717258 9.59 8.70 7.59 ICICI Prudential FMP Series 75-1100 Days Plan J Cumulative 10 - 10000000 10000000 - 11.45 10.01 Sundaram Fixed Term Plan GK 1120 days Regular 10 - 5000000 5000000 - 5.72 5.01 Sundaram Fixed Term Plan GY-Direct Plan 10 30000000 30000000 - 34.86 31.88 - L& T FMP Series 9- Plan D 10 - - 5000000 - - 5.40 IDFC ultra Short Term Fund-( Regular Plan) 10 1866670 1866670 - 4.30 3.96 - SBI SHF ultra Short Term Debt Fund - Regular Plan 1,000 61558 61558 - 12.93 11.99 - HDFC High Interest Fund- Dynamic Plan - Direct - Growth Option 10 1935998 1935998 - 11.34 10.14 - HDFC Medium Term Opportunities Fund- Direct Plan- Growth Option 10 24691641 24691641 - 44.88 40.83 - Birla Sun life Short Term Fund - Direct Plan 10 2045716 2045716 - 12.80 11.66 - Birla Sun life Short Term Fund - Regular Plan 10 5618909 5618909 - 34.99 31.96 - Birla Sun Life Short Term Opportunities Fund - Regular Plan 10 4718438 4718438 - 12.80 11.70 - Birla Sun life Treasury Optimizer Plan - Direct Plan 100 617679 617679 - 12.99 11.74 - Birla Sun Life Treasury Optimizer Plan - Regular Plan 100 1744625 1744625 - 36.32 32.92 - Birla Sun Life Floating Rate Fund Long Term - Regular Plan 100 779493 779493 - 15.50 14.19 -
(Contd.)
NOTES TO THE CONSOLIDATED FINANCIAL STATEMENTS AS AT 31ST MARCH, 2017

150
NOTE 3: INVESTMENTS
Particulars
No. of Shares / Units (in Nos.) ` in CroresFace Value
`
As at 31.03. 2017
As at 31.03. 2016
As at 01.10. 2014
As at 31.03. 2017
As at 31.03 2016
As at 01.10. 2014
Birla Sun life Short Term Opportunities Fund - Direct Plan 10 13067518 13067518 - 36.29 32.94 - IDFC Super Saver Income Fund- Medium Term Plan - Regular Plan 10 36400615 36400615 - 100.93 92.23 - IDFC ultra Short Term Fund- Direct Plan 10 6413102 6413102 - 14.85 13.67 - DHFL Pramerica Fixed Maturity Plan - Series 77 - Regular Plan 10 - 7000000 - - 8.04 - DHFL Pramerica Short Maturity Fund 10 7504245 7504245 - 22.36 20.41 - TATA Short Term Bond Fund - Regular Plan 10 10896570 10896570 - 33.31 30.69 - uTI Short Term Income Fund - Institutional Option-Direct Plan 10 5763855 5763855 - 11.71 10.62 -uTI Short Term Income Fund- Institutional Option 10 60766664 60766664 - 121.16 110.39 - uTI - Treasury Advantage Fund-Institutional Plan 1,000 68805 68805 - 15.42 14.19 - ICICI Prudential Short Term Option Plan 10 26480287 26480287 - 90.36 81.97 - HDFC High Interest Fund - Dynamic Plan - Regular Plan 10 6073551 6073551 - 34.40 30.97 - HDFC Floating Rate Income Fund- Short term plan whole sale option - Regular Plan 10 2421650 2421650 - 6.85 6.31 - Sundaram ultra Short Term Fund Regular 10 7089864 7089864 - 15.79 14.66 - Sundaram Select Debt Short Term Asset Plan Regular 10 12622926 12622926 - 35.48 32.74 - Non-Trade - UnquotedOthers: (at fair value through Profit or Loss)Equity Shares in Mammen Mappillai Investments Pvt. Ltd. 10 65000 65000 65000 0.07 0.07 0.07 Equity Shares in M M Research Company Pvt. Ltd. 10 - - 100000 - - 0.10 Ordinary Shares in MRF Employees Co-operative Society Ltd. - ` 40000 (31.03.2016 and 01.10.2014 - ` 40000)
25 1600 1600 1600 - - -
Ordinary Shares in The Ranipet Leather Finishing Servicing Industrial Co-operative Society Ltd. ` 5000 (31.03.2016 and 01.10.2014 - ` 5000) 100 50 50 50 - - - Equity Shares in Chennai Willingdon Corporate Foundation - ` 50 (31.03.2016 and 01.10.2014 - ` 50) 10 5 5 5 - - - Note: The Company had invested in Co-operative Societies and in certain other companies towards the corpus. These are non participative shares and normally no dividend is accrued. The Company has carried these investments at it transaction value considering it to be its fair value.Others: (at fair value through Profit or Loss)Equity Shares in Funskool (India) Ltd. 10 - - 148500 - - 6.10 Aggregate Amount of Unquoted Investments 1054.73 1019.51 172.96 Grand Total 1059.39 1023.36 176.96
(Contd.)
NOTES TO THE CONSOLIDATED FINANCIAL STATEMENTS AS AT 31ST MARCH, 2017

151
NOTE 3: INVESTMENTS
Particulars
No. of Shares / Units (in Nos.) ` in CroresFace Value
`
As at 31.03. 2017
As at 31.03. 2016
As at 01.10. 2014
As at 31.03. 2017
As at 31.03 2016
As at 01.10. 2014
Current InvestmentsFully paid up - Quoted - Non TradeQuoted - In Mutual Fund Units: (at fair value through Profit or Loss)Reliance Fixed Horizon Fund(G) 10 - - 1000000 - - 1.00 uTI-ST Income Fund Ins(G) 10 295706 1340005 1000000 0.58 2.43 1.50 Reliance Short Term Fund 10 - 1196026 - - 3.38 - Birla SL-FRF Long Term Reg. (G) 100 64358 64358 - 1.28 1.17 - Reliance Corporate Bond Fund-CBGP 10 - 884079 - - 1.05 - Birla Sun Life Dynamic Bond Fund(G) 10 611777 611777 - 1.78 1.61 - Birla Sun Life Short Term Opportunities Fund(G) 10 - 647763 - - 1.61 - DSP Black Rock Income Opportunities Fund(G) 10 - 220681 - - 0.54 - L&T Income Opportunities Fund 10 878819 - - 1.64 - - ICICI Prudential Mutual Fund Collection 1 AC 10 579996 - - 1.01 - - HDFC High Int Fund-STP-Post IPO coll 10 167286 - - 0.55 - - HDFC Short Term Plan 10 646269 - - 2.09 - - uTI Treasury Advantage Fund (D) 1,000 - - 16428 - - 1.65 Birla Cash Manager Fund (D) 100 - - 60350 - - 0.70 Kotak floater long term (D) 10 - - 893002 - - 0.90 HDFC Floating Income (D) 10 - - 606716 - - 0.61 uTI-FTIF Sr XvI plan Iv - 369 D(G) 10 - - 1500000 - - 1.50 uTI-FTIF Sr XvI plan IX - 368 D(G) 10 - - 1044299 - - 1.00 Aggregate Amount of Quoted Investments 8.93 11.79 8.86 Fully paid up - Unquoted - Non TradeUnquoted - In Mutual Fund Units: (at fair value through Profit or Loss )Income Plan: Growth OptionuTI - Liquid Cash Plan - Institutional 1,000 149355 149355 149355 39.68 36.99 32.78 uTI - Treasury Advantage Fund - Institutional Plan 1,000 1196542 1196542 505454 268.22 246.99 91.73 uTI Fixed Income Interval Fund Annual Interval Plan III - Institutional Plan 10 - - 2127358 - - 3.90 ICICI Prudential Savings Fund 100 1215844 1215844 1215844 29.73 27.31 24.18 ICICI Prudential Flexible Income 100 7367845 7367845 1781587 229.39 210.88 44.83 ICICI Prudential Liquid Plan 100 394396 394396 394396 9.47 8.83 7.82 ICICI Prudential Short Term - Option Plan 10 4199807 4199807 - 14.33 13.00 -
NOTES TO THE CONSOLIDATED FINANCIAL STATEMENTS AS AT 31ST MARCH, 2017
(Contd.)

152
NOTE 3: INVESTMENTS
Particulars
No. of Shares / Units (in Nos.) ` in CroresFace Value
`
As at 31.03. 2017
As at 31.03. 2016
As at 01.10. 2014
As at 31.03. 2017
As at 31.03 2016
As at 01.10. 2014
ICICI Prudential FMP Series 72-440 Days Plan L- Regular Plan Cumulative 10 - - 5000000 - - 5.31 ICICI Prudential FMP Series 74-370 Days Plan Q- Regular Plan Cumulative 10 - - 6000000 - - 6.16 ICICI Prudential FMP Series 74-368 Days Plan R- Regular Plan Cumulative 10 - - 6000000 - - 6.16 ICICI Prudential FMP Series 74-368 Days Plan Y- Regular Plan Cumulative 10 - - 5000000 - - 5.10 ICICI Prudential FMP Series 74-367 Days Plan Z- Regular Plan Cumulative 10 - - 5400000 - - 5.50 Reliance Liquid Fund-Cash Plan-Growth Option - CPG Plan 1,000 115318 115318 115318 29.34 27.59 24.67 Reliance Money Manager Fund-Growth Plan - Growth Option - LPIG 1,000 168599 168599 168599 37.81 34.98 30.93 Reliance Medium Term Fund - Growth Plan - Growth Option - IPGP 10 5266727 5266727 5266727 17.97 16.53 14.55 Reliance Liquid Fund - Treasury Plan - Growth Plan - Growth Option - LFIG 1,000 13684 13684 13684 5.41 5.04 4.47 Reliance Fixed Horizon Fund-XXvI-Series 33- Plan-X7GP 10 - - 6000000 - - 6.11 Reliance Fixed Horizon Fund-XXv-Series 6- Plan-WAGP 10 - - 5000000 - - 5.39 Reliance Fixed Horizon Fund-XXv-Series 19- Plan-WOGP 10 - - 5000000 - - 5.31 HDFC Cash Management Fund - Treasury - Advantage plan - Wholesale - Regular Plan 10 16607563 16607563 16607563 59.89 54.96 48.57 HDFC Short Term Plan - Regular Plan 10 4393376 4393376 - 14.24 13.00 - HDFC Liquid Fund - Regular Plan - Premium Plan 1,000 93198 93198 93198 30.37 28.30 25.05 HDFC Floating Rate Income Fund - Short Term Plan - Wholesale Option - Regular Plan 10 97124594 97124594 39131624 274.57 252.95 89.60 HDFC Liquid Fund - Regular Plan 1,000 29580 29580 29580 9.46 8.83 7.82 HDFC FMP 366D May 2014 (2) Series 31 - Regular 10 - - 6000000 - - 6.16 HDFC FMP 370 D June 2014 (1) Series 31 - Regular 10 - - 6000000 - - 6.16 HDFC FMP 371D December 2013 (1) Series 28 - Regular Plan 10 - 5000000 5000000 - 6.08 5.38 HDFC FMP 371 D June 2014 (1) Series 31 - Regular Plan 10 - - 7000000 - - 7.17 HDFC FMP 453D February 2014 (1) Series 29 - Regular Plan 10 - - 5000000 - - 5.30 HDFC FMP 540D December 2013 (1) Series 28 - Regular Plan 10 - - 5000000 - - 5.38 HDFC FMP 370D October 2013 (5) Series 28 - Regular Plan 10 - 5000000 - - 6.13 - HDFC FMP 371D November 2013 (1) Series 28 - Regular Plan 10 - 3655457 - - 4.46 - Birla Sun Life Floating Rate Fund Short Term Plan - Regular Plan 100 1406187 1406187 1406187 30.41 28.32 25.07 Birla Sun Life Cash Manager- Institutional Plan 100 1891226 1891226 1891226 52.00 48.14 42.69 Birla Sun Life Floating Rate Fund Long Term - Regular Plan 100 7844428 7844428 727224 155.93 142.79 11.64 Birla Sun Life Cash Plus - Regular Plan 100 364072 364072 364072 9.48 8.84 7.83 Birla Sun Life Treasury Optimizer Plan - Regular Plan 100 2259785 2259785 1411779 47.04 42.65 23.01 Birla Sun Life Savings Fund - Regular Plan 100 5358593 5358593 - 170.75 156.93 - Birla Sun Life Short Term Opportunities Fund - Regular Plan 10 5242908 5242908 - 14.23 13.00 - Birla Sun Life Fixed Term Plan- Series JE (368 days) - Regular Plan 10 - - 5000000 - - 5.38
NOTES TO THE CONSOLIDATED FINANCIAL STATEMENTS AS AT 31ST MARCH, 2017
(Contd.)

153
NOTE 3: INVESTMENTS
Particulars
No. of Shares / Units (in Nos.) ` in CroresFace Value
`
As at 31.03. 2017
As at 31.03. 2016
As at 01.10. 2014
As at 31.03. 2017
As at 31.03 2016
As at 01.10. 2014
Birla Sun Life Fixed Term Plan- Series JY (367 days) - Regular Plan 10 - - 5000000 - - 5.32 Birla Sun Life Fixed Term Plan- Series LO (369 days) - Regular Plan 10 - - 5000000 - - 5.13 Birla Sun Life Fixed Term Plan- Series LQ (368 days) - Regular Plan 10 - - 6000000 - - 6.11 Franklin India ultra Short Bond Fund Super Institutional Plan 10 - - 59218499 - - 104.70 Franklin India Treasury Management Account Super Institutional Plan 1,000 - - 39170 - - 7.83 Kotak Flexi Debt Regular Plan - Regular 10 12983092 12983092 31453743 27.25 24.50 51.94 Kotak Floater Short Term 1,000 - - 114046 - - 25.05 Kotak Liquid Regular Plan - Regular 1,000 28752 28752 28752 9.46 8.82 7.82 SBI SHF- ultra Short Term Fund - Institutional Plan 1,000 207399 207399 207399 44.33 41.09 36.22 SBI ultra Short Term Debt Fund - Regular Plan 1,000 307774 307774 369333 64.65 59.93 63.39 SBI Premier Liquid Fund - Regular Plan 1,000 37116 37116 37116 9.45 8.82 7.81 SBI - Debt Fund Series - A28-367 Days - Regular Plan 10 - - 5000000 - - 5.13 SBI - Debt Fund Series - A 2 15 Months - Regular Plan 10 - - 5000000 - - 5.31 IDFC ultra Short Term Fund -(Direct Plan) 10 66879275 66879275 - 154.84 142.57 - IDFC ultra Short Term Fund-(Regular Plan) 10 20165731 20165731 22032401 46.44 42.82 41.19 IDFC Cash Fund - (Regular Plan) 1,000 47988 47988 47988 9.46 8.82 7.81 IDFC Fixed Term Plan Series 50 Regular Plan 10 - 5000000 5000000 - 6.07 5.38 IDFC Fixed Term Plan Series 51 Regular Plan 10 - - 5000000 - - 5.38 IDFC Fixed Term Plan Series 97 Regular Plan (788 Days) 10 - - 7000000 - - 7.19 IDFC Fixed Term Plan Series 99 Regular Plan (368 Days) 10 - - 5750000 - - 5.89 IDFC Super Saver Income Fund-Medium Term Plan (Regular Plan) 10 5130715 5130715 - 14.23 13.00 - Sundaram ultra Short-Term Fund Regular Plan 10 71203949 71203949 - 158.52 147.32 - Tata Liquid Plan Fund Regular plan 1,000 31599 31599 31599 9.44 8.81 7.81 TATA Fixed Maturity Plan Series 47 Scheme N - Plan A 10 - - 5000000 - - 5.14 TATA ultra Short term Fund Regular Plan 1,000 616955 616955 - 152.09 140.56 - L&T FMP-Series 9 - Plan J - 1141 Days 10 - - 5000000 - - 5.37 L& T FMP Series 9 - Plan D - 1131 Days 10 - 5000000 - - 6.10 - L&T FMP Series 10 - Plan H - 1155 Days 10 - - 5000000 - - 5.30 DWS Fixed Maturity Plan Series 43-Regular Plan 10 - - 5000000 - - 5.37 DWS Fixed Maturity Plan- Series 45-Regular Plan 10 - - 5000000 - - 5.30 Birla Sun Life Fixed Term Plan - Series LX (1099 days) - Regular 10 3000000 - - 3.75 - - DHFL Pramerica Fixed Maturity Plan - Series 77 - Regular 10 7000000 - - 8.83 - - HDFC FMP 1128D September 2014 (1) Series 32 - Regular 10 10000000 - - 12.48 - - HDFC FMP1134D September 2014 (1) Series 32 - Regular 10 16000000 - - 20.23 - - ICICI Prudential FMP Series 75-1100 Days Plan J Cumulative 10 10000000 - - 12.38 - - Sundaram Fixed Term Plan GK 1120 days Regular 10 5000000 - - 6.23 - - Aggregate Amount of Unquoted Investments 2313.78 2102.75 1086.00
2322.71 2114.54 1094.86
NOTES TO THE CONSOLIDATED FINANCIAL STATEMENTS AS AT 31ST MARCH, 2017

154
NOTE 4 : LOANS ` in Crores
Unsecured, Considered Good Particulars
Non-current Current As at
31.03.2017As at
31.03.2016As at
01.10.2014As at
31.03.2017As at
31.03.2016As at
01.10.2014Loans and Advances to employees 3.87 3.58 1.95 - - -
3.87 3.58 1.95 - - -
NOTE 5 : OTHER FINANCIAL ASSETS ` in Crores
Unsecured, Considered Good Particulars
Non-current Current As at
31.03.2017As at
31.03.2016As at
01.10.2014As at
31.03.2017As at
31.03.2016As at
01.10.2014Bank deposits with more than 12 months maturity 1.86 3.19 3.16 - - - Others:Security Deposits 0.99 1.54 0.15 - - - Interest Accrued on Loans and Deposits - - - 4.10 3.25 4.39 Salary and wage advance - - 6.05 7.10 6.84 Share/Mutual Fund Application Monies - - - - - 7.00Others - - - - - 0.10 Deposits - Rent 13.25 9.44 6.14 - - -
16.10 14.17 9.45 10.15 10.35 18.33
NOTE 6 : DEFERRED TAX ASSET (NET) ` in Crores Particulars As at
31.03.2017As at
31.03.2016As at
01.10.2014Deferred Tax Liabilities:- Arising on account of difference in carrying amount and tax base of PPE and Intangibles (0.17) - (0.09)Deferred Tax Asset:- Accrued Expenses allowable on Actual Payments 0.05 - 0.03 - Carried Forward Business Losses 0.43 - 1.00
0.31 - 0.94
NOTES TO THE CONSOLIDATED FINANCIAL STATEMENTS AS AT 31ST MARCH, 2017

155
NOTE 7 : OTHER ASSETS ` in Crores
ParticularsNon-current Current
As at 31.03.2017
As at 31.03.2016
As at 01.10.2014
As at 31.03.2017
As at 31.03.2016
As at 01.10.2014
Capital Advances 170.50 100.10 162.38 0.19 - - Advances other than capital advances: Security Deposits 49.20 46.17 34.96 - - - Advances to Employees - - - 35.86 23.85 7.70
219.70 146.27 197.34 36.05 23.85 7.70 Others: Advance payment of Income Tax / Tax Deducted
at Source (after adjusting provision) 65.33 64.18 45.47 - - -
MAT Credit Entitlement 34.50 - 0.03 - - - Balance with excise authorities - - - 65.06 78.89 27.55 Advances recoverable in cash or kind 19.96 15.69 1.21 121.03 207.38 93.85 Prepaid Expenses - - - 21.76 21.22 21.41
119.79 79.87 46.71 207.85 307.49 142.81 339.49 226.14 244.05 243.90 331.34 150.51
NOTE 8 : INVENTORIES ` in Crores
Particulars As at 31.03.2017
As at 31.03.2016
As at 01.10.2014
Raw Materials 934.51 711.02 643.92 Raw Materials in transit 88.06 30.67 126.30 Work-in-progress 222.59 148.44 179.96 Finished goods 877.09 732.65 667.26 Stock-in-trade 30.51 19.56 15.47 Stores and spares 272.51 257.47 193.34
2425.27 1899.81 1826.25
NOTES TO THE CONSOLIDATED FINANCIAL STATEMENTS AS AT 31ST MARCH, 2017

156
NOTE 9 : TRADE RECEIVABLES ` in Crores
Particulars As at 31.03.2017
As at 31.03.2016
As at 01.10.2014
Secured, considered good 1164.43 1108.67 1044.16 unsecured, considered good 804.57 730.05 671.20 Doubtful 2.94 2.46 2.26 Less: Impairment provision on Expected Credit Loss Model (2.94) (2.46) (2.26)
1969.00 1838.72 1715.36 Note: The Company has used a practical expedient for computing expected credit loss allowance for trade receivables, taking into account historical credit loss experience and accordingly, provisions are made for expected credit loss for amounts due from customers, where necessary.
NOTE 10 : CASH AND CASH EQUIVALENTS (AS PER CASH FLOW STATEMENT) ` in Crores
Particulars As at 31.03.2017
As at 31.03.2016
As at 01.10.2014
Balances with Banks (of the nature of cash and cash equivalents) 199.94 71.96 227.57 Cheques, drafts on hand 45.74 48.34 45.54 Cash on hand 0.86 0.84 0.06
246.54 121.14 273.17 In terms of Ministry of Corporate Affairs (MCA) notification no. G.S.R. 308 (E) dated 30.03.2017, the details of Specified Bank Notes (SBN) held and transacted during the period form 08th November 2016 to 30th December 2016 is as under;
Particulars SBNs* Other Denomination notes
Total
Closing Cash in hand as on 08th November 2016 0.66 0.15 0.81 (+) Permitted receipts 0.01 1.84 1.85 (-) Permitted payments 0.02 1.43 1.45 (-) Amount deposited in Banks 0.65 0.02 0.67 Closing Cash in hand as on 30th December 2016 - 0.54 0.54 * Bank notes of denominations of existing series of the value of ` 500 and ` 1,000 (MoF Notification No. S.O 3407(E) dated 08th November 2016).
NOTE 11 : BANK BALANCES OTHER THAN CASH AND CASH EQUIVALENTS ` in Crores
Particulars As at 31.03.2017
As at 31.03.2016
As at 01.10.2014
Deposits with original maturity of more than 3 months 93.58 1.38 450.95 Others: unclaimed Dividend Account 2.49 1.71 1.63
96.07 3.09 452.58
NOTES TO THE CONSOLIDATED FINANCIAL STATEMENTS AS AT 31ST MARCH, 2017

157
CONSOLIDATED STATEMENT OF CHANGES IN EQUITY (SOCE) FOR THE YEAR ENDED 31ST MARCH, 2017` in Crores
EQUITY SHARE CAPITAL As at 31.03.2017
As at 31.03.2016
As at 01.10.2014
Number Amount Amount Amount
Authorised Share Capital 9000000 9.00 9.00 9.00
Issued Share Capital(Excludes 71 bonus shares not issued and not alloted on non-payment of call monies)
4241143 4.24 4.24 4.24
Subscribed Share Capital 4241143 4.24 4.24 4.24
Fully Paid-up Share Capital 4241143 4.24 4.24 4.24
Balance at the beginning of the year 4241143 4.24 4.24 4.24
Changes in equity share capital during the year: - - - -
Balance at the end of the reporting year 4241143 4.24 4.24 4.24
Rights, preferences and restrictions attaching to each class of shares including restrictions on the distribution of dividends and the repayment of capital
The Company has one class of equity shares having a par value of ` 10 per share. Each shareholder is eligible for one vote per share held. The dividend proposed by the Board of Directors is subject to the approval of the shareholders in the ensuing Annual General Meeting, except in case of interim dividend. In the event of liquidation, the equity shareholders are eligible to receive the remaining assets of the Company after distribution of all preferential amounts, in proportion to their shareholding.
The Company has declared two interim dividends aggregating to ` 2.54 Crores (Previous period ` 2.54 Crores) which has already been distributed during the FY 2016-17. The proposed final dividend for FY 2016-17 amounts to ` 22.90 Crore will be recognised as distribution to owners during the financial year 2017-18 on its approval by Shareholders. The proposed dividend per share amounts to ` 54/-.
Shares in the Company held by each shareholder holding more than five per cent shares
As at 31.03.2017 As at 31.03.2016 As at 01.10.2014
No. % No. % No. %
Comprehensive Investment and Finance Company Private Limited 438914 10.35% 438414 10.34% 437243 10.31%
MOWI (P) Limited 507984 11.98% 507984 11.98% 507984 11.98%
Enam Shares and Securities Private Ltd. - - 222487 5.25% 267626 6.31%
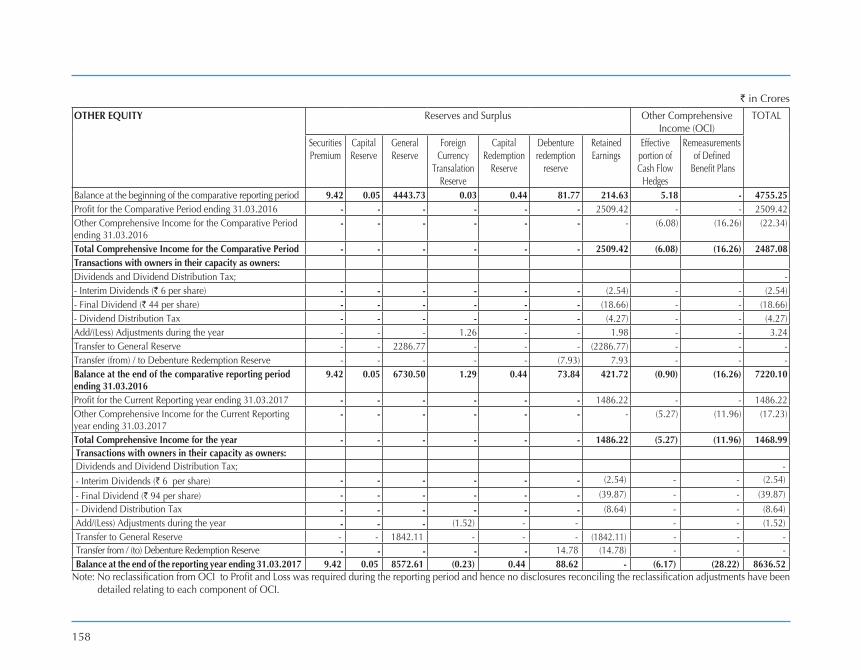
158
` in CroresOTHER EQUITY Reserves and Surplus Other Comprehensive
Income (OCI)TOTAL
Securities Premium
Capital Reserve
General Reserve
Foreign Currency
Transalation Reserve
Capital Redemption
Reserve
Debenture redemption
reserve
Retained Earnings
Effective portion of Cash Flow
Hedges
Remeasurements of Defined
Benefit Plans
Balance at the beginning of the comparative reporting period 9.42 0.05 4443.73 0.03 0.44 81.77 214.63 5.18 - 4755.25 Profit for the Comparative Period ending 31.03.2016 - - - - - - 2509.42 - - 2509.42 Other Comprehensive Income for the Comparative Period ending 31.03.2016
- - - - - - - (6.08) (16.26) (22.34)
Total Comprehensive Income for the Comparative Period - - - - - - 2509.42 (6.08) (16.26) 2487.08 Transactions with owners in their capacity as owners: Dividends and Dividend Distribution Tax; - - Interim Dividends (` 6 per share) - - - - - - (2.54) - - (2.54)- Final Dividend (` 44 per share) - - - - - - (18.66) - - (18.66)- Dividend Distribution Tax - - - - - - (4.27) - - (4.27)Add/(Less) Adjustments during the year - - - 1.26 - - 1.98 - - 3.24 Transfer to General Reserve - - 2286.77 - - - (2286.77) - - - Transfer (from) / to Debenture Redemption Reserve - - - - - (7.93) 7.93 - - - Balance at the end of the comparative reporting period ending 31.03.2016
9.42 0.05 6730.50 1.29 0.44 73.84 421.72 (0.90) (16.26) 7220.10
Profit for the Current Reporting year ending 31.03.2017 - - - - - - 1486.22 - - 1486.22 Other Comprehensive Income for the Current Reporting year ending 31.03.2017
- - - - - - - (5.27) (11.96) (17.23)
Total Comprehensive Income for the year - - - - - - 1486.22 (5.27) (11.96) 1468.99 Transactions with owners in their capacity as owners: Dividends and Dividend Distribution Tax; - - Interim Dividends (` 6 per share) - - - - - - (2.54) - - (2.54)
- Final Dividend (` 94 per share) - - - - - - (39.87) - - (39.87)- Dividend Distribution Tax - - - - - - (8.64) - - (8.64)Add/(Less) Adjustments during the year - - - (1.52) - - - - (1.52)Transfer to General Reserve - - 1842.11 - - - (1842.11) - - - Transfer from / (to) Debenture Redemption Reserve - - - - - 14.78 (14.78) - - - Balance at the end of the reporting year ending 31.03.2017 9.42 0.05 8572.61 (0.23) 0.44 88.62 - (6.17) (28.22) 8636.52
Note: No reclassification from OCI to Profit and Loss was required during the reporting period and hence no disclosures reconciling the reclassification adjustments have been detailed relating to each component of OCI.

159
For SASTRI & SHAH For SCA AND ASSOCIATESChartered Accountants Chartered Accountants
Firm Regn. No. 003643S Firm Regn. No. 101174W JACOB KuRIAN
C R Kumar Shivratan Agarwal MADHu P NAINAN RAvI MANNATH v SRIDHAR K M MAMMENPartner Partner vice President Finance Company Secretary Directors Chairman & Managing Director
Mem. No. 26143 Mem. No. 104180
Chennai, Dated 4th May, 2017
Nature and Purpose of each component of equity Nature and Purpose
Capital Reserve Capital resrve was created on purchase of shares by the parent company.
Foreign Currency Transalation Resrve Exchange differences relating to the transalation of the results and net assets of the groups foreign operations from their functional currencies to the Group’s presentation currency, i.e, Indian Rupees.
Capital Redemption Reserve Capital Redemption Reserve represents statutory reserve created upon buyback of equity shares in the earlier years.
Securities Premium Amounts received in excess of par value on issue of shares is classified as Securities Premium
General Reserve General Reserve represents accumulated profits and is created by transfer of profits from Retained Earnings and it is not an item of Other Comprehensive Income and the same shall not be subsequently reclassified to Statement of Profit and Loss
Debenture Redemption Reserve Debenture Redemption Reserve is created against the balance redemption liability of Debentures issued by the Company as per statutory requirements
Effective portion of Cash Flow Hedges Gains / Losses on Effective portion of Cashflow Hedges are initially recognized in Other Comprehensive Income as per IND AS 109. These gains or losses are reclassified to the Statement of Profit or Loss when the forecasted transaction affects earnings
Remeasurements of Defined Benefit Plans Gains / Losses arising on Remeasurements of Defined Benefit Plans are recognised in the Other Comprehensive Income as per IND AS-19 and shall not be reclassified to the Statement of Profit or Loss in the subsequent years.
This is the Balance Sheet referred to in our report of even date.

160
NOTES TO THE CONSOLIDATED FINANCIAL STATEMENTS AS AT 31ST MARCH, 2017
NOTE 12 : BORROWINGS ` in Crores
Particulars As at 31.03.2017
As at 31.03.2016
As at 01.10.2014
NON CURRENTSecuredDebentures: 9.07% Secured Redeemable Non Convertible (700 Debentures of `10,00,000/- each.) - - 70.00
10.09% Secured Redeemable Non Convertible (5000 Debentures of `10,00,000/- each) 500.00 500.00 500.00 Term loans from Banks: External Commercial Borrowings (ECB) 13.65 69.58 196.70 unsecuredTerm loans from Banks: External Commercial Borrowings (ECB) 687.65 721.54 184.93 Buyers Line of Credit - 139.75 145.20 Fixed Deposits 3.57 5.23 27.53 Sales tax deferral scheme 27.25 43.72 55.12 OthersDeferred payment liabilities 6.20 6.63 11.35
1238.32 1486.45 1190.83 CURRENTSecuredLoans repayable on demand - from banks 834.13 885.59 616.25
834.13 885.59 616.25 2072.45 2372.04 1807.08
Note: Security and terms of repayment in respect of above borrowings are detailed in Note 27 (h) of Standalone Financial Statements.

161
NOTE 13 : PROVISIONS ` in Crores
ParticularsNon-Current Current
As at 31.03.2017
As at 31.03.2016
As at 01.10.2014
As at 31.03.2017
As at 31.03.2016
As at 01.10.2014
Provision for employee benefits 34.71 30.11 21.28 44.06 11.01 40.45 Others: Warranty and others 102.78 95.21 66.36 77.56 78.64 63.49
137.49 125.32 87.64 121.62 89.65 103.94
NOTE 14 : DEFERRED TAX LIABILITIES - (NET) ` in Crores
Particulars As at 31.03.2017
As at 31.03.2016
As at 01.10.2014
Deferred Tax Liabilities (Net): - Arising on account of difference in carrying amount and tax base of PPE and Intangibles 462.23 330.12 261.13 - unrealised (gain)/loss on FvTPL debt Mutual Funds 125.28 52.38 12.56 - on fair valuation of Derivatives - - 2.74 - Other adjustments 14.59 9.68 - Deferred Tax Asset: - Accrued Expenses allowable on Actual Payments (47.07) (31.12) (25.66) - Net gain on remeasurements of defined benefit plans (14.79) (8.66) - - on fair valuation of Derivatives (3.27) (0.47) - - Others (0.47) 0.59 -
536.50 352.52 250.77
NOTE 15 : OTHER LIABILITIES ` in Crores
ParticularsNon-Current Current
As at 31.03.2017
As at 31.03.2016
As at 01.10.2014
As at 31.03.2017
As at 31.03.2016
As at 01.10.2014
Revenue received in advance - - - 35.40 30.91 37.35 Others: Dealers' Security Deposit - - - 1237.26 1188.48 1128.90 Retention Money 23.30 32.11 6.58 - - - Statutory Dues - - - 193.22 222.52 246.19 Liabilities for expenses - - - 30.54 17.36 14.15 Others 4.44 4.13 6.07 - - 0.47
27.74 36.24 12.65 1496.42 1459.27 1427.06
NOTES TO THE CONSOLIDATED FINANCIAL STATEMENTS AS AT 31ST MARCH, 2017

162
NOTE 16 : TRADE PAYABLES ` in Crores
Particulars As at 31.03.2017
As at 31.03.2016
As at 01.10.2014
Outstanding due of Micro and Small Enterprises 13.88 11.16 1.11 Outstanding dues of Creditors other than Micro and Small Enterprises 1394.49 1114.99 1139.76
1408.37 1126.15 1140.87 Of the above: - Acceptances 345.32 251.24 340.06
NOTE 17 : OTHER FINANCIAL LIABILITIES ` in Crores
ParticularsCurrent
As at 31.03.2017
As at 31.03.2016
As at 01.10.2014
Current maturities of long-term debt 260.39 91.86 87.78 Interest accrued 69.58 72.31 46.18 unclaimed dividends 2.49 1.71 1.63 unclaimed matured deposits and interest accrued thereon 0.09 0.12 0.02 Interim Dividend Payable - - 1.27 Others : Employee benefits 135.16 126.12 47.17 Liabilities for expenses 71.73 139.09 109.58 Derivatives(Net) 27.06 18.37 10.98 Others 9.55 8.61 6.02
576.05 458.19 310.63
NOTES TO THE CONSOLIDATED FINANCIAL STATEMENTS AS AT 31ST MARCH, 2017

163
NOTE 18 : REVENUE FROM OPERATIONS ` in Crores
Particulars Year Ended31.03.2017
Period Ended31.03.2016
Sale of Products 14830.82 22359.14 Sale of Services 32.42 36.01 Other Operating Revenues: Export Incentives 20.67 17.09 Miscellaneous 0.20 8.90 Scrap Sales 38.69 69.88
14922.80 22491.02
NOTE 19 : OTHER INCOME
Particulars Year Ended31.03.2017
Period Ended31.03.2016
Interest Income 33.66 70.62 Dividend Income 0.02 0.28 Net gain on sale of Investments classified as FvTPL 0.01 74.25 Net gains on fair value changes on financial assets classified as FvTPL 277.14 173.66 Other Non-Operating Income: Miscellaneous Income 26.55 4.78
337.38 323.59
NOTE 20 : COST OF MATERIALS CONSUMED
Particulars Year Ended31.03.2017
Period Ended31.03.2016
Opening Stock of Raw Materials 741.70 771.16 Purchases during the year 7960.82 11219.67 Closing Stock of Raw Materials (1022.57) (741.70)
7679.95 11249.13
NOTES TO THE CONSOLIDATED FINANCIAL STATEMENTS FOR THE YEAR ENDED 31ST MARCH, 2017

164
NOTE 21 : CHANGES IN INVENTORIES OF FINISHED GOODS, WORK-IN-PROGRESS AND STOCK-IN-TRADE ` in Crores
Particulars Year Ended31.03.2017
Period Ended31.03.2016
Closing Stock: Finished Goods 877.09 732.64 Work-in-Progress 222.59 148.44 Stock-in-Trade 30.51 19.56
1130.19 900.64 Less: Opening Stock: Finished Goods 732.64 667.26 Work-in-Progress 148.44 179.96 Stock-in-Trade 19.56 15.47
900.64 862.69 Differential Excise Duty on Opening and Closing stock of Finished Goods 1.84 23.47
(227.71) (14.48)
NOTE 22 : EMPLOYEE BENEFITS EXPENSE
Particulars Year Ended31.03.2017
Period Ended31.03.2016
Salaries and Wages 820.19 1065.14 Contribution to provident and other funds 82.80 88.28 Staff welfare expenses 97.37 131.80
1000.36 1285.22
NOTE 23 : FINANCE COSTS
Particulars Year Ended31.03.2017
Period Ended31.03.2016
Interest on Loans and Deposits 191.29 255.11 Interest on Debentures 50.45 85.64 Interest on Deferred Payment Credit 0.81 1.46 Other Borrowing Costs; unwinding of discount relating to Long Term Liabilities 8.92 10.35
251.47 352.56
NOTES TO THE CONSOLIDATED FINANCIAL STATEMENTS FOR THE YEAR ENDED 31ST MARCH, 2017

165
NOTE 24 : OTHER EXPENSES ` in Crores
Particulars Year Ended31.03.2017
Period Ended31.03.2016
Stores and Spares Consumed 302.34 460.67 Power and Fuel 580.94 843.37 Processing Expenses 184.28 246.68 Rent 57.86 73.44 Rates and Taxes 14.19 17.42 Insurance 16.67 16.92 Printing and Stationery 6.97 9.34 Repairs and Renewals: Buildings 18.55 27.83 Plant and Machinery 89.66 118.71 Other Assets 44.97 52.22 Travelling and Conveyance 44.31 61.73 Communication Expenses 7.02 11.70 vehicle Expenses 6.10 7.97 Auditors’ Remuneration: As Auditors: Audit fee 0.55 0.63 Tax Audit fee 0.09 0.14 Other Services 0.31 0.16 Reimbursement of Expenses 0.19 0.29
1.14 1.22 Cost Auditors Remuneration: Audit fee 0.06 0.06 Directors’ Fees 0.19 0.24 Directors’ Travelling Expenses 4.21 5.56 Advertisement 265.06 368.89 Warranty 2.46 31.12 Sales tax absorbed by the company 0.25 0.83 Bad debts written off 0.11 0.17 Commission 8.90 23.53 Freight and Forwarding (Net) 433.79 577.58 Loss on Sale of Fixed Asset 3.48 6.54 Net Loss on Foreign Currency Transactions 75.68 104.01 Bank Charges 5.11 8.04 Provision for Impairment of Assets (other than Financial Assets) - 23.93 Provision for Impaiment of Financial Assets 0.45 - Miscellaneous Expenses 101.58 98.90
2276.33 3198.62
NOTES TO THE CONSOLIDATED FINANCIAL STATEMENTS FOR THE YEAR ENDED 31ST MARCH, 2017

166
NOTE 25 (a) - RECONCILIATION OF EQUITY AS AT 1ST OCTOBER, 2014 (DATE OF TRANSITION FOR MRF CORP LTD BEING 1ST APRIL, 2015) ̀ in Crores Particulars Foot Notes Previous GAAP * Adjustments Ind ASASSETSNon-current assetsProperty, Plant and Equipment 3428.78 - 3428.78 Capital Work-in-Progress 627.54 - 627.54 Other Intangible Assets 7.09 - 7.09 Financial Assets: - Investments 25 (d) (i) 131.42 45.54 176.96 Loans 25 (d) (vii) 3.10 (1.15) 1.95 Others financial assets 25 (d) (vii) 12.40 (2.95) 9.45 Deferred Tax Assets (Net) 0.94 - 0.94 Other non-current assets 25 (d) (viii) 245.63 (1.58) 244.05 Current assetsInventories 1826.25 - 1826.25 Financial Assets: Investments 25 (d) (i) 945.01 149.85 1094.86 Trade Receivables 1715.36 - 1715.36 Cash and cash Equivalents 273.17 - 273.17 Bank balances other than cash and cash equivalents 452.58 - 452.58 Others financial assets 18.33 - 18.33 Other current assets 25 (d) (vii) 146.39 4.12 150.51 Total assets 9833.99 193.83 10027.82
EQUITY AND LIABILITIESEquity Equity share capital 4.24 - 4.24 Other equity 4535.44 219.81 4755.25 Equity attributable to owners 4539.68 219.81 4759.49 Non-controlling interest 0.11 - 0.11 Total equity 4539.79 219.81 4759.60 LIABILITIESNon-current liabilitiesFinancial liabilities Borrowings 25 (d) (ii) 1198.75 (7.92) 1190.83 Provisions 25 (d) (vii) 92.00 (4.36) 87.64 Other Non-Current Liabilities 25 (d) (vii) 15.95 (3.30) 12.65 Deferred Tax Liabilities (Net) 25 (d) (vi) 235.47 15.30 250.77 Total non-current liabilities 1542.17 (0.28) 1541.89 Financial liabilities Borrowings 616.25 - 616.25 Trade payables 1140.87 - 1140.87 Other financial liabilities 25 (d) (iii) & (vii) 332.60 (21.97) 310.63 Provisions 25 (d) (iii) & (vii) 107.67 (3.73) 103.94 Current Tax Liabilities (Net) 127.58 - 127.58 Other current liabilities 1427.06 - 1427.06 Total current liabilities 3752.03 (25.70) 3726.33 Total liabilities 5294.20 (25.98) 5268.22 Total equity and liabilities 9833.99 193.83 10027.82 * The previous GAAP figures have been reclassified to conform to Ind AS presentation requirements for the purposes of this note.
NOTES TO THE CONSOLIDATED FINANCIAL STATEMENTS FOR THE YEAR ENDED 31ST MARCH, 2017

167
NOTES TO THE CONSOLIDATED FINANCIAL STATEMENTS FOR THE YEAR ENDED 31ST MARCH, 2017
NOTE 25 (b) - RECONCILIATION OF EQUITY AS AT 31ST MARCH, 2016 ` in Crores Particulars Foot Notes Previous GAAP * Adjustments Ind ASASSETSNon-current assetsProperty, Plant and Equipment 4599.21 - 4599.21 Capital Work-in-Progress 1059.28 - 1059.28 Other Intangible Assets 9.08 - 9.08 Financial Assets: - - Investments 25 (d) (i) 918.49 104.87 1023.36 Loans 25 (d) (vii) 6.19 (2.61) 3.58 Others financial assets 25 (d) (vii) 16.04 (1.87) 14.17 Other non-current assets 25 (d) (viii) 227.83 (1.69) 226.14 Current assets Inventories 1899.81 - 1899.81 Financial Assets: Investments 25 (d) (i) 1854.75 259.79 2114.54 Trade Receivables 1838.72 - 1838.72 Cash and cash Equivalents 121.14 - 121.14 Bank balances other than cash and cash equivalents 3.09 - 3.09 Other financial assets 10.35 - 10.35 Other current assets 25 (d) (vii) 327.00 4.34 331.34 Total assets 12890.98 362.83 13253.81
EQUITY AND LIABILITIESEquity Equity share capital 4.24 - 4.24 Other equity 6851.52 368.58 7220.10 Equity attributable to owners 6855.76 368.58 7224.34 Non-controlling interest 0.12 - 0.12 Total equity 6855.88 368.58 7224.46
LIABILITIESNon-current liabilitiesFinancial liabilities: Borrowings 25 (d) (ii) 1485.08 1.37 1486.45 Provisions 25 (d) (vii) 129.16 (3.84) 125.32 Other Non-Current Liabilities 25 (d) (vii) 38.65 (2.41) 36.24 Deferred Tax Liabilities (Net) 25 (d) (vi) 299.10 53.42 352.52 Total non-current liabilities 1951.99 48.54 2000.53 Financial liabilities: Borrowings 885.59 - 885.59 Trade payables 1126.15 - 1126.15 Other financial liabilities 25 (d) (iii) & (vii) 504.36 (46.17) 458.19 Provisions 25 (d) (iii) & (vii) 97.77 (8.12) 89.65 Current Tax Liabilities (Net) 9.97 - 9.97 Other current liabilities 1459.27 - 1459.27 Total current liabilities 4083.11 (54.29) 4028.82 Total liabilities 6035.10 (5.75) 6029.35 Total equity and liabilities 12890.98 362.83 13253.81 * The previous GAAP figures have been reclassified to conform to Ind AS presentation requirements for the purposes of this note.

168
NOTE 25 (c) - RECONCILIATION OF TOTAL COMPREHENSIVE INCOME FOR THE PERIOD ENDED 31 MARCH 2016 ` in Crores Particulars Foot Note Previous GAAP * Adjustments Ind ASINCOME Revenue from Operations 22491.02 - 22491.02 Other Income 25 (d) (i) & (vii) 150.79 172.80 323.59
TOTAL INCOME 22641.81 172.80 22814.61 EXPENSES Cost of materials consumed 11249.13 - 11249.13 Purchases of Stock-in-Trade 39.76 - 39.76 Changes in inventories of Finished Goods, Stock-in-Trade and Work-in-Progress (14.48) - (14.48) Employee Benefits expense 25 (d) (iv) 1309.48 (24.26) 1285.22 Finance Costs 25 (d) (vii) 343.64 8.92 352.56 Depreciation and Amortisation expense 737.12 - 737.12 Excise Duty 2310.78 - 2310.78 Other Expenses 3203.41 (4.79) 3198.62
TOTAL EXPENSES 19178.84 (20.13) 19158.71 PROFIT BEFORE TAX 3462.97 192.93 3655.90 TAX EXPENSE(1) Current Tax 1032.45 - 1032.45 (2) Deferred Tax 25 (d) (vi) 64.51 49.51 114.02
TOTAL TAX EXPENSE 1096.96 49.51 1146.47 PROFIT FOR THE YEAR 2366.01 143.42 2509.43 NON-CONTROLLING INTEREST (0.01) - (0.01)OTHER COMPREHENSIVE INCOME Items that will not be reclassified to Profit or Loss Remeasurements of Defined benefit plans 25 (d) (iv) - (24.92) (24.92) Income Tax relating to items that will not be reclassified to Profit or Loss 25 (d) (iv) - 8.66 8.66 Items that may be reclassified to Profit or LossDesignated Cash Flow Hedges 25 (d) (ii) - (9.29) (9.29)Income tax relating to items that may be reclassified to Profit or Loss 25 (d) (ii) - 3.21 3.21 TOTAL OTHER COMPREHENSIVE INCOME FOR THE YEAR, NET OF TAX - (22.34) (22.34)TOTAL COMPREHENSIVE INCOME FOR THE YEAR 2366.00 121.08 2487.08
* The previous GAAP figures have been reclassified to conform to Ind AS presentation requirements for the purposes of this note.
NOTES TO THE CONSOLIDATED FINANCIAL STATEMENTS FOR THE YEAR ENDED 31ST MARCH, 2017

169
i) FVTPL Financial Assets:
under previous GAAP, the Company accounted for non-current/current investments in quoted equity shares and unquoted mutual funds units at cost less provision for other than temporary diminution in the value of investments and at lower of cost and share value respectively. under Ind-AS, the investments are required to be classified and measured subsequently at fair value through profit or loss. At the date of transition to Ind-AS, difference between the fair value and GAAP carrying amount of ̀ 195.39 Crores has been recognised in the retained earnings. The impact of ` 169.27 Crores as at 31st March, 2016 has been recognised in the statement of profit and loss.
ii) Derivatives:
under previous GAAP, the company recognised derivatives if the fair value of the derivative resulted in loss in the Statement of Profit or Loss. Derivatives resulting in gains in the Statement of Profit and Loss were not recognised. Ind AS requires all derivatives to be recognised whether they result in loss or gain. All derivatives have been recognised at fair value. The effective portion of the changes in fair value of interest rate swaps designated as hedging instrument under cash flow hedge relating to risk being hedged is recognised in Other Comprehensive Income. The changes in fair value of undesignated derivatives are recognised in retained earnings on the date of transition and in finance costs after the date of transition. However, none of the derivatives designated as hedge, were ineffective during the reporting period. The impact on account of recognition of derivatives in the Other Comprehensive Income for the period ended 31 March 2016 is `6.08 Crores (Net of Tax of `3.21 Crores) and `5.18 Crores (Net of Tax of `2.74 Crores) as at the date of transition.
iii) Other Payables:
under previous GAAP, proposed dividend including Dividend
Distribution Tax are recognised as a liability in the period to which they relate, irrespective of when they are declared. under Ind-AS, dividend is recognised as a liability in the period in which it is declared by the company (usually when approved by shareholders in a general meeting).
Accordingly, the liability of `22.39 Crores for the year ended on 30th September, 2014 recorded for proposed dividend has been derecognised against retained earnings as on the transition date. The proposed dividend for the period ended on 31st March 2016 of `47.99 Crores recognised under Indian GAAP was reduced from other payables and with a corresponding impact in the retained earnings.
iv) Defined Benefit Obligation:
Both under previous GAAP and Ind-AS, the Group recognised costs related to its post-employment defined benefit plan on an actuarial basis. under Indian GAAP, the entire cost, including actuarial gains and losses, are charged to statement of profit or loss. under Ind-AS, re-measurements comprising of actuarial gains and losses arising from experience adjustments and changes in actuarial assumptions, the effect of change in asset ceiling (if applicable) and the return on plan assets (excluding net interest) are recognised immediately in the balance sheet with a corresponding debit or credit to retained earnings through Other Comprehensive Income (OCI). Thus, the employee benefit cost is reduced by ` 16.26 Crores (Net of Tax of `8.66 Crores) as at 31st March, 2016 and re-measurement losses on defined benefit plans has been recognised in the Other Comprehensive Incomes (net of tax)
v) Other Comprehensive Income:
under previous GAAP, the Company has not presented Other Comprehensive Income (OCI) separately. Hence, it has reconciled previous GAAP profit to profit as per Ind-AS. Further, Indian GAAP profit is reconciled to total comprehensive income as per Ind-AS.
NOTES TO THE CONSOLIDATED FINANCIAL STATEMENTS FOR THE YEAR ENDED 31ST MARCH, 2017
NOTE 25 (d) - FOOTNOTES TO THE RECONCILIATION OF EQUITY AS AT 1ST OCTOBER, 2014( 01.04.2015 FOR MRF CORP LTD) AND 31ST MARCH, 2016 AND TOTAL COMPREHENSIVE INCOME FOR THE PERIOD ENDED 31ST MARCH, 2016

170
vi) Deferred Tax:
under previous GAAP, the deferred tax was calculated on income statement approach whereas Ind AS requires deferred tax to be recognised on balance sheet liability method. This change in the concept of recognition and measurement has resulted in an increase of deferred tax liability of ` 15.30 Crores on transition date with corresponding decrease in retained earnings. Further, the impact during the previous period ended 31st March 2016 was net decrease in the total comprehensive income for the period of `38.12 Crores
vii) Other IND AS Adjustments (Non Current Financial Assets / liabilities and provisions):
under previous GAAP, the Company accounted for non-current Financial Assets / liabilities and provisions at undiscounted values. In contrast, the IND AS requires that where the effect of time value of money is material, the amount of Non Current Financial Assets / liabilities and provisions should be the present value of expenditure / income expected to be required to settle the obligations / received upon maturity. This impact is recognised as an Interest Income or as other borrowing cost.
viii) Non Current Assets:
The Company has elected to measure certain advances at fair value at the date of transition to IND AS. Accordingly, at the date of transition to IND AS , a decrease of `1.58 Crores and `0.11 Crores for the period ended 31st March 2016 has been recognised as an expenses on de-recognition of the asset.
NOTE 26 :
A. Capital Management:
For the purpose of the Group’s Capital Management, capital includes Issued Equity Capital, Securities Premium, and all other Equity Reserves attributable to the Equity Holders of the Group. The primary objective of the Group’s Capital Management is to maximise the Share Holder value.
The Group manages its capital structure and makes adjustments in the light of changes in economic conditions and requirements of the financial covenants and to continue as a going concern. The Group monitors using a gearing ratio which is net debts divided by total capital plus net debt. The Group includes within net debt, interest bearing loans and borrowings, less cash and short term deposit. Consequent to such capital structure, there are no externally imposed capital requirements. In order to maintain an optimal capital structure, the group allocates its capital for distribution as dividend or reinvestment into bussiness based on its long term financial plans.
B. Financial Risk Management:
The Group’s principal financial liabilities comprise loans and borrowings, trade and other payables. The main purpose of these financial liabilities is to finance the operations of the Group. The principal financial assets include trade and other receivables, investments in mutual funds and cash and short term deposits.
The Group has assessed market risk, credit risk and liquidity risk to its financial liabilities.
i) Market Risk
Is the risk of loss of future earnings, fair values or cash flows that may result from a change in the price of a financial instrument, as a result of interest rates, foreign exchange rates and other price risks. Financial instruments affected by market risks, primarily include loans & borrowings, investments and foreign currency receivables, payables and borrowings.
In order to optimise and manage the Group’s interest rate risk, the treasury performs a comprehensive risk management policy by balancing the portion of fixed rate and floating rate financial instruments in its total portfolio. The Company due to its AAA rated status commands one of the cheapest source of funding. Interest rate is fixed for the tenor of the term loans availed by the Group. Interest on borrowings subject
NOTES TO THE CONSOLIDATED FINANCIAL STATEMENTS FOR THE YEAR ENDED 31ST MARCH, 2017

171
to floating interest rate are repriced regularly. The sensitivity analysis detailed below have been determined based on the exposure to variable interest rates on the average outstanding amounts due to bankers over a year.
If the interest rates had been 1% higher / lower and all other variables held constant, the company’s profit for the year ended 31st March, 2017 would have been decreased/increased by ` 6.34 crores.
The Group is not exposed to significant risk with regard to foreign currency borrowing and payables.
The foreign currency loans are designated as cash flow hedges and are fully covered for the tenor of the loan. As regards foreign currency trade transactions, net exposure on a month on month basis, is fully covered.
The Group is affected by the price stability of certain commodities. Due to the significantly increased volatility of certain commodities like Natural Rubber, Synthetic Rubber and other Chemicals, the Group enters into purchase contracts on a short term and forward foreign exchange contracts (matching the purchase contracts) are entered into to minimise price fluctuations.
ii) Credit Risk
Is the risk that a counterparty will default on its contractual obligations resulting in a financial loss to the Group. It arises from cash and cash equivalents, investments as well as credit exposure to customers.
The Group holds cash and cash equivalents with banks which are having highest safety rankings and hence has a low credit risk.
Investments in mutual funds are primarily debt funds, which have high safety ratings and are monitored on a monthly
basis and the Group is of the opinion that its mutual fund investments have low credit risk.
The Group’s marketing policies are well structured and all replacement sales are predominantly through dealers and the outstanding are secured by dealer deposits. As regards sales to O.E. and other institutional sales, the Group carries out periodic credit checks and also limits the exposure by establishing maximum payment period for customers and by offering prompt payment discounts, etc. The outstanding trade receivables due for a period exceeding 180 days as at the year ended 31 March 2017 is 0.36% of the total trade receivables.
iii) Liquidity Risk
The Group manages liquidity risk by maintaining adequate surplus, banking facilities and reserve borrowings facilities by continuously monitoring forecasts and actual cash flows.
The Group has a system of forecasting rolling three months cash inflow and outflow and all liquidity requirements are planned.
All Long term borrowings are for a fixed tenor and generally these cannot be foreclosed.
The Group has access to various source of Short term funding and debit maturing within 12 months can be rolled over with existing lenders/new lenders, or repaid based on short term requirements.
Trade and other payables are plugged into the three months rolling cash flow forecast to ensure timely funding, if required.
All payments are made along due dates and requests for early payments are entertained after due approval and availing early payment discounts.
NOTES TO THE CONSOLIDATED FINANCIAL STATEMENTS FOR THE YEAR ENDED 31ST MARCH, 2017
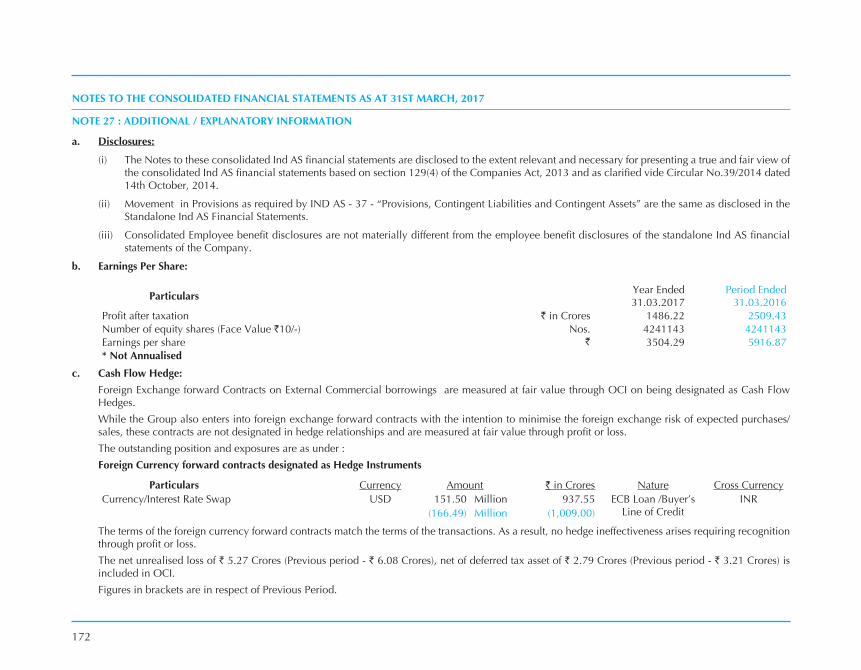
172
NOTE 27 : ADDITIONAL / EXPLANATORY INFORMATION
a. Disclosures:
(i) The Notes to these consolidated Ind AS financial statements are disclosed to the extent relevant and necessary for presenting a true and fair view of the consolidated Ind AS financial statements based on section 129(4) of the Companies Act, 2013 and as clarified vide Circular No.39/2014 dated 14th October, 2014.
(ii) Movement in Provisions as required by IND AS - 37 - “Provisions, Contingent Liabilities and Contingent Assets” are the same as disclosed in the Standalone Ind AS Financial Statements.
(iii) Consolidated Employee benefit disclosures are not materially different from the employee benefit disclosures of the standalone Ind AS financial statements of the Company.
b. Earnings Per Share:
Particulars Year Ended 31.03.2017
Period Ended 31.03.2016
Profit after taxation ` in Crores 1486.22 2509.43 Number of equity shares (Face value `10/-) Nos. 4241143 4241143 Earnings per share ` 3504.29 5916.87 * Not Annualised
c. Cash Flow Hedge: Foreign Exchange forward Contracts on External Commercial borrowings are measured at fair value through OCI on being designated as Cash Flow
Hedges. While the Group also enters into foreign exchange forward contracts with the intention to minimise the foreign exchange risk of expected purchases/
sales, these contracts are not designated in hedge relationships and are measured at fair value through profit or loss. The outstanding position and exposures are as under : Foreign Currency forward contracts designated as Hedge Instruments
Particulars Currency Amount ` in Crores Nature Cross CurrencyCurrency/Interest Rate Swap uSD 151.50 Million 937.55 ECB Loan /Buyer’s
Line of CreditINR
(166.49) Million (1,009.00)
The terms of the foreign currency forward contracts match the terms of the transactions. As a result, no hedge ineffectiveness arises requiring recognition through profit or loss.
The net unrealised loss of ` 5.27 Crores (Previous period - ` 6.08 Crores), net of deferred tax asset of ` 2.79 Crores (Previous period - ` 3.21 Crores) is included in OCI.
Figures in brackets are in respect of Previous Period.
NOTES TO THE CONSOLIDATED FINANCIAL STATEMENTS AS AT 31ST MARCH, 2017

173
d. Forward Contract Outstanding as on 31st March, 2017:
Particulars Currency Amount ` in Crores Nature Cross CurrencyForward Contract uSD 42.97 Million 286.95 Buyer’s Line of Credit INR
(24.98) Million (169.66)Forward Contract uSD 35.66 Million 241.03 Import purchase INR
(17.06) Million (116.63)Forward Contract uSD 64.30 Million 416.99 Sales uSD
(78.17) Million (518.57)
un-hedged foreign currency exposure is ` 29.12 Crores, net receivable (Previous Period - ` 22.17 Crores, net receivable).
Figures in brackets are in respect of Previous Period.
e. Related party disclosures:(a) Names of other related parties and nature of relationship:
Key Management Personnel: i) Mr. K.M. Mammen, Chairman and Managing Director ii) Mr. K.M. Philip, Whole-time Director (upto 31.03.2015)iii) Mr. Arun Mammen, Managing Director (vice Chairman and Managing Director w.e.f. 04.05.2017)iv) Mr. Rahul Mammen Mappillai, Whole-time Director (Managing Director w.e.f. 04.05.2017)v) Mr. Ravi Mannath, Company Secretaryvi) Mr. Madhu P Nainan, vice President Finance
Relatives of Key Management i) Mrs. Ambika Mammen (Wife of Chairman and Managing Director), (Director w.e.f. 23rd Apr,2015 )
Personnel: ii) Dr. (Mrs) Cibi Mammen (Wife of Managing Director), (Director w.e.f. 12th February, 2015)iii) Mr. Samir Thariyan Mappillai (Son of Chairman and Managing Director)
Companies in which Directors are interested:
Badra Estate & Industries Limited, Devon Machines Pvt Ltd, Coastal Rubber Equipments Pvt Ltd
Comprehensive Investments & Finance Co.Pvt Ltd, Kirloskar Electric co Ltd, Braga Industries, Braga Industries LLP,Funskool India Ltd , Pandalur Plantations Pvt Ltd, Gokul Rubber & Tea Plantations Ltd, vPC Freight Forwarders Pvt Ltd.
Other Related Parties: Mr.Jacob Kurian- Director, MRF Ltd Executives Provident Fund Trust, MRF Management Staff Gratuity Scheme, MRF Employees Gratuity Scheme, MRF Managers’ Superannuation Scheme.
NOTES TO THE CONSOLIDATED FINANCIAL STATEMENTS AS AT 31ST MARCH, 2017

174
(b) Transactions with related parties (excluding reimbursements)i) Compensation of Key Management Personnel: ` in Crores
Sitting Fees Remuneration* Commission PayableYear Ended Period Ended Year Ended Period Ended As at As at As at31.03.2017 31.03.2016 31.03.2017 31.03.2016 31.03.2017 31.03.2016 01.10.2014
Short Term Employee Benefit Paid - - 55.48 70.51 - - - Commission Payable - - - - 23.17 29.81 14.81
ii) Compensation to Relatives of Key 0.02 0.02 0.62 0.75 - - - Management Personnel;
* Remuneration does not include provisions made for Gratuity and Leave benefits as they are determined on an actuarial basis for the Company as a whole.
iii) Companies in which Directors are interested:Purchase of Raw Materials/
Components/Machinery
: Coastal Rubber Equipments Pvt Ltd - ` 56.19 Crores (Previous Period - ` 101.78 Crores), Devon Machines Pvt Ltd ` 20.82 Crores (Previous Period - ` 28.37 Crores), Braga Industries ` 84.76 Crores (Previous Period - ` 107.10 Crores), and Others ` 0.01 Crores (Previous Period - ` 3.00 Crores)
Selling & Distribution Expenses : Funskool India Ltd ` 1.05 Crores (Previous Period - ` 1.06 Crores)
Payment towards Services : vPC Freight Forwarders Pvt Ltd - ` 5.94 Crores (Previous Period - ` 13.66 Crores), Coastal Rubber Equipments Pvt Ltd - ` 1.39 Crores (Previous Period - ` 1.67 Crores) and Braga Industries LLP - ` 0.60 Crores (Previous Period - ` 0.01 Crores).
Sale of Investments : Comprehensive Investments & Finance Co Pvt Ltd - ` NIL (Previous Period - ` 6.10 Crores)Sale of Materials : Funskool India Ltd ` 0.03 Crores (Previous Period - ` 0.03 Crores)
Balance Outstanding:Payable : Devon Machines Pvt Ltd - ` Nil (31.03.2016 - ` 0.22 Crores), Coastal Rubber Equipment Pvt Ltd - ` Nil
(31.03.2016 - `2.72 Crores) and Braga Industries - ` 11.76 Crores (31.03.2016 - ` 5.87 Crores)Receivable : Devon Machines Pvt Ltd - ` 0.05 Crores (31.03.2016 - ` Nil), Coastal Rubber Equipment Pvt Ltd - ` 2.65 Crores
(31.03.2016 - ` Nil) and Braga Industries - ` 11.76 Crores (31.03.2016 - `5.87 Crores)
iv) Other Related Parties:Professional Charges : Mr. Jacob Kurien - ` 0.16 Crores (Previous Period - ` 0.17 Crores.)Contributions : MRF Ltd Executives Provident Fund Trust - ` 8.47 Crores (Previous Period - ` 10.27 Crores), MRF Management
Staff Gratuity Scheme - ` 5.23 Crores (Previous Period - ` 30.75 Crores), MRF Employees Gratuity Scheme - ` 0.77 Crores (Previous Period - ` 34.30 Crores), MRF Managers’ Superannuation Scheme - ` 11.89 Crores (Previous Period - ` 13.95 Crores).
NOTES TO THE CONSOLIDATED FINANCIAL STATEMENTS AS AT 31ST MARCH, 2017

175
Balance Outstanding:Contributions Payable : MRF Ltd Executives Provident Fund Trust - ` 0.74 Crores (31.03.2016 - ` 0.62 Crores), MRF Management Staff
Gratuity Scheme - ` 17.76 Crores (31.03.2016 - ` 5.74 Crores), MRF Employees Gratuity Scheme - ` 19.59 Crores (31.03.2016 - ` 0.52 Crores).
(c) Terms and conditions of transactions with related parties;The transactions with related parties are made on terms equivalent to those that prevail in arm’s length transactions. Outstanding balances at the year-end are unsecured and interest free and settlement occurs in cash. There have been no guarantees provided or received for any related party receivables or payables. For the year ended 31st March, 2017, the Company has not recorded any impairment of receivables relating to amounts owed by related parties (31st March, 2016: ` Nil). This assessment is undertaken each financial year through examining the financial position of the related party and the market in which the related party operates.
f. Additional information on Net Assets and Share of Profit as at 31st March, 2017Name of the entity Net Assets, i.e., total assets minus
total liabilitiesShare in profit or loss Share in Other comprehensive
Income (OCI)As % of consolidated
net assetsAmount
` in Crores
As % of net Profit
Amount
` in Crores
As a % of OCI Amount
` in CroresParent - MRF Ltd. 2016-17 98.86 8,541.96 97.96 2,066.37 42.45 (16.84)
2014-16 99.00 6,787.41 98.08 2,320.60 100.00 (22.44)Parent SubsidiariesIndian MRF Corp.Ltd 2016-17 0.52 45.01 0.76 16.02 0.98 (0.39)
2014-16 0.49 33.40 0.61 14.52 0 0.10 MRF International Ltd. 2016-17 0.02 1.51 0.01 0.14
2014-16 0.02 1.42 0.01 0.15 Foreign MRF Lanka (P) Ltd. 2016-17 0.08 6.96 0.11 2.33
2014-16 0.07 5.06 0.14 3.42 MRF SG Pte. LTD 2016-17 0.52 45.32 1.16 24.51
2014-16 0.42 28.47 1.15 27.31 Minority InterestIndian Subsidiary 2016-17 - 0.12 - - - -
2014-16 - 0.12 - 0.01 - -
NOTES TO THE CONSOLIDATED FINANCIAL STATEMENTS AS AT 31ST MARCH, 2017

176
g. Disclosures under Ind AS 108 - “”Operating Segment” - (Refer Note j below)(i) Entity wide disclosure as per paragraph 31 of Ind AS 108: ` in Crores
Year ended31.03.2017
Period ended31.03.2016
Automobile Tyres 13,019.27 19,619.11
Automobile Tubes 1,167.01 1,724.87
Speciality Coating 170.27 304.36
Others 474.27 710.80
14,830.82 22,359.14
(ii) Revenue from External Customers:
India 13,502.79 20,473.90
Outside India 1,328.03 1,885.24
14,830.82 22,359.14
(iii) Non-Current Assets :
India 7,765.22 6,930.53
Outside India 3.80 4.29
(iv) There are no transactions with single external customer which amounts to 10% or more of the Company’s revenue.
h. Terms of Repayment and Security Description of Borrowings:
a) Current Borrowings:
i) Loans repayable on demand from banks are secured by hypothication of Inventories and book debts and carries interest rates at the rate of 8.25% to 9.75% (Previous period 9.35% to 10.50 %)
ii) Buyer’s Line of Credit is repayable within a year and carries interest at the rate of LIBOR plus 15bps to LIBOR plus 25bps (Previous period LIBOR plus 25bps and LIBOR plus 40bps)
iii) Foreign Currency Loans repayable on demand availed by a foreign subsidiary are backed by way of Letter of Comfort from holding Company. The interest rate on the said loans range from 0.30% to 0.40% p.a above the ICE uSD LIBOR. (previous period 0.30% to 0.40% p.a above ICE uSD LIBOR).
NOTES TO THE CONSOLIDATED FINANCIAL STATEMENTS AS AT 31ST MARCH, 2017
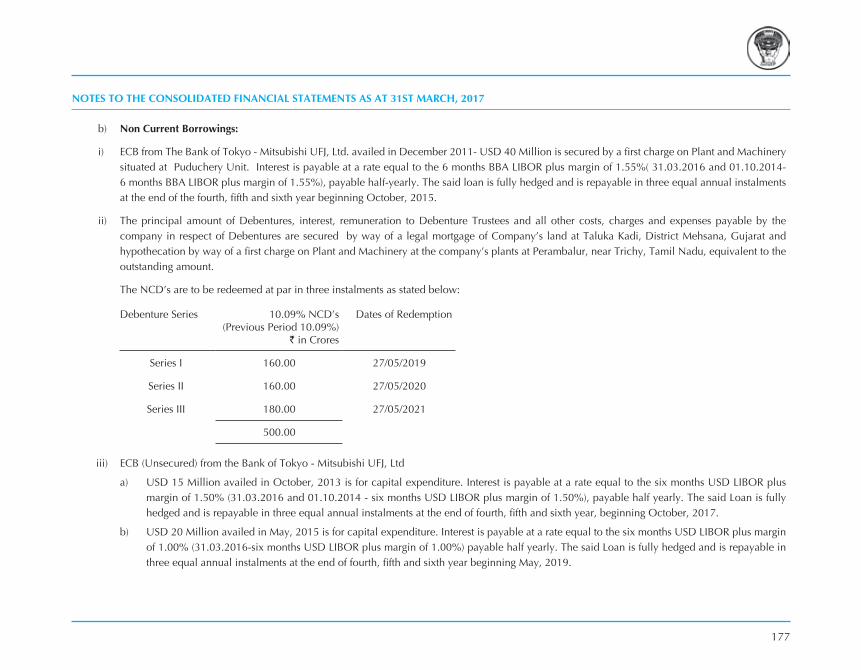
177
b) Non Current Borrowings:
i) ECB from The Bank of Tokyo - Mitsubishi uFJ, Ltd. availed in December 2011- uSD 40 Million is secured by a first charge on Plant and Machinery situated at Puduchery unit. Interest is payable at a rate equal to the 6 months BBA LIBOR plus margin of 1.55%( 31.03.2016 and 01.10.2014- 6 months BBA LIBOR plus margin of 1.55%), payable half-yearly. The said loan is fully hedged and is repayable in three equal annual instalments at the end of the fourth, fifth and sixth year beginning October, 2015.
ii) The principal amount of Debentures, interest, remuneration to Debenture Trustees and all other costs, charges and expenses payable by the company in respect of Debentures are secured by way of a legal mortgage of Company’s land at Taluka Kadi, District Mehsana, Gujarat and hypothecation by way of a first charge on Plant and Machinery at the company’s plants at Perambalur, near Trichy, Tamil Nadu, equivalent to the outstanding amount.
The NCD’s are to be redeemed at par in three instalments as stated below:
Debenture Series 10.09% NCD’s (Previous Period 10.09%)
` in Crores
Dates of Redemption
Series I 160.00 27/05/2019
Series II 160.00 27/05/2020
Series III 180.00 27/05/2021
500.00
iii) ECB (unsecured) from the Bank of Tokyo - Mitsubishi uFJ, Ltd
a) uSD 15 Million availed in October, 2013 is for capital expenditure. Interest is payable at a rate equal to the six months uSD LIBOR plus margin of 1.50% (31.03.2016 and 01.10.2014 - six months uSD LIBOR plus margin of 1.50%), payable half yearly. The said Loan is fully hedged and is repayable in three equal annual instalments at the end of fourth, fifth and sixth year, beginning October, 2017.
b) uSD 20 Million availed in May, 2015 is for capital expenditure. Interest is payable at a rate equal to the six months uSD LIBOR plus margin of 1.00% (31.03.2016-six months uSD LIBOR plus margin of 1.00%) payable half yearly. The said Loan is fully hedged and is repayable in three equal annual instalments at the end of fourth, fifth and sixth year beginning May, 2019.
NOTES TO THE CONSOLIDATED FINANCIAL STATEMENTS AS AT 31ST MARCH, 2017
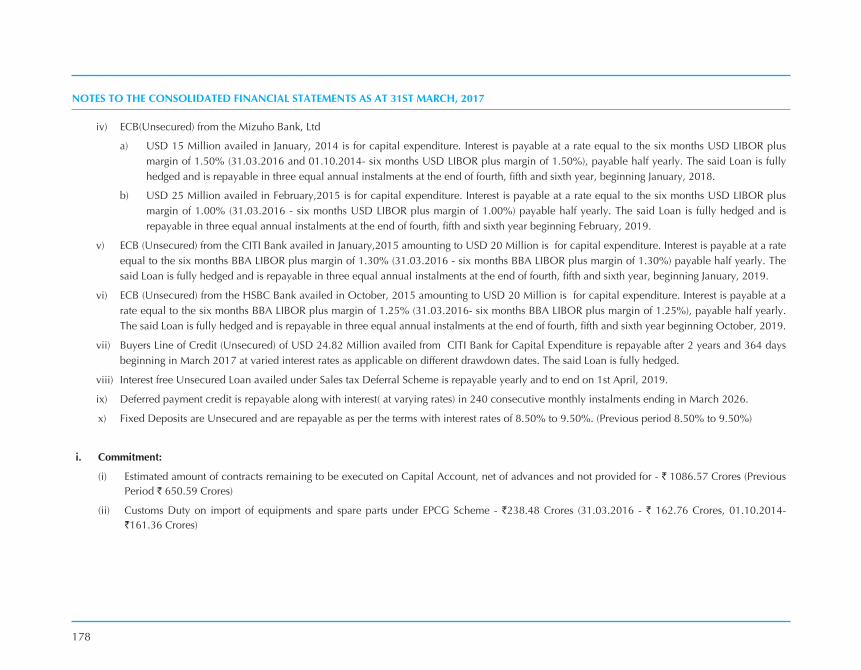
178
iv) ECB(unsecured) from the Mizuho Bank, Ltd
a) uSD 15 Million availed in January, 2014 is for capital expenditure. Interest is payable at a rate equal to the six months uSD LIBOR plus margin of 1.50% (31.03.2016 and 01.10.2014- six months uSD LIBOR plus margin of 1.50%), payable half yearly. The said Loan is fully hedged and is repayable in three equal annual instalments at the end of fourth, fifth and sixth year, beginning January, 2018.
b) uSD 25 Million availed in February,2015 is for capital expenditure. Interest is payable at a rate equal to the six months uSD LIBOR plus margin of 1.00% (31.03.2016 - six months uSD LIBOR plus margin of 1.00%) payable half yearly. The said Loan is fully hedged and is repayable in three equal annual instalments at the end of fourth, fifth and sixth year beginning February, 2019.
v) ECB (unsecured) from the CITI Bank availed in January,2015 amounting to uSD 20 Million is for capital expenditure. Interest is payable at a rate equal to the six months BBA LIBOR plus margin of 1.30% (31.03.2016 - six months BBA LIBOR plus margin of 1.30%) payable half yearly. The said Loan is fully hedged and is repayable in three equal annual instalments at the end of fourth, fifth and sixth year, beginning January, 2019.
vi) ECB (unsecured) from the HSBC Bank availed in October, 2015 amounting to uSD 20 Million is for capital expenditure. Interest is payable at a rate equal to the six months BBA LIBOR plus margin of 1.25% (31.03.2016- six months BBA LIBOR plus margin of 1.25%), payable half yearly. The said Loan is fully hedged and is repayable in three equal annual instalments at the end of fourth, fifth and sixth year beginning October, 2019.
vii) Buyers Line of Credit (unsecured) of uSD 24.82 Million availed from CITI Bank for Capital Expenditure is repayable after 2 years and 364 days beginning in March 2017 at varied interest rates as applicable on different drawdown dates. The said Loan is fully hedged.
viii) Interest free unsecured Loan availed under Sales tax Deferral Scheme is repayable yearly and to end on 1st April, 2019.
ix) Deferred payment credit is repayable along with interest( at varying rates) in 240 consecutive monthly instalments ending in March 2026.
x) Fixed Deposits are unsecured and are repayable as per the terms with interest rates of 8.50% to 9.50%. (Previous period 8.50% to 9.50%)
i. Commitment:
(i) Estimated amount of contracts remaining to be executed on Capital Account, net of advances and not provided for - ` 1086.57 Crores (Previous Period ` 650.59 Crores)
(ii) Customs Duty on import of equipments and spare parts under EPCG Scheme - `238.48 Crores (31.03.2016 - ` 162.76 Crores, 01.10.2014- `161.36 Crores)
NOTES TO THE CONSOLIDATED FINANCIAL STATEMENTS AS AT 31ST MARCH, 2017

179
For SASTRI & SHAH For SCA AND ASSOCIATESChartered Accountants Chartered Accountants
Firm Regn. No. 003643S Firm Regn. No. 101174W JACOB KuRIAN
C R Kumar Shivratan Agarwal MADHu P NAINAN RAvI MANNATH v SRIDHAR K M MAMMENPartner Partner vice President Finance Company Secretary Directors Chairman & Managing Director
Mem. No. 26143 Mem. No. 104180Chennai, Dated 4th May, 2017
NOTES TO THE CONSOLIDATED FINANCIAL STATEMENTS AS AT 31ST MARCH, 2017
j. Contingent Liabilities not provided for:
(i) Guarantees given by the Banks - `35.49 Crores (Previous Period - `47.33 Crores).
(ii) Letters of Credit issued by the Banks - `153.92 Crores (Previous Period - `85.90 Crores).
(iii) Claims not acknowledged as debts:
(a) Disputed Sales Tax demands pending before the Appellate Authorities - ` 36.65 Crores (Previous Period- `23.05 Crores)
(b) Disputed Excise/Customs Duty demands pending before the Appellate Authorities/High Court - `86.42 Crores (Previous Period - `76.07 Crores).
(c) Disputed Income Tax Demands - `79.46 Crores (Previous period - `30.74 Crores). Against the said demand the company has deposited an amount of `15.98 Crores.
(d) Contested EPF Demands pending before Appellate Tribunal - ` 1.10 Crores ( Previous Period `1.10 Crores).
k. The Group, except for MRF Corp Ltd, a subsidiary company, is engaged interalia in the manufacture of Rubber Products such as Tyres, Tubes, Flaps, Tread Rubber and Conveyor Belt. These in the context of Ind AS 108 “Operating Segment” are considered to constitute one single primary segment. MRF Corp Ltd is engaged in the manufacture of Speciality Coatings and its revenues, results and assets do not meet the criteria specified for reportable segment prescribed in the Accounting Standard. The group’s operations outside India do not exceed the quantitative threshold for disclosure envisaged in the Accounting Standard. Non-reportable segments have not been disclosed as unallocated reconciling item in view of their materiality. In view of the above, primary and secondary reporting disclosures for business/geographical segment are not applicable.
l. Previous period Figures have been regrouped/ rearranged, wherever necessary.

180
FORM AOC-1[Pursuant to first proviso to sub-section(3) of section 129 read with rule 5 of Companies(Accounts) Rules,2014]
Statement containing sailient features of the financial statements of subsidiaries/associate companies/joint ventures
SUBSIDIARIES
` in Crores
Sr. No
Name of the Subsidiary
The Date since when subsidiary was acquired
Reporting Period of the Subsidiary
Reporting Currency
Exchange Rate as on
31.03.2017
Share Capital
Reserve & Surplus
Total Assets
Total Liabilities
Investments Turnover Profit before
Taxation
Provision for
Taxation
Profit after
Taxation
Proposed Dividend
Extent of Shareholding
(in %)
1 MRF Corp Ltd 26.08.1985 1st April, 2016 to 31st March, 2017
INR 1 0.05 44.96 71.76 26.75 9.40 174.92 16.12 5.73 10.39 0.10* 100%
2 MRF International Ltd.
23.10.1992 1st April, 2016 to 31st March, 2017
INR 1 0.56 1.59 2.16 0.01 - 0.14 0.14 0.04 0.10 - 94.66%
3 MRF Lanka (P) Ltd. 15.06.2005 1st April, 2016 to 31st March, 2017
LKR 0.43 15.01 6.96 22.71 0.74 - 11.41 2.44 (0.10) 2.54 100%
4 MRF SG Pte Ltd 23.07.2014 1st April, 2016 to 31st March, 2017
uSD 64.85 6.11 45.31 338.74 287.32 - 950.50 20.01 2.19 17.82 - 100%
* The Proposed Dividend is not recognised in the books as per Ind AS.
JACOB KuRIANChennai, 4th May, 2017 RAvI MANNATH MADHu P NAINAN v SRIDHAR K M MAMMEN Company Secretary vice President Finance Directors Chairman & Managing Director

CONTENT
Page
Chairman’s Message 1
New Product Launches 2-3
Awards and Accolades 4
MRF Motorsport Tyres 5
APRC/ MRF Challenge 6
Speciality Coatings 7
Online Retailing 8
ICC T-20 9
Racing Ahead 10-11
Board of Directors 12
Board’s Report 13
Page
Annexures I-IV to the Board’s Report 18
Management Discussion and Analysis 35
Corporate Governance 40
Business Responsibility Report 52
Auditor’s Report 58
Balance Sheet 64
Statement of Profit and Loss 65
Cash Flow Statement 66
Notes Forming Part of the Financial Statements 67
Consolidated Financial Statements 121
Form AOC-1 180
