contamination and ecological risk assessment of...
TRANSCRIPT
Journal of Water Resource and Protection, 2013, 5, 239-248 http://dx.doi.org/10.4236/jwarp.2013.52024 Published Online February 2013 (http://www.scirp.org/journal/jwarp)
Contamination and Ecological Risk Assessment of Heavy Metal in the Sediment of Turag River, Bangladesh:
An Index Analysis Approach
Zoynab Banu1,2, Md. Shariful Alam Chowdhury3, Md. Delwar Hossain4, Ken’ichi Nakagami5 1Gas Transmission Company Ltd. (GTCL), Under the Ministry of Power, Energy and Mineral Resources,
Government of Bangladesh, Bangladesh 2Department of Environmental Engineering, Bangladesh University of Engineering and Technology (BUET), Dhaka, Bangladesh
3DMC of Dhaka Water Supply Sector Development Project (DWSSDP), Dhaka Water Supply and Sewerage Authority (DWASA) & World Bank Scholar, Graduate School of Policy Science, Ritsumeikan University, Kyoto, Japan
4Department of Environmental Engineering, Faculty of Civil Engineering, Bangladesh University of Engineering and Technology (BUET), Dhaka, Bangladesh
5Graduate School of Policy Science, Ritsumeikan Center for Sustainability Science, Ritsumeikan University, Kyoto, Japan Email: [email protected], [email protected], [email protected], [email protected]
Received November 18, 2012; revised December 21, 2012; accepted December 31, 2012
ABSTRACT
Encroachment, disposal of untreated domestic and industrial wastewater and dumping of solid wastes have degraded the overall quality of the river Turag, which is located in Dhaka—the Capital City of Bangladesh. The present study inves- tigated the extent of pollution of sediments of this river and analyzed the regional variability for the concentrations of Cr, Pb, Zn, Cu and Cd—all of concern because of their potential toxicity, using atomic absorption spectrophotometer. As per US EPA sediment quality guideline, metal concentrations ranged between Cd: 0.00 - 0.80, Cr: 32.00 - 75.50, Cu: 46.30 - 60.00, Pb: 28.30 - 36.40, and Zn: 94.60 - 190.10 mg/kg in the Turag river sediments. Cr, Cu, Zn belongs to moderately to highly polluted, Pb and Cd belongs to not polluted for Turag river. The heavy metals contamination in the sediments were also evaluated by applying Index of geo-accumulation (Igeo), contamination factor (Cf), pollution load index (PLI) etc. Toxicity characteristics leaching procedure (TCLP) test (US EPA 1311) for sediment samples have been performed also for metals (Pb, Cd, Cr, Cu and Zn) to determine the readily toxicity level of heavy metals. Sieve analysis of sediment performed in this study to determine the physical characteristic of sediment samples. The metal concentrations are well below the regulated level as per US EPA. This index can be complemented with the contamina-tion index, which allows more site-specific and accurate information on contaminant levels. If the aim of work on con-tamination evaluation is to assess the overall contamination of a study area, the indices are highly appropriate. Keywords: Heavy Metal; TCLP Test; Sediment; Geo-Accumulation Index; Ecological Risk Index; Contamination
Factor; Turag River etc.
1. Introduction
The River Turag running by the side of the Dhaka City, the capital of Bangladesh, is one of the most polluted rivers in Bangladesh. Many industries have set up in and around the Dhaka City during last decade, and the num-ber of new industries are continually increasing [1]. The river Turag have been steadily experiencing complicated problems like pollution and encroachment that have al-most suffocated these valuable lifelines of the city The highest pollution points of the Turag River include the Buriganga Third Bridge area at Bashila and the Tongi Bridge area. At these two points, the river water is pitch- black with the worst of smell and can be used for hardly
any purpose. The other extreme pollution spot is near the Tongi Bridge that derives massive pollutant loading from the Tongi Industrial Area. This industrial area possesses about 29 heavy industries. This cluster of industries of the capital city generates a lot of effluents daily, which contain lots of heavy metal. Pollution of the natural en-vironment by heavy metals is a universal problem be-cause these metals are indestructible and most of them have toxic effects on living organisms, when permissible concentration levels are exceeded. Heavy metals fre-quently reported in literature with regards to potential hazards and occurrences in contaminated soils are Cd, Cr, Pb, Zn, Fe and Cu [2]. Vehicle exhausts, as well as sev-eral industrial activities emit these heavy metals so that
Copyright © 2013 SciRes. JWARP
Z. BANU ET AL. 240
soils, plants and even residents along roads with heavy traffic loads are subjected to increasing levels of con-tamination with heavy metals [3]. Heavy metals con-tamination in aquatic environment is of critical concern, due to toxicity of metals and accumulation in aquatic habitats. Trace metals in contrast to most pollutants, not biodegradable, and they undergo a global ecological cy-cle in which natural water are the main pathways. Of the chemical pollutants, heavy metal being non-biodegrade- able, they can concentrated along the food chain, pro-ducing their toxic effect at points after far removed from the source of pollution [4]. Exposure to heavy metals has linked to several human diseases such as development retardation or malformation, Kidney damage, Cancer, abortion, effect on intelligence and behavior, and even death in some cases of exposure to very high concentra-tion. The symptoms of toxic heavy metal poisoning and the symptoms of autism, PDD, Aspergers, & ADD/ ADHD are very similar. Toxic metals could be the cause of those symptoms. Memory loss, increased allergic re-actions, high blood pressure, depression, mood swings, irritability, poor concentration, aggressive behavior, sleep disabilities, fatigue, speech disorders, high blood pressure, cholesterol, triglycerides, vascular occlusion, neuropathy, autoimmune diseases, and chronic fatigue are just some of the many conditions resulting from ex- posure to toxins [3,4]. Heavy metals poison us by dis- rupting our cellular enzymes, which run on nutritional minerals such as magnesium, zinc, and selenium. The heavy metals most often implicated in human poisoning are lead, mercury, arsenic, and cadmium. Some heavy metals, such as zinc, copper, chromium, iron, and man-ganese, are required by the body in small amounts, but these same elements can be toxic in larger quantities. Toxic heavy metals may lead to a decline in the mental, cognitive, and physical health of the individual.
Objectives
The overall objective of the present study is to assess the heavy metal contamination in river sediments of some polluted rivers. Specific objectives of this study include: To assess the level of heavy metal concentrations in
the sediment, its spatial distribution and compare it with the USEPA quality guideline.
Application of advanced statistical techniques such as principal component analysis, cluster analysis and correlation matrix in order to investigate the complex dynamics of pollutants, source of heavy metal con-centration in the sediments and relationships.
To select different pollution indices to assess heavy metal contamination.
To assess the ecological risk due to sediment con-tamination.
2. Method and Materials
Sediments sample were collected from five sites along the Turag River as showing in Figure 1, Latitude and Longitude for each site were illustrated in Table 1. The sediment samples were directly collected from the Turag River during the dredging of Turag bed sludge. The sam-ples were carried by polythene bag. After collection, some portion of sediment samples were dried in a vac-uum oven at 105˚C until constant weight, lightly ground in an agate mortar for homogenization and prepared for analysis of heavy metal and some portion of samples were prepared for sieve analysis, moisture content and organic content test. For heavy metal test, 5 gm of dried sample was digested with acid and prepared 500 ml solu-tion. Finally, five heavy metals (Pb, Cd, Cr, Cu, and Zn) concentration were determined in the environmental en-gineering laboratory, BUET by using atomic absorption spectrophotometer (AAS). To determine the physical characteristics of sediment, moisture content, organic matter content and sieve analysis test were also perform- ed. Toxicity characteristics leaching procedure (TCLP) test for sediment samples were performed for five heavy metals (Pb, Cd, Cr, Cu and Zn) to determined the readily toxicity level of heavy metals. Heavy metal concentra-tion for the fine portion of sediment samples (sample which passing through # 200 sieve) were also performed in this study.
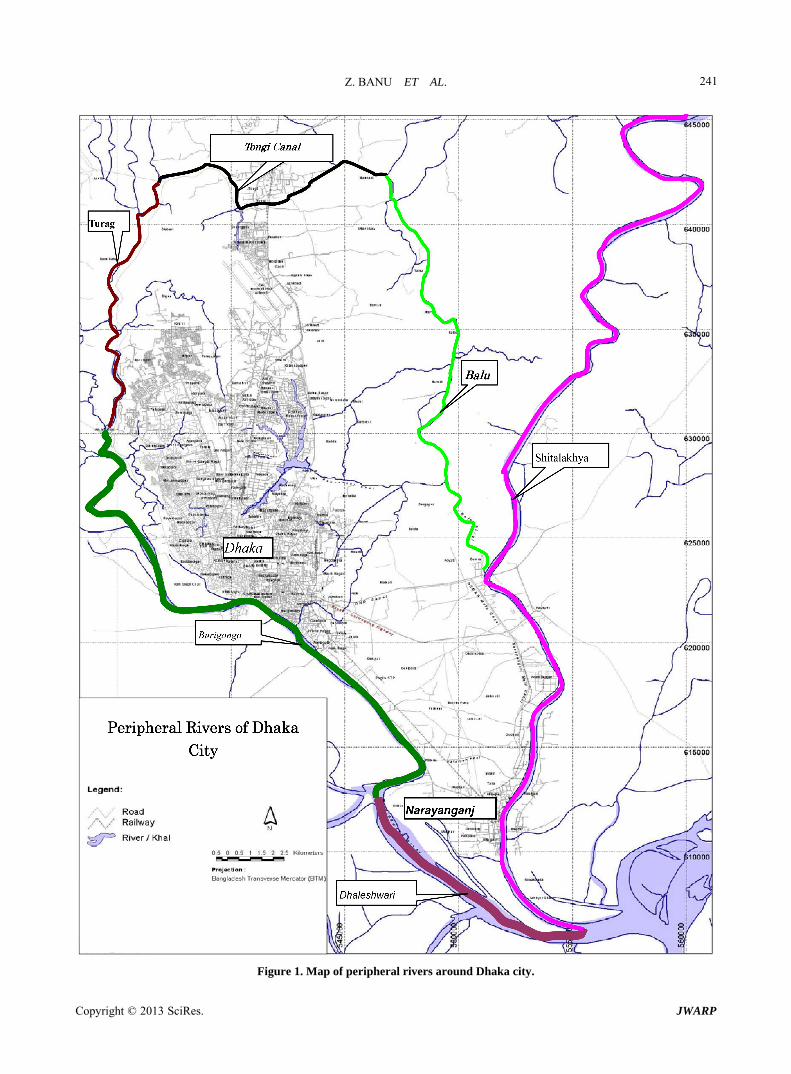
The selected sample drawing points of the Turag River includes the points near Iztema Field, Tongi Bridge, Gabtali Bridge and Sinnir Tek BIWTA Landing Station. Analyzing the DoE provided water quality data of 5 years (2006-2010) (Table 2), the following temporal pattern of the Turag River Pollution has been found (Figure 2).
Due to rapid and unplanned urbanization and industri-alization the Dhaka city’s surrounding rivers, including the Turag have gradually experienced undue and unbear- able pressure to their very existence. The main reason behind this spatial pollution pattern in the Turag within above mentioned area is that huge load of untreated toxic liquid chemical waste is directly dumped into the river from Hazaribagh tanneries through the Bashila Khal at the downstream and from the Tongi Industrial Area at
Table 1. Location of sediment sample collection.
Station No. Name of Location Longitude Latitute
1 Tongi Bridge 90˚24'4.04"E 23˚52'54.30"N
2 World Estema Field 90˚23'37.98"E 23˚52'47.64"N
3 Kamarpara Bridge 90˚23'23.61"E 23˚53'27.88"N
4 Taltola Bridge 90˚22'40.97"E 23˚53'54.98"N
5 Ashulia Beri Bandh 90˚21'37.41"E 23˚53'33.34"N
Copyright © 2013 SciRes. JWARP
Z. BANU ET AL.
Copyright © 2013 SciRes. JWARP
241
Figure 1. Map of peripheral rivers around Dhaka city.
Z. BANU ET AL. 242
Figure 2. Location of coordinates of different sites in Turag river. Table 2. Variation of water quality parameters in Turag river during 2006-2010 [5].
Parameter Unit 2006 2010
pH mg/L 7.1 7.5
EC ,, 98 1800
Chloride ,, 2 34
Turbidity ,, 6.5 12.5
TS ,, 380 896
TDS ,, 342 812
DO ,, 6 0
BOD ,, 2.8 22
COD ,, 58 102
Tongi Bridge and Iztema Field area.
3. Result and Discussion
3.1. Heavy Metal Concentrations
The total metal concentrations for each sampling site found in sediments in this study are shown in Table 3. Metal contents were ranging over following intervals: Pb: 28.30 - 36.40 mg/kg; Cd: 0.0 - 0.80 mg/kg; Cr: 32.0 - 75.50 mg/kg; Cu: 46.30 - 60.0 mg/kg; Zn: 94.60 - 190.10 mg/kg dry weights. Mean concentration of the metals were: Pb: 32.78 mg/kg; Cd: 0.28 mg/kg; Cr: 43.02 mg/kg; Cu: 50.40 mg/kg; Zn: 139.48 mg/kg dry weights, allow-ing to arrange the metals from higher to lower mean
Table 3. Concentration of heavy metals (mg/kg dry weight) of sediments of Turag river.
Location Lead (Pb)Cadmium
(Cd) Chromium
(Cr) Copper
(Cu) Zinc (Zn)
T-1 36.40 0.10 36.00 60.00 179.30
T-2 34.40 0.10 33.50 46.30 113.80
T-3 30.40 0.00 75.50 46.40 190.10
T-4 28.30 0.40 32.00 50.00 94.60
T-5 34.40 0.80 38.10 49.30 119.60
Mean 32.78 0.28 43.02 50.40 139.48
Max 36.40 0.80 75.50 60.00 190.10
Min 28.30 0.00 32.00 46.30 94.60
SD 3.32 0.33 18.31 5.62 42.48
content in this area as: Zn > Cu > Cr > Pb > Cd.
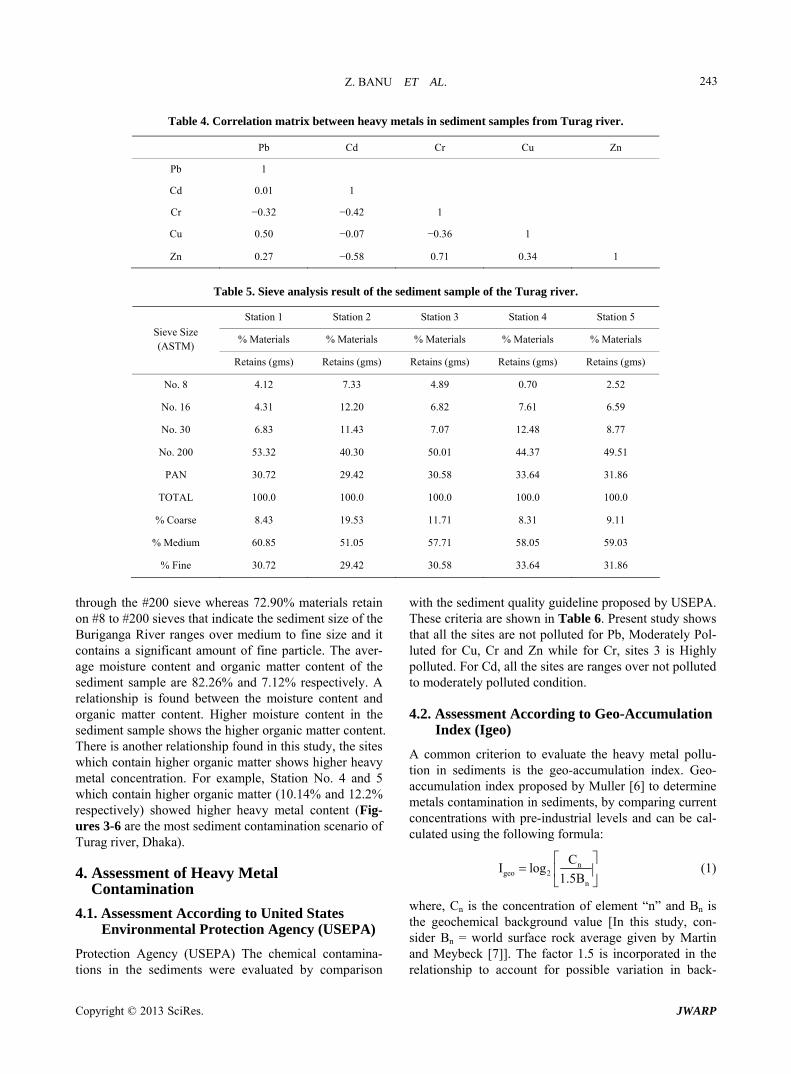
Pearson’s correlation coefficient matrix among the se-lected heavy metals of Turag river sediments is presented in Table 4. Significant correlations between the con-taminants of Cr and Zn (r = 0.71), Pb and Cu (r = 0.50), Zn and Cu (r = 0.34) could indicate the same or similar source input.
3.2. Physical Characteristic of Sediment (Sieve Analysis)
Sieve analysis result of sediment sample is presented in the Table 5. Average in all sites, 1.75% materials retain on #4 and above sieve and 25.34% materials passing
Copyright © 2013 SciRes. JWARP
Z. BANU ET AL. 243
Table 4. Correlation matrix between heavy metals in sediment samples from Turag river.
Pb Cd Cr Cu Zn
Pb 1
Cd 0.01 1
Cr −0.32 −0.42 1
Cu 0.50 −0.07 −0.36 1
Zn 0.27 −0.58 0.71 0.34 1
Table 5. Sieve analysis result of the sediment sample of the Turag river.
Station 1 Station 2 Station 3 Station 4 Station 5
% Materials % Materials % Materials % Materials % Materials Sieve Size (ASTM)
Retains (gms) Retains (gms) Retains (gms) Retains (gms) Retains (gms)
No. 8 4.12 7.33 4.89 0.70 2.52
No. 16 4.31 12.20 6.82 7.61 6.59
No. 30 6.83 11.43 7.07 12.48 8.77
No. 200 53.32 40.30 50.01 44.37 49.51
PAN 30.72 29.42 30.58 33.64 31.86
TOTAL 100.0 100.0 100.0 100.0 100.0
% Coarse 8.43 19.53 11.71 8.31 9.11
% Medium 60.85 51.05 57.71 58.05 59.03
% Fine 30.72 29.42 30.58 33.64 31.86
through the #200 sieve whereas 72.90% materials retain on #8 to #200 sieves that indicate the sediment size of the Buriganga River ranges over medium to fine size and it contains a significant amount of fine particle. The aver-age moisture content and organic matter content of the sediment sample are 82.26% and 7.12% respectively. A relationship is found between the moisture content and organic matter content. Higher moisture content in the sediment sample shows the higher organic matter content. There is another relationship found in this study, the sites which contain higher organic matter shows higher heavy metal concentration. For example, Station No. 4 and 5 which contain higher organic matter (10.14% and 12.2% respectively) showed higher heavy metal content (Fig-ures 3-6 are the most sediment contamination scenario of Turag river, Dhaka).
4. Assessment of Heavy Metal Contamination
4.1. Assessment According to United States Environmental Protection Agency (USEPA)
Protection Agency (USEPA) The chemical contamina-tions in the sediments were evaluated by comparison
with the sediment quality guideline proposed by USEPA. These criteria are shown in Table 6. Present study shows that all the sites are not polluted for Pb, Moderately Pol-luted for Cu, Cr and Zn while for Cr, sites 3 is Highly polluted. For Cd, all the sites are ranges over not polluted to moderately polluted condition.
4.2. Assessment According to Geo-Accumulation Index (Igeo)
A common criterion to evaluate the heavy metal pollu-tion in sediments is the geo-accumulation index. Geo- accumulation index proposed by Muller [6] to determine metals contamination in sediments, by comparing current concentrations with pre-industrial levels and can be cal-culated using the following formula:
ngeo 2
n
CI log
1.5B
(1)
where, Cn is the concentration of element “n” and Bn is the geochemical background value [In this study, con-sider Bn = world surface rock average given by Martin and Meybeck [7]]. The factor 1.5 is incorporated in the relationship to account for possible variation in back-
Copyright © 2013 SciRes. JWARP

Z. BANU ET AL. 244
Figure 3. Textile wastewater discharge in Turag river.
Figure 4. Industrial wastewater discharge in Turag river.
Figure 5. Pitch black water of Turag river, the west of Tongi Bridge, Dhaka, Bangladesh.
Figure 6. Pitch black water discharges from textile dyeing units in low deep canal that link with Turag river. Table 6. USEPA Guidelines for Sediments (Mg/Kg dry weights).
Metal Not pollutedModerately
polluted Heavily polluted
Present study
Pb <40 40 - 60 >60 28.30
Cd …. … >6 0.00
Cr <25 25 - 75 >75 32.00
Cu <25 25 - 50 >50 46.30
Zn <90 90 - 200 >200 94.60
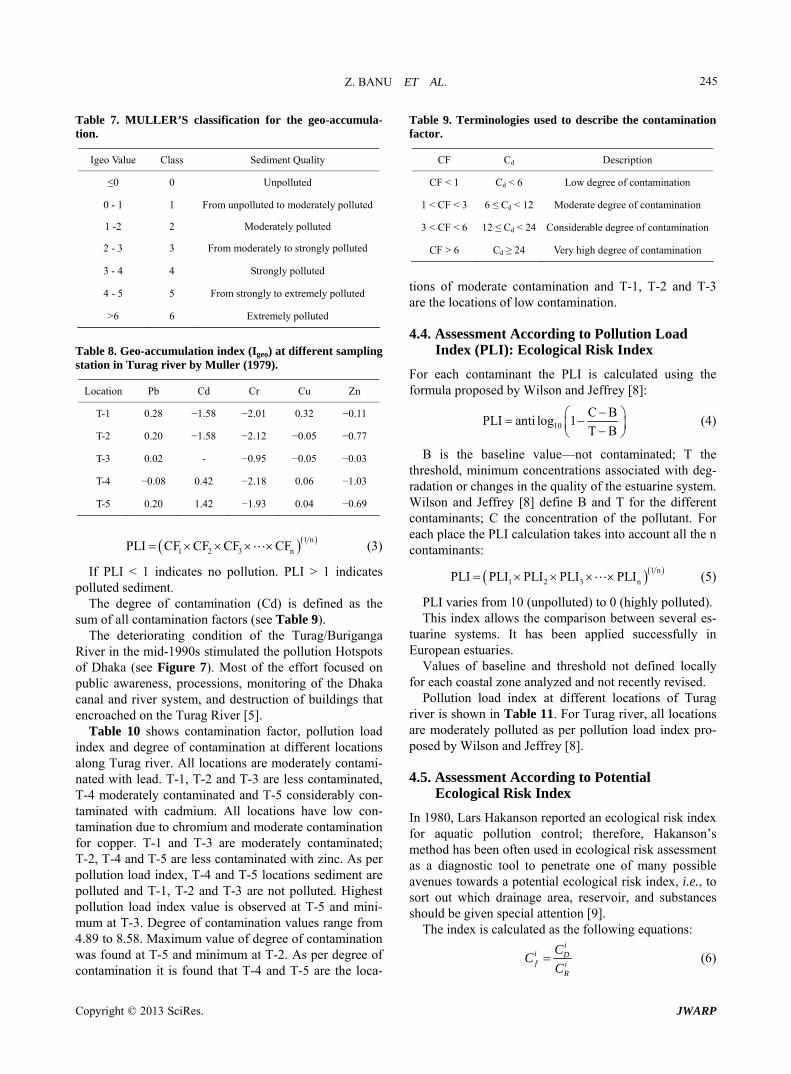
ground data due to lithogenic effect. The geo-accumula- tion index (Igeo) scale consists of seven grades (0 - 6) ranging from unpolluted to highly pollute (shown in Ta-ble 7). According to the Muller scale, the calculated re-sults of Igeo values shown in Table 8.
4.3. Assessment According to Contamination Factor
The contamination factor and degree of contamination are used to determine the contamination status of the sediment in the present study. Contamination factor is calculated according to D. C. Thomilson, D. J. Wilson, C. R. Harris, D. W. Jeffrey [4].
metal
background
CCF
C (2)
In this study world surface rock average proposed by Martin and Meybeck [7] is considered as background concentration.
CF < 1: low contamination factor; 1 ≤ CF < 3: moder-ate contamination factor; 3 = CF < 6: considerable con-tamination factor; CF = 6: very high contamination fac-tor.
Copyright © 2013 SciRes. JWARP
Z. BANU ET AL. 245
Table 7. MULLER’S classification for the geo-accumula- tion.
Igeo Value Class Sediment Quality
≤0 0 Unpolluted
0 - 1 1 From unpolluted to moderately polluted
1 -2 2 Moderately polluted
2 - 3 3 From moderately to strongly polluted
3 - 4 4 Strongly polluted
4 - 5 5 From strongly to extremely polluted
>6 6 Extremely polluted
Table 8. Geo-accumulation index (Igeo) at different sampling station in Turag river by Muller (1979).
Location Pb Cd Cr Cu Zn
T-1 0.28 −1.58 −2.01 0.32 −0.11
T-2 0.20 −1.58 −2.12 −0.05 −0.77
T-3 0.02 - −0.95 −0.05 −0.03
T-4 −0.08 0.42 −2.18 0.06 −1.03
T-5 0.20 1.42 −1.93 0.04 −0.69
1 n
3 nCF 1 2PLI CF CF CF (3)
If PLI < 1 indicates no pollution. PLI > 1 indicates polluted sediment.
The degree of contamination (Cd) is defined as the sum of all contamination factors (see Table 9).
The deteriorating condition of the Turag/Buriganga River in the mid-1990s stimulated the pollution Hotspots of Dhaka (see Figure 7). Most of the effort focused on public awareness, processions, monitoring of the Dhaka canal and river system, and destruction of buildings that encroached on the Turag River [5].
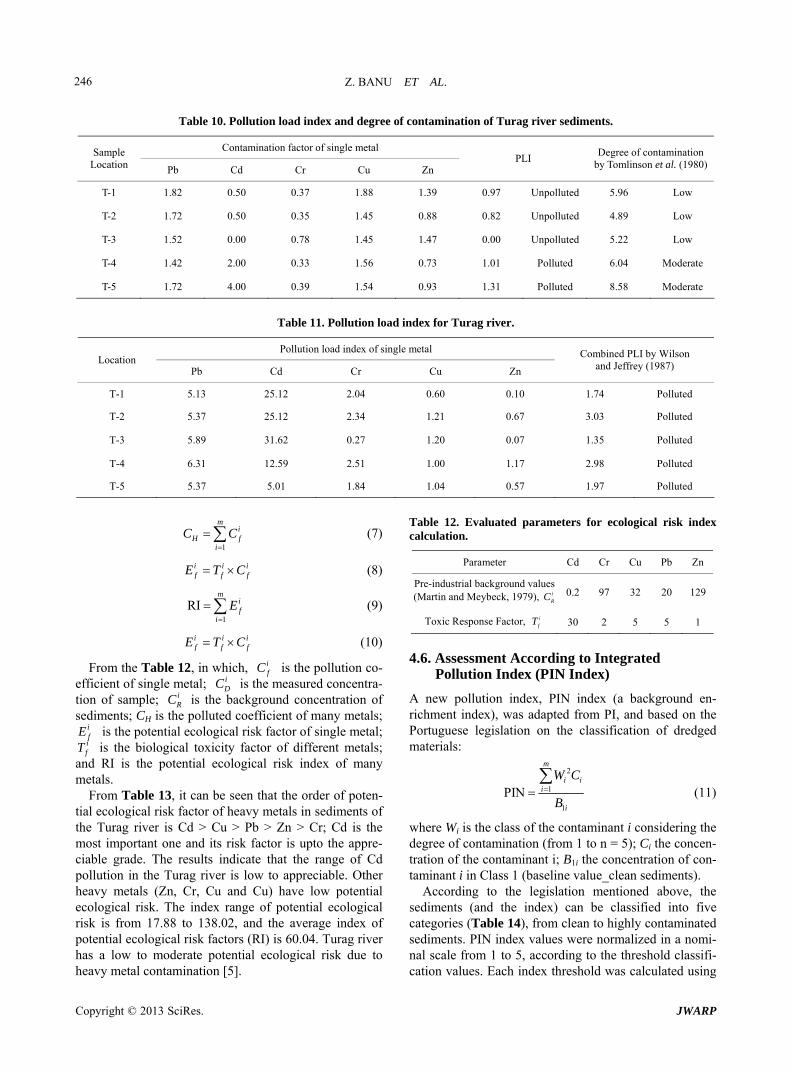
Table 10 shows contamination factor, pollution load index and degree of contamination at different locations along Turag river. All locations are moderately contami-nated with lead. T-1, T-2 and T-3 are less contaminated, T-4 moderately contaminated and T-5 considerably con-taminated with cadmium. All locations have low con-tamination due to chromium and moderate contamination for copper. T-1 and T-3 are moderately contaminated; T-2, T-4 and T-5 are less contaminated with zinc. As per pollution load index, T-4 and T-5 locations sediment are polluted and T-1, T-2 and T-3 are not polluted. Highest pollution load index value is observed at T-5 and mini-mum at T-3. Degree of contamination values range from 4.89 to 8.58. Maximum value of degree of contamination was found at T-5 and minimum at T-2. As per degree of contamination it is found that T-4 and T-5 are the loca-
Table 9. Terminologies used to describe the contamination factor.
CF Cd Description
CF < 1 Cd < 6 Low degree of contamination
1 < CF < 3 6 ≤ Cd < 12 Moderate degree of contamination
3 < CF < 6 12 ≤ Cd < 24 Considerable degree of contamination
CF > 6 Cd ≥ 24 Very high degree of contamination
tions of moderate contamination and T-1, T-2 and T-3 are the locations of low contamination.
4.4. Assessment According to Pollution Load Index (PLI): Ecological Risk Index
For each contaminant the PLI is calculated using the formula proposed by Wilson and Jeffrey [8]:
10
C BPLI anti log 1
T B
(4)
B is the baseline value—not contaminated; T the threshold, minimum concentrations associated with deg-radation or changes in the quality of the estuarine system. Wilson and Jeffrey [8] define B and T for the different contaminants; C the concentration of the pollutant. For each place the PLI calculation takes into account all the n contaminants:
1 n
1 2 3 nPLI PLI PLI PLI PLI (5)
PLI varies from 10 (unpolluted) to 0 (highly polluted). This index allows the comparison between several es-
tuarine systems. It has been applied successfully in European estuaries.
Values of baseline and threshold not defined locally for each coastal zone analyzed and not recently revised.
Pollution load index at different locations of Turag river is shown in Table 11. For Turag river, all locations are moderately polluted as per pollution load index pro-posed by Wilson and Jeffrey [8].
4.5. Assessment According to Potential Ecological Risk Index
In 1980, Lars Hakanson reported an ecological risk index for aquatic pollution control; therefore, Hakanson’s method has been often used in ecological risk assessment as a diagnostic tool to penetrate one of many possible avenues towards a potential ecological risk index, i.e., to sort out which drainage area, reservoir, and substances should be given special attention [9].
The index is calculated as the following equations: i
i Df i
CC
C (6)
R
Copyright © 2013 SciRes. JWARP
Z. BANU ET AL.
Copyright © 2013 SciRes. JWARP
246
Table 10. Pollution load index and degree of contamination of Turag river sediments.
Contamination factor of single metal Sample Location Pb Cd Cr Cu Zn
PLI Degree of contamination
by Tomlinson et al. (1980)
T-1 1.82 0.50 0.37 1.88 1.39 0.97 Unpolluted 5.96 Low
T-2 1.72 0.50 0.35 1.45 0.88 0.82 Unpolluted 4.89 Low
T-3 1.52 0.00 0.78 1.45 1.47 0.00 Unpolluted 5.22 Low
T-4 1.42 2.00 0.33 1.56 0.73 1.01 Polluted 6.04 Moderate
T-5 1.72 4.00 0.39 1.54 0.93 1.31 Polluted 8.58 Moderate
Table 11. Pollution load index for Turag river.
Pollution load index of single metal Location
Pb Cd Cr Cu Zn
Combined PLI by Wilson and Jeffrey (1987)
T-1 5.13 25.12 2.04 0.60 0.10 1.74 Polluted
T-2 5.37 25.12 2.34 1.21 0.67 3.03 Polluted
T-3 5.89 31.62 0.27 1.20 0.07 1.35 Polluted
T-4 6.31 12.59 2.51 1.00 1.17 2.98 Polluted
T-5 5.37 5.01 1.84 1.04 0.57 1.97 Polluted
Table 12. Evaluated parameters for ecological risk index calculation.
1
mi
H fi
C C
i i i
(7)
Parameter Cd Cr Cu Pb Zn
Pre-industrial background values(Martin and Meybeck, 1979),
f f fE T C
1
RIm
i
(8)
i
RC 0.2 97 32 20 129
Toxic Response Factor, f
i
E
i i i
(9) i
fT 30 2 5 5 1
f f fE T C i
(10) 4.6. Assessment According to Integrated
Pollution Index (PIN Index) From the Table 12, in which, fCi
is the pollution co-efficient of single metal; DC is the measured concentra-tion of sample; i
RA new pollution index, PIN index (a background en-richment index), was adapted from PI, and based on the Portuguese legislation on the classification of dredged materials:
C is the background concentration of sediments; CH is the polluted coefficient of many metals;
ifE is the potential ecological risk factor of single metal; ifT is the biological toxicity factor of different metals;
and RI is the potential ecological risk index of many metals.
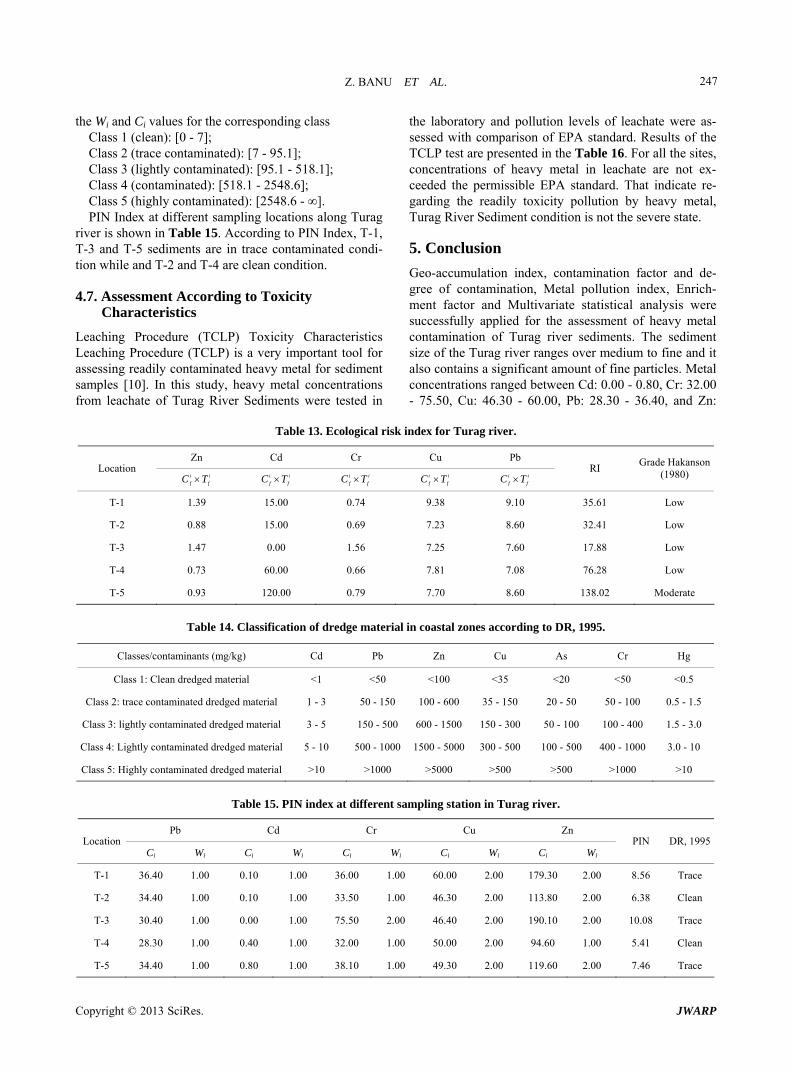
From Table 13, it can be seen that the order of poten-tial ecological risk factor of heavy metals in sediments of the Turag river is Cd > Cu > Pb > Zn > Cr; Cd is the most important one and its risk factor is upto the appre-ciable grade. The results indicate that the range of Cd pollution in the Turag river is low to appreciable. Other heavy metals (Zn, Cr, Cu and Cu) have low potential ecological risk. The index range of potential ecological risk is from 17.88 to 138.02, and the average index of potential ecological risk factors (RI) is 60.04. Turag river has a low to moderate potential ecological risk due to heavy metal contamination [5].
2
1
1
PIN
m
i ii
i
W C
B
(11)
where Wi is the class of the contaminant i considering the degree of contamination (from 1 to n = 5); Ci the concen-tration of the contaminant i; B1i the concentration of con-taminant i in Class 1 (baseline valueclean sediments).
According to the legislation mentioned above, the sediments (and the index) can be classified into five categories (Table 14), from clean to highly contaminated sediments. PIN index values were normalized in a nomi- nal scale from 1 to 5, according to the threshold classifi- cation values. Each index threshold was calculated using
Z. BANU ET AL. 247
the Wi and Ci values for the corresponding class Class 1 (clean): [0 - 7]; Class 2 (trace contaminated): [7 - 95.1]; Class 3 (lightly contaminated): [95.1 - 518.1]; Class 4 (contaminated): [518.1 - 2548.6]; Class 5 (highly contaminated): [2548.6 - ∞]. PIN Index at different sampling locations along Turag
river is shown in Table 15. According to PIN Index, T-1, T-3 and T-5 sediments are in trace contaminated condi-tion while and T-2 and T-4 are clean condition.
4.7. Assessment According to Toxicity Characteristics
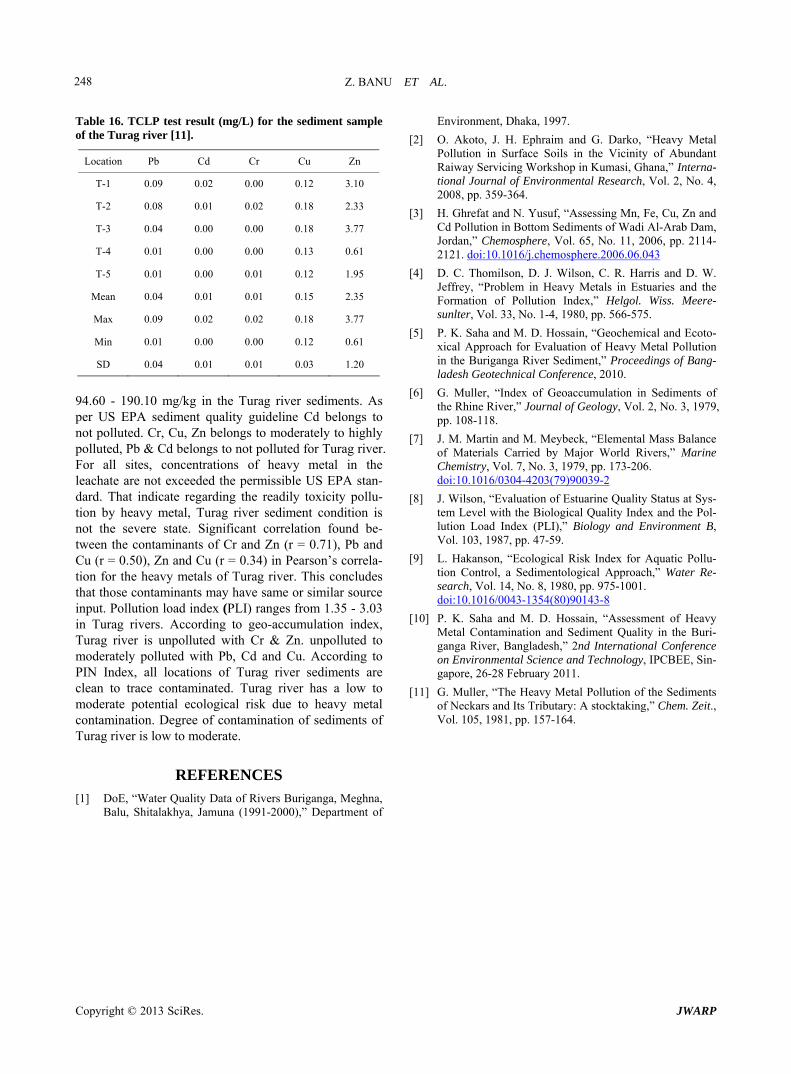
Leaching Procedure (TCLP) Toxicity Characteristics Leaching Procedure (TCLP) is a very important tool for assessing readily contaminated heavy metal for sediment samples [10]. In this study, heavy metal concentrations from leachate of Turag River Sediments were tested in
the laboratory and pollution levels of leachate were as-sessed with comparison of EPA standard. Results of the TCLP test are presented in the Table 16. For all the sites, concentrations of heavy metal in leachate are not ex-ceeded the permissible EPA standard. That indicate re-garding the readily toxicity pollution by heavy metal, Turag River Sediment condition is not the severe state.
5. Conclusion
Geo-accumulation index, contamination factor and de-gree of contamination, Metal pollution index, Enrich-ment factor and Multivariate statistical analysis were successfully applied for the assessment of heavy metal contamination of Turag river sediments. The sediment size of the Turag river ranges over medium to fine and it also contains a significant amount of fine particles. Metal concentrations ranged between Cd: 0.00 - 0.80, Cr: 32.00 - 75.50, Cu: 46.30 - 60.00, Pb: 28.30 - 36.40, and Zn:
Table 13. Ecological risk index for Turag river.
Zn Cd Cr Cu Pb Location
i i
f fC T i i
f fC T i i
f fC T i i
f fC T i i
f fC T RI
Grade Hakanson (1980)
T-1 1.39 15.00 0.74 9.38 9.10 35.61 Low
T-2 0.88 15.00 0.69 7.23 8.60 32.41 Low
T-3 1.47 0.00 1.56 7.25 7.60 17.88 Low
T-4 0.73 60.00 0.66 7.81 7.08 76.28 Low
T-5 0.93 120.00 0.79 7.70 8.60 138.02 Moderate
Table 14. Classification of dredge material in coastal zones according to DR, 1995.
Classes/contaminants (mg/kg) Cd Pb Zn Cu As Cr Hg
Class 1: Clean dredged material <1 <50 <100 <35 <20 <50 <0.5
Class 2: trace contaminated dredged material 1 - 3 50 - 150 100 - 600 35 - 150 20 - 50 50 - 100 0.5 - 1.5
Class 3: lightly contaminated dredged material 3 - 5 150 - 500 600 - 1500 150 - 300 50 - 100 100 - 400 1.5 - 3.0
Class 4: Lightly contaminated dredged material 5 - 10 500 - 1000 1500 - 5000 300 - 500 100 - 500 400 - 1000 3.0 - 10
Class 5: Highly contaminated dredged material >10 >1000 >5000 >500 >500 >1000 >10
Table 15. PIN index at different sampling station in Turag river.
Pb Cd Cr Cu Zn Location
Ci Wi Ci Wi Ci Wi Ci Wi Ci Wi
PIN DR, 1995
T-1 36.40 1.00 0.10 1.00 36.00 1.00 60.00 2.00 179.30 2.00 8.56 Trace
T-2 34.40 1.00 0.10 1.00 33.50 1.00 46.30 2.00 113.80 2.00 6.38 Clean
T-3 30.40 1.00 0.00 1.00 75.50 2.00 46.40 2.00 190.10 2.00 10.08 Trace
T-4 28.30 1.00 0.40 1.00 32.00 1.00 50.00 2.00 94.60 1.00 5.41 Clean
T-5 34.40 1.00 0.80 1.00 38.10 1.00 49.30 2.00 119.60 2.00 7.46 Trace
Copyright © 2013 SciRes. JWARP
Z. BANU ET AL. 248
Table 16. TCLP test result (mg/L) for the sediment sample of the Turag river [11].
Location Pb Cd Cr Cu Zn
T-1 0.09 0.02 0.00 0.12 3.10
T-2 0.08 0.01 0.02 0.18 2.33
T-3 0.04 0.00 0.00 0.18 3.77
T-4 0.01 0.00 0.00 0.13 0.61
T-5 0.01 0.00 0.01 0.12 1.95
Mean 0.04 0.01 0.01 0.15 2.35
Max 0.09 0.02 0.02 0.18 3.77
Min 0.01 0.00 0.00 0.12 0.61
SD 0.04 0.01 0.01 0.03 1.20
94.60 - 190.10 mg/kg in the Turag river sediments. As per US EPA sediment quality guideline Cd belongs to not polluted. Cr, Cu, Zn belongs to moderately to highly polluted, Pb & Cd belongs to not polluted for Turag river. For all sites, concentrations of heavy metal in the leachate are not exceeded the permissible US EPA stan-dard. That indicate regarding the readily toxicity pollu-tion by heavy metal, Turag river sediment condition is not the severe state. Significant correlation found be-tween the contaminants of Cr and Zn (r = 0.71), Pb and Cu (r = 0.50), Zn and Cu (r = 0.34) in Pearson’s correla-tion for the heavy metals of Turag river. This concludes that those contaminants may have same or similar source input. Pollution load index (PLI) ranges from 1.35 - 3.03 in Turag rivers. According to geo-accumulation index, Turag river is unpolluted with Cr & Zn. unpolluted to moderately polluted with Pb, Cd and Cu. According to PIN Index, all locations of Turag river sediments are clean to trace contaminated. Turag river has a low to moderate potential ecological risk due to heavy metal contamination. Degree of contamination of sediments of Turag river is low to moderate.
REFERENCES [1] DoE, “Water Quality Data of Rivers Buriganga, Meghna,
Balu, Shitalakhya, Jamuna (1991-2000),” Department of
Environment, Dhaka, 1997.
[2] O. Akoto, J. H. Ephraim and G. Darko, “Heavy Metal Pollution in Surface Soils in the Vicinity of Abundant Raiway Servicing Workshop in Kumasi, Ghana,” Interna- tional Journal of Environmental Research, Vol. 2, No. 4, 2008, pp. 359-364.
[3] H. Ghrefat and N. Yusuf, “Assessing Mn, Fe, Cu, Zn and Cd Pollution in Bottom Sediments of Wadi Al-Arab Dam, Jordan,” Chemosphere, Vol. 65, No. 11, 2006, pp. 2114- 2121. doi:10.1016/j.chemosphere.2006.06.043
[4] D. C. Thomilson, D. J. Wilson, C. R. Harris and D. W. Jeffrey, “Problem in Heavy Metals in Estuaries and the Formation of Pollution Index,” Helgol. Wiss. Meere-sunlter, Vol. 33, No. 1-4, 1980, pp. 566-575.
[5] P. K. Saha and M. D. Hossain, “Geochemical and Ecoto- xical Approach for Evaluation of Heavy Metal Pollution in the Buriganga River Sediment,” Proceedings of Bang-ladesh Geotechnical Conference, 2010.
[6] G. Muller, “Index of Geoaccumulation in Sediments of the Rhine River,” Journal of Geology, Vol. 2, No. 3, 1979, pp. 108-118.
[7] J. M. Martin and M. Meybeck, “Elemental Mass Balance of Materials Carried by Major World Rivers,” Marine Chemistry, Vol. 7, No. 3, 1979, pp. 173-206. doi:10.1016/0304-4203(79)90039-2
[8] J. Wilson, “Evaluation of Estuarine Quality Status at Sys- tem Level with the Biological Quality Index and the Pol- lution Load Index (PLI),” Biology and Environment B, Vol. 103, 1987, pp. 47-59.
[9] L. Hakanson, “Ecological Risk Index for Aquatic Pollu-tion Control, a Sedimentological Approach,” Water Re- search, Vol. 14, No. 8, 1980, pp. 975-1001. doi:10.1016/0043-1354(80)90143-8
[10] P. K. Saha and M. D. Hossain, “Assessment of Heavy Metal Contamination and Sediment Quality in the Buri- ganga River, Bangladesh,” 2nd International Conference on Environmental Science and Technology, IPCBEE, Sin- gapore, 26-28 February 2011.
[11] G. Muller, “The Heavy Metal Pollution of the Sediments of Neckars and Its Tributary: A stocktaking,” Chem. Zeit., Vol. 105, 1981, pp. 157-164.
Copyright © 2013 SciRes. JWARP