contagion, tipping and navigation in networks networked life mkse 112 fall 2012 prof. michael kearns
TRANSCRIPT
Contagion, Tipping and Navigation in Networks
Networked LifeMKSE 112Fall 2012
Prof. Michael Kearns

Networks: Basic Definitions• A network (or graph) is:
– a collection of individuals or entities, each called a vertex or node– a list of pairs of vertices that are neighbors, representing edges or links
• Examples:– vertices are mathematicians, edges represent coauthorship relationships– vertices are Facebook users, edges represent Facebook friendships– vertices are news articles, edges represent word overlap
• Networks can represent any binary relationship over individuals• Often helpful to visualize networks with a diagram• But to us, the network is the list of edges, not the visualization
– same network has many different visualizations

Networks: Basic Definitions• We will use N to denote the number of vertices in a network• Number of possible edges:
• The degree of a vertex is its number of neighbors
€
N(N −1) /2 ≈ N 2 /2

Networks: Basic Definitions• The distance between two vertices is the length of the shortest
path connecting them• This assumes the network has only a single component or
“piece”• If two vertices are in different components, their distance is
undefined or infinite• The diameter of a network is the average distance between
pairs• It measures how near or far typical individuals are from each
other

Networks: Basic Definitions• So far, we have been discussing undirected networks• Connection relationship is symmetric:
– if vertex u is connected to vertex v, then v is also connected to u– Facebook friendship is symmetric/reciprocal
• Sometimes we’ll want to discuss directed networks– I can follow you on Twitter without you following me– web page A may link to page B, but not vice-versa
• In such cases, directionality matters and edges are annotated by arrows

Illustrating the Concepts
• Example: scientific collaboration– vertices: math and computer science researchers– links: between coauthors on a published paper– Erdos numbers : distance to Paul Erdos– Erdos was definitely a hub or connector; had 507 coauthors– MK’s Erdos number is 3, via Kearns Mansour Alon Erdos– how do we navigate in such networks?
• Example: “real-world” acquaintanceship networks– vertices: people in the world– links: have met in person and know last names– hard to measure– let’s examine the results of our own last-names exercise

# of last names known
# o
f in
div
iduals
average = 28std = 20.6min = 1max = 90
Andre
w L
um
Sandra
Sohn
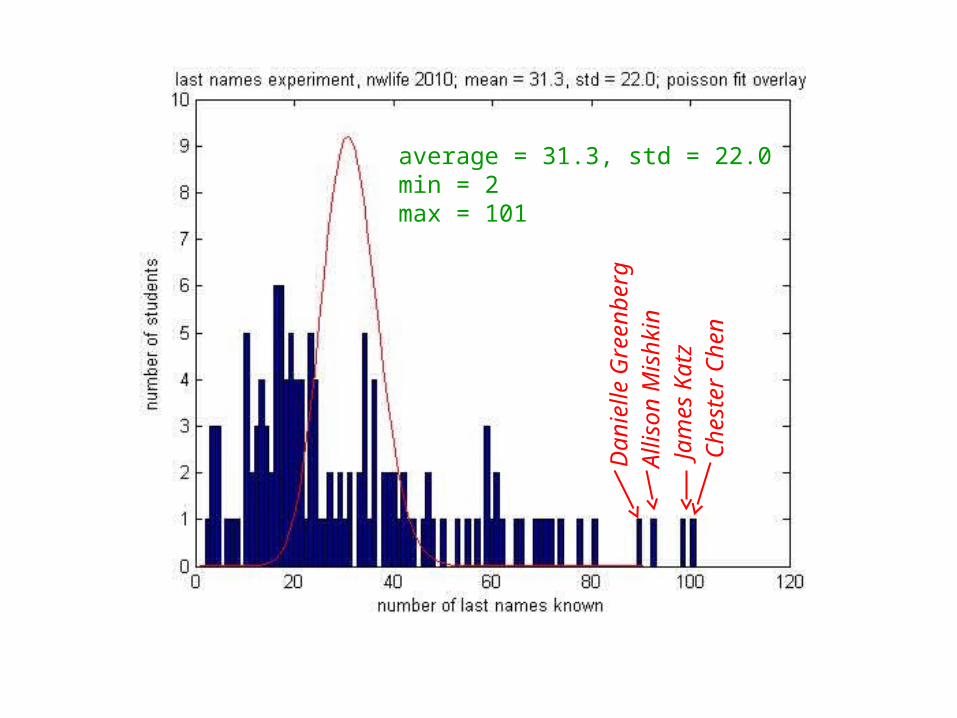
average = 31.3, std = 22.0min = 2max = 101
Chest
er
Chen
Danie
lle G
reenberg
Alli
son M
ishki
nJa
mes
Katz

# o
f in
div
iduals
# of last names known
average = 26.6min = 2max = 114
Jaso
n C
hou
Gaoxia
ng H
u

# of last names known
# o
f in
div
iduals
average = 30.7min = 0max = 113
Geoff
rey K
iderm
an
Nech
em
ya K
agedan

Structure, Dynamics, and Formation

Network Structure (Statics)• Emphasize purely structural properties
– size, diameter, connectivity, degree distribution, etc.– may examine statistics across many networks– will also use the term topology to refer to structure
• Structure can reveal:– community– “important” vertices, centrality, etc.– robustness and vulnerabilities– can also impose constraints on dynamics
• Less emphasis on what actually occurs on network– web pages are linked… but people surf the web– buyers and sellers exchange goods and cash– friends are connected… but have specific interactions

Network Dynamics• Emphasis on what happens on networks• Examples:
– mapping spread of disease in a social network– mapping spread of a fad– computation in the brain– spread of wealth in an economic network
• Statics and dynamics often closely linked– rate of disease spread (dynamic) depends critically on network
connectivity (static)– distribution of wealth depends on network topology
• Gladwell emphasizes dynamics– but often dynamics of transmission– what about dynamics involving deliberation, rationality, etc.?

Network Formation• Why does a particular structure emerge?• Plausible processes for network formation?• Generally interested in processes that are
– decentralized– distributed– limited to local communication and interaction– “organic” and growing– consistent with (some) measurement
• The Internet versus traditional telephony
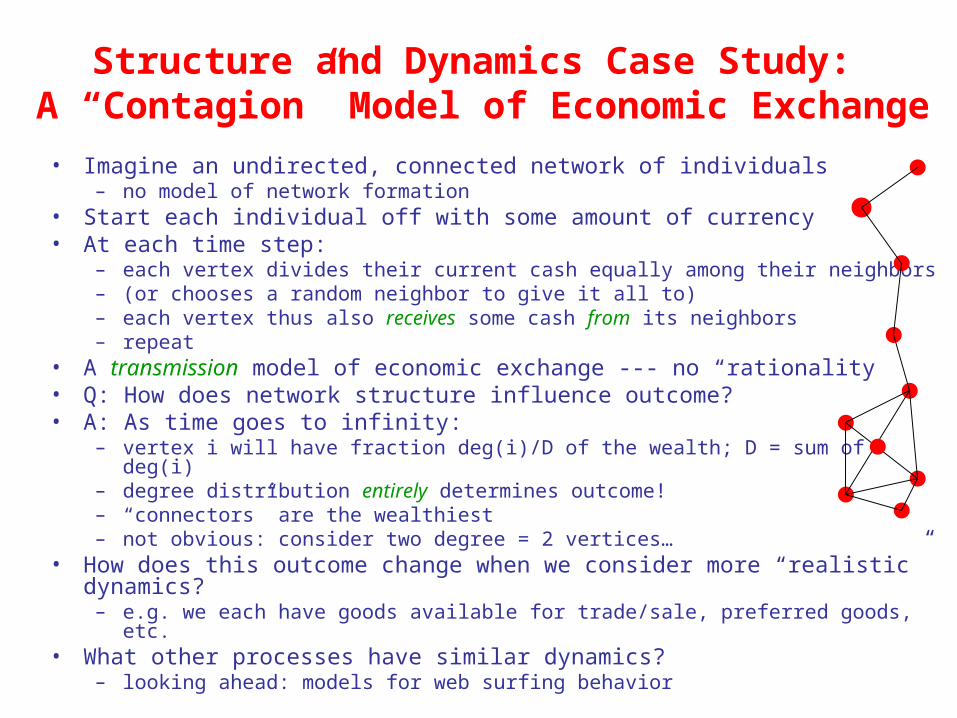
Structure and Dynamics Case Study: A “Contagion” Model of Economic
Exchange• Imagine an undirected, connected network of individuals
– no model of network formation• Start each individual off with some amount of currency• At each time step:
– each vertex divides their current cash equally among their neighbors– (or chooses a random neighbor to give it all to)– each vertex thus also receives some cash from its neighbors– repeat
• A transmission model of economic exchange --- no “rationality”• Q: How does network structure influence outcome?• A: As time goes to infinity:
– vertex i will have fraction deg(i)/D of the wealth; D = sum of deg(i)– degree distribution entirely determines outcome!– “connectors” are the wealthiest– not obvious: consider two degree = 2 vertices…
• How does this outcome change when we consider more “realistic” dynamics?– e.g. we each have goods available for trade/sale, preferred goods, etc.
• What other processes have similar dynamics?– looking ahead: models for web surfing behavior

Gladwell, page 7:
“The Tipping Point is the biography of the idea… that the best way to understand the emergence of fashion trends, the ebb and flow of crime waves, or the rise in teen smoking… is to think of them as epidemics. Ideas and products and messages and behaviors spread just like viruses do…”
…on networks.

Gladwell Tipping Examples
• Hush Puppies:– almost dead in 1994; > 10x sales increase by ’96– no advertising or marketing budget– claim: “viral” fashion spread from NY teens to designers– must be certain connectivity and individuals
• NYC Crime:– 1992: > 2K murders; < 770 five years later– standard socio-economic explanations:
• police performance, decline of crack, improved economy, aging…
– but these all changed incrementally – alternative: small forces provoked anti-crime “virus”
• Technology tipping: fax machines, email, cell phones
• “Tipping” origins: 1970’s “white flight”

Key Characteristics of Tipping(according to Gladwell)
• Contagion:– “viral” spread of disease, ideas, knowledge, etc.– spread is determined by network structure– network structure will influence outcomes
• who gets “infected”, infection rate, number infected
• Amplification of the incremental:– small changes can have large, dramatic effects
• network topology, infectiousness, individual behavior
• Sudden, not gradual change:– phase transitions and non-linear phenomena
• How can we formalize some of these ideas?

size of police force
crim
e r
ate
linear
size of police force
crim
e r
ate
linear
size of police force
crim
e r
ate
size of police force
crim
e r
ate
nonlinear, gradual decay nonlinear, tipping
Rates of Growth and Decay

Gladwell’s Three Sources of Tipping
• The Law of the Few (Messengers):– Connectors, Mavens and Salesman– Hubs and Authorities
• The Stickiness Factor (Message):– The “infectiousness” of the “message” itself– Still largely treated as a crude property of transmission
• The Power of Context:– global influences affecting messenger behavior

“Epidemos”• Forest fire simulation:
– grid of forest and vacant cells– fire always spreads to adjacent four cells
• “perfect” stickiness or infectiousness– connectivity parameter:
• probability of forest– fire will spread to all of connected component of source– tip when forest ~ 0.6– clean mathematical formalization (e.g. fraction burned)
• Viral spread simulation:– population on a grid network, each with four neighbors– stickiness parameter:
• probability of passing disease– connectivity parameter:
• probability of rewiring local connections to random long-distance– no long distance connections: tip at stickiness ~ 0.3– at rewiring = 0.5, often tip at stickiness ~ 0.2

“Mathematizing” the Forest Fire
• Start with a regular 2-dimensional grid network– this represents a complete forest
• Delete each vertex (and its edges) with probability p (independently)– this represents random “clear-cutting” or natural fire breaks
• Choose a random remaining vertex v– this is my campsite
• Q: What is the expected size of v’s connected component?– this is how much of the forest is going to burn

“Mathematizing” the Epidemic• Start with a regular 2-dimensional grid network
– this represents a dense population with “local” connections (neighbors)• Rewire each edge with probability p to a random destination
– this represents “long-distance” connections (chance meetings)• Choose a random remaining vertex v
– this is an infection; spreads probabilistically to each of v’s neighbors• Fraction killed more complex:
– depends on both size and structure of v’s connected component• Important theme:
– mixing regular, local structure with random, long-distance connections
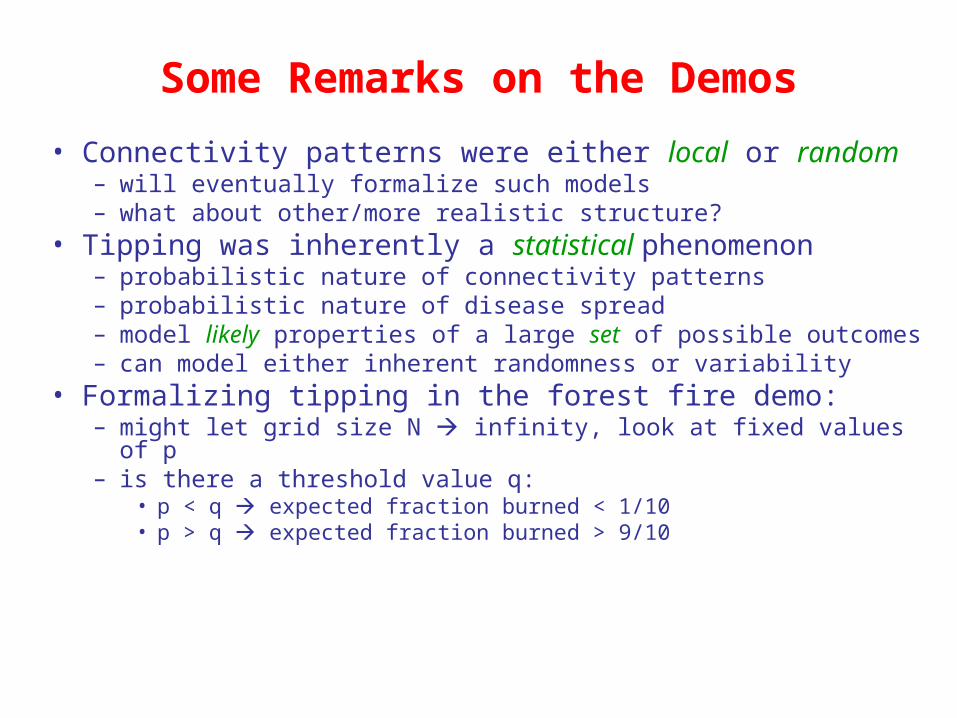
Some Remarks on the Demos
• Connectivity patterns were either local or random– will eventually formalize such models– what about other/more realistic structure?
• Tipping was inherently a statistical phenomenon– probabilistic nature of connectivity patterns– probabilistic nature of disease spread– model likely properties of a large set of possible outcomes– can model either inherent randomness or variability
• Formalizing tipping in the forest fire demo:– might let grid size N infinity, look at fixed values of p– is there a threshold value q:
• p < q expected fraction burned < 1/10• p > q expected fraction burned > 9/10

Small Worlds and the Law of the Few
• Gladwell’s “Law of the Few”:– a “small” number of “highly” connected vertices ( heavy tails)– inordinate importance for global connectivity ( small diameter)
• Travers & Milgram 1969: classic early social network study– destination: a Boston stockbroker; lived in Sharon, MA– sources: Nebraska stockowners; Nebraska and Boston “randoms”– forward letter to a first-name acquaintance “closer” to target– target information provided:
• name, address, occupation, firm, college, wife’s name and hometown• navigational value?
• Basic findings:– 64 of 296 chains reached the target– average length of completed chains: 5.2
• interaction of chain length and navigational difficulties– main approach routes: home (6.1) and work (4.6)– Boston sources (4.4) faster than Nebraska (5.5)– no advantage for Nebraska stockowners

The Connectors to the Target
• T & M found that many of the completed chains passed through a very small number of penultimate individuals– Mr. G, Sharon merchant: 16/64 chains– Mr. D and Mr. P: 10 and 5 chains
• Connectors are individuals with extremely high degree– why should connectors exist?– how common are they?– how do they get that way? (see Gladwell for anecdotes)
• Connectors can be viewed as the “hubs” of social traffic• Note: no reason target must be a connector for small worlds• Two ways of getting small worlds (low diameter):
– truly random connection pattern dense network– a small number of well-placed connectors in a sparse network

Small Worlds: A Modern Experiment
• The Columbia Small Worlds Project:– considerably larger subject pool, uses email– subject of Dodds et al. assigned paper
• Basic methodology:– 18 targets from 13 countries– on-line registration of initial participants, all tracking electronic– 99K registered, 24K initiated chains, 384 reached targets
• Some findings:– < 5% of messages through any penultimate individual– large “friend degree” rarely (< 10%) cited– Dodds et al: no evidence of connectors!
• (but could be that connectors are not cited for this reason…)– interesting analysis of reasons for forwarding– interesting analysis of navigation method vs. chain length

The Strength of Weak Ties• Not all links are of equal importance• Granovetter 1974: study of job searches
– 56% found current job via a personal connection– of these, 16.7% saw their contact “often”– the rest saw their contact “occasionally” or “rarely”
• Your “closest” contacts might not be the most useful– similar backgrounds and experience– they may not know much more than you do– connectors derive power from a large fraction of weak ties
• Further evidence in Dodds et al. paper• T&M, Granovetter, Gladwell: multiple “spaces” & “distances”
– geographic, professional, social, recreational, political,…– we can reason about general principles without precise
measurement

The Magic Number 150
• Social channel capacity– correlation between neocortex
size and group size– Dunbar’s equation: neocortex ratio
group size• Clear implications for many kinds
of social networks• Again, a topological constraint on
typical degree• From primates to military units to
Gore-Tex

A Mathematical Digression
• If there’s a “Magic Number 150” (degree bound)…• …and we want networks with small diameter…• … then there may be constraints on the mere existence of certain NWs
– let be the largest degree allowed• why? e.g. because there is a limit to how many friends you can have
– suppose we are interested in NWs with (worst-case) diameter D (or less)• why? because many have claimed that D is often small
– let N(D) = size of the largest possible NW obeying and D• Exact form of N(,D) is notoriously elusive
– but known that it is between (/2)^D and 2^D• So, for example, if N ~ 300M (U.S. population):
– to be certain NW exists, solve N < (/2)^D – if < 150 (e.g. see Gladwell): D > 4.5– if D < 6 (e.g. see Travers & Milgram): > 52– so these literatures are consistent… (whew!)
• More generally: multiple structural properties may be competing