consumers’ willingness to pay using an · pdf fileconsumers’ willingness to pay...
TRANSCRIPT

CONSUMERS’ WILLINGNESS TO PAY USING AN EXPERIMENTAL
AUCTION METHODOLOGY: APPLICATIONS TO BRAND EQUITY
By
YAN-MING LI
A thesis submitted in partial fulfillment of
the requirements for the degree of
MASTER OF ARTS IN APPAREL, MERCHANDISING, AND TEXTILES
WASHINGTON STATE UNIVERSITY Department of Apparel, Merchandising, Design, and Textiles
MAY 2011

ii
To the Faculty of Washington State University:
The members of the Committee appointed to examine the thesis of YAN-MING LI find it satisfactory and recommend that it be accepted.
_____________________________________ Joan L. Ellis, Ph.D., Chair
_____________________________________ Yoo Jin Kwon, Ph.D.
_____________________________________ Vicki A. McCracken, Ph.D.

iii
ACKNOWLEDGEMENTS
I would like to thank Dr. Joan Ellis for her constant guidance and support throughout
the two years of my graduate life. Without her mentoring, I would have never been able
to finish my thesis on time. Her expertise on willingness to pay is what gave me the
inspiration to write this thesis, without her, this thesis would not have been possible. I
have gained so much from working with Dr. Ellis, from being a student in her class to
being her Teaching Assistant. There are no words to explain the gratitude I have for her
to help me become the person I am today.
I would also like to thank the two members of my committee, Dr. Yoo Jin Kwon and
Dr. Vicki McCracken. Dr. Kwon I must thank for her great comments during my
proposal defense, as well as, the knowledge I gained from her consumer behavior class.
Dr. McCracken I thank for the opportunity to work on Nate’s research, which helped me
so much when it came to data collection. I would also like to thank her for the time and
knowledge she gave during my data analysis.
Without the support of my family to pursue a master’s degree, I would not have the
courage to keep going. My parents have always believed in me no matter what I decide to
do, and I thank them so much for that. I thank my sister, who have always cooked for me
and made sure I ate when I am too busy with my thesis. Living with her for two years
have brought us so much closer together, and I am so grateful to have this great
relationship. I would like to thank all my friends in Pullman who have supported me,
watched me complain, and be my stress reliever. I truly appreciate to have all of them in
my life.

iv
Last but not least, I have to thank my boyfriend, who has watched me grow from an
undergraduate to a graduate student. He always knew how to make me smile no matter
what the circumstance is. I would like to also thank him for financially supporting my
thesis. I could have not been able to purchase all those t-shirts without his generous
donation from Panda Express. I am so grateful to have such a caring and loving person in
my life. With him, everything is possible.

v
CONSUMERS’ WILLINGNESS TO PAY USING AN EXPERIMENTAL
AUCTION METHODOLOGY: APPLICATIONS TO BRAND EQUITY
Abstract
by Yan-Ming Li, M.A. Washington State University
May 2011
Chair: Joan L. Ellis
Research has established a relationship between willingness to pay to price premium
and brand equity, however, most studies used stated preference data, which are
hypothetical situations. Studies using experimental auction methodology to elicit revealed
preferences in branded apparel products have been minimal.
The purpose of the study was to determine the relationship between brand equity
and consumers’ willingness to pay (WTP) a price premium for branded apparel products
using revealed preference methodology. In order to determine the relationship, the
Becker-Degroot-Marshack (BDM) experimental auction mechanism was used with the
endow-and-upgrade approach followed with a survey. The survey includes ten
multidimensional brand equity questions adopted from Yoo and Donthu (2001) brand
equity scale, demographics, previous brand experiences, importance of apparel product
attributes, and beliefs about brands. The experiment resulted in one hundred and three
complete observations. Brand equity was analyzed using a composite score on the
multidimensional brand equity measurement (Yoo and Donthu, 2001), WTP a price

vi
premium was analyzed using descriptive statistics, and Tobit regression analysis was
used to analyze the relationship between brand equity to WTP a price premium.
Findings indicated that the overall brand equity score, perceived quality, and a
belief that there are more choices in branded merchandise positively significantly
influenced WTP a price premium. The higher the brand equity, perceived quality, and
belief that there are more choices in branded merchandise the higher WTP a price
premium. Therefore, marketing efforts need to be placed on building brand equity,
improving perceived quality of brands, emphasizing brand names, visual merchandising,
and assortment planning to increase price premiums.
Further, the importance of apparel product attributes and the belief about brands
influence on consumers’ WTP a price premium using revealed preference methodologies
should be explored. In addition, investigate whether consumers make purchase decisions
based on other variables, such as sustainability, labeling, culture, or the economy, that
may be of greater effect to consumers’ WTP a price premium than brand equity using
revealed preference methodologies.

vii
TABLE OF CONTENTS
Page
ACKNOWLEDGEMENTS ………………………………………………………… iii
ABSTRACT ……… …………………………………………………………....... v -vi
LIST OF TABLES …………………..………………………………………………….. ix
LIST OF FIGURES …………….……………………………………………………….. x CHAPTER
1. INTRODUCTION ……………………………………………………….... ..................... 1
Objectives ……………………………………………………………………………….. 3
Limitations ………………………………………………………………......................... 3
Definition of Terms …………………………………………………….......……............. 3
2. REVIEW OF LITERATURE ……………………………………………... ……............. 5
The Brand Equity Model …………………………………………………………........... 5
Dimensions of Brand Equity ………………………………………………………8
Brand Associations ……………………………………………………… 9
Brand Loyalty ……………………………………………………………10
Perceived Quality ………………………………………………......……11
Reliability and Validity of the BE Model …………………………............... ……12
Willingness to Pay (WTP) ………………………………………… ……………………14
Price Premiums and Brands………………………………………... ……………………15
Willingness to Pay a Price Premium in Brands …………………………………… ……16
Assessing WTP Methods ………………………………………………….……………. 18
3. METHODOLOGY …………………………………………………………………….. 20

viii
Conceptual Framework ……………………………………………………………. …... 20
Economic Value Theory …………………………………………….................. 20
Revealed vs. Stated WTP ………………………………………………………. 20
Experimental Auctions ……………………………………………………......... 21
BDM Experimental Auction Method and Survey ………………………… ...… 22
Data Collection Method …………………………………………………………… …... 24
Experimental Auction (BDM) Bidding Procedure ………………………... …... 25
Data Analysis ……………………………………………………………………… …... 27
4. RESULTS …………………………………………………………………………… 28
Sample ……………………………………………………………………………. 28
Brand Equity Score ……………………………………………………………….. …... 30
Willingness to Pay a Price Premium Distribution ………………………………... …... 31
Relationship between Brand Equity and WTP a Price Premium …………………. …... 33
Model 1 ……………………………………………………………………. …... 34
Model 2 ………………………………………………………………………… 35
Model 3 ……………………………………………………………………. …... 36
Model 4 ……………………………………………………………………. ….. 37
Discussion ………………………………………………………………………… …... 38
5. CONCLUSIONS ………………………………………………………………………. 42
Recommendations for Future Research …………………………………………… …... 45
REFERENCES ………………………………………………………………………… 46
APPENDIX
A. IRB A pproval ……… …………………………………………………… 52
B. Survey …………………………………………………………………….. 55
C. Bid Sheet ……………………………………………………...................... 61

ix
LIST OF TABLES
1. Multidimensional BE Questions ………………………………………............... 24
2. Demographic Characteristics of Participants …………………………………… 29
3. WTP Price Premium and BE Frequencies for Hanes and FOL ………………… 30
4. BE Score Frequencies for Hanes ……………………………………………….. 31
5. B E S cores F requencies f or FOL ……………………………………………… 31
6. WTP Price Premium Frequencies for Hanes …………………………………… 32
7. WTP Price Premium Frequencies for FOL …………………………………… 33
8. WTP Price Premium to Hanes BE score and other variables ………………… 35
9. WTP Price Premium to FOL BE score and other variables …………………….. 36
10. WTP Price Premium to Hanes BE Dimensions and other variables ………… 37
11. WTP Price Premium to FOL BE Dimensions and other variables ……………. 38

x
LIST OF FIGURES
1. Figure 1; The Brand Equity Model …………………………………………………… 8
2. F igure 2; B idding P rocess M odel ………… ………………………………………. 26

1
CHAPTER ONE
INTRODUCTION
Brands are important to both consumers and producers of products. Keller (1998)
notes that brands offer consumers value through product attributes and consistent
performance; brands also identify the manufacturer of a product, creating accountability
and earning trust of customers. A brand helps signal to consumers the level of quality
inherent in a product (Keller, 1998). Furthermore, consumers perceive branded products
as being more reliable, and higher quality (Schroeder, 2003).
Brand equity is defined as the incremental value added to a product by its brand
name (Aaker, 1991). Brand equity is also considered to be the difference in consumer
choice between a branded product and an unbranded product given the same level of
product features (Yoo, Donthu, and Lee, 2000). Existing literature has found that brand
equity affects future profits and long-term cash flow (Srivastava and Shocker, 1991),
merger and acquisition decision making (Mahajan, Rao, and Srivastava, 1994), stock
price (Simon and Sullivan, 1993), sustainable competitive advantage (Bharadwaj,
Varadarajan, and Fahy, 1993), and marketing success (Ambler, 1997). Almost every
marketing activity works, successfully or unsuccessfully, to build, manage, and develop
brand equity (Aaker, 1991; Keller, 1993; Yoo, Donthu, and Lee, 2000).
Therefore, brand equity can be used to describe both the value of the brand and the
brand’s component values. The values may be a monetary value or an increase in a rate
of return. Strong brands command price premiums over the competition and these can
isolate brand equity as the extra revenue achievable in a market compared to competitors
(Fueller and Hippel, 2008). Price premium reflects the brand’s ability to command a

2
higher price than its competitors and is considered important for all types of brands,
despite actual price position within a category (Sethuramen, 2003; Agarwal and Rao,
1996). However, research that identifies and attempts to explain the relationship between
brand equity and price premiums that consumers are willing to pay for apparel products
focused primarily on stated preference data collection methods, which are known to
exhibit poor validity (Auger, Burke, Devinney, and Louviere, 2003) with stated WTP
estimates typically over-estimating true WTP values (Millock, 2002). Research using
experimental auction methodology to elicit revealed preferences, has been minimal.
The purpose of this study is to determine the relationship between brand equity and
consumers’ willingness to pay (WTP) a price premium for branded apparel products
using revealed preference methodology. Brand equity will be measured using Yoo and
Donthu’s (2001) brand equity scale in apparel products and WTP will be elicited using
the Becker-DeGroot-Marschak (BDM) method (Becker, Degroot, and Marschak, 1964).
Research has established a relationship between willingness to pay to price premium and
brand equity, however, most studies use stated preference data, which are hypothetical
situations. The methodology in this study provides revealed preference data using actual
consumer decisions to indicate consumer preferences for goods in a field setting, rather
than in a controlled lab setting. This creates higher reliability and validity to the data, as
well as, eliminating biases (Lusk and Shogren, 2007).
The contribution of this study to the field of textile and apparel merchandising will
be an increased understanding of the relationship between price premium and brand
equity of apparel products, enabling merchandisers and marketers make more effective
strategic marketing decisions that enhance profitability.

3
Objectives:
1. Determine consumers perceived brand equity of branded apparel products.
2. Identify consumers WTP for branded apparel products.
3. Determine the relationship between brand equity to price premiums.
Limitations:
Limitations for t his s tudy were the s ample, t he c hosen b rands, and t he c hosen
product, which was due to t ime and money constraints. Participants in the sample were
from t he nor thwestern part of t he U nited S tates. T herefore, f indings f rom t his s tudy
cannot be generalizable beyond this region. Another l imitation were the brands chosen,
Hanes and Fruit of the Loom. Other b rands may have di fferent WTP and brand equity
scores. In addition, t-shirts was the chosen product used in the study. Other products may
produce different results.
Definition of Terms:
Willingness to pay: the highest amount a consumer is willing to pay for a product at that
point in time (Netemeyer, Krishman, Pullig, Wang, Yagci, Dean, Ricks, and Wirth, 2004).
Price premium: the difference between willingness to pay for brand and non-branded
products give the same level of product features (Sethuramen, 2003).
Brand equity: the difference in consumer choice between the branded product and an
unbranded product given the same level of product features (Yoo et al, 2000).
Multidimensional brand equity: subcategories brand equity concept consisting of
perceived quality, brand loyalty, and brand awareness with strong brand associations
(Yoo et al, 2000).

4
Brand associations/awareness: anything linked in memory to a brand, usually in some
meaningful way (Aaker, 1991).
Brand loyalty: a deeply held commitment to repurchase a preferred product consistently
in the future, despite other influences and marketing efforts that would cause switching
behavior (Oliver, 1997).
Perceived quality: the customer's judgment of the overall excellence, esteem, or
superiority of a brand relative to alternative brands (Netemeyer et al, 2004).

5
CHAPTER TWO
REVIEW OF LITERATURE
This review of literature provides a foundation for the study of how brand equity
relates to consumers’ WTP a price premium for apparel products based on an existing
brand equity scale developed by Yoo and Donthu (2001). The review of literature
includes the development of brand equity model; the dimensions of brand equity in
relation to apparel products; the application of the brand equity model; existing research
on WTP in general and in apparel products; and existing research on WTP a price
premium for brands.
The Brand Equity Model
Aaker’s (1991) brand equity model proposes that brand equity creates value for
both the customer and the firm; value for the customer enhances value for the firm; and
brand equity consists of multiple dimensions. Aaker (1991, 1996) and Keller (1993, 1998)
proposed that brand creates value for both the consumer and the firm and provides value
to the firm by generating value for the consumers. Therefore, brand equity is found to be
the incremental value added to a product by its brand name.
Aaker’s model of brand equity has four dimensions: brand loyalty, brand
awareness, perceived quality, and brand association. How the brand performs on these
dimensions is what leads consumers to develop an overall, intangible rating of brand
equity. This equity then provides value to the customer and the firm. The model by Aaker
(1991) was one of the first influential works in the field of brand equity.

6
Keller (1993) furthered Aaker’s research by looking at customer based brand
equity from a consumer psychology perspective and defining it as the differential effect
of brand knowledge on consumer response to the marketing of the brand. Keller
emphasized two constructs: brand awareness and brand image and adopted two basic
approaches: direct and indirect, to measuring customer based brand equity. The indirect
approach attempted to identify potential sources of customer based brand equity (CBBE)
distribution channels, the effectiveness of marketing communications, the success of
brand by measuring brand awareness, and the characteristics and relationships among
brand associations. The direct approach focused on consumer responses to different
elements of the firm’s marketing program (Keller, 1993). The four elements of the
marketing mix are product, place, promotion, and price. Product is the good or service
sold to satisfy a customer’s needs. Place involves all of the decisions required to make the
product or service available in the target market or to customers. Promotion is the process
of informing the target market of the product. Lastly, price setting includes components
such as analysis of price setting by the competition as well as analysis regarding
acceptance or rejection of prices by the target market (Keller 1993). According to Keller,
a brand can have a positive or negative CBBE when consumers react more or less
favorably to an element of the marketing mix for the brand than they do to the same
marketing mix elements for other brands.
Based primarily on Aaker’s (1991) conceptualizations of brand equity, Yoo and
Donthu (2001) proposed a multidimensional consumer based brand equity model and
tested the model using cross-cultural data. The authors adopted Aaker’s brand equity
dimensions, which were composed of brand loyalty, perceived quality, and brand

7
awareness/associations. Yoo, Donthu, and Lee (2000) developed a scale utilizing 22
items for assessment: five on brand loyalty, four on brand awareness, seven on perceived
quality, and six on brand associations. For brand loyalty, five specific items were
developed by Yoo et al (2000) to capture the attitudinal effect of being loyal to a brand.
For brand awareness, the authors defined this as brand recognition, and used four brand
recognition measures (Keller 1993). The authors measured consumers’ subjective
judgment of a brand’s overall excellence as perceived quality following Zeithaml (1988)
and employed seven items from Dodds, Monroe, and Grewal (1991). For brand
associations, the authors used six new items based on Keller’s (1993) work to measure
both the quantity and quality of information processing.
Yoo et al (2000) found the relationships of perceived quality (β = .10, t-value = 2.72)
and brand associations (β = .07, t-value = 2.06) to brand equity were much weaker than
the relationship of brand loyalty to brand equity (β = .69, t-value = 15.46). However, the
intercorrelations between brand loyalty and perceived quality and between brand loyalty
and brand associations were significant. Therefore, Yoo et al (2000) suggested that
perceived quality and brand associations might affect brand equity by influencing brand
loyalty first.
Yoo et al (2000) extended Aaker’s model in two ways (see Figure 1). First, the
authors placed brand equity as a separate construct between the dimensions of brand
equity and the value for the customer and the firm. They determined that brand equity is
the value of a brand name, which can be high or low. By placing a separate brand equity
construct within the model researchers could better understand how the dimensions of
quality, brand loyalty, and brand associations contribute to brand equity. Second, the

8
researchers added marketing elements as antecedents of brand equity, assuming that they
had a significant effect on the dimensions of brand equity. Yoo’s et al (2000) structural
model of brand equity consisted of three components: overall brand equity, brand equity
dimensions, and marketing mix elements. Marketing elements, adopted from Keller
(1993), are related to the dimensions of brand equity, that is, perceived quality, brand
loyalty, and brand associations combined with brand awareness, and these dimensions are
then related to brand equity.
Dimensions of Brand Equity
Different dimensions of brand equity appear in different frameworks. Aaker (1991,
1996) separates the brand equity in four dimensions: loyalty, awareness, perceived
quality, and associations. Keller (1993) discusses brand equity in terms of awareness and

9
image. Yoo, et al (2000, 2001) developed a multidimensional brand equity scale drawn
from Aaker's and Keller's conceptualizations of brand equity. Yoo, et al (2000) propose a
conceptual framework in which the four marketing mix elements (product, place,
promotion, price) are related to the dimensions of brand equity, which are perceived
quality, brand loyalty, and brand associations combined with brand awareness.
Brand Associations
Brand associations are information linked to the brand in memory and contain the
meaning of the brand for consumers (Yoo et al, 2000). The strength of an association
depends on the consumer processing information. Therefore, a strong association is an
important feature of the brand and implies a strong link in the consumer's mind. Brand
associations are important when it comes to determining brand equity (Keller, 1993;
Aaker, 1996; Netemeyer, et al., 2004). Agarwal and Rao (1996) and Yoo, et al., (2000)
found that brand associations have a positive influence on consumer choice, their
intention to purchase, their stated WTP a price premium for the brand, and
recommending the brand to others.
Brand associations that result in high brand awareness are positively related to brand
equity because they can be a signal of quality and commitment (Yoo et al, 2000). Brand
awareness with strong associations forms a specific brand image in the mind of
consumers. Brand awareness is reflected in the consumer’s ability to identify the brand
under different circumstances and is considered to be of particular importance in low
involvement product categories, such as food (Keller, 1993).

10
Brand Loyalty
Aaker (1991) defines brand loyalty as a situation which reflects how likely a
customer will be to switch to another brand, especially when that brand makes a change,
in either in price or product features. Jensen and Drozdenko (2008) examined the price
premium brand loyal customers would be willing to pay in order to remain loyal. A
sample of 385 consumers was asked price expectations and brand preferences for ten
different product categories. Products included: cereal, deodorant, HDTV, MP3, shirt,
shoes, tires, toothpaste, vitamins, and watch. Findings indicate that 57-86% of non-loyal
brand customers would buy the least expensive brand whose name they recognized,
whereas brand loyal customers would pay an average of 15-37% more. Findings,
however, differed by product category with HDTV’s acquiring just a 9-19% price
premium, while shirts and blouses showed the highest of 22-53% price premium. These
findings suggest that recognizable brand names are able to attract more buyers than lower
priced unknown brands, even among bargain shoppers.
Kalyanaram and Little (1994) found that brand loyal customers have a wider range of
acceptable prices. The authors analyzed scanner data from a consumer goods corporation
for sweetened and unsweetened drink categories with four brands each. They found that
brand loyal customers may have an internal reference price, and they judge other brands
from that reference price. Rauyruen, Miller, and Groth (2009) analyzed data obtained
using online and paper and pencil survey for a sample of 294 Australian small to medium
sized enterprises. Their results indicated that willingness to pay a price premium is
mainly driven by loyalty and suggested that price premium can be a very effective
measure of loyalty.

11
Perceived Quality
Perceived quality is considered a primary part of brand equity and has been
associated with the WTP a price premium, with brand purchase intent, and with brand
choice (Netemeyer, Krishman, Pullig, Wang, Yagci, Dean, Ricks, and Wirth, 2004). The
authors found internal validity among six product categories (colas, pastes, jeans, shoes,
coffee, fast food chain) over 16 different brands (Coke, Pepsi, RC, Crest, Colgate, Close-
up, Levi’s, Lee, Wrangler, Nike, Reebok, Fila, Community coffee, McDonald, Wendy,
Burger King). The findings also suggested perceived quality was a potential direct
antecedent of the willingness to pay a price premium for a brand, and that willingness to
pay a price premium is a potential direct antecedent of brand purchase behavior.
Rao and Monroe (1989) analyzed previous research, which experimentally
investigated the influence of price, brand name, and store name on buyer’s evaluations of
product quality. A set of 36 studies that collectively reported 85 effects of price, brand
name, and store name on perceptions of quality was used in the analysis. Results
indicated that for consumer products, the relationships between price and perceived
quality and between brand name and perceived quality are positive and statistically
significant. Consumers who feel higher quality brands are in general higher priced will be
more likely to pay higher price premiums.
Sethuramen and Cole (1999) sent out questionnaires to a sample of 350 randomly
selected households from a medium sized Midwest metropolitan area, and twenty
categories were selected from a list of top 100 dollar volume grocery products. The
authors found that perceived quality accounts for about 12% of the variation in price

12
premiums across consumers and product categories and is also the most important
variable influencing pricing premiums.
Reliability and Validity of the BE Model
Yoo and Donthu’s (2001) four-item measurement of brand equity is a measure of
overall brand equity based on Aaker’s (1991) definition of brand equity, which is the
incremental value added to a product given the brand name. The authors compared
national brand names from three product categories (shoes, film, color television sets) to
non branded merchandise but with identical product characteristics such as physical
attributes, quality, and price. Yoo and Donthu (2001) pointed out that the difference in
consumer response between the brand names from the three product categories and the no
name brands could be interpreted as the brand equity of the brand name.
Yoo and Donthu (2001) developed two distinct brand equity scales: overall brand
equity and multidimensional brand equity. The authors selected three product categories
(shoes, film, color television sets) and surveyed 12 brands (Adidas, Asics, LA Gear, Nike,
Puma, Reebok, Agfa, Fuji, Kodak, Konica, Samsung, Sony). The brands represent very
different combinations of market factors such as price, quality, market share, brand and
corporate reputation, marketing strategies, and country of origin. Three methods
(Cronbach’s reliability, exploratory factor analysis, and confirmatory factor analysis)
were used to select and assess the final items that would be used for the scale.
Yoo and Donthu (2001) administered questionnaires to a sample of 650 Korean
participants in South Korea and 350 Korean American and 650 American participants.
The authors used a set of 10 items to measure the multidimensional brand equity scale.
The dimensions were significant at p < 0.0001. The Cronbach’s alpha reliability

13
coefficient of brand equity for brand loyalty was 0.60 for Americans, 0.56 for Korean
Americans, and 0.69 for Koreans; 0.84, 0.95, and 0.53 for perceived quality; and 0.59,
0.43, and 0.46 for brand awareness/associations.
The overall brand equity scale was reduced using factor analysis to a final set of four
items from an initial pool of 18 overall brand equity indicators. The reliability of the
overall brand equity scale was 0.90, 0.89, and 0.90 for Americans, Korean Americans,
and Koreans, respectively. This scale was developed primarily to evaluate the convergent
validity of the multidimensional brand equity scale. According to Yoo and Donthu (2001),
the correlation between the overall brand equity and the multidimensional brand equity
index was 0.60, 0.63, and 0.59 (p < 0.0001) for Americans, Korean Americans, and
Koreans, respectively. This high correlation supports the convergent validity of the
multidimensional brand equity.
Washburn and Plank (2002) conducted an independent assessment of the Yoo and
Donthu scale. The authors found the correlations between the overall brand equity model
and the multidimensional brand equity model to be .661, .675, and .684. These
correlations are very consistent to what Yoo and Donthu (2001) found. Washburn and
Plank (2002) view Yoo and Donthu’s (2001) scale as a valued initial step in developing a
recognized tool for measuring consumer-based brand equity.
Atilgan, Aksoy, and Akinci (2005) explored the generalizability of the brand equity
measurement devised by Yoo et al (2000), by retesting the brand equity dimensions. The
authors investigated the causal relationships between the dimensions of brand equity and
brand equity itself, and specifically measured the way in which consumers’ perceptions
of the dimensions of brand equity affected the overall brand equity evaluations. The study

14
found that brand loyalty is the most influential dimension of brand equity. Weak support
is found for the brand awareness and perceived quality dimensions.
Yu, Zhao, and Wang (2008) stated that Yoo and Donthu’s (2001) brand equity scale
suggests a good direction to develop a measure model of customer based brand equity. In
addition, Yoo and Donthu’s (2001) study was conducted using samples from developed
markets such as United States and Korea, and that studies using samples from other
cultures are needed to develop a more broad scale of brand equity. However, the authors
pointed out the flaw of Yoo and Donthu brand equity scale is that the theoretical
foundation was limited mainly to Aaker’s conceptualizations of brand equity, which
includes brand loyalty, brand awareness, perceived quality, and brand associations. The
authors indicated the brand equity model Yoo and Donthu proposed is not a strong
measurement of what causes brand equity to occur, which focuses more on consumer
behavior studies (Yu et al, 2008). The flaw does not affect the usage of the brand equity
scale in this study.
Therefore, Yoo and Donthu (2001) brand equity scale will be used to determine
consumers’ brand equity in this study.
Research Question 1: What are consumers perceived brand equity of branded apparel
products?
Willingness to Pay
A person’s willingness to pay (WTP) for a product is an indication of the dollar
value they attach to the product at that point in time (Werternbroch and Skiera, 2002).
The WTP for one more unit is therefore a dollar measure of the benefits the extra unit
gives them. Recent research on WTP has focused primarily on organic food products.

15
Wang (2007) found that consumers with stronger positive attitudes towards organic food
perceive higher values in organic food and believe organic food should be more
expensive. They also tend to be less price sensitive and willing to pay an extra 5%-30%
for different organic products. Yue, Alfnes, and Jensen (2009) investigated how cosmetic
damage affects consumers’ WTP for apples. They found that 75% of the participants are
willing to pay more for organic than for conventional apples given identical appearance.
However, Bernard and Bernard (2009) found that the WTP for price premiums on rBST-
free and no antibiotics versions of milk were not statistically different than the organic
premium.
Little research has been conducted on apparel products and consumer’s willingness
to pay. Studies that have been done on apparel products are in relation to organic fibers or
environmentally friendly products. Casadesus-Masanell, Crooke, Reinhardt, and Vasishth
(2009) found that consumers are willing to pay more, $6.58 more, for flannel shirts made
of organic cotton than for flannel shirts made of conventional cotton. Hustvedt and
Bernard (2008) also found that consumers are willing to pay a price premium for socks
that are labeled organic. However, minimal research has been done on brand versus non-
brand apparel products.
Research Question 2: Are consumers willing to pay a price premium for branded apparel
products and if so, what is that price premium?
Price Premiums and Brands
There is an abundance of theoretical literature suggesting that WTP a price premium
is related to brand equity and its dimensions. Price premium is considered to be the most
useful measure of brand equity (Sethuramen and Cole, 1999). Each dimension of the
16
brand equity has an impact on the price consumers are willing to pay for the brand (Aaker,
1996; Sethuramen and Cole, 1999). Price premium reflects the brands ability to
command a higher price than its competitors and is considered important for all types of
brands, despite actual price position within a category (Sethuramen, 2003; Agarwal and
Rao, 1996). Sethuramen (2003) found that brand equity is a main component of
consumers’ willingness to pay a premium for national brands relative to store brands. The
study show that nearly 80% of the premium that consumers would pay for national
brands over store brands can be attributed to brand equity.
Other research has shown that for categories where consumers believe there is a high
correlation between price and quality, consumers stated they would be willing to pay a
higher premium for national brands. Sethuraman and Cole (1999) and Sethuramen (2003)
found that since consumers generally believe that national brands, products sold in
department stores or products of non-local origin are of better quality, they would be
more willing to pay higher prices for national rather than store branded products. The
authors surveyed consumers for their perceptions of price and quality of national and
store brands across 20 product categories. They show that a perceived quality differential
increased the ability of national brands to receive price premiums over store brands.
Willingness to Pay a Price Premium in Brands
Brand equity comes from the trust that consumers place in a brand than they do in its
competitors. This trust translates into consumers’ loyalty and their WTP a price premium
for the brand (Blackston, 1995). Netemeyer et al (2004) created a model indicating that
perceived quality or perceived value for the cost are direct antecedents of the WTP a

17
price premium for a brand. In addition, the authors added that WTP a price premium
directly affects brand purchase behavior.
Ding, Ross, and Rao (2010) proposed a model that builds on classic utility theory,
improved with two well documented behavioral regularities, which are: consumers infer
quality information from a product’s price and consumers have a reference price for a
given product. How customers perceive brands and what motivates them to pay price
premium is an important theme in research on brand equity.
Hustvedt and Bernard (2010) examined changes in consumer willingness to pay for
apparel products as labor related information and brand were added. They found that by
adding brand information, WTP is significantly increased for two better-known brands.
Participants were asked to rank the brands based on familiarity, while brand 1 and brand
2 were better known national brands, brand 3 was significantly less familiar, only 22% of
consumer had heard of the brand, compared with brand1, 67% familiarity, and brand 2,
98% familiarity. The brand name significantly impacted WTP with brand 1 and brand 2
both receiving significantly higher bids. The significantly lower WTP for brand 3 was
likely related to its lower familiarity ranking. This suggested a much wider WTP range
for the brand with some participants offering only relatively small premiums and others
with relatively large premiums.
Brand premiums are very significant sources of revenue increase. In a detailed study
of one community, research found that community brands can gain very powerful
positive associations within community memberships, and that many members are
willing to pay considerable premiums for products bearing the community brand (Fueller,
2008). For grocery products across 20 product categories, national brands on average

18
achieve a price premium of 35% compared to private label brands (Sethuraman and Cole
1999). In the luxury segment, top brands achieve price premiums between 20-200% over
normal brands in the segment (Coyler 2005). Existing literature indicates that brands in
general are related to consumers’ willingness to pay a price premium, regardless of its
brand status.
Hypothesis 1: Consumers with higher levels of brand equity, for a particular brand, will
be willing to pay a higher price premium.
Assessing WTP Methods
Past literature measuring WTP used stated preference data. In stated preference
methods, participants either do not take real possession of the goods or do not use their
own money, which creates a bias (Lusk and Shogren, 2007). This study used an
experimental auction methodology in a field setting, which avoids the stated WTP bias by
producing revealed preference data that uses actual consumer decisions in a real market
setting.
A well-known incentive compatible auction method is the BDM procedure
introduced by the authors Becker, Degroot, and Marshak (Becker et al, 1964), which was
used in this study. The BDM procedure was tested by a number of researchers for its
ability to measure WTP (Breidert, 2006; Lusk, Fox, Shroeder, Mintert, and Koohmaraie,
2001; Didier and Lucie, 2008). Lusk et al (2001) elicited individuals WTP using the
BDM mechanism for steak tenderness in a grocery store setting. They indicated that the
BDM method provides incentives for participants to accurately represent their
preferences. In another study, Didier and Lucie (2008) used the BDM mechanism to
measure consumers’ WTP for organic and Fair Trade products in a lab setting. The

19
authors indicated that by using an experimental method, it creates a context close to a real
buying situation and ensures subjects would act in the laboratory as they would act in
reality, reducing social desirability bias (Didier and Lucie, 2008).
Wertenbroch and Skiera (2002) tested it together with a Vickrey auction in a field
experiment with a purchase obligation for the participants. The participants easily
understood the BDM method and few of the individuals approached refused to participate.
Validity was determined by linking the estimated WTP to data from an additional
questionnaire asking the participants to rate their desire towards the tested products. After
the experiment the participants rated how satisfied they were their purchase. The buyers
as well as the non-buyers were extremely satisfied with the outcome of the BDM
experiment. This result indicated that BDM does not experience the overbidding bias,
which is found in some Vickery auctions (Wertenbroch and Skiera 2002), and the BDM
procedure motivates subjects to reveal their preference honestly for a given product
through their WTP (Didier and Lucie, 2008; Lusk et al, 2001) Research using
experimental auctions for estimating products’ WTP is rather limited in branded apparel
products. However, experimental auction methodology can deliver useful information for
understanding consumers’ behavior response to different prices (Breidert, 2006).

20
CHAPTER THREE
METHODOLOGY
The relationship between brand equity and consumers’ willingness to pay a price
premium for branded apparel products using revealed preference methodology is
evaluated in this study. This chapter describes the conceptual framework, the data
collection method, and the data analysis.
Conceptual Framework
Economic Value Theory
Economic value is one of many possible ways to define and measure value.
Measures of economic value are based on what people want, which reflect their
preferences. Therefore, the theory of economic value is based on individual preferences
and choices. People express their preferences through the choices and tradeoffs that they
make, given certain constraints, such as income or available time (Lusk and Shogren,
2007).
Economic value is measured by the maximum amount someone is willing to give
up in other goods and services in order to obtain another good or service (Lusk and
Shogren, 2007). In a market economy, dollars are a universally accepted measure of
economic value, and the number of dollars that a person is willing to pay for something
tells how much of all other goods and services they are willing to give up to get that item.
This is referred to as “willingness to pay” (Lusk and Shogren, 2007).
Revealed vs. Stated WTP
Researchers have developed many value elicitation methods to tease out how people
value various goods and services (Loureiro, McCluskey, and Mittelhammer, 2003). These
21
methods can be broadly categorized as revealed or stated preference methods. Revealed
preference research uses actual consumer decisions to indicate consumer preferences for
goods in both market and non-market contexts. Stated preference methods ask people
questions that are intended to elicit their preferences for a good without requiring that the
consumer act accordingly (Loureiro et al, 2003). Stated preference is commonly
criticized because of the hypothetical nature of the questions, and the fact that actual
behavior is not observed (Loureiro et al, 2003). Researchers do not use hypothetical
situations often because in some cases they result in the measurement of perceived or
potential behavior, rather than real behavior (Loureiro et al, 2003).
Cummings, Harrison, and Rutstrom (1995) conducted three economic experiments
comparing real purchasing behavior for private goods with dichotomous choice questions.
They found that the proportion of choice “yes” responses exceeds the proportion of actual
purchases. Huang, Haab, and Whitehead (1997) concluded that one limitation of stated
preference data is that behavioral intentions are not actual behavior, while observable
behavior is needed to reveal and measure actual economic value.
Neill, Cummings, Ganderton, Harrison, and McGuckin (1994) and Loomis, Brown,
Lucero, and Peterson (1996) reject the equality hypothesis of revealed and stated WTP.
Both studies found that hypothetical statements of WTP are greater than real payments
(revealed) of WTP for market goods. Therefore, stated WTP is not considered a reliable
or valid indication of true WTP of a good for a consumer.
Experimental Auctions
Experimental auctions provide researchers an opportunity to elicit revealed WTP for
consumer products. An experimental auction is a tool that can be used to elicit a

22
participant’s private willingness to pay values in a truthful manner (Lusk and Shogren,
2007). Willingness to pay is determined by having participants bid for a product or
certain attributes, using real money at the time of the auction as opposed to a hypothetical
situation that is simply presented in a survey (Lusk and Shogren, 2007). Experimental
auctions use real money and real goods to create a market situation where people’s
attention is focused on the determined value. Each person submits a bid that, in theory, is
equal to his or her value for the good. This provides an effective way to determine a
consumer’s true willingness to pay (WTP). Experimental auctions avoid the problem of
stated WTP estimation because they involve individuals exchanging real money for real
goods in an active market (Lusk and Shogren, 2007). Therefore, an experimental auction
will be used to determine a consumer’s WTP a price premium for branded apparel
products.
BDM Experimental Auction Method and Survey
The Becker-Degroot-Marshack (BDM) Experimental Auction mechanism (Becker et
al, 1964) was used in this study with the endow-and-upgrade approach to determine the
participants WTP. The BDM auction is not a typical auction where participants bid
against one another, rather, subjects participate in the auction individually. In the BDM
auction procedures for this study, participants were endowed with a generic non-branded
t-shirt and asked whether they wished to upgrade to a branded t-shirt, Hanes or Fruit of
the Loom. If participants wished to upgrade, they were asked to indicate or bid the
maximum additional amount they were willing to pay to obtain that branded t-shirt. This
was repeated twice, once for each brand. Participants were informed that only one of the
two products would be randomly determined as the binding product in the auction. A

23
random price premium generator was used to create values for the participants to bid
against. Values created were between $1 to $5 in dollar increments. If the participant’s
bid was higher than the randomly generated price premium, they ‘won’ the auction and
paid that premium to upgrade to that branded product. The participant did not pay the
most they were willing to pay, instead they paid the lower randomly drawn price
premium. This procedure ensured that the auction was incentive compatible. In other
words, the participant had the incentive to reveal their true WTP. If the participant bid
more than their true WTP they may have had to purchase the good at a price higher than
they were actually willing to pay. If the participant bid less than their true WTP, they may
have miss out on purchasing the product that was of value to them.
The BDM mechanism has been proven useful for eliciting values in field settings,
where the experiment took place. Location of the experiment was conducted at the
Student Recreational Center and the Compton Union Building at Washington State
University. According to Lusk and Shogren (2007), there are three reasons why
conducting the auction in a field setting rather than in a laboratory setting is better. First,
subjects self-select into the market, therefore, sample selection biases are of less concern
as the population of interest is directly intercepted. Second, in a field setting, subjects are
able to bring all their acquired knowledge to perform the task at hand. And third, many
times, field experiments provide interesting tests of the effect of market experience on
behavior. Consequently, experimental auctions conducted in the field could have results
that have higher external validity. Results from the auction would be more applicable to
the real world because participants actually act like real consumers. Since BDM auctions
may be conducted in the field, it is possible to target the population of interest.

24
The goal of this research is to determine the relationship between brand equity and
consumers’ WTP a price premium for branded t-shirts. A brand equity scale developed
by Yoo, Donthu, and Lee (2001) was used to measure brand equity. Brand equity was
measured with a multidimensional brand equity scale, which includes perceived quality,
brand loyalty, and brand awareness with strong brand associations (see Table 1). In
addition, questions about demographics, previous branded athletic t-shirt experience, the
importance of apparel attributes, and their beliefs about brands were included as well.
Data Collection Method
Data collection consisted of an experimental auction with a follow up survey. A
consumer intercept model was used to recruit participants in the Student Recreational
Center and the Compton Union Building at Washington State University. Participants
were endowed with a non-branded t-shirt and then asked if they wish to upgrade to two

25
different branded alternatives, Hanes and Fruit of the Loom (FOL). T-shirts were the
chosen product because they are inexpensive, unisex, and familiar (Hustevedt and
Bernard, 2008). The two brands were chosen because of their high status and familiarity
among consumers. According to Retailing Today (2010), both Hanes and Fruit of the
Loom ranked within the top 5 brands in women’s, men’s, and children’s apparel.
Experimental Auction (BDM) Bidding Procedure
Step 1: Participants were recruited near the entrance of the Student Recreational Center
and the Compton Union Building. Participants were informed that we are researchers
from Washington State University conducting an in field consumer study, and that
participants were compensated with a $5.00 gift card for 10-15 minutes of their time.
Step 2: Participants were provided with oral and written instructions on the BDM
mechanism. Researchers explained to the participants that they have the opportunity to
bid on two distinct brands of t-shirts, if they wish to.
Step 3: Participants were endowed with a generic t-shirt, in which they are free to keep
and take. Participants were then shown two different branded t-shirts, identical in every
visible way except brand to the generic t-shirt they have in their possession, and ask if
they would be willing to upgrade to the branded t-shirts.
Step 4: Participants were informed that only one of the two product bids was to be
binding and that product was randomly determined.
Step 5: If participants wished to upgrade, they were asked to submit a bid for how much
more they are WTP for each of the branded t-shirts.

26
Step 6: If the participant’s bid for the binding branded t-shirt exceeded the value of the
randomly drawn price premium for that branded t-shirt, they exchanged their generic t-
shirt for this binding branded t-shirt and paid the randomly drawn price premium.
Step 7: Participants were then asked to complete a survey.
Following is a flow chart that explains the bidding process (see Figure 2)
Figure 2
Bidding Process
Endowment
Don’t Upgrade
Upgrade
No Obligation Random Determination of Binding Product
Bid
Bid < Random Drawn Price
Bid ≥ Random Drawn Price
No Buying Obligation Buying Obligation

27
Data Analysis
The first research question, “What are consumers perceived brand equity of branded
apparel products?” was analyzed using a composite score on the multidimensional brand
equity measure (Yoo et al, 2000), which was the sum of all the brand equity scores
gathered in the survey.
The second research question, “Are consumers willing to pay a price premium for
branded apparel products and if so, what is that price premium?” was analyzed using
descriptive statistics. With descriptive statistics, the data provided a summary of the price
premiums participants were willing to pay for branded apparel products.
For hypothesis 1, “Consumers with higher levels of brand equity, for a particular
brand, will be willing to pay a higher price premium,” a Tobit regression analysis was
used to analyze the data and quantify the relationship between brand equity to willingness
to pay a price premium.

28
CHAPTER FOUR
RESULTS
The purpose of this study was to determine the relationship between brand equity and
consumers’ willingness to pay a price premium for branded apparel products using
revealed preference methodology. A consumer intercept model was used to recruit
participants for an experimental auction followed with a survey. Data was collected at
Washington State University. Chapter four will review the findings, answer the research
questions, and relate the findings to existing research. Sample demographic
characteristics, brand equity scores and WTP frequencies, and WTP predictive models
will be included.
Sample
Experimental results and surveys were collected from 100 participants. Data were
collected in two days at the Student Recreational Center and the Compton Union
Building on campus. Demographic information collected included gender, age, education,
race, and income. Participants also indicated their previous experience with branded t-
shirts by answering if they had bought branded athletic t-shirts, bought Hanes or Fruit of
the Loom (FOL), and own branded athletic t-shirts (see Table 2). The samples are ranged
between 18 and 46 and above years of age, with 86 percent aged 18-24. Gender was
evenly distributed between female (51%) and male (49%). Majority of participants are
currently enrolled in college (77%) with 63 percent White/Caucasian. Household income
of participants ranged from 30 percent making less than $20,000 to 24 percent making
between $60,000-$80,000. When participants were asked whether they had bought

29
branded athletic t-shirts, Hanes or FOL, or own branded athletic t-shirts, statistics show a
majority responded yes to all three questions.

30
Brand Equity Score
Participants completed a 5-point Likert scale (1=Strongly disagree, 5=Strongly agree)
for assessing brand equity. A no opinion option was scored as 0. The numerical values of
responses were averaged to create a composite score indicating the brand equity (BE)
score for Hanes and FOL (see Table 3). Yoo and Donthu (2001) indicated that a
composite score based on the average is an acceptable proxy for multidimensional brand
equity. The average was adjusted for participants who indicated a no opinion option,
which was considered as incomplete. For example, there are 10 multidimensional brand
equity questions, so if a participant answered one of those questions as no opinion, the
average would be out of 9. Frequency distribution of the BE scores are shown on Table 4
and 5. Participants (56%) indicated their BE score for Hanes was between 3.1 and 4 with
a mean score of 3.4. Similar to Hanes, 58 percent of participants FOL BE scores ranged
from 3.1 to 4 with a mean score of 3.5.
The results answer the first research question, “What are consumers perceived brand
equity of branded apparel products?” Consumers’ perceived brand equity of branded
apparel products on a scale of 1-5, Hanes and FOL BE scores were 3.4 and 3.5 indicating
a moderate BE score for both brands. This indicates that participants in the sample have a
moderate positive value added to the Hanes and FOL brands.

31
Willingness to Pay a Price Premium Distribution
The BDM method with an endow and upgrade approach was used to elicit the
participant’s WTP. Participants were asked to bid how much more they are willing to pay
to upgrade to a Hanes or FOL t-shirt from a generic non-branded t-shirt. Table 3 shows
the mean price premium participants indicated they were WTP for a Hanes t-shirt at
$2.44 and for a FOL t-shirt was $2.69. The minimum amount for both brands was $0, and
the maximum amount was $15. Frequency distribution describing participants’ price
premiums is shown in Table 6 and Table 7. For Hanes, 29 percent of the sample was not
willing to pay more to upgrade from a generic non-branded t-shirt. As for FOL, 28

32
percent was not willing to pay more to upgrade. A majority of the participants were
willing to upgrade to either a Hanes or FOL t-shirt. For Hanes, bids ranged between $1-
$1.99 (13%), $2-$2.99 (13%), $3-$3.99 (16%), and $5-$5.99 (12%). As for FOL, bids
also ranged between $1-$1.99 (7%), $2-$2.99 (23%), $3-$3.99 (15%), and $5-$5.99
(12%).
The result answers the second research question, “Are consumers willing to pay a
price premium for branded apparel products and if so, what is that price premium?”
Consumers are willing to pay a price premium for branded apparel products, and their
average price premium was $2.44 for Hanes and $2.69 for FOL.

33
Relationship between brand equity and willingness to pay a price premium
A Tobit regression analysis was used to analyze the relationship between WTP
and the BE score and BE dimensions separately (refer to Table 1 for BE dimensions).
Bids of zero were observed in 30 percent of the observations for WTP a price premium
for branded t-shirts. The Tobit technique accounted for this low bid (i.e. zero) censoring.
In the survey that followed the experiment, participants were asked to indicate their
previous branded athletic t-shirt experience, the importance of apparel attributes, and
their beliefs about brand. The importance of apparel attributes include importance of
price, appearance of quality, touch/feel of textile, fit, variety/choice, fiber content,
country of origin, and brand. Their beliefs about brands include “branded is better quality
than non-branded”, “more fashionable than non-branded”, “fits better than non-branded”,
and “more choices than non-branded”.

34
Total of four models were created to assess the relationship between brand equity
and willingness to pay a price premium. Two models regressed the price premium of
Hanes and FOL to BE scores, demographics, previous brand experience, product
attributes, and beliefs about brands. Another two models regressed the price premium of
Hanes and FOL to BE dimensions, demographics, previous brand experience, product
attributes, and beliefs about brand. Independent variables with a high level of
insignificance to WTP a price premium were eliminated systematically, resulting in
models with significant predictors of WTP. In addition, as race was coded as a
categorical variable with 8 levels, dummy variables were created for each race category
that took the value 0 or 1 to indicate the presence of a categorical effect.
Model 1
WTP a price premium for Hanes was regressed on the overall Hanes BE score,
demographics, previous brand experience, importance of product attributes, and beliefs
about brands. The BE Hanes score was a significant predictor of WTP a price premium
(p = 0.011) (see Table 8). This indicates that consumers who place a higher equity on
Hanes brand t-shirts are willing to pay for the t-shirt. In addition, other variables were
significant predictors of a participant’s WTP a price premium for a Hanes t-shirt.
Importance of the brand (p = 0.037) and a belief that there are more choices in brands (p
= 0.008) were positively related to WTP a price premium. Consumers who place more
importance on a brand and believe that there are more choices in branded apparel are
willing to pay more. Importance of the feel of textile (p = 0.044) was found to be
negatively related to WTP a price premium. Consumers who were willing to pay more
for a Hanes t-shirt placed a lower level of importance on the feel of textile. Pseudo R-

35
square was .062 indicating that the model was able to account for 6% of the variability in
a participant’s WTP.
Model 2
WTP a price premium for FOL was regressed on the overall FOL BE score,
demographics, previous brand experience, importance of product attributes, and beliefs
about brands. The BE FOL score was a significant predictor of WTP a price premium
(p = 0.032) (see Table 9). This indicates that consumers who place a higher equity on
FOL brand t-shirts are willing to pay more for the t-shirt. In addition, other variables
were significant predictors of a participant’s WTP a price premium for a FOL t-shirt.
Owning a branded athletic t-shirts (p = 0.051) and the belief that there are more choices
in brands (p = 0.000) were positively related to WTP a price premium. Consumers who
own a branded athletic t-shirts and believe that there are more choices in branded apparel
are willing to pay more. Participant’s previous purchase of branded athletic t-shirts (p =
0.042) was found to be negatively related to WTP a price premium. Consumers who were
willing to pay a price premium for FOL had not necessarily had previous experience
purchasing branded t-shirts. Pseudo R-square was .064 indicating that the model was able
to account for 6% of the variability in a participant’s WTP.

36
Model 3
WTP a price premium for Hanes was regressed on the ten BE dimensions
questions (refer to Table 1 for BE dimensions), demographics, previous brand experience,
importance of product attributes, and beliefs about brands. The model indicated that
perceived quality (p = 0.014) and level of brand recognition (p = 0.007) were positively
related to WTP a price premium (see Table 10). Participants who felt that Hanes brand t-
shirts were high quality and felt they could easily recognize the brand among competing
brands were willing to pay a higher price premium. In addition, other variables were
significant predictors of a participant’s WTP a price premium for a Hanes t-shirt.
Importance of the brand (p = 0.018) and a belief that there are more choices in brands
(p = 0.011) were positively related to WTP a price premium. Consumers who place more
importance on a brand and believe that there are more choices in branded apparel are
willing to pay more. Pseudo R-square was 0.090 indicating that the model was able to
account for 9% of the variability in a participant’s WTP.

37
Model 4
WTP a price premium for FOL was regressed on the ten BE dimensions questions
(refer to Table 1 for BE dimensions), demographics, previous brand experience,
importance of product attributes, and beliefs about brands. The model indicated that
perceived quality (p = 0.016) and preference for FOL over other available brands
(p = 0.032) were positively related to WTP a price premium (Table 11). Participants who
felt that FOL brand t-shirts were high quality and preferred FOL over other available
brands had a higher WTP a price premium. Level of loyalty (p = 0.029) was found to be
negatively related to WTP a price premium. Participants who are more loyal to the brand
were less willing to pay a price premium. In addition, other variables were significant
predictors of a participant’s WTP a price premium for a FOL t-shirt. Importance of
country of origin (p = 0.009) and a belief that there are more choices in brands (p = 0.001)
were positively related to WTP a price premium. Consumers who place more importance
on the country of origin and believe that there are more choices in branded apparel are
willing to pay more. Participants’ previous purchase of branded athletic t-shirts
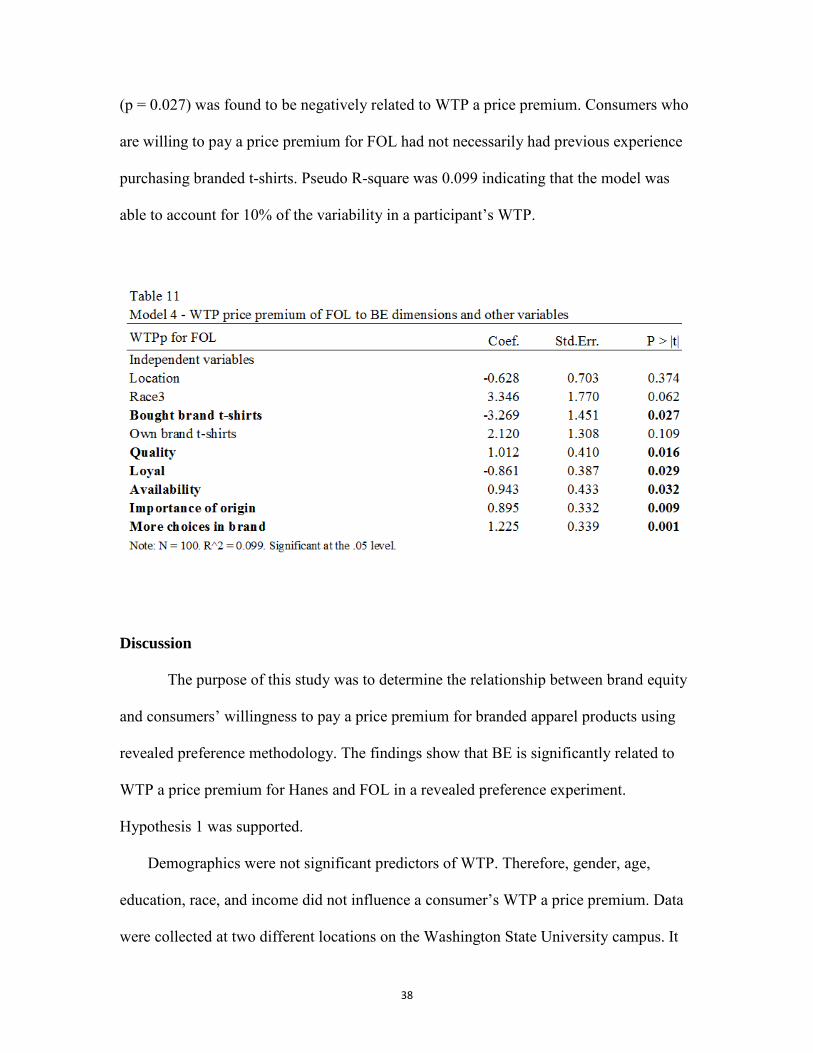
38
(p = 0.027) was found to be negatively related to WTP a price premium. Consumers who
are willing to pay a price premium for FOL had not necessarily had previous experience
purchasing branded t-shirts. Pseudo R-square was 0.099 indicating that the model was
able to account for 10% of the variability in a participant’s WTP.
Discussion
The purpose of this study was to determine the relationship between brand equity
and consumers’ willingness to pay a price premium for branded apparel products using
revealed preference methodology. The findings show that BE is significantly related to
WTP a price premium for Hanes and FOL in a revealed preference experiment.
Hypothesis 1 was supported.
Demographics were not significant predictors of WTP. Therefore, gender, age,
education, race, and income did not influence a consumer’s WTP a price premium. Data
were collected at two different locations on the Washington State University campus. It

39
was determined that location was not a significant predictor of WTP, indicating the
ability to pool the data.
Even though there is a relationship between the composite BE score and
consumers’ WTP a price premium, the dimensions of BE were not all positively related
to WTP. Perceived quality was found positively related to WTP a price premium for
Hanes and FOL, holding all other independent variables constant, which indicates that
consumers who perceive those brands to be of a higher quality were willing to pay more
for that brand. Recognition, which is brand association/awareness, was found positively
related to the Hanes brand only, holding all other independent variables constant, which
indicates that consumers who have a higher association/awareness of the Hanes brand
may be willing to pay more. Brand loyalty, however, was found negatively related to
WTP a price premium for FOL, holding all other independent variables constant, which
indicates consumers who are more loyal to FOL, may not have a higher WTP.
Consistent with the literature, Rao and Monroe (1989) indicated that for consumer
products, the relationships between price and perceived quality and between brand name
and perceived quality are positive and statistically significant. Netemeyer et al (2004)
created a model indicating that perceived quality was a direct antecedent of the WTP a
price premium for a brand and that WTP a price premium directly affects brand purchase
behavior. The findings in this research support Rao and Monroe (1989) and Netermeyer
et al (2004) that in both brands, Hanes and FOL, perceived quality was an indicator of
WTP a price premium and was positive and statistically significant.
From the literature, Sethuraman and Cole (1999) and Sethuramen (2003) found
that consumers would be more willing to pay higher prices for national rather than store

40
branded products. These researchers used stated WTP through surveys across grocery
product categories. However, their conclusions are similar. Results from the current study
show that participants are willing to pay an average of $2 to $3 more to upgrade from a
generic non-branded t-shirt to a branded t-shirt. Stated WTP preference indicated a higher
WTP for branded products and revealed WTP preference in this study supported the
findings.
In addition, results from this study showed that the ability to easily recognize the
Hanes brand among competing brands was positively related to WTP a price premium,
holding all other independent variables constant. Hustevedt and Bernard (2010) found
that by adding brand, WTP was significantly increased. The brand names with high
familiarity significantly impacted WTP and received higher bids. Findings from this
study support Hustedvt and Bernard’s (2010) findings, which also used revealed
preference methodology. Also consistent with this study’s findings, Fueller (2008)
indicated that brands had positive associations within communities, and brands bearing
the community brand had higher WTP price premiums. Even among luxury brands,
highly recognized brands achieve higher WTP price premiums over generic brands
(Coyler, 2005).
Results from this study show brand loyalty was negatively related to WTP a price
premium for FOL, holding all other independent variables constant. Meaning that holding
the value of other variables constant in the model, loyalty had a negative correlation. Past
literature indicates that brand loyal customers would be willing to pay a price premium in
order to remain loyal (Jensen and Drozdenko, 2008), and brand loyal customers have a
wider range of acceptable prices (Kalyanaram and Little, 1994). In another study,

41
Rauyruen, Miller, and Groth (2009) indicated that willingness to pay a price premium
was significantly driven by loyalty and suggested that price premium could be a very
effective measure of loyalty. Simple regression analysis indicated that brand loyalty was
positively correlated to WTP a price premium for FOL, however, this relationship was
not statistically significant at the .05 level. Simple regression assumes that all other 9
variables are uncorrelated with loyalty and that is not true.
42
CHAPTER FIVE
CONCLUSIONS
The purpose of this study was to determine the relationship between brand equity and
consumers’ willingness to pay a price premium for branded apparel products using
revealed preference methodology. The objectives identified to better understand this
relationship were as follows: 1) Determine consumers perceived brand equity of branded
apparel products; 2) Identify consumers WTP for branded apparel products; and 3)
Determine the relationship between brand equity to price premiums.
This chapter summarizes the findings through implications to the field of apparel
merchandising and business retailers, and recommendations for future research are
included.
This study showed that brand equity is an indicator of consumers’ WTP a price
premium for branded apparel. Past research linking brand equity to price premiums has
shown that consumers are willing to pay a price premium for branded apparel products.
These studies utilized stated preference data collection methods that exhibit social
desirability bias and are known to display poor validity. The purpose this research was to
determine if the use of revealed preference methodology would yield similar results. It is
the case with this sample that consumers are willing to a pay a price premium for branded
t-shirts over non-branded t-shirts. Consumers value brands and are willing to pay more
for them. Therefore, marketers and merchandisers should develop and manage brand
equity for apparel products to make effective marketing decisions and enhance
profitability.

43
Consumers placed higher brand equity on Hanes and FOL brands, although equity
scores were moderate. The previously discussed higher brand equity scores yield higher
price premiums. Different brands may yield higher price premiums among this age group,
such as luxury brands. Marketing efforts need to be placed on building brand equity.
Brand equity is an important aspect for all businesses who wish to develop a premium
brand. Consumers are willing to pay more for a brand when they value the brand more.
Consistent with the literature, consumers in this study indicated they were willing to
pay more for brands that they perceive to have higher quality. In addition, consumers
who placed more importance on brand when making clothing purchases had a higher
willingness to pay. Apparel retailers should focus their marketing efforts on emphasizing
brand names and improving the perceived quality of brands to increase price premiums.
In recessionary times, perceived quality is very important in consumers’ purchasing
decisions (Bohlen, Carlotti, and Mihas, 2010).
Consumers in this study who believed there are more choices in branded apparel
were willing to pay more. This has implications to visual merchandising and assortment
planning. Efforts should be made by retailers to maximize choices, such as color and
style, when carrying branded merchandise.
Consumers in this study also indicated they were willing to pay more when they
recognize a certain brand, such as Hanes, among other competing brands. In addition,
consumers who prefer FOL over other available brands were willing to pay more. This
shows that familiarity among brands is important. When consumers are aware of a brand,
they are more likely to purchase that brand when it is made available to them. Efforts
should be made to optimize positioning of branded products to maximize visibility. This
44
also signifies the importance of visibility in the media to promote familiarity and
recognition.
Consumers in this study placed a higher level of importance on country of origin in
branded apparel products when it came to WTP a price premium. Research indicates that
branded apparel products made in a developing country are perceived as lower quality
and consumers may not be willing to pay a price premium (Bilkey and Nes, 1982).
Apparel retailers should be aware of this and educate consumers that country of origin
may not be a direct indicator of product quality. It is important to build a well
recognizable brand image and a perception of high quality, regardless of country of origin.
These models accounted for a limited amount of the variability in WTP. Other
factors that influenced WTP using revealed preference methodologies should be explored.
Factors that may affect consumers’ WTP could be the influence of peers on consumers’
purchase decisions. Fueller (2008) found that community brands can gain very powerful
positive associations within community memberships, and that many members are
willing to pay considerable premiums for products bearing the community brand.
Other considerations would be the culture of the consumers, the labeling of the brand,
the environmental friendliness of the brand, and whether the brand is luxury. Studies
show that in the luxury segment, top brands achieve price premiums between 20-200%
over normal brands in the segment (Coyler 2005). It would be interesting to see if the
results from these factors would hold using revealed preference methodology.
45
Recommendations for Future Research
Based on the findings of the study, suggestions for future research may be to:
1) Further explore the importance of apparel attributes and the beliefs about brands
to consumers’ WTP a price premium using more valid methods of data collection,
such as revealed preference experimental methodologies.
2) Investigate whether consumers make purchase decisions based on other variables,
such as sustainability, labeling, culture, or the economy, that may be of greater
effect to consumers’ WTP a price premium than brand equity using a revealed
preference methodology.
3) Determine how other brands or apparel products may produce different results on
WTP a price premium and brand equity using a revealed preference methodology.
46
REFERENCES
Aaker, D.A. (1991). Managing brand equity. New York: The Free Press. Aaker, D.A. (1996). Measuring brand equity across product and markets. California
Management Review, 38(3), 102-120
Agarwal, M.K. & Rao, V.R. (1996). An empirical comparison of consumer-based measures of brand equity, Marketing Letters, 7(3), 237-247.
Alax, J. (2010). Top 10 sport brands in the world. [online]. Available: http://www.articlesbase.com/article-marketing-articles/top-10-sport-brands-in-the-world-3117629.html. (October 5, 2010)
Ambler, T. (1997). How much brand equity is explained by trust? Manage Decis, 35, 283-292.
Apelbaum, E., & Gerstner, E. (2003). The effects of expert quality evaluations versus brand name on price premiums. Journal of Product & Brand Management, 12 (3), 154-165.
Auger, P., Burke, P., Devinney, T.M., & Louviere, J.J. (2003) What will consumers pay for social product features? Journal for Business Ethics, 42, 281-304.
Becker, G., DeGroot, M., & Marschak, J. (1964) Measuring utility by a single-response
sequential method. Behavioral Science, 9 (2), 226–236.
Bernard, J.C. & Bernard, D. J. (2009) What is it about organic milk? An experimental analysis. American Journal of Agricultural Economics, 91 (3), 826-836.
Bharadwaj, S.G., Varadarajan, P.R., & Fahay, J. (1993). Sustainable competitive advantage in service industries: a conceptual model and research propositions. Journal of Marketing, 57. 83-99.
Bilkey, W.J. & Nes, E. (1982). Country-of-origin effects on product evaluations. Journal
of International Business Studies, Spring/Summer, 89-94.
Blackston, M. (1995). The qualitative dimension of brand equity. Journal of Advertising Research, July/August, 2-7.
Bohlen, B., Carlotti, S. & Mihas, L. (2010). How the recession has changed US
consumer behavior. McKinsey Quarterly, 1, 17-20.

47
Breidert, C., Hahsler, M., & Reutterer, T. (2006). A review of methods for measuring willingness-to-pay. Innovative Marketing.
Casadesus-Masanell, R., Crooke, M., Reinhardt, F., & Vasishth, V. (2009). Households
willingness to pay for green goods: evidence from Patagonia's introduction of organic cotton sportswear. Journal of Economics & Management Strategy, (1), 18, 203-233.
Coyler, E. (2005). That's Rich: Redefining Luxury Brands. [online]. Available: http://www.brandchannel.com/features_effect.asp?pf_id=267. (November 8, 2010).
Cummings, R.G., Harrison, G.W., & Rutstrom, E.E. (1995). Homegrown values and hypothetical surveys: is the dichotomous choice approach incentive compatible?" American Economic Review, 85(1), 260-266.
Didier, T. & Lucie, S. (2008). Measuring consumers’ willingness to pay for organic and
Fair Trade products. International Journal of Consumer Studies, 32, 479-490.
Ding, M., Ross Jr. W.T., & Rao, V.R. (2010). Price as an indicator of quality: implications for utility and demand functions. Journal of Retailing, 86(1), 69-84.
Dodds, W.B., Monroe, K.B., & Grewal, D. (1991). Effects of price, brand and store information on buyers’ product evaluation. Journal of Marketing Research, 28(3), 307-319.
Froehlich, E.J., Carlberg, J.G., & Ward, C.E. (2009). Willingness-to-pay for fresh brand name beef. Canadian Journal of Agricultural Economics, 57, 119-137.
Fueller, J. & Hippel, E.V. (2008). Costless creation of strong brands by user communities: implications for producer-owned brands. MIT Sloan School of Management Working Paper, 8(September), 1-30.
Huang, J.C., Haab, T.C., & Whitehead, J.C. (1997) Willingness to pay for quality improvements: should revealed and stated preference data be combined? Journal of Environmental Economics and Management, 34, 240-255.
Hustvedt, G. & Bernard J. C., (2008) Consumer willingness to pay for sustainable apparel: the influence of labeling for fiber origin and production methods. International Journal of Consumer Studies, 32, 491-498.
Hustvedt, G. & Bernard, J.C. (2010). Effects of social responsibility labeling and brand on willingness to pay for apparel. International Journal of Consumer Studies, 34, 619-626.

48
Jensen, M. & Drozdenko, R. (2008). The changing price of brand loyalty under perceived time pressure. Journal of Product & Brand Management, 17(2), 115-120.
Kalyanaram, G. & Little, J.D.C. (1994). An empirical analysis of latitude of price acceptance in consumer package goods. Journal of Consumer Research, 21(3), 408-418.
Keller, K. L. (1993). Conceptualizing, measuring, and managing customer-based brand equity. Journal of Marketing. 57(1), 1-22.
Keller, K.L. (1998). Strategic brand management. Building, measuring and
managing brand equity. Englewood Cliffs, NJ: Prentice Hall.
Keller, K.L. & Lehmann, D.R. (2003). How do brands create value? Marketing Management, 12(3), 26-31.
Kosenko, R. & Krishman, R. (1990) Consumer price limits and the brand effect.
Journal of Business Psychology,5(2), 153-163.
Loomis, J., Brown, T., Lucero, B. & Peterson, B. (1996) Improving validity experiments of contingent valuation methods: results of efforts to reduce the disparity of hypothetical and actual willingness to pay. Land Economics, 72, 450-461.
Loureiro, M.L., McCluskey, J.J., & Mittelhammer, R.C. (2003) Are stated preferences good predictors of market behavior? Land Economics, 79(1), 44-55.
Lusk, J.L., Fox, J.A., Schroeder, T.C., Mintert, J., & Koohmaraie, M. (2001). In-store
valuation of steak tenderness. American Journal of Agricultural Economics, 83(3), 539-550.
Lusk, J. L. & Shogren, J. F. (2007). Experimental auctions: methods and applications in economic and marketing research. New York: Cambridge University Press.
Mahajan, V., Rao, V.R., & Srivastava, R. (1994). An approach to assess the importance of brand equity in acquisition decisions. Journal of Product Innovation Management, 11, 221-235.
Meyer, A. (2001). What's in it for the customers? Successfully marketing green clothing. Business Strategy and the Environment, 10, 317-330.
Millock K. (2002) Willingness to pay for organic foods: a comparison between survey data and panel data from Denmark, Second World Congress of Environmental and Resource Economists: Monterey, CA, USA.

49
Neill, H., Cummings, R., Ganderton, P., Harrison, G. & McGuckin, T. (1994).
Hypothetical surveys and real economic commitments. Land Economics, 70, 145-154.
Netemeyer, R.G., Krishnan, B., Pullig, C., Wang, G., Yagci, M., Dean, D., Ricks, J. & Wirth, F. (2004). Developing and validating measures of facets of customer based brand equity. Journal of Business Research, 57, 209-224.
O'Cass, A. & Choy, E. (2008) Studying Chinese generation Y consumers' involvement in fashion clothing and perceived brand status. Journal of Product & Brand Management, 17(5), 341-352.
Rao, R.A. & Monroe, K.B. (1989). The effect of price, brand name and store name on
buyers' perceptions of product quality: an intergrative interview. Journal of Marketing Research, 26, 351-357.
Rauyruen, P., Miller, K.E. & Groth, M. (2009). B2B services: linking service loyalty and brand equity. Journal of Services Marketing, 23(3), 175-186.
Schroeder, T.C. (2003). Enhancing Canadian beef industry value-chain alignment. National Beef Industry Development Fund, Canfax Research Services.
Sethuraman, R., & Cole, C. (1999). Factors influencing the price premiums that consumers pay for national brands over store brands. Journal of Product & Brand Management, 8 (4), 340-352.
Sethuramen, R. (2003). Measuring national brands' equity over store brands. Review of Marketing Science, 1(1).
Simon, C.J., & Sullivan, M.W. (1993). The measurement and determinants of brand equity: a financial approach. Marketing Science, 12, 28-52.
Srivastava, R., & Shocker, A.D. (1991). Brand equity: a perspective on its meaning and measurement. Marketing Science Institute, 91-124.
Wang, P. (2007). Consumer behavior and willingness to pay for organic products. MS
thesis, San Jose State University, San Jose, CA. Washburn, J.H. and Plank, R.E. (2002). Measuring brand equity: an evaluation of a
customer-based brand equity scale. Journal of Marketing Theory and Practice, 10 (1), 46-62
Wertenbroch, K., & Skiera, B. (2002). Measuring consumers' willingness to pay at point of purchase. Journal of Marketing Research, 39(May), 228-241.

50
Yoo, B., Donthu, N., & Lee, S. (2000). An examination of selected marketing mix elements and brand equity. Journal of the Academy of Marketing Science, 28 (2), 195-211.
Yoo, B., & Donthu, N. (2001). Developing and validating a multidimensional consumer-based brand equity scale. Journal of Business Research, 52(April), 1-14.
Yue, C., Alfnes, F., & Jensen H.H. (2009) Discounting spotted apples: investigating consumers' willingess to accept cosmetic damage in an organic product. Journal of Agricultural and Applied Economics, 41 (1), 29-46.
Yu, C., Zhao, W., & Wang, H. (2008). An empirical evaluation of a customer based brand equity model and its managerial implications. Frontier Business Research China, 2(4), 553-570.
Zeithaml, V.A. (1988). Consumer perceptions of price, quality, and value: a means-end model and synthesis evidence. Journal of Marketing, 52(3), 2-22.

APPENDIX A
IRB APPROVAL
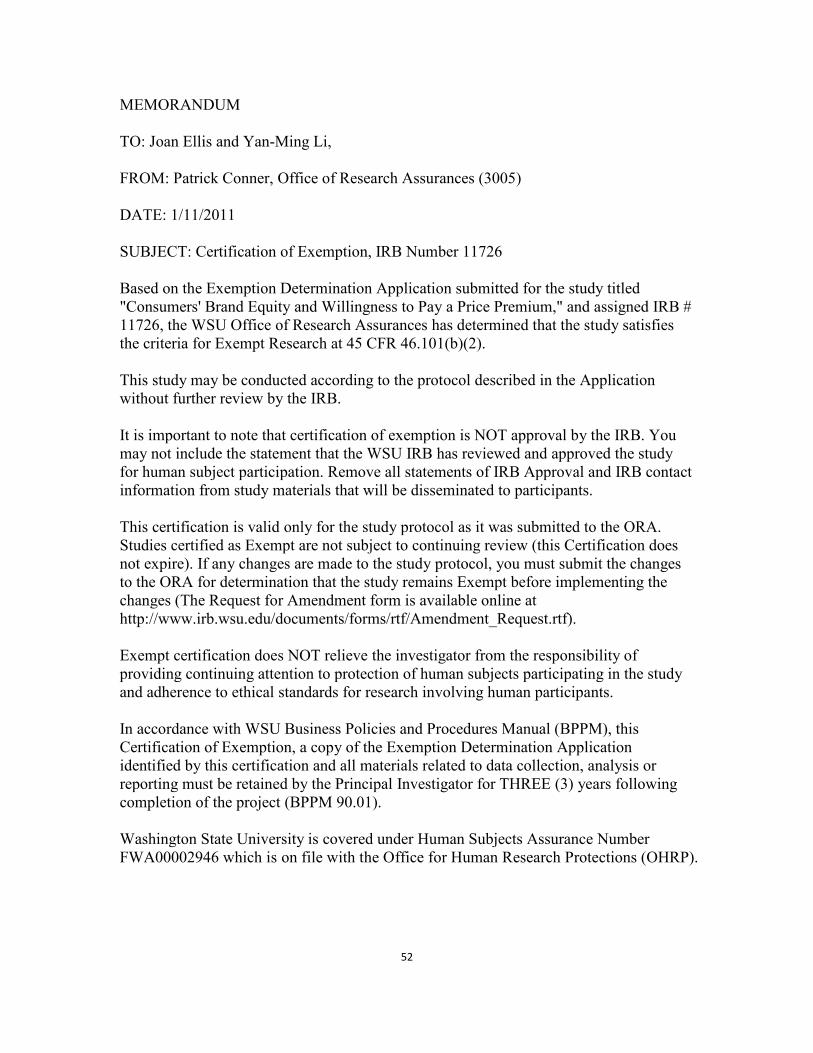
52
MEMORANDUM TO: Joan Ellis and Yan-Ming Li, FROM: Patrick Conner, Office of Research Assurances (3005) DATE: 1/11/2011 SUBJECT: Certification of Exemption, IRB Number 11726 Based on the Exemption Determination Application submitted for the study titled "Consumers' Brand Equity and Willingness to Pay a Price Premium," and assigned IRB # 11726, the WSU Office of Research Assurances has determined that the study satisfies the criteria for Exempt Research at 45 CFR 46.101(b)(2). This study may be conducted according to the protocol described in the Application without further review by the IRB. It is important to note that certification of exemption is NOT approval by the IRB. You may not include the statement that the WSU IRB has reviewed and approved the study for human subject participation. Remove all statements of IRB Approval and IRB contact information from study materials that will be disseminated to participants. This certification is valid only for the study protocol as it was submitted to the ORA. Studies certified as Exempt are not subject to continuing review (this Certification does not expire). If any changes are made to the study protocol, you must submit the changes to the ORA for determination that the study remains Exempt before implementing the changes (The Request for Amendment form is available online at http://www.irb.wsu.edu/documents/forms/rtf/Amendment_Request.rtf). Exempt certification does NOT relieve the investigator from the responsibility of providing continuing attention to protection of human subjects participating in the study and adherence to ethical standards for research involving human participants. In accordance with WSU Business Policies and Procedures Manual (BPPM), this Certification of Exemption, a copy of the Exemption Determination Application identified by this certification and all materials related to data collection, analysis or reporting must be retained by the Principal Investigator for THREE (3) years following completion of the project (BPPM 90.01). Washington State University is covered under Human Subjects Assurance Number FWA00002946 which is on file with the Office for Human Research Protections (OHRP).

53
Review Type: New Review Category: Exempt Date Received: 12/6/2010 Exemption Category: 45 CFR 46.101 (b)(2) OGRD No.: N/A Funding Agency: N/A You have received this notification as you are referenced on a document within the MyResearch.wsu.edu system. You can change how you receive notifications by visiting https://MyResearch.wsu.edu/MyPreferences.aspx Please Note: This notification will not show other recipients as their notification preferences require separate delivery.

APPENDIX B
SURVEY

55

56

57

58

59

APPENDIX C
BID SHEET

61