consumers' price elasticity of demand modeling with economic effects on electricity markets...
TRANSCRIPT

390 IEEE TRANSACTIONS ON SMART GRID, VOL. 4, NO. 1, MARCH 2013
Consumers’ Price Elasticity of Demand ModelingWith Economic Effects on Electricity Markets Using
an Agent-Based ModelPrakash R. Thimmapuram and Jinho Kim
Abstract—Automated Metering Infrastructure (AMI) is a tech-nology that would allow consumers to exhibit price elasticity ofdemand under smart-grid environments. The market power ofthe generation and transmission companies can be mitigated whenconsumers respond to price signals. Such responses by consumerscan also result in reductions in price spikes, consumer energy bills,and emissions of greenhouse gases and other pollutants. In thispaper, we use the Electricity Market Complex Adaptive System(EMCAS), an agent-based model that simulates restructuredelectricity markets, to explore the impact of consumers’ priceelasticity of demand on the performance of the electricity market.An 11-node test network with eight generation companies andfive aggregated consumers is simulated for a period of one month.Results are provided and discussed for a case study based on theKorean power system.
Index Terms—Agent-based modeling, automated metering in-frastructure, price elasticity of demand, smart grid.
I. INTRODUCTION
I N deregulated electricity markets, market power and/or im-balances in the supply and demand associated with the mar-
ginal cost of the last unit dispatched have resulted in large fluc-tuations in wholesale electricity prices. In many of the existingelectricity markets, only generation companies (GenCos) canrespond to the price signals through supply-side offers to the in-dependent system and/or market operator (ISO). Themajority ofconsumers in deregulated markets have contracts with load ag-gregators or load-serving entities who, in turn, submit demandbids to the market operator. If the contract is a pass-throughcontract (i.e., the load aggregator charges the market price withsome fixed profit margin), there is no incentive for the load ag-gregator to provide a mechanism for consumers to respond to
Manuscript received November 26, 2012; accepted December 09, 2012. Dateof publication February 13, 2013; date of current version February 27, 2013.This work was supported by KETEP (2011T100100424). The submitted man-uscript was created by UChicago Argonne, LLC, Operator of Argonne Na-tional Laboratory (“Argonne”). Argonne, a U.S. Department of Energy Officeof Science laboratory, is operated under Contract DE-AC02-06CH11357. TheU.S. Government retains for itself, and others acting on its behalf, a paid-upnonexclusive, irrevocable worldwide license in said article to reproduce, preparederivative works, distribute copies to the public, and perform publicly and dis-play publicly, by or on behalf of the Government. Paper no. TSG-00817-2012.P. R. Thimmapuram is with the Decision and Information Sciences Di-
vision of Argonne National Laboratory, Argonne, IL 60439 USA (e-mail:[email protected]).J. Kim (corresponding author) is with the Department of Energy and Infor-
mation Technology of Gachon University, Seongnam, 460-701 Korea (e-mail:[email protected]).Color versions of one or more of the figures in this paper are available online
at http://ieeexplore.ieee.org.Digital Object Identifier 10.1109/TSG.2012.2234487
prices. On the other hand, if it is a fixed price contract, con-sumers do not see the market prices and will not respond to pricesignals.Moreover, because most consumers do not have access to
hourly or daily electricity price information, their responsesto price changes may lag behind. One potential consumer re-sponse, reducing consumption, occurs when consumers receivetheir monthly electricity bills. Another potential response,switching suppliers, usually occurs on an approximatelymonthly or annual basis, depending on the terms and conditionsof supply contracts.There has been considerable research on consumer response
to electricity prices [1]. In addition, efforts have been under-taken recently to model and simulate the price elasticity in elec-tricity markets [2], [3]. Such studies have shown that reductionsin electricity consumption in response to prices, particularly byresidential customers, are relatively inelastic in the short term;even high price increases produce fairly small changes in elec-tricity usage. Large consumers, on the other hand, are relativelyprice sensitive.Recently, AMI and smart grid have become widely accepted
as promising technologies to provide increased awareness ofelectricity usage and cost to consumers. As a result, those tech-nologies could enable consumers to overcome the technical andmarket barriers to participating in electricity markets throughimproved price elasticity.In this paper, we have set up a model for exploring con-
sumers’ price elasticity of demand (via demand-side bidding)using EMCAS, an agent-based model that simulates the dereg-ulated markets.The remainder of this paper is organized as follows: Section II
presents demand-side response modeling with price elasticity.Section III describes the experimental investigation and pro-vides results and discussion. Section IV offers a real-world casestudy based on Korean electricity markets. Section V presentsour conclusions.
II. DEMAND-SIDE RESPONSE MODELING WITH PRICEELASTICITY
In economics literature, price elasticity is defined as thepercentage change in demand or load (L) resulting from a per-cent change in price (P). For infinitely small changes in price,this can be expressed mathematically as:
(1)
1949-3053/$31.00 © 2013 IEEE

THIMMAPURAM AND KIM: CONSUMERS’ PRICE ELASTICITY OF DEMAND MODELING 391
Fig. 1. Typical demand and supply curves.
TABLE IESTIMATES OF ELECTRICITY PRICE ELASTICITY
where is the consumer’s price elasticity of demand, is theconsumer’s change in load, is the price change, P is the fore-casted energy price ($/MWh), and L is the consumer’s base load(MWh).The equation indicates that: a) a price elasticity of
means that a 1 percent increase in price will result in a 1 percentdecrease in load, b) that zero price elasticity means that theconsumers are insensitive to the price of electricity and that theload is unaffected by the price. In the latter case, the demandcurve is a vertical line, as shown in Fig. 1. However, in elec-tricity markets, the supply curve is more like a hockey stick, inwhich prices increase moderately for most of the supply curveexcept at the end, where prices increase dramatically with asteep slope. The demand responsiveness provides the greatestbenefit in this region [4].
A. Estimates of Price Elasticity of Demand for Electricity
In general, measuring price elasticity is a complex task, andestimated elasticity coefficients usually have a wide range of un-certainty attached to them. It is common to differentiate betweenshort- and long-run elasticity. Short-run elasticity describes theprice-response from the system with its current infrastructureand equipment; long-run elasticity takes into account the invest-ments that can be made (e.g., in energy conservation or alterna-tive energy supply) in response to higher prices.Table I lists examples of ranges of estimates for short- and
long-run elasticity based on several studies [4]–[6]. However,because the studies were carried out in regulated systems, theymight have limited validity for restructured markets. In general,one would expect the price elasticity of demand to increase withimplementation of AMI and smart grid.
Fig. 2. Price elastic demand modeling.
B. Demand-Side Bidding and Market Clearing in theDay-Ahead Market
In the agent-based EMCAS model, consumers submit theirdemand to load aggregators who, in turn, submit the day-aheadhourly demand bid to the ISO. Similarly, the GenCos submittheir day-ahead hourly offers to the ISO. The ISO runs the op-timal load dispatch, optimal power flow, considering the trans-mission network, and determines the hourly locational marginalprices (LMPs) for every hour and for each bus in the system[7]. (The agent-based modeling framework is described in de-tail elsewhere [8], [9].) EMCAS offers an option to allow con-sumers/load aggregators to submit either inelastic or elastic de-mand bids. The shape of the demand curve that is bid into theday-ahead market is modeled by adjusting the following param-eters for each individual consumer:
Reference price
Limit for load reduction (percentage)
Limit for load increase (percentage)
Number of steps on demand curve for loadreduction
Number of steps on demand curve for loadincrease
Fig. 2 shows a typical demand curve. The reference price,, is user input and is fixed for all hours, whereas is
equal to the hourly loads and therefore changes from hour tohour. The minimum and maximum loads are determined by theparameters for the lower and upper limits.If the price elasticity is constant for the entire demand curve,
then (1) can be written as:
(2)
where and (the elasticity) are constants, is a user input,and can easily be calculated for each hour from and .Equation (2) is used to represent the demand-side bidding in themodel. However, the continuous curve in Fig. 2 cannot be biddirectly into the market; a stepwise approximation is necessaryto calculate the market clearing as a linear programming (LP)
392 IEEE TRANSACTIONS ON SMART GRID, VOL. 4, NO. 1, MARCH 2013
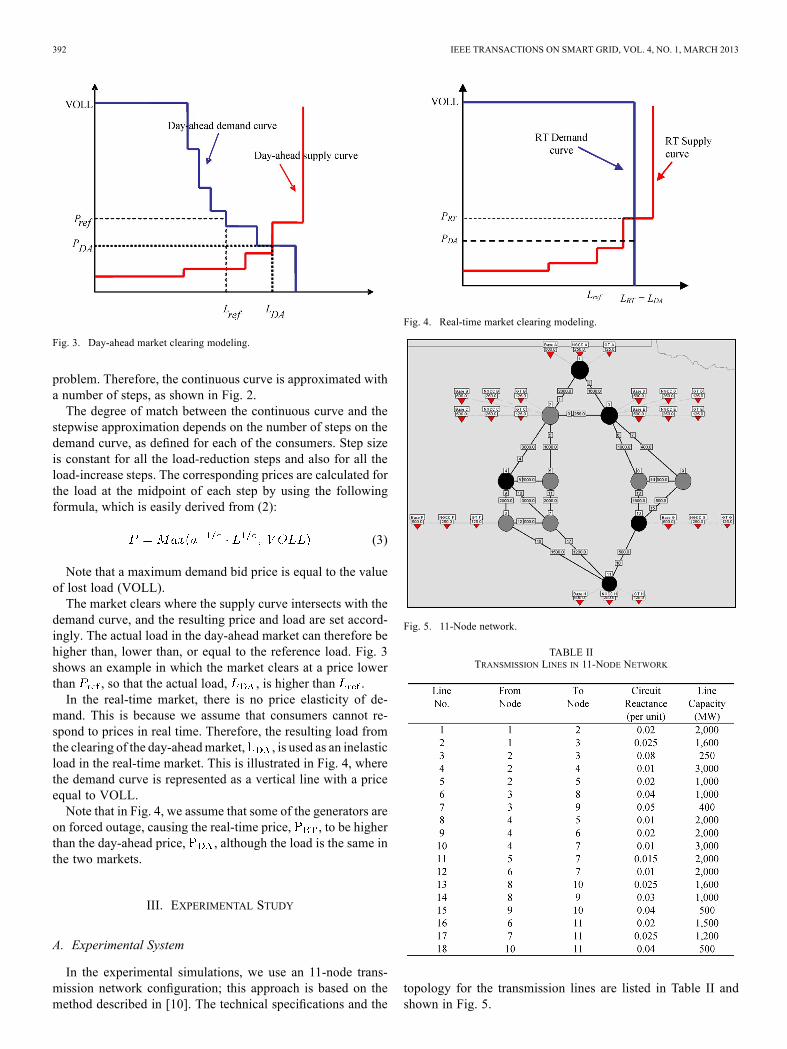
Fig. 3. Day-ahead market clearing modeling.
problem. Therefore, the continuous curve is approximated witha number of steps, as shown in Fig. 2.The degree of match between the continuous curve and the
stepwise approximation depends on the number of steps on thedemand curve, as defined for each of the consumers. Step sizeis constant for all the load-reduction steps and also for all theload-increase steps. The corresponding prices are calculated forthe load at the midpoint of each step by using the followingformula, which is easily derived from (2):
(3)
Note that a maximum demand bid price is equal to the valueof lost load (VOLL).The market clears where the supply curve intersects with the
demand curve, and the resulting price and load are set accord-ingly. The actual load in the day-ahead market can therefore behigher than, lower than, or equal to the reference load. Fig. 3shows an example in which the market clears at a price lowerthan , so that the actual load, , is higher than .In the real-time market, there is no price elasticity of de-
mand. This is because we assume that consumers cannot re-spond to prices in real time. Therefore, the resulting load fromthe clearing of the day-aheadmarket, , is used as an inelasticload in the real-time market. This is illustrated in Fig. 4, wherethe demand curve is represented as a vertical line with a priceequal to VOLL.Note that in Fig. 4, we assume that some of the generators are
on forced outage, causing the real-time price, , to be higherthan the day-ahead price, , although the load is the same inthe two markets.
III. EXPERIMENTAL STUDY
A. Experimental System
In the experimental simulations, we use an 11-node trans-mission network configuration; this approach is based on themethod described in [10]. The technical specifications and the
Fig. 4. Real-time market clearing modeling.
Fig. 5. 11-Node network.
TABLE IITRANSMISSION LINES IN 11-NODE NETWORK
topology for the transmission lines are listed in Table II andshown in Fig. 5.

THIMMAPURAM AND KIM: CONSUMERS’ PRICE ELASTICITY OF DEMAND MODELING 393
TABLE IIIGENERATING UNITS IN 11-NODE SYSTEM
TABLE IVPRODUCTION AND INCREMENTAL BLOCK COSTS
We assume that there is only one transmission company(TransCo) in the system, which owns the entire transmissionnetwork. The transmission network is operated by an ISO.There are eight GenCos in the system, located at various
nodes in the grid (Fig. 5). All of the GenCos have the same setof generating units: one base load coal plant (CO), one com-bined-cycle plant (CC) to cover intermediary load, and one gasturbine (GT) peaking unit. For each GenCo, all three generatingunits (CO, CC, and GT) are connected to the same node. Theparameters for the plants are listed in Tables III and IV. Theseperformance and cost parameters are only representative of thetechnology and are not actual plant data.Note that the bidding blocks for each generating unit are
based on the blocking of the heat rate curves described inTable III. In the base scenario, the GenCos bid according totheir incremental production costs, as listed in Table IV. Forcedoutages are not included in the simulations, making it is easy tocompare the profits for each of the GenCos.We use an aggregate representation of the demand side of the
market. Five aggregate consumers are included, representingtotal demand in the node where they are connected. The loadsare connected to nodes 1, 3, 4, 10, and 11. We are simulatingthe month of July, which is assumed to be the peak-load month
Fig. 6. Hourly consumer load in 11-node case study.
of the year. The five hourly load series are shown in Fig. 6. Thehighest load is clearly in node 11.All of the consumers buy their electricity from a demand
company (DemCo). The transmission network is split into fourzones: A (nodes 1–3), B (nodes 4–7), C (nodes 8–10), and D(node 11). We assumed that there is one DemCo in each of thezones. Note that the consumers pay all charges to the DemCo,including energy, as well as transmission and distribution(T&D), charges.The DemCo, in turn, passes the respective charges on to the
GenCos and T&D companies. A markup can be added to theprice paid by the consumers to represent DemCo profits. How-ever, in this study, we focus on the GenCos and consumersand set the DemCo markup to zero. Fixed costs, $10/MWh and$18/MWh, are assumed for transmission and distribution, re-spectively.
B. Scenarios and Price Elasticity Parameters
For the sake of simplicity, we assumed that all five consumersexhibited price elasticity. A number of scenarios were run toanalyze the impact of price elasticity and the reference price ofconsumers.In all of these scenarios, we assumed that the GenCos bid the
incremental production cost of their units (as listed in Table IV).In demand-side bidding, the consumers had a reference price of$25/MWh or $30/MWh and various price-elastic coefficients. Inaddition, the lower and upper load decrease and increase limitswere set at 90% and 105% of the base load, respectively. Thesescenarios are summarized in Table V. The loads served in thebase case and in other scenarios for a typical day are shown inFig. 7, which shows that consumers increase their load whenprices are lower and decrease their load when prices are higher.
C. Results and Discussion
Tables VI, VII, and VIII, respectively, present the reductionsin peak load, total load served, and total energy cost under var-ious scenarios. The overall peak load reduction is in the range

394 IEEE TRANSACTIONS ON SMART GRID, VOL. 4, NO. 1, MARCH 2013
Fig. 7. Change in consumer load under various scenarios.
TABLE VOVERVIEW OF SIMULATED SCENARIOS FOR 11-NODE SYSTEM
Fig. 8. Price (LMP) exceeding curve in base case.
of 5% to 8%. However, the peak load reduction for Consumer10 is only in the range of 1% to 5%. The lower peak load re-duction for Consumer 10 can be attributed to the LMPs at node10. The LMPs at node 10 exceed the consumers’ reference price85% of the time; at other nodes, it exceeds the reference price91% of the time (Fig. 8). Therefore, the peak load reduction forConsumer 10 is much less than that of the other consumers.Except for Consumer 10, all of the other consumers reduced
their total energy cost by reducing their total load. For Con-sumer 10, higher price elasticity and higher load reduction wererequired for a reduction in the total energy cost. In fact, theLMPs that Consumer 10 pays are higher when exhibiting priceelasticity than in the base case; therefore, the reduction in total
TABLE VIPEAK LOAD AND ITS REDUCTION IN 11-NODE SYSTEM (MW)
TABLE VIITOTAL LOAD SERVED IN 11-NODE SYSTEM (GWH)
TABLE VIIITOTAL ENERGY COST IN 11-NODE SYSTEM (MM$)
TABLE IXIMPACT OF CONSUMER PRICE ELASTICITY IN 11-NODE SYSTEM
energy cost comes solely from a reduction in the load. How-ever, other consumers benefit from a reduction in both load andprices. Table IX presents the impact of the consumers’ priceelasticity on GenCos and TransCos. When consumers exhibitprice elasticities in the range of to , the GenCos’profits are reduced by 3.50% to 6.87% and the TransCo’s con-gestion revenues are almost eliminated.We also studied the impact of the consumers’ reference prices
[Tables X and XI(a), (b), and (c)].As expected, when the reference price increases from
$25/MWh to $30/MWh, the load reduction is only 0.11% to0.27%—for price elasticity in the range of to . Thesmall change in load is because the reference price is now closeto the average price in the base case. Also, there is a slight

THIMMAPURAM AND KIM: CONSUMERS’ PRICE ELASTICITY OF DEMAND MODELING 395
TABLE XIMPACT OF CONSUMER PRICE ELASTICITY AND REFERENCE PRICE
TABLE XI(A) GENCO PROFITS WITH HIGHER CONSUMER REFERENCE PRICE (MM$),(B) CONSUMERS’ LOAD SERVED WITH HIGHER CONSUMER REFERENCEPRICE (GWH), (C) CONSUMERS’ TOTAL COSTS WITH HIGHER CONSUMER
REFERENCE PRICE (MM$)
increase in the GenCos’ profits, because even though they aregenerating less energy compared with the base case, the startupcosts decrease; whereas there is a significant reduction in thecongestion charges. Tables XI(a), (b), and (c) present the profitsof each GenCos, individual consumers’ load served, and totalcost, respectively, when consumers have a higher referenceprice. When the price response is reduced because of a higherreference price, the total cost for consumers at nodes 3 and10 increases compared with the base case. This shows thatall consumers do not benefit equally, and some of them mayactually face a higher cost.
Fig. 9. Hourly consumer load in Korean power system (2006).
TABLE XIIOVERVIEW OF SIMULATED SCENARIOS FOR KOREA POWER SYSTEM
IV. KOREAN POWER SYSTEM
A. Korean Power System
An aggregated representation of the Korean electricity trans-mission network developed in 2006 is used to perform an eco-nomic study on this power system. The Korean power systemhas a total capacity of 72 000 MW, and it includes 126 transmis-sion lines, 97 busses, 9 zones, and 152 generators. The zones areSeoul, Nam Seoul, Suwon, Jechun, Deajon, Kwangju, Daegu,Busan, and Changwon. There are five pumped-storage hydroplants in the system. KEPCO is the only transmission and dis-tribution company.The hourly consumer loads by zone for the month of August
2006 are shown in Fig. 9. Zone Suwon has the highest load;zone Nam Seoul has the lowest load in the system.
B. Scenarios and Price Elasticity Parameters
We assumed that all consumers exhibit price elasticity. Anumber of scenarios were run to analyze the impact of priceelasticity and the reference price of consumers. In all of thesescenarios, GenCos bid the incremental production cost of theirunits. In demand-side bidding, the consumers had a referenceprice of 50 kWon/MWh or 55 kWon/MWh (1 kWon is approx-imately equivalent to U.S. $1) and various price elastic coeffi-cients. In addition, the lower- and upper-load decrease and in-crease limits were set at 90% and 110% of base load, respec-tively. These scenarios are summarized in Table XII.
C. Results and Discussion
Because there are several consumers in the system, the re-sults are presented here at the zonal level. Tables XIII, XIV, and

396 IEEE TRANSACTIONS ON SMART GRID, VOL. 4, NO. 1, MARCH 2013
TABLE XIIIPEAK LOAD AND ITS REDUCTION IN KOREA POWER SYSTEM (MW)
TABLE XIVTOTAL LOAD SERVED IN KOREA POWER SYSTEM (GWH)
TABLE XVTOTAL CONSUMER ENERGY COST IN KOREA POWER SYSTEM (MILLION WON)
XV, respectively, present the reduction in peak load, total loadserved, and total energy cost under various scenarios. There isa 2% to 4% reduction in the peak load in all zones as the con-sumers increase their price elasticity from to . Sim-ilarly, there is a 1% to 2.5% reduction in the total load. By ex-hibiting price elasticity, consumers were also able to reduce theirtotal cost in the range of 2.0% to 4.4%.Fig. 10 shows the price-exceeding curve in the base case. In
all zones, prices exceed the reference price (50 kWon/MWh)nearly 80% of the time, which means that, on the average, con-sumers decreased their load 80% of the time and increased theirload only 20% of the time during the simulation period.Table XVI presents the impact of the consumers’ price elas-
ticity on GenCos and the TransCo. When consumers exhibited
Fig. 10. Zonal price exceeding curve in base case for Korean power system.
TABLE XVIIMPACT OF CONSUMER PRICE ELASTICITY IN KOREAN POWER SYSTEM
price elasticities in the range of to , GenCos’ profitswere reduced by 1.9% to 3.2%, and the TransCo’s congestionrevenues were reduced by 18% to 55%.To understand the impact of the reference price, simulations
were run with a higher reference price of 55 kWon/MWh. Asshown in Fig. 10, the zonal prices exceeded the reference pricenearly 56% of the time.It can be expected that the amount of load increase and de-
crease would be almost equal in these simulations. The resultsfrom the simulations are presented in Tables XVII and XVIII(a)and (b). The total system load is almost identical to the baseload with a minor change—in the range of % to 0.19%.The small change in load is because the reference price is nowcloser to the average price in the base case.Also, there is a slight increase in GenCos’ profits, because
even though they are generating less energy compared with thebase case, the startup costs decreased; whereas there is a signif-icant reduction in the congestion charges.

THIMMAPURAM AND KIM: CONSUMERS’ PRICE ELASTICITY OF DEMAND MODELING 397
TABLE XVIIIMPACT OF CONSUMER PRICE ELASTICITY AND REFERENCE PRICE
TABLE XVIII(A) CONSUMERS’ LOAD SERVED WITH HIGHER CONSUMER REFERENCEPRICE (GWH), (B) CONSUMERS’ TOTAL COSTS WITH HIGHER CONSUMER
REFERENCE PRICE (BILLION WON)
V. CONCLUSION
This paper describes a study in which an agent-based modelwas used to demonstrate and quantify the economic impactof price elasticity of demand in electricity markets whenconsumers are well equipped with smart grid technologies to
increase their awareness of responsiveness of demand. Whilethe impact depends on the price level at which consumersexhibit price responsiveness, price-elastic consumers couldbenefit by a reduction in energy usages and prices. In addi-tion, they could significantly reduce congestion charges and,potentially, reduce the market power of GenCos. While someconsumers may face a higher cost because of their locationin the network, most benefit by exhibiting price elasticity ofdemand. We will investigate these results more specifically inthe next phase of the study.
REFERENCES
[1] A. Faruqui, S. Sergici, and A. Sharif, “The impact of informationalfeedback on energy consumption—A survey of the experimental evi-dence,” in Social Sciences Research Network Working Paper, May 21,2009.
[2] E. Bompard, Y. Ma, R. Napoli, and G. Abrate, “The demand elasticityimpacts on the strategic bidding behavior of the electricity producers,”IEEE Trans. Power Syst., vol. 22, no. 1, pp. 188–197, Feb. 2007.
[3] H. Oh and R. Thomas, “Demand-side bidding agents: Modeling andsimulation,” IEEE Trans. Power Syst., vol. 23, no. 3, pp. 1050–1056,Aug. 2008.
[4] R. Lafferty, D. Hunger, J. Ballard, G. Mahrenholz, D. Mead, and D.Bandera, “Demand responsiveness in electricity markets,” Office ofMarkets, Tariffs and Rates, FREC, Jan. 2001.
[5] B. Stevens and L. Lerner, “Testimony on the effect of restructuring onprice elasticities of demand and supply,” California Energy Commis-sion Jul. 1996 [Online]. Available: http://www.energy.ca.gov/ER96/documents/staff_documents_filed/ER96_96-07-17_stevens.pdf
[6] R. Earle, “Demand elasticity in the California power exchange day-ahead market,” Electr. J., vol. 13, no. 8, pp. 59–65, Oct. 2000.
[7] S. Jang, J. Roh,W. Kim, T. Sharpa, J. Kim, and J. Park, “A novel binaryant colony optimization application to the unit commitment problemof power systems,” J. Electr. Eng. Technol., vol. 6, no. 2, pp. 174–181,Mar. 2011.
[8] V. Koritarov, “Real-world market representation with agents:Modeling the electricity market as a complex adaptive systemwith an agent-based approach,” IEEE Power Energy Mag.vol. 2, no. 4, pp. 39–46, Jul./Aug. 2004 [Online]. Available:http://www.dis.anl.gov/pubs/61120.pdf
[9] R. Cirillo, P. Thimmapuram, T. Veselka, V. Koritarov, G. Conzelmann,C. Macal, and M. North, “Evaluating the potential impact of transmis-sion constraints on the operation of a competitive electricity marketsin Illinois,” ANL Rep. ANL-06/16, Apr. 2006.
[10] R. D. Christie, B. F. Wollenberg, and I. Wangensteen, “Transmissionmanagement in the deregulated environment,” Proc. IEEE, vol. 88, no.2, pp. 170–195, Feb. 2000.
Prakash R. Thimmapuram (M’10) received the M.S. degree in chemical en-gineering from the University of Illinois at Chicago, Chicago, IL, USA, in 1992.He is a Computational Scientist with the Decision and Information Sciences
division of Argonne National Laboratory, Argonne, IL. He has more than 13years of experience in developing models for energy, environmental, and eco-nomic systems analysis. His current research interests include agent-based mod-eling and simulation, electricity markets, power system analysis, and carbontrading.
Jinho Kim (M’97) received his B.S., M.S., and Ph.D. degrees in electrical engi-neering from Seoul National University, Seoul, Korea, in 1995, 1997, and 2001,respectively.He is an Associate Professor in the Department of Information and Commu-
nication, Kyungwon University, Korea, and he is now working with ArgonneNational Laboratory and ADICA LLC, USA, as a Resident Researcher. His cur-rent research interests include electricity market analysis, design and implemen-tation of demand response programs, and energy policies.