consumer survey 2018 - european commission
TRANSCRIPT
CONSUMERS ATTITUDES TOWARDS
CROSS-BORDER TRADE AND CONSUMER PROTECTION
2018
Final Report
Specific contract No 2017 85 02
implementing Framework contract No EAHC 2013CP03 Lot 1
GfK Belgium
Final Version
14022019
Consumers Health Agriculture and
Food
Executive Agency
EUROPEAN COMMISSION
Produced by Consumers Health Agriculture and Food Executive Agency (Chafea) on behalf of
Directorate-General for Justice and Consumers
Unit JUST03 (Economic analysis amp evaluation)
E-mail JUST-03eceuropaeu
European Commission
B-1000 Brussels
EUROPEAN COMMISSION
Directorate-General for Justice and Consumers EU Consumer Programme
2019 3 EN
Consumers attitudes towards cross-border trade and
consumer protection 2018
Final Report
This report was produced under the EU Consumer Programme (2014-2020) in the frame of a service contract with the Consumers Health Agriculture and Food Executive Agency (Chafea)
acting under the mandate from the European Commission
The content of this report represents the views of the contractor and is its sole responsibility it
can in no way be taken to reflect the views of the European Commission andor Chafea or other body of the European Union
The European Commission andor Chafea do not guarantee the accuracy of the data included in this report nor do they accept responsibility for any use made by third parties thereof
More information on the European Union is available on the Internet (httpeuropaeu)
More information on the European Union is available on the Internet (httpeuropaeu)
Luxembourg Publications Office of the European Union 2019
Project number 20191119
Title Survey on consumers attitudes towards cross-border and consumer-related issues 2018 ndash Final Report
Language version
SupportVolume Catalogue number ISBN DOI
EN PDF PDFVolume_01
EB-01-19-185-EN-N 978-92-9478-091-1 102818209599
copy European Union 2019
Reproduction is authorised provided the source is acknowledged
Europe Direct is a service to help you find answers
to your questions about the European Union
Freephone number ()
00 800 6 7 8 9 10 11
() The information given is free as are most calls (though some operators phone boxes or hotels may charge
you)
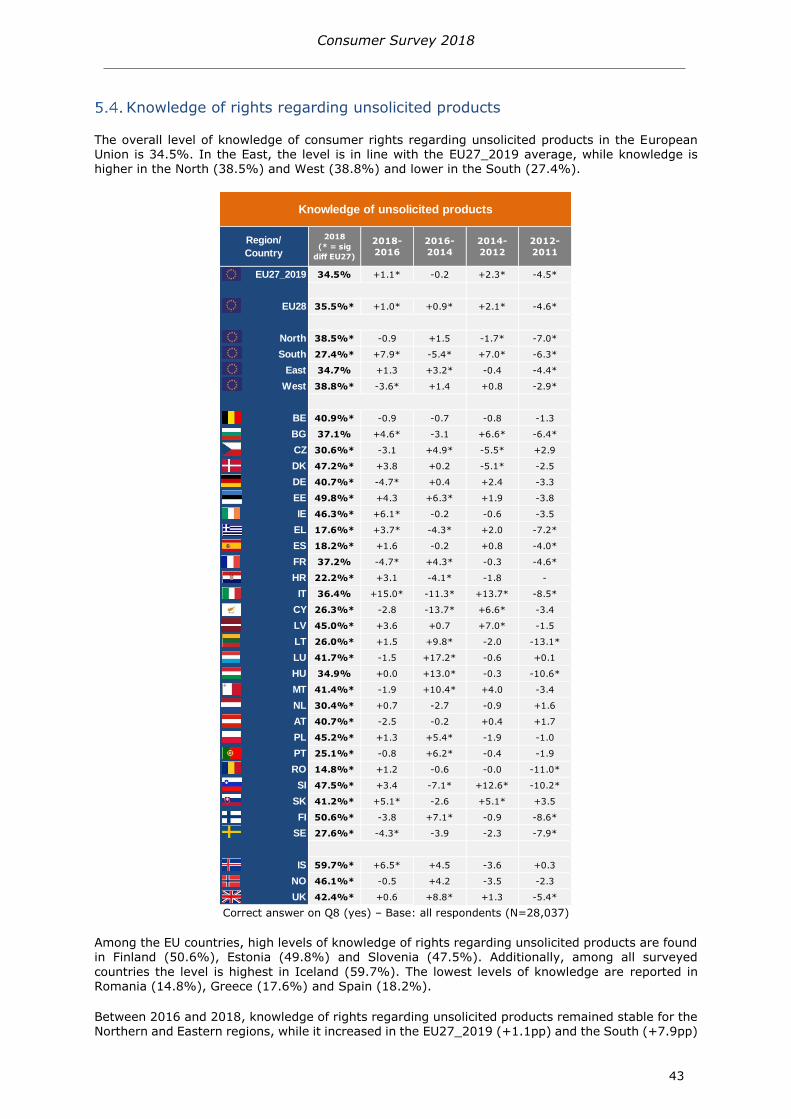
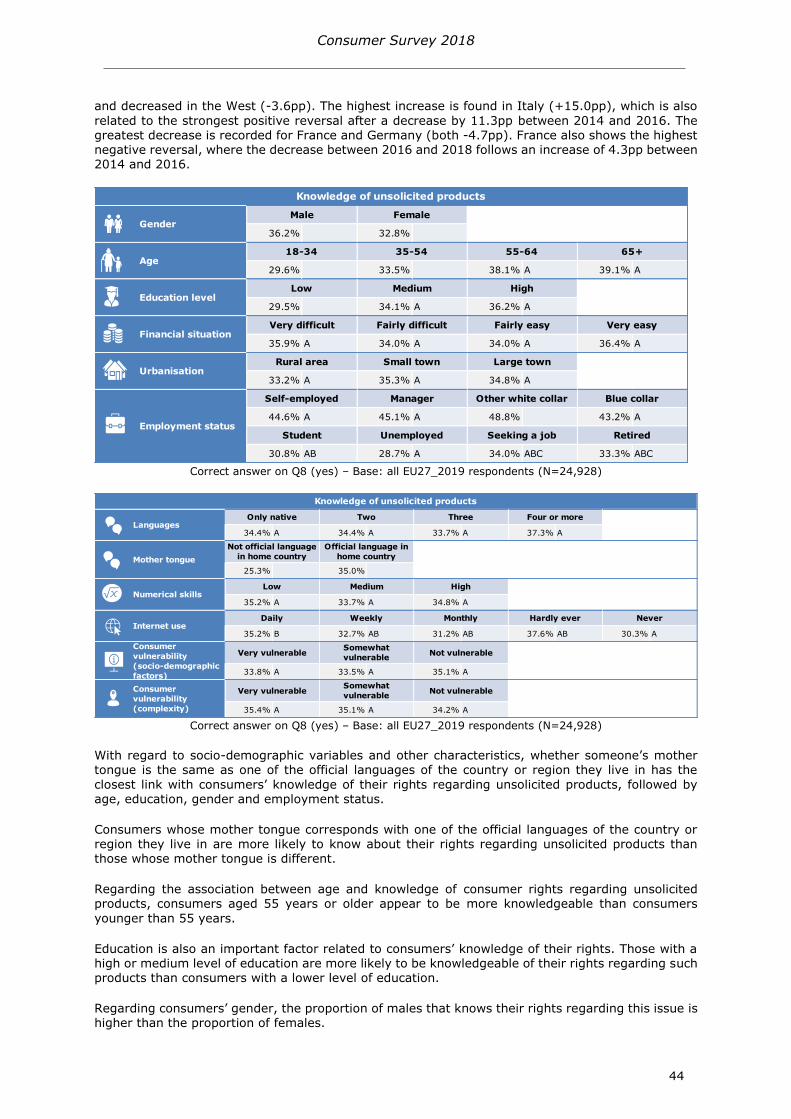
Consumer Survey 2018
5
TABLE OF CONTENTS
TABLE OF CONTENTS 5
1 INTRODUCTION 7
Introduction to the 2018 wave of the Consumer Survey 7
Sampling methodology 7
121 Countries covered 8
122 Core questionnaire 9
123 Socio-demographic and background questions 9
124 Analysis and reporting of statistically significant differences 10
125 Weighting and wave to wave comparisons 11
2 EXECUTIVE SUMMARYKEY FINDINGS 13
3 DOMESTIC AND CROSS-BORDER SHOPPING 16
Domestic and cross-border online purchases 16
Offline cross-border purchases 23
4 THE EVOLUTION OF ONLINE PURCHASE BEHAVIOUR 28
5 KNOWLEDGE OF CONSUMER RIGHTS 35
General level of knowledge about consumer rights 35
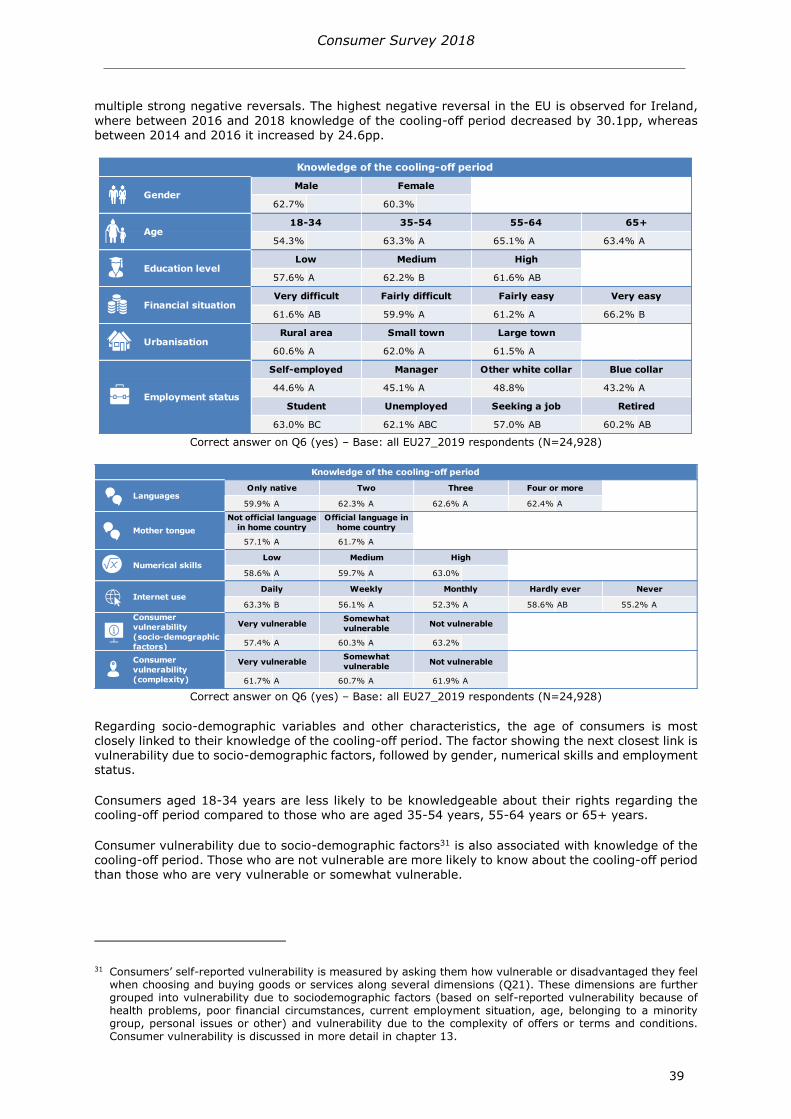
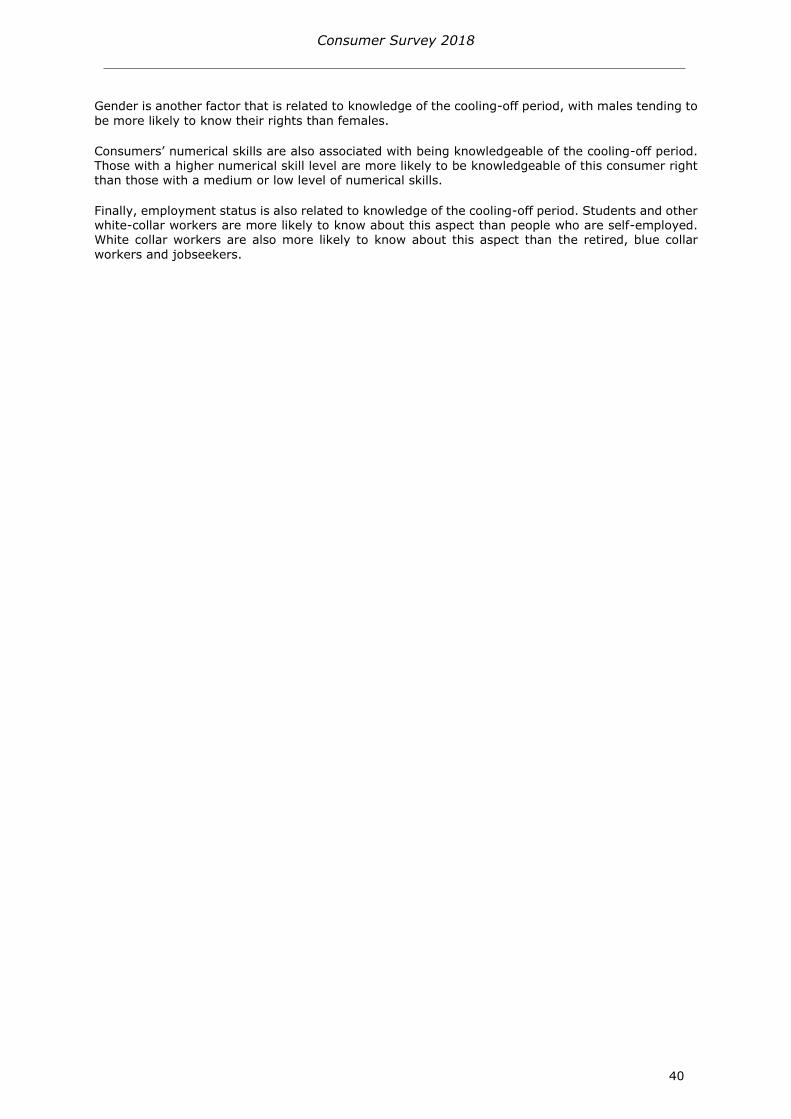
Knowledge of the cooling-off period 38
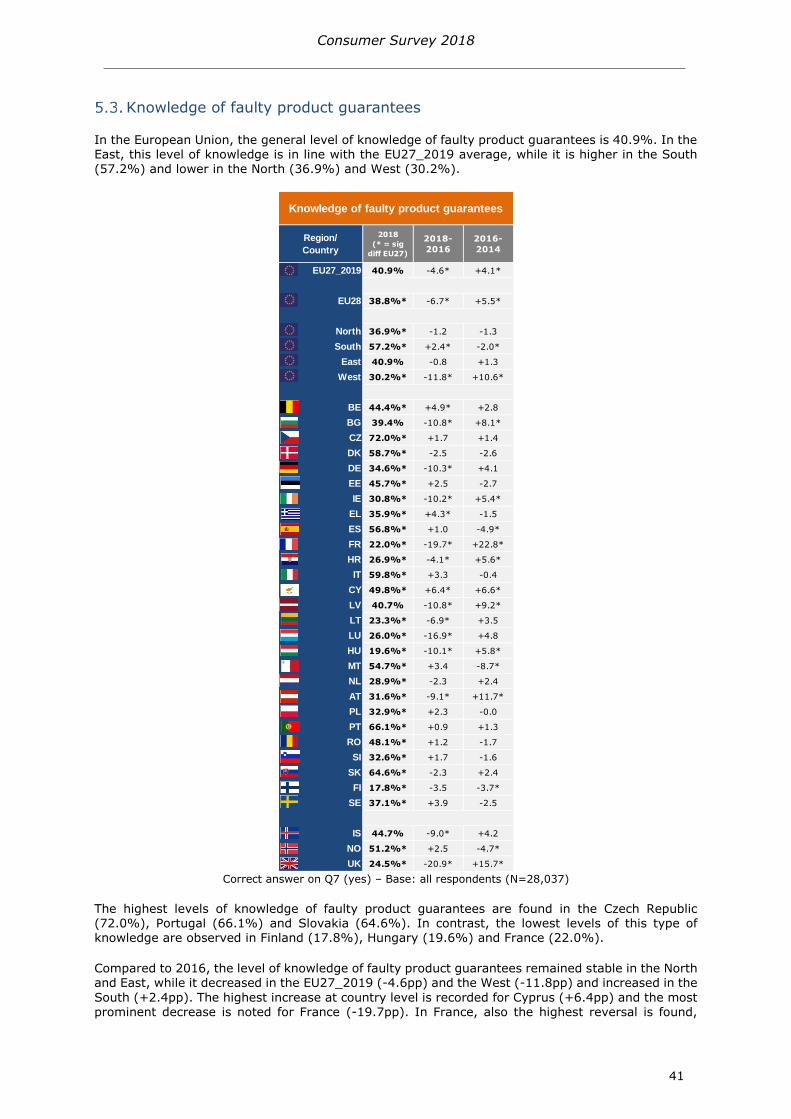
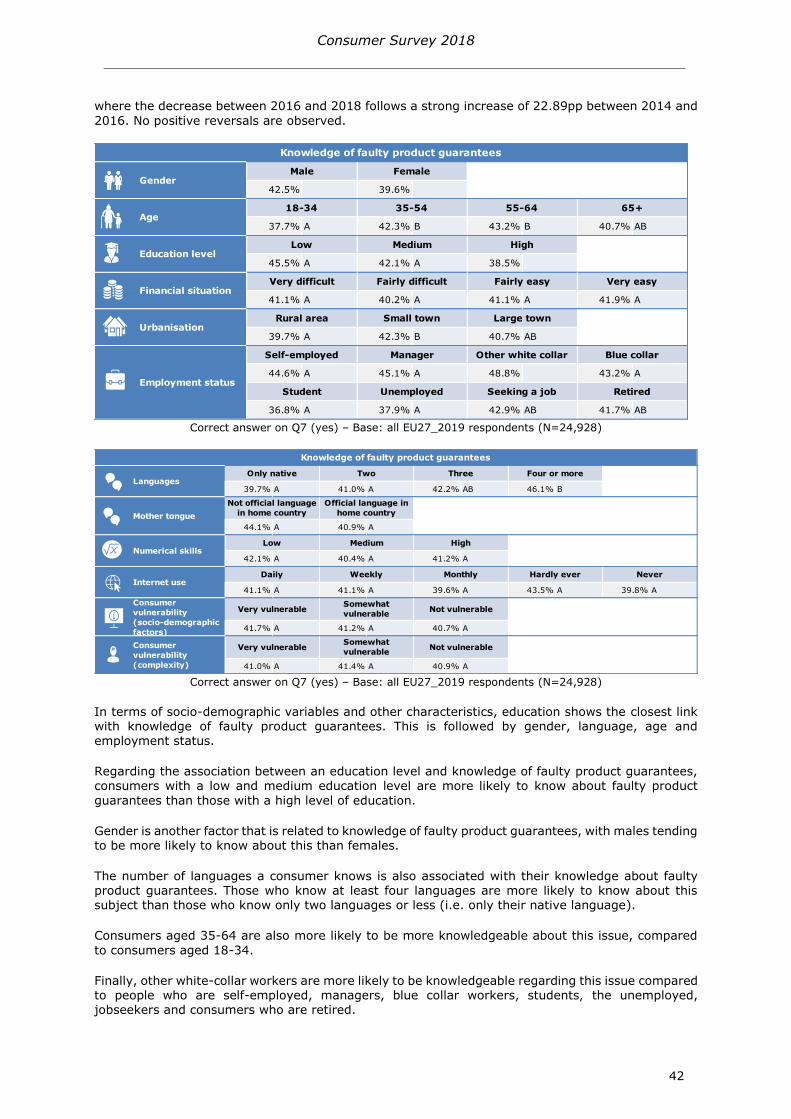
Knowledge of faulty product guarantees 41
Knowledge of rights regarding unsolicited products 43
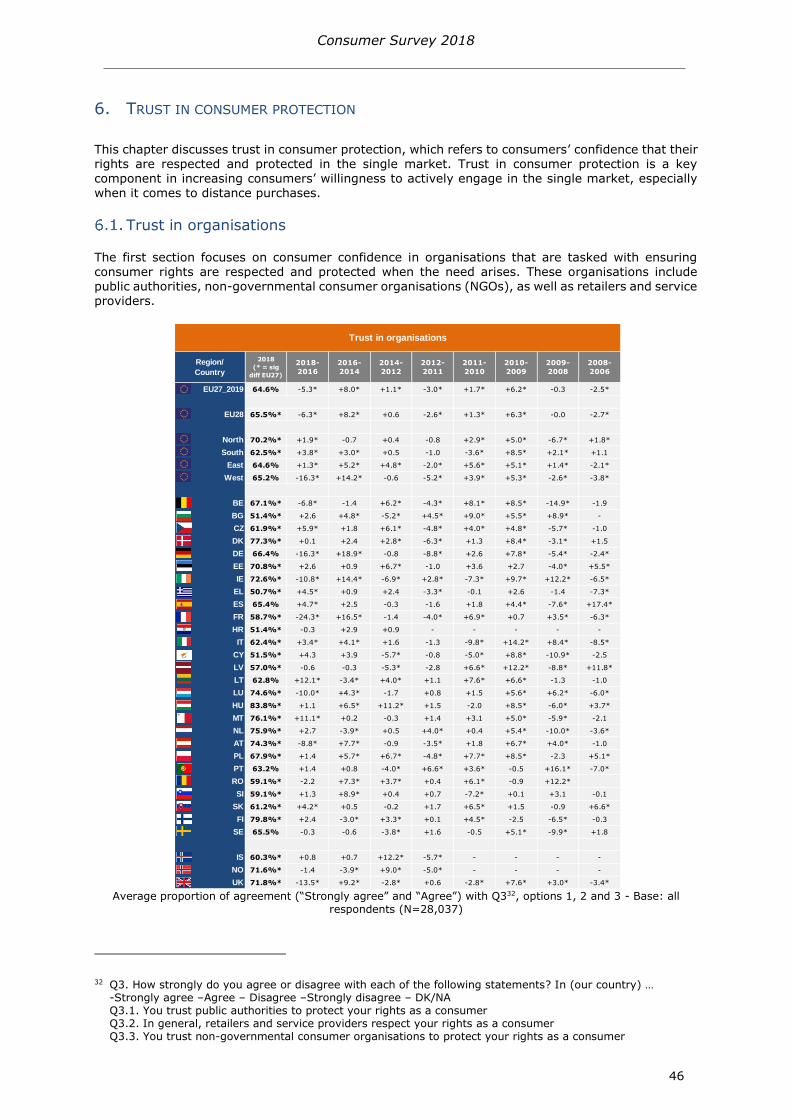
6 TRUST IN CONSUMER PROTECTION 46
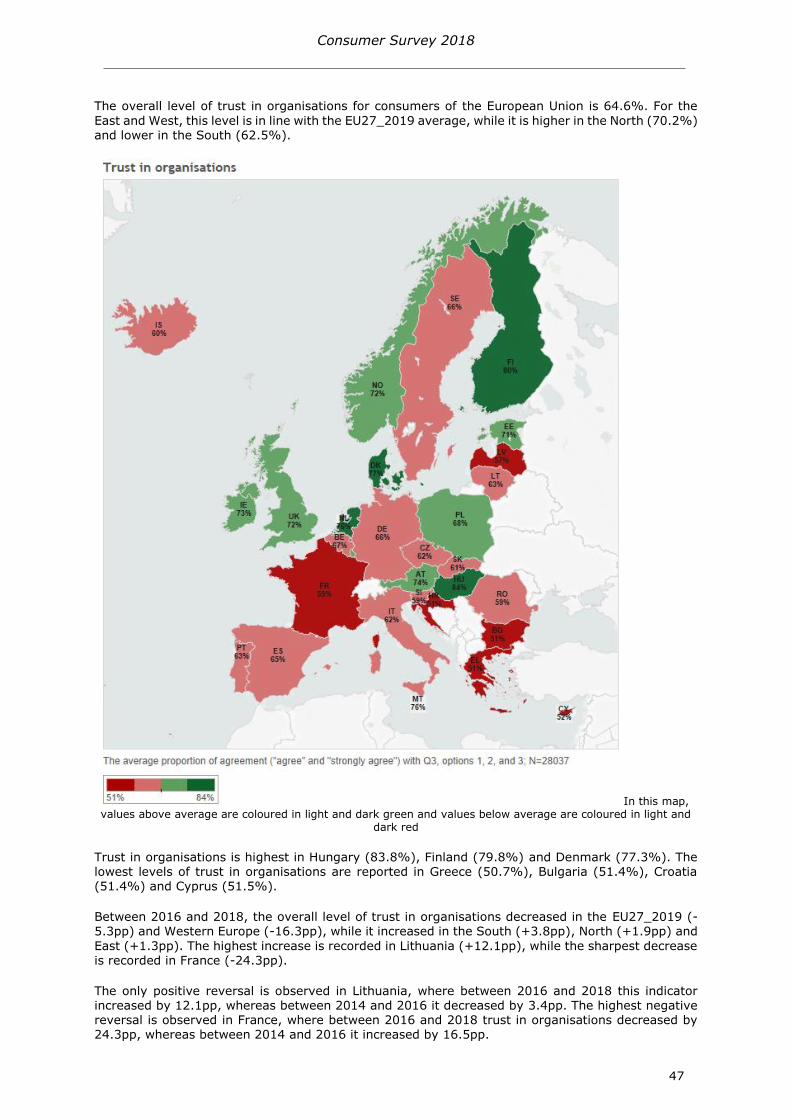
Trust in organisations 46
611 Public authorities 49
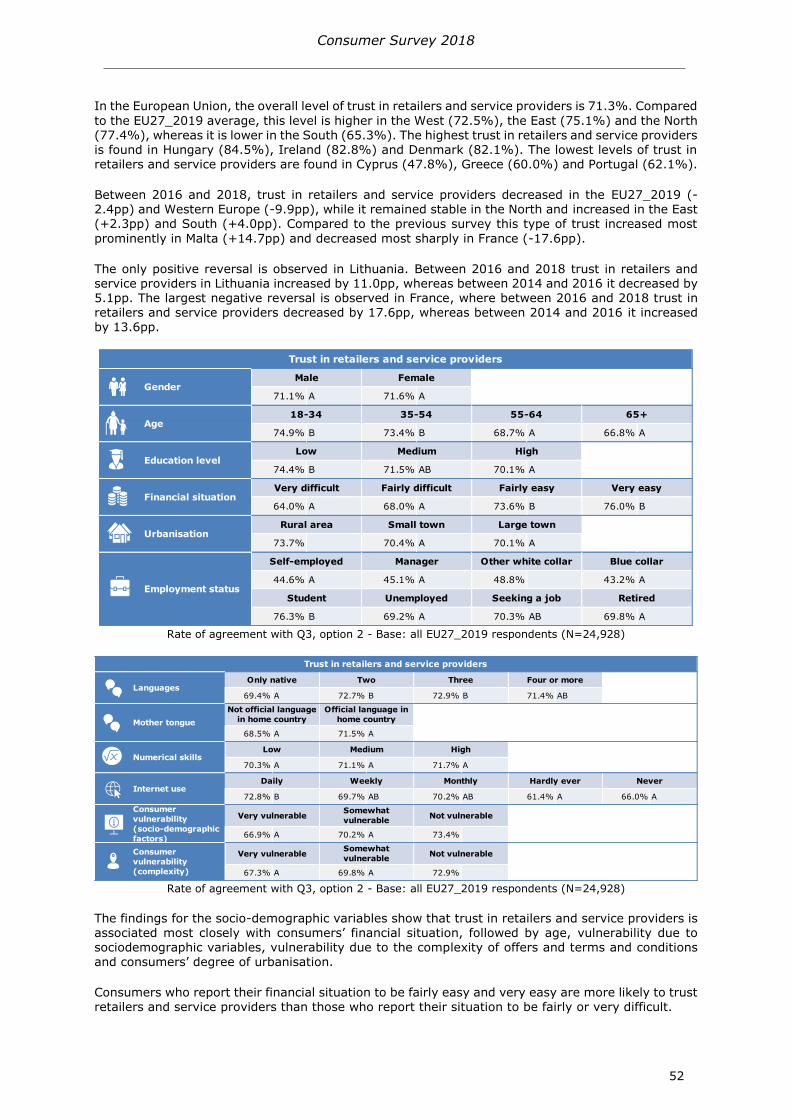
612 Retailers and service providers 51
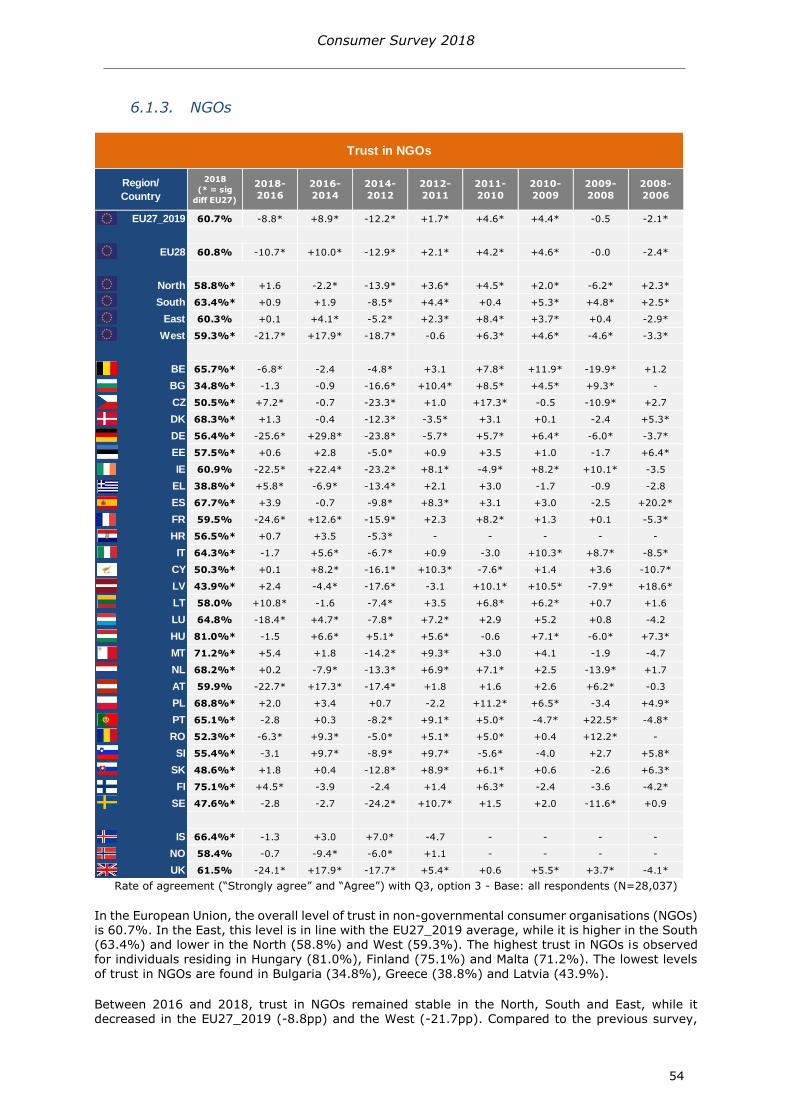
613 NGOs 54
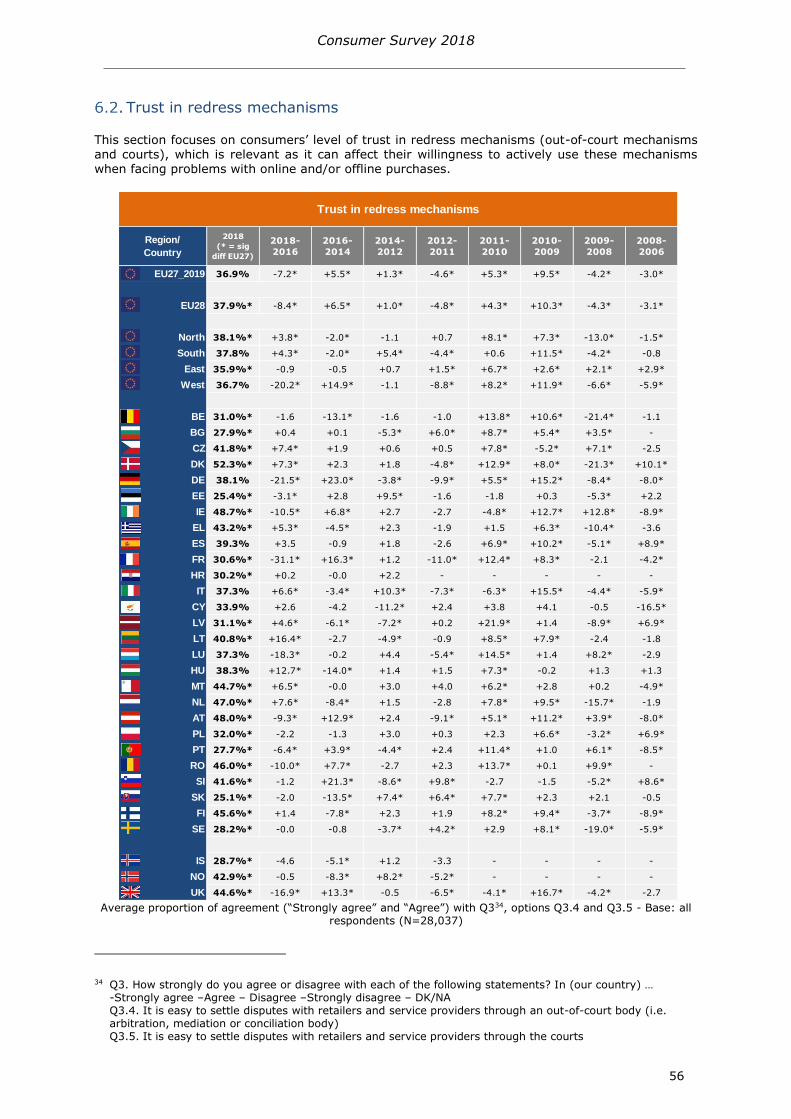
Trust in redress mechanisms 56
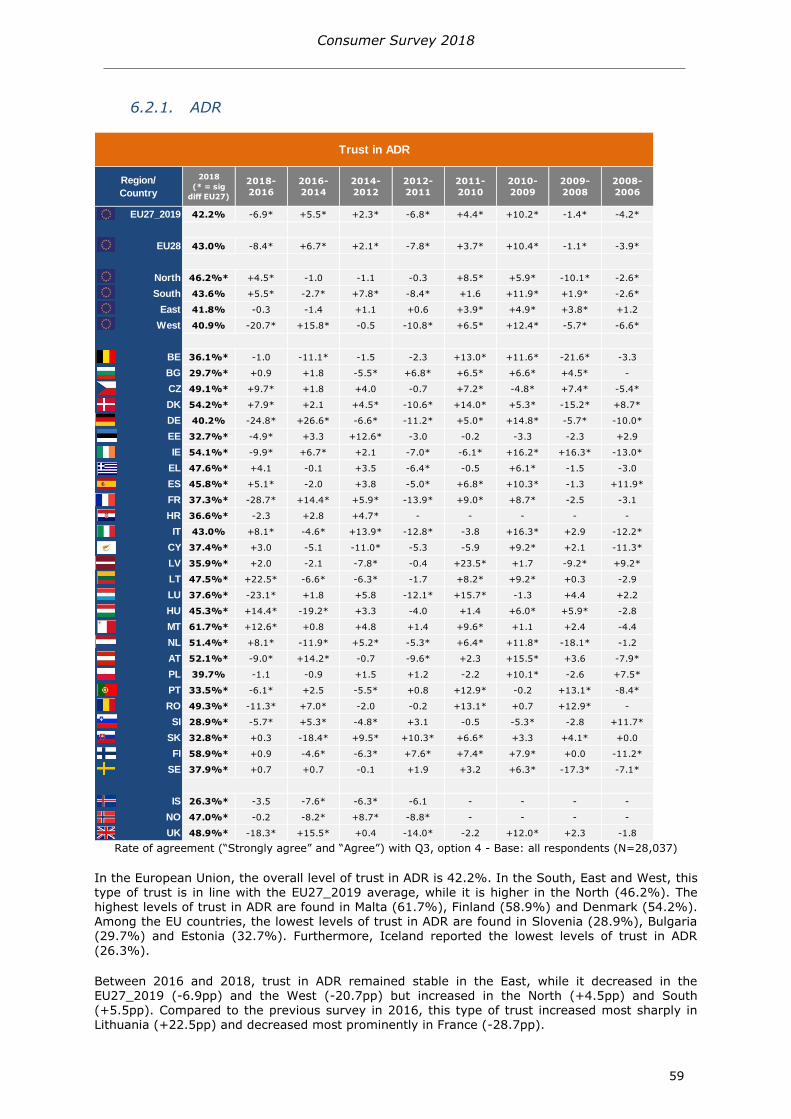
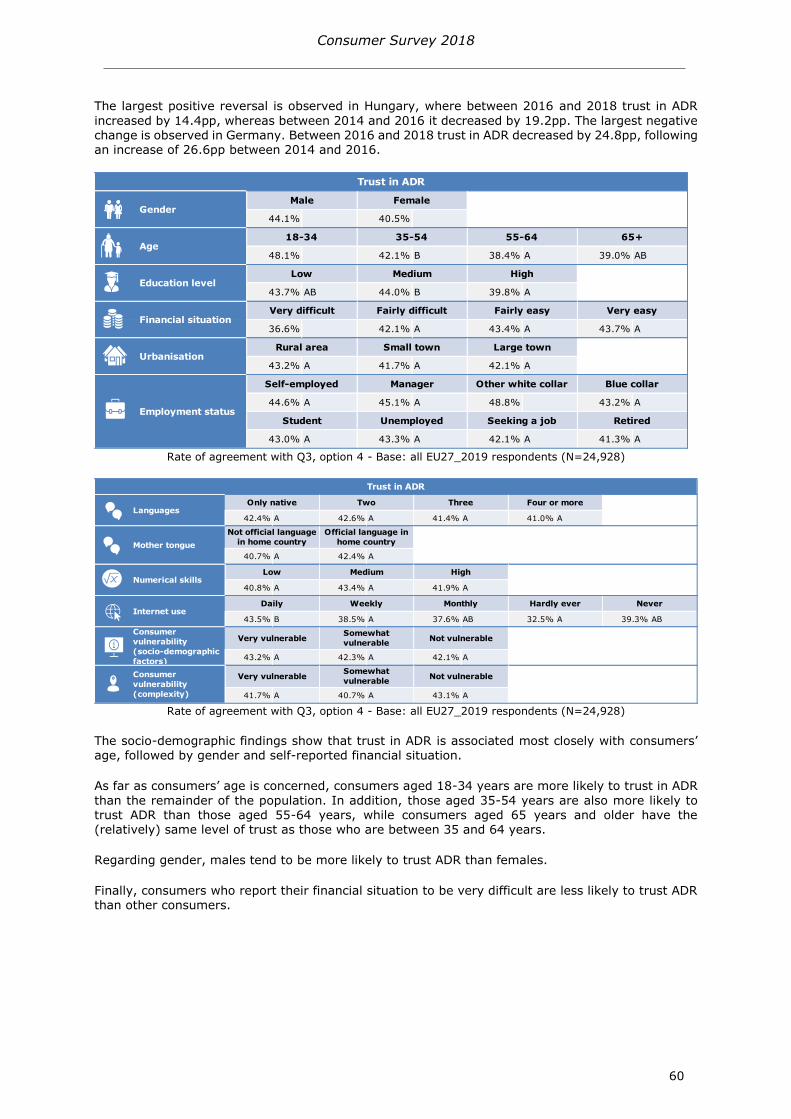
621 ADR 59
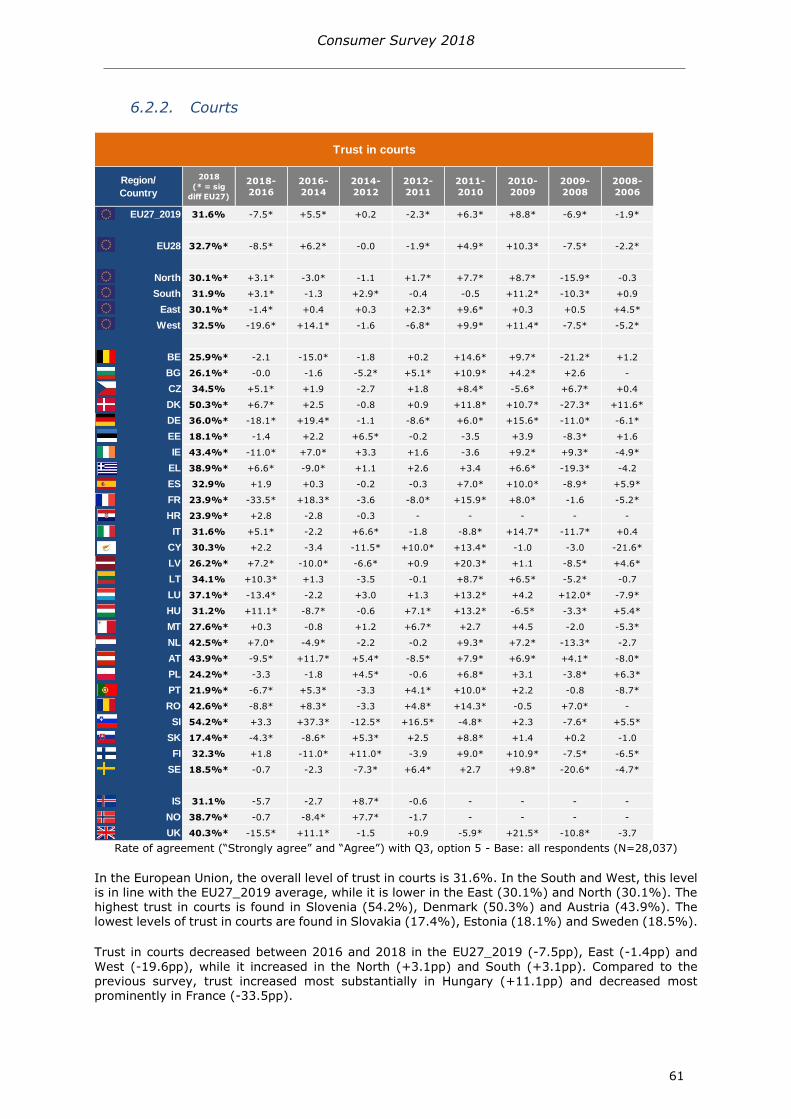
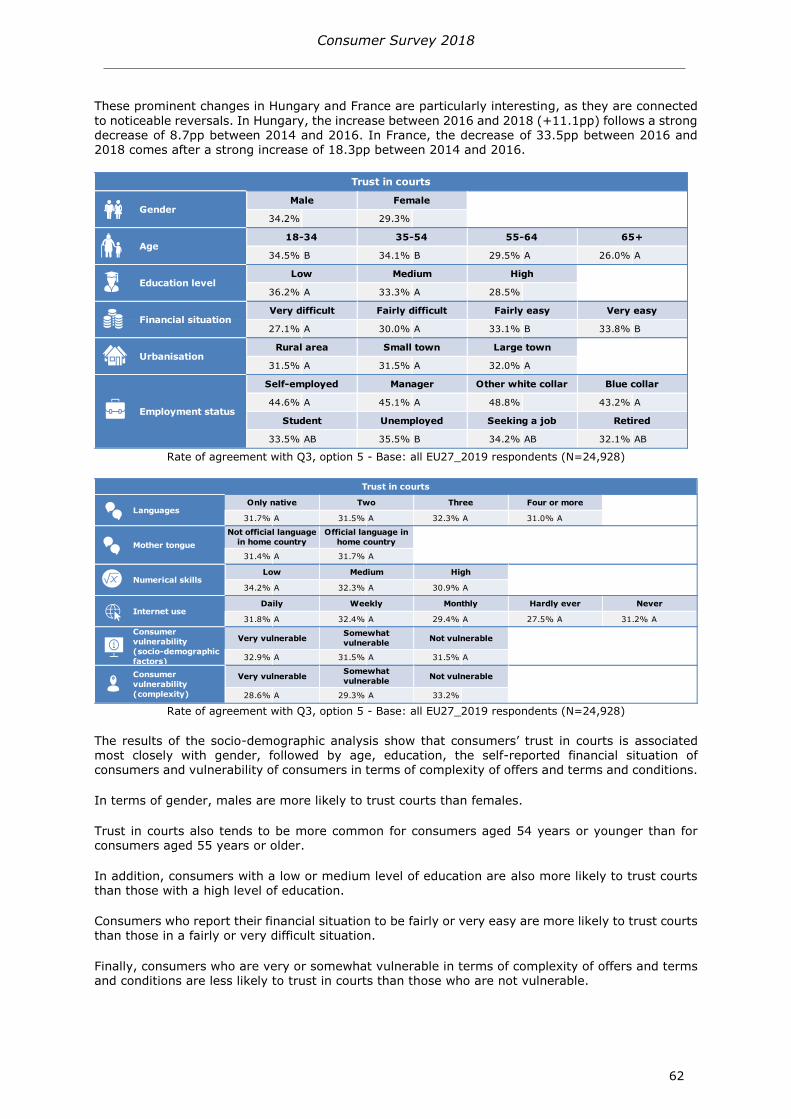
622 Courts 61
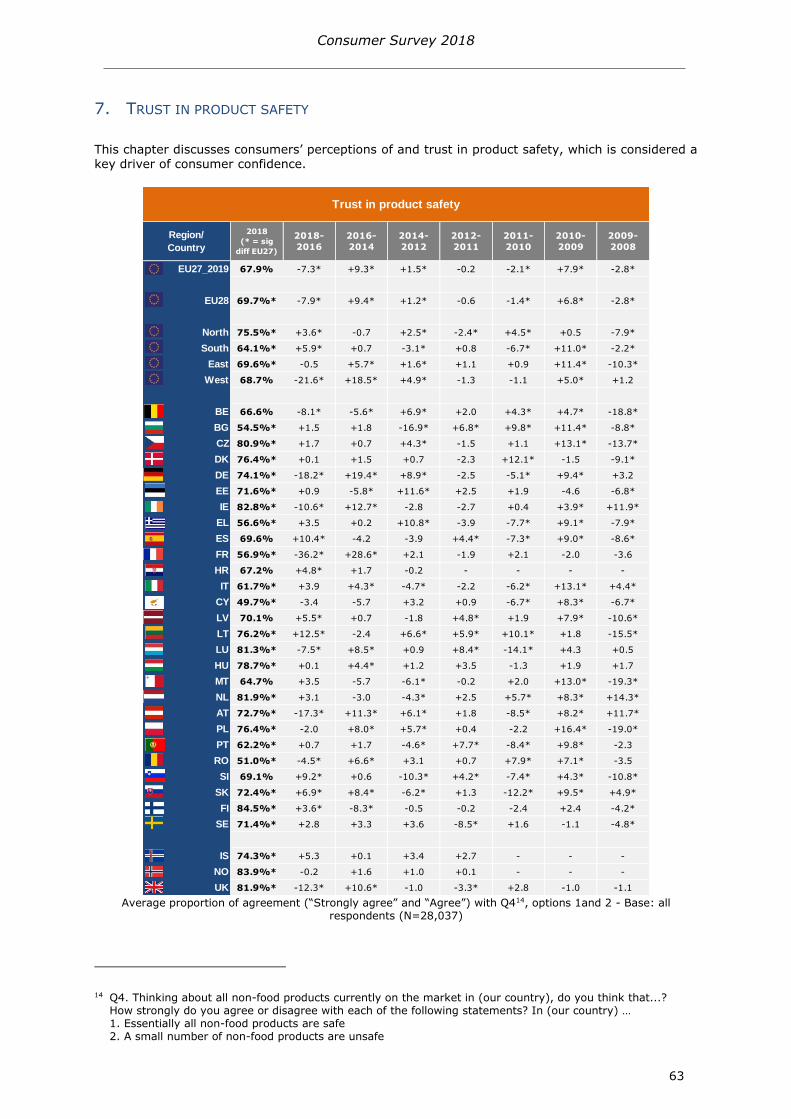
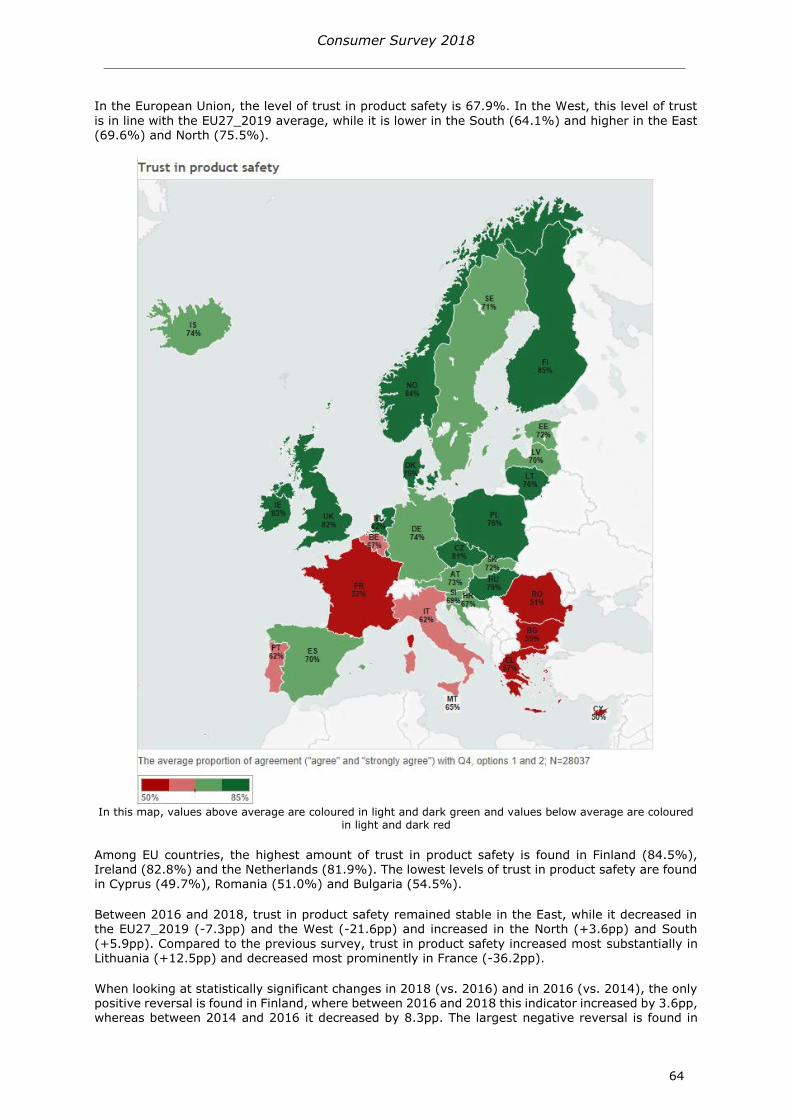
7 TRUST IN PRODUCT SAFETY 63
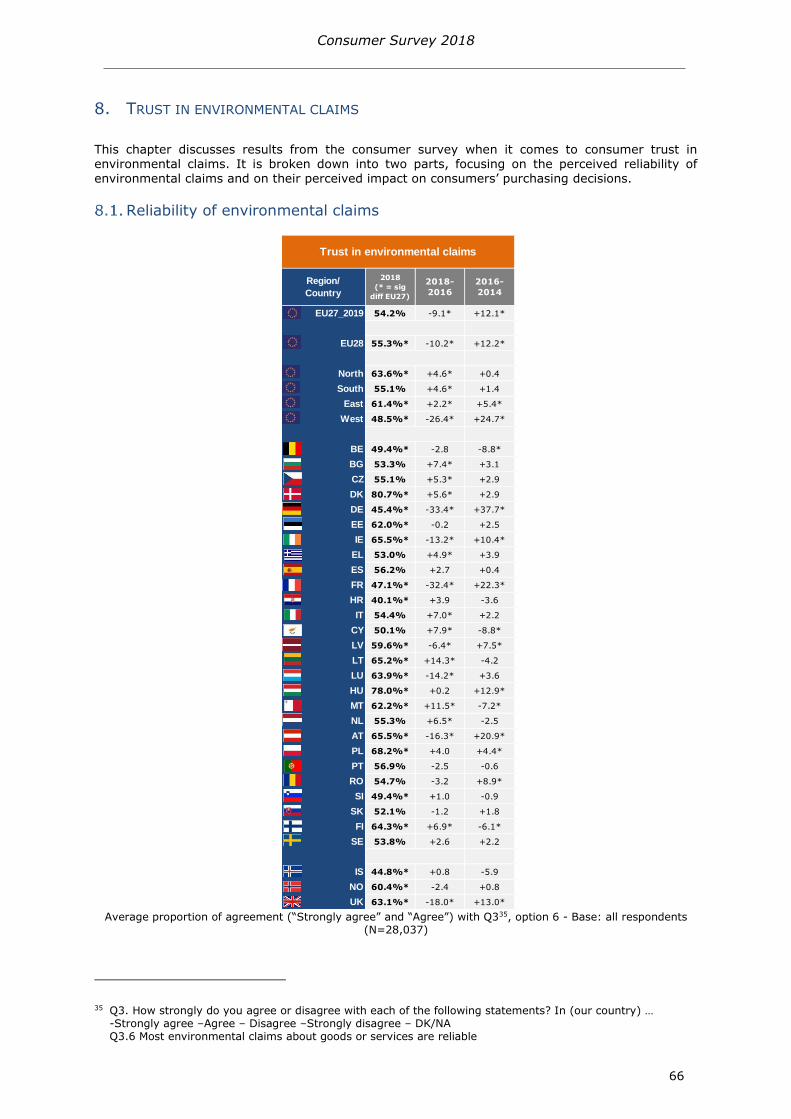
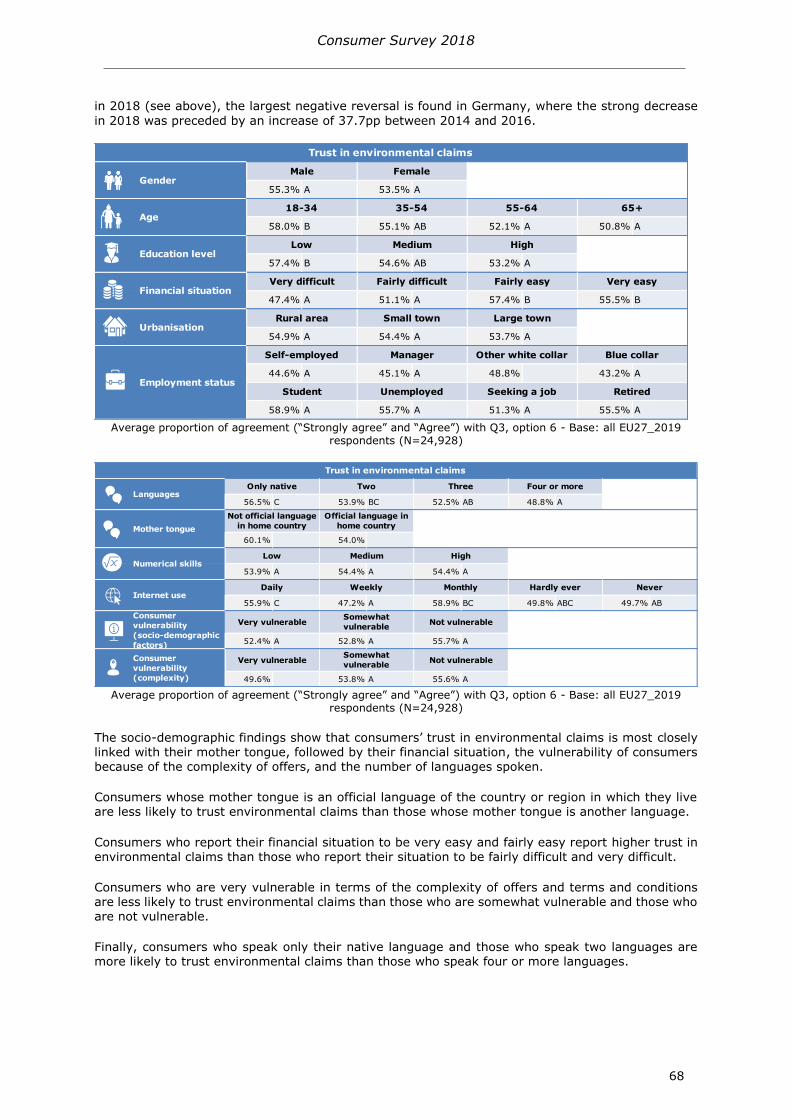
8 TRUST IN ENVIRONMENTAL CLAIMS 66
Reliability of environmental claims 66
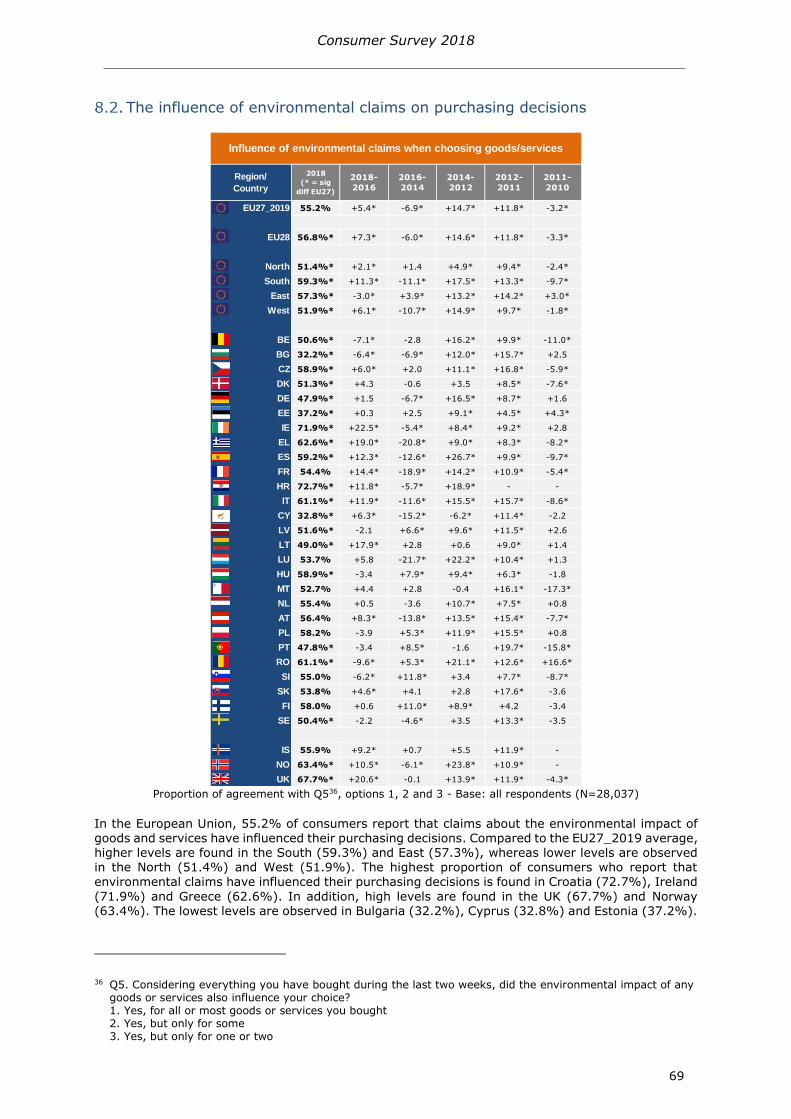
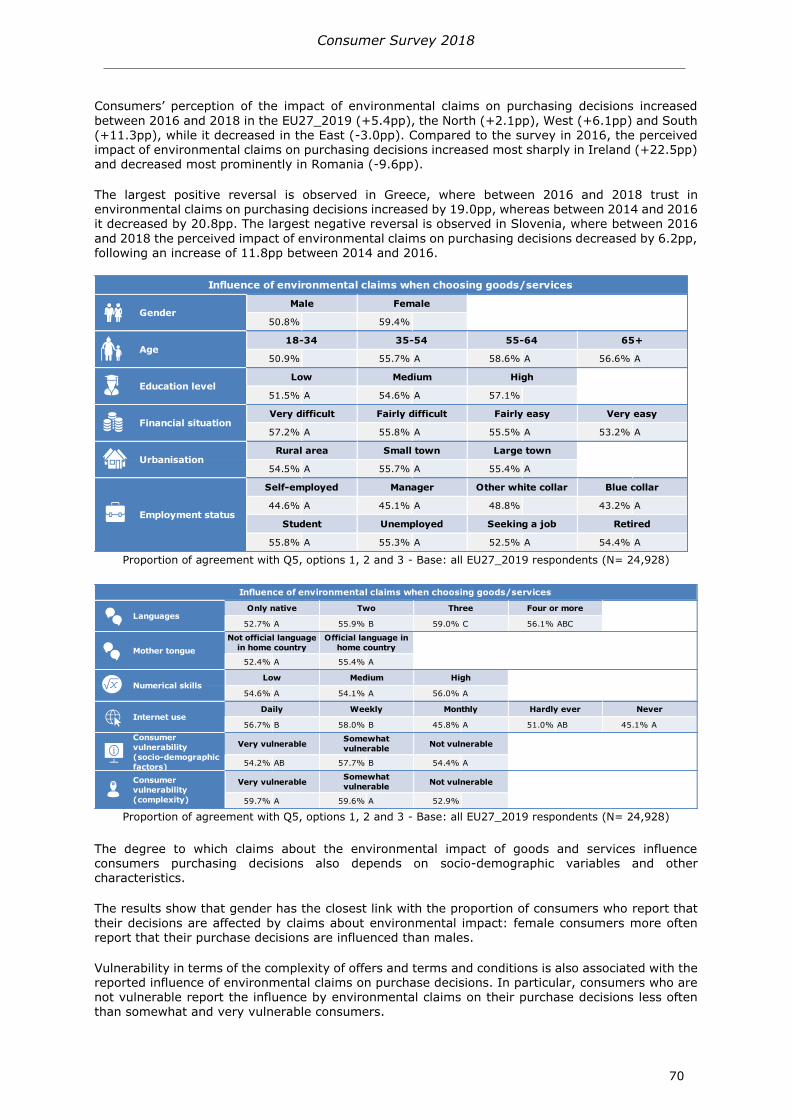
The influence of environmental claims on purchasing decisions 69
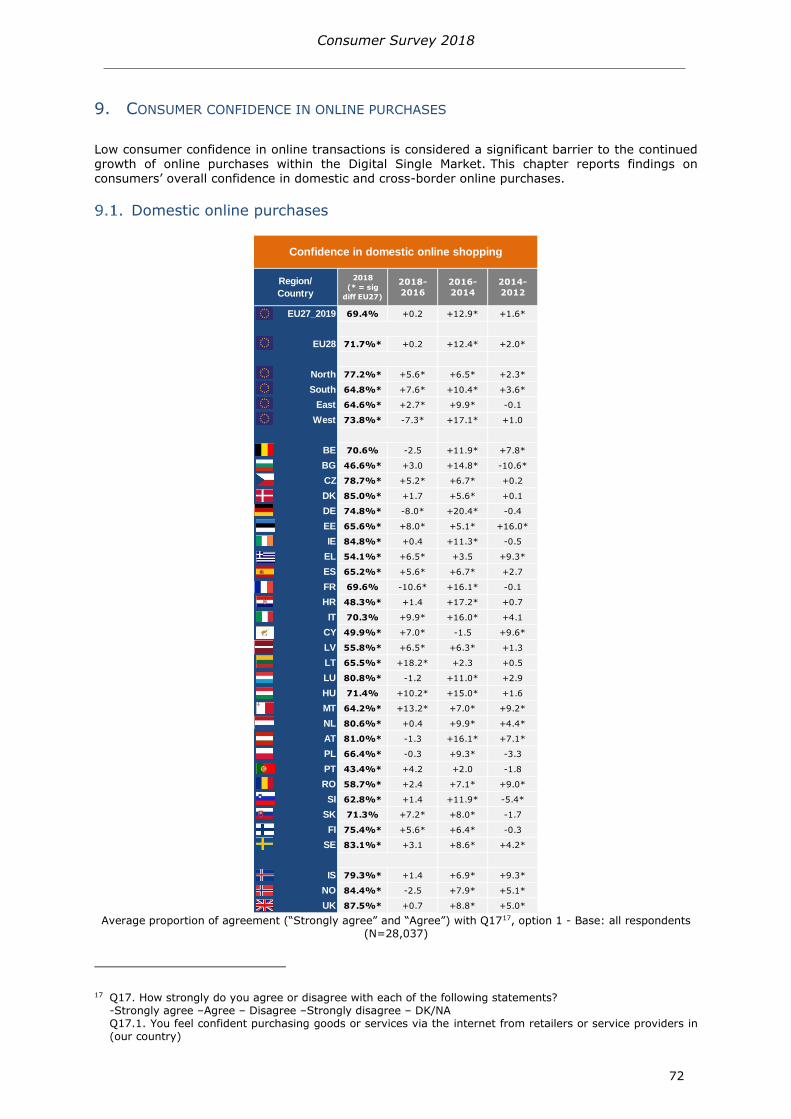
9 CONSUMER CONFIDENCE IN ONLINE PURCHASES 72
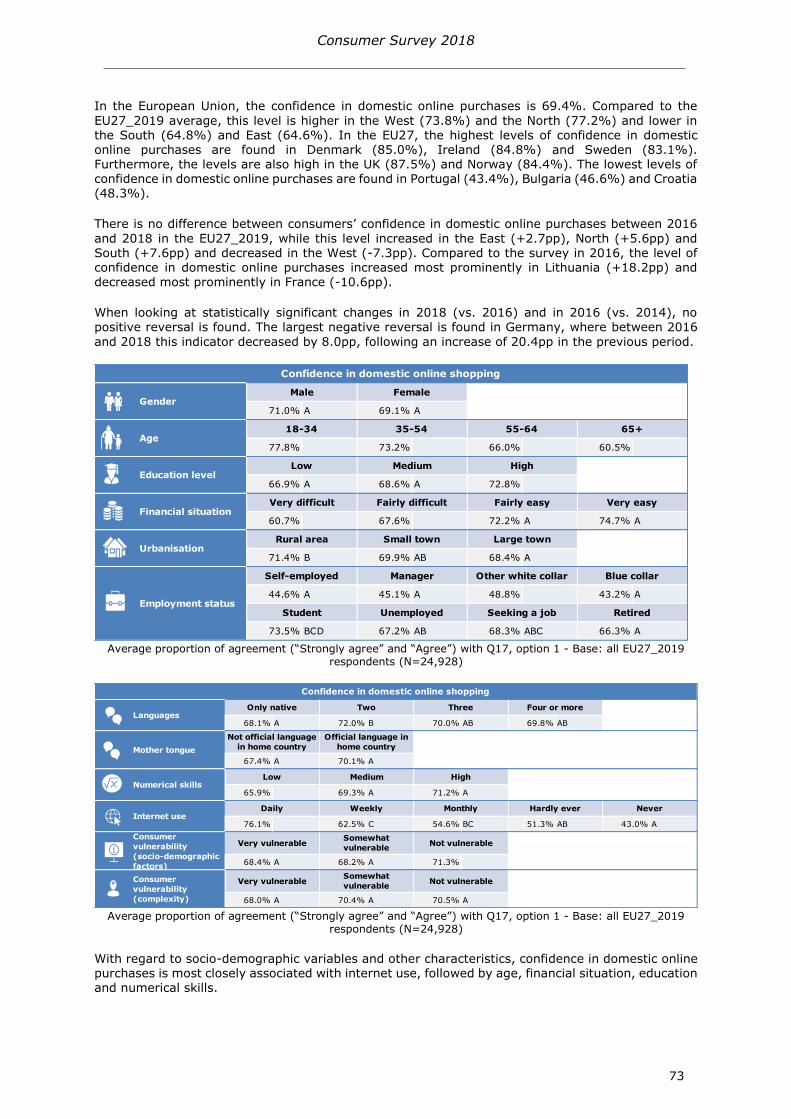
Domestic online purchases 72
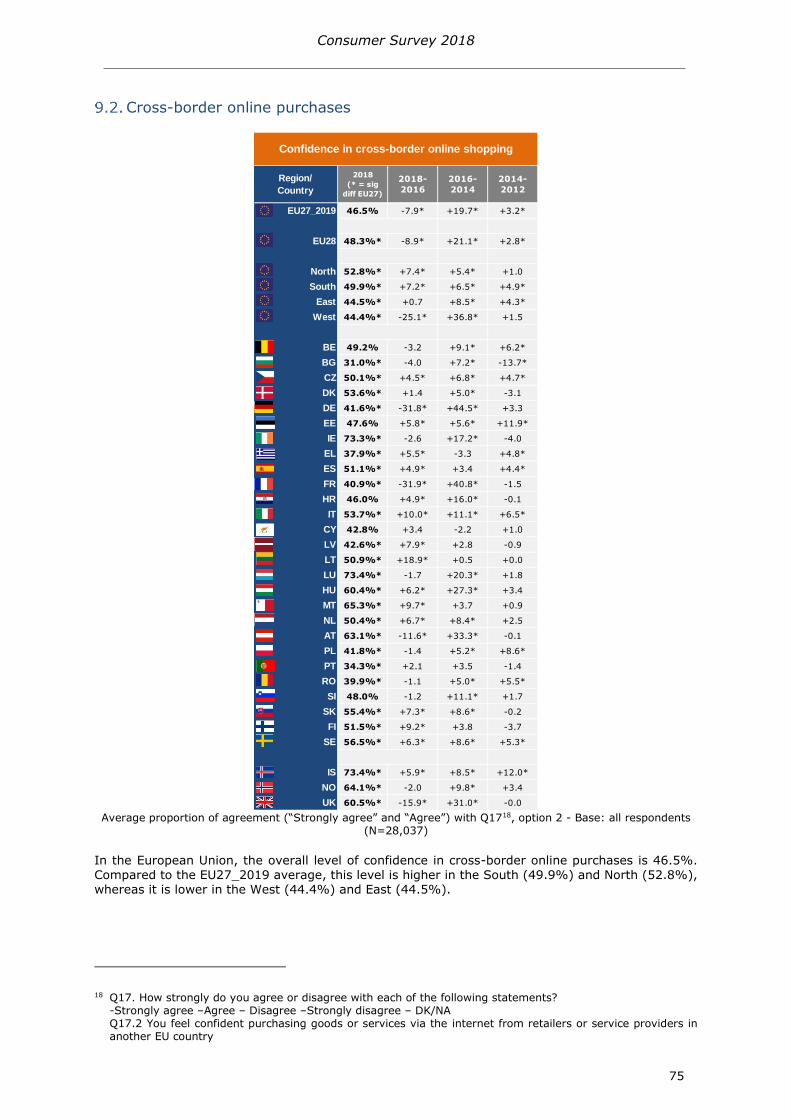
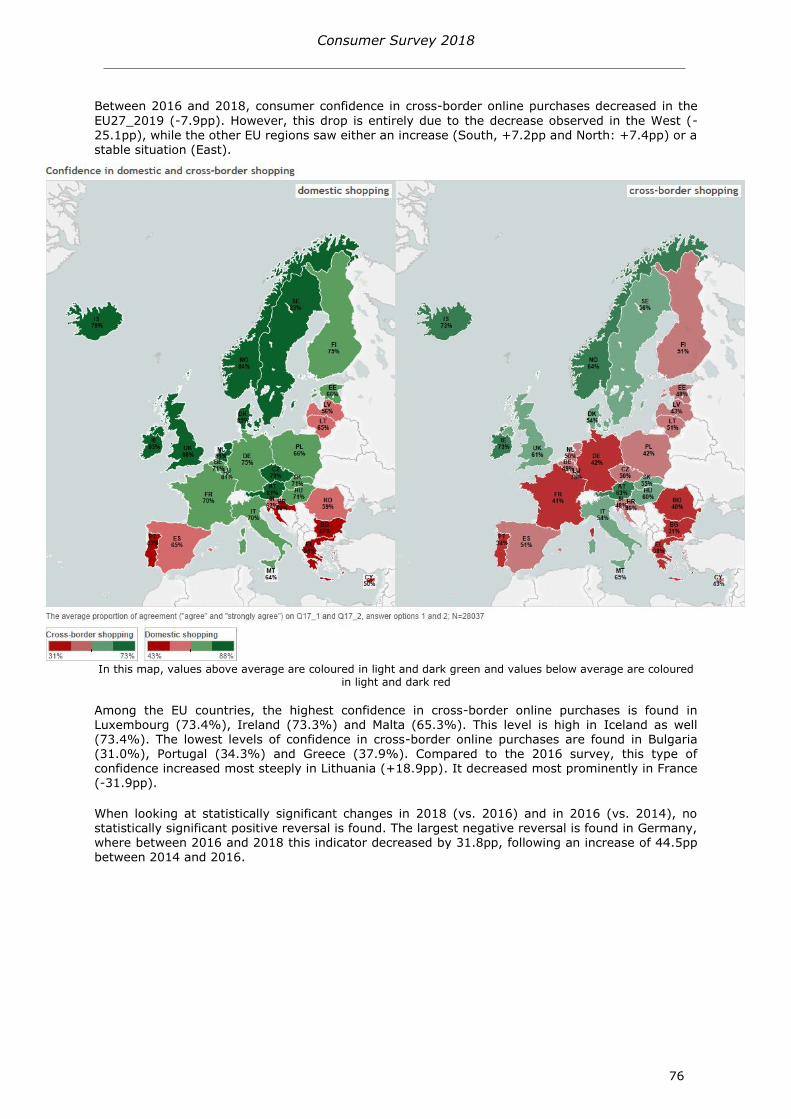
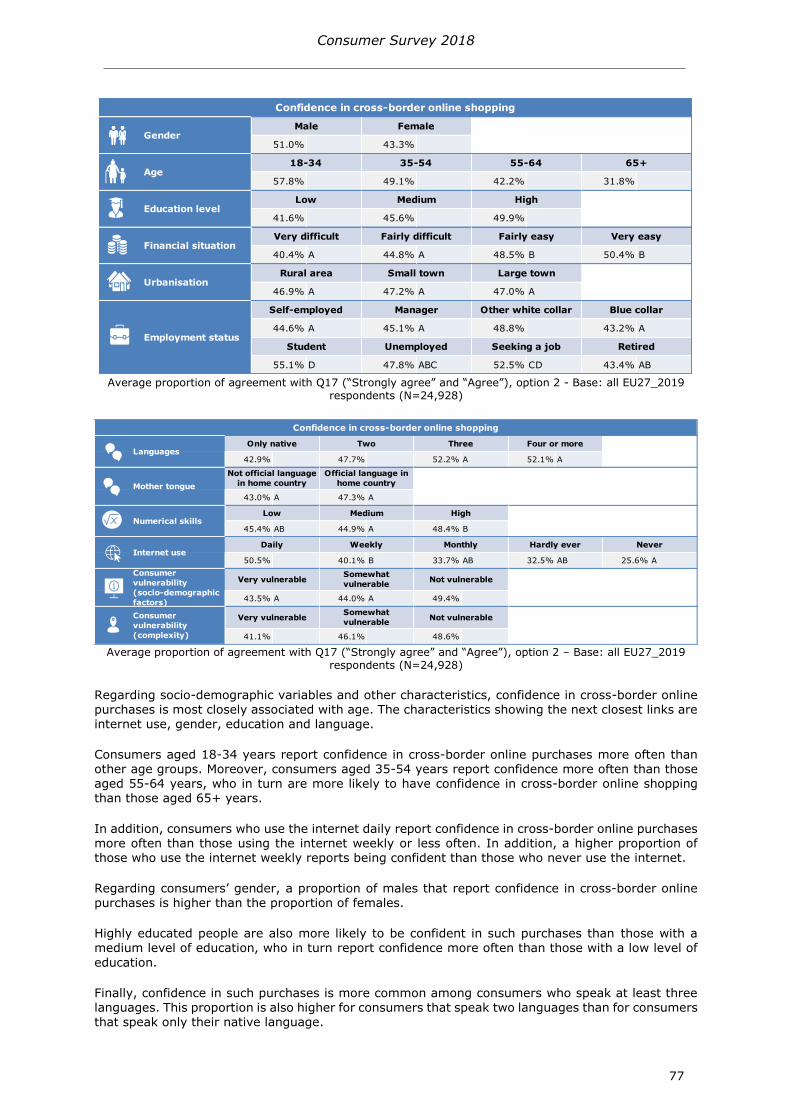
Cross-border online purchases 75
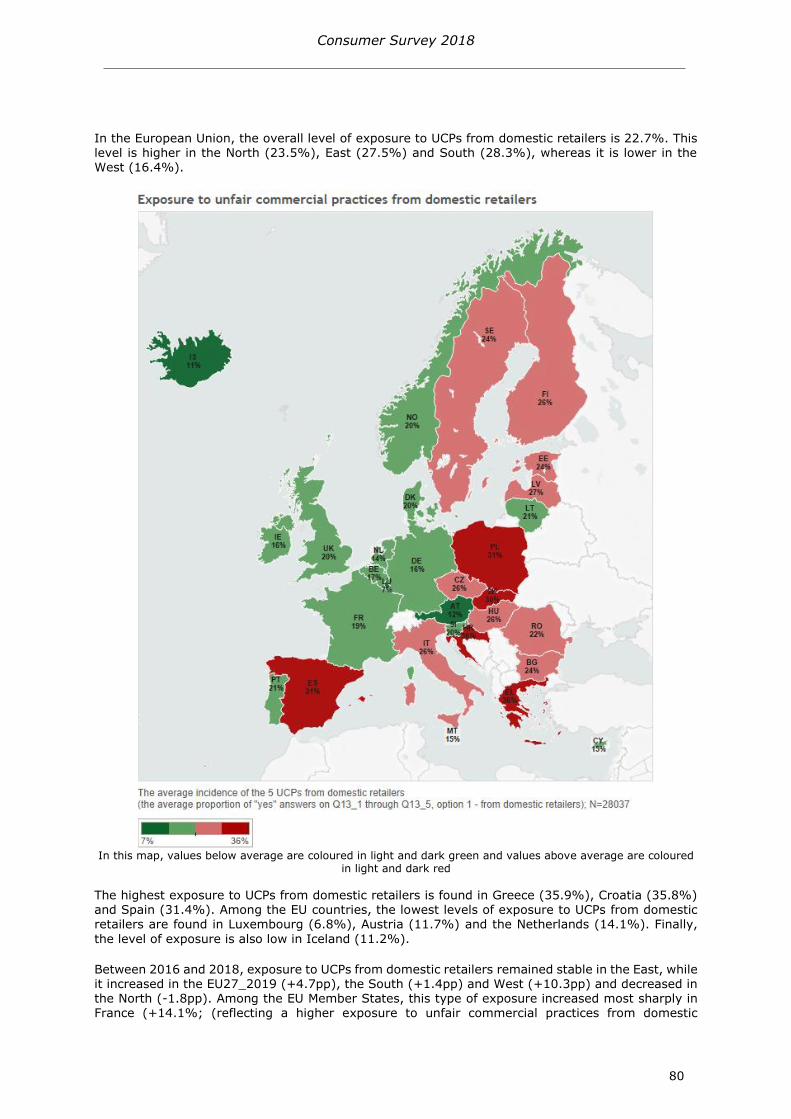
10 UNFAIR COMMERCIAL PRACTICES 78
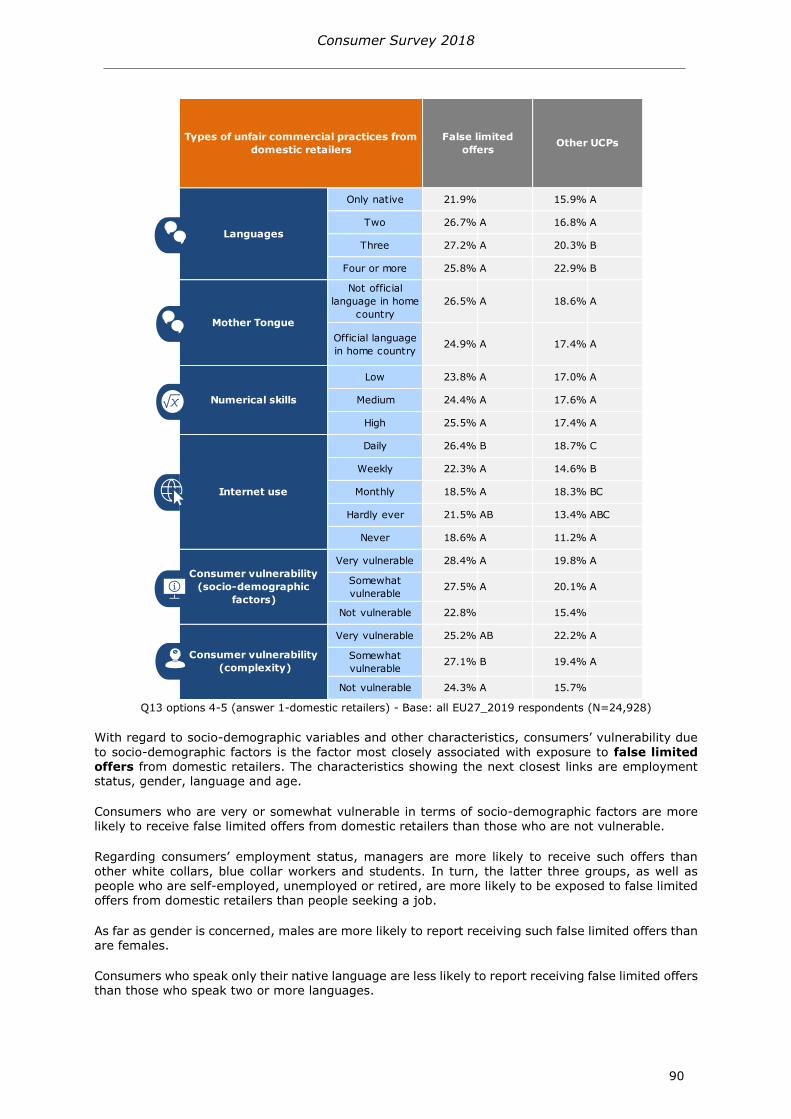
Unfair commercial practices from domestic retailers 78
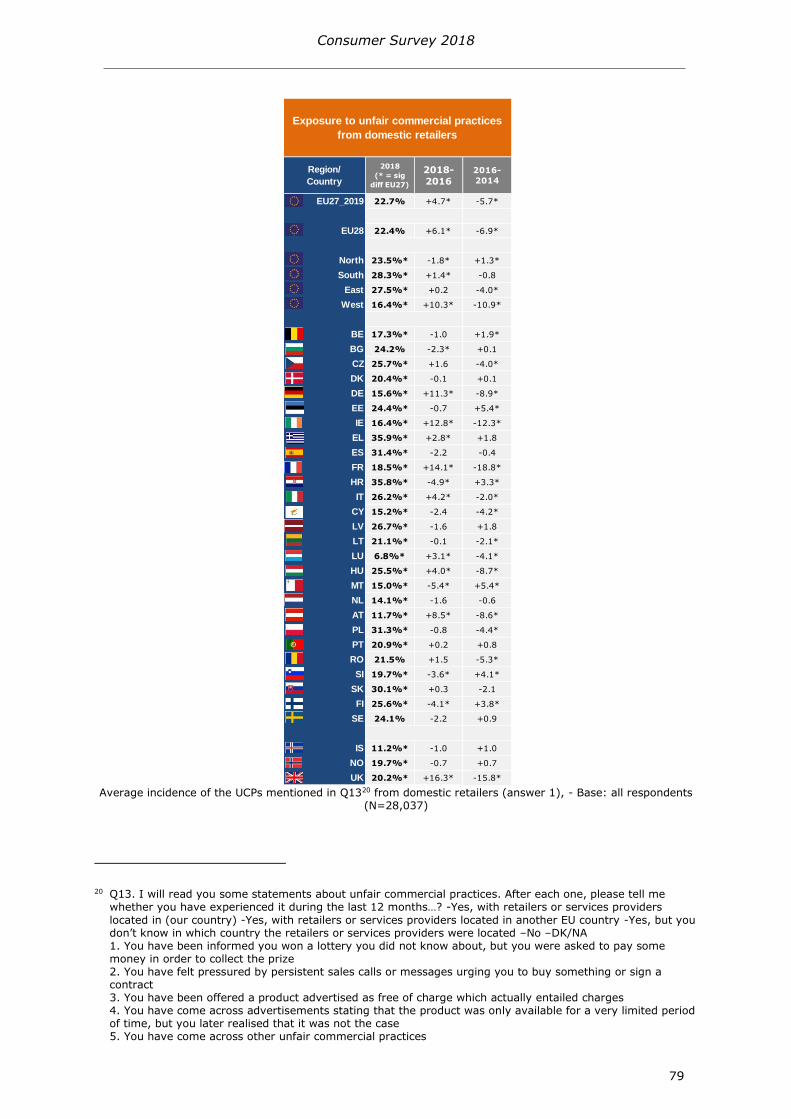
1011 Exposure to UCPs from domestic retailers 78
1012 Types of UCPs from domestic retailers 82
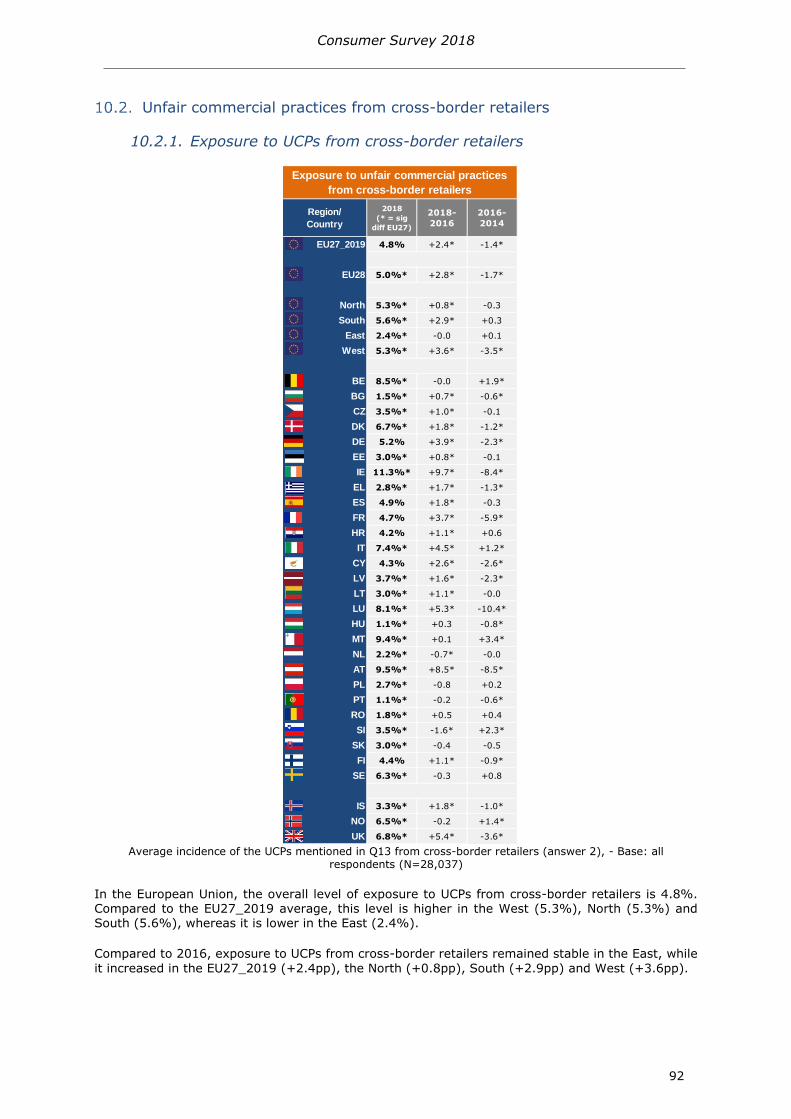
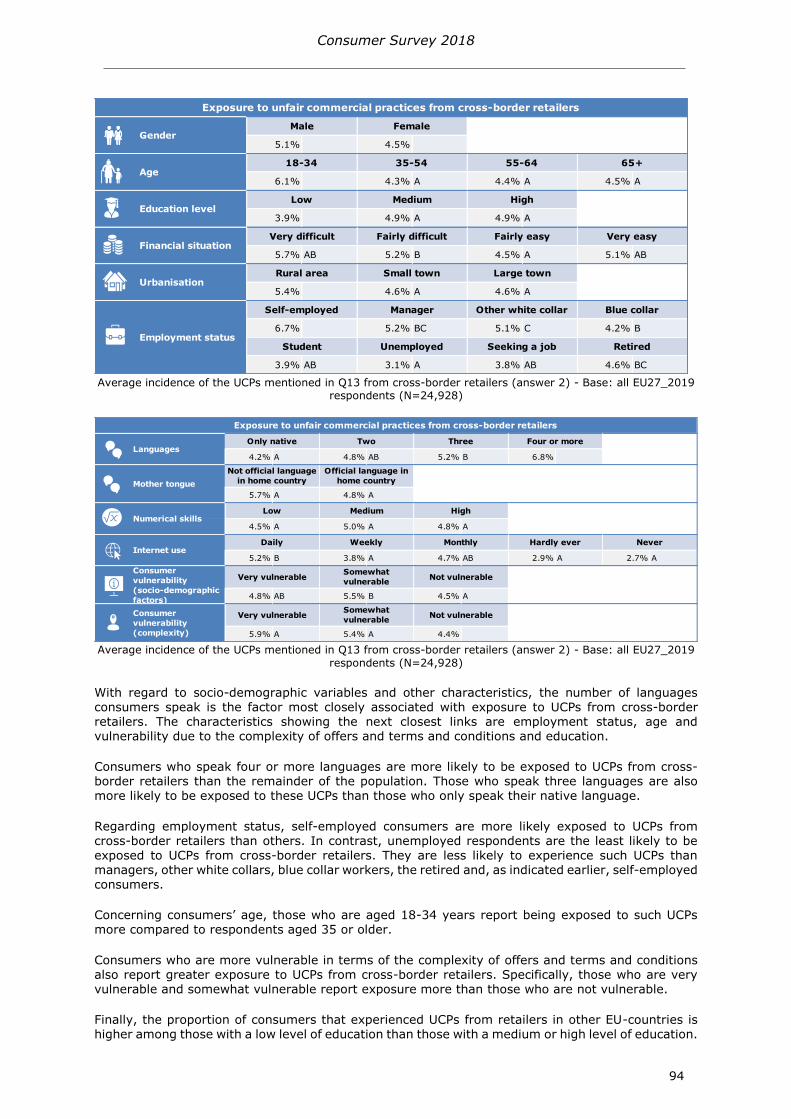
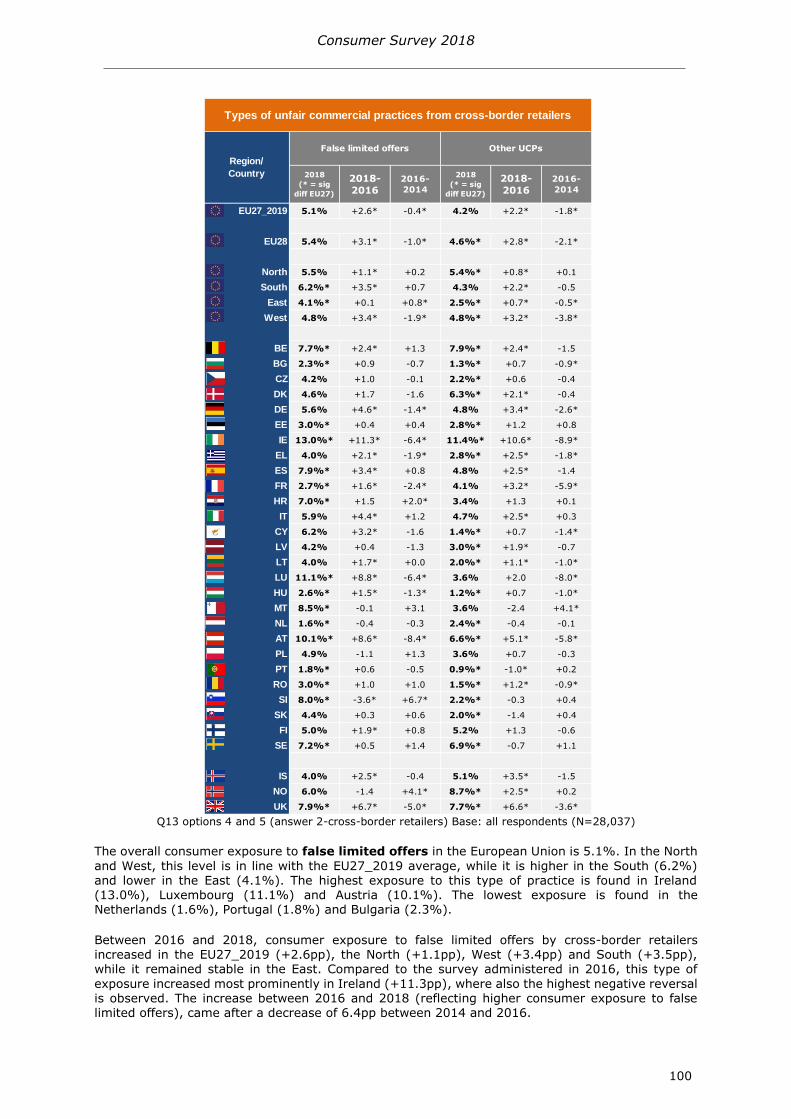
Unfair commercial practices from cross-border retailers 92
1021 Exposure to UCPs from cross-border retailers 92
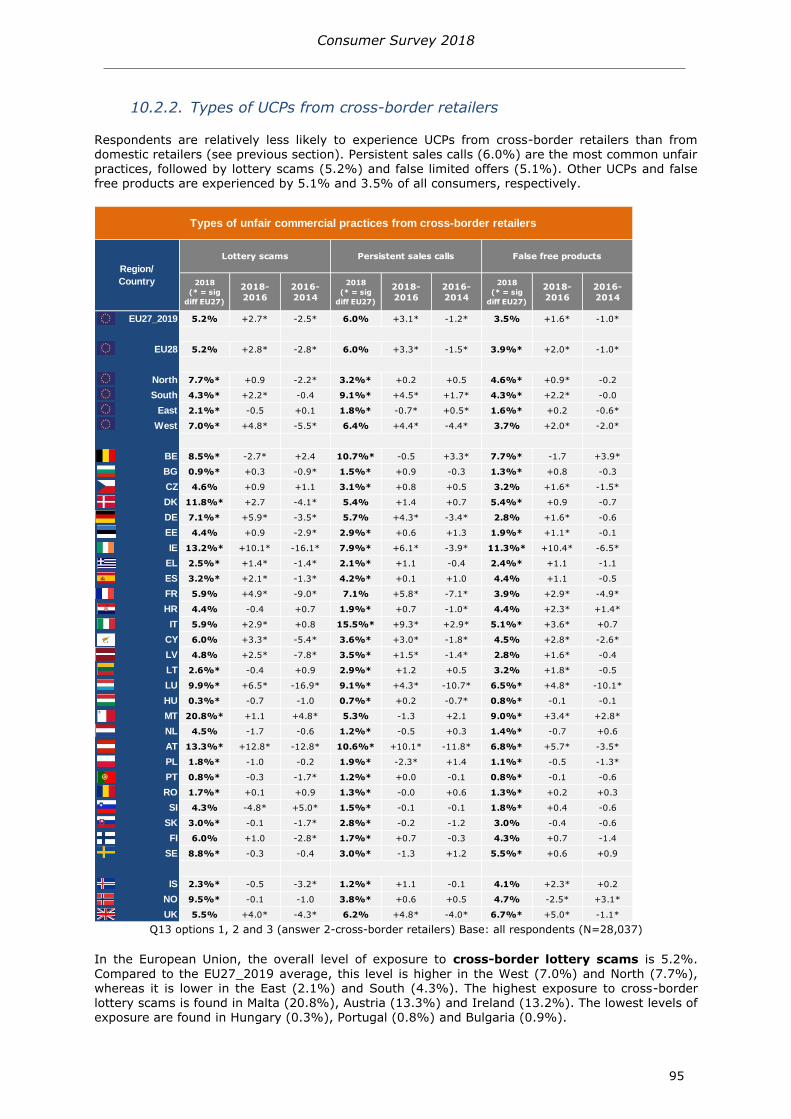
1022 Types of UCPs from cross-border retailers 95
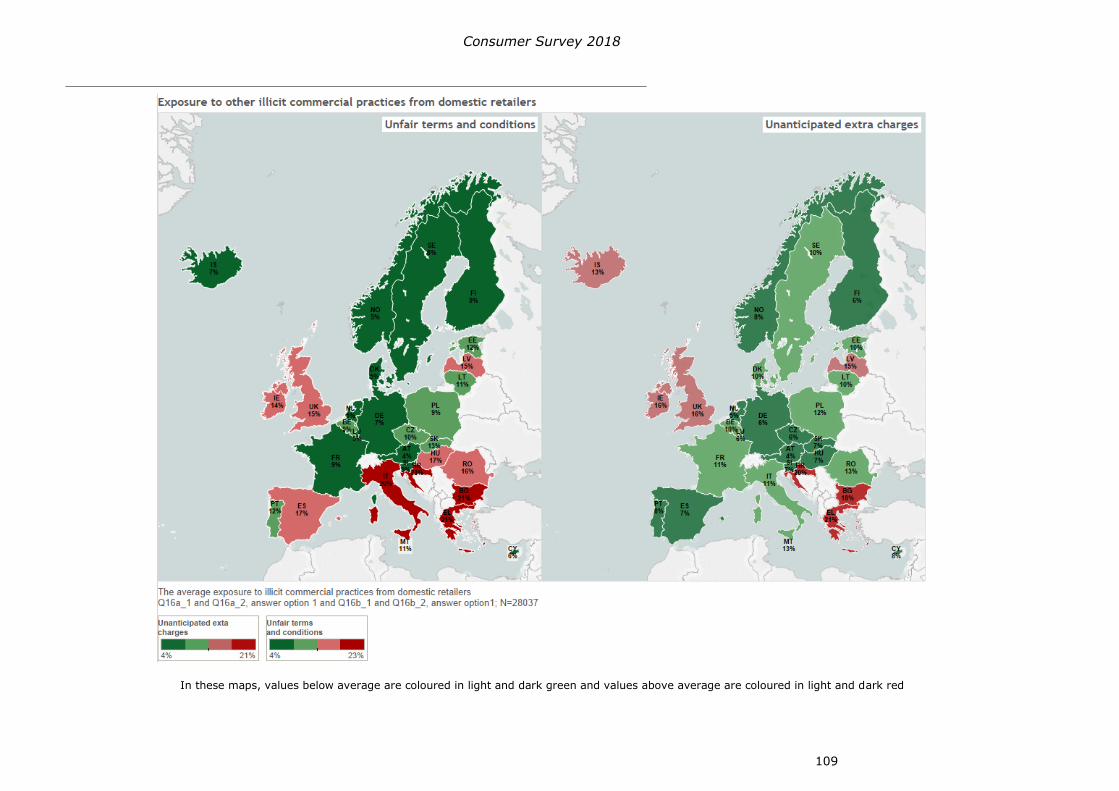
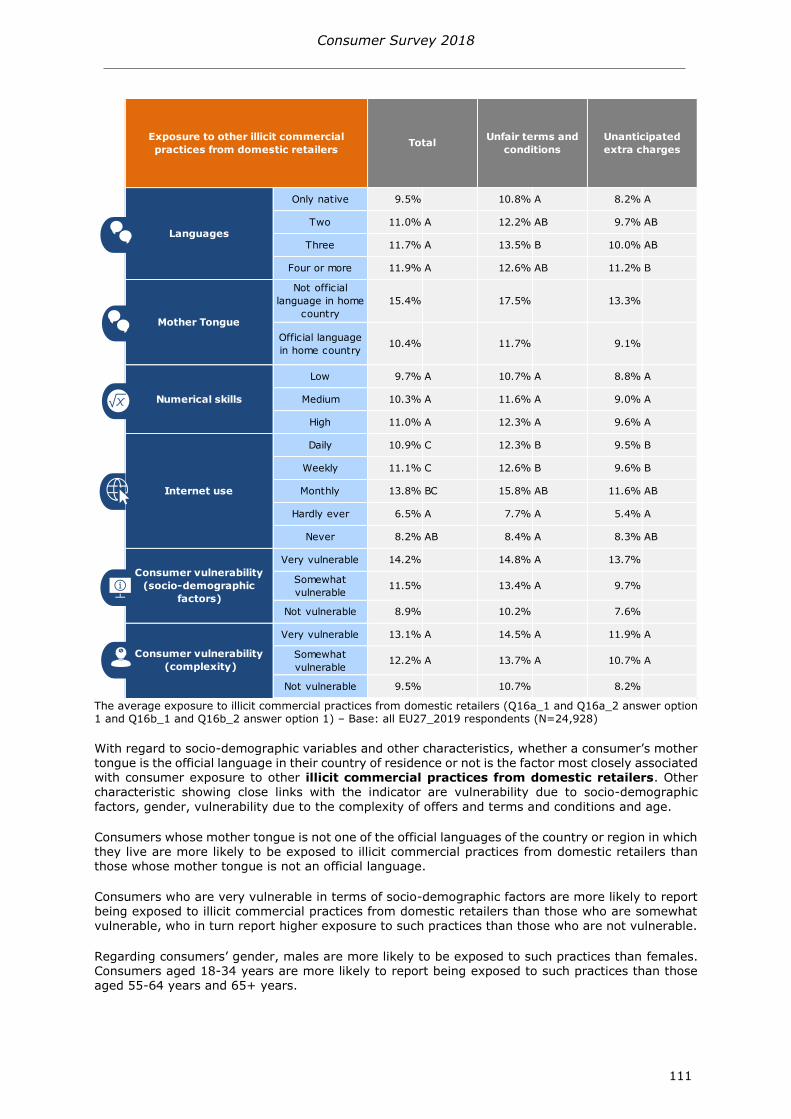
Other illicit commercial practices from domestic retailers 105
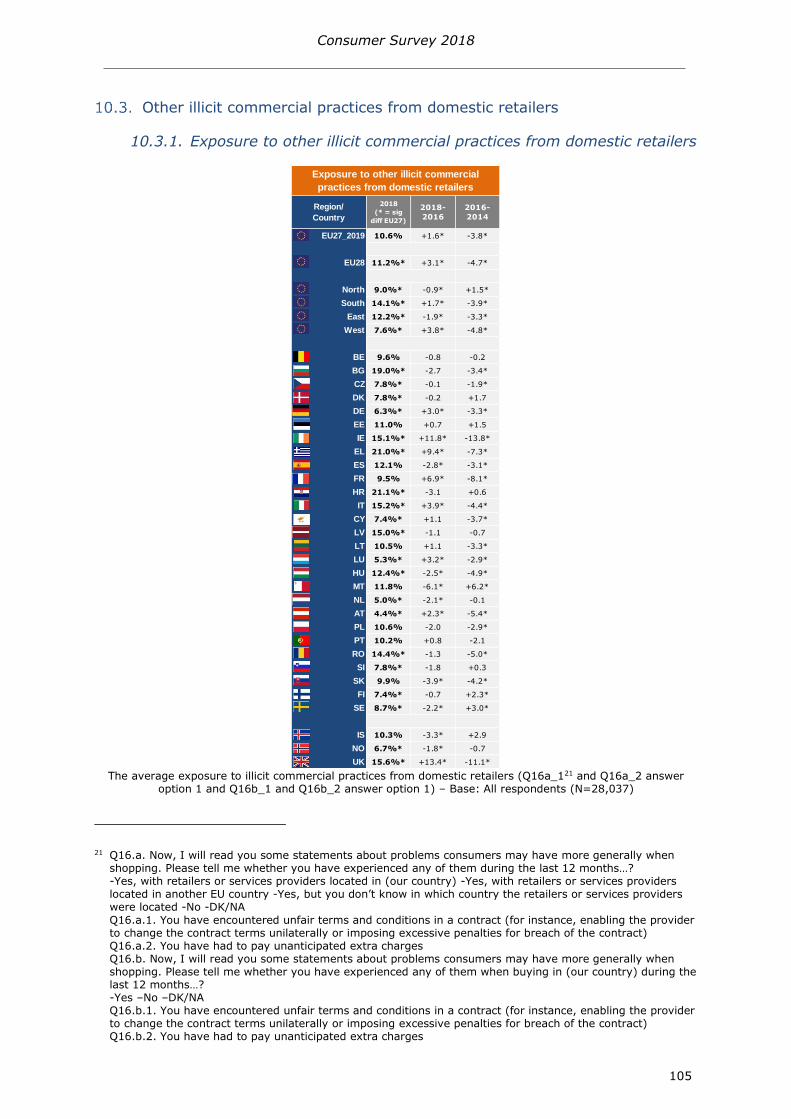
1031 Exposure to other illicit commercial practices from domestic retailers 105
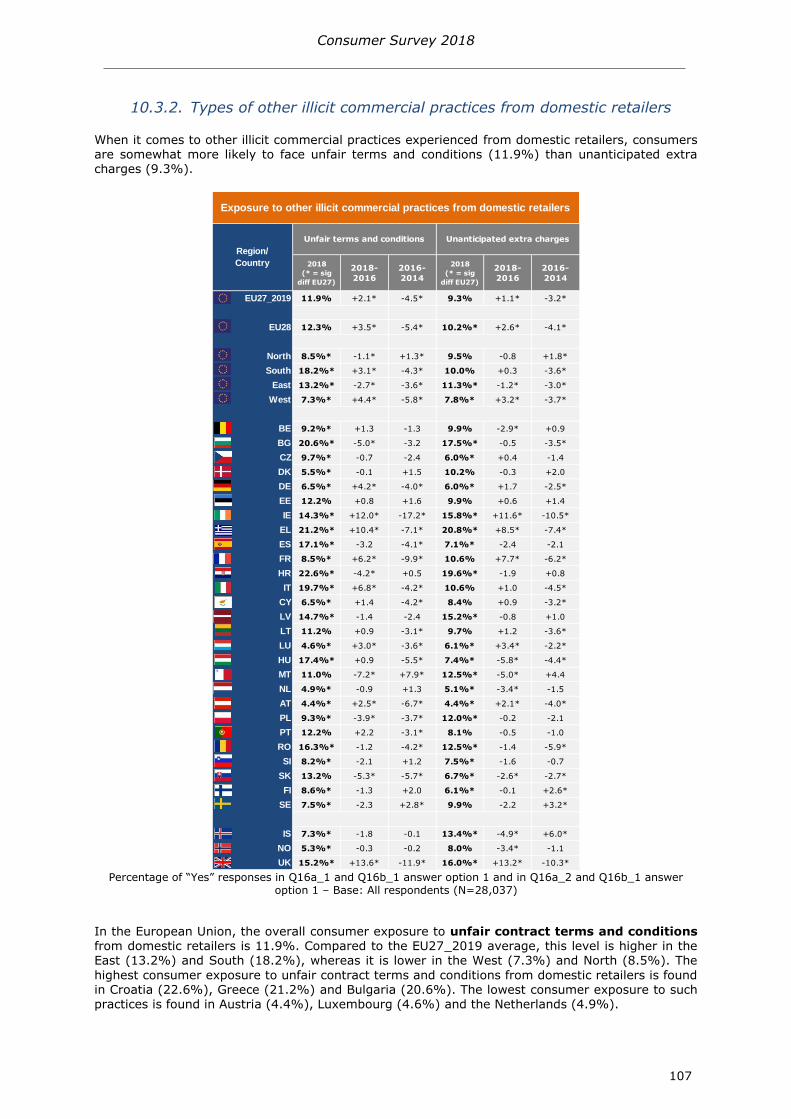
1032 Types of other illicit commercial practices from domestic retailers 107
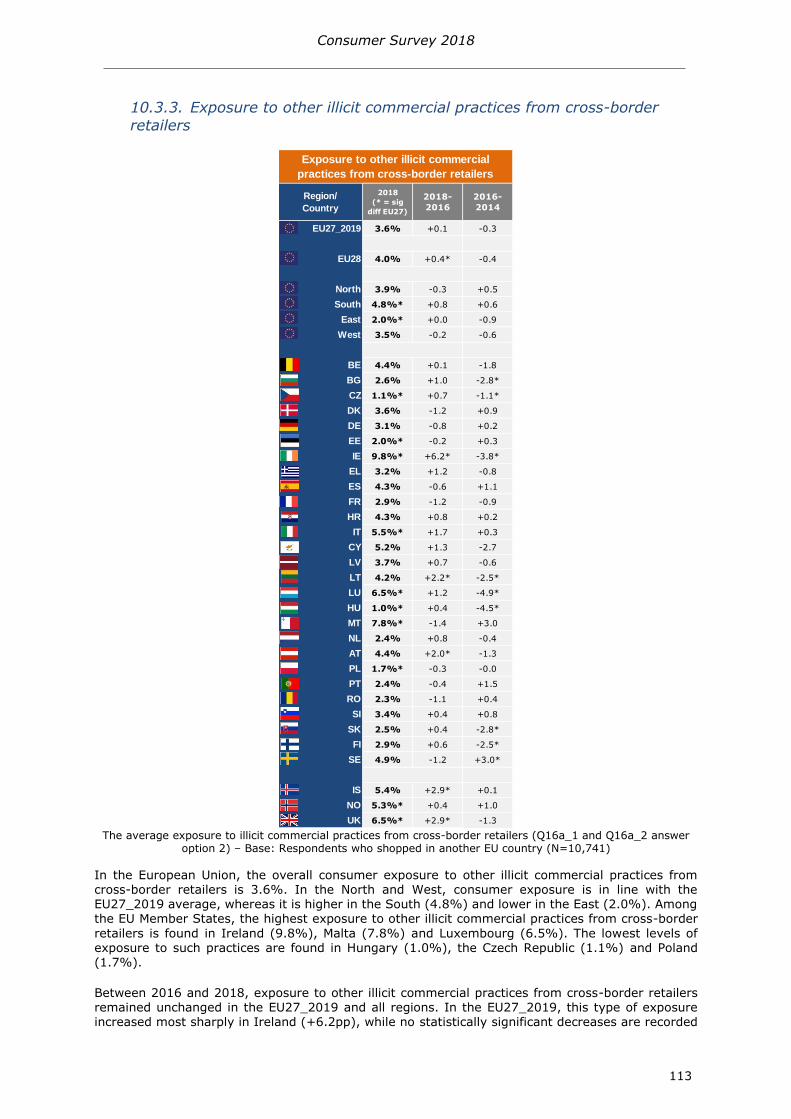
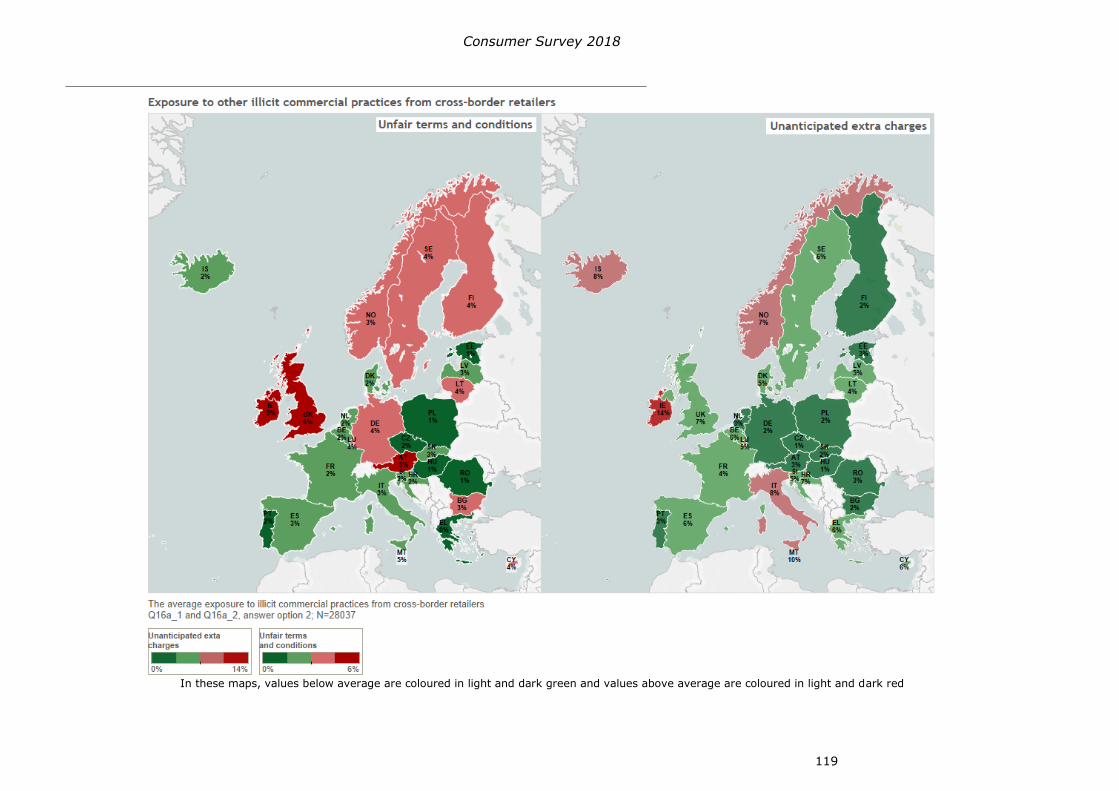
1033 Exposure to other illicit commercial practices from cross-border retailers 113
Consumer Survey 2018
6
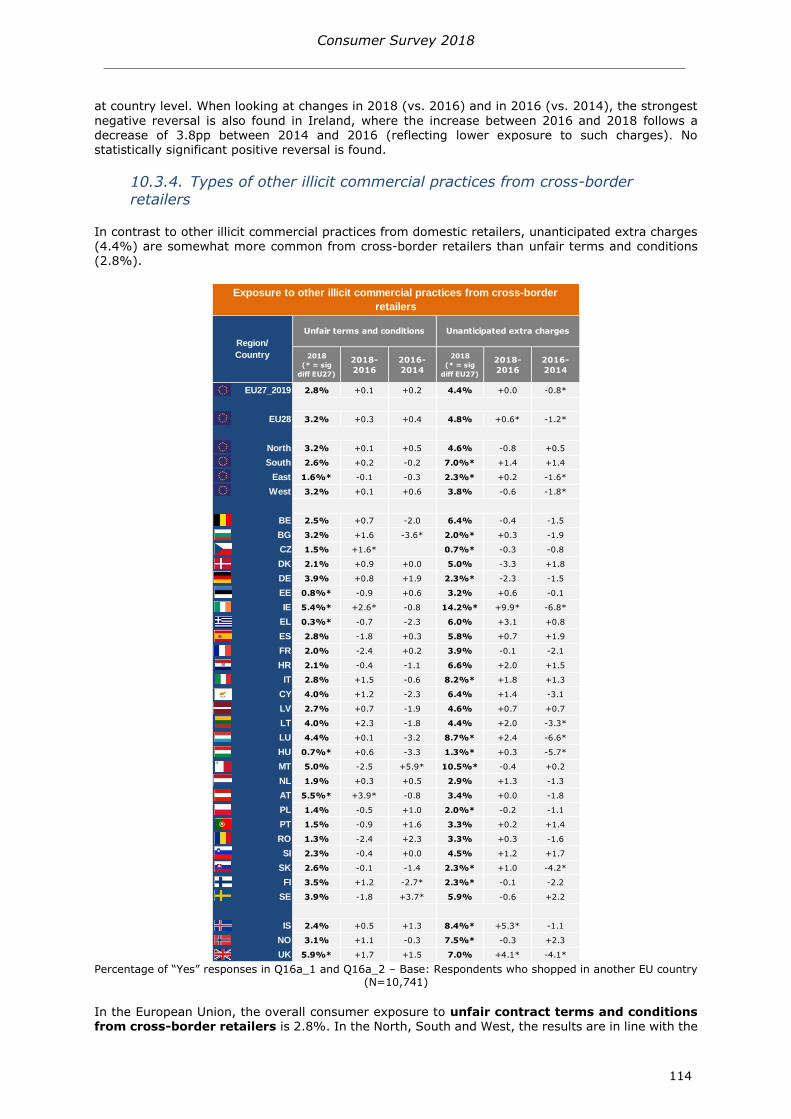
1034 Types of other illicit commercial practices from cross-border retailers 114
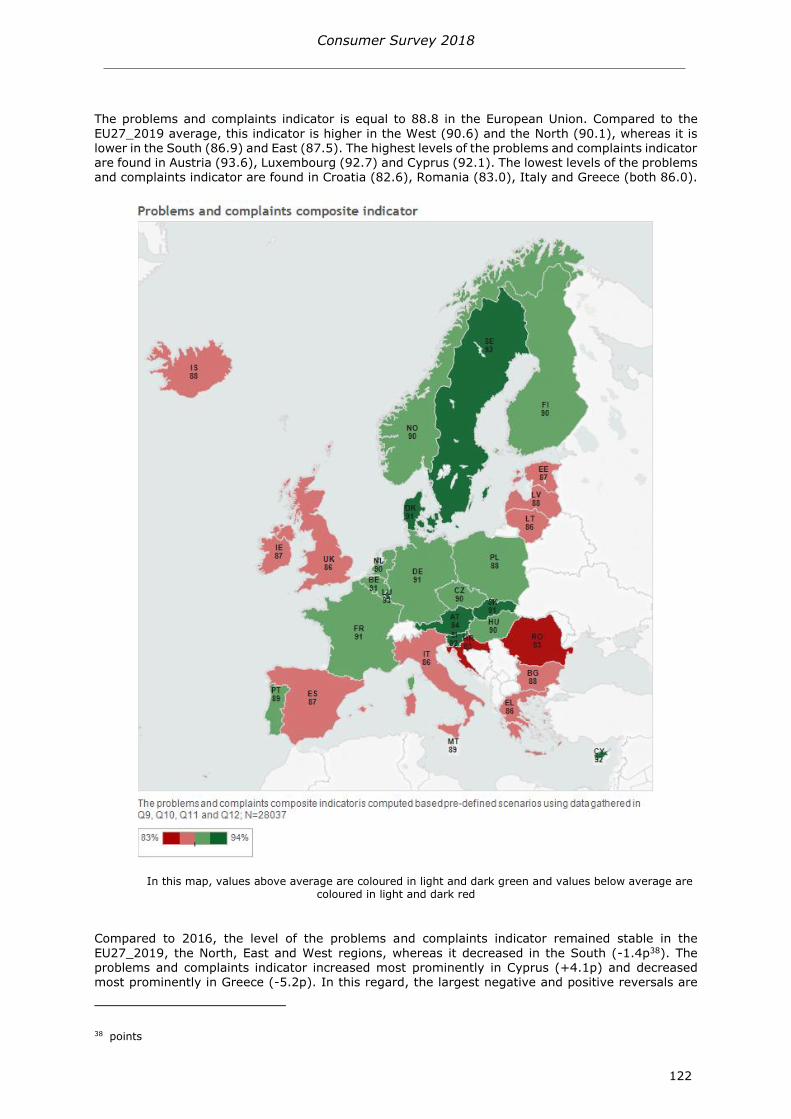
11 OVERALL PROBLEMS AND DISPUTE RESOLUTION 120
The problems and complaints indicator 120
1111 No problems 124
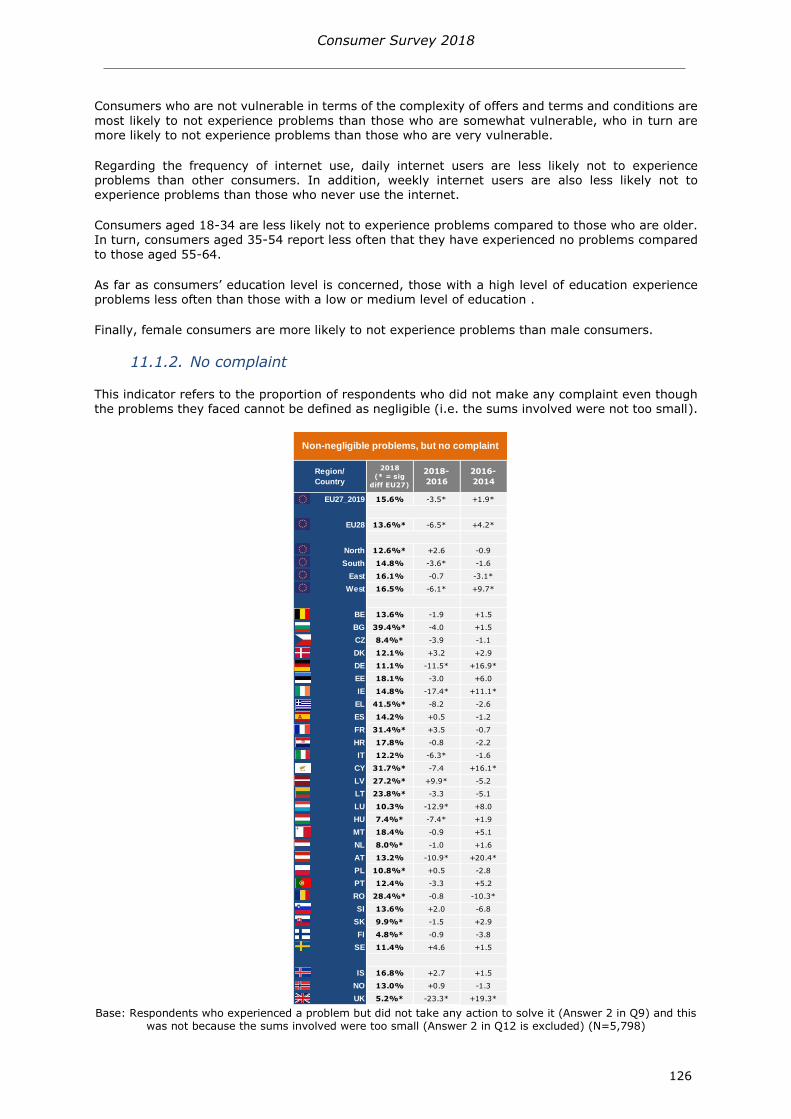
1112 No complaint 126
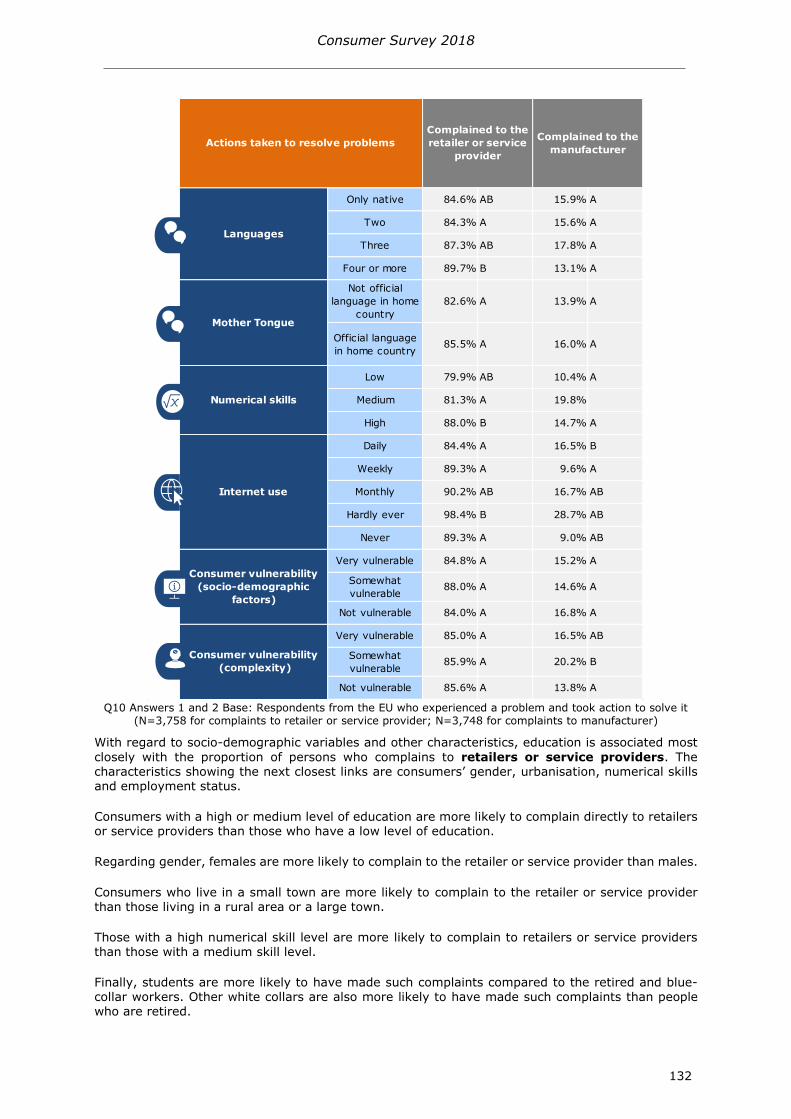
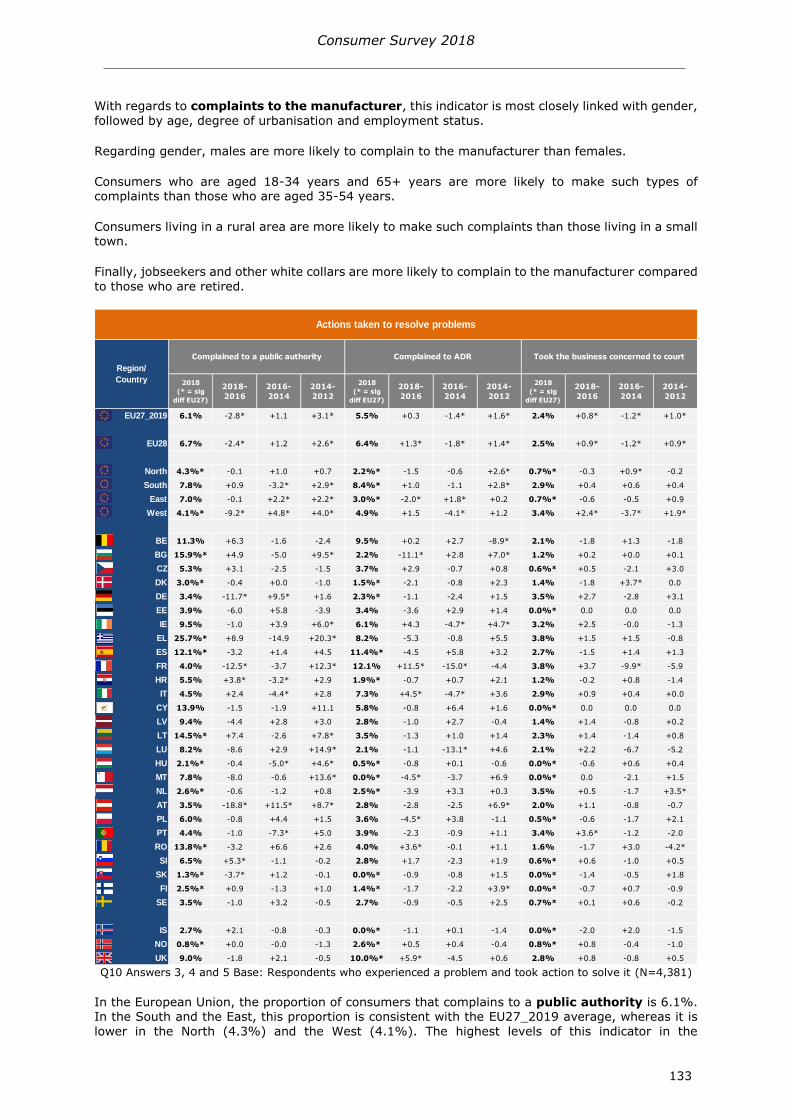
Actions taken to resolve problems (breakdown by kind of action plus no action taken) 129
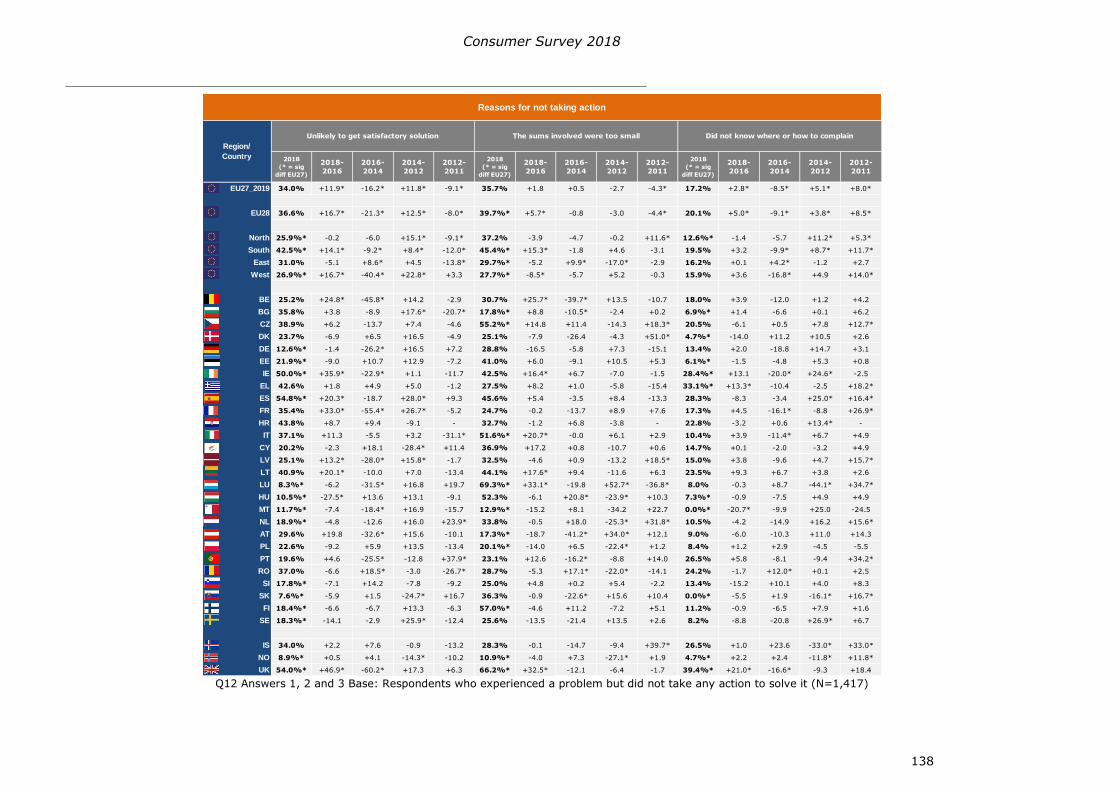
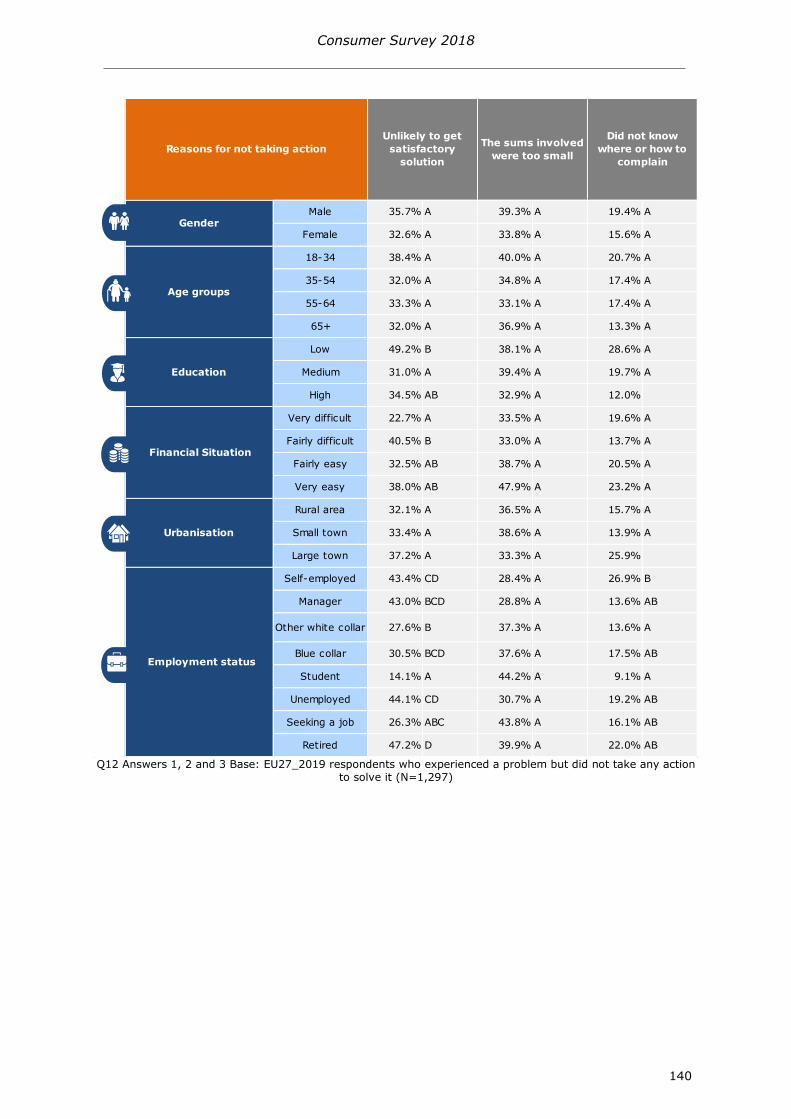
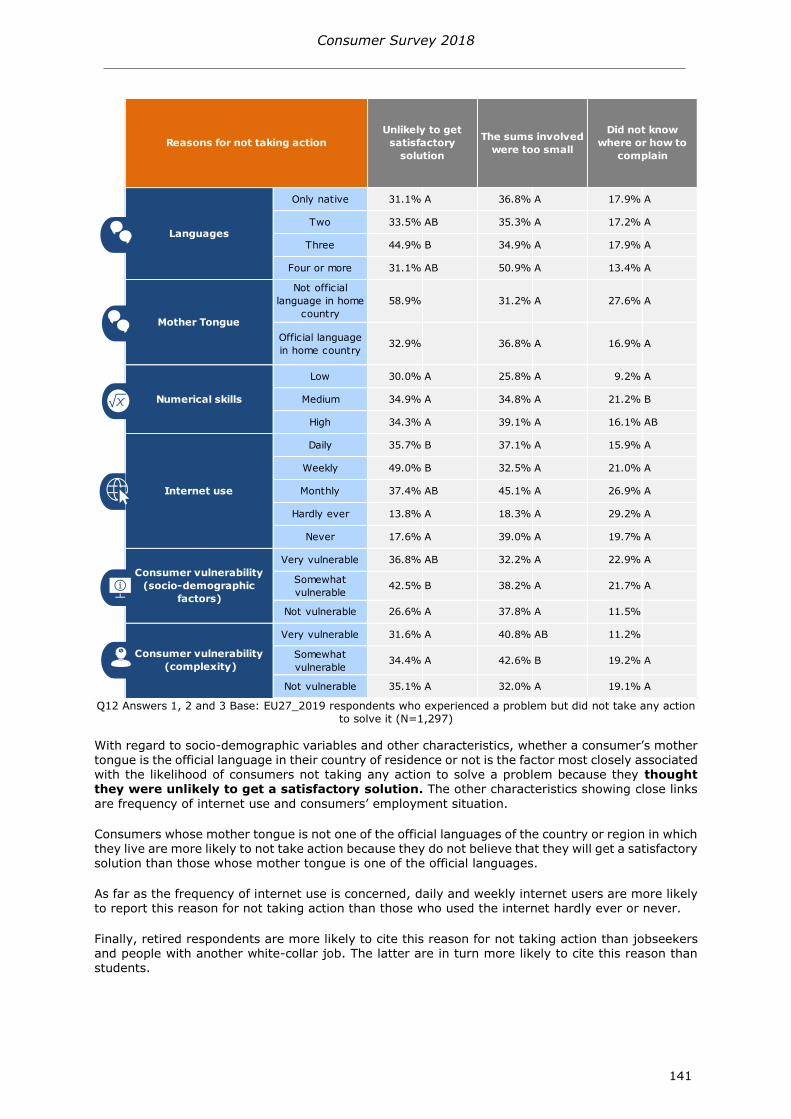
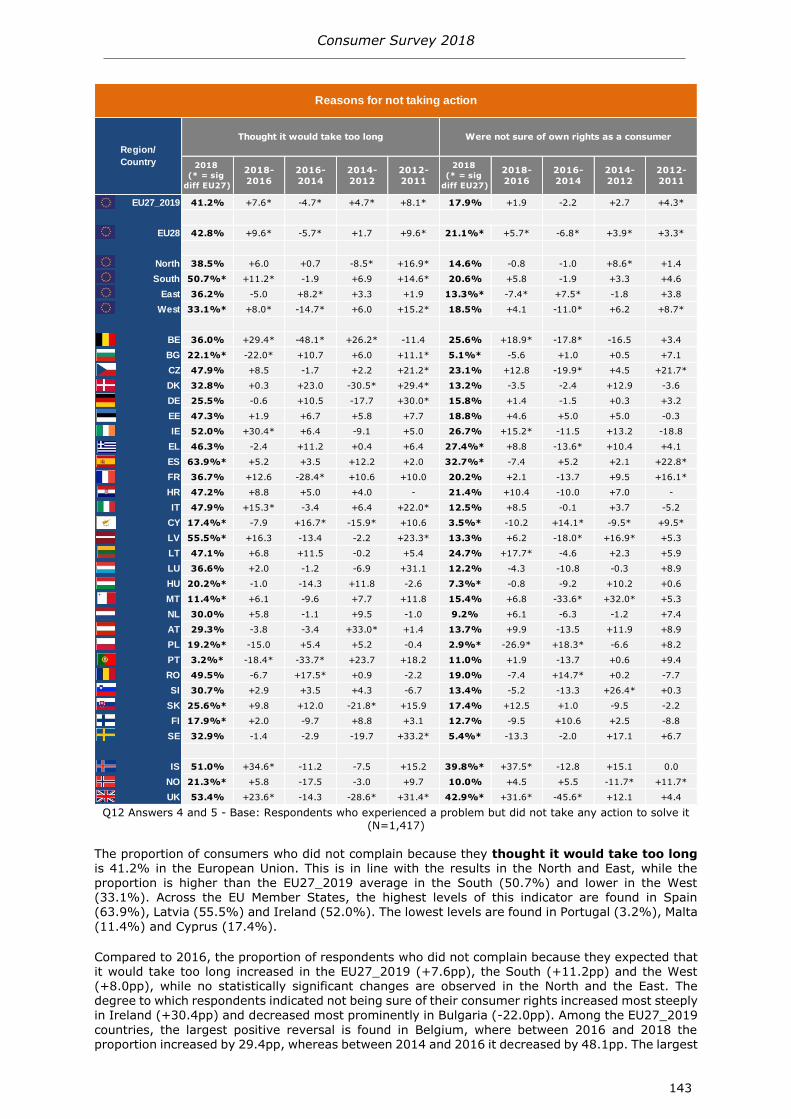
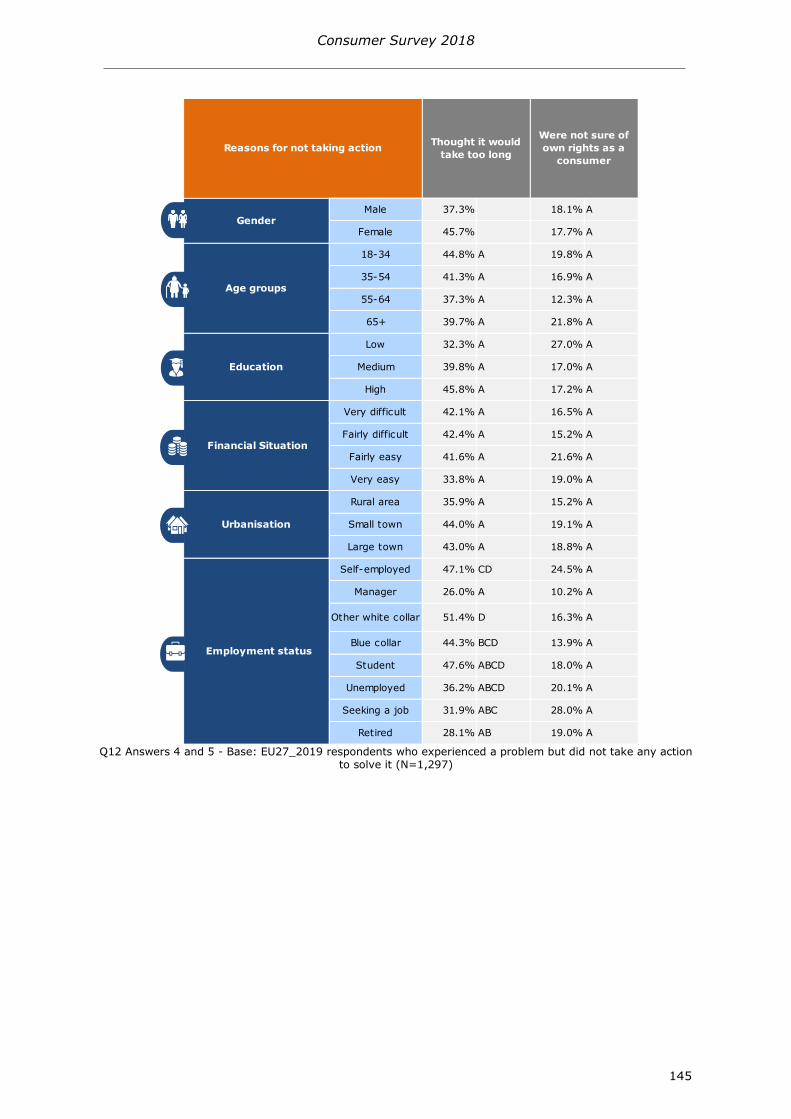
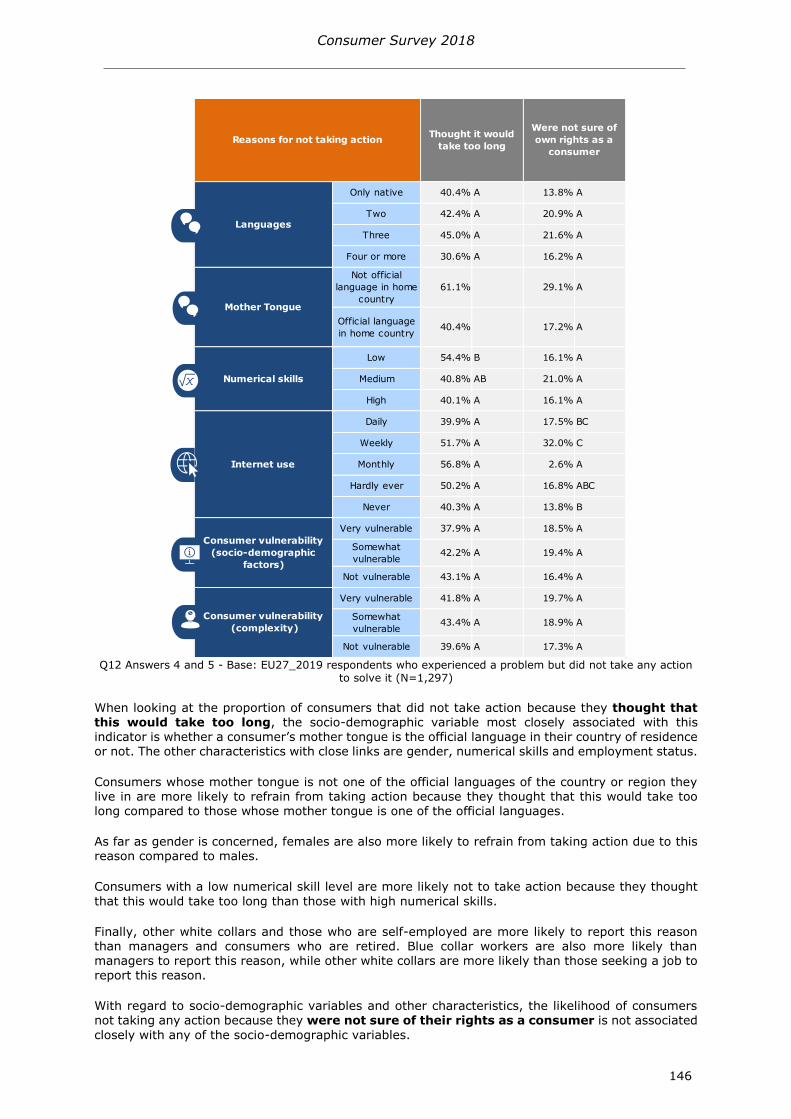
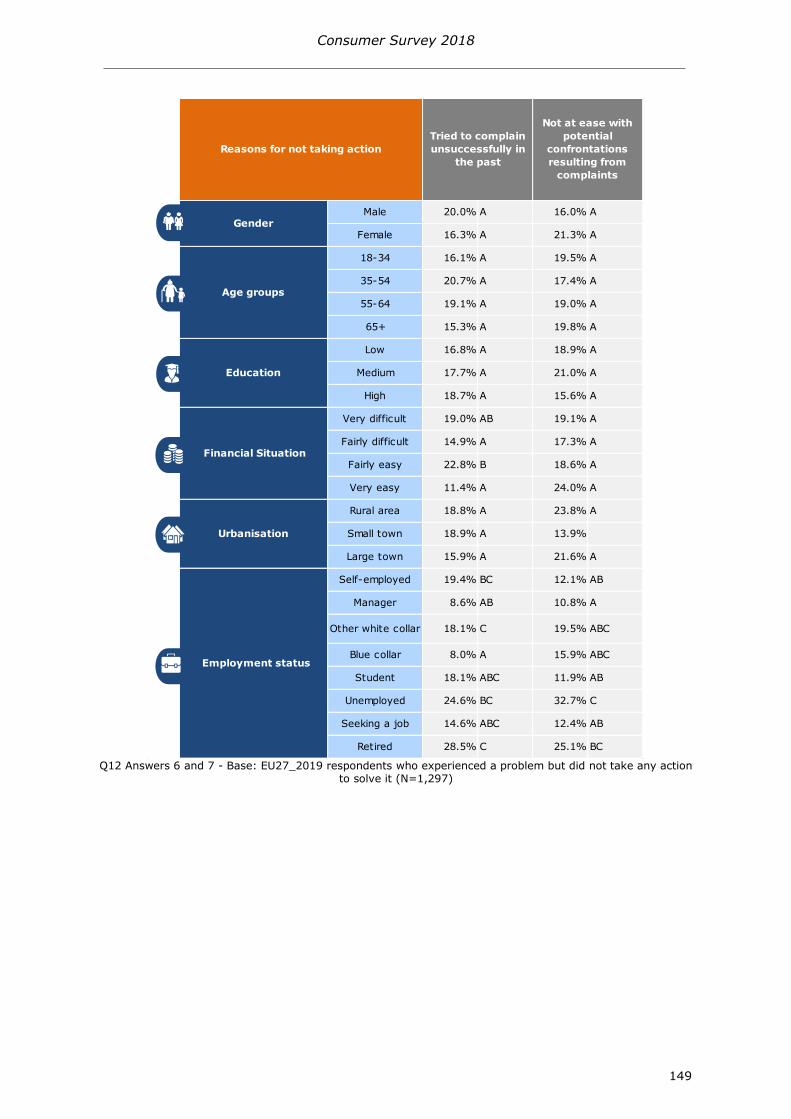
Reasons for not taking action 137
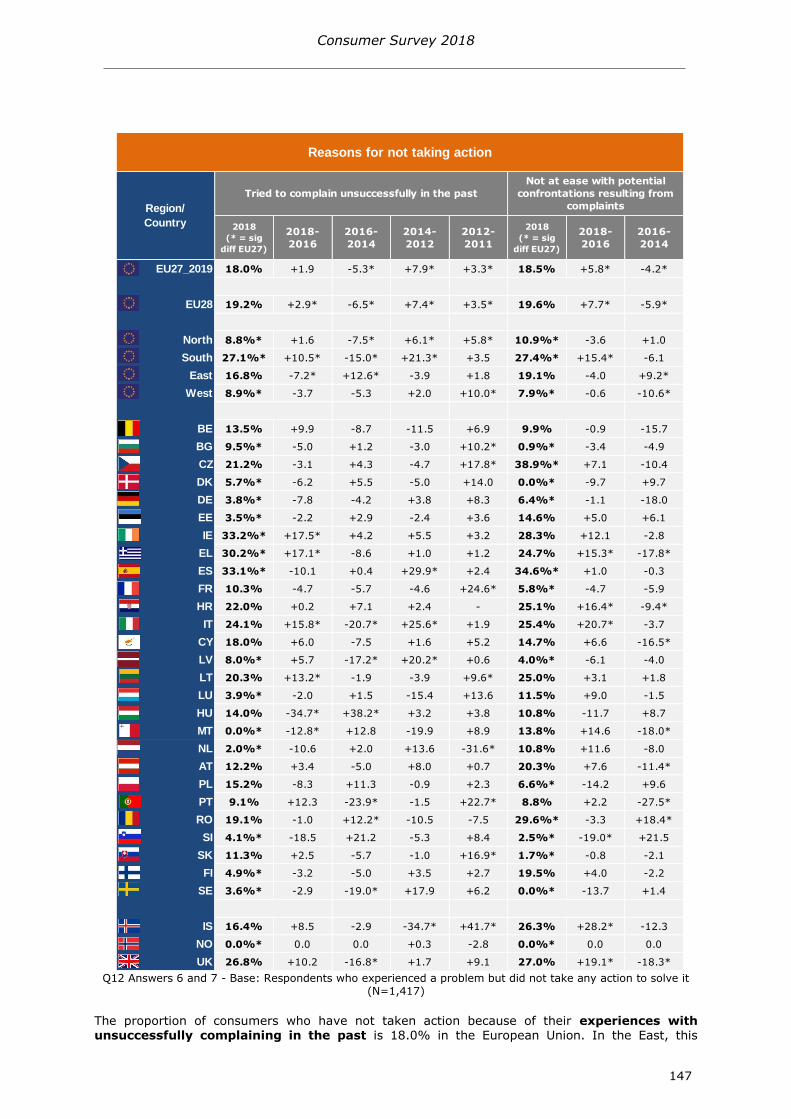
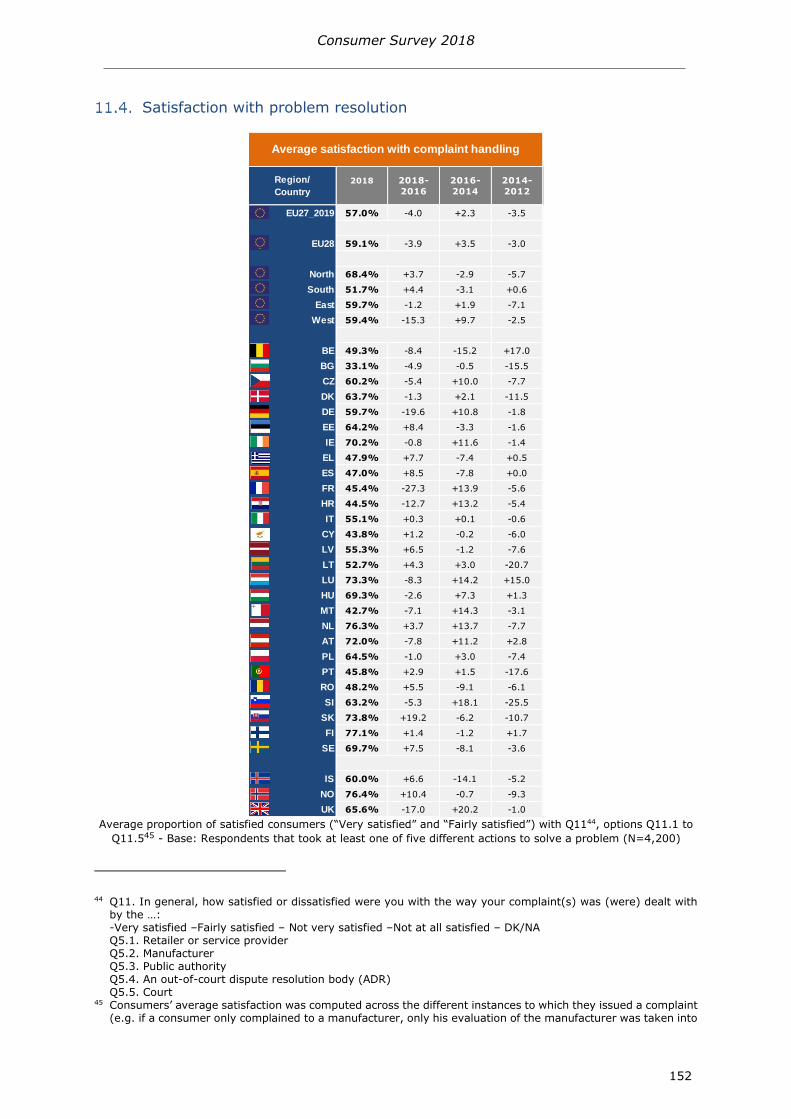
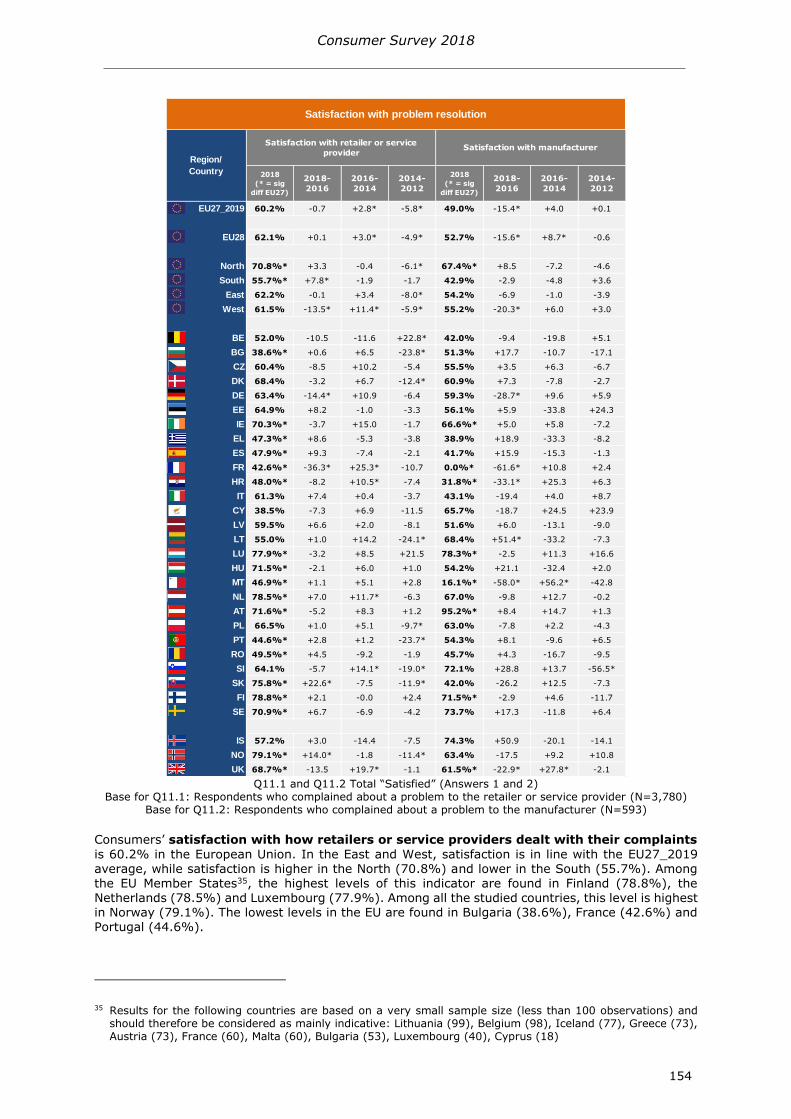
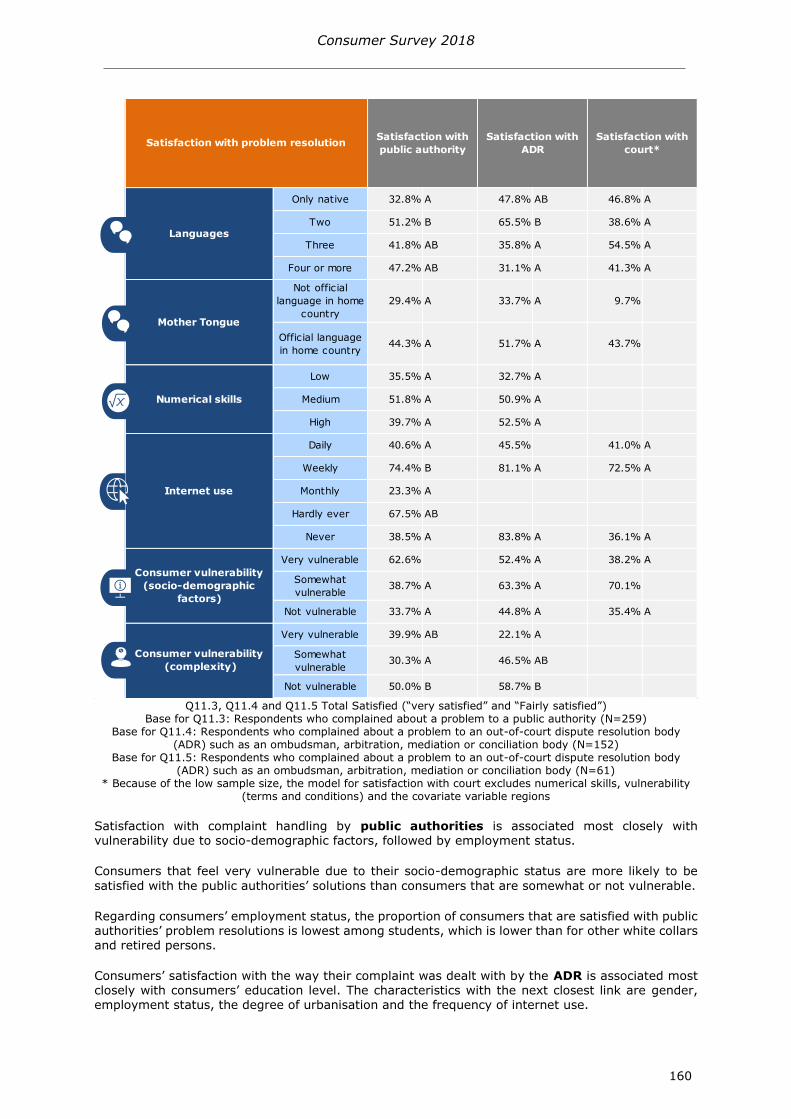
Satisfaction with problem resolution 152
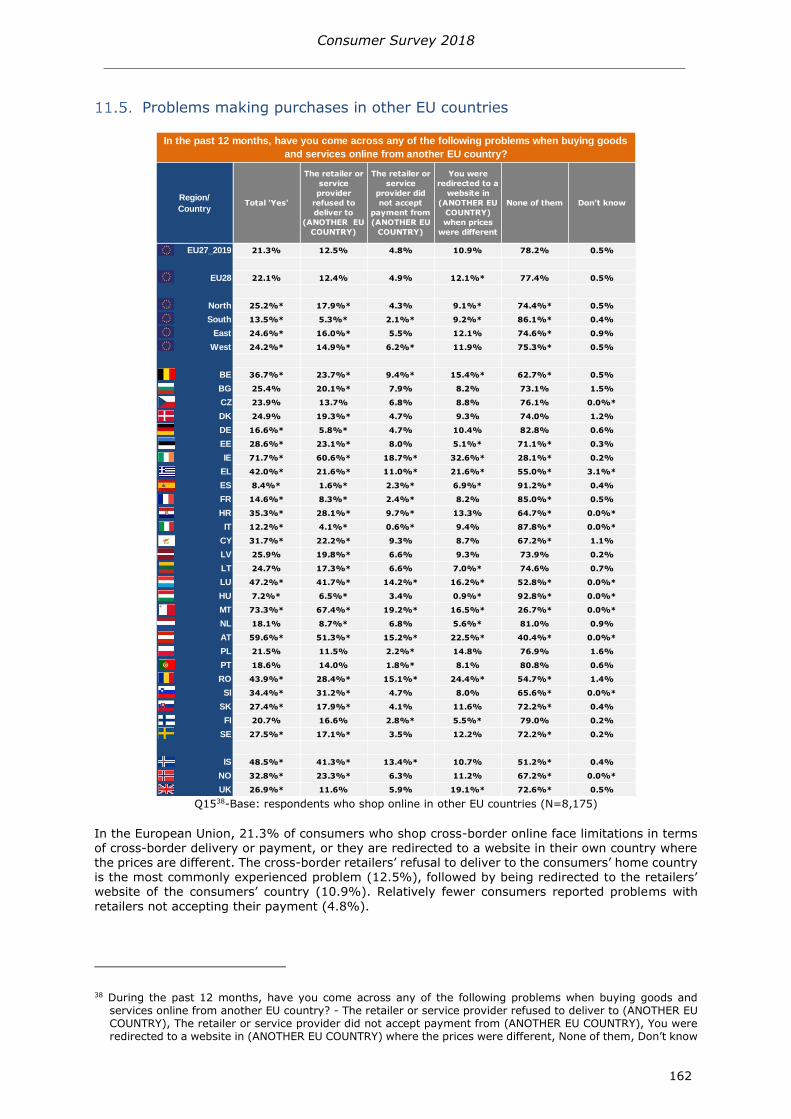
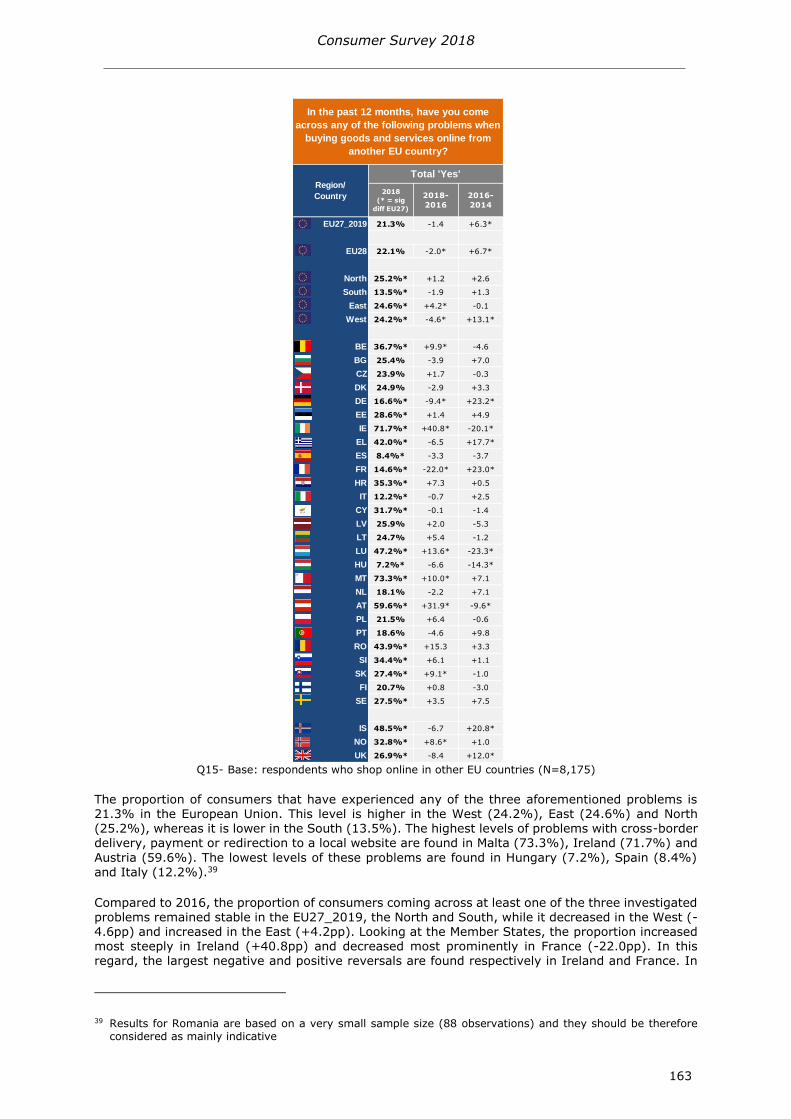
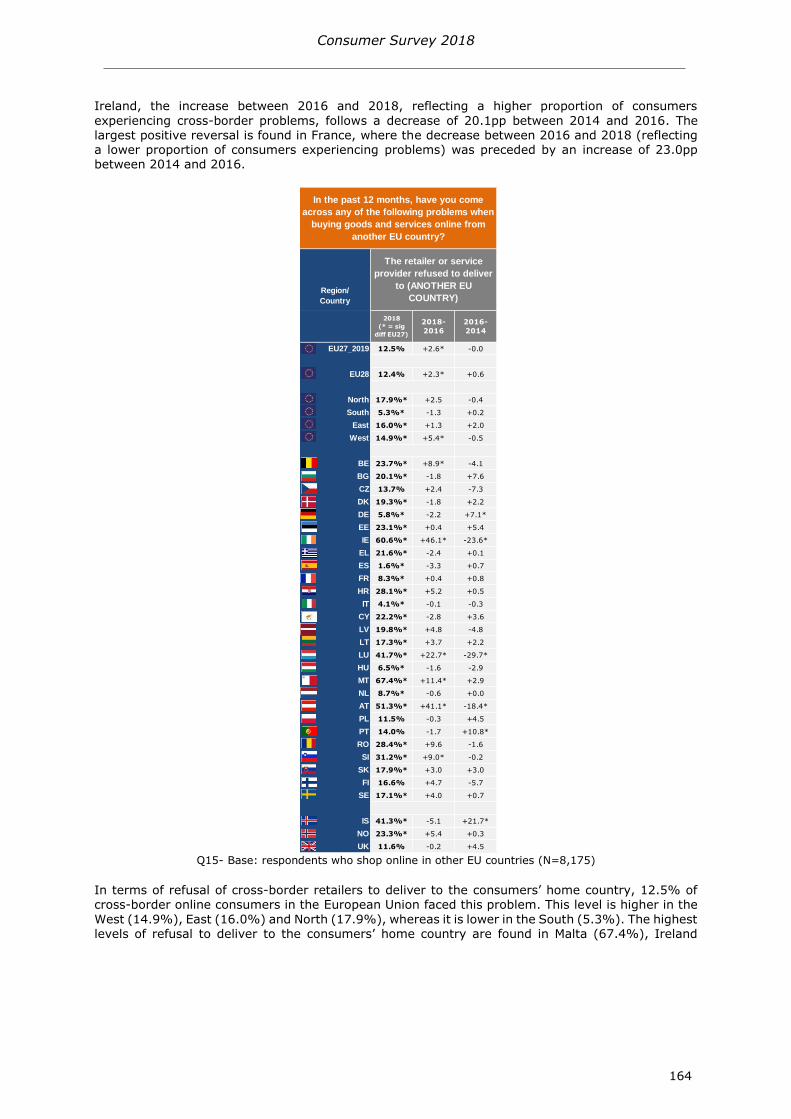
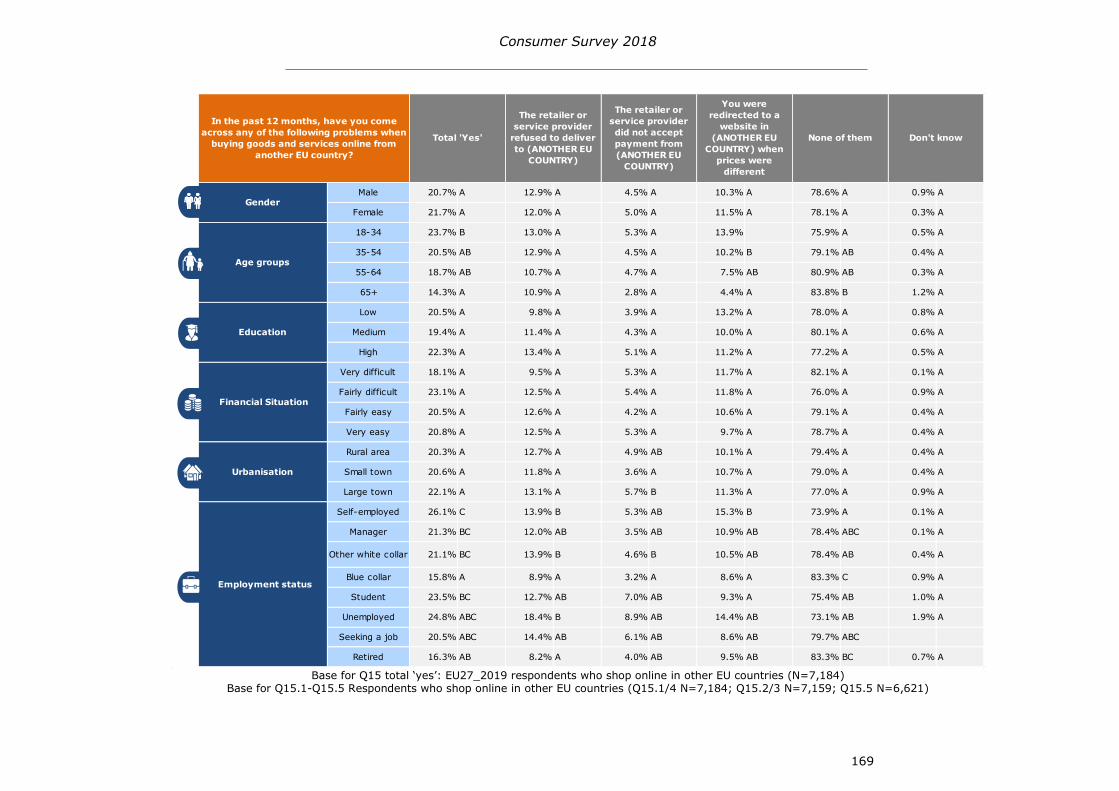
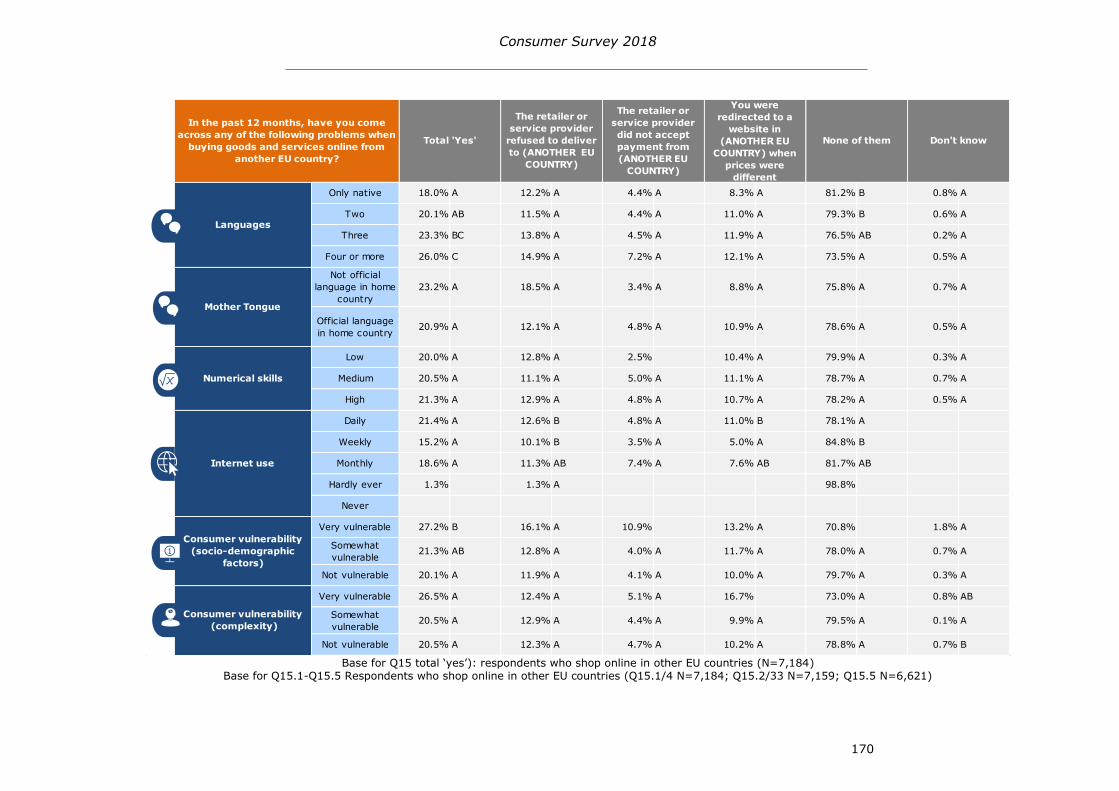
Problems making purchases in other EU countries 162
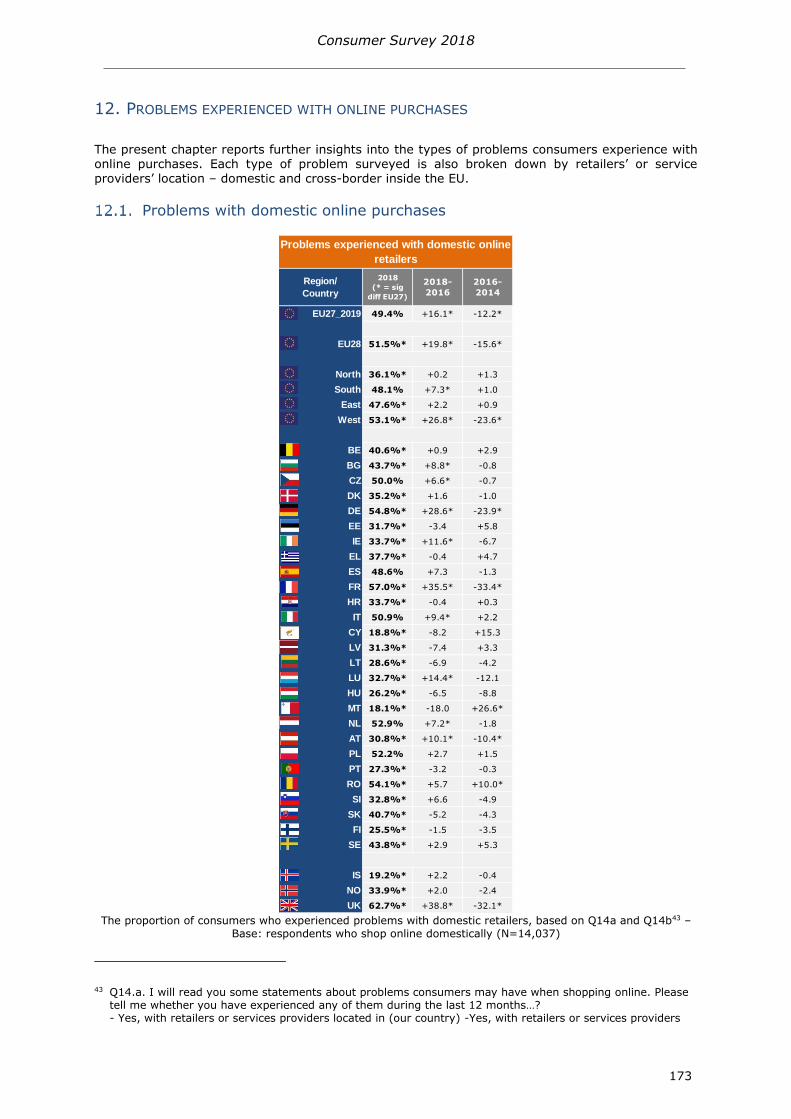
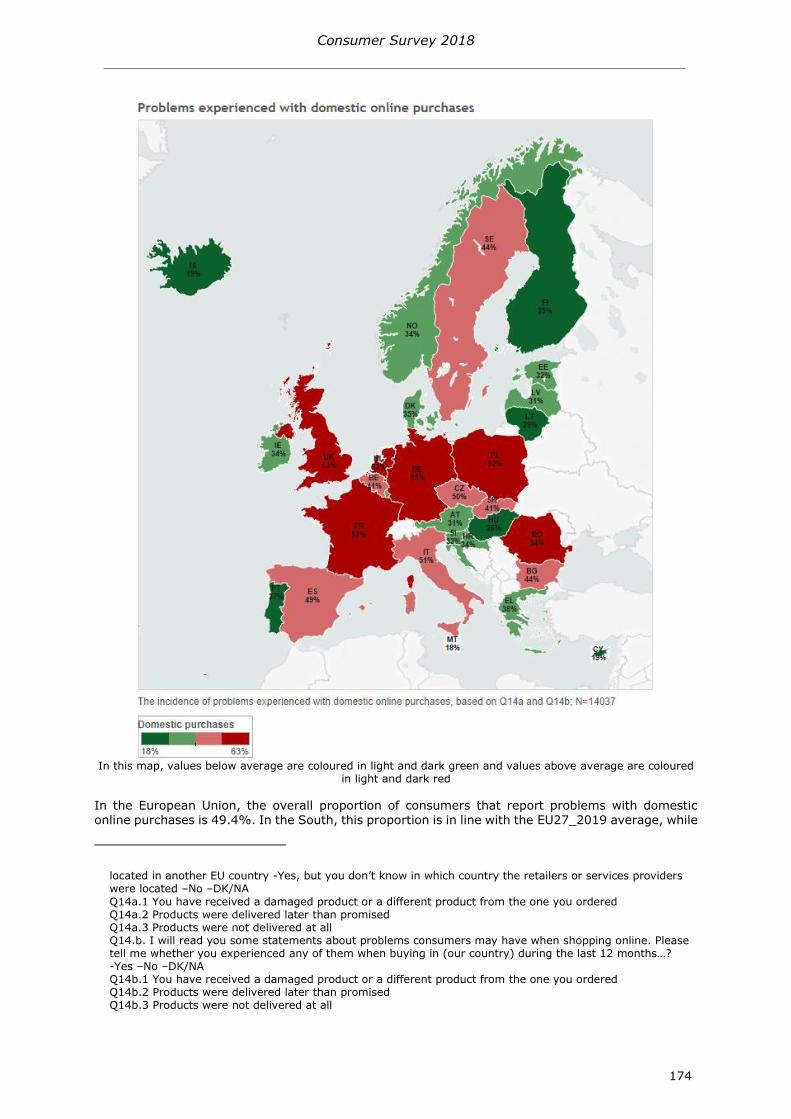
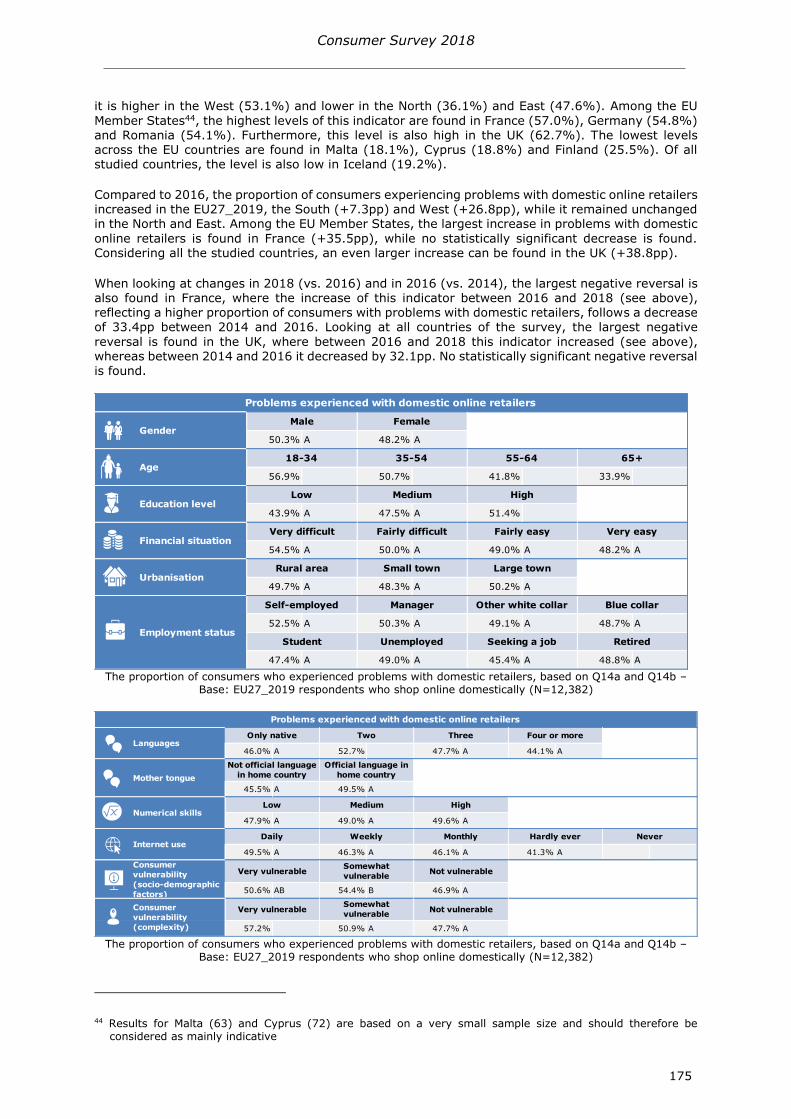
12 PROBLEMS EXPERIENCED WITH ONLINE PURCHASES 173
Problems with domestic online purchases 173
1211 Types of problems with domestic online retailers 177
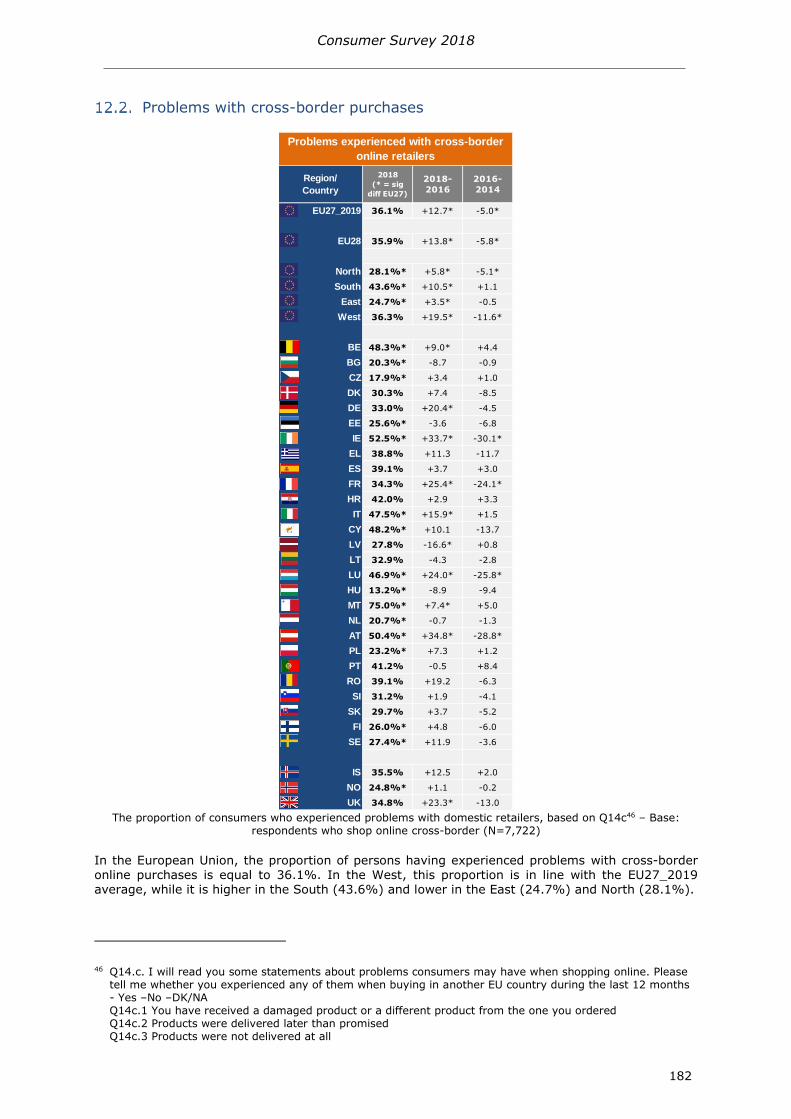
Problems with cross-border purchases 182
1221 Types of problems with cross-border online retailers 186
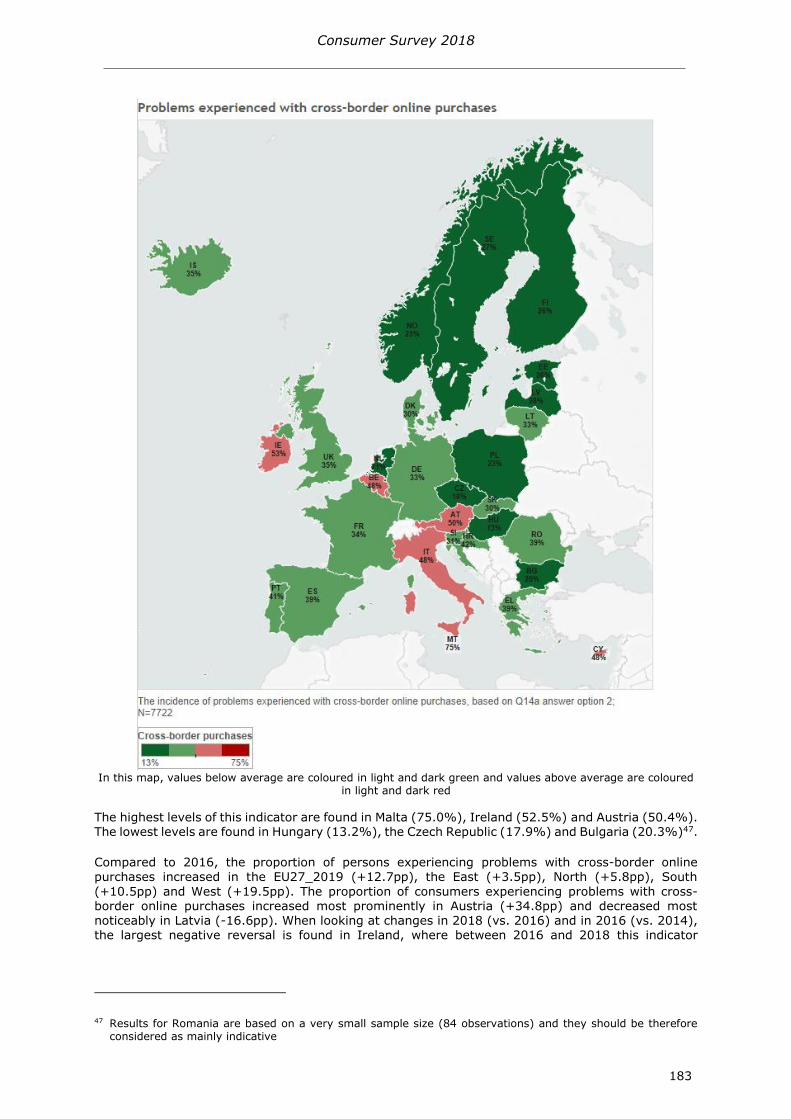
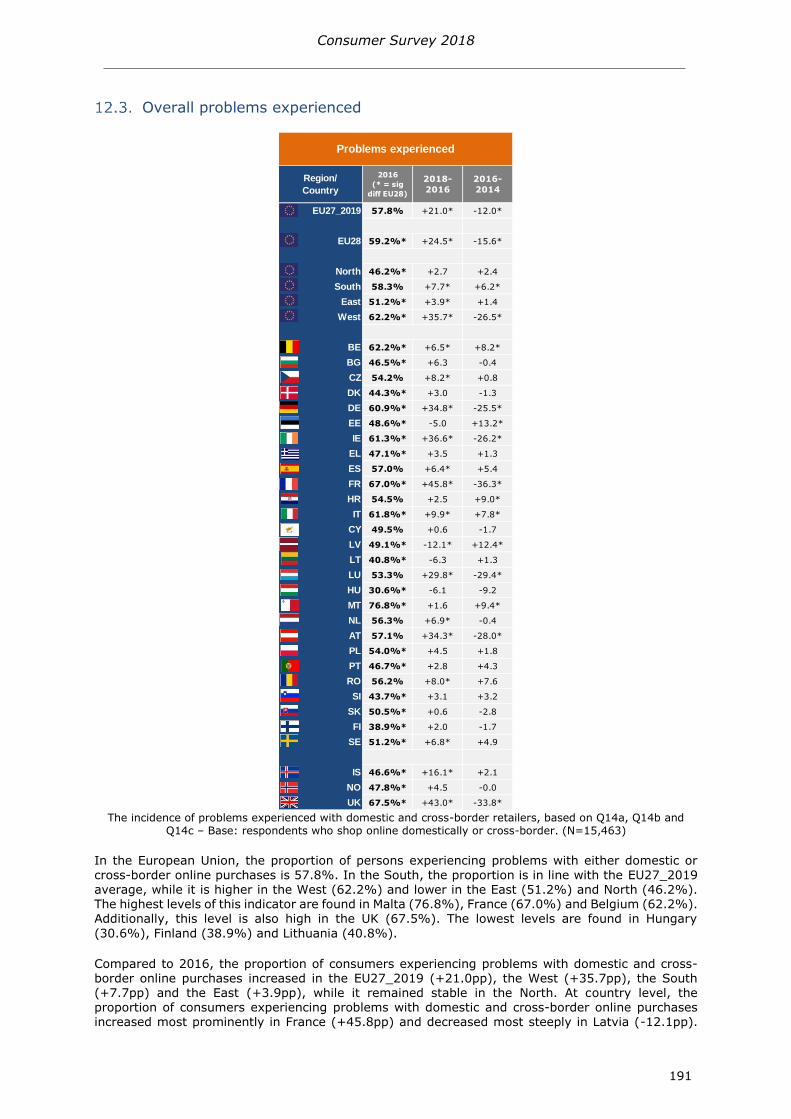
Overall problems experienced 191
1231 Overall types of problems 193
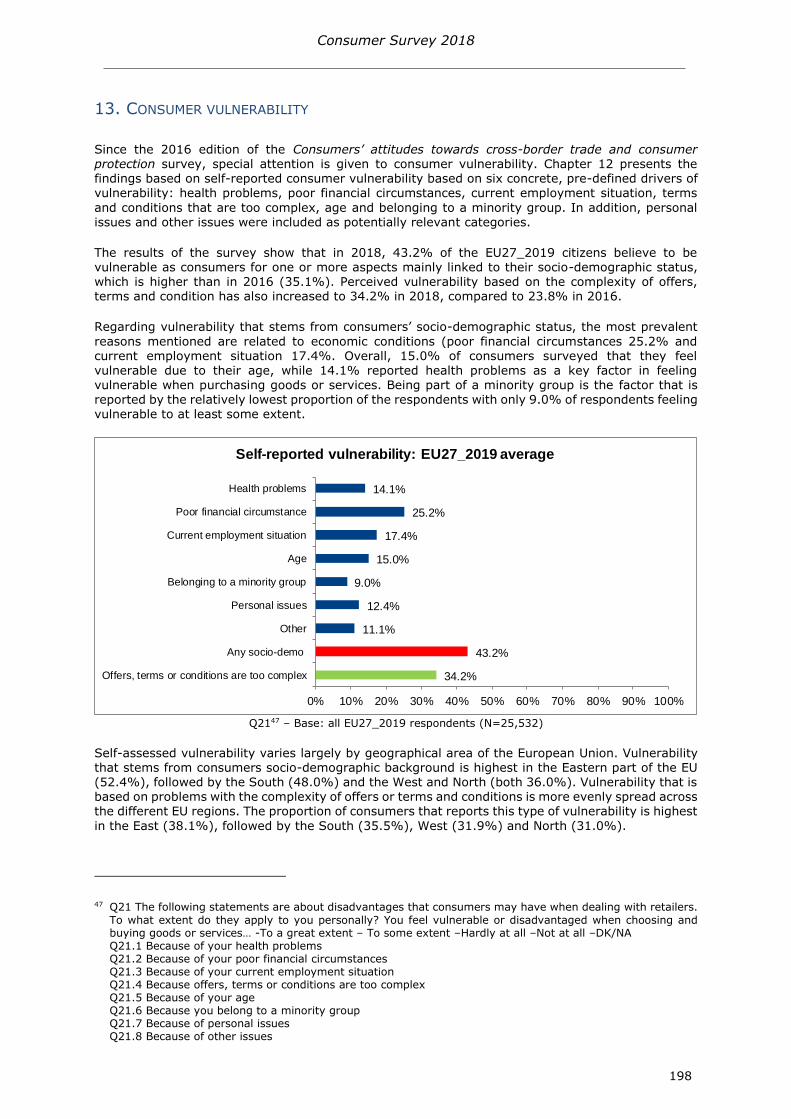
13 CONSUMER VULNERABILITY 198
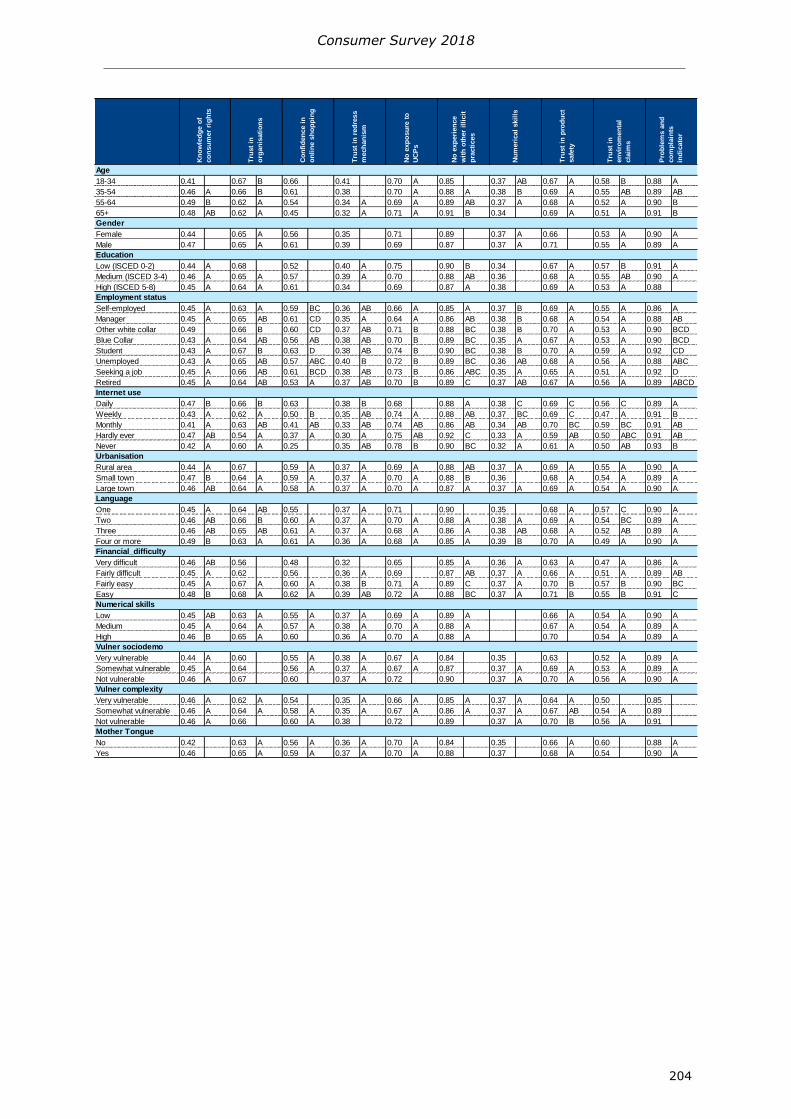
14 DETERMINANTS OF CONSUMER CONDITIONS 202
15 ANNEX I SAMPLING METHODOLOGY 205
Consumer Survey 2018
7
1 INTRODUCTION
Introduction to the 2018 wave of the Consumer Survey
This report discusses the results of the 2018 edition of the survey on consumersrsquo attitudes towards
cross-border trade and consumer-related issues which is part of a series of reports within the EU Consumer Programme The study is a follow-up of a series of related studies that have been conducted since 20061 It was commissioned by the Consumers Health Agriculture and Food Executive Agency (Chafea) The European Commission gathers systematic evidence to monitor consumer markets and national consumer conditions within the EU summarised in the flagship Consumer Conditions Scoreboards (CCS) Results from this survey will feed the 15th edition of the CCS2
The present survey aims to deliver reliable results that are comparable with previous studies in the series on issues related to the attitudes perceptions and experiences of European consumers in the following areas
Domestic and cross-border commerce both online and offline
Knowledge of consumer rights
Trust in consumer protection
Perceptions of the product safety environment
Perceptions of environmental claims and their influence purchase decisions
Confidence in online shopping
Problems experienced actions taken and satisfaction with problem resolution
Exposure to unfair commercial practices
Consumer vulnerability
In total 28037 respondents took part in the survey which was carried out by GfK Social and
Strategic Research (GfK SSR) in the 27 Member States of the European Union and in the United Kingdom Iceland and Norway between 26 March and 11 May 2018 The report presents the overall results of the study as well as comparisons between the Member States socio-demographic variables and comparisons with the results from previous surveys
Sampling methodology
The target population includes all people aged 18 and above resident in the country surveyed and having sufficient command of (one of) the respective national language(s) to answer the questionnaire
In every country a random sample representative of the national population aged 18 or older was drawn by means of fixed line or mobile telephone number registers or Random Digit Dialling software The sampling procedure was set up to achieve a mix of respondents recruited through
mobile phone and fixed line Furthermore the sample intake was monitored to follow up on the
overall composition of the sample in terms of gender age and the ownership of a mobile andor a fixed phone For more information on the sampling methodology please consult Annex I
1 Special Eurobarometer 252 (2006) Special Eurobarometer 298 (2008) Flash Eurobarometer 282 (2009) Flash Eurobarometer 299 (2010) Flash Eurobarometer 332 (2011) Flash Eurobarometer 358 (2012) Flash Eurobarometer 397 (2014) and the Consumersrsquo attitudes towards cross-border trade and consumer related issues 2016 report (2016)
2 httpeceuropaeuconsumersconsumer_evidenceconsumer_scoreboardsindex_enhtm
Consumer Survey 2018
8
The respondents participated in a Computer Assisted Telephone Interview (CATI) conducted by
native speaking interviewers making use of a central programme They were interviewed on the core aspects of their experiences as consumers (see the aforementioned topics) as well as key socio-demographic variables such as age gender and education Based on these data averages and proportions are calculated for the countries and socio-demographic groups
121 Countries covered
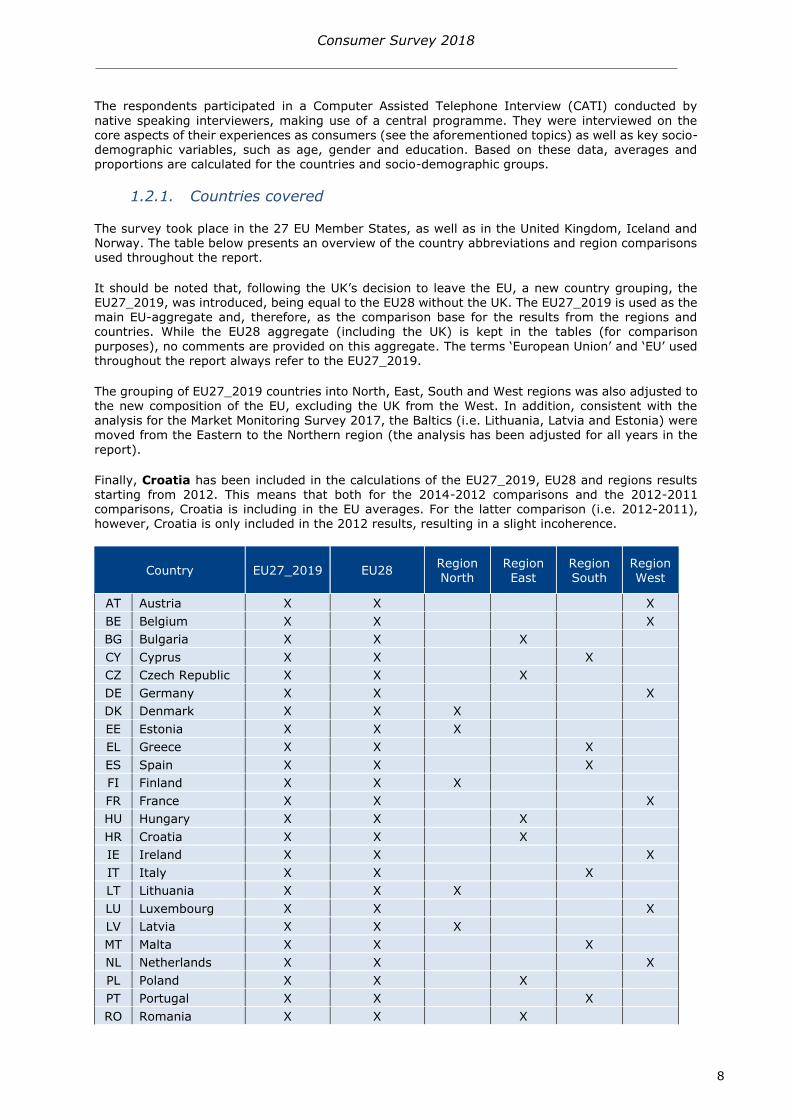
The survey took place in the 27 EU Member States as well as in the United Kingdom Iceland and Norway The table below presents an overview of the country abbreviations and region comparisons used throughout the report
It should be noted that following the UKrsquos decision to leave the EU a new country grouping the EU27_2019 was introduced being equal to the EU28 without the UK The EU27_2019 is used as the main EU-aggregate and therefore as the comparison base for the results from the regions and countries While the EU28 aggregate (including the UK) is kept in the tables (for comparison
purposes) no comments are provided on this aggregate The terms lsquoEuropean Unionrsquo and lsquoEUrsquo used throughout the report always refer to the EU27_2019
The grouping of EU27_2019 countries into North East South and West regions was also adjusted to the new composition of the EU excluding the UK from the West In addition consistent with the analysis for the Market Monitoring Survey 2017 the Baltics (ie Lithuania Latvia and Estonia) were moved from the Eastern to the Northern region (the analysis has been adjusted for all years in the
report)
Finally Croatia has been included in the calculations of the EU27_2019 EU28 and regions results starting from 2012 This means that both for the 2014-2012 comparisons and the 2012-2011 comparisons Croatia is including in the EU averages For the latter comparison (ie 2012-2011) however Croatia is only included in the 2012 results resulting in a slight incoherence
Country EU27_2019 EU28 Region North
Region East
Region South
Region West
AT Austria X X X
BE Belgium X X X
BG Bulgaria X X X
CY Cyprus X X X
CZ Czech Republic X X X
DE Germany X X X
DK Denmark X X X
EE Estonia X X X
EL Greece X X X
ES Spain X X X
FI Finland X X X
FR France X X X
HU Hungary X X X
HR Croatia X X X
IE Ireland X X X
IT Italy X X X
LT Lithuania X X X
LU Luxembourg X X X
LV Latvia X X X
MT Malta X X X
NL Netherlands X X X
PL Poland X X X
PT Portugal X X X
RO Romania X X X
Consumer Survey 2018
9
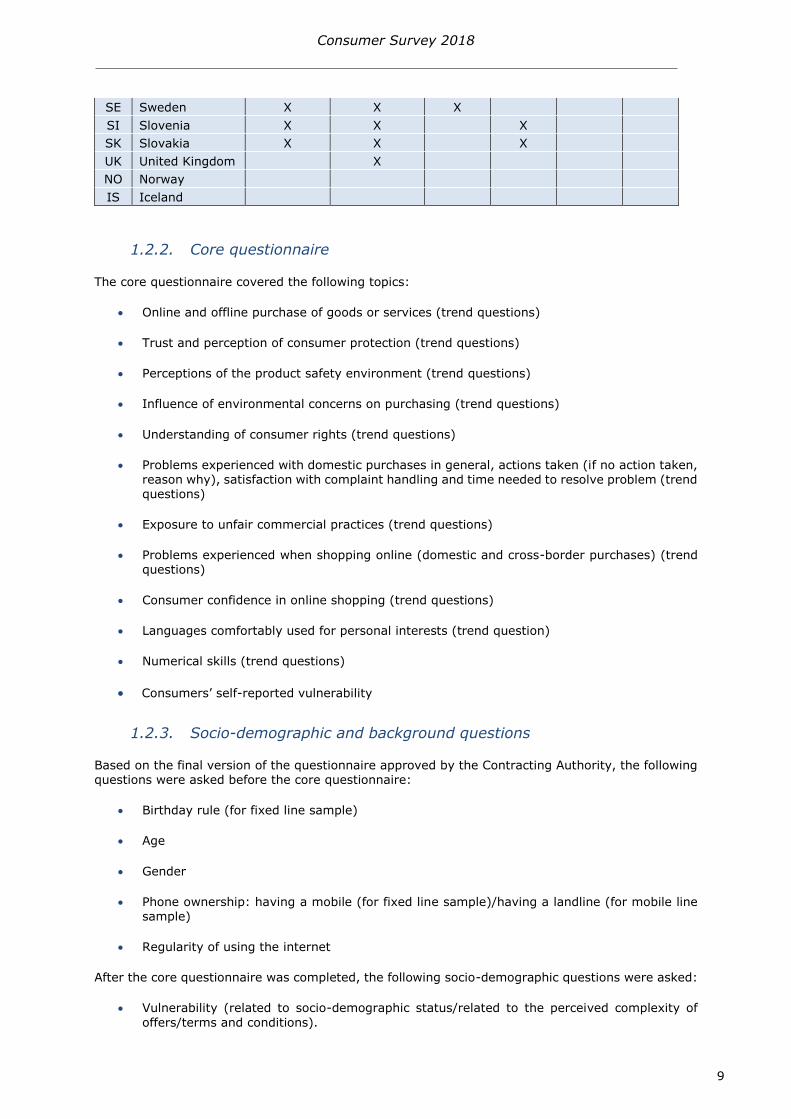
122 Core questionnaire
The core questionnaire covered the following topics
Online and offline purchase of goods or services (trend questions)
Trust and perception of consumer protection (trend questions)
Perceptions of the product safety environment (trend questions)
Influence of environmental concerns on purchasing (trend questions)
Understanding of consumer rights (trend questions)
Problems experienced with domestic purchases in general actions taken (if no action taken reason why) satisfaction with complaint handling and time needed to resolve problem (trend questions)
Exposure to unfair commercial practices (trend questions)
Problems experienced when shopping online (domestic and cross-border purchases) (trend questions)
Consumer confidence in online shopping (trend questions)
Languages comfortably used for personal interests (trend question)
Numerical skills (trend questions)
Consumersrsquo self-reported vulnerability
123 Socio-demographic and background questions
Based on the final version of the questionnaire approved by the Contracting Authority the following questions were asked before the core questionnaire
Birthday rule (for fixed line sample)
Age
Gender
Phone ownership having a mobile (for fixed line sample)having a landline (for mobile line sample)
Regularity of using the internet
After the core questionnaire was completed the following socio-demographic questions were asked
Vulnerability (related to socio-demographic statusrelated to the perceived complexity of
offersterms and conditions)
SE Sweden X X X
SI Slovenia X X X
SK Slovakia X X X
UK United Kingdom X
NO Norway
IS Iceland
Consumer Survey 2018
10
Level of education
Employment situation (occupation)
Mother tongue of a respondent
Region of residence3
Subjective degree of urbanisation
Subjective financial situation
124 Analysis and reporting of statistically significant differences
All differences mentioned in the text are statistically significant unless otherwise mentioned Statistical significance is calculated at the 95 confidence level meaning that the null hypothesis of no difference has been rejected at 5 probability level Differences that are not statistically
significant are considered equal to 0 Consequently the report may describe two values as being equal even if the difference between both values is not equal to 0 It should also be mentioned that especially for measures referring to the entire EU27_2019EU28 given the large sample size for the
survey some differences could be statistically significant even if their absolute magnitude is very small
The findings for the EU27_2019 EU28 the four EU27_2019 regions (North South East and West) and the individual country results are analysed using cross-tabulations Please note that in the region and country tables results that are statistically different from the EU27_2019 average are indicated by asterisks
Differences between the levels of socio-demographic categories are analysed with a regression analysis which explores the relationship between a specific independent variable (eg age) and a dependent variable (eg online purchase behaviour) while considering the effects of other independent variables (eg gender education etc) This type of analysis is considered more appropriate when exploring the impact of socio-demographic variables due to the potential overlap (correlations) between different socio-demographic factors which need to be considered when
measuring the extent to which one of these factors affects the dependent variables The following
regression models are used for the analysis of the different dependent variables
Logit models when the dependent variable is binary (ie it takes only two possible values 0 and 1 eg trust in product safety trust in environmental claims)
Poisson models for dependent variables that can be thought of as a count variable (eg knowledge of consumer rights trust in organisations)
Linear models when the dependent variable is assumed to be numerical and linear (eg problems and complaints)
In all models a control variable on the region of residence of the person interviewed (North South East and West) has been included
3 Regions was recorded on NUTS level 3 (Estonia Croatia Latvia Lithuania Malta Slovenia amp Iceland) and NUTS level 2 (all other countries)
Consumer Survey 2018
11
The values shown in the tables of the socio-demographic analyses are based on model estimates4
Statistically significant differences between levels of a socio-demographic variable are indicated with letters The categories of a socio-demographic variable are statistically significant different from each other except when the categories share the same letter When a category is associated to a blank it means that it is statistically significant different from all the other categories Differences and equalities for socio-demographic results are only considered within each socio-demographic variable (eg 18-34 yearsrsquo old vs 35-54 yearsrsquo old) and not between socio-demographic variables (eg 18-34 yearsrsquo old vs women)
Up to five socio-demographic characteristics with the closest link with the respective dependent variable are reported on in detail Characteristics with the closest link are selected considering the average magnitude of the difference across the factor attributes ndash in absolute terms (eg the differences in the knowledge of consumer rights ndash in absolute terms ndash across the different levels of internet use) ndash and by looking at the overall coherence of these differences
The report describes changes between the current (2018) and previous (2016) waves In addition
changes in the latest waves (2018-2016) are compared to changes in the previous waves (2016-
2014) This is reported on only when both changes are significant and when the direction of the change has reversed ie from an increase to a decrease or from a decrease to an increase For positive indicators (ie knowledge of consumer rights domestic online shopping etc) these cases are labelled ldquonegative reversalrdquo and ldquopositive reversalrdquo respectively For negative indicators (eg problems and complaints exposure to unfair commercial practices etc) the labels are reversed to account for the negative valence of the indicator where an increase would reflect a change towards
the negative The current report focuses on the strongest positive and negative reversals which are determined by the highest absolute sum of both changes
125 Weighting and wave to wave comparisons
Data from the current wave was weighted based on the latest Eurostat data5 available on age (three groups 18-34 35-54 and 55+ year old) and gender distributions In addition the weighting was
also based on telephone ownership data from the Special Eurobarometer 4386 (three groups fixed only mobile only mixed) Finally population weights were also applied both on the EU27_2019 sample (for the EU27_2019 average) and the EU28 sample (for the EU28 average and regions) to account for differences in population size at country level
In contrast with the current Consumer Survey the Consumer Survey 2016 was only weighted on age and gender (in addition to the population weight) To facilitate comparisons between 2018 and 2016 a second weight was calculated for the 2018 survey based solely on age and gender
Both the Consumer Survey 2016 and 2018 have been conducted with a target population of 18+ years while the Consumer Surveys 2014 and earlier are based on a sample of 15+ years For comparisons between the years 2016 and 2014 the latter has been reweighted based on age and gender distributions Data from all waves before 2014 will be used for the wave to wave comparisons based on existing samples (population 15+) and using the existing weights provided by the Contracting Authority (also based on the 15+ population distribution) When comparing 2014 data
4 Model estimates are calculated using the margins function in Stata A margin is a statistic based on a fitted model calculated over a dataset in which some of or all the covariates are fixed at values different from what they really are In the models estimated for this report the margins function calculates the predicted means for the different values of a socio-demographic variable (eg age) while all the other covariates (including the
other socio-demographic variables) are hold fixed In practice the estimated value of a dependant variable Y (ex the of persons who have bought online in the last 12 months) for the male category is obtained under the hypothesis that all the persons interviewed are males while their remaining sociodemographic characteristics (used in the model as regressors) corresponds to the categories observed in the sample
In addition a pwcompare (group effects) option was added to the function to perform pairwise comparisons between all levels of a socio-demographic variable based on the estimated models These comparisons provided information to determine the variables with the closest link with the respective dependent variable
5 Eurostat Population on 1 January 2018 by age sex and NUTS 2 region updated on 27 February 2018
6 Special Eurobarometer 438 E-Communications and the Digital Single Market (2016) available via httpdataeuropaeueuodpendatadatasetS2062_84_2_438_ENG
Consumer Survey 2018
12
to previous waves the original weight will be used based on the 15+ population distribution The
difference in sampling will be clearly communicated when wave-to-wave changes are reported
To summarise the following weighting procedures were used to calculate the results presented in the final report additional analyses and country profiles
2018 Population gender amp age weighting (18+) phone ownership weighting
2016 Population gender amp age weighting (18+)
2014 Population gender amp age weighting (18+)
2014 Population gender amp age weighting (15+)
2012 Population gender amp age weighting (15+)
2011 Population gender amp age weighting (15+)
2010 Population gender amp age weighting (15+)
2009 Population gender amp age weighting (15+)
2008 Population gender amp age weighting (15+)
2006 Population gender amp age weighting (15+)
In conclusion it should be considered that in the light of the methodological approach indicated above
Changes with respect to the previous year ndash which are shown in graphs and tables throughout the report - are always computed on comparable data
However given the change in methodology applied for the 2018 results (age gender amp phone ownership) and the 2018-2016 comparison (age amp gender no phone ownership) it is not possible to compute the exact results for 20167 by subtracting the 2018-2016 change from
the 2018 results The same is true for the changes in previous waves
The applied methodology ensures comparability between the current (2018) and previous (2016) wave As such it is in principle possible to estimate values in level for 2016 by applying back the observed changes between 2016 and 2018 as reported in graphs and tables throughout the report However due to different weightings applied to the 2018 data for presenting the 2018 results and for comparisons with the 2016 results small differences may occur
Differences between 2014 and previous waves are reported based on the original methodology while data in levels is not reported as it is not consistent with the last two waves Because of the lack of comparability with data reported for the last two waves (2016 and 2018) it is not possible to estimate data in levels for the years 2012 and before
7 As presented in the 2017 Consumer Conditions Scoreboard (available via httpseceuropaeuinfositesinfofilesconsumer-conditions-scoreboard-2017-edition_enpdf)
Consumer Survey 2018
13
2 EXECUTIVE SUMMARYKEY FINDINGS
This report presents the findings of the 2018 edition of the survey on consumersrsquo attitudes towards cross-border trade and consumer-related issues which was carried out by GfK SSR8 for the Consumers Health Agriculture and Food Executive Agency (Chafea) and the Directorate General Justice and Consumers of the European Commission The present survey is part of a series of reports
within the EU Consumer Programme which has been performed since 2006 with the aim to monitor national consumer conditions across the EU For this purpose the study assessed several indicators of European consumersrsquo attitudes for 28037 respondents across the EU27_2019 Member States and in the United Kingdom Iceland and Norway For the studied indicators the present report discusses the overall results comparisons between Member States and differences with previous waves of this survey as well as across selected socio-demographic characteristics
In summary the present study reports on the current state of European consumersrsquo attitudes and
experiences regarding cross-border trade and consumer-related issues It provides insights in the magnitude and features of domestic as well as cross-border shopping and identifies areas for improving the consumer experiences The findings of the 2018 edition of this survey have worsened9 slightly for a wide variety of indicators compared to the 2016 edition Most of these developments
are driven for a large part by changes in the Western region After noticeable improvements in this region in the 2016 wave the indicators have gone back to resemble their previous levels
The first key indicator explored in the survey is online purchase behaviour In total almost three out of four EU27_2019 consumers recently bought goods or services online (720) The 2018 survey shows a small decrease of 14 percentage points in online shopping compared to 2016 which is slight reversal of the positive evaluation observed since 2006 Online shopping is most common in the Northern (785) Western (751) and Eastern (719) regions10 of the EU whereas in the Southern (660) region the indicator is lower
Most European consumers11 shop online within their own country (630) A more limited number
of Europeans purchase goods or services cross-borders inside the EU (283) or outside the EU (184) The results also show that the proportion of consumers making online purchases within their own country has slightly decreased compared to 2016 This decrease is mostly driven by a lower value in the Western region (-116pp12) while the degree of domestic online purchases has increased in all other regions The proportion of consumers making online purchases cross-border inside the EU has increased compared to 2016 (+91pp) these purchases have increased in the
Eastern (+57pp) Southern (+45pp) and Northern (+40pp) region while they have decreased in
the Western region (+144pp) Nevertheless cross-border online purchases in the Western region are still the second highest (322) after the Northern region (343)
The observed decrease in domestic online shopping is not reflected by a change in confidence in making online purchases which has remained stable since 2016 On average 694 of European consumers report that they are confident in domestic online shopping However it is noticeable that there is a decrease in confidence in the Western region (-73pp) which goes together with a decrease
in domestic online shopping in the same region Furthermore despite the increase in cross-border online shopping confidence in this type of shopping online decreases compared to 2016 (-79pp)
For effectively protecting online consumers it is important that individuals know their rights when shopping online This survey assessed the level of knowledge about three types of consumer rights the cooling-off period the legal guarantees and the regulation with regard to unsolicited products The average level of knowledge about these rights is at 455 a 27pp decrease compared
8 GfK SSR refers to the GFK Social amp Strategic Research unit which focuses on Public Affairs research GfK SSR has been taken over by the market research company Ipsos in October 2018 and is now part of the Ipsos
Public Affairs unit 9 ie lower values for positive indicators such as knowledge of consumer rights or higher values for negative
indicators such as exposure to unfair commercial practices 10 The grouping of EU27_2019 countries into North East South and West regions was adjusted to the new
composition of the EU excluding the UK from the West In addition consistent with the analysis for the Market Monitoring Survey 2017 the Baltics (ie Lithuania Latvia and Estonia) were moved from the Eastern to the Northern region (the analysis has been adjusted for all years in the report)
11 Throughout the remainder of the Executive Summary ldquoEuropean consumersrdquo and ldquoEuropeansrdquo will be used to refer to EU27_2019 consumers
12 Percentage points
Consumer Survey 2018
14
to the previous wave of the survey Whereas this decrease is evident in Western and Northern
Europe the knowledge of consumer rights has increased in the South (+42pp) Europeans in general are best informed about the cooling off period (610) and slightly less informed about faulty product guarantees (409) and unsolicited products (345)
The present report also assesses the trust of European consumers in the protection of their rights in the single market To study this the levels of different aspects of trust are measured First in terms of trust in organisations and redress mechanisms the respondents indicated the highest levels of trust in retailers and service providers (713) public authorities (618) and NGOs
(607) Lower levels of trust are observed for the ADR (Alternative Dispute Resolution 422) and courts (316) The average levels of trust have decreased in the present study compared to 2016 (-53 pp) The most notable decreases are observed for trust in NGOs (-88pp) courts (-75pp) and the ADR (-69pp)
In addition the survey also investigated trust in product safety which is considered a key driver of consumer confidence In the EU27_2019 almost 7 out of 10 consumers have expressed trust in
product safety However this trust has decreased compared to 2016 (-73pp) and this happened particularly in the West (-216pp)
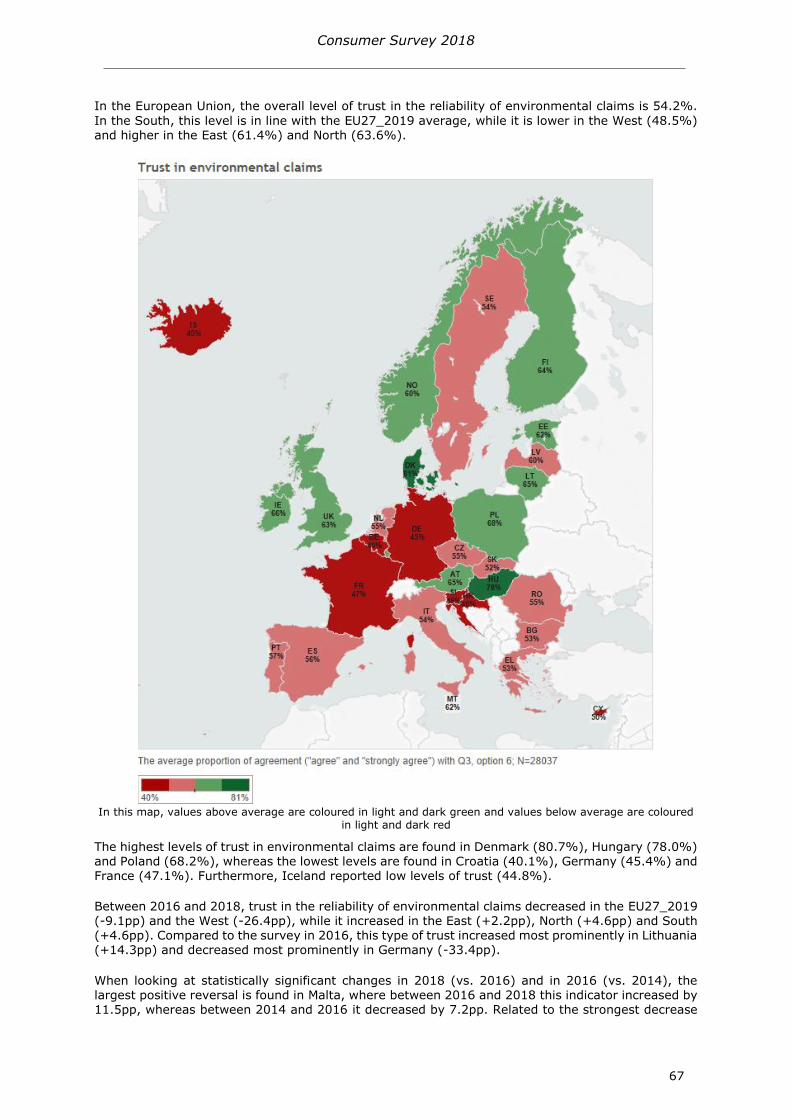
Trust in the reliability of environmental claims which is at 542 in the EU27_2019 also decreased between 2016 and 2018 (by 91 pp)
When shopping online some European consumers encounter unfair commercial practices (UCPs) The survey investigated the exposure to several types of practices that fall within the scope of the Unfair Commercial Practices Directive The overall findings show that the exposure to such practices
originating from domestic (227) and cross-border (48) retailers has increased compared to 2016 (with +47pp and +24pp respectively) In addition to unfair commercial practices consumers in Europe also face other illicit commercial practices when shopping online from domestic retailers (106) and cross-border retailers (36)
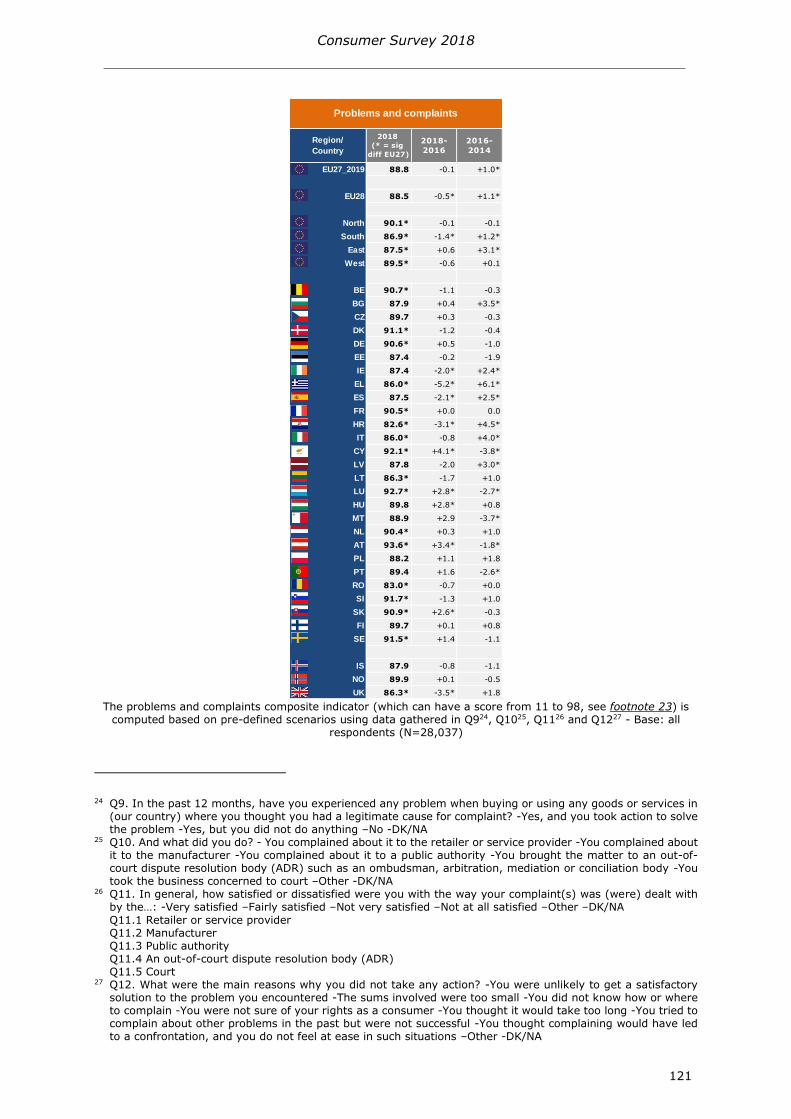
A composite problems and complaints indicator13 was developed in 2014 to measure the problems encountered by European consumers the actions they took their satisfaction with complaint handling and (if applicable) their reasons for not taking action A higher score on this
indicator represents fewer problems and a higher satisfaction with complaint handling The overall level of this indicator is at a high level in the EU27_2019 (a score of 888) and it is the highest in the
West (906) and North (901) regions
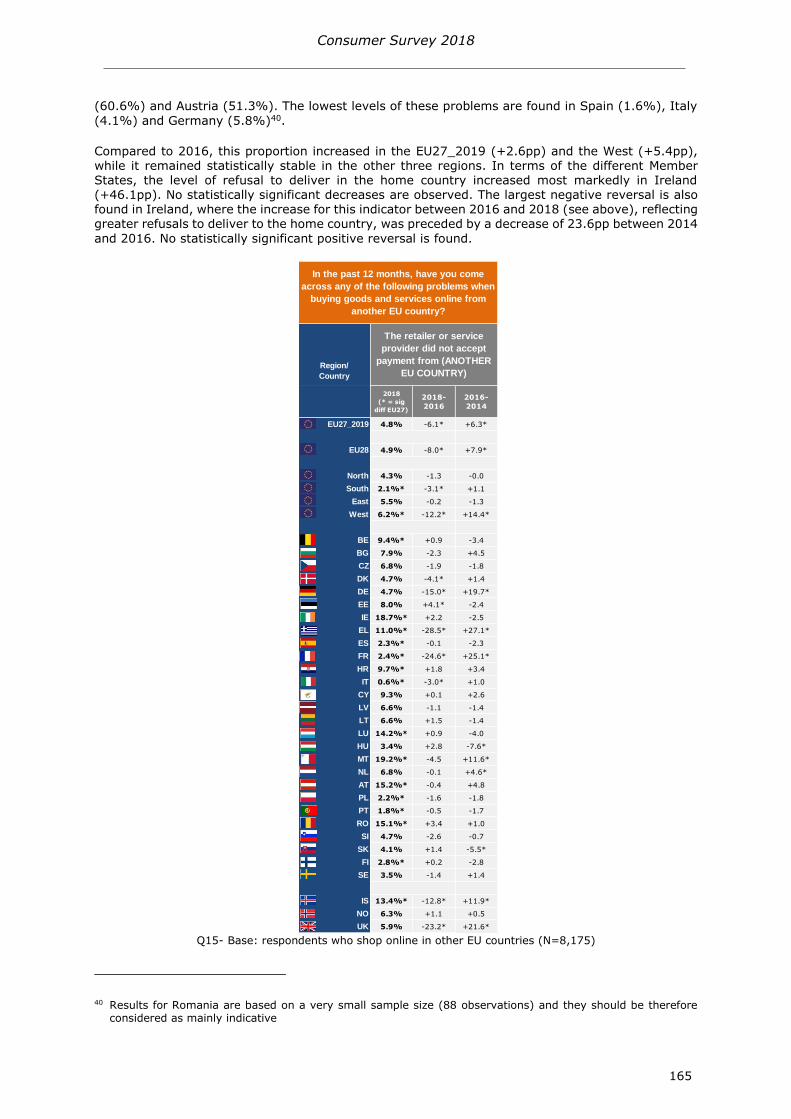
A fair share of European consumers (213) also experiences problems that are specific to online cross-border purchases from other EU countries The most common problems of this type are the refusal of retailers to deliver to the consumersrsquo country (125) and the redirection of consumers
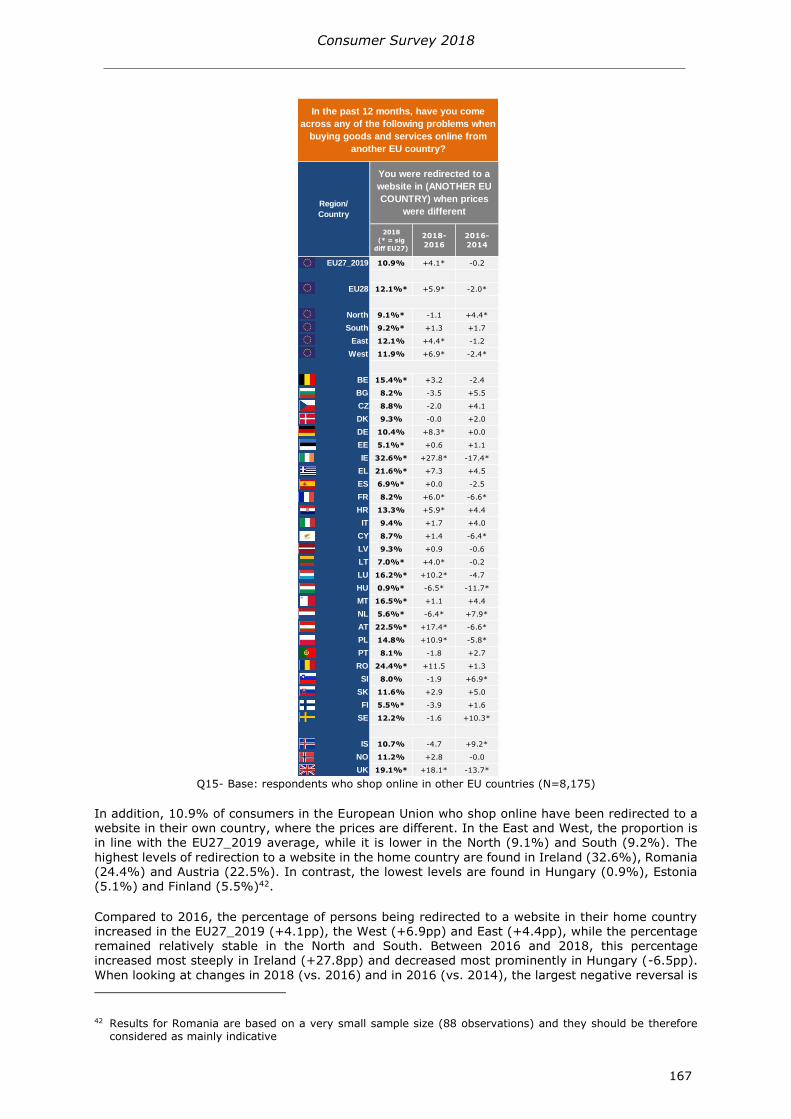
to a website in their home country where prices are different (109) The exposure to both problems has increased since 2016 (respectively +26pp and +41pp)
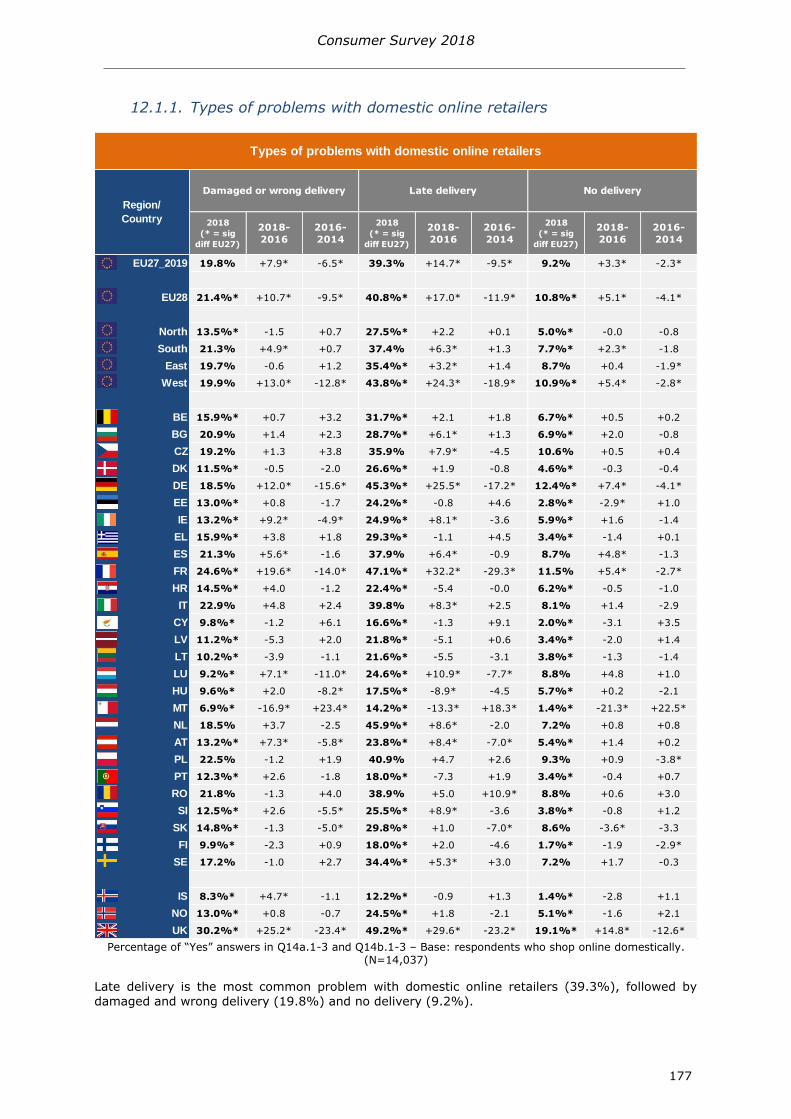
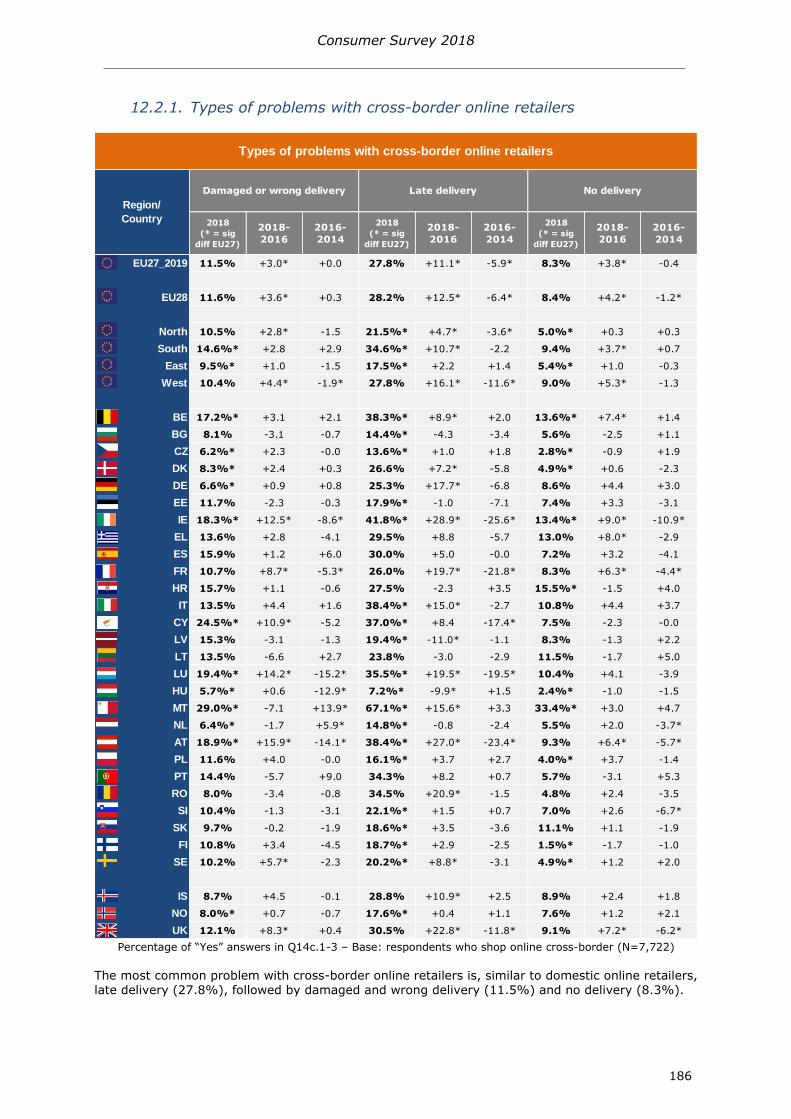
European consumers are also exposed to problems specific to the delivery of online purchases Late delivery of goods is most common both for purchases from domestic online retailers (393) and cross-border retailers (278) In addition a noticeable proportion of respondents also experiences damaged or wrong deliveries of goods (respectively 198 for domestic and 115 for cross-border online purchases)
In case problems do occur the most likely actions taken by consumers are complaining to the retailer (852) or complaining to the manufacturer (157) In contrast bringing businesses to court (24) or addressing problems via an ADR platform (55) are the least likely actions In
some cases consumers refrain from taking any actions when faced with a problem The main reasons for not taking actions are that consumers believe it would take long to resolve the problem (412) or that the sums involved are too small (357)
13 See footnote 22 and 23 (page 117) in the main report for more information on this indicator and its computation
Consumer Survey 2018
15
Continuing the approach started with the 2016 wave of the survey the 2018 survey also assessed
consumer vulnerability The results show that about a quarter of the European consumers (265) self-identify as vulnerable for one or more aspects linked to their socio-demographic background This is lower than in 2016 (317) In contrast perceived vulnerability based on the experienced complexity of offer terms and conditions (342) has increased considerably since 2016 (213)
Finally multiple multivariate analyses were conducted to provide insights into the role of socio-demographic factors Consumersrsquo financial situation is the factor most closely linked to key consumer conditions indicators Specifically consumers in a difficult financial situation tend to show
lower trust in organisations lower confidence in online shopping lower trust in product safety lower trust in environmental claims and a higher probability to experience UCPs In addition severe financial problems are also negatively linked with trust in organisations trust in redress mechanisms and confidence in online shopping and positively linked with exposure to UCPs
Consumer Survey 2018
16
3 DOMESTIC AND CROSS-BORDER SHOPPING
Steady growth is observable in the e-commerce sector throughout the European Union (EU27_2019)14 over the past few years However consumers can still gain considerable value from making online purchases cross-border The first chapter reports the degree to which consumers engage in online shopping from retailers and service providers located in their country of residence
in the EU or outside the EU It also reports on the degree to which consumers engage in cross-border shopping from offline retailers or service providers
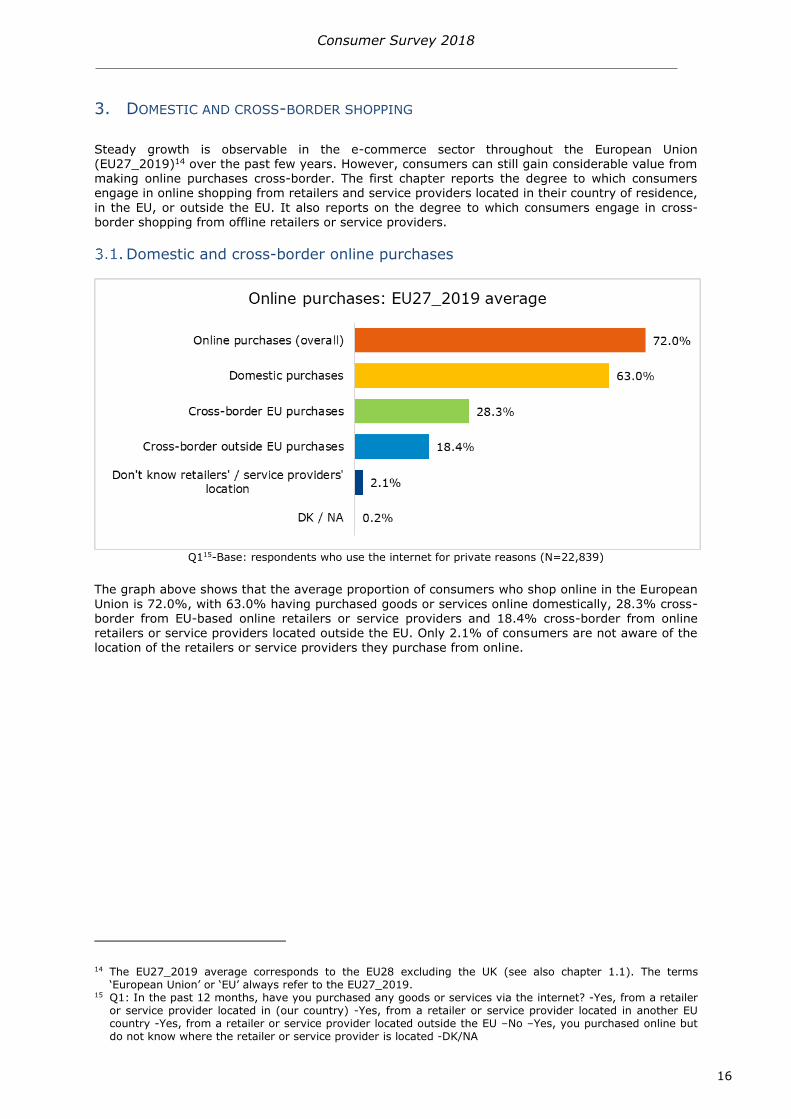
Domestic and cross-border online purchases
Q115-Base respondents who use the internet for private reasons (N=22839)
The graph above shows that the average proportion of consumers who shop online in the European
Union is 720 with 630 having purchased goods or services online domestically 283 cross-border from EU-based online retailers or service providers and 184 cross-border from online
retailers or service providers located outside the EU Only 21 of consumers are not aware of the location of the retailers or service providers they purchase from online
14 The EU27_2019 average corresponds to the EU28 excluding the UK (see also chapter 11) The terms lsquoEuropean Unionrsquo or lsquoEUrsquo always refer to the EU27_2019
15 Q1 In the past 12 months have you purchased any goods or services via the internet -Yes from a retailer or service provider located in (our country) -Yes from a retailer or service provider located in another EU country -Yes from a retailer or service provider located outside the EU ndashNo ndashYes you purchased online but do not know where the retailer or service provider is located -DKNA
Consumer Survey 2018
17
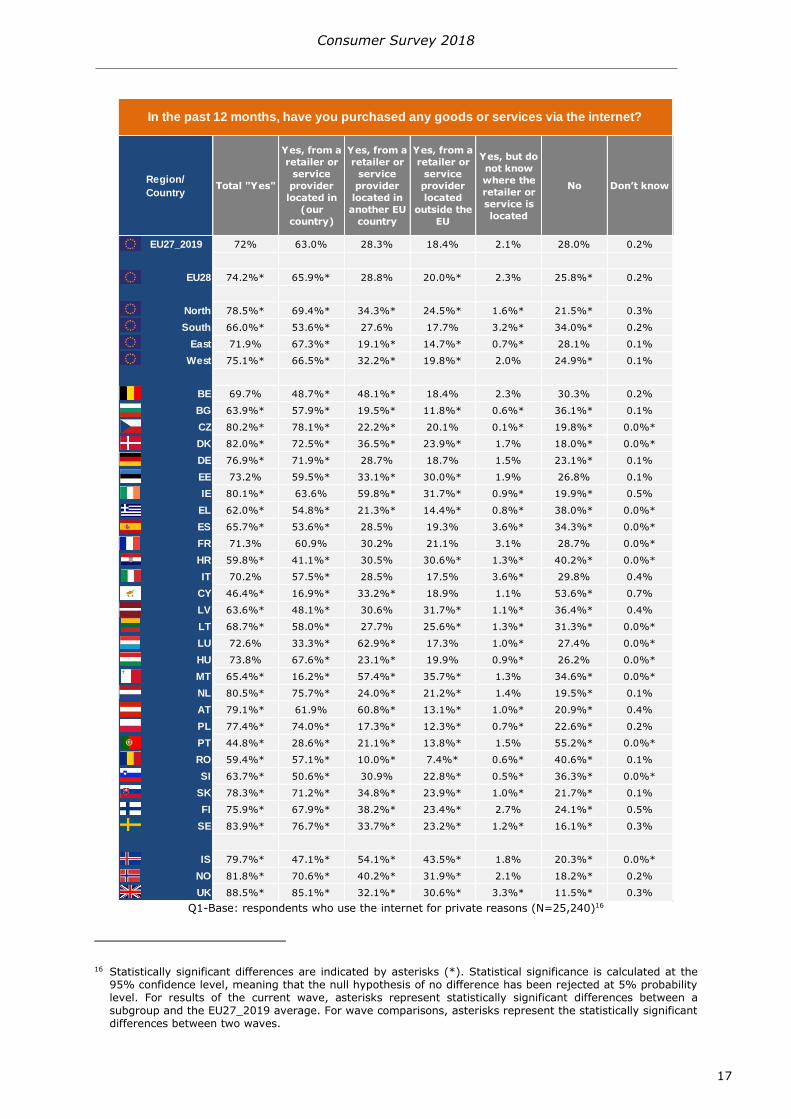
Q1-Base respondents who use the internet for private reasons (N=25240)16
16 Statistically significant differences are indicated by asterisks () Statistical significance is calculated at the 95 confidence level meaning that the null hypothesis of no difference has been rejected at 5 probability level For results of the current wave asterisks represent statistically significant differences between a subgroup and the EU27_2019 average For wave comparisons asterisks represent the statistically significant differences between two waves
Region
CountryTotal Yes
Yes from a
retailer or
service
provider
located in
(our
country)
Yes from a
retailer or
service
provider
located in
another EU
country
Yes from a
retailer or
service
provider
located
outside the
EU
Yes but do
not know
where the
retailer or
service is
located
No Donrsquot know
EU27_2019 72 630 283 184 21 280 02
EU28 742 659 288 200 23 258 02
North 785 694 343 245 16 215 03
South 660 536 276 177 32 340 02
East 719 673 191 147 07 281 01
West 751 665 322 198 20 249 01
BE 697 487 481 184 23 303 02
BG 639 579 195 118 06 361 01
CZ 802 781 222 201 01 198 00
DK 820 725 365 239 17 180 00
DE 769 719 287 187 15 231 01
EE 732 595 331 300 19 268 01
IE 801 636 598 317 09 199 05
EL 620 548 213 144 08 380 00
ES 657 536 285 193 36 343 00
FR 713 609 302 211 31 287 00
HR 598 411 305 306 13 402 00
IT 702 575 285 175 36 298 04
CY 464 169 332 189 11 536 07
LV 636 481 306 317 11 364 04
LT 687 580 277 256 13 313 00
LU 726 333 629 173 10 274 00
HU 738 676 231 199 09 262 00
MT 654 162 574 357 13 346 00
NL 805 757 240 212 14 195 01
AT 791 619 608 131 10 209 04
PL 774 740 173 123 07 226 02
PT 448 286 211 138 15 552 00
RO 594 571 100 74 06 406 01
SI 637 506 309 228 05 363 00
SK 783 712 348 239 10 217 01
FI 759 679 382 234 27 241 05
SE 839 767 337 232 12 161 03
IS 797 471 541 435 18 203 00
NO 818 706 402 319 21 182 02
UK 885 851 321 306 33 115 03
In the past 12 months have you purchased any goods or services via the internet
Consumer Survey 2018
18
Overall 630 of EU27_2019 respondents who use the internet for private reasons report shopping
online domestically Consumers residing in the North (694) East (673) and West regions (665) are more likely to engage in online shopping domestically compared to the EU27_2019 average while those in the South are less likely (536) Among the countries of the European Union the highest levels of domestic shopping online are found in the Czech Republic (781) Sweden (767) and the Netherlands (757) Among all the studied countries the highest level is found in the UK (851) The lowest levels are found in Malta (162) Cyprus (169) and Portugal (286)
The proportion of respondents who shop online cross-border from retailers or service providers in another EU country is 283 in the EU27_2019 The incidence of shopping online from retailers in another EU country in the South is in line with the EU27_2019 average17 while it is higher in the North (343) and the West (322) and lower in the East (191) The highest levels of online cross-border shopping from retailers or service providers in another EU country are found in Luxembourg (629) Austria (608) and Ireland (598) The lowest levels are found in
Romania (100) Poland (173) and Bulgaria (195)
In the European Union 184 of consumers shop online cross-border from retailers or service
providers in countries outside the EU For consumers in the South this incidence is in line with the EU27_2019 average while it is higher in the North (245) and West (198) and lower in the East (147) Among the EU countries the highest levels of this indicator are found in Malta (357) Latvia Ireland (both 317) and Croatia (306) Furthermore this level is also high in Iceland (435) and Norway (319) The lowest levels are found in Romania (74) Bulgaria
(118) and Poland (123)
Only 21 of EU27_2019 consumers do not know where the retailer or service provider they shopped from online is located For consumers in the West the proportion not being aware of the retailersrsquo location is in line with the EU27_2019 average while it is higher in the South (32) and lower in the North (16) and East (07) Among the EU countries the highest levels of this indicator are found in Italy Spain (both 36) Lithuania and Croatia (both 13) Additionally this level is also high in the UK (33) The lowest levels are found in the Czech Republic (01) Slovenia
(05) Bulgaria and Romania (both 06)
17 As mentioned in chapter 124 differences that are not statistically significant are considered equal to 0 regardless of their numerical level
Consumer Survey 2018
19
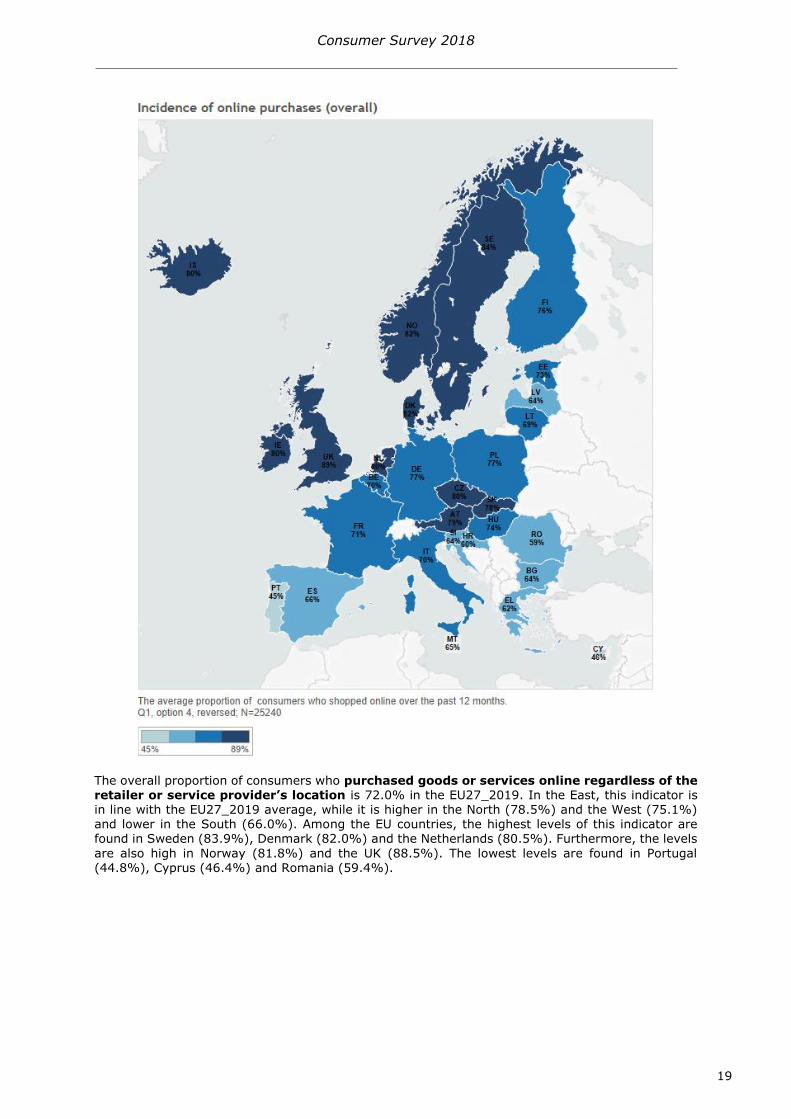
The overall proportion of consumers who purchased goods or services online regardless of the retailer or service providerrsquos location is 720 in the EU27_2019 In the East this indicator is in line with the EU27_2019 average while it is higher in the North (785) and the West (751) and lower in the South (660) Among the EU countries the highest levels of this indicator are found in Sweden (839) Denmark (820) and the Netherlands (805) Furthermore the levels
are also high in Norway (818) and the UK (885) The lowest levels are found in Portugal (448) Cyprus (464) and Romania (594)
Consumer Survey 2018
20
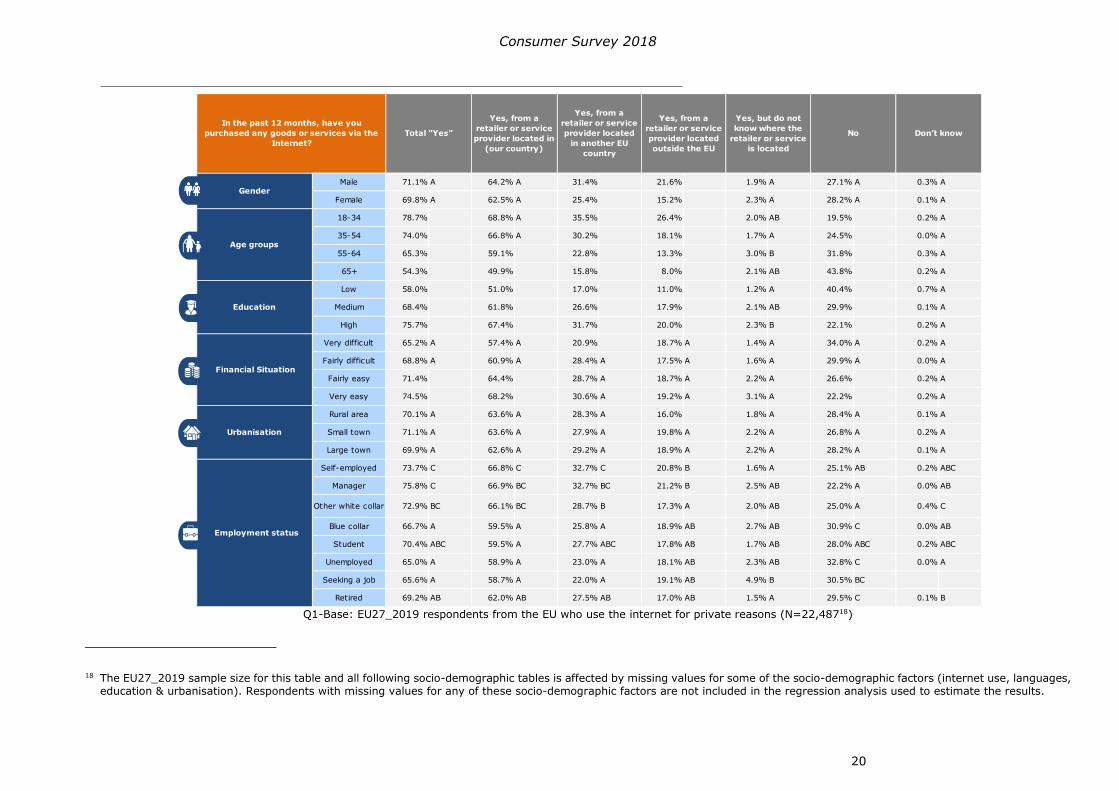
Q1-Base EU27_2019 respondents from the EU who use the internet for private reasons (N=2248718)
18 The EU27_2019 sample size for this table and all following socio-demographic tables is affected by missing values for some of the socio-demographic factors (internet use languages education amp urbanisation) Respondents with missing values for any of these socio-demographic factors are not included in the regression analysis used to estimate the results
Male 711 A 642 A 314 216 19 A 271 A 03 A
Female 698 A 625 A 254 152 23 A 282 A 01 A
18-34 787 688 A 355 264 20 AB 195 02 A
35-54 740 668 A 302 181 17 A 245 00 A
55-64 653 591 228 133 30 B 318 03 A
65+ 543 499 158 80 21 AB 438 02 A
Low 580 510 170 110 12 A 404 07 A
Medium 684 618 266 179 21 AB 299 01 A
High 757 674 317 200 23 B 221 02 A
Very difficult 652 A 574 A 209 187 A 14 A 340 A 02 A
Fairly difficult 688 A 609 A 284 A 175 A 16 A 299 A 00 A
Fairly easy 714 644 287 A 187 A 22 A 266 02 A
Very easy 745 682 306 A 192 A 31 A 222 02 A
Rural area 701 A 636 A 283 A 160 18 A 284 A 01 A
Small town 711 A 636 A 279 A 198 A 22 A 268 A 02 A
Large town 699 A 626 A 292 A 189 A 22 A 282 A 01 A
Self-employed 737 C 668 C 327 C 208 B 16 A 251 AB 02 ABC
Manager 758 C 669 BC 327 BC 212 B 25 AB 222 A 00 AB
Other white collar 729 BC 661 BC 287 B 173 A 20 AB 250 A 04 C
Blue collar 667 A 595 A 258 A 189 AB 27 AB 309 C 00 AB
Student 704 ABC 595 A 277 ABC 178 AB 17 AB 280 ABC 02 ABC
Unemployed 650 A 589 A 230 A 181 AB 23 AB 328 C 00 A
Seeking a job 656 A 587 A 220 A 191 AB 49 B 305 BC
Retired 692 AB 620 AB 275 AB 170 AB 15 A 295 C 01 B
Financial Situation
In the past 12 months have you
purchased any goods or services via the
Internet
Total Yes
Yes from a
retailer or service
provider located in
(our country)
Yes from a
retailer or service
provider located
in another EU
country
No Donrsquot know
Gender
Age groups
Education
Yes from a
retailer or service
provider located
outside the EU
Yes but do not
know where the
retailer or service
is located
Urbanisation
Employment status
Consumer Survey 2018
21
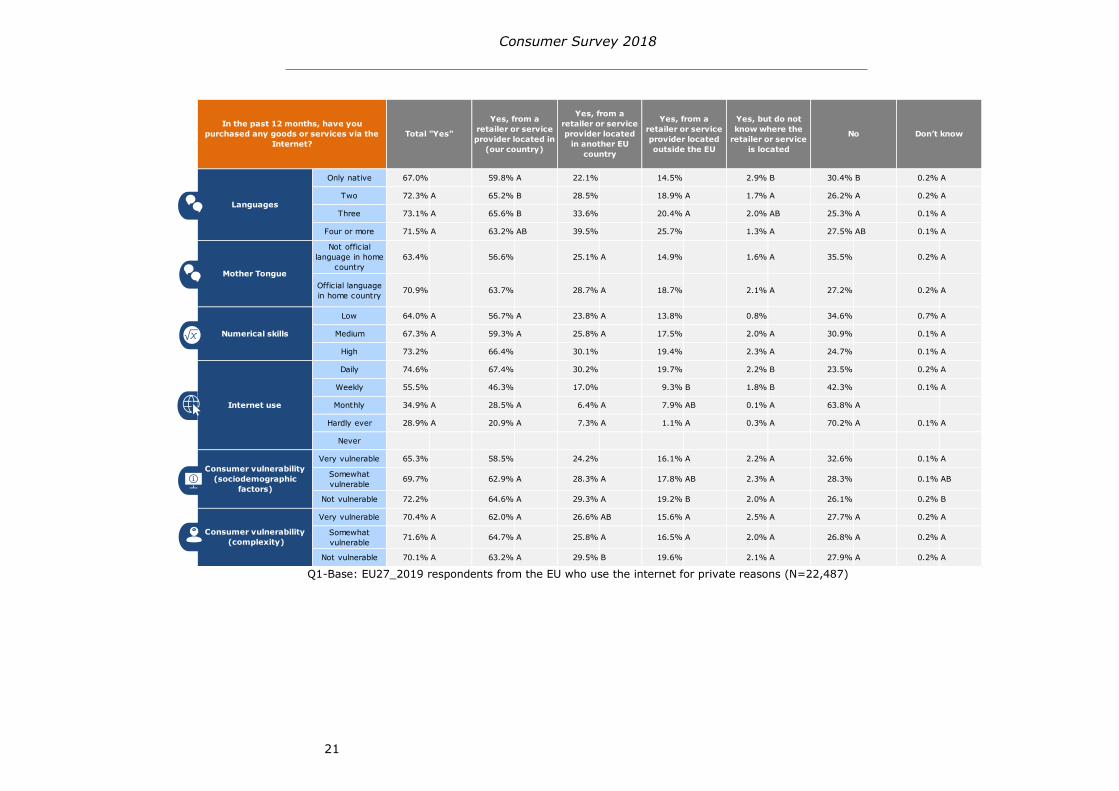
Q1-Base EU27_2019 respondents from the EU who use the internet for private reasons (N=22487)
Only native 670 598 A 221 145 29 B 304 B 02 A
Two 723 A 652 B 285 189 A 17 A 262 A 02 A
Three 731 A 656 B 336 204 A 20 AB 253 A 01 A
Four or more 715 A 632 AB 395 257 13 A 275 AB 01 A
Not official
language in home
country
634 566 251 A 149 16 A 355 02 A
Official language
in home country709 637 287 A 187 21 A 272 02 A
Low 640 A 567 A 238 A 138 08 346 07 A
Medium 673 A 593 A 258 A 175 20 A 309 01 A
High 732 664 301 194 23 A 247 01 A
Daily 746 674 302 197 22 B 235 02 A
Weekly 555 463 170 93 B 18 B 423 01 A
Monthly 349 A 285 A 64 A 79 AB 01 A 638 A
Hardly ever 289 A 209 A 73 A 11 A 03 A 702 A 01 A
Never
Very vulnerable 653 585 242 161 A 22 A 326 01 A
Somewhat
vulnerable697 629 A 283 A 178 AB 23 A 283 01 AB
Not vulnerable 722 646 A 293 A 192 B 20 A 261 02 B
Very vulnerable 704 A 620 A 266 AB 156 A 25 A 277 A 02 A
Somewhat
vulnerable716 A 647 A 258 A 165 A 20 A 268 A 02 A
Not vulnerable 701 A 632 A 295 B 196 21 A 279 A 02 A
In the past 12 months have you
purchased any goods or services via the
Internet
Total Yes
Yes from a
retailer or service
provider located in
(our country)
Yes but do not
know where the
retailer or service
is located
No Donrsquot know
Languages
Mother Tongue
Yes from a
retailer or service
provider located
in another EU
country
Numerical skills
Internet use
Consumer vulnerability
(sociodemographic
factors)
Consumer vulnerability
(complexity)
Yes from a
retailer or service
provider located
outside the EU
Consumer Survey 2018
22
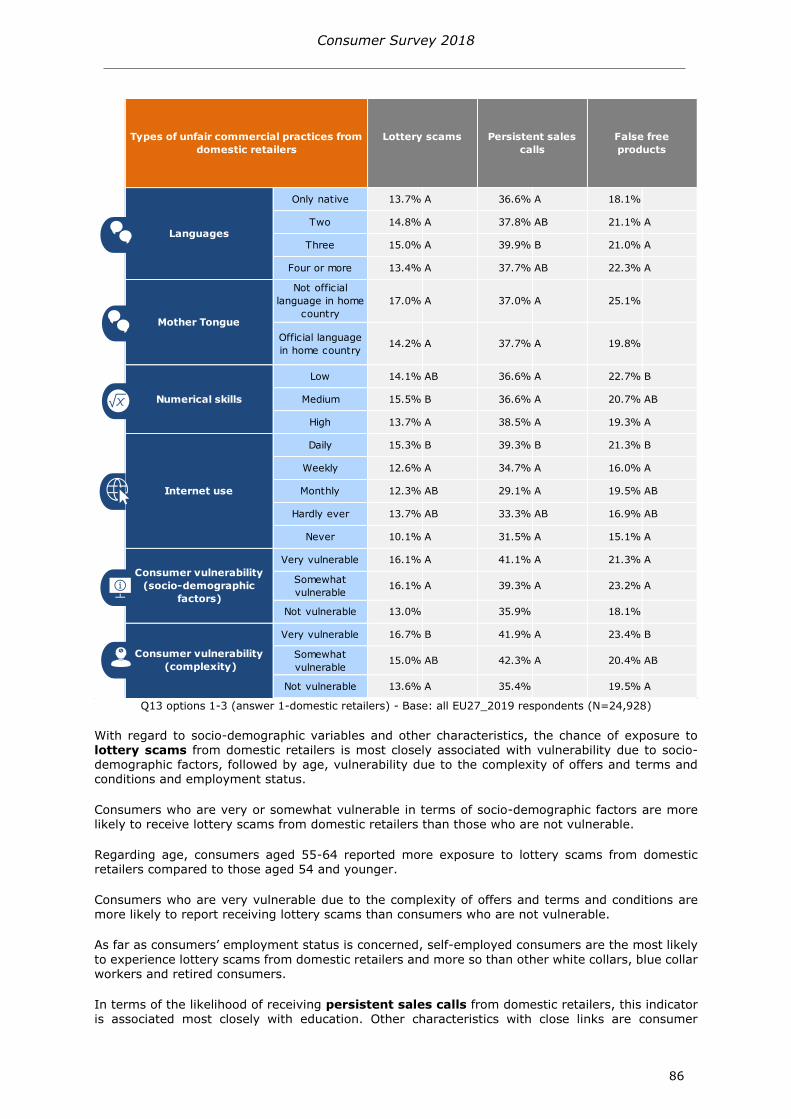
With regard to socio-demographic variables and other characteristics the results of the multivariate
analysis19 show that consumersrsquo internet use is the factor most closely associated20 with internet purchases in their own country followed by education age mother tongue and numerical skills
Regarding consumersrsquo frequency of internet use21 daily internet users are more likely to make domestic online purchases compared to those who use the internet weekly In addition weekly users also conduct more such purchases than monthly internet users and those who hardly ever use the internet
Highly educated consumers are more likely to purchase products and services online domestically than consumers with a medium level of education who in turn show higher values than consumers with a lower level of education
Regarding age domestic purchases are more common amongst consumers aged 18-54 years than amongst older consumers aged 55+
Consumers whose mother tongue is one of the official languages of the country or region they live in are also more likely to make such purchases than those whose mother tongue is not an official
language
Finally those with a high numerical skill level are more likely to make such purchases than those with a medium or low numerical skill level
Purchases of goods and services in another EU country via the internet is associated most closely with consumersrsquo age The characteristics showing the next closest links are education the number of languages spoken internet use and gender
Younger consumers (18-34 years) are more likely to engage in online cross-border shopping than all
other age groups In addition consumers aged 35-54 years are also more likely to make such purchases than those who are aged 55-64 years who in turn are also more likely to make such purchases than those aged 65+ years
Regarding consumersrsquo level of education highly educated consumers are most likely to make such purchases Furthermore those with a medium level of education are in turn more likely to make such purchases than those with a low level of education
Consumers that speak at least four languages are more likely to make such purchases than those
who speak fewer languages Those who speak three languages are also more likely to conduct cross-border online purchases than those who speak two languages who in turn are more likely to make such purchases than those who only speak their native language
Daily internet users are by far the most likely to purchase products or services online from retailers in another EU country In addition weekly internet users also show higher values than consumers who use the internet monthly and those who hardly ever use the internet
Finally males are more likely to make such purchases than females
When it comes to online purchases of goods and services from a retailer or service provider outside the EU consumersrsquo age is associated most closely with this indicator followed by gender education the number of languages spoken and frequency of internet use
As with cross-border purchases younger consumers (18-34 years) are most likely engage in online shopping in a country outside the EU In addition those who are aged 35-54 years are more likely
19 The values shown in the tables of the socio-demographic analyses are based on model estimates (see also chapter 124)
20 The sociodemographic characteristics having the closest link with the dependent variable are selected considering the average magnitude of the difference across the different levels of all the sociodemographic characters (eg the differences in the likelihood to purchase online- in absolute terms- across the different levels of internet use) and by looking at the overall coherence of this variability
21 Since Question 1 measured consumersrsquo online purchases the internet usage level lsquoNeverrsquo is excluded from the regression models
Consumer Survey 2018
23
to make such purchases than those who are aged 55-64 years who in turn are also more likely to
make such purchases than those aged 65+ years
As far as gender is concerned males are more likely to purchase goods or services online from traders outside of the EU than females
Highly educated consumers are more likely to make such purchases than the remainder of the population In addition those with a medium level of education are also more likely to make such purchases than those with a low level of education
Consumers that speak four languages or more are the most likely to make such purchases
Furthermore those who speak two or three languages also make more online purchases from retailers outside of the EU than consumers who only speak their native language
Finally daily internet users are noticeably more likely to conduct online purchases from countries outside the EU than less frequent internet users Weekly internet users also differ from those who use the internet hardly ever
When it comes to consumers making online purchases of goods and services from a retailer
or service provider whom they do not know the location of consumersrsquo numerical skills are most closely associated with this indicator followed by the frequency of internet use education employment status and age
Consumers with high or medium numerical skills22 are more likely to make online purchases from a retailer or service provider whom they do not know the location of than those with low numerical skills
Moreover daily or weekly internet users are also more likely to make online purchases from such
retailers than those who use the internet monthly or hardly ever
Regarding consumersrsquo level of education those who are highly educated are more likely to make such purchases than those with a low level of education
Job-seekers are the most likely to purchase products and services online without knowing the location of the retailers and more so than those who are retired or self-employed The latter two are the least
likely to conduct such purchases
Finally consumers that are 55-64 years old are more likely to purchase goods and services from
retailers whom they do not know the location of than consumers aged 35-54 years old
Offline cross-border purchases
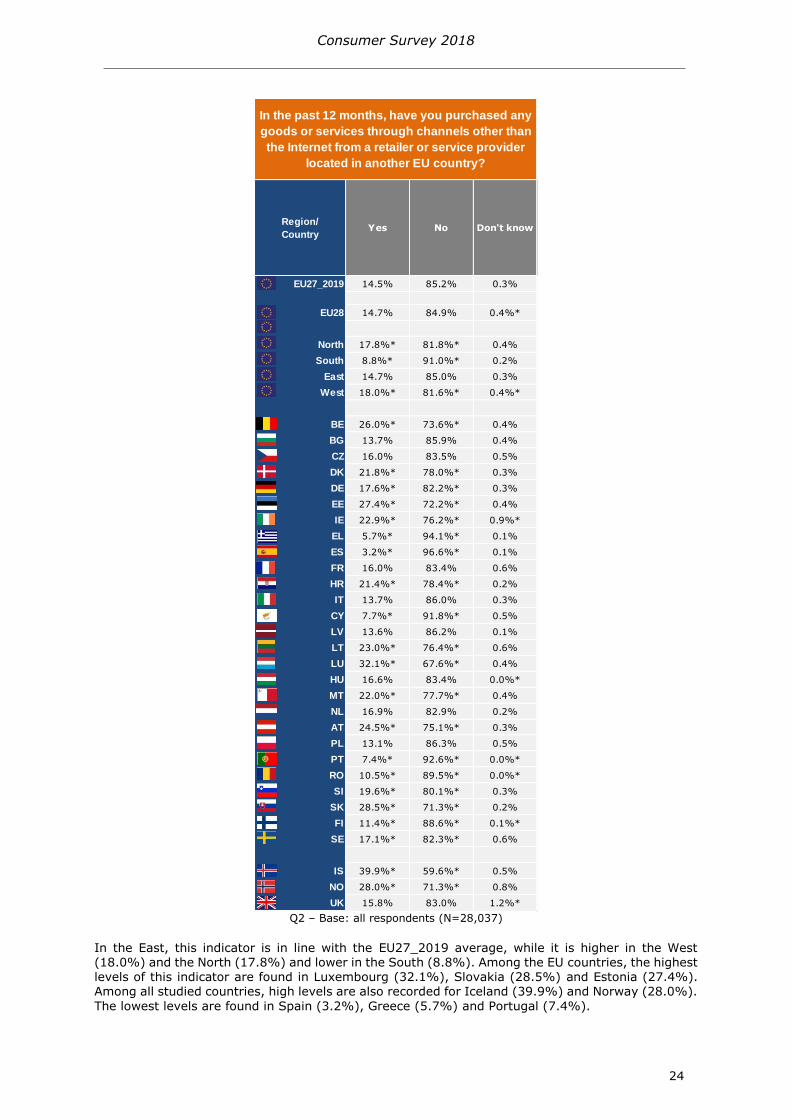
When it comes to shopping cross-border from offline retailers or service providers the majority of respondents (852) has not performed such purchases in the past 12 months in the European Union Yet 145 of consumers in the EU27_2019 has purchased products or services offline in
another EU country during this timeframe
22 Respondentsrsquo numerical skills were measured with two short mathematical scenariosrsquo Suppose that the exact same product is on sale in shop A and shop B I will read you two statements about offers from shop A and shop B In each case please tell me which shop is cheaper 1 Shop A offers a TV set for 440 euro Shop B offers the exact same type of TV set at 500 euro but with a discount of 10 2 Shop A offers a TV set for 890 euro Shop B offers the exact same type of TV set at 940 euro but with a reduction of 60 euro 2 correct answers correspond to a high level of numerical skills 1 correct answer to a medium level and 0 correct answers to a low level
Consumer Survey 2018
24
Q2 ndash Base all respondents (N=28037)
In the East this indicator is in line with the EU27_2019 average while it is higher in the West (180) and the North (178) and lower in the South (88) Among the EU countries the highest levels of this indicator are found in Luxembourg (321) Slovakia (285) and Estonia (274) Among all studied countries high levels are also recorded for Iceland (399) and Norway (280)
The lowest levels are found in Spain (32) Greece (57) and Portugal (74)
Region
CountryYes No Dont know
EU27_2019 145 852 03
EU28 147 849 04
North 178 818 04
South 88 910 02
East 147 850 03
West 180 816 04
BE 260 736 04
BG 137 859 04
CZ 160 835 05
DK 218 780 03
DE 176 822 03
EE 274 722 04
IE 229 762 09
EL 57 941 01
ES 32 966 01
FR 160 834 06
HR 214 784 02
IT 137 860 03
CY 77 918 05
LV 136 862 01
LT 230 764 06
LU 321 676 04
HU 166 834 00
MT 220 777 04
NL 169 829 02
AT 245 751 03
PL 131 863 05
PT 74 926 00
RO 105 895 00
SI 196 801 03
SK 285 713 02
FI 114 886 01
SE 171 823 06
IS 399 596 05
NO 280 713 08
UK 158 830 12
In the past 12 months have you purchased any
goods or services through channels other than
the Internet from a retailer or service provider
located in another EU country
Consumer Survey 2018
25
Q2 ndash Base all EU27_2019 respondents (N=2492823)
23 See footnote 18
Male 149 A 847 A 04
Female 143 A 855 A 02
18-34 168 B 826 A 06 B
35-54 155 B 842 A 03 B
55-64 114 A 884 B 02 AB
65+ 118 A 882 B 01 A
Low 100 898 01 A
Medium 139 858 03 A
High 159 838 04 A
Very difficult 160 AB 839 AB 01
Fairly difficult 136 A 860 B 04 A
Fairly easy 141 A 857 B 03 A
Very easy 168 B 828 A 04 B
Rural area 142 A 855 A 02 A
Small town 143 A 853 A 04 A
Large town 153 A 845 A 03 A
Self-employed 160 DE 836 AB 05 A
Manager 182 E 814 A 04 A
Other white collar 149 CD 848 BC 03 A
Blue collar 132 BC 867 CD 02 A
Student 162 CDE 838 ABC 02 A
Unemployed 99 A 894 D 10 A
Seeking a job 108 AB 887 D 05 A
Retired 134 ABCD 862 BCD 06 A
Age groups
In the past 12 months have you
purchased any goods or services through
channels other than the Internet from a
retailer or service provider located in
another EU country
Yes No Dont know
Gender
Education
Financial Situation
Urbanisation
Employment status
Consumer Survey 2018
26
Q2 ndash Base all EU27_2019 respondents (N=24928)
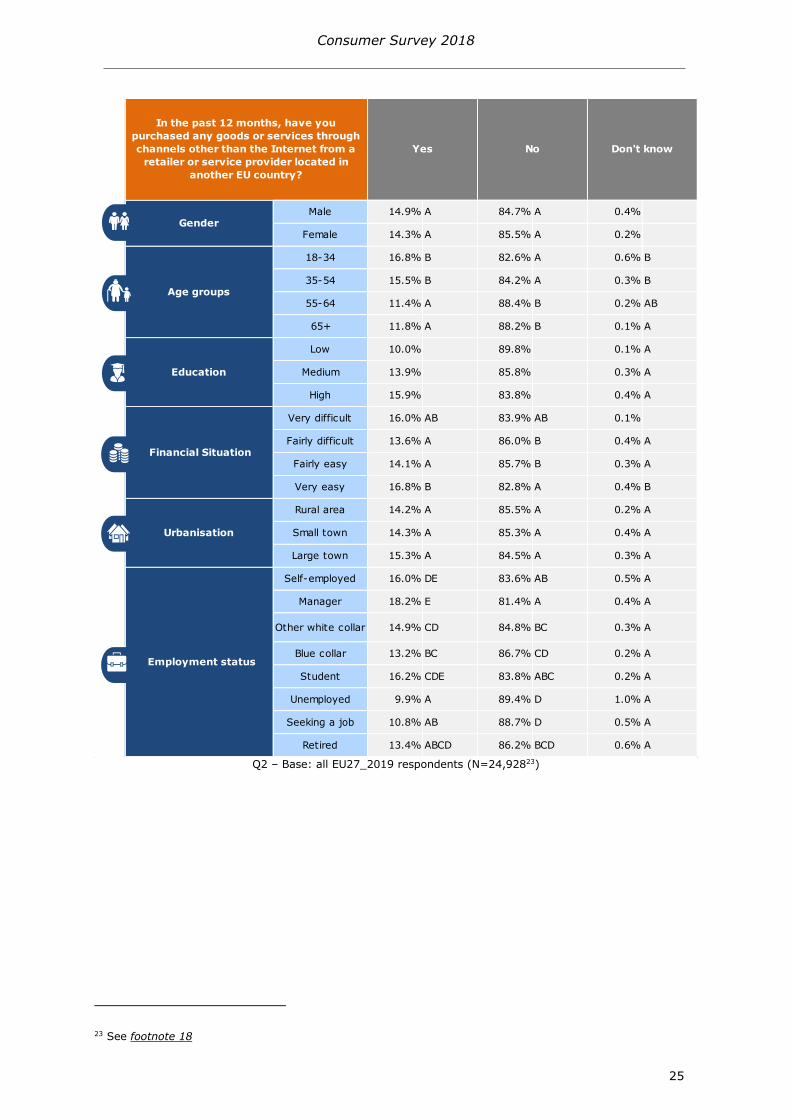
Regarding socio-demographic variables and other characteristics consumersrsquo language skills is the factor most closely associated with cross-border shopping in another EU country through channels other than the internet The characteristics showing the next closest links are education frequency of internet use age and employment status
Consumers speak at least four languages are more likely to make such purchases than those who speak three languages who in turn are more likely to make such purchases than those who speak two languages The latter group is also more likely to make such purchases than those who speak only their native language
Regarding consumersrsquo level of education highly educated consumers are more likely to purchase products and services offline in another EU country than those with a medium or low level of education Those with a medium level of education are also more likely to purchase products or
services offline in another EU country than consumers with a low level of education
Daily internet users are most likely to purchase products and services offline in another EU country compared to those who use the internet less frequently In contrast people that never use the internet show lower values for such purchases than daily or weekly internet users
As far as age is concerned consumers aged 18-54 years are more likely to engage cross-border shopping through channels other than the internet than older consumers aged 55 years or older
Only native 101 897 02 AB
Two 138 858 04 B
Three 201 796 04 AB
Four or more 240 759 01 A
Not official
language in home
country
138 A 851 A 12 A
Official language
in home country147 A 851 A 03 A
Low 119 A 878 A 03 A
Medium 134 A 863 A 03 A
High 154 842 04 A
Daily 156 840 04
Weekly 124 B 876 A 00 A
Monthly 92 AB 907 AB
Hardly ever 84 AB 916 AB
Never 54 A 945 B 01 A
Very vulnerable 141 A 857 A 03 A
Somewhat
vulnerable142 A 855 A 04 A
Not vulnerable 149 A 848 A 03 A
Very vulnerable 152 A 844 A 05 A
Somewhat
vulnerable150 A 847 A 03 A
Not vulnerable 144 A 853 A 03 A
In the past 12 months have you
purchased any goods or services through
channels other than the Internet from a
retailer or service provider located in
another EU country
Consumer vulnerability
(socio-demographic
factors)
Consumer vulnerability
(complexity)
No Dont know
Languages
Mother Tongue
Numerical skills
Internet use
Yes
Consumer Survey 2018
27
Finally regarding employment status managers are most likely to make offline cross-border
purchases and more so than any other consumer group except for self-employed consumers and students In contrast those who are unemployed are the least likely to engage in such purchases and are less likely to do so than managers students people who are self-employed other white collars and blue-collar workers
Consumer Survey 2018
28
4 THE EVOLUTION OF ONLINE PURCHASE BEHAVIOUR2425
Q1-Base respondents who use the internet for private reasons (N=25240)
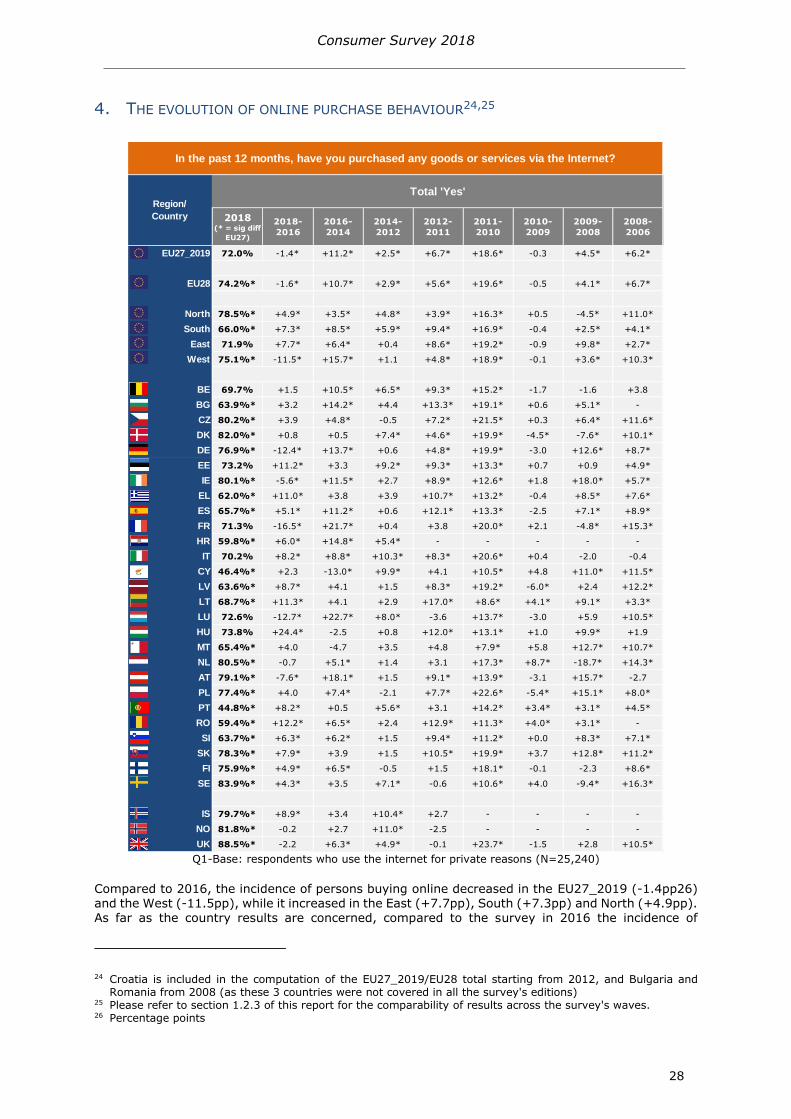
Compared to 2016 the incidence of persons buying online decreased in the EU27_2019 (-14pp26) and the West (-115pp) while it increased in the East (+77pp) South (+73pp) and North (+49pp) As far as the country results are concerned compared to the survey in 2016 the incidence of
24 Croatia is included in the computation of the EU27_2019EU28 total starting from 2012 and Bulgaria and Romania from 2008 (as these 3 countries were not covered in all the surveys editions)
25 Please refer to section 123 of this report for the comparability of results across the surveys waves 26 Percentage points
2018 ( = sig diff
EU27)
2018-
2016
2016-
2014
2014-
2012
2012-
2011
2011-
2010
2010-
2009
2009-
2008
2008-
2006
EU27_2019 720 -14 +112 +25 +67 +186 -03 +45 +62
EU28 742 -16 +107 +29 +56 +196 -05 +41 +67
North 785 +49 +35 +48 +39 +163 +05 -45 +110
South 660 +73 +85 +59 +94 +169 -04 +25 +41
East 719 +77 +64 +04 +86 +192 -09 +98 +27
West 751 -115 +157 +11 +48 +189 -01 +36 +103
BE 697 +15 +105 +65 +93 +152 -17 -16 +38
BG 639 +32 +142 +44 +133 +191 +06 +51 -
CZ 802 +39 +48 -05 +72 +215 +03 +64 +116
DK 820 +08 +05 +74 +46 +199 -45 -76 +101
DE 769 -124 +137 +06 +48 +199 -30 +126 +87
EE 732 +112 +33 +92 +93 +133 +07 +09 +49
IE 801 -56 +115 +27 +89 +126 +18 +180 +57
EL 620 +110 +38 +39 +107 +132 -04 +85 +76
ES 657 +51 +112 +06 +121 +133 -25 +71 +89
FR 713 -165 +217 +04 +38 +200 +21 -48 +153
HR 598 +60 +148 +54 - - - - -
IT 702 +82 +88 +103 +83 +206 +04 -20 -04
CY 464 +23 -130 +99 +41 +105 +48 +110 +115
LV 636 +87 +41 +15 +83 +192 -60 +24 +122
LT 687 +113 +41 +29 +170 +86 +41 +91 +33
LU 726 -127 +227 +80 -36 +137 -30 +59 +105
HU 738 +244 -25 +08 +120 +131 +10 +99 +19
MT 654 +40 -47 +35 +48 +79 +58 +127 +107
NL 805 -07 +51 +14 +31 +173 +87 -187 +143
AT 791 -76 +181 +15 +91 +139 -31 +157 -27
PL 774 +40 +74 -21 +77 +226 -54 +151 +80
PT 448 +82 +05 +56 +31 +142 +34 +31 +45
RO 594 +122 +65 +24 +129 +113 +40 +31 -
SI 637 +63 +62 +15 +94 +112 +00 +83 +71
SK 783 +79 +39 +15 +105 +199 +37 +128 +112
FI 759 +49 +65 -05 +15 +181 -01 -23 +86
SE 839 +43 +35 +71 -06 +106 +40 -94 +163
IS 797 +89 +34 +104 +27 - - - -
NO 818 -02 +27 +110 -25 - - - -
UK 885 -22 +63 +49 -01 +237 -15 +28 +105
In the past 12 months have you purchased any goods or services via the Internet
Region
Country
Total Yes
Consumer Survey 2018
29
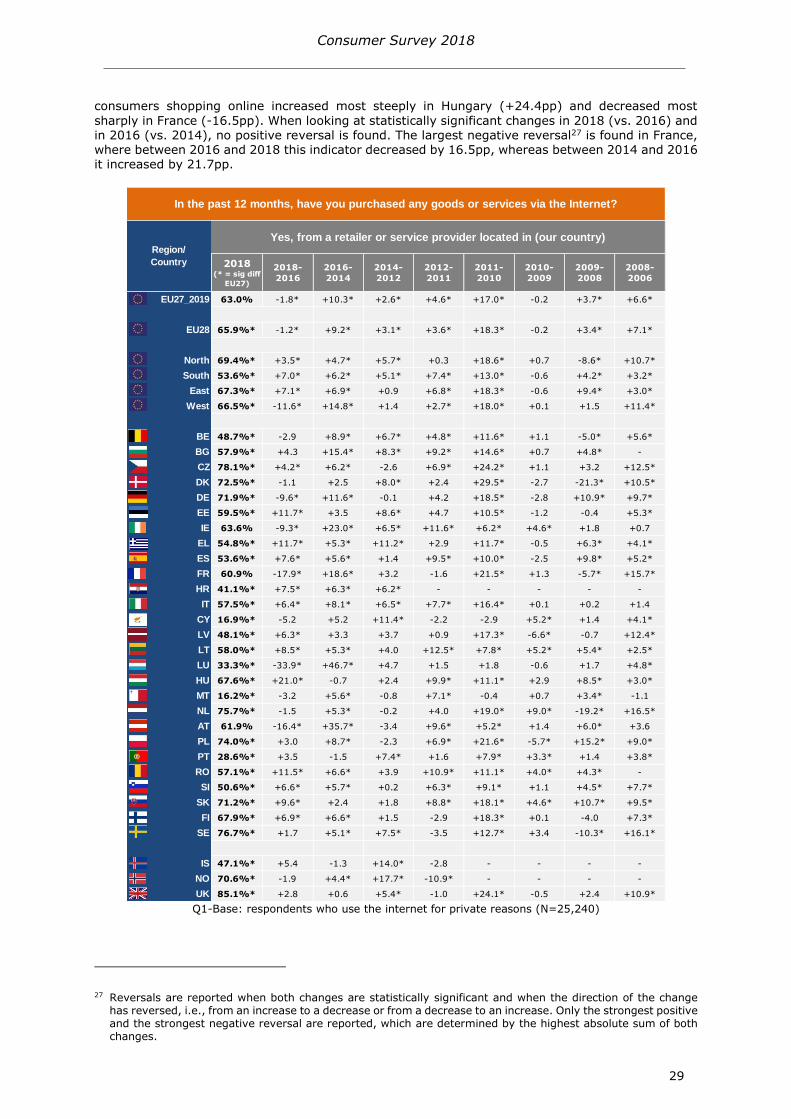
consumers shopping online increased most steeply in Hungary (+244pp) and decreased most
sharply in France (-165pp) When looking at statistically significant changes in 2018 (vs 2016) and in 2016 (vs 2014) no positive reversal is found The largest negative reversal27 is found in France where between 2016 and 2018 this indicator decreased by 165pp whereas between 2014 and 2016 it increased by 217pp
Q1-Base respondents who use the internet for private reasons (N=25240)
27 Reversals are reported when both changes are statistically significant and when the direction of the change has reversed ie from an increase to a decrease or from a decrease to an increase Only the strongest positive and the strongest negative reversal are reported which are determined by the highest absolute sum of both changes
2018 ( = sig diff
EU27)
2018-
2016
2016-
2014
2014-
2012
2012-
2011
2011-
2010
2010-
2009
2009-
2008
2008-
2006
EU27_2019 630 -18 +103 +26 +46 +170 -02 +37 +66
EU28 659 -12 +92 +31 +36 +183 -02 +34 +71
North 694 +35 +47 +57 +03 +186 +07 -86 +107
South 536 +70 +62 +51 +74 +130 -06 +42 +32
East 673 +71 +69 +09 +68 +183 -06 +94 +30
West 665 -116 +148 +14 +27 +180 +01 +15 +114
BE 487 -29 +89 +67 +48 +116 +11 -50 +56
BG 579 +43 +154 +83 +92 +146 +07 +48 -
CZ 781 +42 +62 -26 +69 +242 +11 +32 +125
DK 725 -11 +25 +80 +24 +295 -27 -213 +105
DE 719 -96 +116 -01 +42 +185 -28 +109 +97
EE 595 +117 +35 +86 +47 +105 -12 -04 +53
IE 636 -93 +230 +65 +116 +62 +46 +18 +07
EL 548 +117 +53 +112 +29 +117 -05 +63 +41
ES 536 +76 +56 +14 +95 +100 -25 +98 +52
FR 609 -179 +186 +32 -16 +215 +13 -57 +157
HR 411 +75 +63 +62 - - - - -
IT 575 +64 +81 +65 +77 +164 +01 +02 +14
CY 169 -52 +52 +114 -22 -29 +52 +14 +41
LV 481 +63 +33 +37 +09 +173 -66 -07 +124
LT 580 +85 +53 +40 +125 +78 +52 +54 +25
LU 333 -339 +467 +47 +15 +18 -06 +17 +48
HU 676 +210 -07 +24 +99 +111 +29 +85 +30
MT 162 -32 +56 -08 +71 -04 +07 +34 -11
NL 757 -15 +53 -02 +40 +190 +90 -192 +165
AT 619 -164 +357 -34 +96 +52 +14 +60 +36
PL 740 +30 +87 -23 +69 +216 -57 +152 +90
PT 286 +35 -15 +74 +16 +79 +33 +14 +38
RO 571 +115 +66 +39 +109 +111 +40 +43 -
SI 506 +66 +57 +02 +63 +91 +11 +45 +77
SK 712 +96 +24 +18 +88 +181 +46 +107 +95
FI 679 +69 +66 +15 -29 +183 +01 -40 +73
SE 767 +17 +51 +75 -35 +127 +34 -103 +161
IS 471 +54 -13 +140 -28 - - - -
NO 706 -19 +44 +177 -109 - - - -
UK 851 +28 +06 +54 -10 +241 -05 +24 +109
In the past 12 months have you purchased any goods or services via the Internet
Region
Country
Yes from a retailer or service provider located in (our country)
Consumer Survey 2018
30
In terms of online shopping domestically the proportion of consumers having done so in the past 12
months decreased in the EU27_2019 (-18pp) and the Western region (-116pp) while the opposite pattern can be observed for the Eastern (+71pp) Southern (+70pp) and Northern regions (+35pp) Compared to the survey in 2016 the proportion of consumers who shop online domestically increased most steeply in Hungary (+210pp) The greatest decrease compared to 2016 is observed in Luxembourg (-339pp) In Luxembourg also the largest negative reversal is observed where the decrease between 2016 and 2018 was preceded by an increase of 467pp between 2014 and 2016 There are no statistically significant positive reversals
Q1-Base respondents who use the internet for private reasons (N=25240)
2018 ( = sig diff
EU27)
2018-
2016
2016-
2014
2014-
2012
2012-
2011
2011-
2010
2010-
2009
2009-
2008
2008-
2006
EU27_2019 283 +91 +03 +23 +47 +47 -05 +10 +13
EU28 288 +101 -07 +18 +50 +52 -03 +03 +17
North 343 +40 +32 +40 +49 +47 +04 -06 +26
South 276 +45 +53 +43 +43 +51 -03 +02 +19
East 191 +57 +29 +15 +21 +33 -08 +20 +02
West 322 +144 -46 +11 +65 +49 -06 +10 +18
BE 481 +37 +118 +23 +115 +79 -12 -04 +06
BG 195 +10 +29 +04 +58 +53 +05 +15 -
CZ 222 +68 +33 +39 +09 +33 -01 +13 +04
DK 365 +09 +26 -10 +75 +41 -28 +41 +42
DE 287 +143 -54 +37 +33 +57 -15 +16 +19
EE 331 +33 +31 +57 +80 +43 +24 -10 +27
IE 598 +357 -250 -25 +111 +62 +45 +139 +35
EL 213 +43 +13 -50 +97 +22 -12 +39 +38
ES 285 +69 +66 +06 +43 +44 -15 -07 +41
FR 302 +152 -44 -26 +112 +16 -06 +05 +20
HR 305 +36 +129 +73 - - - - -
IT 285 +27 +59 +87 +40 +56 +05 -03 -01
CY 332 -15 -95 +87 +53 +94 +07 +81 +91
LV 306 +53 +29 +65 +49 +58 -09 +27 +25
LT 277 +60 +60 +21 +54 +14 +20 +23 +17
LU 629 +278 -209 +111 -57 +139 -42 +41 +98
HU 231 +104 +25 +15 +51 +05 +03 +25 -04
MT 574 +67 -82 +48 +69 +44 +78 +90 +114
NL 240 +05 +61 -27 +29 +55 +44 -81 +11
AT 608 +369 -289 +104 +22 +99 -26 +139 +09
PL 173 +53 +10 +38 -03 +38 -16 +17 +09
PT 211 +58 +00 +33 +05 +73 +01 +27 +04
RO 100 +46 +13 -22 +29 +24 -06 +14 -
SI 309 +32 +98 +16 +57 +29 -11 +32 +17
SK 348 +105 +110 -85 +85 +43 -17 +77 +13
FI 382 +44 +39 -01 +48 +69 +11 +24 +14
SE 337 +50 +27 +94 +27 +32 +13 -59 +27
IS 541 +223 +35 +59 +54 - - - -
NO 402 +15 +26 +98 -11 - - - -
UK 321 +162 -73 -13 +78 +82 +09 -44 +50
In the past 12 months have you purchased any goods or services via the Internet
Region
Country
Yes from a retailer or service provider located in another EU country
Consumer Survey 2018
31
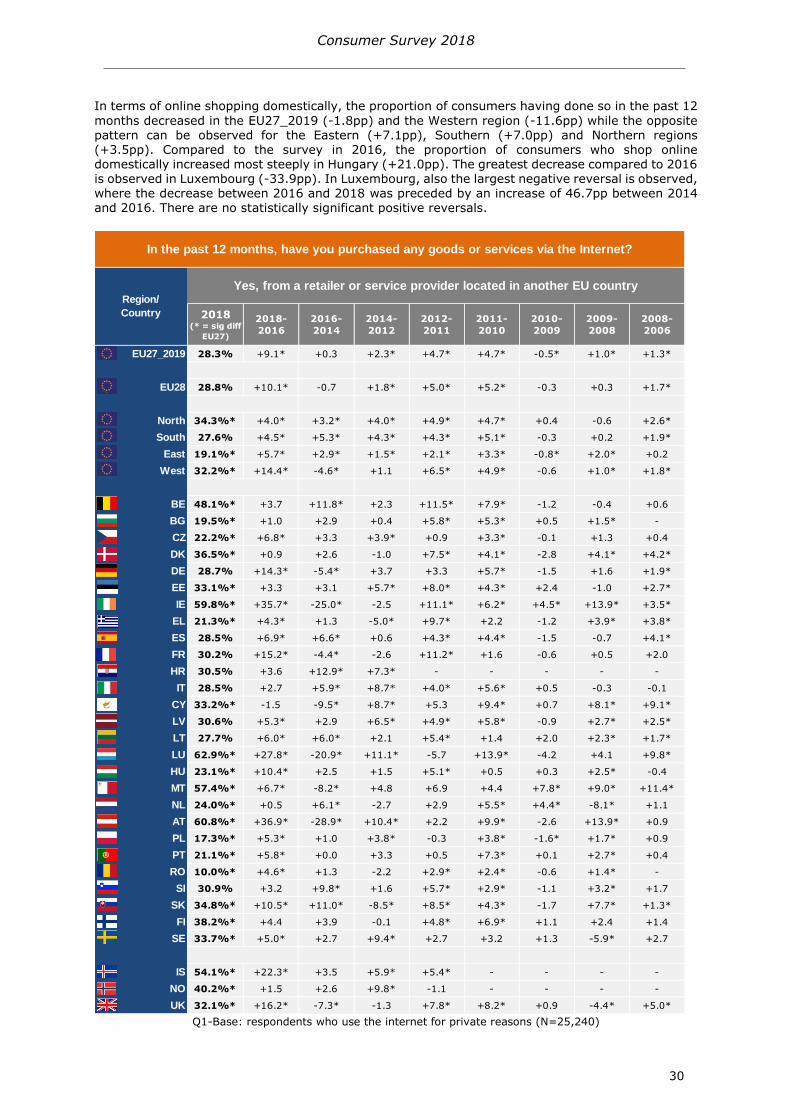
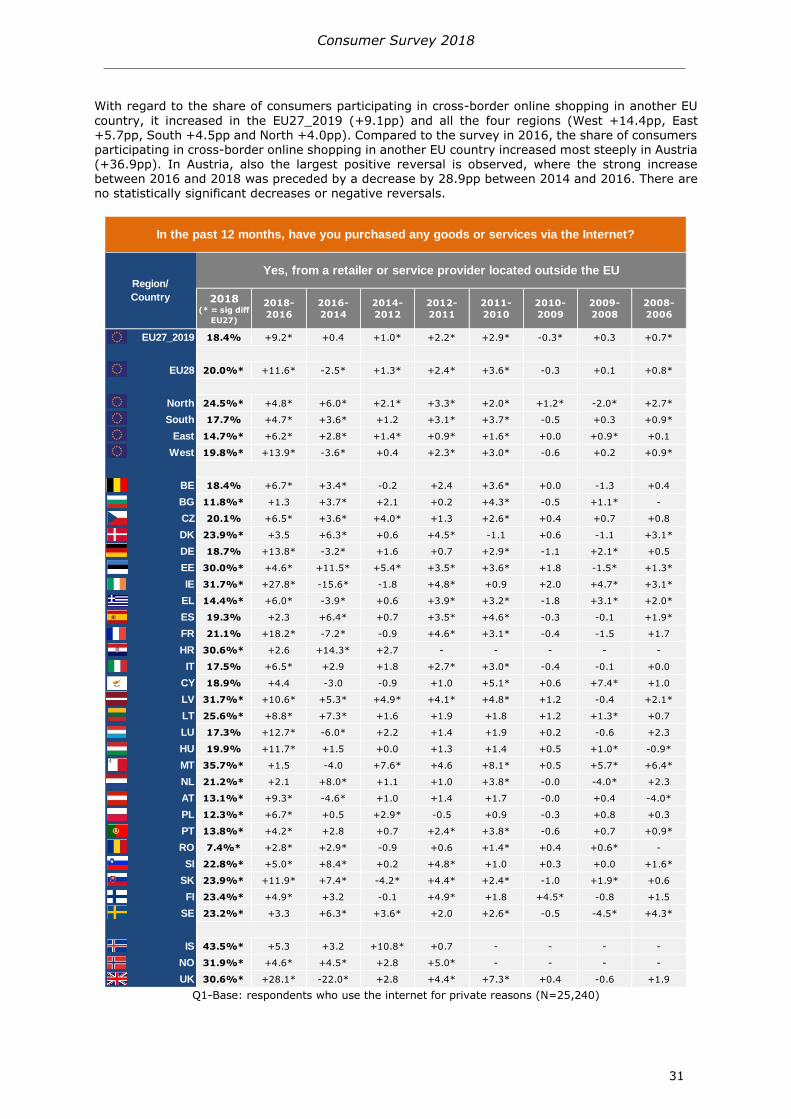
With regard to the share of consumers participating in cross-border online shopping in another EU
country it increased in the EU27_2019 (+91pp) and all the four regions (West +144pp East +57pp South +45pp and North +40pp) Compared to the survey in 2016 the share of consumers participating in cross-border online shopping in another EU country increased most steeply in Austria (+369pp) In Austria also the largest positive reversal is observed where the strong increase between 2016 and 2018 was preceded by a decrease by 289pp between 2014 and 2016 There are no statistically significant decreases or negative reversals
Q1-Base respondents who use the internet for private reasons (N=25240)
2018 ( = sig diff
EU27)
2018-
2016
2016-
2014
2014-
2012
2012-
2011
2011-
2010
2010-
2009
2009-
2008
2008-
2006
EU27_2019 184 +92 +04 +10 +22 +29 -03 +03 +07
EU28 200 +116 -25 +13 +24 +36 -03 +01 +08
North 245 +48 +60 +21 +33 +20 +12 -20 +27
South 177 +47 +36 +12 +31 +37 -05 +03 +09
East 147 +62 +28 +14 +09 +16 +00 +09 +01
West 198 +139 -36 +04 +23 +30 -06 +02 +09
BE 184 +67 +34 -02 +24 +36 +00 -13 +04
BG 118 +13 +37 +21 +02 +43 -05 +11 -
CZ 201 +65 +36 +40 +13 +26 +04 +07 +08
DK 239 +35 +63 +06 +45 -11 +06 -11 +31
DE 187 +138 -32 +16 +07 +29 -11 +21 +05
EE 300 +46 +115 +54 +35 +36 +18 -15 +13
IE 317 +278 -156 -18 +48 +09 +20 +47 +31
EL 144 +60 -39 +06 +39 +32 -18 +31 +20
ES 193 +23 +64 +07 +35 +46 -03 -01 +19
FR 211 +182 -72 -09 +46 +31 -04 -15 +17
HR 306 +26 +143 +27 - - - - -
IT 175 +65 +29 +18 +27 +30 -04 -01 +00
CY 189 +44 -30 -09 +10 +51 +06 +74 +10
LV 317 +106 +53 +49 +41 +48 +12 -04 +21
LT 256 +88 +73 +16 +19 +18 +12 +13 +07
LU 173 +127 -60 +22 +14 +19 +02 -06 +23
HU 199 +117 +15 +00 +13 +14 +05 +10 -09
MT 357 +15 -40 +76 +46 +81 +05 +57 +64
NL 212 +21 +80 +11 +10 +38 -00 -40 +23
AT 131 +93 -46 +10 +14 +17 -00 +04 -40
PL 123 +67 +05 +29 -05 +09 -03 +08 +03
PT 138 +42 +28 +07 +24 +38 -06 +07 +09
RO 74 +28 +29 -09 +06 +14 +04 +06 -
SI 228 +50 +84 +02 +48 +10 +03 +00 +16
SK 239 +119 +74 -42 +44 +24 -10 +19 +06
FI 234 +49 +32 -01 +49 +18 +45 -08 +15
SE 232 +33 +63 +36 +20 +26 -05 -45 +43
IS 435 +53 +32 +108 +07 - - - -
NO 319 +46 +45 +28 +50 - - - -
UK 306 +281 -220 +28 +44 +73 +04 -06 +19
In the past 12 months have you purchased any goods or services via the Internet
Region
Country
Yes from a retailer or service provider located outside the EU
Consumer Survey 2018
32
When considering cross-border online shopping in a country outside the EU the extent of this
behaviour increased in the EU27_2019 (+92pp) and all the four regions in the West (+139pp) East (+62pp) North (+48pp) and South (+47pp) Compared to the survey in 2016 the proportion of consumers who shop cross-border online in a country outside the EU increased most steeply in Ireland (+278pp) This increase between 2016 and 2018 follows a strong decrease of 156pp between 2014 and 2016 (ie positive reversal) There are no statistically significant decreases compared to 2016 and no statistically significant negative reversals
Q1-Base respondents who use the internet for private reasons (N=25240)
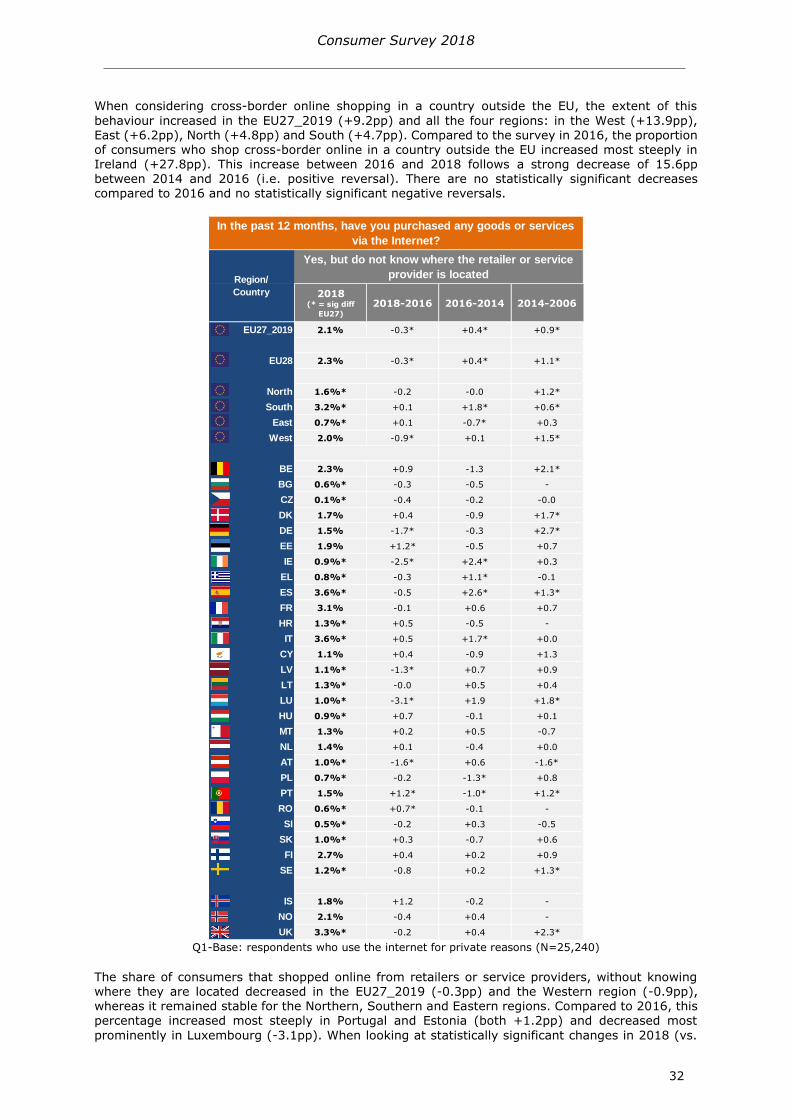
The share of consumers that shopped online from retailers or service providers without knowing where they are located decreased in the EU27_2019 (-03pp) and the Western region (-09pp) whereas it remained stable for the Northern Southern and Eastern regions Compared to 2016 this percentage increased most steeply in Portugal and Estonia (both +12pp) and decreased most
prominently in Luxembourg (-31pp) When looking at statistically significant changes in 2018 (vs
2018( = sig diff
EU27)
2018-2016 2016-2014 2014-2006
EU27_2019 21 -03 +04 +09
EU28 23 -03 +04 +11
North 16 -02 -00 +12
South 32 +01 +18 +06
East 07 +01 -07 +03
West 20 -09 +01 +15
BE 23 +09 -13 +21
BG 06 -03 -05 -
CZ 01 -04 -02 -00
DK 17 +04 -09 +17
DE 15 -17 -03 +27
EE 19 +12 -05 +07
IE 09 -25 +24 +03
EL 08 -03 +11 -01
ES 36 -05 +26 +13
FR 31 -01 +06 +07
HR 13 +05 -05 -
IT 36 +05 +17 +00
CY 11 +04 -09 +13
LV 11 -13 +07 +09
LT 13 -00 +05 +04
LU 10 -31 +19 +18
HU 09 +07 -01 +01
MT 13 +02 +05 -07
NL 14 +01 -04 +00
AT 10 -16 +06 -16
PL 07 -02 -13 +08
PT 15 +12 -10 +12
RO 06 +07 -01 -
SI 05 -02 +03 -05
SK 10 +03 -07 +06
FI 27 +04 +02 +09
SE 12 -08 +02 +13
IS 18 +12 -02 -
NO 21 -04 +04 -
UK 33 -02 +04 +23
In the past 12 months have you purchased any goods or services
via the Internet
Region
Country
Yes but do not know where the retailer or service
provider is located
Consumer Survey 2018
33
2016) and in 2016 (vs 2014) the largest positive reversal is found in Portugal where between 2016
and 2018 this indicator increased by 12pp whereas between 2014 and 2016 it decreased by 10pp The largest negative reversal is found in Ireland where between 2016 and 2018 this indicator decreased by 25pp whereas between 2014 and 2016 it increased by 24pp
Q2 ndash Base all respondents (N=28037)
2018
( = sig
diff EU27)
2018-
2016
2016-
2014
2018
( = sig
diff EU27)
2018-
2016
2016-
2014
2018
( = sig
diff EU27)
2018-
2016
2016-
2014
EU27_2019 145 -02 +34 852 +03 -34 03 -01 -00
EU28 147 -10 +45 849 +10 -45 04 +00 -00
North 178 +23 +21 818 -23 -20 04 -00 -01
South 88 +11 -11 910 -11 +11 02 -01 -01
East 147 +35 -01 850 -34 +04 03 -01 -03
West 180 -35 +87 816 +36 -88 04 -01 +01
BE 260 -03 +104 736 +04 -107 04 -01 +03
BG 137 -06 +36 859 +04 -35 04 +02 -00
CZ 160 +06 +02 835 -09 +01 05 +03 -03
DK 218 +43 +35 780 -42 -28 03 -01 -07
DE 176 -32 +104 822 +35 -104 03 -03 -00
EE 274 -44 +119 722 +41 -116 04 +03 -03
IE 229 -20 +76 762 +18 -78 09 +01 +03
EL 57 -29 +36 941 +32 -40 01 -03 +04
ES 32 +10 -20 966 -07 +16 01 -03 +04
FR 160 -54 +94 834 +52 -97 06 +02 +03
HR 214 +06 +69 784 -04 -70 02 -02 +02
IT 137 +21 -14 860 -22 +18 03 +01 -04
CY 77 -13 -78 918 +11 +93 05 +02 -15
LV 136 +00 +30 862 +01 -32 01 -01 +01
LT 230 +62 +23 764 -69 -19 06 +07 -04
LU 321 +11 -67 676 -09 +64 04 -02 +02
HU 166 +94 +14 834 -91 -14 00 -03 +00
MT 220 +03 +79 777 +00 -86 04 -03 +07
NL 169 -29 -49 829 +29 +47 02 -00 +01
AT 245 +11 +115 751 -06 -119 03 -05 +04
PL 131 +25 -10 863 -24 +16 05 -01 -07
PT 74 +07 +05 926 -06 -00 00 -01 -05
RO 105 +50 -23 895 -49 +23 00 -01 -00
SI 196 +03 +57 801 -05 -57 03 +03 00
SK 285 +91 -22 713 -86 +23 02 -05 -00
FI 114 +09 -37 886 -08 +39 01 -01 -02
SE 171 +21 +30 823 -19 -33 06 -02 +04
IS 399 +64 +97 596 -67 -101 05 +03 +03
NO 280 +02 +26 713 +09 -36 08 -11 +10
UK 158 -64 +118 830 +58 -117 12 +06 -01
In the past 12 months have you purchased any goods or services through channels other than the
Internet from a retailer or service provider located in another EU country
Region
Country
Yes No Dont know
Consumer Survey 2018
34
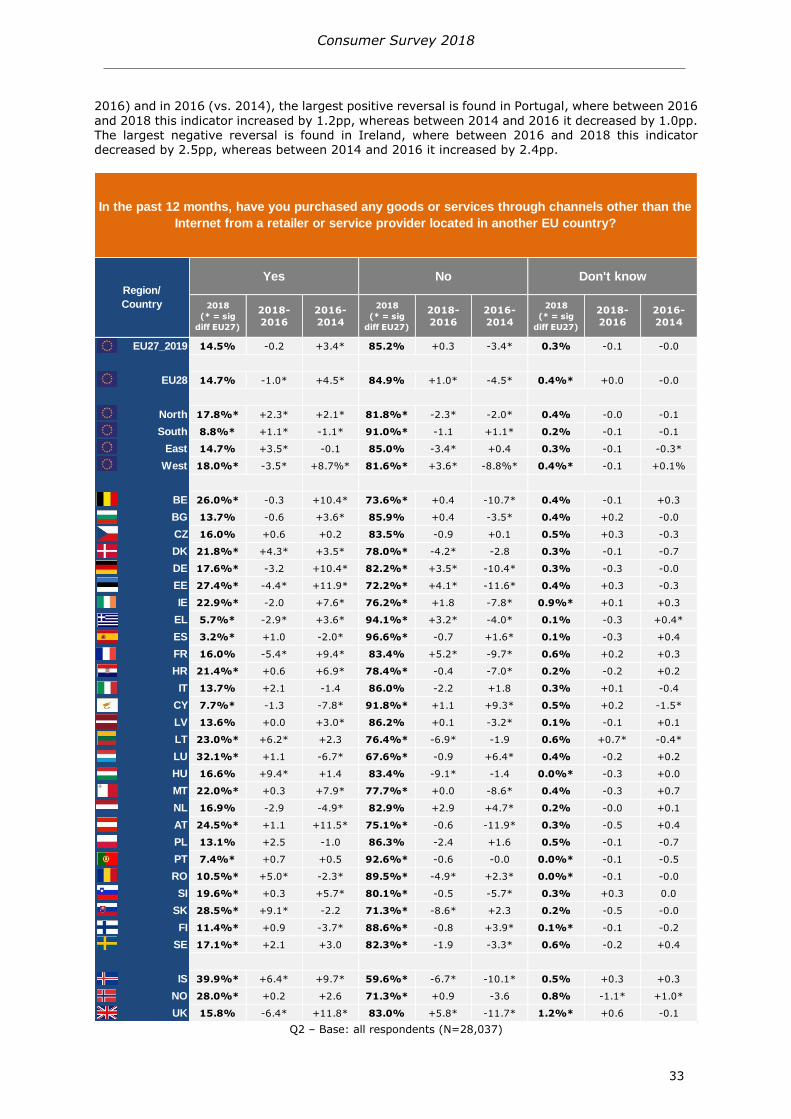
The incidence of consumers shopping cross-border online in another EU country through channels
other than the internet is 145 in the EU27_2019 In the East this indicator is in line with the EU27_2019 average while it is higher in the West (180) and North (178) and lower in the South (88) Among the EU countries the highest levels of this indicator are found in Luxembourg (321) Slovakia (285) and Estonia (274) In addition high levels are also recorded for Norway (280) and Iceland (399) The lowest levels are found in Spain (32) Greece (57) and Portugal (74)
The share of consumers engaging in cross-border shopping in another EU country through channels
other than the internet remained stable in the EU27_2019 while it decreased in the Western region (-35pp) and increased in the other regions (South +11pp North +23pp and East +35pp) compared to 2016 This percentage increased most steeply in Hungary (+94pp) and decreased most prominently in France (-54pp) The strongest positive reversal is found in Romania where between 2016 and 2018 this indicator increased by 50pp whereas between 2014 and 2016 it decreased by 23pp In contrast the highest negative reversal in the EU is found in Estonia where between 2016
and 2018 this proportion of consumers decreased by 44pp whereas between 2014 and 2016 it increased by 119pp Considering all countries of the survey an even stronger negative reversal is observed in the UK (-64pp between 2016 and 2018 +118pp between 2014 and 2016)
Consumer Survey 2018
35
5 KNOWLEDGE OF CONSUMER RIGHTS
This chapter focuses on a consumersrsquo level of knowledge of their rights and specific legislation that pertains to both offline and online purchase contexts Consumersrsquo awareness of their consumer rights is a prerequisite to the effectiveness of existing consumer protection mechanisms
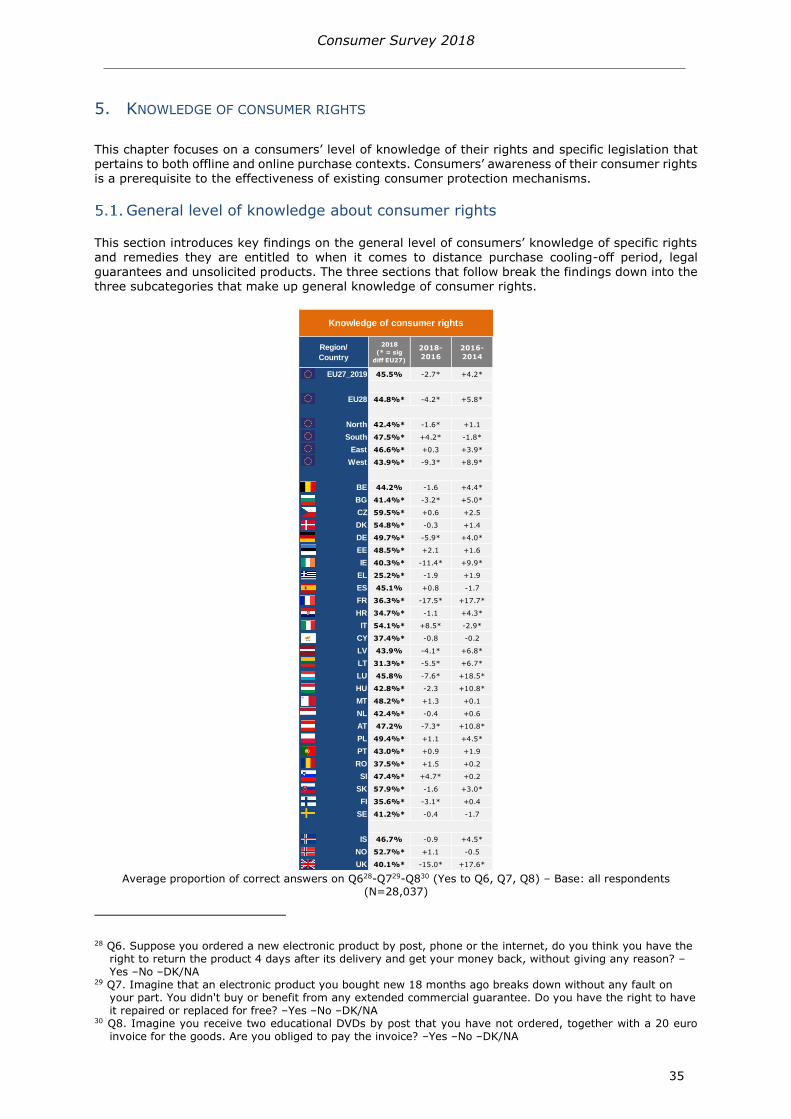
General level of knowledge about consumer rights
This section introduces key findings on the general level of consumersrsquo knowledge of specific rights and remedies they are entitled to when it comes to distance purchase cooling-off period legal guarantees and unsolicited products The three sections that follow break the findings down into the three subcategories that make up general knowledge of consumer rights
Average proportion of correct answers on Q628-Q729-Q830 (Yes to Q6 Q7 Q8) ndash Base all respondents
(N=28037)
28 Q6 Suppose you ordered a new electronic product by post phone or the internet do you think you have the right to return the product 4 days after its delivery and get your money back without giving any reason ndashYes ndashNo ndashDKNA
29 Q7 Imagine that an electronic product you bought new 18 months ago breaks down without any fault on your part You didnt buy or benefit from any extended commercial guarantee Do you have the right to have it repaired or replaced for free ndashYes ndashNo ndashDKNA
30 Q8 Imagine you receive two educational DVDs by post that you have not ordered together with a 20 euro invoice for the goods Are you obliged to pay the invoice ndashYes ndashNo ndashDKNA
Region
Country
2018
( = sig
diff EU27)
2018-
2016
2016-
2014
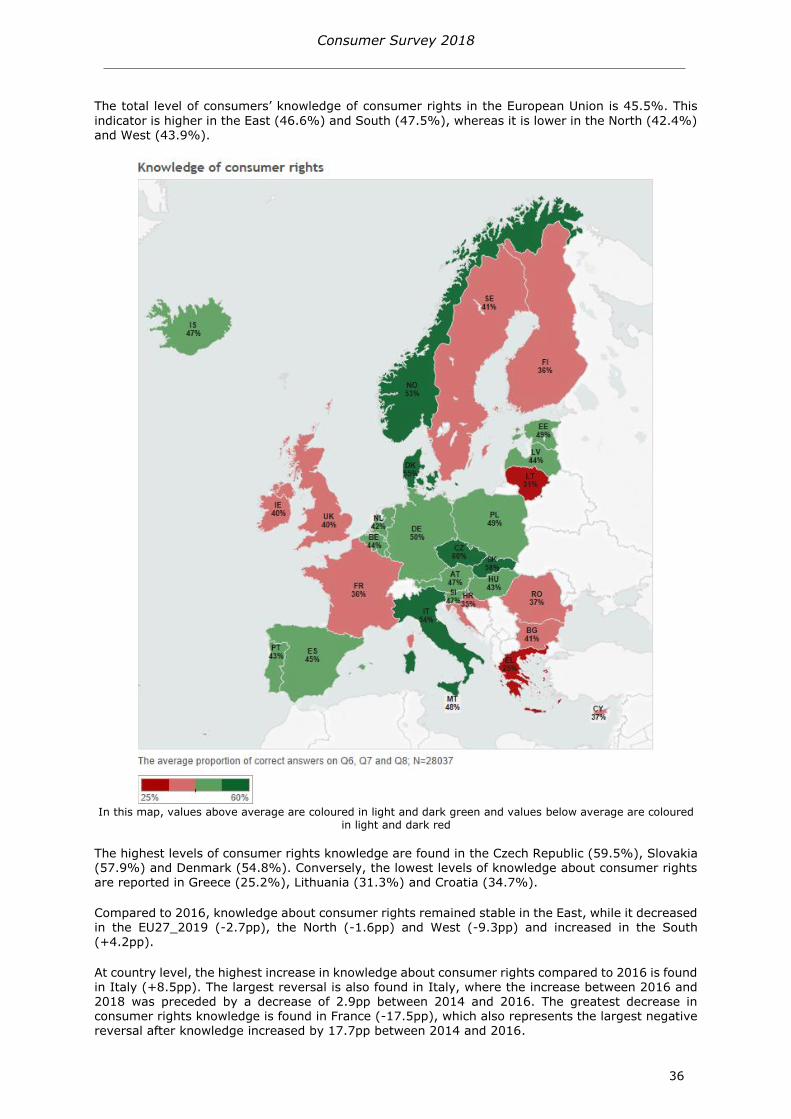
EU27_2019 455 -27 +42
EU28 448 -42 +58
North 424 -16 +11
South 475 +42 -18
East 466 +03 +39
West 439 -93 +89
BE 442 -16 +44
BG 414 -32 +50
CZ 595 +06 +25
DK 548 -03 +14
DE 497 -59 +40
EE 485 +21 +16
IE 403 -114 +99
EL 252 -19 +19
ES 451 +08 -17
FR 363 -175 +177
HR 347 -11 +43
IT 541 +85 -29
CY 374 -08 -02
LV 439 -41 +68
LT 313 -55 +67
LU 458 -76 +185
HU 428 -23 +108
MT 482 +13 +01
NL 424 -04 +06
AT 472 -73 +108
PL 494 +11 +45
PT 430 +09 +19
RO 375 +15 +02
SI 474 +47 +02
SK 579 -16 +30
FI 356 -31 +04
SE 412 -04 -17
IS 467 -09 +45
NO 527 +11 -05
UK 401 -150 +176
Knowledge of consumer rights
Consumer Survey 2018
36
The total level of consumersrsquo knowledge of consumer rights in the European Union is 455 This
indicator is higher in the East (466) and South (475) whereas it is lower in the North (424) and West (439)
In this map values above average are coloured in light and dark green and values below average are coloured
in light and dark red
The highest levels of consumer rights knowledge are found in the Czech Republic (595) Slovakia (579) and Denmark (548) Conversely the lowest levels of knowledge about consumer rights
are reported in Greece (252) Lithuania (313) and Croatia (347)
Compared to 2016 knowledge about consumer rights remained stable in the East while it decreased in the EU27_2019 (-27pp) the North (-16pp) and West (-93pp) and increased in the South (+42pp)
At country level the highest increase in knowledge about consumer rights compared to 2016 is found in Italy (+85pp) The largest reversal is also found in Italy where the increase between 2016 and 2018 was preceded by a decrease of 29pp between 2014 and 2016 The greatest decrease in consumer rights knowledge is found in France (-175pp) which also represents the largest negative reversal after knowledge increased by 177pp between 2014 and 2016
Consumer Survey 2018
37
Average proportion of correct answers on Q6-Q7-Q8 (Yes to Q6 Q7 Q8) ndash Base all EU27_2019 respondents
(N=24928)
Average proportion of correct answers on Q6-Q7-Q8 (Yes to Q6 Q7 Q8) ndash Base all EU27_2019 respondents
(N=24928)
Regarding sociodemographic variables and other consumer characteristics whether a consumerrsquos mother tongue is the official language in their country of residence or not is associated most closely with the knowledge of consumer rights The variables showing the next closest link are age gender employment status and the degree of urbanisation
Those whose mother tongue corresponds with one of the official languages of the country or region
they live in are more likely to know their consumer rights than those whose mother tongue is not an official language
Age is also linked to knowledge of consumer rights Those aged 55-64 years have more knowledge than those aged 35-54 years who in turn have more knowledge than those aged 18-34 years
Gender is also associated with consumersrsquo knowledge of relevant legislation Males show higher levels
of knowledge more often than females
Regarding consumersrsquo employment status other white-collar workers are most likely to be knowledgeable about consumer rights more so than the self-employed managers blue collar workers students unemployed jobseekers and the retired
Finally the degree to which a consumers living area is urbanised also has a link with consumersrsquo knowledge of consumer rights Those who live in a small town are more knowledgeable about their consumer rights than those living in a rural area
471 442
407 464 A 488 B 477 AB
441 A 462 A 455 A
463 AB 447 A 454 A 482 B
445 A 465 B 457 AB
446 A 451 A 488 432 A
433 A 430 A 446 A 451 A
GenderMale Female
Knowledge of consumer rights
Blue collar
Student
65+
Education levelLow Medium High
Age18-34 35-54 55-64
Very easy
UrbanisationRural area Small town Large town
Financial situationVery difficult Fairly difficult Fairly easy
Unemployed Seeking a job RetiredEmployment status
Self-employed Manager Other white collar
446 A 459 AB 462 AB 485 B
418 458
453 AB 446 A 463 B
465 B 433 A 410 A 466 AB 418 A
443 A 450 A 463 A
460 A 458 A 457 A
Four or more
Knowledge of consumer rights
LanguagesOnly native Two
High
Mother tongue
Not official language
in home country
Official language in
home country
Numerical skillsLow Medium
Three
Consumer
vulnerability
(complexity)
Very vulnerableSomewhat
vulnerableNot vulnerable
Hardly ever Never
Consumer
vulnerability
(socio-demographic
factors)
Very vulnerableSomewhat
vulnerableNot vulnerable
Internet useDaily Weekly Monthly
Consumer Survey 2018
38
Knowledge of the cooling-off period
Correct answer on Q6 (yes) ndash Base all respondents (N=28037)
With regard to consumersrsquo knowledge of the cooling-off period the overall share of consumers being
aware of their rights in the EU27_2019 is 610 This indicator is lower in the South (580) and North (518) whereas it is higher in the West (627) and East (643)
Knowledge of the cooling-off period is highest in the Czech Republic (759) Hungary (739) and Germany (738) Among the EU countries it is the lowest in Greece (222) Cyprus (361) and Portugal (378) Among all the countries studied it is low as well in Iceland (356)
Compared to 2016 knowledge of the cooling-off period decreased in the EU27_2019 (-45pp) North (-26pp) and West (-123pp) increased for the Southern region (+24pp) and remained stable in the East For this type of knowledge the largest increase can be observed in Slovenia (+91pp) and the largest decrease can be found in Ireland (-301pp) While no positive reversal is found there are
Region
Country
2018
( = sig
diff EU27)
2018-
2016
2016-
2014
EU27_2019 610 -45 +86
EU28 601 -70 +110
North 518 -26 +30
South 580 +24 +21
East 643 +05 +73
West 627 -123 +145
BE 472 -87 +110
BG 478 -34 +100
CZ 759 +33 +10
DK 585 -22 +65
DE 738 -27 +75
EE 501 -04 +11
IE 437 -301 +246
EL 222 -137 +115
ES 605 -02 +00
FR 495 -281 +258
HR 548 -23 +112
IT 663 +73 +29
CY 361 -58 +64
LV 459 -52 +105
LT 446 -110 +67
LU 698 -45 +336
HU 739 +33 +135
MT 486 +25 -14
NL 679 +04 +21
AT 693 -104 +210
PL 700 -03 +82
PT 378 +26 -19
RO 496 +22 +30
SI 623 +91 +93
SK 678 -77 +94
FI 384 -18 -23
SE 588 -08 +14
IS 356 -03 +47
NO 608 +14 -12
UK 535 -247 +282
Knowledge of the cooling-off period
Consumer Survey 2018
39
multiple strong negative reversals The highest negative reversal in the EU is observed for Ireland
where between 2016 and 2018 knowledge of the cooling-off period decreased by 301pp whereas between 2014 and 2016 it increased by 246pp
Correct answer on Q6 (yes) ndash Base all EU27_2019 respondents (N=24928)
Correct answer on Q6 (yes) ndash Base all EU27_2019 respondents (N=24928)
Regarding socio-demographic variables and other characteristics the age of consumers is most closely linked to their knowledge of the cooling-off period The factor showing the next closest link is vulnerability due to socio-demographic factors followed by gender numerical skills and employment status
Consumers aged 18-34 years are less likely to be knowledgeable about their rights regarding the cooling-off period compared to those who are aged 35-54 years 55-64 years or 65+ years
Consumer vulnerability due to socio-demographic factors31 is also associated with knowledge of the cooling-off period Those who are not vulnerable are more likely to know about the cooling-off period
than those who are very vulnerable or somewhat vulnerable
31 Consumersrsquo self-reported vulnerability is measured by asking them how vulnerable or disadvantaged they feel when choosing and buying goods or services along several dimensions (Q21) These dimensions are further grouped into vulnerability due to sociodemographic factors (based on self-reported vulnerability because of health problems poor financial circumstances current employment situation age belonging to a minority group personal issues or other) and vulnerability due to the complexity of offers or terms and conditions Consumer vulnerability is discussed in more detail in chapter 13
627 603
543 633 A 651 A 634 A
576 A 622 B 616 AB
616 AB 599 A 612 A 662 B
606 A 620 A 615 A
446 A 451 A 488 432 A
630 BC 621 ABC 570 AB 602 AB
GenderMale Female
Knowledge of the cooling-off period
Blue collar
Student
65+
Education levelLow Medium High
Age18-34 35-54 55-64
Very easy
UrbanisationRural area Small town Large town
Financial situationVery difficult Fairly difficult Fairly easy
Unemployed Seeking a job RetiredEmployment status
Self-employed Manager Other white collar
599 A 623 A 626 A 624 A
571 A 617 A
586 A 597 A 630
633 B 561 A 523 A 586 AB 552 A
574 A 603 A 632
617 A 607 A 619 A
Four or more
Knowledge of the cooling-off period
LanguagesOnly native Two
High
Mother tongue
Not official language
in home country
Official language in
home country
Numerical skillsLow Medium
Three
Consumer
vulnerability
(complexity)
Very vulnerableSomewhat
vulnerableNot vulnerable
Hardly ever Never
Consumer
vulnerability
(socio-demographic
factors)
Very vulnerableSomewhat
vulnerableNot vulnerable
Internet useDaily Weekly Monthly
Consumer Survey 2018
40
Gender is another factor that is related to knowledge of the cooling-off period with males tending to
be more likely to know their rights than females
Consumersrsquo numerical skills are also associated with being knowledgeable of the cooling-off period Those with a higher numerical skill level are more likely to be knowledgeable of this consumer right than those with a medium or low level of numerical skills
Finally employment status is also related to knowledge of the cooling-off period Students and other white-collar workers are more likely to know about this aspect than people who are self-employed White collar workers are also more likely to know about this aspect than the retired blue collar
workers and jobseekers
Consumer Survey 2018
41
Knowledge of faulty product guarantees
In the European Union the general level of knowledge of faulty product guarantees is 409 In the East this level of knowledge is in line with the EU27_2019 average while it is higher in the South (572) and lower in the North (369) and West (302)
Correct answer on Q7 (yes) ndash Base all respondents (N=28037)
The highest levels of knowledge of faulty product guarantees are found in the Czech Republic (720) Portugal (661) and Slovakia (646) In contrast the lowest levels of this type of knowledge are observed in Finland (178) Hungary (196) and France (220)
Compared to 2016 the level of knowledge of faulty product guarantees remained stable in the North and East while it decreased in the EU27_2019 (-46pp) and the West (-118pp) and increased in the
South (+24pp) The highest increase at country level is recorded for Cyprus (+64pp) and the most prominent decrease is noted for France (-197pp) In France also the highest reversal is found
Region
Country
2018
( = sig
diff EU27)
2018-
2016
2016-
2014
EU27_2019 409 -46 +41
EU28 388 -67 +55
North 369 -12 -13
South 572 +24 -20
East 409 -08 +13
West 302 -118 +106
BE 444 +49 +28
BG 394 -108 +81
CZ 720 +17 +14
DK 587 -25 -26
DE 346 -103 +41
EE 457 +25 -27
IE 308 -102 +54
EL 359 +43 -15
ES 568 +10 -49
FR 220 -197 +228
HR 269 -41 +56
IT 598 +33 -04
CY 498 +64 +66
LV 407 -108 +92
LT 233 -69 +35
LU 260 -169 +48
HU 196 -101 +58
MT 547 +34 -87
NL 289 -23 +24
AT 316 -91 +117
PL 329 +23 -00
PT 661 +09 +13
RO 481 +12 -17
SI 326 +17 -16
SK 646 -23 +24
FI 178 -35 -37
SE 371 +39 -25
IS 447 -90 +42
NO 512 +25 -47
UK 245 -209 +157
Knowledge of faulty product guarantees
Consumer Survey 2018
42
where the decrease between 2016 and 2018 follows a strong increase of 2289pp between 2014 and
2016 No positive reversals are observed
Correct answer on Q7 (yes) ndash Base all EU27_2019 respondents (N=24928)
Correct answer on Q7 (yes) ndash Base all EU27_2019 respondents (N=24928)
In terms of socio-demographic variables and other characteristics education shows the closest link with knowledge of faulty product guarantees This is followed by gender language age and employment status
Regarding the association between an education level and knowledge of faulty product guarantees consumers with a low and medium education level are more likely to know about faulty product
guarantees than those with a high level of education
Gender is another factor that is related to knowledge of faulty product guarantees with males tending to be more likely to know about this than females
The number of languages a consumer knows is also associated with their knowledge about faulty product guarantees Those who know at least four languages are more likely to know about this subject than those who know only two languages or less (ie only their native language)
Consumers aged 35-64 are also more likely to be more knowledgeable about this issue compared
to consumers aged 18-34
Finally other white-collar workers are more likely to be knowledgeable regarding this issue compared to people who are self-employed managers blue collar workers students the unemployed jobseekers and consumers who are retired
425 396
377 A 423 B 432 B 407 AB
455 A 421 A 385
411 A 402 A 411 A 419 A
397 A 423 B 407 AB
446 A 451 A 488 432 A
368 A 379 A 429 AB 417 AB
GenderMale Female
Knowledge of faulty product guarantees
Blue collar
Student
65+
Education levelLow Medium High
Age18-34 35-54 55-64
Very easy
UrbanisationRural area Small town Large town
Financial situationVery difficult Fairly difficult Fairly easy
Unemployed Seeking a job RetiredEmployment status
Self-employed Manager Other white collar
397 A 410 A 422 AB 461 B
441 A 409 A
421 A 404 A 412 A
411 A 411 A 396 A 435 A 398 A
417 A 412 A 407 A
410 A 414 A 409 A
Four or more
Knowledge of faulty product guarantees
LanguagesOnly native Two
High
Mother tongue
Not official language
in home country
Official language in
home country
Numerical skillsLow Medium
Three
Consumer
vulnerability
(complexity)
Very vulnerableSomewhat
vulnerableNot vulnerable
Hardly ever Never
Consumer
vulnerability
(socio-demographic
factors)
Very vulnerableSomewhat
vulnerableNot vulnerable
Internet useDaily Weekly Monthly
Consumer Survey 2018
43
Knowledge of rights regarding unsolicited products
The overall level of knowledge of consumer rights regarding unsolicited products in the European Union is 345 In the East the level is in line with the EU27_2019 average while knowledge is higher in the North (385) and West (388) and lower in the South (274)
Correct answer on Q8 (yes) ndash Base all respondents (N=28037)
Among the EU countries high levels of knowledge of rights regarding unsolicited products are found in Finland (506) Estonia (498) and Slovenia (475) Additionally among all surveyed
countries the level is highest in Iceland (597) The lowest levels of knowledge are reported in Romania (148) Greece (176) and Spain (182)
Between 2016 and 2018 knowledge of rights regarding unsolicited products remained stable for the Northern and Eastern regions while it increased in the EU27_2019 (+11pp) and the South (+79pp)
Region
Country
2018
( = sig
diff EU27)
2018-
2016
2016-
2014
2014-
2012
2012-
2011
EU27_2019 345 +11 -02 +23 -45
EU28 355 +10 +09 +21 -46
North 385 -09 +15 -17 -70
South 274 +79 -54 +70 -63
East 347 +13 +32 -04 -44
West 388 -36 +14 +08 -29
BE 409 -09 -07 -08 -13
BG 371 +46 -31 +66 -64
CZ 306 -31 +49 -55 +29
DK 472 +38 +02 -51 -25
DE 407 -47 +04 +24 -33
EE 498 +43 +63 +19 -38
IE 463 +61 -02 -06 -35
EL 176 +37 -43 +20 -72
ES 182 +16 -02 +08 -40
FR 372 -47 +43 -03 -46
HR 222 +31 -41 -18 -
IT 364 +150 -113 +137 -85
CY 263 -28 -137 +66 -34
LV 450 +36 +07 +70 -15
LT 260 +15 +98 -20 -131
LU 417 -15 +172 -06 +01
HU 349 +00 +130 -03 -106
MT 414 -19 +104 +40 -34
NL 304 +07 -27 -09 +16
AT 407 -25 -02 +04 +17
PL 452 +13 +54 -19 -10
PT 251 -08 +62 -04 -19
RO 148 +12 -06 -00 -110
SI 475 +34 -71 +126 -102
SK 412 +51 -26 +51 +35
FI 506 -38 +71 -09 -86
SE 276 -43 -39 -23 -79
IS 597 +65 +45 -36 +03
NO 461 -05 +42 -35 -23
UK 424 +06 +88 +13 -54
Knowledge of unsolicited products
Consumer Survey 2018
44
and decreased in the West (-36pp) The highest increase is found in Italy (+150pp) which is also
related to the strongest positive reversal after a decrease by 113pp between 2014 and 2016 The greatest decrease is recorded for France and Germany (both -47pp) France also shows the highest negative reversal where the decrease between 2016 and 2018 follows an increase of 43pp between 2014 and 2016
Correct answer on Q8 (yes) ndash Base all EU27_2019 respondents (N=24928)
Correct answer on Q8 (yes) ndash Base all EU27_2019 respondents (N=24928)
With regard to socio-demographic variables and other characteristics whether someonersquos mother tongue is the same as one of the official languages of the country or region they live in has the
closest link with consumersrsquo knowledge of their rights regarding unsolicited products followed by age education gender and employment status
Consumers whose mother tongue corresponds with one of the official languages of the country or region they live in are more likely to know about their rights regarding unsolicited products than those whose mother tongue is different
Regarding the association between age and knowledge of consumer rights regarding unsolicited products consumers aged 55 years or older appear to be more knowledgeable than consumers
younger than 55 years
Education is also an important factor related to consumersrsquo knowledge of their rights Those with a high or medium level of education are more likely to be knowledgeable of their rights regarding such products than consumers with a lower level of education
Regarding consumersrsquo gender the proportion of males that knows their rights regarding this issue is higher than the proportion of females
362 328
296 335 381 A 391 A
295 341 A 362 A
359 A 340 A 340 A 364 A
332 A 353 A 348 A
446 A 451 A 488 432 A
308 AB 287 A 340 ABC 333 ABC
GenderMale Female
Knowledge of unsolicited products
Blue collar
Student
65+
Education levelLow Medium High
Age18-34 35-54 55-64
Very easy
UrbanisationRural area Small town Large town
Financial situationVery difficult Fairly difficult Fairly easy
Unemployed Seeking a job RetiredEmployment status
Self-employed Manager Other white collar
344 A 344 A 337 A 373 A
253 350
352 A 337 A 348 A
352 B 327 AB 312 AB 376 AB 303 A
338 A 335 A 351 A
354 A 351 A 342 A
Four or more
Knowledge of unsolicited products
LanguagesOnly native Two
High
Mother tongue
Not official language
in home country
Official language in
home country
Numerical skillsLow Medium
Three
Consumer
vulnerability
(complexity)
Very vulnerableSomewhat
vulnerableNot vulnerable
Hardly ever Never
Consumer
vulnerability
(socio-demographic
factors)
Very vulnerableSomewhat
vulnerableNot vulnerable
Internet useDaily Weekly Monthly
Consumer Survey 2018
45
Those who are self-employed white collar workers are more likely to know their rights regarding
unsolicited products than those who are blue collar workers students job seekers and those who are unemployed In addition managers are also more likely to know their rights regarding unsolicited products than unemployed persons
Consumer Survey 2018
46
6 TRUST IN CONSUMER PROTECTION
This chapter discusses trust in consumer protection which refers to consumersrsquo confidence that their rights are respected and protected in the single market Trust in consumer protection is a key component in increasing consumersrsquo willingness to actively engage in the single market especially when it comes to distance purchases
Trust in organisations
The first section focuses on consumer confidence in organisations that are tasked with ensuring consumer rights are respected and protected when the need arises These organisations include public authorities non-governmental consumer organisations (NGOs) as well as retailers and service providers
Average proportion of agreement (ldquoStrongly agreerdquo and ldquoAgreerdquo) with Q332 options 1 2 and 3 - Base all
respondents (N=28037)
32 Q3 How strongly do you agree or disagree with each of the following statements In (our country) hellip -Strongly agree ndashAgree ndash Disagree ndashStrongly disagree ndash DKNA Q31 You trust public authorities to protect your rights as a consumer Q32 In general retailers and service providers respect your rights as a consumer Q33 You trust non-governmental consumer organisations to protect your rights as a consumer
Region
Country
2018
( = sig
diff EU27)
2018-
2016
2016-
2014
2014-
2012
2012-
2011
2011-
2010
2010-
2009
2009-
2008
2008-
2006
EU27_2019 646 -53 +80 +11 -30 +17 +62 -03 -25
EU28 655 -63 +82 +06 -26 +13 +63 -00 -27
North 702 +19 -07 +04 -08 +29 +50 -67 +18
South 625 +38 +30 +05 -10 -36 +85 +21 +11
East 646 +13 +52 +48 -20 +56 +51 +14 -21
West 652 -163 +142 -06 -52 +39 +53 -26 -38
BE 671 -68 -14 +62 -43 +81 +85 -149 -19
BG 514 +26 +48 -52 +45 +90 +55 +89 -
CZ 619 +59 +18 +61 -48 +40 +48 -57 -10
DK 773 +01 +24 +28 -63 +13 +84 -31 +15
DE 664 -163 +189 -08 -88 +26 +78 -54 -24
EE 708 +26 +09 +67 -10 +36 +27 -40 +55
IE 726 -108 +144 -69 +28 -73 +97 +122 -65
EL 507 +45 +09 +24 -33 -01 +26 -14 -73
ES 654 +47 +25 -03 -16 +18 +44 -76 +174
FR 587 -243 +165 -14 -40 +69 +07 +35 -63
HR 514 -03 +29 +09 - - - - -
IT 624 +34 +41 +16 -13 -98 +142 +84 -85
CY 515 +43 +39 -57 -08 -50 +88 -109 -25
LV 570 -06 -03 -53 -28 +66 +122 -88 +118
LT 628 +121 -34 +40 +11 +76 +66 -13 -10
LU 746 -100 +43 -17 +08 +15 +56 +62 -60
HU 838 +11 +65 +112 +15 -20 +85 -60 +37
MT 761 +111 +02 -03 +14 +31 +50 -59 -21
NL 759 +27 -39 +05 +40 +04 +54 -100 -36
AT 743 -88 +77 -09 -35 +18 +67 +40 -10
PL 679 +14 +57 +67 -48 +77 +85 -23 +51
PT 632 +14 +08 -40 +66 +36 -05 +161 -70
RO 591 -22 +73 +37 +04 +61 -09 +122
SI 591 +13 +89 +04 +07 -72 +01 +31 -01
SK 612 +42 +05 -02 +17 +65 +15 -09 +66
FI 798 +24 -30 +33 +01 +45 -25 -65 -03
SE 655 -03 -06 -38 +16 -05 +51 -99 +18
IS 603 +08 +07 +122 -57 - - - -
NO 716 -14 -39 +90 -50 - - - -
UK 718 -135 +92 -28 +06 -28 +76 +30 -34
Trust in organisations
Consumer Survey 2018
47
The overall level of trust in organisations for consumers of the European Union is 646 For the
East and West this level is in line with the EU27_2019 average while it is higher in the North (702) and lower in the South (625)
In this map values above average are coloured in light and dark green and values below average are coloured in light and
dark red
Trust in organisations is highest in Hungary (838) Finland (798) and Denmark (773) The lowest levels of trust in organisations are reported in Greece (507) Bulgaria (514) Croatia
(514) and Cyprus (515)
Between 2016 and 2018 the overall level of trust in organisations decreased in the EU27_2019 (-53pp) and Western Europe (-163pp) while it increased in the South (+38pp) North (+19pp) and
East (+13pp) The highest increase is recorded in Lithuania (+121pp) while the sharpest decrease is recorded in France (-243pp)
The only positive reversal is observed in Lithuania where between 2016 and 2018 this indicator increased by 121pp whereas between 2014 and 2016 it decreased by 34pp The highest negative reversal is observed in France where between 2016 and 2018 trust in organisations decreased by 243pp whereas between 2014 and 2016 it increased by 165pp
Consumer Survey 2018
48
Average proportion of agreement with Q3 options 1 2 and 3 - Base all EU27_2019 respondents (N=24928)
Average proportion of agreement with Q3 options 1 2 and 3 - Base all EU27_2019 respondents (N=24928)
Regarding socio-demographic variables and other characteristics consumersrsquo financial situation33 is
most closely associated with trust in organisations followed by vulnerability due to sociodemographic factors age education and vulnerability due to the complexity of offers and terms and conditions
Consumers that report being in a fairly or very easy financial situation report greater trust than those in a fairly difficult financial situation who in turn say that they have greater trust in organisations than those in a very difficult financial situation
Consumers who are very vulnerable in terms of socio-demographic factors report less trust in
organisations than those who are somewhat vulnerable who in turn have less trust than those who are not vulnerable
Concerning consumersrsquo age people aged 54 or younger tend to have greater trust in organisations than consumers aged 55 or older
Regarding education consumers with a low level of education show higher trust in organisations than those with a medium and high level of education
Finally consumers who are not vulnerable because of the complexity of offers also report greater
trust in organisations than those who are somewhat vulnerable and very vulnerable
33 Based on respondentsrsquo self-reported financial situation
648 A 648 A
669 B 660 B 624 A 621 A
683 645 A 643 A
559 615 672 A 682 A
666 641 A 638 A
446 A 451 A 488 432 A
675 B 645 AB 659 AB 635 AB
GenderMale Female
Trust in organisations
Blue collar
Student
65+
Education levelLow Medium High
Age18-34 35-54 55-64
Very easy
UrbanisationRural area Small town Large town
Financial situationVery difficult Fairly difficult Fairly easy
Unemployed Seeking a job RetiredEmployment status
Self-employed Manager Other white collar
640 AB 658 B 647 AB 629 A
631 A 649 A
628 A 644 A 653 A
661 B 616 A 626 AB 544 A 602 A
596 637 666
615 A 637 A 659
Four or more
Trust in organisations
LanguagesOnly native Two
High
Mother tongue
Not official language
in home country
Official language in
home country
Numerical skillsLow Medium
Three
Consumer
vulnerability
(complexity)
Very vulnerableSomewhat
vulnerableNot vulnerable
Hardly ever Never
Consumer
vulnerability
(socio-demographic
factors)
Very vulnerableSomewhat
vulnerableNot vulnerable
Internet useDaily Weekly Monthly
Consumer Survey 2018
49
The following three subsections separately report on trust in the three types of organisations
surveyed public authorities retailers and service providers and non-governmental organisation (NGOs)
611 Public authorities
Rate of agreement (ldquoStrongly agreerdquo and ldquoAgreerdquo) with Q3 option 1 - Base all respondents (N=28037)
For consumers of the European Union the overall level of trust in public authorities is 618 Compared to the EU27_2019 average this level of trust is higher in the West (638) and North (745) and lower in the East (585) and South (589) Trust in public authorities is highest in Hungary (860) Malta (835) and Finland (829) Among the EU countries the lowest levels of trust in public authorities are found in Croatia (334) Slovenia (484) and Bulgaria (519)
Additionally Iceland also has a low level of this indicator (509)
Region
Country
2018
( = sig
diff EU27)
2018-
2016
2016-
2014
2014-
2012
2012-
2011
2011-
2010
2010-
2009
2009-
2008
2008-
2006
EU27_2019 618 -48 +91 +28 -37 +00 +68 +09 -26
EU28 634 -54 +88 +25 -34 -02 +74 +11 -28
North 745 +30 -18 +25 +23 +24 +61 -92 +46
South 589 +66 +45 -03 -37 -89 +91 +32 +01
East 585 +15 +60 +39 -36 +44 +50 +18 -00
West 638 -172 +155 +45 -45 +41 +61 -01 -48
BE 613 -90 -28 +74 -36 +110 +98 -124 -21
BG 519 +25 +62 -112 +31 +113 +44 +114 -
CZ 579 +79 +51 +74 -28 -73 +61 +01 -23
DK 815 -01 +21 +25 +00 +22 +47 -63 +59
DE 676 -143 +167 +78 -68 +01 +111 -40 -25
EE 733 +43 -37 +164 -32 +34 +41 -32 +53
IE 741 -82 +155 -03 +12 -107 +115 +111 -88
EL 533 +76 -12 +69 -62 -27 +64 -50 -132
ES 590 +69 +69 -49 -43 -17 +53 -93 +152
FR 521 -308 +233 +17 -65 +103 -18 +87 -69
HR 334 -01 +20 +22 - - - - -
IT 590 +67 +35 +23 -38 -174 +147 +123 -71
CY 565 +92 +109 -132 -64 -46 +108 -182 -14
LV 547 +08 -59 -18 -23 +71 +176 -196 +104
LT 559 +145 -36 +75 +01 +22 +115 -119 +31
LU 785 -79 +83 -48 +21 +29 +33 +142 -68
HU 860 +20 +68 +73 +38 -30 +111 -90 +66
MT 835 +133 +21 -22 +14 +07 +77 -34 -68
NL 781 +38 -21 -21 +102 +23 +44 -64 -102
AT 817 -19 +36 +64 -32 +00 +109 -12 -02
PL 593 +10 +75 +68 -67 +74 +87 -22 +49
PT 625 +28 +47 -11 +21 +10 -33 +185 -126
RO 530 -27 +54 +19 -11 +69 -31 +115 -
SI 484 +58 +98 -03 +06 -92 -13 +26 -55
SK 548 +40 -00 +15 -36 +68 +14 -08 +52
FI 829 +37 -53 +15 +65 +34 -28 -49 +28
SE 755 +07 -03 +05 +34 -05 +72 -94 +43
IS 509 +55 +01 +166 -43 - - - -
NO 806 -09 -19 +109 -42 - - - -
UK 742 -100 +68 +02 -06 -32 +119 +33 -40
Trust in pubic authorities
Consumer Survey 2018
50
Compared to 2016 trust in public authorities remained stable in the East while it decreased in the
EU27_2019 (-48pp) and the West (-172pp) and increased in the North (+30pp) and the South (+66pp) The highest increase is found in Lithuania (+145pp) and the most prominent decrease is observed in France (-308pp)
The only positive reversal is observed in Finland where between 2016 and 2018 trust in public authorities increased by 37pp whereas between 2014 and 2016 it decreased by 53pp The greatest negative reversal is found in France As indicated above between 2016 and 2018 trust in public authorities decreased by 308pp following an increase of 233pp between 2014 and 2016
Rate of agreement with Q3 option 1 - Base all EU27_2019 respondents (N=24928)
Rate of agreement with Q3 option 1 - Base all EU27_2019 respondents (N=24928)
In terms of sociodemographic variables and other characteristics consumersrsquo financial situation is most closely associated with trust in public authorities The characteristics showing the next closest links are vulnerability due to socio-demographic factors vulnerability due to the complexity of offers and terms and conditions age and education
Consumers who report their financial situation to be fairly or very easy are more likely to trust public authorities than the remainder of the population In addition those who report their situation to be
fairly difficult are also more likely to trust public authorities than those who report their situation very difficult
Consumers who are very vulnerable in terms of sociodemographic factors are less likely to trust public authorities than those who are somewhat vulnerable who in turn are less likely to trust them than those who are not vulnerable
615 A 626 A
647 B 640 B 575 A 600 AB
652 B 626 AB 605 A
518 580 646 A 677 A
635 A 615 A 612 A
446 A 451 A 488 432 A
670 C 636 BC 651 BC 608 ABC
GenderMale Female
Trust in public authorities
Blue collar
Student
65+
Education levelLow Medium High
Age18-34 35-54 55-64
Very easy
UrbanisationRural area Small town Large town
Financial situationVery difficult Fairly difficult Fairly easy
Unemployed Seeking a job RetiredEmployment status
Self-employed Manager Other white collar
621 A 630 A 605 A 592 A
651 A 619 A
610 A 620 A 623 A
631 B 588 A 632 AB 540 A 597 AB
567 603 645
587 A 591 A 639
Four or more
Trust in public authorities
LanguagesOnly native Two
High
Mother tongue
Not official language
in home country
Official language in
home country
Numerical skillsLow Medium
Three
Consumer
vulnerability
(complexity)
Very vulnerableSomewhat
vulnerableNot vulnerable
Hardly ever Never
Consumer
vulnerability
(socio-demographic
factors)
Very vulnerableSomewhat
vulnerableNot vulnerable
Internet useDaily Weekly Monthly
Consumer Survey 2018
51
In contrast consumers who are not vulnerable in terms of the complexity of offers and terms and
conditions also are more likely to trust public authorities than those who are somewhat vulnerable or very vulnerable
Concerning consumersrsquo age consumers aged 18-54 years are more likely to trust public authorities than consumers who are 55-64 years old while consumers aged 65 years or older are on a par with all other age groups
Finally consumers with a low level of education are also more likely to trust public authorities than those with a high level of education
612 Retailers and service providers
Rate of agreement (ldquoStrongly agreerdquo and ldquoAgreerdquo) with Q3 option 2 - Base all respondents (N=28037)
Region
Country
2018
( = sig
diff EU27)
2018-
2016
2016-
2014
2014-
2012
2012-
2011
2011-
2010
2010-
2009
2009-
2008
2008-
2006
EU27_2019 713 -24 +60 +125 -69 +06 +73 -14 -29
EU28 723 -29 +57 +121 -65 -01 +70 -11 -29
North 774 +10 +19 +125 -83 +20 +68 -48 -16
South 653 +40 +25 +103 -36 -23 +110 -16 +07
East 751 +23 +56 +156 -47 +40 +67 +21 -35
West 725 -99 +93 +124 -104 +13 +51 -32 -35
BE 742 -46 +09 +159 -124 +54 +40 -125 -49
BG 674 +66 +89 +122 -00 +72 +76 +59 -
CZ 774 +27 +09 +340 -126 +20 +87 -63 -34
DK 821 -10 +55 +183 -155 -16 +204 -07 -68
DE 751 -89 +103 +137 -138 +19 +59 -62 -09
EE 815 +29 +36 +87 -06 +40 +32 -71 +47
IE 828 -17 +54 +29 -11 -64 +94 +153 -71
EL 600 -00 +107 +137 -57 -05 +30 +18 -59
ES 695 +32 +11 +138 -89 +41 +50 -109 +166
FR 645 -176 +136 +99 -79 +22 +25 +18 -67
HR 643 -13 +31 +57 - - - - -
IT 638 +53 +32 +91 -10 -89 +177 +41 -100
CY 478 +35 -75 +122 -64 -28 +141 -181 +46
LV 725 -51 +93 +34 -30 +26 +85 +11 +63
LT 746 +110 -51 +119 -04 +140 +20 +74 -77
LU 807 -36 -03 +74 -69 -12 +84 +35 -69
HU 845 +28 +62 +214 -48 -24 +73 -28 -27
MT 736 +147 -32 +157 -66 +56 +34 -125 +52
NL 815 +42 -17 +168 -50 -82 +92 -97 -24
AT 815 -17 +23 +84 -91 +38 +66 +71 -24
PL 757 +11 +61 +126 -56 +44 +103 -14 +54
PT 621 +41 -26 -27 +85 +49 +67 +74 -37
RO 721 +23 +71 +142 -28 +63 +00 +129 -
SI 735 +11 +70 +103 -82 -67 +57 +41 -06
SK 802 +66 +13 +108 -02 +65 +24 +07 +84
FI 816 -09 +03 +108 -78 +37 -23 -109 +04
SE 736 +11 +11 +124 -92 -24 +61 -86 +02
IS 636 -19 -09 +129 -82 - - - -
NO 757 -26 -05 +220 -119 - - - -
UK 796 -63 +30 +90 -32 -57 +53 +20 -22
Trust in retailers and service providers
Consumer Survey 2018
52
In the European Union the overall level of trust in retailers and service providers is 713 Compared
to the EU27_2019 average this level is higher in the West (725) the East (751) and the North (774) whereas it is lower in the South (653) The highest trust in retailers and service providers is found in Hungary (845) Ireland (828) and Denmark (821) The lowest levels of trust in retailers and service providers are found in Cyprus (478) Greece (600) and Portugal (621)
Between 2016 and 2018 trust in retailers and service providers decreased in the EU27_2019 (-24pp) and Western Europe (-99pp) while it remained stable in the North and increased in the East (+23pp) and South (+40pp) Compared to the previous survey this type of trust increased most
prominently in Malta (+147pp) and decreased most sharply in France (-176pp)
The only positive reversal is observed in Lithuania Between 2016 and 2018 trust in retailers and service providers in Lithuania increased by 110pp whereas between 2014 and 2016 it decreased by 51pp The largest negative reversal is observed in France where between 2016 and 2018 trust in retailers and service providers decreased by 176pp whereas between 2014 and 2016 it increased by 136pp
Rate of agreement with Q3 option 2 - Base all EU27_2019 respondents (N=24928)
Rate of agreement with Q3 option 2 - Base all EU27_2019 respondents (N=24928)
The findings for the socio-demographic variables show that trust in retailers and service providers is associated most closely with consumersrsquo financial situation followed by age vulnerability due to sociodemographic variables vulnerability due to the complexity of offers and terms and conditions and consumersrsquo degree of urbanisation
Consumers who report their financial situation to be fairly easy and very easy are more likely to trust retailers and service providers than those who report their situation to be fairly or very difficult
711 A 716 A
749 B 734 B 687 A 668 A
744 B 715 AB 701 A
640 A 680 A 736 B 760 B
737 704 A 701 A
446 A 451 A 488 432 A
763 B 692 A 703 AB 698 A
GenderMale Female
Trust in retailers and service providers
Blue collar
Student
65+
Education levelLow Medium High
Age18-34 35-54 55-64
Very easy
UrbanisationRural area Small town Large town
Financial situationVery difficult Fairly difficult Fairly easy
Unemployed Seeking a job RetiredEmployment status
Self-employed Manager Other white collar
694 A 727 B 729 B 714 AB
685 A 715 A
703 A 711 A 717 A
728 B 697 AB 702 AB 614 A 660 A
669 A 702 A 734
673 A 698 A 729
Four or more
Trust in retailers and service providers
LanguagesOnly native Two
High
Mother tongue
Not official language
in home country
Official language in
home country
Numerical skillsLow Medium
Three
Consumer
vulnerability
(complexity)
Very vulnerableSomewhat
vulnerableNot vulnerable
Hardly ever Never
Consumer
vulnerability
(socio-demographic
factors)
Very vulnerableSomewhat
vulnerableNot vulnerable
Internet useDaily Weekly Monthly
Consumer Survey 2018
53
Consumers who are not vulnerable in terms of socio-demographic factors are more likely to trust
retailers and service providers than those who are very or somewhat vulnerable
Consumers younger than 54 years are also more likely to trust in retailers and service providers than consumers aged 55 or older
Regarding the association between trust and vulnerability due to offers and terms and conditions consumers who are not vulnerable are more likely to trust in retailers and service providers than those who are very or somewhat vulnerable
Finally consumers that live in a rural area are more likely to trust organisations than those living in
small or large towns
Consumer Survey 2018
54
613 NGOs
Rate of agreement (ldquoStrongly agreerdquo and ldquoAgreerdquo) with Q3 option 3 - Base all respondents (N=28037)
In the European Union the overall level of trust in non-governmental consumer organisations (NGOs) is 607 In the East this level is in line with the EU27_2019 average while it is higher in the South (634) and lower in the North (588) and West (593) The highest trust in NGOs is observed for individuals residing in Hungary (810) Finland (751) and Malta (712) The lowest levels
of trust in NGOs are found in Bulgaria (348) Greece (388) and Latvia (439)
Between 2016 and 2018 trust in NGOs remained stable in the North South and East while it decreased in the EU27_2019 (-88pp) and the West (-217pp) Compared to the previous survey
Region
Country
2018
( = sig
diff EU27)
2018-
2016
2016-
2014
2014-
2012
2012-
2011
2011-
2010
2010-
2009
2009-
2008
2008-
2006
EU27_2019 607 -88 +89 -122 +17 +46 +44 -05 -21
EU28 608 -107 +100 -129 +21 +42 +46 -00 -24
North 588 +16 -22 -139 +36 +45 +20 -62 +23
South 634 +09 +19 -85 +44 +04 +53 +48 +25
East 603 +01 +41 -52 +23 +84 +37 +04 -29
West 593 -217 +179 -187 -06 +63 +46 -46 -33
BE 657 -68 -24 -48 +31 +78 +119 -199 +12
BG 348 -13 -09 -166 +104 +85 +45 +93 -
CZ 505 +72 -07 -233 +10 +173 -05 -109 +27
DK 683 +13 -04 -123 -35 +31 +01 -24 +53
DE 564 -256 +298 -238 -57 +57 +64 -60 -37
EE 575 +06 +28 -50 +09 +35 +10 -17 +64
IE 609 -225 +224 -232 +81 -49 +82 +101 -35
EL 388 +58 -69 -134 +21 +30 -17 -09 -28
ES 677 +39 -07 -98 +83 +31 +30 -25 +202
FR 595 -246 +126 -159 +23 +82 +13 +01 -53
HR 565 +07 +35 -53 - - - - -
IT 643 -17 +56 -67 +09 -30 +103 +87 -85
CY 503 +01 +82 -161 +103 -76 +14 +36 -107
LV 439 +24 -44 -176 -31 +101 +105 -79 +186
LT 580 +108 -16 -74 +35 +68 +62 +07 +16
LU 648 -184 +47 -78 +72 +29 +52 +08 -42
HU 810 -15 +66 +51 +56 -06 +71 -60 +73
MT 712 +54 +18 -142 +93 +30 +41 -19 -47
NL 682 +02 -79 -133 +69 +71 +25 -139 +17
AT 599 -227 +173 -174 +18 +16 +26 +62 -03
PL 688 +20 +34 +07 -22 +112 +65 -34 +49
PT 651 -28 +03 -82 +91 +50 -47 +225 -48
RO 523 -63 +93 -50 +51 +50 +04 +122 -
SI 554 -31 +97 -89 +97 -56 -40 +27 +58
SK 486 +18 +04 -128 +89 +61 +06 -26 +63
FI 751 +45 -39 -24 +14 +63 -24 -36 -42
SE 476 -28 -27 -242 +107 +15 +20 -116 +09
IS 664 -13 +30 +70 -47 - - - -
NO 584 -07 -94 -60 +11 - - - -
UK 615 -241 +179 -177 +54 +06 +55 +37 -41
Trust in NGOs
Consumer Survey 2018
55
this type of trust increased most sharply in Lithuania (+108pp) whereas it decreased most
prominently in Germany (-256pp)
The only positive reversal is observed in Greece where between 2016 and 2018 trust in NGOs increased by 58pp whereas between 2014 and 2016 it decreased by 69pp Conversely the largest negative reversal is found in Germany where between 2016 and 2018 this indicator decreased by 256pp following an increase of 298pp between 2014 and 2016
Rate of agreement with Q3 option 3 - Base all EU27_2019 respondents (N=24928)
Rate of agreement with Q3 option 3 - Base all EU27_2019 respondents (N=24928)
With regard to socio-demographic variables and other characteristics higher trust in NGOs is most closely association with vulnerability in terms of socio-demographic factors followed by numerical skills
Regarding consumers who are very vulnerable in terms of socio-demographic factors a higher proportion reports trust in NGOs compared to the remainder of the population
In addition those who have a high numerical skill level are more likely to trust in NGOs than those with low numerical skills Consumers who have a medium level of numerical skills fall somewhere in
between
617 A 603 A
620 A 607 A 611 A 600 A
642 B 594 A 619 AB
542 A 587 AB 637 C 613 BC
625 A 603 A 602 A
446 A 451 A 488 432 A
606 A 607 A 620 A 603 A
GenderMale Female
Trust in NGOs
Blue collar
Student
65+
Education levelLow Medium High
Age18-34 35-54 55-64
Very easy
UrbanisationRural area Small town Large town
Financial situationVery difficult Fairly difficult Fairly easy
Unemployed Seeking a job RetiredEmployment status
Self-employed Manager Other white collar
605 AB 619 B 607 AB 576 A
556 A 612 A
572 A 601 AB 620 B
625 B 569 A 549 AB 507 A 571 A
566 604 A 624 A
596 A 624 A 610 A
Four or more
Trust in NGOs
LanguagesOnly native Two
High
Mother tongue
Not official language
in home country
Official language in
home country
Numerical skillsLow Medium
Three
Consumer
vulnerability
(complexity)
Very vulnerableSomewhat
vulnerableNot vulnerable
Hardly ever Never
Consumer
vulnerability
(socio-demographic
factors)
Very vulnerableSomewhat
vulnerableNot vulnerable
Internet useDaily Weekly Monthly
Consumer Survey 2018
56
Trust in redress mechanisms
This section focuses on consumersrsquo level of trust in redress mechanisms (out-of-court mechanisms and courts) which is relevant as it can affect their willingness to actively use these mechanisms when facing problems with online andor offline purchases
Average proportion of agreement (ldquoStrongly agreerdquo and ldquoAgreerdquo) with Q334 options Q34 and Q35 - Base all
respondents (N=28037)
34 Q3 How strongly do you agree or disagree with each of the following statements In (our country) hellip -Strongly agree ndashAgree ndash Disagree ndashStrongly disagree ndash DKNA
Q34 It is easy to settle disputes with retailers and service providers through an out-of-court body (ie arbitration mediation or conciliation body) Q35 It is easy to settle disputes with retailers and service providers through the courts
Region
Country
2018
( = sig
diff EU27)
2018-
2016
2016-
2014
2014-
2012
2012-
2011
2011-
2010
2010-
2009
2009-
2008
2008-
2006
EU27_2019 369 -72 +55 +13 -46 +53 +95 -42 -30
EU28 379 -84 +65 +10 -48 +43 +103 -43 -31
North 381 +38 -20 -11 +07 +81 +73 -130 -15
South 378 +43 -20 +54 -44 +06 +115 -42 -08
East 359 -09 -05 +07 +15 +67 +26 +21 +29
West 367 -202 +149 -11 -88 +82 +119 -66 -59
BE 310 -16 -131 -16 -10 +138 +106 -214 -11
BG 279 +04 +01 -53 +60 +87 +54 +35 -
CZ 418 +74 +19 +06 +05 +78 -52 +71 -25
DK 523 +73 +23 +18 -48 +129 +80 -213 +101
DE 381 -215 +230 -38 -99 +55 +152 -84 -80
EE 254 -31 +28 +95 -16 -18 +03 -53 +22
IE 487 -105 +68 +27 -27 -48 +127 +128 -89
EL 432 +53 -45 +23 -19 +15 +63 -104 -36
ES 393 +35 -09 +18 -26 +69 +102 -51 +89
FR 306 -311 +163 +12 -110 +124 +83 -21 -42
HR 302 +02 -00 +22 - - - - -
IT 373 +66 -34 +103 -73 -63 +155 -44 -59
CY 339 +26 -42 -112 +24 +38 +41 -05 -165
LV 311 +46 -61 -72 +02 +219 +14 -89 +69
LT 408 +164 -27 -49 -09 +85 +79 -24 -18
LU 373 -183 -02 +44 -54 +145 +14 +82 -29
HU 383 +127 -140 +14 +15 +73 -02 +13 +13
MT 447 +65 -00 +30 +40 +62 +28 +02 -49
NL 470 +76 -84 +15 -28 +78 +95 -157 -19
AT 480 -93 +129 +24 -91 +51 +112 +39 -80
PL 320 -22 -13 +30 +03 +23 +66 -32 +69
PT 277 -64 +39 -44 +24 +114 +10 +61 -85
RO 460 -100 +77 -27 +23 +137 +01 +99 -
SI 416 -12 +213 -86 +98 -27 -15 -52 +86
SK 251 -20 -135 +74 +64 +77 +23 +21 -05
FI 456 +14 -78 +23 +19 +82 +94 -37 -89
SE 282 -00 -08 -37 +42 +29 +81 -190 -59
IS 287 -46 -51 +12 -33 - - - -
NO 429 -05 -83 +82 -52 - - - -
UK 446 -169 +133 -05 -65 -41 +167 -42 -27
Trust in redress mechanisms
Consumer Survey 2018
57
In the European Union the overall level of trust in redress mechanisms is 369 In the South and
West this level is in line with the EU27_2019 average while it is higher in the North (381) and lower in the East (359)
In this map values above average are coloured in light and dark green and values below average are coloured
in light and dark red
The highest trust in redress mechanisms is found in Denmark (523) Ireland (487) and Austria (480) The lowest levels of trust in redress mechanisms are found in Slovakia (251) Estonia
(254) and Portugal (277)
Between 2016 and 2018 trust in redress mechanisms decreased in the EU27_2019 (-72pp) and the West (-202pp) while it remained stable in the East and increased in the North (+38pp) and South
(+43pp) Compared to the 2016 survey this type of trust increased most prominently in Lithuania (+164pp) and decreased most prominently in France (-311pp)
The largest positive reversal is observed in Hungary where between 2016 and 2018 trust in redress mechanisms increased by 127pp whereas between 2014 and 2016 it decreased by 140pp The largest negative reversal is observed in France where the decrease in trust between 2016 and 2018 (-311pp see above) follows a 163pp increase observed between 2014 and 2016
Consumer Survey 2018
58
Average proportion of agreement (ldquoStrongly agreerdquo and ldquoAgreerdquo) with Q3 options 1 2 and 3 - Base all
EU27_2019 respondents (N=24928)
Average proportion of agreement (ldquoStrongly agreerdquo and ldquoAgreerdquo) with Q3 options 1 2 and 3 - Base all
EU27_2019 respondents (N=24928)
Consumer trust in redress mechanisms is associated most closely with age followed by gender education consumersrsquo financial situation vulnerability of consumers in terms of complexity of offers and terms and conditions and consumersrsquo employment status
Consumers aged 54 years or younger show a higher trust in redress mechanisms than older consumers (aged 55 or older)
Regarding consumersrsquo gender males tend to report greater trust than females on this indicator
Consumers with a low level of education show a higher level of trust in redress mechanisms than
those with a high level of education
Additionally consumers that indicate being in a very difficult financial situation show a lower trust in redress mechanisms than all other consumers In addition consumers in a fairly difficult situation also report lower trust than consumers in a fairly easy financial situation
Finally consumers who are very vulnerable and somewhat vulnerable in such terms show lower trust in redress mechanisms than those who are not vulnerable
The following two sections focus on the findings of two specific redress mechanisms the ADR
(Alternative Dispute Resolution) and courts
391 349
412 381 339 A 324 A
400 A 386 A 342
319 360 A 383 B 388 AB
373 A 366 A 370 A
446 A 451 A 488 432 A
381 AB 395 B 382 AB 367 AB
GenderMale Female
Trust in redress mechanisms
Blue collar
Student
65+
Education levelLow Medium High
Age18-34 35-54 55-64
Very easy
UrbanisationRural area Small town Large town
Financial situationVery difficult Fairly difficult Fairly easy
Unemployed Seeking a job RetiredEmployment status
Self-employed Manager Other white collar
371 A 370 A 368 A 360 A
361 A 370 A
375 A 379 A 364 A
377 B 354 AB 334 AB 299 A 352 AB
381 A 369 A 368 A
351 A 350 A 381
Four or more
Trust in redress mechanisms
LanguagesOnly native Two
High
Mother tongue
Not official language
in home country
Official language in
home country
Numerical skillsLow Medium
Three
Consumer
vulnerability
(complexity)
Very vulnerableSomewhat
vulnerableNot vulnerable
Hardly ever Never
Consumer
vulnerability
(socio-demographic
factors)
Very vulnerableSomewhat
vulnerableNot vulnerable
Internet useDaily Weekly Monthly
Consumer Survey 2018
59
621 ADR
Rate of agreement (ldquoStrongly agreerdquo and ldquoAgreerdquo) with Q3 option 4 - Base all respondents (N=28037)
In the European Union the overall level of trust in ADR is 422 In the South East and West this type of trust is in line with the EU27_2019 average while it is higher in the North (462) The highest levels of trust in ADR are found in Malta (617) Finland (589) and Denmark (542) Among the EU countries the lowest levels of trust in ADR are found in Slovenia (289) Bulgaria (297) and Estonia (327) Furthermore Iceland reported the lowest levels of trust in ADR
(263)
Between 2016 and 2018 trust in ADR remained stable in the East while it decreased in the EU27_2019 (-69pp) and the West (-207pp) but increased in the North (+45pp) and South (+55pp) Compared to the previous survey in 2016 this type of trust increased most sharply in Lithuania (+225pp) and decreased most prominently in France (-287pp)
Region
Country
2018
( = sig
diff EU27)
2018-
2016
2016-
2014
2014-
2012
2012-
2011
2011-
2010
2010-
2009
2009-
2008
2008-
2006
EU27_2019 422 -69 +55 +23 -68 +44 +102 -14 -42
EU28 430 -84 +67 +21 -78 +37 +104 -11 -39
North 462 +45 -10 -11 -03 +85 +59 -101 -26
South 436 +55 -27 +78 -84 +16 +119 +19 -26
East 418 -03 -14 +11 +06 +39 +49 +38 +12
West 409 -207 +158 -05 -108 +65 +124 -57 -66
BE 361 -10 -111 -15 -23 +130 +116 -216 -33
BG 297 +09 +18 -55 +68 +65 +66 +45 -
CZ 491 +97 +18 +40 -07 +72 -48 +74 -54
DK 542 +79 +21 +45 -106 +140 +53 -152 +87
DE 402 -248 +266 -66 -112 +50 +148 -57 -100
EE 327 -49 +33 +126 -30 -02 -33 -23 +29
IE 541 -99 +67 +21 -70 -61 +162 +163 -130
EL 476 +41 -01 +35 -64 -05 +61 -15 -30
ES 458 +51 -20 +38 -50 +68 +103 -13 +119
FR 373 -287 +144 +59 -139 +90 +87 -25 -31
HR 366 -23 +28 +47 - - - - -
IT 430 +81 -46 +139 -128 -38 +163 +29 -122
CY 374 +30 -51 -110 -53 -59 +92 +21 -113
LV 359 +20 -21 -78 -04 +235 +17 -92 +92
LT 475 +225 -66 -63 -17 +82 +92 +03 -29
LU 376 -231 +18 +58 -121 +157 -13 +44 +22
HU 453 +144 -192 +33 -40 +14 +60 +59 -28
MT 617 +126 +08 +48 +14 +96 +11 +24 -44
NL 514 +81 -119 +52 -53 +64 +118 -181 -12
AT 521 -90 +142 -07 -96 +23 +155 +36 -79
PL 397 -11 -09 +15 +12 -22 +101 -26 +75
PT 335 -61 +25 -55 +08 +129 -02 +131 -84
RO 493 -113 +70 -20 -02 +131 +07 +129 -
SI 289 -57 +53 -48 +31 -05 -53 -28 +117
SK 328 +03 -184 +95 +103 +66 +33 +41 +00
FI 589 +09 -46 -63 +76 +74 +79 +00 -112
SE 379 +07 +07 -01 +19 +32 +63 -173 -71
IS 263 -35 -76 -63 -61 - - - -
NO 470 -02 -82 +87 -88 - - - -
UK 489 -183 +155 +04 -140 -22 +120 +23 -18
Trust in ADR
Consumer Survey 2018
60
The largest positive reversal is observed in Hungary where between 2016 and 2018 trust in ADR
increased by 144pp whereas between 2014 and 2016 it decreased by 192pp The largest negative change is observed in Germany Between 2016 and 2018 trust in ADR decreased by 248pp following an increase of 266pp between 2014 and 2016
Rate of agreement with Q3 option 4 - Base all EU27_2019 respondents (N=24928)
Rate of agreement with Q3 option 4 - Base all EU27_2019 respondents (N=24928)
The socio-demographic findings show that trust in ADR is associated most closely with consumersrsquo age followed by gender and self-reported financial situation
As far as consumersrsquo age is concerned consumers aged 18-34 years are more likely to trust in ADR
than the remainder of the population In addition those aged 35-54 years are also more likely to trust ADR than those aged 55-64 years while consumers aged 65 years and older have the (relatively) same level of trust as those who are between 35 and 64 years
Regarding gender males tend to be more likely to trust ADR than females
Finally consumers who report their financial situation to be very difficult are less likely to trust ADR than other consumers
441 405
481 421 B 384 A 390 AB
437 AB 440 B 398 A
366 421 A 434 A 437 A
432 A 417 A 421 A
446 A 451 A 488 432 A
430 A 433 A 421 A 413 A
GenderMale Female
Trust in ADR
Blue collar
Student
65+
Education levelLow Medium High
Age18-34 35-54 55-64
Very easy
UrbanisationRural area Small town Large town
Financial situationVery difficult Fairly difficult Fairly easy
Unemployed Seeking a job RetiredEmployment status
Self-employed Manager Other white collar
424 A 426 A 414 A 410 A
407 A 424 A
408 A 434 A 419 A
435 B 385 A 376 AB 325 A 393 AB
432 A 423 A 421 A
417 A 407 A 431 A
Four or more
Trust in ADR
LanguagesOnly native Two
High
Mother tongue
Not official language
in home country
Official language in
home country
Numerical skillsLow Medium
Three
Consumer
vulnerability
(complexity)
Very vulnerableSomewhat
vulnerableNot vulnerable
Hardly ever Never
Consumer
vulnerability
(socio-demographic
factors)
Very vulnerableSomewhat
vulnerableNot vulnerable
Internet useDaily Weekly Monthly
Consumer Survey 2018
61
622 Courts
Rate of agreement (ldquoStrongly agreerdquo and ldquoAgreerdquo) with Q3 option 5 - Base all respondents (N=28037)
In the European Union the overall level of trust in courts is 316 In the South and West this level is in line with the EU27_2019 average while it is lower in the East (301) and North (301) The highest trust in courts is found in Slovenia (542) Denmark (503) and Austria (439) The lowest levels of trust in courts are found in Slovakia (174) Estonia (181) and Sweden (185)
Trust in courts decreased between 2016 and 2018 in the EU27_2019 (-75pp) East (-14pp) and
West (-196pp) while it increased in the North (+31pp) and South (+31pp) Compared to the previous survey trust increased most substantially in Hungary (+111pp) and decreased most prominently in France (-335pp)
Region
Country
2018
( = sig
diff EU27)
2018-
2016
2016-
2014
2014-
2012
2012-
2011
2011-
2010
2010-
2009
2009-
2008
2008-
2006
EU27_2019 316 -75 +55 +02 -23 +63 +88 -69 -19
EU28 327 -85 +62 -00 -19 +49 +103 -75 -22
North 301 +31 -30 -11 +17 +77 +87 -159 -03
South 319 +31 -13 +29 -04 -05 +112 -103 +09
East 301 -14 +04 +03 +23 +96 +03 +05 +45
West 325 -196 +141 -16 -68 +99 +114 -75 -52
BE 259 -21 -150 -18 +02 +146 +97 -212 +12
BG 261 -00 -16 -52 +51 +109 +42 +26 -
CZ 345 +51 +19 -27 +18 +84 -56 +67 +04
DK 503 +67 +25 -08 +09 +118 +107 -273 +116
DE 360 -181 +194 -11 -86 +60 +156 -110 -61
EE 181 -14 +22 +65 -02 -35 +39 -83 +16
IE 434 -110 +70 +33 +16 -36 +92 +93 -49
EL 389 +66 -90 +11 +26 +34 +66 -193 -42
ES 329 +19 +03 -02 -03 +70 +100 -89 +59
FR 239 -335 +183 -36 -80 +159 +80 -16 -52
HR 239 +28 -28 -03 - - - - -
IT 316 +51 -22 +66 -18 -88 +147 -117 +04
CY 303 +22 -34 -115 +100 +134 -10 -30 -216
LV 262 +72 -100 -66 +09 +203 +11 -85 +46
LT 341 +103 +13 -35 -01 +87 +65 -52 -07
LU 371 -134 -22 +30 +13 +132 +42 +120 -79
HU 312 +111 -87 -06 +71 +132 -65 -33 +54
MT 276 +03 -08 +12 +67 +27 +45 -20 -53
NL 425 +70 -49 -22 -02 +93 +72 -133 -27
AT 439 -95 +117 +54 -85 +79 +69 +41 -80
PL 242 -33 -18 +45 -06 +68 +31 -38 +63
PT 219 -67 +53 -33 +41 +100 +22 -08 -87
RO 426 -88 +83 -33 +48 +143 -05 +70 -
SI 542 +33 +373 -125 +165 -48 +23 -76 +55
SK 174 -43 -86 +53 +25 +88 +14 +02 -10
FI 323 +18 -110 +110 -39 +90 +109 -75 -65
SE 185 -07 -23 -73 +64 +27 +98 -206 -47
IS 311 -57 -27 +87 -06 - - - -
NO 387 -07 -84 +77 -17 - - - -
UK 403 -155 +111 -15 +09 -59 +215 -108 -37
Trust in courts
Consumer Survey 2018
62
These prominent changes in Hungary and France are particularly interesting as they are connected
to noticeable reversals In Hungary the increase between 2016 and 2018 (+111pp) follows a strong decrease of 87pp between 2014 and 2016 In France the decrease of 335pp between 2016 and 2018 comes after a strong increase of 183pp between 2014 and 2016
Rate of agreement with Q3 option 5 - Base all EU27_2019 respondents (N=24928)
Rate of agreement with Q3 option 5 - Base all EU27_2019 respondents (N=24928)
The results of the socio-demographic analysis show that consumersrsquo trust in courts is associated most closely with gender followed by age education the self-reported financial situation of consumers and vulnerability of consumers in terms of complexity of offers and terms and conditions
In terms of gender males are more likely to trust courts than females
Trust in courts also tends to be more common for consumers aged 54 years or younger than for consumers aged 55 years or older
In addition consumers with a low or medium level of education are also more likely to trust courts than those with a high level of education
Consumers who report their financial situation to be fairly or very easy are more likely to trust courts than those in a fairly or very difficult situation
Finally consumers who are very or somewhat vulnerable in terms of complexity of offers and terms and conditions are less likely to trust in courts than those who are not vulnerable
342 293
345 B 341 B 295 A 260 A
362 A 333 A 285
271 A 300 A 331 B 338 B
315 A 315 A 320 A
446 A 451 A 488 432 A
335 AB 355 B 342 AB 321 AB
GenderMale Female
Trust in courts
Blue collar
Student
65+
Education levelLow Medium High
Age18-34 35-54 55-64
Very easy
UrbanisationRural area Small town Large town
Financial situationVery difficult Fairly difficult Fairly easy
Unemployed Seeking a job RetiredEmployment status
Self-employed Manager Other white collar
317 A 315 A 323 A 310 A
314 A 317 A
342 A 323 A 309 A
318 A 324 A 294 A 275 A 312 A
329 A 315 A 315 A
286 A 293 A 332
Four or more
Trust in courts
LanguagesOnly native Two
High
Mother tongue
Not official language
in home country
Official language in
home country
Numerical skillsLow Medium
Three
Consumer
vulnerability
(complexity)
Very vulnerableSomewhat
vulnerableNot vulnerable
Hardly ever Never
Consumer
vulnerability
(socio-demographic
factors)
Very vulnerableSomewhat
vulnerableNot vulnerable
Internet useDaily Weekly Monthly
Consumer Survey 2018
63
7 TRUST IN PRODUCT SAFETY
This chapter discusses consumersrsquo perceptions of and trust in product safety which is considered a key driver of consumer confidence
Average proportion of agreement (ldquoStrongly agreerdquo and ldquoAgreerdquo) with Q414 options 1and 2 - Base all
respondents (N=28037)
14 Q4 Thinking about all non-food products currently on the market in (our country) do you think that How strongly do you agree or disagree with each of the following statements In (our country) hellip
1 Essentially all non-food products are safe 2 A small number of non-food products are unsafe
Region
Country
2018
( = sig
diff EU27)
2018-
2016
2016-
2014
2014-
2012
2012-
2011
2011-
2010
2010-
2009
2009-
2008
EU27_2019 679 -73 +93 +15 -02 -21 +79 -28
EU28 697 -79 +94 +12 -06 -14 +68 -28
North 755 +36 -07 +25 -24 +45 +05 -79
South 641 +59 +07 -31 +08 -67 +110 -22
East 696 -05 +57 +16 +11 +09 +114 -103
West 687 -216 +185 +49 -13 -11 +50 +12
BE 666 -81 -56 +69 +20 +43 +47 -188
BG 545 +15 +18 -169 +68 +98 +114 -88
CZ 809 +17 +07 +43 -15 +11 +131 -137
DK 764 +01 +15 +07 -23 +121 -15 -91
DE 741 -182 +194 +89 -25 -51 +94 +32
EE 716 +09 -58 +116 +25 +19 -46 -68
IE 828 -106 +127 -28 -27 +04 +39 +119
EL 566 +35 +02 +108 -39 -77 +91 -79
ES 696 +104 -42 -39 +44 -73 +90 -86
FR 569 -362 +286 +21 -19 +21 -20 -36
HR 672 +48 +17 -02 - - - -
IT 617 +39 +43 -47 -22 -62 +131 +44
CY 497 -34 -57 +32 +09 -67 +83 -67
LV 701 +55 +07 -18 +48 +19 +79 -106
LT 762 +125 -24 +66 +59 +101 +18 -155
LU 813 -75 +85 +09 +84 -141 +43 +05
HU 787 +01 +44 +12 +35 -13 +19 +17
MT 647 +35 -57 -61 -02 +20 +130 -193
NL 819 +31 -30 -43 +25 +57 +83 +143
AT 727 -173 +113 +61 +18 -85 +82 +117
PL 764 -20 +80 +57 +04 -22 +164 -190
PT 622 +07 +17 -46 +77 -84 +98 -23
RO 510 -45 +66 +31 +07 +79 +71 -35
SI 691 +92 +06 -103 +42 -74 +43 -108
SK 724 +69 +84 -62 +13 -122 +95 +49
FI 845 +36 -83 -05 -02 -24 +24 -42
SE 714 +28 +33 +36 -85 +16 -11 -48
IS 743 +53 +01 +34 +27 - - -
NO 839 -02 +16 +10 +01 - - -
UK 819 -123 +106 -10 -33 +28 -10 -11
Trust in product safety
Consumer Survey 2018
64
In the European Union the level of trust in product safety is 679 In the West this level of trust
is in line with the EU27_2019 average while it is lower in the South (641) and higher in the East (696) and North (755)
In this map values above average are coloured in light and dark green and values below average are coloured
in light and dark red
Among EU countries the highest amount of trust in product safety is found in Finland (845) Ireland (828) and the Netherlands (819) The lowest levels of trust in product safety are found
in Cyprus (497) Romania (510) and Bulgaria (545)
Between 2016 and 2018 trust in product safety remained stable in the East while it decreased in the EU27_2019 (-73pp) and the West (-216pp) and increased in the North (+36pp) and South
(+59pp) Compared to the previous survey trust in product safety increased most substantially in Lithuania (+125pp) and decreased most prominently in France (-362pp)
When looking at statistically significant changes in 2018 (vs 2016) and in 2016 (vs 2014) the only positive reversal is found in Finland where between 2016 and 2018 this indicator increased by 36pp whereas between 2014 and 2016 it decreased by 83pp The largest negative reversal is found in
Consumer Survey 2018
65
France where between 2016 and 2018 this indicator decreased by 362pp following an increase of
286pp between 2014 and 2016
Average proportion of agreement with Q4 options 1 and 2 - Base all EU27_2019 respondents (N=24928)
Average proportion of agreement with Q4 options 1 and 2 - Base all EU27_2019 respondents (N=24928)
In terms of socio-demographic variables having trust in product safety is most closely associated with gender followed by internet use consumersrsquo financial situation vulnerability due to socio-demographic factors and numerical skills
Concerning consumersrsquo gender males are more likely to trust in product safety than females
Moreover consumers who use the internet more frequently (ie daily and weekly) have greater
trust in product safety than those who use the internet hardly ever or never Also people that use the internet monthly show greater trust in product safety than those who never use the internet
Consumers who report their financial situation to be fairly or very easy are more likely trust in product
safety is higher than among those who report their situation to be fairly or very difficult
Regarding vulnerability due to socio-demographic factors consumers who are very vulnerable are less likely to trust product safety compared to those who are not or somewhat vulnerable
Finally consumers with high numerical skill levels are more likely to trust in product safety than
those with low and medium numerical skills
710 657
667 A 689 A 684 A 686 A
667 A 679 A 691 A
633 A 661 A 700 B 706 B
685 A 676 A 688 A
446 A 451 A 488 432 A
704 A 683 A 646 A 671 A
GenderMale Female
Trust in product safety
Blue collar
Student
65+
Education levelLow Medium High
Age18-34 35-54 55-64
Very easy
UrbanisationRural area Small town Large town
Financial situationVery difficult Fairly difficult Fairly easy
Unemployed Seeking a job RetiredEmployment status
Self-employed Manager Other white collar
675 A 688 A 680 A 695 A
662 A 683 A
658 A 667 A 695
695 C 688 C 702 BC 595 AB 611 A
632 686 A 696 A
642 A 674 AB 695 B
Four or more
Trust in product safety
LanguagesOnly native Two
High
Mother tongue
Not official language
in home country
Official language in
home country
Numerical skillsLow Medium
Three
Consumer
vulnerability
(complexity)
Very vulnerableSomewhat
vulnerableNot vulnerable
Hardly ever Never
Consumer
vulnerability
(socio-demographic
factors)
Very vulnerableSomewhat
vulnerableNot vulnerable
Internet useDaily Weekly Monthly
Consumer Survey 2018
66
8 TRUST IN ENVIRONMENTAL CLAIMS
This chapter discusses results from the consumer survey when it comes to consumer trust in environmental claims It is broken down into two parts focusing on the perceived reliability of environmental claims and on their perceived impact on consumersrsquo purchasing decisions
Reliability of environmental claims
Average proportion of agreement (ldquoStrongly agreerdquo and ldquoAgreerdquo) with Q335 option 6 - Base all respondents
(N=28037)
35 Q3 How strongly do you agree or disagree with each of the following statements In (our country) hellip -Strongly agree ndashAgree ndash Disagree ndashStrongly disagree ndash DKNA Q36 Most environmental claims about goods or services are reliable
Region
Country
2018
( = sig
diff EU27)
2018-
2016
2016-
2014
EU27_2019 542 -91 +121
EU28 553 -102 +122
North 636 +46 +04
South 551 +46 +14
East 614 +22 +54
West 485 -264 +247
BE 494 -28 -88
BG 533 +74 +31
CZ 551 +53 +29
DK 807 +56 +29
DE 454 -334 +377
EE 620 -02 +25
IE 655 -132 +104
EL 530 +49 +39
ES 562 +27 +04
FR 471 -324 +223
HR 401 +39 -36
IT 544 +70 +22
CY 501 +79 -88
LV 596 -64 +75
LT 652 +143 -42
LU 639 -142 +36
HU 780 +02 +129
MT 622 +115 -72
NL 553 +65 -25
AT 655 -163 +209
PL 682 +40 +44
PT 569 -25 -06
RO 547 -32 +89
SI 494 +10 -09
SK 521 -12 +18
FI 643 +69 -61
SE 538 +26 +22
IS 448 +08 -59
NO 604 -24 +08
UK 631 -180 +130
Trust in environmental claims
Consumer Survey 2018
67
In the European Union the overall level of trust in the reliability of environmental claims is 542
In the South this level is in line with the EU27_2019 average while it is lower in the West (485) and higher in the East (614) and North (636)
In this map values above average are coloured in light and dark green and values below average are coloured
in light and dark red
The highest levels of trust in environmental claims are found in Denmark (807) Hungary (780) and Poland (682) whereas the lowest levels are found in Croatia (401) Germany (454) and
France (471) Furthermore Iceland reported low levels of trust (448)
Between 2016 and 2018 trust in the reliability of environmental claims decreased in the EU27_2019 (-91pp) and the West (-264pp) while it increased in the East (+22pp) North (+46pp) and South (+46pp) Compared to the survey in 2016 this type of trust increased most prominently in Lithuania (+143pp) and decreased most prominently in Germany (-334pp)
When looking at statistically significant changes in 2018 (vs 2016) and in 2016 (vs 2014) the largest positive reversal is found in Malta where between 2016 and 2018 this indicator increased by 115pp whereas between 2014 and 2016 it decreased by 72pp Related to the strongest decrease
Consumer Survey 2018
68
in 2018 (see above) the largest negative reversal is found in Germany where the strong decrease
in 2018 was preceded by an increase of 377pp between 2014 and 2016
Average proportion of agreement (ldquoStrongly agreerdquo and ldquoAgreerdquo) with Q3 option 6 - Base all EU27_2019
respondents (N=24928)
Average proportion of agreement (ldquoStrongly agreerdquo and ldquoAgreerdquo) with Q3 option 6 - Base all EU27_2019
respondents (N=24928)
The socio-demographic findings show that consumersrsquo trust in environmental claims is most closely linked with their mother tongue followed by their financial situation the vulnerability of consumers because of the complexity of offers and the number of languages spoken
Consumers whose mother tongue is an official language of the country or region in which they live are less likely to trust environmental claims than those whose mother tongue is another language
Consumers who report their financial situation to be very easy and fairly easy report higher trust in environmental claims than those who report their situation to be fairly difficult and very difficult
Consumers who are very vulnerable in terms of the complexity of offers and terms and conditions are less likely to trust environmental claims than those who are somewhat vulnerable and those who are not vulnerable
Finally consumers who speak only their native language and those who speak two languages are more likely to trust environmental claims than those who speak four or more languages
553 A 535 A
580 B 551 AB 521 A 508 A
574 B 546 AB 532 A
474 A 511 A 574 B 555 B
549 A 544 A 537 A
446 A 451 A 488 432 A
589 A 557 A 513 A 555 A
GenderMale Female
Trust in environmental claims
Blue collar
Student
65+
Education levelLow Medium High
Age18-34 35-54 55-64
Very easy
UrbanisationRural area Small town Large town
Financial situationVery difficult Fairly difficult Fairly easy
Unemployed Seeking a job RetiredEmployment status
Self-employed Manager Other white collar
565 C 539 BC 525 AB 488 A
601 540
539 A 544 A 544 A
559 C 472 A 589 BC 498 ABC 497 AB
524 A 528 A 557 A
496 538 A 556 A
Four or more
Trust in environmental claims
LanguagesOnly native Two
High
Mother tongue
Not official language
in home country
Official language in
home country
Numerical skillsLow Medium
Three
Consumer
vulnerability
(complexity)
Very vulnerableSomewhat
vulnerableNot vulnerable
Hardly ever Never
Consumer
vulnerability
(socio-demographic
factors)
Very vulnerableSomewhat
vulnerableNot vulnerable
Internet useDaily Weekly Monthly
Consumer Survey 2018
69
The influence of environmental claims on purchasing decisions
Proportion of agreement with Q536 options 1 2 and 3 - Base all respondents (N=28037)
In the European Union 552 of consumers report that claims about the environmental impact of goods and services have influenced their purchasing decisions Compared to the EU27_2019 average higher levels are found in the South (593) and East (573) whereas lower levels are observed in the North (514) and West (519) The highest proportion of consumers who report that
environmental claims have influenced their purchasing decisions is found in Croatia (727) Ireland
(719) and Greece (626) In addition high levels are found in the UK (677) and Norway (634) The lowest levels are observed in Bulgaria (322) Cyprus (328) and Estonia (372)
36 Q5 Considering everything you have bought during the last two weeks did the environmental impact of any goods or services also influence your choice 1 Yes for all or most goods or services you bought 2 Yes but only for some 3 Yes but only for one or two
Region
Country
2018
( = sig
diff EU27)
2018-
2016
2016-
2014
2014-
2012
2012-
2011
2011-
2010
EU27_2019 552 +54 -69 +147 +118 -32
EU28 568 +73 -60 +146 +118 -33
North 514 +21 +14 +49 +94 -24
South 593 +113 -111 +175 +133 -97
East 573 -30 +39 +132 +142 +30
West 519 +61 -107 +149 +97 -18
BE 506 -71 -28 +162 +99 -110
BG 322 -64 -69 +120 +157 +25
CZ 589 +60 +20 +111 +168 -59
DK 513 +43 -06 +35 +85 -76
DE 479 +15 -67 +165 +87 +16
EE 372 +03 +25 +91 +45 +43
IE 719 +225 -54 +84 +92 +28
EL 626 +190 -208 +90 +83 -82
ES 592 +123 -126 +267 +99 -97
FR 544 +144 -189 +142 +109 -54
HR 727 +118 -57 +189 - -
IT 611 +119 -116 +155 +157 -86
CY 328 +63 -152 -62 +114 -22
LV 516 -21 +66 +96 +115 +26
LT 490 +179 +28 +06 +90 +14
LU 537 +58 -217 +222 +104 +13
HU 589 -34 +79 +94 +63 -18
MT 527 +44 +28 -04 +161 -173
NL 554 +05 -36 +107 +75 +08
AT 564 +83 -138 +135 +154 -77
PL 582 -39 +53 +119 +155 +08
PT 478 -34 +85 -16 +197 -158
RO 611 -96 +53 +211 +126 +166
SI 550 -62 +118 +34 +77 -87
SK 538 +46 +41 +28 +176 -36
FI 580 +06 +110 +89 +42 -34
SE 504 -22 -46 +35 +133 -35
IS 559 +92 +07 +55 +119 -
NO 634 +105 -61 +238 +109 -
UK 677 +206 -01 +139 +119 -43
Influence of environmental claims when choosing goodsservices
Consumer Survey 2018
70
Consumersrsquo perception of the impact of environmental claims on purchasing decisions increased
between 2016 and 2018 in the EU27_2019 (+54pp) the North (+21pp) West (+61pp) and South (+113pp) while it decreased in the East (-30pp) Compared to the survey in 2016 the perceived impact of environmental claims on purchasing decisions increased most sharply in Ireland (+225pp) and decreased most prominently in Romania (-96pp)
The largest positive reversal is observed in Greece where between 2016 and 2018 trust in environmental claims on purchasing decisions increased by 190pp whereas between 2014 and 2016 it decreased by 208pp The largest negative reversal is observed in Slovenia where between 2016
and 2018 the perceived impact of environmental claims on purchasing decisions decreased by 62pp following an increase of 118pp between 2014 and 2016
Proportion of agreement with Q5 options 1 2 and 3 - Base all EU27_2019 respondents (N= 24928)
Proportion of agreement with Q5 options 1 2 and 3 - Base all EU27_2019 respondents (N= 24928)
The degree to which claims about the environmental impact of goods and services influence consumers purchasing decisions also depends on socio-demographic variables and other
characteristics
The results show that gender has the closest link with the proportion of consumers who report that
their decisions are affected by claims about environmental impact female consumers more often report that their purchase decisions are influenced than males
Vulnerability in terms of the complexity of offers and terms and conditions is also associated with the reported influence of environmental claims on purchase decisions In particular consumers who are not vulnerable report the influence by environmental claims on their purchase decisions less often than somewhat and very vulnerable consumers
508 594
509 557 A 586 A 566 A
515 A 546 A 571
572 A 558 A 555 A 532 A
545 A 557 A 554 A
446 A 451 A 488 432 A
558 A 553 A 525 A 544 A
GenderMale Female
Influence of environmental claims when choosing goodsservices
Blue collar
Student
65+
Education levelLow Medium High
Age18-34 35-54 55-64
Very easy
UrbanisationRural area Small town Large town
Financial situationVery difficult Fairly difficult Fairly easy
Unemployed Seeking a job RetiredEmployment status
Self-employed Manager Other white collar
527 A 559 B 590 C 561 ABC
524 A 554 A
546 A 541 A 560 A
567 B 580 B 458 A 510 AB 451 A
542 AB 577 B 544 A
597 A 596 A 529
Four or more
Influence of environmental claims when choosing goodsservices
LanguagesOnly native Two
High
Mother tongue
Not official language
in home country
Official language in
home country
Numerical skillsLow Medium
Three
Consumer
vulnerability
(complexity)
Very vulnerableSomewhat
vulnerableNot vulnerable
Hardly ever Never
Consumer
vulnerability
(socio-demographic
factors)
Very vulnerableSomewhat
vulnerableNot vulnerable
Internet useDaily Weekly Monthly
Consumer Survey 2018
71
Age is also associated with this indicator Consumers aged 18-34 reportedly are less likely to have
their purchase decisions be influenced by claims about environmental impact of goods and services than consumers aged 35 and older
Finally highly educated consumers are also more likely to report the influence of environmental claims on their purchase decisions than those with low or medium education
Consumer Survey 2018
72
9 CONSUMER CONFIDENCE IN ONLINE PURCHASES
Low consumer confidence in online transactions is considered a significant barrier to the continued growth of online purchases within the Digital Single Market This chapter reports findings on consumersrsquo overall confidence in domestic and cross-border online purchases
Domestic online purchases
Average proportion of agreement (ldquoStrongly agreerdquo and ldquoAgreerdquo) with Q1717 option 1 - Base all respondents
(N=28037)
17 Q17 How strongly do you agree or disagree with each of the following statements -Strongly agree ndashAgree ndash Disagree ndashStrongly disagree ndash DKNA Q171 You feel confident purchasing goods or services via the internet from retailers or service providers in (our country)
Region
Country
2018
( = sig
diff EU27)
2018-
2016
2016-
2014
2014-
2012
EU27_2019 694 +02 +129 +16
EU28 717 +02 +124 +20
North 772 +56 +65 +23
South 648 +76 +104 +36
East 646 +27 +99 -01
West 738 -73 +171 +10
BE 706 -25 +119 +78
BG 466 +30 +148 -106
CZ 787 +52 +67 +02
DK 850 +17 +56 +01
DE 748 -80 +204 -04
EE 656 +80 +51 +160
IE 848 +04 +113 -05
EL 541 +65 +35 +93
ES 652 +56 +67 +27
FR 696 -106 +161 -01
HR 483 +14 +172 +07
IT 703 +99 +160 +41
CY 499 +70 -15 +96
LV 558 +65 +63 +13
LT 655 +182 +23 +05
LU 808 -12 +110 +29
HU 714 +102 +150 +16
MT 642 +132 +70 +92
NL 806 +04 +99 +44
AT 810 -13 +161 +71
PL 664 -03 +93 -33
PT 434 +42 +20 -18
RO 587 +24 +71 +90
SI 628 +14 +119 -54
SK 713 +72 +80 -17
FI 754 +56 +64 -03
SE 831 +31 +86 +42
IS 793 +14 +69 +93
NO 844 -25 +79 +51
UK 875 +07 +88 +50
Confidence in domestic online shopping
Consumer Survey 2018
73
In the European Union the confidence in domestic online purchases is 694 Compared to the
EU27_2019 average this level is higher in the West (738) and the North (772) and lower in the South (648) and East (646) In the EU27 the highest levels of confidence in domestic online purchases are found in Denmark (850) Ireland (848) and Sweden (831) Furthermore the levels are also high in the UK (875) and Norway (844) The lowest levels of confidence in domestic online purchases are found in Portugal (434) Bulgaria (466) and Croatia (483)
There is no difference between consumersrsquo confidence in domestic online purchases between 2016
and 2018 in the EU27_2019 while this level increased in the East (+27pp) North (+56pp) and South (+76pp) and decreased in the West (-73pp) Compared to the survey in 2016 the level of confidence in domestic online purchases increased most prominently in Lithuania (+182pp) and decreased most prominently in France (-106pp)
When looking at statistically significant changes in 2018 (vs 2016) and in 2016 (vs 2014) no positive reversal is found The largest negative reversal is found in Germany where between 2016
and 2018 this indicator decreased by 80pp following an increase of 204pp in the previous period
Average proportion of agreement (ldquoStrongly agreerdquo and ldquoAgreerdquo) with Q17 option 1 - Base all EU27_2019
respondents (N=24928)
Average proportion of agreement (ldquoStrongly agreerdquo and ldquoAgreerdquo) with Q17 option 1 - Base all EU27_2019
respondents (N=24928)
With regard to socio-demographic variables and other characteristics confidence in domestic online purchases is most closely associated with internet use followed by age financial situation education and numerical skills
710 A 691 A
778 732 660 605
669 A 686 A 728
607 676 722 A 747 A
714 B 699 AB 684 A
446 A 451 A 488 432 A
735 BCD 672 AB 683 ABC 663 A
GenderMale Female
Confidence in domestic online shopping
Blue collar
Student
65+
Education levelLow Medium High
Age18-34 35-54 55-64
Very easy
UrbanisationRural area Small town Large town
Financial situationVery difficult Fairly difficult Fairly easy
Unemployed Seeking a job RetiredEmployment status
Self-employed Manager Other white collar
681 A 720 B 700 AB 698 AB
674 A 701 A
659 693 A 712 A
761 625 C 546 BC 513 AB 430 A
684 A 682 A 713
680 A 704 A 705 A
Four or more
Confidence in domestic online shopping
LanguagesOnly native Two
High
Mother tongue
Not official language
in home country
Official language in
home country
Numerical skillsLow Medium
Three
Consumer
vulnerability
(complexity)
Very vulnerableSomewhat
vulnerableNot vulnerable
Hardly ever Never
Consumer
vulnerability
(socio-demographic
factors)
Very vulnerableSomewhat
vulnerableNot vulnerable
Internet useDaily Weekly Monthly
Consumer Survey 2018
74
Consumers who use the internet daily are the most likely to have confidence in domestic online
shopping followed by those who use it weekly and monthly who in turn are more likely to have confidence in domestic online shopping than those who never use the internet
Consumers aged 18-34 years are most likely to have confidence in domestic online shopping Moreover consumers aged 35-54 years are more likely to have confidence in domestic online shopping than those aged 55-64 years who in turn are more likely than those aged 65+ years
Moreover the proportion of consumers that is confident in domestic online shopping is higher among those in a fairly easy or very easy financial situation than among consumers with a fairly difficult and
very difficult financial situation
Regarding peoplesrsquo education those who are highly educated are more likely to have confidence in domestic online purchases than those with a low or medium level of education
Finally consumers with a high and medium numerical skill level are more likely to have confidence than those with low numerical skills
Consumer Survey 2018
75
Cross-border online purchases
Average proportion of agreement (ldquoStrongly agreerdquo and ldquoAgreerdquo) with Q1718 option 2 - Base all respondents
(N=28037)
In the European Union the overall level of confidence in cross-border online purchases is 465
Compared to the EU27_2019 average this level is higher in the South (499) and North (528) whereas it is lower in the West (444) and East (445)
18 Q17 How strongly do you agree or disagree with each of the following statements -Strongly agree ndashAgree ndash Disagree ndashStrongly disagree ndash DKNA Q172 You feel confident purchasing goods or services via the internet from retailers or service providers in another EU country
Region
Country
2018
( = sig
diff EU27)
2018-
2016
2016-
2014
2014-
2012
EU27_2019 465 -79 +197 +32
EU28 483 -89 +211 +28
North 528 +74 +54 +10
South 499 +72 +65 +49
East 445 +07 +85 +43
West 444 -251 +368 +15
BE 492 -32 +91 +62
BG 310 -40 +72 -137
CZ 501 +45 +68 +47
DK 536 +14 +50 -31
DE 416 -318 +445 +33
EE 476 +58 +56 +119
IE 733 -26 +172 -40
EL 379 +55 -33 +48
ES 511 +49 +34 +44
FR 409 -319 +408 -15
HR 460 +49 +160 -01
IT 537 +100 +111 +65
CY 428 +34 -22 +10
LV 426 +79 +28 -09
LT 509 +189 +05 +00
LU 734 -17 +203 +18
HU 604 +62 +273 +34
MT 653 +97 +37 +09
NL 504 +67 +84 +25
AT 631 -116 +333 -01
PL 418 -14 +52 +86
PT 343 +21 +35 -14
RO 399 -11 +50 +55
SI 480 -12 +111 +17
SK 554 +73 +86 -02
FI 515 +92 +38 -37
SE 565 +63 +86 +53
IS 734 +59 +85 +120
NO 641 -20 +98 +34
UK 605 -159 +310 -00
Confidence in cross-border online shopping
Consumer Survey 2018
76
Between 2016 and 2018 consumer confidence in cross-border online purchases decreased in the
EU27_2019 (-79pp) However this drop is entirely due to the decrease observed in the West (-251pp) while the other EU regions saw either an increase (South +72pp and North +74pp) or a stable situation (East)
In this map values above average are coloured in light and dark green and values below average are coloured in light and dark red
Among the EU countries the highest confidence in cross-border online purchases is found in Luxembourg (734) Ireland (733) and Malta (653) This level is high in Iceland as well (734) The lowest levels of confidence in cross-border online purchases are found in Bulgaria (310) Portugal (343) and Greece (379) Compared to the 2016 survey this type of confidence increased most steeply in Lithuania (+189pp) It decreased most prominently in France (-319pp)
When looking at statistically significant changes in 2018 (vs 2016) and in 2016 (vs 2014) no statistically significant positive reversal is found The largest negative reversal is found in Germany where between 2016 and 2018 this indicator decreased by 318pp following an increase of 445pp between 2014 and 2016
Consumer Survey 2018
77
Average proportion of agreement with Q17 (ldquoStrongly agreerdquo and ldquoAgreerdquo) option 2 - Base all EU27_2019 respondents (N=24928)
Average proportion of agreement with Q17 (ldquoStrongly agreerdquo and ldquoAgreerdquo) option 2 ndash Base all EU27_2019
respondents (N=24928)
Regarding socio-demographic variables and other characteristics confidence in cross-border online purchases is most closely associated with age The characteristics showing the next closest links are internet use gender education and language
Consumers aged 18-34 years report confidence in cross-border online purchases more often than other age groups Moreover consumers aged 35-54 years report confidence more often than those aged 55-64 years who in turn are more likely to have confidence in cross-border online shopping than those aged 65+ years
In addition consumers who use the internet daily report confidence in cross-border online purchases more often than those using the internet weekly or less often In addition a higher proportion of those who use the internet weekly reports being confident than those who never use the internet
Regarding consumersrsquo gender a proportion of males that report confidence in cross-border online purchases is higher than the proportion of females
Highly educated people are also more likely to be confident in such purchases than those with a medium level of education who in turn report confidence more often than those with a low level of
education
Finally confidence in such purchases is more common among consumers who speak at least three languages This proportion is also higher for consumers that speak two languages than for consumers that speak only their native language
510 433
578 491 422 318
416 456 499
404 A 448 A 485 B 504 B
469 A 472 A 470 A
446 A 451 A 488 432 A
551 D 478 ABC 525 CD 434 AB
GenderMale Female
Confidence in cross-border online shopping
Blue collar
Student
65+
Education levelLow Medium High
Age18-34 35-54 55-64
Very easy
UrbanisationRural area Small town Large town
Financial situationVery difficult Fairly difficult Fairly easy
Unemployed Seeking a job RetiredEmployment status
Self-employed Manager Other white collar
429 477 522 A 521 A
430 A 473 A
454 AB 449 A 484 B
505 401 B 337 AB 325 AB 256 A
435 A 440 A 494
411 461 486
Four or more
Confidence in cross-border online shopping
LanguagesOnly native Two
High
Mother tongue
Not official language
in home country
Official language in
home country
Numerical skillsLow Medium
Three
Consumer
vulnerability
(complexity)
Very vulnerableSomewhat
vulnerableNot vulnerable
Hardly ever Never
Consumer
vulnerability
(socio-demographic
factors)
Very vulnerableSomewhat
vulnerableNot vulnerable
Internet useDaily Weekly Monthly
Consumer Survey 2018
78
10 UNFAIR COMMERCIAL PRACTICES
This chapter reports on consumer experiences with encountering unfairillicit commercial practices domestically or cross-border over the past 12 months As in the previous wave the survey presented concrete examples of unfair commercial practices to make them easily recognisable All examples of practices surveyed both unfair and illicit (banned under EU legislation) fall within the scope of the
Unfair Commercial Practices Directive19
Unfair commercial practices from domestic retailers
1011 Exposure to UCPs from domestic retailers
In the European Union the overall level of exposure to unfair commercial practices (UCPs) from domestic retailers is 227 This level is higher in the North (235) East (275) and South (283) whereas it is lower in the West (164)
19 httpeur-lexeuropaeuLexUriServLexUriServdouri=OJL200514900220039ENPDF
Consumer Survey 2018
79
Average incidence of the UCPs mentioned in Q1320 from domestic retailers (answer 1) - Base all respondents
(N=28037)
20 Q13 I will read you some statements about unfair commercial practices After each one please tell me whether you have experienced it during the last 12 monthshellip -Yes with retailers or services providers
located in (our country) -Yes with retailers or services providers located in another EU country -Yes but you donrsquot know in which country the retailers or services providers were located ndashNo ndashDKNA 1 You have been informed you won a lottery you did not know about but you were asked to pay some money in order to collect the prize 2 You have felt pressured by persistent sales calls or messages urging you to buy something or sign a contract 3 You have been offered a product advertised as free of charge which actually entailed charges 4 You have come across advertisements stating that the product was only available for a very limited period of time but you later realised that it was not the case 5 You have come across other unfair commercial practices
Region
Country
2018
( = sig
diff EU27)
2018-
2016
2016-
2014
EU27_2019 227 +47 -57
EU28 224 +61 -69
North 235 -18 +13
South 283 +14 -08
East 275 +02 -40
West 164 +103 -109
BE 173 -10 +19
BG 242 -23 +01
CZ 257 +16 -40
DK 204 -01 +01
DE 156 +113 -89
EE 244 -07 +54
IE 164 +128 -123
EL 359 +28 +18
ES 314 -22 -04
FR 185 +141 -188
HR 358 -49 +33
IT 262 +42 -20
CY 152 -24 -42
LV 267 -16 +18
LT 211 -01 -21
LU 68 +31 -41
HU 255 +40 -87
MT 150 -54 +54
NL 141 -16 -06
AT 117 +85 -86
PL 313 -08 -44
PT 209 +02 +08
RO 215 +15 -53
SI 197 -36 +41
SK 301 +03 -21
FI 256 -41 +38
SE 241 -22 +09
IS 112 -10 +10
NO 197 -07 +07
UK 202 +163 -158
Exposure to unfair commercial practices
from domestic retailers
Consumer Survey 2018
80
In the European Union the overall level of exposure to UCPs from domestic retailers is 227 This level is higher in the North (235) East (275) and South (283) whereas it is lower in the West (164)
In this map values below average are coloured in light and dark green and values above average are coloured
in light and dark red
The highest exposure to UCPs from domestic retailers is found in Greece (359) Croatia (358) and Spain (314) Among the EU countries the lowest levels of exposure to UCPs from domestic retailers are found in Luxembourg (68) Austria (117) and the Netherlands (141) Finally
the level of exposure is also low in Iceland (112)
Between 2016 and 2018 exposure to UCPs from domestic retailers remained stable in the East while it increased in the EU27_2019 (+47pp) the South (+14pp) and West (+103pp) and decreased in the North (-18pp) Among the EU Member States this type of exposure increased most sharply in France (+141 (reflecting a higher exposure to unfair commercial practices from domestic
Consumer Survey 2018
81
retailers) whereas between 2014 and 2016 it decreased by 188pp (ie negative reversal37)
Considering all surveyed countries the UK shows an even stronger increase between 2016 and 2018 (+163) after a noticeable decrease between 2014 and 2016 (-158) Exposure to unfair commercial practices from domestic retailers decreased most prominently in Malta (-54pp) whereas between 2014 and 2016 it increased by 54pp
Average incidence of the UCPs mentioned in Q13 from domestic retailers (answer 1) - Base all EU27_2019
respondents (N=24928)
Average incidence of the UCPs mentioned in Q13 from domestic retailers (answer 1) - Base all EU27_2019
respondents (N=24928)
With regard to socio-demographic variables and other characteristics exposure to UCPs from domestic retailers is associated most closely to consumer vulnerability due to socio-demographic
factors The characteristics showing the next closest links are education consumersrsquo financial situation vulnerability due to the complexity of offers and terms and conditions and internet use
Consumers who are very or somewhat vulnerable in terms of socio-demographic factors are more likely to be exposed to UCPs from domestic retailers than those who are not vulnerable
Regarding consumersrsquo education those with a medium or high level of education are also more likely to experience UCPs from domestic retailers than those with a low level of education
37 For negative indicators such as exposure to unfair commercial practices from domestic retailers the labels for positive and negative reversals are switched to account for the negative valence of the indicator where an increase reflects a change towards the negative
233 A 225 A
224 A 229 AB 243 B 220 A
196 231 A 236 A
263 238 222 A 217 A
229 A 231 A 226 A
446 A 451 A 488 432 A
199 A 227 A 216 A 231 A
GenderMale Female
Exposure to unfair commercial practices from domestic retailers
Blue collar
Student
65+
Education levelLow Medium High
Age18-34 35-54 55-64
Very easy
UrbanisationRural area Small town Large town
Financial situationVery difficult Fairly difficult Fairly easy
Unemployed Seeking a job RetiredEmployment status
Self-employed Manager Other white collar
213 234 A 246 A 244 A
249 A 228 A
228 A 229 A 229 A
242 201 B 195 AB 198 AB 173 A
253 A 252 A 210
258 A 248 A 217
Four or more
Exposure to unfair commercial practices from domestic retailers
LanguagesOnly native Two
High
Mother tongue
Not official language
in home country
Official language in
home country
Numerical skillsLow Medium
Three
Consumer
vulnerability
(complexity)
Very vulnerableSomewhat
vulnerableNot vulnerable
Hardly ever Never
Consumer
vulnerability
(socio-demographic
factors)
Very vulnerableSomewhat
vulnerableNot vulnerable
Internet useDaily Weekly Monthly
Consumer Survey 2018
82
Consumers who consider their financial situation to be very difficult are most likely to report exposure
to such unfair practices In addition consumers with a fairly difficult financial situation report greater exposure than those who consider their situation to be fairly easy or very easy
Furthermore consumers who are very or somewhat vulnerable in terms of the complexity of offers and terms and conditions are also more likely to be exposed to UCPs from domestic retailers than those who are not vulnerable
Finally daily internet users are most likely to be exposed to UCPs from domestic retailers Weekly internet users are also more likely to be exposed to these unfair practices compared to consumers
who never use the internet
1012 Types of UCPs from domestic retailers
Across all types of unfair commercial practices from domestic retailers studied by the current survey persistent sales calls (374) are the most common followed by false limited offers (248) and false free products (199) A noticeable share of consumers also experiences other UCPrsquos (173)
and lottery scams (143)
Consumer Survey 2018
83
Q13 options 1 2 and 3 (answer 1-domestic retailers) Base all respondents (N=28037)
In the European Union the overall level of exposure to lottery scams is 143 In the South and West this level is in line with the EU27_2019 average while it is lower in the North (118) and higher in the East (175) The highest exposure to lottery scams is found in Greece (292) Poland
(260) and Slovakia (199) In the same area the lowest levels of exposure to lottery scams are found in Portugal (38) Cyprus (43) and Luxembourg (44) Moreover this level is lowest in
Iceland (07)
Between 2016 and 2018 exposure to lottery scams increased in the EU27_2019 (+40pp) the South (+19pp) and West (+79pp) while it remained stable in the North and East Compared to the 2016 survey this type of exposure increased most steeply in Germany (+108pp) and decreased most prominently in Latvia (-93pp) When looking at statistically significant changes in 2018 (vs 2016)
and in 2016 (vs 2014) the largest negative reversal is found in France where between 2016 and 2018 this indicator increased by 85pp (reflecting a higher incidence of consumers exposed to lottery scams) whereas between 2014 and 2016 it decreased by 134pp Conversely the largest positive reversal is found in Malta where between 2016 and 2018 this indicator decreased by 69pp
2018
( = sig
diff EU27)
2018-
2016
2016-
2014
2018
( = sig
diff EU27)
2018-
2016
2016-
2014
2018
( = sig
diff EU27)
2018-
2016
2016-
2014
EU27_2019 143 +40 -35 374 +57 -63 199 +35 -57
EU28 137 +43 -36 357 +73 -83 194 +47 -69
North 118 -04 +16 357 -35 +21 238 -34 +16
South 136 +19 +08 585 +38 +09 261 -02 -19
East 175 +07 -51 385 -20 -05 244 +19 -54
West 134 +79 -64 225 +126 -154 128 +80 -95
BE 78 -14 +09 308 -25 +93 163 -11 +09
BG 91 +06 -07 351 -11 +45 240 -15 -02
CZ 163 +19 -53 396 +19 -21 284 +50 -27
DK 142 +44 -43 325 -34 +50 170 -41 +29
DE 154 +108 -36 190 +111 -115 104 +75 -60
EE 64 -29 +62 526 -47 +138 169 +28 +17
IE 93 +65 -05 184 +130 -128 127 +104 -94
EL 292 +28 +44 583 +32 +29 301 +23 +39
ES 119 -29 +16 564 +40 -08 346 -38 -26
FR 128 +85 -134 276 +213 -294 166 +133 -185
HR 141 -34 +06 486 -80 +36 419 -109 +51
IT 141 +62 -06 628 +40 +15 209 +22 -29
CY 43 -32 -11 237 -30 -42 120 -27 -29
LV 93 -93 +60 476 -55 +38 195 +05 +01
LT 91 -15 -39 363 -25 -74 150 -11 +13
LU 44 +13 -05 56 -03 -09 76 +55 -35
HU 61 +18 -62 303 -18 -30 261 +47 -128
MT 83 -69 +93 230 -100 +21 158 -23 +68
NL 137 -09 -10 218 -08 -04 121 -26 -22
AT 80 +50 -33 131 +78 -115 71 +49 -50
PL 260 +20 -43 470 -59 -23 234 +27 -62
PT 38 -19 +08 469 +39 +43 162 -11 -00
RO 111 -16 -92 238 +38 -04 185 +21 -85
SI 123 +03 -16 303 -121 +163 106 -08 +19
SK 199 -18 -61 438 +24 +08 345 +09 +19
FI 115 -40 +64 323 -48 +64 341 -104 +59
SE 124 +15 +25 346 -25 -10 265 -14 -13
IS 07 -08 +10 144 -11 -34 113 +11 +02
NO 109 +22 +26 229 -04 -01 249 -51 +05
UK 98 +63 -42 243 +187 -231 158 +133 -152
Types of unfair commercial practices from domestic retailers
Region
Country
Lottery scams Persistent sales calls False free products
Consumer Survey 2018
84
(reflecting a lower incidence of consumers exposed to lottery scams) following an increase of 93pp
between 2014 and 2016
The overall level of exposure to persistent sales calls is 374 in the European Union In the East this level is in line with the EU27_2019 average while it is lower in the West (225) and North (357) and higher in the South (585) The highest exposure to persistent sales calls is found in Italy (628) Greece (583) and Spain (564) Among the EU countries the lowest levels of exposure to persistent sales calls are found in Luxembourg (56) Austria (131) and Ireland (184) Likewise this level is also low in Iceland (144)
Exposure to persistent sales calls increased in the EU27_2019 (+57pp) the South (+38pp) and West (+126pp) whereas decreases are found in the East (-20pp) and North (-35pp) Compared to the survey in 2016 this type of exposure increased most prominently in France (+213pp) This is also linked to the largest negative reversal where the increase between 2016 and 2018 (reflecting a greater incidence of consumers exposed to such calls) follows a decrease of 294pp between 2014 and 2016 Conversely the most prominent decrease is found in Slovenia (-121pp) which is also
linked to the largest positive reversal The indicator decreased between 2016 and 2018 (reflecting a lower incidence of consumers exposed to such calls) whereas between 2014 and 2016 it increased
by 163pp
The proportion of respondents exposed to false free products in the European Union is 199 It is higher in the North (238) East (244) and South (261) whereas it is lower in the West (128) The highest proportion of respondents exposed to false free products is observed in Croatia (419) Spain (346) and Slovakia (345) The lowest levels of exposure to false free products
are found in Austria (71) Luxembourg (76) and Germany (104)
Compared to 2016 exposure to false free products remained stable in the South while it increased in the EU27_2019 (+35pp) the East (+19pp) and West (+80pp) and decreased in the North (-34pp) Similar to the share of consumers having received persistent sales calls the sharpest increase in exposure to false free products is also found in France (+133pp) which is again linked to the largest negative reversal The increase between 2016 and 2018 (reflecting greater exposure to false free products) was preceded by a decrease of 185pp between 2014 and 2016 The proportion
of respondents exposed to false free products decreased most prominently in Croatia (-109pp) The largest positive reversal is found in Finland where between 2016 and 2018 this indicator decreased by 104pp (reflecting less exposure to false free products) whereas between 2014 and 2016 it increased by 59pp
Consumer Survey 2018
85
Q13 options 1-3 (answer 1-domestic retailers) - Base all EU27_2019 respondents (N=24928)
Male 140 A 361 207 A
Female 147 A 392 195 A
18-34 123 A 354 A 215 A
35-54 139 A 379 AB 209 A
55-64 175 B 388 B 199 A
65+ 148 AB 392 AB 167
Low 126 A 314 186 A
Medium 150 A 377 A 199 A
High 140 A 395 A 206 A
Very difficult 179 B 406 AB 232 B
Fairly difficult 136 A 399 B 207 AB
Fairly easy 140 A 373 A 198 AB
Very easy 153 AB 338 180 A
Rural area 146 A 374 AB 203 A
Small town 147 A 390 B 203 A
Large town 136 A 362 A 195 A
Self-employed 185 B 409 CD 228 CD
Manager 148 AB 432 D 237 D
Other white collar 141 A 364 AB 175 AB
Blue collar 127 A 383 BC 194 BC
Student 145 AB 318 A 152 A
Unemployed 146 AB 357 ABC 229 CD
Seeking a job 138 AB 372 ABCD 219 BCD
Retired 137 A 377 ABC 219 CD
Age groups
Types of unfair commercial practices from
domestic retailers
Lottery scams Persistent sales
calls
False free
products
Gender
Education
Financial Situation
Urbanisation
Employment status
Consumer Survey 2018
86
Q13 options 1-3 (answer 1-domestic retailers) - Base all EU27_2019 respondents (N=24928)
With regard to socio-demographic variables and other characteristics the chance of exposure to lottery scams from domestic retailers is most closely associated with vulnerability due to socio-demographic factors followed by age vulnerability due to the complexity of offers and terms and conditions and employment status
Consumers who are very or somewhat vulnerable in terms of socio-demographic factors are more likely to receive lottery scams from domestic retailers than those who are not vulnerable
Regarding age consumers aged 55-64 reported more exposure to lottery scams from domestic retailers compared to those aged 54 and younger
Consumers who are very vulnerable due to the complexity of offers and terms and conditions are more likely to report receiving lottery scams than consumers who are not vulnerable
As far as consumersrsquo employment status is concerned self-employed consumers are the most likely
to experience lottery scams from domestic retailers and more so than other white collars blue collar workers and retired consumers
In terms of the likelihood of receiving persistent sales calls from domestic retailers this indicator is associated most closely with education Other characteristics with close links are consumer
Only native 137 A 366 A 181
Two 148 A 378 AB 211 A
Three 150 A 399 B 210 A
Four or more 134 A 377 AB 223 A
Not official
language in home
country
170 A 370 A 251
Official language
in home country142 A 377 A 198
Low 141 AB 366 A 227 B
Medium 155 B 366 A 207 AB
High 137 A 385 A 193 A
Daily 153 B 393 B 213 B
Weekly 126 A 347 A 160 A
Monthly 123 AB 291 A 195 AB
Hardly ever 137 AB 333 AB 169 AB
Never 101 A 315 A 151 A
Very vulnerable 161 A 411 A 213 A
Somewhat
vulnerable161 A 393 A 232 A
Not vulnerable 130 359 181
Very vulnerable 167 B 419 A 234 B
Somewhat
vulnerable150 AB 423 A 204 AB
Not vulnerable 136 A 354 195 A
Types of unfair commercial practices from
domestic retailers
Consumer vulnerability
(socio-demographic
factors)
Consumer vulnerability
(complexity)
Persistent sales
calls
False free
products
Languages
Mother Tongue
Numerical skills
Internet use
Lottery scams
Consumer Survey 2018
87
vulnerability due to the complexity of offers and terms and conditions financial situation gender
and vulnerability due to socio-demographic factors
Regarding consumersrsquo level of education consumers with a high- or medium level of education are more likely to receive persistent sales calls from retailers or service providers in their own country than those with a low education level
Consumers who are very or somewhat vulnerable in terms of the complexity of offers and terms and conditions are also more likely to receive such calls than those who are not vulnerable
Furthermore regarding consumersrsquo financial status a better financial situation is linked with less
exposure to persistent sales calls Consumers with a very easy financial situation are less likely to experience such problems than all other consumers Consumers with a fairly easy financial situation are also less likely to experience this type of UCP than consumers with a fairly difficult financial situation
Concerning gender there is a higher proportion of female consumers that received persistent sales calls from domestic retailers than male consumers
Finally consumers who are very or somewhat vulnerable in terms of sociodemographic factors are also more likely to report receiving such calls than those who are not vulnerable
Greater exposure to false offers of free products from domestic retailers is associated most closely with the respondentsrsquo mother tongue The characteristics showing the next closest links are vulnerability due to socio-demographic factors employment status age and the number of languages spoken
Those whose mother tongue does not correspond to one of the official languages of the country or
region they live in are more likely to receive false offers of free products from domestic retailers than those whose mother tongue is an official language
Furthermore consumers who are very or somewhat vulnerable in terms of socio-demographic factors are more likely to receive false offers of free products from retailers in their own country than those who are not vulnerable
Employment status is also linked with the likelihood of receiving false offers for free products with managers being most likely to receive such offers They are also more likely to receive false offers
more than other white collars blue collar workers or students In addition people who are retired self-employed or unemployed also report receiving such offers more than other white collars or students Similarly blue-collar workers or those seeking a job also report this more often than students do
Consumers aged 65 years or older are less likely to report being exposed to false offers for free products from domestic retailers than the remainder of the population
Finally consumers who only speak their native language are less likely to receive false offers of free products from domestic retailers than those who speak two languages or more
Consumer Survey 2018
88
Q13 options 4 and 5 (answer 1-domestic retailers) Base all respondents (N=28037)
The overall consumer exposure to false limited offers in the European Union is 248 In the South this is in line with the EU27_2019 average while it is higher in the North (274) and East (357) and lower in the West (196) The highest exposure to false limited offers is observed in Croatia
(485) Greece (427) and Hungary (413) The lowest levels of exposure to false limited offers are found in Luxembourg (124) the Netherlands (140) and Italy (148)
Compared to 2016 exposure to false limited offers remained stable in the North and South while it increased in the EU27_2019 (+63pp) the East (+17pp) and West (+137pp) Compared to the survey in 2016 this type of exposure increased most sharply in Ireland (+187pp) This increase in the incidence of consumers exposed to false limited offers follows a decrease of 219pp between 2014 and 2016 which makes this the highest negative reversal in the EU27_2019 Considering all
countries of the survey an even higher negative reversal is found in the UK where between 2016 and 2018 this indicator increased by 246pp whereas between 2014 and 2016 it decreased by 232pp The most prominent decrease in exposure to false limited offers is found in Slovenia (-74pp) This is related to the only positive reversal where this decrease was preceded by an increase of 71pp between 2014 and 2016
2018
( = sig
diff EU27)
2018-
2016
2016-
2014
2018
( = sig
diff EU27)
2018-
2016
2016-
2014
EU27_2019 248 +63 -70 173 +38 -59
EU28 254 +86 -91 178 +56 -68
North 274 -14 -03 188 -02 +14
South 239 +09 -26 195 +07 -14
East 357 +17 -33 212 -15 -55
West 196 +137 -131 136 +93 -103
BE 179 -04 +06 139 +03 -19
BG 384 -19 +18 147 -74 -50
CZ 245 +00 -64 196 -06 -38
DK 217 -04 -34 164 +31 +03
DE 211 +165 -138 123 +107 -94
EE 261 -07 +15 200 +21 +40
IE 231 +181 -219 185 +161 -169
EL 427 +30 +19 190 +27 -41
ES 327 -32 +03 218 -51 -04
FR 189 +151 -167 167 +124 -159
HR 485 +08 +49 258 -28 +26
IT 148 +37 -60 183 +51 -19
CY 286 -45 -73 77 +15 -57
LV 394 -07 +50 177 +73 -61
LT 277 +39 -11 174 +04 +04
LU 124 +83 -101 39 +10 -57
HU 413 +153 -178 237 +03 -37
MT 202 -46 +68 76 -32 +19
NL 140 +04 -05 87 -42 +11
AT 209 +169 -159 97 +78 -73
PL 357 -11 -22 243 -15 -69
PT 191 +08 -11 184 -07 +02
RO 357 +34 -21 185 -03 -63
SI 318 -74 +71 137 +19 -32
SK 361 +29 +07 164 -30 -77
FI 285 +05 -04 217 -16 +06
SE 278 -50 +05 192 -35 +40
IS 190 -10 +21 106 -33 +49
NO 242 +02 +00 158 -02 +06
UK 297 +246 -232 214 +186 -133
Types of unfair commercial practices from domestic retailers
Region
Country
False limited offers Other UCPs
Consumer Survey 2018
89
The overall level of exposure to other UCPs in the European Union is 173 This level is higher in
the North (188) South (195) and East (212) whereas it is lower in the West (136) The highest levels of exposure to other UCPs are observed in Croatia (258) Poland (243) and Hungary (237) The lowest levels of exposure to other UCPs are found in Luxembourg (39) Malta (76) and Cyprus (77)
Compared to 2016 exposure to other UCPs remained stable in the North and South while it increased in the EU27_2019 (+38pp) the West (+93pp) and decreased in the East (-15pp) This type of exposure increased most prominently in Ireland (+161pp) and decreased most substantially in
Bulgaria (-74pp) compared to the survey in 2016 When looking at statistically significant changes in 2018 (vs 2016) and in 2016 (vs 2014) the largest negative reversal is also found in Ireland where the increase between 2016 and 2018 by 161pp (reflecting an increase in the incidence of consumers exposed to other UCPs) follows a decrease of 169pp between 2014 and 2016 No statistically significant positive reversal is found
Q13 options 4-5 (answer 1-domestic retailers) - Base all EU27_2019 respondents (N=24928)
Male 264 194
Female 236 155
18-34 269 B 162 A
35-54 249 AB 172 AB
55-64 261 B 193 B
65+ 215 A 178 AB
Low 218 A 132
Medium 255 B 173 A
High 251 AB 187 A
Very difficult 281 B 224
Fairly difficult 268 B 184 A
Fairly easy 235 A 164 A
Very easy 249 AB 166 A
Rural area 251 A 173 A
Small town 245 A 169 A
Large town 255 A 182 A
Self-employed 268 AB 201 BC
Manager 292 B 233 C
Other white collar 242 A 167 A
Blue collar 246 A 173 AB
Student 220 A 162 AB
Unemployed 242 AB 152 A
Seeking a job 163 185 ABC
Retired 269 AB 159 A
Types of unfair commercial practices from
domestic retailers
False limited
offersOther UCPs
Gender
Age groups
Education
Financial Situation
Urbanisation
Employment status
Consumer Survey 2018
90
Q13 options 4-5 (answer 1-domestic retailers) - Base all EU27_2019 respondents (N=24928)
With regard to socio-demographic variables and other characteristics consumersrsquo vulnerability due
to socio-demographic factors is the factor most closely associated with exposure to false limited offers from domestic retailers The characteristics showing the next closest links are employment status gender language and age
Consumers who are very or somewhat vulnerable in terms of socio-demographic factors are more likely to receive false limited offers from domestic retailers than those who are not vulnerable
Regarding consumersrsquo employment status managers are more likely to receive such offers than
other white collars blue collar workers and students In turn the latter three groups as well as
people who are self-employed unemployed or retired are more likely to be exposed to false limited offers from domestic retailers than people seeking a job
As far as gender is concerned males are more likely to report receiving such false limited offers than are females
Consumers who speak only their native language are less likely to report receiving false limited offers than those who speak two or more languages
Only native 219 159 A
Two 267 A 168 A
Three 272 A 203 B
Four or more 258 A 229 B
Not official
language in home
country
265 A 186 A
Official language
in home country249 A 174 A
Low 238 A 170 A
Medium 244 A 176 A
High 255 A 174 A
Daily 264 B 187 C
Weekly 223 A 146 B
Monthly 185 A 183 BC
Hardly ever 215 AB 134 ABC
Never 186 A 112 A
Very vulnerable 284 A 198 A
Somewhat
vulnerable275 A 201 A
Not vulnerable 228 154
Very vulnerable 252 AB 222 A
Somewhat
vulnerable271 B 194 A
Not vulnerable 243 A 157
False limited
offersOther UCPs
Consumer vulnerability
(complexity)
Types of unfair commercial practices from
domestic retailers
Languages
Mother Tongue
Numerical skills
Internet use
Consumer vulnerability
(socio-demographic
factors)
Consumer Survey 2018
91
Age is also linked to exposure to false limited offers from domestic retailers but not in a linear
manner For consumers aged 18-34 years and 55-64 years a higher proportion has received this UCP than for those aged 65+ years
In terms of exposure to other UCPs from domestic retailers this indicator is associated most closely to gender followed by consumersrsquo language skills vulnerability due to the complexity of offers and terms and conditions education and vulnerability due to socio-demographic factors
Regarding consumersrsquo gender males are more likely to be exposed to other UCPs from domestic retailers than females
Those who speak at least three languages report being more exposed to such practices than those who speak two languages or only their native language
Consumers who are very or somewhat vulnerable in terms of the complexity of offers and terms and conditions are also likely to experience other UCPs from retailers in their own country than those who are not vulnerable
Additionally consumers with a low level of education are less likely to report being exposed to other
UCPs than consumers with a medium or high education level
Finally consumers who are very or somewhat vulnerable in terms of socio-demographic factors are also more likely to be exposed to other UCPs from domestic retailers than those who are not vulnerable
Consumer Survey 2018
92
Unfair commercial practices from cross-border retailers
1021 Exposure to UCPs from cross-border retailers
Average incidence of the UCPs mentioned in Q13 from cross-border retailers (answer 2) - Base all
respondents (N=28037)
In the European Union the overall level of exposure to UCPs from cross-border retailers is 48 Compared to the EU27_2019 average this level is higher in the West (53) North (53) and South (56) whereas it is lower in the East (24)
Compared to 2016 exposure to UCPs from cross-border retailers remained stable in the East while
it increased in the EU27_2019 (+24pp) the North (+08pp) South (+29pp) and West (+36pp)
Region
Country
2018
( = sig
diff EU27)
2018-
2016
2016-
2014
EU27_2019 48 +24 -14
EU28 50 +28 -17
North 53 +08 -03
South 56 +29 +03
East 24 -00 +01
West 53 +36 -35
BE 85 -00 +19
BG 15 +07 -06
CZ 35 +10 -01
DK 67 +18 -12
DE 52 +39 -23
EE 30 +08 -01
IE 113 +97 -84
EL 28 +17 -13
ES 49 +18 -03
FR 47 +37 -59
HR 42 +11 +06
IT 74 +45 +12
CY 43 +26 -26
LV 37 +16 -23
LT 30 +11 -00
LU 81 +53 -104
HU 11 +03 -08
MT 94 +01 +34
NL 22 -07 -00
AT 95 +85 -85
PL 27 -08 +02
PT 11 -02 -06
RO 18 +05 +04
SI 35 -16 +23
SK 30 -04 -05
FI 44 +11 -09
SE 63 -03 +08
IS 33 +18 -10
NO 65 -02 +14
UK 68 +54 -36
Exposure to unfair commercial practices
from cross-border retailers
Consumer Survey 2018
93
In this map values below average are coloured in light and dark green and values above average are coloured
in light and dark red
The highest exposure to UCPs from cross-border retailers is found in Ireland (113) Austria (95)
and Malta (94) The lowest levels of exposure are found in Portugal Hungary (both 11) Bulgaria (15) and Romania (18) Compared to the 2016 survey this type of exposure increased most sharply in Ireland (+97pp) and decreased most prominently in Slovenia (-16pp) When looking at statistically significant changes in 2018 (vs 2016) and in 2016 (vs 2014) the largest
negative reversal is also found in Ireland where the increase of this indicator between 2016 and 2018 (reflecting greater exposure to UCPs) follows a decrease of 84pp between 2014 and 2016
(reflecting lower exposure to UCPs) Similarly the only negative reversal is also found in Slovenia where the decrease between 2016 and 2018 follows an increase of 23pp between 2014 and 2016 (reflecting greater exposure to UCPs)
Consumer Survey 2018
94
Average incidence of the UCPs mentioned in Q13 from cross-border retailers (answer 2) - Base all EU27_2019
respondents (N=24928)
Average incidence of the UCPs mentioned in Q13 from cross-border retailers (answer 2) - Base all EU27_2019
respondents (N=24928)
With regard to socio-demographic variables and other characteristics the number of languages consumers speak is the factor most closely associated with exposure to UCPs from cross-border retailers The characteristics showing the next closest links are employment status age and vulnerability due to the complexity of offers and terms and conditions and education
Consumers who speak four or more languages are more likely to be exposed to UCPs from cross-border retailers than the remainder of the population Those who speak three languages are also more likely to be exposed to these UCPs than those who only speak their native language
Regarding employment status self-employed consumers are more likely exposed to UCPs from cross-border retailers than others In contrast unemployed respondents are the least likely to be exposed to UCPs from cross-border retailers They are less likely to experience such UCPs than managers other white collars blue collar workers the retired and as indicated earlier self-employed
consumers
Concerning consumersrsquo age those who are aged 18-34 years report being exposed to such UCPs more compared to respondents aged 35 or older
Consumers who are more vulnerable in terms of the complexity of offers and terms and conditions also report greater exposure to UCPs from cross-border retailers Specifically those who are very vulnerable and somewhat vulnerable report exposure more than those who are not vulnerable
Finally the proportion of consumers that experienced UCPs from retailers in other EU-countries is higher among those with a low level of education than those with a medium or high level of education
51 45
61 43 A 44 A 45 A
39 49 A 49 A
57 AB 52 B 45 A 51 AB
54 46 A 46 A
67 52 BC 51 C 42 B
39 AB 31 A 38 AB 46 BC
GenderMale Female
Exposure to unfair commercial practices from cross-border retailers
Blue collar
Student
65+
Education levelLow Medium High
Age18-34 35-54 55-64
Very easy
UrbanisationRural area Small town Large town
Financial situationVery difficult Fairly difficult Fairly easy
Unemployed Seeking a job RetiredEmployment status
Self-employed Manager Other white collar
42 A 48 AB 52 B 68
57 A 48 A
45 A 50 A 48 A
52 B 38 A 47 AB 29 A 27 A
48 AB 55 B 45 A
59 A 54 A 44
Four or more
Exposure to unfair commercial practices from cross-border retailers
LanguagesOnly native Two
High
Mother tongue
Not official language
in home country
Official language in
home country
Numerical skillsLow Medium
Three
Consumer
vulnerability
(complexity)
Very vulnerableSomewhat
vulnerableNot vulnerable
Hardly ever Never
Consumer
vulnerability
(socio-demographic
factors)
Very vulnerableSomewhat
vulnerableNot vulnerable
Internet useDaily Weekly Monthly
Consumer Survey 2018
95
1022 Types of UCPs from cross-border retailers
Respondents are relatively less likely to experience UCPs from cross-border retailers than from domestic retailers (see previous section) Persistent sales calls (60) are the most common unfair practices followed by lottery scams (52) and false limited offers (51) Other UCPs and false free products are experienced by 51 and 35 of all consumers respectively
Q13 options 1 2 and 3 (answer 2-cross-border retailers) Base all respondents (N=28037)
In the European Union the overall level of exposure to cross-border lottery scams is 52
Compared to the EU27_2019 average this level is higher in the West (70) and North (77) whereas it is lower in the East (21) and South (43) The highest exposure to cross-border lottery scams is found in Malta (208) Austria (133) and Ireland (132) The lowest levels of exposure are found in Hungary (03) Portugal (08) and Bulgaria (09)
2018
( = sig
diff EU27)
2018-
2016
2016-
2014
2018
( = sig
diff EU27)
2018-
2016
2016-
2014
2018
( = sig
diff EU27)
2018-
2016
2016-
2014
EU27_2019 52 +27 -25 60 +31 -12 35 +16 -10
EU28 52 +28 -28 60 +33 -15 39 +20 -10
North 77 +09 -22 32 +02 +05 46 +09 -02
South 43 +22 -04 91 +45 +17 43 +22 -00
East 21 -05 +01 18 -07 +05 16 +02 -06
West 70 +48 -55 64 +44 -44 37 +20 -20
BE 85 -27 +24 107 -05 +33 77 -17 +39
BG 09 +03 -09 15 +09 -03 13 +08 -03
CZ 46 +09 +11 31 +08 +05 32 +16 -15
DK 118 +27 -41 54 +14 +07 54 +09 -07
DE 71 +59 -35 57 +43 -34 28 +16 -06
EE 44 +09 -29 29 +06 +13 19 +11 -01
IE 132 +101 -161 79 +61 -39 113 +104 -65
EL 25 +14 -14 21 +11 -04 24 +11 -11
ES 32 +21 -13 42 +01 +10 44 +11 -05
FR 59 +49 -90 71 +58 -71 39 +29 -49
HR 44 -04 +07 19 +07 -10 44 +23 +14
IT 59 +29 +08 155 +93 +29 51 +36 +07
CY 60 +33 -54 36 +30 -18 45 +28 -26
LV 48 +25 -78 35 +15 -14 28 +16 -04
LT 26 -04 +09 29 +12 +05 32 +18 -05
LU 99 +65 -169 91 +43 -107 65 +48 -101
HU 03 -07 -10 07 +02 -07 08 -01 -01
MT 208 +11 +48 53 -13 +21 90 +34 +28
NL 45 -17 -06 12 -05 +03 14 -07 +06
AT 133 +128 -128 106 +101 -118 68 +57 -35
PL 18 -10 -02 19 -23 +14 11 -05 -13
PT 08 -03 -17 12 +00 -01 08 -01 -06
RO 17 +01 +09 13 -00 +06 13 +02 +03
SI 43 -48 +50 15 -01 -01 18 +04 -06
SK 30 -01 -17 28 -02 -12 30 -04 -06
FI 60 +10 -28 17 +07 -03 43 +07 -14
SE 88 -03 -04 30 -13 +12 55 +06 +09
IS 23 -05 -32 12 +11 -01 41 +23 +02
NO 95 -01 -10 38 +06 +05 47 -25 +31
UK 55 +40 -43 62 +48 -40 67 +50 -11
Types of unfair commercial practices from cross-border retailers
Region
Country
Lottery scams Persistent sales calls False free products
Consumer Survey 2018
96
Between 2016 and 2018 exposure to cross-border lottery scams remained stable in the East and
North while it increased in the EU27_2019 (+27pp) the South (+22pp) and West (+48pp) Compared to the survey administered in 2016 this type of exposure increased most sharply in Austria (+128pp) and decreased most prominently in Slovenia (-48pp) When looking at statistically significant changes in 2018 (vs 2016) and in 2016 (vs 2014) the largest negative reversal is found in Ireland where between 2016 and 2018 this indicator increased by 101pp (reflecting a higher likelihood of being exposed to such scams) whereas between 2014 and 2016 it decreased by 161pp (reflecting a lower likelihood of being exposed to such scams) The only positive reversal is found in
Slovenia (which also showed the strongest decrease) where between 2016 and 2018 this indicator decreased by 48pp following an increase of 50pp between 2014 and 2016
The overall consumer exposure to persistent sales calls by cross-border retailers in the European Union is 60 In the West this level is in line with the EU27_2019 average while it is higher in the South (91) and lower in the East (18) and North (32) The highest exposure to these types of calls is found in Italy (155) Belgium (107) and Austria (106) Among the EU countries
the lowest levels of exposure are found in Hungary (07) the Netherlands and Portugal (both 12) and Romania (13) The level is low as well in Iceland (12)
Between 2016 and 2018 exposure to persistent sales calls by cross-border retailers remained stable in the North while it increased in the EU27_2019 (+31pp) the West (+44pp) and South (+45pp) and decreased in the East (-07pp) Compared to the survey administered in 2016 this type of exposure increased most prominently in Austria (+101pp) and decreased most prominently in Poland (-23pp) When looking at statistically significant changes in 2018 (vs 2016) and in 2016 (vs
2014) the largest negative reversal is also found in Austria where the increase between 2016 and 2018 (reflecting a higher likelihood of being exposed to such calls) was preceded by a decrease of 118pp between 2014 and 2016 No statistically significant negative reversal is found
The overall consumer exposure to false free products by cross-border retailers is 35 in the European Union In the West this level is in line with the EU27_2019 average while it is higher in the South (43) and North (46) and lower in the East (16) The highest exposure to this type of practice is found in Ireland (113) Malta (90) and Belgium (77) The lowest levels of
exposure are found in Hungary and Portugal (both 08) Poland (11) and Bulgaria and Romania (both 13)
Between 2016 and 2018 consumer exposure to false free products by cross-border retailers remained stable in the East while it increased in the EU27_2019 (+16pp) the North (+09pp) West
(+20pp) and South (+22pp) Compared to the survey administered in 2016 this type of exposure increased most sharply in Ireland (+104pp) When looking at statistically significant changes in 2018
(vs 2016) and in 2016 (vs 2014) the largest negative reversal is also found in Ireland where the increase between 2016 and 2018 (reflecting a higher likelihood of being exposed to false free products) was preceded by a decrease of 65pp between 2014 and 2016 There are no statistically significant decreases amongst the EU Member States and no positive reversals Considering all studied countries the only statistically significant decrease and positive reversal is found in Norway (-25pp) where between 2016 and 2018 this indicator decreased by 25pp (reflecting a lower likelihood of being exposed to false free products) following an increase of 31pp between 2014 and
2016
Consumer Survey 2018
97
Q13 options 1 and 3 (answer 2-cross-border retailers) - Base all EU27_2019 respondents (N=24928)
Male 57 A 58 A 38 A
Female 47 A 63 A 32 A
18-34 51 A 71 B 52 B
35-54 52 A 54 A 29 A
55-64 58 A 59 AB 24 A
65+ 47 A 64 AB 36 AB
Low 41 A 47 A 28 A
Medium 51 A 61 A 35 A
High 55 A 64 A 37 A
Very difficult 54 A 58 AB 45 AB
Fairly difficult 55 A 75 B 42 B
Fairly easy 49 A 56 A 31 A
Very easy 55 A 54 A 34 AB
Rural area 55 A 74 B 41 A
Small town 52 A 59 AB 34 A
Large town 49 A 49 A 32 A
Self-employed 78 D 86 C 46 B
Manager 53 BC 53 AB 39 AB
Other white collar 58 CD 67 BC 32 AB
Blue collar 41 AB 53 AB 37 AB
Student 29 A 35 A 28 AB
Unemployed 25 A 37 A 24 A
Seeking a job 28 A 53 ABC 41 AB
Retired 55 BCD 62 BC 36 AB
Age groups
Types of unfair commercial practices from
cross-border retailers
Lottery scams Persistent sales
calls
False free
products
Gender
Education
Financial Situation
Urbanisation
Employment status
Consumer Survey 2018
98
Q13 options 1 and 3 (answer 2-cross-border retailers) - Base all EU27_2019 respondents (N=24928)
Regarding socio-demographic variables and other characteristics consumer exposure to lottery scams from cross-border retailers is associated most closely with employment status followed by the number of languages consumers speak
Regarding consumersrsquo employment status self-employed consumers are most likely to be exposed
to lottery scams from cross-border retailers They experience such scams more often than all other consumers except for other white collars and the retired In contrast students those who are unemployed and jobseekers are the least likely to be exposed to this UCP and less so than the self-employed managers other white collars or the retired
Concerning the consumersrsquo language skills those who speak only their native language are less likely to be exposed to such scams than those who speak two or more languages
With regards to receiving persistent sales calls from cross-border retailers whether a
consumerrsquos mother tongue is the official language in their country of residence or not is the factor most closely associated with this indicator The characteristics showing the next closest links are vulnerability due to the complexity of offers and terms and conditions employment status the degree of urbanisation and age
Only native 42 59 A 28 A
Two 55 A 58 A 37 AB
Three 57 A 67 A 38 AB
Four or more 68 A 76 A 50 B
Not official
language in home
country
64 A 99 26 A
Official language
in home country51 A 59 36 A
Low 46 A 45 A 33 A
Medium 58 A 63 A 36 A
High 50 A 62 A 35 A
Daily 57 B 61 A 40 B
Weekly 33 A 68 A 24 A
Monthly 55 AB 95 A 33 AB
Hardly ever 43 AB 51 A 15 A
Never 28 A 46 A 12 A
Very vulnerable 48 A 58 A 43 A
Somewhat
vulnerable61 A 64 A 36 A
Not vulnerable 49 A 60 A 33 A
Very vulnerable 60 A 78 A 46 A
Somewhat
vulnerable59 A 79 A 36 A
Not vulnerable 48 A 51 33 A
Types of unfair commercial practices from
cross-border retailers
Consumer vulnerability
(socio-demographic
factors)
Consumer vulnerability
(complexity)
Persistent sales
calls
False free
products
Languages
Mother Tongue
Numerical skills
Internet use
Lottery scams
Consumer Survey 2018
99
Consumers whose mother tongue is not one of the official languages of the country or region in which
they live are more likely to report receiving persistent sales calls from cross-border retailers than those whose mother tongue is not an official language
Consumers who are very or somewhat vulnerable due to the complexity of offers and terms and conditions are also more likely to report receiving persistent cross-border sales calls than those who are not vulnerable
Regarding consumersrsquo employment status those who are self-employed are more likely to receive such calls than managers blue collar workers students and people who are unemployed Other white
collars and those who are retired are also more likely to report this than students and the unemployed
Persons that live in a rural area are more likely to report receiving such calls compared to those living in a large town
As far as age is concerned those aged 18-34 years are more likely to receive cross-border persistent sales calls than those aged 35-54 years Consumers aged 55 years and older do not differ from
younger consumers
Regarding exposure to false offers of free products from cross-border retailers this indicator is associated most closely with age followed by the number of languages spoken and employment status
Young consumers (aged 18-34 years) are more likely to report receiving false offers for free products from retailers in another EU country than those aged 35-64 years Those aged 65 years or older do not differ from other age groups
Consumers who speak at least four languages are more likely to be exposed to cross-border false free offers compared to those who only speak their native language
Finally those who are self-employed are more likely to report receiving such offers than those who are unemployed
Consumer Survey 2018
100
Q13 options 4 and 5 (answer 2-cross-border retailers) Base all respondents (N=28037)
The overall consumer exposure to false limited offers in the European Union is 51 In the North
and West this level is in line with the EU27_2019 average while it is higher in the South (62)
and lower in the East (41) The highest exposure to this type of practice is found in Ireland (130) Luxembourg (111) and Austria (101) The lowest exposure is found in the Netherlands (16) Portugal (18) and Bulgaria (23)
Between 2016 and 2018 consumer exposure to false limited offers by cross-border retailers increased in the EU27_2019 (+26pp) the North (+11pp) West (+34pp) and South (+35pp) while it remained stable in the East Compared to the survey administered in 2016 this type of
exposure increased most prominently in Ireland (+113pp) where also the highest negative reversal is observed The increase between 2016 and 2018 (reflecting higher consumer exposure to false limited offers) came after a decrease of 64pp between 2014 and 2016
2018
( = sig
diff EU27)
2018-
2016
2016-
2014
2018
( = sig
diff EU27)
2018-
2016
2016-
2014
EU27_2019 51 +26 -04 42 +22 -18
EU28 54 +31 -10 46 +28 -21
North 55 +11 +02 54 +08 +01
South 62 +35 +07 43 +22 -05
East 41 +01 +08 25 +07 -05
West 48 +34 -19 48 +32 -38
BE 77 +24 +13 79 +24 -15
BG 23 +09 -07 13 +07 -09
CZ 42 +10 -01 22 +06 -04
DK 46 +17 -16 63 +21 -04
DE 56 +46 -14 48 +34 -26
EE 30 +04 +04 28 +12 +08
IE 130 +113 -64 114 +106 -89
EL 40 +21 -19 28 +25 -18
ES 79 +34 +08 48 +25 -14
FR 27 +16 -24 41 +32 -59
HR 70 +15 +20 34 +13 +01
IT 59 +44 +12 47 +25 +03
CY 62 +32 -16 14 +07 -14
LV 42 +04 -13 30 +19 -07
LT 40 +17 +00 20 +11 -10
LU 111 +88 -64 36 +20 -80
HU 26 +15 -13 12 +07 -10
MT 85 -01 +31 36 -24 +41
NL 16 -04 -03 24 -04 -01
AT 101 +86 -84 66 +51 -58
PL 49 -11 +13 36 +07 -03
PT 18 +06 -05 09 -10 +02
RO 30 +10 +10 15 +12 -09
SI 80 -36 +67 22 -03 +04
SK 44 +03 +06 20 -14 +04
FI 50 +19 +08 52 +13 -06
SE 72 +05 +14 69 -07 +11
IS 40 +25 -04 51 +35 -15
NO 60 -14 +41 87 +25 +02
UK 79 +67 -50 77 +66 -36
Types of unfair commercial practices from cross-border retailers
Region
Country
False limited offers Other UCPs
Consumer Survey 2018
101
Exposure to false limited offers decreased most prominently in Slovenia (-36pp) In addition when
looking at statistically significant changes in 2018 (vs 2016) and in 2016 (vs 2014) the only positive reversal is also found in Slovenia where this indicator increased by 67pp between 2014 and 2016 (reflecting higher consumer exposure to such offers) before it decreased between 2016 and 2018
In the European Union the overall consumer exposure to other cross-border UCPs is 42 In the South this indicator is in line with the EU27_2019 average while it is higher in the West (48) and North (54) and lower in the East (25) Among the EU countries the highest exposure to other cross-border UCPs is found in Ireland (114) Belgium (79) and Sweden (69) Of all studied
countries exposure to other cross-border UCPs is high in the UK (77) and Norway (87) as well The lowest values for this indicator are found in Portugal (09) Hungary (12) and Bulgaria (13)
Between 2016 and 2018 exposure to other cross-border UCPs increased in the EU27_2019 (+22pp) and all the regions (East +07pp North +08pp South +22pp West +32pp) Compared to the survey administered in 2016 the strongest increase in exposure to other UCPs from cross-border
retailers as well as the largest negative reversal is found in Ireland where between 2016 and 2018 this indicator increased by 106pp (reflecting higher consumer exposure to other cross-border UCPs)
whereas between 2014 and 2016 it decreased by 89pp Consumersrsquo exposure to other UCPs from cross-border retailers decreased most prominently in Portugal (-10pp) No statistically significant negative reversal is found
Consumer Survey 2018
102
Q13 options 4 and 5 (answer 2-cross-border retailers) - Base all EU27_2019 respondents (N=24928)
Male 57 47
Female 46 36
18-34 77 51 B
35-54 44 A 36 A
55-64 44 A 37 AB
65+ 32 A 45 AB
Low 46 A 31 A
Medium 55 A 42 A
High 48 A 43 A
Very difficult 73 A 61 AB
Fairly difficult 50 A 38 AB
Fairly easy 49 A 39 A
Very easy 56 A 53 B
Rural area 53 A 48 B
Small town 49 A 36 A
Large town 53 A 44 AB
Self-employed 67 D 59 B
Manager 61 CD 49 AB
Other white collar 57 CD 43 AB
Blue collar 38 AB 41 AB
Student 55 BCD 41 AB
Unemployed 38 ABC 29 A
Seeking a job 29 A 35 AB
Retired 45 ABCD 33 A
Types of unfair commercial practices from
cross-border retailers
False limited
offersOther UCPs
Gender
Age groups
Education
Financial Situation
Urbanisation
Employment status
Consumer Survey 2018
103
Q13 options 4 and 5 (answer 2-cross-border retailers) - Base all EU27_2019 respondents (N=24928)
With regard to socio-demographic variables and other characteristics age is the factor most closely
associated with consumersrsquo exposure to false limited offers from cross-border retailers followed by gender employment status and language
Younger consumers (18-34 years) are more likely to report receiving false limited offers from cross-border retailers than those aged 35 or older
As far as gender is concerned male consumers are more likely to receive cross-border false limited offers than females
Regarding consumersrsquo employment status consumers who are self-employed report being exposed
to this UCP most often Their exposure is higher than the exposure for blue collar job workers jobseekers or those who are unemployed The proportion of people reporting this is also higher among managers and other white collars than it is among blue collar workers and jobseekers Students likewise report this more than people seeking a job
Only native 46 A 34 A
Two 51 AB 41 A
Three 51 AB 45 A
Four or more 73 B 73
Not official
language in home
country
39 A 61 A
Official language
in home country52 A 41 A
Low 46 A 57 A
Medium 56 A 37 A
High 50 A 42 A
Daily 56 C 46 B
Weekly 32 B 30 AB
Monthly 34 ABC 19 A
Hardly ever 08 A 20 A
Never 30 B 19 A
Very vulnerable 46 A 46 AB
Somewhat
vulnerable63 53 A
Not vulnerable 47 A 36 B
Very vulnerable 61 A 51 A
Somewhat
vulnerable56 A 40 A
Not vulnerable 48 A 42 A
False limited
offersOther UCPs
Consumer vulnerability
(complexity)
Types of unfair commercial practices from
cross-border retailers
Languages
Mother Tongue
Numerical skills
Internet use
Consumer vulnerability
(socio-demographic
factors)
Consumer Survey 2018
104
Finally consumers who speak four or more languages are more likely to be exposed to false limited
offers than those speaking only their native language
Higher exposure to other UCPs from cross-border retailers is associated most closely to the number of languages spoken followed by the consumersrsquo gender internet use urbanisation and age
Consumers who speak at four languages or more are more likely to be exposed to such practices than consumers who speak fewer languages
Concerning gender males are more likely to report being exposed to such practices than females
Consumers who use the internet daily are also more likely to report having greater exposure to other UCPs from cross-border retailers compared to those who use the internet monthly or less
Consumers from rural areas are more likely to report exposure to other UCPs from cross-border retailers than consumers from small towns
Finally regarding the consumersrsquo age exposure is reported more often by those who are aged 18-34 years than those aged 35-54 years
Consumer Survey 2018
105
Other illicit commercial practices from domestic retailers
1031 Exposure to other illicit commercial practices from domestic retailers
The average exposure to illicit commercial practices from domestic retailers (Q16a_121 and Q16a_2 answer
option 1 and Q16b_1 and Q16b_2 answer option 1) ndash Base All respondents (N=28037)
21 Q16a Now I will read you some statements about problems consumers may have more generally when shopping Please tell me whether you have experienced any of them during the last 12 monthshellip -Yes with retailers or services providers located in (our country) -Yes with retailers or services providers located in another EU country -Yes but you donrsquot know in which country the retailers or services providers were located -No -DKNA
Q16a1 You have encountered unfair terms and conditions in a contract (for instance enabling the provider to change the contract terms unilaterally or imposing excessive penalties for breach of the contract) Q16a2 You have had to pay unanticipated extra charges Q16b Now I will read you some statements about problems consumers may have more generally when shopping Please tell me whether you have experienced any of them when buying in (our country) during the last 12 monthshellip -Yes ndashNo ndashDKNA Q16b1 You have encountered unfair terms and conditions in a contract (for instance enabling the provider to change the contract terms unilaterally or imposing excessive penalties for breach of the contract) Q16b2 You have had to pay unanticipated extra charges
Region
Country
2018
( = sig
diff EU27)
2018-
2016
2016-
2014
EU27_2019 106 +16 -38
EU28 112 +31 -47
North 90 -09 +15
South 141 +17 -39
East 122 -19 -33
West 76 +38 -48
BE 96 -08 -02
BG 190 -27 -34
CZ 78 -01 -19
DK 78 -02 +17
DE 63 +30 -33
EE 110 +07 +15
IE 151 +118 -138
EL 210 +94 -73
ES 121 -28 -31
FR 95 +69 -81
HR 211 -31 +06
IT 152 +39 -44
CY 74 +11 -37
LV 150 -11 -07
LT 105 +11 -33
LU 53 +32 -29
HU 124 -25 -49
MT 118 -61 +62
NL 50 -21 -01
AT 44 +23 -54
PL 106 -20 -29
PT 102 +08 -21
RO 144 -13 -50
SI 78 -18 +03
SK 99 -39 -42
FI 74 -07 +23
SE 87 -22 +30
IS 103 -33 +29
NO 67 -18 -07
UK 156 +134 -111
Exposure to other illicit commercial
practices from domestic retailers
Consumer Survey 2018
106
In the European Union the overall consumer exposure to other illicit commercial practices from
domestic retailers is 106 Compared to the EU27_2019 average this indicator is higher in the East (122) and South (141) whereas it is lower in the West (76pp) and North (90) The highest exposure to other illicit commercial practices from domestic retailers is found in Croatia (211) Greece (210) and Bulgaria (190) The lowest exposure to such practices is found in Austria (44) the Netherlands (50) and Luxembourg (53)
Between 2016 and 2018 consumer exposure to other illicit commercial practices from domestic retailers increased in the EU27_2019 (+16pp) the South (+17pp) and West (+38pp) whereas it
decreased in the North (-09pp) and East (-19pp) Compared to the 2016 survey this type of exposure increased most sharply in Ireland where also the largest negative reversal is found In this country between 2016 and 2018 the indicator increased by 118pp (reflecting higher consumer exposure to other illicit commercial practices) whereas between 2014 and 2016 it decreased by 138pp The largest decrease and positive reversal are found in Malta where between 2016 and 2018 this indicator decreased by 61pp (reflecting lower consumer exposure to other illicit
commercial practices) following an increase of 62pp between 2014 and 2016
Consumer Survey 2018
107
1032 Types of other illicit commercial practices from domestic retailers
When it comes to other illicit commercial practices experienced from domestic retailers consumers are somewhat more likely to face unfair terms and conditions (119) than unanticipated extra charges (93)
Percentage of ldquoYesrdquo responses in Q16a_1 and Q16b_1 answer option 1 and in Q16a_2 and Q16b_1 answer
option 1 ndash Base All respondents (N=28037)
In the European Union the overall consumer exposure to unfair contract terms and conditions from domestic retailers is 119 Compared to the EU27_2019 average this level is higher in the East (132) and South (182) whereas it is lower in the West (73) and North (85) The
highest consumer exposure to unfair contract terms and conditions from domestic retailers is found in Croatia (226) Greece (212) and Bulgaria (206) The lowest consumer exposure to such practices is found in Austria (44) Luxembourg (46) and the Netherlands (49)
2018
( = sig
diff EU27)
2018-
2016
2016-
2014
2018
( = sig
diff EU27)
2018-
2016
2016-
2014
EU27_2019 119 +21 -45 93 +11 -32
EU28 123 +35 -54 102 +26 -41
North 85 -11 +13 95 -08 +18
South 182 +31 -43 100 +03 -36
East 132 -27 -36 113 -12 -30
West 73 +44 -58 78 +32 -37
BE 92 +13 -13 99 -29 +09
BG 206 -50 -32 175 -05 -35
CZ 97 -07 -24 60 +04 -14
DK 55 -01 +15 102 -03 +20
DE 65 +42 -40 60 +17 -25
EE 122 +08 +16 99 +06 +14
IE 143 +120 -172 158 +116 -105
EL 212 +104 -71 208 +85 -74
ES 171 -32 -41 71 -24 -21
FR 85 +62 -99 106 +77 -62
HR 226 -42 +05 196 -19 +08
IT 197 +68 -42 106 +10 -45
CY 65 +14 -42 84 +09 -32
LV 147 -14 -24 152 -08 +10
LT 112 +09 -31 97 +12 -36
LU 46 +30 -36 61 +34 -22
HU 174 +09 -55 74 -58 -44
MT 110 -72 +79 125 -50 +44
NL 49 -09 +13 51 -34 -15
AT 44 +25 -67 44 +21 -40
PL 93 -39 -37 120 -02 -21
PT 122 +22 -31 81 -05 -10
RO 163 -12 -42 125 -14 -59
SI 82 -21 +12 75 -16 -07
SK 132 -53 -57 67 -26 -27
FI 86 -13 +20 61 -01 +26
SE 75 -23 +28 99 -22 +32
IS 73 -18 -01 134 -49 +60
NO 53 -03 -02 80 -34 -11
UK 152 +136 -119 160 +132 -103
Exposure to other illicit commercial practices from domestic retailers
Region
Country
Unfair terms and conditions Unanticipated extra charges
Consumer Survey 2018
108
Compared to 2016 exposure to unfair contract terms and conditions from domestic retailers
increased in the EU27_2019 (+21pp) in the South (+31pp) and West (+44pp) while it decreased in the North (-11) and the East (-27) Exposure to unfair contract terms increased most sharply in Ireland where also the largest negative reversal is found In this country between 2016 and 2018 the indicator increased by 120pp (reflecting higher consumer exposure to unfair contract terms and conditions) whereas between 2014 and 2016 it decreased by 172pp
In contrast in Malta exposure to unfair contract terms decreased most prominently which also represents the only positive reversal Between 2016 and 2018 this indicator decreased by 72pp
(reflecting a development towards a lower consumer exposure to unfair contract terms and conditions) whereas between 2014 and 2016 it increased by 79pp
The overall consumer exposure to unanticipated extra charges from domestic retailers is 93 in the European Union In the North and South this indicator is in line with the EU27_2019 average while exposure levels are higher in the East (113) and lower in the West (78) In the EU the highest exposure to unanticipated extra charges from domestic retailers is found in Greece (208)
Croatia (196) and Bulgaria (175) The lowest consumer exposure to such practices is found in Austria (44) the Netherlands (51) and the Czech Republic and Germany (both 60)
Between 2016 and 2018 exposure to unanticipated extra charges from domestic retailers increased in the EU27_2019 (+11pp) the West (+32pp) and decreased in the East (-12pp) while it remained stable in the North and South For this indicator as well exposure to unanticipated extra charges increased most sharply in Ireland (+116pp reflecting higher exposure to unanticipated extra charges) which is a negative reversal compared to the decrease of 105pp between 2014 and 2016
Exposure to unanticipated extra charges decreased most prominently in Hungary (-58pp) compared to the 2016 survey The largest negative reversal in the EU is also found in Hungary where between 2016 and 2018this indicator decreased by 58pp (reflecting lower consumer exposure to unanticipated extra charges) whereas between 2014 and 2016 it increased by 44pp
Considering all countries in the study the highest negative reversal is found in the UK where between 2016 and 2018 this indicator increased by 132pp (reflecting higher consumer exposure to such charges) whereas between 2014 and 2016 it decreased by 103pp The highest positive
reversal is found in Iceland where between 2016 and 2018 this indicator decreased by 49pp (reflecting lower consumer exposure to such charges) whereas between 2014 and 2016 it increased by 60pp
Consumer Survey 2018
109
In these maps values below average are coloured in light and dark green and values above average are coloured in light and dark red
Consumer Survey 2018
110
The average exposure to illicit commercial practices from domestic retailers (Q16a_1 and Q16a_2 answer
option 1 and Q16b_1 and Q16b_2 answer option 1) ndash Base all EU27_2019 respondents (N=24928)
Male 119 142 95 A
Female 95 98 92 A
18-34 123 C 129 A 118
35-54 109 BC 124 A 94 B
55-64 99 AB 112 A 85 AB
65+ 83 A 102 A 64 A
Low 87 A 96 A 79 A
Medium 102 A 114 A 91 A
High 116 132 100 A
Very difficult 132 C 134 AB 133
Fairly difficult 115 BC 130 B 99 B
Fairly easy 97 A 112 A 82 A
Very easy 100 AB 108 AB 92 AB
Rural area 102 A 110 A 94 AB
Small town 102 A 118 AB 87 A
Large town 117 131 B 102 B
Self-employed 119 B 125 B 114 B
Manager 119 AB 140 B 98 AB
Other white collar 107 AB 123 B 92 AB
Blue collar 108 AB 119 B 97 AB
Student 91 A 80 A 96 AB
Unemployed 103 AB 108 AB 95 AB
Seeking a job 115 AB 151 B 81 AB
Retired 95 AB 110 AB 80 A
Age groups
Exposure to other illicit commercial
practices from domestic retailersTotal
Unfair terms and
conditions
Unanticipated
extra charges
Gender
Education
Financial Situation
Urbanisation
Employment status
Consumer Survey 2018
111
The average exposure to illicit commercial practices from domestic retailers (Q16a_1 and Q16a_2 answer option 1 and Q16b_1 and Q16b_2 answer option 1) ndash Base all EU27_2019 respondents (N=24928)
With regard to socio-demographic variables and other characteristics whether a consumerrsquos mother tongue is the official language in their country of residence or not is the factor most closely associated with consumer exposure to other illicit commercial practices from domestic retailers Other characteristic showing close links with the indicator are vulnerability due to socio-demographic
factors gender vulnerability due to the complexity of offers and terms and conditions and age
Consumers whose mother tongue is not one of the official languages of the country or region in which they live are more likely to be exposed to illicit commercial practices from domestic retailers than those whose mother tongue is not an official language
Consumers who are very vulnerable in terms of socio-demographic factors are more likely to report being exposed to illicit commercial practices from domestic retailers than those who are somewhat vulnerable who in turn report higher exposure to such practices than those who are not vulnerable
Regarding consumersrsquo gender males are more likely to be exposed to such practices than females Consumers aged 18-34 years are more likely to report being exposed to such practices than those aged 55-64 years and 65+ years
Only native 95 108 A 82 A
Two 110 A 122 AB 97 AB
Three 117 A 135 B 100 AB
Four or more 119 A 126 AB 112 B
Not official
language in home
country
154 175 133
Official language
in home country104 117 91
Low 97 A 107 A 88 A
Medium 103 A 116 A 90 A
High 110 A 123 A 96 A
Daily 109 C 123 B 95 B
Weekly 111 C 126 B 96 B
Monthly 138 BC 158 AB 116 AB
Hardly ever 65 A 77 A 54 A
Never 82 AB 84 A 83 AB
Very vulnerable 142 148 A 137
Somewhat
vulnerable115 134 A 97
Not vulnerable 89 102 76
Very vulnerable 131 A 145 A 119 A
Somewhat
vulnerable122 A 137 A 107 A
Not vulnerable 95 107 82
Exposure to other illicit commercial
practices from domestic retailers
Consumer vulnerability
(socio-demographic
factors)
Consumer vulnerability
(complexity)
Unfair terms and
conditions
Unanticipated
extra charges
Languages
Mother Tongue
Numerical skills
Internet use
Total
Consumer Survey 2018
112
In terms of encountering unfair terms and conditions from domestic retailers this indicator is
associated most closely with whether a consumersrsquo mother tongue is the official language in their country of residence or not Other characteristics with close links with the indicator are gender vulnerability due to socio-demographic factors vulnerability due to the complexity of offers and terms and conditions and internet use
Those whose mother tongue does not correspond to one of the official languages of the country or region they live in are more likely to encounter such unfair terms and conditions than those whose mother tongue is one of the official languages
Regarding consumersrsquo gender males are more likely to report encountering unfair terms and conditions from domestic retailers than females
Consumers who are very or somewhat vulnerable in terms of socio-demographic factors are more likely to report encountering unfair terms and conditions compared to consumers who are not vulnerable
Similarly consumers who are very or somewhat vulnerable in terms of the complexity of offers and
terms and conditions are also more likely to report encountering unfair terms and conditions than those who are not vulnerable
As far as internet use is concerned daily and weekly internet users are likely to encounter unfair terms and conditions than those who use the internet hardly ever or never
Whether a consumersrsquo mother tongue is the official language in their country of residence or not is also associated most closely with consumersrsquo exposure to unanticipated extra charges from domestic retailers The characteristics showing the next closest links are vulnerability due to socio-
demographic factors age vulnerability due to the complexity of offers and terms and conditions and the degree of urbanisation
Those whose mother tongue is not one of the official languages of the country or region they live in report receiving such unanticipated charges more likely than those whose mother tongue is one of the official languages
Consumers who are very vulnerable in terms of socio-demographic factors are more likely to report
receiving unanticipated extra charges than who are somewhat vulnerable who in turn are more likely
to report receiving such charges than those who are not vulnerable
Regarding age younger consumers (18-34 years) are also more likely to receive unanticipated extra charges from domestic retailers than those aged 35-54 years who in turn are more likely to receive such charges than those aged 65 years and older
Consumers who are very or somewhat vulnerable in terms of the complexity of offers and terms and conditions also report exposure to unanticipated extra charges more than those who are not
vulnerable
Finally consumers living in a large town are more likely to report receiving such charges than those living in a small town
Consumer Survey 2018
113
1033 Exposure to other illicit commercial practices from cross-border
retailers
The average exposure to illicit commercial practices from cross-border retailers (Q16a_1 and Q16a_2 answer
option 2) ndash Base Respondents who shopped in another EU country (N=10741)
In the European Union the overall consumer exposure to other illicit commercial practices from cross-border retailers is 36 In the North and West consumer exposure is in line with the EU27_2019 average whereas it is higher in the South (48) and lower in the East (20) Among the EU Member States the highest exposure to other illicit commercial practices from cross-border
retailers is found in Ireland (98) Malta (78) and Luxembourg (65) The lowest levels of exposure to such practices are found in Hungary (10) the Czech Republic (11) and Poland (17)
Between 2016 and 2018 exposure to other illicit commercial practices from cross-border retailers remained unchanged in the EU27_2019 and all regions In the EU27_2019 this type of exposure increased most sharply in Ireland (+62pp) while no statistically significant decreases are recorded
Region
Country
2018
( = sig
diff EU27)
2018-
2016
2016-
2014
EU27_2019 36 +01 -03
EU28 40 +04 -04
North 39 -03 +05
South 48 +08 +06
East 20 +00 -09
West 35 -02 -06
BE 44 +01 -18
BG 26 +10 -28
CZ 11 +07 -11
DK 36 -12 +09
DE 31 -08 +02
EE 20 -02 +03
IE 98 +62 -38
EL 32 +12 -08
ES 43 -06 +11
FR 29 -12 -09
HR 43 +08 +02
IT 55 +17 +03
CY 52 +13 -27
LV 37 +07 -06
LT 42 +22 -25
LU 65 +12 -49
HU 10 +04 -45
MT 78 -14 +30
NL 24 +08 -04
AT 44 +20 -13
PL 17 -03 -00
PT 24 -04 +15
RO 23 -11 +04
SI 34 +04 +08
SK 25 +04 -28
FI 29 +06 -25
SE 49 -12 +30
IS 54 +29 +01
NO 53 +04 +10
UK 65 +29 -13
Exposure to other illicit commercial
practices from cross-border retailers
Consumer Survey 2018
114
at country level When looking at changes in 2018 (vs 2016) and in 2016 (vs 2014) the strongest
negative reversal is also found in Ireland where the increase between 2016 and 2018 follows a decrease of 38pp between 2014 and 2016 (reflecting lower exposure to such charges) No statistically significant positive reversal is found
1034 Types of other illicit commercial practices from cross-border retailers
In contrast to other illicit commercial practices from domestic retailers unanticipated extra charges (44) are somewhat more common from cross-border retailers than unfair terms and conditions (28)
Percentage of ldquoYesrdquo responses in Q16a_1 and Q16a_2 ndash Base Respondents who shopped in another EU country
(N=10741)
In the European Union the overall consumer exposure to unfair contract terms and conditions from cross-border retailers is 28 In the North South and West the results are in line with the
2018
( = sig
diff EU27)
2018-
2016
2016-
2014
2018
( = sig
diff EU27)
2018-
2016
2016-
2014
EU27_2019 28 +01 +02 44 +00 -08
EU28 32 +03 +04 48 +06 -12
North 32 +01 +05 46 -08 +05
South 26 +02 -02 70 +14 +14
East 16 -01 -03 23 +02 -16
West 32 +01 +06 38 -06 -18
BE 25 +07 -20 64 -04 -15
BG 32 +16 -36 20 +03 -19
CZ 15 +16 07 -03 -08
DK 21 +09 +00 50 -33 +18
DE 39 +08 +19 23 -23 -15
EE 08 -09 +06 32 +06 -01
IE 54 +26 -08 142 +99 -68
EL 03 -07 -23 60 +31 +08
ES 28 -18 +03 58 +07 +19
FR 20 -24 +02 39 -01 -21
HR 21 -04 -11 66 +20 +15
IT 28 +15 -06 82 +18 +13
CY 40 +12 -23 64 +14 -31
LV 27 +07 -19 46 +07 +07
LT 40 +23 -18 44 +20 -33
LU 44 +01 -32 87 +24 -66
HU 07 +06 -33 13 +03 -57
MT 50 -25 +59 105 -04 +02
NL 19 +03 +05 29 +13 -13
AT 55 +39 -08 34 +00 -18
PL 14 -05 +10 20 -02 -11
PT 15 -09 +16 33 +02 +14
RO 13 -24 +23 33 +03 -16
SI 23 -04 +00 45 +12 +17
SK 26 -01 -14 23 +10 -42
FI 35 +12 -27 23 -01 -22
SE 39 -18 +37 59 -06 +22
IS 24 +05 +13 84 +53 -11
NO 31 +11 -03 75 -03 +23
UK 59 +17 +15 70 +41 -41
Exposure to other illicit commercial practices from cross-border
retailers
Region
Country
Unfair terms and conditions Unanticipated extra charges
Consumer Survey 2018
115
EU27_2019 average while a lower level is noted in the East (16) While the results for most of
the EU Member States are in line with the EU27_2019 average higher levels are observed in Austria (55) Ireland (54) while lower levels are found in Estonia (08) Hungary (07) and Greece (03) The highest level of exposure among all studied countries is found in the UK (59)
Consumer exposure to unfair contract terms and conditions from cross-border retailers did not undergo any statistically significant change between 2016 and 2018 in the EU27_2019 nor in all regions Compared to the 2016 survey this type of exposure increased most sharply in Austria (+39pp) No statistically significant decreases and positive or negative reversals are found
The overall consumer exposure to unanticipated extra charges from cross-border retailers is 44 in the European Union The results in the North and West are in line with the EU27_2019 average whereas they are higher in the South (70) and lower in the East (23) The highest exposure to unanticipated extra charges from cross-border retailers is found in Ireland (142) Malta (105) and Luxembourg (87) The lowest levels of exposure to such practices are found in the Czech Republic (07) Hungary (13) Poland and Bulgaria (both 20)
Compared to 2016 consumer exposure to unanticipated extra charges from cross-border retailers
remained stable in the EU27_2019 and in all regions Among the EU Member States it only increased in Ireland (+99pp) whereas no statistically significant decreases are observed When looking at changes in 2018 (vs 2016) and in 2016 (vs 2014) the largest negative reversal is also found in Ireland where the increase of this indicator (reflecting higher consumer exposure to unanticipated extra charges) follows a decrease of 68pp between 2014 and 2016 (reflecting lower consumer exposure to such extra charges) No positive reversals are found
Consumer Survey 2018
116
The average exposure to illicit commercial practices from cross-border retailers (Q16a_1 and Q16a_2 answer
option 2) ndash Base EU27_2019 respondents who shopped in another EU country (N= 9447) N=9365 for unfair terms and conditions N = 9436 for unanticipated extra charges
Male 39 A 30 A 48 A
Female 32 A 25 A 40 A
18-34 43 B 23 A 64 C
35-54 29 A 27 A 33 AB
55-64 41 AB 45 A 42 BC
65+ 26 AB 36 A 19 A
Low 23 A 10 35 A
Medium 34 A 24 A 44 A
High 39 A 33 A 45 A
Very difficult 47 A 51 A 43 AB
Fairly difficult 41 A 18 A 63 B
Fairly easy 31 A 28 A 35 A
Very easy 41 A 36 A 46 AB
Rural area 39 A 23 A 56 A
Small town 34 A 26 A 42 A
Large town 36 A 34 A 39 A
Self-employed 55 C 36 B 75 B
Manager 39 ABC 28 AB 50 AB
Other white collar 31 AB 22 AB 40 A
Blue collar 26 AB 25 AB 28 A
Student 48 BC 65 B 43 AB
Unemployed 45 ABC 31 AB 62 AB
Seeking a job 42 ABC 34 AB 48 AB
Retired 20 A 15 A 23 A
Age groups
Exposure to other illicit commercial
practices from cross-border retailersTotal
Unfair terms and
conditions by
cross-border
retailers
Unanticipated
extra charges by
cross-borer
retailers
Gender
Education
Financial Situation
Urbanisation
Employment status
Consumer Survey 2018
117
The average exposure to illicit commercial practices from cross-border retailers (Q16a_1 and Q16a_2 answer
option 2) ndash Base EU27_2019 respondents who shopped in another EU country (N= 9447) N=9365 for unfair terms and conditions N = 9436 for unanticipated extra charges
With regard to socio-demographic variables and other characteristics the variable associated most closely with consumer exposure to other illicit commercial practices from cross-border retailers is vulnerability due to the complexity of offers and terms and conditions followed by employment status and age
Consumers who are very vulnerable in terms of the complexity of offers and terms and conditions are more likely to report exposure to such practices than those who are not vulnerable
Regarding consumersrsquo employment status those who are self-employed are most likely to be exposed to other illicit commercial practices from cross-border retailers and more so than other white collars blue collar workers or those who are retired
Finally consumers aged 18-34 years are more likely to report being exposed to such practices than
those aged 35-54 years
In terms of unfair terms and conditions by cross-border retailers vulnerability due to the complexity of offers and terms and conditions is the factor most closely associated with this illicit
Only native 28 A 24 A 32 A
Two 38 A 31 A 46 A
Three 36 A 25 A 48 A
Four or more 42 A 29 A 54 A
Not official
language in home
country
54 A 45 A 65 A
Official language
in home country35 A 27 A 43 A
Low 37 A 21 A 53 A
Medium 43 A 28 A 58 A
High 33 A 28 A 39 A
Daily 37 A 29 B 44 A
Weekly 27 A 04 A 52 A
Monthly 16 A 33 A
Hardly ever 17 A 09 AB 26 A
Never 32 A 18 AB 57 A
Very vulnerable 44 A 40 A 50 A
Somewhat
vulnerable33 A 26 A 40 A
Not vulnerable 36 A 26 A 45 A
Very vulnerable 57 B 66 B 51 A
Somewhat
vulnerable43 AB 35 AB 50 A
Not vulnerable 31 A 21 A 42 A
Exposure to other illicit commercial
pracitces from cross-border retailers
Consumer vulnerability
(socio-demographic
factors)
Consumer vulnerability
(complexity)
unfair terms and
conditions by
cross-border
retailers
unanticipated
extra charges by
cross-borer
retailers
Languages
Mother Tongue
Numerical skills
Internet use
Total
Consumer Survey 2018
118
commercial practice Other characteristics with close links with this indicator are education and
employment status
Consumers who are very vulnerable in terms of the complexity of offers and terms and conditions are also more likely to report exposure to unfair terms and conditions by cross-border retailers than those who are not vulnerable
Regarding consumersrsquo education level those with a medium or high level of education are more likely to report encountering such practices than those with a low level of education
Finally consumer that are self-employed and students are more likely to report exposure to unfair
terms and conditions by cross-border retailers than those who are retired
With regards to unanticipated extra charges by cross-border retailers age and employment status are the factors that are linked closely with the indicator
Consumers aged 18-34 years are more likely to report being exposed to such practices than those aged 35-54 years and 65+ years Consumers aged 55-64 are also more likely to report exposure to
such practices than consumers aged 65+ years
Finally persons that are self-employed are more likely to report exposure to such practices than other white collars blue collar workers and those who are retired
Consumer Survey 2018
119
In these maps values below average are coloured in light and dark green and values above average are coloured in light and dark red
Consumer Survey 2018
120
11 OVERALL PROBLEMS AND DISPUTE RESOLUTION
This chapter looks at the overall level of problems that consumers experience with online purchases as well as the actions they take in terms of making complaints to different sectors (retailer or service
provider manufacturer public authority out-of-court dispute resolution body (ADR) or other) along with their overall satisfaction with problem resolution and the time it took to resolve problems This chapter additionally observes the reasons that consumers reported for not taking actions
The problems and complaints indicator
Due to relatively small sample sizes achieved when asking respondents about problems they
experienced the actions they took to resolve them and their satisfaction with complaint handling a composite indicator on problems and complaints was developed based on data gathered with four survey questions
1) problems experienced buying or using any goods or services domestically
2) the type of action taken to resolve the problem
3) satisfaction with complaint handling
4) the reason for not taking action if applicable
Based on the four questions above a hierarchy of 11 exhaustive (all respondents) and mutually exclusive (each respondent belongs to only one) scenarios was developed2223 The result of this hierarchy is a problems and complaints indicator the higher the value of the indicator the lower the overall level of problems and the higher the overall satisfaction with complaint handling
22 The scenarios were developed by DG JUST with the scientific cooperation with the Joint Research Centre and Member States experts They are based on the following principlesassumptions a) The ideal situation is the one where a person has not experienced any problem b) when one or more problems are experienced the best thing to do is to complain about it unless the decision not to complain is justified solely by the small detriment associated with the problem(s) c) complaining to the retailerprovidermanufacturer indicates a less serious problem andor is less burdensome for the consumer than complaining to third parties (public authority ADR or court) d) The final outcome of the complaint process also matters (result being satisfactory or not)
23 The additional advantage of combining the answers to the different questions in specific scenarios is that a higher rate of complaining behaviour is not automatically seen as better for consumer conditions (unless combined with a satisfactory response) and that not complaining because of small detriment is not penalised For detailed information on the composition of the composite indicator see chapter 221 of Van Roy V Rossetti F Piculescu V (2015) Consumer conditions in the EU revised framework and empirical investigation JRC science and policy report JRC93404 httpseceuropaeujrcenpublicationeur-scientific-and-technical-research-reportsconsumer-conditions-eu-revised-framework-and-empirical-investigation To make it easier to understand how the indicator is built below are three example scenarios of the problems and complaints indicator (most favourable medium and worst scenario) bull Most favourable scenario the consumer did not have any problem or the consumer does not know if he had a problem or not In this scenario the problems and complaints indicator is 98 bull Intermediate scenario the consumer had had a problem and he DID complain about it NEITHER to the retailer NOR the manufacturer However he complained about it to another party and he did get a satisfactory result from any of these parties In this scenario the problems and complaints indicator is equal to 45 bull Worst scenario the consumer had a problem and the low sum involved is NOT among the reasons why he did not complain In this scenario the problems and complaints indicator is equal to 11
Consumer Survey 2018
121
The problems and complaints composite indicator (which can have a score from 11 to 98 see footnote 23) is
computed based on pre-defined scenarios using data gathered in Q924 Q1025 Q1126 and Q1227 - Base all respondents (N=28037)
24 Q9 In the past 12 months have you experienced any problem when buying or using any goods or services in (our country) where you thought you had a legitimate cause for complaint -Yes and you took action to solve the problem -Yes but you did not do anything ndashNo -DKNA
25 Q10 And what did you do - You complained about it to the retailer or service provider -You complained about it to the manufacturer -You complained about it to a public authority -You brought the matter to an out-of-court dispute resolution body (ADR) such as an ombudsman arbitration mediation or conciliation body -You took the business concerned to court ndashOther -DKNA
26 Q11 In general how satisfied or dissatisfied were you with the way your complaint(s) was (were) dealt with by thehellip -Very satisfied ndashFairly satisfied ndashNot very satisfied ndashNot at all satisfied ndashOther ndashDKNA
Q111 Retailer or service provider Q112 Manufacturer Q113 Public authority Q114 An out-of-court dispute resolution body (ADR) Q115 Court
27 Q12 What were the main reasons why you did not take any action -You were unlikely to get a satisfactory solution to the problem you encountered -The sums involved were too small -You did not know how or where to complain -You were not sure of your rights as a consumer -You thought it would take too long -You tried to complain about other problems in the past but were not successful -You thought complaining would have led to a confrontation and you do not feel at ease in such situations ndashOther -DKNA
Region
Country
2018
( = sig
diff EU27)
2018-
2016
2016-
2014
EU27_2019 888 -01 +10
EU28 885 -05 +11
North 901 -01 -01
South 869 -14 +12
East 875 +06 +31
West 895 -06 +01
BE 907 -11 -03
BG 879 +04 +35
CZ 897 +03 -03
DK 911 -12 -04
DE 906 +05 -10
EE 874 -02 -19
IE 874 -20 +24
EL 860 -52 +61
ES 875 -21 +25
FR 905 +00 00
HR 826 -31 +45
IT 860 -08 +40
CY 921 +41 -38
LV 878 -20 +30
LT 863 -17 +10
LU 927 +28 -27
HU 898 +28 +08
MT 889 +29 -37
NL 904 +03 +10
AT 936 +34 -18
PL 882 +11 +18
PT 894 +16 -26
RO 830 -07 +00
SI 917 -13 +10
SK 909 +26 -03
FI 897 +01 +08
SE 915 +14 -11
IS 879 -08 -11
NO 899 +01 -05
UK 863 -35 +18
Problems and complaints
Consumer Survey 2018
122
The problems and complaints indicator is equal to 888 in the European Union Compared to the
EU27_2019 average this indicator is higher in the West (906) and the North (901) whereas it is lower in the South (869) and East (875) The highest levels of the problems and complaints indicator are found in Austria (936) Luxembourg (927) and Cyprus (921) The lowest levels of the problems and complaints indicator are found in Croatia (826) Romania (830) Italy and Greece (both 860)
In this map values above average are coloured in light and dark green and values below average are coloured in light and dark red
Compared to 2016 the level of the problems and complaints indicator remained stable in the
EU27_2019 the North East and West regions whereas it decreased in the South (-14p38) The problems and complaints indicator increased most prominently in Cyprus (+41p) and decreased most prominently in Greece (-52p) In this regard the largest negative and positive reversals are
38 points
Consumer Survey 2018
123
found in Cyprus and Greece respectively In Cyprus the increase between 2016 and 2018 was
preceded by a decrease of 38p between 2014 and 2016 In Greece the problems and complaints indicator increased by 61p between 2014 and 2016 followed by the decrease between 2016 and 2018
The problems and complaints composite indicator is computed based on pre-defined scenarios using data
gathered in Q9 Q10 Q11 and Q1239 ndash Base all EU27_2019 respondents (N=24928)
The problems and complaints composite indicator is computed based on pre-defined scenarios using data
gathered in Q9 Q10 Q11 and Q12 ndash Base all EU27_2019 respondents (N=24928)
With regard to socio-demographic variables and other characteristics vulnerability due to the complexity of offers and terms and conditions is associated most closely with the problems and complaints indicator The characteristics showing the next closest links are consumersrsquo financial situation education employment status and age
Consumers who are not vulnerable in terms of the complexity of offers and terms and conditions have the highest scores on the problems and complaints indicator and thus have experienced a lower
overall level of problems and higher satisfaction with complaint handling) than those who are somewhat vulnerable who in turn have higher scores than those who are very vulnerable
Consumers with a very easy financial situation score higher on the problems and complaints indicator than those who report their situation to be fairly or very difficult Those with a fairly easy financial
39 Problems and complaints rescaled is based on the following function problems_complaints_rescaled=(100-0)(098-011)(problems_complaints_score-098)+100
889 A 900 A
876 A 892 AB 905 B 911 B
914 A 899 A 884
862 A 887 AB 901 BC 908 C
899 A 890 A 895 A
864 A 885 AB 898 BCD 901 BCD
920 CD 881 ABC 922 D 895 ABCD
Unemployed Seeking a job RetiredEmployment status
Self-employed Manager Other white collar
Financial situationVery difficult Fairly difficult Fairly easy
UrbanisationRural area Small town Large town
Blue collar
Student
65+
Education levelLow Medium High
Age18-34 35-54 55-64
Very easy
GenderMale Female
Problems and complaints
896 A 894 A 887 A 900 A
876 A 895 A
899 A 892 A 895 A
887 A 908 B 914 AB 906 AB 931 B
891 A 887 A 899 A
846 887 905
Hardly ever Never
Consumer
vulnerability
(socio-demographic
factors)
Very vulnerableSomewhat
vulnerableNot vulnerable
Internet useDaily Weekly Monthly
Consumer
vulnerability
(complexity)
Very vulnerableSomewhat
vulnerableNot vulnerable
LanguagesOnly native Two
High
Mother tongue
Not official
language in home
country
Official language in
home country
Numerical skillsLow Medium
Three Four or more
Problems and complaints
Consumer Survey 2018
124
situation do not differ from those with a fairly difficult situation but score higher than those with very
difficult situation
Regarding consumersrsquo level of education those with a low or medium level of education score higher on this indicator than those with a high level of education
As far as employment status is concerned those who are seeking a job score higher on the problems and complaints indicator than those who are unemployed managers and self-employed Those who are self-employed have the lowest scores on this indicator and lower than other white collars blue collar workers and students
Finally older consumers tend to score higher on the indicator with those aged 65+ years and 55-64 years scoring higher than those aged 18-34 years
1111 No problems
Percentage of Total ldquoNordquo (answers 3 or 4 at Q9) Base all respondents (N=28037)
Region
Country
2018
( = sig
diff EU27)
2018-
2016
2016-
2014
2014-
2012
EU27_2019 796 -03 +17 +32
EU28 780 -22 +26 +32
North 801 +02 +03 +87
South 753 -46 +53 -08
East 766 +17 +08 +34
West 842 +16 -01 +51
BE 844 -16 +07 +22
BG 847 +06 +49 +95
CZ 801 +15 -27 +156
DK 831 -18 -03 +78
DE 831 +13 +10 +102
EE 763 -23 -19 +25
IE 726 -102 +69 +45
EL 805 -97 +92 +126
ES 783 -55 +60 +59
FR 874 +33 -20 -32
HR 695 -41 +60 +18
IT 706 -45 +59 -92
CY 897 +63 -55 +265
LV 808 -23 +44 +26
LT 786 -44 +09 +39
LU 854 +41 -65 -18
HU 760 +26 +27 +08
MT 829 +55 -68 +15
NL 778 +02 -07 +138
AT 886 +52 +05 +28
PL 760 +46 +15 +43
PT 825 +25 -46 +42
RO 728 -26 -21 -72
SI 844 -20 -07 +89
SK 796 +20 +12 +103
FI 730 +03 +09 +35
SE 832 +34 -05 +159
IS 780 -16 +05 +20
NO 781 -16 -19 +185
UK 663 -160 +90 +38
No problems
Consumer Survey 2018
125
In the European Union the likelihood that consumers do not experience any problem is equal to
796 In the North this incidence is in line with the EU27_2019 average while higher levels are observed in the West (842) and the North (801) and lower levels are observed in the South (753) and the East (766) Among the EU countries the highest proportion of consumers that did not encounter any problem is found in Cyprus (897) Austria (886) and France (874) The lowest levels of this indicator are found in Croatia (695) Italy (706) and Ireland (726) Among all studied countries the UK has the lowest score (663)
Compared to 2016 the proportion of persons not having experienced a problem remained stable in
the EU27_2019 and in the North whereas a decrease is observed in the South (-46pp) and an increase is observed in the East (+17pp) and in the West (+16pp) The level of this indicator increased most prominently in Cyprus (+63pp) and decreased most noticeably in Ireland (-102pp)
The largest positive reversal is observed in Malta where between 2016 and 2018 the proportion of consumers that did not experience problems increased by 55pp whereas between 2014 and 2016 it decreased by 68pp The largest negative reversal in the EU27_2019 is observed in Greece where
between 2016 and 2018 this indicator decreased by 97pp following an increase of 92pp between 2014 and 2016 When we consider all countries of the survey an even larger negative reversal can
be observed in the UK where after it had increased by 90pp between 2014 and 2016 it decreased by 160pp between 2016 and 2018
Percentage of Total ldquoNordquo (answers 3 or 4 at Q9) ndash Base all EU27_2019 respondents (N=24928)
Percentage of Total ldquoNordquo (answers 3 or 4 at Q9) ndash Base all EU27_2019 respondents (N=24928)
With regard to socio-demographic variables and other characteristics not having experienced problems is associated most closely with vulnerability due to the complexity of offers and terms and conditions followed by frequency of internet use age education and gender
783 807
765 791 A 821 B 823 AB
833 A 804 A 777
756 A 792 AB 799 B 811 B
798 A 793 A 796 A
766 A 779 AB 789 AB 813 B
817 B 783 AB 816 AB 806 AB
GenderMale Female
No problems
Blue collar
Student
65+
Education levelLow Medium High
Age18-34 35-54 55-64
Very easy
UrbanisationRural area Small town Large town
Financial situationVery difficult Fairly difficult Fairly easy
Unemployed Seeking a job RetiredEmployment status
Self-employed Manager Other white collar
808 A 794 A 782 A 775 A
773 A 796 A
819 A 800 A 789 A
779 820 A 843 AB 866 AB 888 B
791 A 791 A 799 A
728 782 810
Four or more
No problems
LanguagesOnly native Two
High
Mother tongue
Not official language
in home country
Official language in
home country
Numerical skillsLow Medium
Three
Consumer
vulnerability
(complexity)
Very vulnerableSomewhat
vulnerableNot vulnerable
Hardly ever Never
Consumer
vulnerability
(socio-demographic
factors)
Very vulnerableSomewhat
vulnerableNot vulnerable
Internet useDaily Weekly Monthly
Consumer Survey 2018
126
Consumers who are not vulnerable in terms of the complexity of offers and terms and conditions are
most likely to not experience problems than those who are somewhat vulnerable who in turn are more likely to not experience problems than those who are very vulnerable
Regarding the frequency of internet use daily internet users are less likely not to experience problems than other consumers In addition weekly internet users are also less likely not to experience problems than those who never use the internet
Consumers aged 18-34 are less likely not to experience problems compared to those who are older In turn consumers aged 35-54 report less often that they have experienced no problems compared
to those aged 55-64
As far as consumersrsquo education level is concerned those with a high level of education experience problems less often than those with a low or medium level of education
Finally female consumers are more likely to not experience problems than male consumers
1112 No complaint
This indicator refers to the proportion of respondents who did not make any complaint even though the problems they faced cannot be defined as negligible (ie the sums involved were not too small)
Base Respondents who experienced a problem but did not take any action to solve it (Answer 2 in Q9) and this
was not because the sums involved were too small (Answer 2 in Q12 is excluded) (N=5798)
Region
Country
2018
( = sig
diff EU27)
2018-
2016
2016-
2014
EU27_2019 156 -35 +19
EU28 136 -65 +42
North 126 +26 -09
South 148 -36 -16
East 161 -07 -31
West 165 -61 +97
BE 136 -19 +15
BG 394 -40 +15
CZ 84 -39 -11
DK 121 +32 +29
DE 111 -115 +169
EE 181 -30 +60
IE 148 -174 +111
EL 415 -82 -26
ES 142 +05 -12
FR 314 +35 -07
HR 178 -08 -22
IT 122 -63 -16
CY 317 -74 +161
LV 272 +99 -52
LT 238 -33 -51
LU 103 -129 +80
HU 74 -74 +19
MT 184 -09 +51
NL 80 -10 +16
AT 132 -109 +204
PL 108 +05 -28
PT 124 -33 +52
RO 284 -08 -103
SI 136 +20 -68
SK 99 -15 +29
FI 48 -09 -38
SE 114 +46 +15
IS 168 +27 +15
NO 130 +09 -13
UK 52 -233 +193
Non-negligible problems but no complaint
Consumer Survey 2018
127
The proportion of consumers who experienced a problem but did not take action (the reason for that
not being that the sums involved are too small) is 156 in the European Union In the West East and South the results are in line with the EU27_2019 average while they are lower in the North (126) Among the EU countries28 the highest levels of this indicator are found in Greece (415) Bulgaria (394) and Cyprus (317) whereas the lowest levels are found in Finland (48) Hungary (74) and the Netherlands (80) Among all studied countries the UK (52) also has a low level of this indicator
Compared to 2016 the percentage of consumers who did not complain despite the sums involved
decreased in the EU27_2019 (-35pp) the West (-61pp) and the South (-36pp) while it remained unchanged in the North and the East Compared to the survey in 2016 the level of the indicator increased most steeply in Latvia (+99pp) and decreased most sharply in Ireland (-174pp) The largest positive reversal in the EU27_2019 is found in Austria where between 2016 and 2018 this indicator decreased by 109pp (reflecting a decrease in the incidence of consumers with non-negligible problems) while between 2014 and 2016 it increased by 204pp Considering all countries
in the survey the UK shows an even stronger decrease and positive reversal with a decrease of 233pp between 2016 and 2018 following an increase of 193pp between 2014 and 2016 No statistically significant negative reversals are observed
Base Respondents from the EU who experienced a problem but did not take any action to solve it (Answer 2 in
Q9) and this was not because the sums involved were too small (Answer 2 in Q12 is excluded) (N=5057)
Base Respondents from the EU who experienced a problem but did not take any action to solve it (Answer 2 in
Q9) and this was not because the sums involved were too small (Answer 2 in Q12 is excluded) (N=5057)
Regarding socio-demographic variables and other characteristics the proportion of consumers not taking any action despite experiencing non-negligible problems is associated most closely with the
28 Results for the following countries are based on a very small sample size (less than 100 observations) and should therefore be considered as mainly indicative Malta (87) Luxembourg (73) Cyprus (53)
144 A 160 A
154 A 143 A 157 A 166 A
135 A 137 A 174 A
220 A 183 A 135 91
144 A 160 A 150 A
188 A 170 A 137 A 166 A
154 A 197 A 141 A 125 A
GenderMale Female
Non-negligible problems but no complaint
Blue collar
Student
65+
Education levelLow Medium High
Age18-34 35-54 55-64
Very easy
UrbanisationRural area Small town Large town
Financial situationVery difficult Fairly difficult Fairly easy
Unemployed Seeking a job RetiredEmployment status
Self-employed Manager Other white collar
170 A 158 A 138 A 70
137 A 153 A
180 A 171 A 137 A
140 A 152 AB 148 AB 386 B 263 B
186 B 169 AB 130 A
144 A 143 A 158 A
Four or more
Non-negligible problems but no complaint
LanguagesOnly native Two
High
Mother tongue
Not official language
in home country
Official language in
home country
Numerical skillsLow Medium
Three
Consumer
vulnerability
(complexity)
Very vulnerableSomewhat
vulnerableNot vulnerable
Hardly ever Never
Consumer
vulnerability
(socio-demographic
factors)
Very vulnerableSomewhat
vulnerableNot vulnerable
Internet useDaily Weekly Monthly
Consumer Survey 2018
128
consumerrsquos financial situation languages spoken internet use and vulnerability related to socio-
demographic factors
Consumers who report their financial situation to be fairly or very difficult are more likely to take no action than those whose situation is fairly easy The latter are in turn less likely to take action than those whose situation is very easy
Those who speak three or fewer languages are less likely to take action compared to those speaking at least four languages Between consumers who speak only their native language two languages or three languages there is no difference in this regard
Daily internet users are less likely to take action than those who use the internet hardly ever or never
Finally very vulnerable consumers in terms of socio-demographic factors are less likely to complain when experiencing a non-negligible problem than consumers that are not vulnerable
Consumer Survey 2018
129
Actions taken to resolve problems (breakdown by kind of action plus no
action taken)
The most common actions consumers engage in when they experience a problem is to complain to the retailer or service provider (852) This is followed by complaints to the manufacturer (157)
and a public authority (61) Only a relatively small share of consumers addresses their problems via an ADR platform (55) or takes the business to court (24)
Q10 Answers 1 and 2 Base Respondents who experienced a problem and took action to solve it (N=4381)
In the European Union 852 of the consumers that experienced a problem and took action to solve it complained directly to the retailer or service provider In the North the South and the East the findings are in line with the EU27_2019 average while they are lower in the West (819)
2018
( = sig
diff EU27)
2018-
2016
2016-
2014
2014-
2012
2018
( = sig
diff EU27)
2018-
2016
2016-
2014
2014-
2012
EU27_2019 852 +87 -46 -33 157 -53 +44 +30
EU28 871 +144 -107 -24 178 -59 +56 +39
North 854 -31 +00 -20 110 +05 -18 +27
South 878 +22 +59 -43 243 +77 -26 +36
East 861 -22 +67 -46 124 -20 +15 +38
West 819 +260 -249 -14 104 -223 +152 +18
BE 795 +25 -69 +74 164 -22 -38 +76
BG 617 -74 +90 -272 67 -23 +07 +29
CZ 876 -24 -07 -68 129 +27 -25 +31
DK 826 -28 -03 -38 176 -48 +53 +35
DE 812 +311 -272 -39 108 -242 +176 +08
EE 878 +26 -108 +107 95 +01 +56 -53
IE 915 +396 -373 -19 181 -202 +244 +35
EL 780 +29 +88 +03 218 +106 -66 -57
ES 836 -08 +22 -54 207 +01 -23 +87
FR 794 +325 -367 +103 53 -366 +199 +05
HR 862 -32 +22 +17 145 +19 -13 -00
IT 908 +46 +87 -55 282 +125 -11 +15
CY 766 -105 +110 -108 92 +15 -84 +37
LV 852 -07 -43 +117 61 +05 -10 -19
LT 762 +54 +16 -48 53 +19 -107 +116
LU 819 +295 -209 +42 263 -62 +64 +184
HU 937 +11 +45 -23 63 +50 -76 -04
MT 872 +31 -08 -56 83 -70 +66 -37
NL 858 -05 +05 -49 104 -26 +10 +12
AT 847 +403 -459 -10 152 -162 +187 +11
PL 838 -67 +78 -22 123 -46 +15 +64
PT 870 -01 -60 +105 97 +09 -121 +48
RO 880 +74 +121 +36 188 -20 +140 -37
SI 933 -44 +46 +10 41 +07 -52 +38
SK 935 +70 +69 -164 69 -50 -64 +108
FI 875 -54 +67 -26 139 +29 -87 +17
SE 872 -35 -33 -11 69 -03 +09 +09
IS 950 +36 -50 +40 105 +28 +38 -26
NO 832 -35 +48 -71 108 +14 -15 +09
UK 940 +601 -611 +20 257 -245 +241 +88
Actions taken to resolve problems
Region
Country
Complained to the retailer or service
providerComplained to the manufacturer
Consumer Survey 2018
130
Among the EU countries29 the highest levels of this indicator are found in Hungary (937) Slovakia
(935) and Slovenia (933) Of all studied countries Iceland (950) and the UK (940) have a high level as well The lowest levels are found in Bulgaria (617) Lithuania (762) and Cyprus (766)
The proportion of respondents who complained to the retailer or service provider increased between 2016 and 2018 in the EU27_2019 (+87pp) and the West (+260pp) while no statistically significant changes are observed in the North South and East Among all EU countries the proportion of consumers who complained to the retailer or service provider increased most steeply in Austria
(+403pp) and decreased most prominently in Poland (-67pp) When looking at changes in 2018 (vs 2016) and in 2016 (vs 2014) the largest positive reversal in the EU27_2019 is also found in Austria where the increase between 2016 and 2018 comes after a decrease of 459pp between 2014 and 2016 Among all countries the UK shows an even larger positive reversal where between 2016 and 2018 this indicator increased by 601pp whereas between 2014 and 2016 it decreased by 611pp The only negative reversal is found in Poland where the large decrease between 2016 and
2018 (see above) was preceded by an increase of 78pp between 2014 and 2016
In the European Union the proportion who complained to the manufacturer is 157 Compared
to the EU27_2019 average this proportion is higher in the South (243) and lower in the West (104) the North (110) and the East (124) Among the EU countries the highest levels of this indicator are found in Italy (282) Luxembourg (263) and Greece (218) Furthermore the UK (257) also has high levels for this indicator The lowest levels are found in Slovenia (41) France and Lithuania (both 53) and Latvia (61)
Compared to 2016 the proportion of consumers who complained to the manufacturer decreased in the EU27_2019 (-53pp) and the West (-223pp) increased in the South (+77pp) and remained stable in the North and East The likelihood that consumers would complain to manufacturers directly increased most markedly in Italy (+125pp) and decreased most prominently in France (-366pp) The only positive reversal is found in Hungary where between 2016 and 2018 this indicator increased by 50pp whereas between 2014 and 2016 it decreased by 76pp The largest negative reversal is found in France where the large decrease in the proportion of respondents that complained to a
manufacturer between 2016 and 2018 (see above) comes after an increase of 199pp between 2014 and 2016
29 Results (for both retailersservice providers and manufacturers) for the following countries are based on a very small sample size (less than 100 observations) and they should be therefore considered as mainly indicative Greece (94) Austria (90) Bulgaria (83) Iceland (81) France (76) Malta (69) Luxembourg (49) Cyprus (25)
Consumer Survey 2018
131
Q10 Answers 1 and 2 Base Respondents from the EU who experienced a problem and took action to solve it
(N=3758 for complaints to retailer or service provider N=3748 for complaints to manufacturer)
Male 834 178
Female 877 136
18-34 851 A 189 B
35-54 858 A 118 A
55-64 844 A 157 AB
65+ 859 A 244 B
Low 714 246 A
Medium 849 A 161 A
High 881 A 145 A
Very difficult 773 A 173 A
Fairly difficult 842 AB 163 A
Fairly easy 880 B 159 A
Very easy 837 AB 139 A
Rural area 836 A 200 B
Small town 882 136 A
Large town 835 A 152 AB
Self-employed 851 ABC 179 ABC
Manager 854 ABC 138 ABC
Other white collar 876 BC 189 BC
Blue collar 850 AB 145 ABC
Student 919 C 111 AB
Unemployed 872 ABC 189 ABC
Seeking a job 879 ABC 268 C
Retired 773 A 96 A
Actions taken to resolve problems
Complained to the
retailer or service
provider
Complained to the
manufacturer
Gender
Age groups
Education
Financial Situation
Urbanisation
Employment status
Consumer Survey 2018
132
Q10 Answers 1 and 2 Base Respondents from the EU who experienced a problem and took action to solve it
(N=3758 for complaints to retailer or service provider N=3748 for complaints to manufacturer)
With regard to socio-demographic variables and other characteristics education is associated most
closely with the proportion of persons who complains to retailers or service providers The characteristics showing the next closest links are consumersrsquo gender urbanisation numerical skills and employment status
Consumers with a high or medium level of education are more likely to complain directly to retailers or service providers than those who have a low level of education
Regarding gender females are more likely to complain to the retailer or service provider than males
Consumers who live in a small town are more likely to complain to the retailer or service provider than those living in a rural area or a large town
Those with a high numerical skill level are more likely to complain to retailers or service providers than those with a medium skill level
Finally students are more likely to have made such complaints compared to the retired and blue-collar workers Other white collars are also more likely to have made such complaints than people who are retired
Only native 846 AB 159 A
Two 843 A 156 A
Three 873 AB 178 A
Four or more 897 B 131 A
Not official
language in home
country
826 A 139 A
Official language
in home country855 A 160 A
Low 799 AB 104 A
Medium 813 A 198
High 880 B 147 A
Daily 844 A 165 B
Weekly 893 A 96 A
Monthly 902 AB 167 AB
Hardly ever 984 B 287 AB
Never 893 A 90 AB
Very vulnerable 848 A 152 A
Somewhat
vulnerable880 A 146 A
Not vulnerable 840 A 168 A
Very vulnerable 850 A 165 AB
Somewhat
vulnerable859 A 202 B
Not vulnerable 856 A 138 A
Complained to the
retailer or service
provider
Complained to the
manufacturer
Consumer vulnerability
(complexity)
Actions taken to resolve problems
Languages
Mother Tongue
Numerical skills
Internet use
Consumer vulnerability
(socio-demographic
factors)
Consumer Survey 2018
133
With regards to complaints to the manufacturer this indicator is most closely linked with gender
followed by age degree of urbanisation and employment status
Regarding gender males are more likely to complain to the manufacturer than females
Consumers who are aged 18-34 years and 65+ years are more likely to make such types of complaints than those who are aged 35-54 years
Consumers living in a rural area are more likely to make such complaints than those living in a small town
Finally jobseekers and other white collars are more likely to complain to the manufacturer compared
to those who are retired
Q10 Answers 3 4 and 5 Base Respondents who experienced a problem and took action to solve it (N=4381)
In the European Union the proportion of consumers that complains to a public authority is 61 In the South and the East this proportion is consistent with the EU27_2019 average whereas it is
lower in the North (43) and the West (41) The highest levels of this indicator in the
2018
( = sig
diff EU27)
2018-
2016
2016-
2014
2014-
2012
2018
( = sig
diff EU27)
2018-
2016
2016-
2014
2014-
2012
2018
( = sig
diff EU27)
2018-
2016
2016-
2014
2014-
2012
EU27_2019 61 -28 +11 +31 55 +03 -14 +16 24 +08 -12 +10
EU28 67 -24 +12 +26 64 +13 -18 +14 25 +09 -12 +09
North 43 -01 +10 +07 22 -15 -06 +26 07 -03 +09 -02
South 78 +09 -32 +29 84 +10 -11 +28 29 +04 +06 +04
East 70 -01 +22 +22 30 -20 +18 +02 07 -06 -05 +09
West 41 -92 +48 +40 49 +15 -41 +12 34 +24 -37 +19
BE 113 +63 -16 -24 95 +02 +27 -89 21 -18 +13 -18
BG 159 +49 -50 +95 22 -111 +28 +70 12 +02 +00 +01
CZ 53 +31 -25 -15 37 +29 -07 +08 06 +05 -21 +30
DK 30 -04 +00 -10 15 -21 -08 +23 14 -18 +37 00
DE 34 -117 +95 +16 23 -11 -24 +15 35 +27 -28 +31
EE 39 -60 +58 -39 34 -36 +29 +14 00 00 00 00
IE 95 -10 +39 +60 61 +43 -47 +47 32 +25 -00 -13
EL 257 +89 -149 +203 82 -53 -08 +55 38 +15 +15 -08
ES 121 -32 +14 +45 114 -45 +58 +32 27 -15 +14 +13
FR 40 -125 -37 +123 121 +115 -150 -44 38 +37 -99 -59
HR 55 +38 -32 +29 19 -07 +07 +21 12 -02 +08 -14
IT 45 +24 -44 +28 73 +45 -47 +36 29 +09 +04 +00
CY 139 -15 -19 +111 58 -08 +64 +16 00 00 00 00
LV 94 -44 +28 +30 28 -10 +27 -04 14 +14 -08 +02
LT 145 +74 -26 +78 35 -13 +10 +14 23 +14 -14 +08
LU 82 -86 +29 +149 21 -11 -131 +46 21 +22 -67 -52
HU 21 -04 -50 +46 05 -08 +01 -06 00 -06 +06 +04
MT 78 -80 -06 +136 00 -45 -37 +69 00 00 -21 +15
NL 26 -06 -12 +08 25 -39 +33 +03 35 +05 -17 +35
AT 35 -188 +115 +87 28 -28 -25 +69 20 +11 -08 -07
PL 60 -08 +44 +15 36 -45 +38 -11 05 -06 -17 +21
PT 44 -10 -73 +50 39 -23 -09 +11 34 +36 -12 -20
RO 138 -32 +66 +26 40 +36 -01 +11 16 -17 +30 -42
SI 65 +53 -11 -02 28 +17 -23 +19 06 +06 -10 +05
SK 13 -37 +12 -01 00 -09 -08 +15 00 -14 -05 +18
FI 25 +09 -13 +10 14 -17 -22 +39 00 -07 +07 -09
SE 35 -10 +32 -05 27 -09 -05 +25 07 +01 +06 -02
IS 27 +21 -08 -03 00 -11 +01 -14 00 -20 +20 -15
NO 08 +00 -00 -13 26 +05 +04 -04 08 +08 -04 -10
UK 90 -18 +21 -05 100 +59 -45 +06 28 +08 -08 +05
Actions taken to resolve problems
Region
Country
Complained to a public authority Complained to ADR Took the business concerned to court
Consumer Survey 2018
134
EU27_201930 are found in Greece (257) Bulgaria (159) and Lithuania (145) The lowest
levels among the EU countries are found in Slovakia (13) Hungary (21) and Finland (25) Considering all studied countries the level is also low in Norway (08)
Compared to 2016 the proportion of consumers who complains towards a public authority decreased in the EU27_2019 (-28pp) and the West (-92pp) while it remained relatively stable in the North the East and the South This indicator increased most steeply in Slovenia (+53pp) and decreased most prominently in Austria (-188pp) When looking at statistically significant changes in 2018 (vs 2016) and in 2016 (vs 2014) the only positive reversal is found in Croatia where between 2016
and 2018 this indicator increased by 38pp whereas between 2014 and 2016 it decreased by 32pp The largest negative reversal is found in Austria where the proportion of consumers that took action by complaining to a public authority decreased between 2016 and 2018 (see above) after it increased by 115pp between 2014 and 2016
The proportion of consumers who experienced a problem and complained to an ADR is 55 in the European Union In the West this is in line with the EU27_2019 average while it is higher in the
South (84) and lower in the North (22) and the East (30) Among the EU countries the highest levels of this indicator are found in France (121) Spain (114) and Belgium (95)
Besides these countries the proportion is also high in the UK (100) The lowest levels are found in Malta Slovakia (both 00) Hungary (05) and Finland (14) In addition the level is also very low in Iceland (00)
Between 2016 and 2018 the proportion of consumers who brought their complaints to an ADR remained stable in the EU27_2019 in the North South and West while a decrease is observed in
the East (-20pp) At country level the highest increase compared to the 2016 survey is found in France (+115pp) In France also the largest positive reversal is found where the increase between 2016 and 2018 comes after a decrease of 150p between 2016 and 2018 The sharpest decrease in the degree to which matters were brought to an ADR is found in Bulgaria (-111pp) No negative reversals are observed
In the European Union the proportion of consumers that take their complaints to court is 24 This indicator is in line with the EU27_2019 average in the South and the West whereas it is
noticeable lower in the North and the East (both 07) The highest values in the EU Member States are found in France (38) Greece (38) Germany (35) and the Netherlands (35) whereas the lowest values are found in Estonia Cyprus Hungary Malta Slovakia and Finland (all 0) Consumers in Iceland are also highly unlikely to bring their complaints to a court (0)
Compared to 201640 consumers are more likely to take a business to court in the EU27_2019 (+08pp) and the West (+24pp) while the results remained stable in the North the South and the
East Compared to the survey in 2016 there is only one statistically significant change for this indicator namely an increase in Portugal (+36pp) No positive or negative reversals are found
30 Results (for public authority ADR and court) for the following countries are based on a very small sample size (less than 100 observations) and they should be therefore considered as mainly indicative Greece (94) Austria (90) Bulgaria (83) Iceland (81) France (76) Malta (69) Luxembourg (49) Cyprus (25)
40 As discussed in the Introduction of this report (see chapter 125) different methodologies are applied for the 2018 estimations (weighted on age gender phone ownership and population size) and the 2018-2016 comparisons (weighted on age gender and population size no phone ownership) making it impossible to compute the 2016 values For example it may appear that the incidence is less than 0 in 2016 (eg in Luxembourg the table shows 21 in 2018 and an increase between 2016 and 2018 of 22pp indicating a 2016 result of -01) If the same weighting is applied the values are close to 0
Consumer Survey 2018
135
Q10 Answers 3 4 and 5 Base Respondents who experienced a problem and took action to solve it (N=3748
for public authoritiesADR N=3670 for court)
Male 76 73 27 A
Female 45 36 21 A
18-34 55 AB 31 A 16 A
35-54 82 B 52 AB 23 A
55-64 65 B 58 AB 32 A
65+ 28 A 162 B 53 A
Low 49 A 67 A 46 A
Medium 57 A 54 A 22 A
High 69 A 55 A 22 A
Very difficult 83 AB 89 AB 68 B
Fairly difficult 85 B 71 B 45 B
Fairly easy 40 A 49 AB 14 A
Very easy 60 AB 35 A 11 A
Rural area 57 A 58 A 27 A
Small town 53 A 53 A 16 A
Large town 76 A 57 A 33 A
Self-employed 75 C 108 C 26 AB
Manager 44 ABC 67 ABC 11 A
Other white collar 38 AB 53 AB 22 AB
Blue collar 81 C 84 BC 45 B
Student 125 BC 25 A 24 AB
Unemployed 58 ABC 42 ABC 20 AB
Seeking a job 22 A 66 ABC 19 AB
Retired 98 C 26 A 22 AB
Age groups
Actions taken to resolve problemsComplained to a
public authority
Complained to
ADR
Took the business
concerned to court
Gender
Education
Financial Situation
Urbanisation
Employment status
Consumer Survey 2018
136
Q10 Answers 3 4 and 5 Base Respondents who experienced a problem and took action to solve it (N=3748
for public authoritiesADR N=3670 for court)
In terms of complaints made to a public authority this indicator is most closely linked with gender followed by consumersrsquo employment status and age
Males are more likely to complain to a public authority than females
In addition jobseekers are less likely to make complaints to a public authority than those who are
self-employed blue collar workers retired and students
Regarding age consumers aged 35-64 years are more likely to complain than those who are aged
65+ years
In terms of complaints made to an ADR this indicator is most closely linked with gender followed by age consumersrsquo employment status and their financial situation
Similar to complaints made to a public authority males are more likely to file their complaints with an ADR than females
Consumers aged 65+ years are more likely to have complained to an ADR than those aged 18-34 years
Only native 58 A 67 A 18 A
Two 61 A 50 A 30 A
Three 65 A 37 A 17 A
Four or more 64 A 77 A 44 A
Not official
language in home
country
115 A 67 A 05
Official language
in home country58 A 55 A 26
Low 82 A 66 A 53 A
Medium 58 A 66 A 25 A
High 61 A 49 A 20 A
Daily 59 A 57 A 27 B
Weekly 61 A 39 A 11 AB
Monthly 169 A 117 A
Hardly ever 99 A 49 A
Never 82 A 43 A 08 A
Very vulnerable 76 A 51 A 34 A
Somewhat
vulnerable59 A 54 A 10
Not vulnerable 57 A 58 A 29 A
Very vulnerable 75 A 66 A 24 A
Somewhat
vulnerable63 A 43 A 25 A
Not vulnerable 57 A 58 A 25 A
Actions taken to resolve problems
Consumer vulnerability
(socio-demographic
factors)
Consumer vulnerability
(complexity)
Complained to
ADR
Took the business
concerned to court
Languages
Mother Tongue
Numerical skills
Internet use
Complained to a
public authority
Consumer Survey 2018
137
In terms of employment self-employed respondents are more likely to complain to an ADR than
other white collars students and those who are retired People in a blue-collar job are also more likely to complain than students and people who are retired
Finally consumers in a fairly difficult financial situation are more likely to involve an ADR than consumers in a very easy financial situation
In terms of taking the business concerned to court this indicator is associated most closely with consumersrsquo financial situation Other characteristics that show close links with the indicator whether a consumerrsquos mother tongue is the official language in their country of residence or not the frequency
of internet use and consumersrsquo employment status
Consumers in a reportedly more difficult financial situation are more likely to take the business concerned to court Those whose situation is reportedly fairly or very difficult are more likely to take such action than those whose situation is reported as fairly or very easy
Those whose mother tongue is one of the official languages of the country or region in which they live are more likely to take the business concerned to court than those whose mother tongue is not
an official language
In terms of internet use daily internet users are more likely to take the business to court than consumers that never use the internet
Finally blue collar workers are more likely to take the business concerned to court than managers
Reasons for not taking action
The reasons why a considerable proportion of consumers that experiences problems do not act (see section 1112) differ widely The most commonly cited reasons are consumersrsquo perception that it would take long to resolve the problem (412) that the sums involved are too small (357) and that consumers find it unlikely to get a satisfactory solution (340) A considerable proportion of consumers are also not comfortable with potential confrontations resulting from complaints (185) have unsuccessfully complained in the past (18) are not sure of their own rights as consumers (179) or do not know where or how to complain (172)
Consumer Survey 2018
138
Q12 Answers 1 2 and 3 Base Respondents who experienced a problem but did not take any action to solve it (N=1417)
2018
( = sig
diff EU27)
2018-
2016
2016-
2014
2014-
2012
2012-
2011
2018
( = sig
diff EU27)
2018-
2016
2016-
2014
2014-
2012
2012-
2011
2018
( = sig
diff EU27)
2018-
2016
2016-
2014
2014-
2012
2012-
2011
EU27_2019 340 +119 -162 +118 -91 357 +18 +05 -27 -43 172 +28 -85 +51 +80
EU28 366 +167 -213 +125 -80 397 +57 -08 -30 -44 201 +50 -91 +38 +85
North 259 -02 -60 +151 -91 372 -39 -47 -02 +116 126 -14 -57 +112 +53
South 425 +141 -92 +84 -120 454 +153 -18 +46 -31 195 +32 -99 +87 +117
East 310 -51 +86 +45 -138 297 -52 +99 -170 -29 162 +01 +42 -12 +27
West 269 +167 -404 +228 +33 277 -85 -57 +52 -03 159 +36 -168 +49 +140
BE 252 +248 -458 +142 -29 307 +257 -397 +135 -107 180 +39 -120 +12 +42
BG 358 +38 -89 +176 -207 178 +88 -105 -24 +02 69 +14 -66 +01 +62
CZ 389 +62 -137 +74 -46 552 +148 +114 -143 +183 205 -61 +05 +78 +127
DK 237 -69 +65 +165 -49 251 -79 -264 -43 +510 47 -140 +112 +105 +26
DE 126 -14 -262 +165 +72 288 -165 -58 +73 -151 134 +20 -188 +147 +31
EE 219 -90 +107 +129 -72 410 +60 -91 +105 +53 61 -15 -48 +53 +08
IE 500 +359 -229 +11 -117 425 +164 +67 -70 -15 284 +131 -200 +246 -25
EL 426 +18 +49 +50 -12 275 +82 +10 -58 -154 331 +133 -104 -25 +182
ES 548 +203 -187 +280 +93 456 +54 -35 +84 -133 283 -83 -34 +250 +164
FR 354 +330 -554 +267 -52 247 -02 -137 +89 +76 173 +45 -161 -88 +269
HR 438 +87 +94 -91 - 327 -12 +68 -38 - 228 -32 +06 +134 -
IT 371 +113 -55 +32 -311 516 +207 -00 +61 +29 104 +39 -114 +67 +49
CY 202 -23 +181 -284 +114 369 +172 +08 -107 +06 147 +01 -20 -32 +49
LV 251 +132 -280 +158 -17 325 -46 +09 -132 +185 150 +38 -96 +47 +157
LT 409 +201 -100 +70 -134 441 +176 +94 -116 +63 235 +93 +67 +38 +26
LU 83 -62 -315 +168 +197 693 +331 -198 +527 -368 80 -03 +87 -441 +347
HU 105 -275 +136 +131 -91 523 -61 +208 -239 +103 73 -09 -75 +49 +49
MT 117 -74 -184 +169 -157 129 -152 +81 -342 +227 00 -207 -99 +250 -245
NL 189 -48 -126 +160 +239 338 -05 +180 -253 +318 105 -42 -149 +162 +156
AT 296 +198 -326 +156 -101 173 -187 -412 +340 +121 90 -60 -103 +110 +143
PL 226 -92 +59 +135 -134 201 -140 +65 -224 +12 84 +12 +29 -45 -55
PT 196 +46 -255 -128 +379 231 +126 -162 -88 +140 265 +58 -81 -94 +342
RO 370 -66 +185 -30 -267 287 -53 +171 -220 -141 242 -17 +120 +01 +25
SI 178 -71 +142 -78 -92 250 +48 +02 +54 -22 134 -152 +101 +40 +83
SK 76 -59 +15 -247 +167 363 -09 -226 +156 +104 00 -55 +19 -161 +167
FI 184 -66 -67 +133 -63 570 -46 +112 -72 +51 112 -09 -65 +79 +16
SE 183 -141 -29 +259 -124 256 -135 -214 +135 +26 82 -88 -208 +269 +67
IS 340 +22 +76 -09 -132 283 -01 -147 -94 +397 265 +10 +236 -330 +330
NO 89 +05 +41 -143 -102 109 -40 +73 -271 +19 47 +22 +24 -118 +118
UK 540 +469 -602 +173 +63 662 +325 -121 -64 -17 394 +210 -166 -93 +184
Reasons for not taking action
Region
Country
Unlikely to get satisfactory solution The sums involved were too small Did not know where or how to complain
Consumer Survey 2018
139
In the European Union the proportion of consumers that did not take action because they thought they were unlikely to get a satisfactory solution is 340 In the East this proportion is in line
with the EU27_2019 average while it is higher in the South (425) and lower in the North (259) and West (269) Among all EU countries31 the highest levels of this indicator are found in Spain (548) Ireland (500) and Estonia (219) The UK (540) also has a high level of this indicator The lowest levels are found in Slovakia (76) Luxembourg (83) and Hungary (105)
Additionally Norway also has a low level of 89
Between 2016 and 2018 the proportion of consumers who did not complain because they thought they were unlikely to get a satisfactory solution increased in the EU27_2019 (+119pp) the West (+167pp) and South (+141pp) while no statistically significant changes are observed in the North and East Compared to the survey in 2016 this proportion increased most notably in Ireland (+359pp) and decreased most prominently in Hungary (-275pp) The largest positive reversal among the EU27_2019 countries is found in France where between 2016 and 2018 the proportion
of consumers that did not complain for this reason increased by 330pp whereas between 2014 and 2016 it decreased by 554pp Considering all studied countries an even larger positive reversal is found in the UK where between 2016 and 2018 this indicator increased by 469pp following a decrease of 602pp between 2014 and 2016 No negative reversals are observed
The proportion of consumers that did not complain because the sums involved were too small is
357 in the European Union In the North this proportion is in line with the EU27_2019 average
while it is higher in the South (454) and lower in the East (297) and West (277) Across the EU Member States the highest levels of this indicator are found in Luxembourg (693) Finland (570) and the Czech Republic (552) Among all studied countries the UK also has a high level of this indicator (662) The lowest levels in the EU are found in Malta (129) Austria (173) and Bulgaria (178)41 Norway also has a low level namely 109
Compared to 2016 the EU27_2019 average as well as the results in the North and the East remained relatively stable while the proportion increased in the South (+153pp) and decreased in the West
(-85pp) The degree to which respondents indicated that the sums involved were too small increased most steeply in Luxembourg (+331pp) There are no statistically significant decreases at country level The only positive reversal is found in Belgium where between 2016 and 2018 this indicator increased by 257pp whereas between 2014 and 2016 it decreased by 397pp No negative reversals are observed
In the European Union consumers did not complain because they did not know where or how to complain in 172 of all cases42 In the South East and West this proportion is in line with the
EU27_2019 average while it is lower in the North (126) Among the EU countries the highest levels of this indicator are observed in Greece (331) Ireland (284) and Spain (283) Considering all studied countries the UK also has a high level for this indicator (394) The lowest levels among all EU Member States are observed in Slovakia Malta (both 00) Denmark (47) and Estonia (61) Among all studied countries the level is also low in Norway (47)
Since 2016 the proportion of consumers that did not know where or how to complain increased in
the EU27_2019 (+28pp) whereas no statistically significant changes are observed in all regions The highest increase in the EU is noted in Greece (+133pp) while the strongest decrease is observed in Malta (-207pp) No positive or negative reversals are found in the EU27_2019 countries Considering all countries in the study the only positive reversal is found in the UK where between 2016 and 2018 this indicator increased by 210pp whereas between 2014 and 2016 it decreased by 166pp
31 Results (for all reasons for not taking action) for all countries except Romania (111) and Greece (116) are based on a very small sample size (less than 100 observations) and should therefore be considered as mainly indicative
41 All cases of respondents who experienced a problem but did not take any action to solve it
Consumer Survey 2018
140
Q12 Answers 1 2 and 3 Base EU27_2019 respondents who experienced a problem but did not take any action
to solve it (N=1297)
Male 357 A 393 A 194 A
Female 326 A 338 A 156 A
18-34 384 A 400 A 207 A
35-54 320 A 348 A 174 A
55-64 333 A 331 A 174 A
65+ 320 A 369 A 133 A
Low 492 B 381 A 286 A
Medium 310 A 394 A 197 A
High 345 AB 329 A 120
Very difficult 227 A 335 A 196 A
Fairly difficult 405 B 330 A 137 A
Fairly easy 325 AB 387 A 205 A
Very easy 380 AB 479 A 232 A
Rural area 321 A 365 A 157 A
Small town 334 A 386 A 139 A
Large town 372 A 333 A 259
Self-employed 434 CD 284 A 269 B
Manager 430 BCD 288 A 136 AB
Other white collar 276 B 373 A 136 A
Blue collar 305 BCD 376 A 175 AB
Student 141 A 442 A 91 A
Unemployed 441 CD 307 A 192 AB
Seeking a job 263 ABC 438 A 161 AB
Retired 472 D 399 A 220 AB
Age groups
Reasons for not taking action
Unlikely to get
satisfactory
solution
The sums involved
were too small
Did not know
where or how to
complain
Gender
Education
Financial Situation
Urbanisation
Employment status
Consumer Survey 2018
141
Q12 Answers 1 2 and 3 Base EU27_2019 respondents who experienced a problem but did not take any action
to solve it (N=1297)
With regard to socio-demographic variables and other characteristics whether a consumerrsquos mother tongue is the official language in their country of residence or not is the factor most closely associated with the likelihood of consumers not taking any action to solve a problem because they thought they were unlikely to get a satisfactory solution The other characteristics showing close links
are frequency of internet use and consumersrsquo employment situation
Consumers whose mother tongue is not one of the official languages of the country or region in which they live are more likely to not take action because they do not believe that they will get a satisfactory solution than those whose mother tongue is one of the official languages
As far as the frequency of internet use is concerned daily and weekly internet users are more likely to report this reason for not taking action than those who used the internet hardly ever or never
Finally retired respondents are more likely to cite this reason for not taking action than jobseekers and people with another white-collar job The latter are in turn more likely to cite this reason than students
Only native 311 A 368 A 179 A
Two 335 AB 353 A 172 A
Three 449 B 349 A 179 A
Four or more 311 AB 509 A 134 A
Not official
language in home
country
589 312 A 276 A
Official language
in home country329 368 A 169 A
Low 300 A 258 A 92 A
Medium 349 A 348 A 212 B
High 343 A 391 A 161 AB
Daily 357 B 371 A 159 A
Weekly 490 B 325 A 210 A
Monthly 374 AB 451 A 269 A
Hardly ever 138 A 183 A 292 A
Never 176 A 390 A 197 A
Very vulnerable 368 AB 322 A 229 A
Somewhat
vulnerable425 B 382 A 217 A
Not vulnerable 266 A 378 A 115
Very vulnerable 316 A 408 AB 112
Somewhat
vulnerable344 A 426 B 192 A
Not vulnerable 351 A 320 A 191 A
Reasons for not taking action
Consumer vulnerability
(socio-demographic
factors)
Consumer vulnerability
(complexity)
The sums involved
were too small
Did not know
where or how to
complain
Languages
Mother Tongue
Numerical skills
Internet use
Unlikely to get
satisfactory
solution
Consumer Survey 2018
142
Regarding the proportion of consumers not taking any action because they believe that the sums
involved are too small there are no close associations with any of the socio-demographic characteristics43
With regard to the likelihood of consumers not taking any action to solve a problem because they did not know where or how to complain consumersrsquo level of education is the factor associated most closely with this indicator The characteristics showing the next closest links are the degree of urbanisation vulnerability due to socio-demographic factors vulnerability due to the complexity of offers and terms and conditions and employment status
Consumers with a low or medium level of education are more likely to not take action because they do not know where or how to complain than those with a high level of education
As far as the degree of urbanisation is concerned consumers living in a large town are less likely to refrain from complaining for this reason than those living in a small town or rural area
Consumers who are very or somewhat vulnerable due to socio-demographic factors are more likely not to take action compared to those who are not vulnerable
In contrast those who are not or somewhat vulnerable in terms of the complexity of offers and terms and conditions are more likely to refrain from complaining due to this reason than those who are very vulnerable
Finally consumers who are self-employed are more likely to report that they do not know where or how to complain compared to people with other white-collar jobs and students
43 While vulnerability due to the complexity of offers and terms and conditions effects this dependent variable as shown by the models estimated variability of this dependent variable there is no coherence of this variability Concretely both consumers that are not vulnerable and very vulnerable show lower levels than consumers that are somewhat vulnerable
Consumer Survey 2018
143
Q12 Answers 4 and 5 - Base Respondents who experienced a problem but did not take any action to solve it
(N=1417)
The proportion of consumers who did not complain because they thought it would take too long is 412 in the European Union This is in line with the results in the North and East while the
proportion is higher than the EU27_2019 average in the South (507) and lower in the West (331) Across the EU Member States the highest levels of this indicator are found in Spain (639) Latvia (555) and Ireland (520) The lowest levels are found in Portugal (32) Malta
(114) and Cyprus (174)
Compared to 2016 the proportion of respondents who did not complain because they expected that it would take too long increased in the EU27_2019 (+76pp) the South (+112pp) and the West (+80pp) while no statistically significant changes are observed in the North and the East The degree to which respondents indicated not being sure of their consumer rights increased most steeply in Ireland (+304pp) and decreased most prominently in Bulgaria (-220pp) Among the EU27_2019
countries the largest positive reversal is found in Belgium where between 2016 and 2018 the proportion increased by 294pp whereas between 2014 and 2016 it decreased by 481pp The largest
2018
( = sig
diff EU27)
2018-
2016
2016-
2014
2014-
2012
2012-
2011
2018
( = sig
diff EU27)
2018-
2016
2016-
2014
2014-
2012
2012-
2011
EU27_2019 412 +76 -47 +47 +81 179 +19 -22 +27 +43
EU28 428 +96 -57 +17 +96 211 +57 -68 +39 +33
North 385 +60 +07 -85 +169 146 -08 -10 +86 +14
South 507 +112 -19 +69 +146 206 +58 -19 +33 +46
East 362 -50 +82 +33 +19 133 -74 +75 -18 +38
West 331 +80 -147 +60 +152 185 +41 -110 +62 +87
BE 360 +294 -481 +262 -114 256 +189 -178 -165 +34
BG 221 -220 +107 +60 +111 51 -56 +10 +05 +71
CZ 479 +85 -17 +22 +212 231 +128 -199 +45 +217
DK 328 +03 +230 -305 +294 132 -35 -24 +129 -36
DE 255 -06 +105 -177 +300 158 +14 -15 +03 +32
EE 473 +19 +67 +58 +77 188 +46 +50 +50 -03
IE 520 +304 +64 -91 +50 267 +152 -115 +132 -188
EL 463 -24 +112 +04 +64 274 +88 -136 +104 +41
ES 639 +52 +35 +122 +20 327 -74 +52 +21 +228
FR 367 +126 -284 +106 +100 202 +21 -137 +95 +161
HR 472 +88 +50 +40 - 214 +104 -100 +70 -
IT 479 +153 -34 +64 +220 125 +85 -01 +37 -52
CY 174 -79 +167 -159 +106 35 -102 +141 -95 +95
LV 555 +163 -134 -22 +233 133 +62 -180 +169 +53
LT 471 +68 +115 -02 +54 247 +177 -46 +23 +59
LU 366 +20 -12 -69 +311 122 -43 -108 -03 +89
HU 202 -10 -143 +118 -26 73 -08 -92 +102 +06
MT 114 +61 -96 +77 +118 154 +68 -336 +320 +53
NL 300 +58 -11 +95 -10 92 +61 -63 -12 +74
AT 293 -38 -34 +330 +14 137 +99 -135 +119 +89
PL 192 -150 +54 +52 -04 29 -269 +183 -66 +82
PT 32 -184 -337 +237 +182 110 +19 -137 +06 +94
RO 495 -67 +175 +09 -22 190 -74 +147 +02 -77
SI 307 +29 +35 +43 -67 134 -52 -133 +264 +03
SK 256 +98 +120 -218 +159 174 +125 +10 -95 -22
FI 179 +20 -97 +88 +31 127 -95 +106 +25 -88
SE 329 -14 -29 -197 +332 54 -133 -20 +171 +67
IS 510 +346 -112 -75 +152 398 +375 -128 +151 00
NO 213 +58 -175 -30 +97 100 +45 +55 -117 +117
UK 534 +236 -143 -286 +314 429 +316 -456 +121 +44
Reasons for not taking action
Region
Country
Thought it would take too long Were not sure of own rights as a consumer
Consumer Survey 2018
144
negative reversal is found in Portugal where between 2016 and 2018 the proportion decreased by
184pp following an increase of 337pp between 2014 and 2016
The proportion of respondents who did not complain because they were not sure of their consumer rights is 179 in the European Union In the North South and West the results are in line with the EU27_2019 average whereas the proportion is lower in the East (133) The highest levels of this indicator in the EU32 are found in Spain (327) Greece (274) and Ireland (267) High levels of this indicator are also found in the UK (429) and Iceland (398) The lowest levels of this indicator are found in Poland (29) Cyprus (35) and Bulgaria (51)
Compared to 2016 the proportion of respondents who did not complain because they were unsure about their consumer rights increased in the EU27_2019 (+19pp) decreased in the East (-74pp) and remained statistically unchanged in the North South and West Across all EU Member States this proportion increased most steeply in Belgium (+189pp) and decreased most prominently in Poland (-269pp) Among the EU Member States the largest positive reversal is also found in Belgium where the large increase between 2016 and 2018 (see above) follows a decrease of 178pp
between 2014 and 2016 No negative reversal is found Considering all studied countries an even larger positive reversal is found in the UK where between 2016 and 2018 this indicator increased by
316pp whereas between 2014 and 2016 it decreased by 456pp
32 Results (for all reasons for not taking action) for all countries except Romania (111) and Greece (116) are based on a very small sample size (less than 100 observations) and should therefore be considered as mainly indicative
Consumer Survey 2018
145
Q12 Answers 4 and 5 - Base EU27_2019 respondents who experienced a problem but did not take any action
to solve it (N=1297)
Male 373 181 A
Female 457 177 A
18-34 448 A 198 A
35-54 413 A 169 A
55-64 373 A 123 A
65+ 397 A 218 A
Low 323 A 270 A
Medium 398 A 170 A
High 458 A 172 A
Very difficult 421 A 165 A
Fairly difficult 424 A 152 A
Fairly easy 416 A 216 A
Very easy 338 A 190 A
Rural area 359 A 152 A
Small town 440 A 191 A
Large town 430 A 188 A
Self-employed 471 CD 245 A
Manager 260 A 102 A
Other white collar 514 D 163 A
Blue collar 443 BCD 139 A
Student 476 ABCD 180 A
Unemployed 362 ABCD 201 A
Seeking a job 319 ABC 280 A
Retired 281 AB 190 A
Financial Situation
Urbanisation
Employment status
Reasons for not taking actionThought it would
take too long
Were not sure of
own rights as a
consumer
Gender
Age groups
Education
Consumer Survey 2018
146
Q12 Answers 4 and 5 - Base EU27_2019 respondents who experienced a problem but did not take any action
to solve it (N=1297)
When looking at the proportion of consumers that did not take action because they thought that this would take too long the socio-demographic variable most closely associated with this indicator is whether a consumerrsquos mother tongue is the official language in their country of residence or not The other characteristics with close links are gender numerical skills and employment status
Consumers whose mother tongue is not one of the official languages of the country or region they live in are more likely to refrain from taking action because they thought that this would take too long compared to those whose mother tongue is one of the official languages
As far as gender is concerned females are also more likely to refrain from taking action due to this reason compared to males
Consumers with a low numerical skill level are more likely not to take action because they thought
that this would take too long than those with high numerical skills
Finally other white collars and those who are self-employed are more likely to report this reason than managers and consumers who are retired Blue collar workers are also more likely than managers to report this reason while other white collars are more likely than those seeking a job to report this reason
With regard to socio-demographic variables and other characteristics the likelihood of consumers not taking any action because they were not sure of their rights as a consumer is not associated
closely with any of the socio-demographic variables
Only native 404 A 138 A
Two 424 A 209 A
Three 450 A 216 A
Four or more 306 A 162 A
Not official
language in home
country
611 291 A
Official language
in home country404 172 A
Low 544 B 161 A
Medium 408 AB 210 A
High 401 A 161 A
Daily 399 A 175 BC
Weekly 517 A 320 C
Monthly 568 A 26 A
Hardly ever 502 A 168 ABC
Never 403 A 138 B
Very vulnerable 379 A 185 A
Somewhat
vulnerable422 A 194 A
Not vulnerable 431 A 164 A
Very vulnerable 418 A 197 A
Somewhat
vulnerable434 A 189 A
Not vulnerable 396 A 173 A
Consumer vulnerability
(complexity)
Reasons for not taking action
Languages
Mother Tongue
Numerical skills
Internet use
Consumer vulnerability
(socio-demographic
factors)
Thought it would
take too long
Were not sure of
own rights as a
consumer
Consumer Survey 2018
147
Q12 Answers 6 and 7 - Base Respondents who experienced a problem but did not take any action to solve it
(N=1417)
The proportion of consumers who have not taken action because of their experiences with unsuccessfully complaining in the past is 180 in the European Union In the East this
2018
( = sig
diff EU27)
2018-
2016
2016-
2014
2014-
2012
2012-
2011
2018
( = sig
diff EU27)
2018-
2016
2016-
2014
EU27_2019 180 +19 -53 +79 +33 185 +58 -42
EU28 192 +29 -65 +74 +35 196 +77 -59
North 88 +16 -75 +61 +58 109 -36 +10
South 271 +105 -150 +213 +35 274 +154 -61
East 168 -72 +126 -39 +18 191 -40 +92
West 89 -37 -53 +20 +100 79 -06 -106
BE 135 +99 -87 -115 +69 99 -09 -157
BG 95 -50 +12 -30 +102 09 -34 -49
CZ 212 -31 +43 -47 +178 389 +71 -104
DK 57 -62 +55 -50 +140 00 -97 +97
DE 38 -78 -42 +38 +83 64 -11 -180
EE 35 -22 +29 -24 +36 146 +50 +61
IE 332 +175 +42 +55 +32 283 +121 -28
EL 302 +171 -86 +10 +12 247 +153 -178
ES 331 -101 +04 +299 +24 346 +10 -03
FR 103 -47 -57 -46 +246 58 -47 -59
HR 220 +02 +71 +24 - 251 +164 -94
IT 241 +158 -207 +256 +19 254 +207 -37
CY 180 +60 -75 +16 +52 147 +66 -165
LV 80 +57 -172 +202 +06 40 -61 -40
LT 203 +132 -19 -39 +96 250 +31 +18
LU 39 -20 +15 -154 +136 115 +90 -15
HU 140 -347 +382 +32 +38 108 -117 +87
MT 00 -128 +128 -199 +89 138 +146 -180
NL 20 -106 +20 +136 -316 108 +116 -80
AT 122 +34 -50 +80 +07 203 +76 -114
PL 152 -83 +113 -09 +23 66 -142 +96
PT 91 +123 -239 -15 +227 88 +22 -275
RO 191 -10 +122 -105 -75 296 -33 +184
SI 41 -185 +212 -53 +84 25 -190 +215
SK 113 +25 -57 -10 +169 17 -08 -21
FI 49 -32 -50 +35 +27 195 +40 -22
SE 36 -29 -190 +179 +62 00 -137 +14
IS 164 +85 -29 -347 +417 263 +282 -123
NO 00 00 00 +03 -28 00 00 00
UK 268 +102 -168 +17 +91 270 +191 -183
Reasons for not taking action
Region
Country
Tried to complain unsuccessfully in the past
Not at ease with potential
confrontations resulting from
complaints
Consumer Survey 2018
148
proportion is consistent with the EU27_2019 average while it is higher in the South (271) and
lower in the North (88) and in the West (89) Across the EU Member States3333 the highest levels of this indicator are found in Ireland (332) Spain (331) and Greece (302) The lowest levels in the EU are found in Malta (00) the Netherlands (20) and Estonia (35) In addition the level is also zero in Norway
Compared to 2016 the proportion of respondents that indicated not having taken action because they complained unsuccessfully in the past remained stable in the EU27_2019 in the North and West while it increased in the South (+105pp) and decreased in the East (-72pp) At country level
the proportion to which respondents complained unsuccessfully in the past increased most steeply in Ireland (+175pp) and decreased most prominently in Hungary (-347pp) The only positive reversal is found in Italy where between 2016 and 2018 the indicator increased by 158pp whereas between 2014 and 2016 it decreased by 207pp The only negative reversal is also found in Hungary where the decrease between 2016 and 2018 (see above) was preceded by an increase of 382pp between 2014 and 2016
The proportion of respondents who indicated that they had not complained because they wanted to avoid a confrontation is 185 in the European Union The proportion is in line with the EU27_2019
average in the East whereas it is higher in the South (274) and lower in the North (109) and West (79) Across all EU countries the highest levels of this indicator are found in the Czech Republic (389) Spain (346) and Romania (296) The lowest levels in the EU are found in Denmark Sweden (both 00) Bulgaria (09) and Slovakia (17) Among all studied countries Norway also has a low level of 00
When comparing the results with 2016 the proportion of respondents reporting this reason increased in the EU27_2019 (+58pp) and the South (+154pp) while results remained unchanged in the North East and West At country level the highest increase in the EU is observed in Italy (+207pp) while the largest decrease is observed in Slovenia (-190pp) Considering all countries of the study an even larger increase is observed in Iceland (+282pp) When looking at changes in 2018 (vs 2016) and in 2016 (vs 2014) the largest positive reversal is found in Greece where between 2016 and 2018 this indicator increased by 153pp whereas between 2014 and 2016 it decreased by
178pp No statistically significant negative reversal is found Considering all countries of the study the largest positive reversal is found in the UK where between 2016 and 2018 this indicator increased by 191pp following a decrease of 183pp between 2014 and 2016
33 Results (for all reasons for not taking action) for all countries except Romania (111) and Greece (116) are based on a very small sample size (less than 100 observations) and should therefore be considered as mainly indicative In 2018 the weighting approach was altered to include phone ownership
33 To ensure comparability between the 2018 and 2016 waves the differences between 2018 and 2016 were computed based on the previous weighting procedure applied systematically for both waves This may result in discrepancies between the figures reported for 2018 and the differences between 2018 and 2016
Consumer Survey 2018
149
Q12 Answers 6 and 7 - Base EU27_2019 respondents who experienced a problem but did not take any action
to solve it (N=1297)
Male 200 A 160 A
Female 163 A 213 A
18-34 161 A 195 A
35-54 207 A 174 A
55-64 191 A 190 A
65+ 153 A 198 A
Low 168 A 189 A
Medium 177 A 210 A
High 187 A 156 A
Very difficult 190 AB 191 A
Fairly difficult 149 A 173 A
Fairly easy 228 B 186 A
Very easy 114 A 240 A
Rural area 188 A 238 A
Small town 189 A 139
Large town 159 A 216 A
Self-employed 194 BC 121 AB
Manager 86 AB 108 A
Other white collar 181 C 195 ABC
Blue collar 80 A 159 ABC
Student 181 ABC 119 AB
Unemployed 246 BC 327 C
Seeking a job 146 ABC 124 AB
Retired 285 C 251 BC
Reasons for not taking action
Tried to complain
unsuccessfully in
the past
Not at ease with
potential
confrontations
resulting from
complaints
Gender
Age groups
Education
Financial Situation
Urbanisation
Employment status
Consumer Survey 2018
150
Q12 Answers 6 and 7 - Base EU27_2019 respondents who experienced a problem but did not take any action
to solve it (N=1297)
With regard to socio-demographic variables and other characteristics the likelihood of consumers not taking any action because they had tried to complain unsuccessfully in the past is associated most closely with consumersrsquo numerical skills followed by their vulnerability due to socio-demographic factors and their employment status
Consumers who have a medium or high numerical skill level are more likely to cite their unsuccessful
attempts to complain in the past as a reason for not taking action compared to those with low numerical skills
Consumers who are very vulnerable due to socio-demographic factors are more likely to cite this reason than those who are not vulnerable
Finally regarding consumersrsquo employment status other white collars and those who are retired are also more likely to report this reason for not taking action compared to managers and blue-collar workers
With regard to socio-demographic variables and other characteristics vulnerability due to the socio-demographic factors is the factor most closely associated with the proportion of respondents that has not taken action because they are not at ease with potential confrontations resulting from
Only native 182 A 171 A
Two 170 A 207 A
Three 210 A 196 A
Four or more 145 A 155 A
Not official
language in home
country
314 A 299 A
Official language
in home country173 A 181 A
Low 89 167 A
Medium 210 A 173 A
High 172 A 202 A
Daily 171 A 176 A
Weekly 229 A 300 A
Monthly 220 A 126 A
Hardly ever 377 A 196 A
Never 136 A 184 A
Very vulnerable 234 B 227 A
Somewhat
vulnerable194 AB 230 A
Not vulnerable 135 A 130
Very vulnerable 202 A 116
Somewhat
vulnerable211 A 220 A
Not vulnerable 154 A 204 A
Tried to complain
unsuccessfully in
the past
Not at ease with
potential
confrontations
resulting from
complaints
Consumer vulnerability
(complexity)
Reasons for not taking action
Languages
Mother Tongue
Numerical skills
Internet use
Consumer vulnerability
(socio-demographic
factors)
Consumer Survey 2018
151
complaints Other characteristics showing close links with this indicator are vulnerability due to the
complexity of offers and terms and conditions the degree of urbanisation and employment status
Consumers who are very or somewhat vulnerable in terms of socio-demographic factors are more likely to refrain from taking actions because they want to avoid potential confrontations than those who are not vulnerable
In contrast consumers who are not vulnerable in terms of the complexity of offers and terms and conditions are more likely to refrain from action due to this reason than those who are very or somewhat vulnerable
Consumers who live in a rural area or large town are more likely to indicate they are not at ease with potential confrontations resulting from complaints compared to those living in a small town
Finally with regard to employment status consumers who are unemployed and retired are more likely to not take action for this reason than those who are self-employed managers students and jobseekers
Consumer Survey 2018
152
Satisfaction with problem resolution
Average proportion of satisfied consumers (ldquoVery satisfiedrdquo and ldquoFairly satisfiedrdquo) with Q1144 options Q111 to
Q11545 - Base Respondents that took at least one of five different actions to solve a problem (N=4200)
44 Q11 In general how satisfied or dissatisfied were you with the way your complaint(s) was (were) dealt with by the hellip
-Very satisfied ndashFairly satisfied ndash Not very satisfied ndashNot at all satisfied ndash DKNA Q51 Retailer or service provider Q52 Manufacturer Q53 Public authority Q54 An out-of-court dispute resolution body (ADR) Q55 Court
45 Consumersrsquo average satisfaction was computed across the different instances to which they issued a complaint (eg if a consumer only complained to a manufacturer only his evaluation of the manufacturer was taken into
Region
Country
2018 2018-
2016
2016-
2014
2014-
2012
EU27_2019 570 -40 +23 -35
EU28 591 -39 +35 -30
North 684 +37 -29 -57
South 517 +44 -31 +06
East 597 -12 +19 -71
West 594 -153 +97 -25
BE 493 -84 -152 +170
BG 331 -49 -05 -155
CZ 602 -54 +100 -77
DK 637 -13 +21 -115
DE 597 -196 +108 -18
EE 642 +84 -33 -16
IE 702 -08 +116 -14
EL 479 +77 -74 +05
ES 470 +85 -78 +00
FR 454 -273 +139 -56
HR 445 -127 +132 -54
IT 551 +03 +01 -06
CY 438 +12 -02 -60
LV 553 +65 -12 -76
LT 527 +43 +30 -207
LU 733 -83 +142 +150
HU 693 -26 +73 +13
MT 427 -71 +143 -31
NL 763 +37 +137 -77
AT 720 -78 +112 +28
PL 645 -10 +30 -74
PT 458 +29 +15 -176
RO 482 +55 -91 -61
SI 632 -53 +181 -255
SK 738 +192 -62 -107
FI 771 +14 -12 +17
SE 697 +75 -81 -36
IS 600 +66 -141 -52
NO 764 +104 -07 -93
UK 656 -170 +202 -10
Average satisfaction with complaint handling
Consumer Survey 2018
153
The average satisfaction with complaint handling is 570 in the European Union The satisfaction
is 597 in the East and 594 West while it is 644 in the North and 517 in the South For the EU Member States46 the highest satisfaction levels are observed in Finland (771) the Netherlands (763) and Slovakia (738) In Norway the average satisfaction is also high (764) The lowest levels are found in Bulgaria (331) Malta (427) and Cyprus (438)
Compared to 2016 consumersrsquo average satisfaction with complaint handling decreased in the EU27_2019 (-40pp) and in the West (-153pp) while only relatively small changes were observed
for the North (+37pp) South (+44pp) or East (-12pp) At country-level the indicator increased most noticeably in Slovakia (+192pp) while it decreased most steeply in France (-273pp) In France also the highest negative reversal is found where the decrease between 2016 and 2018 was preceded by an increase of +139pp between 2014 and 2016 No noticeable positive reversals are found
Consumersrsquo satisfaction with the problem resolution differs based on the parties involved When a problem was resolved with the retailer or service provider satisfaction was highest (602) Problem
resolutions achieved via an ADR platform (509) the manufacturer (490) the court (453) and public authorities (422) was also relatively high
account) The indicator was then calculated as the proportion of satisfied respondents (fairly amp very satisfied) across all individual evaluations
Given the way this indicator is calculated not statistical differences are computed 46 Results for the following countries are based on a very small sample size (observations from less than 100
respondents) and they should therefore be considered as mainly indicative Greece (92) France (70) Luxembourg (48) Austria (87) Bulgaria (68) Cyprus (24) Malta (66) and Iceland (79)
Consumer Survey 2018
154
Q111 and Q112 Total ldquoSatisfiedrdquo (Answers 1 and 2)
Base for Q111 Respondents who complained about a problem to the retailer or service provider (N=3780) Base for Q112 Respondents who complained about a problem to the manufacturer (N=593)
Consumersrsquo satisfaction with how retailers or service providers dealt with their complaints
is 602 in the European Union In the East and West satisfaction is in line with the EU27_2019 average while satisfaction is higher in the North (708) and lower in the South (557) Among
the EU Member States35 the highest levels of this indicator are found in Finland (788) the Netherlands (785) and Luxembourg (779) Among all the studied countries this level is highest in Norway (791) The lowest levels in the EU are found in Bulgaria (386) France (426) and Portugal (446)
35 Results for the following countries are based on a very small sample size (less than 100 observations) and should therefore be considered as mainly indicative Lithuania (99) Belgium (98) Iceland (77) Greece (73) Austria (73) France (60) Malta (60) Bulgaria (53) Luxembourg (40) Cyprus (18)
2018
( = sig
diff EU27)
2018-
2016
2016-
2014
2014-
2012
2018
( = sig
diff EU27)
2018-
2016
2016-
2014
2014-
2012
EU27_2019 602 -07 +28 -58 490 -154 +40 +01
EU28 621 +01 +30 -49 527 -156 +87 -06
North 708 +33 -04 -61 674 +85 -72 -46
South 557 +78 -19 -17 429 -29 -48 +36
East 622 -01 +34 -80 542 -69 -10 -39
West 615 -135 +114 -59 552 -203 +60 +30
BE 520 -105 -116 +228 420 -94 -198 +51
BG 386 +06 +65 -238 513 +177 -107 -171
CZ 604 -85 +102 -54 555 +35 +63 -67
DK 684 -32 +67 -124 609 +73 -78 -27
DE 634 -144 +109 -64 593 -287 +96 +59
EE 649 +82 -10 -33 561 +59 -338 +243
IE 703 -37 +150 -17 666 +50 +58 -72
EL 473 +86 -53 -38 389 +189 -333 -82
ES 479 +93 -74 -21 417 +159 -153 -13
FR 426 -363 +253 -107 00 -616 +108 +24
HR 480 -82 +105 -74 318 -331 +253 +63
IT 613 +74 +04 -37 431 -194 +40 +87
CY 385 -73 +69 -115 657 -187 +245 +239
LV 595 +66 +20 -81 516 +60 -131 -90
LT 550 +10 +142 -241 684 +514 -332 -73
LU 779 -32 +85 +215 783 -25 +113 +166
HU 715 -21 +60 +10 542 +211 -324 +20
MT 469 +11 +51 +28 161 -580 +562 -428
NL 785 +70 +117 -63 670 -98 +127 -02
AT 716 -52 +83 +12 952 +84 +147 +13
PL 665 +10 +51 -97 630 -78 +22 -43
PT 446 +28 +12 -237 543 +81 -96 +65
RO 495 +45 -92 -19 457 +43 -167 -95
SI 641 -57 +141 -190 721 +288 +137 -565
SK 758 +226 -75 -119 420 -262 +125 -73
FI 788 +21 -00 +24 715 -29 +46 -117
SE 709 +67 -69 -42 737 +173 -118 +64
IS 572 +30 -144 -75 743 +509 -201 -141
NO 791 +140 -18 -114 634 -175 +92 +108
UK 687 -135 +197 -11 615 -229 +278 -21
Satisfaction with problem resolution
Region
Country
Satisfaction with retailer or service
providerSatisfaction with manufacturer
Consumer Survey 2018
155
Compared to 2016 the respondentsrsquo satisfaction with how retailers or service providers dealt with
their complaints remained stable in the EU27_2019 the North and East while it increased in the South (+78pp) and decreased in the West (-135pp) Compared to the survey in 2016 this type of satisfaction increased most markedly in Slovakia (+226pp) and decreased most in France (-363pp) When looking at changes in 2018 (vs 2016) and in 2016 (vs 2014) no statistically significant positive reversal is found The only negative reversal is found in France where the decrease between 2016 and 2018 (see above) was preceded by an increase of 253pp between 2014 and 2016
The respondentsrsquo satisfaction with how manufacturers dealt with their complaints is 490
in the European Union The satisfaction with manufacturers in the South East and West is in line with the EU27_2019 average while the satisfaction is higher in the North (674) Among the EU Member States36 the highest levels of this indicator are found in Austria (952) Luxembourg (783) and Sweden (737) Considering all countries of the study high levels are also found in Iceland (743) The lowest levels are found in France (00) Malta (161) and Croatia (318)
Compared to 2016 satisfaction with how manufacturers dealt with consumer complaints decreased
in the EU27_2019 (-154pp) and the West (-203pp) whereas it remained statistically stable in the North South and East At country-level this type of satisfaction increased most steeply in Lithuania
(+514pp) whereas it decreased most in France (-616pp) No statistically significant positive reversal is found The largest negative reversal is found in Malta where between 2016 and 2018 this indicator decreased by 580pp whereas between 2014 and 2016 it increased by 562pp
36 Results for all countries are based on a very small sample size (less than 100 observations) and should therefore be considered as mainly indicative
Consumer Survey 2018
156
Q111 and Q112 Total ldquoSatisfiedrdquo (Answers 1 and 2)
Base for Q111 Respondents who complained about a problem to the retailer or service provider (N=3227) Base for Q112 Respondents who complained about a problem to the manufacturer (N=483)
Male 599 A 483 A
Female 613 A 526 A
18-34 576 A 562 B
35-54 632 A 362 A
55-64 582 A 550 B
65+ 628 A 584 AB
Low 620 A 631 A
Medium 597 A 515 A
High 611 A 454 A
Very difficult 542 A 558 AB
Fairly difficult 596 A 384 A
Fairly easy 621 A 570 B
Very easy 621 A 543 AB
Rural area 598 A 497 A
Small town 603 A 462 A
Large town 617 A 549 A
Self-employed 539 A 357 A
Manager 585 AB 707 C
Other white collar 646 B 473 AB
Blue collar 594 AB 538 ABC
Student 709 B 474 ABC
Unemployed 548 AB 689 BC
Seeking a job 655 AB 589 ABC
Retired 546 AB 450 ABC
Satisfaction with problem resolution
Satisfaction with
retailer or service
provider
Satisfaction with
manufacturer
Gender
Age groups
Education
Financial Situation
Urbanisation
Employment status
Consumer Survey 2018
157
Q111 and Q112 Total ldquoSatisfiedrdquo (Answers 1 and 2)
Base for Q111 Respondents who complained about a problem to the retailer or service provider (N=3227) Base for Q112 Respondents who complained about a problem to the manufacturer (N=483)
Consumersrsquo satisfaction with problem resolutions provided by retailers or service providers is associated most closely with vulnerability due to the complexity of offers and terms and conditions followed by employment status
Consumers that are very or somewhat vulnerable report being less satisfied with the problem resolutions provided by retailers and service providers than consumers who are not vulnerable
In addition consumersrsquo satisfaction with retailers and service providers in this respect is lowest for self-employed consumers which is lower than for other white collars and students
When solutions are provided by manufacturers consumersrsquo satisfaction is most closely linked with consumersrsquo numerical skills vulnerability due to the complexity of offers and terms and conditions age and employment situation
Consumers with low numerical skills are less likely to be satisfied with the manufacturersrsquo solutions than consumers with high numerical skills
Only native 588 A 436 A
Two 601 A 600 B
Three 629 A 393 A
Four or more 628 A 481 AB
Not official
language in home
country
535 A 448 A
Official language
in home country610 A 501 A
Low 598 A 286 A
Medium 595 A 445 AB
High 611 A 552 B
Daily 608 B 400 A
Weekly 655 B 639 A
Monthly 530 AB 503 A
Hardly ever 285 A
Never 549 AB 638 A
Very vulnerable 660 B 455 A
Somewhat
vulnerable566 A 507 A
Not vulnerable 613 AB 507 A
Very vulnerable 503 A 314 A
Somewhat
vulnerable553 A 484 AB
Not vulnerable 648 559 B
Satisfaction with
retailer or service
provider
Satisfaction with
manufacturer
Consumer vulnerability
(complexity)
Satisfaction with problem resolution
Languages
Mother Tongue
Numerical skills
Internet use
Consumer vulnerability
(socio-demographic
factors)
Consumer Survey 2018
158
Furthermore consumers who are very vulnerable due to the complexity of offers and terms and
conditions are less satisfied with solutions provided by manufacturers than consumers that do not perceive themselves as vulnerable
Regarding age consumers who are 18-34 years or 55-64 years report higher satisfaction with the problem resolution obtained with the manufacturer than those who are aged 35-54
Finally the satisfaction with manufacturers for problem resolution is higher for managers which in turn is higher than for consumers who are self-employed or other white collars
Q113 Q114 and Q115 Total Satisfied (ldquovery satisfiedrdquo and ldquoFairly satisfiedrdquo) Due to a limited sample size per
country country results could not be calculated Base for Q113 Respondents who complained about a problem to a public authority (N=299)
Base for Q114 Respondents who complained about a problem to an out-of-court dispute resolution body (ADR) such as an ombudsman arbitration mediation or conciliation body (N=194)
Base for Q115 Respondents who complained about a problem to an out-of-court dispute resolution body (ADR) such as an ombudsman arbitration mediation or conciliation body (N=75)
Overall satisfaction37 with how public authorities dealt with complaints is 422 in the European Union The EU27_2019 average is statistically in line with all regions Consumersrsquo satisfaction with public authorities has decreased since 2016 in the EU27_2019 (-150pp) and the West (-183pp)
while no statistically significant changes are observed in the East South and North
Satisfaction with ADR (Alternative Dispute Resolution) is 509 in the European Union and the
satisfaction in all regions is in line with the EU27_2019 average Compared to 2016 satisfaction with ADR decreased in the EU27_2019 (-115pp) and the West (-274pp) while it is statistically stable in the North South and East
Finally the average satisfaction with courts is 453 in the European Union The satisfaction in the South East and West is in line with the EU27_2019 average while satisfaction in the North (176) is lower (176) Compared to 2016 the satisfaction with courts remained statistically stable in the EU27_2019 and all four regions
37 Due to the exceptionally low sample sizes achieved for the last three satisfaction questions only EU27_2019 and region averages are reported
2018
( = sig
diff EU27)
2018-
2016
2016-
2014
2014-
2012
2018
( = sig
diff EU27)
2018-
2016
2016-
2014
2014-
2012
2018
( = sig
diff EU27)
2018-
2016
2016-
2014
2014-
2012
EU27_2019 422 -150 -12 +129 509 -115 -30 +150 453 +105 -100 -71
EU28 461 -135 -22 +115 541 -128 +01 +106 457 +103 -103 -57
North 339 -05 -286 -38 652 +63 -104 +31 176 -142 +13 +205
South 389 +32 -135 +48 429 -106 -50 +215 656 +220 +108 +09
East 383 -113 +74 -28 594 -05 -48 +130 571 +375 -502 -34
West 550 -183 -25 +333 598 -274 +126 +115 268 -95 -54 -138
Satisfaction with problem resolution
Region
Country
Satisfaction with public authority Satisfaction with ADR Satisfaction with court
Consumer Survey 2018
159
Q113 Q114 and Q115 Total Satisfied (ldquovery satisfiedrdquo and ldquoFairly satisfiedrdquo)
Base for Q113 Respondents who complained about a problem to a public authority (N=259) Base for Q114 Respondents who complained about a problem to an out-of-court dispute resolution body
(ADR) such as an ombudsman arbitration mediation or conciliation body (N=152) Base for Q115 Respondents who complained about a problem to an out-of-court dispute resolution body
(ADR) such as an ombudsman arbitration mediation or conciliation body (N=61) Because of the low sample size the model for satisfaction with court excludes numerical skills vulnerability
(terms and conditions) and the covariate variable regions
Male 420 A 574 496
Female 451 A 348 233
18-34 348 A 484 AB 520 A
35-54 500 A 622 B 481 A
55-64 367 A 479 AB 499 A
65+ 363 A 338 A 117
Low 661 A 190 331 A
Medium 394 A 481 A 462 A
High 413 A 614 A 437 A
Very difficult 388 AB 505 A 621 B
Fairly difficult 349 A 553 A 337 AB
Fairly easy 503 AB 461 A 522 AB
Very easy 617 B 572 A 175 A
Rural area 485 A 424 A 404 A
Small town 391 A 421 A 357 A
Large town 440 A 711 480 A
Self-employed 352 AB 396 B 05 A
Manager 417 AB 389 AB 568 BCDE
Other white collar 475 B 491 B 132 ABC
Blue collar 448 AB 569 BC 527 D
Student 227 A 808 CD 454 CD
Unemployed 331 AB 908 D 36 AB
Seeking a job 496 AB 90 A
Retired 565 B 643 BCD 932 E
Financial Situation
Urbanisation
Employment status
Satisfaction with
courtSatisfaction with problem resolution
Satisfaction with
public authority
Satisfaction with
ADR
Gender
Age groups
Education
Consumer Survey 2018
160
Q113 Q114 and Q115 Total Satisfied (ldquovery satisfiedrdquo and ldquoFairly satisfiedrdquo)
Base for Q113 Respondents who complained about a problem to a public authority (N=259) Base for Q114 Respondents who complained about a problem to an out-of-court dispute resolution body
(ADR) such as an ombudsman arbitration mediation or conciliation body (N=152) Base for Q115 Respondents who complained about a problem to an out-of-court dispute resolution body
(ADR) such as an ombudsman arbitration mediation or conciliation body (N=61) Because of the low sample size the model for satisfaction with court excludes numerical skills vulnerability
(terms and conditions) and the covariate variable regions
Satisfaction with complaint handling by public authorities is associated most closely with vulnerability due to socio-demographic factors followed by employment status
Consumers that feel very vulnerable due to their socio-demographic status are more likely to be
satisfied with the public authoritiesrsquo solutions than consumers that are somewhat or not vulnerable
Regarding consumersrsquo employment status the proportion of consumers that are satisfied with public authoritiesrsquo problem resolutions is lowest among students which is lower than for other white collars and retired persons
Consumersrsquo satisfaction with the way their complaint was dealt with by the ADR is associated most closely with consumersrsquo education level The characteristics with the next closest link are gender employment status the degree of urbanisation and the frequency of internet use
Only native 328 A 478 AB 468 A
Two 512 B 655 B 386 A
Three 418 AB 358 A 545 A
Four or more 472 AB 311 A 413 A
Not official
language in home
country
294 A 337 A 97
Official language
in home country443 A 517 A 437
Low 355 A 327 A
Medium 518 A 509 A
High 397 A 525 A
Daily 406 A 455 410 A
Weekly 744 B 811 A 725 A
Monthly 233 A
Hardly ever 675 AB
Never 385 A 838 A 361 A
Very vulnerable 626 524 A 382 A
Somewhat
vulnerable387 A 633 A 701
Not vulnerable 337 A 448 A 354 A
Very vulnerable 399 AB 221 A
Somewhat
vulnerable303 A 465 AB
Not vulnerable 500 B 587 B
Internet use
Consumer vulnerability
(socio-demographic
factors)
Consumer vulnerability
(complexity)
Satisfaction with problem resolutionSatisfaction with
court
Languages
Mother Tongue
Numerical skills
Satisfaction with
public authority
Satisfaction with
ADR
Consumer Survey 2018
161
Regarding education satisfaction is higher for medium or highly educated consumers compared to
consumers with a low education level
Furthermore male consumers are also more satisfied with solutions by the ADR than female consumers
Higher satisfaction with the ADR is also observed for those who are unemployed and students who are more satisfied than jobseekers self-employed managers and other white collars Unemployed consumers are also more satisfied than blue collar workers and those who are retired are more satisfied than jobseekers
Consumers living in a large town are more satisfied with solutions by the ADR than those living in a small town or rural area
Finally consumers who use the internet never or only weekly are more satisfied with ADR solutions compared to daily internet users
Regarding the socio-demographic variables that have links with consumersrsquo satisfaction with
complaint handling by courts whether a consumerrsquos mother tongue is the official language in their
country of residence or not is the factor most closely associated with this indicator The characteristics with next closest links with this indicator are employment status gender age and financial situation It must be noted however that due to a very low sample size these findings should be considered as purely indicative
Consumers whose mother tongue is the official language in their country of residence are much more likely to be satisfied with the courtsrsquo resolution than consumers whose mother tongue is different from the language in their country of residence
In addition the levels for this indicator are highest among the retired which is higher than for self-employed other white collars blue collar workers students and the unemployed In contrast for self-employed and unemployed persons the levels are lower than for most other categories including blue collar workers students retired as well as managers (only for self-employed)
As far as gender is concerned male consumers are also more likely to be satisfied than female consumers
Consumers aged 65 years and older are less likely to be satisfied with solutions achieved through
the court compared to all other age groups
Finally consumers in a very difficult financial situation are more likely to be satisfied with the solution reached through courts than consumers in a very easy financial situation
Consumer Survey 2018
162
Problems making purchases in other EU countries
Q1538-Base respondents who shop online in other EU countries (N=8175)
In the European Union 213 of consumers who shop cross-border online face limitations in terms of cross-border delivery or payment or they are redirected to a website in their own country where the prices are different The cross-border retailersrsquo refusal to deliver to the consumersrsquo home country
is the most commonly experienced problem (125) followed by being redirected to the retailersrsquo website of the consumersrsquo country (109) Relatively fewer consumers reported problems with
retailers not accepting their payment (48)
38 During the past 12 months have you come across any of the following problems when buying goods and services online from another EU country - The retailer or service provider refused to deliver to (ANOTHER EU COUNTRY) The retailer or service provider did not accept payment from (ANOTHER EU COUNTRY) You were redirected to a website in (ANOTHER EU COUNTRY) where the prices were different None of them Donrsquot know
Region
CountryTotal Yes
The retailer or
service
provider
refused to
deliver to
(ANOTHER EU
COUNTRY)
The retailer or
service
provider did
not accept
payment from
(ANOTHER EU
COUNTRY)
You were
redirected to a
website in
(ANOTHER EU
COUNTRY)
when prices
were different
None of them Dont know
EU27_2019 213 125 48 109 782 05
EU28 221 124 49 121 774 05
North 252 179 43 91 744 05
South 135 53 21 92 861 04
East 246 160 55 121 746 09
West 242 149 62 119 753 05
BE 367 237 94 154 627 05
BG 254 201 79 82 731 15
CZ 239 137 68 88 761 00
DK 249 193 47 93 740 12
DE 166 58 47 104 828 06
EE 286 231 80 51 711 03
IE 717 606 187 326 281 02
EL 420 216 110 216 550 31
ES 84 16 23 69 912 04
FR 146 83 24 82 850 05
HR 353 281 97 133 647 00
IT 122 41 06 94 878 00
CY 317 222 93 87 672 11
LV 259 198 66 93 739 02
LT 247 173 66 70 746 07
LU 472 417 142 162 528 00
HU 72 65 34 09 928 00
MT 733 674 192 165 267 00
NL 181 87 68 56 810 09
AT 596 513 152 225 404 00
PL 215 115 22 148 769 16
PT 186 140 18 81 808 06
RO 439 284 151 244 547 14
SI 344 312 47 80 656 00
SK 274 179 41 116 722 04
FI 207 166 28 55 790 02
SE 275 171 35 122 722 02
IS 485 413 134 107 512 04
NO 328 233 63 112 672 00
UK 269 116 59 191 726 05
In the past 12 months have you come across any of the following problems when buying goods
and services online from another EU country
Consumer Survey 2018
163
Q15- Base respondents who shop online in other EU countries (N=8175)
The proportion of consumers that have experienced any of the three aforementioned problems is 213 in the European Union This level is higher in the West (242) East (246) and North (252) whereas it is lower in the South (135) The highest levels of problems with cross-border delivery payment or redirection to a local website are found in Malta (733) Ireland (717) and
Austria (596) The lowest levels of these problems are found in Hungary (72) Spain (84)
and Italy (122)39
Compared to 2016 the proportion of consumers coming across at least one of the three investigated problems remained stable in the EU27_2019 the North and South while it decreased in the West (-46pp) and increased in the East (+42pp) Looking at the Member States the proportion increased most steeply in Ireland (+408pp) and decreased most prominently in France (-220pp) In this regard the largest negative and positive reversals are found respectively in Ireland and France In
39 Results for Romania are based on a very small sample size (88 observations) and they should be therefore considered as mainly indicative
2018
( = sig
diff EU27)
2018-
2016
2016-
2014
EU27_2019 213 -14 +63
EU28 221 -20 +67
North 252 +12 +26
South 135 -19 +13
East 246 +42 -01
West 242 -46 +131
BE 367 +99 -46
BG 254 -39 +70
CZ 239 +17 -03
DK 249 -29 +33
DE 166 -94 +232
EE 286 +14 +49
IE 717 +408 -201
EL 420 -65 +177
ES 84 -33 -37
FR 146 -220 +230
HR 353 +73 +05
IT 122 -07 +25
CY 317 -01 -14
LV 259 +20 -53
LT 247 +54 -12
LU 472 +136 -233
HU 72 -66 -143
MT 733 +100 +71
NL 181 -22 +71
AT 596 +319 -96
PL 215 +64 -06
PT 186 -46 +98
RO 439 +153 +33
SI 344 +61 +11
SK 274 +91 -10
FI 207 +08 -30
SE 275 +35 +75
IS 485 -67 +208
NO 328 +86 +10
UK 269 -84 +120
In the past 12 months have you come
across any of the following problems when
buying goods and services online from
another EU country
Region
Country
Total Yes
Consumer Survey 2018
164
Ireland the increase between 2016 and 2018 reflecting a higher proportion of consumers
experiencing cross-border problems follows a decrease of 201pp between 2014 and 2016 The largest positive reversal is found in France where the decrease between 2016 and 2018 (reflecting a lower proportion of consumers experiencing problems) was preceded by an increase of 230pp between 2014 and 2016
Q15- Base respondents who shop online in other EU countries (N=8175)
In terms of refusal of cross-border retailers to deliver to the consumersrsquo home country 125 of cross-border online consumers in the European Union faced this problem This level is higher in the
West (149) East (160) and North (179) whereas it is lower in the South (53) The highest levels of refusal to deliver to the consumersrsquo home country are found in Malta (674) Ireland
2018
( = sig
diff EU27)
2018-
2016
2016-
2014
EU27_2019 125 +26 -00
EU28 124 +23 +06
North 179 +25 -04
South 53 -13 +02
East 160 +13 +20
West 149 +54 -05
BE 237 +89 -41
BG 201 -18 +76
CZ 137 +24 -73
DK 193 -18 +22
DE 58 -22 +71
EE 231 +04 +54
IE 606 +461 -236
EL 216 -24 +01
ES 16 -33 +07
FR 83 +04 +08
HR 281 +52 +05
IT 41 -01 -03
CY 222 -28 +36
LV 198 +48 -48
LT 173 +37 +22
LU 417 +227 -297
HU 65 -16 -29
MT 674 +114 +29
NL 87 -06 +00
AT 513 +411 -184
PL 115 -03 +45
PT 140 -17 +108
RO 284 +96 -16
SI 312 +90 -02
SK 179 +30 +30
FI 166 +47 -57
SE 171 +40 +07
IS 413 -51 +217
NO 233 +54 +03
UK 116 -02 +45
In the past 12 months have you come
across any of the following problems when
buying goods and services online from
another EU country
Region
Country
The retailer or service
provider refused to deliver
to (ANOTHER EU
COUNTRY)
Consumer Survey 2018
165
(606) and Austria (513) The lowest levels of these problems are found in Spain (16) Italy
(41) and Germany (58)40
Compared to 2016 this proportion increased in the EU27_2019 (+26pp) and the West (+54pp) while it remained statistically stable in the other three regions In terms of the different Member States the level of refusal to deliver in the home country increased most markedly in Ireland (+461pp) No statistically significant decreases are observed The largest negative reversal is also found in Ireland where the increase for this indicator between 2016 and 2018 (see above) reflecting greater refusals to deliver to the home country was preceded by a decrease of 236pp between 2014
and 2016 No statistically significant positive reversal is found
Q15- Base respondents who shop online in other EU countries (N=8175)
40 Results for Romania are based on a very small sample size (88 observations) and they should be therefore considered as mainly indicative
2018
( = sig
diff EU27)
2018-
2016
2016-
2014
EU27_2019 48 -61 +63
EU28 49 -80 +79
North 43 -13 -00
South 21 -31 +11
East 55 -02 -13
West 62 -122 +144
BE 94 +09 -34
BG 79 -23 +45
CZ 68 -19 -18
DK 47 -41 +14
DE 47 -150 +197
EE 80 +41 -24
IE 187 +22 -25
EL 110 -285 +271
ES 23 -01 -23
FR 24 -246 +251
HR 97 +18 +34
IT 06 -30 +10
CY 93 +01 +26
LV 66 -11 -14
LT 66 +15 -14
LU 142 +09 -40
HU 34 +28 -76
MT 192 -45 +116
NL 68 -01 +46
AT 152 -04 +48
PL 22 -16 -18
PT 18 -05 -17
RO 151 +34 +10
SI 47 -26 -07
SK 41 +14 -55
FI 28 +02 -28
SE 35 -14 +14
IS 134 -128 +119
NO 63 +11 +05
UK 59 -232 +216
In the past 12 months have you come
across any of the following problems when
buying goods and services online from
another EU country
Region
Country
The retailer or service
provider did not accept
payment from (ANOTHER
EU COUNTRY)
Consumer Survey 2018
166
Furthermore the percentage of consumers whose payments were not accepted for cross-border
online transactions is 48 in the European Union In the North and East this percentage is in line with the EU27_2019 average while it is higher in the West (62) and lower in the South (21) Cross-border payment refusal is most common in Malta (192) Ireland (187) and Austria (152) The lowest levels are found in Italy (06) Portugal (18) and Poland (22)41
The proportion of consumers whose payments were not accepted when shopping cross-border online has decreased between 2016 and 2018 in the EU27_2019 (-61pp) the South (-31pp) and the West (-122pp) while no statistically significant changes are observed in the North and the East Compared
to the survey in 2016 cross-border payment refusal increased most steeply in Estonia (+41pp) and decreased most prominently in Greece (-285pp) The largest positive reversal is also found in Greece where the decrease between 2016 and 2018 (reflecting a higher proportion of consumers experiencing payment refusal) follows an increase of 271pp between 2014 and 2016 No statistically significant negative reversal is found
41 Results for Romania are based on a very small sample size (88 observations) and they should be therefore considered as mainly indicative
Consumer Survey 2018
167
Q15- Base respondents who shop online in other EU countries (N=8175)
In addition 109 of consumers in the European Union who shop online have been redirected to a website in their own country where the prices are different In the East and West the proportion is in line with the EU27_2019 average while it is lower in the North (91) and South (92) The
highest levels of redirection to a website in the home country are found in Ireland (326) Romania (244) and Austria (225) In contrast the lowest levels are found in Hungary (09) Estonia
(51) and Finland (55)42
Compared to 2016 the percentage of persons being redirected to a website in their home country increased in the EU27_2019 (+41pp) the West (+69pp) and East (+44pp) while the percentage remained relatively stable in the North and South Between 2016 and 2018 this percentage increased most steeply in Ireland (+278pp) and decreased most prominently in Hungary (-65pp)
When looking at changes in 2018 (vs 2016) and in 2016 (vs 2014) the largest negative reversal is
42 Results for Romania are based on a very small sample size (88 observations) and they should be therefore considered as mainly indicative
2018
( = sig
diff EU27)
2018-
2016
2016-
2014
EU27_2019 109 +41 -02
EU28 121 +59 -20
North 91 -11 +44
South 92 +13 +17
East 121 +44 -12
West 119 +69 -24
BE 154 +32 -24
BG 82 -35 +55
CZ 88 -20 +41
DK 93 -00 +20
DE 104 +83 +00
EE 51 +06 +11
IE 326 +278 -174
EL 216 +73 +45
ES 69 +00 -25
FR 82 +60 -66
HR 133 +59 +44
IT 94 +17 +40
CY 87 +14 -64
LV 93 +09 -06
LT 70 +40 -02
LU 162 +102 -47
HU 09 -65 -117
MT 165 +11 +44
NL 56 -64 +79
AT 225 +174 -66
PL 148 +109 -58
PT 81 -18 +27
RO 244 +115 +13
SI 80 -19 +69
SK 116 +29 +50
FI 55 -39 +16
SE 122 -16 +103
IS 107 -47 +92
NO 112 +28 -00
UK 191 +181 -137
In the past 12 months have you come
across any of the following problems when
buying goods and services online from
another EU country
Region
Country
You were redirected to a
website in (ANOTHER EU
COUNTRY) when prices
were different
Consumer Survey 2018
168
also found in Ireland where the increase between 2016 and 2018 (reflecting a higher proportion of
consumer experiencing redirections) follows a decrease of 174pp between 2014 and 2016 The largest positive reversal is found in the Netherlands where between 2016 and 2018 this indicator decreased by 64pp whereas between 2014 and 2016 it increased by 79pp
Consumer Survey 2018
169
Base for Q15 total lsquoyesrsquo EU27_2019 respondents who shop online in other EU countries (N=7184)
Base for Q151-Q155 Respondents who shop online in other EU countries (Q1514 N=7184 Q1523 N=7159 Q155 N=6621)
Male 207 A 129 A 45 A 103 A 786 A 09 A
Female 217 A 120 A 50 A 115 A 781 A 03 A
18-34 237 B 130 A 53 A 139 759 A 05 A
35-54 205 AB 129 A 45 A 102 B 791 AB 04 A
55-64 187 AB 107 A 47 A 75 AB 809 AB 03 A
65+ 143 A 109 A 28 A 44 A 838 B 12 A
Low 205 A 98 A 39 A 132 A 780 A 08 A
Medium 194 A 114 A 43 A 100 A 801 A 06 A
High 223 A 134 A 51 A 112 A 772 A 05 A
Very difficult 181 A 95 A 53 A 117 A 821 A 01 A
Fairly difficult 231 A 125 A 54 A 118 A 760 A 09 A
Fairly easy 205 A 126 A 42 A 106 A 791 A 04 A
Very easy 208 A 125 A 53 A 97 A 787 A 04 A
Rural area 203 A 127 A 49 AB 101 A 794 A 04 A
Small town 206 A 118 A 36 A 107 A 790 A 04 A
Large town 221 A 131 A 57 B 113 A 770 A 09 A
Self-employed 261 C 139 B 53 AB 153 B 739 A 01 A
Manager 213 BC 120 AB 35 AB 109 AB 784 ABC 01 A
Other white collar 211 BC 139 B 46 B 105 AB 784 AB 04 A
Blue collar 158 A 89 A 32 A 86 A 833 C 09 A
Student 235 BC 127 AB 70 AB 93 A 754 AB 10 A
Unemployed 248 ABC 184 B 89 AB 144 AB 731 AB 19 A
Seeking a job 205 ABC 144 AB 61 AB 86 AB 797 ABC
Retired 163 AB 82 A 40 AB 95 AB 833 BC 07 A
Urbanisation
In the past 12 months have you come
across any of the following problems when
buying goods and services online from
another EU country
Total Yes
The retailer or
service provider
refused to deliver
to (ANOTHER EU
COUNTRY)
The retailer or
service provider
did not accept
payment from
(ANOTHER EU
COUNTRY)
Dont know
Gender
Age groups
Education
Financial Situation
You were
redirected to a
website in
(ANOTHER EU
COUNTRY) when
prices were
different
None of them
Employment status
Consumer Survey 2018
170
Base for Q15 total lsquoyesrsquo) respondents who shop online in other EU countries (N=7184)
Base for Q151-Q155 Respondents who shop online in other EU countries (Q1514 N=7184 Q15233 N=7159 Q155 N=6621)
Only native 180 A 122 A 44 A 83 A 812 B 08 A
Two 201 AB 115 A 44 A 110 A 793 B 06 A
Three 233 BC 138 A 45 A 119 A 765 AB 02 A
Four or more 260 C 149 A 72 A 121 A 735 A 05 A
Not official
language in home
country
232 A 185 A 34 A 88 A 758 A 07 A
Official language
in home country209 A 121 A 48 A 109 A 786 A 05 A
Low 200 A 128 A 25 104 A 799 A 03 A
Medium 205 A 111 A 50 A 111 A 787 A 07 A
High 213 A 129 A 48 A 107 A 782 A 05 A
Daily 214 A 126 B 48 A 110 B 781 A
Weekly 152 A 101 B 35 A 50 A 848 B
Monthly 186 A 113 AB 74 A 76 AB 817 AB
Hardly ever 13 13 A 988
Never
Very vulnerable 272 B 161 A 109 132 A 708 18 A
Somewhat
vulnerable213 AB 128 A 40 A 117 A 780 A 07 A
Not vulnerable 201 A 119 A 41 A 100 A 797 A 03 A
Very vulnerable 265 A 124 A 51 A 167 730 A 08 AB
Somewhat
vulnerable205 A 129 A 44 A 99 A 795 A 01 A
Not vulnerable 205 A 123 A 47 A 102 A 788 A 07 B
In the past 12 months have you come
across any of the following problems when
buying goods and services online from
another EU country
Total Yes
The retailer or
service provider
refused to deliver
to (ANOTHER EU
COUNTRY)
The retailer or
service provider
did not accept
payment from
(ANOTHER EU
COUNTRY)
Consumer vulnerability
(socio-demographic
factors)
Consumer vulnerability
(complexity)
None of them Dont know
Languages
Mother Tongue
Numerical skills
Internet use
You were
redirected to a
website in
(ANOTHER EU
COUNTRY) when
prices were
different
Consumer Survey 2018
171
With regard to socio-demographic variables and other characteristics consumersrsquo frequency of internet use is the factor associated most closely with the proportion of consumers that has come
across any of the presented problems (ie Total lsquoYesrsquo) when buying goods online in another EU country The characteristics having the next closest links with this indicator are consumersrsquo language skills vulnerability due to socio-demographic factors age and employment status
Consumers who hardly ever use the internet are much less likely to have come across the presented
problems than consumers who use the internet more frequently (ie monthly weekly or daily)
Regarding the number of languages that consumers speak consumers who speak four or more languages are more likely to have come across any of the presented problems when buying goods online in another EU country than those who speak two languages or only their native language In addition consumers who speak three languages are also more likely to have come across any of the presented problems than those who speak only their native language
Those who are not vulnerable in terms of socio-demographic factors are less likely to have come
across any of the presented problems than consumers who are very vulnerable
As far as age is concerned consumers aged 65+ years are less likely to experience such problems
than young consumers (ie those aged between 18 and 34 years)
Finally blue collar workers and those who are retired are less likely to have come across any of the presented problems than consumers who are self-employed Blue collar workers are also less likely to have come across any of the presented problems than students managers and other white collars
Those who are unemployed and seeking a job do not differ from the other groups on this indicator
The likelihood that consumers come across the problem where a retailer or service provider refused to deliver to another EU country is associated most closely with internet use followed by employment status
People who hardly ever use the internet are less likely to be confronted with this problem than daily or weekly internet users
Regarding employment status consumers who are unemployed self-employed and those with
another white-collar job are more likely to come across the problem of retailers or service providers refusing to deliver to another EU country than blue collar workers and people who are retired Those
who are students or jobseekers do not differ from the other groups in terms of this issue
When it comes to the problem of a retailer or service provider not accepting payment from another EU country the likelihood of being confronted with this problem is most closely associated with vulnerability due to socio-demographic factors followed by numerical skills the degree of urbanisation and employment status
Consumers who are very vulnerable in terms of socio-demographic factors are more likely to have their payment rejected during a cross-border purchase interaction than those who are somewhat or not vulnerable
With regard to numerical skills consumers with low numerical skills are less likely to have faced this problem than consumers with medium or high numerical skills
Those who live in a small town are less likely to have come across this problem than consumers who
live in a large town
Finally with regard to employment status other white collars are more likely to face this issue compared to blue collar workers
Regarding the problem of a consumer trying to buy something online and being redirected to a website in another EU country where prices are different vulnerability due to the complexity of offers and terms and conditions is the factor associated most closely with this indicator Other factors with close links are age and employment status
Consumers who are very vulnerable are more likely to come across this problem than those who are somewhat or not vulnerable
Consumer Survey 2018
172
Younger consumers (aged 18-34 years) are also more likely to be confronted with the problem than
all other age groups In addition those aged 35-54 years are more likely to be confronted with this issue than people aged 65+ years
Finally with regard to employment status consumers who are self-employed are more likely to have faced this problem than students or blue-collar workers All other employment groups do not differ from these groups on this indicator
Consumer Survey 2018
173
12 PROBLEMS EXPERIENCED WITH ONLINE PURCHASES
The present chapter reports further insights into the types of problems consumers experience with online purchases Each type of problem surveyed is also broken down by retailersrsquo or service providersrsquo location ndash domestic and cross-border inside the EU
Problems with domestic online purchases
The proportion of consumers who experienced problems with domestic retailers based on Q14a and Q14b43 ndash
Base respondents who shop online domestically (N=14037)
43 Q14a I will read you some statements about problems consumers may have when shopping online Please tell me whether you have experienced any of them during the last 12 monthshellip
- Yes with retailers or services providers located in (our country) -Yes with retailers or services providers
Region
Country
2018
( = sig
diff EU27)
2018-
2016
2016-
2014
EU27_2019 494 +161 -122
EU28 515 +198 -156
North 361 +02 +13
South 481 +73 +10
East 476 +22 +09
West 531 +268 -236
BE 406 +09 +29
BG 437 +88 -08
CZ 500 +66 -07
DK 352 +16 -10
DE 548 +286 -239
EE 317 -34 +58
IE 337 +116 -67
EL 377 -04 +47
ES 486 +73 -13
FR 570 +355 -334
HR 337 -04 +03
IT 509 +94 +22
CY 188 -82 +153
LV 313 -74 +33
LT 286 -69 -42
LU 327 +144 -121
HU 262 -65 -88
MT 181 -180 +266
NL 529 +72 -18
AT 308 +101 -104
PL 522 +27 +15
PT 273 -32 -03
RO 541 +57 +100
SI 328 +66 -49
SK 407 -52 -43
FI 255 -15 -35
SE 438 +29 +53
IS 192 +22 -04
NO 339 +20 -24
UK 627 +388 -321
Problems experienced with domestic online
retailers
Consumer Survey 2018
174
In this map values below average are coloured in light and dark green and values above average are coloured
in light and dark red
In the European Union the overall proportion of consumers that report problems with domestic online purchases is 494 In the South this proportion is in line with the EU27_2019 average while
located in another EU country -Yes but you donrsquot know in which country the retailers or services providers were located ndashNo ndashDKNA
Q14a1 You have received a damaged product or a different product from the one you ordered Q14a2 Products were delivered later than promised Q14a3 Products were not delivered at all Q14b I will read you some statements about problems consumers may have when shopping online Please
tell me whether you experienced any of them when buying in (our country) during the last 12 monthshellip -Yes ndashNo ndashDKNA Q14b1 You have received a damaged product or a different product from the one you ordered Q14b2 Products were delivered later than promised Q14b3 Products were not delivered at all
Consumer Survey 2018
175
it is higher in the West (531) and lower in the North (361) and East (476) Among the EU
Member States44 the highest levels of this indicator are found in France (570) Germany (548) and Romania (541) Furthermore this level is also high in the UK (627) The lowest levels across the EU countries are found in Malta (181) Cyprus (188) and Finland (255) Of all studied countries the level is also low in Iceland (192)
Compared to 2016 the proportion of consumers experiencing problems with domestic online retailers increased in the EU27_2019 the South (+73pp) and West (+268pp) while it remained unchanged in the North and East Among the EU Member States the largest increase in problems with domestic
online retailers is found in France (+355pp) while no statistically significant decrease is found Considering all the studied countries an even larger increase can be found in the UK (+388pp)
When looking at changes in 2018 (vs 2016) and in 2016 (vs 2014) the largest negative reversal is also found in France where the increase of this indicator between 2016 and 2018 (see above) reflecting a higher proportion of consumers with problems with domestic retailers follows a decrease of 334pp between 2014 and 2016 Looking at all countries of the survey the largest negative
reversal is found in the UK where between 2016 and 2018 this indicator increased (see above) whereas between 2014 and 2016 it decreased by 321pp No statistically significant negative reversal
is found
The proportion of consumers who experienced problems with domestic retailers based on Q14a and Q14b ndash
Base EU27_2019 respondents who shop online domestically (N=12382)
The proportion of consumers who experienced problems with domestic retailers based on Q14a and Q14b ndash
Base EU27_2019 respondents who shop online domestically (N=12382)
44 Results for Malta (63) and Cyprus (72) are based on a very small sample size and should therefore be considered as mainly indicative
503 A 482 A
569 507 418 339
439 A 475 A 514
545 A 500 A 490 A 482 A
497 A 483 A 502 A
525 A 503 A 491 A 487 A
474 A 490 A 454 A 488 A
GenderMale Female
Problems experienced with domestic online retailers
Blue collar
Student
65+
Education levelLow Medium High
Age18-34 35-54 55-64
Very easy
UrbanisationRural area Small town Large town
Financial situationVery difficult Fairly difficult Fairly easy
Unemployed Seeking a job RetiredEmployment status
Self-employed Manager Other white collar
460 A 527 477 A 441 A
455 A 495 A
479 A 490 A 496 A
495 A 463 A 461 A 413 A
506 AB 544 B 469 A
572 509 A 477 A
Four or more
Problems experienced with domestic online retailers
LanguagesOnly native Two
High
Mother tongue
Not official language
in home country
Official language in
home country
Numerical skillsLow Medium
Three
Consumer
vulnerability
(complexity)
Very vulnerableSomewhat
vulnerableNot vulnerable
Hardly ever Never
Consumer
vulnerability
(socio-demographic
factors)
Very vulnerableSomewhat
vulnerableNot vulnerable
Internet useDaily Weekly Monthly
Consumer Survey 2018
176
Regarding the socio-demographic variables associated with the proportion of consumers who
experienced problems with domestic online purchases age is the factor that is associated most closely Other characteristics with close links are vulnerability due to the complexity of offers and terms and conditions and consumersrsquo education level
The proportion of consumers who experienced problems with domestic online purchases decreases with rising age Younger consumers (aged 18-34 years) are most likely to encounter problems than all other age groups In turn those aged 35-54 years show a higher likelihood than those aged 55-64 years who in turn are more likely to encounter issues with domestic online purchases than those
aged 65 or older
Furthermore among consumers who are very vulnerable due to the complexity of offers and terms and conditions the incidence is higher than among those who are somewhat or not vulnerable
Finally highly educated consumers are more likely to experience problems with domestic online purchases than those with a medium or low level of education
Consumer Survey 2018
177
1211 Types of problems with domestic online retailers
Percentage of ldquoYesrdquo answers in Q14a1-3 and Q14b1-3 ndash Base respondents who shop online domestically
(N=14037)
Late delivery is the most common problem with domestic online retailers (393) followed by
damaged and wrong delivery (198) and no delivery (92)
2018
( = sig
diff EU27)
2018-
2016
2016-
2014
2018
( = sig
diff EU27)
2018-
2016
2016-
2014
2018
( = sig
diff EU27)
2018-
2016
2016-
2014
EU27_2019 198 +79 -65 393 +147 -95 92 +33 -23
EU28 214 +107 -95 408 +170 -119 108 +51 -41
North 135 -15 +07 275 +22 +01 50 -00 -08
South 213 +49 +07 374 +63 +13 77 +23 -18
East 197 -06 +12 354 +32 +14 87 +04 -19
West 199 +130 -128 438 +243 -189 109 +54 -28
BE 159 +07 +32 317 +21 +18 67 +05 +02
BG 209 +14 +23 287 +61 +13 69 +20 -08
CZ 192 +13 +38 359 +79 -45 106 +05 +04
DK 115 -05 -20 266 +19 -08 46 -03 -04
DE 185 +120 -156 453 +255 -172 124 +74 -41
EE 130 +08 -17 242 -08 +46 28 -29 +10
IE 132 +92 -49 249 +81 -36 59 +16 -14
EL 159 +38 +18 293 -11 +45 34 -14 +01
ES 213 +56 -16 379 +64 -09 87 +48 -13
FR 246 +196 -140 471 +322 -293 115 +54 -27
HR 145 +40 -12 224 -54 -00 62 -05 -10
IT 229 +48 +24 398 +83 +25 81 +14 -29
CY 98 -12 +61 166 -13 +91 20 -31 +35
LV 112 -53 +20 218 -51 +06 34 -20 +14
LT 102 -39 -11 216 -55 -31 38 -13 -14
LU 92 +71 -110 246 +109 -77 88 +48 +10
HU 96 +20 -82 175 -89 -45 57 +02 -21
MT 69 -169 +234 142 -133 +183 14 -213 +225
NL 185 +37 -25 459 +86 -20 72 +08 +08
AT 132 +73 -58 238 +84 -70 54 +14 +02
PL 225 -12 +19 409 +47 +26 93 +09 -38
PT 123 +26 -18 180 -73 +19 34 -04 +07
RO 218 -13 +40 389 +50 +109 88 +06 +30
SI 125 +26 -55 255 +89 -36 38 -08 +12
SK 148 -13 -50 298 +10 -70 86 -36 -33
FI 99 -23 +09 180 +20 -46 17 -19 -29
SE 172 -10 +27 344 +53 +30 72 +17 -03
IS 83 +47 -11 122 -09 +13 14 -28 +11
NO 130 +08 -07 245 +18 -21 51 -16 +21
UK 302 +252 -234 492 +296 -232 191 +148 -126
Types of problems with domestic online retailers
Region
Country
Damaged or wrong delivery Late delivery No delivery
Consumer Survey 2018
178
In the European Union the overall proportion of consumers exposed to damaged or wrong
deliveries is 198 In the South East and West the proportion of consumers who experienced this problem is in line with the EU27_2019 average while it is lower in the North (135) Among the EU Member States the highest levels of this indicator are found in France (246) Greece and Belgium (both 159) Among all the studied countries this level is highest in the UK (302) The lowest levels among the EU countries are found in Malta (69) Luxembourg (92) and Hungary (96) Of all studied countries the level is also low in Iceland (83)
Between 2016 and 2018m the proportion of consumers experiencing damaged or wrong deliveries
increased in the EU27_2019 (+79pp) the South (+49pp) and West (130pp) while it remained stable in the North and East Compared to the survey in 2016 the proportion of consumers experiencing damaged or wrong delivery increased most prominently in France (+196pp) and decreased most steeply in Malta (-169pp) Considering all countries of the study the largest increase is observed in the UK (+252pp)
The largest positive reversal is also found in Malta where the decrease between 2016 and 2018
(reflecting a lower proportion of consumers that experienced damaged or wrong deliveries) was preceded by an increase of 234pp between 2014 and 2016 The largest negative reversal is found
in France where between 2016 and 2018 this indicator increased by 196pp (reflecting a higher proportion of consumers with this problem) whereas between 2014 and 2016 it decreased by 140pp Looking at all countries of the study the largest negative reversal is found in the UK where between 2016 and 2018 this indicator increased by 252pp following a decrease of 234pp between 2014 and 2016
The overall proportion of consumers who experienced late deliveries from domestic online retailers is 393 in the European Union While the proportion of consumers who experienced this problem is in line with the EU27_2019 average in the South it is higher in the West (438) and lower in the North (275) and East (354) Among the EU Member States the highest levels of this indicator are found in France (471) the Netherlands (459) and Germany (453) The lowest levels are found in Malta (142) Cyprus (166) and Hungary (175) Among all studied countries this level is highest in the UK (492) and lowest in Iceland (122)
The proportion of consumers experiencing late deliveries increased in 2018 in the EU27_2019 (+147pp) the East (+32pp) South (+63pp) and West (+243pp) while no changes are observed in the North Compared to the survey in 2016 the proportion of consumers who experienced late delivery increased most prominently in France (+322pp) where also the largest negative reversal
is found Before the increase in the proportion of consumers who experienced late deliveries between 2016 and 2018 this indicator decreased by 293pp between 2014 and 2016 This indicator decreased
most prominently in Malta (-133pp) where also the only positive reversal is found The decrease between 2016 and 2018 (reflecting fewer late deliveries) was preceded by an increase of 183pp between 2014 and 2016
In the European Union the proportion of consumers who experienced deliveries not taking place is 92 In the East the proportion of consumers who experienced this problem is in line with the EU27_2019 average while it is higher in the West (109) and lower in the South (77) and North (50) Among the EU Member States the highest levels of this indicator are found in Germany
(124) Bulgaria (69) and Belgium (67) The lowest levels are found in Malta (14) Finland (17) and Cyprus (20) When looking at all the studied countries the highest level is found in the UK (191) and the lowest in Iceland (14)45
In 2018 the proportion of consumers for whom deliveries had not taken place increased in the EU27_2019 (+33pp) the South (+23pp) and West (+54pp) while it remained stable in the North and the South Compared to the survey in 2016 the proportion of consumers who experienced no
deliveries increased most noticeably in Germany (+74pp) and decreased most prominently in Malta
(-213pp) In this regard the largest negative and positive reversals are found respectively in Germany and Malta In Germany the increase between 2016 and 2018 reflecting a higher proportion of consumers that experienced problems with deliveries not taking place was preceded by a decrease of 41pp between 2014 and 2016 The only positive reversal is found in Malta where between 2016 and 2018 the indicator decreased (reflecting fewer deliveries that had not taken place see above) whereas between 2014 and 2016 it increased by 225pp Looking at all countries of the study the
45 Results for Malta (63) and Cyprus (72) are based on a very small sample size and should therefore be considered as mainly indicative
Consumer Survey 2018
179
largest negative reversal is found in the UK where between 2016 and 2018 the incidence of this
problem increased by 148pp following a decrease of 126pp between 2014 and 2016
Percentage of ldquoYesrdquo answers in Q14a1-3 and Q14b1-3 ndash Base EU27_2019 respondents who shop online
domestically (N=12382)
Male 202 A 401 A 87 A
Female 194 A 380 A 95 A
18-34 224 B 470 113 A
35-54 210 B 396 105 A
55-64 167 A 324 67
65+ 124 A 246 37
Low 166 AB 343 A 98 A
Medium 181 A 371 A 98 A
High 216 B 413 85 A
Very difficult 223 A 412 A 119 AB
Fairly difficult 210 A 410 A 73 A
Fairly easy 189 A 386 A 96 B
Very easy 201 A 381 A 98 AB
Rural area 191 A 408 A 91 A
Small town 190 A 378 A 83 A
Large town 215 A 391 A 100 A
Self-employed 218 B 404 A 114 C
Manager 230 B 405 A 110 BC
Other white collar 194 AB 396 A 77 A
Blue collar 204 B 372 A 75 AB
Student 146 A 389 A 89 ABC
Unemployed 230 B 345 A 86 ABC
Seeking a job 136 A 378 A 89 ABC
Retired 199 AB 388 A 138 C
Age groups
Types of problems with domestic online
retailers
Damaged or wrong
deliveryLate delivery No delivery
Gender
Education
Financial Situation
Urbanisation
Employment status
Consumer Survey 2018
180
Percentage of ldquoYesrdquo answers in Q14a1-3 and Q14b1-3 ndash Base EU27_2019 respondents who shop online
domestically (N=12382)
Regarding the likelihood of having come across the problem of damaged or wrong deliveries of
products purchased online from a domestic retailer the factor associated most closely is age followed by employment status and education
Consumers aged between 18 and 54 years are more likely to have experienced damaged or wrong deliveries for such purchases than those aged 55 or older
Regarding consumersrsquo employment status students and jobseekers are less likely to face this
problem than blue collar workers self-employed unemployed and managers
In terms of education highly educated consumers are more likely to experience damaged or wrong deliveries from domestic retailers than consumers with a medium education level
When it comes to late deliveries of domestic online purchases the factor associated most closely is also age Other characteristics with close links are vulnerability due to the complexity of offers and terms and conditions and education level
Only native 180 A 365 A 87 A
Two 217 B 425 96 A
Three 189 AB 362 A 87 A
Four or more 171 A 339 A 85 A
Not official
language in home
country
177 A 375 A 124 A
Official language
in home country199 A 391 A 89 A
Low 229 A 361 A 90 A
Medium 197 A 403 A 84 A
High 196 A 389 A 94 A
Daily 200 A 391 A 94 B
Weekly 175 A 387 A 49 A
Monthly 158 A 404 A 60 AB
Hardly ever 143 A 332 A 76 AB
Never
Very vulnerable 216 AB 379 AB 96 AB
Somewhat
vulnerable235 B 420 B 125 B
Not vulnerable 180 A 380 A 76 A
Very vulnerable 213 A 480 137
Somewhat
vulnerable216 A 406 A 87 A
Not vulnerable 189 A 374 A 86 A
Types of problems with domestic online
retailers
Consumer vulnerability
(socio-demographic
factors)
Consumer vulnerability
(complexity)
Late delivery No delivery
Languages
Mother Tongue
Numerical skills
Internet use
Damaged or wrong
delivery
Consumer Survey 2018
181
Younger consumers (18-34 years) are more likely to experience this problem than any other age
group In addition those aged 35-54 years are more likely to experience this issue than those aged 55-64 years who in turn report a higher likelihood than those aged 65 years or older
Furthermore consumers who are very vulnerable due to the complexity of offers and terms and conditions are more likely to face this problem than those who are somewhat or not vulnerable
Finally highly educated consumers are more likely to come across this problem than those with a medium or low education level
Regarding socio-demographic characteristics that are linked with the probability of having a domestic
online purchase not delivered age is also the factor associated most closely with this indicator Other characteristics with close links are vulnerability due to the complexity of offers and terms and conditions and employment status
Consumers aged 18-54 years are more likely to encounter problems of not having their domestic online purchase delivered than those aged 55-64 years who in turn report a higher likelihood than those aged 65 years or older
In addition consumers who are very vulnerable due to the complexity of offers and terms and conditions are more likely to have faced this problem than those who are somewhat or not vulnerable
Finally consumers who are self-employed or retired are more likely to come across this problem for a domestic online purchase than other white collars and blue-collar workers Managers are also more likely to come across this problem than other white collars
Consumer Survey 2018
182
Problems with cross-border purchases
The proportion of consumers who experienced problems with domestic retailers based on Q14c46 ndash Base
respondents who shop online cross-border (N=7722)
In the European Union the proportion of persons having experienced problems with cross-border
online purchases is equal to 361 In the West this proportion is in line with the EU27_2019 average while it is higher in the South (436) and lower in the East (247) and North (281)
46 Q14c I will read you some statements about problems consumers may have when shopping online Please tell me whether you experienced any of them when buying in another EU country during the last 12 months
- Yes ndashNo ndashDKNA Q14c1 You have received a damaged product or a different product from the one you ordered Q14c2 Products were delivered later than promised Q14c3 Products were not delivered at all
Region
Country
2018
( = sig
diff EU27)
2018-
2016
2016-
2014
EU27_2019 361 +127 -50
EU28 359 +138 -58
North 281 +58 -51
South 436 +105 +11
East 247 +35 -05
West 363 +195 -116
BE 483 +90 +44
BG 203 -87 -09
CZ 179 +34 +10
DK 303 +74 -85
DE 330 +204 -45
EE 256 -36 -68
IE 525 +337 -301
EL 388 +113 -117
ES 391 +37 +30
FR 343 +254 -241
HR 420 +29 +33
IT 475 +159 +15
CY 482 +101 -137
LV 278 -166 +08
LT 329 -43 -28
LU 469 +240 -258
HU 132 -89 -94
MT 750 +74 +50
NL 207 -07 -13
AT 504 +348 -288
PL 232 +73 +12
PT 412 -05 +84
RO 391 +192 -63
SI 312 +19 -41
SK 297 +37 -52
FI 260 +48 -60
SE 274 +119 -36
IS 355 +125 +20
NO 248 +11 -02
UK 348 +233 -130
Problems experienced with cross-border
online retailers
Consumer Survey 2018
183
In this map values below average are coloured in light and dark green and values above average are coloured
in light and dark red
The highest levels of this indicator are found in Malta (750) Ireland (525) and Austria (504) The lowest levels are found in Hungary (132) the Czech Republic (179) and Bulgaria (203)47
Compared to 2016 the proportion of persons experiencing problems with cross-border online
purchases increased in the EU27_2019 (+127pp) the East (+35pp) North (+58pp) South
(+105pp) and West (+195pp) The proportion of consumers experiencing problems with cross-border online purchases increased most prominently in Austria (+348pp) and decreased most noticeably in Latvia (-166pp) When looking at changes in 2018 (vs 2016) and in 2016 (vs 2014) the largest negative reversal is found in Ireland where between 2016 and 2018 this indicator
47 Results for Romania are based on a very small sample size (84 observations) and they should be therefore considered as mainly indicative
Consumer Survey 2018
184
increased by 337pp (reflecting a higher proportion of consumers experiencing problems) whereas
between 2014 and 2016 it decreased by 301pp No statistically significant positive reversal is found
The proportion of consumers who experienced problems with cross-border online purchases based on Q14c ndash
Base EU27_2019 respondents who shop online cross-border (N=6788)
The proportion of consumers who experienced problems with cross-border online purchases based on Q14c ndash
Base EU27_2019 respondents who shop online cross-border (N=6788)
With regard to the association between the incidence of problems experienced with cross-border online purchases and socio-demographic variables the factor associated most closely with this indicator is vulnerability due to the complexity of offers and terms and conditions followed by language consumersrsquo financial situation frequency of internet use and age
Consumers who are very vulnerable due to the complexity of offers are more likely to experience problems online with cross-border retailers than those who are somewhat or not vulnerable
Regarding consumersrsquo language skills those who speak at least four languages are more likely to experience such problems than the remainder of the population
Those in a very easy financial situation are less likely to experience problems with cross-border retailers than other consumers In addition consumers in a fairly easy financial situation are also less likely to experience problems with those retailers than consumers in a fairly difficult financial
situation
A higher frequency of internet use is surprisingly associated with less problems experienced online with cross-border retailers with daily internet users being less likely to experience problems than those who hardly use the internet
358 A 366 A
409 B 342 A 319 A 313 AB
367 A 383 A 346 A
444 AB 412 B 356 A 299
356 A 357 A 372 A
398 BC 401 BC 333 AB 344 AB
473 C 404 ABC 401 ABC 276 A
GenderMale Female
Problems experienced with cross-border online retailers
Blue collar
Student
65+
Education levelLow Medium High
Age18-34 35-54 55-64
Very easy
UrbanisationRural area Small town Large town
Financial situationVery difficult Fairly difficult Fairly easy
Unemployed Seeking a job RetiredEmployment status
Self-employed Manager Other white collar
330 A 346 A 365 A 488
354 A 362 A
416 A 360 A 358 A
360 A 358 AB 449 AB 697 B
372 A 374 A 356 A
461 353 A 354 A
Four or more
Problems experienced with cross-border online retailers
LanguagesOnly native Two
High
Mother tongue
Not official language
in home country
Official language in
home country
Numerical skillsLow Medium
Three
Consumer
vulnerability
(complexity)
Very vulnerableSomewhat
vulnerableNot vulnerable
Hardly ever Never
Consumer
vulnerability
(socio-demographic
factors)
Very vulnerableSomewhat
vulnerableNot vulnerable
Internet useDaily Weekly Monthly
Consumer Survey 2018
185
Finally concerning consumersrsquo age consumers aged 18-34 years are more likely to experience such
problems than those aged 35-64 years
Consumer Survey 2018
186
1221 Types of problems with cross-border online retailers
Percentage of ldquoYesrdquo answers in Q14c1-3 ndash Base respondents who shop online cross-border (N=7722)
The most common problem with cross-border online retailers is similar to domestic online retailers late delivery (278) followed by damaged and wrong delivery (115) and no delivery (83)
2018
( = sig
diff EU27)
2018-
2016
2016-
2014
2018
( = sig
diff EU27)
2018-
2016
2016-
2014
2018
( = sig
diff EU27)
2018-
2016
2016-
2014
EU27_2019 115 +30 +00 278 +111 -59 83 +38 -04
EU28 116 +36 +03 282 +125 -64 84 +42 -12
North 105 +28 -15 215 +47 -36 50 +03 +03
South 146 +28 +29 346 +107 -22 94 +37 +07
East 95 +10 -15 175 +22 +14 54 +10 -03
West 104 +44 -19 278 +161 -116 90 +53 -13
BE 172 +31 +21 383 +89 +20 136 +74 +14
BG 81 -31 -07 144 -43 -34 56 -25 +11
CZ 62 +23 -00 136 +10 +18 28 -09 +19
DK 83 +24 +03 266 +72 -58 49 +06 -23
DE 66 +09 +08 253 +177 -68 86 +44 +30
EE 117 -23 -03 179 -10 -71 74 +33 -31
IE 183 +125 -86 418 +289 -256 134 +90 -109
EL 136 +28 -41 295 +88 -57 130 +80 -29
ES 159 +12 +60 300 +50 -00 72 +32 -41
FR 107 +87 -53 260 +197 -218 83 +63 -44
HR 157 +11 -06 275 -23 +35 155 -15 +40
IT 135 +44 +16 384 +150 -27 108 +44 +37
CY 245 +109 -52 370 +84 -174 75 -23 -00
LV 153 -31 -13 194 -110 -11 83 -13 +22
LT 135 -66 +27 238 -30 -29 115 -17 +50
LU 194 +142 -152 355 +195 -195 104 +41 -39
HU 57 +06 -129 72 -99 +15 24 -10 -15
MT 290 -71 +139 671 +156 +33 334 +30 +47
NL 64 -17 +59 148 -08 -24 55 +20 -37
AT 189 +159 -141 384 +270 -234 93 +64 -57
PL 116 +40 -00 161 +37 +27 40 +37 -14
PT 144 -57 +90 343 +82 +07 57 -31 +53
RO 80 -34 -08 345 +209 -15 48 +24 -35
SI 104 -13 -31 221 +15 +07 70 +26 -67
SK 97 -02 -19 186 +35 -36 111 +11 -19
FI 108 +34 -45 187 +29 -25 15 -17 -10
SE 102 +57 -23 202 +88 -31 49 +12 +20
IS 87 +45 -01 288 +109 +25 89 +24 +18
NO 80 +07 -07 176 +04 +11 76 +12 +21
UK 121 +83 +04 305 +228 -118 91 +72 -62
Types of problems with cross-border online retailers
Region
Country
Damaged or wrong delivery Late delivery No delivery
Consumer Survey 2018
187
In the European Union the proportion of persons having experienced damaged or wrong cross-
border delivery is equal to 115 This proportion is equal to the EU27_2019 average in the North and the West while it is higher in the South (146) and lower in the East (95) The highest levels of this indicator are found in Malta (290) Cyprus (245) and Luxembourg (194) The lowest levels are found in Hungary (57) the Czech Republic (62) and the Netherlands (64)48
Between 2016 and 2018 the proportion of consumers who experienced damaged or wrong cross-border delivery increased in the EU27_2019 (+30pp) the North (+28pp) and West (+44pp) while it did not statistically change in the South and East Compared to the survey in 2016 the proportion
of consumers who experienced damaged or wrong cross-border delivery increased most markedly in Austria (+159pp) No statistically significant decrease is observed When looking at changes in 2018 (vs 2016) and in 2016 (vs 2014) the largest positive reversal is also found in Austria where the increase between 2016 and 2018 was preceded by a decrease of 141pp between 2014 and 2016 No statistically significant negative reversal is found
The overall proportion of consumers experiencing late cross-border deliveries is 278 in the
European Union The proportion of persons having experienced this problem in the West is in line with the EU27_2019 average while it is higher in the South (346) and lower in the North (215)
and East (175) The highest levels of this indicator are found in Malta (671) Ireland (418) and Italy and Austria (both 384) The lowest levels are found in Hungary (72) the Czech Republic (136) and Bulgaria (144)
Compared to 2016 the proportion of consumers experiencing late cross-border delivery increased in the EU27_2019 (+111pp) the North (+47pp) South (+107pp) and West (+161pp) while it
stayed the same in the East The largest increase is recorded for Ireland (+289pp) whereas the largest decrease is observed in Latvia (-110pp) The largest negative reversal is also found in Ireland where the increase for this indicator between 2016 and 2018 (reflecting a greater proportion of consumers experiencing late deliveries) follows a decrease of 256pp between 2014 and 2016 No statistically significant positive reversal is found
In the European Union the proportion of persons whose purchase was not delivered is 83 The incidence of this problem is in line with the EU27_2019 average in the South and West while it is
lower in the North (50) and East (54) The highest levels of this indicator are found in the Malta (334) Croatia (155) and Belgium (136) The lowest levels are found in Finland (15) Hungary (24) and the Czech Republic (28)
Between 2016 and 2018 the proportion of persons who made cross-border purchases that were not delivered increased in the EU27_2019 (+38pp) the South (+37pp) and West (+53pp) while it did not change in the North and East Compared to the survey in 2016 the proportion of consumers who
experienced no cross-border delivery increased most prominently in Ireland (+90pp) No statistically significant decrease is observed When looking at changes in 2018 (vs 2016) and in 2016 (vs 2014) the largest negative reversal is also found in Ireland where the increase between 2016 and 2018 (reflecting a greater incidence of such problems) follows a decrease of 109pp between 2014 and 2016 No statistically significant positive reversal is found
48 The results of all three types of problems are based on a very small sample size for Romania (84 observations) and they should be therefore considered as mainly indicative
Consumer Survey 2018
188
Percentage of ldquoYesrdquo answers in Q14c1-3 ndash Base EU27_2019 respondents who shop online cross-border
(Q14c1 N=6788 Q14c23 N=6781)
Male 115 A 275 A 81 A
Female 116 A 283 A 86 A
18-34 124 A 325 94 A
35-54 103 A 265 A 78 A
55-64 129 A 223 A 67 A
65+ 110 A 212 A 81 A
Low 167 A 239 A 131 A
Medium 116 A 297 A 80 A
High 112 A 266 A 82 A
Very difficult 191 A 310 AB 62 A
Fairly difficult 128 A 308 B 94 A
Fairly easy 110 A 283 B 82 A
Very easy 96 A 220 A 75 A
Rural area 106 A 283 A 85 A
Small town 123 A 270 A 79 A
Large town 113 A 284 A 87 A
Self-employed 132 B 292 ABC 92 A
Manager 146 B 310 ABC 72 A
Other white collar 107 B 259 AB 74 A
Blue collar 117 B 248 AB 88 A
Student 154 B 351 C 112 A
Unemployed 109 AB 367 BC 123 A
Seeking a job 104 AB 343 ABC 97 A
Retired 52 A 219 A 71 A
Age groups
Types of problems with cross-border
online retailers
Damaged or wrong
deliveryLate delivery No delivery
Gender
Education
Financial Situation
Urbanisation
Employment status
Consumer Survey 2018
189
Percentage of ldquoYesrdquo answers in Q14c1-3 ndash Base EU27_2019 respondents who shop online cross-border
(Q14c1 N=6788 Q14c23 N=6781)
Regarding the association of socio-demo variables with the incidence of experiencing damaged or wrong deliveries when making a cross-border online purchase vulnerability due to the complexity
of offers and terms and conditions is the factor most closely associated with this indicator followed by employment status and the number of languages spoken
Consumers who are very vulnerable due to the complexity of offers are more likely to experience this problem than those who are somewhat or not vulnerable
In terms of employment consumers who are retired are less likely to come across this type of
problem than students other white collars blue collar workers the self-employed managers and
students
Finally those who speak four or more languages are more likely to experience problems with damaged or wrong deliveries from cross-border retailers than those who speak two languages or only their native language
The socio-demographic variable most closely associated with the likelihood of coming across problems with late deliveries when making a cross-border online purchase is internet use followed by age the number of languages spoken consumersrsquo financial situation and employment status
Only native 100 A 266 A 71 A
Two 111 A 269 A 73 A
Three 120 AB 273 A 115 B
Four or more 156 B 358 89 AB
Not official
language in home
country
78 A 296 A 107 A
Official language
in home country118 A 277 A 81 A
Low 143 A 283 A 119 A
Medium 112 A 299 A 73 A
High 114 A 271 A 83 A
Daily 117 B 276 A 83 A
Weekly 79 AB 295 A 67 A
Monthly 33 A 174 A 255 A
Hardly ever 52 AB 727 181 A
Never
Very vulnerable 132 A 271 A 82 A
Somewhat
vulnerable132 A 282 A 93 A
Not vulnerable 106 A 278 A 79 A
Very vulnerable 194 354 A 125 A
Somewhat
vulnerable106 A 268 A 79 A
Not vulnerable 109 A 274 A 79 A
Types of problems with cross-border
online retailers
Consumer vulnerability
(socio-demographic
factors)
Consumer vulnerability
(complexity)
Late delivery No delivery
Languages
Mother Tongue
Numerical skills
Internet use
Damaged or wrong
delivery
Consumer Survey 2018
190
Consumers who hardly ever use the internet are much more likely to experience this problem than
those who use the internet more frequently (ie monthly weekly or daily)
As far as age is concerned those aged 18-34 years are more likely to face late deliveries from cross-border online purchases than all other age groups
Those who speak four or more languages are also more likely to experience late deliveries than those who speak fewer languages or only their native language
Consumers in a very easy financial situation are less likely to experience late deliveries from cross-border retailers than those in a fairly easy or fairly difficult financial situation
Finally consumers who are retired blue collar workers or other white collars are less likely to experience this problem than students Those who are retired are also less likely to experience this problem than those who are unemployed
Regarding the problem of not receiving deliveries when making a cross-border online purchase none of the measured socio-demographic variables is associated closely with this indicator
Consumer Survey 2018
191
Overall problems experienced
The incidence of problems experienced with domestic and cross-border retailers based on Q14a Q14b and
Q14c ndash Base respondents who shop online domestically or cross-border (N=15463)
In the European Union the proportion of persons experiencing problems with either domestic or
cross-border online purchases is 578 In the South the proportion is in line with the EU27_2019 average while it is higher in the West (622) and lower in the East (512) and North (462) The highest levels of this indicator are found in Malta (768) France (670) and Belgium (622) Additionally this level is also high in the UK (675) The lowest levels are found in Hungary
(306) Finland (389) and Lithuania (408)
Compared to 2016 the proportion of consumers experiencing problems with domestic and cross-border online purchases increased in the EU27_2019 (+210pp) the West (+357pp) the South (+77pp) and the East (+39pp) while it remained stable in the North At country level the proportion of consumers experiencing problems with domestic and cross-border online purchases increased most prominently in France (+458pp) and decreased most steeply in Latvia (-121pp)
Region
Country
2016
( = sig
diff EU28)
2018-
2016
2016-
2014
EU27_2019 578 +210 -120
EU28 592 +245 -156
North 462 +27 +24
South 583 +77 +62
East 512 +39 +14
West 622 +357 -265
BE 622 +65 +82
BG 465 +63 -04
CZ 542 +82 +08
DK 443 +30 -13
DE 609 +348 -255
EE 486 -50 +132
IE 613 +366 -262
EL 471 +35 +13
ES 570 +64 +54
FR 670 +458 -363
HR 545 +25 +90
IT 618 +99 +78
CY 495 +06 -17
LV 491 -121 +124
LT 408 -63 +13
LU 533 +298 -294
HU 306 -61 -92
MT 768 +16 +94
NL 563 +69 -04
AT 571 +343 -280
PL 540 +45 +18
PT 467 +28 +43
RO 562 +80 +76
SI 437 +31 +32
SK 505 +06 -28
FI 389 +20 -17
SE 512 +68 +49
IS 466 +161 +21
NO 478 +45 -00
UK 675 +430 -338
Problems experienced
Consumer Survey 2018
192
When looking at changes in 2018 (vs 2016) and in 2016 (vs 2014) the largest negative and positive
reversals are also found respectively in France and Latvia In France this indicator increased between 2016 and 2018 (indicating a higher proportion of consumers experiencing problems) following a decrease of 363pp between 2014 and 2016 (indicating fewer problems) In Latvia this indicator decreased between 2016 and 2018 (see above) following an increase of 24pp between 2014 and 2016 (indicating more problems)
The incidence of problems experienced with domestic and cross-border retailers based on Q14a Q14b and
Q14c ndash Base EU27_2019 respondents who shop online domestically or cross-border (N=13680)
The incidence of problems experienced with domestic and cross-border retailers based on Q14a Q14b and
Q14c ndash Base EU27_2019 respondents who shop online domestically or cross-border (N=13680)
With regard to socio-demographic variables and other characteristics problems with online retailers (both domestic and cross-border) are associated most closely with age The characteristics that have
the next closest links with the indicator are vulnerability due to the complexity of offers and terms and conditions education gender and consumersrsquo financial situation
Consumers aged 18-34 years are more likely to experience problems with online retailers than all
other age groups In addition those aged 35-54 years are more likely to experience such problems than those aged 55-64 years who in turn are more likely to experience such problems than those aged 65+ years
Consumers who are very vulnerable in terms of the complexity of offers and terms and conditions are also more likely to experience problems with online retailers than those who are somewhat or not vulnerable
Regarding consumersrsquo education level those with a high level of education are more likely to encounter problems than those with a medium or low level of education
595 559
671 590 489 397
505 A 563 A 597
605 AB 598 B 577 AB 546 A
582 A 563 A 590 A
616 B 616 B 572 AB 568 AB
592 AB 580 AB 499 A 548 AB
GenderMale Female
Problems experienced
Blue collar
Student
65+
Education levelLow Medium High
Age18-34 35-54 55-64
Very easy
UrbanisationRural area Small town Large town
Financial situationVery difficult Fairly difficult Fairly easy
Unemployed Seeking a job RetiredEmployment status
Self-employed Manager Other white collar
532 A 604 B 574 B 587 AB
510 A 580 A
556 A 570 A 582 A
581 A 533 A 524 A 546 A
596 AB 625 B 554 A
656 573 A 567 A
Four or more
Problems experienced
LanguagesOnly native Two
High
Mother tongue
Not official language
in home country
Official language in
home country
Numerical skillsLow Medium
Three
Consumer
vulnerability
(complexity)
Very vulnerableSomewhat
vulnerableNot vulnerable
Hardly ever Never
Consumer
vulnerability
(socio-demographic
factors)
Very vulnerableSomewhat
vulnerableNot vulnerable
Internet useDaily Weekly Monthly
Consumer Survey 2018
193
As far as gender is concerned males are more likely to encounter problems with online retailers than
females
Finally less exposure to problems is reported by consumers in a very easy financial situation compared to those in a fairly difficult financial situation
1231 Overall types of problems
Percentage of ldquoYesrdquo answers in Q14a1-3 Q14b1-3 or Q14c1-3 ndash Base respondents who shop online
domestically or cross-border (N=15463)
2018
( = sig
diff EU27)
2018-
2016
2016-
2014
2018
( = sig
diff EU27)
2018-
2016
2016-
2014
2018
( = sig
diff EU27)
2018-
2016
2016-
2014
EU27_2019 235 +99 -60 467 +194 -99 133 +62 -22
EU28 250 +127 -89 480 +220 -125 146 +79 -40
North 188 -02 +21 357 +41 +06 87 +05 +08
South 262 +59 +33 464 +81 +41 119 +42 -05
East 219 +05 +12 384 +44 +21 106 +14 -13
West 235 +157 -130 522 +319 -211 159 +99 -35
BE 257 +34 +54 510 +98 +49 166 +60 +26
BG 216 -04 +16 315 +46 +16 97 +12 +10
CZ 211 +23 +42 394 +88 -25 117 +03 +11
DK 158 +06 -07 359 +40 -06 77 +08 -05
DE 206 +133 -158 512 +312 -187 160 +105 -38
EE 219 -24 +51 369 -21 +99 115 -13 +45
IE 253 +201 -119 502 +314 -201 164 +113 -96
EL 198 +33 +17 371 +29 +27 84 +21 -12
ES 268 +73 +12 453 +65 +37 119 +57 -03
FR 285 +233 -143 568 +423 -322 182 +120 -41
HR 255 +51 +37 369 -56 +85 192 -00 +67
IT 271 +58 +50 495 +107 +50 126 +39 -10
CY 292 +89 +05 386 +34 -79 96 -41 +44
LV 241 -54 +79 345 -81 +67 105 -42 +71
LT 167 -61 +43 307 -56 +10 101 -15 +26
LU 256 +215 -190 419 +246 -217 145 +90 -50
HU 123 +35 -99 208 -85 -34 75 +12 -14
MT 309 -131 +188 678 +61 +84 346 -57 +118
NL 195 +25 -06 481 +84 -14 94 +19 +01
AT 247 +182 -135 450 +280 -227 126 +75 -55
PL 243 +04 +17 427 +60 +28 103 +19 -38
PT 203 +24 +32 356 +15 +25 81 +07 +33
RO 224 -10 +36 411 +72 +93 97 +15 +25
SI 182 -07 +07 335 +60 +39 97 +13 +13
SK 198 +14 -39 368 +51 -52 153 +04 -18
FI 168 -01 +06 280 +38 -30 52 -09 -21
SE 210 +09 +33 402 +81 +16 100 +19 +17
IS 178 +98 +18 345 +113 +26 113 +19 +14
NO 189 +28 -11 340 +25 -04 128 +12 +40
UK 333 +277 -234 554 +356 -258 223 +176 -133
Types of problems
Region
Country
Damaged or wrong delivery Late delivery No delivery
Consumer Survey 2018
194
As with domestic and cross-border online retailers the most common problem overall is late delivery (467) followed by damaged or wrong delivery (235) and purchases not being delivered (133)
In the European Union the proportion of people reporting damaged or wrong deliveries both for domestic and cross-border purchases is 235 In the West this proportion is in line with the EU27_2019 average while it is higher in the South (262) and lower in the North (188) and
East (219) The only result at country level that is higher than the EU27_2019 average is observed in France (285) Additionally this proportion is also high in the UK (333) The lowest proportions are found in Hungary (123) Denmark (158) and Lithuania (167)
Compared to 2016 the proportion of persons experiencing damaged or wrong deliveries of domestic and cross-border purchases increased in the EU27_2019 (+99pp) the West (+157pp) and South (+59pp) while no changes are observed in the East and North At country level the proportion of
consumers who experienced damaged or wrong delivery in domestic and cross-border purchases increased most prominently in France (+233pp) No statistically significant decreases are observed
When looking at changes in 2018 (vs 2016) and in 2016 (vs 2014) the largest negative reversal is found in Luxembourg where between 2016 and 2018 this indicator increased by 215pp reflecting a higher incidence of consumers experiencing damaged or wrong deliveries whereas between 2014 and 2016 it decreased by 190pp Considering all countries of this study an even larger negative reversal is found in the UK where an increase between 2016 and 2018 by 277pp follows a decrease
of 234pp between 2014 and 2016 No statistically significant positive reversal is found
The proportion of consumers experiencing late deliveries for both domestic and cross-border online purchases is 467 in the European Union In the South the proportion is in line with the EU27_2019 average while it is higher in the West (522) and lower in the East (384) and North (357) The highest levels of this indicator are found in Malta (678) France (568) and Germany (512) In addition the level is also high in the UK (554) The lowest levels are found in Hungary (208) Finland (280) and Lithuania (307)
Between 2016 and 2018 the proportion of persons experiencing late delivery of domestic and cross-border purchases increased in the EU27_2019 (+194pp) and in all regions (North +41pp East +44pp South +81pp West +319pp) Compared to the survey in 2016 the proportion of persons
having problems with late delivery of domestic and cross-border purchases increased most prominently in France (+423pp) No statistically significant decreases are observed When looking at changes in 2018 (vs 2016) and in 2016 (vs 2014) the largest negative reversal is also found in
France where the increase between 2016 and 2018 (reflecting a higher incidence of such problems) was preceded by a decrease of 322pp between 2014 and 2016 No statistically significant positive reversal is found
The proportion of consumers who made domestic and cross-border online purchases that were not delivered is 133 in the European Union In the South the proportion is in line with the EU27_2019 average while it is higher in the West (159) and lower in the North (87) and East (106) The highest levels of this indicator are found in Malta (346) Hungary (192) and France
(182) In addition the proportion where online cross-border purchased were not delivered is also high in the UK (223) The lowest levels are found in Finland (52) Hungary (75) and Denmark (77)
Compared to 2016 the proportion of consumers experiencing deliveries of domestic and cross-border purchases that did not take place increased in the EU27_2019 (+62pp) the West (+99pp) South
(+42pp) and East (+14pp) while it remained stable in the North At country-level the proportion of consumers who experienced no delivery in domestic and cross-border purchases increased most
prominently in France (+120pp) while no statistically significant decreases are observed Across the EU Member States the largest negative reversal is found in Ireland where between 2016 and 2018 this indicator increased by 113pp (reflecting a higher incidence of such problems) whereas between 2014 and 2016 it decreased by 96pp Looking at all surveyed countries the largest negative reversal is found in the UK where between 2016 and 2018 this indicator increased by 176pp following a decrease of 133pp between 2014 and 2016 No statistically significant positive reversal
is found
Consumer Survey 2018
195
Percentage of ldquoYesrdquo answers in Q14a1-3 Q14b1-3 or Q14c1-3 ndash Base EU27_2019 respondents who shop
online domestically or cross-border (N=13680)
Male 246 A 479 A 131 A
Female 226 A 452 A 132 A
18-34 278 565 177
35-54 240 473 134
55-64 203 380 94
65+ 147 287 59
Low 207 AB 391 A 135 A
Medium 217 A 450 A 134 A
High 255 B 487 129 A
Very difficult 289 A 457 A 146 A
Fairly difficult 251 A 491 A 121 A
Fairly easy 226 A 465 A 137 A
Very easy 230 A 444 A 125 A
Rural area 230 A 479 A 133 A
Small town 230 A 454 A 120 A
Large town 249 A 468 A 143 A
Self-employed 281 D 472 AB 158 B
Manager 272 CD 509 B 149 B
Other white collar 230 ABC 469 AB 112 A
Blue collar 239 BCD 441 A 122 AB
Student 188 AB 497 AB 139 AB
Unemployed 254 BCD 432 AB 127 AB
Seeking a job 174 A 405 A 131 AB
Retired 217 ABC 452 AB 166 AB
Age groups
Types of problemsDamaged or wrong
deliveryLate delivery No delivery
Gender
Education
Financial Situation
Urbanisation
Employment status
Consumer Survey 2018
196
Percentage of ldquoYesrdquo answers in Q14a1-3 Q14b1-3 or Q14c1-3 ndash Base EU27_2019 respondents who shop
online domestically or cross-border (N=13680)
With regard to socio-demographic variables and other characteristics damaged or wrong deliveries for domestic and cross-border purchases is associated most closely with age followed by employment status and education
Younger consumers (aged 18-34 years) are more likely to receive damaged or wrong deliveries than the remainder of the population In addition those aged 35-54 years are more likely to experience
this problem with domestic or cross-border retailers than consumers aged 55 or older
Regarding consumersrsquo employment status those who are self-employed are more likely to
experience damaged or wrong deliveries than other white collars students those seeking a job and those who are retired Blue collar workers and those who are unemployed are also more likely to experience such problems than those who are seeking a job
In terms of education highly educated consumers are more likely to report damaged or wrong deliveries than consumers with a medium education
In terms of experiencing late deliveries for both domestic and cross-border purchases this indicator is associated most closely with age Other characteristics that have a close link with this indicator are vulnerability due to the complexity of offers and terms and conditions education and employment status
Only native 213 A 427 A 117 A
Two 253 B 493 B 134 A
Three 227 AB 452 A 140 A
Four or more 235 AB 473 AB 144 A
Not official
language in home
country
197 A 420 A 166 A
Official language
in home country238 A 468 A 129 A
Low 268 A 432 A 134 A
Medium 228 A 476 A 119 A
High 236 A 465 A 136 A
Daily 240 A 467 A 134 B
Weekly 189 A 443 A 85 A
Monthly 171 A 461 A 118 AB
Hardly ever 137 A 480 A 143 AB
Never
Very vulnerable 253 AB 468 AB 135 AB
Somewhat
vulnerable272 B 492 B 169 B
Not vulnerable 218 A 454 A 115 A
Very vulnerable 273 A 552 186
Somewhat
vulnerable247 A 466 A 125 A
Not vulnerable 226 A 454 A 126 A
Types of problems
Consumer vulnerability
(socio-demographic
factors)
Consumer vulnerability
(complexity)
Late delivery No delivery
Languages
Mother Tongue
Numerical skills
Internet use
Damaged or wrong
delivery
Consumer Survey 2018
197
Similar to experiencing issues with damaged or wrong deliveries younger consumers (aged 18-34
years) are more likely to experience problems with late deliveries than all other age groups In addition those aged 35-54 years are more likely to experience this problem than consumers aged 55-64 years who in turn are more likely to encounter such problems than those aged 65+ years
Consumers who are very vulnerably due to the complexity of offers and terms and conditions are also noticeably more likely to experience late deliveries than those who are somewhat or not vulnerable
Regarding education consumers with a high level of education are more likely to report encountering
such problems than consumers with a low or medium level of education
Finally in terms of consumersrsquo employment status managers are the most likely to experience late deliveries and more so than blue collar workers and jobseekers
Regarding the incidence of consumers having their domestic or cross-border purchases not delivered this indicator is associated most closely with age followed by vulnerability due to the complexity of offers and terms and conditions and employment status
Consistent with the findings for the two other problems with domestic and cross-border purchases consumers aged 18-34 years are more likely to experience the issues of having their purchases not delivered than all other age groups In addition those aged 35-54 years are more likely to encounter this problem than consumers aged 55-64 years who in turn are more likely to encounter this problem than those aged 65+ years
Consumers who are very vulnerable due to complexity of offers and terms and conditions are also more likely to report missing deliveries than those who are somewhat or not vulnerable
Finally in terms of consumersrsquo employment status managers and consumers who are self-employed are more likely compared to other white collars
Consumer Survey 2018
198
13 CONSUMER VULNERABILITY
Since the 2016 edition of the Consumersrsquo attitudes towards cross-border trade and consumer protection survey special attention is given to consumer vulnerability Chapter 12 presents the findings based on self-reported consumer vulnerability based on six concrete pre-defined drivers of vulnerability health problems poor financial circumstances current employment situation terms
and conditions that are too complex age and belonging to a minority group In addition personal issues and other issues were included as potentially relevant categories
The results of the survey show that in 2018 432 of the EU27_2019 citizens believe to be vulnerable as consumers for one or more aspects mainly linked to their socio-demographic status which is higher than in 2016 (351) Perceived vulnerability based on the complexity of offers terms and condition has also increased to 342 in 2018 compared to 238 in 2016
Regarding vulnerability that stems from consumersrsquo socio-demographic status the most prevalent
reasons mentioned are related to economic conditions (poor financial circumstances 252 and current employment situation 174 Overall 150 of consumers surveyed that they feel
vulnerable due to their age while 141 reported health problems as a key factor in feeling vulnerable when purchasing goods or services Being part of a minority group is the factor that is reported by the relatively lowest proportion of the respondents with only 90 of respondents feeling vulnerable to at least some extent
Q2147 ndash Base all EU27_2019 respondents (N=25532)
Self-assessed vulnerability varies largely by geographical area of the European Union Vulnerability that stems from consumers socio-demographic background is highest in the Eastern part of the EU (524) followed by the South (480) and the West and North (both 360) Vulnerability that is based on problems with the complexity of offers or terms and conditions is more evenly spread across the different EU regions The proportion of consumers that reports this type of vulnerability is highest
in the East (381) followed by the South (355) West (319) and North (310)
47 Q21 The following statements are about disadvantages that consumers may have when dealing with retailers
To what extent do they apply to you personally You feel vulnerable or disadvantaged when choosing and buying goods or serviceshellip -To a great extent ndash To some extent ndashHardly at all ndashNot at all ndashDKNA Q211 Because of your health problems Q212 Because of your poor financial circumstances Q213 Because of your current employment situation Q214 Because offers terms or conditions are too complex Q215 Because of your age Q216 Because you belong to a minority group Q217 Because of personal issues Q218 Because of other issues
342
432
111
124
90
150
174
252
141
0 10 20 30 40 50 60 70 80 90 100
Offers terms or conditions are too complex
Any socio-demo
Other
Personal issues
Belonging to a minority group
Age
Current employment situation
Poor financial circumstance
Health problems
Self-reported vulnerability EU27_2019 average
Consumer Survey 2018
199
Q21 ndash Base all EU27_2019 respondents (N=25532)
Additional analyses were done to better understand the relationship between consumer conditions and consumersrsquo self-assessed vulnerability based on their socio-demographic background and how that relationship differs from one regional area to the other Results from the multivariate analysis performed by geographical area show that while this type of perceived vulnerability is highest in the East the link between consumersrsquo self-assessed vulnerability and consumer conditions tends to be the weakest The difference in scores on consumer conditions between very vulnerable and not
vulnerable consumers in the South is more than twice as high as the differences observed in the East Consumers in the South however scored also relatively high on vulnerability The link of vulnerability with consumer conditions in the West and North is relatively moderate with values between the ones of the East and the South
Q21ndash Base all EU27_2019 respondents ndash East (N=7845) West (N=6304) South (N=4851) North
(N=5928) When the difference between the very vulnerable and the not vulnerable consumers is not statistically
significant at 5 probability level it is considered equal to 0 (ex knowledge of consumer rights in the Western and Northern regions)
In a final analysis an alternative way to look at the possible determinants of consumer vulnerability was considered by performing a multivariate analysis between self-assessed vulnerability and the socio-demographic characteristics of the persons interviewed
Consumer conditions EAST WEST SOUTH NORTH
Knowledge of consumer rights 0000 0000 0045 0045
Trust in organisations 0092 0000 0097 0000
Confidence in online shopping 0000 0000 0080 0058
Perception of redress mechanism -0037 0000 0000 0000
No exposure to UCPs 0031 0082 0039 0068
No experience of specific shopping problems 0036 0069 0062 0048
Numerical skills 0023 0000 0000 0040
Trust in product safety 0047 0115 0000 0000
Trust in enviromental claims 0000 0000 0095 0000
Problems and complaints indicator 0000 0000 0000 0031
Average 0019 0027 0042 0029
Consumer Survey 2018
200
Q21 ndash Base all EU27_2019 respondents (N=24928)
By and large the results from the logit regressions confirm what was stated by consumers (as discussed above) The tendency to feel vulnerable regarding their socio-demographic background is associated most closely with the financial situation of the consumers In particular
the easier a consumersrsquo financial situation the less likely they are to perceive themselves vulnerable Also higher levels of vulnerability (in terms of socio-demographics) are also observed in persons with a mother tongue not being one of the official languages spoken in the countryregion of
Male 410 342 A
Female 448 343 A
18-34 474 314 A
35-54 430 B 323 A
55-64 421 AB 384 B
65+ 385 AB 374 B
Low 449 A 364 A
Medium 432 A 331 A
High 422 A 351 A
Very difficult 684 441
Fairly difficult 557 389
Fairly easy 363 325
Very easy 270 267
Rural area 456 353 A
Small town 420 A 334 A
Large town 416 A 342 A
Self-employed 430 BC 357 A
Manager 383 AB 346 A
Other white collar 370 A 342 A
Blue collar 421 BC 355 A
Student 516 E 362 A
Unemployed 443 CD 332 A
Seeking a job 519 E 348 A
Retired 485 DE 327 A
Only native 436 AB 345 A
Two 422 AB 340 A
Three 448 B 350 A
Four or more 398 A 324 A
Not official
language in home
country
517 348 A
Official language
in home country425 342 A
Low 433 AB 337 A
Medium 449 B 341 A
High 419 A 344 A
Daily 416 A 346 B
Weekly 482 B 379 B
Monthly 505 AB 365 AB
Hardly ever 446 AB 315 AB
Never 472 B 292 A
Internet use
Financial Situation
Urbanisation
Employment status
Languages
Mother Tongue
Numerical skills
Education
Vulnerability
(socio-
demographics)
Vulnerability
(complexity)
Gender
Age groups
Consumer Survey 2018
201
residence With regard to employment status white collars and managers are the least likely to
experience feelings of vulnerability while those seeking a job and students are more exposed to this issue Furthermore we observe that consumers of 55 years and older are less likely to be vulnerable than young consumers (18-34-year-old) Males tend to be less vulnerable than females and consumers in rural areas are more vulnerable than consumers living in small and large towns
Fewer links with socio-demographic categories are found for vulnerability that stems from complexity with offer and terms and conditions Similar to the other vulnerability type consumers are more likely to feel vulnerable due to complexity when they are in a more difficult
financial situation In addition consumers aged 55 years or older are less likely to be vulnerable than consumers younger than 55 years Finally internet usage is also associated with this type of vulnerability consumers that never use the internet are less likely to perceive themselves vulnerable due to complexity than daily and weekly internet users
Consumer Survey 2018
202
14 DETERMINANTS OF CONSUMER CONDITIONS
As part of this report on consumersrsquo attitudes towards cross-border trade and consumer protection this chapter presents an overview of the links between the socio-demographic variables and a series of key consumer conditions indicators This overview is a summary of the results of a multivariate analysis which estimates the influence of each individual socio-demographic characteristic with the
other characteristics held constant48 The table below shows the socio-demographic variables as rows and the different key consumer conditions indicators in the columns49 By comparing estimated averages across the different dependent variables conclusions about the link of the different socio-demographic with consumer conditions can be drawn
The financial situation of the persons interviewed is the factor more closely linked with consumer conditions Persons with a difficult financial situation (ie a very or fairly difficult situation) tend to show lower trust in organisations lower confidence in online shopping lower trust in product safety
lower trust in environmental claims and a higher probability to experience UCPs Trust in organisations and confidence in online shopping is also lower for people with severe financial problems (ie a very difficult financial situation) than for people with a fairly difficult financial situation the former group being more likely to be exposed to UCPs Likewise trust in redress
mechanisms is lower for people with severe financial problems than the remainder of the population Finally persons in an easy or very easy financial situation score higher on the problems and
complaints indicator than people with severe financial problems
Age tends to be negatively correlated with most of the variables covering trust and confidence Persons of 55 years old and above tend to express lower levels of trust in organisations trust in redress mechanisms and confidence in online shopping than the rest of the population In addition young persons (less than 35 years old) are more likely to express trust in environmental claims than those aged 55 or more There is also a marked negative correlation between age and consumersrsquo confidence in online shopping In contrast young persons appear less knowledgeable of their
consumer rights than all the other age groups and they are more likely to experience other shopping problems (ie other illicit practices) Finally persons aged 65 and above show slightly less numerical skills than the rest of the population
Levels of education are positively correlated with confidence in online shopping and as it can be expected to numerical skills In contrast highly educated persons are more likely to be exposed to unfair commercial practices they show a lower score on the problems and complaints indicator and
they are less likely to express trust in redress mechanisms than the rest of the population In
48 The analysis has been performed on the micro-data from the 2018 Survey on Consumersrsquo attitudes towards cross-border trade and consumer protection It covers the 27 EU Member States (ie EU27_2019 excluding the UK) The statistical modelling that was used here is a regression analysis This type of analysis is useful when we want to investigate the relationship between a dependent variable and one or more independent variables There are several different types of regression models We have used both a Poisson model and a Logit model The former is typically used when the dependent variable can be thought of as a count variable The latter is used in a situation where the dependent variable is binary ie it takes only two possible values ldquo0rdquo and ldquo1rdquo The Poisson regression model was used for the following dependent variables knowledge of consumer rights trust in organisations confidence in online shopping trust in redress mechanisms (no) exposure to UCPs (no) experience of other illicit commercial practices and numerical skills The Logit regression model was used for the remaining dependent variables trust in product safety trust in environmental claims The composite indicator on problems and complaints was instead modelled through linear regression (assuming that the variable is numerical) In all models a control variable on the region of residence of the person interviewed (Northern EU Southern EU Eastern EU and Western EU) has been included
49 The table shows the estimated averages of the model for each dependent variable according to the different values of the independent variable In addition these averages should be considered statistically different except when the pair of categories shares one letter (see the column adjacent to the right) When a category
is associated with a blank it means that it is statistically different from all the other categories The letters used in the table have no meaning as they are only used for comparing categories For example an estimated average for knowledge of consumer rights is equal to 047 for males and to 044 for females and this difference is statistically significant (both categories are associated with a blank) Conversely an estimated average on trust in product safety is equal to 067 for low educated persons and to 069 for highly educated persons (but the difference is not statistically significant as both categories share the letter A) Similarly estimated averages on trust in environmental claims are equal to 056 for daily internet users and to 059 for monthly internet users (but the difference is not statistically significant as both categories share the letter C) Estimated averages are all standardized (with a range from 0 to 1) they can be compared across both rows and columns
Consumer Survey 2018
203
addition persons with a low level of education show higher trust in organisations than the rest of the
population It should also be underlined that the knowledge of consumer rights seems not to be influenced by the level of education of the respondents
Perceived vulnerability stemming from the perceived complexity of offersterms and conditions tends to be associated with lower scores on several consumer conditions aspects Consumers who consider themselves as not vulnerable have higher trust in organizations and in redress mechanisms and they are also less likely to be exposed to UCPs and to other illicit practices In addition very vulnerable consumers show less confidence in online buying and lower trust in
environmental claims Finally there is a negative correlation between perceived vulnerability and the problems and complaints indicator (ie the more a person feels vulnerable the lower the score on the problems and complaints indicator)
Perceived vulnerability related to the socio-demographic status of the persons interviewed tends to be linked to lower trust in organizations and a higher probability to encounter other illicit practices In addition persons who perceive themselves as very vulnerable show lower numerical
skills and lower trust in product safety than the rest of the population Similarly consumers who do not feel vulnerable have more confidence in online shopping and they are less likely to encounter
unfair commercial practices (UCPs) with respect to those who have declared to be vulnerable or very vulnerable
Internet use shows as it can be expected a strong positive confidence in online shopping with a strong difference between consumers who never use the internet and those who use the internet daily In addition persons who use the internet at least weekly portray higher levels of trust in
product safety with respect to those who use the internet either sporadically or never Conversely daily internet users are more likely to be exposed to UCPs than the rest of the population
Men tend to be more knowledgeable of their rights as consumers more confident in online shopping and more trustful in regard to product safety They also show higher trust in redress mechanism On the other hand women are less likely to be exposed to unfair commercial practices and are less likely to experience other shopping problems
Consumers whose mother tongue is different from the official language(s) of their country of
residence appear less knowledgeable of their rights as consumers and seem to have lower numerical skills On the other hand they are less likely to report other illicit practices and have higher trust in
product safety
As it can be expected consumers with more language skills (ie more than one language) are more confident in online shopping These consumers also tend to have better numerical skills Nevertheless the same group of persons is also slightly more likely to be exposed to unfair
commercial practices and other illicit practices which may be related to a more active (international) shopping behaviour Extensive language skills seem to be partly associated with lower trust in environmental claims as consumers who speak three or more languages trust these claims to a lesser degree than consumers who speak only one language
The influence of employment status on consumer conditions is less clear-cut than what can be observed for other socio-demographic factors White-collar (excluding managers) are slightly more knowledgeable of their rights as consumers Self-employed and managers are more likely to be
exposed to unfair commercial practices and self-employed most likely experience other shopping problems In addition self-employed show the lowest score on the problems and complaints indicator indicating a lower overall level of problems and higher satisfaction with complaint handling
The influence of numerical skills on consumer conditions is limited High numerical skills are associated with higher confidence in online shopping and more trust in product safety
Finally the area of residence (ie urbanisation rural small town and large town) also has a limited link with consumer conditions Trust in organisations is higher in rural areas compared to small and
large towns Numerical skills appear to be slightly lower in small towns than in large towns and rural areas
Consumer Survey 2018
204
Age
18-34 041 067 B 066 041 070 A 085 037 AB 067 A 058 B 088 A
35-54 046 A 066 B 061 038 070 A 088 A 038 B 069 A 055 AB 089 AB
55-64 049 B 062 A 054 034 A 069 A 089 AB 037 A 068 A 052 A 090 B
65+ 048 AB 062 A 045 032 A 071 A 091 B 034 069 A 051 A 091 B
Gender
Female 044 065 A 056 035 071 089 037 A 066 053 A 090 A
Male 047 065 A 061 039 069 087 037 A 071 055 A 089 A
Education
Low (ISCED 0-2) 044 A 068 052 040 A 075 090 B 034 067 A 057 B 091 A
Medium (ISCED 3-4) 046 A 065 A 057 039 A 070 088 AB 036 068 A 055 AB 090 A
High (ISCED 5-8) 045 A 064 A 061 034 069 087 A 038 069 A 053 A 088
Employment status
Self-employed 045 A 063 A 059 BC 036 AB 066 A 085 A 037 B 069 A 055 A 086 A
Manager 045 A 065 AB 061 CD 035 A 064 A 086 AB 038 B 068 A 054 A 088 AB
Other white collar 049 066 B 060 CD 037 AB 071 B 088 BC 038 B 070 A 053 A 090 BCD
Blue Collar 043 A 064 AB 056 AB 038 AB 070 B 089 BC 035 A 067 A 053 A 090 BCD
Student 043 A 067 B 063 D 038 AB 074 B 090 BC 038 B 070 A 059 A 092 CD
Unemployed 043 A 065 AB 057 ABC 040 B 072 B 089 BC 036 AB 068 A 056 A 088 ABC
Seeking a job 045 A 066 AB 061 BCD 038 AB 073 B 086 ABC 035 A 065 A 051 A 092 D
Retired 045 A 064 AB 053 A 037 AB 070 B 089 C 037 AB 067 A 056 A 089 ABCD
Internet use
Daily 047 B 066 B 063 038 B 068 088 A 038 C 069 C 056 C 089 A
Weekly 043 A 062 A 050 B 035 AB 074 A 088 AB 037 BC 069 C 047 A 091 B
Monthly 041 A 063 AB 041 AB 033 AB 074 AB 086 AB 034 AB 070 BC 059 BC 091 AB
Hardly ever 047 AB 054 A 037 A 030 A 075 AB 092 C 033 A 059 AB 050 ABC 091 AB
Never 042 A 060 A 025 035 AB 078 B 090 BC 032 A 061 A 050 AB 093 B
Urbanisation
Rural area 044 A 067 059 A 037 A 069 A 088 AB 037 A 069 A 055 A 090 A
Small town 047 B 064 A 059 A 037 A 070 A 088 B 036 068 A 054 A 089 A
Large town 046 AB 064 A 058 A 037 A 070 A 087 A 037 A 069 A 054 A 090 A
Language
One 045 A 064 AB 055 037 A 071 090 035 068 A 057 C 090 A
Two 046 AB 066 B 060 A 037 A 070 A 088 A 038 A 069 A 054 BC 089 A
Three 046 AB 065 AB 061 A 037 A 068 A 086 A 038 AB 068 A 052 AB 089 A
Four or more 049 B 063 A 061 A 036 A 068 A 085 A 039 B 070 A 049 A 090 A
Financial_difficulty
Very difficult 046 AB 056 048 032 065 085 A 036 A 063 A 047 A 086 A
Fairly difficult 045 A 062 056 036 A 069 087 AB 037 A 066 A 051 A 089 AB
Fairly easy 045 A 067 A 060 A 038 B 071 A 089 C 037 A 070 B 057 B 090 BC
Easy 048 B 068 A 062 A 039 AB 072 A 088 BC 037 A 071 B 055 B 091 C
Numerical skills
Low 045 AB 063 A 055 A 037 A 069 A 089 A 066 A 054 A 090 A
Medium 045 A 064 A 057 A 038 A 070 A 088 A 067 A 054 A 089 A
High 046 B 065 A 060 036 A 070 A 088 A 070 054 A 089 A
Vulner sociodemo
Very vulnerable 044 A 060 055 A 038 A 067 A 084 035 063 052 A 089 A
Somewhat vulnerable 045 A 064 056 A 037 A 067 A 087 037 A 069 A 053 A 089 A
Not vulnerable 046 A 067 060 037 A 072 090 037 A 070 A 056 A 090 A
Vulner complexity
Very vulnerable 046 A 062 A 054 035 A 066 A 085 A 037 A 064 A 050 085
Somewhat vulnerable 046 A 064 A 058 A 035 A 067 A 086 A 037 A 067 AB 054 A 089
Not vulnerable 046 A 066 060 A 038 072 089 037 A 070 B 056 A 091
Mother Tongue
No 042 063 A 056 A 036 A 070 A 084 035 066 A 060 088 A
Yes 046 065 A 059 A 037 A 070 A 088 037 068 A 054 090 A
No
exp
eri
en
ce
wit
h o
ther
illi
cit
pra
cti
ces
Nu
meri
cal
skil
ls
Tru
st
in p
rod
uct
safe
ty
Tru
st
in
en
vir
om
en
tal
cla
ims
Pro
ble
ms a
nd
co
mp
lain
ts
ind
icato
r
Kn
ow
led
ge o
f
co
nsu
mer
rig
hts
Tru
st
in
org
an
isati
on
s
Co
nfi
den
ce i
n
on
lin
e s
ho
pp
ing
Tru
st
in r
ed
ress
mech
an
ism
No
exp
osu
re t
o
UC
Ps
Consumer Survey 2018
205
15 ANNEX I SAMPLING METHODOLOGY
In every country a random sample representative of the national population aged 18 or over was drawn ie each person belonging to the target universe had a chance to participate in the survey For some countries suitable telephone number register(s) are available for both fixed and mobile lines whilst for other countries only register(s) for either fixed or mobile lines can be used and in
some countries no register exists at all In instances where no register was available RDD50-numbers were generated The following variables were used for stratification gender age and region as far as the information was available in the sample frame(s)
A dual sampling frame was introduced
Mobile sample potential respondents within a given country that can be reached via a mobile line (regardless of whether they can also be reached via a fixed line) As such this sample includes respondents from both the mobile only and mixed population
119924119952119939119946119949119942 119956119938119950119953119949119942 =119927119955119952119953119952119955119957119946119952119951 119952119943 119950119952119939119946119949119942 119949119946119951119942119956
119931119952119957119938119949 119953119952119953119958119949119938119957119946119952119951 119952119943 119953119945119952119951119942 119951119958119950119939119942119955119956=
119924 + 119924119917(119924 + 119924119917) + (119917 + 119924119917)
Fixed sample potential respondents within a given country that can be reached via a fixed line (regardless of whether they can also be reached via mobile line) As such this sample includes respondents from both the fixed line only and mixed population
119917119946119961119942119941 119949119946119951119942 119956119938119950119953119949119942 =119927119955119952119953119952119955119957119946119952119951 119952119943 119943119946119961119942119941 119949119946119951119942119956
119931119952119957119938119949 119953119952119953119958119949119938119957119946119952119951 119952119943 119953119945119952119951119942 119951119958119950119939119942119955119956=
119917 + 119924119917
(119924 + 119924119917) + (119917 + 119924119917)
F = fixed only M = mobile only and MF = mobile and fixed
For example Germany was set to have the following proportions in the study 83 mixed 9 fixed only 8 mobile only Therefore the local teams composed a gross sample of 50 fixed numbers defined as ((83+9)(83+9)+(83+8)) and 50 mobile numbers ((83+8)(83+9)+(83+8))
To further guarantee the representativeness of the sample the time of calling was predominantly weekday evenings with interviewing before only authorised upon specific request with a motivated rationale In case of interviews conducted during the weekend or appointments made upon
respondent request calls could take place all day long Also the birthday rule question was included for landlines to ensure a random selection procedure and minimise potential bias related to the person who would answer the call
No quota was set for socio-demographic variables such as gender or age However during fieldwork the overall sample intake was monitored daily to follow up on the overall composition of the sample on gender age region and the possession of a mobile andor a fixed phone in accordance with the
sampling approach adopted
50 Random Digit Dialing With RDD software is used to generate new telephone numbers starting from a list of starting numbers New telephone numbers are created and used by adding and subtracting digits in the existing telephone number The composition of the starting number is important here for obtaining sufficient geographical spread
Consumer Survey 2018
206
HOW TO OBTAIN EU PUBLICATIONS
Free publications
bull one copy via EU Bookshop (httpbookshopeuropaeu)
bull more than one copy or postersmaps from the European Unionrsquos representations (httpeceuropaeurepresent_enhtm) from the delegations in non-EU countries (httpeeaseuropaeudelegationsindex_enhtm) by contacting the Europe Direct service (httpeuropaeueuropedirectindex_enhtm) or calling 00 800 6 7 8
9 10 11 (freephone number from anywhere in the EU) () () The information given is free as are most calls (though some operators phone boxes or hotels may charge you)
Priced publications
bull via EU Bookshop (httpbookshopeuropaeu)
doi 102818209599
EB-0
1-1
9-1
85-E
N-N

EUROPEAN COMMISSION
Produced by Consumers Health Agriculture and Food Executive Agency (Chafea) on behalf of
Directorate-General for Justice and Consumers
Unit JUST03 (Economic analysis amp evaluation)
E-mail JUST-03eceuropaeu
European Commission
B-1000 Brussels
EUROPEAN COMMISSION
Directorate-General for Justice and Consumers EU Consumer Programme
2019 3 EN
Consumers attitudes towards cross-border trade and
consumer protection 2018
Final Report
This report was produced under the EU Consumer Programme (2014-2020) in the frame of a service contract with the Consumers Health Agriculture and Food Executive Agency (Chafea)
acting under the mandate from the European Commission
The content of this report represents the views of the contractor and is its sole responsibility it
can in no way be taken to reflect the views of the European Commission andor Chafea or other body of the European Union
The European Commission andor Chafea do not guarantee the accuracy of the data included in this report nor do they accept responsibility for any use made by third parties thereof
More information on the European Union is available on the Internet (httpeuropaeu)
More information on the European Union is available on the Internet (httpeuropaeu)
Luxembourg Publications Office of the European Union 2019
Project number 20191119
Title Survey on consumers attitudes towards cross-border and consumer-related issues 2018 ndash Final Report
Language version
SupportVolume Catalogue number ISBN DOI
EN PDF PDFVolume_01
EB-01-19-185-EN-N 978-92-9478-091-1 102818209599
copy European Union 2019
Reproduction is authorised provided the source is acknowledged
Europe Direct is a service to help you find answers
to your questions about the European Union
Freephone number ()
00 800 6 7 8 9 10 11
() The information given is free as are most calls (though some operators phone boxes or hotels may charge
you)
Consumer Survey 2018
5
TABLE OF CONTENTS
TABLE OF CONTENTS 5
1 INTRODUCTION 7
Introduction to the 2018 wave of the Consumer Survey 7
Sampling methodology 7
121 Countries covered 8
122 Core questionnaire 9
123 Socio-demographic and background questions 9
124 Analysis and reporting of statistically significant differences 10
125 Weighting and wave to wave comparisons 11
2 EXECUTIVE SUMMARYKEY FINDINGS 13
3 DOMESTIC AND CROSS-BORDER SHOPPING 16
Domestic and cross-border online purchases 16
Offline cross-border purchases 23
4 THE EVOLUTION OF ONLINE PURCHASE BEHAVIOUR 28
5 KNOWLEDGE OF CONSUMER RIGHTS 35
General level of knowledge about consumer rights 35
Knowledge of the cooling-off period 38
Knowledge of faulty product guarantees 41
Knowledge of rights regarding unsolicited products 43
6 TRUST IN CONSUMER PROTECTION 46
Trust in organisations 46
611 Public authorities 49
612 Retailers and service providers 51
613 NGOs 54
Trust in redress mechanisms 56
621 ADR 59
622 Courts 61
7 TRUST IN PRODUCT SAFETY 63
8 TRUST IN ENVIRONMENTAL CLAIMS 66
Reliability of environmental claims 66
The influence of environmental claims on purchasing decisions 69
9 CONSUMER CONFIDENCE IN ONLINE PURCHASES 72
Domestic online purchases 72
Cross-border online purchases 75
10 UNFAIR COMMERCIAL PRACTICES 78
Unfair commercial practices from domestic retailers 78
1011 Exposure to UCPs from domestic retailers 78
1012 Types of UCPs from domestic retailers 82
Unfair commercial practices from cross-border retailers 92
1021 Exposure to UCPs from cross-border retailers 92
1022 Types of UCPs from cross-border retailers 95
Other illicit commercial practices from domestic retailers 105
1031 Exposure to other illicit commercial practices from domestic retailers 105
1032 Types of other illicit commercial practices from domestic retailers 107
1033 Exposure to other illicit commercial practices from cross-border retailers 113
Consumer Survey 2018
6
1034 Types of other illicit commercial practices from cross-border retailers 114
11 OVERALL PROBLEMS AND DISPUTE RESOLUTION 120
The problems and complaints indicator 120
1111 No problems 124
1112 No complaint 126
Actions taken to resolve problems (breakdown by kind of action plus no action taken) 129
Reasons for not taking action 137
Satisfaction with problem resolution 152
Problems making purchases in other EU countries 162
12 PROBLEMS EXPERIENCED WITH ONLINE PURCHASES 173
Problems with domestic online purchases 173
1211 Types of problems with domestic online retailers 177
Problems with cross-border purchases 182
1221 Types of problems with cross-border online retailers 186
Overall problems experienced 191
1231 Overall types of problems 193
13 CONSUMER VULNERABILITY 198
14 DETERMINANTS OF CONSUMER CONDITIONS 202
15 ANNEX I SAMPLING METHODOLOGY 205
Consumer Survey 2018
7
1 INTRODUCTION
Introduction to the 2018 wave of the Consumer Survey
This report discusses the results of the 2018 edition of the survey on consumersrsquo attitudes towards
cross-border trade and consumer-related issues which is part of a series of reports within the EU Consumer Programme The study is a follow-up of a series of related studies that have been conducted since 20061 It was commissioned by the Consumers Health Agriculture and Food Executive Agency (Chafea) The European Commission gathers systematic evidence to monitor consumer markets and national consumer conditions within the EU summarised in the flagship Consumer Conditions Scoreboards (CCS) Results from this survey will feed the 15th edition of the CCS2
The present survey aims to deliver reliable results that are comparable with previous studies in the series on issues related to the attitudes perceptions and experiences of European consumers in the following areas
Domestic and cross-border commerce both online and offline
Knowledge of consumer rights
Trust in consumer protection
Perceptions of the product safety environment
Perceptions of environmental claims and their influence purchase decisions
Confidence in online shopping
Problems experienced actions taken and satisfaction with problem resolution
Exposure to unfair commercial practices
Consumer vulnerability
In total 28037 respondents took part in the survey which was carried out by GfK Social and
Strategic Research (GfK SSR) in the 27 Member States of the European Union and in the United Kingdom Iceland and Norway between 26 March and 11 May 2018 The report presents the overall results of the study as well as comparisons between the Member States socio-demographic variables and comparisons with the results from previous surveys
Sampling methodology
The target population includes all people aged 18 and above resident in the country surveyed and having sufficient command of (one of) the respective national language(s) to answer the questionnaire
In every country a random sample representative of the national population aged 18 or older was drawn by means of fixed line or mobile telephone number registers or Random Digit Dialling software The sampling procedure was set up to achieve a mix of respondents recruited through
mobile phone and fixed line Furthermore the sample intake was monitored to follow up on the
overall composition of the sample in terms of gender age and the ownership of a mobile andor a fixed phone For more information on the sampling methodology please consult Annex I
1 Special Eurobarometer 252 (2006) Special Eurobarometer 298 (2008) Flash Eurobarometer 282 (2009) Flash Eurobarometer 299 (2010) Flash Eurobarometer 332 (2011) Flash Eurobarometer 358 (2012) Flash Eurobarometer 397 (2014) and the Consumersrsquo attitudes towards cross-border trade and consumer related issues 2016 report (2016)
2 httpeceuropaeuconsumersconsumer_evidenceconsumer_scoreboardsindex_enhtm
Consumer Survey 2018
8
The respondents participated in a Computer Assisted Telephone Interview (CATI) conducted by
native speaking interviewers making use of a central programme They were interviewed on the core aspects of their experiences as consumers (see the aforementioned topics) as well as key socio-demographic variables such as age gender and education Based on these data averages and proportions are calculated for the countries and socio-demographic groups
121 Countries covered
The survey took place in the 27 EU Member States as well as in the United Kingdom Iceland and Norway The table below presents an overview of the country abbreviations and region comparisons used throughout the report
It should be noted that following the UKrsquos decision to leave the EU a new country grouping the EU27_2019 was introduced being equal to the EU28 without the UK The EU27_2019 is used as the main EU-aggregate and therefore as the comparison base for the results from the regions and countries While the EU28 aggregate (including the UK) is kept in the tables (for comparison
purposes) no comments are provided on this aggregate The terms lsquoEuropean Unionrsquo and lsquoEUrsquo used throughout the report always refer to the EU27_2019
The grouping of EU27_2019 countries into North East South and West regions was also adjusted to the new composition of the EU excluding the UK from the West In addition consistent with the analysis for the Market Monitoring Survey 2017 the Baltics (ie Lithuania Latvia and Estonia) were moved from the Eastern to the Northern region (the analysis has been adjusted for all years in the
report)
Finally Croatia has been included in the calculations of the EU27_2019 EU28 and regions results starting from 2012 This means that both for the 2014-2012 comparisons and the 2012-2011 comparisons Croatia is including in the EU averages For the latter comparison (ie 2012-2011) however Croatia is only included in the 2012 results resulting in a slight incoherence
Country EU27_2019 EU28 Region North
Region East
Region South
Region West
AT Austria X X X
BE Belgium X X X
BG Bulgaria X X X
CY Cyprus X X X
CZ Czech Republic X X X
DE Germany X X X
DK Denmark X X X
EE Estonia X X X
EL Greece X X X
ES Spain X X X
FI Finland X X X
FR France X X X
HU Hungary X X X
HR Croatia X X X
IE Ireland X X X
IT Italy X X X
LT Lithuania X X X
LU Luxembourg X X X
LV Latvia X X X
MT Malta X X X
NL Netherlands X X X
PL Poland X X X
PT Portugal X X X
RO Romania X X X
Consumer Survey 2018
9
122 Core questionnaire
The core questionnaire covered the following topics
Online and offline purchase of goods or services (trend questions)
Trust and perception of consumer protection (trend questions)
Perceptions of the product safety environment (trend questions)
Influence of environmental concerns on purchasing (trend questions)
Understanding of consumer rights (trend questions)
Problems experienced with domestic purchases in general actions taken (if no action taken reason why) satisfaction with complaint handling and time needed to resolve problem (trend questions)
Exposure to unfair commercial practices (trend questions)
Problems experienced when shopping online (domestic and cross-border purchases) (trend questions)
Consumer confidence in online shopping (trend questions)
Languages comfortably used for personal interests (trend question)
Numerical skills (trend questions)
Consumersrsquo self-reported vulnerability
123 Socio-demographic and background questions
Based on the final version of the questionnaire approved by the Contracting Authority the following questions were asked before the core questionnaire
Birthday rule (for fixed line sample)
Age
Gender
Phone ownership having a mobile (for fixed line sample)having a landline (for mobile line sample)
Regularity of using the internet
After the core questionnaire was completed the following socio-demographic questions were asked
Vulnerability (related to socio-demographic statusrelated to the perceived complexity of
offersterms and conditions)
SE Sweden X X X
SI Slovenia X X X
SK Slovakia X X X
UK United Kingdom X
NO Norway
IS Iceland
Consumer Survey 2018
10
Level of education
Employment situation (occupation)
Mother tongue of a respondent
Region of residence3
Subjective degree of urbanisation
Subjective financial situation
124 Analysis and reporting of statistically significant differences
All differences mentioned in the text are statistically significant unless otherwise mentioned Statistical significance is calculated at the 95 confidence level meaning that the null hypothesis of no difference has been rejected at 5 probability level Differences that are not statistically
significant are considered equal to 0 Consequently the report may describe two values as being equal even if the difference between both values is not equal to 0 It should also be mentioned that especially for measures referring to the entire EU27_2019EU28 given the large sample size for the
survey some differences could be statistically significant even if their absolute magnitude is very small
The findings for the EU27_2019 EU28 the four EU27_2019 regions (North South East and West) and the individual country results are analysed using cross-tabulations Please note that in the region and country tables results that are statistically different from the EU27_2019 average are indicated by asterisks
Differences between the levels of socio-demographic categories are analysed with a regression analysis which explores the relationship between a specific independent variable (eg age) and a dependent variable (eg online purchase behaviour) while considering the effects of other independent variables (eg gender education etc) This type of analysis is considered more appropriate when exploring the impact of socio-demographic variables due to the potential overlap (correlations) between different socio-demographic factors which need to be considered when
measuring the extent to which one of these factors affects the dependent variables The following
regression models are used for the analysis of the different dependent variables
Logit models when the dependent variable is binary (ie it takes only two possible values 0 and 1 eg trust in product safety trust in environmental claims)
Poisson models for dependent variables that can be thought of as a count variable (eg knowledge of consumer rights trust in organisations)
Linear models when the dependent variable is assumed to be numerical and linear (eg problems and complaints)
In all models a control variable on the region of residence of the person interviewed (North South East and West) has been included
3 Regions was recorded on NUTS level 3 (Estonia Croatia Latvia Lithuania Malta Slovenia amp Iceland) and NUTS level 2 (all other countries)
Consumer Survey 2018
11
The values shown in the tables of the socio-demographic analyses are based on model estimates4
Statistically significant differences between levels of a socio-demographic variable are indicated with letters The categories of a socio-demographic variable are statistically significant different from each other except when the categories share the same letter When a category is associated to a blank it means that it is statistically significant different from all the other categories Differences and equalities for socio-demographic results are only considered within each socio-demographic variable (eg 18-34 yearsrsquo old vs 35-54 yearsrsquo old) and not between socio-demographic variables (eg 18-34 yearsrsquo old vs women)
Up to five socio-demographic characteristics with the closest link with the respective dependent variable are reported on in detail Characteristics with the closest link are selected considering the average magnitude of the difference across the factor attributes ndash in absolute terms (eg the differences in the knowledge of consumer rights ndash in absolute terms ndash across the different levels of internet use) ndash and by looking at the overall coherence of these differences
The report describes changes between the current (2018) and previous (2016) waves In addition
changes in the latest waves (2018-2016) are compared to changes in the previous waves (2016-
2014) This is reported on only when both changes are significant and when the direction of the change has reversed ie from an increase to a decrease or from a decrease to an increase For positive indicators (ie knowledge of consumer rights domestic online shopping etc) these cases are labelled ldquonegative reversalrdquo and ldquopositive reversalrdquo respectively For negative indicators (eg problems and complaints exposure to unfair commercial practices etc) the labels are reversed to account for the negative valence of the indicator where an increase would reflect a change towards
the negative The current report focuses on the strongest positive and negative reversals which are determined by the highest absolute sum of both changes
125 Weighting and wave to wave comparisons
Data from the current wave was weighted based on the latest Eurostat data5 available on age (three groups 18-34 35-54 and 55+ year old) and gender distributions In addition the weighting was
also based on telephone ownership data from the Special Eurobarometer 4386 (three groups fixed only mobile only mixed) Finally population weights were also applied both on the EU27_2019 sample (for the EU27_2019 average) and the EU28 sample (for the EU28 average and regions) to account for differences in population size at country level
In contrast with the current Consumer Survey the Consumer Survey 2016 was only weighted on age and gender (in addition to the population weight) To facilitate comparisons between 2018 and 2016 a second weight was calculated for the 2018 survey based solely on age and gender
Both the Consumer Survey 2016 and 2018 have been conducted with a target population of 18+ years while the Consumer Surveys 2014 and earlier are based on a sample of 15+ years For comparisons between the years 2016 and 2014 the latter has been reweighted based on age and gender distributions Data from all waves before 2014 will be used for the wave to wave comparisons based on existing samples (population 15+) and using the existing weights provided by the Contracting Authority (also based on the 15+ population distribution) When comparing 2014 data
4 Model estimates are calculated using the margins function in Stata A margin is a statistic based on a fitted model calculated over a dataset in which some of or all the covariates are fixed at values different from what they really are In the models estimated for this report the margins function calculates the predicted means for the different values of a socio-demographic variable (eg age) while all the other covariates (including the
other socio-demographic variables) are hold fixed In practice the estimated value of a dependant variable Y (ex the of persons who have bought online in the last 12 months) for the male category is obtained under the hypothesis that all the persons interviewed are males while their remaining sociodemographic characteristics (used in the model as regressors) corresponds to the categories observed in the sample
In addition a pwcompare (group effects) option was added to the function to perform pairwise comparisons between all levels of a socio-demographic variable based on the estimated models These comparisons provided information to determine the variables with the closest link with the respective dependent variable
5 Eurostat Population on 1 January 2018 by age sex and NUTS 2 region updated on 27 February 2018
6 Special Eurobarometer 438 E-Communications and the Digital Single Market (2016) available via httpdataeuropaeueuodpendatadatasetS2062_84_2_438_ENG
Consumer Survey 2018
12
to previous waves the original weight will be used based on the 15+ population distribution The
difference in sampling will be clearly communicated when wave-to-wave changes are reported
To summarise the following weighting procedures were used to calculate the results presented in the final report additional analyses and country profiles
2018 Population gender amp age weighting (18+) phone ownership weighting
2016 Population gender amp age weighting (18+)
2014 Population gender amp age weighting (18+)
2014 Population gender amp age weighting (15+)
2012 Population gender amp age weighting (15+)
2011 Population gender amp age weighting (15+)
2010 Population gender amp age weighting (15+)
2009 Population gender amp age weighting (15+)
2008 Population gender amp age weighting (15+)
2006 Population gender amp age weighting (15+)
In conclusion it should be considered that in the light of the methodological approach indicated above
Changes with respect to the previous year ndash which are shown in graphs and tables throughout the report - are always computed on comparable data
However given the change in methodology applied for the 2018 results (age gender amp phone ownership) and the 2018-2016 comparison (age amp gender no phone ownership) it is not possible to compute the exact results for 20167 by subtracting the 2018-2016 change from
the 2018 results The same is true for the changes in previous waves
The applied methodology ensures comparability between the current (2018) and previous (2016) wave As such it is in principle possible to estimate values in level for 2016 by applying back the observed changes between 2016 and 2018 as reported in graphs and tables throughout the report However due to different weightings applied to the 2018 data for presenting the 2018 results and for comparisons with the 2016 results small differences may occur
Differences between 2014 and previous waves are reported based on the original methodology while data in levels is not reported as it is not consistent with the last two waves Because of the lack of comparability with data reported for the last two waves (2016 and 2018) it is not possible to estimate data in levels for the years 2012 and before
7 As presented in the 2017 Consumer Conditions Scoreboard (available via httpseceuropaeuinfositesinfofilesconsumer-conditions-scoreboard-2017-edition_enpdf)
Consumer Survey 2018
13
2 EXECUTIVE SUMMARYKEY FINDINGS
This report presents the findings of the 2018 edition of the survey on consumersrsquo attitudes towards cross-border trade and consumer-related issues which was carried out by GfK SSR8 for the Consumers Health Agriculture and Food Executive Agency (Chafea) and the Directorate General Justice and Consumers of the European Commission The present survey is part of a series of reports
within the EU Consumer Programme which has been performed since 2006 with the aim to monitor national consumer conditions across the EU For this purpose the study assessed several indicators of European consumersrsquo attitudes for 28037 respondents across the EU27_2019 Member States and in the United Kingdom Iceland and Norway For the studied indicators the present report discusses the overall results comparisons between Member States and differences with previous waves of this survey as well as across selected socio-demographic characteristics
In summary the present study reports on the current state of European consumersrsquo attitudes and
experiences regarding cross-border trade and consumer-related issues It provides insights in the magnitude and features of domestic as well as cross-border shopping and identifies areas for improving the consumer experiences The findings of the 2018 edition of this survey have worsened9 slightly for a wide variety of indicators compared to the 2016 edition Most of these developments
are driven for a large part by changes in the Western region After noticeable improvements in this region in the 2016 wave the indicators have gone back to resemble their previous levels
The first key indicator explored in the survey is online purchase behaviour In total almost three out of four EU27_2019 consumers recently bought goods or services online (720) The 2018 survey shows a small decrease of 14 percentage points in online shopping compared to 2016 which is slight reversal of the positive evaluation observed since 2006 Online shopping is most common in the Northern (785) Western (751) and Eastern (719) regions10 of the EU whereas in the Southern (660) region the indicator is lower
Most European consumers11 shop online within their own country (630) A more limited number
of Europeans purchase goods or services cross-borders inside the EU (283) or outside the EU (184) The results also show that the proportion of consumers making online purchases within their own country has slightly decreased compared to 2016 This decrease is mostly driven by a lower value in the Western region (-116pp12) while the degree of domestic online purchases has increased in all other regions The proportion of consumers making online purchases cross-border inside the EU has increased compared to 2016 (+91pp) these purchases have increased in the
Eastern (+57pp) Southern (+45pp) and Northern (+40pp) region while they have decreased in
the Western region (+144pp) Nevertheless cross-border online purchases in the Western region are still the second highest (322) after the Northern region (343)
The observed decrease in domestic online shopping is not reflected by a change in confidence in making online purchases which has remained stable since 2016 On average 694 of European consumers report that they are confident in domestic online shopping However it is noticeable that there is a decrease in confidence in the Western region (-73pp) which goes together with a decrease
in domestic online shopping in the same region Furthermore despite the increase in cross-border online shopping confidence in this type of shopping online decreases compared to 2016 (-79pp)
For effectively protecting online consumers it is important that individuals know their rights when shopping online This survey assessed the level of knowledge about three types of consumer rights the cooling-off period the legal guarantees and the regulation with regard to unsolicited products The average level of knowledge about these rights is at 455 a 27pp decrease compared
8 GfK SSR refers to the GFK Social amp Strategic Research unit which focuses on Public Affairs research GfK SSR has been taken over by the market research company Ipsos in October 2018 and is now part of the Ipsos
Public Affairs unit 9 ie lower values for positive indicators such as knowledge of consumer rights or higher values for negative
indicators such as exposure to unfair commercial practices 10 The grouping of EU27_2019 countries into North East South and West regions was adjusted to the new
composition of the EU excluding the UK from the West In addition consistent with the analysis for the Market Monitoring Survey 2017 the Baltics (ie Lithuania Latvia and Estonia) were moved from the Eastern to the Northern region (the analysis has been adjusted for all years in the report)
11 Throughout the remainder of the Executive Summary ldquoEuropean consumersrdquo and ldquoEuropeansrdquo will be used to refer to EU27_2019 consumers
12 Percentage points
Consumer Survey 2018
14
to the previous wave of the survey Whereas this decrease is evident in Western and Northern
Europe the knowledge of consumer rights has increased in the South (+42pp) Europeans in general are best informed about the cooling off period (610) and slightly less informed about faulty product guarantees (409) and unsolicited products (345)
The present report also assesses the trust of European consumers in the protection of their rights in the single market To study this the levels of different aspects of trust are measured First in terms of trust in organisations and redress mechanisms the respondents indicated the highest levels of trust in retailers and service providers (713) public authorities (618) and NGOs
(607) Lower levels of trust are observed for the ADR (Alternative Dispute Resolution 422) and courts (316) The average levels of trust have decreased in the present study compared to 2016 (-53 pp) The most notable decreases are observed for trust in NGOs (-88pp) courts (-75pp) and the ADR (-69pp)
In addition the survey also investigated trust in product safety which is considered a key driver of consumer confidence In the EU27_2019 almost 7 out of 10 consumers have expressed trust in
product safety However this trust has decreased compared to 2016 (-73pp) and this happened particularly in the West (-216pp)
Trust in the reliability of environmental claims which is at 542 in the EU27_2019 also decreased between 2016 and 2018 (by 91 pp)
When shopping online some European consumers encounter unfair commercial practices (UCPs) The survey investigated the exposure to several types of practices that fall within the scope of the Unfair Commercial Practices Directive The overall findings show that the exposure to such practices
originating from domestic (227) and cross-border (48) retailers has increased compared to 2016 (with +47pp and +24pp respectively) In addition to unfair commercial practices consumers in Europe also face other illicit commercial practices when shopping online from domestic retailers (106) and cross-border retailers (36)
A composite problems and complaints indicator13 was developed in 2014 to measure the problems encountered by European consumers the actions they took their satisfaction with complaint handling and (if applicable) their reasons for not taking action A higher score on this
indicator represents fewer problems and a higher satisfaction with complaint handling The overall level of this indicator is at a high level in the EU27_2019 (a score of 888) and it is the highest in the
West (906) and North (901) regions
A fair share of European consumers (213) also experiences problems that are specific to online cross-border purchases from other EU countries The most common problems of this type are the refusal of retailers to deliver to the consumersrsquo country (125) and the redirection of consumers
to a website in their home country where prices are different (109) The exposure to both problems has increased since 2016 (respectively +26pp and +41pp)
European consumers are also exposed to problems specific to the delivery of online purchases Late delivery of goods is most common both for purchases from domestic online retailers (393) and cross-border retailers (278) In addition a noticeable proportion of respondents also experiences damaged or wrong deliveries of goods (respectively 198 for domestic and 115 for cross-border online purchases)
In case problems do occur the most likely actions taken by consumers are complaining to the retailer (852) or complaining to the manufacturer (157) In contrast bringing businesses to court (24) or addressing problems via an ADR platform (55) are the least likely actions In
some cases consumers refrain from taking any actions when faced with a problem The main reasons for not taking actions are that consumers believe it would take long to resolve the problem (412) or that the sums involved are too small (357)
13 See footnote 22 and 23 (page 117) in the main report for more information on this indicator and its computation
Consumer Survey 2018
15
Continuing the approach started with the 2016 wave of the survey the 2018 survey also assessed
consumer vulnerability The results show that about a quarter of the European consumers (265) self-identify as vulnerable for one or more aspects linked to their socio-demographic background This is lower than in 2016 (317) In contrast perceived vulnerability based on the experienced complexity of offer terms and conditions (342) has increased considerably since 2016 (213)
Finally multiple multivariate analyses were conducted to provide insights into the role of socio-demographic factors Consumersrsquo financial situation is the factor most closely linked to key consumer conditions indicators Specifically consumers in a difficult financial situation tend to show
lower trust in organisations lower confidence in online shopping lower trust in product safety lower trust in environmental claims and a higher probability to experience UCPs In addition severe financial problems are also negatively linked with trust in organisations trust in redress mechanisms and confidence in online shopping and positively linked with exposure to UCPs
Consumer Survey 2018
16
3 DOMESTIC AND CROSS-BORDER SHOPPING
Steady growth is observable in the e-commerce sector throughout the European Union (EU27_2019)14 over the past few years However consumers can still gain considerable value from making online purchases cross-border The first chapter reports the degree to which consumers engage in online shopping from retailers and service providers located in their country of residence
in the EU or outside the EU It also reports on the degree to which consumers engage in cross-border shopping from offline retailers or service providers
Domestic and cross-border online purchases
Q115-Base respondents who use the internet for private reasons (N=22839)
The graph above shows that the average proportion of consumers who shop online in the European
Union is 720 with 630 having purchased goods or services online domestically 283 cross-border from EU-based online retailers or service providers and 184 cross-border from online
retailers or service providers located outside the EU Only 21 of consumers are not aware of the location of the retailers or service providers they purchase from online
14 The EU27_2019 average corresponds to the EU28 excluding the UK (see also chapter 11) The terms lsquoEuropean Unionrsquo or lsquoEUrsquo always refer to the EU27_2019
15 Q1 In the past 12 months have you purchased any goods or services via the internet -Yes from a retailer or service provider located in (our country) -Yes from a retailer or service provider located in another EU country -Yes from a retailer or service provider located outside the EU ndashNo ndashYes you purchased online but do not know where the retailer or service provider is located -DKNA
Consumer Survey 2018
17
Q1-Base respondents who use the internet for private reasons (N=25240)16
16 Statistically significant differences are indicated by asterisks () Statistical significance is calculated at the 95 confidence level meaning that the null hypothesis of no difference has been rejected at 5 probability level For results of the current wave asterisks represent statistically significant differences between a subgroup and the EU27_2019 average For wave comparisons asterisks represent the statistically significant differences between two waves
Region
CountryTotal Yes
Yes from a
retailer or
service
provider
located in
(our
country)
Yes from a
retailer or
service
provider
located in
another EU
country
Yes from a
retailer or
service
provider
located
outside the
EU
Yes but do
not know
where the
retailer or
service is
located
No Donrsquot know
EU27_2019 72 630 283 184 21 280 02
EU28 742 659 288 200 23 258 02
North 785 694 343 245 16 215 03
South 660 536 276 177 32 340 02
East 719 673 191 147 07 281 01
West 751 665 322 198 20 249 01
BE 697 487 481 184 23 303 02
BG 639 579 195 118 06 361 01
CZ 802 781 222 201 01 198 00
DK 820 725 365 239 17 180 00
DE 769 719 287 187 15 231 01
EE 732 595 331 300 19 268 01
IE 801 636 598 317 09 199 05
EL 620 548 213 144 08 380 00
ES 657 536 285 193 36 343 00
FR 713 609 302 211 31 287 00
HR 598 411 305 306 13 402 00
IT 702 575 285 175 36 298 04
CY 464 169 332 189 11 536 07
LV 636 481 306 317 11 364 04
LT 687 580 277 256 13 313 00
LU 726 333 629 173 10 274 00
HU 738 676 231 199 09 262 00
MT 654 162 574 357 13 346 00
NL 805 757 240 212 14 195 01
AT 791 619 608 131 10 209 04
PL 774 740 173 123 07 226 02
PT 448 286 211 138 15 552 00
RO 594 571 100 74 06 406 01
SI 637 506 309 228 05 363 00
SK 783 712 348 239 10 217 01
FI 759 679 382 234 27 241 05
SE 839 767 337 232 12 161 03
IS 797 471 541 435 18 203 00
NO 818 706 402 319 21 182 02
UK 885 851 321 306 33 115 03
In the past 12 months have you purchased any goods or services via the internet
Consumer Survey 2018
18
Overall 630 of EU27_2019 respondents who use the internet for private reasons report shopping
online domestically Consumers residing in the North (694) East (673) and West regions (665) are more likely to engage in online shopping domestically compared to the EU27_2019 average while those in the South are less likely (536) Among the countries of the European Union the highest levels of domestic shopping online are found in the Czech Republic (781) Sweden (767) and the Netherlands (757) Among all the studied countries the highest level is found in the UK (851) The lowest levels are found in Malta (162) Cyprus (169) and Portugal (286)
The proportion of respondents who shop online cross-border from retailers or service providers in another EU country is 283 in the EU27_2019 The incidence of shopping online from retailers in another EU country in the South is in line with the EU27_2019 average17 while it is higher in the North (343) and the West (322) and lower in the East (191) The highest levels of online cross-border shopping from retailers or service providers in another EU country are found in Luxembourg (629) Austria (608) and Ireland (598) The lowest levels are found in
Romania (100) Poland (173) and Bulgaria (195)
In the European Union 184 of consumers shop online cross-border from retailers or service
providers in countries outside the EU For consumers in the South this incidence is in line with the EU27_2019 average while it is higher in the North (245) and West (198) and lower in the East (147) Among the EU countries the highest levels of this indicator are found in Malta (357) Latvia Ireland (both 317) and Croatia (306) Furthermore this level is also high in Iceland (435) and Norway (319) The lowest levels are found in Romania (74) Bulgaria
(118) and Poland (123)
Only 21 of EU27_2019 consumers do not know where the retailer or service provider they shopped from online is located For consumers in the West the proportion not being aware of the retailersrsquo location is in line with the EU27_2019 average while it is higher in the South (32) and lower in the North (16) and East (07) Among the EU countries the highest levels of this indicator are found in Italy Spain (both 36) Lithuania and Croatia (both 13) Additionally this level is also high in the UK (33) The lowest levels are found in the Czech Republic (01) Slovenia
(05) Bulgaria and Romania (both 06)
17 As mentioned in chapter 124 differences that are not statistically significant are considered equal to 0 regardless of their numerical level
Consumer Survey 2018
19
The overall proportion of consumers who purchased goods or services online regardless of the retailer or service providerrsquos location is 720 in the EU27_2019 In the East this indicator is in line with the EU27_2019 average while it is higher in the North (785) and the West (751) and lower in the South (660) Among the EU countries the highest levels of this indicator are found in Sweden (839) Denmark (820) and the Netherlands (805) Furthermore the levels
are also high in Norway (818) and the UK (885) The lowest levels are found in Portugal (448) Cyprus (464) and Romania (594)
Consumer Survey 2018
20
Q1-Base EU27_2019 respondents from the EU who use the internet for private reasons (N=2248718)
18 The EU27_2019 sample size for this table and all following socio-demographic tables is affected by missing values for some of the socio-demographic factors (internet use languages education amp urbanisation) Respondents with missing values for any of these socio-demographic factors are not included in the regression analysis used to estimate the results
Male 711 A 642 A 314 216 19 A 271 A 03 A
Female 698 A 625 A 254 152 23 A 282 A 01 A
18-34 787 688 A 355 264 20 AB 195 02 A
35-54 740 668 A 302 181 17 A 245 00 A
55-64 653 591 228 133 30 B 318 03 A
65+ 543 499 158 80 21 AB 438 02 A
Low 580 510 170 110 12 A 404 07 A
Medium 684 618 266 179 21 AB 299 01 A
High 757 674 317 200 23 B 221 02 A
Very difficult 652 A 574 A 209 187 A 14 A 340 A 02 A
Fairly difficult 688 A 609 A 284 A 175 A 16 A 299 A 00 A
Fairly easy 714 644 287 A 187 A 22 A 266 02 A
Very easy 745 682 306 A 192 A 31 A 222 02 A
Rural area 701 A 636 A 283 A 160 18 A 284 A 01 A
Small town 711 A 636 A 279 A 198 A 22 A 268 A 02 A
Large town 699 A 626 A 292 A 189 A 22 A 282 A 01 A
Self-employed 737 C 668 C 327 C 208 B 16 A 251 AB 02 ABC
Manager 758 C 669 BC 327 BC 212 B 25 AB 222 A 00 AB
Other white collar 729 BC 661 BC 287 B 173 A 20 AB 250 A 04 C
Blue collar 667 A 595 A 258 A 189 AB 27 AB 309 C 00 AB
Student 704 ABC 595 A 277 ABC 178 AB 17 AB 280 ABC 02 ABC
Unemployed 650 A 589 A 230 A 181 AB 23 AB 328 C 00 A
Seeking a job 656 A 587 A 220 A 191 AB 49 B 305 BC
Retired 692 AB 620 AB 275 AB 170 AB 15 A 295 C 01 B
Financial Situation
In the past 12 months have you
purchased any goods or services via the
Internet
Total Yes
Yes from a
retailer or service
provider located in
(our country)
Yes from a
retailer or service
provider located
in another EU
country
No Donrsquot know
Gender
Age groups
Education
Yes from a
retailer or service
provider located
outside the EU
Yes but do not
know where the
retailer or service
is located
Urbanisation
Employment status
Consumer Survey 2018
21
Q1-Base EU27_2019 respondents from the EU who use the internet for private reasons (N=22487)
Only native 670 598 A 221 145 29 B 304 B 02 A
Two 723 A 652 B 285 189 A 17 A 262 A 02 A
Three 731 A 656 B 336 204 A 20 AB 253 A 01 A
Four or more 715 A 632 AB 395 257 13 A 275 AB 01 A
Not official
language in home
country
634 566 251 A 149 16 A 355 02 A
Official language
in home country709 637 287 A 187 21 A 272 02 A
Low 640 A 567 A 238 A 138 08 346 07 A
Medium 673 A 593 A 258 A 175 20 A 309 01 A
High 732 664 301 194 23 A 247 01 A
Daily 746 674 302 197 22 B 235 02 A
Weekly 555 463 170 93 B 18 B 423 01 A
Monthly 349 A 285 A 64 A 79 AB 01 A 638 A
Hardly ever 289 A 209 A 73 A 11 A 03 A 702 A 01 A
Never
Very vulnerable 653 585 242 161 A 22 A 326 01 A
Somewhat
vulnerable697 629 A 283 A 178 AB 23 A 283 01 AB
Not vulnerable 722 646 A 293 A 192 B 20 A 261 02 B
Very vulnerable 704 A 620 A 266 AB 156 A 25 A 277 A 02 A
Somewhat
vulnerable716 A 647 A 258 A 165 A 20 A 268 A 02 A
Not vulnerable 701 A 632 A 295 B 196 21 A 279 A 02 A
In the past 12 months have you
purchased any goods or services via the
Internet
Total Yes
Yes from a
retailer or service
provider located in
(our country)
Yes but do not
know where the
retailer or service
is located
No Donrsquot know
Languages
Mother Tongue
Yes from a
retailer or service
provider located
in another EU
country
Numerical skills
Internet use
Consumer vulnerability
(sociodemographic
factors)
Consumer vulnerability
(complexity)
Yes from a
retailer or service
provider located
outside the EU
Consumer Survey 2018
22
With regard to socio-demographic variables and other characteristics the results of the multivariate
analysis19 show that consumersrsquo internet use is the factor most closely associated20 with internet purchases in their own country followed by education age mother tongue and numerical skills
Regarding consumersrsquo frequency of internet use21 daily internet users are more likely to make domestic online purchases compared to those who use the internet weekly In addition weekly users also conduct more such purchases than monthly internet users and those who hardly ever use the internet
Highly educated consumers are more likely to purchase products and services online domestically than consumers with a medium level of education who in turn show higher values than consumers with a lower level of education
Regarding age domestic purchases are more common amongst consumers aged 18-54 years than amongst older consumers aged 55+
Consumers whose mother tongue is one of the official languages of the country or region they live in are also more likely to make such purchases than those whose mother tongue is not an official
language
Finally those with a high numerical skill level are more likely to make such purchases than those with a medium or low numerical skill level
Purchases of goods and services in another EU country via the internet is associated most closely with consumersrsquo age The characteristics showing the next closest links are education the number of languages spoken internet use and gender
Younger consumers (18-34 years) are more likely to engage in online cross-border shopping than all
other age groups In addition consumers aged 35-54 years are also more likely to make such purchases than those who are aged 55-64 years who in turn are also more likely to make such purchases than those aged 65+ years
Regarding consumersrsquo level of education highly educated consumers are most likely to make such purchases Furthermore those with a medium level of education are in turn more likely to make such purchases than those with a low level of education
Consumers that speak at least four languages are more likely to make such purchases than those
who speak fewer languages Those who speak three languages are also more likely to conduct cross-border online purchases than those who speak two languages who in turn are more likely to make such purchases than those who only speak their native language
Daily internet users are by far the most likely to purchase products or services online from retailers in another EU country In addition weekly internet users also show higher values than consumers who use the internet monthly and those who hardly ever use the internet
Finally males are more likely to make such purchases than females
When it comes to online purchases of goods and services from a retailer or service provider outside the EU consumersrsquo age is associated most closely with this indicator followed by gender education the number of languages spoken and frequency of internet use
As with cross-border purchases younger consumers (18-34 years) are most likely engage in online shopping in a country outside the EU In addition those who are aged 35-54 years are more likely
19 The values shown in the tables of the socio-demographic analyses are based on model estimates (see also chapter 124)
20 The sociodemographic characteristics having the closest link with the dependent variable are selected considering the average magnitude of the difference across the different levels of all the sociodemographic characters (eg the differences in the likelihood to purchase online- in absolute terms- across the different levels of internet use) and by looking at the overall coherence of this variability
21 Since Question 1 measured consumersrsquo online purchases the internet usage level lsquoNeverrsquo is excluded from the regression models
Consumer Survey 2018
23
to make such purchases than those who are aged 55-64 years who in turn are also more likely to
make such purchases than those aged 65+ years
As far as gender is concerned males are more likely to purchase goods or services online from traders outside of the EU than females
Highly educated consumers are more likely to make such purchases than the remainder of the population In addition those with a medium level of education are also more likely to make such purchases than those with a low level of education
Consumers that speak four languages or more are the most likely to make such purchases
Furthermore those who speak two or three languages also make more online purchases from retailers outside of the EU than consumers who only speak their native language
Finally daily internet users are noticeably more likely to conduct online purchases from countries outside the EU than less frequent internet users Weekly internet users also differ from those who use the internet hardly ever
When it comes to consumers making online purchases of goods and services from a retailer
or service provider whom they do not know the location of consumersrsquo numerical skills are most closely associated with this indicator followed by the frequency of internet use education employment status and age
Consumers with high or medium numerical skills22 are more likely to make online purchases from a retailer or service provider whom they do not know the location of than those with low numerical skills
Moreover daily or weekly internet users are also more likely to make online purchases from such
retailers than those who use the internet monthly or hardly ever
Regarding consumersrsquo level of education those who are highly educated are more likely to make such purchases than those with a low level of education
Job-seekers are the most likely to purchase products and services online without knowing the location of the retailers and more so than those who are retired or self-employed The latter two are the least
likely to conduct such purchases
Finally consumers that are 55-64 years old are more likely to purchase goods and services from
retailers whom they do not know the location of than consumers aged 35-54 years old
Offline cross-border purchases
When it comes to shopping cross-border from offline retailers or service providers the majority of respondents (852) has not performed such purchases in the past 12 months in the European Union Yet 145 of consumers in the EU27_2019 has purchased products or services offline in
another EU country during this timeframe
22 Respondentsrsquo numerical skills were measured with two short mathematical scenariosrsquo Suppose that the exact same product is on sale in shop A and shop B I will read you two statements about offers from shop A and shop B In each case please tell me which shop is cheaper 1 Shop A offers a TV set for 440 euro Shop B offers the exact same type of TV set at 500 euro but with a discount of 10 2 Shop A offers a TV set for 890 euro Shop B offers the exact same type of TV set at 940 euro but with a reduction of 60 euro 2 correct answers correspond to a high level of numerical skills 1 correct answer to a medium level and 0 correct answers to a low level
Consumer Survey 2018
24
Q2 ndash Base all respondents (N=28037)
In the East this indicator is in line with the EU27_2019 average while it is higher in the West (180) and the North (178) and lower in the South (88) Among the EU countries the highest levels of this indicator are found in Luxembourg (321) Slovakia (285) and Estonia (274) Among all studied countries high levels are also recorded for Iceland (399) and Norway (280)
The lowest levels are found in Spain (32) Greece (57) and Portugal (74)
Region
CountryYes No Dont know
EU27_2019 145 852 03
EU28 147 849 04
North 178 818 04
South 88 910 02
East 147 850 03
West 180 816 04
BE 260 736 04
BG 137 859 04
CZ 160 835 05
DK 218 780 03
DE 176 822 03
EE 274 722 04
IE 229 762 09
EL 57 941 01
ES 32 966 01
FR 160 834 06
HR 214 784 02
IT 137 860 03
CY 77 918 05
LV 136 862 01
LT 230 764 06
LU 321 676 04
HU 166 834 00
MT 220 777 04
NL 169 829 02
AT 245 751 03
PL 131 863 05
PT 74 926 00
RO 105 895 00
SI 196 801 03
SK 285 713 02
FI 114 886 01
SE 171 823 06
IS 399 596 05
NO 280 713 08
UK 158 830 12
In the past 12 months have you purchased any
goods or services through channels other than
the Internet from a retailer or service provider
located in another EU country
Consumer Survey 2018
25
Q2 ndash Base all EU27_2019 respondents (N=2492823)
23 See footnote 18
Male 149 A 847 A 04
Female 143 A 855 A 02
18-34 168 B 826 A 06 B
35-54 155 B 842 A 03 B
55-64 114 A 884 B 02 AB
65+ 118 A 882 B 01 A
Low 100 898 01 A
Medium 139 858 03 A
High 159 838 04 A
Very difficult 160 AB 839 AB 01
Fairly difficult 136 A 860 B 04 A
Fairly easy 141 A 857 B 03 A
Very easy 168 B 828 A 04 B
Rural area 142 A 855 A 02 A
Small town 143 A 853 A 04 A
Large town 153 A 845 A 03 A
Self-employed 160 DE 836 AB 05 A
Manager 182 E 814 A 04 A
Other white collar 149 CD 848 BC 03 A
Blue collar 132 BC 867 CD 02 A
Student 162 CDE 838 ABC 02 A
Unemployed 99 A 894 D 10 A
Seeking a job 108 AB 887 D 05 A
Retired 134 ABCD 862 BCD 06 A
Age groups
In the past 12 months have you
purchased any goods or services through
channels other than the Internet from a
retailer or service provider located in
another EU country
Yes No Dont know
Gender
Education
Financial Situation
Urbanisation
Employment status
Consumer Survey 2018
26
Q2 ndash Base all EU27_2019 respondents (N=24928)
Regarding socio-demographic variables and other characteristics consumersrsquo language skills is the factor most closely associated with cross-border shopping in another EU country through channels other than the internet The characteristics showing the next closest links are education frequency of internet use age and employment status
Consumers speak at least four languages are more likely to make such purchases than those who speak three languages who in turn are more likely to make such purchases than those who speak two languages The latter group is also more likely to make such purchases than those who speak only their native language
Regarding consumersrsquo level of education highly educated consumers are more likely to purchase products and services offline in another EU country than those with a medium or low level of education Those with a medium level of education are also more likely to purchase products or
services offline in another EU country than consumers with a low level of education
Daily internet users are most likely to purchase products and services offline in another EU country compared to those who use the internet less frequently In contrast people that never use the internet show lower values for such purchases than daily or weekly internet users
As far as age is concerned consumers aged 18-54 years are more likely to engage cross-border shopping through channels other than the internet than older consumers aged 55 years or older
Only native 101 897 02 AB
Two 138 858 04 B
Three 201 796 04 AB
Four or more 240 759 01 A
Not official
language in home
country
138 A 851 A 12 A
Official language
in home country147 A 851 A 03 A
Low 119 A 878 A 03 A
Medium 134 A 863 A 03 A
High 154 842 04 A
Daily 156 840 04
Weekly 124 B 876 A 00 A
Monthly 92 AB 907 AB
Hardly ever 84 AB 916 AB
Never 54 A 945 B 01 A
Very vulnerable 141 A 857 A 03 A
Somewhat
vulnerable142 A 855 A 04 A
Not vulnerable 149 A 848 A 03 A
Very vulnerable 152 A 844 A 05 A
Somewhat
vulnerable150 A 847 A 03 A
Not vulnerable 144 A 853 A 03 A
In the past 12 months have you
purchased any goods or services through
channels other than the Internet from a
retailer or service provider located in
another EU country
Consumer vulnerability
(socio-demographic
factors)
Consumer vulnerability
(complexity)
No Dont know
Languages
Mother Tongue
Numerical skills
Internet use
Yes
Consumer Survey 2018
27
Finally regarding employment status managers are most likely to make offline cross-border
purchases and more so than any other consumer group except for self-employed consumers and students In contrast those who are unemployed are the least likely to engage in such purchases and are less likely to do so than managers students people who are self-employed other white collars and blue-collar workers
Consumer Survey 2018
28
4 THE EVOLUTION OF ONLINE PURCHASE BEHAVIOUR2425
Q1-Base respondents who use the internet for private reasons (N=25240)
Compared to 2016 the incidence of persons buying online decreased in the EU27_2019 (-14pp26) and the West (-115pp) while it increased in the East (+77pp) South (+73pp) and North (+49pp) As far as the country results are concerned compared to the survey in 2016 the incidence of
24 Croatia is included in the computation of the EU27_2019EU28 total starting from 2012 and Bulgaria and Romania from 2008 (as these 3 countries were not covered in all the surveys editions)
25 Please refer to section 123 of this report for the comparability of results across the surveys waves 26 Percentage points
2018 ( = sig diff
EU27)
2018-
2016
2016-
2014
2014-
2012
2012-
2011
2011-
2010
2010-
2009
2009-
2008
2008-
2006
EU27_2019 720 -14 +112 +25 +67 +186 -03 +45 +62
EU28 742 -16 +107 +29 +56 +196 -05 +41 +67
North 785 +49 +35 +48 +39 +163 +05 -45 +110
South 660 +73 +85 +59 +94 +169 -04 +25 +41
East 719 +77 +64 +04 +86 +192 -09 +98 +27
West 751 -115 +157 +11 +48 +189 -01 +36 +103
BE 697 +15 +105 +65 +93 +152 -17 -16 +38
BG 639 +32 +142 +44 +133 +191 +06 +51 -
CZ 802 +39 +48 -05 +72 +215 +03 +64 +116
DK 820 +08 +05 +74 +46 +199 -45 -76 +101
DE 769 -124 +137 +06 +48 +199 -30 +126 +87
EE 732 +112 +33 +92 +93 +133 +07 +09 +49
IE 801 -56 +115 +27 +89 +126 +18 +180 +57
EL 620 +110 +38 +39 +107 +132 -04 +85 +76
ES 657 +51 +112 +06 +121 +133 -25 +71 +89
FR 713 -165 +217 +04 +38 +200 +21 -48 +153
HR 598 +60 +148 +54 - - - - -
IT 702 +82 +88 +103 +83 +206 +04 -20 -04
CY 464 +23 -130 +99 +41 +105 +48 +110 +115
LV 636 +87 +41 +15 +83 +192 -60 +24 +122
LT 687 +113 +41 +29 +170 +86 +41 +91 +33
LU 726 -127 +227 +80 -36 +137 -30 +59 +105
HU 738 +244 -25 +08 +120 +131 +10 +99 +19
MT 654 +40 -47 +35 +48 +79 +58 +127 +107
NL 805 -07 +51 +14 +31 +173 +87 -187 +143
AT 791 -76 +181 +15 +91 +139 -31 +157 -27
PL 774 +40 +74 -21 +77 +226 -54 +151 +80
PT 448 +82 +05 +56 +31 +142 +34 +31 +45
RO 594 +122 +65 +24 +129 +113 +40 +31 -
SI 637 +63 +62 +15 +94 +112 +00 +83 +71
SK 783 +79 +39 +15 +105 +199 +37 +128 +112
FI 759 +49 +65 -05 +15 +181 -01 -23 +86
SE 839 +43 +35 +71 -06 +106 +40 -94 +163
IS 797 +89 +34 +104 +27 - - - -
NO 818 -02 +27 +110 -25 - - - -
UK 885 -22 +63 +49 -01 +237 -15 +28 +105
In the past 12 months have you purchased any goods or services via the Internet
Region
Country
Total Yes
Consumer Survey 2018
29
consumers shopping online increased most steeply in Hungary (+244pp) and decreased most
sharply in France (-165pp) When looking at statistically significant changes in 2018 (vs 2016) and in 2016 (vs 2014) no positive reversal is found The largest negative reversal27 is found in France where between 2016 and 2018 this indicator decreased by 165pp whereas between 2014 and 2016 it increased by 217pp
Q1-Base respondents who use the internet for private reasons (N=25240)
27 Reversals are reported when both changes are statistically significant and when the direction of the change has reversed ie from an increase to a decrease or from a decrease to an increase Only the strongest positive and the strongest negative reversal are reported which are determined by the highest absolute sum of both changes
2018 ( = sig diff
EU27)
2018-
2016
2016-
2014
2014-
2012
2012-
2011
2011-
2010
2010-
2009
2009-
2008
2008-
2006
EU27_2019 630 -18 +103 +26 +46 +170 -02 +37 +66
EU28 659 -12 +92 +31 +36 +183 -02 +34 +71
North 694 +35 +47 +57 +03 +186 +07 -86 +107
South 536 +70 +62 +51 +74 +130 -06 +42 +32
East 673 +71 +69 +09 +68 +183 -06 +94 +30
West 665 -116 +148 +14 +27 +180 +01 +15 +114
BE 487 -29 +89 +67 +48 +116 +11 -50 +56
BG 579 +43 +154 +83 +92 +146 +07 +48 -
CZ 781 +42 +62 -26 +69 +242 +11 +32 +125
DK 725 -11 +25 +80 +24 +295 -27 -213 +105
DE 719 -96 +116 -01 +42 +185 -28 +109 +97
EE 595 +117 +35 +86 +47 +105 -12 -04 +53
IE 636 -93 +230 +65 +116 +62 +46 +18 +07
EL 548 +117 +53 +112 +29 +117 -05 +63 +41
ES 536 +76 +56 +14 +95 +100 -25 +98 +52
FR 609 -179 +186 +32 -16 +215 +13 -57 +157
HR 411 +75 +63 +62 - - - - -
IT 575 +64 +81 +65 +77 +164 +01 +02 +14
CY 169 -52 +52 +114 -22 -29 +52 +14 +41
LV 481 +63 +33 +37 +09 +173 -66 -07 +124
LT 580 +85 +53 +40 +125 +78 +52 +54 +25
LU 333 -339 +467 +47 +15 +18 -06 +17 +48
HU 676 +210 -07 +24 +99 +111 +29 +85 +30
MT 162 -32 +56 -08 +71 -04 +07 +34 -11
NL 757 -15 +53 -02 +40 +190 +90 -192 +165
AT 619 -164 +357 -34 +96 +52 +14 +60 +36
PL 740 +30 +87 -23 +69 +216 -57 +152 +90
PT 286 +35 -15 +74 +16 +79 +33 +14 +38
RO 571 +115 +66 +39 +109 +111 +40 +43 -
SI 506 +66 +57 +02 +63 +91 +11 +45 +77
SK 712 +96 +24 +18 +88 +181 +46 +107 +95
FI 679 +69 +66 +15 -29 +183 +01 -40 +73
SE 767 +17 +51 +75 -35 +127 +34 -103 +161
IS 471 +54 -13 +140 -28 - - - -
NO 706 -19 +44 +177 -109 - - - -
UK 851 +28 +06 +54 -10 +241 -05 +24 +109
In the past 12 months have you purchased any goods or services via the Internet
Region
Country
Yes from a retailer or service provider located in (our country)
Consumer Survey 2018
30
In terms of online shopping domestically the proportion of consumers having done so in the past 12
months decreased in the EU27_2019 (-18pp) and the Western region (-116pp) while the opposite pattern can be observed for the Eastern (+71pp) Southern (+70pp) and Northern regions (+35pp) Compared to the survey in 2016 the proportion of consumers who shop online domestically increased most steeply in Hungary (+210pp) The greatest decrease compared to 2016 is observed in Luxembourg (-339pp) In Luxembourg also the largest negative reversal is observed where the decrease between 2016 and 2018 was preceded by an increase of 467pp between 2014 and 2016 There are no statistically significant positive reversals
Q1-Base respondents who use the internet for private reasons (N=25240)
2018 ( = sig diff
EU27)
2018-
2016
2016-
2014
2014-
2012
2012-
2011
2011-
2010
2010-
2009
2009-
2008
2008-
2006
EU27_2019 283 +91 +03 +23 +47 +47 -05 +10 +13
EU28 288 +101 -07 +18 +50 +52 -03 +03 +17
North 343 +40 +32 +40 +49 +47 +04 -06 +26
South 276 +45 +53 +43 +43 +51 -03 +02 +19
East 191 +57 +29 +15 +21 +33 -08 +20 +02
West 322 +144 -46 +11 +65 +49 -06 +10 +18
BE 481 +37 +118 +23 +115 +79 -12 -04 +06
BG 195 +10 +29 +04 +58 +53 +05 +15 -
CZ 222 +68 +33 +39 +09 +33 -01 +13 +04
DK 365 +09 +26 -10 +75 +41 -28 +41 +42
DE 287 +143 -54 +37 +33 +57 -15 +16 +19
EE 331 +33 +31 +57 +80 +43 +24 -10 +27
IE 598 +357 -250 -25 +111 +62 +45 +139 +35
EL 213 +43 +13 -50 +97 +22 -12 +39 +38
ES 285 +69 +66 +06 +43 +44 -15 -07 +41
FR 302 +152 -44 -26 +112 +16 -06 +05 +20
HR 305 +36 +129 +73 - - - - -
IT 285 +27 +59 +87 +40 +56 +05 -03 -01
CY 332 -15 -95 +87 +53 +94 +07 +81 +91
LV 306 +53 +29 +65 +49 +58 -09 +27 +25
LT 277 +60 +60 +21 +54 +14 +20 +23 +17
LU 629 +278 -209 +111 -57 +139 -42 +41 +98
HU 231 +104 +25 +15 +51 +05 +03 +25 -04
MT 574 +67 -82 +48 +69 +44 +78 +90 +114
NL 240 +05 +61 -27 +29 +55 +44 -81 +11
AT 608 +369 -289 +104 +22 +99 -26 +139 +09
PL 173 +53 +10 +38 -03 +38 -16 +17 +09
PT 211 +58 +00 +33 +05 +73 +01 +27 +04
RO 100 +46 +13 -22 +29 +24 -06 +14 -
SI 309 +32 +98 +16 +57 +29 -11 +32 +17
SK 348 +105 +110 -85 +85 +43 -17 +77 +13
FI 382 +44 +39 -01 +48 +69 +11 +24 +14
SE 337 +50 +27 +94 +27 +32 +13 -59 +27
IS 541 +223 +35 +59 +54 - - - -
NO 402 +15 +26 +98 -11 - - - -
UK 321 +162 -73 -13 +78 +82 +09 -44 +50
In the past 12 months have you purchased any goods or services via the Internet
Region
Country
Yes from a retailer or service provider located in another EU country
Consumer Survey 2018
31
With regard to the share of consumers participating in cross-border online shopping in another EU
country it increased in the EU27_2019 (+91pp) and all the four regions (West +144pp East +57pp South +45pp and North +40pp) Compared to the survey in 2016 the share of consumers participating in cross-border online shopping in another EU country increased most steeply in Austria (+369pp) In Austria also the largest positive reversal is observed where the strong increase between 2016 and 2018 was preceded by a decrease by 289pp between 2014 and 2016 There are no statistically significant decreases or negative reversals
Q1-Base respondents who use the internet for private reasons (N=25240)
2018 ( = sig diff
EU27)
2018-
2016
2016-
2014
2014-
2012
2012-
2011
2011-
2010
2010-
2009
2009-
2008
2008-
2006
EU27_2019 184 +92 +04 +10 +22 +29 -03 +03 +07
EU28 200 +116 -25 +13 +24 +36 -03 +01 +08
North 245 +48 +60 +21 +33 +20 +12 -20 +27
South 177 +47 +36 +12 +31 +37 -05 +03 +09
East 147 +62 +28 +14 +09 +16 +00 +09 +01
West 198 +139 -36 +04 +23 +30 -06 +02 +09
BE 184 +67 +34 -02 +24 +36 +00 -13 +04
BG 118 +13 +37 +21 +02 +43 -05 +11 -
CZ 201 +65 +36 +40 +13 +26 +04 +07 +08
DK 239 +35 +63 +06 +45 -11 +06 -11 +31
DE 187 +138 -32 +16 +07 +29 -11 +21 +05
EE 300 +46 +115 +54 +35 +36 +18 -15 +13
IE 317 +278 -156 -18 +48 +09 +20 +47 +31
EL 144 +60 -39 +06 +39 +32 -18 +31 +20
ES 193 +23 +64 +07 +35 +46 -03 -01 +19
FR 211 +182 -72 -09 +46 +31 -04 -15 +17
HR 306 +26 +143 +27 - - - - -
IT 175 +65 +29 +18 +27 +30 -04 -01 +00
CY 189 +44 -30 -09 +10 +51 +06 +74 +10
LV 317 +106 +53 +49 +41 +48 +12 -04 +21
LT 256 +88 +73 +16 +19 +18 +12 +13 +07
LU 173 +127 -60 +22 +14 +19 +02 -06 +23
HU 199 +117 +15 +00 +13 +14 +05 +10 -09
MT 357 +15 -40 +76 +46 +81 +05 +57 +64
NL 212 +21 +80 +11 +10 +38 -00 -40 +23
AT 131 +93 -46 +10 +14 +17 -00 +04 -40
PL 123 +67 +05 +29 -05 +09 -03 +08 +03
PT 138 +42 +28 +07 +24 +38 -06 +07 +09
RO 74 +28 +29 -09 +06 +14 +04 +06 -
SI 228 +50 +84 +02 +48 +10 +03 +00 +16
SK 239 +119 +74 -42 +44 +24 -10 +19 +06
FI 234 +49 +32 -01 +49 +18 +45 -08 +15
SE 232 +33 +63 +36 +20 +26 -05 -45 +43
IS 435 +53 +32 +108 +07 - - - -
NO 319 +46 +45 +28 +50 - - - -
UK 306 +281 -220 +28 +44 +73 +04 -06 +19
In the past 12 months have you purchased any goods or services via the Internet
Region
Country
Yes from a retailer or service provider located outside the EU
Consumer Survey 2018
32
When considering cross-border online shopping in a country outside the EU the extent of this
behaviour increased in the EU27_2019 (+92pp) and all the four regions in the West (+139pp) East (+62pp) North (+48pp) and South (+47pp) Compared to the survey in 2016 the proportion of consumers who shop cross-border online in a country outside the EU increased most steeply in Ireland (+278pp) This increase between 2016 and 2018 follows a strong decrease of 156pp between 2014 and 2016 (ie positive reversal) There are no statistically significant decreases compared to 2016 and no statistically significant negative reversals
Q1-Base respondents who use the internet for private reasons (N=25240)
The share of consumers that shopped online from retailers or service providers without knowing where they are located decreased in the EU27_2019 (-03pp) and the Western region (-09pp) whereas it remained stable for the Northern Southern and Eastern regions Compared to 2016 this percentage increased most steeply in Portugal and Estonia (both +12pp) and decreased most
prominently in Luxembourg (-31pp) When looking at statistically significant changes in 2018 (vs
2018( = sig diff
EU27)
2018-2016 2016-2014 2014-2006
EU27_2019 21 -03 +04 +09
EU28 23 -03 +04 +11
North 16 -02 -00 +12
South 32 +01 +18 +06
East 07 +01 -07 +03
West 20 -09 +01 +15
BE 23 +09 -13 +21
BG 06 -03 -05 -
CZ 01 -04 -02 -00
DK 17 +04 -09 +17
DE 15 -17 -03 +27
EE 19 +12 -05 +07
IE 09 -25 +24 +03
EL 08 -03 +11 -01
ES 36 -05 +26 +13
FR 31 -01 +06 +07
HR 13 +05 -05 -
IT 36 +05 +17 +00
CY 11 +04 -09 +13
LV 11 -13 +07 +09
LT 13 -00 +05 +04
LU 10 -31 +19 +18
HU 09 +07 -01 +01
MT 13 +02 +05 -07
NL 14 +01 -04 +00
AT 10 -16 +06 -16
PL 07 -02 -13 +08
PT 15 +12 -10 +12
RO 06 +07 -01 -
SI 05 -02 +03 -05
SK 10 +03 -07 +06
FI 27 +04 +02 +09
SE 12 -08 +02 +13
IS 18 +12 -02 -
NO 21 -04 +04 -
UK 33 -02 +04 +23
In the past 12 months have you purchased any goods or services
via the Internet
Region
Country
Yes but do not know where the retailer or service
provider is located
Consumer Survey 2018
33
2016) and in 2016 (vs 2014) the largest positive reversal is found in Portugal where between 2016
and 2018 this indicator increased by 12pp whereas between 2014 and 2016 it decreased by 10pp The largest negative reversal is found in Ireland where between 2016 and 2018 this indicator decreased by 25pp whereas between 2014 and 2016 it increased by 24pp
Q2 ndash Base all respondents (N=28037)
2018
( = sig
diff EU27)
2018-
2016
2016-
2014
2018
( = sig
diff EU27)
2018-
2016
2016-
2014
2018
( = sig
diff EU27)
2018-
2016
2016-
2014
EU27_2019 145 -02 +34 852 +03 -34 03 -01 -00
EU28 147 -10 +45 849 +10 -45 04 +00 -00
North 178 +23 +21 818 -23 -20 04 -00 -01
South 88 +11 -11 910 -11 +11 02 -01 -01
East 147 +35 -01 850 -34 +04 03 -01 -03
West 180 -35 +87 816 +36 -88 04 -01 +01
BE 260 -03 +104 736 +04 -107 04 -01 +03
BG 137 -06 +36 859 +04 -35 04 +02 -00
CZ 160 +06 +02 835 -09 +01 05 +03 -03
DK 218 +43 +35 780 -42 -28 03 -01 -07
DE 176 -32 +104 822 +35 -104 03 -03 -00
EE 274 -44 +119 722 +41 -116 04 +03 -03
IE 229 -20 +76 762 +18 -78 09 +01 +03
EL 57 -29 +36 941 +32 -40 01 -03 +04
ES 32 +10 -20 966 -07 +16 01 -03 +04
FR 160 -54 +94 834 +52 -97 06 +02 +03
HR 214 +06 +69 784 -04 -70 02 -02 +02
IT 137 +21 -14 860 -22 +18 03 +01 -04
CY 77 -13 -78 918 +11 +93 05 +02 -15
LV 136 +00 +30 862 +01 -32 01 -01 +01
LT 230 +62 +23 764 -69 -19 06 +07 -04
LU 321 +11 -67 676 -09 +64 04 -02 +02
HU 166 +94 +14 834 -91 -14 00 -03 +00
MT 220 +03 +79 777 +00 -86 04 -03 +07
NL 169 -29 -49 829 +29 +47 02 -00 +01
AT 245 +11 +115 751 -06 -119 03 -05 +04
PL 131 +25 -10 863 -24 +16 05 -01 -07
PT 74 +07 +05 926 -06 -00 00 -01 -05
RO 105 +50 -23 895 -49 +23 00 -01 -00
SI 196 +03 +57 801 -05 -57 03 +03 00
SK 285 +91 -22 713 -86 +23 02 -05 -00
FI 114 +09 -37 886 -08 +39 01 -01 -02
SE 171 +21 +30 823 -19 -33 06 -02 +04
IS 399 +64 +97 596 -67 -101 05 +03 +03
NO 280 +02 +26 713 +09 -36 08 -11 +10
UK 158 -64 +118 830 +58 -117 12 +06 -01
In the past 12 months have you purchased any goods or services through channels other than the
Internet from a retailer or service provider located in another EU country
Region
Country
Yes No Dont know
Consumer Survey 2018
34
The incidence of consumers shopping cross-border online in another EU country through channels
other than the internet is 145 in the EU27_2019 In the East this indicator is in line with the EU27_2019 average while it is higher in the West (180) and North (178) and lower in the South (88) Among the EU countries the highest levels of this indicator are found in Luxembourg (321) Slovakia (285) and Estonia (274) In addition high levels are also recorded for Norway (280) and Iceland (399) The lowest levels are found in Spain (32) Greece (57) and Portugal (74)
The share of consumers engaging in cross-border shopping in another EU country through channels
other than the internet remained stable in the EU27_2019 while it decreased in the Western region (-35pp) and increased in the other regions (South +11pp North +23pp and East +35pp) compared to 2016 This percentage increased most steeply in Hungary (+94pp) and decreased most prominently in France (-54pp) The strongest positive reversal is found in Romania where between 2016 and 2018 this indicator increased by 50pp whereas between 2014 and 2016 it decreased by 23pp In contrast the highest negative reversal in the EU is found in Estonia where between 2016
and 2018 this proportion of consumers decreased by 44pp whereas between 2014 and 2016 it increased by 119pp Considering all countries of the survey an even stronger negative reversal is observed in the UK (-64pp between 2016 and 2018 +118pp between 2014 and 2016)
Consumer Survey 2018
35
5 KNOWLEDGE OF CONSUMER RIGHTS
This chapter focuses on a consumersrsquo level of knowledge of their rights and specific legislation that pertains to both offline and online purchase contexts Consumersrsquo awareness of their consumer rights is a prerequisite to the effectiveness of existing consumer protection mechanisms
General level of knowledge about consumer rights
This section introduces key findings on the general level of consumersrsquo knowledge of specific rights and remedies they are entitled to when it comes to distance purchase cooling-off period legal guarantees and unsolicited products The three sections that follow break the findings down into the three subcategories that make up general knowledge of consumer rights
Average proportion of correct answers on Q628-Q729-Q830 (Yes to Q6 Q7 Q8) ndash Base all respondents
(N=28037)
28 Q6 Suppose you ordered a new electronic product by post phone or the internet do you think you have the right to return the product 4 days after its delivery and get your money back without giving any reason ndashYes ndashNo ndashDKNA
29 Q7 Imagine that an electronic product you bought new 18 months ago breaks down without any fault on your part You didnt buy or benefit from any extended commercial guarantee Do you have the right to have it repaired or replaced for free ndashYes ndashNo ndashDKNA
30 Q8 Imagine you receive two educational DVDs by post that you have not ordered together with a 20 euro invoice for the goods Are you obliged to pay the invoice ndashYes ndashNo ndashDKNA
Region
Country
2018
( = sig
diff EU27)
2018-
2016
2016-
2014
EU27_2019 455 -27 +42
EU28 448 -42 +58
North 424 -16 +11
South 475 +42 -18
East 466 +03 +39
West 439 -93 +89
BE 442 -16 +44
BG 414 -32 +50
CZ 595 +06 +25
DK 548 -03 +14
DE 497 -59 +40
EE 485 +21 +16
IE 403 -114 +99
EL 252 -19 +19
ES 451 +08 -17
FR 363 -175 +177
HR 347 -11 +43
IT 541 +85 -29
CY 374 -08 -02
LV 439 -41 +68
LT 313 -55 +67
LU 458 -76 +185
HU 428 -23 +108
MT 482 +13 +01
NL 424 -04 +06
AT 472 -73 +108
PL 494 +11 +45
PT 430 +09 +19
RO 375 +15 +02
SI 474 +47 +02
SK 579 -16 +30
FI 356 -31 +04
SE 412 -04 -17
IS 467 -09 +45
NO 527 +11 -05
UK 401 -150 +176
Knowledge of consumer rights
Consumer Survey 2018
36
The total level of consumersrsquo knowledge of consumer rights in the European Union is 455 This
indicator is higher in the East (466) and South (475) whereas it is lower in the North (424) and West (439)
In this map values above average are coloured in light and dark green and values below average are coloured
in light and dark red
The highest levels of consumer rights knowledge are found in the Czech Republic (595) Slovakia (579) and Denmark (548) Conversely the lowest levels of knowledge about consumer rights
are reported in Greece (252) Lithuania (313) and Croatia (347)
Compared to 2016 knowledge about consumer rights remained stable in the East while it decreased in the EU27_2019 (-27pp) the North (-16pp) and West (-93pp) and increased in the South (+42pp)
At country level the highest increase in knowledge about consumer rights compared to 2016 is found in Italy (+85pp) The largest reversal is also found in Italy where the increase between 2016 and 2018 was preceded by a decrease of 29pp between 2014 and 2016 The greatest decrease in consumer rights knowledge is found in France (-175pp) which also represents the largest negative reversal after knowledge increased by 177pp between 2014 and 2016
Consumer Survey 2018
37
Average proportion of correct answers on Q6-Q7-Q8 (Yes to Q6 Q7 Q8) ndash Base all EU27_2019 respondents
(N=24928)
Average proportion of correct answers on Q6-Q7-Q8 (Yes to Q6 Q7 Q8) ndash Base all EU27_2019 respondents
(N=24928)
Regarding sociodemographic variables and other consumer characteristics whether a consumerrsquos mother tongue is the official language in their country of residence or not is associated most closely with the knowledge of consumer rights The variables showing the next closest link are age gender employment status and the degree of urbanisation
Those whose mother tongue corresponds with one of the official languages of the country or region
they live in are more likely to know their consumer rights than those whose mother tongue is not an official language
Age is also linked to knowledge of consumer rights Those aged 55-64 years have more knowledge than those aged 35-54 years who in turn have more knowledge than those aged 18-34 years
Gender is also associated with consumersrsquo knowledge of relevant legislation Males show higher levels
of knowledge more often than females
Regarding consumersrsquo employment status other white-collar workers are most likely to be knowledgeable about consumer rights more so than the self-employed managers blue collar workers students unemployed jobseekers and the retired
Finally the degree to which a consumers living area is urbanised also has a link with consumersrsquo knowledge of consumer rights Those who live in a small town are more knowledgeable about their consumer rights than those living in a rural area
471 442
407 464 A 488 B 477 AB
441 A 462 A 455 A
463 AB 447 A 454 A 482 B
445 A 465 B 457 AB
446 A 451 A 488 432 A
433 A 430 A 446 A 451 A
GenderMale Female
Knowledge of consumer rights
Blue collar
Student
65+
Education levelLow Medium High
Age18-34 35-54 55-64
Very easy
UrbanisationRural area Small town Large town
Financial situationVery difficult Fairly difficult Fairly easy
Unemployed Seeking a job RetiredEmployment status
Self-employed Manager Other white collar
446 A 459 AB 462 AB 485 B
418 458
453 AB 446 A 463 B
465 B 433 A 410 A 466 AB 418 A
443 A 450 A 463 A
460 A 458 A 457 A
Four or more
Knowledge of consumer rights
LanguagesOnly native Two
High
Mother tongue
Not official language
in home country
Official language in
home country
Numerical skillsLow Medium
Three
Consumer
vulnerability
(complexity)
Very vulnerableSomewhat
vulnerableNot vulnerable
Hardly ever Never
Consumer
vulnerability
(socio-demographic
factors)
Very vulnerableSomewhat
vulnerableNot vulnerable
Internet useDaily Weekly Monthly
Consumer Survey 2018
38
Knowledge of the cooling-off period
Correct answer on Q6 (yes) ndash Base all respondents (N=28037)
With regard to consumersrsquo knowledge of the cooling-off period the overall share of consumers being
aware of their rights in the EU27_2019 is 610 This indicator is lower in the South (580) and North (518) whereas it is higher in the West (627) and East (643)
Knowledge of the cooling-off period is highest in the Czech Republic (759) Hungary (739) and Germany (738) Among the EU countries it is the lowest in Greece (222) Cyprus (361) and Portugal (378) Among all the countries studied it is low as well in Iceland (356)
Compared to 2016 knowledge of the cooling-off period decreased in the EU27_2019 (-45pp) North (-26pp) and West (-123pp) increased for the Southern region (+24pp) and remained stable in the East For this type of knowledge the largest increase can be observed in Slovenia (+91pp) and the largest decrease can be found in Ireland (-301pp) While no positive reversal is found there are
Region
Country
2018
( = sig
diff EU27)
2018-
2016
2016-
2014
EU27_2019 610 -45 +86
EU28 601 -70 +110
North 518 -26 +30
South 580 +24 +21
East 643 +05 +73
West 627 -123 +145
BE 472 -87 +110
BG 478 -34 +100
CZ 759 +33 +10
DK 585 -22 +65
DE 738 -27 +75
EE 501 -04 +11
IE 437 -301 +246
EL 222 -137 +115
ES 605 -02 +00
FR 495 -281 +258
HR 548 -23 +112
IT 663 +73 +29
CY 361 -58 +64
LV 459 -52 +105
LT 446 -110 +67
LU 698 -45 +336
HU 739 +33 +135
MT 486 +25 -14
NL 679 +04 +21
AT 693 -104 +210
PL 700 -03 +82
PT 378 +26 -19
RO 496 +22 +30
SI 623 +91 +93
SK 678 -77 +94
FI 384 -18 -23
SE 588 -08 +14
IS 356 -03 +47
NO 608 +14 -12
UK 535 -247 +282
Knowledge of the cooling-off period
Consumer Survey 2018
39
multiple strong negative reversals The highest negative reversal in the EU is observed for Ireland
where between 2016 and 2018 knowledge of the cooling-off period decreased by 301pp whereas between 2014 and 2016 it increased by 246pp
Correct answer on Q6 (yes) ndash Base all EU27_2019 respondents (N=24928)
Correct answer on Q6 (yes) ndash Base all EU27_2019 respondents (N=24928)
Regarding socio-demographic variables and other characteristics the age of consumers is most closely linked to their knowledge of the cooling-off period The factor showing the next closest link is vulnerability due to socio-demographic factors followed by gender numerical skills and employment status
Consumers aged 18-34 years are less likely to be knowledgeable about their rights regarding the cooling-off period compared to those who are aged 35-54 years 55-64 years or 65+ years
Consumer vulnerability due to socio-demographic factors31 is also associated with knowledge of the cooling-off period Those who are not vulnerable are more likely to know about the cooling-off period
than those who are very vulnerable or somewhat vulnerable
31 Consumersrsquo self-reported vulnerability is measured by asking them how vulnerable or disadvantaged they feel when choosing and buying goods or services along several dimensions (Q21) These dimensions are further grouped into vulnerability due to sociodemographic factors (based on self-reported vulnerability because of health problems poor financial circumstances current employment situation age belonging to a minority group personal issues or other) and vulnerability due to the complexity of offers or terms and conditions Consumer vulnerability is discussed in more detail in chapter 13
627 603
543 633 A 651 A 634 A
576 A 622 B 616 AB
616 AB 599 A 612 A 662 B
606 A 620 A 615 A
446 A 451 A 488 432 A
630 BC 621 ABC 570 AB 602 AB
GenderMale Female
Knowledge of the cooling-off period
Blue collar
Student
65+
Education levelLow Medium High
Age18-34 35-54 55-64
Very easy
UrbanisationRural area Small town Large town
Financial situationVery difficult Fairly difficult Fairly easy
Unemployed Seeking a job RetiredEmployment status
Self-employed Manager Other white collar
599 A 623 A 626 A 624 A
571 A 617 A
586 A 597 A 630
633 B 561 A 523 A 586 AB 552 A
574 A 603 A 632
617 A 607 A 619 A
Four or more
Knowledge of the cooling-off period
LanguagesOnly native Two
High
Mother tongue
Not official language
in home country
Official language in
home country
Numerical skillsLow Medium
Three
Consumer
vulnerability
(complexity)
Very vulnerableSomewhat
vulnerableNot vulnerable
Hardly ever Never
Consumer
vulnerability
(socio-demographic
factors)
Very vulnerableSomewhat
vulnerableNot vulnerable
Internet useDaily Weekly Monthly
Consumer Survey 2018
40
Gender is another factor that is related to knowledge of the cooling-off period with males tending to
be more likely to know their rights than females
Consumersrsquo numerical skills are also associated with being knowledgeable of the cooling-off period Those with a higher numerical skill level are more likely to be knowledgeable of this consumer right than those with a medium or low level of numerical skills
Finally employment status is also related to knowledge of the cooling-off period Students and other white-collar workers are more likely to know about this aspect than people who are self-employed White collar workers are also more likely to know about this aspect than the retired blue collar
workers and jobseekers
Consumer Survey 2018
41
Knowledge of faulty product guarantees
In the European Union the general level of knowledge of faulty product guarantees is 409 In the East this level of knowledge is in line with the EU27_2019 average while it is higher in the South (572) and lower in the North (369) and West (302)
Correct answer on Q7 (yes) ndash Base all respondents (N=28037)
The highest levels of knowledge of faulty product guarantees are found in the Czech Republic (720) Portugal (661) and Slovakia (646) In contrast the lowest levels of this type of knowledge are observed in Finland (178) Hungary (196) and France (220)
Compared to 2016 the level of knowledge of faulty product guarantees remained stable in the North and East while it decreased in the EU27_2019 (-46pp) and the West (-118pp) and increased in the
South (+24pp) The highest increase at country level is recorded for Cyprus (+64pp) and the most prominent decrease is noted for France (-197pp) In France also the highest reversal is found
Region
Country
2018
( = sig
diff EU27)
2018-
2016
2016-
2014
EU27_2019 409 -46 +41
EU28 388 -67 +55
North 369 -12 -13
South 572 +24 -20
East 409 -08 +13
West 302 -118 +106
BE 444 +49 +28
BG 394 -108 +81
CZ 720 +17 +14
DK 587 -25 -26
DE 346 -103 +41
EE 457 +25 -27
IE 308 -102 +54
EL 359 +43 -15
ES 568 +10 -49
FR 220 -197 +228
HR 269 -41 +56
IT 598 +33 -04
CY 498 +64 +66
LV 407 -108 +92
LT 233 -69 +35
LU 260 -169 +48
HU 196 -101 +58
MT 547 +34 -87
NL 289 -23 +24
AT 316 -91 +117
PL 329 +23 -00
PT 661 +09 +13
RO 481 +12 -17
SI 326 +17 -16
SK 646 -23 +24
FI 178 -35 -37
SE 371 +39 -25
IS 447 -90 +42
NO 512 +25 -47
UK 245 -209 +157
Knowledge of faulty product guarantees
Consumer Survey 2018
42
where the decrease between 2016 and 2018 follows a strong increase of 2289pp between 2014 and
2016 No positive reversals are observed
Correct answer on Q7 (yes) ndash Base all EU27_2019 respondents (N=24928)
Correct answer on Q7 (yes) ndash Base all EU27_2019 respondents (N=24928)
In terms of socio-demographic variables and other characteristics education shows the closest link with knowledge of faulty product guarantees This is followed by gender language age and employment status
Regarding the association between an education level and knowledge of faulty product guarantees consumers with a low and medium education level are more likely to know about faulty product
guarantees than those with a high level of education
Gender is another factor that is related to knowledge of faulty product guarantees with males tending to be more likely to know about this than females
The number of languages a consumer knows is also associated with their knowledge about faulty product guarantees Those who know at least four languages are more likely to know about this subject than those who know only two languages or less (ie only their native language)
Consumers aged 35-64 are also more likely to be more knowledgeable about this issue compared
to consumers aged 18-34
Finally other white-collar workers are more likely to be knowledgeable regarding this issue compared to people who are self-employed managers blue collar workers students the unemployed jobseekers and consumers who are retired
425 396
377 A 423 B 432 B 407 AB
455 A 421 A 385
411 A 402 A 411 A 419 A
397 A 423 B 407 AB
446 A 451 A 488 432 A
368 A 379 A 429 AB 417 AB
GenderMale Female
Knowledge of faulty product guarantees
Blue collar
Student
65+
Education levelLow Medium High
Age18-34 35-54 55-64
Very easy
UrbanisationRural area Small town Large town
Financial situationVery difficult Fairly difficult Fairly easy
Unemployed Seeking a job RetiredEmployment status
Self-employed Manager Other white collar
397 A 410 A 422 AB 461 B
441 A 409 A
421 A 404 A 412 A
411 A 411 A 396 A 435 A 398 A
417 A 412 A 407 A
410 A 414 A 409 A
Four or more
Knowledge of faulty product guarantees
LanguagesOnly native Two
High
Mother tongue
Not official language
in home country
Official language in
home country
Numerical skillsLow Medium
Three
Consumer
vulnerability
(complexity)
Very vulnerableSomewhat
vulnerableNot vulnerable
Hardly ever Never
Consumer
vulnerability
(socio-demographic
factors)
Very vulnerableSomewhat
vulnerableNot vulnerable
Internet useDaily Weekly Monthly
Consumer Survey 2018
43
Knowledge of rights regarding unsolicited products
The overall level of knowledge of consumer rights regarding unsolicited products in the European Union is 345 In the East the level is in line with the EU27_2019 average while knowledge is higher in the North (385) and West (388) and lower in the South (274)
Correct answer on Q8 (yes) ndash Base all respondents (N=28037)
Among the EU countries high levels of knowledge of rights regarding unsolicited products are found in Finland (506) Estonia (498) and Slovenia (475) Additionally among all surveyed
countries the level is highest in Iceland (597) The lowest levels of knowledge are reported in Romania (148) Greece (176) and Spain (182)
Between 2016 and 2018 knowledge of rights regarding unsolicited products remained stable for the Northern and Eastern regions while it increased in the EU27_2019 (+11pp) and the South (+79pp)
Region
Country
2018
( = sig
diff EU27)
2018-
2016
2016-
2014
2014-
2012
2012-
2011
EU27_2019 345 +11 -02 +23 -45
EU28 355 +10 +09 +21 -46
North 385 -09 +15 -17 -70
South 274 +79 -54 +70 -63
East 347 +13 +32 -04 -44
West 388 -36 +14 +08 -29
BE 409 -09 -07 -08 -13
BG 371 +46 -31 +66 -64
CZ 306 -31 +49 -55 +29
DK 472 +38 +02 -51 -25
DE 407 -47 +04 +24 -33
EE 498 +43 +63 +19 -38
IE 463 +61 -02 -06 -35
EL 176 +37 -43 +20 -72
ES 182 +16 -02 +08 -40
FR 372 -47 +43 -03 -46
HR 222 +31 -41 -18 -
IT 364 +150 -113 +137 -85
CY 263 -28 -137 +66 -34
LV 450 +36 +07 +70 -15
LT 260 +15 +98 -20 -131
LU 417 -15 +172 -06 +01
HU 349 +00 +130 -03 -106
MT 414 -19 +104 +40 -34
NL 304 +07 -27 -09 +16
AT 407 -25 -02 +04 +17
PL 452 +13 +54 -19 -10
PT 251 -08 +62 -04 -19
RO 148 +12 -06 -00 -110
SI 475 +34 -71 +126 -102
SK 412 +51 -26 +51 +35
FI 506 -38 +71 -09 -86
SE 276 -43 -39 -23 -79
IS 597 +65 +45 -36 +03
NO 461 -05 +42 -35 -23
UK 424 +06 +88 +13 -54
Knowledge of unsolicited products
Consumer Survey 2018
44
and decreased in the West (-36pp) The highest increase is found in Italy (+150pp) which is also
related to the strongest positive reversal after a decrease by 113pp between 2014 and 2016 The greatest decrease is recorded for France and Germany (both -47pp) France also shows the highest negative reversal where the decrease between 2016 and 2018 follows an increase of 43pp between 2014 and 2016
Correct answer on Q8 (yes) ndash Base all EU27_2019 respondents (N=24928)
Correct answer on Q8 (yes) ndash Base all EU27_2019 respondents (N=24928)
With regard to socio-demographic variables and other characteristics whether someonersquos mother tongue is the same as one of the official languages of the country or region they live in has the
closest link with consumersrsquo knowledge of their rights regarding unsolicited products followed by age education gender and employment status
Consumers whose mother tongue corresponds with one of the official languages of the country or region they live in are more likely to know about their rights regarding unsolicited products than those whose mother tongue is different
Regarding the association between age and knowledge of consumer rights regarding unsolicited products consumers aged 55 years or older appear to be more knowledgeable than consumers
younger than 55 years
Education is also an important factor related to consumersrsquo knowledge of their rights Those with a high or medium level of education are more likely to be knowledgeable of their rights regarding such products than consumers with a lower level of education
Regarding consumersrsquo gender the proportion of males that knows their rights regarding this issue is higher than the proportion of females
362 328
296 335 381 A 391 A
295 341 A 362 A
359 A 340 A 340 A 364 A
332 A 353 A 348 A
446 A 451 A 488 432 A
308 AB 287 A 340 ABC 333 ABC
GenderMale Female
Knowledge of unsolicited products
Blue collar
Student
65+
Education levelLow Medium High
Age18-34 35-54 55-64
Very easy
UrbanisationRural area Small town Large town
Financial situationVery difficult Fairly difficult Fairly easy
Unemployed Seeking a job RetiredEmployment status
Self-employed Manager Other white collar
344 A 344 A 337 A 373 A
253 350
352 A 337 A 348 A
352 B 327 AB 312 AB 376 AB 303 A
338 A 335 A 351 A
354 A 351 A 342 A
Four or more
Knowledge of unsolicited products
LanguagesOnly native Two
High
Mother tongue
Not official language
in home country
Official language in
home country
Numerical skillsLow Medium
Three
Consumer
vulnerability
(complexity)
Very vulnerableSomewhat
vulnerableNot vulnerable
Hardly ever Never
Consumer
vulnerability
(socio-demographic
factors)
Very vulnerableSomewhat
vulnerableNot vulnerable
Internet useDaily Weekly Monthly
Consumer Survey 2018
45
Those who are self-employed white collar workers are more likely to know their rights regarding
unsolicited products than those who are blue collar workers students job seekers and those who are unemployed In addition managers are also more likely to know their rights regarding unsolicited products than unemployed persons
Consumer Survey 2018
46
6 TRUST IN CONSUMER PROTECTION
This chapter discusses trust in consumer protection which refers to consumersrsquo confidence that their rights are respected and protected in the single market Trust in consumer protection is a key component in increasing consumersrsquo willingness to actively engage in the single market especially when it comes to distance purchases
Trust in organisations
The first section focuses on consumer confidence in organisations that are tasked with ensuring consumer rights are respected and protected when the need arises These organisations include public authorities non-governmental consumer organisations (NGOs) as well as retailers and service providers
Average proportion of agreement (ldquoStrongly agreerdquo and ldquoAgreerdquo) with Q332 options 1 2 and 3 - Base all
respondents (N=28037)
32 Q3 How strongly do you agree or disagree with each of the following statements In (our country) hellip -Strongly agree ndashAgree ndash Disagree ndashStrongly disagree ndash DKNA Q31 You trust public authorities to protect your rights as a consumer Q32 In general retailers and service providers respect your rights as a consumer Q33 You trust non-governmental consumer organisations to protect your rights as a consumer
Region
Country
2018
( = sig
diff EU27)
2018-
2016
2016-
2014
2014-
2012
2012-
2011
2011-
2010
2010-
2009
2009-
2008
2008-
2006
EU27_2019 646 -53 +80 +11 -30 +17 +62 -03 -25
EU28 655 -63 +82 +06 -26 +13 +63 -00 -27
North 702 +19 -07 +04 -08 +29 +50 -67 +18
South 625 +38 +30 +05 -10 -36 +85 +21 +11
East 646 +13 +52 +48 -20 +56 +51 +14 -21
West 652 -163 +142 -06 -52 +39 +53 -26 -38
BE 671 -68 -14 +62 -43 +81 +85 -149 -19
BG 514 +26 +48 -52 +45 +90 +55 +89 -
CZ 619 +59 +18 +61 -48 +40 +48 -57 -10
DK 773 +01 +24 +28 -63 +13 +84 -31 +15
DE 664 -163 +189 -08 -88 +26 +78 -54 -24
EE 708 +26 +09 +67 -10 +36 +27 -40 +55
IE 726 -108 +144 -69 +28 -73 +97 +122 -65
EL 507 +45 +09 +24 -33 -01 +26 -14 -73
ES 654 +47 +25 -03 -16 +18 +44 -76 +174
FR 587 -243 +165 -14 -40 +69 +07 +35 -63
HR 514 -03 +29 +09 - - - - -
IT 624 +34 +41 +16 -13 -98 +142 +84 -85
CY 515 +43 +39 -57 -08 -50 +88 -109 -25
LV 570 -06 -03 -53 -28 +66 +122 -88 +118
LT 628 +121 -34 +40 +11 +76 +66 -13 -10
LU 746 -100 +43 -17 +08 +15 +56 +62 -60
HU 838 +11 +65 +112 +15 -20 +85 -60 +37
MT 761 +111 +02 -03 +14 +31 +50 -59 -21
NL 759 +27 -39 +05 +40 +04 +54 -100 -36
AT 743 -88 +77 -09 -35 +18 +67 +40 -10
PL 679 +14 +57 +67 -48 +77 +85 -23 +51
PT 632 +14 +08 -40 +66 +36 -05 +161 -70
RO 591 -22 +73 +37 +04 +61 -09 +122
SI 591 +13 +89 +04 +07 -72 +01 +31 -01
SK 612 +42 +05 -02 +17 +65 +15 -09 +66
FI 798 +24 -30 +33 +01 +45 -25 -65 -03
SE 655 -03 -06 -38 +16 -05 +51 -99 +18
IS 603 +08 +07 +122 -57 - - - -
NO 716 -14 -39 +90 -50 - - - -
UK 718 -135 +92 -28 +06 -28 +76 +30 -34
Trust in organisations
Consumer Survey 2018
47
The overall level of trust in organisations for consumers of the European Union is 646 For the
East and West this level is in line with the EU27_2019 average while it is higher in the North (702) and lower in the South (625)
In this map values above average are coloured in light and dark green and values below average are coloured in light and
dark red
Trust in organisations is highest in Hungary (838) Finland (798) and Denmark (773) The lowest levels of trust in organisations are reported in Greece (507) Bulgaria (514) Croatia
(514) and Cyprus (515)
Between 2016 and 2018 the overall level of trust in organisations decreased in the EU27_2019 (-53pp) and Western Europe (-163pp) while it increased in the South (+38pp) North (+19pp) and
East (+13pp) The highest increase is recorded in Lithuania (+121pp) while the sharpest decrease is recorded in France (-243pp)
The only positive reversal is observed in Lithuania where between 2016 and 2018 this indicator increased by 121pp whereas between 2014 and 2016 it decreased by 34pp The highest negative reversal is observed in France where between 2016 and 2018 trust in organisations decreased by 243pp whereas between 2014 and 2016 it increased by 165pp
Consumer Survey 2018
48
Average proportion of agreement with Q3 options 1 2 and 3 - Base all EU27_2019 respondents (N=24928)
Average proportion of agreement with Q3 options 1 2 and 3 - Base all EU27_2019 respondents (N=24928)
Regarding socio-demographic variables and other characteristics consumersrsquo financial situation33 is
most closely associated with trust in organisations followed by vulnerability due to sociodemographic factors age education and vulnerability due to the complexity of offers and terms and conditions
Consumers that report being in a fairly or very easy financial situation report greater trust than those in a fairly difficult financial situation who in turn say that they have greater trust in organisations than those in a very difficult financial situation
Consumers who are very vulnerable in terms of socio-demographic factors report less trust in
organisations than those who are somewhat vulnerable who in turn have less trust than those who are not vulnerable
Concerning consumersrsquo age people aged 54 or younger tend to have greater trust in organisations than consumers aged 55 or older
Regarding education consumers with a low level of education show higher trust in organisations than those with a medium and high level of education
Finally consumers who are not vulnerable because of the complexity of offers also report greater
trust in organisations than those who are somewhat vulnerable and very vulnerable
33 Based on respondentsrsquo self-reported financial situation
648 A 648 A
669 B 660 B 624 A 621 A
683 645 A 643 A
559 615 672 A 682 A
666 641 A 638 A
446 A 451 A 488 432 A
675 B 645 AB 659 AB 635 AB
GenderMale Female
Trust in organisations
Blue collar
Student
65+
Education levelLow Medium High
Age18-34 35-54 55-64
Very easy
UrbanisationRural area Small town Large town
Financial situationVery difficult Fairly difficult Fairly easy
Unemployed Seeking a job RetiredEmployment status
Self-employed Manager Other white collar
640 AB 658 B 647 AB 629 A
631 A 649 A
628 A 644 A 653 A
661 B 616 A 626 AB 544 A 602 A
596 637 666
615 A 637 A 659
Four or more
Trust in organisations
LanguagesOnly native Two
High
Mother tongue
Not official language
in home country
Official language in
home country
Numerical skillsLow Medium
Three
Consumer
vulnerability
(complexity)
Very vulnerableSomewhat
vulnerableNot vulnerable
Hardly ever Never
Consumer
vulnerability
(socio-demographic
factors)
Very vulnerableSomewhat
vulnerableNot vulnerable
Internet useDaily Weekly Monthly
Consumer Survey 2018
49
The following three subsections separately report on trust in the three types of organisations
surveyed public authorities retailers and service providers and non-governmental organisation (NGOs)
611 Public authorities
Rate of agreement (ldquoStrongly agreerdquo and ldquoAgreerdquo) with Q3 option 1 - Base all respondents (N=28037)
For consumers of the European Union the overall level of trust in public authorities is 618 Compared to the EU27_2019 average this level of trust is higher in the West (638) and North (745) and lower in the East (585) and South (589) Trust in public authorities is highest in Hungary (860) Malta (835) and Finland (829) Among the EU countries the lowest levels of trust in public authorities are found in Croatia (334) Slovenia (484) and Bulgaria (519)
Additionally Iceland also has a low level of this indicator (509)
Region
Country
2018
( = sig
diff EU27)
2018-
2016
2016-
2014
2014-
2012
2012-
2011
2011-
2010
2010-
2009
2009-
2008
2008-
2006
EU27_2019 618 -48 +91 +28 -37 +00 +68 +09 -26
EU28 634 -54 +88 +25 -34 -02 +74 +11 -28
North 745 +30 -18 +25 +23 +24 +61 -92 +46
South 589 +66 +45 -03 -37 -89 +91 +32 +01
East 585 +15 +60 +39 -36 +44 +50 +18 -00
West 638 -172 +155 +45 -45 +41 +61 -01 -48
BE 613 -90 -28 +74 -36 +110 +98 -124 -21
BG 519 +25 +62 -112 +31 +113 +44 +114 -
CZ 579 +79 +51 +74 -28 -73 +61 +01 -23
DK 815 -01 +21 +25 +00 +22 +47 -63 +59
DE 676 -143 +167 +78 -68 +01 +111 -40 -25
EE 733 +43 -37 +164 -32 +34 +41 -32 +53
IE 741 -82 +155 -03 +12 -107 +115 +111 -88
EL 533 +76 -12 +69 -62 -27 +64 -50 -132
ES 590 +69 +69 -49 -43 -17 +53 -93 +152
FR 521 -308 +233 +17 -65 +103 -18 +87 -69
HR 334 -01 +20 +22 - - - - -
IT 590 +67 +35 +23 -38 -174 +147 +123 -71
CY 565 +92 +109 -132 -64 -46 +108 -182 -14
LV 547 +08 -59 -18 -23 +71 +176 -196 +104
LT 559 +145 -36 +75 +01 +22 +115 -119 +31
LU 785 -79 +83 -48 +21 +29 +33 +142 -68
HU 860 +20 +68 +73 +38 -30 +111 -90 +66
MT 835 +133 +21 -22 +14 +07 +77 -34 -68
NL 781 +38 -21 -21 +102 +23 +44 -64 -102
AT 817 -19 +36 +64 -32 +00 +109 -12 -02
PL 593 +10 +75 +68 -67 +74 +87 -22 +49
PT 625 +28 +47 -11 +21 +10 -33 +185 -126
RO 530 -27 +54 +19 -11 +69 -31 +115 -
SI 484 +58 +98 -03 +06 -92 -13 +26 -55
SK 548 +40 -00 +15 -36 +68 +14 -08 +52
FI 829 +37 -53 +15 +65 +34 -28 -49 +28
SE 755 +07 -03 +05 +34 -05 +72 -94 +43
IS 509 +55 +01 +166 -43 - - - -
NO 806 -09 -19 +109 -42 - - - -
UK 742 -100 +68 +02 -06 -32 +119 +33 -40
Trust in pubic authorities
Consumer Survey 2018
50
Compared to 2016 trust in public authorities remained stable in the East while it decreased in the
EU27_2019 (-48pp) and the West (-172pp) and increased in the North (+30pp) and the South (+66pp) The highest increase is found in Lithuania (+145pp) and the most prominent decrease is observed in France (-308pp)
The only positive reversal is observed in Finland where between 2016 and 2018 trust in public authorities increased by 37pp whereas between 2014 and 2016 it decreased by 53pp The greatest negative reversal is found in France As indicated above between 2016 and 2018 trust in public authorities decreased by 308pp following an increase of 233pp between 2014 and 2016
Rate of agreement with Q3 option 1 - Base all EU27_2019 respondents (N=24928)
Rate of agreement with Q3 option 1 - Base all EU27_2019 respondents (N=24928)
In terms of sociodemographic variables and other characteristics consumersrsquo financial situation is most closely associated with trust in public authorities The characteristics showing the next closest links are vulnerability due to socio-demographic factors vulnerability due to the complexity of offers and terms and conditions age and education
Consumers who report their financial situation to be fairly or very easy are more likely to trust public authorities than the remainder of the population In addition those who report their situation to be
fairly difficult are also more likely to trust public authorities than those who report their situation very difficult
Consumers who are very vulnerable in terms of sociodemographic factors are less likely to trust public authorities than those who are somewhat vulnerable who in turn are less likely to trust them than those who are not vulnerable
615 A 626 A
647 B 640 B 575 A 600 AB
652 B 626 AB 605 A
518 580 646 A 677 A
635 A 615 A 612 A
446 A 451 A 488 432 A
670 C 636 BC 651 BC 608 ABC
GenderMale Female
Trust in public authorities
Blue collar
Student
65+
Education levelLow Medium High
Age18-34 35-54 55-64
Very easy
UrbanisationRural area Small town Large town
Financial situationVery difficult Fairly difficult Fairly easy
Unemployed Seeking a job RetiredEmployment status
Self-employed Manager Other white collar
621 A 630 A 605 A 592 A
651 A 619 A
610 A 620 A 623 A
631 B 588 A 632 AB 540 A 597 AB
567 603 645
587 A 591 A 639
Four or more
Trust in public authorities
LanguagesOnly native Two
High
Mother tongue
Not official language
in home country
Official language in
home country
Numerical skillsLow Medium
Three
Consumer
vulnerability
(complexity)
Very vulnerableSomewhat
vulnerableNot vulnerable
Hardly ever Never
Consumer
vulnerability
(socio-demographic
factors)
Very vulnerableSomewhat
vulnerableNot vulnerable
Internet useDaily Weekly Monthly
Consumer Survey 2018
51
In contrast consumers who are not vulnerable in terms of the complexity of offers and terms and
conditions also are more likely to trust public authorities than those who are somewhat vulnerable or very vulnerable
Concerning consumersrsquo age consumers aged 18-54 years are more likely to trust public authorities than consumers who are 55-64 years old while consumers aged 65 years or older are on a par with all other age groups
Finally consumers with a low level of education are also more likely to trust public authorities than those with a high level of education
612 Retailers and service providers
Rate of agreement (ldquoStrongly agreerdquo and ldquoAgreerdquo) with Q3 option 2 - Base all respondents (N=28037)
Region
Country
2018
( = sig
diff EU27)
2018-
2016
2016-
2014
2014-
2012
2012-
2011
2011-
2010
2010-
2009
2009-
2008
2008-
2006
EU27_2019 713 -24 +60 +125 -69 +06 +73 -14 -29
EU28 723 -29 +57 +121 -65 -01 +70 -11 -29
North 774 +10 +19 +125 -83 +20 +68 -48 -16
South 653 +40 +25 +103 -36 -23 +110 -16 +07
East 751 +23 +56 +156 -47 +40 +67 +21 -35
West 725 -99 +93 +124 -104 +13 +51 -32 -35
BE 742 -46 +09 +159 -124 +54 +40 -125 -49
BG 674 +66 +89 +122 -00 +72 +76 +59 -
CZ 774 +27 +09 +340 -126 +20 +87 -63 -34
DK 821 -10 +55 +183 -155 -16 +204 -07 -68
DE 751 -89 +103 +137 -138 +19 +59 -62 -09
EE 815 +29 +36 +87 -06 +40 +32 -71 +47
IE 828 -17 +54 +29 -11 -64 +94 +153 -71
EL 600 -00 +107 +137 -57 -05 +30 +18 -59
ES 695 +32 +11 +138 -89 +41 +50 -109 +166
FR 645 -176 +136 +99 -79 +22 +25 +18 -67
HR 643 -13 +31 +57 - - - - -
IT 638 +53 +32 +91 -10 -89 +177 +41 -100
CY 478 +35 -75 +122 -64 -28 +141 -181 +46
LV 725 -51 +93 +34 -30 +26 +85 +11 +63
LT 746 +110 -51 +119 -04 +140 +20 +74 -77
LU 807 -36 -03 +74 -69 -12 +84 +35 -69
HU 845 +28 +62 +214 -48 -24 +73 -28 -27
MT 736 +147 -32 +157 -66 +56 +34 -125 +52
NL 815 +42 -17 +168 -50 -82 +92 -97 -24
AT 815 -17 +23 +84 -91 +38 +66 +71 -24
PL 757 +11 +61 +126 -56 +44 +103 -14 +54
PT 621 +41 -26 -27 +85 +49 +67 +74 -37
RO 721 +23 +71 +142 -28 +63 +00 +129 -
SI 735 +11 +70 +103 -82 -67 +57 +41 -06
SK 802 +66 +13 +108 -02 +65 +24 +07 +84
FI 816 -09 +03 +108 -78 +37 -23 -109 +04
SE 736 +11 +11 +124 -92 -24 +61 -86 +02
IS 636 -19 -09 +129 -82 - - - -
NO 757 -26 -05 +220 -119 - - - -
UK 796 -63 +30 +90 -32 -57 +53 +20 -22
Trust in retailers and service providers
Consumer Survey 2018
52
In the European Union the overall level of trust in retailers and service providers is 713 Compared
to the EU27_2019 average this level is higher in the West (725) the East (751) and the North (774) whereas it is lower in the South (653) The highest trust in retailers and service providers is found in Hungary (845) Ireland (828) and Denmark (821) The lowest levels of trust in retailers and service providers are found in Cyprus (478) Greece (600) and Portugal (621)
Between 2016 and 2018 trust in retailers and service providers decreased in the EU27_2019 (-24pp) and Western Europe (-99pp) while it remained stable in the North and increased in the East (+23pp) and South (+40pp) Compared to the previous survey this type of trust increased most
prominently in Malta (+147pp) and decreased most sharply in France (-176pp)
The only positive reversal is observed in Lithuania Between 2016 and 2018 trust in retailers and service providers in Lithuania increased by 110pp whereas between 2014 and 2016 it decreased by 51pp The largest negative reversal is observed in France where between 2016 and 2018 trust in retailers and service providers decreased by 176pp whereas between 2014 and 2016 it increased by 136pp
Rate of agreement with Q3 option 2 - Base all EU27_2019 respondents (N=24928)
Rate of agreement with Q3 option 2 - Base all EU27_2019 respondents (N=24928)
The findings for the socio-demographic variables show that trust in retailers and service providers is associated most closely with consumersrsquo financial situation followed by age vulnerability due to sociodemographic variables vulnerability due to the complexity of offers and terms and conditions and consumersrsquo degree of urbanisation
Consumers who report their financial situation to be fairly easy and very easy are more likely to trust retailers and service providers than those who report their situation to be fairly or very difficult
711 A 716 A
749 B 734 B 687 A 668 A
744 B 715 AB 701 A
640 A 680 A 736 B 760 B
737 704 A 701 A
446 A 451 A 488 432 A
763 B 692 A 703 AB 698 A
GenderMale Female
Trust in retailers and service providers
Blue collar
Student
65+
Education levelLow Medium High
Age18-34 35-54 55-64
Very easy
UrbanisationRural area Small town Large town
Financial situationVery difficult Fairly difficult Fairly easy
Unemployed Seeking a job RetiredEmployment status
Self-employed Manager Other white collar
694 A 727 B 729 B 714 AB
685 A 715 A
703 A 711 A 717 A
728 B 697 AB 702 AB 614 A 660 A
669 A 702 A 734
673 A 698 A 729
Four or more
Trust in retailers and service providers
LanguagesOnly native Two
High
Mother tongue
Not official language
in home country
Official language in
home country
Numerical skillsLow Medium
Three
Consumer
vulnerability
(complexity)
Very vulnerableSomewhat
vulnerableNot vulnerable
Hardly ever Never
Consumer
vulnerability
(socio-demographic
factors)
Very vulnerableSomewhat
vulnerableNot vulnerable
Internet useDaily Weekly Monthly
Consumer Survey 2018
53
Consumers who are not vulnerable in terms of socio-demographic factors are more likely to trust
retailers and service providers than those who are very or somewhat vulnerable
Consumers younger than 54 years are also more likely to trust in retailers and service providers than consumers aged 55 or older
Regarding the association between trust and vulnerability due to offers and terms and conditions consumers who are not vulnerable are more likely to trust in retailers and service providers than those who are very or somewhat vulnerable
Finally consumers that live in a rural area are more likely to trust organisations than those living in
small or large towns
Consumer Survey 2018
54
613 NGOs
Rate of agreement (ldquoStrongly agreerdquo and ldquoAgreerdquo) with Q3 option 3 - Base all respondents (N=28037)
In the European Union the overall level of trust in non-governmental consumer organisations (NGOs) is 607 In the East this level is in line with the EU27_2019 average while it is higher in the South (634) and lower in the North (588) and West (593) The highest trust in NGOs is observed for individuals residing in Hungary (810) Finland (751) and Malta (712) The lowest levels
of trust in NGOs are found in Bulgaria (348) Greece (388) and Latvia (439)
Between 2016 and 2018 trust in NGOs remained stable in the North South and East while it decreased in the EU27_2019 (-88pp) and the West (-217pp) Compared to the previous survey
Region
Country
2018
( = sig
diff EU27)
2018-
2016
2016-
2014
2014-
2012
2012-
2011
2011-
2010
2010-
2009
2009-
2008
2008-
2006
EU27_2019 607 -88 +89 -122 +17 +46 +44 -05 -21
EU28 608 -107 +100 -129 +21 +42 +46 -00 -24
North 588 +16 -22 -139 +36 +45 +20 -62 +23
South 634 +09 +19 -85 +44 +04 +53 +48 +25
East 603 +01 +41 -52 +23 +84 +37 +04 -29
West 593 -217 +179 -187 -06 +63 +46 -46 -33
BE 657 -68 -24 -48 +31 +78 +119 -199 +12
BG 348 -13 -09 -166 +104 +85 +45 +93 -
CZ 505 +72 -07 -233 +10 +173 -05 -109 +27
DK 683 +13 -04 -123 -35 +31 +01 -24 +53
DE 564 -256 +298 -238 -57 +57 +64 -60 -37
EE 575 +06 +28 -50 +09 +35 +10 -17 +64
IE 609 -225 +224 -232 +81 -49 +82 +101 -35
EL 388 +58 -69 -134 +21 +30 -17 -09 -28
ES 677 +39 -07 -98 +83 +31 +30 -25 +202
FR 595 -246 +126 -159 +23 +82 +13 +01 -53
HR 565 +07 +35 -53 - - - - -
IT 643 -17 +56 -67 +09 -30 +103 +87 -85
CY 503 +01 +82 -161 +103 -76 +14 +36 -107
LV 439 +24 -44 -176 -31 +101 +105 -79 +186
LT 580 +108 -16 -74 +35 +68 +62 +07 +16
LU 648 -184 +47 -78 +72 +29 +52 +08 -42
HU 810 -15 +66 +51 +56 -06 +71 -60 +73
MT 712 +54 +18 -142 +93 +30 +41 -19 -47
NL 682 +02 -79 -133 +69 +71 +25 -139 +17
AT 599 -227 +173 -174 +18 +16 +26 +62 -03
PL 688 +20 +34 +07 -22 +112 +65 -34 +49
PT 651 -28 +03 -82 +91 +50 -47 +225 -48
RO 523 -63 +93 -50 +51 +50 +04 +122 -
SI 554 -31 +97 -89 +97 -56 -40 +27 +58
SK 486 +18 +04 -128 +89 +61 +06 -26 +63
FI 751 +45 -39 -24 +14 +63 -24 -36 -42
SE 476 -28 -27 -242 +107 +15 +20 -116 +09
IS 664 -13 +30 +70 -47 - - - -
NO 584 -07 -94 -60 +11 - - - -
UK 615 -241 +179 -177 +54 +06 +55 +37 -41
Trust in NGOs
Consumer Survey 2018
55
this type of trust increased most sharply in Lithuania (+108pp) whereas it decreased most
prominently in Germany (-256pp)
The only positive reversal is observed in Greece where between 2016 and 2018 trust in NGOs increased by 58pp whereas between 2014 and 2016 it decreased by 69pp Conversely the largest negative reversal is found in Germany where between 2016 and 2018 this indicator decreased by 256pp following an increase of 298pp between 2014 and 2016
Rate of agreement with Q3 option 3 - Base all EU27_2019 respondents (N=24928)
Rate of agreement with Q3 option 3 - Base all EU27_2019 respondents (N=24928)
With regard to socio-demographic variables and other characteristics higher trust in NGOs is most closely association with vulnerability in terms of socio-demographic factors followed by numerical skills
Regarding consumers who are very vulnerable in terms of socio-demographic factors a higher proportion reports trust in NGOs compared to the remainder of the population
In addition those who have a high numerical skill level are more likely to trust in NGOs than those with low numerical skills Consumers who have a medium level of numerical skills fall somewhere in
between
617 A 603 A
620 A 607 A 611 A 600 A
642 B 594 A 619 AB
542 A 587 AB 637 C 613 BC
625 A 603 A 602 A
446 A 451 A 488 432 A
606 A 607 A 620 A 603 A
GenderMale Female
Trust in NGOs
Blue collar
Student
65+
Education levelLow Medium High
Age18-34 35-54 55-64
Very easy
UrbanisationRural area Small town Large town
Financial situationVery difficult Fairly difficult Fairly easy
Unemployed Seeking a job RetiredEmployment status
Self-employed Manager Other white collar
605 AB 619 B 607 AB 576 A
556 A 612 A
572 A 601 AB 620 B
625 B 569 A 549 AB 507 A 571 A
566 604 A 624 A
596 A 624 A 610 A
Four or more
Trust in NGOs
LanguagesOnly native Two
High
Mother tongue
Not official language
in home country
Official language in
home country
Numerical skillsLow Medium
Three
Consumer
vulnerability
(complexity)
Very vulnerableSomewhat
vulnerableNot vulnerable
Hardly ever Never
Consumer
vulnerability
(socio-demographic
factors)
Very vulnerableSomewhat
vulnerableNot vulnerable
Internet useDaily Weekly Monthly
Consumer Survey 2018
56
Trust in redress mechanisms
This section focuses on consumersrsquo level of trust in redress mechanisms (out-of-court mechanisms and courts) which is relevant as it can affect their willingness to actively use these mechanisms when facing problems with online andor offline purchases
Average proportion of agreement (ldquoStrongly agreerdquo and ldquoAgreerdquo) with Q334 options Q34 and Q35 - Base all
respondents (N=28037)
34 Q3 How strongly do you agree or disagree with each of the following statements In (our country) hellip -Strongly agree ndashAgree ndash Disagree ndashStrongly disagree ndash DKNA
Q34 It is easy to settle disputes with retailers and service providers through an out-of-court body (ie arbitration mediation or conciliation body) Q35 It is easy to settle disputes with retailers and service providers through the courts
Region
Country
2018
( = sig
diff EU27)
2018-
2016
2016-
2014
2014-
2012
2012-
2011
2011-
2010
2010-
2009
2009-
2008
2008-
2006
EU27_2019 369 -72 +55 +13 -46 +53 +95 -42 -30
EU28 379 -84 +65 +10 -48 +43 +103 -43 -31
North 381 +38 -20 -11 +07 +81 +73 -130 -15
South 378 +43 -20 +54 -44 +06 +115 -42 -08
East 359 -09 -05 +07 +15 +67 +26 +21 +29
West 367 -202 +149 -11 -88 +82 +119 -66 -59
BE 310 -16 -131 -16 -10 +138 +106 -214 -11
BG 279 +04 +01 -53 +60 +87 +54 +35 -
CZ 418 +74 +19 +06 +05 +78 -52 +71 -25
DK 523 +73 +23 +18 -48 +129 +80 -213 +101
DE 381 -215 +230 -38 -99 +55 +152 -84 -80
EE 254 -31 +28 +95 -16 -18 +03 -53 +22
IE 487 -105 +68 +27 -27 -48 +127 +128 -89
EL 432 +53 -45 +23 -19 +15 +63 -104 -36
ES 393 +35 -09 +18 -26 +69 +102 -51 +89
FR 306 -311 +163 +12 -110 +124 +83 -21 -42
HR 302 +02 -00 +22 - - - - -
IT 373 +66 -34 +103 -73 -63 +155 -44 -59
CY 339 +26 -42 -112 +24 +38 +41 -05 -165
LV 311 +46 -61 -72 +02 +219 +14 -89 +69
LT 408 +164 -27 -49 -09 +85 +79 -24 -18
LU 373 -183 -02 +44 -54 +145 +14 +82 -29
HU 383 +127 -140 +14 +15 +73 -02 +13 +13
MT 447 +65 -00 +30 +40 +62 +28 +02 -49
NL 470 +76 -84 +15 -28 +78 +95 -157 -19
AT 480 -93 +129 +24 -91 +51 +112 +39 -80
PL 320 -22 -13 +30 +03 +23 +66 -32 +69
PT 277 -64 +39 -44 +24 +114 +10 +61 -85
RO 460 -100 +77 -27 +23 +137 +01 +99 -
SI 416 -12 +213 -86 +98 -27 -15 -52 +86
SK 251 -20 -135 +74 +64 +77 +23 +21 -05
FI 456 +14 -78 +23 +19 +82 +94 -37 -89
SE 282 -00 -08 -37 +42 +29 +81 -190 -59
IS 287 -46 -51 +12 -33 - - - -
NO 429 -05 -83 +82 -52 - - - -
UK 446 -169 +133 -05 -65 -41 +167 -42 -27
Trust in redress mechanisms
Consumer Survey 2018
57
In the European Union the overall level of trust in redress mechanisms is 369 In the South and
West this level is in line with the EU27_2019 average while it is higher in the North (381) and lower in the East (359)
In this map values above average are coloured in light and dark green and values below average are coloured
in light and dark red
The highest trust in redress mechanisms is found in Denmark (523) Ireland (487) and Austria (480) The lowest levels of trust in redress mechanisms are found in Slovakia (251) Estonia
(254) and Portugal (277)
Between 2016 and 2018 trust in redress mechanisms decreased in the EU27_2019 (-72pp) and the West (-202pp) while it remained stable in the East and increased in the North (+38pp) and South
(+43pp) Compared to the 2016 survey this type of trust increased most prominently in Lithuania (+164pp) and decreased most prominently in France (-311pp)
The largest positive reversal is observed in Hungary where between 2016 and 2018 trust in redress mechanisms increased by 127pp whereas between 2014 and 2016 it decreased by 140pp The largest negative reversal is observed in France where the decrease in trust between 2016 and 2018 (-311pp see above) follows a 163pp increase observed between 2014 and 2016
Consumer Survey 2018
58
Average proportion of agreement (ldquoStrongly agreerdquo and ldquoAgreerdquo) with Q3 options 1 2 and 3 - Base all
EU27_2019 respondents (N=24928)
Average proportion of agreement (ldquoStrongly agreerdquo and ldquoAgreerdquo) with Q3 options 1 2 and 3 - Base all
EU27_2019 respondents (N=24928)
Consumer trust in redress mechanisms is associated most closely with age followed by gender education consumersrsquo financial situation vulnerability of consumers in terms of complexity of offers and terms and conditions and consumersrsquo employment status
Consumers aged 54 years or younger show a higher trust in redress mechanisms than older consumers (aged 55 or older)
Regarding consumersrsquo gender males tend to report greater trust than females on this indicator
Consumers with a low level of education show a higher level of trust in redress mechanisms than
those with a high level of education
Additionally consumers that indicate being in a very difficult financial situation show a lower trust in redress mechanisms than all other consumers In addition consumers in a fairly difficult situation also report lower trust than consumers in a fairly easy financial situation
Finally consumers who are very vulnerable and somewhat vulnerable in such terms show lower trust in redress mechanisms than those who are not vulnerable
The following two sections focus on the findings of two specific redress mechanisms the ADR
(Alternative Dispute Resolution) and courts
391 349
412 381 339 A 324 A
400 A 386 A 342
319 360 A 383 B 388 AB
373 A 366 A 370 A
446 A 451 A 488 432 A
381 AB 395 B 382 AB 367 AB
GenderMale Female
Trust in redress mechanisms
Blue collar
Student
65+
Education levelLow Medium High
Age18-34 35-54 55-64
Very easy
UrbanisationRural area Small town Large town
Financial situationVery difficult Fairly difficult Fairly easy
Unemployed Seeking a job RetiredEmployment status
Self-employed Manager Other white collar
371 A 370 A 368 A 360 A
361 A 370 A
375 A 379 A 364 A
377 B 354 AB 334 AB 299 A 352 AB
381 A 369 A 368 A
351 A 350 A 381
Four or more
Trust in redress mechanisms
LanguagesOnly native Two
High
Mother tongue
Not official language
in home country
Official language in
home country
Numerical skillsLow Medium
Three
Consumer
vulnerability
(complexity)
Very vulnerableSomewhat
vulnerableNot vulnerable
Hardly ever Never
Consumer
vulnerability
(socio-demographic
factors)
Very vulnerableSomewhat
vulnerableNot vulnerable
Internet useDaily Weekly Monthly
Consumer Survey 2018
59
621 ADR
Rate of agreement (ldquoStrongly agreerdquo and ldquoAgreerdquo) with Q3 option 4 - Base all respondents (N=28037)
In the European Union the overall level of trust in ADR is 422 In the South East and West this type of trust is in line with the EU27_2019 average while it is higher in the North (462) The highest levels of trust in ADR are found in Malta (617) Finland (589) and Denmark (542) Among the EU countries the lowest levels of trust in ADR are found in Slovenia (289) Bulgaria (297) and Estonia (327) Furthermore Iceland reported the lowest levels of trust in ADR
(263)
Between 2016 and 2018 trust in ADR remained stable in the East while it decreased in the EU27_2019 (-69pp) and the West (-207pp) but increased in the North (+45pp) and South (+55pp) Compared to the previous survey in 2016 this type of trust increased most sharply in Lithuania (+225pp) and decreased most prominently in France (-287pp)
Region
Country
2018
( = sig
diff EU27)
2018-
2016
2016-
2014
2014-
2012
2012-
2011
2011-
2010
2010-
2009
2009-
2008
2008-
2006
EU27_2019 422 -69 +55 +23 -68 +44 +102 -14 -42
EU28 430 -84 +67 +21 -78 +37 +104 -11 -39
North 462 +45 -10 -11 -03 +85 +59 -101 -26
South 436 +55 -27 +78 -84 +16 +119 +19 -26
East 418 -03 -14 +11 +06 +39 +49 +38 +12
West 409 -207 +158 -05 -108 +65 +124 -57 -66
BE 361 -10 -111 -15 -23 +130 +116 -216 -33
BG 297 +09 +18 -55 +68 +65 +66 +45 -
CZ 491 +97 +18 +40 -07 +72 -48 +74 -54
DK 542 +79 +21 +45 -106 +140 +53 -152 +87
DE 402 -248 +266 -66 -112 +50 +148 -57 -100
EE 327 -49 +33 +126 -30 -02 -33 -23 +29
IE 541 -99 +67 +21 -70 -61 +162 +163 -130
EL 476 +41 -01 +35 -64 -05 +61 -15 -30
ES 458 +51 -20 +38 -50 +68 +103 -13 +119
FR 373 -287 +144 +59 -139 +90 +87 -25 -31
HR 366 -23 +28 +47 - - - - -
IT 430 +81 -46 +139 -128 -38 +163 +29 -122
CY 374 +30 -51 -110 -53 -59 +92 +21 -113
LV 359 +20 -21 -78 -04 +235 +17 -92 +92
LT 475 +225 -66 -63 -17 +82 +92 +03 -29
LU 376 -231 +18 +58 -121 +157 -13 +44 +22
HU 453 +144 -192 +33 -40 +14 +60 +59 -28
MT 617 +126 +08 +48 +14 +96 +11 +24 -44
NL 514 +81 -119 +52 -53 +64 +118 -181 -12
AT 521 -90 +142 -07 -96 +23 +155 +36 -79
PL 397 -11 -09 +15 +12 -22 +101 -26 +75
PT 335 -61 +25 -55 +08 +129 -02 +131 -84
RO 493 -113 +70 -20 -02 +131 +07 +129 -
SI 289 -57 +53 -48 +31 -05 -53 -28 +117
SK 328 +03 -184 +95 +103 +66 +33 +41 +00
FI 589 +09 -46 -63 +76 +74 +79 +00 -112
SE 379 +07 +07 -01 +19 +32 +63 -173 -71
IS 263 -35 -76 -63 -61 - - - -
NO 470 -02 -82 +87 -88 - - - -
UK 489 -183 +155 +04 -140 -22 +120 +23 -18
Trust in ADR
Consumer Survey 2018
60
The largest positive reversal is observed in Hungary where between 2016 and 2018 trust in ADR
increased by 144pp whereas between 2014 and 2016 it decreased by 192pp The largest negative change is observed in Germany Between 2016 and 2018 trust in ADR decreased by 248pp following an increase of 266pp between 2014 and 2016
Rate of agreement with Q3 option 4 - Base all EU27_2019 respondents (N=24928)
Rate of agreement with Q3 option 4 - Base all EU27_2019 respondents (N=24928)
The socio-demographic findings show that trust in ADR is associated most closely with consumersrsquo age followed by gender and self-reported financial situation
As far as consumersrsquo age is concerned consumers aged 18-34 years are more likely to trust in ADR
than the remainder of the population In addition those aged 35-54 years are also more likely to trust ADR than those aged 55-64 years while consumers aged 65 years and older have the (relatively) same level of trust as those who are between 35 and 64 years
Regarding gender males tend to be more likely to trust ADR than females
Finally consumers who report their financial situation to be very difficult are less likely to trust ADR than other consumers
441 405
481 421 B 384 A 390 AB
437 AB 440 B 398 A
366 421 A 434 A 437 A
432 A 417 A 421 A
446 A 451 A 488 432 A
430 A 433 A 421 A 413 A
GenderMale Female
Trust in ADR
Blue collar
Student
65+
Education levelLow Medium High
Age18-34 35-54 55-64
Very easy
UrbanisationRural area Small town Large town
Financial situationVery difficult Fairly difficult Fairly easy
Unemployed Seeking a job RetiredEmployment status
Self-employed Manager Other white collar
424 A 426 A 414 A 410 A
407 A 424 A
408 A 434 A 419 A
435 B 385 A 376 AB 325 A 393 AB
432 A 423 A 421 A
417 A 407 A 431 A
Four or more
Trust in ADR
LanguagesOnly native Two
High
Mother tongue
Not official language
in home country
Official language in
home country
Numerical skillsLow Medium
Three
Consumer
vulnerability
(complexity)
Very vulnerableSomewhat
vulnerableNot vulnerable
Hardly ever Never
Consumer
vulnerability
(socio-demographic
factors)
Very vulnerableSomewhat
vulnerableNot vulnerable
Internet useDaily Weekly Monthly
Consumer Survey 2018
61
622 Courts
Rate of agreement (ldquoStrongly agreerdquo and ldquoAgreerdquo) with Q3 option 5 - Base all respondents (N=28037)
In the European Union the overall level of trust in courts is 316 In the South and West this level is in line with the EU27_2019 average while it is lower in the East (301) and North (301) The highest trust in courts is found in Slovenia (542) Denmark (503) and Austria (439) The lowest levels of trust in courts are found in Slovakia (174) Estonia (181) and Sweden (185)
Trust in courts decreased between 2016 and 2018 in the EU27_2019 (-75pp) East (-14pp) and
West (-196pp) while it increased in the North (+31pp) and South (+31pp) Compared to the previous survey trust increased most substantially in Hungary (+111pp) and decreased most prominently in France (-335pp)
Region
Country
2018
( = sig
diff EU27)
2018-
2016
2016-
2014
2014-
2012
2012-
2011
2011-
2010
2010-
2009
2009-
2008
2008-
2006
EU27_2019 316 -75 +55 +02 -23 +63 +88 -69 -19
EU28 327 -85 +62 -00 -19 +49 +103 -75 -22
North 301 +31 -30 -11 +17 +77 +87 -159 -03
South 319 +31 -13 +29 -04 -05 +112 -103 +09
East 301 -14 +04 +03 +23 +96 +03 +05 +45
West 325 -196 +141 -16 -68 +99 +114 -75 -52
BE 259 -21 -150 -18 +02 +146 +97 -212 +12
BG 261 -00 -16 -52 +51 +109 +42 +26 -
CZ 345 +51 +19 -27 +18 +84 -56 +67 +04
DK 503 +67 +25 -08 +09 +118 +107 -273 +116
DE 360 -181 +194 -11 -86 +60 +156 -110 -61
EE 181 -14 +22 +65 -02 -35 +39 -83 +16
IE 434 -110 +70 +33 +16 -36 +92 +93 -49
EL 389 +66 -90 +11 +26 +34 +66 -193 -42
ES 329 +19 +03 -02 -03 +70 +100 -89 +59
FR 239 -335 +183 -36 -80 +159 +80 -16 -52
HR 239 +28 -28 -03 - - - - -
IT 316 +51 -22 +66 -18 -88 +147 -117 +04
CY 303 +22 -34 -115 +100 +134 -10 -30 -216
LV 262 +72 -100 -66 +09 +203 +11 -85 +46
LT 341 +103 +13 -35 -01 +87 +65 -52 -07
LU 371 -134 -22 +30 +13 +132 +42 +120 -79
HU 312 +111 -87 -06 +71 +132 -65 -33 +54
MT 276 +03 -08 +12 +67 +27 +45 -20 -53
NL 425 +70 -49 -22 -02 +93 +72 -133 -27
AT 439 -95 +117 +54 -85 +79 +69 +41 -80
PL 242 -33 -18 +45 -06 +68 +31 -38 +63
PT 219 -67 +53 -33 +41 +100 +22 -08 -87
RO 426 -88 +83 -33 +48 +143 -05 +70 -
SI 542 +33 +373 -125 +165 -48 +23 -76 +55
SK 174 -43 -86 +53 +25 +88 +14 +02 -10
FI 323 +18 -110 +110 -39 +90 +109 -75 -65
SE 185 -07 -23 -73 +64 +27 +98 -206 -47
IS 311 -57 -27 +87 -06 - - - -
NO 387 -07 -84 +77 -17 - - - -
UK 403 -155 +111 -15 +09 -59 +215 -108 -37
Trust in courts
Consumer Survey 2018
62
These prominent changes in Hungary and France are particularly interesting as they are connected
to noticeable reversals In Hungary the increase between 2016 and 2018 (+111pp) follows a strong decrease of 87pp between 2014 and 2016 In France the decrease of 335pp between 2016 and 2018 comes after a strong increase of 183pp between 2014 and 2016
Rate of agreement with Q3 option 5 - Base all EU27_2019 respondents (N=24928)
Rate of agreement with Q3 option 5 - Base all EU27_2019 respondents (N=24928)
The results of the socio-demographic analysis show that consumersrsquo trust in courts is associated most closely with gender followed by age education the self-reported financial situation of consumers and vulnerability of consumers in terms of complexity of offers and terms and conditions
In terms of gender males are more likely to trust courts than females
Trust in courts also tends to be more common for consumers aged 54 years or younger than for consumers aged 55 years or older
In addition consumers with a low or medium level of education are also more likely to trust courts than those with a high level of education
Consumers who report their financial situation to be fairly or very easy are more likely to trust courts than those in a fairly or very difficult situation
Finally consumers who are very or somewhat vulnerable in terms of complexity of offers and terms and conditions are less likely to trust in courts than those who are not vulnerable
342 293
345 B 341 B 295 A 260 A
362 A 333 A 285
271 A 300 A 331 B 338 B
315 A 315 A 320 A
446 A 451 A 488 432 A
335 AB 355 B 342 AB 321 AB
GenderMale Female
Trust in courts
Blue collar
Student
65+
Education levelLow Medium High
Age18-34 35-54 55-64
Very easy
UrbanisationRural area Small town Large town
Financial situationVery difficult Fairly difficult Fairly easy
Unemployed Seeking a job RetiredEmployment status
Self-employed Manager Other white collar
317 A 315 A 323 A 310 A
314 A 317 A
342 A 323 A 309 A
318 A 324 A 294 A 275 A 312 A
329 A 315 A 315 A
286 A 293 A 332
Four or more
Trust in courts
LanguagesOnly native Two
High
Mother tongue
Not official language
in home country
Official language in
home country
Numerical skillsLow Medium
Three
Consumer
vulnerability
(complexity)
Very vulnerableSomewhat
vulnerableNot vulnerable
Hardly ever Never
Consumer
vulnerability
(socio-demographic
factors)
Very vulnerableSomewhat
vulnerableNot vulnerable
Internet useDaily Weekly Monthly
Consumer Survey 2018
63
7 TRUST IN PRODUCT SAFETY
This chapter discusses consumersrsquo perceptions of and trust in product safety which is considered a key driver of consumer confidence
Average proportion of agreement (ldquoStrongly agreerdquo and ldquoAgreerdquo) with Q414 options 1and 2 - Base all
respondents (N=28037)
14 Q4 Thinking about all non-food products currently on the market in (our country) do you think that How strongly do you agree or disagree with each of the following statements In (our country) hellip
1 Essentially all non-food products are safe 2 A small number of non-food products are unsafe
Region
Country
2018
( = sig
diff EU27)
2018-
2016
2016-
2014
2014-
2012
2012-
2011
2011-
2010
2010-
2009
2009-
2008
EU27_2019 679 -73 +93 +15 -02 -21 +79 -28
EU28 697 -79 +94 +12 -06 -14 +68 -28
North 755 +36 -07 +25 -24 +45 +05 -79
South 641 +59 +07 -31 +08 -67 +110 -22
East 696 -05 +57 +16 +11 +09 +114 -103
West 687 -216 +185 +49 -13 -11 +50 +12
BE 666 -81 -56 +69 +20 +43 +47 -188
BG 545 +15 +18 -169 +68 +98 +114 -88
CZ 809 +17 +07 +43 -15 +11 +131 -137
DK 764 +01 +15 +07 -23 +121 -15 -91
DE 741 -182 +194 +89 -25 -51 +94 +32
EE 716 +09 -58 +116 +25 +19 -46 -68
IE 828 -106 +127 -28 -27 +04 +39 +119
EL 566 +35 +02 +108 -39 -77 +91 -79
ES 696 +104 -42 -39 +44 -73 +90 -86
FR 569 -362 +286 +21 -19 +21 -20 -36
HR 672 +48 +17 -02 - - - -
IT 617 +39 +43 -47 -22 -62 +131 +44
CY 497 -34 -57 +32 +09 -67 +83 -67
LV 701 +55 +07 -18 +48 +19 +79 -106
LT 762 +125 -24 +66 +59 +101 +18 -155
LU 813 -75 +85 +09 +84 -141 +43 +05
HU 787 +01 +44 +12 +35 -13 +19 +17
MT 647 +35 -57 -61 -02 +20 +130 -193
NL 819 +31 -30 -43 +25 +57 +83 +143
AT 727 -173 +113 +61 +18 -85 +82 +117
PL 764 -20 +80 +57 +04 -22 +164 -190
PT 622 +07 +17 -46 +77 -84 +98 -23
RO 510 -45 +66 +31 +07 +79 +71 -35
SI 691 +92 +06 -103 +42 -74 +43 -108
SK 724 +69 +84 -62 +13 -122 +95 +49
FI 845 +36 -83 -05 -02 -24 +24 -42
SE 714 +28 +33 +36 -85 +16 -11 -48
IS 743 +53 +01 +34 +27 - - -
NO 839 -02 +16 +10 +01 - - -
UK 819 -123 +106 -10 -33 +28 -10 -11
Trust in product safety
Consumer Survey 2018
64
In the European Union the level of trust in product safety is 679 In the West this level of trust
is in line with the EU27_2019 average while it is lower in the South (641) and higher in the East (696) and North (755)
In this map values above average are coloured in light and dark green and values below average are coloured
in light and dark red
Among EU countries the highest amount of trust in product safety is found in Finland (845) Ireland (828) and the Netherlands (819) The lowest levels of trust in product safety are found
in Cyprus (497) Romania (510) and Bulgaria (545)
Between 2016 and 2018 trust in product safety remained stable in the East while it decreased in the EU27_2019 (-73pp) and the West (-216pp) and increased in the North (+36pp) and South
(+59pp) Compared to the previous survey trust in product safety increased most substantially in Lithuania (+125pp) and decreased most prominently in France (-362pp)
When looking at statistically significant changes in 2018 (vs 2016) and in 2016 (vs 2014) the only positive reversal is found in Finland where between 2016 and 2018 this indicator increased by 36pp whereas between 2014 and 2016 it decreased by 83pp The largest negative reversal is found in
Consumer Survey 2018
65
France where between 2016 and 2018 this indicator decreased by 362pp following an increase of
286pp between 2014 and 2016
Average proportion of agreement with Q4 options 1 and 2 - Base all EU27_2019 respondents (N=24928)
Average proportion of agreement with Q4 options 1 and 2 - Base all EU27_2019 respondents (N=24928)
In terms of socio-demographic variables having trust in product safety is most closely associated with gender followed by internet use consumersrsquo financial situation vulnerability due to socio-demographic factors and numerical skills
Concerning consumersrsquo gender males are more likely to trust in product safety than females
Moreover consumers who use the internet more frequently (ie daily and weekly) have greater
trust in product safety than those who use the internet hardly ever or never Also people that use the internet monthly show greater trust in product safety than those who never use the internet
Consumers who report their financial situation to be fairly or very easy are more likely trust in product
safety is higher than among those who report their situation to be fairly or very difficult
Regarding vulnerability due to socio-demographic factors consumers who are very vulnerable are less likely to trust product safety compared to those who are not or somewhat vulnerable
Finally consumers with high numerical skill levels are more likely to trust in product safety than
those with low and medium numerical skills
710 657
667 A 689 A 684 A 686 A
667 A 679 A 691 A
633 A 661 A 700 B 706 B
685 A 676 A 688 A
446 A 451 A 488 432 A
704 A 683 A 646 A 671 A
GenderMale Female
Trust in product safety
Blue collar
Student
65+
Education levelLow Medium High
Age18-34 35-54 55-64
Very easy
UrbanisationRural area Small town Large town
Financial situationVery difficult Fairly difficult Fairly easy
Unemployed Seeking a job RetiredEmployment status
Self-employed Manager Other white collar
675 A 688 A 680 A 695 A
662 A 683 A
658 A 667 A 695
695 C 688 C 702 BC 595 AB 611 A
632 686 A 696 A
642 A 674 AB 695 B
Four or more
Trust in product safety
LanguagesOnly native Two
High
Mother tongue
Not official language
in home country
Official language in
home country
Numerical skillsLow Medium
Three
Consumer
vulnerability
(complexity)
Very vulnerableSomewhat
vulnerableNot vulnerable
Hardly ever Never
Consumer
vulnerability
(socio-demographic
factors)
Very vulnerableSomewhat
vulnerableNot vulnerable
Internet useDaily Weekly Monthly
Consumer Survey 2018
66
8 TRUST IN ENVIRONMENTAL CLAIMS
This chapter discusses results from the consumer survey when it comes to consumer trust in environmental claims It is broken down into two parts focusing on the perceived reliability of environmental claims and on their perceived impact on consumersrsquo purchasing decisions
Reliability of environmental claims
Average proportion of agreement (ldquoStrongly agreerdquo and ldquoAgreerdquo) with Q335 option 6 - Base all respondents
(N=28037)
35 Q3 How strongly do you agree or disagree with each of the following statements In (our country) hellip -Strongly agree ndashAgree ndash Disagree ndashStrongly disagree ndash DKNA Q36 Most environmental claims about goods or services are reliable
Region
Country
2018
( = sig
diff EU27)
2018-
2016
2016-
2014
EU27_2019 542 -91 +121
EU28 553 -102 +122
North 636 +46 +04
South 551 +46 +14
East 614 +22 +54
West 485 -264 +247
BE 494 -28 -88
BG 533 +74 +31
CZ 551 +53 +29
DK 807 +56 +29
DE 454 -334 +377
EE 620 -02 +25
IE 655 -132 +104
EL 530 +49 +39
ES 562 +27 +04
FR 471 -324 +223
HR 401 +39 -36
IT 544 +70 +22
CY 501 +79 -88
LV 596 -64 +75
LT 652 +143 -42
LU 639 -142 +36
HU 780 +02 +129
MT 622 +115 -72
NL 553 +65 -25
AT 655 -163 +209
PL 682 +40 +44
PT 569 -25 -06
RO 547 -32 +89
SI 494 +10 -09
SK 521 -12 +18
FI 643 +69 -61
SE 538 +26 +22
IS 448 +08 -59
NO 604 -24 +08
UK 631 -180 +130
Trust in environmental claims
Consumer Survey 2018
67
In the European Union the overall level of trust in the reliability of environmental claims is 542
In the South this level is in line with the EU27_2019 average while it is lower in the West (485) and higher in the East (614) and North (636)
In this map values above average are coloured in light and dark green and values below average are coloured
in light and dark red
The highest levels of trust in environmental claims are found in Denmark (807) Hungary (780) and Poland (682) whereas the lowest levels are found in Croatia (401) Germany (454) and
France (471) Furthermore Iceland reported low levels of trust (448)
Between 2016 and 2018 trust in the reliability of environmental claims decreased in the EU27_2019 (-91pp) and the West (-264pp) while it increased in the East (+22pp) North (+46pp) and South (+46pp) Compared to the survey in 2016 this type of trust increased most prominently in Lithuania (+143pp) and decreased most prominently in Germany (-334pp)
When looking at statistically significant changes in 2018 (vs 2016) and in 2016 (vs 2014) the largest positive reversal is found in Malta where between 2016 and 2018 this indicator increased by 115pp whereas between 2014 and 2016 it decreased by 72pp Related to the strongest decrease
Consumer Survey 2018
68
in 2018 (see above) the largest negative reversal is found in Germany where the strong decrease
in 2018 was preceded by an increase of 377pp between 2014 and 2016
Average proportion of agreement (ldquoStrongly agreerdquo and ldquoAgreerdquo) with Q3 option 6 - Base all EU27_2019
respondents (N=24928)
Average proportion of agreement (ldquoStrongly agreerdquo and ldquoAgreerdquo) with Q3 option 6 - Base all EU27_2019
respondents (N=24928)
The socio-demographic findings show that consumersrsquo trust in environmental claims is most closely linked with their mother tongue followed by their financial situation the vulnerability of consumers because of the complexity of offers and the number of languages spoken
Consumers whose mother tongue is an official language of the country or region in which they live are less likely to trust environmental claims than those whose mother tongue is another language
Consumers who report their financial situation to be very easy and fairly easy report higher trust in environmental claims than those who report their situation to be fairly difficult and very difficult
Consumers who are very vulnerable in terms of the complexity of offers and terms and conditions are less likely to trust environmental claims than those who are somewhat vulnerable and those who are not vulnerable
Finally consumers who speak only their native language and those who speak two languages are more likely to trust environmental claims than those who speak four or more languages
553 A 535 A
580 B 551 AB 521 A 508 A
574 B 546 AB 532 A
474 A 511 A 574 B 555 B
549 A 544 A 537 A
446 A 451 A 488 432 A
589 A 557 A 513 A 555 A
GenderMale Female
Trust in environmental claims
Blue collar
Student
65+
Education levelLow Medium High
Age18-34 35-54 55-64
Very easy
UrbanisationRural area Small town Large town
Financial situationVery difficult Fairly difficult Fairly easy
Unemployed Seeking a job RetiredEmployment status
Self-employed Manager Other white collar
565 C 539 BC 525 AB 488 A
601 540
539 A 544 A 544 A
559 C 472 A 589 BC 498 ABC 497 AB
524 A 528 A 557 A
496 538 A 556 A
Four or more
Trust in environmental claims
LanguagesOnly native Two
High
Mother tongue
Not official language
in home country
Official language in
home country
Numerical skillsLow Medium
Three
Consumer
vulnerability
(complexity)
Very vulnerableSomewhat
vulnerableNot vulnerable
Hardly ever Never
Consumer
vulnerability
(socio-demographic
factors)
Very vulnerableSomewhat
vulnerableNot vulnerable
Internet useDaily Weekly Monthly
Consumer Survey 2018
69
The influence of environmental claims on purchasing decisions
Proportion of agreement with Q536 options 1 2 and 3 - Base all respondents (N=28037)
In the European Union 552 of consumers report that claims about the environmental impact of goods and services have influenced their purchasing decisions Compared to the EU27_2019 average higher levels are found in the South (593) and East (573) whereas lower levels are observed in the North (514) and West (519) The highest proportion of consumers who report that
environmental claims have influenced their purchasing decisions is found in Croatia (727) Ireland
(719) and Greece (626) In addition high levels are found in the UK (677) and Norway (634) The lowest levels are observed in Bulgaria (322) Cyprus (328) and Estonia (372)
36 Q5 Considering everything you have bought during the last two weeks did the environmental impact of any goods or services also influence your choice 1 Yes for all or most goods or services you bought 2 Yes but only for some 3 Yes but only for one or two
Region
Country
2018
( = sig
diff EU27)
2018-
2016
2016-
2014
2014-
2012
2012-
2011
2011-
2010
EU27_2019 552 +54 -69 +147 +118 -32
EU28 568 +73 -60 +146 +118 -33
North 514 +21 +14 +49 +94 -24
South 593 +113 -111 +175 +133 -97
East 573 -30 +39 +132 +142 +30
West 519 +61 -107 +149 +97 -18
BE 506 -71 -28 +162 +99 -110
BG 322 -64 -69 +120 +157 +25
CZ 589 +60 +20 +111 +168 -59
DK 513 +43 -06 +35 +85 -76
DE 479 +15 -67 +165 +87 +16
EE 372 +03 +25 +91 +45 +43
IE 719 +225 -54 +84 +92 +28
EL 626 +190 -208 +90 +83 -82
ES 592 +123 -126 +267 +99 -97
FR 544 +144 -189 +142 +109 -54
HR 727 +118 -57 +189 - -
IT 611 +119 -116 +155 +157 -86
CY 328 +63 -152 -62 +114 -22
LV 516 -21 +66 +96 +115 +26
LT 490 +179 +28 +06 +90 +14
LU 537 +58 -217 +222 +104 +13
HU 589 -34 +79 +94 +63 -18
MT 527 +44 +28 -04 +161 -173
NL 554 +05 -36 +107 +75 +08
AT 564 +83 -138 +135 +154 -77
PL 582 -39 +53 +119 +155 +08
PT 478 -34 +85 -16 +197 -158
RO 611 -96 +53 +211 +126 +166
SI 550 -62 +118 +34 +77 -87
SK 538 +46 +41 +28 +176 -36
FI 580 +06 +110 +89 +42 -34
SE 504 -22 -46 +35 +133 -35
IS 559 +92 +07 +55 +119 -
NO 634 +105 -61 +238 +109 -
UK 677 +206 -01 +139 +119 -43
Influence of environmental claims when choosing goodsservices
Consumer Survey 2018
70
Consumersrsquo perception of the impact of environmental claims on purchasing decisions increased
between 2016 and 2018 in the EU27_2019 (+54pp) the North (+21pp) West (+61pp) and South (+113pp) while it decreased in the East (-30pp) Compared to the survey in 2016 the perceived impact of environmental claims on purchasing decisions increased most sharply in Ireland (+225pp) and decreased most prominently in Romania (-96pp)
The largest positive reversal is observed in Greece where between 2016 and 2018 trust in environmental claims on purchasing decisions increased by 190pp whereas between 2014 and 2016 it decreased by 208pp The largest negative reversal is observed in Slovenia where between 2016
and 2018 the perceived impact of environmental claims on purchasing decisions decreased by 62pp following an increase of 118pp between 2014 and 2016
Proportion of agreement with Q5 options 1 2 and 3 - Base all EU27_2019 respondents (N= 24928)
Proportion of agreement with Q5 options 1 2 and 3 - Base all EU27_2019 respondents (N= 24928)
The degree to which claims about the environmental impact of goods and services influence consumers purchasing decisions also depends on socio-demographic variables and other
characteristics
The results show that gender has the closest link with the proportion of consumers who report that
their decisions are affected by claims about environmental impact female consumers more often report that their purchase decisions are influenced than males
Vulnerability in terms of the complexity of offers and terms and conditions is also associated with the reported influence of environmental claims on purchase decisions In particular consumers who are not vulnerable report the influence by environmental claims on their purchase decisions less often than somewhat and very vulnerable consumers
508 594
509 557 A 586 A 566 A
515 A 546 A 571
572 A 558 A 555 A 532 A
545 A 557 A 554 A
446 A 451 A 488 432 A
558 A 553 A 525 A 544 A
GenderMale Female
Influence of environmental claims when choosing goodsservices
Blue collar
Student
65+
Education levelLow Medium High
Age18-34 35-54 55-64
Very easy
UrbanisationRural area Small town Large town
Financial situationVery difficult Fairly difficult Fairly easy
Unemployed Seeking a job RetiredEmployment status
Self-employed Manager Other white collar
527 A 559 B 590 C 561 ABC
524 A 554 A
546 A 541 A 560 A
567 B 580 B 458 A 510 AB 451 A
542 AB 577 B 544 A
597 A 596 A 529
Four or more
Influence of environmental claims when choosing goodsservices
LanguagesOnly native Two
High
Mother tongue
Not official language
in home country
Official language in
home country
Numerical skillsLow Medium
Three
Consumer
vulnerability
(complexity)
Very vulnerableSomewhat
vulnerableNot vulnerable
Hardly ever Never
Consumer
vulnerability
(socio-demographic
factors)
Very vulnerableSomewhat
vulnerableNot vulnerable
Internet useDaily Weekly Monthly
Consumer Survey 2018
71
Age is also associated with this indicator Consumers aged 18-34 reportedly are less likely to have
their purchase decisions be influenced by claims about environmental impact of goods and services than consumers aged 35 and older
Finally highly educated consumers are also more likely to report the influence of environmental claims on their purchase decisions than those with low or medium education
Consumer Survey 2018
72
9 CONSUMER CONFIDENCE IN ONLINE PURCHASES
Low consumer confidence in online transactions is considered a significant barrier to the continued growth of online purchases within the Digital Single Market This chapter reports findings on consumersrsquo overall confidence in domestic and cross-border online purchases
Domestic online purchases
Average proportion of agreement (ldquoStrongly agreerdquo and ldquoAgreerdquo) with Q1717 option 1 - Base all respondents
(N=28037)
17 Q17 How strongly do you agree or disagree with each of the following statements -Strongly agree ndashAgree ndash Disagree ndashStrongly disagree ndash DKNA Q171 You feel confident purchasing goods or services via the internet from retailers or service providers in (our country)
Region
Country
2018
( = sig
diff EU27)
2018-
2016
2016-
2014
2014-
2012
EU27_2019 694 +02 +129 +16
EU28 717 +02 +124 +20
North 772 +56 +65 +23
South 648 +76 +104 +36
East 646 +27 +99 -01
West 738 -73 +171 +10
BE 706 -25 +119 +78
BG 466 +30 +148 -106
CZ 787 +52 +67 +02
DK 850 +17 +56 +01
DE 748 -80 +204 -04
EE 656 +80 +51 +160
IE 848 +04 +113 -05
EL 541 +65 +35 +93
ES 652 +56 +67 +27
FR 696 -106 +161 -01
HR 483 +14 +172 +07
IT 703 +99 +160 +41
CY 499 +70 -15 +96
LV 558 +65 +63 +13
LT 655 +182 +23 +05
LU 808 -12 +110 +29
HU 714 +102 +150 +16
MT 642 +132 +70 +92
NL 806 +04 +99 +44
AT 810 -13 +161 +71
PL 664 -03 +93 -33
PT 434 +42 +20 -18
RO 587 +24 +71 +90
SI 628 +14 +119 -54
SK 713 +72 +80 -17
FI 754 +56 +64 -03
SE 831 +31 +86 +42
IS 793 +14 +69 +93
NO 844 -25 +79 +51
UK 875 +07 +88 +50
Confidence in domestic online shopping
Consumer Survey 2018
73
In the European Union the confidence in domestic online purchases is 694 Compared to the
EU27_2019 average this level is higher in the West (738) and the North (772) and lower in the South (648) and East (646) In the EU27 the highest levels of confidence in domestic online purchases are found in Denmark (850) Ireland (848) and Sweden (831) Furthermore the levels are also high in the UK (875) and Norway (844) The lowest levels of confidence in domestic online purchases are found in Portugal (434) Bulgaria (466) and Croatia (483)
There is no difference between consumersrsquo confidence in domestic online purchases between 2016
and 2018 in the EU27_2019 while this level increased in the East (+27pp) North (+56pp) and South (+76pp) and decreased in the West (-73pp) Compared to the survey in 2016 the level of confidence in domestic online purchases increased most prominently in Lithuania (+182pp) and decreased most prominently in France (-106pp)
When looking at statistically significant changes in 2018 (vs 2016) and in 2016 (vs 2014) no positive reversal is found The largest negative reversal is found in Germany where between 2016
and 2018 this indicator decreased by 80pp following an increase of 204pp in the previous period
Average proportion of agreement (ldquoStrongly agreerdquo and ldquoAgreerdquo) with Q17 option 1 - Base all EU27_2019
respondents (N=24928)
Average proportion of agreement (ldquoStrongly agreerdquo and ldquoAgreerdquo) with Q17 option 1 - Base all EU27_2019
respondents (N=24928)
With regard to socio-demographic variables and other characteristics confidence in domestic online purchases is most closely associated with internet use followed by age financial situation education and numerical skills
710 A 691 A
778 732 660 605
669 A 686 A 728
607 676 722 A 747 A
714 B 699 AB 684 A
446 A 451 A 488 432 A
735 BCD 672 AB 683 ABC 663 A
GenderMale Female
Confidence in domestic online shopping
Blue collar
Student
65+
Education levelLow Medium High
Age18-34 35-54 55-64
Very easy
UrbanisationRural area Small town Large town
Financial situationVery difficult Fairly difficult Fairly easy
Unemployed Seeking a job RetiredEmployment status
Self-employed Manager Other white collar
681 A 720 B 700 AB 698 AB
674 A 701 A
659 693 A 712 A
761 625 C 546 BC 513 AB 430 A
684 A 682 A 713
680 A 704 A 705 A
Four or more
Confidence in domestic online shopping
LanguagesOnly native Two
High
Mother tongue
Not official language
in home country
Official language in
home country
Numerical skillsLow Medium
Three
Consumer
vulnerability
(complexity)
Very vulnerableSomewhat
vulnerableNot vulnerable
Hardly ever Never
Consumer
vulnerability
(socio-demographic
factors)
Very vulnerableSomewhat
vulnerableNot vulnerable
Internet useDaily Weekly Monthly
Consumer Survey 2018
74
Consumers who use the internet daily are the most likely to have confidence in domestic online
shopping followed by those who use it weekly and monthly who in turn are more likely to have confidence in domestic online shopping than those who never use the internet
Consumers aged 18-34 years are most likely to have confidence in domestic online shopping Moreover consumers aged 35-54 years are more likely to have confidence in domestic online shopping than those aged 55-64 years who in turn are more likely than those aged 65+ years
Moreover the proportion of consumers that is confident in domestic online shopping is higher among those in a fairly easy or very easy financial situation than among consumers with a fairly difficult and
very difficult financial situation
Regarding peoplesrsquo education those who are highly educated are more likely to have confidence in domestic online purchases than those with a low or medium level of education
Finally consumers with a high and medium numerical skill level are more likely to have confidence than those with low numerical skills
Consumer Survey 2018
75
Cross-border online purchases
Average proportion of agreement (ldquoStrongly agreerdquo and ldquoAgreerdquo) with Q1718 option 2 - Base all respondents
(N=28037)
In the European Union the overall level of confidence in cross-border online purchases is 465
Compared to the EU27_2019 average this level is higher in the South (499) and North (528) whereas it is lower in the West (444) and East (445)
18 Q17 How strongly do you agree or disagree with each of the following statements -Strongly agree ndashAgree ndash Disagree ndashStrongly disagree ndash DKNA Q172 You feel confident purchasing goods or services via the internet from retailers or service providers in another EU country
Region
Country
2018
( = sig
diff EU27)
2018-
2016
2016-
2014
2014-
2012
EU27_2019 465 -79 +197 +32
EU28 483 -89 +211 +28
North 528 +74 +54 +10
South 499 +72 +65 +49
East 445 +07 +85 +43
West 444 -251 +368 +15
BE 492 -32 +91 +62
BG 310 -40 +72 -137
CZ 501 +45 +68 +47
DK 536 +14 +50 -31
DE 416 -318 +445 +33
EE 476 +58 +56 +119
IE 733 -26 +172 -40
EL 379 +55 -33 +48
ES 511 +49 +34 +44
FR 409 -319 +408 -15
HR 460 +49 +160 -01
IT 537 +100 +111 +65
CY 428 +34 -22 +10
LV 426 +79 +28 -09
LT 509 +189 +05 +00
LU 734 -17 +203 +18
HU 604 +62 +273 +34
MT 653 +97 +37 +09
NL 504 +67 +84 +25
AT 631 -116 +333 -01
PL 418 -14 +52 +86
PT 343 +21 +35 -14
RO 399 -11 +50 +55
SI 480 -12 +111 +17
SK 554 +73 +86 -02
FI 515 +92 +38 -37
SE 565 +63 +86 +53
IS 734 +59 +85 +120
NO 641 -20 +98 +34
UK 605 -159 +310 -00
Confidence in cross-border online shopping
Consumer Survey 2018
76
Between 2016 and 2018 consumer confidence in cross-border online purchases decreased in the
EU27_2019 (-79pp) However this drop is entirely due to the decrease observed in the West (-251pp) while the other EU regions saw either an increase (South +72pp and North +74pp) or a stable situation (East)
In this map values above average are coloured in light and dark green and values below average are coloured in light and dark red
Among the EU countries the highest confidence in cross-border online purchases is found in Luxembourg (734) Ireland (733) and Malta (653) This level is high in Iceland as well (734) The lowest levels of confidence in cross-border online purchases are found in Bulgaria (310) Portugal (343) and Greece (379) Compared to the 2016 survey this type of confidence increased most steeply in Lithuania (+189pp) It decreased most prominently in France (-319pp)
When looking at statistically significant changes in 2018 (vs 2016) and in 2016 (vs 2014) no statistically significant positive reversal is found The largest negative reversal is found in Germany where between 2016 and 2018 this indicator decreased by 318pp following an increase of 445pp between 2014 and 2016
Consumer Survey 2018
77
Average proportion of agreement with Q17 (ldquoStrongly agreerdquo and ldquoAgreerdquo) option 2 - Base all EU27_2019 respondents (N=24928)
Average proportion of agreement with Q17 (ldquoStrongly agreerdquo and ldquoAgreerdquo) option 2 ndash Base all EU27_2019
respondents (N=24928)
Regarding socio-demographic variables and other characteristics confidence in cross-border online purchases is most closely associated with age The characteristics showing the next closest links are internet use gender education and language
Consumers aged 18-34 years report confidence in cross-border online purchases more often than other age groups Moreover consumers aged 35-54 years report confidence more often than those aged 55-64 years who in turn are more likely to have confidence in cross-border online shopping than those aged 65+ years
In addition consumers who use the internet daily report confidence in cross-border online purchases more often than those using the internet weekly or less often In addition a higher proportion of those who use the internet weekly reports being confident than those who never use the internet
Regarding consumersrsquo gender a proportion of males that report confidence in cross-border online purchases is higher than the proportion of females
Highly educated people are also more likely to be confident in such purchases than those with a medium level of education who in turn report confidence more often than those with a low level of
education
Finally confidence in such purchases is more common among consumers who speak at least three languages This proportion is also higher for consumers that speak two languages than for consumers that speak only their native language
510 433
578 491 422 318
416 456 499
404 A 448 A 485 B 504 B
469 A 472 A 470 A
446 A 451 A 488 432 A
551 D 478 ABC 525 CD 434 AB
GenderMale Female
Confidence in cross-border online shopping
Blue collar
Student
65+
Education levelLow Medium High
Age18-34 35-54 55-64
Very easy
UrbanisationRural area Small town Large town
Financial situationVery difficult Fairly difficult Fairly easy
Unemployed Seeking a job RetiredEmployment status
Self-employed Manager Other white collar
429 477 522 A 521 A
430 A 473 A
454 AB 449 A 484 B
505 401 B 337 AB 325 AB 256 A
435 A 440 A 494
411 461 486
Four or more
Confidence in cross-border online shopping
LanguagesOnly native Two
High
Mother tongue
Not official language
in home country
Official language in
home country
Numerical skillsLow Medium
Three
Consumer
vulnerability
(complexity)
Very vulnerableSomewhat
vulnerableNot vulnerable
Hardly ever Never
Consumer
vulnerability
(socio-demographic
factors)
Very vulnerableSomewhat
vulnerableNot vulnerable
Internet useDaily Weekly Monthly
Consumer Survey 2018
78
10 UNFAIR COMMERCIAL PRACTICES
This chapter reports on consumer experiences with encountering unfairillicit commercial practices domestically or cross-border over the past 12 months As in the previous wave the survey presented concrete examples of unfair commercial practices to make them easily recognisable All examples of practices surveyed both unfair and illicit (banned under EU legislation) fall within the scope of the
Unfair Commercial Practices Directive19
Unfair commercial practices from domestic retailers
1011 Exposure to UCPs from domestic retailers
In the European Union the overall level of exposure to unfair commercial practices (UCPs) from domestic retailers is 227 This level is higher in the North (235) East (275) and South (283) whereas it is lower in the West (164)
19 httpeur-lexeuropaeuLexUriServLexUriServdouri=OJL200514900220039ENPDF
Consumer Survey 2018
79
Average incidence of the UCPs mentioned in Q1320 from domestic retailers (answer 1) - Base all respondents
(N=28037)
20 Q13 I will read you some statements about unfair commercial practices After each one please tell me whether you have experienced it during the last 12 monthshellip -Yes with retailers or services providers
located in (our country) -Yes with retailers or services providers located in another EU country -Yes but you donrsquot know in which country the retailers or services providers were located ndashNo ndashDKNA 1 You have been informed you won a lottery you did not know about but you were asked to pay some money in order to collect the prize 2 You have felt pressured by persistent sales calls or messages urging you to buy something or sign a contract 3 You have been offered a product advertised as free of charge which actually entailed charges 4 You have come across advertisements stating that the product was only available for a very limited period of time but you later realised that it was not the case 5 You have come across other unfair commercial practices
Region
Country
2018
( = sig
diff EU27)
2018-
2016
2016-
2014
EU27_2019 227 +47 -57
EU28 224 +61 -69
North 235 -18 +13
South 283 +14 -08
East 275 +02 -40
West 164 +103 -109
BE 173 -10 +19
BG 242 -23 +01
CZ 257 +16 -40
DK 204 -01 +01
DE 156 +113 -89
EE 244 -07 +54
IE 164 +128 -123
EL 359 +28 +18
ES 314 -22 -04
FR 185 +141 -188
HR 358 -49 +33
IT 262 +42 -20
CY 152 -24 -42
LV 267 -16 +18
LT 211 -01 -21
LU 68 +31 -41
HU 255 +40 -87
MT 150 -54 +54
NL 141 -16 -06
AT 117 +85 -86
PL 313 -08 -44
PT 209 +02 +08
RO 215 +15 -53
SI 197 -36 +41
SK 301 +03 -21
FI 256 -41 +38
SE 241 -22 +09
IS 112 -10 +10
NO 197 -07 +07
UK 202 +163 -158
Exposure to unfair commercial practices
from domestic retailers
Consumer Survey 2018
80
In the European Union the overall level of exposure to UCPs from domestic retailers is 227 This level is higher in the North (235) East (275) and South (283) whereas it is lower in the West (164)
In this map values below average are coloured in light and dark green and values above average are coloured
in light and dark red
The highest exposure to UCPs from domestic retailers is found in Greece (359) Croatia (358) and Spain (314) Among the EU countries the lowest levels of exposure to UCPs from domestic retailers are found in Luxembourg (68) Austria (117) and the Netherlands (141) Finally
the level of exposure is also low in Iceland (112)
Between 2016 and 2018 exposure to UCPs from domestic retailers remained stable in the East while it increased in the EU27_2019 (+47pp) the South (+14pp) and West (+103pp) and decreased in the North (-18pp) Among the EU Member States this type of exposure increased most sharply in France (+141 (reflecting a higher exposure to unfair commercial practices from domestic
Consumer Survey 2018
81
retailers) whereas between 2014 and 2016 it decreased by 188pp (ie negative reversal37)
Considering all surveyed countries the UK shows an even stronger increase between 2016 and 2018 (+163) after a noticeable decrease between 2014 and 2016 (-158) Exposure to unfair commercial practices from domestic retailers decreased most prominently in Malta (-54pp) whereas between 2014 and 2016 it increased by 54pp
Average incidence of the UCPs mentioned in Q13 from domestic retailers (answer 1) - Base all EU27_2019
respondents (N=24928)
Average incidence of the UCPs mentioned in Q13 from domestic retailers (answer 1) - Base all EU27_2019
respondents (N=24928)
With regard to socio-demographic variables and other characteristics exposure to UCPs from domestic retailers is associated most closely to consumer vulnerability due to socio-demographic
factors The characteristics showing the next closest links are education consumersrsquo financial situation vulnerability due to the complexity of offers and terms and conditions and internet use
Consumers who are very or somewhat vulnerable in terms of socio-demographic factors are more likely to be exposed to UCPs from domestic retailers than those who are not vulnerable
Regarding consumersrsquo education those with a medium or high level of education are also more likely to experience UCPs from domestic retailers than those with a low level of education
37 For negative indicators such as exposure to unfair commercial practices from domestic retailers the labels for positive and negative reversals are switched to account for the negative valence of the indicator where an increase reflects a change towards the negative
233 A 225 A
224 A 229 AB 243 B 220 A
196 231 A 236 A
263 238 222 A 217 A
229 A 231 A 226 A
446 A 451 A 488 432 A
199 A 227 A 216 A 231 A
GenderMale Female
Exposure to unfair commercial practices from domestic retailers
Blue collar
Student
65+
Education levelLow Medium High
Age18-34 35-54 55-64
Very easy
UrbanisationRural area Small town Large town
Financial situationVery difficult Fairly difficult Fairly easy
Unemployed Seeking a job RetiredEmployment status
Self-employed Manager Other white collar
213 234 A 246 A 244 A
249 A 228 A
228 A 229 A 229 A
242 201 B 195 AB 198 AB 173 A
253 A 252 A 210
258 A 248 A 217
Four or more
Exposure to unfair commercial practices from domestic retailers
LanguagesOnly native Two
High
Mother tongue
Not official language
in home country
Official language in
home country
Numerical skillsLow Medium
Three
Consumer
vulnerability
(complexity)
Very vulnerableSomewhat
vulnerableNot vulnerable
Hardly ever Never
Consumer
vulnerability
(socio-demographic
factors)
Very vulnerableSomewhat
vulnerableNot vulnerable
Internet useDaily Weekly Monthly
Consumer Survey 2018
82
Consumers who consider their financial situation to be very difficult are most likely to report exposure
to such unfair practices In addition consumers with a fairly difficult financial situation report greater exposure than those who consider their situation to be fairly easy or very easy
Furthermore consumers who are very or somewhat vulnerable in terms of the complexity of offers and terms and conditions are also more likely to be exposed to UCPs from domestic retailers than those who are not vulnerable
Finally daily internet users are most likely to be exposed to UCPs from domestic retailers Weekly internet users are also more likely to be exposed to these unfair practices compared to consumers
who never use the internet
1012 Types of UCPs from domestic retailers
Across all types of unfair commercial practices from domestic retailers studied by the current survey persistent sales calls (374) are the most common followed by false limited offers (248) and false free products (199) A noticeable share of consumers also experiences other UCPrsquos (173)
and lottery scams (143)
Consumer Survey 2018
83
Q13 options 1 2 and 3 (answer 1-domestic retailers) Base all respondents (N=28037)
In the European Union the overall level of exposure to lottery scams is 143 In the South and West this level is in line with the EU27_2019 average while it is lower in the North (118) and higher in the East (175) The highest exposure to lottery scams is found in Greece (292) Poland
(260) and Slovakia (199) In the same area the lowest levels of exposure to lottery scams are found in Portugal (38) Cyprus (43) and Luxembourg (44) Moreover this level is lowest in
Iceland (07)
Between 2016 and 2018 exposure to lottery scams increased in the EU27_2019 (+40pp) the South (+19pp) and West (+79pp) while it remained stable in the North and East Compared to the 2016 survey this type of exposure increased most steeply in Germany (+108pp) and decreased most prominently in Latvia (-93pp) When looking at statistically significant changes in 2018 (vs 2016)
and in 2016 (vs 2014) the largest negative reversal is found in France where between 2016 and 2018 this indicator increased by 85pp (reflecting a higher incidence of consumers exposed to lottery scams) whereas between 2014 and 2016 it decreased by 134pp Conversely the largest positive reversal is found in Malta where between 2016 and 2018 this indicator decreased by 69pp
2018
( = sig
diff EU27)
2018-
2016
2016-
2014
2018
( = sig
diff EU27)
2018-
2016
2016-
2014
2018
( = sig
diff EU27)
2018-
2016
2016-
2014
EU27_2019 143 +40 -35 374 +57 -63 199 +35 -57
EU28 137 +43 -36 357 +73 -83 194 +47 -69
North 118 -04 +16 357 -35 +21 238 -34 +16
South 136 +19 +08 585 +38 +09 261 -02 -19
East 175 +07 -51 385 -20 -05 244 +19 -54
West 134 +79 -64 225 +126 -154 128 +80 -95
BE 78 -14 +09 308 -25 +93 163 -11 +09
BG 91 +06 -07 351 -11 +45 240 -15 -02
CZ 163 +19 -53 396 +19 -21 284 +50 -27
DK 142 +44 -43 325 -34 +50 170 -41 +29
DE 154 +108 -36 190 +111 -115 104 +75 -60
EE 64 -29 +62 526 -47 +138 169 +28 +17
IE 93 +65 -05 184 +130 -128 127 +104 -94
EL 292 +28 +44 583 +32 +29 301 +23 +39
ES 119 -29 +16 564 +40 -08 346 -38 -26
FR 128 +85 -134 276 +213 -294 166 +133 -185
HR 141 -34 +06 486 -80 +36 419 -109 +51
IT 141 +62 -06 628 +40 +15 209 +22 -29
CY 43 -32 -11 237 -30 -42 120 -27 -29
LV 93 -93 +60 476 -55 +38 195 +05 +01
LT 91 -15 -39 363 -25 -74 150 -11 +13
LU 44 +13 -05 56 -03 -09 76 +55 -35
HU 61 +18 -62 303 -18 -30 261 +47 -128
MT 83 -69 +93 230 -100 +21 158 -23 +68
NL 137 -09 -10 218 -08 -04 121 -26 -22
AT 80 +50 -33 131 +78 -115 71 +49 -50
PL 260 +20 -43 470 -59 -23 234 +27 -62
PT 38 -19 +08 469 +39 +43 162 -11 -00
RO 111 -16 -92 238 +38 -04 185 +21 -85
SI 123 +03 -16 303 -121 +163 106 -08 +19
SK 199 -18 -61 438 +24 +08 345 +09 +19
FI 115 -40 +64 323 -48 +64 341 -104 +59
SE 124 +15 +25 346 -25 -10 265 -14 -13
IS 07 -08 +10 144 -11 -34 113 +11 +02
NO 109 +22 +26 229 -04 -01 249 -51 +05
UK 98 +63 -42 243 +187 -231 158 +133 -152
Types of unfair commercial practices from domestic retailers
Region
Country
Lottery scams Persistent sales calls False free products
Consumer Survey 2018
84
(reflecting a lower incidence of consumers exposed to lottery scams) following an increase of 93pp
between 2014 and 2016
The overall level of exposure to persistent sales calls is 374 in the European Union In the East this level is in line with the EU27_2019 average while it is lower in the West (225) and North (357) and higher in the South (585) The highest exposure to persistent sales calls is found in Italy (628) Greece (583) and Spain (564) Among the EU countries the lowest levels of exposure to persistent sales calls are found in Luxembourg (56) Austria (131) and Ireland (184) Likewise this level is also low in Iceland (144)
Exposure to persistent sales calls increased in the EU27_2019 (+57pp) the South (+38pp) and West (+126pp) whereas decreases are found in the East (-20pp) and North (-35pp) Compared to the survey in 2016 this type of exposure increased most prominently in France (+213pp) This is also linked to the largest negative reversal where the increase between 2016 and 2018 (reflecting a greater incidence of consumers exposed to such calls) follows a decrease of 294pp between 2014 and 2016 Conversely the most prominent decrease is found in Slovenia (-121pp) which is also
linked to the largest positive reversal The indicator decreased between 2016 and 2018 (reflecting a lower incidence of consumers exposed to such calls) whereas between 2014 and 2016 it increased
by 163pp
The proportion of respondents exposed to false free products in the European Union is 199 It is higher in the North (238) East (244) and South (261) whereas it is lower in the West (128) The highest proportion of respondents exposed to false free products is observed in Croatia (419) Spain (346) and Slovakia (345) The lowest levels of exposure to false free products
are found in Austria (71) Luxembourg (76) and Germany (104)
Compared to 2016 exposure to false free products remained stable in the South while it increased in the EU27_2019 (+35pp) the East (+19pp) and West (+80pp) and decreased in the North (-34pp) Similar to the share of consumers having received persistent sales calls the sharpest increase in exposure to false free products is also found in France (+133pp) which is again linked to the largest negative reversal The increase between 2016 and 2018 (reflecting greater exposure to false free products) was preceded by a decrease of 185pp between 2014 and 2016 The proportion
of respondents exposed to false free products decreased most prominently in Croatia (-109pp) The largest positive reversal is found in Finland where between 2016 and 2018 this indicator decreased by 104pp (reflecting less exposure to false free products) whereas between 2014 and 2016 it increased by 59pp
Consumer Survey 2018
85
Q13 options 1-3 (answer 1-domestic retailers) - Base all EU27_2019 respondents (N=24928)
Male 140 A 361 207 A
Female 147 A 392 195 A
18-34 123 A 354 A 215 A
35-54 139 A 379 AB 209 A
55-64 175 B 388 B 199 A
65+ 148 AB 392 AB 167
Low 126 A 314 186 A
Medium 150 A 377 A 199 A
High 140 A 395 A 206 A
Very difficult 179 B 406 AB 232 B
Fairly difficult 136 A 399 B 207 AB
Fairly easy 140 A 373 A 198 AB
Very easy 153 AB 338 180 A
Rural area 146 A 374 AB 203 A
Small town 147 A 390 B 203 A
Large town 136 A 362 A 195 A
Self-employed 185 B 409 CD 228 CD
Manager 148 AB 432 D 237 D
Other white collar 141 A 364 AB 175 AB
Blue collar 127 A 383 BC 194 BC
Student 145 AB 318 A 152 A
Unemployed 146 AB 357 ABC 229 CD
Seeking a job 138 AB 372 ABCD 219 BCD
Retired 137 A 377 ABC 219 CD
Age groups
Types of unfair commercial practices from
domestic retailers
Lottery scams Persistent sales
calls
False free
products
Gender
Education
Financial Situation
Urbanisation
Employment status
Consumer Survey 2018
86
Q13 options 1-3 (answer 1-domestic retailers) - Base all EU27_2019 respondents (N=24928)
With regard to socio-demographic variables and other characteristics the chance of exposure to lottery scams from domestic retailers is most closely associated with vulnerability due to socio-demographic factors followed by age vulnerability due to the complexity of offers and terms and conditions and employment status
Consumers who are very or somewhat vulnerable in terms of socio-demographic factors are more likely to receive lottery scams from domestic retailers than those who are not vulnerable
Regarding age consumers aged 55-64 reported more exposure to lottery scams from domestic retailers compared to those aged 54 and younger
Consumers who are very vulnerable due to the complexity of offers and terms and conditions are more likely to report receiving lottery scams than consumers who are not vulnerable
As far as consumersrsquo employment status is concerned self-employed consumers are the most likely
to experience lottery scams from domestic retailers and more so than other white collars blue collar workers and retired consumers
In terms of the likelihood of receiving persistent sales calls from domestic retailers this indicator is associated most closely with education Other characteristics with close links are consumer
Only native 137 A 366 A 181
Two 148 A 378 AB 211 A
Three 150 A 399 B 210 A
Four or more 134 A 377 AB 223 A
Not official
language in home
country
170 A 370 A 251
Official language
in home country142 A 377 A 198
Low 141 AB 366 A 227 B
Medium 155 B 366 A 207 AB
High 137 A 385 A 193 A
Daily 153 B 393 B 213 B
Weekly 126 A 347 A 160 A
Monthly 123 AB 291 A 195 AB
Hardly ever 137 AB 333 AB 169 AB
Never 101 A 315 A 151 A
Very vulnerable 161 A 411 A 213 A
Somewhat
vulnerable161 A 393 A 232 A
Not vulnerable 130 359 181
Very vulnerable 167 B 419 A 234 B
Somewhat
vulnerable150 AB 423 A 204 AB
Not vulnerable 136 A 354 195 A
Types of unfair commercial practices from
domestic retailers
Consumer vulnerability
(socio-demographic
factors)
Consumer vulnerability
(complexity)
Persistent sales
calls
False free
products
Languages
Mother Tongue
Numerical skills
Internet use
Lottery scams
Consumer Survey 2018
87
vulnerability due to the complexity of offers and terms and conditions financial situation gender
and vulnerability due to socio-demographic factors
Regarding consumersrsquo level of education consumers with a high- or medium level of education are more likely to receive persistent sales calls from retailers or service providers in their own country than those with a low education level
Consumers who are very or somewhat vulnerable in terms of the complexity of offers and terms and conditions are also more likely to receive such calls than those who are not vulnerable
Furthermore regarding consumersrsquo financial status a better financial situation is linked with less
exposure to persistent sales calls Consumers with a very easy financial situation are less likely to experience such problems than all other consumers Consumers with a fairly easy financial situation are also less likely to experience this type of UCP than consumers with a fairly difficult financial situation
Concerning gender there is a higher proportion of female consumers that received persistent sales calls from domestic retailers than male consumers
Finally consumers who are very or somewhat vulnerable in terms of sociodemographic factors are also more likely to report receiving such calls than those who are not vulnerable
Greater exposure to false offers of free products from domestic retailers is associated most closely with the respondentsrsquo mother tongue The characteristics showing the next closest links are vulnerability due to socio-demographic factors employment status age and the number of languages spoken
Those whose mother tongue does not correspond to one of the official languages of the country or
region they live in are more likely to receive false offers of free products from domestic retailers than those whose mother tongue is an official language
Furthermore consumers who are very or somewhat vulnerable in terms of socio-demographic factors are more likely to receive false offers of free products from retailers in their own country than those who are not vulnerable
Employment status is also linked with the likelihood of receiving false offers for free products with managers being most likely to receive such offers They are also more likely to receive false offers
more than other white collars blue collar workers or students In addition people who are retired self-employed or unemployed also report receiving such offers more than other white collars or students Similarly blue-collar workers or those seeking a job also report this more often than students do
Consumers aged 65 years or older are less likely to report being exposed to false offers for free products from domestic retailers than the remainder of the population
Finally consumers who only speak their native language are less likely to receive false offers of free products from domestic retailers than those who speak two languages or more
Consumer Survey 2018
88
Q13 options 4 and 5 (answer 1-domestic retailers) Base all respondents (N=28037)
The overall consumer exposure to false limited offers in the European Union is 248 In the South this is in line with the EU27_2019 average while it is higher in the North (274) and East (357) and lower in the West (196) The highest exposure to false limited offers is observed in Croatia
(485) Greece (427) and Hungary (413) The lowest levels of exposure to false limited offers are found in Luxembourg (124) the Netherlands (140) and Italy (148)
Compared to 2016 exposure to false limited offers remained stable in the North and South while it increased in the EU27_2019 (+63pp) the East (+17pp) and West (+137pp) Compared to the survey in 2016 this type of exposure increased most sharply in Ireland (+187pp) This increase in the incidence of consumers exposed to false limited offers follows a decrease of 219pp between 2014 and 2016 which makes this the highest negative reversal in the EU27_2019 Considering all
countries of the survey an even higher negative reversal is found in the UK where between 2016 and 2018 this indicator increased by 246pp whereas between 2014 and 2016 it decreased by 232pp The most prominent decrease in exposure to false limited offers is found in Slovenia (-74pp) This is related to the only positive reversal where this decrease was preceded by an increase of 71pp between 2014 and 2016
2018
( = sig
diff EU27)
2018-
2016
2016-
2014
2018
( = sig
diff EU27)
2018-
2016
2016-
2014
EU27_2019 248 +63 -70 173 +38 -59
EU28 254 +86 -91 178 +56 -68
North 274 -14 -03 188 -02 +14
South 239 +09 -26 195 +07 -14
East 357 +17 -33 212 -15 -55
West 196 +137 -131 136 +93 -103
BE 179 -04 +06 139 +03 -19
BG 384 -19 +18 147 -74 -50
CZ 245 +00 -64 196 -06 -38
DK 217 -04 -34 164 +31 +03
DE 211 +165 -138 123 +107 -94
EE 261 -07 +15 200 +21 +40
IE 231 +181 -219 185 +161 -169
EL 427 +30 +19 190 +27 -41
ES 327 -32 +03 218 -51 -04
FR 189 +151 -167 167 +124 -159
HR 485 +08 +49 258 -28 +26
IT 148 +37 -60 183 +51 -19
CY 286 -45 -73 77 +15 -57
LV 394 -07 +50 177 +73 -61
LT 277 +39 -11 174 +04 +04
LU 124 +83 -101 39 +10 -57
HU 413 +153 -178 237 +03 -37
MT 202 -46 +68 76 -32 +19
NL 140 +04 -05 87 -42 +11
AT 209 +169 -159 97 +78 -73
PL 357 -11 -22 243 -15 -69
PT 191 +08 -11 184 -07 +02
RO 357 +34 -21 185 -03 -63
SI 318 -74 +71 137 +19 -32
SK 361 +29 +07 164 -30 -77
FI 285 +05 -04 217 -16 +06
SE 278 -50 +05 192 -35 +40
IS 190 -10 +21 106 -33 +49
NO 242 +02 +00 158 -02 +06
UK 297 +246 -232 214 +186 -133
Types of unfair commercial practices from domestic retailers
Region
Country
False limited offers Other UCPs
Consumer Survey 2018
89
The overall level of exposure to other UCPs in the European Union is 173 This level is higher in
the North (188) South (195) and East (212) whereas it is lower in the West (136) The highest levels of exposure to other UCPs are observed in Croatia (258) Poland (243) and Hungary (237) The lowest levels of exposure to other UCPs are found in Luxembourg (39) Malta (76) and Cyprus (77)
Compared to 2016 exposure to other UCPs remained stable in the North and South while it increased in the EU27_2019 (+38pp) the West (+93pp) and decreased in the East (-15pp) This type of exposure increased most prominently in Ireland (+161pp) and decreased most substantially in
Bulgaria (-74pp) compared to the survey in 2016 When looking at statistically significant changes in 2018 (vs 2016) and in 2016 (vs 2014) the largest negative reversal is also found in Ireland where the increase between 2016 and 2018 by 161pp (reflecting an increase in the incidence of consumers exposed to other UCPs) follows a decrease of 169pp between 2014 and 2016 No statistically significant positive reversal is found
Q13 options 4-5 (answer 1-domestic retailers) - Base all EU27_2019 respondents (N=24928)
Male 264 194
Female 236 155
18-34 269 B 162 A
35-54 249 AB 172 AB
55-64 261 B 193 B
65+ 215 A 178 AB
Low 218 A 132
Medium 255 B 173 A
High 251 AB 187 A
Very difficult 281 B 224
Fairly difficult 268 B 184 A
Fairly easy 235 A 164 A
Very easy 249 AB 166 A
Rural area 251 A 173 A
Small town 245 A 169 A
Large town 255 A 182 A
Self-employed 268 AB 201 BC
Manager 292 B 233 C
Other white collar 242 A 167 A
Blue collar 246 A 173 AB
Student 220 A 162 AB
Unemployed 242 AB 152 A
Seeking a job 163 185 ABC
Retired 269 AB 159 A
Types of unfair commercial practices from
domestic retailers
False limited
offersOther UCPs
Gender
Age groups
Education
Financial Situation
Urbanisation
Employment status
Consumer Survey 2018
90
Q13 options 4-5 (answer 1-domestic retailers) - Base all EU27_2019 respondents (N=24928)
With regard to socio-demographic variables and other characteristics consumersrsquo vulnerability due
to socio-demographic factors is the factor most closely associated with exposure to false limited offers from domestic retailers The characteristics showing the next closest links are employment status gender language and age
Consumers who are very or somewhat vulnerable in terms of socio-demographic factors are more likely to receive false limited offers from domestic retailers than those who are not vulnerable
Regarding consumersrsquo employment status managers are more likely to receive such offers than
other white collars blue collar workers and students In turn the latter three groups as well as
people who are self-employed unemployed or retired are more likely to be exposed to false limited offers from domestic retailers than people seeking a job
As far as gender is concerned males are more likely to report receiving such false limited offers than are females
Consumers who speak only their native language are less likely to report receiving false limited offers than those who speak two or more languages
Only native 219 159 A
Two 267 A 168 A
Three 272 A 203 B
Four or more 258 A 229 B
Not official
language in home
country
265 A 186 A
Official language
in home country249 A 174 A
Low 238 A 170 A
Medium 244 A 176 A
High 255 A 174 A
Daily 264 B 187 C
Weekly 223 A 146 B
Monthly 185 A 183 BC
Hardly ever 215 AB 134 ABC
Never 186 A 112 A
Very vulnerable 284 A 198 A
Somewhat
vulnerable275 A 201 A
Not vulnerable 228 154
Very vulnerable 252 AB 222 A
Somewhat
vulnerable271 B 194 A
Not vulnerable 243 A 157
False limited
offersOther UCPs
Consumer vulnerability
(complexity)
Types of unfair commercial practices from
domestic retailers
Languages
Mother Tongue
Numerical skills
Internet use
Consumer vulnerability
(socio-demographic
factors)
Consumer Survey 2018
91
Age is also linked to exposure to false limited offers from domestic retailers but not in a linear
manner For consumers aged 18-34 years and 55-64 years a higher proportion has received this UCP than for those aged 65+ years
In terms of exposure to other UCPs from domestic retailers this indicator is associated most closely to gender followed by consumersrsquo language skills vulnerability due to the complexity of offers and terms and conditions education and vulnerability due to socio-demographic factors
Regarding consumersrsquo gender males are more likely to be exposed to other UCPs from domestic retailers than females
Those who speak at least three languages report being more exposed to such practices than those who speak two languages or only their native language
Consumers who are very or somewhat vulnerable in terms of the complexity of offers and terms and conditions are also likely to experience other UCPs from retailers in their own country than those who are not vulnerable
Additionally consumers with a low level of education are less likely to report being exposed to other
UCPs than consumers with a medium or high education level
Finally consumers who are very or somewhat vulnerable in terms of socio-demographic factors are also more likely to be exposed to other UCPs from domestic retailers than those who are not vulnerable
Consumer Survey 2018
92
Unfair commercial practices from cross-border retailers
1021 Exposure to UCPs from cross-border retailers
Average incidence of the UCPs mentioned in Q13 from cross-border retailers (answer 2) - Base all
respondents (N=28037)
In the European Union the overall level of exposure to UCPs from cross-border retailers is 48 Compared to the EU27_2019 average this level is higher in the West (53) North (53) and South (56) whereas it is lower in the East (24)
Compared to 2016 exposure to UCPs from cross-border retailers remained stable in the East while
it increased in the EU27_2019 (+24pp) the North (+08pp) South (+29pp) and West (+36pp)
Region
Country
2018
( = sig
diff EU27)
2018-
2016
2016-
2014
EU27_2019 48 +24 -14
EU28 50 +28 -17
North 53 +08 -03
South 56 +29 +03
East 24 -00 +01
West 53 +36 -35
BE 85 -00 +19
BG 15 +07 -06
CZ 35 +10 -01
DK 67 +18 -12
DE 52 +39 -23
EE 30 +08 -01
IE 113 +97 -84
EL 28 +17 -13
ES 49 +18 -03
FR 47 +37 -59
HR 42 +11 +06
IT 74 +45 +12
CY 43 +26 -26
LV 37 +16 -23
LT 30 +11 -00
LU 81 +53 -104
HU 11 +03 -08
MT 94 +01 +34
NL 22 -07 -00
AT 95 +85 -85
PL 27 -08 +02
PT 11 -02 -06
RO 18 +05 +04
SI 35 -16 +23
SK 30 -04 -05
FI 44 +11 -09
SE 63 -03 +08
IS 33 +18 -10
NO 65 -02 +14
UK 68 +54 -36
Exposure to unfair commercial practices
from cross-border retailers
Consumer Survey 2018
93
In this map values below average are coloured in light and dark green and values above average are coloured
in light and dark red
The highest exposure to UCPs from cross-border retailers is found in Ireland (113) Austria (95)
and Malta (94) The lowest levels of exposure are found in Portugal Hungary (both 11) Bulgaria (15) and Romania (18) Compared to the 2016 survey this type of exposure increased most sharply in Ireland (+97pp) and decreased most prominently in Slovenia (-16pp) When looking at statistically significant changes in 2018 (vs 2016) and in 2016 (vs 2014) the largest
negative reversal is also found in Ireland where the increase of this indicator between 2016 and 2018 (reflecting greater exposure to UCPs) follows a decrease of 84pp between 2014 and 2016
(reflecting lower exposure to UCPs) Similarly the only negative reversal is also found in Slovenia where the decrease between 2016 and 2018 follows an increase of 23pp between 2014 and 2016 (reflecting greater exposure to UCPs)
Consumer Survey 2018
94
Average incidence of the UCPs mentioned in Q13 from cross-border retailers (answer 2) - Base all EU27_2019
respondents (N=24928)
Average incidence of the UCPs mentioned in Q13 from cross-border retailers (answer 2) - Base all EU27_2019
respondents (N=24928)
With regard to socio-demographic variables and other characteristics the number of languages consumers speak is the factor most closely associated with exposure to UCPs from cross-border retailers The characteristics showing the next closest links are employment status age and vulnerability due to the complexity of offers and terms and conditions and education
Consumers who speak four or more languages are more likely to be exposed to UCPs from cross-border retailers than the remainder of the population Those who speak three languages are also more likely to be exposed to these UCPs than those who only speak their native language
Regarding employment status self-employed consumers are more likely exposed to UCPs from cross-border retailers than others In contrast unemployed respondents are the least likely to be exposed to UCPs from cross-border retailers They are less likely to experience such UCPs than managers other white collars blue collar workers the retired and as indicated earlier self-employed
consumers
Concerning consumersrsquo age those who are aged 18-34 years report being exposed to such UCPs more compared to respondents aged 35 or older
Consumers who are more vulnerable in terms of the complexity of offers and terms and conditions also report greater exposure to UCPs from cross-border retailers Specifically those who are very vulnerable and somewhat vulnerable report exposure more than those who are not vulnerable
Finally the proportion of consumers that experienced UCPs from retailers in other EU-countries is higher among those with a low level of education than those with a medium or high level of education
51 45
61 43 A 44 A 45 A
39 49 A 49 A
57 AB 52 B 45 A 51 AB
54 46 A 46 A
67 52 BC 51 C 42 B
39 AB 31 A 38 AB 46 BC
GenderMale Female
Exposure to unfair commercial practices from cross-border retailers
Blue collar
Student
65+
Education levelLow Medium High
Age18-34 35-54 55-64
Very easy
UrbanisationRural area Small town Large town
Financial situationVery difficult Fairly difficult Fairly easy
Unemployed Seeking a job RetiredEmployment status
Self-employed Manager Other white collar
42 A 48 AB 52 B 68
57 A 48 A
45 A 50 A 48 A
52 B 38 A 47 AB 29 A 27 A
48 AB 55 B 45 A
59 A 54 A 44
Four or more
Exposure to unfair commercial practices from cross-border retailers
LanguagesOnly native Two
High
Mother tongue
Not official language
in home country
Official language in
home country
Numerical skillsLow Medium
Three
Consumer
vulnerability
(complexity)
Very vulnerableSomewhat
vulnerableNot vulnerable
Hardly ever Never
Consumer
vulnerability
(socio-demographic
factors)
Very vulnerableSomewhat
vulnerableNot vulnerable
Internet useDaily Weekly Monthly
Consumer Survey 2018
95
1022 Types of UCPs from cross-border retailers
Respondents are relatively less likely to experience UCPs from cross-border retailers than from domestic retailers (see previous section) Persistent sales calls (60) are the most common unfair practices followed by lottery scams (52) and false limited offers (51) Other UCPs and false free products are experienced by 51 and 35 of all consumers respectively
Q13 options 1 2 and 3 (answer 2-cross-border retailers) Base all respondents (N=28037)
In the European Union the overall level of exposure to cross-border lottery scams is 52
Compared to the EU27_2019 average this level is higher in the West (70) and North (77) whereas it is lower in the East (21) and South (43) The highest exposure to cross-border lottery scams is found in Malta (208) Austria (133) and Ireland (132) The lowest levels of exposure are found in Hungary (03) Portugal (08) and Bulgaria (09)
2018
( = sig
diff EU27)
2018-
2016
2016-
2014
2018
( = sig
diff EU27)
2018-
2016
2016-
2014
2018
( = sig
diff EU27)
2018-
2016
2016-
2014
EU27_2019 52 +27 -25 60 +31 -12 35 +16 -10
EU28 52 +28 -28 60 +33 -15 39 +20 -10
North 77 +09 -22 32 +02 +05 46 +09 -02
South 43 +22 -04 91 +45 +17 43 +22 -00
East 21 -05 +01 18 -07 +05 16 +02 -06
West 70 +48 -55 64 +44 -44 37 +20 -20
BE 85 -27 +24 107 -05 +33 77 -17 +39
BG 09 +03 -09 15 +09 -03 13 +08 -03
CZ 46 +09 +11 31 +08 +05 32 +16 -15
DK 118 +27 -41 54 +14 +07 54 +09 -07
DE 71 +59 -35 57 +43 -34 28 +16 -06
EE 44 +09 -29 29 +06 +13 19 +11 -01
IE 132 +101 -161 79 +61 -39 113 +104 -65
EL 25 +14 -14 21 +11 -04 24 +11 -11
ES 32 +21 -13 42 +01 +10 44 +11 -05
FR 59 +49 -90 71 +58 -71 39 +29 -49
HR 44 -04 +07 19 +07 -10 44 +23 +14
IT 59 +29 +08 155 +93 +29 51 +36 +07
CY 60 +33 -54 36 +30 -18 45 +28 -26
LV 48 +25 -78 35 +15 -14 28 +16 -04
LT 26 -04 +09 29 +12 +05 32 +18 -05
LU 99 +65 -169 91 +43 -107 65 +48 -101
HU 03 -07 -10 07 +02 -07 08 -01 -01
MT 208 +11 +48 53 -13 +21 90 +34 +28
NL 45 -17 -06 12 -05 +03 14 -07 +06
AT 133 +128 -128 106 +101 -118 68 +57 -35
PL 18 -10 -02 19 -23 +14 11 -05 -13
PT 08 -03 -17 12 +00 -01 08 -01 -06
RO 17 +01 +09 13 -00 +06 13 +02 +03
SI 43 -48 +50 15 -01 -01 18 +04 -06
SK 30 -01 -17 28 -02 -12 30 -04 -06
FI 60 +10 -28 17 +07 -03 43 +07 -14
SE 88 -03 -04 30 -13 +12 55 +06 +09
IS 23 -05 -32 12 +11 -01 41 +23 +02
NO 95 -01 -10 38 +06 +05 47 -25 +31
UK 55 +40 -43 62 +48 -40 67 +50 -11
Types of unfair commercial practices from cross-border retailers
Region
Country
Lottery scams Persistent sales calls False free products
Consumer Survey 2018
96
Between 2016 and 2018 exposure to cross-border lottery scams remained stable in the East and
North while it increased in the EU27_2019 (+27pp) the South (+22pp) and West (+48pp) Compared to the survey administered in 2016 this type of exposure increased most sharply in Austria (+128pp) and decreased most prominently in Slovenia (-48pp) When looking at statistically significant changes in 2018 (vs 2016) and in 2016 (vs 2014) the largest negative reversal is found in Ireland where between 2016 and 2018 this indicator increased by 101pp (reflecting a higher likelihood of being exposed to such scams) whereas between 2014 and 2016 it decreased by 161pp (reflecting a lower likelihood of being exposed to such scams) The only positive reversal is found in
Slovenia (which also showed the strongest decrease) where between 2016 and 2018 this indicator decreased by 48pp following an increase of 50pp between 2014 and 2016
The overall consumer exposure to persistent sales calls by cross-border retailers in the European Union is 60 In the West this level is in line with the EU27_2019 average while it is higher in the South (91) and lower in the East (18) and North (32) The highest exposure to these types of calls is found in Italy (155) Belgium (107) and Austria (106) Among the EU countries
the lowest levels of exposure are found in Hungary (07) the Netherlands and Portugal (both 12) and Romania (13) The level is low as well in Iceland (12)
Between 2016 and 2018 exposure to persistent sales calls by cross-border retailers remained stable in the North while it increased in the EU27_2019 (+31pp) the West (+44pp) and South (+45pp) and decreased in the East (-07pp) Compared to the survey administered in 2016 this type of exposure increased most prominently in Austria (+101pp) and decreased most prominently in Poland (-23pp) When looking at statistically significant changes in 2018 (vs 2016) and in 2016 (vs
2014) the largest negative reversal is also found in Austria where the increase between 2016 and 2018 (reflecting a higher likelihood of being exposed to such calls) was preceded by a decrease of 118pp between 2014 and 2016 No statistically significant negative reversal is found
The overall consumer exposure to false free products by cross-border retailers is 35 in the European Union In the West this level is in line with the EU27_2019 average while it is higher in the South (43) and North (46) and lower in the East (16) The highest exposure to this type of practice is found in Ireland (113) Malta (90) and Belgium (77) The lowest levels of
exposure are found in Hungary and Portugal (both 08) Poland (11) and Bulgaria and Romania (both 13)
Between 2016 and 2018 consumer exposure to false free products by cross-border retailers remained stable in the East while it increased in the EU27_2019 (+16pp) the North (+09pp) West
(+20pp) and South (+22pp) Compared to the survey administered in 2016 this type of exposure increased most sharply in Ireland (+104pp) When looking at statistically significant changes in 2018
(vs 2016) and in 2016 (vs 2014) the largest negative reversal is also found in Ireland where the increase between 2016 and 2018 (reflecting a higher likelihood of being exposed to false free products) was preceded by a decrease of 65pp between 2014 and 2016 There are no statistically significant decreases amongst the EU Member States and no positive reversals Considering all studied countries the only statistically significant decrease and positive reversal is found in Norway (-25pp) where between 2016 and 2018 this indicator decreased by 25pp (reflecting a lower likelihood of being exposed to false free products) following an increase of 31pp between 2014 and
2016
Consumer Survey 2018
97
Q13 options 1 and 3 (answer 2-cross-border retailers) - Base all EU27_2019 respondents (N=24928)
Male 57 A 58 A 38 A
Female 47 A 63 A 32 A
18-34 51 A 71 B 52 B
35-54 52 A 54 A 29 A
55-64 58 A 59 AB 24 A
65+ 47 A 64 AB 36 AB
Low 41 A 47 A 28 A
Medium 51 A 61 A 35 A
High 55 A 64 A 37 A
Very difficult 54 A 58 AB 45 AB
Fairly difficult 55 A 75 B 42 B
Fairly easy 49 A 56 A 31 A
Very easy 55 A 54 A 34 AB
Rural area 55 A 74 B 41 A
Small town 52 A 59 AB 34 A
Large town 49 A 49 A 32 A
Self-employed 78 D 86 C 46 B
Manager 53 BC 53 AB 39 AB
Other white collar 58 CD 67 BC 32 AB
Blue collar 41 AB 53 AB 37 AB
Student 29 A 35 A 28 AB
Unemployed 25 A 37 A 24 A
Seeking a job 28 A 53 ABC 41 AB
Retired 55 BCD 62 BC 36 AB
Age groups
Types of unfair commercial practices from
cross-border retailers
Lottery scams Persistent sales
calls
False free
products
Gender
Education
Financial Situation
Urbanisation
Employment status
Consumer Survey 2018
98
Q13 options 1 and 3 (answer 2-cross-border retailers) - Base all EU27_2019 respondents (N=24928)
Regarding socio-demographic variables and other characteristics consumer exposure to lottery scams from cross-border retailers is associated most closely with employment status followed by the number of languages consumers speak
Regarding consumersrsquo employment status self-employed consumers are most likely to be exposed
to lottery scams from cross-border retailers They experience such scams more often than all other consumers except for other white collars and the retired In contrast students those who are unemployed and jobseekers are the least likely to be exposed to this UCP and less so than the self-employed managers other white collars or the retired
Concerning the consumersrsquo language skills those who speak only their native language are less likely to be exposed to such scams than those who speak two or more languages
With regards to receiving persistent sales calls from cross-border retailers whether a
consumerrsquos mother tongue is the official language in their country of residence or not is the factor most closely associated with this indicator The characteristics showing the next closest links are vulnerability due to the complexity of offers and terms and conditions employment status the degree of urbanisation and age
Only native 42 59 A 28 A
Two 55 A 58 A 37 AB
Three 57 A 67 A 38 AB
Four or more 68 A 76 A 50 B
Not official
language in home
country
64 A 99 26 A
Official language
in home country51 A 59 36 A
Low 46 A 45 A 33 A
Medium 58 A 63 A 36 A
High 50 A 62 A 35 A
Daily 57 B 61 A 40 B
Weekly 33 A 68 A 24 A
Monthly 55 AB 95 A 33 AB
Hardly ever 43 AB 51 A 15 A
Never 28 A 46 A 12 A
Very vulnerable 48 A 58 A 43 A
Somewhat
vulnerable61 A 64 A 36 A
Not vulnerable 49 A 60 A 33 A
Very vulnerable 60 A 78 A 46 A
Somewhat
vulnerable59 A 79 A 36 A
Not vulnerable 48 A 51 33 A
Types of unfair commercial practices from
cross-border retailers
Consumer vulnerability
(socio-demographic
factors)
Consumer vulnerability
(complexity)
Persistent sales
calls
False free
products
Languages
Mother Tongue
Numerical skills
Internet use
Lottery scams
Consumer Survey 2018
99
Consumers whose mother tongue is not one of the official languages of the country or region in which
they live are more likely to report receiving persistent sales calls from cross-border retailers than those whose mother tongue is not an official language
Consumers who are very or somewhat vulnerable due to the complexity of offers and terms and conditions are also more likely to report receiving persistent cross-border sales calls than those who are not vulnerable
Regarding consumersrsquo employment status those who are self-employed are more likely to receive such calls than managers blue collar workers students and people who are unemployed Other white
collars and those who are retired are also more likely to report this than students and the unemployed
Persons that live in a rural area are more likely to report receiving such calls compared to those living in a large town
As far as age is concerned those aged 18-34 years are more likely to receive cross-border persistent sales calls than those aged 35-54 years Consumers aged 55 years and older do not differ from
younger consumers
Regarding exposure to false offers of free products from cross-border retailers this indicator is associated most closely with age followed by the number of languages spoken and employment status
Young consumers (aged 18-34 years) are more likely to report receiving false offers for free products from retailers in another EU country than those aged 35-64 years Those aged 65 years or older do not differ from other age groups
Consumers who speak at least four languages are more likely to be exposed to cross-border false free offers compared to those who only speak their native language
Finally those who are self-employed are more likely to report receiving such offers than those who are unemployed
Consumer Survey 2018
100
Q13 options 4 and 5 (answer 2-cross-border retailers) Base all respondents (N=28037)
The overall consumer exposure to false limited offers in the European Union is 51 In the North
and West this level is in line with the EU27_2019 average while it is higher in the South (62)
and lower in the East (41) The highest exposure to this type of practice is found in Ireland (130) Luxembourg (111) and Austria (101) The lowest exposure is found in the Netherlands (16) Portugal (18) and Bulgaria (23)
Between 2016 and 2018 consumer exposure to false limited offers by cross-border retailers increased in the EU27_2019 (+26pp) the North (+11pp) West (+34pp) and South (+35pp) while it remained stable in the East Compared to the survey administered in 2016 this type of
exposure increased most prominently in Ireland (+113pp) where also the highest negative reversal is observed The increase between 2016 and 2018 (reflecting higher consumer exposure to false limited offers) came after a decrease of 64pp between 2014 and 2016
2018
( = sig
diff EU27)
2018-
2016
2016-
2014
2018
( = sig
diff EU27)
2018-
2016
2016-
2014
EU27_2019 51 +26 -04 42 +22 -18
EU28 54 +31 -10 46 +28 -21
North 55 +11 +02 54 +08 +01
South 62 +35 +07 43 +22 -05
East 41 +01 +08 25 +07 -05
West 48 +34 -19 48 +32 -38
BE 77 +24 +13 79 +24 -15
BG 23 +09 -07 13 +07 -09
CZ 42 +10 -01 22 +06 -04
DK 46 +17 -16 63 +21 -04
DE 56 +46 -14 48 +34 -26
EE 30 +04 +04 28 +12 +08
IE 130 +113 -64 114 +106 -89
EL 40 +21 -19 28 +25 -18
ES 79 +34 +08 48 +25 -14
FR 27 +16 -24 41 +32 -59
HR 70 +15 +20 34 +13 +01
IT 59 +44 +12 47 +25 +03
CY 62 +32 -16 14 +07 -14
LV 42 +04 -13 30 +19 -07
LT 40 +17 +00 20 +11 -10
LU 111 +88 -64 36 +20 -80
HU 26 +15 -13 12 +07 -10
MT 85 -01 +31 36 -24 +41
NL 16 -04 -03 24 -04 -01
AT 101 +86 -84 66 +51 -58
PL 49 -11 +13 36 +07 -03
PT 18 +06 -05 09 -10 +02
RO 30 +10 +10 15 +12 -09
SI 80 -36 +67 22 -03 +04
SK 44 +03 +06 20 -14 +04
FI 50 +19 +08 52 +13 -06
SE 72 +05 +14 69 -07 +11
IS 40 +25 -04 51 +35 -15
NO 60 -14 +41 87 +25 +02
UK 79 +67 -50 77 +66 -36
Types of unfair commercial practices from cross-border retailers
Region
Country
False limited offers Other UCPs
Consumer Survey 2018
101
Exposure to false limited offers decreased most prominently in Slovenia (-36pp) In addition when
looking at statistically significant changes in 2018 (vs 2016) and in 2016 (vs 2014) the only positive reversal is also found in Slovenia where this indicator increased by 67pp between 2014 and 2016 (reflecting higher consumer exposure to such offers) before it decreased between 2016 and 2018
In the European Union the overall consumer exposure to other cross-border UCPs is 42 In the South this indicator is in line with the EU27_2019 average while it is higher in the West (48) and North (54) and lower in the East (25) Among the EU countries the highest exposure to other cross-border UCPs is found in Ireland (114) Belgium (79) and Sweden (69) Of all studied
countries exposure to other cross-border UCPs is high in the UK (77) and Norway (87) as well The lowest values for this indicator are found in Portugal (09) Hungary (12) and Bulgaria (13)
Between 2016 and 2018 exposure to other cross-border UCPs increased in the EU27_2019 (+22pp) and all the regions (East +07pp North +08pp South +22pp West +32pp) Compared to the survey administered in 2016 the strongest increase in exposure to other UCPs from cross-border
retailers as well as the largest negative reversal is found in Ireland where between 2016 and 2018 this indicator increased by 106pp (reflecting higher consumer exposure to other cross-border UCPs)
whereas between 2014 and 2016 it decreased by 89pp Consumersrsquo exposure to other UCPs from cross-border retailers decreased most prominently in Portugal (-10pp) No statistically significant negative reversal is found
Consumer Survey 2018
102
Q13 options 4 and 5 (answer 2-cross-border retailers) - Base all EU27_2019 respondents (N=24928)
Male 57 47
Female 46 36
18-34 77 51 B
35-54 44 A 36 A
55-64 44 A 37 AB
65+ 32 A 45 AB
Low 46 A 31 A
Medium 55 A 42 A
High 48 A 43 A
Very difficult 73 A 61 AB
Fairly difficult 50 A 38 AB
Fairly easy 49 A 39 A
Very easy 56 A 53 B
Rural area 53 A 48 B
Small town 49 A 36 A
Large town 53 A 44 AB
Self-employed 67 D 59 B
Manager 61 CD 49 AB
Other white collar 57 CD 43 AB
Blue collar 38 AB 41 AB
Student 55 BCD 41 AB
Unemployed 38 ABC 29 A
Seeking a job 29 A 35 AB
Retired 45 ABCD 33 A
Types of unfair commercial practices from
cross-border retailers
False limited
offersOther UCPs
Gender
Age groups
Education
Financial Situation
Urbanisation
Employment status
Consumer Survey 2018
103
Q13 options 4 and 5 (answer 2-cross-border retailers) - Base all EU27_2019 respondents (N=24928)
With regard to socio-demographic variables and other characteristics age is the factor most closely
associated with consumersrsquo exposure to false limited offers from cross-border retailers followed by gender employment status and language
Younger consumers (18-34 years) are more likely to report receiving false limited offers from cross-border retailers than those aged 35 or older
As far as gender is concerned male consumers are more likely to receive cross-border false limited offers than females
Regarding consumersrsquo employment status consumers who are self-employed report being exposed
to this UCP most often Their exposure is higher than the exposure for blue collar job workers jobseekers or those who are unemployed The proportion of people reporting this is also higher among managers and other white collars than it is among blue collar workers and jobseekers Students likewise report this more than people seeking a job
Only native 46 A 34 A
Two 51 AB 41 A
Three 51 AB 45 A
Four or more 73 B 73
Not official
language in home
country
39 A 61 A
Official language
in home country52 A 41 A
Low 46 A 57 A
Medium 56 A 37 A
High 50 A 42 A
Daily 56 C 46 B
Weekly 32 B 30 AB
Monthly 34 ABC 19 A
Hardly ever 08 A 20 A
Never 30 B 19 A
Very vulnerable 46 A 46 AB
Somewhat
vulnerable63 53 A
Not vulnerable 47 A 36 B
Very vulnerable 61 A 51 A
Somewhat
vulnerable56 A 40 A
Not vulnerable 48 A 42 A
False limited
offersOther UCPs
Consumer vulnerability
(complexity)
Types of unfair commercial practices from
cross-border retailers
Languages
Mother Tongue
Numerical skills
Internet use
Consumer vulnerability
(socio-demographic
factors)
Consumer Survey 2018
104
Finally consumers who speak four or more languages are more likely to be exposed to false limited
offers than those speaking only their native language
Higher exposure to other UCPs from cross-border retailers is associated most closely to the number of languages spoken followed by the consumersrsquo gender internet use urbanisation and age
Consumers who speak at four languages or more are more likely to be exposed to such practices than consumers who speak fewer languages
Concerning gender males are more likely to report being exposed to such practices than females
Consumers who use the internet daily are also more likely to report having greater exposure to other UCPs from cross-border retailers compared to those who use the internet monthly or less
Consumers from rural areas are more likely to report exposure to other UCPs from cross-border retailers than consumers from small towns
Finally regarding the consumersrsquo age exposure is reported more often by those who are aged 18-34 years than those aged 35-54 years
Consumer Survey 2018
105
Other illicit commercial practices from domestic retailers
1031 Exposure to other illicit commercial practices from domestic retailers
The average exposure to illicit commercial practices from domestic retailers (Q16a_121 and Q16a_2 answer
option 1 and Q16b_1 and Q16b_2 answer option 1) ndash Base All respondents (N=28037)
21 Q16a Now I will read you some statements about problems consumers may have more generally when shopping Please tell me whether you have experienced any of them during the last 12 monthshellip -Yes with retailers or services providers located in (our country) -Yes with retailers or services providers located in another EU country -Yes but you donrsquot know in which country the retailers or services providers were located -No -DKNA
Q16a1 You have encountered unfair terms and conditions in a contract (for instance enabling the provider to change the contract terms unilaterally or imposing excessive penalties for breach of the contract) Q16a2 You have had to pay unanticipated extra charges Q16b Now I will read you some statements about problems consumers may have more generally when shopping Please tell me whether you have experienced any of them when buying in (our country) during the last 12 monthshellip -Yes ndashNo ndashDKNA Q16b1 You have encountered unfair terms and conditions in a contract (for instance enabling the provider to change the contract terms unilaterally or imposing excessive penalties for breach of the contract) Q16b2 You have had to pay unanticipated extra charges
Region
Country
2018
( = sig
diff EU27)
2018-
2016
2016-
2014
EU27_2019 106 +16 -38
EU28 112 +31 -47
North 90 -09 +15
South 141 +17 -39
East 122 -19 -33
West 76 +38 -48
BE 96 -08 -02
BG 190 -27 -34
CZ 78 -01 -19
DK 78 -02 +17
DE 63 +30 -33
EE 110 +07 +15
IE 151 +118 -138
EL 210 +94 -73
ES 121 -28 -31
FR 95 +69 -81
HR 211 -31 +06
IT 152 +39 -44
CY 74 +11 -37
LV 150 -11 -07
LT 105 +11 -33
LU 53 +32 -29
HU 124 -25 -49
MT 118 -61 +62
NL 50 -21 -01
AT 44 +23 -54
PL 106 -20 -29
PT 102 +08 -21
RO 144 -13 -50
SI 78 -18 +03
SK 99 -39 -42
FI 74 -07 +23
SE 87 -22 +30
IS 103 -33 +29
NO 67 -18 -07
UK 156 +134 -111
Exposure to other illicit commercial
practices from domestic retailers
Consumer Survey 2018
106
In the European Union the overall consumer exposure to other illicit commercial practices from
domestic retailers is 106 Compared to the EU27_2019 average this indicator is higher in the East (122) and South (141) whereas it is lower in the West (76pp) and North (90) The highest exposure to other illicit commercial practices from domestic retailers is found in Croatia (211) Greece (210) and Bulgaria (190) The lowest exposure to such practices is found in Austria (44) the Netherlands (50) and Luxembourg (53)
Between 2016 and 2018 consumer exposure to other illicit commercial practices from domestic retailers increased in the EU27_2019 (+16pp) the South (+17pp) and West (+38pp) whereas it
decreased in the North (-09pp) and East (-19pp) Compared to the 2016 survey this type of exposure increased most sharply in Ireland where also the largest negative reversal is found In this country between 2016 and 2018 the indicator increased by 118pp (reflecting higher consumer exposure to other illicit commercial practices) whereas between 2014 and 2016 it decreased by 138pp The largest decrease and positive reversal are found in Malta where between 2016 and 2018 this indicator decreased by 61pp (reflecting lower consumer exposure to other illicit
commercial practices) following an increase of 62pp between 2014 and 2016
Consumer Survey 2018
107
1032 Types of other illicit commercial practices from domestic retailers
When it comes to other illicit commercial practices experienced from domestic retailers consumers are somewhat more likely to face unfair terms and conditions (119) than unanticipated extra charges (93)
Percentage of ldquoYesrdquo responses in Q16a_1 and Q16b_1 answer option 1 and in Q16a_2 and Q16b_1 answer
option 1 ndash Base All respondents (N=28037)
In the European Union the overall consumer exposure to unfair contract terms and conditions from domestic retailers is 119 Compared to the EU27_2019 average this level is higher in the East (132) and South (182) whereas it is lower in the West (73) and North (85) The
highest consumer exposure to unfair contract terms and conditions from domestic retailers is found in Croatia (226) Greece (212) and Bulgaria (206) The lowest consumer exposure to such practices is found in Austria (44) Luxembourg (46) and the Netherlands (49)
2018
( = sig
diff EU27)
2018-
2016
2016-
2014
2018
( = sig
diff EU27)
2018-
2016
2016-
2014
EU27_2019 119 +21 -45 93 +11 -32
EU28 123 +35 -54 102 +26 -41
North 85 -11 +13 95 -08 +18
South 182 +31 -43 100 +03 -36
East 132 -27 -36 113 -12 -30
West 73 +44 -58 78 +32 -37
BE 92 +13 -13 99 -29 +09
BG 206 -50 -32 175 -05 -35
CZ 97 -07 -24 60 +04 -14
DK 55 -01 +15 102 -03 +20
DE 65 +42 -40 60 +17 -25
EE 122 +08 +16 99 +06 +14
IE 143 +120 -172 158 +116 -105
EL 212 +104 -71 208 +85 -74
ES 171 -32 -41 71 -24 -21
FR 85 +62 -99 106 +77 -62
HR 226 -42 +05 196 -19 +08
IT 197 +68 -42 106 +10 -45
CY 65 +14 -42 84 +09 -32
LV 147 -14 -24 152 -08 +10
LT 112 +09 -31 97 +12 -36
LU 46 +30 -36 61 +34 -22
HU 174 +09 -55 74 -58 -44
MT 110 -72 +79 125 -50 +44
NL 49 -09 +13 51 -34 -15
AT 44 +25 -67 44 +21 -40
PL 93 -39 -37 120 -02 -21
PT 122 +22 -31 81 -05 -10
RO 163 -12 -42 125 -14 -59
SI 82 -21 +12 75 -16 -07
SK 132 -53 -57 67 -26 -27
FI 86 -13 +20 61 -01 +26
SE 75 -23 +28 99 -22 +32
IS 73 -18 -01 134 -49 +60
NO 53 -03 -02 80 -34 -11
UK 152 +136 -119 160 +132 -103
Exposure to other illicit commercial practices from domestic retailers
Region
Country
Unfair terms and conditions Unanticipated extra charges
Consumer Survey 2018
108
Compared to 2016 exposure to unfair contract terms and conditions from domestic retailers
increased in the EU27_2019 (+21pp) in the South (+31pp) and West (+44pp) while it decreased in the North (-11) and the East (-27) Exposure to unfair contract terms increased most sharply in Ireland where also the largest negative reversal is found In this country between 2016 and 2018 the indicator increased by 120pp (reflecting higher consumer exposure to unfair contract terms and conditions) whereas between 2014 and 2016 it decreased by 172pp
In contrast in Malta exposure to unfair contract terms decreased most prominently which also represents the only positive reversal Between 2016 and 2018 this indicator decreased by 72pp
(reflecting a development towards a lower consumer exposure to unfair contract terms and conditions) whereas between 2014 and 2016 it increased by 79pp
The overall consumer exposure to unanticipated extra charges from domestic retailers is 93 in the European Union In the North and South this indicator is in line with the EU27_2019 average while exposure levels are higher in the East (113) and lower in the West (78) In the EU the highest exposure to unanticipated extra charges from domestic retailers is found in Greece (208)
Croatia (196) and Bulgaria (175) The lowest consumer exposure to such practices is found in Austria (44) the Netherlands (51) and the Czech Republic and Germany (both 60)
Between 2016 and 2018 exposure to unanticipated extra charges from domestic retailers increased in the EU27_2019 (+11pp) the West (+32pp) and decreased in the East (-12pp) while it remained stable in the North and South For this indicator as well exposure to unanticipated extra charges increased most sharply in Ireland (+116pp reflecting higher exposure to unanticipated extra charges) which is a negative reversal compared to the decrease of 105pp between 2014 and 2016
Exposure to unanticipated extra charges decreased most prominently in Hungary (-58pp) compared to the 2016 survey The largest negative reversal in the EU is also found in Hungary where between 2016 and 2018this indicator decreased by 58pp (reflecting lower consumer exposure to unanticipated extra charges) whereas between 2014 and 2016 it increased by 44pp
Considering all countries in the study the highest negative reversal is found in the UK where between 2016 and 2018 this indicator increased by 132pp (reflecting higher consumer exposure to such charges) whereas between 2014 and 2016 it decreased by 103pp The highest positive
reversal is found in Iceland where between 2016 and 2018 this indicator decreased by 49pp (reflecting lower consumer exposure to such charges) whereas between 2014 and 2016 it increased by 60pp
Consumer Survey 2018
109
In these maps values below average are coloured in light and dark green and values above average are coloured in light and dark red
Consumer Survey 2018
110
The average exposure to illicit commercial practices from domestic retailers (Q16a_1 and Q16a_2 answer
option 1 and Q16b_1 and Q16b_2 answer option 1) ndash Base all EU27_2019 respondents (N=24928)
Male 119 142 95 A
Female 95 98 92 A
18-34 123 C 129 A 118
35-54 109 BC 124 A 94 B
55-64 99 AB 112 A 85 AB
65+ 83 A 102 A 64 A
Low 87 A 96 A 79 A
Medium 102 A 114 A 91 A
High 116 132 100 A
Very difficult 132 C 134 AB 133
Fairly difficult 115 BC 130 B 99 B
Fairly easy 97 A 112 A 82 A
Very easy 100 AB 108 AB 92 AB
Rural area 102 A 110 A 94 AB
Small town 102 A 118 AB 87 A
Large town 117 131 B 102 B
Self-employed 119 B 125 B 114 B
Manager 119 AB 140 B 98 AB
Other white collar 107 AB 123 B 92 AB
Blue collar 108 AB 119 B 97 AB
Student 91 A 80 A 96 AB
Unemployed 103 AB 108 AB 95 AB
Seeking a job 115 AB 151 B 81 AB
Retired 95 AB 110 AB 80 A
Age groups
Exposure to other illicit commercial
practices from domestic retailersTotal
Unfair terms and
conditions
Unanticipated
extra charges
Gender
Education
Financial Situation
Urbanisation
Employment status
Consumer Survey 2018
111
The average exposure to illicit commercial practices from domestic retailers (Q16a_1 and Q16a_2 answer option 1 and Q16b_1 and Q16b_2 answer option 1) ndash Base all EU27_2019 respondents (N=24928)
With regard to socio-demographic variables and other characteristics whether a consumerrsquos mother tongue is the official language in their country of residence or not is the factor most closely associated with consumer exposure to other illicit commercial practices from domestic retailers Other characteristic showing close links with the indicator are vulnerability due to socio-demographic
factors gender vulnerability due to the complexity of offers and terms and conditions and age
Consumers whose mother tongue is not one of the official languages of the country or region in which they live are more likely to be exposed to illicit commercial practices from domestic retailers than those whose mother tongue is not an official language
Consumers who are very vulnerable in terms of socio-demographic factors are more likely to report being exposed to illicit commercial practices from domestic retailers than those who are somewhat vulnerable who in turn report higher exposure to such practices than those who are not vulnerable
Regarding consumersrsquo gender males are more likely to be exposed to such practices than females Consumers aged 18-34 years are more likely to report being exposed to such practices than those aged 55-64 years and 65+ years
Only native 95 108 A 82 A
Two 110 A 122 AB 97 AB
Three 117 A 135 B 100 AB
Four or more 119 A 126 AB 112 B
Not official
language in home
country
154 175 133
Official language
in home country104 117 91
Low 97 A 107 A 88 A
Medium 103 A 116 A 90 A
High 110 A 123 A 96 A
Daily 109 C 123 B 95 B
Weekly 111 C 126 B 96 B
Monthly 138 BC 158 AB 116 AB
Hardly ever 65 A 77 A 54 A
Never 82 AB 84 A 83 AB
Very vulnerable 142 148 A 137
Somewhat
vulnerable115 134 A 97
Not vulnerable 89 102 76
Very vulnerable 131 A 145 A 119 A
Somewhat
vulnerable122 A 137 A 107 A
Not vulnerable 95 107 82
Exposure to other illicit commercial
practices from domestic retailers
Consumer vulnerability
(socio-demographic
factors)
Consumer vulnerability
(complexity)
Unfair terms and
conditions
Unanticipated
extra charges
Languages
Mother Tongue
Numerical skills
Internet use
Total
Consumer Survey 2018
112
In terms of encountering unfair terms and conditions from domestic retailers this indicator is
associated most closely with whether a consumersrsquo mother tongue is the official language in their country of residence or not Other characteristics with close links with the indicator are gender vulnerability due to socio-demographic factors vulnerability due to the complexity of offers and terms and conditions and internet use
Those whose mother tongue does not correspond to one of the official languages of the country or region they live in are more likely to encounter such unfair terms and conditions than those whose mother tongue is one of the official languages
Regarding consumersrsquo gender males are more likely to report encountering unfair terms and conditions from domestic retailers than females
Consumers who are very or somewhat vulnerable in terms of socio-demographic factors are more likely to report encountering unfair terms and conditions compared to consumers who are not vulnerable
Similarly consumers who are very or somewhat vulnerable in terms of the complexity of offers and
terms and conditions are also more likely to report encountering unfair terms and conditions than those who are not vulnerable
As far as internet use is concerned daily and weekly internet users are likely to encounter unfair terms and conditions than those who use the internet hardly ever or never
Whether a consumersrsquo mother tongue is the official language in their country of residence or not is also associated most closely with consumersrsquo exposure to unanticipated extra charges from domestic retailers The characteristics showing the next closest links are vulnerability due to socio-
demographic factors age vulnerability due to the complexity of offers and terms and conditions and the degree of urbanisation
Those whose mother tongue is not one of the official languages of the country or region they live in report receiving such unanticipated charges more likely than those whose mother tongue is one of the official languages
Consumers who are very vulnerable in terms of socio-demographic factors are more likely to report
receiving unanticipated extra charges than who are somewhat vulnerable who in turn are more likely
to report receiving such charges than those who are not vulnerable
Regarding age younger consumers (18-34 years) are also more likely to receive unanticipated extra charges from domestic retailers than those aged 35-54 years who in turn are more likely to receive such charges than those aged 65 years and older
Consumers who are very or somewhat vulnerable in terms of the complexity of offers and terms and conditions also report exposure to unanticipated extra charges more than those who are not
vulnerable
Finally consumers living in a large town are more likely to report receiving such charges than those living in a small town
Consumer Survey 2018
113
1033 Exposure to other illicit commercial practices from cross-border
retailers
The average exposure to illicit commercial practices from cross-border retailers (Q16a_1 and Q16a_2 answer
option 2) ndash Base Respondents who shopped in another EU country (N=10741)
In the European Union the overall consumer exposure to other illicit commercial practices from cross-border retailers is 36 In the North and West consumer exposure is in line with the EU27_2019 average whereas it is higher in the South (48) and lower in the East (20) Among the EU Member States the highest exposure to other illicit commercial practices from cross-border
retailers is found in Ireland (98) Malta (78) and Luxembourg (65) The lowest levels of exposure to such practices are found in Hungary (10) the Czech Republic (11) and Poland (17)
Between 2016 and 2018 exposure to other illicit commercial practices from cross-border retailers remained unchanged in the EU27_2019 and all regions In the EU27_2019 this type of exposure increased most sharply in Ireland (+62pp) while no statistically significant decreases are recorded
Region
Country
2018
( = sig
diff EU27)
2018-
2016
2016-
2014
EU27_2019 36 +01 -03
EU28 40 +04 -04
North 39 -03 +05
South 48 +08 +06
East 20 +00 -09
West 35 -02 -06
BE 44 +01 -18
BG 26 +10 -28
CZ 11 +07 -11
DK 36 -12 +09
DE 31 -08 +02
EE 20 -02 +03
IE 98 +62 -38
EL 32 +12 -08
ES 43 -06 +11
FR 29 -12 -09
HR 43 +08 +02
IT 55 +17 +03
CY 52 +13 -27
LV 37 +07 -06
LT 42 +22 -25
LU 65 +12 -49
HU 10 +04 -45
MT 78 -14 +30
NL 24 +08 -04
AT 44 +20 -13
PL 17 -03 -00
PT 24 -04 +15
RO 23 -11 +04
SI 34 +04 +08
SK 25 +04 -28
FI 29 +06 -25
SE 49 -12 +30
IS 54 +29 +01
NO 53 +04 +10
UK 65 +29 -13
Exposure to other illicit commercial
practices from cross-border retailers
Consumer Survey 2018
114
at country level When looking at changes in 2018 (vs 2016) and in 2016 (vs 2014) the strongest
negative reversal is also found in Ireland where the increase between 2016 and 2018 follows a decrease of 38pp between 2014 and 2016 (reflecting lower exposure to such charges) No statistically significant positive reversal is found
1034 Types of other illicit commercial practices from cross-border retailers
In contrast to other illicit commercial practices from domestic retailers unanticipated extra charges (44) are somewhat more common from cross-border retailers than unfair terms and conditions (28)
Percentage of ldquoYesrdquo responses in Q16a_1 and Q16a_2 ndash Base Respondents who shopped in another EU country
(N=10741)
In the European Union the overall consumer exposure to unfair contract terms and conditions from cross-border retailers is 28 In the North South and West the results are in line with the
2018
( = sig
diff EU27)
2018-
2016
2016-
2014
2018
( = sig
diff EU27)
2018-
2016
2016-
2014
EU27_2019 28 +01 +02 44 +00 -08
EU28 32 +03 +04 48 +06 -12
North 32 +01 +05 46 -08 +05
South 26 +02 -02 70 +14 +14
East 16 -01 -03 23 +02 -16
West 32 +01 +06 38 -06 -18
BE 25 +07 -20 64 -04 -15
BG 32 +16 -36 20 +03 -19
CZ 15 +16 07 -03 -08
DK 21 +09 +00 50 -33 +18
DE 39 +08 +19 23 -23 -15
EE 08 -09 +06 32 +06 -01
IE 54 +26 -08 142 +99 -68
EL 03 -07 -23 60 +31 +08
ES 28 -18 +03 58 +07 +19
FR 20 -24 +02 39 -01 -21
HR 21 -04 -11 66 +20 +15
IT 28 +15 -06 82 +18 +13
CY 40 +12 -23 64 +14 -31
LV 27 +07 -19 46 +07 +07
LT 40 +23 -18 44 +20 -33
LU 44 +01 -32 87 +24 -66
HU 07 +06 -33 13 +03 -57
MT 50 -25 +59 105 -04 +02
NL 19 +03 +05 29 +13 -13
AT 55 +39 -08 34 +00 -18
PL 14 -05 +10 20 -02 -11
PT 15 -09 +16 33 +02 +14
RO 13 -24 +23 33 +03 -16
SI 23 -04 +00 45 +12 +17
SK 26 -01 -14 23 +10 -42
FI 35 +12 -27 23 -01 -22
SE 39 -18 +37 59 -06 +22
IS 24 +05 +13 84 +53 -11
NO 31 +11 -03 75 -03 +23
UK 59 +17 +15 70 +41 -41
Exposure to other illicit commercial practices from cross-border
retailers
Region
Country
Unfair terms and conditions Unanticipated extra charges
Consumer Survey 2018
115
EU27_2019 average while a lower level is noted in the East (16) While the results for most of
the EU Member States are in line with the EU27_2019 average higher levels are observed in Austria (55) Ireland (54) while lower levels are found in Estonia (08) Hungary (07) and Greece (03) The highest level of exposure among all studied countries is found in the UK (59)
Consumer exposure to unfair contract terms and conditions from cross-border retailers did not undergo any statistically significant change between 2016 and 2018 in the EU27_2019 nor in all regions Compared to the 2016 survey this type of exposure increased most sharply in Austria (+39pp) No statistically significant decreases and positive or negative reversals are found
The overall consumer exposure to unanticipated extra charges from cross-border retailers is 44 in the European Union The results in the North and West are in line with the EU27_2019 average whereas they are higher in the South (70) and lower in the East (23) The highest exposure to unanticipated extra charges from cross-border retailers is found in Ireland (142) Malta (105) and Luxembourg (87) The lowest levels of exposure to such practices are found in the Czech Republic (07) Hungary (13) Poland and Bulgaria (both 20)
Compared to 2016 consumer exposure to unanticipated extra charges from cross-border retailers
remained stable in the EU27_2019 and in all regions Among the EU Member States it only increased in Ireland (+99pp) whereas no statistically significant decreases are observed When looking at changes in 2018 (vs 2016) and in 2016 (vs 2014) the largest negative reversal is also found in Ireland where the increase of this indicator (reflecting higher consumer exposure to unanticipated extra charges) follows a decrease of 68pp between 2014 and 2016 (reflecting lower consumer exposure to such extra charges) No positive reversals are found
Consumer Survey 2018
116
The average exposure to illicit commercial practices from cross-border retailers (Q16a_1 and Q16a_2 answer
option 2) ndash Base EU27_2019 respondents who shopped in another EU country (N= 9447) N=9365 for unfair terms and conditions N = 9436 for unanticipated extra charges
Male 39 A 30 A 48 A
Female 32 A 25 A 40 A
18-34 43 B 23 A 64 C
35-54 29 A 27 A 33 AB
55-64 41 AB 45 A 42 BC
65+ 26 AB 36 A 19 A
Low 23 A 10 35 A
Medium 34 A 24 A 44 A
High 39 A 33 A 45 A
Very difficult 47 A 51 A 43 AB
Fairly difficult 41 A 18 A 63 B
Fairly easy 31 A 28 A 35 A
Very easy 41 A 36 A 46 AB
Rural area 39 A 23 A 56 A
Small town 34 A 26 A 42 A
Large town 36 A 34 A 39 A
Self-employed 55 C 36 B 75 B
Manager 39 ABC 28 AB 50 AB
Other white collar 31 AB 22 AB 40 A
Blue collar 26 AB 25 AB 28 A
Student 48 BC 65 B 43 AB
Unemployed 45 ABC 31 AB 62 AB
Seeking a job 42 ABC 34 AB 48 AB
Retired 20 A 15 A 23 A
Age groups
Exposure to other illicit commercial
practices from cross-border retailersTotal
Unfair terms and
conditions by
cross-border
retailers
Unanticipated
extra charges by
cross-borer
retailers
Gender
Education
Financial Situation
Urbanisation
Employment status
Consumer Survey 2018
117
The average exposure to illicit commercial practices from cross-border retailers (Q16a_1 and Q16a_2 answer
option 2) ndash Base EU27_2019 respondents who shopped in another EU country (N= 9447) N=9365 for unfair terms and conditions N = 9436 for unanticipated extra charges
With regard to socio-demographic variables and other characteristics the variable associated most closely with consumer exposure to other illicit commercial practices from cross-border retailers is vulnerability due to the complexity of offers and terms and conditions followed by employment status and age
Consumers who are very vulnerable in terms of the complexity of offers and terms and conditions are more likely to report exposure to such practices than those who are not vulnerable
Regarding consumersrsquo employment status those who are self-employed are most likely to be exposed to other illicit commercial practices from cross-border retailers and more so than other white collars blue collar workers or those who are retired
Finally consumers aged 18-34 years are more likely to report being exposed to such practices than
those aged 35-54 years
In terms of unfair terms and conditions by cross-border retailers vulnerability due to the complexity of offers and terms and conditions is the factor most closely associated with this illicit
Only native 28 A 24 A 32 A
Two 38 A 31 A 46 A
Three 36 A 25 A 48 A
Four or more 42 A 29 A 54 A
Not official
language in home
country
54 A 45 A 65 A
Official language
in home country35 A 27 A 43 A
Low 37 A 21 A 53 A
Medium 43 A 28 A 58 A
High 33 A 28 A 39 A
Daily 37 A 29 B 44 A
Weekly 27 A 04 A 52 A
Monthly 16 A 33 A
Hardly ever 17 A 09 AB 26 A
Never 32 A 18 AB 57 A
Very vulnerable 44 A 40 A 50 A
Somewhat
vulnerable33 A 26 A 40 A
Not vulnerable 36 A 26 A 45 A
Very vulnerable 57 B 66 B 51 A
Somewhat
vulnerable43 AB 35 AB 50 A
Not vulnerable 31 A 21 A 42 A
Exposure to other illicit commercial
pracitces from cross-border retailers
Consumer vulnerability
(socio-demographic
factors)
Consumer vulnerability
(complexity)
unfair terms and
conditions by
cross-border
retailers
unanticipated
extra charges by
cross-borer
retailers
Languages
Mother Tongue
Numerical skills
Internet use
Total
Consumer Survey 2018
118
commercial practice Other characteristics with close links with this indicator are education and
employment status
Consumers who are very vulnerable in terms of the complexity of offers and terms and conditions are also more likely to report exposure to unfair terms and conditions by cross-border retailers than those who are not vulnerable
Regarding consumersrsquo education level those with a medium or high level of education are more likely to report encountering such practices than those with a low level of education
Finally consumer that are self-employed and students are more likely to report exposure to unfair
terms and conditions by cross-border retailers than those who are retired
With regards to unanticipated extra charges by cross-border retailers age and employment status are the factors that are linked closely with the indicator
Consumers aged 18-34 years are more likely to report being exposed to such practices than those aged 35-54 years and 65+ years Consumers aged 55-64 are also more likely to report exposure to
such practices than consumers aged 65+ years
Finally persons that are self-employed are more likely to report exposure to such practices than other white collars blue collar workers and those who are retired
Consumer Survey 2018
119
In these maps values below average are coloured in light and dark green and values above average are coloured in light and dark red
Consumer Survey 2018
120
11 OVERALL PROBLEMS AND DISPUTE RESOLUTION
This chapter looks at the overall level of problems that consumers experience with online purchases as well as the actions they take in terms of making complaints to different sectors (retailer or service
provider manufacturer public authority out-of-court dispute resolution body (ADR) or other) along with their overall satisfaction with problem resolution and the time it took to resolve problems This chapter additionally observes the reasons that consumers reported for not taking actions
The problems and complaints indicator
Due to relatively small sample sizes achieved when asking respondents about problems they
experienced the actions they took to resolve them and their satisfaction with complaint handling a composite indicator on problems and complaints was developed based on data gathered with four survey questions
1) problems experienced buying or using any goods or services domestically
2) the type of action taken to resolve the problem
3) satisfaction with complaint handling
4) the reason for not taking action if applicable
Based on the four questions above a hierarchy of 11 exhaustive (all respondents) and mutually exclusive (each respondent belongs to only one) scenarios was developed2223 The result of this hierarchy is a problems and complaints indicator the higher the value of the indicator the lower the overall level of problems and the higher the overall satisfaction with complaint handling
22 The scenarios were developed by DG JUST with the scientific cooperation with the Joint Research Centre and Member States experts They are based on the following principlesassumptions a) The ideal situation is the one where a person has not experienced any problem b) when one or more problems are experienced the best thing to do is to complain about it unless the decision not to complain is justified solely by the small detriment associated with the problem(s) c) complaining to the retailerprovidermanufacturer indicates a less serious problem andor is less burdensome for the consumer than complaining to third parties (public authority ADR or court) d) The final outcome of the complaint process also matters (result being satisfactory or not)
23 The additional advantage of combining the answers to the different questions in specific scenarios is that a higher rate of complaining behaviour is not automatically seen as better for consumer conditions (unless combined with a satisfactory response) and that not complaining because of small detriment is not penalised For detailed information on the composition of the composite indicator see chapter 221 of Van Roy V Rossetti F Piculescu V (2015) Consumer conditions in the EU revised framework and empirical investigation JRC science and policy report JRC93404 httpseceuropaeujrcenpublicationeur-scientific-and-technical-research-reportsconsumer-conditions-eu-revised-framework-and-empirical-investigation To make it easier to understand how the indicator is built below are three example scenarios of the problems and complaints indicator (most favourable medium and worst scenario) bull Most favourable scenario the consumer did not have any problem or the consumer does not know if he had a problem or not In this scenario the problems and complaints indicator is 98 bull Intermediate scenario the consumer had had a problem and he DID complain about it NEITHER to the retailer NOR the manufacturer However he complained about it to another party and he did get a satisfactory result from any of these parties In this scenario the problems and complaints indicator is equal to 45 bull Worst scenario the consumer had a problem and the low sum involved is NOT among the reasons why he did not complain In this scenario the problems and complaints indicator is equal to 11
Consumer Survey 2018
121
The problems and complaints composite indicator (which can have a score from 11 to 98 see footnote 23) is
computed based on pre-defined scenarios using data gathered in Q924 Q1025 Q1126 and Q1227 - Base all respondents (N=28037)
24 Q9 In the past 12 months have you experienced any problem when buying or using any goods or services in (our country) where you thought you had a legitimate cause for complaint -Yes and you took action to solve the problem -Yes but you did not do anything ndashNo -DKNA
25 Q10 And what did you do - You complained about it to the retailer or service provider -You complained about it to the manufacturer -You complained about it to a public authority -You brought the matter to an out-of-court dispute resolution body (ADR) such as an ombudsman arbitration mediation or conciliation body -You took the business concerned to court ndashOther -DKNA
26 Q11 In general how satisfied or dissatisfied were you with the way your complaint(s) was (were) dealt with by thehellip -Very satisfied ndashFairly satisfied ndashNot very satisfied ndashNot at all satisfied ndashOther ndashDKNA
Q111 Retailer or service provider Q112 Manufacturer Q113 Public authority Q114 An out-of-court dispute resolution body (ADR) Q115 Court
27 Q12 What were the main reasons why you did not take any action -You were unlikely to get a satisfactory solution to the problem you encountered -The sums involved were too small -You did not know how or where to complain -You were not sure of your rights as a consumer -You thought it would take too long -You tried to complain about other problems in the past but were not successful -You thought complaining would have led to a confrontation and you do not feel at ease in such situations ndashOther -DKNA
Region
Country
2018
( = sig
diff EU27)
2018-
2016
2016-
2014
EU27_2019 888 -01 +10
EU28 885 -05 +11
North 901 -01 -01
South 869 -14 +12
East 875 +06 +31
West 895 -06 +01
BE 907 -11 -03
BG 879 +04 +35
CZ 897 +03 -03
DK 911 -12 -04
DE 906 +05 -10
EE 874 -02 -19
IE 874 -20 +24
EL 860 -52 +61
ES 875 -21 +25
FR 905 +00 00
HR 826 -31 +45
IT 860 -08 +40
CY 921 +41 -38
LV 878 -20 +30
LT 863 -17 +10
LU 927 +28 -27
HU 898 +28 +08
MT 889 +29 -37
NL 904 +03 +10
AT 936 +34 -18
PL 882 +11 +18
PT 894 +16 -26
RO 830 -07 +00
SI 917 -13 +10
SK 909 +26 -03
FI 897 +01 +08
SE 915 +14 -11
IS 879 -08 -11
NO 899 +01 -05
UK 863 -35 +18
Problems and complaints
Consumer Survey 2018
122
The problems and complaints indicator is equal to 888 in the European Union Compared to the
EU27_2019 average this indicator is higher in the West (906) and the North (901) whereas it is lower in the South (869) and East (875) The highest levels of the problems and complaints indicator are found in Austria (936) Luxembourg (927) and Cyprus (921) The lowest levels of the problems and complaints indicator are found in Croatia (826) Romania (830) Italy and Greece (both 860)
In this map values above average are coloured in light and dark green and values below average are coloured in light and dark red
Compared to 2016 the level of the problems and complaints indicator remained stable in the
EU27_2019 the North East and West regions whereas it decreased in the South (-14p38) The problems and complaints indicator increased most prominently in Cyprus (+41p) and decreased most prominently in Greece (-52p) In this regard the largest negative and positive reversals are
38 points
Consumer Survey 2018
123
found in Cyprus and Greece respectively In Cyprus the increase between 2016 and 2018 was
preceded by a decrease of 38p between 2014 and 2016 In Greece the problems and complaints indicator increased by 61p between 2014 and 2016 followed by the decrease between 2016 and 2018
The problems and complaints composite indicator is computed based on pre-defined scenarios using data
gathered in Q9 Q10 Q11 and Q1239 ndash Base all EU27_2019 respondents (N=24928)
The problems and complaints composite indicator is computed based on pre-defined scenarios using data
gathered in Q9 Q10 Q11 and Q12 ndash Base all EU27_2019 respondents (N=24928)
With regard to socio-demographic variables and other characteristics vulnerability due to the complexity of offers and terms and conditions is associated most closely with the problems and complaints indicator The characteristics showing the next closest links are consumersrsquo financial situation education employment status and age
Consumers who are not vulnerable in terms of the complexity of offers and terms and conditions have the highest scores on the problems and complaints indicator and thus have experienced a lower
overall level of problems and higher satisfaction with complaint handling) than those who are somewhat vulnerable who in turn have higher scores than those who are very vulnerable
Consumers with a very easy financial situation score higher on the problems and complaints indicator than those who report their situation to be fairly or very difficult Those with a fairly easy financial
39 Problems and complaints rescaled is based on the following function problems_complaints_rescaled=(100-0)(098-011)(problems_complaints_score-098)+100
889 A 900 A
876 A 892 AB 905 B 911 B
914 A 899 A 884
862 A 887 AB 901 BC 908 C
899 A 890 A 895 A
864 A 885 AB 898 BCD 901 BCD
920 CD 881 ABC 922 D 895 ABCD
Unemployed Seeking a job RetiredEmployment status
Self-employed Manager Other white collar
Financial situationVery difficult Fairly difficult Fairly easy
UrbanisationRural area Small town Large town
Blue collar
Student
65+
Education levelLow Medium High
Age18-34 35-54 55-64
Very easy
GenderMale Female
Problems and complaints
896 A 894 A 887 A 900 A
876 A 895 A
899 A 892 A 895 A
887 A 908 B 914 AB 906 AB 931 B
891 A 887 A 899 A
846 887 905
Hardly ever Never
Consumer
vulnerability
(socio-demographic
factors)
Very vulnerableSomewhat
vulnerableNot vulnerable
Internet useDaily Weekly Monthly
Consumer
vulnerability
(complexity)
Very vulnerableSomewhat
vulnerableNot vulnerable
LanguagesOnly native Two
High
Mother tongue
Not official
language in home
country
Official language in
home country
Numerical skillsLow Medium
Three Four or more
Problems and complaints
Consumer Survey 2018
124
situation do not differ from those with a fairly difficult situation but score higher than those with very
difficult situation
Regarding consumersrsquo level of education those with a low or medium level of education score higher on this indicator than those with a high level of education
As far as employment status is concerned those who are seeking a job score higher on the problems and complaints indicator than those who are unemployed managers and self-employed Those who are self-employed have the lowest scores on this indicator and lower than other white collars blue collar workers and students
Finally older consumers tend to score higher on the indicator with those aged 65+ years and 55-64 years scoring higher than those aged 18-34 years
1111 No problems
Percentage of Total ldquoNordquo (answers 3 or 4 at Q9) Base all respondents (N=28037)
Region
Country
2018
( = sig
diff EU27)
2018-
2016
2016-
2014
2014-
2012
EU27_2019 796 -03 +17 +32
EU28 780 -22 +26 +32
North 801 +02 +03 +87
South 753 -46 +53 -08
East 766 +17 +08 +34
West 842 +16 -01 +51
BE 844 -16 +07 +22
BG 847 +06 +49 +95
CZ 801 +15 -27 +156
DK 831 -18 -03 +78
DE 831 +13 +10 +102
EE 763 -23 -19 +25
IE 726 -102 +69 +45
EL 805 -97 +92 +126
ES 783 -55 +60 +59
FR 874 +33 -20 -32
HR 695 -41 +60 +18
IT 706 -45 +59 -92
CY 897 +63 -55 +265
LV 808 -23 +44 +26
LT 786 -44 +09 +39
LU 854 +41 -65 -18
HU 760 +26 +27 +08
MT 829 +55 -68 +15
NL 778 +02 -07 +138
AT 886 +52 +05 +28
PL 760 +46 +15 +43
PT 825 +25 -46 +42
RO 728 -26 -21 -72
SI 844 -20 -07 +89
SK 796 +20 +12 +103
FI 730 +03 +09 +35
SE 832 +34 -05 +159
IS 780 -16 +05 +20
NO 781 -16 -19 +185
UK 663 -160 +90 +38
No problems
Consumer Survey 2018
125
In the European Union the likelihood that consumers do not experience any problem is equal to
796 In the North this incidence is in line with the EU27_2019 average while higher levels are observed in the West (842) and the North (801) and lower levels are observed in the South (753) and the East (766) Among the EU countries the highest proportion of consumers that did not encounter any problem is found in Cyprus (897) Austria (886) and France (874) The lowest levels of this indicator are found in Croatia (695) Italy (706) and Ireland (726) Among all studied countries the UK has the lowest score (663)
Compared to 2016 the proportion of persons not having experienced a problem remained stable in
the EU27_2019 and in the North whereas a decrease is observed in the South (-46pp) and an increase is observed in the East (+17pp) and in the West (+16pp) The level of this indicator increased most prominently in Cyprus (+63pp) and decreased most noticeably in Ireland (-102pp)
The largest positive reversal is observed in Malta where between 2016 and 2018 the proportion of consumers that did not experience problems increased by 55pp whereas between 2014 and 2016 it decreased by 68pp The largest negative reversal in the EU27_2019 is observed in Greece where
between 2016 and 2018 this indicator decreased by 97pp following an increase of 92pp between 2014 and 2016 When we consider all countries of the survey an even larger negative reversal can
be observed in the UK where after it had increased by 90pp between 2014 and 2016 it decreased by 160pp between 2016 and 2018
Percentage of Total ldquoNordquo (answers 3 or 4 at Q9) ndash Base all EU27_2019 respondents (N=24928)
Percentage of Total ldquoNordquo (answers 3 or 4 at Q9) ndash Base all EU27_2019 respondents (N=24928)
With regard to socio-demographic variables and other characteristics not having experienced problems is associated most closely with vulnerability due to the complexity of offers and terms and conditions followed by frequency of internet use age education and gender
783 807
765 791 A 821 B 823 AB
833 A 804 A 777
756 A 792 AB 799 B 811 B
798 A 793 A 796 A
766 A 779 AB 789 AB 813 B
817 B 783 AB 816 AB 806 AB
GenderMale Female
No problems
Blue collar
Student
65+
Education levelLow Medium High
Age18-34 35-54 55-64
Very easy
UrbanisationRural area Small town Large town
Financial situationVery difficult Fairly difficult Fairly easy
Unemployed Seeking a job RetiredEmployment status
Self-employed Manager Other white collar
808 A 794 A 782 A 775 A
773 A 796 A
819 A 800 A 789 A
779 820 A 843 AB 866 AB 888 B
791 A 791 A 799 A
728 782 810
Four or more
No problems
LanguagesOnly native Two
High
Mother tongue
Not official language
in home country
Official language in
home country
Numerical skillsLow Medium
Three
Consumer
vulnerability
(complexity)
Very vulnerableSomewhat
vulnerableNot vulnerable
Hardly ever Never
Consumer
vulnerability
(socio-demographic
factors)
Very vulnerableSomewhat
vulnerableNot vulnerable
Internet useDaily Weekly Monthly
Consumer Survey 2018
126
Consumers who are not vulnerable in terms of the complexity of offers and terms and conditions are
most likely to not experience problems than those who are somewhat vulnerable who in turn are more likely to not experience problems than those who are very vulnerable
Regarding the frequency of internet use daily internet users are less likely not to experience problems than other consumers In addition weekly internet users are also less likely not to experience problems than those who never use the internet
Consumers aged 18-34 are less likely not to experience problems compared to those who are older In turn consumers aged 35-54 report less often that they have experienced no problems compared
to those aged 55-64
As far as consumersrsquo education level is concerned those with a high level of education experience problems less often than those with a low or medium level of education
Finally female consumers are more likely to not experience problems than male consumers
1112 No complaint
This indicator refers to the proportion of respondents who did not make any complaint even though the problems they faced cannot be defined as negligible (ie the sums involved were not too small)
Base Respondents who experienced a problem but did not take any action to solve it (Answer 2 in Q9) and this
was not because the sums involved were too small (Answer 2 in Q12 is excluded) (N=5798)
Region
Country
2018
( = sig
diff EU27)
2018-
2016
2016-
2014
EU27_2019 156 -35 +19
EU28 136 -65 +42
North 126 +26 -09
South 148 -36 -16
East 161 -07 -31
West 165 -61 +97
BE 136 -19 +15
BG 394 -40 +15
CZ 84 -39 -11
DK 121 +32 +29
DE 111 -115 +169
EE 181 -30 +60
IE 148 -174 +111
EL 415 -82 -26
ES 142 +05 -12
FR 314 +35 -07
HR 178 -08 -22
IT 122 -63 -16
CY 317 -74 +161
LV 272 +99 -52
LT 238 -33 -51
LU 103 -129 +80
HU 74 -74 +19
MT 184 -09 +51
NL 80 -10 +16
AT 132 -109 +204
PL 108 +05 -28
PT 124 -33 +52
RO 284 -08 -103
SI 136 +20 -68
SK 99 -15 +29
FI 48 -09 -38
SE 114 +46 +15
IS 168 +27 +15
NO 130 +09 -13
UK 52 -233 +193
Non-negligible problems but no complaint
Consumer Survey 2018
127
The proportion of consumers who experienced a problem but did not take action (the reason for that
not being that the sums involved are too small) is 156 in the European Union In the West East and South the results are in line with the EU27_2019 average while they are lower in the North (126) Among the EU countries28 the highest levels of this indicator are found in Greece (415) Bulgaria (394) and Cyprus (317) whereas the lowest levels are found in Finland (48) Hungary (74) and the Netherlands (80) Among all studied countries the UK (52) also has a low level of this indicator
Compared to 2016 the percentage of consumers who did not complain despite the sums involved
decreased in the EU27_2019 (-35pp) the West (-61pp) and the South (-36pp) while it remained unchanged in the North and the East Compared to the survey in 2016 the level of the indicator increased most steeply in Latvia (+99pp) and decreased most sharply in Ireland (-174pp) The largest positive reversal in the EU27_2019 is found in Austria where between 2016 and 2018 this indicator decreased by 109pp (reflecting a decrease in the incidence of consumers with non-negligible problems) while between 2014 and 2016 it increased by 204pp Considering all countries
in the survey the UK shows an even stronger decrease and positive reversal with a decrease of 233pp between 2016 and 2018 following an increase of 193pp between 2014 and 2016 No statistically significant negative reversals are observed
Base Respondents from the EU who experienced a problem but did not take any action to solve it (Answer 2 in
Q9) and this was not because the sums involved were too small (Answer 2 in Q12 is excluded) (N=5057)
Base Respondents from the EU who experienced a problem but did not take any action to solve it (Answer 2 in
Q9) and this was not because the sums involved were too small (Answer 2 in Q12 is excluded) (N=5057)
Regarding socio-demographic variables and other characteristics the proportion of consumers not taking any action despite experiencing non-negligible problems is associated most closely with the
28 Results for the following countries are based on a very small sample size (less than 100 observations) and should therefore be considered as mainly indicative Malta (87) Luxembourg (73) Cyprus (53)
144 A 160 A
154 A 143 A 157 A 166 A
135 A 137 A 174 A
220 A 183 A 135 91
144 A 160 A 150 A
188 A 170 A 137 A 166 A
154 A 197 A 141 A 125 A
GenderMale Female
Non-negligible problems but no complaint
Blue collar
Student
65+
Education levelLow Medium High
Age18-34 35-54 55-64
Very easy
UrbanisationRural area Small town Large town
Financial situationVery difficult Fairly difficult Fairly easy
Unemployed Seeking a job RetiredEmployment status
Self-employed Manager Other white collar
170 A 158 A 138 A 70
137 A 153 A
180 A 171 A 137 A
140 A 152 AB 148 AB 386 B 263 B
186 B 169 AB 130 A
144 A 143 A 158 A
Four or more
Non-negligible problems but no complaint
LanguagesOnly native Two
High
Mother tongue
Not official language
in home country
Official language in
home country
Numerical skillsLow Medium
Three
Consumer
vulnerability
(complexity)
Very vulnerableSomewhat
vulnerableNot vulnerable
Hardly ever Never
Consumer
vulnerability
(socio-demographic
factors)
Very vulnerableSomewhat
vulnerableNot vulnerable
Internet useDaily Weekly Monthly
Consumer Survey 2018
128
consumerrsquos financial situation languages spoken internet use and vulnerability related to socio-
demographic factors
Consumers who report their financial situation to be fairly or very difficult are more likely to take no action than those whose situation is fairly easy The latter are in turn less likely to take action than those whose situation is very easy
Those who speak three or fewer languages are less likely to take action compared to those speaking at least four languages Between consumers who speak only their native language two languages or three languages there is no difference in this regard
Daily internet users are less likely to take action than those who use the internet hardly ever or never
Finally very vulnerable consumers in terms of socio-demographic factors are less likely to complain when experiencing a non-negligible problem than consumers that are not vulnerable
Consumer Survey 2018
129
Actions taken to resolve problems (breakdown by kind of action plus no
action taken)
The most common actions consumers engage in when they experience a problem is to complain to the retailer or service provider (852) This is followed by complaints to the manufacturer (157)
and a public authority (61) Only a relatively small share of consumers addresses their problems via an ADR platform (55) or takes the business to court (24)
Q10 Answers 1 and 2 Base Respondents who experienced a problem and took action to solve it (N=4381)
In the European Union 852 of the consumers that experienced a problem and took action to solve it complained directly to the retailer or service provider In the North the South and the East the findings are in line with the EU27_2019 average while they are lower in the West (819)
2018
( = sig
diff EU27)
2018-
2016
2016-
2014
2014-
2012
2018
( = sig
diff EU27)
2018-
2016
2016-
2014
2014-
2012
EU27_2019 852 +87 -46 -33 157 -53 +44 +30
EU28 871 +144 -107 -24 178 -59 +56 +39
North 854 -31 +00 -20 110 +05 -18 +27
South 878 +22 +59 -43 243 +77 -26 +36
East 861 -22 +67 -46 124 -20 +15 +38
West 819 +260 -249 -14 104 -223 +152 +18
BE 795 +25 -69 +74 164 -22 -38 +76
BG 617 -74 +90 -272 67 -23 +07 +29
CZ 876 -24 -07 -68 129 +27 -25 +31
DK 826 -28 -03 -38 176 -48 +53 +35
DE 812 +311 -272 -39 108 -242 +176 +08
EE 878 +26 -108 +107 95 +01 +56 -53
IE 915 +396 -373 -19 181 -202 +244 +35
EL 780 +29 +88 +03 218 +106 -66 -57
ES 836 -08 +22 -54 207 +01 -23 +87
FR 794 +325 -367 +103 53 -366 +199 +05
HR 862 -32 +22 +17 145 +19 -13 -00
IT 908 +46 +87 -55 282 +125 -11 +15
CY 766 -105 +110 -108 92 +15 -84 +37
LV 852 -07 -43 +117 61 +05 -10 -19
LT 762 +54 +16 -48 53 +19 -107 +116
LU 819 +295 -209 +42 263 -62 +64 +184
HU 937 +11 +45 -23 63 +50 -76 -04
MT 872 +31 -08 -56 83 -70 +66 -37
NL 858 -05 +05 -49 104 -26 +10 +12
AT 847 +403 -459 -10 152 -162 +187 +11
PL 838 -67 +78 -22 123 -46 +15 +64
PT 870 -01 -60 +105 97 +09 -121 +48
RO 880 +74 +121 +36 188 -20 +140 -37
SI 933 -44 +46 +10 41 +07 -52 +38
SK 935 +70 +69 -164 69 -50 -64 +108
FI 875 -54 +67 -26 139 +29 -87 +17
SE 872 -35 -33 -11 69 -03 +09 +09
IS 950 +36 -50 +40 105 +28 +38 -26
NO 832 -35 +48 -71 108 +14 -15 +09
UK 940 +601 -611 +20 257 -245 +241 +88
Actions taken to resolve problems
Region
Country
Complained to the retailer or service
providerComplained to the manufacturer
Consumer Survey 2018
130
Among the EU countries29 the highest levels of this indicator are found in Hungary (937) Slovakia
(935) and Slovenia (933) Of all studied countries Iceland (950) and the UK (940) have a high level as well The lowest levels are found in Bulgaria (617) Lithuania (762) and Cyprus (766)
The proportion of respondents who complained to the retailer or service provider increased between 2016 and 2018 in the EU27_2019 (+87pp) and the West (+260pp) while no statistically significant changes are observed in the North South and East Among all EU countries the proportion of consumers who complained to the retailer or service provider increased most steeply in Austria
(+403pp) and decreased most prominently in Poland (-67pp) When looking at changes in 2018 (vs 2016) and in 2016 (vs 2014) the largest positive reversal in the EU27_2019 is also found in Austria where the increase between 2016 and 2018 comes after a decrease of 459pp between 2014 and 2016 Among all countries the UK shows an even larger positive reversal where between 2016 and 2018 this indicator increased by 601pp whereas between 2014 and 2016 it decreased by 611pp The only negative reversal is found in Poland where the large decrease between 2016 and
2018 (see above) was preceded by an increase of 78pp between 2014 and 2016
In the European Union the proportion who complained to the manufacturer is 157 Compared
to the EU27_2019 average this proportion is higher in the South (243) and lower in the West (104) the North (110) and the East (124) Among the EU countries the highest levels of this indicator are found in Italy (282) Luxembourg (263) and Greece (218) Furthermore the UK (257) also has high levels for this indicator The lowest levels are found in Slovenia (41) France and Lithuania (both 53) and Latvia (61)
Compared to 2016 the proportion of consumers who complained to the manufacturer decreased in the EU27_2019 (-53pp) and the West (-223pp) increased in the South (+77pp) and remained stable in the North and East The likelihood that consumers would complain to manufacturers directly increased most markedly in Italy (+125pp) and decreased most prominently in France (-366pp) The only positive reversal is found in Hungary where between 2016 and 2018 this indicator increased by 50pp whereas between 2014 and 2016 it decreased by 76pp The largest negative reversal is found in France where the large decrease in the proportion of respondents that complained to a
manufacturer between 2016 and 2018 (see above) comes after an increase of 199pp between 2014 and 2016
29 Results (for both retailersservice providers and manufacturers) for the following countries are based on a very small sample size (less than 100 observations) and they should be therefore considered as mainly indicative Greece (94) Austria (90) Bulgaria (83) Iceland (81) France (76) Malta (69) Luxembourg (49) Cyprus (25)
Consumer Survey 2018
131
Q10 Answers 1 and 2 Base Respondents from the EU who experienced a problem and took action to solve it
(N=3758 for complaints to retailer or service provider N=3748 for complaints to manufacturer)
Male 834 178
Female 877 136
18-34 851 A 189 B
35-54 858 A 118 A
55-64 844 A 157 AB
65+ 859 A 244 B
Low 714 246 A
Medium 849 A 161 A
High 881 A 145 A
Very difficult 773 A 173 A
Fairly difficult 842 AB 163 A
Fairly easy 880 B 159 A
Very easy 837 AB 139 A
Rural area 836 A 200 B
Small town 882 136 A
Large town 835 A 152 AB
Self-employed 851 ABC 179 ABC
Manager 854 ABC 138 ABC
Other white collar 876 BC 189 BC
Blue collar 850 AB 145 ABC
Student 919 C 111 AB
Unemployed 872 ABC 189 ABC
Seeking a job 879 ABC 268 C
Retired 773 A 96 A
Actions taken to resolve problems
Complained to the
retailer or service
provider
Complained to the
manufacturer
Gender
Age groups
Education
Financial Situation
Urbanisation
Employment status
Consumer Survey 2018
132
Q10 Answers 1 and 2 Base Respondents from the EU who experienced a problem and took action to solve it
(N=3758 for complaints to retailer or service provider N=3748 for complaints to manufacturer)
With regard to socio-demographic variables and other characteristics education is associated most
closely with the proportion of persons who complains to retailers or service providers The characteristics showing the next closest links are consumersrsquo gender urbanisation numerical skills and employment status
Consumers with a high or medium level of education are more likely to complain directly to retailers or service providers than those who have a low level of education
Regarding gender females are more likely to complain to the retailer or service provider than males
Consumers who live in a small town are more likely to complain to the retailer or service provider than those living in a rural area or a large town
Those with a high numerical skill level are more likely to complain to retailers or service providers than those with a medium skill level
Finally students are more likely to have made such complaints compared to the retired and blue-collar workers Other white collars are also more likely to have made such complaints than people who are retired
Only native 846 AB 159 A
Two 843 A 156 A
Three 873 AB 178 A
Four or more 897 B 131 A
Not official
language in home
country
826 A 139 A
Official language
in home country855 A 160 A
Low 799 AB 104 A
Medium 813 A 198
High 880 B 147 A
Daily 844 A 165 B
Weekly 893 A 96 A
Monthly 902 AB 167 AB
Hardly ever 984 B 287 AB
Never 893 A 90 AB
Very vulnerable 848 A 152 A
Somewhat
vulnerable880 A 146 A
Not vulnerable 840 A 168 A
Very vulnerable 850 A 165 AB
Somewhat
vulnerable859 A 202 B
Not vulnerable 856 A 138 A
Complained to the
retailer or service
provider
Complained to the
manufacturer
Consumer vulnerability
(complexity)
Actions taken to resolve problems
Languages
Mother Tongue
Numerical skills
Internet use
Consumer vulnerability
(socio-demographic
factors)
Consumer Survey 2018
133
With regards to complaints to the manufacturer this indicator is most closely linked with gender
followed by age degree of urbanisation and employment status
Regarding gender males are more likely to complain to the manufacturer than females
Consumers who are aged 18-34 years and 65+ years are more likely to make such types of complaints than those who are aged 35-54 years
Consumers living in a rural area are more likely to make such complaints than those living in a small town
Finally jobseekers and other white collars are more likely to complain to the manufacturer compared
to those who are retired
Q10 Answers 3 4 and 5 Base Respondents who experienced a problem and took action to solve it (N=4381)
In the European Union the proportion of consumers that complains to a public authority is 61 In the South and the East this proportion is consistent with the EU27_2019 average whereas it is
lower in the North (43) and the West (41) The highest levels of this indicator in the
2018
( = sig
diff EU27)
2018-
2016
2016-
2014
2014-
2012
2018
( = sig
diff EU27)
2018-
2016
2016-
2014
2014-
2012
2018
( = sig
diff EU27)
2018-
2016
2016-
2014
2014-
2012
EU27_2019 61 -28 +11 +31 55 +03 -14 +16 24 +08 -12 +10
EU28 67 -24 +12 +26 64 +13 -18 +14 25 +09 -12 +09
North 43 -01 +10 +07 22 -15 -06 +26 07 -03 +09 -02
South 78 +09 -32 +29 84 +10 -11 +28 29 +04 +06 +04
East 70 -01 +22 +22 30 -20 +18 +02 07 -06 -05 +09
West 41 -92 +48 +40 49 +15 -41 +12 34 +24 -37 +19
BE 113 +63 -16 -24 95 +02 +27 -89 21 -18 +13 -18
BG 159 +49 -50 +95 22 -111 +28 +70 12 +02 +00 +01
CZ 53 +31 -25 -15 37 +29 -07 +08 06 +05 -21 +30
DK 30 -04 +00 -10 15 -21 -08 +23 14 -18 +37 00
DE 34 -117 +95 +16 23 -11 -24 +15 35 +27 -28 +31
EE 39 -60 +58 -39 34 -36 +29 +14 00 00 00 00
IE 95 -10 +39 +60 61 +43 -47 +47 32 +25 -00 -13
EL 257 +89 -149 +203 82 -53 -08 +55 38 +15 +15 -08
ES 121 -32 +14 +45 114 -45 +58 +32 27 -15 +14 +13
FR 40 -125 -37 +123 121 +115 -150 -44 38 +37 -99 -59
HR 55 +38 -32 +29 19 -07 +07 +21 12 -02 +08 -14
IT 45 +24 -44 +28 73 +45 -47 +36 29 +09 +04 +00
CY 139 -15 -19 +111 58 -08 +64 +16 00 00 00 00
LV 94 -44 +28 +30 28 -10 +27 -04 14 +14 -08 +02
LT 145 +74 -26 +78 35 -13 +10 +14 23 +14 -14 +08
LU 82 -86 +29 +149 21 -11 -131 +46 21 +22 -67 -52
HU 21 -04 -50 +46 05 -08 +01 -06 00 -06 +06 +04
MT 78 -80 -06 +136 00 -45 -37 +69 00 00 -21 +15
NL 26 -06 -12 +08 25 -39 +33 +03 35 +05 -17 +35
AT 35 -188 +115 +87 28 -28 -25 +69 20 +11 -08 -07
PL 60 -08 +44 +15 36 -45 +38 -11 05 -06 -17 +21
PT 44 -10 -73 +50 39 -23 -09 +11 34 +36 -12 -20
RO 138 -32 +66 +26 40 +36 -01 +11 16 -17 +30 -42
SI 65 +53 -11 -02 28 +17 -23 +19 06 +06 -10 +05
SK 13 -37 +12 -01 00 -09 -08 +15 00 -14 -05 +18
FI 25 +09 -13 +10 14 -17 -22 +39 00 -07 +07 -09
SE 35 -10 +32 -05 27 -09 -05 +25 07 +01 +06 -02
IS 27 +21 -08 -03 00 -11 +01 -14 00 -20 +20 -15
NO 08 +00 -00 -13 26 +05 +04 -04 08 +08 -04 -10
UK 90 -18 +21 -05 100 +59 -45 +06 28 +08 -08 +05
Actions taken to resolve problems
Region
Country
Complained to a public authority Complained to ADR Took the business concerned to court
Consumer Survey 2018
134
EU27_201930 are found in Greece (257) Bulgaria (159) and Lithuania (145) The lowest
levels among the EU countries are found in Slovakia (13) Hungary (21) and Finland (25) Considering all studied countries the level is also low in Norway (08)
Compared to 2016 the proportion of consumers who complains towards a public authority decreased in the EU27_2019 (-28pp) and the West (-92pp) while it remained relatively stable in the North the East and the South This indicator increased most steeply in Slovenia (+53pp) and decreased most prominently in Austria (-188pp) When looking at statistically significant changes in 2018 (vs 2016) and in 2016 (vs 2014) the only positive reversal is found in Croatia where between 2016
and 2018 this indicator increased by 38pp whereas between 2014 and 2016 it decreased by 32pp The largest negative reversal is found in Austria where the proportion of consumers that took action by complaining to a public authority decreased between 2016 and 2018 (see above) after it increased by 115pp between 2014 and 2016
The proportion of consumers who experienced a problem and complained to an ADR is 55 in the European Union In the West this is in line with the EU27_2019 average while it is higher in the
South (84) and lower in the North (22) and the East (30) Among the EU countries the highest levels of this indicator are found in France (121) Spain (114) and Belgium (95)
Besides these countries the proportion is also high in the UK (100) The lowest levels are found in Malta Slovakia (both 00) Hungary (05) and Finland (14) In addition the level is also very low in Iceland (00)
Between 2016 and 2018 the proportion of consumers who brought their complaints to an ADR remained stable in the EU27_2019 in the North South and West while a decrease is observed in
the East (-20pp) At country level the highest increase compared to the 2016 survey is found in France (+115pp) In France also the largest positive reversal is found where the increase between 2016 and 2018 comes after a decrease of 150p between 2016 and 2018 The sharpest decrease in the degree to which matters were brought to an ADR is found in Bulgaria (-111pp) No negative reversals are observed
In the European Union the proportion of consumers that take their complaints to court is 24 This indicator is in line with the EU27_2019 average in the South and the West whereas it is
noticeable lower in the North and the East (both 07) The highest values in the EU Member States are found in France (38) Greece (38) Germany (35) and the Netherlands (35) whereas the lowest values are found in Estonia Cyprus Hungary Malta Slovakia and Finland (all 0) Consumers in Iceland are also highly unlikely to bring their complaints to a court (0)
Compared to 201640 consumers are more likely to take a business to court in the EU27_2019 (+08pp) and the West (+24pp) while the results remained stable in the North the South and the
East Compared to the survey in 2016 there is only one statistically significant change for this indicator namely an increase in Portugal (+36pp) No positive or negative reversals are found
30 Results (for public authority ADR and court) for the following countries are based on a very small sample size (less than 100 observations) and they should be therefore considered as mainly indicative Greece (94) Austria (90) Bulgaria (83) Iceland (81) France (76) Malta (69) Luxembourg (49) Cyprus (25)
40 As discussed in the Introduction of this report (see chapter 125) different methodologies are applied for the 2018 estimations (weighted on age gender phone ownership and population size) and the 2018-2016 comparisons (weighted on age gender and population size no phone ownership) making it impossible to compute the 2016 values For example it may appear that the incidence is less than 0 in 2016 (eg in Luxembourg the table shows 21 in 2018 and an increase between 2016 and 2018 of 22pp indicating a 2016 result of -01) If the same weighting is applied the values are close to 0
Consumer Survey 2018
135
Q10 Answers 3 4 and 5 Base Respondents who experienced a problem and took action to solve it (N=3748
for public authoritiesADR N=3670 for court)
Male 76 73 27 A
Female 45 36 21 A
18-34 55 AB 31 A 16 A
35-54 82 B 52 AB 23 A
55-64 65 B 58 AB 32 A
65+ 28 A 162 B 53 A
Low 49 A 67 A 46 A
Medium 57 A 54 A 22 A
High 69 A 55 A 22 A
Very difficult 83 AB 89 AB 68 B
Fairly difficult 85 B 71 B 45 B
Fairly easy 40 A 49 AB 14 A
Very easy 60 AB 35 A 11 A
Rural area 57 A 58 A 27 A
Small town 53 A 53 A 16 A
Large town 76 A 57 A 33 A
Self-employed 75 C 108 C 26 AB
Manager 44 ABC 67 ABC 11 A
Other white collar 38 AB 53 AB 22 AB
Blue collar 81 C 84 BC 45 B
Student 125 BC 25 A 24 AB
Unemployed 58 ABC 42 ABC 20 AB
Seeking a job 22 A 66 ABC 19 AB
Retired 98 C 26 A 22 AB
Age groups
Actions taken to resolve problemsComplained to a
public authority
Complained to
ADR
Took the business
concerned to court
Gender
Education
Financial Situation
Urbanisation
Employment status
Consumer Survey 2018
136
Q10 Answers 3 4 and 5 Base Respondents who experienced a problem and took action to solve it (N=3748
for public authoritiesADR N=3670 for court)
In terms of complaints made to a public authority this indicator is most closely linked with gender followed by consumersrsquo employment status and age
Males are more likely to complain to a public authority than females
In addition jobseekers are less likely to make complaints to a public authority than those who are
self-employed blue collar workers retired and students
Regarding age consumers aged 35-64 years are more likely to complain than those who are aged
65+ years
In terms of complaints made to an ADR this indicator is most closely linked with gender followed by age consumersrsquo employment status and their financial situation
Similar to complaints made to a public authority males are more likely to file their complaints with an ADR than females
Consumers aged 65+ years are more likely to have complained to an ADR than those aged 18-34 years
Only native 58 A 67 A 18 A
Two 61 A 50 A 30 A
Three 65 A 37 A 17 A
Four or more 64 A 77 A 44 A
Not official
language in home
country
115 A 67 A 05
Official language
in home country58 A 55 A 26
Low 82 A 66 A 53 A
Medium 58 A 66 A 25 A
High 61 A 49 A 20 A
Daily 59 A 57 A 27 B
Weekly 61 A 39 A 11 AB
Monthly 169 A 117 A
Hardly ever 99 A 49 A
Never 82 A 43 A 08 A
Very vulnerable 76 A 51 A 34 A
Somewhat
vulnerable59 A 54 A 10
Not vulnerable 57 A 58 A 29 A
Very vulnerable 75 A 66 A 24 A
Somewhat
vulnerable63 A 43 A 25 A
Not vulnerable 57 A 58 A 25 A
Actions taken to resolve problems
Consumer vulnerability
(socio-demographic
factors)
Consumer vulnerability
(complexity)
Complained to
ADR
Took the business
concerned to court
Languages
Mother Tongue
Numerical skills
Internet use
Complained to a
public authority
Consumer Survey 2018
137
In terms of employment self-employed respondents are more likely to complain to an ADR than
other white collars students and those who are retired People in a blue-collar job are also more likely to complain than students and people who are retired
Finally consumers in a fairly difficult financial situation are more likely to involve an ADR than consumers in a very easy financial situation
In terms of taking the business concerned to court this indicator is associated most closely with consumersrsquo financial situation Other characteristics that show close links with the indicator whether a consumerrsquos mother tongue is the official language in their country of residence or not the frequency
of internet use and consumersrsquo employment status
Consumers in a reportedly more difficult financial situation are more likely to take the business concerned to court Those whose situation is reportedly fairly or very difficult are more likely to take such action than those whose situation is reported as fairly or very easy
Those whose mother tongue is one of the official languages of the country or region in which they live are more likely to take the business concerned to court than those whose mother tongue is not
an official language
In terms of internet use daily internet users are more likely to take the business to court than consumers that never use the internet
Finally blue collar workers are more likely to take the business concerned to court than managers
Reasons for not taking action
The reasons why a considerable proportion of consumers that experiences problems do not act (see section 1112) differ widely The most commonly cited reasons are consumersrsquo perception that it would take long to resolve the problem (412) that the sums involved are too small (357) and that consumers find it unlikely to get a satisfactory solution (340) A considerable proportion of consumers are also not comfortable with potential confrontations resulting from complaints (185) have unsuccessfully complained in the past (18) are not sure of their own rights as consumers (179) or do not know where or how to complain (172)
Consumer Survey 2018
138
Q12 Answers 1 2 and 3 Base Respondents who experienced a problem but did not take any action to solve it (N=1417)
2018
( = sig
diff EU27)
2018-
2016
2016-
2014
2014-
2012
2012-
2011
2018
( = sig
diff EU27)
2018-
2016
2016-
2014
2014-
2012
2012-
2011
2018
( = sig
diff EU27)
2018-
2016
2016-
2014
2014-
2012
2012-
2011
EU27_2019 340 +119 -162 +118 -91 357 +18 +05 -27 -43 172 +28 -85 +51 +80
EU28 366 +167 -213 +125 -80 397 +57 -08 -30 -44 201 +50 -91 +38 +85
North 259 -02 -60 +151 -91 372 -39 -47 -02 +116 126 -14 -57 +112 +53
South 425 +141 -92 +84 -120 454 +153 -18 +46 -31 195 +32 -99 +87 +117
East 310 -51 +86 +45 -138 297 -52 +99 -170 -29 162 +01 +42 -12 +27
West 269 +167 -404 +228 +33 277 -85 -57 +52 -03 159 +36 -168 +49 +140
BE 252 +248 -458 +142 -29 307 +257 -397 +135 -107 180 +39 -120 +12 +42
BG 358 +38 -89 +176 -207 178 +88 -105 -24 +02 69 +14 -66 +01 +62
CZ 389 +62 -137 +74 -46 552 +148 +114 -143 +183 205 -61 +05 +78 +127
DK 237 -69 +65 +165 -49 251 -79 -264 -43 +510 47 -140 +112 +105 +26
DE 126 -14 -262 +165 +72 288 -165 -58 +73 -151 134 +20 -188 +147 +31
EE 219 -90 +107 +129 -72 410 +60 -91 +105 +53 61 -15 -48 +53 +08
IE 500 +359 -229 +11 -117 425 +164 +67 -70 -15 284 +131 -200 +246 -25
EL 426 +18 +49 +50 -12 275 +82 +10 -58 -154 331 +133 -104 -25 +182
ES 548 +203 -187 +280 +93 456 +54 -35 +84 -133 283 -83 -34 +250 +164
FR 354 +330 -554 +267 -52 247 -02 -137 +89 +76 173 +45 -161 -88 +269
HR 438 +87 +94 -91 - 327 -12 +68 -38 - 228 -32 +06 +134 -
IT 371 +113 -55 +32 -311 516 +207 -00 +61 +29 104 +39 -114 +67 +49
CY 202 -23 +181 -284 +114 369 +172 +08 -107 +06 147 +01 -20 -32 +49
LV 251 +132 -280 +158 -17 325 -46 +09 -132 +185 150 +38 -96 +47 +157
LT 409 +201 -100 +70 -134 441 +176 +94 -116 +63 235 +93 +67 +38 +26
LU 83 -62 -315 +168 +197 693 +331 -198 +527 -368 80 -03 +87 -441 +347
HU 105 -275 +136 +131 -91 523 -61 +208 -239 +103 73 -09 -75 +49 +49
MT 117 -74 -184 +169 -157 129 -152 +81 -342 +227 00 -207 -99 +250 -245
NL 189 -48 -126 +160 +239 338 -05 +180 -253 +318 105 -42 -149 +162 +156
AT 296 +198 -326 +156 -101 173 -187 -412 +340 +121 90 -60 -103 +110 +143
PL 226 -92 +59 +135 -134 201 -140 +65 -224 +12 84 +12 +29 -45 -55
PT 196 +46 -255 -128 +379 231 +126 -162 -88 +140 265 +58 -81 -94 +342
RO 370 -66 +185 -30 -267 287 -53 +171 -220 -141 242 -17 +120 +01 +25
SI 178 -71 +142 -78 -92 250 +48 +02 +54 -22 134 -152 +101 +40 +83
SK 76 -59 +15 -247 +167 363 -09 -226 +156 +104 00 -55 +19 -161 +167
FI 184 -66 -67 +133 -63 570 -46 +112 -72 +51 112 -09 -65 +79 +16
SE 183 -141 -29 +259 -124 256 -135 -214 +135 +26 82 -88 -208 +269 +67
IS 340 +22 +76 -09 -132 283 -01 -147 -94 +397 265 +10 +236 -330 +330
NO 89 +05 +41 -143 -102 109 -40 +73 -271 +19 47 +22 +24 -118 +118
UK 540 +469 -602 +173 +63 662 +325 -121 -64 -17 394 +210 -166 -93 +184
Reasons for not taking action
Region
Country
Unlikely to get satisfactory solution The sums involved were too small Did not know where or how to complain
Consumer Survey 2018
139
In the European Union the proportion of consumers that did not take action because they thought they were unlikely to get a satisfactory solution is 340 In the East this proportion is in line
with the EU27_2019 average while it is higher in the South (425) and lower in the North (259) and West (269) Among all EU countries31 the highest levels of this indicator are found in Spain (548) Ireland (500) and Estonia (219) The UK (540) also has a high level of this indicator The lowest levels are found in Slovakia (76) Luxembourg (83) and Hungary (105)
Additionally Norway also has a low level of 89
Between 2016 and 2018 the proportion of consumers who did not complain because they thought they were unlikely to get a satisfactory solution increased in the EU27_2019 (+119pp) the West (+167pp) and South (+141pp) while no statistically significant changes are observed in the North and East Compared to the survey in 2016 this proportion increased most notably in Ireland (+359pp) and decreased most prominently in Hungary (-275pp) The largest positive reversal among the EU27_2019 countries is found in France where between 2016 and 2018 the proportion
of consumers that did not complain for this reason increased by 330pp whereas between 2014 and 2016 it decreased by 554pp Considering all studied countries an even larger positive reversal is found in the UK where between 2016 and 2018 this indicator increased by 469pp following a decrease of 602pp between 2014 and 2016 No negative reversals are observed
The proportion of consumers that did not complain because the sums involved were too small is
357 in the European Union In the North this proportion is in line with the EU27_2019 average
while it is higher in the South (454) and lower in the East (297) and West (277) Across the EU Member States the highest levels of this indicator are found in Luxembourg (693) Finland (570) and the Czech Republic (552) Among all studied countries the UK also has a high level of this indicator (662) The lowest levels in the EU are found in Malta (129) Austria (173) and Bulgaria (178)41 Norway also has a low level namely 109
Compared to 2016 the EU27_2019 average as well as the results in the North and the East remained relatively stable while the proportion increased in the South (+153pp) and decreased in the West
(-85pp) The degree to which respondents indicated that the sums involved were too small increased most steeply in Luxembourg (+331pp) There are no statistically significant decreases at country level The only positive reversal is found in Belgium where between 2016 and 2018 this indicator increased by 257pp whereas between 2014 and 2016 it decreased by 397pp No negative reversals are observed
In the European Union consumers did not complain because they did not know where or how to complain in 172 of all cases42 In the South East and West this proportion is in line with the
EU27_2019 average while it is lower in the North (126) Among the EU countries the highest levels of this indicator are observed in Greece (331) Ireland (284) and Spain (283) Considering all studied countries the UK also has a high level for this indicator (394) The lowest levels among all EU Member States are observed in Slovakia Malta (both 00) Denmark (47) and Estonia (61) Among all studied countries the level is also low in Norway (47)
Since 2016 the proportion of consumers that did not know where or how to complain increased in
the EU27_2019 (+28pp) whereas no statistically significant changes are observed in all regions The highest increase in the EU is noted in Greece (+133pp) while the strongest decrease is observed in Malta (-207pp) No positive or negative reversals are found in the EU27_2019 countries Considering all countries in the study the only positive reversal is found in the UK where between 2016 and 2018 this indicator increased by 210pp whereas between 2014 and 2016 it decreased by 166pp
31 Results (for all reasons for not taking action) for all countries except Romania (111) and Greece (116) are based on a very small sample size (less than 100 observations) and should therefore be considered as mainly indicative
41 All cases of respondents who experienced a problem but did not take any action to solve it
Consumer Survey 2018
140
Q12 Answers 1 2 and 3 Base EU27_2019 respondents who experienced a problem but did not take any action
to solve it (N=1297)
Male 357 A 393 A 194 A
Female 326 A 338 A 156 A
18-34 384 A 400 A 207 A
35-54 320 A 348 A 174 A
55-64 333 A 331 A 174 A
65+ 320 A 369 A 133 A
Low 492 B 381 A 286 A
Medium 310 A 394 A 197 A
High 345 AB 329 A 120
Very difficult 227 A 335 A 196 A
Fairly difficult 405 B 330 A 137 A
Fairly easy 325 AB 387 A 205 A
Very easy 380 AB 479 A 232 A
Rural area 321 A 365 A 157 A
Small town 334 A 386 A 139 A
Large town 372 A 333 A 259
Self-employed 434 CD 284 A 269 B
Manager 430 BCD 288 A 136 AB
Other white collar 276 B 373 A 136 A
Blue collar 305 BCD 376 A 175 AB
Student 141 A 442 A 91 A
Unemployed 441 CD 307 A 192 AB
Seeking a job 263 ABC 438 A 161 AB
Retired 472 D 399 A 220 AB
Age groups
Reasons for not taking action
Unlikely to get
satisfactory
solution
The sums involved
were too small
Did not know
where or how to
complain
Gender
Education
Financial Situation
Urbanisation
Employment status
Consumer Survey 2018
141
Q12 Answers 1 2 and 3 Base EU27_2019 respondents who experienced a problem but did not take any action
to solve it (N=1297)
With regard to socio-demographic variables and other characteristics whether a consumerrsquos mother tongue is the official language in their country of residence or not is the factor most closely associated with the likelihood of consumers not taking any action to solve a problem because they thought they were unlikely to get a satisfactory solution The other characteristics showing close links
are frequency of internet use and consumersrsquo employment situation
Consumers whose mother tongue is not one of the official languages of the country or region in which they live are more likely to not take action because they do not believe that they will get a satisfactory solution than those whose mother tongue is one of the official languages
As far as the frequency of internet use is concerned daily and weekly internet users are more likely to report this reason for not taking action than those who used the internet hardly ever or never
Finally retired respondents are more likely to cite this reason for not taking action than jobseekers and people with another white-collar job The latter are in turn more likely to cite this reason than students
Only native 311 A 368 A 179 A
Two 335 AB 353 A 172 A
Three 449 B 349 A 179 A
Four or more 311 AB 509 A 134 A
Not official
language in home
country
589 312 A 276 A
Official language
in home country329 368 A 169 A
Low 300 A 258 A 92 A
Medium 349 A 348 A 212 B
High 343 A 391 A 161 AB
Daily 357 B 371 A 159 A
Weekly 490 B 325 A 210 A
Monthly 374 AB 451 A 269 A
Hardly ever 138 A 183 A 292 A
Never 176 A 390 A 197 A
Very vulnerable 368 AB 322 A 229 A
Somewhat
vulnerable425 B 382 A 217 A
Not vulnerable 266 A 378 A 115
Very vulnerable 316 A 408 AB 112
Somewhat
vulnerable344 A 426 B 192 A
Not vulnerable 351 A 320 A 191 A
Reasons for not taking action
Consumer vulnerability
(socio-demographic
factors)
Consumer vulnerability
(complexity)
The sums involved
were too small
Did not know
where or how to
complain
Languages
Mother Tongue
Numerical skills
Internet use
Unlikely to get
satisfactory
solution
Consumer Survey 2018
142
Regarding the proportion of consumers not taking any action because they believe that the sums
involved are too small there are no close associations with any of the socio-demographic characteristics43
With regard to the likelihood of consumers not taking any action to solve a problem because they did not know where or how to complain consumersrsquo level of education is the factor associated most closely with this indicator The characteristics showing the next closest links are the degree of urbanisation vulnerability due to socio-demographic factors vulnerability due to the complexity of offers and terms and conditions and employment status
Consumers with a low or medium level of education are more likely to not take action because they do not know where or how to complain than those with a high level of education
As far as the degree of urbanisation is concerned consumers living in a large town are less likely to refrain from complaining for this reason than those living in a small town or rural area
Consumers who are very or somewhat vulnerable due to socio-demographic factors are more likely not to take action compared to those who are not vulnerable
In contrast those who are not or somewhat vulnerable in terms of the complexity of offers and terms and conditions are more likely to refrain from complaining due to this reason than those who are very vulnerable
Finally consumers who are self-employed are more likely to report that they do not know where or how to complain compared to people with other white-collar jobs and students
43 While vulnerability due to the complexity of offers and terms and conditions effects this dependent variable as shown by the models estimated variability of this dependent variable there is no coherence of this variability Concretely both consumers that are not vulnerable and very vulnerable show lower levels than consumers that are somewhat vulnerable
Consumer Survey 2018
143
Q12 Answers 4 and 5 - Base Respondents who experienced a problem but did not take any action to solve it
(N=1417)
The proportion of consumers who did not complain because they thought it would take too long is 412 in the European Union This is in line with the results in the North and East while the
proportion is higher than the EU27_2019 average in the South (507) and lower in the West (331) Across the EU Member States the highest levels of this indicator are found in Spain (639) Latvia (555) and Ireland (520) The lowest levels are found in Portugal (32) Malta
(114) and Cyprus (174)
Compared to 2016 the proportion of respondents who did not complain because they expected that it would take too long increased in the EU27_2019 (+76pp) the South (+112pp) and the West (+80pp) while no statistically significant changes are observed in the North and the East The degree to which respondents indicated not being sure of their consumer rights increased most steeply in Ireland (+304pp) and decreased most prominently in Bulgaria (-220pp) Among the EU27_2019
countries the largest positive reversal is found in Belgium where between 2016 and 2018 the proportion increased by 294pp whereas between 2014 and 2016 it decreased by 481pp The largest
2018
( = sig
diff EU27)
2018-
2016
2016-
2014
2014-
2012
2012-
2011
2018
( = sig
diff EU27)
2018-
2016
2016-
2014
2014-
2012
2012-
2011
EU27_2019 412 +76 -47 +47 +81 179 +19 -22 +27 +43
EU28 428 +96 -57 +17 +96 211 +57 -68 +39 +33
North 385 +60 +07 -85 +169 146 -08 -10 +86 +14
South 507 +112 -19 +69 +146 206 +58 -19 +33 +46
East 362 -50 +82 +33 +19 133 -74 +75 -18 +38
West 331 +80 -147 +60 +152 185 +41 -110 +62 +87
BE 360 +294 -481 +262 -114 256 +189 -178 -165 +34
BG 221 -220 +107 +60 +111 51 -56 +10 +05 +71
CZ 479 +85 -17 +22 +212 231 +128 -199 +45 +217
DK 328 +03 +230 -305 +294 132 -35 -24 +129 -36
DE 255 -06 +105 -177 +300 158 +14 -15 +03 +32
EE 473 +19 +67 +58 +77 188 +46 +50 +50 -03
IE 520 +304 +64 -91 +50 267 +152 -115 +132 -188
EL 463 -24 +112 +04 +64 274 +88 -136 +104 +41
ES 639 +52 +35 +122 +20 327 -74 +52 +21 +228
FR 367 +126 -284 +106 +100 202 +21 -137 +95 +161
HR 472 +88 +50 +40 - 214 +104 -100 +70 -
IT 479 +153 -34 +64 +220 125 +85 -01 +37 -52
CY 174 -79 +167 -159 +106 35 -102 +141 -95 +95
LV 555 +163 -134 -22 +233 133 +62 -180 +169 +53
LT 471 +68 +115 -02 +54 247 +177 -46 +23 +59
LU 366 +20 -12 -69 +311 122 -43 -108 -03 +89
HU 202 -10 -143 +118 -26 73 -08 -92 +102 +06
MT 114 +61 -96 +77 +118 154 +68 -336 +320 +53
NL 300 +58 -11 +95 -10 92 +61 -63 -12 +74
AT 293 -38 -34 +330 +14 137 +99 -135 +119 +89
PL 192 -150 +54 +52 -04 29 -269 +183 -66 +82
PT 32 -184 -337 +237 +182 110 +19 -137 +06 +94
RO 495 -67 +175 +09 -22 190 -74 +147 +02 -77
SI 307 +29 +35 +43 -67 134 -52 -133 +264 +03
SK 256 +98 +120 -218 +159 174 +125 +10 -95 -22
FI 179 +20 -97 +88 +31 127 -95 +106 +25 -88
SE 329 -14 -29 -197 +332 54 -133 -20 +171 +67
IS 510 +346 -112 -75 +152 398 +375 -128 +151 00
NO 213 +58 -175 -30 +97 100 +45 +55 -117 +117
UK 534 +236 -143 -286 +314 429 +316 -456 +121 +44
Reasons for not taking action
Region
Country
Thought it would take too long Were not sure of own rights as a consumer
Consumer Survey 2018
144
negative reversal is found in Portugal where between 2016 and 2018 the proportion decreased by
184pp following an increase of 337pp between 2014 and 2016
The proportion of respondents who did not complain because they were not sure of their consumer rights is 179 in the European Union In the North South and West the results are in line with the EU27_2019 average whereas the proportion is lower in the East (133) The highest levels of this indicator in the EU32 are found in Spain (327) Greece (274) and Ireland (267) High levels of this indicator are also found in the UK (429) and Iceland (398) The lowest levels of this indicator are found in Poland (29) Cyprus (35) and Bulgaria (51)
Compared to 2016 the proportion of respondents who did not complain because they were unsure about their consumer rights increased in the EU27_2019 (+19pp) decreased in the East (-74pp) and remained statistically unchanged in the North South and West Across all EU Member States this proportion increased most steeply in Belgium (+189pp) and decreased most prominently in Poland (-269pp) Among the EU Member States the largest positive reversal is also found in Belgium where the large increase between 2016 and 2018 (see above) follows a decrease of 178pp
between 2014 and 2016 No negative reversal is found Considering all studied countries an even larger positive reversal is found in the UK where between 2016 and 2018 this indicator increased by
316pp whereas between 2014 and 2016 it decreased by 456pp
32 Results (for all reasons for not taking action) for all countries except Romania (111) and Greece (116) are based on a very small sample size (less than 100 observations) and should therefore be considered as mainly indicative
Consumer Survey 2018
145
Q12 Answers 4 and 5 - Base EU27_2019 respondents who experienced a problem but did not take any action
to solve it (N=1297)
Male 373 181 A
Female 457 177 A
18-34 448 A 198 A
35-54 413 A 169 A
55-64 373 A 123 A
65+ 397 A 218 A
Low 323 A 270 A
Medium 398 A 170 A
High 458 A 172 A
Very difficult 421 A 165 A
Fairly difficult 424 A 152 A
Fairly easy 416 A 216 A
Very easy 338 A 190 A
Rural area 359 A 152 A
Small town 440 A 191 A
Large town 430 A 188 A
Self-employed 471 CD 245 A
Manager 260 A 102 A
Other white collar 514 D 163 A
Blue collar 443 BCD 139 A
Student 476 ABCD 180 A
Unemployed 362 ABCD 201 A
Seeking a job 319 ABC 280 A
Retired 281 AB 190 A
Financial Situation
Urbanisation
Employment status
Reasons for not taking actionThought it would
take too long
Were not sure of
own rights as a
consumer
Gender
Age groups
Education
Consumer Survey 2018
146
Q12 Answers 4 and 5 - Base EU27_2019 respondents who experienced a problem but did not take any action
to solve it (N=1297)
When looking at the proportion of consumers that did not take action because they thought that this would take too long the socio-demographic variable most closely associated with this indicator is whether a consumerrsquos mother tongue is the official language in their country of residence or not The other characteristics with close links are gender numerical skills and employment status
Consumers whose mother tongue is not one of the official languages of the country or region they live in are more likely to refrain from taking action because they thought that this would take too long compared to those whose mother tongue is one of the official languages
As far as gender is concerned females are also more likely to refrain from taking action due to this reason compared to males
Consumers with a low numerical skill level are more likely not to take action because they thought
that this would take too long than those with high numerical skills
Finally other white collars and those who are self-employed are more likely to report this reason than managers and consumers who are retired Blue collar workers are also more likely than managers to report this reason while other white collars are more likely than those seeking a job to report this reason
With regard to socio-demographic variables and other characteristics the likelihood of consumers not taking any action because they were not sure of their rights as a consumer is not associated
closely with any of the socio-demographic variables
Only native 404 A 138 A
Two 424 A 209 A
Three 450 A 216 A
Four or more 306 A 162 A
Not official
language in home
country
611 291 A
Official language
in home country404 172 A
Low 544 B 161 A
Medium 408 AB 210 A
High 401 A 161 A
Daily 399 A 175 BC
Weekly 517 A 320 C
Monthly 568 A 26 A
Hardly ever 502 A 168 ABC
Never 403 A 138 B
Very vulnerable 379 A 185 A
Somewhat
vulnerable422 A 194 A
Not vulnerable 431 A 164 A
Very vulnerable 418 A 197 A
Somewhat
vulnerable434 A 189 A
Not vulnerable 396 A 173 A
Consumer vulnerability
(complexity)
Reasons for not taking action
Languages
Mother Tongue
Numerical skills
Internet use
Consumer vulnerability
(socio-demographic
factors)
Thought it would
take too long
Were not sure of
own rights as a
consumer
Consumer Survey 2018
147
Q12 Answers 6 and 7 - Base Respondents who experienced a problem but did not take any action to solve it
(N=1417)
The proportion of consumers who have not taken action because of their experiences with unsuccessfully complaining in the past is 180 in the European Union In the East this
2018
( = sig
diff EU27)
2018-
2016
2016-
2014
2014-
2012
2012-
2011
2018
( = sig
diff EU27)
2018-
2016
2016-
2014
EU27_2019 180 +19 -53 +79 +33 185 +58 -42
EU28 192 +29 -65 +74 +35 196 +77 -59
North 88 +16 -75 +61 +58 109 -36 +10
South 271 +105 -150 +213 +35 274 +154 -61
East 168 -72 +126 -39 +18 191 -40 +92
West 89 -37 -53 +20 +100 79 -06 -106
BE 135 +99 -87 -115 +69 99 -09 -157
BG 95 -50 +12 -30 +102 09 -34 -49
CZ 212 -31 +43 -47 +178 389 +71 -104
DK 57 -62 +55 -50 +140 00 -97 +97
DE 38 -78 -42 +38 +83 64 -11 -180
EE 35 -22 +29 -24 +36 146 +50 +61
IE 332 +175 +42 +55 +32 283 +121 -28
EL 302 +171 -86 +10 +12 247 +153 -178
ES 331 -101 +04 +299 +24 346 +10 -03
FR 103 -47 -57 -46 +246 58 -47 -59
HR 220 +02 +71 +24 - 251 +164 -94
IT 241 +158 -207 +256 +19 254 +207 -37
CY 180 +60 -75 +16 +52 147 +66 -165
LV 80 +57 -172 +202 +06 40 -61 -40
LT 203 +132 -19 -39 +96 250 +31 +18
LU 39 -20 +15 -154 +136 115 +90 -15
HU 140 -347 +382 +32 +38 108 -117 +87
MT 00 -128 +128 -199 +89 138 +146 -180
NL 20 -106 +20 +136 -316 108 +116 -80
AT 122 +34 -50 +80 +07 203 +76 -114
PL 152 -83 +113 -09 +23 66 -142 +96
PT 91 +123 -239 -15 +227 88 +22 -275
RO 191 -10 +122 -105 -75 296 -33 +184
SI 41 -185 +212 -53 +84 25 -190 +215
SK 113 +25 -57 -10 +169 17 -08 -21
FI 49 -32 -50 +35 +27 195 +40 -22
SE 36 -29 -190 +179 +62 00 -137 +14
IS 164 +85 -29 -347 +417 263 +282 -123
NO 00 00 00 +03 -28 00 00 00
UK 268 +102 -168 +17 +91 270 +191 -183
Reasons for not taking action
Region
Country
Tried to complain unsuccessfully in the past
Not at ease with potential
confrontations resulting from
complaints
Consumer Survey 2018
148
proportion is consistent with the EU27_2019 average while it is higher in the South (271) and
lower in the North (88) and in the West (89) Across the EU Member States3333 the highest levels of this indicator are found in Ireland (332) Spain (331) and Greece (302) The lowest levels in the EU are found in Malta (00) the Netherlands (20) and Estonia (35) In addition the level is also zero in Norway
Compared to 2016 the proportion of respondents that indicated not having taken action because they complained unsuccessfully in the past remained stable in the EU27_2019 in the North and West while it increased in the South (+105pp) and decreased in the East (-72pp) At country level
the proportion to which respondents complained unsuccessfully in the past increased most steeply in Ireland (+175pp) and decreased most prominently in Hungary (-347pp) The only positive reversal is found in Italy where between 2016 and 2018 the indicator increased by 158pp whereas between 2014 and 2016 it decreased by 207pp The only negative reversal is also found in Hungary where the decrease between 2016 and 2018 (see above) was preceded by an increase of 382pp between 2014 and 2016
The proportion of respondents who indicated that they had not complained because they wanted to avoid a confrontation is 185 in the European Union The proportion is in line with the EU27_2019
average in the East whereas it is higher in the South (274) and lower in the North (109) and West (79) Across all EU countries the highest levels of this indicator are found in the Czech Republic (389) Spain (346) and Romania (296) The lowest levels in the EU are found in Denmark Sweden (both 00) Bulgaria (09) and Slovakia (17) Among all studied countries Norway also has a low level of 00
When comparing the results with 2016 the proportion of respondents reporting this reason increased in the EU27_2019 (+58pp) and the South (+154pp) while results remained unchanged in the North East and West At country level the highest increase in the EU is observed in Italy (+207pp) while the largest decrease is observed in Slovenia (-190pp) Considering all countries of the study an even larger increase is observed in Iceland (+282pp) When looking at changes in 2018 (vs 2016) and in 2016 (vs 2014) the largest positive reversal is found in Greece where between 2016 and 2018 this indicator increased by 153pp whereas between 2014 and 2016 it decreased by
178pp No statistically significant negative reversal is found Considering all countries of the study the largest positive reversal is found in the UK where between 2016 and 2018 this indicator increased by 191pp following a decrease of 183pp between 2014 and 2016
33 Results (for all reasons for not taking action) for all countries except Romania (111) and Greece (116) are based on a very small sample size (less than 100 observations) and should therefore be considered as mainly indicative In 2018 the weighting approach was altered to include phone ownership
33 To ensure comparability between the 2018 and 2016 waves the differences between 2018 and 2016 were computed based on the previous weighting procedure applied systematically for both waves This may result in discrepancies between the figures reported for 2018 and the differences between 2018 and 2016
Consumer Survey 2018
149
Q12 Answers 6 and 7 - Base EU27_2019 respondents who experienced a problem but did not take any action
to solve it (N=1297)
Male 200 A 160 A
Female 163 A 213 A
18-34 161 A 195 A
35-54 207 A 174 A
55-64 191 A 190 A
65+ 153 A 198 A
Low 168 A 189 A
Medium 177 A 210 A
High 187 A 156 A
Very difficult 190 AB 191 A
Fairly difficult 149 A 173 A
Fairly easy 228 B 186 A
Very easy 114 A 240 A
Rural area 188 A 238 A
Small town 189 A 139
Large town 159 A 216 A
Self-employed 194 BC 121 AB
Manager 86 AB 108 A
Other white collar 181 C 195 ABC
Blue collar 80 A 159 ABC
Student 181 ABC 119 AB
Unemployed 246 BC 327 C
Seeking a job 146 ABC 124 AB
Retired 285 C 251 BC
Reasons for not taking action
Tried to complain
unsuccessfully in
the past
Not at ease with
potential
confrontations
resulting from
complaints
Gender
Age groups
Education
Financial Situation
Urbanisation
Employment status
Consumer Survey 2018
150
Q12 Answers 6 and 7 - Base EU27_2019 respondents who experienced a problem but did not take any action
to solve it (N=1297)
With regard to socio-demographic variables and other characteristics the likelihood of consumers not taking any action because they had tried to complain unsuccessfully in the past is associated most closely with consumersrsquo numerical skills followed by their vulnerability due to socio-demographic factors and their employment status
Consumers who have a medium or high numerical skill level are more likely to cite their unsuccessful
attempts to complain in the past as a reason for not taking action compared to those with low numerical skills
Consumers who are very vulnerable due to socio-demographic factors are more likely to cite this reason than those who are not vulnerable
Finally regarding consumersrsquo employment status other white collars and those who are retired are also more likely to report this reason for not taking action compared to managers and blue-collar workers
With regard to socio-demographic variables and other characteristics vulnerability due to the socio-demographic factors is the factor most closely associated with the proportion of respondents that has not taken action because they are not at ease with potential confrontations resulting from
Only native 182 A 171 A
Two 170 A 207 A
Three 210 A 196 A
Four or more 145 A 155 A
Not official
language in home
country
314 A 299 A
Official language
in home country173 A 181 A
Low 89 167 A
Medium 210 A 173 A
High 172 A 202 A
Daily 171 A 176 A
Weekly 229 A 300 A
Monthly 220 A 126 A
Hardly ever 377 A 196 A
Never 136 A 184 A
Very vulnerable 234 B 227 A
Somewhat
vulnerable194 AB 230 A
Not vulnerable 135 A 130
Very vulnerable 202 A 116
Somewhat
vulnerable211 A 220 A
Not vulnerable 154 A 204 A
Tried to complain
unsuccessfully in
the past
Not at ease with
potential
confrontations
resulting from
complaints
Consumer vulnerability
(complexity)
Reasons for not taking action
Languages
Mother Tongue
Numerical skills
Internet use
Consumer vulnerability
(socio-demographic
factors)
Consumer Survey 2018
151
complaints Other characteristics showing close links with this indicator are vulnerability due to the
complexity of offers and terms and conditions the degree of urbanisation and employment status
Consumers who are very or somewhat vulnerable in terms of socio-demographic factors are more likely to refrain from taking actions because they want to avoid potential confrontations than those who are not vulnerable
In contrast consumers who are not vulnerable in terms of the complexity of offers and terms and conditions are more likely to refrain from action due to this reason than those who are very or somewhat vulnerable
Consumers who live in a rural area or large town are more likely to indicate they are not at ease with potential confrontations resulting from complaints compared to those living in a small town
Finally with regard to employment status consumers who are unemployed and retired are more likely to not take action for this reason than those who are self-employed managers students and jobseekers
Consumer Survey 2018
152
Satisfaction with problem resolution
Average proportion of satisfied consumers (ldquoVery satisfiedrdquo and ldquoFairly satisfiedrdquo) with Q1144 options Q111 to
Q11545 - Base Respondents that took at least one of five different actions to solve a problem (N=4200)
44 Q11 In general how satisfied or dissatisfied were you with the way your complaint(s) was (were) dealt with by the hellip
-Very satisfied ndashFairly satisfied ndash Not very satisfied ndashNot at all satisfied ndash DKNA Q51 Retailer or service provider Q52 Manufacturer Q53 Public authority Q54 An out-of-court dispute resolution body (ADR) Q55 Court
45 Consumersrsquo average satisfaction was computed across the different instances to which they issued a complaint (eg if a consumer only complained to a manufacturer only his evaluation of the manufacturer was taken into
Region
Country
2018 2018-
2016
2016-
2014
2014-
2012
EU27_2019 570 -40 +23 -35
EU28 591 -39 +35 -30
North 684 +37 -29 -57
South 517 +44 -31 +06
East 597 -12 +19 -71
West 594 -153 +97 -25
BE 493 -84 -152 +170
BG 331 -49 -05 -155
CZ 602 -54 +100 -77
DK 637 -13 +21 -115
DE 597 -196 +108 -18
EE 642 +84 -33 -16
IE 702 -08 +116 -14
EL 479 +77 -74 +05
ES 470 +85 -78 +00
FR 454 -273 +139 -56
HR 445 -127 +132 -54
IT 551 +03 +01 -06
CY 438 +12 -02 -60
LV 553 +65 -12 -76
LT 527 +43 +30 -207
LU 733 -83 +142 +150
HU 693 -26 +73 +13
MT 427 -71 +143 -31
NL 763 +37 +137 -77
AT 720 -78 +112 +28
PL 645 -10 +30 -74
PT 458 +29 +15 -176
RO 482 +55 -91 -61
SI 632 -53 +181 -255
SK 738 +192 -62 -107
FI 771 +14 -12 +17
SE 697 +75 -81 -36
IS 600 +66 -141 -52
NO 764 +104 -07 -93
UK 656 -170 +202 -10
Average satisfaction with complaint handling
Consumer Survey 2018
153
The average satisfaction with complaint handling is 570 in the European Union The satisfaction
is 597 in the East and 594 West while it is 644 in the North and 517 in the South For the EU Member States46 the highest satisfaction levels are observed in Finland (771) the Netherlands (763) and Slovakia (738) In Norway the average satisfaction is also high (764) The lowest levels are found in Bulgaria (331) Malta (427) and Cyprus (438)
Compared to 2016 consumersrsquo average satisfaction with complaint handling decreased in the EU27_2019 (-40pp) and in the West (-153pp) while only relatively small changes were observed
for the North (+37pp) South (+44pp) or East (-12pp) At country-level the indicator increased most noticeably in Slovakia (+192pp) while it decreased most steeply in France (-273pp) In France also the highest negative reversal is found where the decrease between 2016 and 2018 was preceded by an increase of +139pp between 2014 and 2016 No noticeable positive reversals are found
Consumersrsquo satisfaction with the problem resolution differs based on the parties involved When a problem was resolved with the retailer or service provider satisfaction was highest (602) Problem
resolutions achieved via an ADR platform (509) the manufacturer (490) the court (453) and public authorities (422) was also relatively high
account) The indicator was then calculated as the proportion of satisfied respondents (fairly amp very satisfied) across all individual evaluations
Given the way this indicator is calculated not statistical differences are computed 46 Results for the following countries are based on a very small sample size (observations from less than 100
respondents) and they should therefore be considered as mainly indicative Greece (92) France (70) Luxembourg (48) Austria (87) Bulgaria (68) Cyprus (24) Malta (66) and Iceland (79)
Consumer Survey 2018
154
Q111 and Q112 Total ldquoSatisfiedrdquo (Answers 1 and 2)
Base for Q111 Respondents who complained about a problem to the retailer or service provider (N=3780) Base for Q112 Respondents who complained about a problem to the manufacturer (N=593)
Consumersrsquo satisfaction with how retailers or service providers dealt with their complaints
is 602 in the European Union In the East and West satisfaction is in line with the EU27_2019 average while satisfaction is higher in the North (708) and lower in the South (557) Among
the EU Member States35 the highest levels of this indicator are found in Finland (788) the Netherlands (785) and Luxembourg (779) Among all the studied countries this level is highest in Norway (791) The lowest levels in the EU are found in Bulgaria (386) France (426) and Portugal (446)
35 Results for the following countries are based on a very small sample size (less than 100 observations) and should therefore be considered as mainly indicative Lithuania (99) Belgium (98) Iceland (77) Greece (73) Austria (73) France (60) Malta (60) Bulgaria (53) Luxembourg (40) Cyprus (18)
2018
( = sig
diff EU27)
2018-
2016
2016-
2014
2014-
2012
2018
( = sig
diff EU27)
2018-
2016
2016-
2014
2014-
2012
EU27_2019 602 -07 +28 -58 490 -154 +40 +01
EU28 621 +01 +30 -49 527 -156 +87 -06
North 708 +33 -04 -61 674 +85 -72 -46
South 557 +78 -19 -17 429 -29 -48 +36
East 622 -01 +34 -80 542 -69 -10 -39
West 615 -135 +114 -59 552 -203 +60 +30
BE 520 -105 -116 +228 420 -94 -198 +51
BG 386 +06 +65 -238 513 +177 -107 -171
CZ 604 -85 +102 -54 555 +35 +63 -67
DK 684 -32 +67 -124 609 +73 -78 -27
DE 634 -144 +109 -64 593 -287 +96 +59
EE 649 +82 -10 -33 561 +59 -338 +243
IE 703 -37 +150 -17 666 +50 +58 -72
EL 473 +86 -53 -38 389 +189 -333 -82
ES 479 +93 -74 -21 417 +159 -153 -13
FR 426 -363 +253 -107 00 -616 +108 +24
HR 480 -82 +105 -74 318 -331 +253 +63
IT 613 +74 +04 -37 431 -194 +40 +87
CY 385 -73 +69 -115 657 -187 +245 +239
LV 595 +66 +20 -81 516 +60 -131 -90
LT 550 +10 +142 -241 684 +514 -332 -73
LU 779 -32 +85 +215 783 -25 +113 +166
HU 715 -21 +60 +10 542 +211 -324 +20
MT 469 +11 +51 +28 161 -580 +562 -428
NL 785 +70 +117 -63 670 -98 +127 -02
AT 716 -52 +83 +12 952 +84 +147 +13
PL 665 +10 +51 -97 630 -78 +22 -43
PT 446 +28 +12 -237 543 +81 -96 +65
RO 495 +45 -92 -19 457 +43 -167 -95
SI 641 -57 +141 -190 721 +288 +137 -565
SK 758 +226 -75 -119 420 -262 +125 -73
FI 788 +21 -00 +24 715 -29 +46 -117
SE 709 +67 -69 -42 737 +173 -118 +64
IS 572 +30 -144 -75 743 +509 -201 -141
NO 791 +140 -18 -114 634 -175 +92 +108
UK 687 -135 +197 -11 615 -229 +278 -21
Satisfaction with problem resolution
Region
Country
Satisfaction with retailer or service
providerSatisfaction with manufacturer
Consumer Survey 2018
155
Compared to 2016 the respondentsrsquo satisfaction with how retailers or service providers dealt with
their complaints remained stable in the EU27_2019 the North and East while it increased in the South (+78pp) and decreased in the West (-135pp) Compared to the survey in 2016 this type of satisfaction increased most markedly in Slovakia (+226pp) and decreased most in France (-363pp) When looking at changes in 2018 (vs 2016) and in 2016 (vs 2014) no statistically significant positive reversal is found The only negative reversal is found in France where the decrease between 2016 and 2018 (see above) was preceded by an increase of 253pp between 2014 and 2016
The respondentsrsquo satisfaction with how manufacturers dealt with their complaints is 490
in the European Union The satisfaction with manufacturers in the South East and West is in line with the EU27_2019 average while the satisfaction is higher in the North (674) Among the EU Member States36 the highest levels of this indicator are found in Austria (952) Luxembourg (783) and Sweden (737) Considering all countries of the study high levels are also found in Iceland (743) The lowest levels are found in France (00) Malta (161) and Croatia (318)
Compared to 2016 satisfaction with how manufacturers dealt with consumer complaints decreased
in the EU27_2019 (-154pp) and the West (-203pp) whereas it remained statistically stable in the North South and East At country-level this type of satisfaction increased most steeply in Lithuania
(+514pp) whereas it decreased most in France (-616pp) No statistically significant positive reversal is found The largest negative reversal is found in Malta where between 2016 and 2018 this indicator decreased by 580pp whereas between 2014 and 2016 it increased by 562pp
36 Results for all countries are based on a very small sample size (less than 100 observations) and should therefore be considered as mainly indicative
Consumer Survey 2018
156
Q111 and Q112 Total ldquoSatisfiedrdquo (Answers 1 and 2)
Base for Q111 Respondents who complained about a problem to the retailer or service provider (N=3227) Base for Q112 Respondents who complained about a problem to the manufacturer (N=483)
Male 599 A 483 A
Female 613 A 526 A
18-34 576 A 562 B
35-54 632 A 362 A
55-64 582 A 550 B
65+ 628 A 584 AB
Low 620 A 631 A
Medium 597 A 515 A
High 611 A 454 A
Very difficult 542 A 558 AB
Fairly difficult 596 A 384 A
Fairly easy 621 A 570 B
Very easy 621 A 543 AB
Rural area 598 A 497 A
Small town 603 A 462 A
Large town 617 A 549 A
Self-employed 539 A 357 A
Manager 585 AB 707 C
Other white collar 646 B 473 AB
Blue collar 594 AB 538 ABC
Student 709 B 474 ABC
Unemployed 548 AB 689 BC
Seeking a job 655 AB 589 ABC
Retired 546 AB 450 ABC
Satisfaction with problem resolution
Satisfaction with
retailer or service
provider
Satisfaction with
manufacturer
Gender
Age groups
Education
Financial Situation
Urbanisation
Employment status
Consumer Survey 2018
157
Q111 and Q112 Total ldquoSatisfiedrdquo (Answers 1 and 2)
Base for Q111 Respondents who complained about a problem to the retailer or service provider (N=3227) Base for Q112 Respondents who complained about a problem to the manufacturer (N=483)
Consumersrsquo satisfaction with problem resolutions provided by retailers or service providers is associated most closely with vulnerability due to the complexity of offers and terms and conditions followed by employment status
Consumers that are very or somewhat vulnerable report being less satisfied with the problem resolutions provided by retailers and service providers than consumers who are not vulnerable
In addition consumersrsquo satisfaction with retailers and service providers in this respect is lowest for self-employed consumers which is lower than for other white collars and students
When solutions are provided by manufacturers consumersrsquo satisfaction is most closely linked with consumersrsquo numerical skills vulnerability due to the complexity of offers and terms and conditions age and employment situation
Consumers with low numerical skills are less likely to be satisfied with the manufacturersrsquo solutions than consumers with high numerical skills
Only native 588 A 436 A
Two 601 A 600 B
Three 629 A 393 A
Four or more 628 A 481 AB
Not official
language in home
country
535 A 448 A
Official language
in home country610 A 501 A
Low 598 A 286 A
Medium 595 A 445 AB
High 611 A 552 B
Daily 608 B 400 A
Weekly 655 B 639 A
Monthly 530 AB 503 A
Hardly ever 285 A
Never 549 AB 638 A
Very vulnerable 660 B 455 A
Somewhat
vulnerable566 A 507 A
Not vulnerable 613 AB 507 A
Very vulnerable 503 A 314 A
Somewhat
vulnerable553 A 484 AB
Not vulnerable 648 559 B
Satisfaction with
retailer or service
provider
Satisfaction with
manufacturer
Consumer vulnerability
(complexity)
Satisfaction with problem resolution
Languages
Mother Tongue
Numerical skills
Internet use
Consumer vulnerability
(socio-demographic
factors)
Consumer Survey 2018
158
Furthermore consumers who are very vulnerable due to the complexity of offers and terms and
conditions are less satisfied with solutions provided by manufacturers than consumers that do not perceive themselves as vulnerable
Regarding age consumers who are 18-34 years or 55-64 years report higher satisfaction with the problem resolution obtained with the manufacturer than those who are aged 35-54
Finally the satisfaction with manufacturers for problem resolution is higher for managers which in turn is higher than for consumers who are self-employed or other white collars
Q113 Q114 and Q115 Total Satisfied (ldquovery satisfiedrdquo and ldquoFairly satisfiedrdquo) Due to a limited sample size per
country country results could not be calculated Base for Q113 Respondents who complained about a problem to a public authority (N=299)
Base for Q114 Respondents who complained about a problem to an out-of-court dispute resolution body (ADR) such as an ombudsman arbitration mediation or conciliation body (N=194)
Base for Q115 Respondents who complained about a problem to an out-of-court dispute resolution body (ADR) such as an ombudsman arbitration mediation or conciliation body (N=75)
Overall satisfaction37 with how public authorities dealt with complaints is 422 in the European Union The EU27_2019 average is statistically in line with all regions Consumersrsquo satisfaction with public authorities has decreased since 2016 in the EU27_2019 (-150pp) and the West (-183pp)
while no statistically significant changes are observed in the East South and North
Satisfaction with ADR (Alternative Dispute Resolution) is 509 in the European Union and the
satisfaction in all regions is in line with the EU27_2019 average Compared to 2016 satisfaction with ADR decreased in the EU27_2019 (-115pp) and the West (-274pp) while it is statistically stable in the North South and East
Finally the average satisfaction with courts is 453 in the European Union The satisfaction in the South East and West is in line with the EU27_2019 average while satisfaction in the North (176) is lower (176) Compared to 2016 the satisfaction with courts remained statistically stable in the EU27_2019 and all four regions
37 Due to the exceptionally low sample sizes achieved for the last three satisfaction questions only EU27_2019 and region averages are reported
2018
( = sig
diff EU27)
2018-
2016
2016-
2014
2014-
2012
2018
( = sig
diff EU27)
2018-
2016
2016-
2014
2014-
2012
2018
( = sig
diff EU27)
2018-
2016
2016-
2014
2014-
2012
EU27_2019 422 -150 -12 +129 509 -115 -30 +150 453 +105 -100 -71
EU28 461 -135 -22 +115 541 -128 +01 +106 457 +103 -103 -57
North 339 -05 -286 -38 652 +63 -104 +31 176 -142 +13 +205
South 389 +32 -135 +48 429 -106 -50 +215 656 +220 +108 +09
East 383 -113 +74 -28 594 -05 -48 +130 571 +375 -502 -34
West 550 -183 -25 +333 598 -274 +126 +115 268 -95 -54 -138
Satisfaction with problem resolution
Region
Country
Satisfaction with public authority Satisfaction with ADR Satisfaction with court
Consumer Survey 2018
159
Q113 Q114 and Q115 Total Satisfied (ldquovery satisfiedrdquo and ldquoFairly satisfiedrdquo)
Base for Q113 Respondents who complained about a problem to a public authority (N=259) Base for Q114 Respondents who complained about a problem to an out-of-court dispute resolution body
(ADR) such as an ombudsman arbitration mediation or conciliation body (N=152) Base for Q115 Respondents who complained about a problem to an out-of-court dispute resolution body
(ADR) such as an ombudsman arbitration mediation or conciliation body (N=61) Because of the low sample size the model for satisfaction with court excludes numerical skills vulnerability
(terms and conditions) and the covariate variable regions
Male 420 A 574 496
Female 451 A 348 233
18-34 348 A 484 AB 520 A
35-54 500 A 622 B 481 A
55-64 367 A 479 AB 499 A
65+ 363 A 338 A 117
Low 661 A 190 331 A
Medium 394 A 481 A 462 A
High 413 A 614 A 437 A
Very difficult 388 AB 505 A 621 B
Fairly difficult 349 A 553 A 337 AB
Fairly easy 503 AB 461 A 522 AB
Very easy 617 B 572 A 175 A
Rural area 485 A 424 A 404 A
Small town 391 A 421 A 357 A
Large town 440 A 711 480 A
Self-employed 352 AB 396 B 05 A
Manager 417 AB 389 AB 568 BCDE
Other white collar 475 B 491 B 132 ABC
Blue collar 448 AB 569 BC 527 D
Student 227 A 808 CD 454 CD
Unemployed 331 AB 908 D 36 AB
Seeking a job 496 AB 90 A
Retired 565 B 643 BCD 932 E
Financial Situation
Urbanisation
Employment status
Satisfaction with
courtSatisfaction with problem resolution
Satisfaction with
public authority
Satisfaction with
ADR
Gender
Age groups
Education
Consumer Survey 2018
160
Q113 Q114 and Q115 Total Satisfied (ldquovery satisfiedrdquo and ldquoFairly satisfiedrdquo)
Base for Q113 Respondents who complained about a problem to a public authority (N=259) Base for Q114 Respondents who complained about a problem to an out-of-court dispute resolution body
(ADR) such as an ombudsman arbitration mediation or conciliation body (N=152) Base for Q115 Respondents who complained about a problem to an out-of-court dispute resolution body
(ADR) such as an ombudsman arbitration mediation or conciliation body (N=61) Because of the low sample size the model for satisfaction with court excludes numerical skills vulnerability
(terms and conditions) and the covariate variable regions
Satisfaction with complaint handling by public authorities is associated most closely with vulnerability due to socio-demographic factors followed by employment status
Consumers that feel very vulnerable due to their socio-demographic status are more likely to be
satisfied with the public authoritiesrsquo solutions than consumers that are somewhat or not vulnerable
Regarding consumersrsquo employment status the proportion of consumers that are satisfied with public authoritiesrsquo problem resolutions is lowest among students which is lower than for other white collars and retired persons
Consumersrsquo satisfaction with the way their complaint was dealt with by the ADR is associated most closely with consumersrsquo education level The characteristics with the next closest link are gender employment status the degree of urbanisation and the frequency of internet use
Only native 328 A 478 AB 468 A
Two 512 B 655 B 386 A
Three 418 AB 358 A 545 A
Four or more 472 AB 311 A 413 A
Not official
language in home
country
294 A 337 A 97
Official language
in home country443 A 517 A 437
Low 355 A 327 A
Medium 518 A 509 A
High 397 A 525 A
Daily 406 A 455 410 A
Weekly 744 B 811 A 725 A
Monthly 233 A
Hardly ever 675 AB
Never 385 A 838 A 361 A
Very vulnerable 626 524 A 382 A
Somewhat
vulnerable387 A 633 A 701
Not vulnerable 337 A 448 A 354 A
Very vulnerable 399 AB 221 A
Somewhat
vulnerable303 A 465 AB
Not vulnerable 500 B 587 B
Internet use
Consumer vulnerability
(socio-demographic
factors)
Consumer vulnerability
(complexity)
Satisfaction with problem resolutionSatisfaction with
court
Languages
Mother Tongue
Numerical skills
Satisfaction with
public authority
Satisfaction with
ADR
Consumer Survey 2018
161
Regarding education satisfaction is higher for medium or highly educated consumers compared to
consumers with a low education level
Furthermore male consumers are also more satisfied with solutions by the ADR than female consumers
Higher satisfaction with the ADR is also observed for those who are unemployed and students who are more satisfied than jobseekers self-employed managers and other white collars Unemployed consumers are also more satisfied than blue collar workers and those who are retired are more satisfied than jobseekers
Consumers living in a large town are more satisfied with solutions by the ADR than those living in a small town or rural area
Finally consumers who use the internet never or only weekly are more satisfied with ADR solutions compared to daily internet users
Regarding the socio-demographic variables that have links with consumersrsquo satisfaction with
complaint handling by courts whether a consumerrsquos mother tongue is the official language in their
country of residence or not is the factor most closely associated with this indicator The characteristics with next closest links with this indicator are employment status gender age and financial situation It must be noted however that due to a very low sample size these findings should be considered as purely indicative
Consumers whose mother tongue is the official language in their country of residence are much more likely to be satisfied with the courtsrsquo resolution than consumers whose mother tongue is different from the language in their country of residence
In addition the levels for this indicator are highest among the retired which is higher than for self-employed other white collars blue collar workers students and the unemployed In contrast for self-employed and unemployed persons the levels are lower than for most other categories including blue collar workers students retired as well as managers (only for self-employed)
As far as gender is concerned male consumers are also more likely to be satisfied than female consumers
Consumers aged 65 years and older are less likely to be satisfied with solutions achieved through
the court compared to all other age groups
Finally consumers in a very difficult financial situation are more likely to be satisfied with the solution reached through courts than consumers in a very easy financial situation
Consumer Survey 2018
162
Problems making purchases in other EU countries
Q1538-Base respondents who shop online in other EU countries (N=8175)
In the European Union 213 of consumers who shop cross-border online face limitations in terms of cross-border delivery or payment or they are redirected to a website in their own country where the prices are different The cross-border retailersrsquo refusal to deliver to the consumersrsquo home country
is the most commonly experienced problem (125) followed by being redirected to the retailersrsquo website of the consumersrsquo country (109) Relatively fewer consumers reported problems with
retailers not accepting their payment (48)
38 During the past 12 months have you come across any of the following problems when buying goods and services online from another EU country - The retailer or service provider refused to deliver to (ANOTHER EU COUNTRY) The retailer or service provider did not accept payment from (ANOTHER EU COUNTRY) You were redirected to a website in (ANOTHER EU COUNTRY) where the prices were different None of them Donrsquot know
Region
CountryTotal Yes
The retailer or
service
provider
refused to
deliver to
(ANOTHER EU
COUNTRY)
The retailer or
service
provider did
not accept
payment from
(ANOTHER EU
COUNTRY)
You were
redirected to a
website in
(ANOTHER EU
COUNTRY)
when prices
were different
None of them Dont know
EU27_2019 213 125 48 109 782 05
EU28 221 124 49 121 774 05
North 252 179 43 91 744 05
South 135 53 21 92 861 04
East 246 160 55 121 746 09
West 242 149 62 119 753 05
BE 367 237 94 154 627 05
BG 254 201 79 82 731 15
CZ 239 137 68 88 761 00
DK 249 193 47 93 740 12
DE 166 58 47 104 828 06
EE 286 231 80 51 711 03
IE 717 606 187 326 281 02
EL 420 216 110 216 550 31
ES 84 16 23 69 912 04
FR 146 83 24 82 850 05
HR 353 281 97 133 647 00
IT 122 41 06 94 878 00
CY 317 222 93 87 672 11
LV 259 198 66 93 739 02
LT 247 173 66 70 746 07
LU 472 417 142 162 528 00
HU 72 65 34 09 928 00
MT 733 674 192 165 267 00
NL 181 87 68 56 810 09
AT 596 513 152 225 404 00
PL 215 115 22 148 769 16
PT 186 140 18 81 808 06
RO 439 284 151 244 547 14
SI 344 312 47 80 656 00
SK 274 179 41 116 722 04
FI 207 166 28 55 790 02
SE 275 171 35 122 722 02
IS 485 413 134 107 512 04
NO 328 233 63 112 672 00
UK 269 116 59 191 726 05
In the past 12 months have you come across any of the following problems when buying goods
and services online from another EU country
Consumer Survey 2018
163
Q15- Base respondents who shop online in other EU countries (N=8175)
The proportion of consumers that have experienced any of the three aforementioned problems is 213 in the European Union This level is higher in the West (242) East (246) and North (252) whereas it is lower in the South (135) The highest levels of problems with cross-border delivery payment or redirection to a local website are found in Malta (733) Ireland (717) and
Austria (596) The lowest levels of these problems are found in Hungary (72) Spain (84)
and Italy (122)39
Compared to 2016 the proportion of consumers coming across at least one of the three investigated problems remained stable in the EU27_2019 the North and South while it decreased in the West (-46pp) and increased in the East (+42pp) Looking at the Member States the proportion increased most steeply in Ireland (+408pp) and decreased most prominently in France (-220pp) In this regard the largest negative and positive reversals are found respectively in Ireland and France In
39 Results for Romania are based on a very small sample size (88 observations) and they should be therefore considered as mainly indicative
2018
( = sig
diff EU27)
2018-
2016
2016-
2014
EU27_2019 213 -14 +63
EU28 221 -20 +67
North 252 +12 +26
South 135 -19 +13
East 246 +42 -01
West 242 -46 +131
BE 367 +99 -46
BG 254 -39 +70
CZ 239 +17 -03
DK 249 -29 +33
DE 166 -94 +232
EE 286 +14 +49
IE 717 +408 -201
EL 420 -65 +177
ES 84 -33 -37
FR 146 -220 +230
HR 353 +73 +05
IT 122 -07 +25
CY 317 -01 -14
LV 259 +20 -53
LT 247 +54 -12
LU 472 +136 -233
HU 72 -66 -143
MT 733 +100 +71
NL 181 -22 +71
AT 596 +319 -96
PL 215 +64 -06
PT 186 -46 +98
RO 439 +153 +33
SI 344 +61 +11
SK 274 +91 -10
FI 207 +08 -30
SE 275 +35 +75
IS 485 -67 +208
NO 328 +86 +10
UK 269 -84 +120
In the past 12 months have you come
across any of the following problems when
buying goods and services online from
another EU country
Region
Country
Total Yes
Consumer Survey 2018
164
Ireland the increase between 2016 and 2018 reflecting a higher proportion of consumers
experiencing cross-border problems follows a decrease of 201pp between 2014 and 2016 The largest positive reversal is found in France where the decrease between 2016 and 2018 (reflecting a lower proportion of consumers experiencing problems) was preceded by an increase of 230pp between 2014 and 2016
Q15- Base respondents who shop online in other EU countries (N=8175)
In terms of refusal of cross-border retailers to deliver to the consumersrsquo home country 125 of cross-border online consumers in the European Union faced this problem This level is higher in the
West (149) East (160) and North (179) whereas it is lower in the South (53) The highest levels of refusal to deliver to the consumersrsquo home country are found in Malta (674) Ireland
2018
( = sig
diff EU27)
2018-
2016
2016-
2014
EU27_2019 125 +26 -00
EU28 124 +23 +06
North 179 +25 -04
South 53 -13 +02
East 160 +13 +20
West 149 +54 -05
BE 237 +89 -41
BG 201 -18 +76
CZ 137 +24 -73
DK 193 -18 +22
DE 58 -22 +71
EE 231 +04 +54
IE 606 +461 -236
EL 216 -24 +01
ES 16 -33 +07
FR 83 +04 +08
HR 281 +52 +05
IT 41 -01 -03
CY 222 -28 +36
LV 198 +48 -48
LT 173 +37 +22
LU 417 +227 -297
HU 65 -16 -29
MT 674 +114 +29
NL 87 -06 +00
AT 513 +411 -184
PL 115 -03 +45
PT 140 -17 +108
RO 284 +96 -16
SI 312 +90 -02
SK 179 +30 +30
FI 166 +47 -57
SE 171 +40 +07
IS 413 -51 +217
NO 233 +54 +03
UK 116 -02 +45
In the past 12 months have you come
across any of the following problems when
buying goods and services online from
another EU country
Region
Country
The retailer or service
provider refused to deliver
to (ANOTHER EU
COUNTRY)
Consumer Survey 2018
165
(606) and Austria (513) The lowest levels of these problems are found in Spain (16) Italy
(41) and Germany (58)40
Compared to 2016 this proportion increased in the EU27_2019 (+26pp) and the West (+54pp) while it remained statistically stable in the other three regions In terms of the different Member States the level of refusal to deliver in the home country increased most markedly in Ireland (+461pp) No statistically significant decreases are observed The largest negative reversal is also found in Ireland where the increase for this indicator between 2016 and 2018 (see above) reflecting greater refusals to deliver to the home country was preceded by a decrease of 236pp between 2014
and 2016 No statistically significant positive reversal is found
Q15- Base respondents who shop online in other EU countries (N=8175)
40 Results for Romania are based on a very small sample size (88 observations) and they should be therefore considered as mainly indicative
2018
( = sig
diff EU27)
2018-
2016
2016-
2014
EU27_2019 48 -61 +63
EU28 49 -80 +79
North 43 -13 -00
South 21 -31 +11
East 55 -02 -13
West 62 -122 +144
BE 94 +09 -34
BG 79 -23 +45
CZ 68 -19 -18
DK 47 -41 +14
DE 47 -150 +197
EE 80 +41 -24
IE 187 +22 -25
EL 110 -285 +271
ES 23 -01 -23
FR 24 -246 +251
HR 97 +18 +34
IT 06 -30 +10
CY 93 +01 +26
LV 66 -11 -14
LT 66 +15 -14
LU 142 +09 -40
HU 34 +28 -76
MT 192 -45 +116
NL 68 -01 +46
AT 152 -04 +48
PL 22 -16 -18
PT 18 -05 -17
RO 151 +34 +10
SI 47 -26 -07
SK 41 +14 -55
FI 28 +02 -28
SE 35 -14 +14
IS 134 -128 +119
NO 63 +11 +05
UK 59 -232 +216
In the past 12 months have you come
across any of the following problems when
buying goods and services online from
another EU country
Region
Country
The retailer or service
provider did not accept
payment from (ANOTHER
EU COUNTRY)
Consumer Survey 2018
166
Furthermore the percentage of consumers whose payments were not accepted for cross-border
online transactions is 48 in the European Union In the North and East this percentage is in line with the EU27_2019 average while it is higher in the West (62) and lower in the South (21) Cross-border payment refusal is most common in Malta (192) Ireland (187) and Austria (152) The lowest levels are found in Italy (06) Portugal (18) and Poland (22)41
The proportion of consumers whose payments were not accepted when shopping cross-border online has decreased between 2016 and 2018 in the EU27_2019 (-61pp) the South (-31pp) and the West (-122pp) while no statistically significant changes are observed in the North and the East Compared
to the survey in 2016 cross-border payment refusal increased most steeply in Estonia (+41pp) and decreased most prominently in Greece (-285pp) The largest positive reversal is also found in Greece where the decrease between 2016 and 2018 (reflecting a higher proportion of consumers experiencing payment refusal) follows an increase of 271pp between 2014 and 2016 No statistically significant negative reversal is found
41 Results for Romania are based on a very small sample size (88 observations) and they should be therefore considered as mainly indicative
Consumer Survey 2018
167
Q15- Base respondents who shop online in other EU countries (N=8175)
In addition 109 of consumers in the European Union who shop online have been redirected to a website in their own country where the prices are different In the East and West the proportion is in line with the EU27_2019 average while it is lower in the North (91) and South (92) The
highest levels of redirection to a website in the home country are found in Ireland (326) Romania (244) and Austria (225) In contrast the lowest levels are found in Hungary (09) Estonia
(51) and Finland (55)42
Compared to 2016 the percentage of persons being redirected to a website in their home country increased in the EU27_2019 (+41pp) the West (+69pp) and East (+44pp) while the percentage remained relatively stable in the North and South Between 2016 and 2018 this percentage increased most steeply in Ireland (+278pp) and decreased most prominently in Hungary (-65pp)
When looking at changes in 2018 (vs 2016) and in 2016 (vs 2014) the largest negative reversal is
42 Results for Romania are based on a very small sample size (88 observations) and they should be therefore considered as mainly indicative
2018
( = sig
diff EU27)
2018-
2016
2016-
2014
EU27_2019 109 +41 -02
EU28 121 +59 -20
North 91 -11 +44
South 92 +13 +17
East 121 +44 -12
West 119 +69 -24
BE 154 +32 -24
BG 82 -35 +55
CZ 88 -20 +41
DK 93 -00 +20
DE 104 +83 +00
EE 51 +06 +11
IE 326 +278 -174
EL 216 +73 +45
ES 69 +00 -25
FR 82 +60 -66
HR 133 +59 +44
IT 94 +17 +40
CY 87 +14 -64
LV 93 +09 -06
LT 70 +40 -02
LU 162 +102 -47
HU 09 -65 -117
MT 165 +11 +44
NL 56 -64 +79
AT 225 +174 -66
PL 148 +109 -58
PT 81 -18 +27
RO 244 +115 +13
SI 80 -19 +69
SK 116 +29 +50
FI 55 -39 +16
SE 122 -16 +103
IS 107 -47 +92
NO 112 +28 -00
UK 191 +181 -137
In the past 12 months have you come
across any of the following problems when
buying goods and services online from
another EU country
Region
Country
You were redirected to a
website in (ANOTHER EU
COUNTRY) when prices
were different
Consumer Survey 2018
168
also found in Ireland where the increase between 2016 and 2018 (reflecting a higher proportion of
consumer experiencing redirections) follows a decrease of 174pp between 2014 and 2016 The largest positive reversal is found in the Netherlands where between 2016 and 2018 this indicator decreased by 64pp whereas between 2014 and 2016 it increased by 79pp
Consumer Survey 2018
169
Base for Q15 total lsquoyesrsquo EU27_2019 respondents who shop online in other EU countries (N=7184)
Base for Q151-Q155 Respondents who shop online in other EU countries (Q1514 N=7184 Q1523 N=7159 Q155 N=6621)
Male 207 A 129 A 45 A 103 A 786 A 09 A
Female 217 A 120 A 50 A 115 A 781 A 03 A
18-34 237 B 130 A 53 A 139 759 A 05 A
35-54 205 AB 129 A 45 A 102 B 791 AB 04 A
55-64 187 AB 107 A 47 A 75 AB 809 AB 03 A
65+ 143 A 109 A 28 A 44 A 838 B 12 A
Low 205 A 98 A 39 A 132 A 780 A 08 A
Medium 194 A 114 A 43 A 100 A 801 A 06 A
High 223 A 134 A 51 A 112 A 772 A 05 A
Very difficult 181 A 95 A 53 A 117 A 821 A 01 A
Fairly difficult 231 A 125 A 54 A 118 A 760 A 09 A
Fairly easy 205 A 126 A 42 A 106 A 791 A 04 A
Very easy 208 A 125 A 53 A 97 A 787 A 04 A
Rural area 203 A 127 A 49 AB 101 A 794 A 04 A
Small town 206 A 118 A 36 A 107 A 790 A 04 A
Large town 221 A 131 A 57 B 113 A 770 A 09 A
Self-employed 261 C 139 B 53 AB 153 B 739 A 01 A
Manager 213 BC 120 AB 35 AB 109 AB 784 ABC 01 A
Other white collar 211 BC 139 B 46 B 105 AB 784 AB 04 A
Blue collar 158 A 89 A 32 A 86 A 833 C 09 A
Student 235 BC 127 AB 70 AB 93 A 754 AB 10 A
Unemployed 248 ABC 184 B 89 AB 144 AB 731 AB 19 A
Seeking a job 205 ABC 144 AB 61 AB 86 AB 797 ABC
Retired 163 AB 82 A 40 AB 95 AB 833 BC 07 A
Urbanisation
In the past 12 months have you come
across any of the following problems when
buying goods and services online from
another EU country
Total Yes
The retailer or
service provider
refused to deliver
to (ANOTHER EU
COUNTRY)
The retailer or
service provider
did not accept
payment from
(ANOTHER EU
COUNTRY)
Dont know
Gender
Age groups
Education
Financial Situation
You were
redirected to a
website in
(ANOTHER EU
COUNTRY) when
prices were
different
None of them
Employment status
Consumer Survey 2018
170
Base for Q15 total lsquoyesrsquo) respondents who shop online in other EU countries (N=7184)
Base for Q151-Q155 Respondents who shop online in other EU countries (Q1514 N=7184 Q15233 N=7159 Q155 N=6621)
Only native 180 A 122 A 44 A 83 A 812 B 08 A
Two 201 AB 115 A 44 A 110 A 793 B 06 A
Three 233 BC 138 A 45 A 119 A 765 AB 02 A
Four or more 260 C 149 A 72 A 121 A 735 A 05 A
Not official
language in home
country
232 A 185 A 34 A 88 A 758 A 07 A
Official language
in home country209 A 121 A 48 A 109 A 786 A 05 A
Low 200 A 128 A 25 104 A 799 A 03 A
Medium 205 A 111 A 50 A 111 A 787 A 07 A
High 213 A 129 A 48 A 107 A 782 A 05 A
Daily 214 A 126 B 48 A 110 B 781 A
Weekly 152 A 101 B 35 A 50 A 848 B
Monthly 186 A 113 AB 74 A 76 AB 817 AB
Hardly ever 13 13 A 988
Never
Very vulnerable 272 B 161 A 109 132 A 708 18 A
Somewhat
vulnerable213 AB 128 A 40 A 117 A 780 A 07 A
Not vulnerable 201 A 119 A 41 A 100 A 797 A 03 A
Very vulnerable 265 A 124 A 51 A 167 730 A 08 AB
Somewhat
vulnerable205 A 129 A 44 A 99 A 795 A 01 A
Not vulnerable 205 A 123 A 47 A 102 A 788 A 07 B
In the past 12 months have you come
across any of the following problems when
buying goods and services online from
another EU country
Total Yes
The retailer or
service provider
refused to deliver
to (ANOTHER EU
COUNTRY)
The retailer or
service provider
did not accept
payment from
(ANOTHER EU
COUNTRY)
Consumer vulnerability
(socio-demographic
factors)
Consumer vulnerability
(complexity)
None of them Dont know
Languages
Mother Tongue
Numerical skills
Internet use
You were
redirected to a
website in
(ANOTHER EU
COUNTRY) when
prices were
different
Consumer Survey 2018
171
With regard to socio-demographic variables and other characteristics consumersrsquo frequency of internet use is the factor associated most closely with the proportion of consumers that has come
across any of the presented problems (ie Total lsquoYesrsquo) when buying goods online in another EU country The characteristics having the next closest links with this indicator are consumersrsquo language skills vulnerability due to socio-demographic factors age and employment status
Consumers who hardly ever use the internet are much less likely to have come across the presented
problems than consumers who use the internet more frequently (ie monthly weekly or daily)
Regarding the number of languages that consumers speak consumers who speak four or more languages are more likely to have come across any of the presented problems when buying goods online in another EU country than those who speak two languages or only their native language In addition consumers who speak three languages are also more likely to have come across any of the presented problems than those who speak only their native language
Those who are not vulnerable in terms of socio-demographic factors are less likely to have come
across any of the presented problems than consumers who are very vulnerable
As far as age is concerned consumers aged 65+ years are less likely to experience such problems
than young consumers (ie those aged between 18 and 34 years)
Finally blue collar workers and those who are retired are less likely to have come across any of the presented problems than consumers who are self-employed Blue collar workers are also less likely to have come across any of the presented problems than students managers and other white collars
Those who are unemployed and seeking a job do not differ from the other groups on this indicator
The likelihood that consumers come across the problem where a retailer or service provider refused to deliver to another EU country is associated most closely with internet use followed by employment status
People who hardly ever use the internet are less likely to be confronted with this problem than daily or weekly internet users
Regarding employment status consumers who are unemployed self-employed and those with
another white-collar job are more likely to come across the problem of retailers or service providers refusing to deliver to another EU country than blue collar workers and people who are retired Those
who are students or jobseekers do not differ from the other groups in terms of this issue
When it comes to the problem of a retailer or service provider not accepting payment from another EU country the likelihood of being confronted with this problem is most closely associated with vulnerability due to socio-demographic factors followed by numerical skills the degree of urbanisation and employment status
Consumers who are very vulnerable in terms of socio-demographic factors are more likely to have their payment rejected during a cross-border purchase interaction than those who are somewhat or not vulnerable
With regard to numerical skills consumers with low numerical skills are less likely to have faced this problem than consumers with medium or high numerical skills
Those who live in a small town are less likely to have come across this problem than consumers who
live in a large town
Finally with regard to employment status other white collars are more likely to face this issue compared to blue collar workers
Regarding the problem of a consumer trying to buy something online and being redirected to a website in another EU country where prices are different vulnerability due to the complexity of offers and terms and conditions is the factor associated most closely with this indicator Other factors with close links are age and employment status
Consumers who are very vulnerable are more likely to come across this problem than those who are somewhat or not vulnerable
Consumer Survey 2018
172
Younger consumers (aged 18-34 years) are also more likely to be confronted with the problem than
all other age groups In addition those aged 35-54 years are more likely to be confronted with this issue than people aged 65+ years
Finally with regard to employment status consumers who are self-employed are more likely to have faced this problem than students or blue-collar workers All other employment groups do not differ from these groups on this indicator
Consumer Survey 2018
173
12 PROBLEMS EXPERIENCED WITH ONLINE PURCHASES
The present chapter reports further insights into the types of problems consumers experience with online purchases Each type of problem surveyed is also broken down by retailersrsquo or service providersrsquo location ndash domestic and cross-border inside the EU
Problems with domestic online purchases
The proportion of consumers who experienced problems with domestic retailers based on Q14a and Q14b43 ndash
Base respondents who shop online domestically (N=14037)
43 Q14a I will read you some statements about problems consumers may have when shopping online Please tell me whether you have experienced any of them during the last 12 monthshellip
- Yes with retailers or services providers located in (our country) -Yes with retailers or services providers
Region
Country
2018
( = sig
diff EU27)
2018-
2016
2016-
2014
EU27_2019 494 +161 -122
EU28 515 +198 -156
North 361 +02 +13
South 481 +73 +10
East 476 +22 +09
West 531 +268 -236
BE 406 +09 +29
BG 437 +88 -08
CZ 500 +66 -07
DK 352 +16 -10
DE 548 +286 -239
EE 317 -34 +58
IE 337 +116 -67
EL 377 -04 +47
ES 486 +73 -13
FR 570 +355 -334
HR 337 -04 +03
IT 509 +94 +22
CY 188 -82 +153
LV 313 -74 +33
LT 286 -69 -42
LU 327 +144 -121
HU 262 -65 -88
MT 181 -180 +266
NL 529 +72 -18
AT 308 +101 -104
PL 522 +27 +15
PT 273 -32 -03
RO 541 +57 +100
SI 328 +66 -49
SK 407 -52 -43
FI 255 -15 -35
SE 438 +29 +53
IS 192 +22 -04
NO 339 +20 -24
UK 627 +388 -321
Problems experienced with domestic online
retailers
Consumer Survey 2018
174
In this map values below average are coloured in light and dark green and values above average are coloured
in light and dark red
In the European Union the overall proportion of consumers that report problems with domestic online purchases is 494 In the South this proportion is in line with the EU27_2019 average while
located in another EU country -Yes but you donrsquot know in which country the retailers or services providers were located ndashNo ndashDKNA
Q14a1 You have received a damaged product or a different product from the one you ordered Q14a2 Products were delivered later than promised Q14a3 Products were not delivered at all Q14b I will read you some statements about problems consumers may have when shopping online Please
tell me whether you experienced any of them when buying in (our country) during the last 12 monthshellip -Yes ndashNo ndashDKNA Q14b1 You have received a damaged product or a different product from the one you ordered Q14b2 Products were delivered later than promised Q14b3 Products were not delivered at all
Consumer Survey 2018
175
it is higher in the West (531) and lower in the North (361) and East (476) Among the EU
Member States44 the highest levels of this indicator are found in France (570) Germany (548) and Romania (541) Furthermore this level is also high in the UK (627) The lowest levels across the EU countries are found in Malta (181) Cyprus (188) and Finland (255) Of all studied countries the level is also low in Iceland (192)
Compared to 2016 the proportion of consumers experiencing problems with domestic online retailers increased in the EU27_2019 the South (+73pp) and West (+268pp) while it remained unchanged in the North and East Among the EU Member States the largest increase in problems with domestic
online retailers is found in France (+355pp) while no statistically significant decrease is found Considering all the studied countries an even larger increase can be found in the UK (+388pp)
When looking at changes in 2018 (vs 2016) and in 2016 (vs 2014) the largest negative reversal is also found in France where the increase of this indicator between 2016 and 2018 (see above) reflecting a higher proportion of consumers with problems with domestic retailers follows a decrease of 334pp between 2014 and 2016 Looking at all countries of the survey the largest negative
reversal is found in the UK where between 2016 and 2018 this indicator increased (see above) whereas between 2014 and 2016 it decreased by 321pp No statistically significant negative reversal
is found
The proportion of consumers who experienced problems with domestic retailers based on Q14a and Q14b ndash
Base EU27_2019 respondents who shop online domestically (N=12382)
The proportion of consumers who experienced problems with domestic retailers based on Q14a and Q14b ndash
Base EU27_2019 respondents who shop online domestically (N=12382)
44 Results for Malta (63) and Cyprus (72) are based on a very small sample size and should therefore be considered as mainly indicative
503 A 482 A
569 507 418 339
439 A 475 A 514
545 A 500 A 490 A 482 A
497 A 483 A 502 A
525 A 503 A 491 A 487 A
474 A 490 A 454 A 488 A
GenderMale Female
Problems experienced with domestic online retailers
Blue collar
Student
65+
Education levelLow Medium High
Age18-34 35-54 55-64
Very easy
UrbanisationRural area Small town Large town
Financial situationVery difficult Fairly difficult Fairly easy
Unemployed Seeking a job RetiredEmployment status
Self-employed Manager Other white collar
460 A 527 477 A 441 A
455 A 495 A
479 A 490 A 496 A
495 A 463 A 461 A 413 A
506 AB 544 B 469 A
572 509 A 477 A
Four or more
Problems experienced with domestic online retailers
LanguagesOnly native Two
High
Mother tongue
Not official language
in home country
Official language in
home country
Numerical skillsLow Medium
Three
Consumer
vulnerability
(complexity)
Very vulnerableSomewhat
vulnerableNot vulnerable
Hardly ever Never
Consumer
vulnerability
(socio-demographic
factors)
Very vulnerableSomewhat
vulnerableNot vulnerable
Internet useDaily Weekly Monthly
Consumer Survey 2018
176
Regarding the socio-demographic variables associated with the proportion of consumers who
experienced problems with domestic online purchases age is the factor that is associated most closely Other characteristics with close links are vulnerability due to the complexity of offers and terms and conditions and consumersrsquo education level
The proportion of consumers who experienced problems with domestic online purchases decreases with rising age Younger consumers (aged 18-34 years) are most likely to encounter problems than all other age groups In turn those aged 35-54 years show a higher likelihood than those aged 55-64 years who in turn are more likely to encounter issues with domestic online purchases than those
aged 65 or older
Furthermore among consumers who are very vulnerable due to the complexity of offers and terms and conditions the incidence is higher than among those who are somewhat or not vulnerable
Finally highly educated consumers are more likely to experience problems with domestic online purchases than those with a medium or low level of education
Consumer Survey 2018
177
1211 Types of problems with domestic online retailers
Percentage of ldquoYesrdquo answers in Q14a1-3 and Q14b1-3 ndash Base respondents who shop online domestically
(N=14037)
Late delivery is the most common problem with domestic online retailers (393) followed by
damaged and wrong delivery (198) and no delivery (92)
2018
( = sig
diff EU27)
2018-
2016
2016-
2014
2018
( = sig
diff EU27)
2018-
2016
2016-
2014
2018
( = sig
diff EU27)
2018-
2016
2016-
2014
EU27_2019 198 +79 -65 393 +147 -95 92 +33 -23
EU28 214 +107 -95 408 +170 -119 108 +51 -41
North 135 -15 +07 275 +22 +01 50 -00 -08
South 213 +49 +07 374 +63 +13 77 +23 -18
East 197 -06 +12 354 +32 +14 87 +04 -19
West 199 +130 -128 438 +243 -189 109 +54 -28
BE 159 +07 +32 317 +21 +18 67 +05 +02
BG 209 +14 +23 287 +61 +13 69 +20 -08
CZ 192 +13 +38 359 +79 -45 106 +05 +04
DK 115 -05 -20 266 +19 -08 46 -03 -04
DE 185 +120 -156 453 +255 -172 124 +74 -41
EE 130 +08 -17 242 -08 +46 28 -29 +10
IE 132 +92 -49 249 +81 -36 59 +16 -14
EL 159 +38 +18 293 -11 +45 34 -14 +01
ES 213 +56 -16 379 +64 -09 87 +48 -13
FR 246 +196 -140 471 +322 -293 115 +54 -27
HR 145 +40 -12 224 -54 -00 62 -05 -10
IT 229 +48 +24 398 +83 +25 81 +14 -29
CY 98 -12 +61 166 -13 +91 20 -31 +35
LV 112 -53 +20 218 -51 +06 34 -20 +14
LT 102 -39 -11 216 -55 -31 38 -13 -14
LU 92 +71 -110 246 +109 -77 88 +48 +10
HU 96 +20 -82 175 -89 -45 57 +02 -21
MT 69 -169 +234 142 -133 +183 14 -213 +225
NL 185 +37 -25 459 +86 -20 72 +08 +08
AT 132 +73 -58 238 +84 -70 54 +14 +02
PL 225 -12 +19 409 +47 +26 93 +09 -38
PT 123 +26 -18 180 -73 +19 34 -04 +07
RO 218 -13 +40 389 +50 +109 88 +06 +30
SI 125 +26 -55 255 +89 -36 38 -08 +12
SK 148 -13 -50 298 +10 -70 86 -36 -33
FI 99 -23 +09 180 +20 -46 17 -19 -29
SE 172 -10 +27 344 +53 +30 72 +17 -03
IS 83 +47 -11 122 -09 +13 14 -28 +11
NO 130 +08 -07 245 +18 -21 51 -16 +21
UK 302 +252 -234 492 +296 -232 191 +148 -126
Types of problems with domestic online retailers
Region
Country
Damaged or wrong delivery Late delivery No delivery
Consumer Survey 2018
178
In the European Union the overall proportion of consumers exposed to damaged or wrong
deliveries is 198 In the South East and West the proportion of consumers who experienced this problem is in line with the EU27_2019 average while it is lower in the North (135) Among the EU Member States the highest levels of this indicator are found in France (246) Greece and Belgium (both 159) Among all the studied countries this level is highest in the UK (302) The lowest levels among the EU countries are found in Malta (69) Luxembourg (92) and Hungary (96) Of all studied countries the level is also low in Iceland (83)
Between 2016 and 2018m the proportion of consumers experiencing damaged or wrong deliveries
increased in the EU27_2019 (+79pp) the South (+49pp) and West (130pp) while it remained stable in the North and East Compared to the survey in 2016 the proportion of consumers experiencing damaged or wrong delivery increased most prominently in France (+196pp) and decreased most steeply in Malta (-169pp) Considering all countries of the study the largest increase is observed in the UK (+252pp)
The largest positive reversal is also found in Malta where the decrease between 2016 and 2018
(reflecting a lower proportion of consumers that experienced damaged or wrong deliveries) was preceded by an increase of 234pp between 2014 and 2016 The largest negative reversal is found
in France where between 2016 and 2018 this indicator increased by 196pp (reflecting a higher proportion of consumers with this problem) whereas between 2014 and 2016 it decreased by 140pp Looking at all countries of the study the largest negative reversal is found in the UK where between 2016 and 2018 this indicator increased by 252pp following a decrease of 234pp between 2014 and 2016
The overall proportion of consumers who experienced late deliveries from domestic online retailers is 393 in the European Union While the proportion of consumers who experienced this problem is in line with the EU27_2019 average in the South it is higher in the West (438) and lower in the North (275) and East (354) Among the EU Member States the highest levels of this indicator are found in France (471) the Netherlands (459) and Germany (453) The lowest levels are found in Malta (142) Cyprus (166) and Hungary (175) Among all studied countries this level is highest in the UK (492) and lowest in Iceland (122)
The proportion of consumers experiencing late deliveries increased in 2018 in the EU27_2019 (+147pp) the East (+32pp) South (+63pp) and West (+243pp) while no changes are observed in the North Compared to the survey in 2016 the proportion of consumers who experienced late delivery increased most prominently in France (+322pp) where also the largest negative reversal
is found Before the increase in the proportion of consumers who experienced late deliveries between 2016 and 2018 this indicator decreased by 293pp between 2014 and 2016 This indicator decreased
most prominently in Malta (-133pp) where also the only positive reversal is found The decrease between 2016 and 2018 (reflecting fewer late deliveries) was preceded by an increase of 183pp between 2014 and 2016
In the European Union the proportion of consumers who experienced deliveries not taking place is 92 In the East the proportion of consumers who experienced this problem is in line with the EU27_2019 average while it is higher in the West (109) and lower in the South (77) and North (50) Among the EU Member States the highest levels of this indicator are found in Germany
(124) Bulgaria (69) and Belgium (67) The lowest levels are found in Malta (14) Finland (17) and Cyprus (20) When looking at all the studied countries the highest level is found in the UK (191) and the lowest in Iceland (14)45
In 2018 the proportion of consumers for whom deliveries had not taken place increased in the EU27_2019 (+33pp) the South (+23pp) and West (+54pp) while it remained stable in the North and the South Compared to the survey in 2016 the proportion of consumers who experienced no
deliveries increased most noticeably in Germany (+74pp) and decreased most prominently in Malta
(-213pp) In this regard the largest negative and positive reversals are found respectively in Germany and Malta In Germany the increase between 2016 and 2018 reflecting a higher proportion of consumers that experienced problems with deliveries not taking place was preceded by a decrease of 41pp between 2014 and 2016 The only positive reversal is found in Malta where between 2016 and 2018 the indicator decreased (reflecting fewer deliveries that had not taken place see above) whereas between 2014 and 2016 it increased by 225pp Looking at all countries of the study the
45 Results for Malta (63) and Cyprus (72) are based on a very small sample size and should therefore be considered as mainly indicative
Consumer Survey 2018
179
largest negative reversal is found in the UK where between 2016 and 2018 the incidence of this
problem increased by 148pp following a decrease of 126pp between 2014 and 2016
Percentage of ldquoYesrdquo answers in Q14a1-3 and Q14b1-3 ndash Base EU27_2019 respondents who shop online
domestically (N=12382)
Male 202 A 401 A 87 A
Female 194 A 380 A 95 A
18-34 224 B 470 113 A
35-54 210 B 396 105 A
55-64 167 A 324 67
65+ 124 A 246 37
Low 166 AB 343 A 98 A
Medium 181 A 371 A 98 A
High 216 B 413 85 A
Very difficult 223 A 412 A 119 AB
Fairly difficult 210 A 410 A 73 A
Fairly easy 189 A 386 A 96 B
Very easy 201 A 381 A 98 AB
Rural area 191 A 408 A 91 A
Small town 190 A 378 A 83 A
Large town 215 A 391 A 100 A
Self-employed 218 B 404 A 114 C
Manager 230 B 405 A 110 BC
Other white collar 194 AB 396 A 77 A
Blue collar 204 B 372 A 75 AB
Student 146 A 389 A 89 ABC
Unemployed 230 B 345 A 86 ABC
Seeking a job 136 A 378 A 89 ABC
Retired 199 AB 388 A 138 C
Age groups
Types of problems with domestic online
retailers
Damaged or wrong
deliveryLate delivery No delivery
Gender
Education
Financial Situation
Urbanisation
Employment status
Consumer Survey 2018
180
Percentage of ldquoYesrdquo answers in Q14a1-3 and Q14b1-3 ndash Base EU27_2019 respondents who shop online
domestically (N=12382)
Regarding the likelihood of having come across the problem of damaged or wrong deliveries of
products purchased online from a domestic retailer the factor associated most closely is age followed by employment status and education
Consumers aged between 18 and 54 years are more likely to have experienced damaged or wrong deliveries for such purchases than those aged 55 or older
Regarding consumersrsquo employment status students and jobseekers are less likely to face this
problem than blue collar workers self-employed unemployed and managers
In terms of education highly educated consumers are more likely to experience damaged or wrong deliveries from domestic retailers than consumers with a medium education level
When it comes to late deliveries of domestic online purchases the factor associated most closely is also age Other characteristics with close links are vulnerability due to the complexity of offers and terms and conditions and education level
Only native 180 A 365 A 87 A
Two 217 B 425 96 A
Three 189 AB 362 A 87 A
Four or more 171 A 339 A 85 A
Not official
language in home
country
177 A 375 A 124 A
Official language
in home country199 A 391 A 89 A
Low 229 A 361 A 90 A
Medium 197 A 403 A 84 A
High 196 A 389 A 94 A
Daily 200 A 391 A 94 B
Weekly 175 A 387 A 49 A
Monthly 158 A 404 A 60 AB
Hardly ever 143 A 332 A 76 AB
Never
Very vulnerable 216 AB 379 AB 96 AB
Somewhat
vulnerable235 B 420 B 125 B
Not vulnerable 180 A 380 A 76 A
Very vulnerable 213 A 480 137
Somewhat
vulnerable216 A 406 A 87 A
Not vulnerable 189 A 374 A 86 A
Types of problems with domestic online
retailers
Consumer vulnerability
(socio-demographic
factors)
Consumer vulnerability
(complexity)
Late delivery No delivery
Languages
Mother Tongue
Numerical skills
Internet use
Damaged or wrong
delivery
Consumer Survey 2018
181
Younger consumers (18-34 years) are more likely to experience this problem than any other age
group In addition those aged 35-54 years are more likely to experience this issue than those aged 55-64 years who in turn report a higher likelihood than those aged 65 years or older
Furthermore consumers who are very vulnerable due to the complexity of offers and terms and conditions are more likely to face this problem than those who are somewhat or not vulnerable
Finally highly educated consumers are more likely to come across this problem than those with a medium or low education level
Regarding socio-demographic characteristics that are linked with the probability of having a domestic
online purchase not delivered age is also the factor associated most closely with this indicator Other characteristics with close links are vulnerability due to the complexity of offers and terms and conditions and employment status
Consumers aged 18-54 years are more likely to encounter problems of not having their domestic online purchase delivered than those aged 55-64 years who in turn report a higher likelihood than those aged 65 years or older
In addition consumers who are very vulnerable due to the complexity of offers and terms and conditions are more likely to have faced this problem than those who are somewhat or not vulnerable
Finally consumers who are self-employed or retired are more likely to come across this problem for a domestic online purchase than other white collars and blue-collar workers Managers are also more likely to come across this problem than other white collars
Consumer Survey 2018
182
Problems with cross-border purchases
The proportion of consumers who experienced problems with domestic retailers based on Q14c46 ndash Base
respondents who shop online cross-border (N=7722)
In the European Union the proportion of persons having experienced problems with cross-border
online purchases is equal to 361 In the West this proportion is in line with the EU27_2019 average while it is higher in the South (436) and lower in the East (247) and North (281)
46 Q14c I will read you some statements about problems consumers may have when shopping online Please tell me whether you experienced any of them when buying in another EU country during the last 12 months
- Yes ndashNo ndashDKNA Q14c1 You have received a damaged product or a different product from the one you ordered Q14c2 Products were delivered later than promised Q14c3 Products were not delivered at all
Region
Country
2018
( = sig
diff EU27)
2018-
2016
2016-
2014
EU27_2019 361 +127 -50
EU28 359 +138 -58
North 281 +58 -51
South 436 +105 +11
East 247 +35 -05
West 363 +195 -116
BE 483 +90 +44
BG 203 -87 -09
CZ 179 +34 +10
DK 303 +74 -85
DE 330 +204 -45
EE 256 -36 -68
IE 525 +337 -301
EL 388 +113 -117
ES 391 +37 +30
FR 343 +254 -241
HR 420 +29 +33
IT 475 +159 +15
CY 482 +101 -137
LV 278 -166 +08
LT 329 -43 -28
LU 469 +240 -258
HU 132 -89 -94
MT 750 +74 +50
NL 207 -07 -13
AT 504 +348 -288
PL 232 +73 +12
PT 412 -05 +84
RO 391 +192 -63
SI 312 +19 -41
SK 297 +37 -52
FI 260 +48 -60
SE 274 +119 -36
IS 355 +125 +20
NO 248 +11 -02
UK 348 +233 -130
Problems experienced with cross-border
online retailers
Consumer Survey 2018
183
In this map values below average are coloured in light and dark green and values above average are coloured
in light and dark red
The highest levels of this indicator are found in Malta (750) Ireland (525) and Austria (504) The lowest levels are found in Hungary (132) the Czech Republic (179) and Bulgaria (203)47
Compared to 2016 the proportion of persons experiencing problems with cross-border online
purchases increased in the EU27_2019 (+127pp) the East (+35pp) North (+58pp) South
(+105pp) and West (+195pp) The proportion of consumers experiencing problems with cross-border online purchases increased most prominently in Austria (+348pp) and decreased most noticeably in Latvia (-166pp) When looking at changes in 2018 (vs 2016) and in 2016 (vs 2014) the largest negative reversal is found in Ireland where between 2016 and 2018 this indicator
47 Results for Romania are based on a very small sample size (84 observations) and they should be therefore considered as mainly indicative
Consumer Survey 2018
184
increased by 337pp (reflecting a higher proportion of consumers experiencing problems) whereas
between 2014 and 2016 it decreased by 301pp No statistically significant positive reversal is found
The proportion of consumers who experienced problems with cross-border online purchases based on Q14c ndash
Base EU27_2019 respondents who shop online cross-border (N=6788)
The proportion of consumers who experienced problems with cross-border online purchases based on Q14c ndash
Base EU27_2019 respondents who shop online cross-border (N=6788)
With regard to the association between the incidence of problems experienced with cross-border online purchases and socio-demographic variables the factor associated most closely with this indicator is vulnerability due to the complexity of offers and terms and conditions followed by language consumersrsquo financial situation frequency of internet use and age
Consumers who are very vulnerable due to the complexity of offers are more likely to experience problems online with cross-border retailers than those who are somewhat or not vulnerable
Regarding consumersrsquo language skills those who speak at least four languages are more likely to experience such problems than the remainder of the population
Those in a very easy financial situation are less likely to experience problems with cross-border retailers than other consumers In addition consumers in a fairly easy financial situation are also less likely to experience problems with those retailers than consumers in a fairly difficult financial
situation
A higher frequency of internet use is surprisingly associated with less problems experienced online with cross-border retailers with daily internet users being less likely to experience problems than those who hardly use the internet
358 A 366 A
409 B 342 A 319 A 313 AB
367 A 383 A 346 A
444 AB 412 B 356 A 299
356 A 357 A 372 A
398 BC 401 BC 333 AB 344 AB
473 C 404 ABC 401 ABC 276 A
GenderMale Female
Problems experienced with cross-border online retailers
Blue collar
Student
65+
Education levelLow Medium High
Age18-34 35-54 55-64
Very easy
UrbanisationRural area Small town Large town
Financial situationVery difficult Fairly difficult Fairly easy
Unemployed Seeking a job RetiredEmployment status
Self-employed Manager Other white collar
330 A 346 A 365 A 488
354 A 362 A
416 A 360 A 358 A
360 A 358 AB 449 AB 697 B
372 A 374 A 356 A
461 353 A 354 A
Four or more
Problems experienced with cross-border online retailers
LanguagesOnly native Two
High
Mother tongue
Not official language
in home country
Official language in
home country
Numerical skillsLow Medium
Three
Consumer
vulnerability
(complexity)
Very vulnerableSomewhat
vulnerableNot vulnerable
Hardly ever Never
Consumer
vulnerability
(socio-demographic
factors)
Very vulnerableSomewhat
vulnerableNot vulnerable
Internet useDaily Weekly Monthly
Consumer Survey 2018
185
Finally concerning consumersrsquo age consumers aged 18-34 years are more likely to experience such
problems than those aged 35-64 years
Consumer Survey 2018
186
1221 Types of problems with cross-border online retailers
Percentage of ldquoYesrdquo answers in Q14c1-3 ndash Base respondents who shop online cross-border (N=7722)
The most common problem with cross-border online retailers is similar to domestic online retailers late delivery (278) followed by damaged and wrong delivery (115) and no delivery (83)
2018
( = sig
diff EU27)
2018-
2016
2016-
2014
2018
( = sig
diff EU27)
2018-
2016
2016-
2014
2018
( = sig
diff EU27)
2018-
2016
2016-
2014
EU27_2019 115 +30 +00 278 +111 -59 83 +38 -04
EU28 116 +36 +03 282 +125 -64 84 +42 -12
North 105 +28 -15 215 +47 -36 50 +03 +03
South 146 +28 +29 346 +107 -22 94 +37 +07
East 95 +10 -15 175 +22 +14 54 +10 -03
West 104 +44 -19 278 +161 -116 90 +53 -13
BE 172 +31 +21 383 +89 +20 136 +74 +14
BG 81 -31 -07 144 -43 -34 56 -25 +11
CZ 62 +23 -00 136 +10 +18 28 -09 +19
DK 83 +24 +03 266 +72 -58 49 +06 -23
DE 66 +09 +08 253 +177 -68 86 +44 +30
EE 117 -23 -03 179 -10 -71 74 +33 -31
IE 183 +125 -86 418 +289 -256 134 +90 -109
EL 136 +28 -41 295 +88 -57 130 +80 -29
ES 159 +12 +60 300 +50 -00 72 +32 -41
FR 107 +87 -53 260 +197 -218 83 +63 -44
HR 157 +11 -06 275 -23 +35 155 -15 +40
IT 135 +44 +16 384 +150 -27 108 +44 +37
CY 245 +109 -52 370 +84 -174 75 -23 -00
LV 153 -31 -13 194 -110 -11 83 -13 +22
LT 135 -66 +27 238 -30 -29 115 -17 +50
LU 194 +142 -152 355 +195 -195 104 +41 -39
HU 57 +06 -129 72 -99 +15 24 -10 -15
MT 290 -71 +139 671 +156 +33 334 +30 +47
NL 64 -17 +59 148 -08 -24 55 +20 -37
AT 189 +159 -141 384 +270 -234 93 +64 -57
PL 116 +40 -00 161 +37 +27 40 +37 -14
PT 144 -57 +90 343 +82 +07 57 -31 +53
RO 80 -34 -08 345 +209 -15 48 +24 -35
SI 104 -13 -31 221 +15 +07 70 +26 -67
SK 97 -02 -19 186 +35 -36 111 +11 -19
FI 108 +34 -45 187 +29 -25 15 -17 -10
SE 102 +57 -23 202 +88 -31 49 +12 +20
IS 87 +45 -01 288 +109 +25 89 +24 +18
NO 80 +07 -07 176 +04 +11 76 +12 +21
UK 121 +83 +04 305 +228 -118 91 +72 -62
Types of problems with cross-border online retailers
Region
Country
Damaged or wrong delivery Late delivery No delivery
Consumer Survey 2018
187
In the European Union the proportion of persons having experienced damaged or wrong cross-
border delivery is equal to 115 This proportion is equal to the EU27_2019 average in the North and the West while it is higher in the South (146) and lower in the East (95) The highest levels of this indicator are found in Malta (290) Cyprus (245) and Luxembourg (194) The lowest levels are found in Hungary (57) the Czech Republic (62) and the Netherlands (64)48
Between 2016 and 2018 the proportion of consumers who experienced damaged or wrong cross-border delivery increased in the EU27_2019 (+30pp) the North (+28pp) and West (+44pp) while it did not statistically change in the South and East Compared to the survey in 2016 the proportion
of consumers who experienced damaged or wrong cross-border delivery increased most markedly in Austria (+159pp) No statistically significant decrease is observed When looking at changes in 2018 (vs 2016) and in 2016 (vs 2014) the largest positive reversal is also found in Austria where the increase between 2016 and 2018 was preceded by a decrease of 141pp between 2014 and 2016 No statistically significant negative reversal is found
The overall proportion of consumers experiencing late cross-border deliveries is 278 in the
European Union The proportion of persons having experienced this problem in the West is in line with the EU27_2019 average while it is higher in the South (346) and lower in the North (215)
and East (175) The highest levels of this indicator are found in Malta (671) Ireland (418) and Italy and Austria (both 384) The lowest levels are found in Hungary (72) the Czech Republic (136) and Bulgaria (144)
Compared to 2016 the proportion of consumers experiencing late cross-border delivery increased in the EU27_2019 (+111pp) the North (+47pp) South (+107pp) and West (+161pp) while it
stayed the same in the East The largest increase is recorded for Ireland (+289pp) whereas the largest decrease is observed in Latvia (-110pp) The largest negative reversal is also found in Ireland where the increase for this indicator between 2016 and 2018 (reflecting a greater proportion of consumers experiencing late deliveries) follows a decrease of 256pp between 2014 and 2016 No statistically significant positive reversal is found
In the European Union the proportion of persons whose purchase was not delivered is 83 The incidence of this problem is in line with the EU27_2019 average in the South and West while it is
lower in the North (50) and East (54) The highest levels of this indicator are found in the Malta (334) Croatia (155) and Belgium (136) The lowest levels are found in Finland (15) Hungary (24) and the Czech Republic (28)
Between 2016 and 2018 the proportion of persons who made cross-border purchases that were not delivered increased in the EU27_2019 (+38pp) the South (+37pp) and West (+53pp) while it did not change in the North and East Compared to the survey in 2016 the proportion of consumers who
experienced no cross-border delivery increased most prominently in Ireland (+90pp) No statistically significant decrease is observed When looking at changes in 2018 (vs 2016) and in 2016 (vs 2014) the largest negative reversal is also found in Ireland where the increase between 2016 and 2018 (reflecting a greater incidence of such problems) follows a decrease of 109pp between 2014 and 2016 No statistically significant positive reversal is found
48 The results of all three types of problems are based on a very small sample size for Romania (84 observations) and they should be therefore considered as mainly indicative
Consumer Survey 2018
188
Percentage of ldquoYesrdquo answers in Q14c1-3 ndash Base EU27_2019 respondents who shop online cross-border
(Q14c1 N=6788 Q14c23 N=6781)
Male 115 A 275 A 81 A
Female 116 A 283 A 86 A
18-34 124 A 325 94 A
35-54 103 A 265 A 78 A
55-64 129 A 223 A 67 A
65+ 110 A 212 A 81 A
Low 167 A 239 A 131 A
Medium 116 A 297 A 80 A
High 112 A 266 A 82 A
Very difficult 191 A 310 AB 62 A
Fairly difficult 128 A 308 B 94 A
Fairly easy 110 A 283 B 82 A
Very easy 96 A 220 A 75 A
Rural area 106 A 283 A 85 A
Small town 123 A 270 A 79 A
Large town 113 A 284 A 87 A
Self-employed 132 B 292 ABC 92 A
Manager 146 B 310 ABC 72 A
Other white collar 107 B 259 AB 74 A
Blue collar 117 B 248 AB 88 A
Student 154 B 351 C 112 A
Unemployed 109 AB 367 BC 123 A
Seeking a job 104 AB 343 ABC 97 A
Retired 52 A 219 A 71 A
Age groups
Types of problems with cross-border
online retailers
Damaged or wrong
deliveryLate delivery No delivery
Gender
Education
Financial Situation
Urbanisation
Employment status
Consumer Survey 2018
189
Percentage of ldquoYesrdquo answers in Q14c1-3 ndash Base EU27_2019 respondents who shop online cross-border
(Q14c1 N=6788 Q14c23 N=6781)
Regarding the association of socio-demo variables with the incidence of experiencing damaged or wrong deliveries when making a cross-border online purchase vulnerability due to the complexity
of offers and terms and conditions is the factor most closely associated with this indicator followed by employment status and the number of languages spoken
Consumers who are very vulnerable due to the complexity of offers are more likely to experience this problem than those who are somewhat or not vulnerable
In terms of employment consumers who are retired are less likely to come across this type of
problem than students other white collars blue collar workers the self-employed managers and
students
Finally those who speak four or more languages are more likely to experience problems with damaged or wrong deliveries from cross-border retailers than those who speak two languages or only their native language
The socio-demographic variable most closely associated with the likelihood of coming across problems with late deliveries when making a cross-border online purchase is internet use followed by age the number of languages spoken consumersrsquo financial situation and employment status
Only native 100 A 266 A 71 A
Two 111 A 269 A 73 A
Three 120 AB 273 A 115 B
Four or more 156 B 358 89 AB
Not official
language in home
country
78 A 296 A 107 A
Official language
in home country118 A 277 A 81 A
Low 143 A 283 A 119 A
Medium 112 A 299 A 73 A
High 114 A 271 A 83 A
Daily 117 B 276 A 83 A
Weekly 79 AB 295 A 67 A
Monthly 33 A 174 A 255 A
Hardly ever 52 AB 727 181 A
Never
Very vulnerable 132 A 271 A 82 A
Somewhat
vulnerable132 A 282 A 93 A
Not vulnerable 106 A 278 A 79 A
Very vulnerable 194 354 A 125 A
Somewhat
vulnerable106 A 268 A 79 A
Not vulnerable 109 A 274 A 79 A
Types of problems with cross-border
online retailers
Consumer vulnerability
(socio-demographic
factors)
Consumer vulnerability
(complexity)
Late delivery No delivery
Languages
Mother Tongue
Numerical skills
Internet use
Damaged or wrong
delivery
Consumer Survey 2018
190
Consumers who hardly ever use the internet are much more likely to experience this problem than
those who use the internet more frequently (ie monthly weekly or daily)
As far as age is concerned those aged 18-34 years are more likely to face late deliveries from cross-border online purchases than all other age groups
Those who speak four or more languages are also more likely to experience late deliveries than those who speak fewer languages or only their native language
Consumers in a very easy financial situation are less likely to experience late deliveries from cross-border retailers than those in a fairly easy or fairly difficult financial situation
Finally consumers who are retired blue collar workers or other white collars are less likely to experience this problem than students Those who are retired are also less likely to experience this problem than those who are unemployed
Regarding the problem of not receiving deliveries when making a cross-border online purchase none of the measured socio-demographic variables is associated closely with this indicator
Consumer Survey 2018
191
Overall problems experienced
The incidence of problems experienced with domestic and cross-border retailers based on Q14a Q14b and
Q14c ndash Base respondents who shop online domestically or cross-border (N=15463)
In the European Union the proportion of persons experiencing problems with either domestic or
cross-border online purchases is 578 In the South the proportion is in line with the EU27_2019 average while it is higher in the West (622) and lower in the East (512) and North (462) The highest levels of this indicator are found in Malta (768) France (670) and Belgium (622) Additionally this level is also high in the UK (675) The lowest levels are found in Hungary
(306) Finland (389) and Lithuania (408)
Compared to 2016 the proportion of consumers experiencing problems with domestic and cross-border online purchases increased in the EU27_2019 (+210pp) the West (+357pp) the South (+77pp) and the East (+39pp) while it remained stable in the North At country level the proportion of consumers experiencing problems with domestic and cross-border online purchases increased most prominently in France (+458pp) and decreased most steeply in Latvia (-121pp)
Region
Country
2016
( = sig
diff EU28)
2018-
2016
2016-
2014
EU27_2019 578 +210 -120
EU28 592 +245 -156
North 462 +27 +24
South 583 +77 +62
East 512 +39 +14
West 622 +357 -265
BE 622 +65 +82
BG 465 +63 -04
CZ 542 +82 +08
DK 443 +30 -13
DE 609 +348 -255
EE 486 -50 +132
IE 613 +366 -262
EL 471 +35 +13
ES 570 +64 +54
FR 670 +458 -363
HR 545 +25 +90
IT 618 +99 +78
CY 495 +06 -17
LV 491 -121 +124
LT 408 -63 +13
LU 533 +298 -294
HU 306 -61 -92
MT 768 +16 +94
NL 563 +69 -04
AT 571 +343 -280
PL 540 +45 +18
PT 467 +28 +43
RO 562 +80 +76
SI 437 +31 +32
SK 505 +06 -28
FI 389 +20 -17
SE 512 +68 +49
IS 466 +161 +21
NO 478 +45 -00
UK 675 +430 -338
Problems experienced
Consumer Survey 2018
192
When looking at changes in 2018 (vs 2016) and in 2016 (vs 2014) the largest negative and positive
reversals are also found respectively in France and Latvia In France this indicator increased between 2016 and 2018 (indicating a higher proportion of consumers experiencing problems) following a decrease of 363pp between 2014 and 2016 (indicating fewer problems) In Latvia this indicator decreased between 2016 and 2018 (see above) following an increase of 24pp between 2014 and 2016 (indicating more problems)
The incidence of problems experienced with domestic and cross-border retailers based on Q14a Q14b and
Q14c ndash Base EU27_2019 respondents who shop online domestically or cross-border (N=13680)
The incidence of problems experienced with domestic and cross-border retailers based on Q14a Q14b and
Q14c ndash Base EU27_2019 respondents who shop online domestically or cross-border (N=13680)
With regard to socio-demographic variables and other characteristics problems with online retailers (both domestic and cross-border) are associated most closely with age The characteristics that have
the next closest links with the indicator are vulnerability due to the complexity of offers and terms and conditions education gender and consumersrsquo financial situation
Consumers aged 18-34 years are more likely to experience problems with online retailers than all
other age groups In addition those aged 35-54 years are more likely to experience such problems than those aged 55-64 years who in turn are more likely to experience such problems than those aged 65+ years
Consumers who are very vulnerable in terms of the complexity of offers and terms and conditions are also more likely to experience problems with online retailers than those who are somewhat or not vulnerable
Regarding consumersrsquo education level those with a high level of education are more likely to encounter problems than those with a medium or low level of education
595 559
671 590 489 397
505 A 563 A 597
605 AB 598 B 577 AB 546 A
582 A 563 A 590 A
616 B 616 B 572 AB 568 AB
592 AB 580 AB 499 A 548 AB
GenderMale Female
Problems experienced
Blue collar
Student
65+
Education levelLow Medium High
Age18-34 35-54 55-64
Very easy
UrbanisationRural area Small town Large town
Financial situationVery difficult Fairly difficult Fairly easy
Unemployed Seeking a job RetiredEmployment status
Self-employed Manager Other white collar
532 A 604 B 574 B 587 AB
510 A 580 A
556 A 570 A 582 A
581 A 533 A 524 A 546 A
596 AB 625 B 554 A
656 573 A 567 A
Four or more
Problems experienced
LanguagesOnly native Two
High
Mother tongue
Not official language
in home country
Official language in
home country
Numerical skillsLow Medium
Three
Consumer
vulnerability
(complexity)
Very vulnerableSomewhat
vulnerableNot vulnerable
Hardly ever Never
Consumer
vulnerability
(socio-demographic
factors)
Very vulnerableSomewhat
vulnerableNot vulnerable
Internet useDaily Weekly Monthly
Consumer Survey 2018
193
As far as gender is concerned males are more likely to encounter problems with online retailers than
females
Finally less exposure to problems is reported by consumers in a very easy financial situation compared to those in a fairly difficult financial situation
1231 Overall types of problems
Percentage of ldquoYesrdquo answers in Q14a1-3 Q14b1-3 or Q14c1-3 ndash Base respondents who shop online
domestically or cross-border (N=15463)
2018
( = sig
diff EU27)
2018-
2016
2016-
2014
2018
( = sig
diff EU27)
2018-
2016
2016-
2014
2018
( = sig
diff EU27)
2018-
2016
2016-
2014
EU27_2019 235 +99 -60 467 +194 -99 133 +62 -22
EU28 250 +127 -89 480 +220 -125 146 +79 -40
North 188 -02 +21 357 +41 +06 87 +05 +08
South 262 +59 +33 464 +81 +41 119 +42 -05
East 219 +05 +12 384 +44 +21 106 +14 -13
West 235 +157 -130 522 +319 -211 159 +99 -35
BE 257 +34 +54 510 +98 +49 166 +60 +26
BG 216 -04 +16 315 +46 +16 97 +12 +10
CZ 211 +23 +42 394 +88 -25 117 +03 +11
DK 158 +06 -07 359 +40 -06 77 +08 -05
DE 206 +133 -158 512 +312 -187 160 +105 -38
EE 219 -24 +51 369 -21 +99 115 -13 +45
IE 253 +201 -119 502 +314 -201 164 +113 -96
EL 198 +33 +17 371 +29 +27 84 +21 -12
ES 268 +73 +12 453 +65 +37 119 +57 -03
FR 285 +233 -143 568 +423 -322 182 +120 -41
HR 255 +51 +37 369 -56 +85 192 -00 +67
IT 271 +58 +50 495 +107 +50 126 +39 -10
CY 292 +89 +05 386 +34 -79 96 -41 +44
LV 241 -54 +79 345 -81 +67 105 -42 +71
LT 167 -61 +43 307 -56 +10 101 -15 +26
LU 256 +215 -190 419 +246 -217 145 +90 -50
HU 123 +35 -99 208 -85 -34 75 +12 -14
MT 309 -131 +188 678 +61 +84 346 -57 +118
NL 195 +25 -06 481 +84 -14 94 +19 +01
AT 247 +182 -135 450 +280 -227 126 +75 -55
PL 243 +04 +17 427 +60 +28 103 +19 -38
PT 203 +24 +32 356 +15 +25 81 +07 +33
RO 224 -10 +36 411 +72 +93 97 +15 +25
SI 182 -07 +07 335 +60 +39 97 +13 +13
SK 198 +14 -39 368 +51 -52 153 +04 -18
FI 168 -01 +06 280 +38 -30 52 -09 -21
SE 210 +09 +33 402 +81 +16 100 +19 +17
IS 178 +98 +18 345 +113 +26 113 +19 +14
NO 189 +28 -11 340 +25 -04 128 +12 +40
UK 333 +277 -234 554 +356 -258 223 +176 -133
Types of problems
Region
Country
Damaged or wrong delivery Late delivery No delivery
Consumer Survey 2018
194
As with domestic and cross-border online retailers the most common problem overall is late delivery (467) followed by damaged or wrong delivery (235) and purchases not being delivered (133)
In the European Union the proportion of people reporting damaged or wrong deliveries both for domestic and cross-border purchases is 235 In the West this proportion is in line with the EU27_2019 average while it is higher in the South (262) and lower in the North (188) and
East (219) The only result at country level that is higher than the EU27_2019 average is observed in France (285) Additionally this proportion is also high in the UK (333) The lowest proportions are found in Hungary (123) Denmark (158) and Lithuania (167)
Compared to 2016 the proportion of persons experiencing damaged or wrong deliveries of domestic and cross-border purchases increased in the EU27_2019 (+99pp) the West (+157pp) and South (+59pp) while no changes are observed in the East and North At country level the proportion of
consumers who experienced damaged or wrong delivery in domestic and cross-border purchases increased most prominently in France (+233pp) No statistically significant decreases are observed
When looking at changes in 2018 (vs 2016) and in 2016 (vs 2014) the largest negative reversal is found in Luxembourg where between 2016 and 2018 this indicator increased by 215pp reflecting a higher incidence of consumers experiencing damaged or wrong deliveries whereas between 2014 and 2016 it decreased by 190pp Considering all countries of this study an even larger negative reversal is found in the UK where an increase between 2016 and 2018 by 277pp follows a decrease
of 234pp between 2014 and 2016 No statistically significant positive reversal is found
The proportion of consumers experiencing late deliveries for both domestic and cross-border online purchases is 467 in the European Union In the South the proportion is in line with the EU27_2019 average while it is higher in the West (522) and lower in the East (384) and North (357) The highest levels of this indicator are found in Malta (678) France (568) and Germany (512) In addition the level is also high in the UK (554) The lowest levels are found in Hungary (208) Finland (280) and Lithuania (307)
Between 2016 and 2018 the proportion of persons experiencing late delivery of domestic and cross-border purchases increased in the EU27_2019 (+194pp) and in all regions (North +41pp East +44pp South +81pp West +319pp) Compared to the survey in 2016 the proportion of persons
having problems with late delivery of domestic and cross-border purchases increased most prominently in France (+423pp) No statistically significant decreases are observed When looking at changes in 2018 (vs 2016) and in 2016 (vs 2014) the largest negative reversal is also found in
France where the increase between 2016 and 2018 (reflecting a higher incidence of such problems) was preceded by a decrease of 322pp between 2014 and 2016 No statistically significant positive reversal is found
The proportion of consumers who made domestic and cross-border online purchases that were not delivered is 133 in the European Union In the South the proportion is in line with the EU27_2019 average while it is higher in the West (159) and lower in the North (87) and East (106) The highest levels of this indicator are found in Malta (346) Hungary (192) and France
(182) In addition the proportion where online cross-border purchased were not delivered is also high in the UK (223) The lowest levels are found in Finland (52) Hungary (75) and Denmark (77)
Compared to 2016 the proportion of consumers experiencing deliveries of domestic and cross-border purchases that did not take place increased in the EU27_2019 (+62pp) the West (+99pp) South
(+42pp) and East (+14pp) while it remained stable in the North At country-level the proportion of consumers who experienced no delivery in domestic and cross-border purchases increased most
prominently in France (+120pp) while no statistically significant decreases are observed Across the EU Member States the largest negative reversal is found in Ireland where between 2016 and 2018 this indicator increased by 113pp (reflecting a higher incidence of such problems) whereas between 2014 and 2016 it decreased by 96pp Looking at all surveyed countries the largest negative reversal is found in the UK where between 2016 and 2018 this indicator increased by 176pp following a decrease of 133pp between 2014 and 2016 No statistically significant positive reversal
is found
Consumer Survey 2018
195
Percentage of ldquoYesrdquo answers in Q14a1-3 Q14b1-3 or Q14c1-3 ndash Base EU27_2019 respondents who shop
online domestically or cross-border (N=13680)
Male 246 A 479 A 131 A
Female 226 A 452 A 132 A
18-34 278 565 177
35-54 240 473 134
55-64 203 380 94
65+ 147 287 59
Low 207 AB 391 A 135 A
Medium 217 A 450 A 134 A
High 255 B 487 129 A
Very difficult 289 A 457 A 146 A
Fairly difficult 251 A 491 A 121 A
Fairly easy 226 A 465 A 137 A
Very easy 230 A 444 A 125 A
Rural area 230 A 479 A 133 A
Small town 230 A 454 A 120 A
Large town 249 A 468 A 143 A
Self-employed 281 D 472 AB 158 B
Manager 272 CD 509 B 149 B
Other white collar 230 ABC 469 AB 112 A
Blue collar 239 BCD 441 A 122 AB
Student 188 AB 497 AB 139 AB
Unemployed 254 BCD 432 AB 127 AB
Seeking a job 174 A 405 A 131 AB
Retired 217 ABC 452 AB 166 AB
Age groups
Types of problemsDamaged or wrong
deliveryLate delivery No delivery
Gender
Education
Financial Situation
Urbanisation
Employment status
Consumer Survey 2018
196
Percentage of ldquoYesrdquo answers in Q14a1-3 Q14b1-3 or Q14c1-3 ndash Base EU27_2019 respondents who shop
online domestically or cross-border (N=13680)
With regard to socio-demographic variables and other characteristics damaged or wrong deliveries for domestic and cross-border purchases is associated most closely with age followed by employment status and education
Younger consumers (aged 18-34 years) are more likely to receive damaged or wrong deliveries than the remainder of the population In addition those aged 35-54 years are more likely to experience
this problem with domestic or cross-border retailers than consumers aged 55 or older
Regarding consumersrsquo employment status those who are self-employed are more likely to
experience damaged or wrong deliveries than other white collars students those seeking a job and those who are retired Blue collar workers and those who are unemployed are also more likely to experience such problems than those who are seeking a job
In terms of education highly educated consumers are more likely to report damaged or wrong deliveries than consumers with a medium education
In terms of experiencing late deliveries for both domestic and cross-border purchases this indicator is associated most closely with age Other characteristics that have a close link with this indicator are vulnerability due to the complexity of offers and terms and conditions education and employment status
Only native 213 A 427 A 117 A
Two 253 B 493 B 134 A
Three 227 AB 452 A 140 A
Four or more 235 AB 473 AB 144 A
Not official
language in home
country
197 A 420 A 166 A
Official language
in home country238 A 468 A 129 A
Low 268 A 432 A 134 A
Medium 228 A 476 A 119 A
High 236 A 465 A 136 A
Daily 240 A 467 A 134 B
Weekly 189 A 443 A 85 A
Monthly 171 A 461 A 118 AB
Hardly ever 137 A 480 A 143 AB
Never
Very vulnerable 253 AB 468 AB 135 AB
Somewhat
vulnerable272 B 492 B 169 B
Not vulnerable 218 A 454 A 115 A
Very vulnerable 273 A 552 186
Somewhat
vulnerable247 A 466 A 125 A
Not vulnerable 226 A 454 A 126 A
Types of problems
Consumer vulnerability
(socio-demographic
factors)
Consumer vulnerability
(complexity)
Late delivery No delivery
Languages
Mother Tongue
Numerical skills
Internet use
Damaged or wrong
delivery
Consumer Survey 2018
197
Similar to experiencing issues with damaged or wrong deliveries younger consumers (aged 18-34
years) are more likely to experience problems with late deliveries than all other age groups In addition those aged 35-54 years are more likely to experience this problem than consumers aged 55-64 years who in turn are more likely to encounter such problems than those aged 65+ years
Consumers who are very vulnerably due to the complexity of offers and terms and conditions are also noticeably more likely to experience late deliveries than those who are somewhat or not vulnerable
Regarding education consumers with a high level of education are more likely to report encountering
such problems than consumers with a low or medium level of education
Finally in terms of consumersrsquo employment status managers are the most likely to experience late deliveries and more so than blue collar workers and jobseekers
Regarding the incidence of consumers having their domestic or cross-border purchases not delivered this indicator is associated most closely with age followed by vulnerability due to the complexity of offers and terms and conditions and employment status
Consistent with the findings for the two other problems with domestic and cross-border purchases consumers aged 18-34 years are more likely to experience the issues of having their purchases not delivered than all other age groups In addition those aged 35-54 years are more likely to encounter this problem than consumers aged 55-64 years who in turn are more likely to encounter this problem than those aged 65+ years
Consumers who are very vulnerable due to complexity of offers and terms and conditions are also more likely to report missing deliveries than those who are somewhat or not vulnerable
Finally in terms of consumersrsquo employment status managers and consumers who are self-employed are more likely compared to other white collars
Consumer Survey 2018
198
13 CONSUMER VULNERABILITY
Since the 2016 edition of the Consumersrsquo attitudes towards cross-border trade and consumer protection survey special attention is given to consumer vulnerability Chapter 12 presents the findings based on self-reported consumer vulnerability based on six concrete pre-defined drivers of vulnerability health problems poor financial circumstances current employment situation terms
and conditions that are too complex age and belonging to a minority group In addition personal issues and other issues were included as potentially relevant categories
The results of the survey show that in 2018 432 of the EU27_2019 citizens believe to be vulnerable as consumers for one or more aspects mainly linked to their socio-demographic status which is higher than in 2016 (351) Perceived vulnerability based on the complexity of offers terms and condition has also increased to 342 in 2018 compared to 238 in 2016
Regarding vulnerability that stems from consumersrsquo socio-demographic status the most prevalent
reasons mentioned are related to economic conditions (poor financial circumstances 252 and current employment situation 174 Overall 150 of consumers surveyed that they feel
vulnerable due to their age while 141 reported health problems as a key factor in feeling vulnerable when purchasing goods or services Being part of a minority group is the factor that is reported by the relatively lowest proportion of the respondents with only 90 of respondents feeling vulnerable to at least some extent
Q2147 ndash Base all EU27_2019 respondents (N=25532)
Self-assessed vulnerability varies largely by geographical area of the European Union Vulnerability that stems from consumers socio-demographic background is highest in the Eastern part of the EU (524) followed by the South (480) and the West and North (both 360) Vulnerability that is based on problems with the complexity of offers or terms and conditions is more evenly spread across the different EU regions The proportion of consumers that reports this type of vulnerability is highest
in the East (381) followed by the South (355) West (319) and North (310)
47 Q21 The following statements are about disadvantages that consumers may have when dealing with retailers
To what extent do they apply to you personally You feel vulnerable or disadvantaged when choosing and buying goods or serviceshellip -To a great extent ndash To some extent ndashHardly at all ndashNot at all ndashDKNA Q211 Because of your health problems Q212 Because of your poor financial circumstances Q213 Because of your current employment situation Q214 Because offers terms or conditions are too complex Q215 Because of your age Q216 Because you belong to a minority group Q217 Because of personal issues Q218 Because of other issues
342
432
111
124
90
150
174
252
141
0 10 20 30 40 50 60 70 80 90 100
Offers terms or conditions are too complex
Any socio-demo
Other
Personal issues
Belonging to a minority group
Age
Current employment situation
Poor financial circumstance
Health problems
Self-reported vulnerability EU27_2019 average
Consumer Survey 2018
199
Q21 ndash Base all EU27_2019 respondents (N=25532)
Additional analyses were done to better understand the relationship between consumer conditions and consumersrsquo self-assessed vulnerability based on their socio-demographic background and how that relationship differs from one regional area to the other Results from the multivariate analysis performed by geographical area show that while this type of perceived vulnerability is highest in the East the link between consumersrsquo self-assessed vulnerability and consumer conditions tends to be the weakest The difference in scores on consumer conditions between very vulnerable and not
vulnerable consumers in the South is more than twice as high as the differences observed in the East Consumers in the South however scored also relatively high on vulnerability The link of vulnerability with consumer conditions in the West and North is relatively moderate with values between the ones of the East and the South
Q21ndash Base all EU27_2019 respondents ndash East (N=7845) West (N=6304) South (N=4851) North
(N=5928) When the difference between the very vulnerable and the not vulnerable consumers is not statistically
significant at 5 probability level it is considered equal to 0 (ex knowledge of consumer rights in the Western and Northern regions)
In a final analysis an alternative way to look at the possible determinants of consumer vulnerability was considered by performing a multivariate analysis between self-assessed vulnerability and the socio-demographic characteristics of the persons interviewed
Consumer conditions EAST WEST SOUTH NORTH
Knowledge of consumer rights 0000 0000 0045 0045
Trust in organisations 0092 0000 0097 0000
Confidence in online shopping 0000 0000 0080 0058
Perception of redress mechanism -0037 0000 0000 0000
No exposure to UCPs 0031 0082 0039 0068
No experience of specific shopping problems 0036 0069 0062 0048
Numerical skills 0023 0000 0000 0040
Trust in product safety 0047 0115 0000 0000
Trust in enviromental claims 0000 0000 0095 0000
Problems and complaints indicator 0000 0000 0000 0031
Average 0019 0027 0042 0029
Consumer Survey 2018
200
Q21 ndash Base all EU27_2019 respondents (N=24928)
By and large the results from the logit regressions confirm what was stated by consumers (as discussed above) The tendency to feel vulnerable regarding their socio-demographic background is associated most closely with the financial situation of the consumers In particular
the easier a consumersrsquo financial situation the less likely they are to perceive themselves vulnerable Also higher levels of vulnerability (in terms of socio-demographics) are also observed in persons with a mother tongue not being one of the official languages spoken in the countryregion of
Male 410 342 A
Female 448 343 A
18-34 474 314 A
35-54 430 B 323 A
55-64 421 AB 384 B
65+ 385 AB 374 B
Low 449 A 364 A
Medium 432 A 331 A
High 422 A 351 A
Very difficult 684 441
Fairly difficult 557 389
Fairly easy 363 325
Very easy 270 267
Rural area 456 353 A
Small town 420 A 334 A
Large town 416 A 342 A
Self-employed 430 BC 357 A
Manager 383 AB 346 A
Other white collar 370 A 342 A
Blue collar 421 BC 355 A
Student 516 E 362 A
Unemployed 443 CD 332 A
Seeking a job 519 E 348 A
Retired 485 DE 327 A
Only native 436 AB 345 A
Two 422 AB 340 A
Three 448 B 350 A
Four or more 398 A 324 A
Not official
language in home
country
517 348 A
Official language
in home country425 342 A
Low 433 AB 337 A
Medium 449 B 341 A
High 419 A 344 A
Daily 416 A 346 B
Weekly 482 B 379 B
Monthly 505 AB 365 AB
Hardly ever 446 AB 315 AB
Never 472 B 292 A
Internet use
Financial Situation
Urbanisation
Employment status
Languages
Mother Tongue
Numerical skills
Education
Vulnerability
(socio-
demographics)
Vulnerability
(complexity)
Gender
Age groups
Consumer Survey 2018
201
residence With regard to employment status white collars and managers are the least likely to
experience feelings of vulnerability while those seeking a job and students are more exposed to this issue Furthermore we observe that consumers of 55 years and older are less likely to be vulnerable than young consumers (18-34-year-old) Males tend to be less vulnerable than females and consumers in rural areas are more vulnerable than consumers living in small and large towns
Fewer links with socio-demographic categories are found for vulnerability that stems from complexity with offer and terms and conditions Similar to the other vulnerability type consumers are more likely to feel vulnerable due to complexity when they are in a more difficult
financial situation In addition consumers aged 55 years or older are less likely to be vulnerable than consumers younger than 55 years Finally internet usage is also associated with this type of vulnerability consumers that never use the internet are less likely to perceive themselves vulnerable due to complexity than daily and weekly internet users
Consumer Survey 2018
202
14 DETERMINANTS OF CONSUMER CONDITIONS
As part of this report on consumersrsquo attitudes towards cross-border trade and consumer protection this chapter presents an overview of the links between the socio-demographic variables and a series of key consumer conditions indicators This overview is a summary of the results of a multivariate analysis which estimates the influence of each individual socio-demographic characteristic with the
other characteristics held constant48 The table below shows the socio-demographic variables as rows and the different key consumer conditions indicators in the columns49 By comparing estimated averages across the different dependent variables conclusions about the link of the different socio-demographic with consumer conditions can be drawn
The financial situation of the persons interviewed is the factor more closely linked with consumer conditions Persons with a difficult financial situation (ie a very or fairly difficult situation) tend to show lower trust in organisations lower confidence in online shopping lower trust in product safety
lower trust in environmental claims and a higher probability to experience UCPs Trust in organisations and confidence in online shopping is also lower for people with severe financial problems (ie a very difficult financial situation) than for people with a fairly difficult financial situation the former group being more likely to be exposed to UCPs Likewise trust in redress
mechanisms is lower for people with severe financial problems than the remainder of the population Finally persons in an easy or very easy financial situation score higher on the problems and
complaints indicator than people with severe financial problems
Age tends to be negatively correlated with most of the variables covering trust and confidence Persons of 55 years old and above tend to express lower levels of trust in organisations trust in redress mechanisms and confidence in online shopping than the rest of the population In addition young persons (less than 35 years old) are more likely to express trust in environmental claims than those aged 55 or more There is also a marked negative correlation between age and consumersrsquo confidence in online shopping In contrast young persons appear less knowledgeable of their
consumer rights than all the other age groups and they are more likely to experience other shopping problems (ie other illicit practices) Finally persons aged 65 and above show slightly less numerical skills than the rest of the population
Levels of education are positively correlated with confidence in online shopping and as it can be expected to numerical skills In contrast highly educated persons are more likely to be exposed to unfair commercial practices they show a lower score on the problems and complaints indicator and
they are less likely to express trust in redress mechanisms than the rest of the population In
48 The analysis has been performed on the micro-data from the 2018 Survey on Consumersrsquo attitudes towards cross-border trade and consumer protection It covers the 27 EU Member States (ie EU27_2019 excluding the UK) The statistical modelling that was used here is a regression analysis This type of analysis is useful when we want to investigate the relationship between a dependent variable and one or more independent variables There are several different types of regression models We have used both a Poisson model and a Logit model The former is typically used when the dependent variable can be thought of as a count variable The latter is used in a situation where the dependent variable is binary ie it takes only two possible values ldquo0rdquo and ldquo1rdquo The Poisson regression model was used for the following dependent variables knowledge of consumer rights trust in organisations confidence in online shopping trust in redress mechanisms (no) exposure to UCPs (no) experience of other illicit commercial practices and numerical skills The Logit regression model was used for the remaining dependent variables trust in product safety trust in environmental claims The composite indicator on problems and complaints was instead modelled through linear regression (assuming that the variable is numerical) In all models a control variable on the region of residence of the person interviewed (Northern EU Southern EU Eastern EU and Western EU) has been included
49 The table shows the estimated averages of the model for each dependent variable according to the different values of the independent variable In addition these averages should be considered statistically different except when the pair of categories shares one letter (see the column adjacent to the right) When a category
is associated with a blank it means that it is statistically different from all the other categories The letters used in the table have no meaning as they are only used for comparing categories For example an estimated average for knowledge of consumer rights is equal to 047 for males and to 044 for females and this difference is statistically significant (both categories are associated with a blank) Conversely an estimated average on trust in product safety is equal to 067 for low educated persons and to 069 for highly educated persons (but the difference is not statistically significant as both categories share the letter A) Similarly estimated averages on trust in environmental claims are equal to 056 for daily internet users and to 059 for monthly internet users (but the difference is not statistically significant as both categories share the letter C) Estimated averages are all standardized (with a range from 0 to 1) they can be compared across both rows and columns
Consumer Survey 2018
203
addition persons with a low level of education show higher trust in organisations than the rest of the
population It should also be underlined that the knowledge of consumer rights seems not to be influenced by the level of education of the respondents
Perceived vulnerability stemming from the perceived complexity of offersterms and conditions tends to be associated with lower scores on several consumer conditions aspects Consumers who consider themselves as not vulnerable have higher trust in organizations and in redress mechanisms and they are also less likely to be exposed to UCPs and to other illicit practices In addition very vulnerable consumers show less confidence in online buying and lower trust in
environmental claims Finally there is a negative correlation between perceived vulnerability and the problems and complaints indicator (ie the more a person feels vulnerable the lower the score on the problems and complaints indicator)
Perceived vulnerability related to the socio-demographic status of the persons interviewed tends to be linked to lower trust in organizations and a higher probability to encounter other illicit practices In addition persons who perceive themselves as very vulnerable show lower numerical
skills and lower trust in product safety than the rest of the population Similarly consumers who do not feel vulnerable have more confidence in online shopping and they are less likely to encounter
unfair commercial practices (UCPs) with respect to those who have declared to be vulnerable or very vulnerable
Internet use shows as it can be expected a strong positive confidence in online shopping with a strong difference between consumers who never use the internet and those who use the internet daily In addition persons who use the internet at least weekly portray higher levels of trust in
product safety with respect to those who use the internet either sporadically or never Conversely daily internet users are more likely to be exposed to UCPs than the rest of the population
Men tend to be more knowledgeable of their rights as consumers more confident in online shopping and more trustful in regard to product safety They also show higher trust in redress mechanism On the other hand women are less likely to be exposed to unfair commercial practices and are less likely to experience other shopping problems
Consumers whose mother tongue is different from the official language(s) of their country of
residence appear less knowledgeable of their rights as consumers and seem to have lower numerical skills On the other hand they are less likely to report other illicit practices and have higher trust in
product safety
As it can be expected consumers with more language skills (ie more than one language) are more confident in online shopping These consumers also tend to have better numerical skills Nevertheless the same group of persons is also slightly more likely to be exposed to unfair
commercial practices and other illicit practices which may be related to a more active (international) shopping behaviour Extensive language skills seem to be partly associated with lower trust in environmental claims as consumers who speak three or more languages trust these claims to a lesser degree than consumers who speak only one language
The influence of employment status on consumer conditions is less clear-cut than what can be observed for other socio-demographic factors White-collar (excluding managers) are slightly more knowledgeable of their rights as consumers Self-employed and managers are more likely to be
exposed to unfair commercial practices and self-employed most likely experience other shopping problems In addition self-employed show the lowest score on the problems and complaints indicator indicating a lower overall level of problems and higher satisfaction with complaint handling
The influence of numerical skills on consumer conditions is limited High numerical skills are associated with higher confidence in online shopping and more trust in product safety
Finally the area of residence (ie urbanisation rural small town and large town) also has a limited link with consumer conditions Trust in organisations is higher in rural areas compared to small and
large towns Numerical skills appear to be slightly lower in small towns than in large towns and rural areas
Consumer Survey 2018
204
Age
18-34 041 067 B 066 041 070 A 085 037 AB 067 A 058 B 088 A
35-54 046 A 066 B 061 038 070 A 088 A 038 B 069 A 055 AB 089 AB
55-64 049 B 062 A 054 034 A 069 A 089 AB 037 A 068 A 052 A 090 B
65+ 048 AB 062 A 045 032 A 071 A 091 B 034 069 A 051 A 091 B
Gender
Female 044 065 A 056 035 071 089 037 A 066 053 A 090 A
Male 047 065 A 061 039 069 087 037 A 071 055 A 089 A
Education
Low (ISCED 0-2) 044 A 068 052 040 A 075 090 B 034 067 A 057 B 091 A
Medium (ISCED 3-4) 046 A 065 A 057 039 A 070 088 AB 036 068 A 055 AB 090 A
High (ISCED 5-8) 045 A 064 A 061 034 069 087 A 038 069 A 053 A 088
Employment status
Self-employed 045 A 063 A 059 BC 036 AB 066 A 085 A 037 B 069 A 055 A 086 A
Manager 045 A 065 AB 061 CD 035 A 064 A 086 AB 038 B 068 A 054 A 088 AB
Other white collar 049 066 B 060 CD 037 AB 071 B 088 BC 038 B 070 A 053 A 090 BCD
Blue Collar 043 A 064 AB 056 AB 038 AB 070 B 089 BC 035 A 067 A 053 A 090 BCD
Student 043 A 067 B 063 D 038 AB 074 B 090 BC 038 B 070 A 059 A 092 CD
Unemployed 043 A 065 AB 057 ABC 040 B 072 B 089 BC 036 AB 068 A 056 A 088 ABC
Seeking a job 045 A 066 AB 061 BCD 038 AB 073 B 086 ABC 035 A 065 A 051 A 092 D
Retired 045 A 064 AB 053 A 037 AB 070 B 089 C 037 AB 067 A 056 A 089 ABCD
Internet use
Daily 047 B 066 B 063 038 B 068 088 A 038 C 069 C 056 C 089 A
Weekly 043 A 062 A 050 B 035 AB 074 A 088 AB 037 BC 069 C 047 A 091 B
Monthly 041 A 063 AB 041 AB 033 AB 074 AB 086 AB 034 AB 070 BC 059 BC 091 AB
Hardly ever 047 AB 054 A 037 A 030 A 075 AB 092 C 033 A 059 AB 050 ABC 091 AB
Never 042 A 060 A 025 035 AB 078 B 090 BC 032 A 061 A 050 AB 093 B
Urbanisation
Rural area 044 A 067 059 A 037 A 069 A 088 AB 037 A 069 A 055 A 090 A
Small town 047 B 064 A 059 A 037 A 070 A 088 B 036 068 A 054 A 089 A
Large town 046 AB 064 A 058 A 037 A 070 A 087 A 037 A 069 A 054 A 090 A
Language
One 045 A 064 AB 055 037 A 071 090 035 068 A 057 C 090 A
Two 046 AB 066 B 060 A 037 A 070 A 088 A 038 A 069 A 054 BC 089 A
Three 046 AB 065 AB 061 A 037 A 068 A 086 A 038 AB 068 A 052 AB 089 A
Four or more 049 B 063 A 061 A 036 A 068 A 085 A 039 B 070 A 049 A 090 A
Financial_difficulty
Very difficult 046 AB 056 048 032 065 085 A 036 A 063 A 047 A 086 A
Fairly difficult 045 A 062 056 036 A 069 087 AB 037 A 066 A 051 A 089 AB
Fairly easy 045 A 067 A 060 A 038 B 071 A 089 C 037 A 070 B 057 B 090 BC
Easy 048 B 068 A 062 A 039 AB 072 A 088 BC 037 A 071 B 055 B 091 C
Numerical skills
Low 045 AB 063 A 055 A 037 A 069 A 089 A 066 A 054 A 090 A
Medium 045 A 064 A 057 A 038 A 070 A 088 A 067 A 054 A 089 A
High 046 B 065 A 060 036 A 070 A 088 A 070 054 A 089 A
Vulner sociodemo
Very vulnerable 044 A 060 055 A 038 A 067 A 084 035 063 052 A 089 A
Somewhat vulnerable 045 A 064 056 A 037 A 067 A 087 037 A 069 A 053 A 089 A
Not vulnerable 046 A 067 060 037 A 072 090 037 A 070 A 056 A 090 A
Vulner complexity
Very vulnerable 046 A 062 A 054 035 A 066 A 085 A 037 A 064 A 050 085
Somewhat vulnerable 046 A 064 A 058 A 035 A 067 A 086 A 037 A 067 AB 054 A 089
Not vulnerable 046 A 066 060 A 038 072 089 037 A 070 B 056 A 091
Mother Tongue
No 042 063 A 056 A 036 A 070 A 084 035 066 A 060 088 A
Yes 046 065 A 059 A 037 A 070 A 088 037 068 A 054 090 A
No
exp
eri
en
ce
wit
h o
ther
illi
cit
pra
cti
ces
Nu
meri
cal
skil
ls
Tru
st
in p
rod
uct
safe
ty
Tru
st
in
en
vir
om
en
tal
cla
ims
Pro
ble
ms a
nd
co
mp
lain
ts
ind
icato
r
Kn
ow
led
ge o
f
co
nsu
mer
rig
hts
Tru
st
in
org
an
isati
on
s
Co
nfi
den
ce i
n
on
lin
e s
ho
pp
ing
Tru
st
in r
ed
ress
mech
an
ism
No
exp
osu
re t
o
UC
Ps
Consumer Survey 2018
205
15 ANNEX I SAMPLING METHODOLOGY
In every country a random sample representative of the national population aged 18 or over was drawn ie each person belonging to the target universe had a chance to participate in the survey For some countries suitable telephone number register(s) are available for both fixed and mobile lines whilst for other countries only register(s) for either fixed or mobile lines can be used and in
some countries no register exists at all In instances where no register was available RDD50-numbers were generated The following variables were used for stratification gender age and region as far as the information was available in the sample frame(s)
A dual sampling frame was introduced
Mobile sample potential respondents within a given country that can be reached via a mobile line (regardless of whether they can also be reached via a fixed line) As such this sample includes respondents from both the mobile only and mixed population
119924119952119939119946119949119942 119956119938119950119953119949119942 =119927119955119952119953119952119955119957119946119952119951 119952119943 119950119952119939119946119949119942 119949119946119951119942119956
119931119952119957119938119949 119953119952119953119958119949119938119957119946119952119951 119952119943 119953119945119952119951119942 119951119958119950119939119942119955119956=
119924 + 119924119917(119924 + 119924119917) + (119917 + 119924119917)
Fixed sample potential respondents within a given country that can be reached via a fixed line (regardless of whether they can also be reached via mobile line) As such this sample includes respondents from both the fixed line only and mixed population
119917119946119961119942119941 119949119946119951119942 119956119938119950119953119949119942 =119927119955119952119953119952119955119957119946119952119951 119952119943 119943119946119961119942119941 119949119946119951119942119956
119931119952119957119938119949 119953119952119953119958119949119938119957119946119952119951 119952119943 119953119945119952119951119942 119951119958119950119939119942119955119956=
119917 + 119924119917
(119924 + 119924119917) + (119917 + 119924119917)
F = fixed only M = mobile only and MF = mobile and fixed
For example Germany was set to have the following proportions in the study 83 mixed 9 fixed only 8 mobile only Therefore the local teams composed a gross sample of 50 fixed numbers defined as ((83+9)(83+9)+(83+8)) and 50 mobile numbers ((83+8)(83+9)+(83+8))
To further guarantee the representativeness of the sample the time of calling was predominantly weekday evenings with interviewing before only authorised upon specific request with a motivated rationale In case of interviews conducted during the weekend or appointments made upon
respondent request calls could take place all day long Also the birthday rule question was included for landlines to ensure a random selection procedure and minimise potential bias related to the person who would answer the call
No quota was set for socio-demographic variables such as gender or age However during fieldwork the overall sample intake was monitored daily to follow up on the overall composition of the sample on gender age region and the possession of a mobile andor a fixed phone in accordance with the
sampling approach adopted
50 Random Digit Dialing With RDD software is used to generate new telephone numbers starting from a list of starting numbers New telephone numbers are created and used by adding and subtracting digits in the existing telephone number The composition of the starting number is important here for obtaining sufficient geographical spread
Consumer Survey 2018
206
HOW TO OBTAIN EU PUBLICATIONS
Free publications
bull one copy via EU Bookshop (httpbookshopeuropaeu)
bull more than one copy or postersmaps from the European Unionrsquos representations (httpeceuropaeurepresent_enhtm) from the delegations in non-EU countries (httpeeaseuropaeudelegationsindex_enhtm) by contacting the Europe Direct service (httpeuropaeueuropedirectindex_enhtm) or calling 00 800 6 7 8
9 10 11 (freephone number from anywhere in the EU) () () The information given is free as are most calls (though some operators phone boxes or hotels may charge you)
Priced publications
bull via EU Bookshop (httpbookshopeuropaeu)
doi 102818209599
EB-0
1-1
9-1
85-E
N-N
Consumer Survey 2018
5
TABLE OF CONTENTS
TABLE OF CONTENTS 5
1 INTRODUCTION 7
Introduction to the 2018 wave of the Consumer Survey 7
Sampling methodology 7
121 Countries covered 8
122 Core questionnaire 9
123 Socio-demographic and background questions 9
124 Analysis and reporting of statistically significant differences 10
125 Weighting and wave to wave comparisons 11
2 EXECUTIVE SUMMARYKEY FINDINGS 13
3 DOMESTIC AND CROSS-BORDER SHOPPING 16
Domestic and cross-border online purchases 16
Offline cross-border purchases 23
4 THE EVOLUTION OF ONLINE PURCHASE BEHAVIOUR 28
5 KNOWLEDGE OF CONSUMER RIGHTS 35
General level of knowledge about consumer rights 35
Knowledge of the cooling-off period 38
Knowledge of faulty product guarantees 41
Knowledge of rights regarding unsolicited products 43
6 TRUST IN CONSUMER PROTECTION 46
Trust in organisations 46
611 Public authorities 49
612 Retailers and service providers 51
613 NGOs 54
Trust in redress mechanisms 56
621 ADR 59
622 Courts 61
7 TRUST IN PRODUCT SAFETY 63
8 TRUST IN ENVIRONMENTAL CLAIMS 66
Reliability of environmental claims 66
The influence of environmental claims on purchasing decisions 69
9 CONSUMER CONFIDENCE IN ONLINE PURCHASES 72
Domestic online purchases 72
Cross-border online purchases 75
10 UNFAIR COMMERCIAL PRACTICES 78
Unfair commercial practices from domestic retailers 78
1011 Exposure to UCPs from domestic retailers 78
1012 Types of UCPs from domestic retailers 82
Unfair commercial practices from cross-border retailers 92
1021 Exposure to UCPs from cross-border retailers 92
1022 Types of UCPs from cross-border retailers 95
Other illicit commercial practices from domestic retailers 105
1031 Exposure to other illicit commercial practices from domestic retailers 105
1032 Types of other illicit commercial practices from domestic retailers 107
1033 Exposure to other illicit commercial practices from cross-border retailers 113
Consumer Survey 2018
6
1034 Types of other illicit commercial practices from cross-border retailers 114
11 OVERALL PROBLEMS AND DISPUTE RESOLUTION 120
The problems and complaints indicator 120
1111 No problems 124
1112 No complaint 126
Actions taken to resolve problems (breakdown by kind of action plus no action taken) 129
Reasons for not taking action 137
Satisfaction with problem resolution 152
Problems making purchases in other EU countries 162
12 PROBLEMS EXPERIENCED WITH ONLINE PURCHASES 173
Problems with domestic online purchases 173
1211 Types of problems with domestic online retailers 177
Problems with cross-border purchases 182
1221 Types of problems with cross-border online retailers 186
Overall problems experienced 191
1231 Overall types of problems 193
13 CONSUMER VULNERABILITY 198
14 DETERMINANTS OF CONSUMER CONDITIONS 202
15 ANNEX I SAMPLING METHODOLOGY 205
Consumer Survey 2018
7
1 INTRODUCTION
Introduction to the 2018 wave of the Consumer Survey
This report discusses the results of the 2018 edition of the survey on consumersrsquo attitudes towards
cross-border trade and consumer-related issues which is part of a series of reports within the EU Consumer Programme The study is a follow-up of a series of related studies that have been conducted since 20061 It was commissioned by the Consumers Health Agriculture and Food Executive Agency (Chafea) The European Commission gathers systematic evidence to monitor consumer markets and national consumer conditions within the EU summarised in the flagship Consumer Conditions Scoreboards (CCS) Results from this survey will feed the 15th edition of the CCS2
The present survey aims to deliver reliable results that are comparable with previous studies in the series on issues related to the attitudes perceptions and experiences of European consumers in the following areas
Domestic and cross-border commerce both online and offline
Knowledge of consumer rights
Trust in consumer protection
Perceptions of the product safety environment
Perceptions of environmental claims and their influence purchase decisions
Confidence in online shopping
Problems experienced actions taken and satisfaction with problem resolution
Exposure to unfair commercial practices
Consumer vulnerability
In total 28037 respondents took part in the survey which was carried out by GfK Social and
Strategic Research (GfK SSR) in the 27 Member States of the European Union and in the United Kingdom Iceland and Norway between 26 March and 11 May 2018 The report presents the overall results of the study as well as comparisons between the Member States socio-demographic variables and comparisons with the results from previous surveys
Sampling methodology
The target population includes all people aged 18 and above resident in the country surveyed and having sufficient command of (one of) the respective national language(s) to answer the questionnaire
In every country a random sample representative of the national population aged 18 or older was drawn by means of fixed line or mobile telephone number registers or Random Digit Dialling software The sampling procedure was set up to achieve a mix of respondents recruited through
mobile phone and fixed line Furthermore the sample intake was monitored to follow up on the
overall composition of the sample in terms of gender age and the ownership of a mobile andor a fixed phone For more information on the sampling methodology please consult Annex I
1 Special Eurobarometer 252 (2006) Special Eurobarometer 298 (2008) Flash Eurobarometer 282 (2009) Flash Eurobarometer 299 (2010) Flash Eurobarometer 332 (2011) Flash Eurobarometer 358 (2012) Flash Eurobarometer 397 (2014) and the Consumersrsquo attitudes towards cross-border trade and consumer related issues 2016 report (2016)
2 httpeceuropaeuconsumersconsumer_evidenceconsumer_scoreboardsindex_enhtm
Consumer Survey 2018
8
The respondents participated in a Computer Assisted Telephone Interview (CATI) conducted by
native speaking interviewers making use of a central programme They were interviewed on the core aspects of their experiences as consumers (see the aforementioned topics) as well as key socio-demographic variables such as age gender and education Based on these data averages and proportions are calculated for the countries and socio-demographic groups
121 Countries covered
The survey took place in the 27 EU Member States as well as in the United Kingdom Iceland and Norway The table below presents an overview of the country abbreviations and region comparisons used throughout the report
It should be noted that following the UKrsquos decision to leave the EU a new country grouping the EU27_2019 was introduced being equal to the EU28 without the UK The EU27_2019 is used as the main EU-aggregate and therefore as the comparison base for the results from the regions and countries While the EU28 aggregate (including the UK) is kept in the tables (for comparison
purposes) no comments are provided on this aggregate The terms lsquoEuropean Unionrsquo and lsquoEUrsquo used throughout the report always refer to the EU27_2019
The grouping of EU27_2019 countries into North East South and West regions was also adjusted to the new composition of the EU excluding the UK from the West In addition consistent with the analysis for the Market Monitoring Survey 2017 the Baltics (ie Lithuania Latvia and Estonia) were moved from the Eastern to the Northern region (the analysis has been adjusted for all years in the
report)
Finally Croatia has been included in the calculations of the EU27_2019 EU28 and regions results starting from 2012 This means that both for the 2014-2012 comparisons and the 2012-2011 comparisons Croatia is including in the EU averages For the latter comparison (ie 2012-2011) however Croatia is only included in the 2012 results resulting in a slight incoherence
Country EU27_2019 EU28 Region North
Region East
Region South
Region West
AT Austria X X X
BE Belgium X X X
BG Bulgaria X X X
CY Cyprus X X X
CZ Czech Republic X X X
DE Germany X X X
DK Denmark X X X
EE Estonia X X X
EL Greece X X X
ES Spain X X X
FI Finland X X X
FR France X X X
HU Hungary X X X
HR Croatia X X X
IE Ireland X X X
IT Italy X X X
LT Lithuania X X X
LU Luxembourg X X X
LV Latvia X X X
MT Malta X X X
NL Netherlands X X X
PL Poland X X X
PT Portugal X X X
RO Romania X X X
Consumer Survey 2018
9
122 Core questionnaire
The core questionnaire covered the following topics
Online and offline purchase of goods or services (trend questions)
Trust and perception of consumer protection (trend questions)
Perceptions of the product safety environment (trend questions)
Influence of environmental concerns on purchasing (trend questions)
Understanding of consumer rights (trend questions)
Problems experienced with domestic purchases in general actions taken (if no action taken reason why) satisfaction with complaint handling and time needed to resolve problem (trend questions)
Exposure to unfair commercial practices (trend questions)
Problems experienced when shopping online (domestic and cross-border purchases) (trend questions)
Consumer confidence in online shopping (trend questions)
Languages comfortably used for personal interests (trend question)
Numerical skills (trend questions)
Consumersrsquo self-reported vulnerability
123 Socio-demographic and background questions
Based on the final version of the questionnaire approved by the Contracting Authority the following questions were asked before the core questionnaire
Birthday rule (for fixed line sample)
Age
Gender
Phone ownership having a mobile (for fixed line sample)having a landline (for mobile line sample)
Regularity of using the internet
After the core questionnaire was completed the following socio-demographic questions were asked
Vulnerability (related to socio-demographic statusrelated to the perceived complexity of
offersterms and conditions)
SE Sweden X X X
SI Slovenia X X X
SK Slovakia X X X
UK United Kingdom X
NO Norway
IS Iceland
Consumer Survey 2018
10
Level of education
Employment situation (occupation)
Mother tongue of a respondent
Region of residence3
Subjective degree of urbanisation
Subjective financial situation
124 Analysis and reporting of statistically significant differences
All differences mentioned in the text are statistically significant unless otherwise mentioned Statistical significance is calculated at the 95 confidence level meaning that the null hypothesis of no difference has been rejected at 5 probability level Differences that are not statistically
significant are considered equal to 0 Consequently the report may describe two values as being equal even if the difference between both values is not equal to 0 It should also be mentioned that especially for measures referring to the entire EU27_2019EU28 given the large sample size for the
survey some differences could be statistically significant even if their absolute magnitude is very small
The findings for the EU27_2019 EU28 the four EU27_2019 regions (North South East and West) and the individual country results are analysed using cross-tabulations Please note that in the region and country tables results that are statistically different from the EU27_2019 average are indicated by asterisks
Differences between the levels of socio-demographic categories are analysed with a regression analysis which explores the relationship between a specific independent variable (eg age) and a dependent variable (eg online purchase behaviour) while considering the effects of other independent variables (eg gender education etc) This type of analysis is considered more appropriate when exploring the impact of socio-demographic variables due to the potential overlap (correlations) between different socio-demographic factors which need to be considered when
measuring the extent to which one of these factors affects the dependent variables The following
regression models are used for the analysis of the different dependent variables
Logit models when the dependent variable is binary (ie it takes only two possible values 0 and 1 eg trust in product safety trust in environmental claims)
Poisson models for dependent variables that can be thought of as a count variable (eg knowledge of consumer rights trust in organisations)
Linear models when the dependent variable is assumed to be numerical and linear (eg problems and complaints)
In all models a control variable on the region of residence of the person interviewed (North South East and West) has been included
3 Regions was recorded on NUTS level 3 (Estonia Croatia Latvia Lithuania Malta Slovenia amp Iceland) and NUTS level 2 (all other countries)
Consumer Survey 2018
11
The values shown in the tables of the socio-demographic analyses are based on model estimates4
Statistically significant differences between levels of a socio-demographic variable are indicated with letters The categories of a socio-demographic variable are statistically significant different from each other except when the categories share the same letter When a category is associated to a blank it means that it is statistically significant different from all the other categories Differences and equalities for socio-demographic results are only considered within each socio-demographic variable (eg 18-34 yearsrsquo old vs 35-54 yearsrsquo old) and not between socio-demographic variables (eg 18-34 yearsrsquo old vs women)
Up to five socio-demographic characteristics with the closest link with the respective dependent variable are reported on in detail Characteristics with the closest link are selected considering the average magnitude of the difference across the factor attributes ndash in absolute terms (eg the differences in the knowledge of consumer rights ndash in absolute terms ndash across the different levels of internet use) ndash and by looking at the overall coherence of these differences
The report describes changes between the current (2018) and previous (2016) waves In addition
changes in the latest waves (2018-2016) are compared to changes in the previous waves (2016-
2014) This is reported on only when both changes are significant and when the direction of the change has reversed ie from an increase to a decrease or from a decrease to an increase For positive indicators (ie knowledge of consumer rights domestic online shopping etc) these cases are labelled ldquonegative reversalrdquo and ldquopositive reversalrdquo respectively For negative indicators (eg problems and complaints exposure to unfair commercial practices etc) the labels are reversed to account for the negative valence of the indicator where an increase would reflect a change towards
the negative The current report focuses on the strongest positive and negative reversals which are determined by the highest absolute sum of both changes
125 Weighting and wave to wave comparisons
Data from the current wave was weighted based on the latest Eurostat data5 available on age (three groups 18-34 35-54 and 55+ year old) and gender distributions In addition the weighting was
also based on telephone ownership data from the Special Eurobarometer 4386 (three groups fixed only mobile only mixed) Finally population weights were also applied both on the EU27_2019 sample (for the EU27_2019 average) and the EU28 sample (for the EU28 average and regions) to account for differences in population size at country level
In contrast with the current Consumer Survey the Consumer Survey 2016 was only weighted on age and gender (in addition to the population weight) To facilitate comparisons between 2018 and 2016 a second weight was calculated for the 2018 survey based solely on age and gender
Both the Consumer Survey 2016 and 2018 have been conducted with a target population of 18+ years while the Consumer Surveys 2014 and earlier are based on a sample of 15+ years For comparisons between the years 2016 and 2014 the latter has been reweighted based on age and gender distributions Data from all waves before 2014 will be used for the wave to wave comparisons based on existing samples (population 15+) and using the existing weights provided by the Contracting Authority (also based on the 15+ population distribution) When comparing 2014 data
4 Model estimates are calculated using the margins function in Stata A margin is a statistic based on a fitted model calculated over a dataset in which some of or all the covariates are fixed at values different from what they really are In the models estimated for this report the margins function calculates the predicted means for the different values of a socio-demographic variable (eg age) while all the other covariates (including the
other socio-demographic variables) are hold fixed In practice the estimated value of a dependant variable Y (ex the of persons who have bought online in the last 12 months) for the male category is obtained under the hypothesis that all the persons interviewed are males while their remaining sociodemographic characteristics (used in the model as regressors) corresponds to the categories observed in the sample
In addition a pwcompare (group effects) option was added to the function to perform pairwise comparisons between all levels of a socio-demographic variable based on the estimated models These comparisons provided information to determine the variables with the closest link with the respective dependent variable
5 Eurostat Population on 1 January 2018 by age sex and NUTS 2 region updated on 27 February 2018
6 Special Eurobarometer 438 E-Communications and the Digital Single Market (2016) available via httpdataeuropaeueuodpendatadatasetS2062_84_2_438_ENG
Consumer Survey 2018
12
to previous waves the original weight will be used based on the 15+ population distribution The
difference in sampling will be clearly communicated when wave-to-wave changes are reported
To summarise the following weighting procedures were used to calculate the results presented in the final report additional analyses and country profiles
2018 Population gender amp age weighting (18+) phone ownership weighting
2016 Population gender amp age weighting (18+)
2014 Population gender amp age weighting (18+)
2014 Population gender amp age weighting (15+)
2012 Population gender amp age weighting (15+)
2011 Population gender amp age weighting (15+)
2010 Population gender amp age weighting (15+)
2009 Population gender amp age weighting (15+)
2008 Population gender amp age weighting (15+)
2006 Population gender amp age weighting (15+)
In conclusion it should be considered that in the light of the methodological approach indicated above
Changes with respect to the previous year ndash which are shown in graphs and tables throughout the report - are always computed on comparable data
However given the change in methodology applied for the 2018 results (age gender amp phone ownership) and the 2018-2016 comparison (age amp gender no phone ownership) it is not possible to compute the exact results for 20167 by subtracting the 2018-2016 change from
the 2018 results The same is true for the changes in previous waves
The applied methodology ensures comparability between the current (2018) and previous (2016) wave As such it is in principle possible to estimate values in level for 2016 by applying back the observed changes between 2016 and 2018 as reported in graphs and tables throughout the report However due to different weightings applied to the 2018 data for presenting the 2018 results and for comparisons with the 2016 results small differences may occur
Differences between 2014 and previous waves are reported based on the original methodology while data in levels is not reported as it is not consistent with the last two waves Because of the lack of comparability with data reported for the last two waves (2016 and 2018) it is not possible to estimate data in levels for the years 2012 and before
7 As presented in the 2017 Consumer Conditions Scoreboard (available via httpseceuropaeuinfositesinfofilesconsumer-conditions-scoreboard-2017-edition_enpdf)
Consumer Survey 2018
13
2 EXECUTIVE SUMMARYKEY FINDINGS
This report presents the findings of the 2018 edition of the survey on consumersrsquo attitudes towards cross-border trade and consumer-related issues which was carried out by GfK SSR8 for the Consumers Health Agriculture and Food Executive Agency (Chafea) and the Directorate General Justice and Consumers of the European Commission The present survey is part of a series of reports
within the EU Consumer Programme which has been performed since 2006 with the aim to monitor national consumer conditions across the EU For this purpose the study assessed several indicators of European consumersrsquo attitudes for 28037 respondents across the EU27_2019 Member States and in the United Kingdom Iceland and Norway For the studied indicators the present report discusses the overall results comparisons between Member States and differences with previous waves of this survey as well as across selected socio-demographic characteristics
In summary the present study reports on the current state of European consumersrsquo attitudes and
experiences regarding cross-border trade and consumer-related issues It provides insights in the magnitude and features of domestic as well as cross-border shopping and identifies areas for improving the consumer experiences The findings of the 2018 edition of this survey have worsened9 slightly for a wide variety of indicators compared to the 2016 edition Most of these developments
are driven for a large part by changes in the Western region After noticeable improvements in this region in the 2016 wave the indicators have gone back to resemble their previous levels
The first key indicator explored in the survey is online purchase behaviour In total almost three out of four EU27_2019 consumers recently bought goods or services online (720) The 2018 survey shows a small decrease of 14 percentage points in online shopping compared to 2016 which is slight reversal of the positive evaluation observed since 2006 Online shopping is most common in the Northern (785) Western (751) and Eastern (719) regions10 of the EU whereas in the Southern (660) region the indicator is lower
Most European consumers11 shop online within their own country (630) A more limited number
of Europeans purchase goods or services cross-borders inside the EU (283) or outside the EU (184) The results also show that the proportion of consumers making online purchases within their own country has slightly decreased compared to 2016 This decrease is mostly driven by a lower value in the Western region (-116pp12) while the degree of domestic online purchases has increased in all other regions The proportion of consumers making online purchases cross-border inside the EU has increased compared to 2016 (+91pp) these purchases have increased in the
Eastern (+57pp) Southern (+45pp) and Northern (+40pp) region while they have decreased in
the Western region (+144pp) Nevertheless cross-border online purchases in the Western region are still the second highest (322) after the Northern region (343)
The observed decrease in domestic online shopping is not reflected by a change in confidence in making online purchases which has remained stable since 2016 On average 694 of European consumers report that they are confident in domestic online shopping However it is noticeable that there is a decrease in confidence in the Western region (-73pp) which goes together with a decrease
in domestic online shopping in the same region Furthermore despite the increase in cross-border online shopping confidence in this type of shopping online decreases compared to 2016 (-79pp)
For effectively protecting online consumers it is important that individuals know their rights when shopping online This survey assessed the level of knowledge about three types of consumer rights the cooling-off period the legal guarantees and the regulation with regard to unsolicited products The average level of knowledge about these rights is at 455 a 27pp decrease compared
8 GfK SSR refers to the GFK Social amp Strategic Research unit which focuses on Public Affairs research GfK SSR has been taken over by the market research company Ipsos in October 2018 and is now part of the Ipsos
Public Affairs unit 9 ie lower values for positive indicators such as knowledge of consumer rights or higher values for negative
indicators such as exposure to unfair commercial practices 10 The grouping of EU27_2019 countries into North East South and West regions was adjusted to the new
composition of the EU excluding the UK from the West In addition consistent with the analysis for the Market Monitoring Survey 2017 the Baltics (ie Lithuania Latvia and Estonia) were moved from the Eastern to the Northern region (the analysis has been adjusted for all years in the report)
11 Throughout the remainder of the Executive Summary ldquoEuropean consumersrdquo and ldquoEuropeansrdquo will be used to refer to EU27_2019 consumers
12 Percentage points
Consumer Survey 2018
14
to the previous wave of the survey Whereas this decrease is evident in Western and Northern
Europe the knowledge of consumer rights has increased in the South (+42pp) Europeans in general are best informed about the cooling off period (610) and slightly less informed about faulty product guarantees (409) and unsolicited products (345)
The present report also assesses the trust of European consumers in the protection of their rights in the single market To study this the levels of different aspects of trust are measured First in terms of trust in organisations and redress mechanisms the respondents indicated the highest levels of trust in retailers and service providers (713) public authorities (618) and NGOs
(607) Lower levels of trust are observed for the ADR (Alternative Dispute Resolution 422) and courts (316) The average levels of trust have decreased in the present study compared to 2016 (-53 pp) The most notable decreases are observed for trust in NGOs (-88pp) courts (-75pp) and the ADR (-69pp)
In addition the survey also investigated trust in product safety which is considered a key driver of consumer confidence In the EU27_2019 almost 7 out of 10 consumers have expressed trust in
product safety However this trust has decreased compared to 2016 (-73pp) and this happened particularly in the West (-216pp)
Trust in the reliability of environmental claims which is at 542 in the EU27_2019 also decreased between 2016 and 2018 (by 91 pp)
When shopping online some European consumers encounter unfair commercial practices (UCPs) The survey investigated the exposure to several types of practices that fall within the scope of the Unfair Commercial Practices Directive The overall findings show that the exposure to such practices
originating from domestic (227) and cross-border (48) retailers has increased compared to 2016 (with +47pp and +24pp respectively) In addition to unfair commercial practices consumers in Europe also face other illicit commercial practices when shopping online from domestic retailers (106) and cross-border retailers (36)
A composite problems and complaints indicator13 was developed in 2014 to measure the problems encountered by European consumers the actions they took their satisfaction with complaint handling and (if applicable) their reasons for not taking action A higher score on this
indicator represents fewer problems and a higher satisfaction with complaint handling The overall level of this indicator is at a high level in the EU27_2019 (a score of 888) and it is the highest in the
West (906) and North (901) regions
A fair share of European consumers (213) also experiences problems that are specific to online cross-border purchases from other EU countries The most common problems of this type are the refusal of retailers to deliver to the consumersrsquo country (125) and the redirection of consumers
to a website in their home country where prices are different (109) The exposure to both problems has increased since 2016 (respectively +26pp and +41pp)
European consumers are also exposed to problems specific to the delivery of online purchases Late delivery of goods is most common both for purchases from domestic online retailers (393) and cross-border retailers (278) In addition a noticeable proportion of respondents also experiences damaged or wrong deliveries of goods (respectively 198 for domestic and 115 for cross-border online purchases)
In case problems do occur the most likely actions taken by consumers are complaining to the retailer (852) or complaining to the manufacturer (157) In contrast bringing businesses to court (24) or addressing problems via an ADR platform (55) are the least likely actions In
some cases consumers refrain from taking any actions when faced with a problem The main reasons for not taking actions are that consumers believe it would take long to resolve the problem (412) or that the sums involved are too small (357)
13 See footnote 22 and 23 (page 117) in the main report for more information on this indicator and its computation
Consumer Survey 2018
15
Continuing the approach started with the 2016 wave of the survey the 2018 survey also assessed
consumer vulnerability The results show that about a quarter of the European consumers (265) self-identify as vulnerable for one or more aspects linked to their socio-demographic background This is lower than in 2016 (317) In contrast perceived vulnerability based on the experienced complexity of offer terms and conditions (342) has increased considerably since 2016 (213)
Finally multiple multivariate analyses were conducted to provide insights into the role of socio-demographic factors Consumersrsquo financial situation is the factor most closely linked to key consumer conditions indicators Specifically consumers in a difficult financial situation tend to show
lower trust in organisations lower confidence in online shopping lower trust in product safety lower trust in environmental claims and a higher probability to experience UCPs In addition severe financial problems are also negatively linked with trust in organisations trust in redress mechanisms and confidence in online shopping and positively linked with exposure to UCPs
Consumer Survey 2018
16
3 DOMESTIC AND CROSS-BORDER SHOPPING
Steady growth is observable in the e-commerce sector throughout the European Union (EU27_2019)14 over the past few years However consumers can still gain considerable value from making online purchases cross-border The first chapter reports the degree to which consumers engage in online shopping from retailers and service providers located in their country of residence
in the EU or outside the EU It also reports on the degree to which consumers engage in cross-border shopping from offline retailers or service providers
Domestic and cross-border online purchases
Q115-Base respondents who use the internet for private reasons (N=22839)
The graph above shows that the average proportion of consumers who shop online in the European
Union is 720 with 630 having purchased goods or services online domestically 283 cross-border from EU-based online retailers or service providers and 184 cross-border from online
retailers or service providers located outside the EU Only 21 of consumers are not aware of the location of the retailers or service providers they purchase from online
14 The EU27_2019 average corresponds to the EU28 excluding the UK (see also chapter 11) The terms lsquoEuropean Unionrsquo or lsquoEUrsquo always refer to the EU27_2019
15 Q1 In the past 12 months have you purchased any goods or services via the internet -Yes from a retailer or service provider located in (our country) -Yes from a retailer or service provider located in another EU country -Yes from a retailer or service provider located outside the EU ndashNo ndashYes you purchased online but do not know where the retailer or service provider is located -DKNA
Consumer Survey 2018
17
Q1-Base respondents who use the internet for private reasons (N=25240)16
16 Statistically significant differences are indicated by asterisks () Statistical significance is calculated at the 95 confidence level meaning that the null hypothesis of no difference has been rejected at 5 probability level For results of the current wave asterisks represent statistically significant differences between a subgroup and the EU27_2019 average For wave comparisons asterisks represent the statistically significant differences between two waves
Region
CountryTotal Yes
Yes from a
retailer or
service
provider
located in
(our
country)
Yes from a
retailer or
service
provider
located in
another EU
country
Yes from a
retailer or
service
provider
located
outside the
EU
Yes but do
not know
where the
retailer or
service is
located
No Donrsquot know
EU27_2019 72 630 283 184 21 280 02
EU28 742 659 288 200 23 258 02
North 785 694 343 245 16 215 03
South 660 536 276 177 32 340 02
East 719 673 191 147 07 281 01
West 751 665 322 198 20 249 01
BE 697 487 481 184 23 303 02
BG 639 579 195 118 06 361 01
CZ 802 781 222 201 01 198 00
DK 820 725 365 239 17 180 00
DE 769 719 287 187 15 231 01
EE 732 595 331 300 19 268 01
IE 801 636 598 317 09 199 05
EL 620 548 213 144 08 380 00
ES 657 536 285 193 36 343 00
FR 713 609 302 211 31 287 00
HR 598 411 305 306 13 402 00
IT 702 575 285 175 36 298 04
CY 464 169 332 189 11 536 07
LV 636 481 306 317 11 364 04
LT 687 580 277 256 13 313 00
LU 726 333 629 173 10 274 00
HU 738 676 231 199 09 262 00
MT 654 162 574 357 13 346 00
NL 805 757 240 212 14 195 01
AT 791 619 608 131 10 209 04
PL 774 740 173 123 07 226 02
PT 448 286 211 138 15 552 00
RO 594 571 100 74 06 406 01
SI 637 506 309 228 05 363 00
SK 783 712 348 239 10 217 01
FI 759 679 382 234 27 241 05
SE 839 767 337 232 12 161 03
IS 797 471 541 435 18 203 00
NO 818 706 402 319 21 182 02
UK 885 851 321 306 33 115 03
In the past 12 months have you purchased any goods or services via the internet
Consumer Survey 2018
18
Overall 630 of EU27_2019 respondents who use the internet for private reasons report shopping
online domestically Consumers residing in the North (694) East (673) and West regions (665) are more likely to engage in online shopping domestically compared to the EU27_2019 average while those in the South are less likely (536) Among the countries of the European Union the highest levels of domestic shopping online are found in the Czech Republic (781) Sweden (767) and the Netherlands (757) Among all the studied countries the highest level is found in the UK (851) The lowest levels are found in Malta (162) Cyprus (169) and Portugal (286)
The proportion of respondents who shop online cross-border from retailers or service providers in another EU country is 283 in the EU27_2019 The incidence of shopping online from retailers in another EU country in the South is in line with the EU27_2019 average17 while it is higher in the North (343) and the West (322) and lower in the East (191) The highest levels of online cross-border shopping from retailers or service providers in another EU country are found in Luxembourg (629) Austria (608) and Ireland (598) The lowest levels are found in
Romania (100) Poland (173) and Bulgaria (195)
In the European Union 184 of consumers shop online cross-border from retailers or service
providers in countries outside the EU For consumers in the South this incidence is in line with the EU27_2019 average while it is higher in the North (245) and West (198) and lower in the East (147) Among the EU countries the highest levels of this indicator are found in Malta (357) Latvia Ireland (both 317) and Croatia (306) Furthermore this level is also high in Iceland (435) and Norway (319) The lowest levels are found in Romania (74) Bulgaria
(118) and Poland (123)
Only 21 of EU27_2019 consumers do not know where the retailer or service provider they shopped from online is located For consumers in the West the proportion not being aware of the retailersrsquo location is in line with the EU27_2019 average while it is higher in the South (32) and lower in the North (16) and East (07) Among the EU countries the highest levels of this indicator are found in Italy Spain (both 36) Lithuania and Croatia (both 13) Additionally this level is also high in the UK (33) The lowest levels are found in the Czech Republic (01) Slovenia
(05) Bulgaria and Romania (both 06)
17 As mentioned in chapter 124 differences that are not statistically significant are considered equal to 0 regardless of their numerical level
Consumer Survey 2018
19
The overall proportion of consumers who purchased goods or services online regardless of the retailer or service providerrsquos location is 720 in the EU27_2019 In the East this indicator is in line with the EU27_2019 average while it is higher in the North (785) and the West (751) and lower in the South (660) Among the EU countries the highest levels of this indicator are found in Sweden (839) Denmark (820) and the Netherlands (805) Furthermore the levels
are also high in Norway (818) and the UK (885) The lowest levels are found in Portugal (448) Cyprus (464) and Romania (594)
Consumer Survey 2018
20
Q1-Base EU27_2019 respondents from the EU who use the internet for private reasons (N=2248718)
18 The EU27_2019 sample size for this table and all following socio-demographic tables is affected by missing values for some of the socio-demographic factors (internet use languages education amp urbanisation) Respondents with missing values for any of these socio-demographic factors are not included in the regression analysis used to estimate the results
Male 711 A 642 A 314 216 19 A 271 A 03 A
Female 698 A 625 A 254 152 23 A 282 A 01 A
18-34 787 688 A 355 264 20 AB 195 02 A
35-54 740 668 A 302 181 17 A 245 00 A
55-64 653 591 228 133 30 B 318 03 A
65+ 543 499 158 80 21 AB 438 02 A
Low 580 510 170 110 12 A 404 07 A
Medium 684 618 266 179 21 AB 299 01 A
High 757 674 317 200 23 B 221 02 A
Very difficult 652 A 574 A 209 187 A 14 A 340 A 02 A
Fairly difficult 688 A 609 A 284 A 175 A 16 A 299 A 00 A
Fairly easy 714 644 287 A 187 A 22 A 266 02 A
Very easy 745 682 306 A 192 A 31 A 222 02 A
Rural area 701 A 636 A 283 A 160 18 A 284 A 01 A
Small town 711 A 636 A 279 A 198 A 22 A 268 A 02 A
Large town 699 A 626 A 292 A 189 A 22 A 282 A 01 A
Self-employed 737 C 668 C 327 C 208 B 16 A 251 AB 02 ABC
Manager 758 C 669 BC 327 BC 212 B 25 AB 222 A 00 AB
Other white collar 729 BC 661 BC 287 B 173 A 20 AB 250 A 04 C
Blue collar 667 A 595 A 258 A 189 AB 27 AB 309 C 00 AB
Student 704 ABC 595 A 277 ABC 178 AB 17 AB 280 ABC 02 ABC
Unemployed 650 A 589 A 230 A 181 AB 23 AB 328 C 00 A
Seeking a job 656 A 587 A 220 A 191 AB 49 B 305 BC
Retired 692 AB 620 AB 275 AB 170 AB 15 A 295 C 01 B
Financial Situation
In the past 12 months have you
purchased any goods or services via the
Internet
Total Yes
Yes from a
retailer or service
provider located in
(our country)
Yes from a
retailer or service
provider located
in another EU
country
No Donrsquot know
Gender
Age groups
Education
Yes from a
retailer or service
provider located
outside the EU
Yes but do not
know where the
retailer or service
is located
Urbanisation
Employment status
Consumer Survey 2018
21
Q1-Base EU27_2019 respondents from the EU who use the internet for private reasons (N=22487)
Only native 670 598 A 221 145 29 B 304 B 02 A
Two 723 A 652 B 285 189 A 17 A 262 A 02 A
Three 731 A 656 B 336 204 A 20 AB 253 A 01 A
Four or more 715 A 632 AB 395 257 13 A 275 AB 01 A
Not official
language in home
country
634 566 251 A 149 16 A 355 02 A
Official language
in home country709 637 287 A 187 21 A 272 02 A
Low 640 A 567 A 238 A 138 08 346 07 A
Medium 673 A 593 A 258 A 175 20 A 309 01 A
High 732 664 301 194 23 A 247 01 A
Daily 746 674 302 197 22 B 235 02 A
Weekly 555 463 170 93 B 18 B 423 01 A
Monthly 349 A 285 A 64 A 79 AB 01 A 638 A
Hardly ever 289 A 209 A 73 A 11 A 03 A 702 A 01 A
Never
Very vulnerable 653 585 242 161 A 22 A 326 01 A
Somewhat
vulnerable697 629 A 283 A 178 AB 23 A 283 01 AB
Not vulnerable 722 646 A 293 A 192 B 20 A 261 02 B
Very vulnerable 704 A 620 A 266 AB 156 A 25 A 277 A 02 A
Somewhat
vulnerable716 A 647 A 258 A 165 A 20 A 268 A 02 A
Not vulnerable 701 A 632 A 295 B 196 21 A 279 A 02 A
In the past 12 months have you
purchased any goods or services via the
Internet
Total Yes
Yes from a
retailer or service
provider located in
(our country)
Yes but do not
know where the
retailer or service
is located
No Donrsquot know
Languages
Mother Tongue
Yes from a
retailer or service
provider located
in another EU
country
Numerical skills
Internet use
Consumer vulnerability
(sociodemographic
factors)
Consumer vulnerability
(complexity)
Yes from a
retailer or service
provider located
outside the EU
Consumer Survey 2018
22
With regard to socio-demographic variables and other characteristics the results of the multivariate
analysis19 show that consumersrsquo internet use is the factor most closely associated20 with internet purchases in their own country followed by education age mother tongue and numerical skills
Regarding consumersrsquo frequency of internet use21 daily internet users are more likely to make domestic online purchases compared to those who use the internet weekly In addition weekly users also conduct more such purchases than monthly internet users and those who hardly ever use the internet
Highly educated consumers are more likely to purchase products and services online domestically than consumers with a medium level of education who in turn show higher values than consumers with a lower level of education
Regarding age domestic purchases are more common amongst consumers aged 18-54 years than amongst older consumers aged 55+
Consumers whose mother tongue is one of the official languages of the country or region they live in are also more likely to make such purchases than those whose mother tongue is not an official
language
Finally those with a high numerical skill level are more likely to make such purchases than those with a medium or low numerical skill level
Purchases of goods and services in another EU country via the internet is associated most closely with consumersrsquo age The characteristics showing the next closest links are education the number of languages spoken internet use and gender
Younger consumers (18-34 years) are more likely to engage in online cross-border shopping than all
other age groups In addition consumers aged 35-54 years are also more likely to make such purchases than those who are aged 55-64 years who in turn are also more likely to make such purchases than those aged 65+ years
Regarding consumersrsquo level of education highly educated consumers are most likely to make such purchases Furthermore those with a medium level of education are in turn more likely to make such purchases than those with a low level of education
Consumers that speak at least four languages are more likely to make such purchases than those
who speak fewer languages Those who speak three languages are also more likely to conduct cross-border online purchases than those who speak two languages who in turn are more likely to make such purchases than those who only speak their native language
Daily internet users are by far the most likely to purchase products or services online from retailers in another EU country In addition weekly internet users also show higher values than consumers who use the internet monthly and those who hardly ever use the internet
Finally males are more likely to make such purchases than females
When it comes to online purchases of goods and services from a retailer or service provider outside the EU consumersrsquo age is associated most closely with this indicator followed by gender education the number of languages spoken and frequency of internet use
As with cross-border purchases younger consumers (18-34 years) are most likely engage in online shopping in a country outside the EU In addition those who are aged 35-54 years are more likely
19 The values shown in the tables of the socio-demographic analyses are based on model estimates (see also chapter 124)
20 The sociodemographic characteristics having the closest link with the dependent variable are selected considering the average magnitude of the difference across the different levels of all the sociodemographic characters (eg the differences in the likelihood to purchase online- in absolute terms- across the different levels of internet use) and by looking at the overall coherence of this variability
21 Since Question 1 measured consumersrsquo online purchases the internet usage level lsquoNeverrsquo is excluded from the regression models
Consumer Survey 2018
23
to make such purchases than those who are aged 55-64 years who in turn are also more likely to
make such purchases than those aged 65+ years
As far as gender is concerned males are more likely to purchase goods or services online from traders outside of the EU than females
Highly educated consumers are more likely to make such purchases than the remainder of the population In addition those with a medium level of education are also more likely to make such purchases than those with a low level of education
Consumers that speak four languages or more are the most likely to make such purchases
Furthermore those who speak two or three languages also make more online purchases from retailers outside of the EU than consumers who only speak their native language
Finally daily internet users are noticeably more likely to conduct online purchases from countries outside the EU than less frequent internet users Weekly internet users also differ from those who use the internet hardly ever
When it comes to consumers making online purchases of goods and services from a retailer
or service provider whom they do not know the location of consumersrsquo numerical skills are most closely associated with this indicator followed by the frequency of internet use education employment status and age
Consumers with high or medium numerical skills22 are more likely to make online purchases from a retailer or service provider whom they do not know the location of than those with low numerical skills
Moreover daily or weekly internet users are also more likely to make online purchases from such
retailers than those who use the internet monthly or hardly ever
Regarding consumersrsquo level of education those who are highly educated are more likely to make such purchases than those with a low level of education
Job-seekers are the most likely to purchase products and services online without knowing the location of the retailers and more so than those who are retired or self-employed The latter two are the least
likely to conduct such purchases
Finally consumers that are 55-64 years old are more likely to purchase goods and services from
retailers whom they do not know the location of than consumers aged 35-54 years old
Offline cross-border purchases
When it comes to shopping cross-border from offline retailers or service providers the majority of respondents (852) has not performed such purchases in the past 12 months in the European Union Yet 145 of consumers in the EU27_2019 has purchased products or services offline in
another EU country during this timeframe
22 Respondentsrsquo numerical skills were measured with two short mathematical scenariosrsquo Suppose that the exact same product is on sale in shop A and shop B I will read you two statements about offers from shop A and shop B In each case please tell me which shop is cheaper 1 Shop A offers a TV set for 440 euro Shop B offers the exact same type of TV set at 500 euro but with a discount of 10 2 Shop A offers a TV set for 890 euro Shop B offers the exact same type of TV set at 940 euro but with a reduction of 60 euro 2 correct answers correspond to a high level of numerical skills 1 correct answer to a medium level and 0 correct answers to a low level
Consumer Survey 2018
24
Q2 ndash Base all respondents (N=28037)
In the East this indicator is in line with the EU27_2019 average while it is higher in the West (180) and the North (178) and lower in the South (88) Among the EU countries the highest levels of this indicator are found in Luxembourg (321) Slovakia (285) and Estonia (274) Among all studied countries high levels are also recorded for Iceland (399) and Norway (280)
The lowest levels are found in Spain (32) Greece (57) and Portugal (74)
Region
CountryYes No Dont know
EU27_2019 145 852 03
EU28 147 849 04
North 178 818 04
South 88 910 02
East 147 850 03
West 180 816 04
BE 260 736 04
BG 137 859 04
CZ 160 835 05
DK 218 780 03
DE 176 822 03
EE 274 722 04
IE 229 762 09
EL 57 941 01
ES 32 966 01
FR 160 834 06
HR 214 784 02
IT 137 860 03
CY 77 918 05
LV 136 862 01
LT 230 764 06
LU 321 676 04
HU 166 834 00
MT 220 777 04
NL 169 829 02
AT 245 751 03
PL 131 863 05
PT 74 926 00
RO 105 895 00
SI 196 801 03
SK 285 713 02
FI 114 886 01
SE 171 823 06
IS 399 596 05
NO 280 713 08
UK 158 830 12
In the past 12 months have you purchased any
goods or services through channels other than
the Internet from a retailer or service provider
located in another EU country
Consumer Survey 2018
25
Q2 ndash Base all EU27_2019 respondents (N=2492823)
23 See footnote 18
Male 149 A 847 A 04
Female 143 A 855 A 02
18-34 168 B 826 A 06 B
35-54 155 B 842 A 03 B
55-64 114 A 884 B 02 AB
65+ 118 A 882 B 01 A
Low 100 898 01 A
Medium 139 858 03 A
High 159 838 04 A
Very difficult 160 AB 839 AB 01
Fairly difficult 136 A 860 B 04 A
Fairly easy 141 A 857 B 03 A
Very easy 168 B 828 A 04 B
Rural area 142 A 855 A 02 A
Small town 143 A 853 A 04 A
Large town 153 A 845 A 03 A
Self-employed 160 DE 836 AB 05 A
Manager 182 E 814 A 04 A
Other white collar 149 CD 848 BC 03 A
Blue collar 132 BC 867 CD 02 A
Student 162 CDE 838 ABC 02 A
Unemployed 99 A 894 D 10 A
Seeking a job 108 AB 887 D 05 A
Retired 134 ABCD 862 BCD 06 A
Age groups
In the past 12 months have you
purchased any goods or services through
channels other than the Internet from a
retailer or service provider located in
another EU country
Yes No Dont know
Gender
Education
Financial Situation
Urbanisation
Employment status
Consumer Survey 2018
26
Q2 ndash Base all EU27_2019 respondents (N=24928)
Regarding socio-demographic variables and other characteristics consumersrsquo language skills is the factor most closely associated with cross-border shopping in another EU country through channels other than the internet The characteristics showing the next closest links are education frequency of internet use age and employment status
Consumers speak at least four languages are more likely to make such purchases than those who speak three languages who in turn are more likely to make such purchases than those who speak two languages The latter group is also more likely to make such purchases than those who speak only their native language
Regarding consumersrsquo level of education highly educated consumers are more likely to purchase products and services offline in another EU country than those with a medium or low level of education Those with a medium level of education are also more likely to purchase products or
services offline in another EU country than consumers with a low level of education
Daily internet users are most likely to purchase products and services offline in another EU country compared to those who use the internet less frequently In contrast people that never use the internet show lower values for such purchases than daily or weekly internet users
As far as age is concerned consumers aged 18-54 years are more likely to engage cross-border shopping through channels other than the internet than older consumers aged 55 years or older
Only native 101 897 02 AB
Two 138 858 04 B
Three 201 796 04 AB
Four or more 240 759 01 A
Not official
language in home
country
138 A 851 A 12 A
Official language
in home country147 A 851 A 03 A
Low 119 A 878 A 03 A
Medium 134 A 863 A 03 A
High 154 842 04 A
Daily 156 840 04
Weekly 124 B 876 A 00 A
Monthly 92 AB 907 AB
Hardly ever 84 AB 916 AB
Never 54 A 945 B 01 A
Very vulnerable 141 A 857 A 03 A
Somewhat
vulnerable142 A 855 A 04 A
Not vulnerable 149 A 848 A 03 A
Very vulnerable 152 A 844 A 05 A
Somewhat
vulnerable150 A 847 A 03 A
Not vulnerable 144 A 853 A 03 A
In the past 12 months have you
purchased any goods or services through
channels other than the Internet from a
retailer or service provider located in
another EU country
Consumer vulnerability
(socio-demographic
factors)
Consumer vulnerability
(complexity)
No Dont know
Languages
Mother Tongue
Numerical skills
Internet use
Yes
Consumer Survey 2018
27
Finally regarding employment status managers are most likely to make offline cross-border
purchases and more so than any other consumer group except for self-employed consumers and students In contrast those who are unemployed are the least likely to engage in such purchases and are less likely to do so than managers students people who are self-employed other white collars and blue-collar workers
Consumer Survey 2018
28
4 THE EVOLUTION OF ONLINE PURCHASE BEHAVIOUR2425
Q1-Base respondents who use the internet for private reasons (N=25240)
Compared to 2016 the incidence of persons buying online decreased in the EU27_2019 (-14pp26) and the West (-115pp) while it increased in the East (+77pp) South (+73pp) and North (+49pp) As far as the country results are concerned compared to the survey in 2016 the incidence of
24 Croatia is included in the computation of the EU27_2019EU28 total starting from 2012 and Bulgaria and Romania from 2008 (as these 3 countries were not covered in all the surveys editions)
25 Please refer to section 123 of this report for the comparability of results across the surveys waves 26 Percentage points
2018 ( = sig diff
EU27)
2018-
2016
2016-
2014
2014-
2012
2012-
2011
2011-
2010
2010-
2009
2009-
2008
2008-
2006
EU27_2019 720 -14 +112 +25 +67 +186 -03 +45 +62
EU28 742 -16 +107 +29 +56 +196 -05 +41 +67
North 785 +49 +35 +48 +39 +163 +05 -45 +110
South 660 +73 +85 +59 +94 +169 -04 +25 +41
East 719 +77 +64 +04 +86 +192 -09 +98 +27
West 751 -115 +157 +11 +48 +189 -01 +36 +103
BE 697 +15 +105 +65 +93 +152 -17 -16 +38
BG 639 +32 +142 +44 +133 +191 +06 +51 -
CZ 802 +39 +48 -05 +72 +215 +03 +64 +116
DK 820 +08 +05 +74 +46 +199 -45 -76 +101
DE 769 -124 +137 +06 +48 +199 -30 +126 +87
EE 732 +112 +33 +92 +93 +133 +07 +09 +49
IE 801 -56 +115 +27 +89 +126 +18 +180 +57
EL 620 +110 +38 +39 +107 +132 -04 +85 +76
ES 657 +51 +112 +06 +121 +133 -25 +71 +89
FR 713 -165 +217 +04 +38 +200 +21 -48 +153
HR 598 +60 +148 +54 - - - - -
IT 702 +82 +88 +103 +83 +206 +04 -20 -04
CY 464 +23 -130 +99 +41 +105 +48 +110 +115
LV 636 +87 +41 +15 +83 +192 -60 +24 +122
LT 687 +113 +41 +29 +170 +86 +41 +91 +33
LU 726 -127 +227 +80 -36 +137 -30 +59 +105
HU 738 +244 -25 +08 +120 +131 +10 +99 +19
MT 654 +40 -47 +35 +48 +79 +58 +127 +107
NL 805 -07 +51 +14 +31 +173 +87 -187 +143
AT 791 -76 +181 +15 +91 +139 -31 +157 -27
PL 774 +40 +74 -21 +77 +226 -54 +151 +80
PT 448 +82 +05 +56 +31 +142 +34 +31 +45
RO 594 +122 +65 +24 +129 +113 +40 +31 -
SI 637 +63 +62 +15 +94 +112 +00 +83 +71
SK 783 +79 +39 +15 +105 +199 +37 +128 +112
FI 759 +49 +65 -05 +15 +181 -01 -23 +86
SE 839 +43 +35 +71 -06 +106 +40 -94 +163
IS 797 +89 +34 +104 +27 - - - -
NO 818 -02 +27 +110 -25 - - - -
UK 885 -22 +63 +49 -01 +237 -15 +28 +105
In the past 12 months have you purchased any goods or services via the Internet
Region
Country
Total Yes
Consumer Survey 2018
29
consumers shopping online increased most steeply in Hungary (+244pp) and decreased most
sharply in France (-165pp) When looking at statistically significant changes in 2018 (vs 2016) and in 2016 (vs 2014) no positive reversal is found The largest negative reversal27 is found in France where between 2016 and 2018 this indicator decreased by 165pp whereas between 2014 and 2016 it increased by 217pp
Q1-Base respondents who use the internet for private reasons (N=25240)
27 Reversals are reported when both changes are statistically significant and when the direction of the change has reversed ie from an increase to a decrease or from a decrease to an increase Only the strongest positive and the strongest negative reversal are reported which are determined by the highest absolute sum of both changes
2018 ( = sig diff
EU27)
2018-
2016
2016-
2014
2014-
2012
2012-
2011
2011-
2010
2010-
2009
2009-
2008
2008-
2006
EU27_2019 630 -18 +103 +26 +46 +170 -02 +37 +66
EU28 659 -12 +92 +31 +36 +183 -02 +34 +71
North 694 +35 +47 +57 +03 +186 +07 -86 +107
South 536 +70 +62 +51 +74 +130 -06 +42 +32
East 673 +71 +69 +09 +68 +183 -06 +94 +30
West 665 -116 +148 +14 +27 +180 +01 +15 +114
BE 487 -29 +89 +67 +48 +116 +11 -50 +56
BG 579 +43 +154 +83 +92 +146 +07 +48 -
CZ 781 +42 +62 -26 +69 +242 +11 +32 +125
DK 725 -11 +25 +80 +24 +295 -27 -213 +105
DE 719 -96 +116 -01 +42 +185 -28 +109 +97
EE 595 +117 +35 +86 +47 +105 -12 -04 +53
IE 636 -93 +230 +65 +116 +62 +46 +18 +07
EL 548 +117 +53 +112 +29 +117 -05 +63 +41
ES 536 +76 +56 +14 +95 +100 -25 +98 +52
FR 609 -179 +186 +32 -16 +215 +13 -57 +157
HR 411 +75 +63 +62 - - - - -
IT 575 +64 +81 +65 +77 +164 +01 +02 +14
CY 169 -52 +52 +114 -22 -29 +52 +14 +41
LV 481 +63 +33 +37 +09 +173 -66 -07 +124
LT 580 +85 +53 +40 +125 +78 +52 +54 +25
LU 333 -339 +467 +47 +15 +18 -06 +17 +48
HU 676 +210 -07 +24 +99 +111 +29 +85 +30
MT 162 -32 +56 -08 +71 -04 +07 +34 -11
NL 757 -15 +53 -02 +40 +190 +90 -192 +165
AT 619 -164 +357 -34 +96 +52 +14 +60 +36
PL 740 +30 +87 -23 +69 +216 -57 +152 +90
PT 286 +35 -15 +74 +16 +79 +33 +14 +38
RO 571 +115 +66 +39 +109 +111 +40 +43 -
SI 506 +66 +57 +02 +63 +91 +11 +45 +77
SK 712 +96 +24 +18 +88 +181 +46 +107 +95
FI 679 +69 +66 +15 -29 +183 +01 -40 +73
SE 767 +17 +51 +75 -35 +127 +34 -103 +161
IS 471 +54 -13 +140 -28 - - - -
NO 706 -19 +44 +177 -109 - - - -
UK 851 +28 +06 +54 -10 +241 -05 +24 +109
In the past 12 months have you purchased any goods or services via the Internet
Region
Country
Yes from a retailer or service provider located in (our country)
Consumer Survey 2018
30
In terms of online shopping domestically the proportion of consumers having done so in the past 12
months decreased in the EU27_2019 (-18pp) and the Western region (-116pp) while the opposite pattern can be observed for the Eastern (+71pp) Southern (+70pp) and Northern regions (+35pp) Compared to the survey in 2016 the proportion of consumers who shop online domestically increased most steeply in Hungary (+210pp) The greatest decrease compared to 2016 is observed in Luxembourg (-339pp) In Luxembourg also the largest negative reversal is observed where the decrease between 2016 and 2018 was preceded by an increase of 467pp between 2014 and 2016 There are no statistically significant positive reversals
Q1-Base respondents who use the internet for private reasons (N=25240)
2018 ( = sig diff
EU27)
2018-
2016
2016-
2014
2014-
2012
2012-
2011
2011-
2010
2010-
2009
2009-
2008
2008-
2006
EU27_2019 283 +91 +03 +23 +47 +47 -05 +10 +13
EU28 288 +101 -07 +18 +50 +52 -03 +03 +17
North 343 +40 +32 +40 +49 +47 +04 -06 +26
South 276 +45 +53 +43 +43 +51 -03 +02 +19
East 191 +57 +29 +15 +21 +33 -08 +20 +02
West 322 +144 -46 +11 +65 +49 -06 +10 +18
BE 481 +37 +118 +23 +115 +79 -12 -04 +06
BG 195 +10 +29 +04 +58 +53 +05 +15 -
CZ 222 +68 +33 +39 +09 +33 -01 +13 +04
DK 365 +09 +26 -10 +75 +41 -28 +41 +42
DE 287 +143 -54 +37 +33 +57 -15 +16 +19
EE 331 +33 +31 +57 +80 +43 +24 -10 +27
IE 598 +357 -250 -25 +111 +62 +45 +139 +35
EL 213 +43 +13 -50 +97 +22 -12 +39 +38
ES 285 +69 +66 +06 +43 +44 -15 -07 +41
FR 302 +152 -44 -26 +112 +16 -06 +05 +20
HR 305 +36 +129 +73 - - - - -
IT 285 +27 +59 +87 +40 +56 +05 -03 -01
CY 332 -15 -95 +87 +53 +94 +07 +81 +91
LV 306 +53 +29 +65 +49 +58 -09 +27 +25
LT 277 +60 +60 +21 +54 +14 +20 +23 +17
LU 629 +278 -209 +111 -57 +139 -42 +41 +98
HU 231 +104 +25 +15 +51 +05 +03 +25 -04
MT 574 +67 -82 +48 +69 +44 +78 +90 +114
NL 240 +05 +61 -27 +29 +55 +44 -81 +11
AT 608 +369 -289 +104 +22 +99 -26 +139 +09
PL 173 +53 +10 +38 -03 +38 -16 +17 +09
PT 211 +58 +00 +33 +05 +73 +01 +27 +04
RO 100 +46 +13 -22 +29 +24 -06 +14 -
SI 309 +32 +98 +16 +57 +29 -11 +32 +17
SK 348 +105 +110 -85 +85 +43 -17 +77 +13
FI 382 +44 +39 -01 +48 +69 +11 +24 +14
SE 337 +50 +27 +94 +27 +32 +13 -59 +27
IS 541 +223 +35 +59 +54 - - - -
NO 402 +15 +26 +98 -11 - - - -
UK 321 +162 -73 -13 +78 +82 +09 -44 +50
In the past 12 months have you purchased any goods or services via the Internet
Region
Country
Yes from a retailer or service provider located in another EU country
Consumer Survey 2018
31
With regard to the share of consumers participating in cross-border online shopping in another EU
country it increased in the EU27_2019 (+91pp) and all the four regions (West +144pp East +57pp South +45pp and North +40pp) Compared to the survey in 2016 the share of consumers participating in cross-border online shopping in another EU country increased most steeply in Austria (+369pp) In Austria also the largest positive reversal is observed where the strong increase between 2016 and 2018 was preceded by a decrease by 289pp between 2014 and 2016 There are no statistically significant decreases or negative reversals
Q1-Base respondents who use the internet for private reasons (N=25240)
2018 ( = sig diff
EU27)
2018-
2016
2016-
2014
2014-
2012
2012-
2011
2011-
2010
2010-
2009
2009-
2008
2008-
2006
EU27_2019 184 +92 +04 +10 +22 +29 -03 +03 +07
EU28 200 +116 -25 +13 +24 +36 -03 +01 +08
North 245 +48 +60 +21 +33 +20 +12 -20 +27
South 177 +47 +36 +12 +31 +37 -05 +03 +09
East 147 +62 +28 +14 +09 +16 +00 +09 +01
West 198 +139 -36 +04 +23 +30 -06 +02 +09
BE 184 +67 +34 -02 +24 +36 +00 -13 +04
BG 118 +13 +37 +21 +02 +43 -05 +11 -
CZ 201 +65 +36 +40 +13 +26 +04 +07 +08
DK 239 +35 +63 +06 +45 -11 +06 -11 +31
DE 187 +138 -32 +16 +07 +29 -11 +21 +05
EE 300 +46 +115 +54 +35 +36 +18 -15 +13
IE 317 +278 -156 -18 +48 +09 +20 +47 +31
EL 144 +60 -39 +06 +39 +32 -18 +31 +20
ES 193 +23 +64 +07 +35 +46 -03 -01 +19
FR 211 +182 -72 -09 +46 +31 -04 -15 +17
HR 306 +26 +143 +27 - - - - -
IT 175 +65 +29 +18 +27 +30 -04 -01 +00
CY 189 +44 -30 -09 +10 +51 +06 +74 +10
LV 317 +106 +53 +49 +41 +48 +12 -04 +21
LT 256 +88 +73 +16 +19 +18 +12 +13 +07
LU 173 +127 -60 +22 +14 +19 +02 -06 +23
HU 199 +117 +15 +00 +13 +14 +05 +10 -09
MT 357 +15 -40 +76 +46 +81 +05 +57 +64
NL 212 +21 +80 +11 +10 +38 -00 -40 +23
AT 131 +93 -46 +10 +14 +17 -00 +04 -40
PL 123 +67 +05 +29 -05 +09 -03 +08 +03
PT 138 +42 +28 +07 +24 +38 -06 +07 +09
RO 74 +28 +29 -09 +06 +14 +04 +06 -
SI 228 +50 +84 +02 +48 +10 +03 +00 +16
SK 239 +119 +74 -42 +44 +24 -10 +19 +06
FI 234 +49 +32 -01 +49 +18 +45 -08 +15
SE 232 +33 +63 +36 +20 +26 -05 -45 +43
IS 435 +53 +32 +108 +07 - - - -
NO 319 +46 +45 +28 +50 - - - -
UK 306 +281 -220 +28 +44 +73 +04 -06 +19
In the past 12 months have you purchased any goods or services via the Internet
Region
Country
Yes from a retailer or service provider located outside the EU
Consumer Survey 2018
32
When considering cross-border online shopping in a country outside the EU the extent of this
behaviour increased in the EU27_2019 (+92pp) and all the four regions in the West (+139pp) East (+62pp) North (+48pp) and South (+47pp) Compared to the survey in 2016 the proportion of consumers who shop cross-border online in a country outside the EU increased most steeply in Ireland (+278pp) This increase between 2016 and 2018 follows a strong decrease of 156pp between 2014 and 2016 (ie positive reversal) There are no statistically significant decreases compared to 2016 and no statistically significant negative reversals
Q1-Base respondents who use the internet for private reasons (N=25240)
The share of consumers that shopped online from retailers or service providers without knowing where they are located decreased in the EU27_2019 (-03pp) and the Western region (-09pp) whereas it remained stable for the Northern Southern and Eastern regions Compared to 2016 this percentage increased most steeply in Portugal and Estonia (both +12pp) and decreased most
prominently in Luxembourg (-31pp) When looking at statistically significant changes in 2018 (vs
2018( = sig diff
EU27)
2018-2016 2016-2014 2014-2006
EU27_2019 21 -03 +04 +09
EU28 23 -03 +04 +11
North 16 -02 -00 +12
South 32 +01 +18 +06
East 07 +01 -07 +03
West 20 -09 +01 +15
BE 23 +09 -13 +21
BG 06 -03 -05 -
CZ 01 -04 -02 -00
DK 17 +04 -09 +17
DE 15 -17 -03 +27
EE 19 +12 -05 +07
IE 09 -25 +24 +03
EL 08 -03 +11 -01
ES 36 -05 +26 +13
FR 31 -01 +06 +07
HR 13 +05 -05 -
IT 36 +05 +17 +00
CY 11 +04 -09 +13
LV 11 -13 +07 +09
LT 13 -00 +05 +04
LU 10 -31 +19 +18
HU 09 +07 -01 +01
MT 13 +02 +05 -07
NL 14 +01 -04 +00
AT 10 -16 +06 -16
PL 07 -02 -13 +08
PT 15 +12 -10 +12
RO 06 +07 -01 -
SI 05 -02 +03 -05
SK 10 +03 -07 +06
FI 27 +04 +02 +09
SE 12 -08 +02 +13
IS 18 +12 -02 -
NO 21 -04 +04 -
UK 33 -02 +04 +23
In the past 12 months have you purchased any goods or services
via the Internet
Region
Country
Yes but do not know where the retailer or service
provider is located
Consumer Survey 2018
33
2016) and in 2016 (vs 2014) the largest positive reversal is found in Portugal where between 2016
and 2018 this indicator increased by 12pp whereas between 2014 and 2016 it decreased by 10pp The largest negative reversal is found in Ireland where between 2016 and 2018 this indicator decreased by 25pp whereas between 2014 and 2016 it increased by 24pp
Q2 ndash Base all respondents (N=28037)
2018
( = sig
diff EU27)
2018-
2016
2016-
2014
2018
( = sig
diff EU27)
2018-
2016
2016-
2014
2018
( = sig
diff EU27)
2018-
2016
2016-
2014
EU27_2019 145 -02 +34 852 +03 -34 03 -01 -00
EU28 147 -10 +45 849 +10 -45 04 +00 -00
North 178 +23 +21 818 -23 -20 04 -00 -01
South 88 +11 -11 910 -11 +11 02 -01 -01
East 147 +35 -01 850 -34 +04 03 -01 -03
West 180 -35 +87 816 +36 -88 04 -01 +01
BE 260 -03 +104 736 +04 -107 04 -01 +03
BG 137 -06 +36 859 +04 -35 04 +02 -00
CZ 160 +06 +02 835 -09 +01 05 +03 -03
DK 218 +43 +35 780 -42 -28 03 -01 -07
DE 176 -32 +104 822 +35 -104 03 -03 -00
EE 274 -44 +119 722 +41 -116 04 +03 -03
IE 229 -20 +76 762 +18 -78 09 +01 +03
EL 57 -29 +36 941 +32 -40 01 -03 +04
ES 32 +10 -20 966 -07 +16 01 -03 +04
FR 160 -54 +94 834 +52 -97 06 +02 +03
HR 214 +06 +69 784 -04 -70 02 -02 +02
IT 137 +21 -14 860 -22 +18 03 +01 -04
CY 77 -13 -78 918 +11 +93 05 +02 -15
LV 136 +00 +30 862 +01 -32 01 -01 +01
LT 230 +62 +23 764 -69 -19 06 +07 -04
LU 321 +11 -67 676 -09 +64 04 -02 +02
HU 166 +94 +14 834 -91 -14 00 -03 +00
MT 220 +03 +79 777 +00 -86 04 -03 +07
NL 169 -29 -49 829 +29 +47 02 -00 +01
AT 245 +11 +115 751 -06 -119 03 -05 +04
PL 131 +25 -10 863 -24 +16 05 -01 -07
PT 74 +07 +05 926 -06 -00 00 -01 -05
RO 105 +50 -23 895 -49 +23 00 -01 -00
SI 196 +03 +57 801 -05 -57 03 +03 00
SK 285 +91 -22 713 -86 +23 02 -05 -00
FI 114 +09 -37 886 -08 +39 01 -01 -02
SE 171 +21 +30 823 -19 -33 06 -02 +04
IS 399 +64 +97 596 -67 -101 05 +03 +03
NO 280 +02 +26 713 +09 -36 08 -11 +10
UK 158 -64 +118 830 +58 -117 12 +06 -01
In the past 12 months have you purchased any goods or services through channels other than the
Internet from a retailer or service provider located in another EU country
Region
Country
Yes No Dont know
Consumer Survey 2018
34
The incidence of consumers shopping cross-border online in another EU country through channels
other than the internet is 145 in the EU27_2019 In the East this indicator is in line with the EU27_2019 average while it is higher in the West (180) and North (178) and lower in the South (88) Among the EU countries the highest levels of this indicator are found in Luxembourg (321) Slovakia (285) and Estonia (274) In addition high levels are also recorded for Norway (280) and Iceland (399) The lowest levels are found in Spain (32) Greece (57) and Portugal (74)
The share of consumers engaging in cross-border shopping in another EU country through channels
other than the internet remained stable in the EU27_2019 while it decreased in the Western region (-35pp) and increased in the other regions (South +11pp North +23pp and East +35pp) compared to 2016 This percentage increased most steeply in Hungary (+94pp) and decreased most prominently in France (-54pp) The strongest positive reversal is found in Romania where between 2016 and 2018 this indicator increased by 50pp whereas between 2014 and 2016 it decreased by 23pp In contrast the highest negative reversal in the EU is found in Estonia where between 2016
and 2018 this proportion of consumers decreased by 44pp whereas between 2014 and 2016 it increased by 119pp Considering all countries of the survey an even stronger negative reversal is observed in the UK (-64pp between 2016 and 2018 +118pp between 2014 and 2016)
Consumer Survey 2018
35
5 KNOWLEDGE OF CONSUMER RIGHTS
This chapter focuses on a consumersrsquo level of knowledge of their rights and specific legislation that pertains to both offline and online purchase contexts Consumersrsquo awareness of their consumer rights is a prerequisite to the effectiveness of existing consumer protection mechanisms
General level of knowledge about consumer rights
This section introduces key findings on the general level of consumersrsquo knowledge of specific rights and remedies they are entitled to when it comes to distance purchase cooling-off period legal guarantees and unsolicited products The three sections that follow break the findings down into the three subcategories that make up general knowledge of consumer rights
Average proportion of correct answers on Q628-Q729-Q830 (Yes to Q6 Q7 Q8) ndash Base all respondents
(N=28037)
28 Q6 Suppose you ordered a new electronic product by post phone or the internet do you think you have the right to return the product 4 days after its delivery and get your money back without giving any reason ndashYes ndashNo ndashDKNA
29 Q7 Imagine that an electronic product you bought new 18 months ago breaks down without any fault on your part You didnt buy or benefit from any extended commercial guarantee Do you have the right to have it repaired or replaced for free ndashYes ndashNo ndashDKNA
30 Q8 Imagine you receive two educational DVDs by post that you have not ordered together with a 20 euro invoice for the goods Are you obliged to pay the invoice ndashYes ndashNo ndashDKNA
Region
Country
2018
( = sig
diff EU27)
2018-
2016
2016-
2014
EU27_2019 455 -27 +42
EU28 448 -42 +58
North 424 -16 +11
South 475 +42 -18
East 466 +03 +39
West 439 -93 +89
BE 442 -16 +44
BG 414 -32 +50
CZ 595 +06 +25
DK 548 -03 +14
DE 497 -59 +40
EE 485 +21 +16
IE 403 -114 +99
EL 252 -19 +19
ES 451 +08 -17
FR 363 -175 +177
HR 347 -11 +43
IT 541 +85 -29
CY 374 -08 -02
LV 439 -41 +68
LT 313 -55 +67
LU 458 -76 +185
HU 428 -23 +108
MT 482 +13 +01
NL 424 -04 +06
AT 472 -73 +108
PL 494 +11 +45
PT 430 +09 +19
RO 375 +15 +02
SI 474 +47 +02
SK 579 -16 +30
FI 356 -31 +04
SE 412 -04 -17
IS 467 -09 +45
NO 527 +11 -05
UK 401 -150 +176
Knowledge of consumer rights
Consumer Survey 2018
36
The total level of consumersrsquo knowledge of consumer rights in the European Union is 455 This
indicator is higher in the East (466) and South (475) whereas it is lower in the North (424) and West (439)
In this map values above average are coloured in light and dark green and values below average are coloured
in light and dark red
The highest levels of consumer rights knowledge are found in the Czech Republic (595) Slovakia (579) and Denmark (548) Conversely the lowest levels of knowledge about consumer rights
are reported in Greece (252) Lithuania (313) and Croatia (347)
Compared to 2016 knowledge about consumer rights remained stable in the East while it decreased in the EU27_2019 (-27pp) the North (-16pp) and West (-93pp) and increased in the South (+42pp)
At country level the highest increase in knowledge about consumer rights compared to 2016 is found in Italy (+85pp) The largest reversal is also found in Italy where the increase between 2016 and 2018 was preceded by a decrease of 29pp between 2014 and 2016 The greatest decrease in consumer rights knowledge is found in France (-175pp) which also represents the largest negative reversal after knowledge increased by 177pp between 2014 and 2016
Consumer Survey 2018
37
Average proportion of correct answers on Q6-Q7-Q8 (Yes to Q6 Q7 Q8) ndash Base all EU27_2019 respondents
(N=24928)
Average proportion of correct answers on Q6-Q7-Q8 (Yes to Q6 Q7 Q8) ndash Base all EU27_2019 respondents
(N=24928)
Regarding sociodemographic variables and other consumer characteristics whether a consumerrsquos mother tongue is the official language in their country of residence or not is associated most closely with the knowledge of consumer rights The variables showing the next closest link are age gender employment status and the degree of urbanisation
Those whose mother tongue corresponds with one of the official languages of the country or region
they live in are more likely to know their consumer rights than those whose mother tongue is not an official language
Age is also linked to knowledge of consumer rights Those aged 55-64 years have more knowledge than those aged 35-54 years who in turn have more knowledge than those aged 18-34 years
Gender is also associated with consumersrsquo knowledge of relevant legislation Males show higher levels
of knowledge more often than females
Regarding consumersrsquo employment status other white-collar workers are most likely to be knowledgeable about consumer rights more so than the self-employed managers blue collar workers students unemployed jobseekers and the retired
Finally the degree to which a consumers living area is urbanised also has a link with consumersrsquo knowledge of consumer rights Those who live in a small town are more knowledgeable about their consumer rights than those living in a rural area
471 442
407 464 A 488 B 477 AB
441 A 462 A 455 A
463 AB 447 A 454 A 482 B
445 A 465 B 457 AB
446 A 451 A 488 432 A
433 A 430 A 446 A 451 A
GenderMale Female
Knowledge of consumer rights
Blue collar
Student
65+
Education levelLow Medium High
Age18-34 35-54 55-64
Very easy
UrbanisationRural area Small town Large town
Financial situationVery difficult Fairly difficult Fairly easy
Unemployed Seeking a job RetiredEmployment status
Self-employed Manager Other white collar
446 A 459 AB 462 AB 485 B
418 458
453 AB 446 A 463 B
465 B 433 A 410 A 466 AB 418 A
443 A 450 A 463 A
460 A 458 A 457 A
Four or more
Knowledge of consumer rights
LanguagesOnly native Two
High
Mother tongue
Not official language
in home country
Official language in
home country
Numerical skillsLow Medium
Three
Consumer
vulnerability
(complexity)
Very vulnerableSomewhat
vulnerableNot vulnerable
Hardly ever Never
Consumer
vulnerability
(socio-demographic
factors)
Very vulnerableSomewhat
vulnerableNot vulnerable
Internet useDaily Weekly Monthly
Consumer Survey 2018
38
Knowledge of the cooling-off period
Correct answer on Q6 (yes) ndash Base all respondents (N=28037)
With regard to consumersrsquo knowledge of the cooling-off period the overall share of consumers being
aware of their rights in the EU27_2019 is 610 This indicator is lower in the South (580) and North (518) whereas it is higher in the West (627) and East (643)
Knowledge of the cooling-off period is highest in the Czech Republic (759) Hungary (739) and Germany (738) Among the EU countries it is the lowest in Greece (222) Cyprus (361) and Portugal (378) Among all the countries studied it is low as well in Iceland (356)
Compared to 2016 knowledge of the cooling-off period decreased in the EU27_2019 (-45pp) North (-26pp) and West (-123pp) increased for the Southern region (+24pp) and remained stable in the East For this type of knowledge the largest increase can be observed in Slovenia (+91pp) and the largest decrease can be found in Ireland (-301pp) While no positive reversal is found there are
Region
Country
2018
( = sig
diff EU27)
2018-
2016
2016-
2014
EU27_2019 610 -45 +86
EU28 601 -70 +110
North 518 -26 +30
South 580 +24 +21
East 643 +05 +73
West 627 -123 +145
BE 472 -87 +110
BG 478 -34 +100
CZ 759 +33 +10
DK 585 -22 +65
DE 738 -27 +75
EE 501 -04 +11
IE 437 -301 +246
EL 222 -137 +115
ES 605 -02 +00
FR 495 -281 +258
HR 548 -23 +112
IT 663 +73 +29
CY 361 -58 +64
LV 459 -52 +105
LT 446 -110 +67
LU 698 -45 +336
HU 739 +33 +135
MT 486 +25 -14
NL 679 +04 +21
AT 693 -104 +210
PL 700 -03 +82
PT 378 +26 -19
RO 496 +22 +30
SI 623 +91 +93
SK 678 -77 +94
FI 384 -18 -23
SE 588 -08 +14
IS 356 -03 +47
NO 608 +14 -12
UK 535 -247 +282
Knowledge of the cooling-off period
Consumer Survey 2018
39
multiple strong negative reversals The highest negative reversal in the EU is observed for Ireland
where between 2016 and 2018 knowledge of the cooling-off period decreased by 301pp whereas between 2014 and 2016 it increased by 246pp
Correct answer on Q6 (yes) ndash Base all EU27_2019 respondents (N=24928)
Correct answer on Q6 (yes) ndash Base all EU27_2019 respondents (N=24928)
Regarding socio-demographic variables and other characteristics the age of consumers is most closely linked to their knowledge of the cooling-off period The factor showing the next closest link is vulnerability due to socio-demographic factors followed by gender numerical skills and employment status
Consumers aged 18-34 years are less likely to be knowledgeable about their rights regarding the cooling-off period compared to those who are aged 35-54 years 55-64 years or 65+ years
Consumer vulnerability due to socio-demographic factors31 is also associated with knowledge of the cooling-off period Those who are not vulnerable are more likely to know about the cooling-off period
than those who are very vulnerable or somewhat vulnerable
31 Consumersrsquo self-reported vulnerability is measured by asking them how vulnerable or disadvantaged they feel when choosing and buying goods or services along several dimensions (Q21) These dimensions are further grouped into vulnerability due to sociodemographic factors (based on self-reported vulnerability because of health problems poor financial circumstances current employment situation age belonging to a minority group personal issues or other) and vulnerability due to the complexity of offers or terms and conditions Consumer vulnerability is discussed in more detail in chapter 13
627 603
543 633 A 651 A 634 A
576 A 622 B 616 AB
616 AB 599 A 612 A 662 B
606 A 620 A 615 A
446 A 451 A 488 432 A
630 BC 621 ABC 570 AB 602 AB
GenderMale Female
Knowledge of the cooling-off period
Blue collar
Student
65+
Education levelLow Medium High
Age18-34 35-54 55-64
Very easy
UrbanisationRural area Small town Large town
Financial situationVery difficult Fairly difficult Fairly easy
Unemployed Seeking a job RetiredEmployment status
Self-employed Manager Other white collar
599 A 623 A 626 A 624 A
571 A 617 A
586 A 597 A 630
633 B 561 A 523 A 586 AB 552 A
574 A 603 A 632
617 A 607 A 619 A
Four or more
Knowledge of the cooling-off period
LanguagesOnly native Two
High
Mother tongue
Not official language
in home country
Official language in
home country
Numerical skillsLow Medium
Three
Consumer
vulnerability
(complexity)
Very vulnerableSomewhat
vulnerableNot vulnerable
Hardly ever Never
Consumer
vulnerability
(socio-demographic
factors)
Very vulnerableSomewhat
vulnerableNot vulnerable
Internet useDaily Weekly Monthly
Consumer Survey 2018
40
Gender is another factor that is related to knowledge of the cooling-off period with males tending to
be more likely to know their rights than females
Consumersrsquo numerical skills are also associated with being knowledgeable of the cooling-off period Those with a higher numerical skill level are more likely to be knowledgeable of this consumer right than those with a medium or low level of numerical skills
Finally employment status is also related to knowledge of the cooling-off period Students and other white-collar workers are more likely to know about this aspect than people who are self-employed White collar workers are also more likely to know about this aspect than the retired blue collar
workers and jobseekers
Consumer Survey 2018
41
Knowledge of faulty product guarantees
In the European Union the general level of knowledge of faulty product guarantees is 409 In the East this level of knowledge is in line with the EU27_2019 average while it is higher in the South (572) and lower in the North (369) and West (302)
Correct answer on Q7 (yes) ndash Base all respondents (N=28037)
The highest levels of knowledge of faulty product guarantees are found in the Czech Republic (720) Portugal (661) and Slovakia (646) In contrast the lowest levels of this type of knowledge are observed in Finland (178) Hungary (196) and France (220)
Compared to 2016 the level of knowledge of faulty product guarantees remained stable in the North and East while it decreased in the EU27_2019 (-46pp) and the West (-118pp) and increased in the
South (+24pp) The highest increase at country level is recorded for Cyprus (+64pp) and the most prominent decrease is noted for France (-197pp) In France also the highest reversal is found
Region
Country
2018
( = sig
diff EU27)
2018-
2016
2016-
2014
EU27_2019 409 -46 +41
EU28 388 -67 +55
North 369 -12 -13
South 572 +24 -20
East 409 -08 +13
West 302 -118 +106
BE 444 +49 +28
BG 394 -108 +81
CZ 720 +17 +14
DK 587 -25 -26
DE 346 -103 +41
EE 457 +25 -27
IE 308 -102 +54
EL 359 +43 -15
ES 568 +10 -49
FR 220 -197 +228
HR 269 -41 +56
IT 598 +33 -04
CY 498 +64 +66
LV 407 -108 +92
LT 233 -69 +35
LU 260 -169 +48
HU 196 -101 +58
MT 547 +34 -87
NL 289 -23 +24
AT 316 -91 +117
PL 329 +23 -00
PT 661 +09 +13
RO 481 +12 -17
SI 326 +17 -16
SK 646 -23 +24
FI 178 -35 -37
SE 371 +39 -25
IS 447 -90 +42
NO 512 +25 -47
UK 245 -209 +157
Knowledge of faulty product guarantees
Consumer Survey 2018
42
where the decrease between 2016 and 2018 follows a strong increase of 2289pp between 2014 and
2016 No positive reversals are observed
Correct answer on Q7 (yes) ndash Base all EU27_2019 respondents (N=24928)
Correct answer on Q7 (yes) ndash Base all EU27_2019 respondents (N=24928)
In terms of socio-demographic variables and other characteristics education shows the closest link with knowledge of faulty product guarantees This is followed by gender language age and employment status
Regarding the association between an education level and knowledge of faulty product guarantees consumers with a low and medium education level are more likely to know about faulty product
guarantees than those with a high level of education
Gender is another factor that is related to knowledge of faulty product guarantees with males tending to be more likely to know about this than females
The number of languages a consumer knows is also associated with their knowledge about faulty product guarantees Those who know at least four languages are more likely to know about this subject than those who know only two languages or less (ie only their native language)
Consumers aged 35-64 are also more likely to be more knowledgeable about this issue compared
to consumers aged 18-34
Finally other white-collar workers are more likely to be knowledgeable regarding this issue compared to people who are self-employed managers blue collar workers students the unemployed jobseekers and consumers who are retired
425 396
377 A 423 B 432 B 407 AB
455 A 421 A 385
411 A 402 A 411 A 419 A
397 A 423 B 407 AB
446 A 451 A 488 432 A
368 A 379 A 429 AB 417 AB
GenderMale Female
Knowledge of faulty product guarantees
Blue collar
Student
65+
Education levelLow Medium High
Age18-34 35-54 55-64
Very easy
UrbanisationRural area Small town Large town
Financial situationVery difficult Fairly difficult Fairly easy
Unemployed Seeking a job RetiredEmployment status
Self-employed Manager Other white collar
397 A 410 A 422 AB 461 B
441 A 409 A
421 A 404 A 412 A
411 A 411 A 396 A 435 A 398 A
417 A 412 A 407 A
410 A 414 A 409 A
Four or more
Knowledge of faulty product guarantees
LanguagesOnly native Two
High
Mother tongue
Not official language
in home country
Official language in
home country
Numerical skillsLow Medium
Three
Consumer
vulnerability
(complexity)
Very vulnerableSomewhat
vulnerableNot vulnerable
Hardly ever Never
Consumer
vulnerability
(socio-demographic
factors)
Very vulnerableSomewhat
vulnerableNot vulnerable
Internet useDaily Weekly Monthly
Consumer Survey 2018
43
Knowledge of rights regarding unsolicited products
The overall level of knowledge of consumer rights regarding unsolicited products in the European Union is 345 In the East the level is in line with the EU27_2019 average while knowledge is higher in the North (385) and West (388) and lower in the South (274)
Correct answer on Q8 (yes) ndash Base all respondents (N=28037)
Among the EU countries high levels of knowledge of rights regarding unsolicited products are found in Finland (506) Estonia (498) and Slovenia (475) Additionally among all surveyed
countries the level is highest in Iceland (597) The lowest levels of knowledge are reported in Romania (148) Greece (176) and Spain (182)
Between 2016 and 2018 knowledge of rights regarding unsolicited products remained stable for the Northern and Eastern regions while it increased in the EU27_2019 (+11pp) and the South (+79pp)
Region
Country
2018
( = sig
diff EU27)
2018-
2016
2016-
2014
2014-
2012
2012-
2011
EU27_2019 345 +11 -02 +23 -45
EU28 355 +10 +09 +21 -46
North 385 -09 +15 -17 -70
South 274 +79 -54 +70 -63
East 347 +13 +32 -04 -44
West 388 -36 +14 +08 -29
BE 409 -09 -07 -08 -13
BG 371 +46 -31 +66 -64
CZ 306 -31 +49 -55 +29
DK 472 +38 +02 -51 -25
DE 407 -47 +04 +24 -33
EE 498 +43 +63 +19 -38
IE 463 +61 -02 -06 -35
EL 176 +37 -43 +20 -72
ES 182 +16 -02 +08 -40
FR 372 -47 +43 -03 -46
HR 222 +31 -41 -18 -
IT 364 +150 -113 +137 -85
CY 263 -28 -137 +66 -34
LV 450 +36 +07 +70 -15
LT 260 +15 +98 -20 -131
LU 417 -15 +172 -06 +01
HU 349 +00 +130 -03 -106
MT 414 -19 +104 +40 -34
NL 304 +07 -27 -09 +16
AT 407 -25 -02 +04 +17
PL 452 +13 +54 -19 -10
PT 251 -08 +62 -04 -19
RO 148 +12 -06 -00 -110
SI 475 +34 -71 +126 -102
SK 412 +51 -26 +51 +35
FI 506 -38 +71 -09 -86
SE 276 -43 -39 -23 -79
IS 597 +65 +45 -36 +03
NO 461 -05 +42 -35 -23
UK 424 +06 +88 +13 -54
Knowledge of unsolicited products
Consumer Survey 2018
44
and decreased in the West (-36pp) The highest increase is found in Italy (+150pp) which is also
related to the strongest positive reversal after a decrease by 113pp between 2014 and 2016 The greatest decrease is recorded for France and Germany (both -47pp) France also shows the highest negative reversal where the decrease between 2016 and 2018 follows an increase of 43pp between 2014 and 2016
Correct answer on Q8 (yes) ndash Base all EU27_2019 respondents (N=24928)
Correct answer on Q8 (yes) ndash Base all EU27_2019 respondents (N=24928)
With regard to socio-demographic variables and other characteristics whether someonersquos mother tongue is the same as one of the official languages of the country or region they live in has the
closest link with consumersrsquo knowledge of their rights regarding unsolicited products followed by age education gender and employment status
Consumers whose mother tongue corresponds with one of the official languages of the country or region they live in are more likely to know about their rights regarding unsolicited products than those whose mother tongue is different
Regarding the association between age and knowledge of consumer rights regarding unsolicited products consumers aged 55 years or older appear to be more knowledgeable than consumers
younger than 55 years
Education is also an important factor related to consumersrsquo knowledge of their rights Those with a high or medium level of education are more likely to be knowledgeable of their rights regarding such products than consumers with a lower level of education
Regarding consumersrsquo gender the proportion of males that knows their rights regarding this issue is higher than the proportion of females
362 328
296 335 381 A 391 A
295 341 A 362 A
359 A 340 A 340 A 364 A
332 A 353 A 348 A
446 A 451 A 488 432 A
308 AB 287 A 340 ABC 333 ABC
GenderMale Female
Knowledge of unsolicited products
Blue collar
Student
65+
Education levelLow Medium High
Age18-34 35-54 55-64
Very easy
UrbanisationRural area Small town Large town
Financial situationVery difficult Fairly difficult Fairly easy
Unemployed Seeking a job RetiredEmployment status
Self-employed Manager Other white collar
344 A 344 A 337 A 373 A
253 350
352 A 337 A 348 A
352 B 327 AB 312 AB 376 AB 303 A
338 A 335 A 351 A
354 A 351 A 342 A
Four or more
Knowledge of unsolicited products
LanguagesOnly native Two
High
Mother tongue
Not official language
in home country
Official language in
home country
Numerical skillsLow Medium
Three
Consumer
vulnerability
(complexity)
Very vulnerableSomewhat
vulnerableNot vulnerable
Hardly ever Never
Consumer
vulnerability
(socio-demographic
factors)
Very vulnerableSomewhat
vulnerableNot vulnerable
Internet useDaily Weekly Monthly
Consumer Survey 2018
45
Those who are self-employed white collar workers are more likely to know their rights regarding
unsolicited products than those who are blue collar workers students job seekers and those who are unemployed In addition managers are also more likely to know their rights regarding unsolicited products than unemployed persons
Consumer Survey 2018
46
6 TRUST IN CONSUMER PROTECTION
This chapter discusses trust in consumer protection which refers to consumersrsquo confidence that their rights are respected and protected in the single market Trust in consumer protection is a key component in increasing consumersrsquo willingness to actively engage in the single market especially when it comes to distance purchases
Trust in organisations
The first section focuses on consumer confidence in organisations that are tasked with ensuring consumer rights are respected and protected when the need arises These organisations include public authorities non-governmental consumer organisations (NGOs) as well as retailers and service providers
Average proportion of agreement (ldquoStrongly agreerdquo and ldquoAgreerdquo) with Q332 options 1 2 and 3 - Base all
respondents (N=28037)
32 Q3 How strongly do you agree or disagree with each of the following statements In (our country) hellip -Strongly agree ndashAgree ndash Disagree ndashStrongly disagree ndash DKNA Q31 You trust public authorities to protect your rights as a consumer Q32 In general retailers and service providers respect your rights as a consumer Q33 You trust non-governmental consumer organisations to protect your rights as a consumer
Region
Country
2018
( = sig
diff EU27)
2018-
2016
2016-
2014
2014-
2012
2012-
2011
2011-
2010
2010-
2009
2009-
2008
2008-
2006
EU27_2019 646 -53 +80 +11 -30 +17 +62 -03 -25
EU28 655 -63 +82 +06 -26 +13 +63 -00 -27
North 702 +19 -07 +04 -08 +29 +50 -67 +18
South 625 +38 +30 +05 -10 -36 +85 +21 +11
East 646 +13 +52 +48 -20 +56 +51 +14 -21
West 652 -163 +142 -06 -52 +39 +53 -26 -38
BE 671 -68 -14 +62 -43 +81 +85 -149 -19
BG 514 +26 +48 -52 +45 +90 +55 +89 -
CZ 619 +59 +18 +61 -48 +40 +48 -57 -10
DK 773 +01 +24 +28 -63 +13 +84 -31 +15
DE 664 -163 +189 -08 -88 +26 +78 -54 -24
EE 708 +26 +09 +67 -10 +36 +27 -40 +55
IE 726 -108 +144 -69 +28 -73 +97 +122 -65
EL 507 +45 +09 +24 -33 -01 +26 -14 -73
ES 654 +47 +25 -03 -16 +18 +44 -76 +174
FR 587 -243 +165 -14 -40 +69 +07 +35 -63
HR 514 -03 +29 +09 - - - - -
IT 624 +34 +41 +16 -13 -98 +142 +84 -85
CY 515 +43 +39 -57 -08 -50 +88 -109 -25
LV 570 -06 -03 -53 -28 +66 +122 -88 +118
LT 628 +121 -34 +40 +11 +76 +66 -13 -10
LU 746 -100 +43 -17 +08 +15 +56 +62 -60
HU 838 +11 +65 +112 +15 -20 +85 -60 +37
MT 761 +111 +02 -03 +14 +31 +50 -59 -21
NL 759 +27 -39 +05 +40 +04 +54 -100 -36
AT 743 -88 +77 -09 -35 +18 +67 +40 -10
PL 679 +14 +57 +67 -48 +77 +85 -23 +51
PT 632 +14 +08 -40 +66 +36 -05 +161 -70
RO 591 -22 +73 +37 +04 +61 -09 +122
SI 591 +13 +89 +04 +07 -72 +01 +31 -01
SK 612 +42 +05 -02 +17 +65 +15 -09 +66
FI 798 +24 -30 +33 +01 +45 -25 -65 -03
SE 655 -03 -06 -38 +16 -05 +51 -99 +18
IS 603 +08 +07 +122 -57 - - - -
NO 716 -14 -39 +90 -50 - - - -
UK 718 -135 +92 -28 +06 -28 +76 +30 -34
Trust in organisations
Consumer Survey 2018
47
The overall level of trust in organisations for consumers of the European Union is 646 For the
East and West this level is in line with the EU27_2019 average while it is higher in the North (702) and lower in the South (625)
In this map values above average are coloured in light and dark green and values below average are coloured in light and
dark red
Trust in organisations is highest in Hungary (838) Finland (798) and Denmark (773) The lowest levels of trust in organisations are reported in Greece (507) Bulgaria (514) Croatia
(514) and Cyprus (515)
Between 2016 and 2018 the overall level of trust in organisations decreased in the EU27_2019 (-53pp) and Western Europe (-163pp) while it increased in the South (+38pp) North (+19pp) and
East (+13pp) The highest increase is recorded in Lithuania (+121pp) while the sharpest decrease is recorded in France (-243pp)
The only positive reversal is observed in Lithuania where between 2016 and 2018 this indicator increased by 121pp whereas between 2014 and 2016 it decreased by 34pp The highest negative reversal is observed in France where between 2016 and 2018 trust in organisations decreased by 243pp whereas between 2014 and 2016 it increased by 165pp
Consumer Survey 2018
48
Average proportion of agreement with Q3 options 1 2 and 3 - Base all EU27_2019 respondents (N=24928)
Average proportion of agreement with Q3 options 1 2 and 3 - Base all EU27_2019 respondents (N=24928)
Regarding socio-demographic variables and other characteristics consumersrsquo financial situation33 is
most closely associated with trust in organisations followed by vulnerability due to sociodemographic factors age education and vulnerability due to the complexity of offers and terms and conditions
Consumers that report being in a fairly or very easy financial situation report greater trust than those in a fairly difficult financial situation who in turn say that they have greater trust in organisations than those in a very difficult financial situation
Consumers who are very vulnerable in terms of socio-demographic factors report less trust in
organisations than those who are somewhat vulnerable who in turn have less trust than those who are not vulnerable
Concerning consumersrsquo age people aged 54 or younger tend to have greater trust in organisations than consumers aged 55 or older
Regarding education consumers with a low level of education show higher trust in organisations than those with a medium and high level of education
Finally consumers who are not vulnerable because of the complexity of offers also report greater
trust in organisations than those who are somewhat vulnerable and very vulnerable
33 Based on respondentsrsquo self-reported financial situation
648 A 648 A
669 B 660 B 624 A 621 A
683 645 A 643 A
559 615 672 A 682 A
666 641 A 638 A
446 A 451 A 488 432 A
675 B 645 AB 659 AB 635 AB
GenderMale Female
Trust in organisations
Blue collar
Student
65+
Education levelLow Medium High
Age18-34 35-54 55-64
Very easy
UrbanisationRural area Small town Large town
Financial situationVery difficult Fairly difficult Fairly easy
Unemployed Seeking a job RetiredEmployment status
Self-employed Manager Other white collar
640 AB 658 B 647 AB 629 A
631 A 649 A
628 A 644 A 653 A
661 B 616 A 626 AB 544 A 602 A
596 637 666
615 A 637 A 659
Four or more
Trust in organisations
LanguagesOnly native Two
High
Mother tongue
Not official language
in home country
Official language in
home country
Numerical skillsLow Medium
Three
Consumer
vulnerability
(complexity)
Very vulnerableSomewhat
vulnerableNot vulnerable
Hardly ever Never
Consumer
vulnerability
(socio-demographic
factors)
Very vulnerableSomewhat
vulnerableNot vulnerable
Internet useDaily Weekly Monthly
Consumer Survey 2018
49
The following three subsections separately report on trust in the three types of organisations
surveyed public authorities retailers and service providers and non-governmental organisation (NGOs)
611 Public authorities
Rate of agreement (ldquoStrongly agreerdquo and ldquoAgreerdquo) with Q3 option 1 - Base all respondents (N=28037)
For consumers of the European Union the overall level of trust in public authorities is 618 Compared to the EU27_2019 average this level of trust is higher in the West (638) and North (745) and lower in the East (585) and South (589) Trust in public authorities is highest in Hungary (860) Malta (835) and Finland (829) Among the EU countries the lowest levels of trust in public authorities are found in Croatia (334) Slovenia (484) and Bulgaria (519)
Additionally Iceland also has a low level of this indicator (509)
Region
Country
2018
( = sig
diff EU27)
2018-
2016
2016-
2014
2014-
2012
2012-
2011
2011-
2010
2010-
2009
2009-
2008
2008-
2006
EU27_2019 618 -48 +91 +28 -37 +00 +68 +09 -26
EU28 634 -54 +88 +25 -34 -02 +74 +11 -28
North 745 +30 -18 +25 +23 +24 +61 -92 +46
South 589 +66 +45 -03 -37 -89 +91 +32 +01
East 585 +15 +60 +39 -36 +44 +50 +18 -00
West 638 -172 +155 +45 -45 +41 +61 -01 -48
BE 613 -90 -28 +74 -36 +110 +98 -124 -21
BG 519 +25 +62 -112 +31 +113 +44 +114 -
CZ 579 +79 +51 +74 -28 -73 +61 +01 -23
DK 815 -01 +21 +25 +00 +22 +47 -63 +59
DE 676 -143 +167 +78 -68 +01 +111 -40 -25
EE 733 +43 -37 +164 -32 +34 +41 -32 +53
IE 741 -82 +155 -03 +12 -107 +115 +111 -88
EL 533 +76 -12 +69 -62 -27 +64 -50 -132
ES 590 +69 +69 -49 -43 -17 +53 -93 +152
FR 521 -308 +233 +17 -65 +103 -18 +87 -69
HR 334 -01 +20 +22 - - - - -
IT 590 +67 +35 +23 -38 -174 +147 +123 -71
CY 565 +92 +109 -132 -64 -46 +108 -182 -14
LV 547 +08 -59 -18 -23 +71 +176 -196 +104
LT 559 +145 -36 +75 +01 +22 +115 -119 +31
LU 785 -79 +83 -48 +21 +29 +33 +142 -68
HU 860 +20 +68 +73 +38 -30 +111 -90 +66
MT 835 +133 +21 -22 +14 +07 +77 -34 -68
NL 781 +38 -21 -21 +102 +23 +44 -64 -102
AT 817 -19 +36 +64 -32 +00 +109 -12 -02
PL 593 +10 +75 +68 -67 +74 +87 -22 +49
PT 625 +28 +47 -11 +21 +10 -33 +185 -126
RO 530 -27 +54 +19 -11 +69 -31 +115 -
SI 484 +58 +98 -03 +06 -92 -13 +26 -55
SK 548 +40 -00 +15 -36 +68 +14 -08 +52
FI 829 +37 -53 +15 +65 +34 -28 -49 +28
SE 755 +07 -03 +05 +34 -05 +72 -94 +43
IS 509 +55 +01 +166 -43 - - - -
NO 806 -09 -19 +109 -42 - - - -
UK 742 -100 +68 +02 -06 -32 +119 +33 -40
Trust in pubic authorities
Consumer Survey 2018
50
Compared to 2016 trust in public authorities remained stable in the East while it decreased in the
EU27_2019 (-48pp) and the West (-172pp) and increased in the North (+30pp) and the South (+66pp) The highest increase is found in Lithuania (+145pp) and the most prominent decrease is observed in France (-308pp)
The only positive reversal is observed in Finland where between 2016 and 2018 trust in public authorities increased by 37pp whereas between 2014 and 2016 it decreased by 53pp The greatest negative reversal is found in France As indicated above between 2016 and 2018 trust in public authorities decreased by 308pp following an increase of 233pp between 2014 and 2016
Rate of agreement with Q3 option 1 - Base all EU27_2019 respondents (N=24928)
Rate of agreement with Q3 option 1 - Base all EU27_2019 respondents (N=24928)
In terms of sociodemographic variables and other characteristics consumersrsquo financial situation is most closely associated with trust in public authorities The characteristics showing the next closest links are vulnerability due to socio-demographic factors vulnerability due to the complexity of offers and terms and conditions age and education
Consumers who report their financial situation to be fairly or very easy are more likely to trust public authorities than the remainder of the population In addition those who report their situation to be
fairly difficult are also more likely to trust public authorities than those who report their situation very difficult
Consumers who are very vulnerable in terms of sociodemographic factors are less likely to trust public authorities than those who are somewhat vulnerable who in turn are less likely to trust them than those who are not vulnerable
615 A 626 A
647 B 640 B 575 A 600 AB
652 B 626 AB 605 A
518 580 646 A 677 A
635 A 615 A 612 A
446 A 451 A 488 432 A
670 C 636 BC 651 BC 608 ABC
GenderMale Female
Trust in public authorities
Blue collar
Student
65+
Education levelLow Medium High
Age18-34 35-54 55-64
Very easy
UrbanisationRural area Small town Large town
Financial situationVery difficult Fairly difficult Fairly easy
Unemployed Seeking a job RetiredEmployment status
Self-employed Manager Other white collar
621 A 630 A 605 A 592 A
651 A 619 A
610 A 620 A 623 A
631 B 588 A 632 AB 540 A 597 AB
567 603 645
587 A 591 A 639
Four or more
Trust in public authorities
LanguagesOnly native Two
High
Mother tongue
Not official language
in home country
Official language in
home country
Numerical skillsLow Medium
Three
Consumer
vulnerability
(complexity)
Very vulnerableSomewhat
vulnerableNot vulnerable
Hardly ever Never
Consumer
vulnerability
(socio-demographic
factors)
Very vulnerableSomewhat
vulnerableNot vulnerable
Internet useDaily Weekly Monthly
Consumer Survey 2018
51
In contrast consumers who are not vulnerable in terms of the complexity of offers and terms and
conditions also are more likely to trust public authorities than those who are somewhat vulnerable or very vulnerable
Concerning consumersrsquo age consumers aged 18-54 years are more likely to trust public authorities than consumers who are 55-64 years old while consumers aged 65 years or older are on a par with all other age groups
Finally consumers with a low level of education are also more likely to trust public authorities than those with a high level of education
612 Retailers and service providers
Rate of agreement (ldquoStrongly agreerdquo and ldquoAgreerdquo) with Q3 option 2 - Base all respondents (N=28037)
Region
Country
2018
( = sig
diff EU27)
2018-
2016
2016-
2014
2014-
2012
2012-
2011
2011-
2010
2010-
2009
2009-
2008
2008-
2006
EU27_2019 713 -24 +60 +125 -69 +06 +73 -14 -29
EU28 723 -29 +57 +121 -65 -01 +70 -11 -29
North 774 +10 +19 +125 -83 +20 +68 -48 -16
South 653 +40 +25 +103 -36 -23 +110 -16 +07
East 751 +23 +56 +156 -47 +40 +67 +21 -35
West 725 -99 +93 +124 -104 +13 +51 -32 -35
BE 742 -46 +09 +159 -124 +54 +40 -125 -49
BG 674 +66 +89 +122 -00 +72 +76 +59 -
CZ 774 +27 +09 +340 -126 +20 +87 -63 -34
DK 821 -10 +55 +183 -155 -16 +204 -07 -68
DE 751 -89 +103 +137 -138 +19 +59 -62 -09
EE 815 +29 +36 +87 -06 +40 +32 -71 +47
IE 828 -17 +54 +29 -11 -64 +94 +153 -71
EL 600 -00 +107 +137 -57 -05 +30 +18 -59
ES 695 +32 +11 +138 -89 +41 +50 -109 +166
FR 645 -176 +136 +99 -79 +22 +25 +18 -67
HR 643 -13 +31 +57 - - - - -
IT 638 +53 +32 +91 -10 -89 +177 +41 -100
CY 478 +35 -75 +122 -64 -28 +141 -181 +46
LV 725 -51 +93 +34 -30 +26 +85 +11 +63
LT 746 +110 -51 +119 -04 +140 +20 +74 -77
LU 807 -36 -03 +74 -69 -12 +84 +35 -69
HU 845 +28 +62 +214 -48 -24 +73 -28 -27
MT 736 +147 -32 +157 -66 +56 +34 -125 +52
NL 815 +42 -17 +168 -50 -82 +92 -97 -24
AT 815 -17 +23 +84 -91 +38 +66 +71 -24
PL 757 +11 +61 +126 -56 +44 +103 -14 +54
PT 621 +41 -26 -27 +85 +49 +67 +74 -37
RO 721 +23 +71 +142 -28 +63 +00 +129 -
SI 735 +11 +70 +103 -82 -67 +57 +41 -06
SK 802 +66 +13 +108 -02 +65 +24 +07 +84
FI 816 -09 +03 +108 -78 +37 -23 -109 +04
SE 736 +11 +11 +124 -92 -24 +61 -86 +02
IS 636 -19 -09 +129 -82 - - - -
NO 757 -26 -05 +220 -119 - - - -
UK 796 -63 +30 +90 -32 -57 +53 +20 -22
Trust in retailers and service providers
Consumer Survey 2018
52
In the European Union the overall level of trust in retailers and service providers is 713 Compared
to the EU27_2019 average this level is higher in the West (725) the East (751) and the North (774) whereas it is lower in the South (653) The highest trust in retailers and service providers is found in Hungary (845) Ireland (828) and Denmark (821) The lowest levels of trust in retailers and service providers are found in Cyprus (478) Greece (600) and Portugal (621)
Between 2016 and 2018 trust in retailers and service providers decreased in the EU27_2019 (-24pp) and Western Europe (-99pp) while it remained stable in the North and increased in the East (+23pp) and South (+40pp) Compared to the previous survey this type of trust increased most
prominently in Malta (+147pp) and decreased most sharply in France (-176pp)
The only positive reversal is observed in Lithuania Between 2016 and 2018 trust in retailers and service providers in Lithuania increased by 110pp whereas between 2014 and 2016 it decreased by 51pp The largest negative reversal is observed in France where between 2016 and 2018 trust in retailers and service providers decreased by 176pp whereas between 2014 and 2016 it increased by 136pp
Rate of agreement with Q3 option 2 - Base all EU27_2019 respondents (N=24928)
Rate of agreement with Q3 option 2 - Base all EU27_2019 respondents (N=24928)
The findings for the socio-demographic variables show that trust in retailers and service providers is associated most closely with consumersrsquo financial situation followed by age vulnerability due to sociodemographic variables vulnerability due to the complexity of offers and terms and conditions and consumersrsquo degree of urbanisation
Consumers who report their financial situation to be fairly easy and very easy are more likely to trust retailers and service providers than those who report their situation to be fairly or very difficult
711 A 716 A
749 B 734 B 687 A 668 A
744 B 715 AB 701 A
640 A 680 A 736 B 760 B
737 704 A 701 A
446 A 451 A 488 432 A
763 B 692 A 703 AB 698 A
GenderMale Female
Trust in retailers and service providers
Blue collar
Student
65+
Education levelLow Medium High
Age18-34 35-54 55-64
Very easy
UrbanisationRural area Small town Large town
Financial situationVery difficult Fairly difficult Fairly easy
Unemployed Seeking a job RetiredEmployment status
Self-employed Manager Other white collar
694 A 727 B 729 B 714 AB
685 A 715 A
703 A 711 A 717 A
728 B 697 AB 702 AB 614 A 660 A
669 A 702 A 734
673 A 698 A 729
Four or more
Trust in retailers and service providers
LanguagesOnly native Two
High
Mother tongue
Not official language
in home country
Official language in
home country
Numerical skillsLow Medium
Three
Consumer
vulnerability
(complexity)
Very vulnerableSomewhat
vulnerableNot vulnerable
Hardly ever Never
Consumer
vulnerability
(socio-demographic
factors)
Very vulnerableSomewhat
vulnerableNot vulnerable
Internet useDaily Weekly Monthly
Consumer Survey 2018
53
Consumers who are not vulnerable in terms of socio-demographic factors are more likely to trust
retailers and service providers than those who are very or somewhat vulnerable
Consumers younger than 54 years are also more likely to trust in retailers and service providers than consumers aged 55 or older
Regarding the association between trust and vulnerability due to offers and terms and conditions consumers who are not vulnerable are more likely to trust in retailers and service providers than those who are very or somewhat vulnerable
Finally consumers that live in a rural area are more likely to trust organisations than those living in
small or large towns
Consumer Survey 2018
54
613 NGOs
Rate of agreement (ldquoStrongly agreerdquo and ldquoAgreerdquo) with Q3 option 3 - Base all respondents (N=28037)
In the European Union the overall level of trust in non-governmental consumer organisations (NGOs) is 607 In the East this level is in line with the EU27_2019 average while it is higher in the South (634) and lower in the North (588) and West (593) The highest trust in NGOs is observed for individuals residing in Hungary (810) Finland (751) and Malta (712) The lowest levels
of trust in NGOs are found in Bulgaria (348) Greece (388) and Latvia (439)
Between 2016 and 2018 trust in NGOs remained stable in the North South and East while it decreased in the EU27_2019 (-88pp) and the West (-217pp) Compared to the previous survey
Region
Country
2018
( = sig
diff EU27)
2018-
2016
2016-
2014
2014-
2012
2012-
2011
2011-
2010
2010-
2009
2009-
2008
2008-
2006
EU27_2019 607 -88 +89 -122 +17 +46 +44 -05 -21
EU28 608 -107 +100 -129 +21 +42 +46 -00 -24
North 588 +16 -22 -139 +36 +45 +20 -62 +23
South 634 +09 +19 -85 +44 +04 +53 +48 +25
East 603 +01 +41 -52 +23 +84 +37 +04 -29
West 593 -217 +179 -187 -06 +63 +46 -46 -33
BE 657 -68 -24 -48 +31 +78 +119 -199 +12
BG 348 -13 -09 -166 +104 +85 +45 +93 -
CZ 505 +72 -07 -233 +10 +173 -05 -109 +27
DK 683 +13 -04 -123 -35 +31 +01 -24 +53
DE 564 -256 +298 -238 -57 +57 +64 -60 -37
EE 575 +06 +28 -50 +09 +35 +10 -17 +64
IE 609 -225 +224 -232 +81 -49 +82 +101 -35
EL 388 +58 -69 -134 +21 +30 -17 -09 -28
ES 677 +39 -07 -98 +83 +31 +30 -25 +202
FR 595 -246 +126 -159 +23 +82 +13 +01 -53
HR 565 +07 +35 -53 - - - - -
IT 643 -17 +56 -67 +09 -30 +103 +87 -85
CY 503 +01 +82 -161 +103 -76 +14 +36 -107
LV 439 +24 -44 -176 -31 +101 +105 -79 +186
LT 580 +108 -16 -74 +35 +68 +62 +07 +16
LU 648 -184 +47 -78 +72 +29 +52 +08 -42
HU 810 -15 +66 +51 +56 -06 +71 -60 +73
MT 712 +54 +18 -142 +93 +30 +41 -19 -47
NL 682 +02 -79 -133 +69 +71 +25 -139 +17
AT 599 -227 +173 -174 +18 +16 +26 +62 -03
PL 688 +20 +34 +07 -22 +112 +65 -34 +49
PT 651 -28 +03 -82 +91 +50 -47 +225 -48
RO 523 -63 +93 -50 +51 +50 +04 +122 -
SI 554 -31 +97 -89 +97 -56 -40 +27 +58
SK 486 +18 +04 -128 +89 +61 +06 -26 +63
FI 751 +45 -39 -24 +14 +63 -24 -36 -42
SE 476 -28 -27 -242 +107 +15 +20 -116 +09
IS 664 -13 +30 +70 -47 - - - -
NO 584 -07 -94 -60 +11 - - - -
UK 615 -241 +179 -177 +54 +06 +55 +37 -41
Trust in NGOs
Consumer Survey 2018
55
this type of trust increased most sharply in Lithuania (+108pp) whereas it decreased most
prominently in Germany (-256pp)
The only positive reversal is observed in Greece where between 2016 and 2018 trust in NGOs increased by 58pp whereas between 2014 and 2016 it decreased by 69pp Conversely the largest negative reversal is found in Germany where between 2016 and 2018 this indicator decreased by 256pp following an increase of 298pp between 2014 and 2016
Rate of agreement with Q3 option 3 - Base all EU27_2019 respondents (N=24928)
Rate of agreement with Q3 option 3 - Base all EU27_2019 respondents (N=24928)
With regard to socio-demographic variables and other characteristics higher trust in NGOs is most closely association with vulnerability in terms of socio-demographic factors followed by numerical skills
Regarding consumers who are very vulnerable in terms of socio-demographic factors a higher proportion reports trust in NGOs compared to the remainder of the population
In addition those who have a high numerical skill level are more likely to trust in NGOs than those with low numerical skills Consumers who have a medium level of numerical skills fall somewhere in
between
617 A 603 A
620 A 607 A 611 A 600 A
642 B 594 A 619 AB
542 A 587 AB 637 C 613 BC
625 A 603 A 602 A
446 A 451 A 488 432 A
606 A 607 A 620 A 603 A
GenderMale Female
Trust in NGOs
Blue collar
Student
65+
Education levelLow Medium High
Age18-34 35-54 55-64
Very easy
UrbanisationRural area Small town Large town
Financial situationVery difficult Fairly difficult Fairly easy
Unemployed Seeking a job RetiredEmployment status
Self-employed Manager Other white collar
605 AB 619 B 607 AB 576 A
556 A 612 A
572 A 601 AB 620 B
625 B 569 A 549 AB 507 A 571 A
566 604 A 624 A
596 A 624 A 610 A
Four or more
Trust in NGOs
LanguagesOnly native Two
High
Mother tongue
Not official language
in home country
Official language in
home country
Numerical skillsLow Medium
Three
Consumer
vulnerability
(complexity)
Very vulnerableSomewhat
vulnerableNot vulnerable
Hardly ever Never
Consumer
vulnerability
(socio-demographic
factors)
Very vulnerableSomewhat
vulnerableNot vulnerable
Internet useDaily Weekly Monthly
Consumer Survey 2018
56
Trust in redress mechanisms
This section focuses on consumersrsquo level of trust in redress mechanisms (out-of-court mechanisms and courts) which is relevant as it can affect their willingness to actively use these mechanisms when facing problems with online andor offline purchases
Average proportion of agreement (ldquoStrongly agreerdquo and ldquoAgreerdquo) with Q334 options Q34 and Q35 - Base all
respondents (N=28037)
34 Q3 How strongly do you agree or disagree with each of the following statements In (our country) hellip -Strongly agree ndashAgree ndash Disagree ndashStrongly disagree ndash DKNA
Q34 It is easy to settle disputes with retailers and service providers through an out-of-court body (ie arbitration mediation or conciliation body) Q35 It is easy to settle disputes with retailers and service providers through the courts
Region
Country
2018
( = sig
diff EU27)
2018-
2016
2016-
2014
2014-
2012
2012-
2011
2011-
2010
2010-
2009
2009-
2008
2008-
2006
EU27_2019 369 -72 +55 +13 -46 +53 +95 -42 -30
EU28 379 -84 +65 +10 -48 +43 +103 -43 -31
North 381 +38 -20 -11 +07 +81 +73 -130 -15
South 378 +43 -20 +54 -44 +06 +115 -42 -08
East 359 -09 -05 +07 +15 +67 +26 +21 +29
West 367 -202 +149 -11 -88 +82 +119 -66 -59
BE 310 -16 -131 -16 -10 +138 +106 -214 -11
BG 279 +04 +01 -53 +60 +87 +54 +35 -
CZ 418 +74 +19 +06 +05 +78 -52 +71 -25
DK 523 +73 +23 +18 -48 +129 +80 -213 +101
DE 381 -215 +230 -38 -99 +55 +152 -84 -80
EE 254 -31 +28 +95 -16 -18 +03 -53 +22
IE 487 -105 +68 +27 -27 -48 +127 +128 -89
EL 432 +53 -45 +23 -19 +15 +63 -104 -36
ES 393 +35 -09 +18 -26 +69 +102 -51 +89
FR 306 -311 +163 +12 -110 +124 +83 -21 -42
HR 302 +02 -00 +22 - - - - -
IT 373 +66 -34 +103 -73 -63 +155 -44 -59
CY 339 +26 -42 -112 +24 +38 +41 -05 -165
LV 311 +46 -61 -72 +02 +219 +14 -89 +69
LT 408 +164 -27 -49 -09 +85 +79 -24 -18
LU 373 -183 -02 +44 -54 +145 +14 +82 -29
HU 383 +127 -140 +14 +15 +73 -02 +13 +13
MT 447 +65 -00 +30 +40 +62 +28 +02 -49
NL 470 +76 -84 +15 -28 +78 +95 -157 -19
AT 480 -93 +129 +24 -91 +51 +112 +39 -80
PL 320 -22 -13 +30 +03 +23 +66 -32 +69
PT 277 -64 +39 -44 +24 +114 +10 +61 -85
RO 460 -100 +77 -27 +23 +137 +01 +99 -
SI 416 -12 +213 -86 +98 -27 -15 -52 +86
SK 251 -20 -135 +74 +64 +77 +23 +21 -05
FI 456 +14 -78 +23 +19 +82 +94 -37 -89
SE 282 -00 -08 -37 +42 +29 +81 -190 -59
IS 287 -46 -51 +12 -33 - - - -
NO 429 -05 -83 +82 -52 - - - -
UK 446 -169 +133 -05 -65 -41 +167 -42 -27
Trust in redress mechanisms
Consumer Survey 2018
57
In the European Union the overall level of trust in redress mechanisms is 369 In the South and
West this level is in line with the EU27_2019 average while it is higher in the North (381) and lower in the East (359)
In this map values above average are coloured in light and dark green and values below average are coloured
in light and dark red
The highest trust in redress mechanisms is found in Denmark (523) Ireland (487) and Austria (480) The lowest levels of trust in redress mechanisms are found in Slovakia (251) Estonia
(254) and Portugal (277)
Between 2016 and 2018 trust in redress mechanisms decreased in the EU27_2019 (-72pp) and the West (-202pp) while it remained stable in the East and increased in the North (+38pp) and South
(+43pp) Compared to the 2016 survey this type of trust increased most prominently in Lithuania (+164pp) and decreased most prominently in France (-311pp)
The largest positive reversal is observed in Hungary where between 2016 and 2018 trust in redress mechanisms increased by 127pp whereas between 2014 and 2016 it decreased by 140pp The largest negative reversal is observed in France where the decrease in trust between 2016 and 2018 (-311pp see above) follows a 163pp increase observed between 2014 and 2016
Consumer Survey 2018
58
Average proportion of agreement (ldquoStrongly agreerdquo and ldquoAgreerdquo) with Q3 options 1 2 and 3 - Base all
EU27_2019 respondents (N=24928)
Average proportion of agreement (ldquoStrongly agreerdquo and ldquoAgreerdquo) with Q3 options 1 2 and 3 - Base all
EU27_2019 respondents (N=24928)
Consumer trust in redress mechanisms is associated most closely with age followed by gender education consumersrsquo financial situation vulnerability of consumers in terms of complexity of offers and terms and conditions and consumersrsquo employment status
Consumers aged 54 years or younger show a higher trust in redress mechanisms than older consumers (aged 55 or older)
Regarding consumersrsquo gender males tend to report greater trust than females on this indicator
Consumers with a low level of education show a higher level of trust in redress mechanisms than
those with a high level of education
Additionally consumers that indicate being in a very difficult financial situation show a lower trust in redress mechanisms than all other consumers In addition consumers in a fairly difficult situation also report lower trust than consumers in a fairly easy financial situation
Finally consumers who are very vulnerable and somewhat vulnerable in such terms show lower trust in redress mechanisms than those who are not vulnerable
The following two sections focus on the findings of two specific redress mechanisms the ADR
(Alternative Dispute Resolution) and courts
391 349
412 381 339 A 324 A
400 A 386 A 342
319 360 A 383 B 388 AB
373 A 366 A 370 A
446 A 451 A 488 432 A
381 AB 395 B 382 AB 367 AB
GenderMale Female
Trust in redress mechanisms
Blue collar
Student
65+
Education levelLow Medium High
Age18-34 35-54 55-64
Very easy
UrbanisationRural area Small town Large town
Financial situationVery difficult Fairly difficult Fairly easy
Unemployed Seeking a job RetiredEmployment status
Self-employed Manager Other white collar
371 A 370 A 368 A 360 A
361 A 370 A
375 A 379 A 364 A
377 B 354 AB 334 AB 299 A 352 AB
381 A 369 A 368 A
351 A 350 A 381
Four or more
Trust in redress mechanisms
LanguagesOnly native Two
High
Mother tongue
Not official language
in home country
Official language in
home country
Numerical skillsLow Medium
Three
Consumer
vulnerability
(complexity)
Very vulnerableSomewhat
vulnerableNot vulnerable
Hardly ever Never
Consumer
vulnerability
(socio-demographic
factors)
Very vulnerableSomewhat
vulnerableNot vulnerable
Internet useDaily Weekly Monthly
Consumer Survey 2018
59
621 ADR
Rate of agreement (ldquoStrongly agreerdquo and ldquoAgreerdquo) with Q3 option 4 - Base all respondents (N=28037)
In the European Union the overall level of trust in ADR is 422 In the South East and West this type of trust is in line with the EU27_2019 average while it is higher in the North (462) The highest levels of trust in ADR are found in Malta (617) Finland (589) and Denmark (542) Among the EU countries the lowest levels of trust in ADR are found in Slovenia (289) Bulgaria (297) and Estonia (327) Furthermore Iceland reported the lowest levels of trust in ADR
(263)
Between 2016 and 2018 trust in ADR remained stable in the East while it decreased in the EU27_2019 (-69pp) and the West (-207pp) but increased in the North (+45pp) and South (+55pp) Compared to the previous survey in 2016 this type of trust increased most sharply in Lithuania (+225pp) and decreased most prominently in France (-287pp)
Region
Country
2018
( = sig
diff EU27)
2018-
2016
2016-
2014
2014-
2012
2012-
2011
2011-
2010
2010-
2009
2009-
2008
2008-
2006
EU27_2019 422 -69 +55 +23 -68 +44 +102 -14 -42
EU28 430 -84 +67 +21 -78 +37 +104 -11 -39
North 462 +45 -10 -11 -03 +85 +59 -101 -26
South 436 +55 -27 +78 -84 +16 +119 +19 -26
East 418 -03 -14 +11 +06 +39 +49 +38 +12
West 409 -207 +158 -05 -108 +65 +124 -57 -66
BE 361 -10 -111 -15 -23 +130 +116 -216 -33
BG 297 +09 +18 -55 +68 +65 +66 +45 -
CZ 491 +97 +18 +40 -07 +72 -48 +74 -54
DK 542 +79 +21 +45 -106 +140 +53 -152 +87
DE 402 -248 +266 -66 -112 +50 +148 -57 -100
EE 327 -49 +33 +126 -30 -02 -33 -23 +29
IE 541 -99 +67 +21 -70 -61 +162 +163 -130
EL 476 +41 -01 +35 -64 -05 +61 -15 -30
ES 458 +51 -20 +38 -50 +68 +103 -13 +119
FR 373 -287 +144 +59 -139 +90 +87 -25 -31
HR 366 -23 +28 +47 - - - - -
IT 430 +81 -46 +139 -128 -38 +163 +29 -122
CY 374 +30 -51 -110 -53 -59 +92 +21 -113
LV 359 +20 -21 -78 -04 +235 +17 -92 +92
LT 475 +225 -66 -63 -17 +82 +92 +03 -29
LU 376 -231 +18 +58 -121 +157 -13 +44 +22
HU 453 +144 -192 +33 -40 +14 +60 +59 -28
MT 617 +126 +08 +48 +14 +96 +11 +24 -44
NL 514 +81 -119 +52 -53 +64 +118 -181 -12
AT 521 -90 +142 -07 -96 +23 +155 +36 -79
PL 397 -11 -09 +15 +12 -22 +101 -26 +75
PT 335 -61 +25 -55 +08 +129 -02 +131 -84
RO 493 -113 +70 -20 -02 +131 +07 +129 -
SI 289 -57 +53 -48 +31 -05 -53 -28 +117
SK 328 +03 -184 +95 +103 +66 +33 +41 +00
FI 589 +09 -46 -63 +76 +74 +79 +00 -112
SE 379 +07 +07 -01 +19 +32 +63 -173 -71
IS 263 -35 -76 -63 -61 - - - -
NO 470 -02 -82 +87 -88 - - - -
UK 489 -183 +155 +04 -140 -22 +120 +23 -18
Trust in ADR
Consumer Survey 2018
60
The largest positive reversal is observed in Hungary where between 2016 and 2018 trust in ADR
increased by 144pp whereas between 2014 and 2016 it decreased by 192pp The largest negative change is observed in Germany Between 2016 and 2018 trust in ADR decreased by 248pp following an increase of 266pp between 2014 and 2016
Rate of agreement with Q3 option 4 - Base all EU27_2019 respondents (N=24928)
Rate of agreement with Q3 option 4 - Base all EU27_2019 respondents (N=24928)
The socio-demographic findings show that trust in ADR is associated most closely with consumersrsquo age followed by gender and self-reported financial situation
As far as consumersrsquo age is concerned consumers aged 18-34 years are more likely to trust in ADR
than the remainder of the population In addition those aged 35-54 years are also more likely to trust ADR than those aged 55-64 years while consumers aged 65 years and older have the (relatively) same level of trust as those who are between 35 and 64 years
Regarding gender males tend to be more likely to trust ADR than females
Finally consumers who report their financial situation to be very difficult are less likely to trust ADR than other consumers
441 405
481 421 B 384 A 390 AB
437 AB 440 B 398 A
366 421 A 434 A 437 A
432 A 417 A 421 A
446 A 451 A 488 432 A
430 A 433 A 421 A 413 A
GenderMale Female
Trust in ADR
Blue collar
Student
65+
Education levelLow Medium High
Age18-34 35-54 55-64
Very easy
UrbanisationRural area Small town Large town
Financial situationVery difficult Fairly difficult Fairly easy
Unemployed Seeking a job RetiredEmployment status
Self-employed Manager Other white collar
424 A 426 A 414 A 410 A
407 A 424 A
408 A 434 A 419 A
435 B 385 A 376 AB 325 A 393 AB
432 A 423 A 421 A
417 A 407 A 431 A
Four or more
Trust in ADR
LanguagesOnly native Two
High
Mother tongue
Not official language
in home country
Official language in
home country
Numerical skillsLow Medium
Three
Consumer
vulnerability
(complexity)
Very vulnerableSomewhat
vulnerableNot vulnerable
Hardly ever Never
Consumer
vulnerability
(socio-demographic
factors)
Very vulnerableSomewhat
vulnerableNot vulnerable
Internet useDaily Weekly Monthly
Consumer Survey 2018
61
622 Courts
Rate of agreement (ldquoStrongly agreerdquo and ldquoAgreerdquo) with Q3 option 5 - Base all respondents (N=28037)
In the European Union the overall level of trust in courts is 316 In the South and West this level is in line with the EU27_2019 average while it is lower in the East (301) and North (301) The highest trust in courts is found in Slovenia (542) Denmark (503) and Austria (439) The lowest levels of trust in courts are found in Slovakia (174) Estonia (181) and Sweden (185)
Trust in courts decreased between 2016 and 2018 in the EU27_2019 (-75pp) East (-14pp) and
West (-196pp) while it increased in the North (+31pp) and South (+31pp) Compared to the previous survey trust increased most substantially in Hungary (+111pp) and decreased most prominently in France (-335pp)
Region
Country
2018
( = sig
diff EU27)
2018-
2016
2016-
2014
2014-
2012
2012-
2011
2011-
2010
2010-
2009
2009-
2008
2008-
2006
EU27_2019 316 -75 +55 +02 -23 +63 +88 -69 -19
EU28 327 -85 +62 -00 -19 +49 +103 -75 -22
North 301 +31 -30 -11 +17 +77 +87 -159 -03
South 319 +31 -13 +29 -04 -05 +112 -103 +09
East 301 -14 +04 +03 +23 +96 +03 +05 +45
West 325 -196 +141 -16 -68 +99 +114 -75 -52
BE 259 -21 -150 -18 +02 +146 +97 -212 +12
BG 261 -00 -16 -52 +51 +109 +42 +26 -
CZ 345 +51 +19 -27 +18 +84 -56 +67 +04
DK 503 +67 +25 -08 +09 +118 +107 -273 +116
DE 360 -181 +194 -11 -86 +60 +156 -110 -61
EE 181 -14 +22 +65 -02 -35 +39 -83 +16
IE 434 -110 +70 +33 +16 -36 +92 +93 -49
EL 389 +66 -90 +11 +26 +34 +66 -193 -42
ES 329 +19 +03 -02 -03 +70 +100 -89 +59
FR 239 -335 +183 -36 -80 +159 +80 -16 -52
HR 239 +28 -28 -03 - - - - -
IT 316 +51 -22 +66 -18 -88 +147 -117 +04
CY 303 +22 -34 -115 +100 +134 -10 -30 -216
LV 262 +72 -100 -66 +09 +203 +11 -85 +46
LT 341 +103 +13 -35 -01 +87 +65 -52 -07
LU 371 -134 -22 +30 +13 +132 +42 +120 -79
HU 312 +111 -87 -06 +71 +132 -65 -33 +54
MT 276 +03 -08 +12 +67 +27 +45 -20 -53
NL 425 +70 -49 -22 -02 +93 +72 -133 -27
AT 439 -95 +117 +54 -85 +79 +69 +41 -80
PL 242 -33 -18 +45 -06 +68 +31 -38 +63
PT 219 -67 +53 -33 +41 +100 +22 -08 -87
RO 426 -88 +83 -33 +48 +143 -05 +70 -
SI 542 +33 +373 -125 +165 -48 +23 -76 +55
SK 174 -43 -86 +53 +25 +88 +14 +02 -10
FI 323 +18 -110 +110 -39 +90 +109 -75 -65
SE 185 -07 -23 -73 +64 +27 +98 -206 -47
IS 311 -57 -27 +87 -06 - - - -
NO 387 -07 -84 +77 -17 - - - -
UK 403 -155 +111 -15 +09 -59 +215 -108 -37
Trust in courts
Consumer Survey 2018
62
These prominent changes in Hungary and France are particularly interesting as they are connected
to noticeable reversals In Hungary the increase between 2016 and 2018 (+111pp) follows a strong decrease of 87pp between 2014 and 2016 In France the decrease of 335pp between 2016 and 2018 comes after a strong increase of 183pp between 2014 and 2016
Rate of agreement with Q3 option 5 - Base all EU27_2019 respondents (N=24928)
Rate of agreement with Q3 option 5 - Base all EU27_2019 respondents (N=24928)
The results of the socio-demographic analysis show that consumersrsquo trust in courts is associated most closely with gender followed by age education the self-reported financial situation of consumers and vulnerability of consumers in terms of complexity of offers and terms and conditions
In terms of gender males are more likely to trust courts than females
Trust in courts also tends to be more common for consumers aged 54 years or younger than for consumers aged 55 years or older
In addition consumers with a low or medium level of education are also more likely to trust courts than those with a high level of education
Consumers who report their financial situation to be fairly or very easy are more likely to trust courts than those in a fairly or very difficult situation
Finally consumers who are very or somewhat vulnerable in terms of complexity of offers and terms and conditions are less likely to trust in courts than those who are not vulnerable
342 293
345 B 341 B 295 A 260 A
362 A 333 A 285
271 A 300 A 331 B 338 B
315 A 315 A 320 A
446 A 451 A 488 432 A
335 AB 355 B 342 AB 321 AB
GenderMale Female
Trust in courts
Blue collar
Student
65+
Education levelLow Medium High
Age18-34 35-54 55-64
Very easy
UrbanisationRural area Small town Large town
Financial situationVery difficult Fairly difficult Fairly easy
Unemployed Seeking a job RetiredEmployment status
Self-employed Manager Other white collar
317 A 315 A 323 A 310 A
314 A 317 A
342 A 323 A 309 A
318 A 324 A 294 A 275 A 312 A
329 A 315 A 315 A
286 A 293 A 332
Four or more
Trust in courts
LanguagesOnly native Two
High
Mother tongue
Not official language
in home country
Official language in
home country
Numerical skillsLow Medium
Three
Consumer
vulnerability
(complexity)
Very vulnerableSomewhat
vulnerableNot vulnerable
Hardly ever Never
Consumer
vulnerability
(socio-demographic
factors)
Very vulnerableSomewhat
vulnerableNot vulnerable
Internet useDaily Weekly Monthly
Consumer Survey 2018
63
7 TRUST IN PRODUCT SAFETY
This chapter discusses consumersrsquo perceptions of and trust in product safety which is considered a key driver of consumer confidence
Average proportion of agreement (ldquoStrongly agreerdquo and ldquoAgreerdquo) with Q414 options 1and 2 - Base all
respondents (N=28037)
14 Q4 Thinking about all non-food products currently on the market in (our country) do you think that How strongly do you agree or disagree with each of the following statements In (our country) hellip
1 Essentially all non-food products are safe 2 A small number of non-food products are unsafe
Region
Country
2018
( = sig
diff EU27)
2018-
2016
2016-
2014
2014-
2012
2012-
2011
2011-
2010
2010-
2009
2009-
2008
EU27_2019 679 -73 +93 +15 -02 -21 +79 -28
EU28 697 -79 +94 +12 -06 -14 +68 -28
North 755 +36 -07 +25 -24 +45 +05 -79
South 641 +59 +07 -31 +08 -67 +110 -22
East 696 -05 +57 +16 +11 +09 +114 -103
West 687 -216 +185 +49 -13 -11 +50 +12
BE 666 -81 -56 +69 +20 +43 +47 -188
BG 545 +15 +18 -169 +68 +98 +114 -88
CZ 809 +17 +07 +43 -15 +11 +131 -137
DK 764 +01 +15 +07 -23 +121 -15 -91
DE 741 -182 +194 +89 -25 -51 +94 +32
EE 716 +09 -58 +116 +25 +19 -46 -68
IE 828 -106 +127 -28 -27 +04 +39 +119
EL 566 +35 +02 +108 -39 -77 +91 -79
ES 696 +104 -42 -39 +44 -73 +90 -86
FR 569 -362 +286 +21 -19 +21 -20 -36
HR 672 +48 +17 -02 - - - -
IT 617 +39 +43 -47 -22 -62 +131 +44
CY 497 -34 -57 +32 +09 -67 +83 -67
LV 701 +55 +07 -18 +48 +19 +79 -106
LT 762 +125 -24 +66 +59 +101 +18 -155
LU 813 -75 +85 +09 +84 -141 +43 +05
HU 787 +01 +44 +12 +35 -13 +19 +17
MT 647 +35 -57 -61 -02 +20 +130 -193
NL 819 +31 -30 -43 +25 +57 +83 +143
AT 727 -173 +113 +61 +18 -85 +82 +117
PL 764 -20 +80 +57 +04 -22 +164 -190
PT 622 +07 +17 -46 +77 -84 +98 -23
RO 510 -45 +66 +31 +07 +79 +71 -35
SI 691 +92 +06 -103 +42 -74 +43 -108
SK 724 +69 +84 -62 +13 -122 +95 +49
FI 845 +36 -83 -05 -02 -24 +24 -42
SE 714 +28 +33 +36 -85 +16 -11 -48
IS 743 +53 +01 +34 +27 - - -
NO 839 -02 +16 +10 +01 - - -
UK 819 -123 +106 -10 -33 +28 -10 -11
Trust in product safety
Consumer Survey 2018
64
In the European Union the level of trust in product safety is 679 In the West this level of trust
is in line with the EU27_2019 average while it is lower in the South (641) and higher in the East (696) and North (755)
In this map values above average are coloured in light and dark green and values below average are coloured
in light and dark red
Among EU countries the highest amount of trust in product safety is found in Finland (845) Ireland (828) and the Netherlands (819) The lowest levels of trust in product safety are found
in Cyprus (497) Romania (510) and Bulgaria (545)
Between 2016 and 2018 trust in product safety remained stable in the East while it decreased in the EU27_2019 (-73pp) and the West (-216pp) and increased in the North (+36pp) and South
(+59pp) Compared to the previous survey trust in product safety increased most substantially in Lithuania (+125pp) and decreased most prominently in France (-362pp)
When looking at statistically significant changes in 2018 (vs 2016) and in 2016 (vs 2014) the only positive reversal is found in Finland where between 2016 and 2018 this indicator increased by 36pp whereas between 2014 and 2016 it decreased by 83pp The largest negative reversal is found in
Consumer Survey 2018
65
France where between 2016 and 2018 this indicator decreased by 362pp following an increase of
286pp between 2014 and 2016
Average proportion of agreement with Q4 options 1 and 2 - Base all EU27_2019 respondents (N=24928)
Average proportion of agreement with Q4 options 1 and 2 - Base all EU27_2019 respondents (N=24928)
In terms of socio-demographic variables having trust in product safety is most closely associated with gender followed by internet use consumersrsquo financial situation vulnerability due to socio-demographic factors and numerical skills
Concerning consumersrsquo gender males are more likely to trust in product safety than females
Moreover consumers who use the internet more frequently (ie daily and weekly) have greater
trust in product safety than those who use the internet hardly ever or never Also people that use the internet monthly show greater trust in product safety than those who never use the internet
Consumers who report their financial situation to be fairly or very easy are more likely trust in product
safety is higher than among those who report their situation to be fairly or very difficult
Regarding vulnerability due to socio-demographic factors consumers who are very vulnerable are less likely to trust product safety compared to those who are not or somewhat vulnerable
Finally consumers with high numerical skill levels are more likely to trust in product safety than
those with low and medium numerical skills
710 657
667 A 689 A 684 A 686 A
667 A 679 A 691 A
633 A 661 A 700 B 706 B
685 A 676 A 688 A
446 A 451 A 488 432 A
704 A 683 A 646 A 671 A
GenderMale Female
Trust in product safety
Blue collar
Student
65+
Education levelLow Medium High
Age18-34 35-54 55-64
Very easy
UrbanisationRural area Small town Large town
Financial situationVery difficult Fairly difficult Fairly easy
Unemployed Seeking a job RetiredEmployment status
Self-employed Manager Other white collar
675 A 688 A 680 A 695 A
662 A 683 A
658 A 667 A 695
695 C 688 C 702 BC 595 AB 611 A
632 686 A 696 A
642 A 674 AB 695 B
Four or more
Trust in product safety
LanguagesOnly native Two
High
Mother tongue
Not official language
in home country
Official language in
home country
Numerical skillsLow Medium
Three
Consumer
vulnerability
(complexity)
Very vulnerableSomewhat
vulnerableNot vulnerable
Hardly ever Never
Consumer
vulnerability
(socio-demographic
factors)
Very vulnerableSomewhat
vulnerableNot vulnerable
Internet useDaily Weekly Monthly
Consumer Survey 2018
66
8 TRUST IN ENVIRONMENTAL CLAIMS
This chapter discusses results from the consumer survey when it comes to consumer trust in environmental claims It is broken down into two parts focusing on the perceived reliability of environmental claims and on their perceived impact on consumersrsquo purchasing decisions
Reliability of environmental claims
Average proportion of agreement (ldquoStrongly agreerdquo and ldquoAgreerdquo) with Q335 option 6 - Base all respondents
(N=28037)
35 Q3 How strongly do you agree or disagree with each of the following statements In (our country) hellip -Strongly agree ndashAgree ndash Disagree ndashStrongly disagree ndash DKNA Q36 Most environmental claims about goods or services are reliable
Region
Country
2018
( = sig
diff EU27)
2018-
2016
2016-
2014
EU27_2019 542 -91 +121
EU28 553 -102 +122
North 636 +46 +04
South 551 +46 +14
East 614 +22 +54
West 485 -264 +247
BE 494 -28 -88
BG 533 +74 +31
CZ 551 +53 +29
DK 807 +56 +29
DE 454 -334 +377
EE 620 -02 +25
IE 655 -132 +104
EL 530 +49 +39
ES 562 +27 +04
FR 471 -324 +223
HR 401 +39 -36
IT 544 +70 +22
CY 501 +79 -88
LV 596 -64 +75
LT 652 +143 -42
LU 639 -142 +36
HU 780 +02 +129
MT 622 +115 -72
NL 553 +65 -25
AT 655 -163 +209
PL 682 +40 +44
PT 569 -25 -06
RO 547 -32 +89
SI 494 +10 -09
SK 521 -12 +18
FI 643 +69 -61
SE 538 +26 +22
IS 448 +08 -59
NO 604 -24 +08
UK 631 -180 +130
Trust in environmental claims
Consumer Survey 2018
67
In the European Union the overall level of trust in the reliability of environmental claims is 542
In the South this level is in line with the EU27_2019 average while it is lower in the West (485) and higher in the East (614) and North (636)
In this map values above average are coloured in light and dark green and values below average are coloured
in light and dark red
The highest levels of trust in environmental claims are found in Denmark (807) Hungary (780) and Poland (682) whereas the lowest levels are found in Croatia (401) Germany (454) and
France (471) Furthermore Iceland reported low levels of trust (448)
Between 2016 and 2018 trust in the reliability of environmental claims decreased in the EU27_2019 (-91pp) and the West (-264pp) while it increased in the East (+22pp) North (+46pp) and South (+46pp) Compared to the survey in 2016 this type of trust increased most prominently in Lithuania (+143pp) and decreased most prominently in Germany (-334pp)
When looking at statistically significant changes in 2018 (vs 2016) and in 2016 (vs 2014) the largest positive reversal is found in Malta where between 2016 and 2018 this indicator increased by 115pp whereas between 2014 and 2016 it decreased by 72pp Related to the strongest decrease
Consumer Survey 2018
68
in 2018 (see above) the largest negative reversal is found in Germany where the strong decrease
in 2018 was preceded by an increase of 377pp between 2014 and 2016
Average proportion of agreement (ldquoStrongly agreerdquo and ldquoAgreerdquo) with Q3 option 6 - Base all EU27_2019
respondents (N=24928)
Average proportion of agreement (ldquoStrongly agreerdquo and ldquoAgreerdquo) with Q3 option 6 - Base all EU27_2019
respondents (N=24928)
The socio-demographic findings show that consumersrsquo trust in environmental claims is most closely linked with their mother tongue followed by their financial situation the vulnerability of consumers because of the complexity of offers and the number of languages spoken
Consumers whose mother tongue is an official language of the country or region in which they live are less likely to trust environmental claims than those whose mother tongue is another language
Consumers who report their financial situation to be very easy and fairly easy report higher trust in environmental claims than those who report their situation to be fairly difficult and very difficult
Consumers who are very vulnerable in terms of the complexity of offers and terms and conditions are less likely to trust environmental claims than those who are somewhat vulnerable and those who are not vulnerable
Finally consumers who speak only their native language and those who speak two languages are more likely to trust environmental claims than those who speak four or more languages
553 A 535 A
580 B 551 AB 521 A 508 A
574 B 546 AB 532 A
474 A 511 A 574 B 555 B
549 A 544 A 537 A
446 A 451 A 488 432 A
589 A 557 A 513 A 555 A
GenderMale Female
Trust in environmental claims
Blue collar
Student
65+
Education levelLow Medium High
Age18-34 35-54 55-64
Very easy
UrbanisationRural area Small town Large town
Financial situationVery difficult Fairly difficult Fairly easy
Unemployed Seeking a job RetiredEmployment status
Self-employed Manager Other white collar
565 C 539 BC 525 AB 488 A
601 540
539 A 544 A 544 A
559 C 472 A 589 BC 498 ABC 497 AB
524 A 528 A 557 A
496 538 A 556 A
Four or more
Trust in environmental claims
LanguagesOnly native Two
High
Mother tongue
Not official language
in home country
Official language in
home country
Numerical skillsLow Medium
Three
Consumer
vulnerability
(complexity)
Very vulnerableSomewhat
vulnerableNot vulnerable
Hardly ever Never
Consumer
vulnerability
(socio-demographic
factors)
Very vulnerableSomewhat
vulnerableNot vulnerable
Internet useDaily Weekly Monthly
Consumer Survey 2018
69
The influence of environmental claims on purchasing decisions
Proportion of agreement with Q536 options 1 2 and 3 - Base all respondents (N=28037)
In the European Union 552 of consumers report that claims about the environmental impact of goods and services have influenced their purchasing decisions Compared to the EU27_2019 average higher levels are found in the South (593) and East (573) whereas lower levels are observed in the North (514) and West (519) The highest proportion of consumers who report that
environmental claims have influenced their purchasing decisions is found in Croatia (727) Ireland
(719) and Greece (626) In addition high levels are found in the UK (677) and Norway (634) The lowest levels are observed in Bulgaria (322) Cyprus (328) and Estonia (372)
36 Q5 Considering everything you have bought during the last two weeks did the environmental impact of any goods or services also influence your choice 1 Yes for all or most goods or services you bought 2 Yes but only for some 3 Yes but only for one or two
Region
Country
2018
( = sig
diff EU27)
2018-
2016
2016-
2014
2014-
2012
2012-
2011
2011-
2010
EU27_2019 552 +54 -69 +147 +118 -32
EU28 568 +73 -60 +146 +118 -33
North 514 +21 +14 +49 +94 -24
South 593 +113 -111 +175 +133 -97
East 573 -30 +39 +132 +142 +30
West 519 +61 -107 +149 +97 -18
BE 506 -71 -28 +162 +99 -110
BG 322 -64 -69 +120 +157 +25
CZ 589 +60 +20 +111 +168 -59
DK 513 +43 -06 +35 +85 -76
DE 479 +15 -67 +165 +87 +16
EE 372 +03 +25 +91 +45 +43
IE 719 +225 -54 +84 +92 +28
EL 626 +190 -208 +90 +83 -82
ES 592 +123 -126 +267 +99 -97
FR 544 +144 -189 +142 +109 -54
HR 727 +118 -57 +189 - -
IT 611 +119 -116 +155 +157 -86
CY 328 +63 -152 -62 +114 -22
LV 516 -21 +66 +96 +115 +26
LT 490 +179 +28 +06 +90 +14
LU 537 +58 -217 +222 +104 +13
HU 589 -34 +79 +94 +63 -18
MT 527 +44 +28 -04 +161 -173
NL 554 +05 -36 +107 +75 +08
AT 564 +83 -138 +135 +154 -77
PL 582 -39 +53 +119 +155 +08
PT 478 -34 +85 -16 +197 -158
RO 611 -96 +53 +211 +126 +166
SI 550 -62 +118 +34 +77 -87
SK 538 +46 +41 +28 +176 -36
FI 580 +06 +110 +89 +42 -34
SE 504 -22 -46 +35 +133 -35
IS 559 +92 +07 +55 +119 -
NO 634 +105 -61 +238 +109 -
UK 677 +206 -01 +139 +119 -43
Influence of environmental claims when choosing goodsservices
Consumer Survey 2018
70
Consumersrsquo perception of the impact of environmental claims on purchasing decisions increased
between 2016 and 2018 in the EU27_2019 (+54pp) the North (+21pp) West (+61pp) and South (+113pp) while it decreased in the East (-30pp) Compared to the survey in 2016 the perceived impact of environmental claims on purchasing decisions increased most sharply in Ireland (+225pp) and decreased most prominently in Romania (-96pp)
The largest positive reversal is observed in Greece where between 2016 and 2018 trust in environmental claims on purchasing decisions increased by 190pp whereas between 2014 and 2016 it decreased by 208pp The largest negative reversal is observed in Slovenia where between 2016
and 2018 the perceived impact of environmental claims on purchasing decisions decreased by 62pp following an increase of 118pp between 2014 and 2016
Proportion of agreement with Q5 options 1 2 and 3 - Base all EU27_2019 respondents (N= 24928)
Proportion of agreement with Q5 options 1 2 and 3 - Base all EU27_2019 respondents (N= 24928)
The degree to which claims about the environmental impact of goods and services influence consumers purchasing decisions also depends on socio-demographic variables and other
characteristics
The results show that gender has the closest link with the proportion of consumers who report that
their decisions are affected by claims about environmental impact female consumers more often report that their purchase decisions are influenced than males
Vulnerability in terms of the complexity of offers and terms and conditions is also associated with the reported influence of environmental claims on purchase decisions In particular consumers who are not vulnerable report the influence by environmental claims on their purchase decisions less often than somewhat and very vulnerable consumers
508 594
509 557 A 586 A 566 A
515 A 546 A 571
572 A 558 A 555 A 532 A
545 A 557 A 554 A
446 A 451 A 488 432 A
558 A 553 A 525 A 544 A
GenderMale Female
Influence of environmental claims when choosing goodsservices
Blue collar
Student
65+
Education levelLow Medium High
Age18-34 35-54 55-64
Very easy
UrbanisationRural area Small town Large town
Financial situationVery difficult Fairly difficult Fairly easy
Unemployed Seeking a job RetiredEmployment status
Self-employed Manager Other white collar
527 A 559 B 590 C 561 ABC
524 A 554 A
546 A 541 A 560 A
567 B 580 B 458 A 510 AB 451 A
542 AB 577 B 544 A
597 A 596 A 529
Four or more
Influence of environmental claims when choosing goodsservices
LanguagesOnly native Two
High
Mother tongue
Not official language
in home country
Official language in
home country
Numerical skillsLow Medium
Three
Consumer
vulnerability
(complexity)
Very vulnerableSomewhat
vulnerableNot vulnerable
Hardly ever Never
Consumer
vulnerability
(socio-demographic
factors)
Very vulnerableSomewhat
vulnerableNot vulnerable
Internet useDaily Weekly Monthly
Consumer Survey 2018
71
Age is also associated with this indicator Consumers aged 18-34 reportedly are less likely to have
their purchase decisions be influenced by claims about environmental impact of goods and services than consumers aged 35 and older
Finally highly educated consumers are also more likely to report the influence of environmental claims on their purchase decisions than those with low or medium education
Consumer Survey 2018
72
9 CONSUMER CONFIDENCE IN ONLINE PURCHASES
Low consumer confidence in online transactions is considered a significant barrier to the continued growth of online purchases within the Digital Single Market This chapter reports findings on consumersrsquo overall confidence in domestic and cross-border online purchases
Domestic online purchases
Average proportion of agreement (ldquoStrongly agreerdquo and ldquoAgreerdquo) with Q1717 option 1 - Base all respondents
(N=28037)
17 Q17 How strongly do you agree or disagree with each of the following statements -Strongly agree ndashAgree ndash Disagree ndashStrongly disagree ndash DKNA Q171 You feel confident purchasing goods or services via the internet from retailers or service providers in (our country)
Region
Country
2018
( = sig
diff EU27)
2018-
2016
2016-
2014
2014-
2012
EU27_2019 694 +02 +129 +16
EU28 717 +02 +124 +20
North 772 +56 +65 +23
South 648 +76 +104 +36
East 646 +27 +99 -01
West 738 -73 +171 +10
BE 706 -25 +119 +78
BG 466 +30 +148 -106
CZ 787 +52 +67 +02
DK 850 +17 +56 +01
DE 748 -80 +204 -04
EE 656 +80 +51 +160
IE 848 +04 +113 -05
EL 541 +65 +35 +93
ES 652 +56 +67 +27
FR 696 -106 +161 -01
HR 483 +14 +172 +07
IT 703 +99 +160 +41
CY 499 +70 -15 +96
LV 558 +65 +63 +13
LT 655 +182 +23 +05
LU 808 -12 +110 +29
HU 714 +102 +150 +16
MT 642 +132 +70 +92
NL 806 +04 +99 +44
AT 810 -13 +161 +71
PL 664 -03 +93 -33
PT 434 +42 +20 -18
RO 587 +24 +71 +90
SI 628 +14 +119 -54
SK 713 +72 +80 -17
FI 754 +56 +64 -03
SE 831 +31 +86 +42
IS 793 +14 +69 +93
NO 844 -25 +79 +51
UK 875 +07 +88 +50
Confidence in domestic online shopping
Consumer Survey 2018
73
In the European Union the confidence in domestic online purchases is 694 Compared to the
EU27_2019 average this level is higher in the West (738) and the North (772) and lower in the South (648) and East (646) In the EU27 the highest levels of confidence in domestic online purchases are found in Denmark (850) Ireland (848) and Sweden (831) Furthermore the levels are also high in the UK (875) and Norway (844) The lowest levels of confidence in domestic online purchases are found in Portugal (434) Bulgaria (466) and Croatia (483)
There is no difference between consumersrsquo confidence in domestic online purchases between 2016
and 2018 in the EU27_2019 while this level increased in the East (+27pp) North (+56pp) and South (+76pp) and decreased in the West (-73pp) Compared to the survey in 2016 the level of confidence in domestic online purchases increased most prominently in Lithuania (+182pp) and decreased most prominently in France (-106pp)
When looking at statistically significant changes in 2018 (vs 2016) and in 2016 (vs 2014) no positive reversal is found The largest negative reversal is found in Germany where between 2016
and 2018 this indicator decreased by 80pp following an increase of 204pp in the previous period
Average proportion of agreement (ldquoStrongly agreerdquo and ldquoAgreerdquo) with Q17 option 1 - Base all EU27_2019
respondents (N=24928)
Average proportion of agreement (ldquoStrongly agreerdquo and ldquoAgreerdquo) with Q17 option 1 - Base all EU27_2019
respondents (N=24928)
With regard to socio-demographic variables and other characteristics confidence in domestic online purchases is most closely associated with internet use followed by age financial situation education and numerical skills
710 A 691 A
778 732 660 605
669 A 686 A 728
607 676 722 A 747 A
714 B 699 AB 684 A
446 A 451 A 488 432 A
735 BCD 672 AB 683 ABC 663 A
GenderMale Female
Confidence in domestic online shopping
Blue collar
Student
65+
Education levelLow Medium High
Age18-34 35-54 55-64
Very easy
UrbanisationRural area Small town Large town
Financial situationVery difficult Fairly difficult Fairly easy
Unemployed Seeking a job RetiredEmployment status
Self-employed Manager Other white collar
681 A 720 B 700 AB 698 AB
674 A 701 A
659 693 A 712 A
761 625 C 546 BC 513 AB 430 A
684 A 682 A 713
680 A 704 A 705 A
Four or more
Confidence in domestic online shopping
LanguagesOnly native Two
High
Mother tongue
Not official language
in home country
Official language in
home country
Numerical skillsLow Medium
Three
Consumer
vulnerability
(complexity)
Very vulnerableSomewhat
vulnerableNot vulnerable
Hardly ever Never
Consumer
vulnerability
(socio-demographic
factors)
Very vulnerableSomewhat
vulnerableNot vulnerable
Internet useDaily Weekly Monthly
Consumer Survey 2018
74
Consumers who use the internet daily are the most likely to have confidence in domestic online
shopping followed by those who use it weekly and monthly who in turn are more likely to have confidence in domestic online shopping than those who never use the internet
Consumers aged 18-34 years are most likely to have confidence in domestic online shopping Moreover consumers aged 35-54 years are more likely to have confidence in domestic online shopping than those aged 55-64 years who in turn are more likely than those aged 65+ years
Moreover the proportion of consumers that is confident in domestic online shopping is higher among those in a fairly easy or very easy financial situation than among consumers with a fairly difficult and
very difficult financial situation
Regarding peoplesrsquo education those who are highly educated are more likely to have confidence in domestic online purchases than those with a low or medium level of education
Finally consumers with a high and medium numerical skill level are more likely to have confidence than those with low numerical skills
Consumer Survey 2018
75
Cross-border online purchases
Average proportion of agreement (ldquoStrongly agreerdquo and ldquoAgreerdquo) with Q1718 option 2 - Base all respondents
(N=28037)
In the European Union the overall level of confidence in cross-border online purchases is 465
Compared to the EU27_2019 average this level is higher in the South (499) and North (528) whereas it is lower in the West (444) and East (445)
18 Q17 How strongly do you agree or disagree with each of the following statements -Strongly agree ndashAgree ndash Disagree ndashStrongly disagree ndash DKNA Q172 You feel confident purchasing goods or services via the internet from retailers or service providers in another EU country
Region
Country
2018
( = sig
diff EU27)
2018-
2016
2016-
2014
2014-
2012
EU27_2019 465 -79 +197 +32
EU28 483 -89 +211 +28
North 528 +74 +54 +10
South 499 +72 +65 +49
East 445 +07 +85 +43
West 444 -251 +368 +15
BE 492 -32 +91 +62
BG 310 -40 +72 -137
CZ 501 +45 +68 +47
DK 536 +14 +50 -31
DE 416 -318 +445 +33
EE 476 +58 +56 +119
IE 733 -26 +172 -40
EL 379 +55 -33 +48
ES 511 +49 +34 +44
FR 409 -319 +408 -15
HR 460 +49 +160 -01
IT 537 +100 +111 +65
CY 428 +34 -22 +10
LV 426 +79 +28 -09
LT 509 +189 +05 +00
LU 734 -17 +203 +18
HU 604 +62 +273 +34
MT 653 +97 +37 +09
NL 504 +67 +84 +25
AT 631 -116 +333 -01
PL 418 -14 +52 +86
PT 343 +21 +35 -14
RO 399 -11 +50 +55
SI 480 -12 +111 +17
SK 554 +73 +86 -02
FI 515 +92 +38 -37
SE 565 +63 +86 +53
IS 734 +59 +85 +120
NO 641 -20 +98 +34
UK 605 -159 +310 -00
Confidence in cross-border online shopping
Consumer Survey 2018
76
Between 2016 and 2018 consumer confidence in cross-border online purchases decreased in the
EU27_2019 (-79pp) However this drop is entirely due to the decrease observed in the West (-251pp) while the other EU regions saw either an increase (South +72pp and North +74pp) or a stable situation (East)
In this map values above average are coloured in light and dark green and values below average are coloured in light and dark red
Among the EU countries the highest confidence in cross-border online purchases is found in Luxembourg (734) Ireland (733) and Malta (653) This level is high in Iceland as well (734) The lowest levels of confidence in cross-border online purchases are found in Bulgaria (310) Portugal (343) and Greece (379) Compared to the 2016 survey this type of confidence increased most steeply in Lithuania (+189pp) It decreased most prominently in France (-319pp)
When looking at statistically significant changes in 2018 (vs 2016) and in 2016 (vs 2014) no statistically significant positive reversal is found The largest negative reversal is found in Germany where between 2016 and 2018 this indicator decreased by 318pp following an increase of 445pp between 2014 and 2016
Consumer Survey 2018
77
Average proportion of agreement with Q17 (ldquoStrongly agreerdquo and ldquoAgreerdquo) option 2 - Base all EU27_2019 respondents (N=24928)
Average proportion of agreement with Q17 (ldquoStrongly agreerdquo and ldquoAgreerdquo) option 2 ndash Base all EU27_2019
respondents (N=24928)
Regarding socio-demographic variables and other characteristics confidence in cross-border online purchases is most closely associated with age The characteristics showing the next closest links are internet use gender education and language
Consumers aged 18-34 years report confidence in cross-border online purchases more often than other age groups Moreover consumers aged 35-54 years report confidence more often than those aged 55-64 years who in turn are more likely to have confidence in cross-border online shopping than those aged 65+ years
In addition consumers who use the internet daily report confidence in cross-border online purchases more often than those using the internet weekly or less often In addition a higher proportion of those who use the internet weekly reports being confident than those who never use the internet
Regarding consumersrsquo gender a proportion of males that report confidence in cross-border online purchases is higher than the proportion of females
Highly educated people are also more likely to be confident in such purchases than those with a medium level of education who in turn report confidence more often than those with a low level of
education
Finally confidence in such purchases is more common among consumers who speak at least three languages This proportion is also higher for consumers that speak two languages than for consumers that speak only their native language
510 433
578 491 422 318
416 456 499
404 A 448 A 485 B 504 B
469 A 472 A 470 A
446 A 451 A 488 432 A
551 D 478 ABC 525 CD 434 AB
GenderMale Female
Confidence in cross-border online shopping
Blue collar
Student
65+
Education levelLow Medium High
Age18-34 35-54 55-64
Very easy
UrbanisationRural area Small town Large town
Financial situationVery difficult Fairly difficult Fairly easy
Unemployed Seeking a job RetiredEmployment status
Self-employed Manager Other white collar
429 477 522 A 521 A
430 A 473 A
454 AB 449 A 484 B
505 401 B 337 AB 325 AB 256 A
435 A 440 A 494
411 461 486
Four or more
Confidence in cross-border online shopping
LanguagesOnly native Two
High
Mother tongue
Not official language
in home country
Official language in
home country
Numerical skillsLow Medium
Three
Consumer
vulnerability
(complexity)
Very vulnerableSomewhat
vulnerableNot vulnerable
Hardly ever Never
Consumer
vulnerability
(socio-demographic
factors)
Very vulnerableSomewhat
vulnerableNot vulnerable
Internet useDaily Weekly Monthly
Consumer Survey 2018
78
10 UNFAIR COMMERCIAL PRACTICES
This chapter reports on consumer experiences with encountering unfairillicit commercial practices domestically or cross-border over the past 12 months As in the previous wave the survey presented concrete examples of unfair commercial practices to make them easily recognisable All examples of practices surveyed both unfair and illicit (banned under EU legislation) fall within the scope of the
Unfair Commercial Practices Directive19
Unfair commercial practices from domestic retailers
1011 Exposure to UCPs from domestic retailers
In the European Union the overall level of exposure to unfair commercial practices (UCPs) from domestic retailers is 227 This level is higher in the North (235) East (275) and South (283) whereas it is lower in the West (164)
19 httpeur-lexeuropaeuLexUriServLexUriServdouri=OJL200514900220039ENPDF
Consumer Survey 2018
79
Average incidence of the UCPs mentioned in Q1320 from domestic retailers (answer 1) - Base all respondents
(N=28037)
20 Q13 I will read you some statements about unfair commercial practices After each one please tell me whether you have experienced it during the last 12 monthshellip -Yes with retailers or services providers
located in (our country) -Yes with retailers or services providers located in another EU country -Yes but you donrsquot know in which country the retailers or services providers were located ndashNo ndashDKNA 1 You have been informed you won a lottery you did not know about but you were asked to pay some money in order to collect the prize 2 You have felt pressured by persistent sales calls or messages urging you to buy something or sign a contract 3 You have been offered a product advertised as free of charge which actually entailed charges 4 You have come across advertisements stating that the product was only available for a very limited period of time but you later realised that it was not the case 5 You have come across other unfair commercial practices
Region
Country
2018
( = sig
diff EU27)
2018-
2016
2016-
2014
EU27_2019 227 +47 -57
EU28 224 +61 -69
North 235 -18 +13
South 283 +14 -08
East 275 +02 -40
West 164 +103 -109
BE 173 -10 +19
BG 242 -23 +01
CZ 257 +16 -40
DK 204 -01 +01
DE 156 +113 -89
EE 244 -07 +54
IE 164 +128 -123
EL 359 +28 +18
ES 314 -22 -04
FR 185 +141 -188
HR 358 -49 +33
IT 262 +42 -20
CY 152 -24 -42
LV 267 -16 +18
LT 211 -01 -21
LU 68 +31 -41
HU 255 +40 -87
MT 150 -54 +54
NL 141 -16 -06
AT 117 +85 -86
PL 313 -08 -44
PT 209 +02 +08
RO 215 +15 -53
SI 197 -36 +41
SK 301 +03 -21
FI 256 -41 +38
SE 241 -22 +09
IS 112 -10 +10
NO 197 -07 +07
UK 202 +163 -158
Exposure to unfair commercial practices
from domestic retailers
Consumer Survey 2018
80
In the European Union the overall level of exposure to UCPs from domestic retailers is 227 This level is higher in the North (235) East (275) and South (283) whereas it is lower in the West (164)
In this map values below average are coloured in light and dark green and values above average are coloured
in light and dark red
The highest exposure to UCPs from domestic retailers is found in Greece (359) Croatia (358) and Spain (314) Among the EU countries the lowest levels of exposure to UCPs from domestic retailers are found in Luxembourg (68) Austria (117) and the Netherlands (141) Finally
the level of exposure is also low in Iceland (112)
Between 2016 and 2018 exposure to UCPs from domestic retailers remained stable in the East while it increased in the EU27_2019 (+47pp) the South (+14pp) and West (+103pp) and decreased in the North (-18pp) Among the EU Member States this type of exposure increased most sharply in France (+141 (reflecting a higher exposure to unfair commercial practices from domestic
Consumer Survey 2018
81
retailers) whereas between 2014 and 2016 it decreased by 188pp (ie negative reversal37)
Considering all surveyed countries the UK shows an even stronger increase between 2016 and 2018 (+163) after a noticeable decrease between 2014 and 2016 (-158) Exposure to unfair commercial practices from domestic retailers decreased most prominently in Malta (-54pp) whereas between 2014 and 2016 it increased by 54pp
Average incidence of the UCPs mentioned in Q13 from domestic retailers (answer 1) - Base all EU27_2019
respondents (N=24928)
Average incidence of the UCPs mentioned in Q13 from domestic retailers (answer 1) - Base all EU27_2019
respondents (N=24928)
With regard to socio-demographic variables and other characteristics exposure to UCPs from domestic retailers is associated most closely to consumer vulnerability due to socio-demographic
factors The characteristics showing the next closest links are education consumersrsquo financial situation vulnerability due to the complexity of offers and terms and conditions and internet use
Consumers who are very or somewhat vulnerable in terms of socio-demographic factors are more likely to be exposed to UCPs from domestic retailers than those who are not vulnerable
Regarding consumersrsquo education those with a medium or high level of education are also more likely to experience UCPs from domestic retailers than those with a low level of education
37 For negative indicators such as exposure to unfair commercial practices from domestic retailers the labels for positive and negative reversals are switched to account for the negative valence of the indicator where an increase reflects a change towards the negative
233 A 225 A
224 A 229 AB 243 B 220 A
196 231 A 236 A
263 238 222 A 217 A
229 A 231 A 226 A
446 A 451 A 488 432 A
199 A 227 A 216 A 231 A
GenderMale Female
Exposure to unfair commercial practices from domestic retailers
Blue collar
Student
65+
Education levelLow Medium High
Age18-34 35-54 55-64
Very easy
UrbanisationRural area Small town Large town
Financial situationVery difficult Fairly difficult Fairly easy
Unemployed Seeking a job RetiredEmployment status
Self-employed Manager Other white collar
213 234 A 246 A 244 A
249 A 228 A
228 A 229 A 229 A
242 201 B 195 AB 198 AB 173 A
253 A 252 A 210
258 A 248 A 217
Four or more
Exposure to unfair commercial practices from domestic retailers
LanguagesOnly native Two
High
Mother tongue
Not official language
in home country
Official language in
home country
Numerical skillsLow Medium
Three
Consumer
vulnerability
(complexity)
Very vulnerableSomewhat
vulnerableNot vulnerable
Hardly ever Never
Consumer
vulnerability
(socio-demographic
factors)
Very vulnerableSomewhat
vulnerableNot vulnerable
Internet useDaily Weekly Monthly
Consumer Survey 2018
82
Consumers who consider their financial situation to be very difficult are most likely to report exposure
to such unfair practices In addition consumers with a fairly difficult financial situation report greater exposure than those who consider their situation to be fairly easy or very easy
Furthermore consumers who are very or somewhat vulnerable in terms of the complexity of offers and terms and conditions are also more likely to be exposed to UCPs from domestic retailers than those who are not vulnerable
Finally daily internet users are most likely to be exposed to UCPs from domestic retailers Weekly internet users are also more likely to be exposed to these unfair practices compared to consumers
who never use the internet
1012 Types of UCPs from domestic retailers
Across all types of unfair commercial practices from domestic retailers studied by the current survey persistent sales calls (374) are the most common followed by false limited offers (248) and false free products (199) A noticeable share of consumers also experiences other UCPrsquos (173)
and lottery scams (143)
Consumer Survey 2018
83
Q13 options 1 2 and 3 (answer 1-domestic retailers) Base all respondents (N=28037)
In the European Union the overall level of exposure to lottery scams is 143 In the South and West this level is in line with the EU27_2019 average while it is lower in the North (118) and higher in the East (175) The highest exposure to lottery scams is found in Greece (292) Poland
(260) and Slovakia (199) In the same area the lowest levels of exposure to lottery scams are found in Portugal (38) Cyprus (43) and Luxembourg (44) Moreover this level is lowest in
Iceland (07)
Between 2016 and 2018 exposure to lottery scams increased in the EU27_2019 (+40pp) the South (+19pp) and West (+79pp) while it remained stable in the North and East Compared to the 2016 survey this type of exposure increased most steeply in Germany (+108pp) and decreased most prominently in Latvia (-93pp) When looking at statistically significant changes in 2018 (vs 2016)
and in 2016 (vs 2014) the largest negative reversal is found in France where between 2016 and 2018 this indicator increased by 85pp (reflecting a higher incidence of consumers exposed to lottery scams) whereas between 2014 and 2016 it decreased by 134pp Conversely the largest positive reversal is found in Malta where between 2016 and 2018 this indicator decreased by 69pp
2018
( = sig
diff EU27)
2018-
2016
2016-
2014
2018
( = sig
diff EU27)
2018-
2016
2016-
2014
2018
( = sig
diff EU27)
2018-
2016
2016-
2014
EU27_2019 143 +40 -35 374 +57 -63 199 +35 -57
EU28 137 +43 -36 357 +73 -83 194 +47 -69
North 118 -04 +16 357 -35 +21 238 -34 +16
South 136 +19 +08 585 +38 +09 261 -02 -19
East 175 +07 -51 385 -20 -05 244 +19 -54
West 134 +79 -64 225 +126 -154 128 +80 -95
BE 78 -14 +09 308 -25 +93 163 -11 +09
BG 91 +06 -07 351 -11 +45 240 -15 -02
CZ 163 +19 -53 396 +19 -21 284 +50 -27
DK 142 +44 -43 325 -34 +50 170 -41 +29
DE 154 +108 -36 190 +111 -115 104 +75 -60
EE 64 -29 +62 526 -47 +138 169 +28 +17
IE 93 +65 -05 184 +130 -128 127 +104 -94
EL 292 +28 +44 583 +32 +29 301 +23 +39
ES 119 -29 +16 564 +40 -08 346 -38 -26
FR 128 +85 -134 276 +213 -294 166 +133 -185
HR 141 -34 +06 486 -80 +36 419 -109 +51
IT 141 +62 -06 628 +40 +15 209 +22 -29
CY 43 -32 -11 237 -30 -42 120 -27 -29
LV 93 -93 +60 476 -55 +38 195 +05 +01
LT 91 -15 -39 363 -25 -74 150 -11 +13
LU 44 +13 -05 56 -03 -09 76 +55 -35
HU 61 +18 -62 303 -18 -30 261 +47 -128
MT 83 -69 +93 230 -100 +21 158 -23 +68
NL 137 -09 -10 218 -08 -04 121 -26 -22
AT 80 +50 -33 131 +78 -115 71 +49 -50
PL 260 +20 -43 470 -59 -23 234 +27 -62
PT 38 -19 +08 469 +39 +43 162 -11 -00
RO 111 -16 -92 238 +38 -04 185 +21 -85
SI 123 +03 -16 303 -121 +163 106 -08 +19
SK 199 -18 -61 438 +24 +08 345 +09 +19
FI 115 -40 +64 323 -48 +64 341 -104 +59
SE 124 +15 +25 346 -25 -10 265 -14 -13
IS 07 -08 +10 144 -11 -34 113 +11 +02
NO 109 +22 +26 229 -04 -01 249 -51 +05
UK 98 +63 -42 243 +187 -231 158 +133 -152
Types of unfair commercial practices from domestic retailers
Region
Country
Lottery scams Persistent sales calls False free products
Consumer Survey 2018
84
(reflecting a lower incidence of consumers exposed to lottery scams) following an increase of 93pp
between 2014 and 2016
The overall level of exposure to persistent sales calls is 374 in the European Union In the East this level is in line with the EU27_2019 average while it is lower in the West (225) and North (357) and higher in the South (585) The highest exposure to persistent sales calls is found in Italy (628) Greece (583) and Spain (564) Among the EU countries the lowest levels of exposure to persistent sales calls are found in Luxembourg (56) Austria (131) and Ireland (184) Likewise this level is also low in Iceland (144)
Exposure to persistent sales calls increased in the EU27_2019 (+57pp) the South (+38pp) and West (+126pp) whereas decreases are found in the East (-20pp) and North (-35pp) Compared to the survey in 2016 this type of exposure increased most prominently in France (+213pp) This is also linked to the largest negative reversal where the increase between 2016 and 2018 (reflecting a greater incidence of consumers exposed to such calls) follows a decrease of 294pp between 2014 and 2016 Conversely the most prominent decrease is found in Slovenia (-121pp) which is also
linked to the largest positive reversal The indicator decreased between 2016 and 2018 (reflecting a lower incidence of consumers exposed to such calls) whereas between 2014 and 2016 it increased
by 163pp
The proportion of respondents exposed to false free products in the European Union is 199 It is higher in the North (238) East (244) and South (261) whereas it is lower in the West (128) The highest proportion of respondents exposed to false free products is observed in Croatia (419) Spain (346) and Slovakia (345) The lowest levels of exposure to false free products
are found in Austria (71) Luxembourg (76) and Germany (104)
Compared to 2016 exposure to false free products remained stable in the South while it increased in the EU27_2019 (+35pp) the East (+19pp) and West (+80pp) and decreased in the North (-34pp) Similar to the share of consumers having received persistent sales calls the sharpest increase in exposure to false free products is also found in France (+133pp) which is again linked to the largest negative reversal The increase between 2016 and 2018 (reflecting greater exposure to false free products) was preceded by a decrease of 185pp between 2014 and 2016 The proportion
of respondents exposed to false free products decreased most prominently in Croatia (-109pp) The largest positive reversal is found in Finland where between 2016 and 2018 this indicator decreased by 104pp (reflecting less exposure to false free products) whereas between 2014 and 2016 it increased by 59pp
Consumer Survey 2018
85
Q13 options 1-3 (answer 1-domestic retailers) - Base all EU27_2019 respondents (N=24928)
Male 140 A 361 207 A
Female 147 A 392 195 A
18-34 123 A 354 A 215 A
35-54 139 A 379 AB 209 A
55-64 175 B 388 B 199 A
65+ 148 AB 392 AB 167
Low 126 A 314 186 A
Medium 150 A 377 A 199 A
High 140 A 395 A 206 A
Very difficult 179 B 406 AB 232 B
Fairly difficult 136 A 399 B 207 AB
Fairly easy 140 A 373 A 198 AB
Very easy 153 AB 338 180 A
Rural area 146 A 374 AB 203 A
Small town 147 A 390 B 203 A
Large town 136 A 362 A 195 A
Self-employed 185 B 409 CD 228 CD
Manager 148 AB 432 D 237 D
Other white collar 141 A 364 AB 175 AB
Blue collar 127 A 383 BC 194 BC
Student 145 AB 318 A 152 A
Unemployed 146 AB 357 ABC 229 CD
Seeking a job 138 AB 372 ABCD 219 BCD
Retired 137 A 377 ABC 219 CD
Age groups
Types of unfair commercial practices from
domestic retailers
Lottery scams Persistent sales
calls
False free
products
Gender
Education
Financial Situation
Urbanisation
Employment status
Consumer Survey 2018
86
Q13 options 1-3 (answer 1-domestic retailers) - Base all EU27_2019 respondents (N=24928)
With regard to socio-demographic variables and other characteristics the chance of exposure to lottery scams from domestic retailers is most closely associated with vulnerability due to socio-demographic factors followed by age vulnerability due to the complexity of offers and terms and conditions and employment status
Consumers who are very or somewhat vulnerable in terms of socio-demographic factors are more likely to receive lottery scams from domestic retailers than those who are not vulnerable
Regarding age consumers aged 55-64 reported more exposure to lottery scams from domestic retailers compared to those aged 54 and younger
Consumers who are very vulnerable due to the complexity of offers and terms and conditions are more likely to report receiving lottery scams than consumers who are not vulnerable
As far as consumersrsquo employment status is concerned self-employed consumers are the most likely
to experience lottery scams from domestic retailers and more so than other white collars blue collar workers and retired consumers
In terms of the likelihood of receiving persistent sales calls from domestic retailers this indicator is associated most closely with education Other characteristics with close links are consumer
Only native 137 A 366 A 181
Two 148 A 378 AB 211 A
Three 150 A 399 B 210 A
Four or more 134 A 377 AB 223 A
Not official
language in home
country
170 A 370 A 251
Official language
in home country142 A 377 A 198
Low 141 AB 366 A 227 B
Medium 155 B 366 A 207 AB
High 137 A 385 A 193 A
Daily 153 B 393 B 213 B
Weekly 126 A 347 A 160 A
Monthly 123 AB 291 A 195 AB
Hardly ever 137 AB 333 AB 169 AB
Never 101 A 315 A 151 A
Very vulnerable 161 A 411 A 213 A
Somewhat
vulnerable161 A 393 A 232 A
Not vulnerable 130 359 181
Very vulnerable 167 B 419 A 234 B
Somewhat
vulnerable150 AB 423 A 204 AB
Not vulnerable 136 A 354 195 A
Types of unfair commercial practices from
domestic retailers
Consumer vulnerability
(socio-demographic
factors)
Consumer vulnerability
(complexity)
Persistent sales
calls
False free
products
Languages
Mother Tongue
Numerical skills
Internet use
Lottery scams
Consumer Survey 2018
87
vulnerability due to the complexity of offers and terms and conditions financial situation gender
and vulnerability due to socio-demographic factors
Regarding consumersrsquo level of education consumers with a high- or medium level of education are more likely to receive persistent sales calls from retailers or service providers in their own country than those with a low education level
Consumers who are very or somewhat vulnerable in terms of the complexity of offers and terms and conditions are also more likely to receive such calls than those who are not vulnerable
Furthermore regarding consumersrsquo financial status a better financial situation is linked with less
exposure to persistent sales calls Consumers with a very easy financial situation are less likely to experience such problems than all other consumers Consumers with a fairly easy financial situation are also less likely to experience this type of UCP than consumers with a fairly difficult financial situation
Concerning gender there is a higher proportion of female consumers that received persistent sales calls from domestic retailers than male consumers
Finally consumers who are very or somewhat vulnerable in terms of sociodemographic factors are also more likely to report receiving such calls than those who are not vulnerable
Greater exposure to false offers of free products from domestic retailers is associated most closely with the respondentsrsquo mother tongue The characteristics showing the next closest links are vulnerability due to socio-demographic factors employment status age and the number of languages spoken
Those whose mother tongue does not correspond to one of the official languages of the country or
region they live in are more likely to receive false offers of free products from domestic retailers than those whose mother tongue is an official language
Furthermore consumers who are very or somewhat vulnerable in terms of socio-demographic factors are more likely to receive false offers of free products from retailers in their own country than those who are not vulnerable
Employment status is also linked with the likelihood of receiving false offers for free products with managers being most likely to receive such offers They are also more likely to receive false offers
more than other white collars blue collar workers or students In addition people who are retired self-employed or unemployed also report receiving such offers more than other white collars or students Similarly blue-collar workers or those seeking a job also report this more often than students do
Consumers aged 65 years or older are less likely to report being exposed to false offers for free products from domestic retailers than the remainder of the population
Finally consumers who only speak their native language are less likely to receive false offers of free products from domestic retailers than those who speak two languages or more
Consumer Survey 2018
88
Q13 options 4 and 5 (answer 1-domestic retailers) Base all respondents (N=28037)
The overall consumer exposure to false limited offers in the European Union is 248 In the South this is in line with the EU27_2019 average while it is higher in the North (274) and East (357) and lower in the West (196) The highest exposure to false limited offers is observed in Croatia
(485) Greece (427) and Hungary (413) The lowest levels of exposure to false limited offers are found in Luxembourg (124) the Netherlands (140) and Italy (148)
Compared to 2016 exposure to false limited offers remained stable in the North and South while it increased in the EU27_2019 (+63pp) the East (+17pp) and West (+137pp) Compared to the survey in 2016 this type of exposure increased most sharply in Ireland (+187pp) This increase in the incidence of consumers exposed to false limited offers follows a decrease of 219pp between 2014 and 2016 which makes this the highest negative reversal in the EU27_2019 Considering all
countries of the survey an even higher negative reversal is found in the UK where between 2016 and 2018 this indicator increased by 246pp whereas between 2014 and 2016 it decreased by 232pp The most prominent decrease in exposure to false limited offers is found in Slovenia (-74pp) This is related to the only positive reversal where this decrease was preceded by an increase of 71pp between 2014 and 2016
2018
( = sig
diff EU27)
2018-
2016
2016-
2014
2018
( = sig
diff EU27)
2018-
2016
2016-
2014
EU27_2019 248 +63 -70 173 +38 -59
EU28 254 +86 -91 178 +56 -68
North 274 -14 -03 188 -02 +14
South 239 +09 -26 195 +07 -14
East 357 +17 -33 212 -15 -55
West 196 +137 -131 136 +93 -103
BE 179 -04 +06 139 +03 -19
BG 384 -19 +18 147 -74 -50
CZ 245 +00 -64 196 -06 -38
DK 217 -04 -34 164 +31 +03
DE 211 +165 -138 123 +107 -94
EE 261 -07 +15 200 +21 +40
IE 231 +181 -219 185 +161 -169
EL 427 +30 +19 190 +27 -41
ES 327 -32 +03 218 -51 -04
FR 189 +151 -167 167 +124 -159
HR 485 +08 +49 258 -28 +26
IT 148 +37 -60 183 +51 -19
CY 286 -45 -73 77 +15 -57
LV 394 -07 +50 177 +73 -61
LT 277 +39 -11 174 +04 +04
LU 124 +83 -101 39 +10 -57
HU 413 +153 -178 237 +03 -37
MT 202 -46 +68 76 -32 +19
NL 140 +04 -05 87 -42 +11
AT 209 +169 -159 97 +78 -73
PL 357 -11 -22 243 -15 -69
PT 191 +08 -11 184 -07 +02
RO 357 +34 -21 185 -03 -63
SI 318 -74 +71 137 +19 -32
SK 361 +29 +07 164 -30 -77
FI 285 +05 -04 217 -16 +06
SE 278 -50 +05 192 -35 +40
IS 190 -10 +21 106 -33 +49
NO 242 +02 +00 158 -02 +06
UK 297 +246 -232 214 +186 -133
Types of unfair commercial practices from domestic retailers
Region
Country
False limited offers Other UCPs
Consumer Survey 2018
89
The overall level of exposure to other UCPs in the European Union is 173 This level is higher in
the North (188) South (195) and East (212) whereas it is lower in the West (136) The highest levels of exposure to other UCPs are observed in Croatia (258) Poland (243) and Hungary (237) The lowest levels of exposure to other UCPs are found in Luxembourg (39) Malta (76) and Cyprus (77)
Compared to 2016 exposure to other UCPs remained stable in the North and South while it increased in the EU27_2019 (+38pp) the West (+93pp) and decreased in the East (-15pp) This type of exposure increased most prominently in Ireland (+161pp) and decreased most substantially in
Bulgaria (-74pp) compared to the survey in 2016 When looking at statistically significant changes in 2018 (vs 2016) and in 2016 (vs 2014) the largest negative reversal is also found in Ireland where the increase between 2016 and 2018 by 161pp (reflecting an increase in the incidence of consumers exposed to other UCPs) follows a decrease of 169pp between 2014 and 2016 No statistically significant positive reversal is found
Q13 options 4-5 (answer 1-domestic retailers) - Base all EU27_2019 respondents (N=24928)
Male 264 194
Female 236 155
18-34 269 B 162 A
35-54 249 AB 172 AB
55-64 261 B 193 B
65+ 215 A 178 AB
Low 218 A 132
Medium 255 B 173 A
High 251 AB 187 A
Very difficult 281 B 224
Fairly difficult 268 B 184 A
Fairly easy 235 A 164 A
Very easy 249 AB 166 A
Rural area 251 A 173 A
Small town 245 A 169 A
Large town 255 A 182 A
Self-employed 268 AB 201 BC
Manager 292 B 233 C
Other white collar 242 A 167 A
Blue collar 246 A 173 AB
Student 220 A 162 AB
Unemployed 242 AB 152 A
Seeking a job 163 185 ABC
Retired 269 AB 159 A
Types of unfair commercial practices from
domestic retailers
False limited
offersOther UCPs
Gender
Age groups
Education
Financial Situation
Urbanisation
Employment status
Consumer Survey 2018
90
Q13 options 4-5 (answer 1-domestic retailers) - Base all EU27_2019 respondents (N=24928)
With regard to socio-demographic variables and other characteristics consumersrsquo vulnerability due
to socio-demographic factors is the factor most closely associated with exposure to false limited offers from domestic retailers The characteristics showing the next closest links are employment status gender language and age
Consumers who are very or somewhat vulnerable in terms of socio-demographic factors are more likely to receive false limited offers from domestic retailers than those who are not vulnerable
Regarding consumersrsquo employment status managers are more likely to receive such offers than
other white collars blue collar workers and students In turn the latter three groups as well as
people who are self-employed unemployed or retired are more likely to be exposed to false limited offers from domestic retailers than people seeking a job
As far as gender is concerned males are more likely to report receiving such false limited offers than are females
Consumers who speak only their native language are less likely to report receiving false limited offers than those who speak two or more languages
Only native 219 159 A
Two 267 A 168 A
Three 272 A 203 B
Four or more 258 A 229 B
Not official
language in home
country
265 A 186 A
Official language
in home country249 A 174 A
Low 238 A 170 A
Medium 244 A 176 A
High 255 A 174 A
Daily 264 B 187 C
Weekly 223 A 146 B
Monthly 185 A 183 BC
Hardly ever 215 AB 134 ABC
Never 186 A 112 A
Very vulnerable 284 A 198 A
Somewhat
vulnerable275 A 201 A
Not vulnerable 228 154
Very vulnerable 252 AB 222 A
Somewhat
vulnerable271 B 194 A
Not vulnerable 243 A 157
False limited
offersOther UCPs
Consumer vulnerability
(complexity)
Types of unfair commercial practices from
domestic retailers
Languages
Mother Tongue
Numerical skills
Internet use
Consumer vulnerability
(socio-demographic
factors)
Consumer Survey 2018
91
Age is also linked to exposure to false limited offers from domestic retailers but not in a linear
manner For consumers aged 18-34 years and 55-64 years a higher proportion has received this UCP than for those aged 65+ years
In terms of exposure to other UCPs from domestic retailers this indicator is associated most closely to gender followed by consumersrsquo language skills vulnerability due to the complexity of offers and terms and conditions education and vulnerability due to socio-demographic factors
Regarding consumersrsquo gender males are more likely to be exposed to other UCPs from domestic retailers than females
Those who speak at least three languages report being more exposed to such practices than those who speak two languages or only their native language
Consumers who are very or somewhat vulnerable in terms of the complexity of offers and terms and conditions are also likely to experience other UCPs from retailers in their own country than those who are not vulnerable
Additionally consumers with a low level of education are less likely to report being exposed to other
UCPs than consumers with a medium or high education level
Finally consumers who are very or somewhat vulnerable in terms of socio-demographic factors are also more likely to be exposed to other UCPs from domestic retailers than those who are not vulnerable
Consumer Survey 2018
92
Unfair commercial practices from cross-border retailers
1021 Exposure to UCPs from cross-border retailers
Average incidence of the UCPs mentioned in Q13 from cross-border retailers (answer 2) - Base all
respondents (N=28037)
In the European Union the overall level of exposure to UCPs from cross-border retailers is 48 Compared to the EU27_2019 average this level is higher in the West (53) North (53) and South (56) whereas it is lower in the East (24)
Compared to 2016 exposure to UCPs from cross-border retailers remained stable in the East while
it increased in the EU27_2019 (+24pp) the North (+08pp) South (+29pp) and West (+36pp)
Region
Country
2018
( = sig
diff EU27)
2018-
2016
2016-
2014
EU27_2019 48 +24 -14
EU28 50 +28 -17
North 53 +08 -03
South 56 +29 +03
East 24 -00 +01
West 53 +36 -35
BE 85 -00 +19
BG 15 +07 -06
CZ 35 +10 -01
DK 67 +18 -12
DE 52 +39 -23
EE 30 +08 -01
IE 113 +97 -84
EL 28 +17 -13
ES 49 +18 -03
FR 47 +37 -59
HR 42 +11 +06
IT 74 +45 +12
CY 43 +26 -26
LV 37 +16 -23
LT 30 +11 -00
LU 81 +53 -104
HU 11 +03 -08
MT 94 +01 +34
NL 22 -07 -00
AT 95 +85 -85
PL 27 -08 +02
PT 11 -02 -06
RO 18 +05 +04
SI 35 -16 +23
SK 30 -04 -05
FI 44 +11 -09
SE 63 -03 +08
IS 33 +18 -10
NO 65 -02 +14
UK 68 +54 -36
Exposure to unfair commercial practices
from cross-border retailers
Consumer Survey 2018
93
In this map values below average are coloured in light and dark green and values above average are coloured
in light and dark red
The highest exposure to UCPs from cross-border retailers is found in Ireland (113) Austria (95)
and Malta (94) The lowest levels of exposure are found in Portugal Hungary (both 11) Bulgaria (15) and Romania (18) Compared to the 2016 survey this type of exposure increased most sharply in Ireland (+97pp) and decreased most prominently in Slovenia (-16pp) When looking at statistically significant changes in 2018 (vs 2016) and in 2016 (vs 2014) the largest
negative reversal is also found in Ireland where the increase of this indicator between 2016 and 2018 (reflecting greater exposure to UCPs) follows a decrease of 84pp between 2014 and 2016
(reflecting lower exposure to UCPs) Similarly the only negative reversal is also found in Slovenia where the decrease between 2016 and 2018 follows an increase of 23pp between 2014 and 2016 (reflecting greater exposure to UCPs)
Consumer Survey 2018
94
Average incidence of the UCPs mentioned in Q13 from cross-border retailers (answer 2) - Base all EU27_2019
respondents (N=24928)
Average incidence of the UCPs mentioned in Q13 from cross-border retailers (answer 2) - Base all EU27_2019
respondents (N=24928)
With regard to socio-demographic variables and other characteristics the number of languages consumers speak is the factor most closely associated with exposure to UCPs from cross-border retailers The characteristics showing the next closest links are employment status age and vulnerability due to the complexity of offers and terms and conditions and education
Consumers who speak four or more languages are more likely to be exposed to UCPs from cross-border retailers than the remainder of the population Those who speak three languages are also more likely to be exposed to these UCPs than those who only speak their native language
Regarding employment status self-employed consumers are more likely exposed to UCPs from cross-border retailers than others In contrast unemployed respondents are the least likely to be exposed to UCPs from cross-border retailers They are less likely to experience such UCPs than managers other white collars blue collar workers the retired and as indicated earlier self-employed
consumers
Concerning consumersrsquo age those who are aged 18-34 years report being exposed to such UCPs more compared to respondents aged 35 or older
Consumers who are more vulnerable in terms of the complexity of offers and terms and conditions also report greater exposure to UCPs from cross-border retailers Specifically those who are very vulnerable and somewhat vulnerable report exposure more than those who are not vulnerable
Finally the proportion of consumers that experienced UCPs from retailers in other EU-countries is higher among those with a low level of education than those with a medium or high level of education
51 45
61 43 A 44 A 45 A
39 49 A 49 A
57 AB 52 B 45 A 51 AB
54 46 A 46 A
67 52 BC 51 C 42 B
39 AB 31 A 38 AB 46 BC
GenderMale Female
Exposure to unfair commercial practices from cross-border retailers
Blue collar
Student
65+
Education levelLow Medium High
Age18-34 35-54 55-64
Very easy
UrbanisationRural area Small town Large town
Financial situationVery difficult Fairly difficult Fairly easy
Unemployed Seeking a job RetiredEmployment status
Self-employed Manager Other white collar
42 A 48 AB 52 B 68
57 A 48 A
45 A 50 A 48 A
52 B 38 A 47 AB 29 A 27 A
48 AB 55 B 45 A
59 A 54 A 44
Four or more
Exposure to unfair commercial practices from cross-border retailers
LanguagesOnly native Two
High
Mother tongue
Not official language
in home country
Official language in
home country
Numerical skillsLow Medium
Three
Consumer
vulnerability
(complexity)
Very vulnerableSomewhat
vulnerableNot vulnerable
Hardly ever Never
Consumer
vulnerability
(socio-demographic
factors)
Very vulnerableSomewhat
vulnerableNot vulnerable
Internet useDaily Weekly Monthly
Consumer Survey 2018
95
1022 Types of UCPs from cross-border retailers
Respondents are relatively less likely to experience UCPs from cross-border retailers than from domestic retailers (see previous section) Persistent sales calls (60) are the most common unfair practices followed by lottery scams (52) and false limited offers (51) Other UCPs and false free products are experienced by 51 and 35 of all consumers respectively
Q13 options 1 2 and 3 (answer 2-cross-border retailers) Base all respondents (N=28037)
In the European Union the overall level of exposure to cross-border lottery scams is 52
Compared to the EU27_2019 average this level is higher in the West (70) and North (77) whereas it is lower in the East (21) and South (43) The highest exposure to cross-border lottery scams is found in Malta (208) Austria (133) and Ireland (132) The lowest levels of exposure are found in Hungary (03) Portugal (08) and Bulgaria (09)
2018
( = sig
diff EU27)
2018-
2016
2016-
2014
2018
( = sig
diff EU27)
2018-
2016
2016-
2014
2018
( = sig
diff EU27)
2018-
2016
2016-
2014
EU27_2019 52 +27 -25 60 +31 -12 35 +16 -10
EU28 52 +28 -28 60 +33 -15 39 +20 -10
North 77 +09 -22 32 +02 +05 46 +09 -02
South 43 +22 -04 91 +45 +17 43 +22 -00
East 21 -05 +01 18 -07 +05 16 +02 -06
West 70 +48 -55 64 +44 -44 37 +20 -20
BE 85 -27 +24 107 -05 +33 77 -17 +39
BG 09 +03 -09 15 +09 -03 13 +08 -03
CZ 46 +09 +11 31 +08 +05 32 +16 -15
DK 118 +27 -41 54 +14 +07 54 +09 -07
DE 71 +59 -35 57 +43 -34 28 +16 -06
EE 44 +09 -29 29 +06 +13 19 +11 -01
IE 132 +101 -161 79 +61 -39 113 +104 -65
EL 25 +14 -14 21 +11 -04 24 +11 -11
ES 32 +21 -13 42 +01 +10 44 +11 -05
FR 59 +49 -90 71 +58 -71 39 +29 -49
HR 44 -04 +07 19 +07 -10 44 +23 +14
IT 59 +29 +08 155 +93 +29 51 +36 +07
CY 60 +33 -54 36 +30 -18 45 +28 -26
LV 48 +25 -78 35 +15 -14 28 +16 -04
LT 26 -04 +09 29 +12 +05 32 +18 -05
LU 99 +65 -169 91 +43 -107 65 +48 -101
HU 03 -07 -10 07 +02 -07 08 -01 -01
MT 208 +11 +48 53 -13 +21 90 +34 +28
NL 45 -17 -06 12 -05 +03 14 -07 +06
AT 133 +128 -128 106 +101 -118 68 +57 -35
PL 18 -10 -02 19 -23 +14 11 -05 -13
PT 08 -03 -17 12 +00 -01 08 -01 -06
RO 17 +01 +09 13 -00 +06 13 +02 +03
SI 43 -48 +50 15 -01 -01 18 +04 -06
SK 30 -01 -17 28 -02 -12 30 -04 -06
FI 60 +10 -28 17 +07 -03 43 +07 -14
SE 88 -03 -04 30 -13 +12 55 +06 +09
IS 23 -05 -32 12 +11 -01 41 +23 +02
NO 95 -01 -10 38 +06 +05 47 -25 +31
UK 55 +40 -43 62 +48 -40 67 +50 -11
Types of unfair commercial practices from cross-border retailers
Region
Country
Lottery scams Persistent sales calls False free products
Consumer Survey 2018
96
Between 2016 and 2018 exposure to cross-border lottery scams remained stable in the East and
North while it increased in the EU27_2019 (+27pp) the South (+22pp) and West (+48pp) Compared to the survey administered in 2016 this type of exposure increased most sharply in Austria (+128pp) and decreased most prominently in Slovenia (-48pp) When looking at statistically significant changes in 2018 (vs 2016) and in 2016 (vs 2014) the largest negative reversal is found in Ireland where between 2016 and 2018 this indicator increased by 101pp (reflecting a higher likelihood of being exposed to such scams) whereas between 2014 and 2016 it decreased by 161pp (reflecting a lower likelihood of being exposed to such scams) The only positive reversal is found in
Slovenia (which also showed the strongest decrease) where between 2016 and 2018 this indicator decreased by 48pp following an increase of 50pp between 2014 and 2016
The overall consumer exposure to persistent sales calls by cross-border retailers in the European Union is 60 In the West this level is in line with the EU27_2019 average while it is higher in the South (91) and lower in the East (18) and North (32) The highest exposure to these types of calls is found in Italy (155) Belgium (107) and Austria (106) Among the EU countries
the lowest levels of exposure are found in Hungary (07) the Netherlands and Portugal (both 12) and Romania (13) The level is low as well in Iceland (12)
Between 2016 and 2018 exposure to persistent sales calls by cross-border retailers remained stable in the North while it increased in the EU27_2019 (+31pp) the West (+44pp) and South (+45pp) and decreased in the East (-07pp) Compared to the survey administered in 2016 this type of exposure increased most prominently in Austria (+101pp) and decreased most prominently in Poland (-23pp) When looking at statistically significant changes in 2018 (vs 2016) and in 2016 (vs
2014) the largest negative reversal is also found in Austria where the increase between 2016 and 2018 (reflecting a higher likelihood of being exposed to such calls) was preceded by a decrease of 118pp between 2014 and 2016 No statistically significant negative reversal is found
The overall consumer exposure to false free products by cross-border retailers is 35 in the European Union In the West this level is in line with the EU27_2019 average while it is higher in the South (43) and North (46) and lower in the East (16) The highest exposure to this type of practice is found in Ireland (113) Malta (90) and Belgium (77) The lowest levels of
exposure are found in Hungary and Portugal (both 08) Poland (11) and Bulgaria and Romania (both 13)
Between 2016 and 2018 consumer exposure to false free products by cross-border retailers remained stable in the East while it increased in the EU27_2019 (+16pp) the North (+09pp) West
(+20pp) and South (+22pp) Compared to the survey administered in 2016 this type of exposure increased most sharply in Ireland (+104pp) When looking at statistically significant changes in 2018
(vs 2016) and in 2016 (vs 2014) the largest negative reversal is also found in Ireland where the increase between 2016 and 2018 (reflecting a higher likelihood of being exposed to false free products) was preceded by a decrease of 65pp between 2014 and 2016 There are no statistically significant decreases amongst the EU Member States and no positive reversals Considering all studied countries the only statistically significant decrease and positive reversal is found in Norway (-25pp) where between 2016 and 2018 this indicator decreased by 25pp (reflecting a lower likelihood of being exposed to false free products) following an increase of 31pp between 2014 and
2016
Consumer Survey 2018
97
Q13 options 1 and 3 (answer 2-cross-border retailers) - Base all EU27_2019 respondents (N=24928)
Male 57 A 58 A 38 A
Female 47 A 63 A 32 A
18-34 51 A 71 B 52 B
35-54 52 A 54 A 29 A
55-64 58 A 59 AB 24 A
65+ 47 A 64 AB 36 AB
Low 41 A 47 A 28 A
Medium 51 A 61 A 35 A
High 55 A 64 A 37 A
Very difficult 54 A 58 AB 45 AB
Fairly difficult 55 A 75 B 42 B
Fairly easy 49 A 56 A 31 A
Very easy 55 A 54 A 34 AB
Rural area 55 A 74 B 41 A
Small town 52 A 59 AB 34 A
Large town 49 A 49 A 32 A
Self-employed 78 D 86 C 46 B
Manager 53 BC 53 AB 39 AB
Other white collar 58 CD 67 BC 32 AB
Blue collar 41 AB 53 AB 37 AB
Student 29 A 35 A 28 AB
Unemployed 25 A 37 A 24 A
Seeking a job 28 A 53 ABC 41 AB
Retired 55 BCD 62 BC 36 AB
Age groups
Types of unfair commercial practices from
cross-border retailers
Lottery scams Persistent sales
calls
False free
products
Gender
Education
Financial Situation
Urbanisation
Employment status
Consumer Survey 2018
98
Q13 options 1 and 3 (answer 2-cross-border retailers) - Base all EU27_2019 respondents (N=24928)
Regarding socio-demographic variables and other characteristics consumer exposure to lottery scams from cross-border retailers is associated most closely with employment status followed by the number of languages consumers speak
Regarding consumersrsquo employment status self-employed consumers are most likely to be exposed
to lottery scams from cross-border retailers They experience such scams more often than all other consumers except for other white collars and the retired In contrast students those who are unemployed and jobseekers are the least likely to be exposed to this UCP and less so than the self-employed managers other white collars or the retired
Concerning the consumersrsquo language skills those who speak only their native language are less likely to be exposed to such scams than those who speak two or more languages
With regards to receiving persistent sales calls from cross-border retailers whether a
consumerrsquos mother tongue is the official language in their country of residence or not is the factor most closely associated with this indicator The characteristics showing the next closest links are vulnerability due to the complexity of offers and terms and conditions employment status the degree of urbanisation and age
Only native 42 59 A 28 A
Two 55 A 58 A 37 AB
Three 57 A 67 A 38 AB
Four or more 68 A 76 A 50 B
Not official
language in home
country
64 A 99 26 A
Official language
in home country51 A 59 36 A
Low 46 A 45 A 33 A
Medium 58 A 63 A 36 A
High 50 A 62 A 35 A
Daily 57 B 61 A 40 B
Weekly 33 A 68 A 24 A
Monthly 55 AB 95 A 33 AB
Hardly ever 43 AB 51 A 15 A
Never 28 A 46 A 12 A
Very vulnerable 48 A 58 A 43 A
Somewhat
vulnerable61 A 64 A 36 A
Not vulnerable 49 A 60 A 33 A
Very vulnerable 60 A 78 A 46 A
Somewhat
vulnerable59 A 79 A 36 A
Not vulnerable 48 A 51 33 A
Types of unfair commercial practices from
cross-border retailers
Consumer vulnerability
(socio-demographic
factors)
Consumer vulnerability
(complexity)
Persistent sales
calls
False free
products
Languages
Mother Tongue
Numerical skills
Internet use
Lottery scams
Consumer Survey 2018
99
Consumers whose mother tongue is not one of the official languages of the country or region in which
they live are more likely to report receiving persistent sales calls from cross-border retailers than those whose mother tongue is not an official language
Consumers who are very or somewhat vulnerable due to the complexity of offers and terms and conditions are also more likely to report receiving persistent cross-border sales calls than those who are not vulnerable
Regarding consumersrsquo employment status those who are self-employed are more likely to receive such calls than managers blue collar workers students and people who are unemployed Other white
collars and those who are retired are also more likely to report this than students and the unemployed
Persons that live in a rural area are more likely to report receiving such calls compared to those living in a large town
As far as age is concerned those aged 18-34 years are more likely to receive cross-border persistent sales calls than those aged 35-54 years Consumers aged 55 years and older do not differ from
younger consumers
Regarding exposure to false offers of free products from cross-border retailers this indicator is associated most closely with age followed by the number of languages spoken and employment status
Young consumers (aged 18-34 years) are more likely to report receiving false offers for free products from retailers in another EU country than those aged 35-64 years Those aged 65 years or older do not differ from other age groups
Consumers who speak at least four languages are more likely to be exposed to cross-border false free offers compared to those who only speak their native language
Finally those who are self-employed are more likely to report receiving such offers than those who are unemployed
Consumer Survey 2018
100
Q13 options 4 and 5 (answer 2-cross-border retailers) Base all respondents (N=28037)
The overall consumer exposure to false limited offers in the European Union is 51 In the North
and West this level is in line with the EU27_2019 average while it is higher in the South (62)
and lower in the East (41) The highest exposure to this type of practice is found in Ireland (130) Luxembourg (111) and Austria (101) The lowest exposure is found in the Netherlands (16) Portugal (18) and Bulgaria (23)
Between 2016 and 2018 consumer exposure to false limited offers by cross-border retailers increased in the EU27_2019 (+26pp) the North (+11pp) West (+34pp) and South (+35pp) while it remained stable in the East Compared to the survey administered in 2016 this type of
exposure increased most prominently in Ireland (+113pp) where also the highest negative reversal is observed The increase between 2016 and 2018 (reflecting higher consumer exposure to false limited offers) came after a decrease of 64pp between 2014 and 2016
2018
( = sig
diff EU27)
2018-
2016
2016-
2014
2018
( = sig
diff EU27)
2018-
2016
2016-
2014
EU27_2019 51 +26 -04 42 +22 -18
EU28 54 +31 -10 46 +28 -21
North 55 +11 +02 54 +08 +01
South 62 +35 +07 43 +22 -05
East 41 +01 +08 25 +07 -05
West 48 +34 -19 48 +32 -38
BE 77 +24 +13 79 +24 -15
BG 23 +09 -07 13 +07 -09
CZ 42 +10 -01 22 +06 -04
DK 46 +17 -16 63 +21 -04
DE 56 +46 -14 48 +34 -26
EE 30 +04 +04 28 +12 +08
IE 130 +113 -64 114 +106 -89
EL 40 +21 -19 28 +25 -18
ES 79 +34 +08 48 +25 -14
FR 27 +16 -24 41 +32 -59
HR 70 +15 +20 34 +13 +01
IT 59 +44 +12 47 +25 +03
CY 62 +32 -16 14 +07 -14
LV 42 +04 -13 30 +19 -07
LT 40 +17 +00 20 +11 -10
LU 111 +88 -64 36 +20 -80
HU 26 +15 -13 12 +07 -10
MT 85 -01 +31 36 -24 +41
NL 16 -04 -03 24 -04 -01
AT 101 +86 -84 66 +51 -58
PL 49 -11 +13 36 +07 -03
PT 18 +06 -05 09 -10 +02
RO 30 +10 +10 15 +12 -09
SI 80 -36 +67 22 -03 +04
SK 44 +03 +06 20 -14 +04
FI 50 +19 +08 52 +13 -06
SE 72 +05 +14 69 -07 +11
IS 40 +25 -04 51 +35 -15
NO 60 -14 +41 87 +25 +02
UK 79 +67 -50 77 +66 -36
Types of unfair commercial practices from cross-border retailers
Region
Country
False limited offers Other UCPs
Consumer Survey 2018
101
Exposure to false limited offers decreased most prominently in Slovenia (-36pp) In addition when
looking at statistically significant changes in 2018 (vs 2016) and in 2016 (vs 2014) the only positive reversal is also found in Slovenia where this indicator increased by 67pp between 2014 and 2016 (reflecting higher consumer exposure to such offers) before it decreased between 2016 and 2018
In the European Union the overall consumer exposure to other cross-border UCPs is 42 In the South this indicator is in line with the EU27_2019 average while it is higher in the West (48) and North (54) and lower in the East (25) Among the EU countries the highest exposure to other cross-border UCPs is found in Ireland (114) Belgium (79) and Sweden (69) Of all studied
countries exposure to other cross-border UCPs is high in the UK (77) and Norway (87) as well The lowest values for this indicator are found in Portugal (09) Hungary (12) and Bulgaria (13)
Between 2016 and 2018 exposure to other cross-border UCPs increased in the EU27_2019 (+22pp) and all the regions (East +07pp North +08pp South +22pp West +32pp) Compared to the survey administered in 2016 the strongest increase in exposure to other UCPs from cross-border
retailers as well as the largest negative reversal is found in Ireland where between 2016 and 2018 this indicator increased by 106pp (reflecting higher consumer exposure to other cross-border UCPs)
whereas between 2014 and 2016 it decreased by 89pp Consumersrsquo exposure to other UCPs from cross-border retailers decreased most prominently in Portugal (-10pp) No statistically significant negative reversal is found
Consumer Survey 2018
102
Q13 options 4 and 5 (answer 2-cross-border retailers) - Base all EU27_2019 respondents (N=24928)
Male 57 47
Female 46 36
18-34 77 51 B
35-54 44 A 36 A
55-64 44 A 37 AB
65+ 32 A 45 AB
Low 46 A 31 A
Medium 55 A 42 A
High 48 A 43 A
Very difficult 73 A 61 AB
Fairly difficult 50 A 38 AB
Fairly easy 49 A 39 A
Very easy 56 A 53 B
Rural area 53 A 48 B
Small town 49 A 36 A
Large town 53 A 44 AB
Self-employed 67 D 59 B
Manager 61 CD 49 AB
Other white collar 57 CD 43 AB
Blue collar 38 AB 41 AB
Student 55 BCD 41 AB
Unemployed 38 ABC 29 A
Seeking a job 29 A 35 AB
Retired 45 ABCD 33 A
Types of unfair commercial practices from
cross-border retailers
False limited
offersOther UCPs
Gender
Age groups
Education
Financial Situation
Urbanisation
Employment status
Consumer Survey 2018
103
Q13 options 4 and 5 (answer 2-cross-border retailers) - Base all EU27_2019 respondents (N=24928)
With regard to socio-demographic variables and other characteristics age is the factor most closely
associated with consumersrsquo exposure to false limited offers from cross-border retailers followed by gender employment status and language
Younger consumers (18-34 years) are more likely to report receiving false limited offers from cross-border retailers than those aged 35 or older
As far as gender is concerned male consumers are more likely to receive cross-border false limited offers than females
Regarding consumersrsquo employment status consumers who are self-employed report being exposed
to this UCP most often Their exposure is higher than the exposure for blue collar job workers jobseekers or those who are unemployed The proportion of people reporting this is also higher among managers and other white collars than it is among blue collar workers and jobseekers Students likewise report this more than people seeking a job
Only native 46 A 34 A
Two 51 AB 41 A
Three 51 AB 45 A
Four or more 73 B 73
Not official
language in home
country
39 A 61 A
Official language
in home country52 A 41 A
Low 46 A 57 A
Medium 56 A 37 A
High 50 A 42 A
Daily 56 C 46 B
Weekly 32 B 30 AB
Monthly 34 ABC 19 A
Hardly ever 08 A 20 A
Never 30 B 19 A
Very vulnerable 46 A 46 AB
Somewhat
vulnerable63 53 A
Not vulnerable 47 A 36 B
Very vulnerable 61 A 51 A
Somewhat
vulnerable56 A 40 A
Not vulnerable 48 A 42 A
False limited
offersOther UCPs
Consumer vulnerability
(complexity)
Types of unfair commercial practices from
cross-border retailers
Languages
Mother Tongue
Numerical skills
Internet use
Consumer vulnerability
(socio-demographic
factors)
Consumer Survey 2018
104
Finally consumers who speak four or more languages are more likely to be exposed to false limited
offers than those speaking only their native language
Higher exposure to other UCPs from cross-border retailers is associated most closely to the number of languages spoken followed by the consumersrsquo gender internet use urbanisation and age
Consumers who speak at four languages or more are more likely to be exposed to such practices than consumers who speak fewer languages
Concerning gender males are more likely to report being exposed to such practices than females
Consumers who use the internet daily are also more likely to report having greater exposure to other UCPs from cross-border retailers compared to those who use the internet monthly or less
Consumers from rural areas are more likely to report exposure to other UCPs from cross-border retailers than consumers from small towns
Finally regarding the consumersrsquo age exposure is reported more often by those who are aged 18-34 years than those aged 35-54 years
Consumer Survey 2018
105
Other illicit commercial practices from domestic retailers
1031 Exposure to other illicit commercial practices from domestic retailers
The average exposure to illicit commercial practices from domestic retailers (Q16a_121 and Q16a_2 answer
option 1 and Q16b_1 and Q16b_2 answer option 1) ndash Base All respondents (N=28037)
21 Q16a Now I will read you some statements about problems consumers may have more generally when shopping Please tell me whether you have experienced any of them during the last 12 monthshellip -Yes with retailers or services providers located in (our country) -Yes with retailers or services providers located in another EU country -Yes but you donrsquot know in which country the retailers or services providers were located -No -DKNA
Q16a1 You have encountered unfair terms and conditions in a contract (for instance enabling the provider to change the contract terms unilaterally or imposing excessive penalties for breach of the contract) Q16a2 You have had to pay unanticipated extra charges Q16b Now I will read you some statements about problems consumers may have more generally when shopping Please tell me whether you have experienced any of them when buying in (our country) during the last 12 monthshellip -Yes ndashNo ndashDKNA Q16b1 You have encountered unfair terms and conditions in a contract (for instance enabling the provider to change the contract terms unilaterally or imposing excessive penalties for breach of the contract) Q16b2 You have had to pay unanticipated extra charges
Region
Country
2018
( = sig
diff EU27)
2018-
2016
2016-
2014
EU27_2019 106 +16 -38
EU28 112 +31 -47
North 90 -09 +15
South 141 +17 -39
East 122 -19 -33
West 76 +38 -48
BE 96 -08 -02
BG 190 -27 -34
CZ 78 -01 -19
DK 78 -02 +17
DE 63 +30 -33
EE 110 +07 +15
IE 151 +118 -138
EL 210 +94 -73
ES 121 -28 -31
FR 95 +69 -81
HR 211 -31 +06
IT 152 +39 -44
CY 74 +11 -37
LV 150 -11 -07
LT 105 +11 -33
LU 53 +32 -29
HU 124 -25 -49
MT 118 -61 +62
NL 50 -21 -01
AT 44 +23 -54
PL 106 -20 -29
PT 102 +08 -21
RO 144 -13 -50
SI 78 -18 +03
SK 99 -39 -42
FI 74 -07 +23
SE 87 -22 +30
IS 103 -33 +29
NO 67 -18 -07
UK 156 +134 -111
Exposure to other illicit commercial
practices from domestic retailers
Consumer Survey 2018
106
In the European Union the overall consumer exposure to other illicit commercial practices from
domestic retailers is 106 Compared to the EU27_2019 average this indicator is higher in the East (122) and South (141) whereas it is lower in the West (76pp) and North (90) The highest exposure to other illicit commercial practices from domestic retailers is found in Croatia (211) Greece (210) and Bulgaria (190) The lowest exposure to such practices is found in Austria (44) the Netherlands (50) and Luxembourg (53)
Between 2016 and 2018 consumer exposure to other illicit commercial practices from domestic retailers increased in the EU27_2019 (+16pp) the South (+17pp) and West (+38pp) whereas it
decreased in the North (-09pp) and East (-19pp) Compared to the 2016 survey this type of exposure increased most sharply in Ireland where also the largest negative reversal is found In this country between 2016 and 2018 the indicator increased by 118pp (reflecting higher consumer exposure to other illicit commercial practices) whereas between 2014 and 2016 it decreased by 138pp The largest decrease and positive reversal are found in Malta where between 2016 and 2018 this indicator decreased by 61pp (reflecting lower consumer exposure to other illicit
commercial practices) following an increase of 62pp between 2014 and 2016
Consumer Survey 2018
107
1032 Types of other illicit commercial practices from domestic retailers
When it comes to other illicit commercial practices experienced from domestic retailers consumers are somewhat more likely to face unfair terms and conditions (119) than unanticipated extra charges (93)
Percentage of ldquoYesrdquo responses in Q16a_1 and Q16b_1 answer option 1 and in Q16a_2 and Q16b_1 answer
option 1 ndash Base All respondents (N=28037)
In the European Union the overall consumer exposure to unfair contract terms and conditions from domestic retailers is 119 Compared to the EU27_2019 average this level is higher in the East (132) and South (182) whereas it is lower in the West (73) and North (85) The
highest consumer exposure to unfair contract terms and conditions from domestic retailers is found in Croatia (226) Greece (212) and Bulgaria (206) The lowest consumer exposure to such practices is found in Austria (44) Luxembourg (46) and the Netherlands (49)
2018
( = sig
diff EU27)
2018-
2016
2016-
2014
2018
( = sig
diff EU27)
2018-
2016
2016-
2014
EU27_2019 119 +21 -45 93 +11 -32
EU28 123 +35 -54 102 +26 -41
North 85 -11 +13 95 -08 +18
South 182 +31 -43 100 +03 -36
East 132 -27 -36 113 -12 -30
West 73 +44 -58 78 +32 -37
BE 92 +13 -13 99 -29 +09
BG 206 -50 -32 175 -05 -35
CZ 97 -07 -24 60 +04 -14
DK 55 -01 +15 102 -03 +20
DE 65 +42 -40 60 +17 -25
EE 122 +08 +16 99 +06 +14
IE 143 +120 -172 158 +116 -105
EL 212 +104 -71 208 +85 -74
ES 171 -32 -41 71 -24 -21
FR 85 +62 -99 106 +77 -62
HR 226 -42 +05 196 -19 +08
IT 197 +68 -42 106 +10 -45
CY 65 +14 -42 84 +09 -32
LV 147 -14 -24 152 -08 +10
LT 112 +09 -31 97 +12 -36
LU 46 +30 -36 61 +34 -22
HU 174 +09 -55 74 -58 -44
MT 110 -72 +79 125 -50 +44
NL 49 -09 +13 51 -34 -15
AT 44 +25 -67 44 +21 -40
PL 93 -39 -37 120 -02 -21
PT 122 +22 -31 81 -05 -10
RO 163 -12 -42 125 -14 -59
SI 82 -21 +12 75 -16 -07
SK 132 -53 -57 67 -26 -27
FI 86 -13 +20 61 -01 +26
SE 75 -23 +28 99 -22 +32
IS 73 -18 -01 134 -49 +60
NO 53 -03 -02 80 -34 -11
UK 152 +136 -119 160 +132 -103
Exposure to other illicit commercial practices from domestic retailers
Region
Country
Unfair terms and conditions Unanticipated extra charges
Consumer Survey 2018
108
Compared to 2016 exposure to unfair contract terms and conditions from domestic retailers
increased in the EU27_2019 (+21pp) in the South (+31pp) and West (+44pp) while it decreased in the North (-11) and the East (-27) Exposure to unfair contract terms increased most sharply in Ireland where also the largest negative reversal is found In this country between 2016 and 2018 the indicator increased by 120pp (reflecting higher consumer exposure to unfair contract terms and conditions) whereas between 2014 and 2016 it decreased by 172pp
In contrast in Malta exposure to unfair contract terms decreased most prominently which also represents the only positive reversal Between 2016 and 2018 this indicator decreased by 72pp
(reflecting a development towards a lower consumer exposure to unfair contract terms and conditions) whereas between 2014 and 2016 it increased by 79pp
The overall consumer exposure to unanticipated extra charges from domestic retailers is 93 in the European Union In the North and South this indicator is in line with the EU27_2019 average while exposure levels are higher in the East (113) and lower in the West (78) In the EU the highest exposure to unanticipated extra charges from domestic retailers is found in Greece (208)
Croatia (196) and Bulgaria (175) The lowest consumer exposure to such practices is found in Austria (44) the Netherlands (51) and the Czech Republic and Germany (both 60)
Between 2016 and 2018 exposure to unanticipated extra charges from domestic retailers increased in the EU27_2019 (+11pp) the West (+32pp) and decreased in the East (-12pp) while it remained stable in the North and South For this indicator as well exposure to unanticipated extra charges increased most sharply in Ireland (+116pp reflecting higher exposure to unanticipated extra charges) which is a negative reversal compared to the decrease of 105pp between 2014 and 2016
Exposure to unanticipated extra charges decreased most prominently in Hungary (-58pp) compared to the 2016 survey The largest negative reversal in the EU is also found in Hungary where between 2016 and 2018this indicator decreased by 58pp (reflecting lower consumer exposure to unanticipated extra charges) whereas between 2014 and 2016 it increased by 44pp
Considering all countries in the study the highest negative reversal is found in the UK where between 2016 and 2018 this indicator increased by 132pp (reflecting higher consumer exposure to such charges) whereas between 2014 and 2016 it decreased by 103pp The highest positive
reversal is found in Iceland where between 2016 and 2018 this indicator decreased by 49pp (reflecting lower consumer exposure to such charges) whereas between 2014 and 2016 it increased by 60pp
Consumer Survey 2018
109
In these maps values below average are coloured in light and dark green and values above average are coloured in light and dark red
Consumer Survey 2018
110
The average exposure to illicit commercial practices from domestic retailers (Q16a_1 and Q16a_2 answer
option 1 and Q16b_1 and Q16b_2 answer option 1) ndash Base all EU27_2019 respondents (N=24928)
Male 119 142 95 A
Female 95 98 92 A
18-34 123 C 129 A 118
35-54 109 BC 124 A 94 B
55-64 99 AB 112 A 85 AB
65+ 83 A 102 A 64 A
Low 87 A 96 A 79 A
Medium 102 A 114 A 91 A
High 116 132 100 A
Very difficult 132 C 134 AB 133
Fairly difficult 115 BC 130 B 99 B
Fairly easy 97 A 112 A 82 A
Very easy 100 AB 108 AB 92 AB
Rural area 102 A 110 A 94 AB
Small town 102 A 118 AB 87 A
Large town 117 131 B 102 B
Self-employed 119 B 125 B 114 B
Manager 119 AB 140 B 98 AB
Other white collar 107 AB 123 B 92 AB
Blue collar 108 AB 119 B 97 AB
Student 91 A 80 A 96 AB
Unemployed 103 AB 108 AB 95 AB
Seeking a job 115 AB 151 B 81 AB
Retired 95 AB 110 AB 80 A
Age groups
Exposure to other illicit commercial
practices from domestic retailersTotal
Unfair terms and
conditions
Unanticipated
extra charges
Gender
Education
Financial Situation
Urbanisation
Employment status
Consumer Survey 2018
111
The average exposure to illicit commercial practices from domestic retailers (Q16a_1 and Q16a_2 answer option 1 and Q16b_1 and Q16b_2 answer option 1) ndash Base all EU27_2019 respondents (N=24928)
With regard to socio-demographic variables and other characteristics whether a consumerrsquos mother tongue is the official language in their country of residence or not is the factor most closely associated with consumer exposure to other illicit commercial practices from domestic retailers Other characteristic showing close links with the indicator are vulnerability due to socio-demographic
factors gender vulnerability due to the complexity of offers and terms and conditions and age
Consumers whose mother tongue is not one of the official languages of the country or region in which they live are more likely to be exposed to illicit commercial practices from domestic retailers than those whose mother tongue is not an official language
Consumers who are very vulnerable in terms of socio-demographic factors are more likely to report being exposed to illicit commercial practices from domestic retailers than those who are somewhat vulnerable who in turn report higher exposure to such practices than those who are not vulnerable
Regarding consumersrsquo gender males are more likely to be exposed to such practices than females Consumers aged 18-34 years are more likely to report being exposed to such practices than those aged 55-64 years and 65+ years
Only native 95 108 A 82 A
Two 110 A 122 AB 97 AB
Three 117 A 135 B 100 AB
Four or more 119 A 126 AB 112 B
Not official
language in home
country
154 175 133
Official language
in home country104 117 91
Low 97 A 107 A 88 A
Medium 103 A 116 A 90 A
High 110 A 123 A 96 A
Daily 109 C 123 B 95 B
Weekly 111 C 126 B 96 B
Monthly 138 BC 158 AB 116 AB
Hardly ever 65 A 77 A 54 A
Never 82 AB 84 A 83 AB
Very vulnerable 142 148 A 137
Somewhat
vulnerable115 134 A 97
Not vulnerable 89 102 76
Very vulnerable 131 A 145 A 119 A
Somewhat
vulnerable122 A 137 A 107 A
Not vulnerable 95 107 82
Exposure to other illicit commercial
practices from domestic retailers
Consumer vulnerability
(socio-demographic
factors)
Consumer vulnerability
(complexity)
Unfair terms and
conditions
Unanticipated
extra charges
Languages
Mother Tongue
Numerical skills
Internet use
Total
Consumer Survey 2018
112
In terms of encountering unfair terms and conditions from domestic retailers this indicator is
associated most closely with whether a consumersrsquo mother tongue is the official language in their country of residence or not Other characteristics with close links with the indicator are gender vulnerability due to socio-demographic factors vulnerability due to the complexity of offers and terms and conditions and internet use
Those whose mother tongue does not correspond to one of the official languages of the country or region they live in are more likely to encounter such unfair terms and conditions than those whose mother tongue is one of the official languages
Regarding consumersrsquo gender males are more likely to report encountering unfair terms and conditions from domestic retailers than females
Consumers who are very or somewhat vulnerable in terms of socio-demographic factors are more likely to report encountering unfair terms and conditions compared to consumers who are not vulnerable
Similarly consumers who are very or somewhat vulnerable in terms of the complexity of offers and
terms and conditions are also more likely to report encountering unfair terms and conditions than those who are not vulnerable
As far as internet use is concerned daily and weekly internet users are likely to encounter unfair terms and conditions than those who use the internet hardly ever or never
Whether a consumersrsquo mother tongue is the official language in their country of residence or not is also associated most closely with consumersrsquo exposure to unanticipated extra charges from domestic retailers The characteristics showing the next closest links are vulnerability due to socio-
demographic factors age vulnerability due to the complexity of offers and terms and conditions and the degree of urbanisation
Those whose mother tongue is not one of the official languages of the country or region they live in report receiving such unanticipated charges more likely than those whose mother tongue is one of the official languages
Consumers who are very vulnerable in terms of socio-demographic factors are more likely to report
receiving unanticipated extra charges than who are somewhat vulnerable who in turn are more likely
to report receiving such charges than those who are not vulnerable
Regarding age younger consumers (18-34 years) are also more likely to receive unanticipated extra charges from domestic retailers than those aged 35-54 years who in turn are more likely to receive such charges than those aged 65 years and older
Consumers who are very or somewhat vulnerable in terms of the complexity of offers and terms and conditions also report exposure to unanticipated extra charges more than those who are not
vulnerable
Finally consumers living in a large town are more likely to report receiving such charges than those living in a small town
Consumer Survey 2018
113
1033 Exposure to other illicit commercial practices from cross-border
retailers
The average exposure to illicit commercial practices from cross-border retailers (Q16a_1 and Q16a_2 answer
option 2) ndash Base Respondents who shopped in another EU country (N=10741)
In the European Union the overall consumer exposure to other illicit commercial practices from cross-border retailers is 36 In the North and West consumer exposure is in line with the EU27_2019 average whereas it is higher in the South (48) and lower in the East (20) Among the EU Member States the highest exposure to other illicit commercial practices from cross-border
retailers is found in Ireland (98) Malta (78) and Luxembourg (65) The lowest levels of exposure to such practices are found in Hungary (10) the Czech Republic (11) and Poland (17)
Between 2016 and 2018 exposure to other illicit commercial practices from cross-border retailers remained unchanged in the EU27_2019 and all regions In the EU27_2019 this type of exposure increased most sharply in Ireland (+62pp) while no statistically significant decreases are recorded
Region
Country
2018
( = sig
diff EU27)
2018-
2016
2016-
2014
EU27_2019 36 +01 -03
EU28 40 +04 -04
North 39 -03 +05
South 48 +08 +06
East 20 +00 -09
West 35 -02 -06
BE 44 +01 -18
BG 26 +10 -28
CZ 11 +07 -11
DK 36 -12 +09
DE 31 -08 +02
EE 20 -02 +03
IE 98 +62 -38
EL 32 +12 -08
ES 43 -06 +11
FR 29 -12 -09
HR 43 +08 +02
IT 55 +17 +03
CY 52 +13 -27
LV 37 +07 -06
LT 42 +22 -25
LU 65 +12 -49
HU 10 +04 -45
MT 78 -14 +30
NL 24 +08 -04
AT 44 +20 -13
PL 17 -03 -00
PT 24 -04 +15
RO 23 -11 +04
SI 34 +04 +08
SK 25 +04 -28
FI 29 +06 -25
SE 49 -12 +30
IS 54 +29 +01
NO 53 +04 +10
UK 65 +29 -13
Exposure to other illicit commercial
practices from cross-border retailers
Consumer Survey 2018
114
at country level When looking at changes in 2018 (vs 2016) and in 2016 (vs 2014) the strongest
negative reversal is also found in Ireland where the increase between 2016 and 2018 follows a decrease of 38pp between 2014 and 2016 (reflecting lower exposure to such charges) No statistically significant positive reversal is found
1034 Types of other illicit commercial practices from cross-border retailers
In contrast to other illicit commercial practices from domestic retailers unanticipated extra charges (44) are somewhat more common from cross-border retailers than unfair terms and conditions (28)
Percentage of ldquoYesrdquo responses in Q16a_1 and Q16a_2 ndash Base Respondents who shopped in another EU country
(N=10741)
In the European Union the overall consumer exposure to unfair contract terms and conditions from cross-border retailers is 28 In the North South and West the results are in line with the
2018
( = sig
diff EU27)
2018-
2016
2016-
2014
2018
( = sig
diff EU27)
2018-
2016
2016-
2014
EU27_2019 28 +01 +02 44 +00 -08
EU28 32 +03 +04 48 +06 -12
North 32 +01 +05 46 -08 +05
South 26 +02 -02 70 +14 +14
East 16 -01 -03 23 +02 -16
West 32 +01 +06 38 -06 -18
BE 25 +07 -20 64 -04 -15
BG 32 +16 -36 20 +03 -19
CZ 15 +16 07 -03 -08
DK 21 +09 +00 50 -33 +18
DE 39 +08 +19 23 -23 -15
EE 08 -09 +06 32 +06 -01
IE 54 +26 -08 142 +99 -68
EL 03 -07 -23 60 +31 +08
ES 28 -18 +03 58 +07 +19
FR 20 -24 +02 39 -01 -21
HR 21 -04 -11 66 +20 +15
IT 28 +15 -06 82 +18 +13
CY 40 +12 -23 64 +14 -31
LV 27 +07 -19 46 +07 +07
LT 40 +23 -18 44 +20 -33
LU 44 +01 -32 87 +24 -66
HU 07 +06 -33 13 +03 -57
MT 50 -25 +59 105 -04 +02
NL 19 +03 +05 29 +13 -13
AT 55 +39 -08 34 +00 -18
PL 14 -05 +10 20 -02 -11
PT 15 -09 +16 33 +02 +14
RO 13 -24 +23 33 +03 -16
SI 23 -04 +00 45 +12 +17
SK 26 -01 -14 23 +10 -42
FI 35 +12 -27 23 -01 -22
SE 39 -18 +37 59 -06 +22
IS 24 +05 +13 84 +53 -11
NO 31 +11 -03 75 -03 +23
UK 59 +17 +15 70 +41 -41
Exposure to other illicit commercial practices from cross-border
retailers
Region
Country
Unfair terms and conditions Unanticipated extra charges
Consumer Survey 2018
115
EU27_2019 average while a lower level is noted in the East (16) While the results for most of
the EU Member States are in line with the EU27_2019 average higher levels are observed in Austria (55) Ireland (54) while lower levels are found in Estonia (08) Hungary (07) and Greece (03) The highest level of exposure among all studied countries is found in the UK (59)
Consumer exposure to unfair contract terms and conditions from cross-border retailers did not undergo any statistically significant change between 2016 and 2018 in the EU27_2019 nor in all regions Compared to the 2016 survey this type of exposure increased most sharply in Austria (+39pp) No statistically significant decreases and positive or negative reversals are found
The overall consumer exposure to unanticipated extra charges from cross-border retailers is 44 in the European Union The results in the North and West are in line with the EU27_2019 average whereas they are higher in the South (70) and lower in the East (23) The highest exposure to unanticipated extra charges from cross-border retailers is found in Ireland (142) Malta (105) and Luxembourg (87) The lowest levels of exposure to such practices are found in the Czech Republic (07) Hungary (13) Poland and Bulgaria (both 20)
Compared to 2016 consumer exposure to unanticipated extra charges from cross-border retailers
remained stable in the EU27_2019 and in all regions Among the EU Member States it only increased in Ireland (+99pp) whereas no statistically significant decreases are observed When looking at changes in 2018 (vs 2016) and in 2016 (vs 2014) the largest negative reversal is also found in Ireland where the increase of this indicator (reflecting higher consumer exposure to unanticipated extra charges) follows a decrease of 68pp between 2014 and 2016 (reflecting lower consumer exposure to such extra charges) No positive reversals are found
Consumer Survey 2018
116
The average exposure to illicit commercial practices from cross-border retailers (Q16a_1 and Q16a_2 answer
option 2) ndash Base EU27_2019 respondents who shopped in another EU country (N= 9447) N=9365 for unfair terms and conditions N = 9436 for unanticipated extra charges
Male 39 A 30 A 48 A
Female 32 A 25 A 40 A
18-34 43 B 23 A 64 C
35-54 29 A 27 A 33 AB
55-64 41 AB 45 A 42 BC
65+ 26 AB 36 A 19 A
Low 23 A 10 35 A
Medium 34 A 24 A 44 A
High 39 A 33 A 45 A
Very difficult 47 A 51 A 43 AB
Fairly difficult 41 A 18 A 63 B
Fairly easy 31 A 28 A 35 A
Very easy 41 A 36 A 46 AB
Rural area 39 A 23 A 56 A
Small town 34 A 26 A 42 A
Large town 36 A 34 A 39 A
Self-employed 55 C 36 B 75 B
Manager 39 ABC 28 AB 50 AB
Other white collar 31 AB 22 AB 40 A
Blue collar 26 AB 25 AB 28 A
Student 48 BC 65 B 43 AB
Unemployed 45 ABC 31 AB 62 AB
Seeking a job 42 ABC 34 AB 48 AB
Retired 20 A 15 A 23 A
Age groups
Exposure to other illicit commercial
practices from cross-border retailersTotal
Unfair terms and
conditions by
cross-border
retailers
Unanticipated
extra charges by
cross-borer
retailers
Gender
Education
Financial Situation
Urbanisation
Employment status
Consumer Survey 2018
117
The average exposure to illicit commercial practices from cross-border retailers (Q16a_1 and Q16a_2 answer
option 2) ndash Base EU27_2019 respondents who shopped in another EU country (N= 9447) N=9365 for unfair terms and conditions N = 9436 for unanticipated extra charges
With regard to socio-demographic variables and other characteristics the variable associated most closely with consumer exposure to other illicit commercial practices from cross-border retailers is vulnerability due to the complexity of offers and terms and conditions followed by employment status and age
Consumers who are very vulnerable in terms of the complexity of offers and terms and conditions are more likely to report exposure to such practices than those who are not vulnerable
Regarding consumersrsquo employment status those who are self-employed are most likely to be exposed to other illicit commercial practices from cross-border retailers and more so than other white collars blue collar workers or those who are retired
Finally consumers aged 18-34 years are more likely to report being exposed to such practices than
those aged 35-54 years
In terms of unfair terms and conditions by cross-border retailers vulnerability due to the complexity of offers and terms and conditions is the factor most closely associated with this illicit
Only native 28 A 24 A 32 A
Two 38 A 31 A 46 A
Three 36 A 25 A 48 A
Four or more 42 A 29 A 54 A
Not official
language in home
country
54 A 45 A 65 A
Official language
in home country35 A 27 A 43 A
Low 37 A 21 A 53 A
Medium 43 A 28 A 58 A
High 33 A 28 A 39 A
Daily 37 A 29 B 44 A
Weekly 27 A 04 A 52 A
Monthly 16 A 33 A
Hardly ever 17 A 09 AB 26 A
Never 32 A 18 AB 57 A
Very vulnerable 44 A 40 A 50 A
Somewhat
vulnerable33 A 26 A 40 A
Not vulnerable 36 A 26 A 45 A
Very vulnerable 57 B 66 B 51 A
Somewhat
vulnerable43 AB 35 AB 50 A
Not vulnerable 31 A 21 A 42 A
Exposure to other illicit commercial
pracitces from cross-border retailers
Consumer vulnerability
(socio-demographic
factors)
Consumer vulnerability
(complexity)
unfair terms and
conditions by
cross-border
retailers
unanticipated
extra charges by
cross-borer
retailers
Languages
Mother Tongue
Numerical skills
Internet use
Total
Consumer Survey 2018
118
commercial practice Other characteristics with close links with this indicator are education and
employment status
Consumers who are very vulnerable in terms of the complexity of offers and terms and conditions are also more likely to report exposure to unfair terms and conditions by cross-border retailers than those who are not vulnerable
Regarding consumersrsquo education level those with a medium or high level of education are more likely to report encountering such practices than those with a low level of education
Finally consumer that are self-employed and students are more likely to report exposure to unfair
terms and conditions by cross-border retailers than those who are retired
With regards to unanticipated extra charges by cross-border retailers age and employment status are the factors that are linked closely with the indicator
Consumers aged 18-34 years are more likely to report being exposed to such practices than those aged 35-54 years and 65+ years Consumers aged 55-64 are also more likely to report exposure to
such practices than consumers aged 65+ years
Finally persons that are self-employed are more likely to report exposure to such practices than other white collars blue collar workers and those who are retired
Consumer Survey 2018
119
In these maps values below average are coloured in light and dark green and values above average are coloured in light and dark red
Consumer Survey 2018
120
11 OVERALL PROBLEMS AND DISPUTE RESOLUTION
This chapter looks at the overall level of problems that consumers experience with online purchases as well as the actions they take in terms of making complaints to different sectors (retailer or service
provider manufacturer public authority out-of-court dispute resolution body (ADR) or other) along with their overall satisfaction with problem resolution and the time it took to resolve problems This chapter additionally observes the reasons that consumers reported for not taking actions
The problems and complaints indicator
Due to relatively small sample sizes achieved when asking respondents about problems they
experienced the actions they took to resolve them and their satisfaction with complaint handling a composite indicator on problems and complaints was developed based on data gathered with four survey questions
1) problems experienced buying or using any goods or services domestically
2) the type of action taken to resolve the problem
3) satisfaction with complaint handling
4) the reason for not taking action if applicable
Based on the four questions above a hierarchy of 11 exhaustive (all respondents) and mutually exclusive (each respondent belongs to only one) scenarios was developed2223 The result of this hierarchy is a problems and complaints indicator the higher the value of the indicator the lower the overall level of problems and the higher the overall satisfaction with complaint handling
22 The scenarios were developed by DG JUST with the scientific cooperation with the Joint Research Centre and Member States experts They are based on the following principlesassumptions a) The ideal situation is the one where a person has not experienced any problem b) when one or more problems are experienced the best thing to do is to complain about it unless the decision not to complain is justified solely by the small detriment associated with the problem(s) c) complaining to the retailerprovidermanufacturer indicates a less serious problem andor is less burdensome for the consumer than complaining to third parties (public authority ADR or court) d) The final outcome of the complaint process also matters (result being satisfactory or not)
23 The additional advantage of combining the answers to the different questions in specific scenarios is that a higher rate of complaining behaviour is not automatically seen as better for consumer conditions (unless combined with a satisfactory response) and that not complaining because of small detriment is not penalised For detailed information on the composition of the composite indicator see chapter 221 of Van Roy V Rossetti F Piculescu V (2015) Consumer conditions in the EU revised framework and empirical investigation JRC science and policy report JRC93404 httpseceuropaeujrcenpublicationeur-scientific-and-technical-research-reportsconsumer-conditions-eu-revised-framework-and-empirical-investigation To make it easier to understand how the indicator is built below are three example scenarios of the problems and complaints indicator (most favourable medium and worst scenario) bull Most favourable scenario the consumer did not have any problem or the consumer does not know if he had a problem or not In this scenario the problems and complaints indicator is 98 bull Intermediate scenario the consumer had had a problem and he DID complain about it NEITHER to the retailer NOR the manufacturer However he complained about it to another party and he did get a satisfactory result from any of these parties In this scenario the problems and complaints indicator is equal to 45 bull Worst scenario the consumer had a problem and the low sum involved is NOT among the reasons why he did not complain In this scenario the problems and complaints indicator is equal to 11
Consumer Survey 2018
121
The problems and complaints composite indicator (which can have a score from 11 to 98 see footnote 23) is
computed based on pre-defined scenarios using data gathered in Q924 Q1025 Q1126 and Q1227 - Base all respondents (N=28037)
24 Q9 In the past 12 months have you experienced any problem when buying or using any goods or services in (our country) where you thought you had a legitimate cause for complaint -Yes and you took action to solve the problem -Yes but you did not do anything ndashNo -DKNA
25 Q10 And what did you do - You complained about it to the retailer or service provider -You complained about it to the manufacturer -You complained about it to a public authority -You brought the matter to an out-of-court dispute resolution body (ADR) such as an ombudsman arbitration mediation or conciliation body -You took the business concerned to court ndashOther -DKNA
26 Q11 In general how satisfied or dissatisfied were you with the way your complaint(s) was (were) dealt with by thehellip -Very satisfied ndashFairly satisfied ndashNot very satisfied ndashNot at all satisfied ndashOther ndashDKNA
Q111 Retailer or service provider Q112 Manufacturer Q113 Public authority Q114 An out-of-court dispute resolution body (ADR) Q115 Court
27 Q12 What were the main reasons why you did not take any action -You were unlikely to get a satisfactory solution to the problem you encountered -The sums involved were too small -You did not know how or where to complain -You were not sure of your rights as a consumer -You thought it would take too long -You tried to complain about other problems in the past but were not successful -You thought complaining would have led to a confrontation and you do not feel at ease in such situations ndashOther -DKNA
Region
Country
2018
( = sig
diff EU27)
2018-
2016
2016-
2014
EU27_2019 888 -01 +10
EU28 885 -05 +11
North 901 -01 -01
South 869 -14 +12
East 875 +06 +31
West 895 -06 +01
BE 907 -11 -03
BG 879 +04 +35
CZ 897 +03 -03
DK 911 -12 -04
DE 906 +05 -10
EE 874 -02 -19
IE 874 -20 +24
EL 860 -52 +61
ES 875 -21 +25
FR 905 +00 00
HR 826 -31 +45
IT 860 -08 +40
CY 921 +41 -38
LV 878 -20 +30
LT 863 -17 +10
LU 927 +28 -27
HU 898 +28 +08
MT 889 +29 -37
NL 904 +03 +10
AT 936 +34 -18
PL 882 +11 +18
PT 894 +16 -26
RO 830 -07 +00
SI 917 -13 +10
SK 909 +26 -03
FI 897 +01 +08
SE 915 +14 -11
IS 879 -08 -11
NO 899 +01 -05
UK 863 -35 +18
Problems and complaints
Consumer Survey 2018
122
The problems and complaints indicator is equal to 888 in the European Union Compared to the
EU27_2019 average this indicator is higher in the West (906) and the North (901) whereas it is lower in the South (869) and East (875) The highest levels of the problems and complaints indicator are found in Austria (936) Luxembourg (927) and Cyprus (921) The lowest levels of the problems and complaints indicator are found in Croatia (826) Romania (830) Italy and Greece (both 860)
In this map values above average are coloured in light and dark green and values below average are coloured in light and dark red
Compared to 2016 the level of the problems and complaints indicator remained stable in the
EU27_2019 the North East and West regions whereas it decreased in the South (-14p38) The problems and complaints indicator increased most prominently in Cyprus (+41p) and decreased most prominently in Greece (-52p) In this regard the largest negative and positive reversals are
38 points
Consumer Survey 2018
123
found in Cyprus and Greece respectively In Cyprus the increase between 2016 and 2018 was
preceded by a decrease of 38p between 2014 and 2016 In Greece the problems and complaints indicator increased by 61p between 2014 and 2016 followed by the decrease between 2016 and 2018
The problems and complaints composite indicator is computed based on pre-defined scenarios using data
gathered in Q9 Q10 Q11 and Q1239 ndash Base all EU27_2019 respondents (N=24928)
The problems and complaints composite indicator is computed based on pre-defined scenarios using data
gathered in Q9 Q10 Q11 and Q12 ndash Base all EU27_2019 respondents (N=24928)
With regard to socio-demographic variables and other characteristics vulnerability due to the complexity of offers and terms and conditions is associated most closely with the problems and complaints indicator The characteristics showing the next closest links are consumersrsquo financial situation education employment status and age
Consumers who are not vulnerable in terms of the complexity of offers and terms and conditions have the highest scores on the problems and complaints indicator and thus have experienced a lower
overall level of problems and higher satisfaction with complaint handling) than those who are somewhat vulnerable who in turn have higher scores than those who are very vulnerable
Consumers with a very easy financial situation score higher on the problems and complaints indicator than those who report their situation to be fairly or very difficult Those with a fairly easy financial
39 Problems and complaints rescaled is based on the following function problems_complaints_rescaled=(100-0)(098-011)(problems_complaints_score-098)+100
889 A 900 A
876 A 892 AB 905 B 911 B
914 A 899 A 884
862 A 887 AB 901 BC 908 C
899 A 890 A 895 A
864 A 885 AB 898 BCD 901 BCD
920 CD 881 ABC 922 D 895 ABCD
Unemployed Seeking a job RetiredEmployment status
Self-employed Manager Other white collar
Financial situationVery difficult Fairly difficult Fairly easy
UrbanisationRural area Small town Large town
Blue collar
Student
65+
Education levelLow Medium High
Age18-34 35-54 55-64
Very easy
GenderMale Female
Problems and complaints
896 A 894 A 887 A 900 A
876 A 895 A
899 A 892 A 895 A
887 A 908 B 914 AB 906 AB 931 B
891 A 887 A 899 A
846 887 905
Hardly ever Never
Consumer
vulnerability
(socio-demographic
factors)
Very vulnerableSomewhat
vulnerableNot vulnerable
Internet useDaily Weekly Monthly
Consumer
vulnerability
(complexity)
Very vulnerableSomewhat
vulnerableNot vulnerable
LanguagesOnly native Two
High
Mother tongue
Not official
language in home
country
Official language in
home country
Numerical skillsLow Medium
Three Four or more
Problems and complaints
Consumer Survey 2018
124
situation do not differ from those with a fairly difficult situation but score higher than those with very
difficult situation
Regarding consumersrsquo level of education those with a low or medium level of education score higher on this indicator than those with a high level of education
As far as employment status is concerned those who are seeking a job score higher on the problems and complaints indicator than those who are unemployed managers and self-employed Those who are self-employed have the lowest scores on this indicator and lower than other white collars blue collar workers and students
Finally older consumers tend to score higher on the indicator with those aged 65+ years and 55-64 years scoring higher than those aged 18-34 years
1111 No problems
Percentage of Total ldquoNordquo (answers 3 or 4 at Q9) Base all respondents (N=28037)
Region
Country
2018
( = sig
diff EU27)
2018-
2016
2016-
2014
2014-
2012
EU27_2019 796 -03 +17 +32
EU28 780 -22 +26 +32
North 801 +02 +03 +87
South 753 -46 +53 -08
East 766 +17 +08 +34
West 842 +16 -01 +51
BE 844 -16 +07 +22
BG 847 +06 +49 +95
CZ 801 +15 -27 +156
DK 831 -18 -03 +78
DE 831 +13 +10 +102
EE 763 -23 -19 +25
IE 726 -102 +69 +45
EL 805 -97 +92 +126
ES 783 -55 +60 +59
FR 874 +33 -20 -32
HR 695 -41 +60 +18
IT 706 -45 +59 -92
CY 897 +63 -55 +265
LV 808 -23 +44 +26
LT 786 -44 +09 +39
LU 854 +41 -65 -18
HU 760 +26 +27 +08
MT 829 +55 -68 +15
NL 778 +02 -07 +138
AT 886 +52 +05 +28
PL 760 +46 +15 +43
PT 825 +25 -46 +42
RO 728 -26 -21 -72
SI 844 -20 -07 +89
SK 796 +20 +12 +103
FI 730 +03 +09 +35
SE 832 +34 -05 +159
IS 780 -16 +05 +20
NO 781 -16 -19 +185
UK 663 -160 +90 +38
No problems
Consumer Survey 2018
125
In the European Union the likelihood that consumers do not experience any problem is equal to
796 In the North this incidence is in line with the EU27_2019 average while higher levels are observed in the West (842) and the North (801) and lower levels are observed in the South (753) and the East (766) Among the EU countries the highest proportion of consumers that did not encounter any problem is found in Cyprus (897) Austria (886) and France (874) The lowest levels of this indicator are found in Croatia (695) Italy (706) and Ireland (726) Among all studied countries the UK has the lowest score (663)
Compared to 2016 the proportion of persons not having experienced a problem remained stable in
the EU27_2019 and in the North whereas a decrease is observed in the South (-46pp) and an increase is observed in the East (+17pp) and in the West (+16pp) The level of this indicator increased most prominently in Cyprus (+63pp) and decreased most noticeably in Ireland (-102pp)
The largest positive reversal is observed in Malta where between 2016 and 2018 the proportion of consumers that did not experience problems increased by 55pp whereas between 2014 and 2016 it decreased by 68pp The largest negative reversal in the EU27_2019 is observed in Greece where
between 2016 and 2018 this indicator decreased by 97pp following an increase of 92pp between 2014 and 2016 When we consider all countries of the survey an even larger negative reversal can
be observed in the UK where after it had increased by 90pp between 2014 and 2016 it decreased by 160pp between 2016 and 2018
Percentage of Total ldquoNordquo (answers 3 or 4 at Q9) ndash Base all EU27_2019 respondents (N=24928)
Percentage of Total ldquoNordquo (answers 3 or 4 at Q9) ndash Base all EU27_2019 respondents (N=24928)
With regard to socio-demographic variables and other characteristics not having experienced problems is associated most closely with vulnerability due to the complexity of offers and terms and conditions followed by frequency of internet use age education and gender
783 807
765 791 A 821 B 823 AB
833 A 804 A 777
756 A 792 AB 799 B 811 B
798 A 793 A 796 A
766 A 779 AB 789 AB 813 B
817 B 783 AB 816 AB 806 AB
GenderMale Female
No problems
Blue collar
Student
65+
Education levelLow Medium High
Age18-34 35-54 55-64
Very easy
UrbanisationRural area Small town Large town
Financial situationVery difficult Fairly difficult Fairly easy
Unemployed Seeking a job RetiredEmployment status
Self-employed Manager Other white collar
808 A 794 A 782 A 775 A
773 A 796 A
819 A 800 A 789 A
779 820 A 843 AB 866 AB 888 B
791 A 791 A 799 A
728 782 810
Four or more
No problems
LanguagesOnly native Two
High
Mother tongue
Not official language
in home country
Official language in
home country
Numerical skillsLow Medium
Three
Consumer
vulnerability
(complexity)
Very vulnerableSomewhat
vulnerableNot vulnerable
Hardly ever Never
Consumer
vulnerability
(socio-demographic
factors)
Very vulnerableSomewhat
vulnerableNot vulnerable
Internet useDaily Weekly Monthly
Consumer Survey 2018
126
Consumers who are not vulnerable in terms of the complexity of offers and terms and conditions are
most likely to not experience problems than those who are somewhat vulnerable who in turn are more likely to not experience problems than those who are very vulnerable
Regarding the frequency of internet use daily internet users are less likely not to experience problems than other consumers In addition weekly internet users are also less likely not to experience problems than those who never use the internet
Consumers aged 18-34 are less likely not to experience problems compared to those who are older In turn consumers aged 35-54 report less often that they have experienced no problems compared
to those aged 55-64
As far as consumersrsquo education level is concerned those with a high level of education experience problems less often than those with a low or medium level of education
Finally female consumers are more likely to not experience problems than male consumers
1112 No complaint
This indicator refers to the proportion of respondents who did not make any complaint even though the problems they faced cannot be defined as negligible (ie the sums involved were not too small)
Base Respondents who experienced a problem but did not take any action to solve it (Answer 2 in Q9) and this
was not because the sums involved were too small (Answer 2 in Q12 is excluded) (N=5798)
Region
Country
2018
( = sig
diff EU27)
2018-
2016
2016-
2014
EU27_2019 156 -35 +19
EU28 136 -65 +42
North 126 +26 -09
South 148 -36 -16
East 161 -07 -31
West 165 -61 +97
BE 136 -19 +15
BG 394 -40 +15
CZ 84 -39 -11
DK 121 +32 +29
DE 111 -115 +169
EE 181 -30 +60
IE 148 -174 +111
EL 415 -82 -26
ES 142 +05 -12
FR 314 +35 -07
HR 178 -08 -22
IT 122 -63 -16
CY 317 -74 +161
LV 272 +99 -52
LT 238 -33 -51
LU 103 -129 +80
HU 74 -74 +19
MT 184 -09 +51
NL 80 -10 +16
AT 132 -109 +204
PL 108 +05 -28
PT 124 -33 +52
RO 284 -08 -103
SI 136 +20 -68
SK 99 -15 +29
FI 48 -09 -38
SE 114 +46 +15
IS 168 +27 +15
NO 130 +09 -13
UK 52 -233 +193
Non-negligible problems but no complaint
Consumer Survey 2018
127
The proportion of consumers who experienced a problem but did not take action (the reason for that
not being that the sums involved are too small) is 156 in the European Union In the West East and South the results are in line with the EU27_2019 average while they are lower in the North (126) Among the EU countries28 the highest levels of this indicator are found in Greece (415) Bulgaria (394) and Cyprus (317) whereas the lowest levels are found in Finland (48) Hungary (74) and the Netherlands (80) Among all studied countries the UK (52) also has a low level of this indicator
Compared to 2016 the percentage of consumers who did not complain despite the sums involved
decreased in the EU27_2019 (-35pp) the West (-61pp) and the South (-36pp) while it remained unchanged in the North and the East Compared to the survey in 2016 the level of the indicator increased most steeply in Latvia (+99pp) and decreased most sharply in Ireland (-174pp) The largest positive reversal in the EU27_2019 is found in Austria where between 2016 and 2018 this indicator decreased by 109pp (reflecting a decrease in the incidence of consumers with non-negligible problems) while between 2014 and 2016 it increased by 204pp Considering all countries
in the survey the UK shows an even stronger decrease and positive reversal with a decrease of 233pp between 2016 and 2018 following an increase of 193pp between 2014 and 2016 No statistically significant negative reversals are observed
Base Respondents from the EU who experienced a problem but did not take any action to solve it (Answer 2 in
Q9) and this was not because the sums involved were too small (Answer 2 in Q12 is excluded) (N=5057)
Base Respondents from the EU who experienced a problem but did not take any action to solve it (Answer 2 in
Q9) and this was not because the sums involved were too small (Answer 2 in Q12 is excluded) (N=5057)
Regarding socio-demographic variables and other characteristics the proportion of consumers not taking any action despite experiencing non-negligible problems is associated most closely with the
28 Results for the following countries are based on a very small sample size (less than 100 observations) and should therefore be considered as mainly indicative Malta (87) Luxembourg (73) Cyprus (53)
144 A 160 A
154 A 143 A 157 A 166 A
135 A 137 A 174 A
220 A 183 A 135 91
144 A 160 A 150 A
188 A 170 A 137 A 166 A
154 A 197 A 141 A 125 A
GenderMale Female
Non-negligible problems but no complaint
Blue collar
Student
65+
Education levelLow Medium High
Age18-34 35-54 55-64
Very easy
UrbanisationRural area Small town Large town
Financial situationVery difficult Fairly difficult Fairly easy
Unemployed Seeking a job RetiredEmployment status
Self-employed Manager Other white collar
170 A 158 A 138 A 70
137 A 153 A
180 A 171 A 137 A
140 A 152 AB 148 AB 386 B 263 B
186 B 169 AB 130 A
144 A 143 A 158 A
Four or more
Non-negligible problems but no complaint
LanguagesOnly native Two
High
Mother tongue
Not official language
in home country
Official language in
home country
Numerical skillsLow Medium
Three
Consumer
vulnerability
(complexity)
Very vulnerableSomewhat
vulnerableNot vulnerable
Hardly ever Never
Consumer
vulnerability
(socio-demographic
factors)
Very vulnerableSomewhat
vulnerableNot vulnerable
Internet useDaily Weekly Monthly
Consumer Survey 2018
128
consumerrsquos financial situation languages spoken internet use and vulnerability related to socio-
demographic factors
Consumers who report their financial situation to be fairly or very difficult are more likely to take no action than those whose situation is fairly easy The latter are in turn less likely to take action than those whose situation is very easy
Those who speak three or fewer languages are less likely to take action compared to those speaking at least four languages Between consumers who speak only their native language two languages or three languages there is no difference in this regard
Daily internet users are less likely to take action than those who use the internet hardly ever or never
Finally very vulnerable consumers in terms of socio-demographic factors are less likely to complain when experiencing a non-negligible problem than consumers that are not vulnerable
Consumer Survey 2018
129
Actions taken to resolve problems (breakdown by kind of action plus no
action taken)
The most common actions consumers engage in when they experience a problem is to complain to the retailer or service provider (852) This is followed by complaints to the manufacturer (157)
and a public authority (61) Only a relatively small share of consumers addresses their problems via an ADR platform (55) or takes the business to court (24)
Q10 Answers 1 and 2 Base Respondents who experienced a problem and took action to solve it (N=4381)
In the European Union 852 of the consumers that experienced a problem and took action to solve it complained directly to the retailer or service provider In the North the South and the East the findings are in line with the EU27_2019 average while they are lower in the West (819)
2018
( = sig
diff EU27)
2018-
2016
2016-
2014
2014-
2012
2018
( = sig
diff EU27)
2018-
2016
2016-
2014
2014-
2012
EU27_2019 852 +87 -46 -33 157 -53 +44 +30
EU28 871 +144 -107 -24 178 -59 +56 +39
North 854 -31 +00 -20 110 +05 -18 +27
South 878 +22 +59 -43 243 +77 -26 +36
East 861 -22 +67 -46 124 -20 +15 +38
West 819 +260 -249 -14 104 -223 +152 +18
BE 795 +25 -69 +74 164 -22 -38 +76
BG 617 -74 +90 -272 67 -23 +07 +29
CZ 876 -24 -07 -68 129 +27 -25 +31
DK 826 -28 -03 -38 176 -48 +53 +35
DE 812 +311 -272 -39 108 -242 +176 +08
EE 878 +26 -108 +107 95 +01 +56 -53
IE 915 +396 -373 -19 181 -202 +244 +35
EL 780 +29 +88 +03 218 +106 -66 -57
ES 836 -08 +22 -54 207 +01 -23 +87
FR 794 +325 -367 +103 53 -366 +199 +05
HR 862 -32 +22 +17 145 +19 -13 -00
IT 908 +46 +87 -55 282 +125 -11 +15
CY 766 -105 +110 -108 92 +15 -84 +37
LV 852 -07 -43 +117 61 +05 -10 -19
LT 762 +54 +16 -48 53 +19 -107 +116
LU 819 +295 -209 +42 263 -62 +64 +184
HU 937 +11 +45 -23 63 +50 -76 -04
MT 872 +31 -08 -56 83 -70 +66 -37
NL 858 -05 +05 -49 104 -26 +10 +12
AT 847 +403 -459 -10 152 -162 +187 +11
PL 838 -67 +78 -22 123 -46 +15 +64
PT 870 -01 -60 +105 97 +09 -121 +48
RO 880 +74 +121 +36 188 -20 +140 -37
SI 933 -44 +46 +10 41 +07 -52 +38
SK 935 +70 +69 -164 69 -50 -64 +108
FI 875 -54 +67 -26 139 +29 -87 +17
SE 872 -35 -33 -11 69 -03 +09 +09
IS 950 +36 -50 +40 105 +28 +38 -26
NO 832 -35 +48 -71 108 +14 -15 +09
UK 940 +601 -611 +20 257 -245 +241 +88
Actions taken to resolve problems
Region
Country
Complained to the retailer or service
providerComplained to the manufacturer
Consumer Survey 2018
130
Among the EU countries29 the highest levels of this indicator are found in Hungary (937) Slovakia
(935) and Slovenia (933) Of all studied countries Iceland (950) and the UK (940) have a high level as well The lowest levels are found in Bulgaria (617) Lithuania (762) and Cyprus (766)
The proportion of respondents who complained to the retailer or service provider increased between 2016 and 2018 in the EU27_2019 (+87pp) and the West (+260pp) while no statistically significant changes are observed in the North South and East Among all EU countries the proportion of consumers who complained to the retailer or service provider increased most steeply in Austria
(+403pp) and decreased most prominently in Poland (-67pp) When looking at changes in 2018 (vs 2016) and in 2016 (vs 2014) the largest positive reversal in the EU27_2019 is also found in Austria where the increase between 2016 and 2018 comes after a decrease of 459pp between 2014 and 2016 Among all countries the UK shows an even larger positive reversal where between 2016 and 2018 this indicator increased by 601pp whereas between 2014 and 2016 it decreased by 611pp The only negative reversal is found in Poland where the large decrease between 2016 and
2018 (see above) was preceded by an increase of 78pp between 2014 and 2016
In the European Union the proportion who complained to the manufacturer is 157 Compared
to the EU27_2019 average this proportion is higher in the South (243) and lower in the West (104) the North (110) and the East (124) Among the EU countries the highest levels of this indicator are found in Italy (282) Luxembourg (263) and Greece (218) Furthermore the UK (257) also has high levels for this indicator The lowest levels are found in Slovenia (41) France and Lithuania (both 53) and Latvia (61)
Compared to 2016 the proportion of consumers who complained to the manufacturer decreased in the EU27_2019 (-53pp) and the West (-223pp) increased in the South (+77pp) and remained stable in the North and East The likelihood that consumers would complain to manufacturers directly increased most markedly in Italy (+125pp) and decreased most prominently in France (-366pp) The only positive reversal is found in Hungary where between 2016 and 2018 this indicator increased by 50pp whereas between 2014 and 2016 it decreased by 76pp The largest negative reversal is found in France where the large decrease in the proportion of respondents that complained to a
manufacturer between 2016 and 2018 (see above) comes after an increase of 199pp between 2014 and 2016
29 Results (for both retailersservice providers and manufacturers) for the following countries are based on a very small sample size (less than 100 observations) and they should be therefore considered as mainly indicative Greece (94) Austria (90) Bulgaria (83) Iceland (81) France (76) Malta (69) Luxembourg (49) Cyprus (25)
Consumer Survey 2018
131
Q10 Answers 1 and 2 Base Respondents from the EU who experienced a problem and took action to solve it
(N=3758 for complaints to retailer or service provider N=3748 for complaints to manufacturer)
Male 834 178
Female 877 136
18-34 851 A 189 B
35-54 858 A 118 A
55-64 844 A 157 AB
65+ 859 A 244 B
Low 714 246 A
Medium 849 A 161 A
High 881 A 145 A
Very difficult 773 A 173 A
Fairly difficult 842 AB 163 A
Fairly easy 880 B 159 A
Very easy 837 AB 139 A
Rural area 836 A 200 B
Small town 882 136 A
Large town 835 A 152 AB
Self-employed 851 ABC 179 ABC
Manager 854 ABC 138 ABC
Other white collar 876 BC 189 BC
Blue collar 850 AB 145 ABC
Student 919 C 111 AB
Unemployed 872 ABC 189 ABC
Seeking a job 879 ABC 268 C
Retired 773 A 96 A
Actions taken to resolve problems
Complained to the
retailer or service
provider
Complained to the
manufacturer
Gender
Age groups
Education
Financial Situation
Urbanisation
Employment status
Consumer Survey 2018
132
Q10 Answers 1 and 2 Base Respondents from the EU who experienced a problem and took action to solve it
(N=3758 for complaints to retailer or service provider N=3748 for complaints to manufacturer)
With regard to socio-demographic variables and other characteristics education is associated most
closely with the proportion of persons who complains to retailers or service providers The characteristics showing the next closest links are consumersrsquo gender urbanisation numerical skills and employment status
Consumers with a high or medium level of education are more likely to complain directly to retailers or service providers than those who have a low level of education
Regarding gender females are more likely to complain to the retailer or service provider than males
Consumers who live in a small town are more likely to complain to the retailer or service provider than those living in a rural area or a large town
Those with a high numerical skill level are more likely to complain to retailers or service providers than those with a medium skill level
Finally students are more likely to have made such complaints compared to the retired and blue-collar workers Other white collars are also more likely to have made such complaints than people who are retired
Only native 846 AB 159 A
Two 843 A 156 A
Three 873 AB 178 A
Four or more 897 B 131 A
Not official
language in home
country
826 A 139 A
Official language
in home country855 A 160 A
Low 799 AB 104 A
Medium 813 A 198
High 880 B 147 A
Daily 844 A 165 B
Weekly 893 A 96 A
Monthly 902 AB 167 AB
Hardly ever 984 B 287 AB
Never 893 A 90 AB
Very vulnerable 848 A 152 A
Somewhat
vulnerable880 A 146 A
Not vulnerable 840 A 168 A
Very vulnerable 850 A 165 AB
Somewhat
vulnerable859 A 202 B
Not vulnerable 856 A 138 A
Complained to the
retailer or service
provider
Complained to the
manufacturer
Consumer vulnerability
(complexity)
Actions taken to resolve problems
Languages
Mother Tongue
Numerical skills
Internet use
Consumer vulnerability
(socio-demographic
factors)
Consumer Survey 2018
133
With regards to complaints to the manufacturer this indicator is most closely linked with gender
followed by age degree of urbanisation and employment status
Regarding gender males are more likely to complain to the manufacturer than females
Consumers who are aged 18-34 years and 65+ years are more likely to make such types of complaints than those who are aged 35-54 years
Consumers living in a rural area are more likely to make such complaints than those living in a small town
Finally jobseekers and other white collars are more likely to complain to the manufacturer compared
to those who are retired
Q10 Answers 3 4 and 5 Base Respondents who experienced a problem and took action to solve it (N=4381)
In the European Union the proportion of consumers that complains to a public authority is 61 In the South and the East this proportion is consistent with the EU27_2019 average whereas it is
lower in the North (43) and the West (41) The highest levels of this indicator in the
2018
( = sig
diff EU27)
2018-
2016
2016-
2014
2014-
2012
2018
( = sig
diff EU27)
2018-
2016
2016-
2014
2014-
2012
2018
( = sig
diff EU27)
2018-
2016
2016-
2014
2014-
2012
EU27_2019 61 -28 +11 +31 55 +03 -14 +16 24 +08 -12 +10
EU28 67 -24 +12 +26 64 +13 -18 +14 25 +09 -12 +09
North 43 -01 +10 +07 22 -15 -06 +26 07 -03 +09 -02
South 78 +09 -32 +29 84 +10 -11 +28 29 +04 +06 +04
East 70 -01 +22 +22 30 -20 +18 +02 07 -06 -05 +09
West 41 -92 +48 +40 49 +15 -41 +12 34 +24 -37 +19
BE 113 +63 -16 -24 95 +02 +27 -89 21 -18 +13 -18
BG 159 +49 -50 +95 22 -111 +28 +70 12 +02 +00 +01
CZ 53 +31 -25 -15 37 +29 -07 +08 06 +05 -21 +30
DK 30 -04 +00 -10 15 -21 -08 +23 14 -18 +37 00
DE 34 -117 +95 +16 23 -11 -24 +15 35 +27 -28 +31
EE 39 -60 +58 -39 34 -36 +29 +14 00 00 00 00
IE 95 -10 +39 +60 61 +43 -47 +47 32 +25 -00 -13
EL 257 +89 -149 +203 82 -53 -08 +55 38 +15 +15 -08
ES 121 -32 +14 +45 114 -45 +58 +32 27 -15 +14 +13
FR 40 -125 -37 +123 121 +115 -150 -44 38 +37 -99 -59
HR 55 +38 -32 +29 19 -07 +07 +21 12 -02 +08 -14
IT 45 +24 -44 +28 73 +45 -47 +36 29 +09 +04 +00
CY 139 -15 -19 +111 58 -08 +64 +16 00 00 00 00
LV 94 -44 +28 +30 28 -10 +27 -04 14 +14 -08 +02
LT 145 +74 -26 +78 35 -13 +10 +14 23 +14 -14 +08
LU 82 -86 +29 +149 21 -11 -131 +46 21 +22 -67 -52
HU 21 -04 -50 +46 05 -08 +01 -06 00 -06 +06 +04
MT 78 -80 -06 +136 00 -45 -37 +69 00 00 -21 +15
NL 26 -06 -12 +08 25 -39 +33 +03 35 +05 -17 +35
AT 35 -188 +115 +87 28 -28 -25 +69 20 +11 -08 -07
PL 60 -08 +44 +15 36 -45 +38 -11 05 -06 -17 +21
PT 44 -10 -73 +50 39 -23 -09 +11 34 +36 -12 -20
RO 138 -32 +66 +26 40 +36 -01 +11 16 -17 +30 -42
SI 65 +53 -11 -02 28 +17 -23 +19 06 +06 -10 +05
SK 13 -37 +12 -01 00 -09 -08 +15 00 -14 -05 +18
FI 25 +09 -13 +10 14 -17 -22 +39 00 -07 +07 -09
SE 35 -10 +32 -05 27 -09 -05 +25 07 +01 +06 -02
IS 27 +21 -08 -03 00 -11 +01 -14 00 -20 +20 -15
NO 08 +00 -00 -13 26 +05 +04 -04 08 +08 -04 -10
UK 90 -18 +21 -05 100 +59 -45 +06 28 +08 -08 +05
Actions taken to resolve problems
Region
Country
Complained to a public authority Complained to ADR Took the business concerned to court
Consumer Survey 2018
134
EU27_201930 are found in Greece (257) Bulgaria (159) and Lithuania (145) The lowest
levels among the EU countries are found in Slovakia (13) Hungary (21) and Finland (25) Considering all studied countries the level is also low in Norway (08)
Compared to 2016 the proportion of consumers who complains towards a public authority decreased in the EU27_2019 (-28pp) and the West (-92pp) while it remained relatively stable in the North the East and the South This indicator increased most steeply in Slovenia (+53pp) and decreased most prominently in Austria (-188pp) When looking at statistically significant changes in 2018 (vs 2016) and in 2016 (vs 2014) the only positive reversal is found in Croatia where between 2016
and 2018 this indicator increased by 38pp whereas between 2014 and 2016 it decreased by 32pp The largest negative reversal is found in Austria where the proportion of consumers that took action by complaining to a public authority decreased between 2016 and 2018 (see above) after it increased by 115pp between 2014 and 2016
The proportion of consumers who experienced a problem and complained to an ADR is 55 in the European Union In the West this is in line with the EU27_2019 average while it is higher in the
South (84) and lower in the North (22) and the East (30) Among the EU countries the highest levels of this indicator are found in France (121) Spain (114) and Belgium (95)
Besides these countries the proportion is also high in the UK (100) The lowest levels are found in Malta Slovakia (both 00) Hungary (05) and Finland (14) In addition the level is also very low in Iceland (00)
Between 2016 and 2018 the proportion of consumers who brought their complaints to an ADR remained stable in the EU27_2019 in the North South and West while a decrease is observed in
the East (-20pp) At country level the highest increase compared to the 2016 survey is found in France (+115pp) In France also the largest positive reversal is found where the increase between 2016 and 2018 comes after a decrease of 150p between 2016 and 2018 The sharpest decrease in the degree to which matters were brought to an ADR is found in Bulgaria (-111pp) No negative reversals are observed
In the European Union the proportion of consumers that take their complaints to court is 24 This indicator is in line with the EU27_2019 average in the South and the West whereas it is
noticeable lower in the North and the East (both 07) The highest values in the EU Member States are found in France (38) Greece (38) Germany (35) and the Netherlands (35) whereas the lowest values are found in Estonia Cyprus Hungary Malta Slovakia and Finland (all 0) Consumers in Iceland are also highly unlikely to bring their complaints to a court (0)
Compared to 201640 consumers are more likely to take a business to court in the EU27_2019 (+08pp) and the West (+24pp) while the results remained stable in the North the South and the
East Compared to the survey in 2016 there is only one statistically significant change for this indicator namely an increase in Portugal (+36pp) No positive or negative reversals are found
30 Results (for public authority ADR and court) for the following countries are based on a very small sample size (less than 100 observations) and they should be therefore considered as mainly indicative Greece (94) Austria (90) Bulgaria (83) Iceland (81) France (76) Malta (69) Luxembourg (49) Cyprus (25)
40 As discussed in the Introduction of this report (see chapter 125) different methodologies are applied for the 2018 estimations (weighted on age gender phone ownership and population size) and the 2018-2016 comparisons (weighted on age gender and population size no phone ownership) making it impossible to compute the 2016 values For example it may appear that the incidence is less than 0 in 2016 (eg in Luxembourg the table shows 21 in 2018 and an increase between 2016 and 2018 of 22pp indicating a 2016 result of -01) If the same weighting is applied the values are close to 0
Consumer Survey 2018
135
Q10 Answers 3 4 and 5 Base Respondents who experienced a problem and took action to solve it (N=3748
for public authoritiesADR N=3670 for court)
Male 76 73 27 A
Female 45 36 21 A
18-34 55 AB 31 A 16 A
35-54 82 B 52 AB 23 A
55-64 65 B 58 AB 32 A
65+ 28 A 162 B 53 A
Low 49 A 67 A 46 A
Medium 57 A 54 A 22 A
High 69 A 55 A 22 A
Very difficult 83 AB 89 AB 68 B
Fairly difficult 85 B 71 B 45 B
Fairly easy 40 A 49 AB 14 A
Very easy 60 AB 35 A 11 A
Rural area 57 A 58 A 27 A
Small town 53 A 53 A 16 A
Large town 76 A 57 A 33 A
Self-employed 75 C 108 C 26 AB
Manager 44 ABC 67 ABC 11 A
Other white collar 38 AB 53 AB 22 AB
Blue collar 81 C 84 BC 45 B
Student 125 BC 25 A 24 AB
Unemployed 58 ABC 42 ABC 20 AB
Seeking a job 22 A 66 ABC 19 AB
Retired 98 C 26 A 22 AB
Age groups
Actions taken to resolve problemsComplained to a
public authority
Complained to
ADR
Took the business
concerned to court
Gender
Education
Financial Situation
Urbanisation
Employment status
Consumer Survey 2018
136
Q10 Answers 3 4 and 5 Base Respondents who experienced a problem and took action to solve it (N=3748
for public authoritiesADR N=3670 for court)
In terms of complaints made to a public authority this indicator is most closely linked with gender followed by consumersrsquo employment status and age
Males are more likely to complain to a public authority than females
In addition jobseekers are less likely to make complaints to a public authority than those who are
self-employed blue collar workers retired and students
Regarding age consumers aged 35-64 years are more likely to complain than those who are aged
65+ years
In terms of complaints made to an ADR this indicator is most closely linked with gender followed by age consumersrsquo employment status and their financial situation
Similar to complaints made to a public authority males are more likely to file their complaints with an ADR than females
Consumers aged 65+ years are more likely to have complained to an ADR than those aged 18-34 years
Only native 58 A 67 A 18 A
Two 61 A 50 A 30 A
Three 65 A 37 A 17 A
Four or more 64 A 77 A 44 A
Not official
language in home
country
115 A 67 A 05
Official language
in home country58 A 55 A 26
Low 82 A 66 A 53 A
Medium 58 A 66 A 25 A
High 61 A 49 A 20 A
Daily 59 A 57 A 27 B
Weekly 61 A 39 A 11 AB
Monthly 169 A 117 A
Hardly ever 99 A 49 A
Never 82 A 43 A 08 A
Very vulnerable 76 A 51 A 34 A
Somewhat
vulnerable59 A 54 A 10
Not vulnerable 57 A 58 A 29 A
Very vulnerable 75 A 66 A 24 A
Somewhat
vulnerable63 A 43 A 25 A
Not vulnerable 57 A 58 A 25 A
Actions taken to resolve problems
Consumer vulnerability
(socio-demographic
factors)
Consumer vulnerability
(complexity)
Complained to
ADR
Took the business
concerned to court
Languages
Mother Tongue
Numerical skills
Internet use
Complained to a
public authority
Consumer Survey 2018
137
In terms of employment self-employed respondents are more likely to complain to an ADR than
other white collars students and those who are retired People in a blue-collar job are also more likely to complain than students and people who are retired
Finally consumers in a fairly difficult financial situation are more likely to involve an ADR than consumers in a very easy financial situation
In terms of taking the business concerned to court this indicator is associated most closely with consumersrsquo financial situation Other characteristics that show close links with the indicator whether a consumerrsquos mother tongue is the official language in their country of residence or not the frequency
of internet use and consumersrsquo employment status
Consumers in a reportedly more difficult financial situation are more likely to take the business concerned to court Those whose situation is reportedly fairly or very difficult are more likely to take such action than those whose situation is reported as fairly or very easy
Those whose mother tongue is one of the official languages of the country or region in which they live are more likely to take the business concerned to court than those whose mother tongue is not
an official language
In terms of internet use daily internet users are more likely to take the business to court than consumers that never use the internet
Finally blue collar workers are more likely to take the business concerned to court than managers
Reasons for not taking action
The reasons why a considerable proportion of consumers that experiences problems do not act (see section 1112) differ widely The most commonly cited reasons are consumersrsquo perception that it would take long to resolve the problem (412) that the sums involved are too small (357) and that consumers find it unlikely to get a satisfactory solution (340) A considerable proportion of consumers are also not comfortable with potential confrontations resulting from complaints (185) have unsuccessfully complained in the past (18) are not sure of their own rights as consumers (179) or do not know where or how to complain (172)
Consumer Survey 2018
138
Q12 Answers 1 2 and 3 Base Respondents who experienced a problem but did not take any action to solve it (N=1417)
2018
( = sig
diff EU27)
2018-
2016
2016-
2014
2014-
2012
2012-
2011
2018
( = sig
diff EU27)
2018-
2016
2016-
2014
2014-
2012
2012-
2011
2018
( = sig
diff EU27)
2018-
2016
2016-
2014
2014-
2012
2012-
2011
EU27_2019 340 +119 -162 +118 -91 357 +18 +05 -27 -43 172 +28 -85 +51 +80
EU28 366 +167 -213 +125 -80 397 +57 -08 -30 -44 201 +50 -91 +38 +85
North 259 -02 -60 +151 -91 372 -39 -47 -02 +116 126 -14 -57 +112 +53
South 425 +141 -92 +84 -120 454 +153 -18 +46 -31 195 +32 -99 +87 +117
East 310 -51 +86 +45 -138 297 -52 +99 -170 -29 162 +01 +42 -12 +27
West 269 +167 -404 +228 +33 277 -85 -57 +52 -03 159 +36 -168 +49 +140
BE 252 +248 -458 +142 -29 307 +257 -397 +135 -107 180 +39 -120 +12 +42
BG 358 +38 -89 +176 -207 178 +88 -105 -24 +02 69 +14 -66 +01 +62
CZ 389 +62 -137 +74 -46 552 +148 +114 -143 +183 205 -61 +05 +78 +127
DK 237 -69 +65 +165 -49 251 -79 -264 -43 +510 47 -140 +112 +105 +26
DE 126 -14 -262 +165 +72 288 -165 -58 +73 -151 134 +20 -188 +147 +31
EE 219 -90 +107 +129 -72 410 +60 -91 +105 +53 61 -15 -48 +53 +08
IE 500 +359 -229 +11 -117 425 +164 +67 -70 -15 284 +131 -200 +246 -25
EL 426 +18 +49 +50 -12 275 +82 +10 -58 -154 331 +133 -104 -25 +182
ES 548 +203 -187 +280 +93 456 +54 -35 +84 -133 283 -83 -34 +250 +164
FR 354 +330 -554 +267 -52 247 -02 -137 +89 +76 173 +45 -161 -88 +269
HR 438 +87 +94 -91 - 327 -12 +68 -38 - 228 -32 +06 +134 -
IT 371 +113 -55 +32 -311 516 +207 -00 +61 +29 104 +39 -114 +67 +49
CY 202 -23 +181 -284 +114 369 +172 +08 -107 +06 147 +01 -20 -32 +49
LV 251 +132 -280 +158 -17 325 -46 +09 -132 +185 150 +38 -96 +47 +157
LT 409 +201 -100 +70 -134 441 +176 +94 -116 +63 235 +93 +67 +38 +26
LU 83 -62 -315 +168 +197 693 +331 -198 +527 -368 80 -03 +87 -441 +347
HU 105 -275 +136 +131 -91 523 -61 +208 -239 +103 73 -09 -75 +49 +49
MT 117 -74 -184 +169 -157 129 -152 +81 -342 +227 00 -207 -99 +250 -245
NL 189 -48 -126 +160 +239 338 -05 +180 -253 +318 105 -42 -149 +162 +156
AT 296 +198 -326 +156 -101 173 -187 -412 +340 +121 90 -60 -103 +110 +143
PL 226 -92 +59 +135 -134 201 -140 +65 -224 +12 84 +12 +29 -45 -55
PT 196 +46 -255 -128 +379 231 +126 -162 -88 +140 265 +58 -81 -94 +342
RO 370 -66 +185 -30 -267 287 -53 +171 -220 -141 242 -17 +120 +01 +25
SI 178 -71 +142 -78 -92 250 +48 +02 +54 -22 134 -152 +101 +40 +83
SK 76 -59 +15 -247 +167 363 -09 -226 +156 +104 00 -55 +19 -161 +167
FI 184 -66 -67 +133 -63 570 -46 +112 -72 +51 112 -09 -65 +79 +16
SE 183 -141 -29 +259 -124 256 -135 -214 +135 +26 82 -88 -208 +269 +67
IS 340 +22 +76 -09 -132 283 -01 -147 -94 +397 265 +10 +236 -330 +330
NO 89 +05 +41 -143 -102 109 -40 +73 -271 +19 47 +22 +24 -118 +118
UK 540 +469 -602 +173 +63 662 +325 -121 -64 -17 394 +210 -166 -93 +184
Reasons for not taking action
Region
Country
Unlikely to get satisfactory solution The sums involved were too small Did not know where or how to complain
Consumer Survey 2018
139
In the European Union the proportion of consumers that did not take action because they thought they were unlikely to get a satisfactory solution is 340 In the East this proportion is in line
with the EU27_2019 average while it is higher in the South (425) and lower in the North (259) and West (269) Among all EU countries31 the highest levels of this indicator are found in Spain (548) Ireland (500) and Estonia (219) The UK (540) also has a high level of this indicator The lowest levels are found in Slovakia (76) Luxembourg (83) and Hungary (105)
Additionally Norway also has a low level of 89
Between 2016 and 2018 the proportion of consumers who did not complain because they thought they were unlikely to get a satisfactory solution increased in the EU27_2019 (+119pp) the West (+167pp) and South (+141pp) while no statistically significant changes are observed in the North and East Compared to the survey in 2016 this proportion increased most notably in Ireland (+359pp) and decreased most prominently in Hungary (-275pp) The largest positive reversal among the EU27_2019 countries is found in France where between 2016 and 2018 the proportion
of consumers that did not complain for this reason increased by 330pp whereas between 2014 and 2016 it decreased by 554pp Considering all studied countries an even larger positive reversal is found in the UK where between 2016 and 2018 this indicator increased by 469pp following a decrease of 602pp between 2014 and 2016 No negative reversals are observed
The proportion of consumers that did not complain because the sums involved were too small is
357 in the European Union In the North this proportion is in line with the EU27_2019 average
while it is higher in the South (454) and lower in the East (297) and West (277) Across the EU Member States the highest levels of this indicator are found in Luxembourg (693) Finland (570) and the Czech Republic (552) Among all studied countries the UK also has a high level of this indicator (662) The lowest levels in the EU are found in Malta (129) Austria (173) and Bulgaria (178)41 Norway also has a low level namely 109
Compared to 2016 the EU27_2019 average as well as the results in the North and the East remained relatively stable while the proportion increased in the South (+153pp) and decreased in the West
(-85pp) The degree to which respondents indicated that the sums involved were too small increased most steeply in Luxembourg (+331pp) There are no statistically significant decreases at country level The only positive reversal is found in Belgium where between 2016 and 2018 this indicator increased by 257pp whereas between 2014 and 2016 it decreased by 397pp No negative reversals are observed
In the European Union consumers did not complain because they did not know where or how to complain in 172 of all cases42 In the South East and West this proportion is in line with the
EU27_2019 average while it is lower in the North (126) Among the EU countries the highest levels of this indicator are observed in Greece (331) Ireland (284) and Spain (283) Considering all studied countries the UK also has a high level for this indicator (394) The lowest levels among all EU Member States are observed in Slovakia Malta (both 00) Denmark (47) and Estonia (61) Among all studied countries the level is also low in Norway (47)
Since 2016 the proportion of consumers that did not know where or how to complain increased in
the EU27_2019 (+28pp) whereas no statistically significant changes are observed in all regions The highest increase in the EU is noted in Greece (+133pp) while the strongest decrease is observed in Malta (-207pp) No positive or negative reversals are found in the EU27_2019 countries Considering all countries in the study the only positive reversal is found in the UK where between 2016 and 2018 this indicator increased by 210pp whereas between 2014 and 2016 it decreased by 166pp
31 Results (for all reasons for not taking action) for all countries except Romania (111) and Greece (116) are based on a very small sample size (less than 100 observations) and should therefore be considered as mainly indicative
41 All cases of respondents who experienced a problem but did not take any action to solve it
Consumer Survey 2018
140
Q12 Answers 1 2 and 3 Base EU27_2019 respondents who experienced a problem but did not take any action
to solve it (N=1297)
Male 357 A 393 A 194 A
Female 326 A 338 A 156 A
18-34 384 A 400 A 207 A
35-54 320 A 348 A 174 A
55-64 333 A 331 A 174 A
65+ 320 A 369 A 133 A
Low 492 B 381 A 286 A
Medium 310 A 394 A 197 A
High 345 AB 329 A 120
Very difficult 227 A 335 A 196 A
Fairly difficult 405 B 330 A 137 A
Fairly easy 325 AB 387 A 205 A
Very easy 380 AB 479 A 232 A
Rural area 321 A 365 A 157 A
Small town 334 A 386 A 139 A
Large town 372 A 333 A 259
Self-employed 434 CD 284 A 269 B
Manager 430 BCD 288 A 136 AB
Other white collar 276 B 373 A 136 A
Blue collar 305 BCD 376 A 175 AB
Student 141 A 442 A 91 A
Unemployed 441 CD 307 A 192 AB
Seeking a job 263 ABC 438 A 161 AB
Retired 472 D 399 A 220 AB
Age groups
Reasons for not taking action
Unlikely to get
satisfactory
solution
The sums involved
were too small
Did not know
where or how to
complain
Gender
Education
Financial Situation
Urbanisation
Employment status
Consumer Survey 2018
141
Q12 Answers 1 2 and 3 Base EU27_2019 respondents who experienced a problem but did not take any action
to solve it (N=1297)
With regard to socio-demographic variables and other characteristics whether a consumerrsquos mother tongue is the official language in their country of residence or not is the factor most closely associated with the likelihood of consumers not taking any action to solve a problem because they thought they were unlikely to get a satisfactory solution The other characteristics showing close links
are frequency of internet use and consumersrsquo employment situation
Consumers whose mother tongue is not one of the official languages of the country or region in which they live are more likely to not take action because they do not believe that they will get a satisfactory solution than those whose mother tongue is one of the official languages
As far as the frequency of internet use is concerned daily and weekly internet users are more likely to report this reason for not taking action than those who used the internet hardly ever or never
Finally retired respondents are more likely to cite this reason for not taking action than jobseekers and people with another white-collar job The latter are in turn more likely to cite this reason than students
Only native 311 A 368 A 179 A
Two 335 AB 353 A 172 A
Three 449 B 349 A 179 A
Four or more 311 AB 509 A 134 A
Not official
language in home
country
589 312 A 276 A
Official language
in home country329 368 A 169 A
Low 300 A 258 A 92 A
Medium 349 A 348 A 212 B
High 343 A 391 A 161 AB
Daily 357 B 371 A 159 A
Weekly 490 B 325 A 210 A
Monthly 374 AB 451 A 269 A
Hardly ever 138 A 183 A 292 A
Never 176 A 390 A 197 A
Very vulnerable 368 AB 322 A 229 A
Somewhat
vulnerable425 B 382 A 217 A
Not vulnerable 266 A 378 A 115
Very vulnerable 316 A 408 AB 112
Somewhat
vulnerable344 A 426 B 192 A
Not vulnerable 351 A 320 A 191 A
Reasons for not taking action
Consumer vulnerability
(socio-demographic
factors)
Consumer vulnerability
(complexity)
The sums involved
were too small
Did not know
where or how to
complain
Languages
Mother Tongue
Numerical skills
Internet use
Unlikely to get
satisfactory
solution
Consumer Survey 2018
142
Regarding the proportion of consumers not taking any action because they believe that the sums
involved are too small there are no close associations with any of the socio-demographic characteristics43
With regard to the likelihood of consumers not taking any action to solve a problem because they did not know where or how to complain consumersrsquo level of education is the factor associated most closely with this indicator The characteristics showing the next closest links are the degree of urbanisation vulnerability due to socio-demographic factors vulnerability due to the complexity of offers and terms and conditions and employment status
Consumers with a low or medium level of education are more likely to not take action because they do not know where or how to complain than those with a high level of education
As far as the degree of urbanisation is concerned consumers living in a large town are less likely to refrain from complaining for this reason than those living in a small town or rural area
Consumers who are very or somewhat vulnerable due to socio-demographic factors are more likely not to take action compared to those who are not vulnerable
In contrast those who are not or somewhat vulnerable in terms of the complexity of offers and terms and conditions are more likely to refrain from complaining due to this reason than those who are very vulnerable
Finally consumers who are self-employed are more likely to report that they do not know where or how to complain compared to people with other white-collar jobs and students
43 While vulnerability due to the complexity of offers and terms and conditions effects this dependent variable as shown by the models estimated variability of this dependent variable there is no coherence of this variability Concretely both consumers that are not vulnerable and very vulnerable show lower levels than consumers that are somewhat vulnerable
Consumer Survey 2018
143
Q12 Answers 4 and 5 - Base Respondents who experienced a problem but did not take any action to solve it
(N=1417)
The proportion of consumers who did not complain because they thought it would take too long is 412 in the European Union This is in line with the results in the North and East while the
proportion is higher than the EU27_2019 average in the South (507) and lower in the West (331) Across the EU Member States the highest levels of this indicator are found in Spain (639) Latvia (555) and Ireland (520) The lowest levels are found in Portugal (32) Malta
(114) and Cyprus (174)
Compared to 2016 the proportion of respondents who did not complain because they expected that it would take too long increased in the EU27_2019 (+76pp) the South (+112pp) and the West (+80pp) while no statistically significant changes are observed in the North and the East The degree to which respondents indicated not being sure of their consumer rights increased most steeply in Ireland (+304pp) and decreased most prominently in Bulgaria (-220pp) Among the EU27_2019
countries the largest positive reversal is found in Belgium where between 2016 and 2018 the proportion increased by 294pp whereas between 2014 and 2016 it decreased by 481pp The largest
2018
( = sig
diff EU27)
2018-
2016
2016-
2014
2014-
2012
2012-
2011
2018
( = sig
diff EU27)
2018-
2016
2016-
2014
2014-
2012
2012-
2011
EU27_2019 412 +76 -47 +47 +81 179 +19 -22 +27 +43
EU28 428 +96 -57 +17 +96 211 +57 -68 +39 +33
North 385 +60 +07 -85 +169 146 -08 -10 +86 +14
South 507 +112 -19 +69 +146 206 +58 -19 +33 +46
East 362 -50 +82 +33 +19 133 -74 +75 -18 +38
West 331 +80 -147 +60 +152 185 +41 -110 +62 +87
BE 360 +294 -481 +262 -114 256 +189 -178 -165 +34
BG 221 -220 +107 +60 +111 51 -56 +10 +05 +71
CZ 479 +85 -17 +22 +212 231 +128 -199 +45 +217
DK 328 +03 +230 -305 +294 132 -35 -24 +129 -36
DE 255 -06 +105 -177 +300 158 +14 -15 +03 +32
EE 473 +19 +67 +58 +77 188 +46 +50 +50 -03
IE 520 +304 +64 -91 +50 267 +152 -115 +132 -188
EL 463 -24 +112 +04 +64 274 +88 -136 +104 +41
ES 639 +52 +35 +122 +20 327 -74 +52 +21 +228
FR 367 +126 -284 +106 +100 202 +21 -137 +95 +161
HR 472 +88 +50 +40 - 214 +104 -100 +70 -
IT 479 +153 -34 +64 +220 125 +85 -01 +37 -52
CY 174 -79 +167 -159 +106 35 -102 +141 -95 +95
LV 555 +163 -134 -22 +233 133 +62 -180 +169 +53
LT 471 +68 +115 -02 +54 247 +177 -46 +23 +59
LU 366 +20 -12 -69 +311 122 -43 -108 -03 +89
HU 202 -10 -143 +118 -26 73 -08 -92 +102 +06
MT 114 +61 -96 +77 +118 154 +68 -336 +320 +53
NL 300 +58 -11 +95 -10 92 +61 -63 -12 +74
AT 293 -38 -34 +330 +14 137 +99 -135 +119 +89
PL 192 -150 +54 +52 -04 29 -269 +183 -66 +82
PT 32 -184 -337 +237 +182 110 +19 -137 +06 +94
RO 495 -67 +175 +09 -22 190 -74 +147 +02 -77
SI 307 +29 +35 +43 -67 134 -52 -133 +264 +03
SK 256 +98 +120 -218 +159 174 +125 +10 -95 -22
FI 179 +20 -97 +88 +31 127 -95 +106 +25 -88
SE 329 -14 -29 -197 +332 54 -133 -20 +171 +67
IS 510 +346 -112 -75 +152 398 +375 -128 +151 00
NO 213 +58 -175 -30 +97 100 +45 +55 -117 +117
UK 534 +236 -143 -286 +314 429 +316 -456 +121 +44
Reasons for not taking action
Region
Country
Thought it would take too long Were not sure of own rights as a consumer
Consumer Survey 2018
144
negative reversal is found in Portugal where between 2016 and 2018 the proportion decreased by
184pp following an increase of 337pp between 2014 and 2016
The proportion of respondents who did not complain because they were not sure of their consumer rights is 179 in the European Union In the North South and West the results are in line with the EU27_2019 average whereas the proportion is lower in the East (133) The highest levels of this indicator in the EU32 are found in Spain (327) Greece (274) and Ireland (267) High levels of this indicator are also found in the UK (429) and Iceland (398) The lowest levels of this indicator are found in Poland (29) Cyprus (35) and Bulgaria (51)
Compared to 2016 the proportion of respondents who did not complain because they were unsure about their consumer rights increased in the EU27_2019 (+19pp) decreased in the East (-74pp) and remained statistically unchanged in the North South and West Across all EU Member States this proportion increased most steeply in Belgium (+189pp) and decreased most prominently in Poland (-269pp) Among the EU Member States the largest positive reversal is also found in Belgium where the large increase between 2016 and 2018 (see above) follows a decrease of 178pp
between 2014 and 2016 No negative reversal is found Considering all studied countries an even larger positive reversal is found in the UK where between 2016 and 2018 this indicator increased by
316pp whereas between 2014 and 2016 it decreased by 456pp
32 Results (for all reasons for not taking action) for all countries except Romania (111) and Greece (116) are based on a very small sample size (less than 100 observations) and should therefore be considered as mainly indicative
Consumer Survey 2018
145
Q12 Answers 4 and 5 - Base EU27_2019 respondents who experienced a problem but did not take any action
to solve it (N=1297)
Male 373 181 A
Female 457 177 A
18-34 448 A 198 A
35-54 413 A 169 A
55-64 373 A 123 A
65+ 397 A 218 A
Low 323 A 270 A
Medium 398 A 170 A
High 458 A 172 A
Very difficult 421 A 165 A
Fairly difficult 424 A 152 A
Fairly easy 416 A 216 A
Very easy 338 A 190 A
Rural area 359 A 152 A
Small town 440 A 191 A
Large town 430 A 188 A
Self-employed 471 CD 245 A
Manager 260 A 102 A
Other white collar 514 D 163 A
Blue collar 443 BCD 139 A
Student 476 ABCD 180 A
Unemployed 362 ABCD 201 A
Seeking a job 319 ABC 280 A
Retired 281 AB 190 A
Financial Situation
Urbanisation
Employment status
Reasons for not taking actionThought it would
take too long
Were not sure of
own rights as a
consumer
Gender
Age groups
Education
Consumer Survey 2018
146
Q12 Answers 4 and 5 - Base EU27_2019 respondents who experienced a problem but did not take any action
to solve it (N=1297)
When looking at the proportion of consumers that did not take action because they thought that this would take too long the socio-demographic variable most closely associated with this indicator is whether a consumerrsquos mother tongue is the official language in their country of residence or not The other characteristics with close links are gender numerical skills and employment status
Consumers whose mother tongue is not one of the official languages of the country or region they live in are more likely to refrain from taking action because they thought that this would take too long compared to those whose mother tongue is one of the official languages
As far as gender is concerned females are also more likely to refrain from taking action due to this reason compared to males
Consumers with a low numerical skill level are more likely not to take action because they thought
that this would take too long than those with high numerical skills
Finally other white collars and those who are self-employed are more likely to report this reason than managers and consumers who are retired Blue collar workers are also more likely than managers to report this reason while other white collars are more likely than those seeking a job to report this reason
With regard to socio-demographic variables and other characteristics the likelihood of consumers not taking any action because they were not sure of their rights as a consumer is not associated
closely with any of the socio-demographic variables
Only native 404 A 138 A
Two 424 A 209 A
Three 450 A 216 A
Four or more 306 A 162 A
Not official
language in home
country
611 291 A
Official language
in home country404 172 A
Low 544 B 161 A
Medium 408 AB 210 A
High 401 A 161 A
Daily 399 A 175 BC
Weekly 517 A 320 C
Monthly 568 A 26 A
Hardly ever 502 A 168 ABC
Never 403 A 138 B
Very vulnerable 379 A 185 A
Somewhat
vulnerable422 A 194 A
Not vulnerable 431 A 164 A
Very vulnerable 418 A 197 A
Somewhat
vulnerable434 A 189 A
Not vulnerable 396 A 173 A
Consumer vulnerability
(complexity)
Reasons for not taking action
Languages
Mother Tongue
Numerical skills
Internet use
Consumer vulnerability
(socio-demographic
factors)
Thought it would
take too long
Were not sure of
own rights as a
consumer
Consumer Survey 2018
147
Q12 Answers 6 and 7 - Base Respondents who experienced a problem but did not take any action to solve it
(N=1417)
The proportion of consumers who have not taken action because of their experiences with unsuccessfully complaining in the past is 180 in the European Union In the East this
2018
( = sig
diff EU27)
2018-
2016
2016-
2014
2014-
2012
2012-
2011
2018
( = sig
diff EU27)
2018-
2016
2016-
2014
EU27_2019 180 +19 -53 +79 +33 185 +58 -42
EU28 192 +29 -65 +74 +35 196 +77 -59
North 88 +16 -75 +61 +58 109 -36 +10
South 271 +105 -150 +213 +35 274 +154 -61
East 168 -72 +126 -39 +18 191 -40 +92
West 89 -37 -53 +20 +100 79 -06 -106
BE 135 +99 -87 -115 +69 99 -09 -157
BG 95 -50 +12 -30 +102 09 -34 -49
CZ 212 -31 +43 -47 +178 389 +71 -104
DK 57 -62 +55 -50 +140 00 -97 +97
DE 38 -78 -42 +38 +83 64 -11 -180
EE 35 -22 +29 -24 +36 146 +50 +61
IE 332 +175 +42 +55 +32 283 +121 -28
EL 302 +171 -86 +10 +12 247 +153 -178
ES 331 -101 +04 +299 +24 346 +10 -03
FR 103 -47 -57 -46 +246 58 -47 -59
HR 220 +02 +71 +24 - 251 +164 -94
IT 241 +158 -207 +256 +19 254 +207 -37
CY 180 +60 -75 +16 +52 147 +66 -165
LV 80 +57 -172 +202 +06 40 -61 -40
LT 203 +132 -19 -39 +96 250 +31 +18
LU 39 -20 +15 -154 +136 115 +90 -15
HU 140 -347 +382 +32 +38 108 -117 +87
MT 00 -128 +128 -199 +89 138 +146 -180
NL 20 -106 +20 +136 -316 108 +116 -80
AT 122 +34 -50 +80 +07 203 +76 -114
PL 152 -83 +113 -09 +23 66 -142 +96
PT 91 +123 -239 -15 +227 88 +22 -275
RO 191 -10 +122 -105 -75 296 -33 +184
SI 41 -185 +212 -53 +84 25 -190 +215
SK 113 +25 -57 -10 +169 17 -08 -21
FI 49 -32 -50 +35 +27 195 +40 -22
SE 36 -29 -190 +179 +62 00 -137 +14
IS 164 +85 -29 -347 +417 263 +282 -123
NO 00 00 00 +03 -28 00 00 00
UK 268 +102 -168 +17 +91 270 +191 -183
Reasons for not taking action
Region
Country
Tried to complain unsuccessfully in the past
Not at ease with potential
confrontations resulting from
complaints
Consumer Survey 2018
148
proportion is consistent with the EU27_2019 average while it is higher in the South (271) and
lower in the North (88) and in the West (89) Across the EU Member States3333 the highest levels of this indicator are found in Ireland (332) Spain (331) and Greece (302) The lowest levels in the EU are found in Malta (00) the Netherlands (20) and Estonia (35) In addition the level is also zero in Norway
Compared to 2016 the proportion of respondents that indicated not having taken action because they complained unsuccessfully in the past remained stable in the EU27_2019 in the North and West while it increased in the South (+105pp) and decreased in the East (-72pp) At country level
the proportion to which respondents complained unsuccessfully in the past increased most steeply in Ireland (+175pp) and decreased most prominently in Hungary (-347pp) The only positive reversal is found in Italy where between 2016 and 2018 the indicator increased by 158pp whereas between 2014 and 2016 it decreased by 207pp The only negative reversal is also found in Hungary where the decrease between 2016 and 2018 (see above) was preceded by an increase of 382pp between 2014 and 2016
The proportion of respondents who indicated that they had not complained because they wanted to avoid a confrontation is 185 in the European Union The proportion is in line with the EU27_2019
average in the East whereas it is higher in the South (274) and lower in the North (109) and West (79) Across all EU countries the highest levels of this indicator are found in the Czech Republic (389) Spain (346) and Romania (296) The lowest levels in the EU are found in Denmark Sweden (both 00) Bulgaria (09) and Slovakia (17) Among all studied countries Norway also has a low level of 00
When comparing the results with 2016 the proportion of respondents reporting this reason increased in the EU27_2019 (+58pp) and the South (+154pp) while results remained unchanged in the North East and West At country level the highest increase in the EU is observed in Italy (+207pp) while the largest decrease is observed in Slovenia (-190pp) Considering all countries of the study an even larger increase is observed in Iceland (+282pp) When looking at changes in 2018 (vs 2016) and in 2016 (vs 2014) the largest positive reversal is found in Greece where between 2016 and 2018 this indicator increased by 153pp whereas between 2014 and 2016 it decreased by
178pp No statistically significant negative reversal is found Considering all countries of the study the largest positive reversal is found in the UK where between 2016 and 2018 this indicator increased by 191pp following a decrease of 183pp between 2014 and 2016
33 Results (for all reasons for not taking action) for all countries except Romania (111) and Greece (116) are based on a very small sample size (less than 100 observations) and should therefore be considered as mainly indicative In 2018 the weighting approach was altered to include phone ownership
33 To ensure comparability between the 2018 and 2016 waves the differences between 2018 and 2016 were computed based on the previous weighting procedure applied systematically for both waves This may result in discrepancies between the figures reported for 2018 and the differences between 2018 and 2016
Consumer Survey 2018
149
Q12 Answers 6 and 7 - Base EU27_2019 respondents who experienced a problem but did not take any action
to solve it (N=1297)
Male 200 A 160 A
Female 163 A 213 A
18-34 161 A 195 A
35-54 207 A 174 A
55-64 191 A 190 A
65+ 153 A 198 A
Low 168 A 189 A
Medium 177 A 210 A
High 187 A 156 A
Very difficult 190 AB 191 A
Fairly difficult 149 A 173 A
Fairly easy 228 B 186 A
Very easy 114 A 240 A
Rural area 188 A 238 A
Small town 189 A 139
Large town 159 A 216 A
Self-employed 194 BC 121 AB
Manager 86 AB 108 A
Other white collar 181 C 195 ABC
Blue collar 80 A 159 ABC
Student 181 ABC 119 AB
Unemployed 246 BC 327 C
Seeking a job 146 ABC 124 AB
Retired 285 C 251 BC
Reasons for not taking action
Tried to complain
unsuccessfully in
the past
Not at ease with
potential
confrontations
resulting from
complaints
Gender
Age groups
Education
Financial Situation
Urbanisation
Employment status
Consumer Survey 2018
150
Q12 Answers 6 and 7 - Base EU27_2019 respondents who experienced a problem but did not take any action
to solve it (N=1297)
With regard to socio-demographic variables and other characteristics the likelihood of consumers not taking any action because they had tried to complain unsuccessfully in the past is associated most closely with consumersrsquo numerical skills followed by their vulnerability due to socio-demographic factors and their employment status
Consumers who have a medium or high numerical skill level are more likely to cite their unsuccessful
attempts to complain in the past as a reason for not taking action compared to those with low numerical skills
Consumers who are very vulnerable due to socio-demographic factors are more likely to cite this reason than those who are not vulnerable
Finally regarding consumersrsquo employment status other white collars and those who are retired are also more likely to report this reason for not taking action compared to managers and blue-collar workers
With regard to socio-demographic variables and other characteristics vulnerability due to the socio-demographic factors is the factor most closely associated with the proportion of respondents that has not taken action because they are not at ease with potential confrontations resulting from
Only native 182 A 171 A
Two 170 A 207 A
Three 210 A 196 A
Four or more 145 A 155 A
Not official
language in home
country
314 A 299 A
Official language
in home country173 A 181 A
Low 89 167 A
Medium 210 A 173 A
High 172 A 202 A
Daily 171 A 176 A
Weekly 229 A 300 A
Monthly 220 A 126 A
Hardly ever 377 A 196 A
Never 136 A 184 A
Very vulnerable 234 B 227 A
Somewhat
vulnerable194 AB 230 A
Not vulnerable 135 A 130
Very vulnerable 202 A 116
Somewhat
vulnerable211 A 220 A
Not vulnerable 154 A 204 A
Tried to complain
unsuccessfully in
the past
Not at ease with
potential
confrontations
resulting from
complaints
Consumer vulnerability
(complexity)
Reasons for not taking action
Languages
Mother Tongue
Numerical skills
Internet use
Consumer vulnerability
(socio-demographic
factors)
Consumer Survey 2018
151
complaints Other characteristics showing close links with this indicator are vulnerability due to the
complexity of offers and terms and conditions the degree of urbanisation and employment status
Consumers who are very or somewhat vulnerable in terms of socio-demographic factors are more likely to refrain from taking actions because they want to avoid potential confrontations than those who are not vulnerable
In contrast consumers who are not vulnerable in terms of the complexity of offers and terms and conditions are more likely to refrain from action due to this reason than those who are very or somewhat vulnerable
Consumers who live in a rural area or large town are more likely to indicate they are not at ease with potential confrontations resulting from complaints compared to those living in a small town
Finally with regard to employment status consumers who are unemployed and retired are more likely to not take action for this reason than those who are self-employed managers students and jobseekers
Consumer Survey 2018
152
Satisfaction with problem resolution
Average proportion of satisfied consumers (ldquoVery satisfiedrdquo and ldquoFairly satisfiedrdquo) with Q1144 options Q111 to
Q11545 - Base Respondents that took at least one of five different actions to solve a problem (N=4200)
44 Q11 In general how satisfied or dissatisfied were you with the way your complaint(s) was (were) dealt with by the hellip
-Very satisfied ndashFairly satisfied ndash Not very satisfied ndashNot at all satisfied ndash DKNA Q51 Retailer or service provider Q52 Manufacturer Q53 Public authority Q54 An out-of-court dispute resolution body (ADR) Q55 Court
45 Consumersrsquo average satisfaction was computed across the different instances to which they issued a complaint (eg if a consumer only complained to a manufacturer only his evaluation of the manufacturer was taken into
Region
Country
2018 2018-
2016
2016-
2014
2014-
2012
EU27_2019 570 -40 +23 -35
EU28 591 -39 +35 -30
North 684 +37 -29 -57
South 517 +44 -31 +06
East 597 -12 +19 -71
West 594 -153 +97 -25
BE 493 -84 -152 +170
BG 331 -49 -05 -155
CZ 602 -54 +100 -77
DK 637 -13 +21 -115
DE 597 -196 +108 -18
EE 642 +84 -33 -16
IE 702 -08 +116 -14
EL 479 +77 -74 +05
ES 470 +85 -78 +00
FR 454 -273 +139 -56
HR 445 -127 +132 -54
IT 551 +03 +01 -06
CY 438 +12 -02 -60
LV 553 +65 -12 -76
LT 527 +43 +30 -207
LU 733 -83 +142 +150
HU 693 -26 +73 +13
MT 427 -71 +143 -31
NL 763 +37 +137 -77
AT 720 -78 +112 +28
PL 645 -10 +30 -74
PT 458 +29 +15 -176
RO 482 +55 -91 -61
SI 632 -53 +181 -255
SK 738 +192 -62 -107
FI 771 +14 -12 +17
SE 697 +75 -81 -36
IS 600 +66 -141 -52
NO 764 +104 -07 -93
UK 656 -170 +202 -10
Average satisfaction with complaint handling
Consumer Survey 2018
153
The average satisfaction with complaint handling is 570 in the European Union The satisfaction
is 597 in the East and 594 West while it is 644 in the North and 517 in the South For the EU Member States46 the highest satisfaction levels are observed in Finland (771) the Netherlands (763) and Slovakia (738) In Norway the average satisfaction is also high (764) The lowest levels are found in Bulgaria (331) Malta (427) and Cyprus (438)
Compared to 2016 consumersrsquo average satisfaction with complaint handling decreased in the EU27_2019 (-40pp) and in the West (-153pp) while only relatively small changes were observed
for the North (+37pp) South (+44pp) or East (-12pp) At country-level the indicator increased most noticeably in Slovakia (+192pp) while it decreased most steeply in France (-273pp) In France also the highest negative reversal is found where the decrease between 2016 and 2018 was preceded by an increase of +139pp between 2014 and 2016 No noticeable positive reversals are found
Consumersrsquo satisfaction with the problem resolution differs based on the parties involved When a problem was resolved with the retailer or service provider satisfaction was highest (602) Problem
resolutions achieved via an ADR platform (509) the manufacturer (490) the court (453) and public authorities (422) was also relatively high
account) The indicator was then calculated as the proportion of satisfied respondents (fairly amp very satisfied) across all individual evaluations
Given the way this indicator is calculated not statistical differences are computed 46 Results for the following countries are based on a very small sample size (observations from less than 100
respondents) and they should therefore be considered as mainly indicative Greece (92) France (70) Luxembourg (48) Austria (87) Bulgaria (68) Cyprus (24) Malta (66) and Iceland (79)
Consumer Survey 2018
154
Q111 and Q112 Total ldquoSatisfiedrdquo (Answers 1 and 2)
Base for Q111 Respondents who complained about a problem to the retailer or service provider (N=3780) Base for Q112 Respondents who complained about a problem to the manufacturer (N=593)
Consumersrsquo satisfaction with how retailers or service providers dealt with their complaints
is 602 in the European Union In the East and West satisfaction is in line with the EU27_2019 average while satisfaction is higher in the North (708) and lower in the South (557) Among
the EU Member States35 the highest levels of this indicator are found in Finland (788) the Netherlands (785) and Luxembourg (779) Among all the studied countries this level is highest in Norway (791) The lowest levels in the EU are found in Bulgaria (386) France (426) and Portugal (446)
35 Results for the following countries are based on a very small sample size (less than 100 observations) and should therefore be considered as mainly indicative Lithuania (99) Belgium (98) Iceland (77) Greece (73) Austria (73) France (60) Malta (60) Bulgaria (53) Luxembourg (40) Cyprus (18)
2018
( = sig
diff EU27)
2018-
2016
2016-
2014
2014-
2012
2018
( = sig
diff EU27)
2018-
2016
2016-
2014
2014-
2012
EU27_2019 602 -07 +28 -58 490 -154 +40 +01
EU28 621 +01 +30 -49 527 -156 +87 -06
North 708 +33 -04 -61 674 +85 -72 -46
South 557 +78 -19 -17 429 -29 -48 +36
East 622 -01 +34 -80 542 -69 -10 -39
West 615 -135 +114 -59 552 -203 +60 +30
BE 520 -105 -116 +228 420 -94 -198 +51
BG 386 +06 +65 -238 513 +177 -107 -171
CZ 604 -85 +102 -54 555 +35 +63 -67
DK 684 -32 +67 -124 609 +73 -78 -27
DE 634 -144 +109 -64 593 -287 +96 +59
EE 649 +82 -10 -33 561 +59 -338 +243
IE 703 -37 +150 -17 666 +50 +58 -72
EL 473 +86 -53 -38 389 +189 -333 -82
ES 479 +93 -74 -21 417 +159 -153 -13
FR 426 -363 +253 -107 00 -616 +108 +24
HR 480 -82 +105 -74 318 -331 +253 +63
IT 613 +74 +04 -37 431 -194 +40 +87
CY 385 -73 +69 -115 657 -187 +245 +239
LV 595 +66 +20 -81 516 +60 -131 -90
LT 550 +10 +142 -241 684 +514 -332 -73
LU 779 -32 +85 +215 783 -25 +113 +166
HU 715 -21 +60 +10 542 +211 -324 +20
MT 469 +11 +51 +28 161 -580 +562 -428
NL 785 +70 +117 -63 670 -98 +127 -02
AT 716 -52 +83 +12 952 +84 +147 +13
PL 665 +10 +51 -97 630 -78 +22 -43
PT 446 +28 +12 -237 543 +81 -96 +65
RO 495 +45 -92 -19 457 +43 -167 -95
SI 641 -57 +141 -190 721 +288 +137 -565
SK 758 +226 -75 -119 420 -262 +125 -73
FI 788 +21 -00 +24 715 -29 +46 -117
SE 709 +67 -69 -42 737 +173 -118 +64
IS 572 +30 -144 -75 743 +509 -201 -141
NO 791 +140 -18 -114 634 -175 +92 +108
UK 687 -135 +197 -11 615 -229 +278 -21
Satisfaction with problem resolution
Region
Country
Satisfaction with retailer or service
providerSatisfaction with manufacturer
Consumer Survey 2018
155
Compared to 2016 the respondentsrsquo satisfaction with how retailers or service providers dealt with
their complaints remained stable in the EU27_2019 the North and East while it increased in the South (+78pp) and decreased in the West (-135pp) Compared to the survey in 2016 this type of satisfaction increased most markedly in Slovakia (+226pp) and decreased most in France (-363pp) When looking at changes in 2018 (vs 2016) and in 2016 (vs 2014) no statistically significant positive reversal is found The only negative reversal is found in France where the decrease between 2016 and 2018 (see above) was preceded by an increase of 253pp between 2014 and 2016
The respondentsrsquo satisfaction with how manufacturers dealt with their complaints is 490
in the European Union The satisfaction with manufacturers in the South East and West is in line with the EU27_2019 average while the satisfaction is higher in the North (674) Among the EU Member States36 the highest levels of this indicator are found in Austria (952) Luxembourg (783) and Sweden (737) Considering all countries of the study high levels are also found in Iceland (743) The lowest levels are found in France (00) Malta (161) and Croatia (318)
Compared to 2016 satisfaction with how manufacturers dealt with consumer complaints decreased
in the EU27_2019 (-154pp) and the West (-203pp) whereas it remained statistically stable in the North South and East At country-level this type of satisfaction increased most steeply in Lithuania
(+514pp) whereas it decreased most in France (-616pp) No statistically significant positive reversal is found The largest negative reversal is found in Malta where between 2016 and 2018 this indicator decreased by 580pp whereas between 2014 and 2016 it increased by 562pp
36 Results for all countries are based on a very small sample size (less than 100 observations) and should therefore be considered as mainly indicative
Consumer Survey 2018
156
Q111 and Q112 Total ldquoSatisfiedrdquo (Answers 1 and 2)
Base for Q111 Respondents who complained about a problem to the retailer or service provider (N=3227) Base for Q112 Respondents who complained about a problem to the manufacturer (N=483)
Male 599 A 483 A
Female 613 A 526 A
18-34 576 A 562 B
35-54 632 A 362 A
55-64 582 A 550 B
65+ 628 A 584 AB
Low 620 A 631 A
Medium 597 A 515 A
High 611 A 454 A
Very difficult 542 A 558 AB
Fairly difficult 596 A 384 A
Fairly easy 621 A 570 B
Very easy 621 A 543 AB
Rural area 598 A 497 A
Small town 603 A 462 A
Large town 617 A 549 A
Self-employed 539 A 357 A
Manager 585 AB 707 C
Other white collar 646 B 473 AB
Blue collar 594 AB 538 ABC
Student 709 B 474 ABC
Unemployed 548 AB 689 BC
Seeking a job 655 AB 589 ABC
Retired 546 AB 450 ABC
Satisfaction with problem resolution
Satisfaction with
retailer or service
provider
Satisfaction with
manufacturer
Gender
Age groups
Education
Financial Situation
Urbanisation
Employment status
Consumer Survey 2018
157
Q111 and Q112 Total ldquoSatisfiedrdquo (Answers 1 and 2)
Base for Q111 Respondents who complained about a problem to the retailer or service provider (N=3227) Base for Q112 Respondents who complained about a problem to the manufacturer (N=483)
Consumersrsquo satisfaction with problem resolutions provided by retailers or service providers is associated most closely with vulnerability due to the complexity of offers and terms and conditions followed by employment status
Consumers that are very or somewhat vulnerable report being less satisfied with the problem resolutions provided by retailers and service providers than consumers who are not vulnerable
In addition consumersrsquo satisfaction with retailers and service providers in this respect is lowest for self-employed consumers which is lower than for other white collars and students
When solutions are provided by manufacturers consumersrsquo satisfaction is most closely linked with consumersrsquo numerical skills vulnerability due to the complexity of offers and terms and conditions age and employment situation
Consumers with low numerical skills are less likely to be satisfied with the manufacturersrsquo solutions than consumers with high numerical skills
Only native 588 A 436 A
Two 601 A 600 B
Three 629 A 393 A
Four or more 628 A 481 AB
Not official
language in home
country
535 A 448 A
Official language
in home country610 A 501 A
Low 598 A 286 A
Medium 595 A 445 AB
High 611 A 552 B
Daily 608 B 400 A
Weekly 655 B 639 A
Monthly 530 AB 503 A
Hardly ever 285 A
Never 549 AB 638 A
Very vulnerable 660 B 455 A
Somewhat
vulnerable566 A 507 A
Not vulnerable 613 AB 507 A
Very vulnerable 503 A 314 A
Somewhat
vulnerable553 A 484 AB
Not vulnerable 648 559 B
Satisfaction with
retailer or service
provider
Satisfaction with
manufacturer
Consumer vulnerability
(complexity)
Satisfaction with problem resolution
Languages
Mother Tongue
Numerical skills
Internet use
Consumer vulnerability
(socio-demographic
factors)
Consumer Survey 2018
158
Furthermore consumers who are very vulnerable due to the complexity of offers and terms and
conditions are less satisfied with solutions provided by manufacturers than consumers that do not perceive themselves as vulnerable
Regarding age consumers who are 18-34 years or 55-64 years report higher satisfaction with the problem resolution obtained with the manufacturer than those who are aged 35-54
Finally the satisfaction with manufacturers for problem resolution is higher for managers which in turn is higher than for consumers who are self-employed or other white collars
Q113 Q114 and Q115 Total Satisfied (ldquovery satisfiedrdquo and ldquoFairly satisfiedrdquo) Due to a limited sample size per
country country results could not be calculated Base for Q113 Respondents who complained about a problem to a public authority (N=299)
Base for Q114 Respondents who complained about a problem to an out-of-court dispute resolution body (ADR) such as an ombudsman arbitration mediation or conciliation body (N=194)
Base for Q115 Respondents who complained about a problem to an out-of-court dispute resolution body (ADR) such as an ombudsman arbitration mediation or conciliation body (N=75)
Overall satisfaction37 with how public authorities dealt with complaints is 422 in the European Union The EU27_2019 average is statistically in line with all regions Consumersrsquo satisfaction with public authorities has decreased since 2016 in the EU27_2019 (-150pp) and the West (-183pp)
while no statistically significant changes are observed in the East South and North
Satisfaction with ADR (Alternative Dispute Resolution) is 509 in the European Union and the
satisfaction in all regions is in line with the EU27_2019 average Compared to 2016 satisfaction with ADR decreased in the EU27_2019 (-115pp) and the West (-274pp) while it is statistically stable in the North South and East
Finally the average satisfaction with courts is 453 in the European Union The satisfaction in the South East and West is in line with the EU27_2019 average while satisfaction in the North (176) is lower (176) Compared to 2016 the satisfaction with courts remained statistically stable in the EU27_2019 and all four regions
37 Due to the exceptionally low sample sizes achieved for the last three satisfaction questions only EU27_2019 and region averages are reported
2018
( = sig
diff EU27)
2018-
2016
2016-
2014
2014-
2012
2018
( = sig
diff EU27)
2018-
2016
2016-
2014
2014-
2012
2018
( = sig
diff EU27)
2018-
2016
2016-
2014
2014-
2012
EU27_2019 422 -150 -12 +129 509 -115 -30 +150 453 +105 -100 -71
EU28 461 -135 -22 +115 541 -128 +01 +106 457 +103 -103 -57
North 339 -05 -286 -38 652 +63 -104 +31 176 -142 +13 +205
South 389 +32 -135 +48 429 -106 -50 +215 656 +220 +108 +09
East 383 -113 +74 -28 594 -05 -48 +130 571 +375 -502 -34
West 550 -183 -25 +333 598 -274 +126 +115 268 -95 -54 -138
Satisfaction with problem resolution
Region
Country
Satisfaction with public authority Satisfaction with ADR Satisfaction with court
Consumer Survey 2018
159
Q113 Q114 and Q115 Total Satisfied (ldquovery satisfiedrdquo and ldquoFairly satisfiedrdquo)
Base for Q113 Respondents who complained about a problem to a public authority (N=259) Base for Q114 Respondents who complained about a problem to an out-of-court dispute resolution body
(ADR) such as an ombudsman arbitration mediation or conciliation body (N=152) Base for Q115 Respondents who complained about a problem to an out-of-court dispute resolution body
(ADR) such as an ombudsman arbitration mediation or conciliation body (N=61) Because of the low sample size the model for satisfaction with court excludes numerical skills vulnerability
(terms and conditions) and the covariate variable regions
Male 420 A 574 496
Female 451 A 348 233
18-34 348 A 484 AB 520 A
35-54 500 A 622 B 481 A
55-64 367 A 479 AB 499 A
65+ 363 A 338 A 117
Low 661 A 190 331 A
Medium 394 A 481 A 462 A
High 413 A 614 A 437 A
Very difficult 388 AB 505 A 621 B
Fairly difficult 349 A 553 A 337 AB
Fairly easy 503 AB 461 A 522 AB
Very easy 617 B 572 A 175 A
Rural area 485 A 424 A 404 A
Small town 391 A 421 A 357 A
Large town 440 A 711 480 A
Self-employed 352 AB 396 B 05 A
Manager 417 AB 389 AB 568 BCDE
Other white collar 475 B 491 B 132 ABC
Blue collar 448 AB 569 BC 527 D
Student 227 A 808 CD 454 CD
Unemployed 331 AB 908 D 36 AB
Seeking a job 496 AB 90 A
Retired 565 B 643 BCD 932 E
Financial Situation
Urbanisation
Employment status
Satisfaction with
courtSatisfaction with problem resolution
Satisfaction with
public authority
Satisfaction with
ADR
Gender
Age groups
Education
Consumer Survey 2018
160
Q113 Q114 and Q115 Total Satisfied (ldquovery satisfiedrdquo and ldquoFairly satisfiedrdquo)
Base for Q113 Respondents who complained about a problem to a public authority (N=259) Base for Q114 Respondents who complained about a problem to an out-of-court dispute resolution body
(ADR) such as an ombudsman arbitration mediation or conciliation body (N=152) Base for Q115 Respondents who complained about a problem to an out-of-court dispute resolution body
(ADR) such as an ombudsman arbitration mediation or conciliation body (N=61) Because of the low sample size the model for satisfaction with court excludes numerical skills vulnerability
(terms and conditions) and the covariate variable regions
Satisfaction with complaint handling by public authorities is associated most closely with vulnerability due to socio-demographic factors followed by employment status
Consumers that feel very vulnerable due to their socio-demographic status are more likely to be
satisfied with the public authoritiesrsquo solutions than consumers that are somewhat or not vulnerable
Regarding consumersrsquo employment status the proportion of consumers that are satisfied with public authoritiesrsquo problem resolutions is lowest among students which is lower than for other white collars and retired persons
Consumersrsquo satisfaction with the way their complaint was dealt with by the ADR is associated most closely with consumersrsquo education level The characteristics with the next closest link are gender employment status the degree of urbanisation and the frequency of internet use
Only native 328 A 478 AB 468 A
Two 512 B 655 B 386 A
Three 418 AB 358 A 545 A
Four or more 472 AB 311 A 413 A
Not official
language in home
country
294 A 337 A 97
Official language
in home country443 A 517 A 437
Low 355 A 327 A
Medium 518 A 509 A
High 397 A 525 A
Daily 406 A 455 410 A
Weekly 744 B 811 A 725 A
Monthly 233 A
Hardly ever 675 AB
Never 385 A 838 A 361 A
Very vulnerable 626 524 A 382 A
Somewhat
vulnerable387 A 633 A 701
Not vulnerable 337 A 448 A 354 A
Very vulnerable 399 AB 221 A
Somewhat
vulnerable303 A 465 AB
Not vulnerable 500 B 587 B
Internet use
Consumer vulnerability
(socio-demographic
factors)
Consumer vulnerability
(complexity)
Satisfaction with problem resolutionSatisfaction with
court
Languages
Mother Tongue
Numerical skills
Satisfaction with
public authority
Satisfaction with
ADR
Consumer Survey 2018
161
Regarding education satisfaction is higher for medium or highly educated consumers compared to
consumers with a low education level
Furthermore male consumers are also more satisfied with solutions by the ADR than female consumers
Higher satisfaction with the ADR is also observed for those who are unemployed and students who are more satisfied than jobseekers self-employed managers and other white collars Unemployed consumers are also more satisfied than blue collar workers and those who are retired are more satisfied than jobseekers
Consumers living in a large town are more satisfied with solutions by the ADR than those living in a small town or rural area
Finally consumers who use the internet never or only weekly are more satisfied with ADR solutions compared to daily internet users
Regarding the socio-demographic variables that have links with consumersrsquo satisfaction with
complaint handling by courts whether a consumerrsquos mother tongue is the official language in their
country of residence or not is the factor most closely associated with this indicator The characteristics with next closest links with this indicator are employment status gender age and financial situation It must be noted however that due to a very low sample size these findings should be considered as purely indicative
Consumers whose mother tongue is the official language in their country of residence are much more likely to be satisfied with the courtsrsquo resolution than consumers whose mother tongue is different from the language in their country of residence
In addition the levels for this indicator are highest among the retired which is higher than for self-employed other white collars blue collar workers students and the unemployed In contrast for self-employed and unemployed persons the levels are lower than for most other categories including blue collar workers students retired as well as managers (only for self-employed)
As far as gender is concerned male consumers are also more likely to be satisfied than female consumers
Consumers aged 65 years and older are less likely to be satisfied with solutions achieved through
the court compared to all other age groups
Finally consumers in a very difficult financial situation are more likely to be satisfied with the solution reached through courts than consumers in a very easy financial situation
Consumer Survey 2018
162
Problems making purchases in other EU countries
Q1538-Base respondents who shop online in other EU countries (N=8175)
In the European Union 213 of consumers who shop cross-border online face limitations in terms of cross-border delivery or payment or they are redirected to a website in their own country where the prices are different The cross-border retailersrsquo refusal to deliver to the consumersrsquo home country
is the most commonly experienced problem (125) followed by being redirected to the retailersrsquo website of the consumersrsquo country (109) Relatively fewer consumers reported problems with
retailers not accepting their payment (48)
38 During the past 12 months have you come across any of the following problems when buying goods and services online from another EU country - The retailer or service provider refused to deliver to (ANOTHER EU COUNTRY) The retailer or service provider did not accept payment from (ANOTHER EU COUNTRY) You were redirected to a website in (ANOTHER EU COUNTRY) where the prices were different None of them Donrsquot know
Region
CountryTotal Yes
The retailer or
service
provider
refused to
deliver to
(ANOTHER EU
COUNTRY)
The retailer or
service
provider did
not accept
payment from
(ANOTHER EU
COUNTRY)
You were
redirected to a
website in
(ANOTHER EU
COUNTRY)
when prices
were different
None of them Dont know
EU27_2019 213 125 48 109 782 05
EU28 221 124 49 121 774 05
North 252 179 43 91 744 05
South 135 53 21 92 861 04
East 246 160 55 121 746 09
West 242 149 62 119 753 05
BE 367 237 94 154 627 05
BG 254 201 79 82 731 15
CZ 239 137 68 88 761 00
DK 249 193 47 93 740 12
DE 166 58 47 104 828 06
EE 286 231 80 51 711 03
IE 717 606 187 326 281 02
EL 420 216 110 216 550 31
ES 84 16 23 69 912 04
FR 146 83 24 82 850 05
HR 353 281 97 133 647 00
IT 122 41 06 94 878 00
CY 317 222 93 87 672 11
LV 259 198 66 93 739 02
LT 247 173 66 70 746 07
LU 472 417 142 162 528 00
HU 72 65 34 09 928 00
MT 733 674 192 165 267 00
NL 181 87 68 56 810 09
AT 596 513 152 225 404 00
PL 215 115 22 148 769 16
PT 186 140 18 81 808 06
RO 439 284 151 244 547 14
SI 344 312 47 80 656 00
SK 274 179 41 116 722 04
FI 207 166 28 55 790 02
SE 275 171 35 122 722 02
IS 485 413 134 107 512 04
NO 328 233 63 112 672 00
UK 269 116 59 191 726 05
In the past 12 months have you come across any of the following problems when buying goods
and services online from another EU country
Consumer Survey 2018
163
Q15- Base respondents who shop online in other EU countries (N=8175)
The proportion of consumers that have experienced any of the three aforementioned problems is 213 in the European Union This level is higher in the West (242) East (246) and North (252) whereas it is lower in the South (135) The highest levels of problems with cross-border delivery payment or redirection to a local website are found in Malta (733) Ireland (717) and
Austria (596) The lowest levels of these problems are found in Hungary (72) Spain (84)
and Italy (122)39
Compared to 2016 the proportion of consumers coming across at least one of the three investigated problems remained stable in the EU27_2019 the North and South while it decreased in the West (-46pp) and increased in the East (+42pp) Looking at the Member States the proportion increased most steeply in Ireland (+408pp) and decreased most prominently in France (-220pp) In this regard the largest negative and positive reversals are found respectively in Ireland and France In
39 Results for Romania are based on a very small sample size (88 observations) and they should be therefore considered as mainly indicative
2018
( = sig
diff EU27)
2018-
2016
2016-
2014
EU27_2019 213 -14 +63
EU28 221 -20 +67
North 252 +12 +26
South 135 -19 +13
East 246 +42 -01
West 242 -46 +131
BE 367 +99 -46
BG 254 -39 +70
CZ 239 +17 -03
DK 249 -29 +33
DE 166 -94 +232
EE 286 +14 +49
IE 717 +408 -201
EL 420 -65 +177
ES 84 -33 -37
FR 146 -220 +230
HR 353 +73 +05
IT 122 -07 +25
CY 317 -01 -14
LV 259 +20 -53
LT 247 +54 -12
LU 472 +136 -233
HU 72 -66 -143
MT 733 +100 +71
NL 181 -22 +71
AT 596 +319 -96
PL 215 +64 -06
PT 186 -46 +98
RO 439 +153 +33
SI 344 +61 +11
SK 274 +91 -10
FI 207 +08 -30
SE 275 +35 +75
IS 485 -67 +208
NO 328 +86 +10
UK 269 -84 +120
In the past 12 months have you come
across any of the following problems when
buying goods and services online from
another EU country
Region
Country
Total Yes
Consumer Survey 2018
164
Ireland the increase between 2016 and 2018 reflecting a higher proportion of consumers
experiencing cross-border problems follows a decrease of 201pp between 2014 and 2016 The largest positive reversal is found in France where the decrease between 2016 and 2018 (reflecting a lower proportion of consumers experiencing problems) was preceded by an increase of 230pp between 2014 and 2016
Q15- Base respondents who shop online in other EU countries (N=8175)
In terms of refusal of cross-border retailers to deliver to the consumersrsquo home country 125 of cross-border online consumers in the European Union faced this problem This level is higher in the
West (149) East (160) and North (179) whereas it is lower in the South (53) The highest levels of refusal to deliver to the consumersrsquo home country are found in Malta (674) Ireland
2018
( = sig
diff EU27)
2018-
2016
2016-
2014
EU27_2019 125 +26 -00
EU28 124 +23 +06
North 179 +25 -04
South 53 -13 +02
East 160 +13 +20
West 149 +54 -05
BE 237 +89 -41
BG 201 -18 +76
CZ 137 +24 -73
DK 193 -18 +22
DE 58 -22 +71
EE 231 +04 +54
IE 606 +461 -236
EL 216 -24 +01
ES 16 -33 +07
FR 83 +04 +08
HR 281 +52 +05
IT 41 -01 -03
CY 222 -28 +36
LV 198 +48 -48
LT 173 +37 +22
LU 417 +227 -297
HU 65 -16 -29
MT 674 +114 +29
NL 87 -06 +00
AT 513 +411 -184
PL 115 -03 +45
PT 140 -17 +108
RO 284 +96 -16
SI 312 +90 -02
SK 179 +30 +30
FI 166 +47 -57
SE 171 +40 +07
IS 413 -51 +217
NO 233 +54 +03
UK 116 -02 +45
In the past 12 months have you come
across any of the following problems when
buying goods and services online from
another EU country
Region
Country
The retailer or service
provider refused to deliver
to (ANOTHER EU
COUNTRY)
Consumer Survey 2018
165
(606) and Austria (513) The lowest levels of these problems are found in Spain (16) Italy
(41) and Germany (58)40
Compared to 2016 this proportion increased in the EU27_2019 (+26pp) and the West (+54pp) while it remained statistically stable in the other three regions In terms of the different Member States the level of refusal to deliver in the home country increased most markedly in Ireland (+461pp) No statistically significant decreases are observed The largest negative reversal is also found in Ireland where the increase for this indicator between 2016 and 2018 (see above) reflecting greater refusals to deliver to the home country was preceded by a decrease of 236pp between 2014
and 2016 No statistically significant positive reversal is found
Q15- Base respondents who shop online in other EU countries (N=8175)
40 Results for Romania are based on a very small sample size (88 observations) and they should be therefore considered as mainly indicative
2018
( = sig
diff EU27)
2018-
2016
2016-
2014
EU27_2019 48 -61 +63
EU28 49 -80 +79
North 43 -13 -00
South 21 -31 +11
East 55 -02 -13
West 62 -122 +144
BE 94 +09 -34
BG 79 -23 +45
CZ 68 -19 -18
DK 47 -41 +14
DE 47 -150 +197
EE 80 +41 -24
IE 187 +22 -25
EL 110 -285 +271
ES 23 -01 -23
FR 24 -246 +251
HR 97 +18 +34
IT 06 -30 +10
CY 93 +01 +26
LV 66 -11 -14
LT 66 +15 -14
LU 142 +09 -40
HU 34 +28 -76
MT 192 -45 +116
NL 68 -01 +46
AT 152 -04 +48
PL 22 -16 -18
PT 18 -05 -17
RO 151 +34 +10
SI 47 -26 -07
SK 41 +14 -55
FI 28 +02 -28
SE 35 -14 +14
IS 134 -128 +119
NO 63 +11 +05
UK 59 -232 +216
In the past 12 months have you come
across any of the following problems when
buying goods and services online from
another EU country
Region
Country
The retailer or service
provider did not accept
payment from (ANOTHER
EU COUNTRY)
Consumer Survey 2018
166
Furthermore the percentage of consumers whose payments were not accepted for cross-border
online transactions is 48 in the European Union In the North and East this percentage is in line with the EU27_2019 average while it is higher in the West (62) and lower in the South (21) Cross-border payment refusal is most common in Malta (192) Ireland (187) and Austria (152) The lowest levels are found in Italy (06) Portugal (18) and Poland (22)41
The proportion of consumers whose payments were not accepted when shopping cross-border online has decreased between 2016 and 2018 in the EU27_2019 (-61pp) the South (-31pp) and the West (-122pp) while no statistically significant changes are observed in the North and the East Compared
to the survey in 2016 cross-border payment refusal increased most steeply in Estonia (+41pp) and decreased most prominently in Greece (-285pp) The largest positive reversal is also found in Greece where the decrease between 2016 and 2018 (reflecting a higher proportion of consumers experiencing payment refusal) follows an increase of 271pp between 2014 and 2016 No statistically significant negative reversal is found
41 Results for Romania are based on a very small sample size (88 observations) and they should be therefore considered as mainly indicative
Consumer Survey 2018
167
Q15- Base respondents who shop online in other EU countries (N=8175)
In addition 109 of consumers in the European Union who shop online have been redirected to a website in their own country where the prices are different In the East and West the proportion is in line with the EU27_2019 average while it is lower in the North (91) and South (92) The
highest levels of redirection to a website in the home country are found in Ireland (326) Romania (244) and Austria (225) In contrast the lowest levels are found in Hungary (09) Estonia
(51) and Finland (55)42
Compared to 2016 the percentage of persons being redirected to a website in their home country increased in the EU27_2019 (+41pp) the West (+69pp) and East (+44pp) while the percentage remained relatively stable in the North and South Between 2016 and 2018 this percentage increased most steeply in Ireland (+278pp) and decreased most prominently in Hungary (-65pp)
When looking at changes in 2018 (vs 2016) and in 2016 (vs 2014) the largest negative reversal is
42 Results for Romania are based on a very small sample size (88 observations) and they should be therefore considered as mainly indicative
2018
( = sig
diff EU27)
2018-
2016
2016-
2014
EU27_2019 109 +41 -02
EU28 121 +59 -20
North 91 -11 +44
South 92 +13 +17
East 121 +44 -12
West 119 +69 -24
BE 154 +32 -24
BG 82 -35 +55
CZ 88 -20 +41
DK 93 -00 +20
DE 104 +83 +00
EE 51 +06 +11
IE 326 +278 -174
EL 216 +73 +45
ES 69 +00 -25
FR 82 +60 -66
HR 133 +59 +44
IT 94 +17 +40
CY 87 +14 -64
LV 93 +09 -06
LT 70 +40 -02
LU 162 +102 -47
HU 09 -65 -117
MT 165 +11 +44
NL 56 -64 +79
AT 225 +174 -66
PL 148 +109 -58
PT 81 -18 +27
RO 244 +115 +13
SI 80 -19 +69
SK 116 +29 +50
FI 55 -39 +16
SE 122 -16 +103
IS 107 -47 +92
NO 112 +28 -00
UK 191 +181 -137
In the past 12 months have you come
across any of the following problems when
buying goods and services online from
another EU country
Region
Country
You were redirected to a
website in (ANOTHER EU
COUNTRY) when prices
were different
Consumer Survey 2018
168
also found in Ireland where the increase between 2016 and 2018 (reflecting a higher proportion of
consumer experiencing redirections) follows a decrease of 174pp between 2014 and 2016 The largest positive reversal is found in the Netherlands where between 2016 and 2018 this indicator decreased by 64pp whereas between 2014 and 2016 it increased by 79pp
Consumer Survey 2018
169
Base for Q15 total lsquoyesrsquo EU27_2019 respondents who shop online in other EU countries (N=7184)
Base for Q151-Q155 Respondents who shop online in other EU countries (Q1514 N=7184 Q1523 N=7159 Q155 N=6621)
Male 207 A 129 A 45 A 103 A 786 A 09 A
Female 217 A 120 A 50 A 115 A 781 A 03 A
18-34 237 B 130 A 53 A 139 759 A 05 A
35-54 205 AB 129 A 45 A 102 B 791 AB 04 A
55-64 187 AB 107 A 47 A 75 AB 809 AB 03 A
65+ 143 A 109 A 28 A 44 A 838 B 12 A
Low 205 A 98 A 39 A 132 A 780 A 08 A
Medium 194 A 114 A 43 A 100 A 801 A 06 A
High 223 A 134 A 51 A 112 A 772 A 05 A
Very difficult 181 A 95 A 53 A 117 A 821 A 01 A
Fairly difficult 231 A 125 A 54 A 118 A 760 A 09 A
Fairly easy 205 A 126 A 42 A 106 A 791 A 04 A
Very easy 208 A 125 A 53 A 97 A 787 A 04 A
Rural area 203 A 127 A 49 AB 101 A 794 A 04 A
Small town 206 A 118 A 36 A 107 A 790 A 04 A
Large town 221 A 131 A 57 B 113 A 770 A 09 A
Self-employed 261 C 139 B 53 AB 153 B 739 A 01 A
Manager 213 BC 120 AB 35 AB 109 AB 784 ABC 01 A
Other white collar 211 BC 139 B 46 B 105 AB 784 AB 04 A
Blue collar 158 A 89 A 32 A 86 A 833 C 09 A
Student 235 BC 127 AB 70 AB 93 A 754 AB 10 A
Unemployed 248 ABC 184 B 89 AB 144 AB 731 AB 19 A
Seeking a job 205 ABC 144 AB 61 AB 86 AB 797 ABC
Retired 163 AB 82 A 40 AB 95 AB 833 BC 07 A
Urbanisation
In the past 12 months have you come
across any of the following problems when
buying goods and services online from
another EU country
Total Yes
The retailer or
service provider
refused to deliver
to (ANOTHER EU
COUNTRY)
The retailer or
service provider
did not accept
payment from
(ANOTHER EU
COUNTRY)
Dont know
Gender
Age groups
Education
Financial Situation
You were
redirected to a
website in
(ANOTHER EU
COUNTRY) when
prices were
different
None of them
Employment status
Consumer Survey 2018
170
Base for Q15 total lsquoyesrsquo) respondents who shop online in other EU countries (N=7184)
Base for Q151-Q155 Respondents who shop online in other EU countries (Q1514 N=7184 Q15233 N=7159 Q155 N=6621)
Only native 180 A 122 A 44 A 83 A 812 B 08 A
Two 201 AB 115 A 44 A 110 A 793 B 06 A
Three 233 BC 138 A 45 A 119 A 765 AB 02 A
Four or more 260 C 149 A 72 A 121 A 735 A 05 A
Not official
language in home
country
232 A 185 A 34 A 88 A 758 A 07 A
Official language
in home country209 A 121 A 48 A 109 A 786 A 05 A
Low 200 A 128 A 25 104 A 799 A 03 A
Medium 205 A 111 A 50 A 111 A 787 A 07 A
High 213 A 129 A 48 A 107 A 782 A 05 A
Daily 214 A 126 B 48 A 110 B 781 A
Weekly 152 A 101 B 35 A 50 A 848 B
Monthly 186 A 113 AB 74 A 76 AB 817 AB
Hardly ever 13 13 A 988
Never
Very vulnerable 272 B 161 A 109 132 A 708 18 A
Somewhat
vulnerable213 AB 128 A 40 A 117 A 780 A 07 A
Not vulnerable 201 A 119 A 41 A 100 A 797 A 03 A
Very vulnerable 265 A 124 A 51 A 167 730 A 08 AB
Somewhat
vulnerable205 A 129 A 44 A 99 A 795 A 01 A
Not vulnerable 205 A 123 A 47 A 102 A 788 A 07 B
In the past 12 months have you come
across any of the following problems when
buying goods and services online from
another EU country
Total Yes
The retailer or
service provider
refused to deliver
to (ANOTHER EU
COUNTRY)
The retailer or
service provider
did not accept
payment from
(ANOTHER EU
COUNTRY)
Consumer vulnerability
(socio-demographic
factors)
Consumer vulnerability
(complexity)
None of them Dont know
Languages
Mother Tongue
Numerical skills
Internet use
You were
redirected to a
website in
(ANOTHER EU
COUNTRY) when
prices were
different
Consumer Survey 2018
171
With regard to socio-demographic variables and other characteristics consumersrsquo frequency of internet use is the factor associated most closely with the proportion of consumers that has come
across any of the presented problems (ie Total lsquoYesrsquo) when buying goods online in another EU country The characteristics having the next closest links with this indicator are consumersrsquo language skills vulnerability due to socio-demographic factors age and employment status
Consumers who hardly ever use the internet are much less likely to have come across the presented
problems than consumers who use the internet more frequently (ie monthly weekly or daily)
Regarding the number of languages that consumers speak consumers who speak four or more languages are more likely to have come across any of the presented problems when buying goods online in another EU country than those who speak two languages or only their native language In addition consumers who speak three languages are also more likely to have come across any of the presented problems than those who speak only their native language
Those who are not vulnerable in terms of socio-demographic factors are less likely to have come
across any of the presented problems than consumers who are very vulnerable
As far as age is concerned consumers aged 65+ years are less likely to experience such problems
than young consumers (ie those aged between 18 and 34 years)
Finally blue collar workers and those who are retired are less likely to have come across any of the presented problems than consumers who are self-employed Blue collar workers are also less likely to have come across any of the presented problems than students managers and other white collars
Those who are unemployed and seeking a job do not differ from the other groups on this indicator
The likelihood that consumers come across the problem where a retailer or service provider refused to deliver to another EU country is associated most closely with internet use followed by employment status
People who hardly ever use the internet are less likely to be confronted with this problem than daily or weekly internet users
Regarding employment status consumers who are unemployed self-employed and those with
another white-collar job are more likely to come across the problem of retailers or service providers refusing to deliver to another EU country than blue collar workers and people who are retired Those
who are students or jobseekers do not differ from the other groups in terms of this issue
When it comes to the problem of a retailer or service provider not accepting payment from another EU country the likelihood of being confronted with this problem is most closely associated with vulnerability due to socio-demographic factors followed by numerical skills the degree of urbanisation and employment status
Consumers who are very vulnerable in terms of socio-demographic factors are more likely to have their payment rejected during a cross-border purchase interaction than those who are somewhat or not vulnerable
With regard to numerical skills consumers with low numerical skills are less likely to have faced this problem than consumers with medium or high numerical skills
Those who live in a small town are less likely to have come across this problem than consumers who
live in a large town
Finally with regard to employment status other white collars are more likely to face this issue compared to blue collar workers
Regarding the problem of a consumer trying to buy something online and being redirected to a website in another EU country where prices are different vulnerability due to the complexity of offers and terms and conditions is the factor associated most closely with this indicator Other factors with close links are age and employment status
Consumers who are very vulnerable are more likely to come across this problem than those who are somewhat or not vulnerable
Consumer Survey 2018
172
Younger consumers (aged 18-34 years) are also more likely to be confronted with the problem than
all other age groups In addition those aged 35-54 years are more likely to be confronted with this issue than people aged 65+ years
Finally with regard to employment status consumers who are self-employed are more likely to have faced this problem than students or blue-collar workers All other employment groups do not differ from these groups on this indicator
Consumer Survey 2018
173
12 PROBLEMS EXPERIENCED WITH ONLINE PURCHASES
The present chapter reports further insights into the types of problems consumers experience with online purchases Each type of problem surveyed is also broken down by retailersrsquo or service providersrsquo location ndash domestic and cross-border inside the EU
Problems with domestic online purchases
The proportion of consumers who experienced problems with domestic retailers based on Q14a and Q14b43 ndash
Base respondents who shop online domestically (N=14037)
43 Q14a I will read you some statements about problems consumers may have when shopping online Please tell me whether you have experienced any of them during the last 12 monthshellip
- Yes with retailers or services providers located in (our country) -Yes with retailers or services providers
Region
Country
2018
( = sig
diff EU27)
2018-
2016
2016-
2014
EU27_2019 494 +161 -122
EU28 515 +198 -156
North 361 +02 +13
South 481 +73 +10
East 476 +22 +09
West 531 +268 -236
BE 406 +09 +29
BG 437 +88 -08
CZ 500 +66 -07
DK 352 +16 -10
DE 548 +286 -239
EE 317 -34 +58
IE 337 +116 -67
EL 377 -04 +47
ES 486 +73 -13
FR 570 +355 -334
HR 337 -04 +03
IT 509 +94 +22
CY 188 -82 +153
LV 313 -74 +33
LT 286 -69 -42
LU 327 +144 -121
HU 262 -65 -88
MT 181 -180 +266
NL 529 +72 -18
AT 308 +101 -104
PL 522 +27 +15
PT 273 -32 -03
RO 541 +57 +100
SI 328 +66 -49
SK 407 -52 -43
FI 255 -15 -35
SE 438 +29 +53
IS 192 +22 -04
NO 339 +20 -24
UK 627 +388 -321
Problems experienced with domestic online
retailers
Consumer Survey 2018
174
In this map values below average are coloured in light and dark green and values above average are coloured
in light and dark red
In the European Union the overall proportion of consumers that report problems with domestic online purchases is 494 In the South this proportion is in line with the EU27_2019 average while
located in another EU country -Yes but you donrsquot know in which country the retailers or services providers were located ndashNo ndashDKNA
Q14a1 You have received a damaged product or a different product from the one you ordered Q14a2 Products were delivered later than promised Q14a3 Products were not delivered at all Q14b I will read you some statements about problems consumers may have when shopping online Please
tell me whether you experienced any of them when buying in (our country) during the last 12 monthshellip -Yes ndashNo ndashDKNA Q14b1 You have received a damaged product or a different product from the one you ordered Q14b2 Products were delivered later than promised Q14b3 Products were not delivered at all
Consumer Survey 2018
175
it is higher in the West (531) and lower in the North (361) and East (476) Among the EU
Member States44 the highest levels of this indicator are found in France (570) Germany (548) and Romania (541) Furthermore this level is also high in the UK (627) The lowest levels across the EU countries are found in Malta (181) Cyprus (188) and Finland (255) Of all studied countries the level is also low in Iceland (192)
Compared to 2016 the proportion of consumers experiencing problems with domestic online retailers increased in the EU27_2019 the South (+73pp) and West (+268pp) while it remained unchanged in the North and East Among the EU Member States the largest increase in problems with domestic
online retailers is found in France (+355pp) while no statistically significant decrease is found Considering all the studied countries an even larger increase can be found in the UK (+388pp)
When looking at changes in 2018 (vs 2016) and in 2016 (vs 2014) the largest negative reversal is also found in France where the increase of this indicator between 2016 and 2018 (see above) reflecting a higher proportion of consumers with problems with domestic retailers follows a decrease of 334pp between 2014 and 2016 Looking at all countries of the survey the largest negative
reversal is found in the UK where between 2016 and 2018 this indicator increased (see above) whereas between 2014 and 2016 it decreased by 321pp No statistically significant negative reversal
is found
The proportion of consumers who experienced problems with domestic retailers based on Q14a and Q14b ndash
Base EU27_2019 respondents who shop online domestically (N=12382)
The proportion of consumers who experienced problems with domestic retailers based on Q14a and Q14b ndash
Base EU27_2019 respondents who shop online domestically (N=12382)
44 Results for Malta (63) and Cyprus (72) are based on a very small sample size and should therefore be considered as mainly indicative
503 A 482 A
569 507 418 339
439 A 475 A 514
545 A 500 A 490 A 482 A
497 A 483 A 502 A
525 A 503 A 491 A 487 A
474 A 490 A 454 A 488 A
GenderMale Female
Problems experienced with domestic online retailers
Blue collar
Student
65+
Education levelLow Medium High
Age18-34 35-54 55-64
Very easy
UrbanisationRural area Small town Large town
Financial situationVery difficult Fairly difficult Fairly easy
Unemployed Seeking a job RetiredEmployment status
Self-employed Manager Other white collar
460 A 527 477 A 441 A
455 A 495 A
479 A 490 A 496 A
495 A 463 A 461 A 413 A
506 AB 544 B 469 A
572 509 A 477 A
Four or more
Problems experienced with domestic online retailers
LanguagesOnly native Two
High
Mother tongue
Not official language
in home country
Official language in
home country
Numerical skillsLow Medium
Three
Consumer
vulnerability
(complexity)
Very vulnerableSomewhat
vulnerableNot vulnerable
Hardly ever Never
Consumer
vulnerability
(socio-demographic
factors)
Very vulnerableSomewhat
vulnerableNot vulnerable
Internet useDaily Weekly Monthly
Consumer Survey 2018
176
Regarding the socio-demographic variables associated with the proportion of consumers who
experienced problems with domestic online purchases age is the factor that is associated most closely Other characteristics with close links are vulnerability due to the complexity of offers and terms and conditions and consumersrsquo education level
The proportion of consumers who experienced problems with domestic online purchases decreases with rising age Younger consumers (aged 18-34 years) are most likely to encounter problems than all other age groups In turn those aged 35-54 years show a higher likelihood than those aged 55-64 years who in turn are more likely to encounter issues with domestic online purchases than those
aged 65 or older
Furthermore among consumers who are very vulnerable due to the complexity of offers and terms and conditions the incidence is higher than among those who are somewhat or not vulnerable
Finally highly educated consumers are more likely to experience problems with domestic online purchases than those with a medium or low level of education
Consumer Survey 2018
177
1211 Types of problems with domestic online retailers
Percentage of ldquoYesrdquo answers in Q14a1-3 and Q14b1-3 ndash Base respondents who shop online domestically
(N=14037)
Late delivery is the most common problem with domestic online retailers (393) followed by
damaged and wrong delivery (198) and no delivery (92)
2018
( = sig
diff EU27)
2018-
2016
2016-
2014
2018
( = sig
diff EU27)
2018-
2016
2016-
2014
2018
( = sig
diff EU27)
2018-
2016
2016-
2014
EU27_2019 198 +79 -65 393 +147 -95 92 +33 -23
EU28 214 +107 -95 408 +170 -119 108 +51 -41
North 135 -15 +07 275 +22 +01 50 -00 -08
South 213 +49 +07 374 +63 +13 77 +23 -18
East 197 -06 +12 354 +32 +14 87 +04 -19
West 199 +130 -128 438 +243 -189 109 +54 -28
BE 159 +07 +32 317 +21 +18 67 +05 +02
BG 209 +14 +23 287 +61 +13 69 +20 -08
CZ 192 +13 +38 359 +79 -45 106 +05 +04
DK 115 -05 -20 266 +19 -08 46 -03 -04
DE 185 +120 -156 453 +255 -172 124 +74 -41
EE 130 +08 -17 242 -08 +46 28 -29 +10
IE 132 +92 -49 249 +81 -36 59 +16 -14
EL 159 +38 +18 293 -11 +45 34 -14 +01
ES 213 +56 -16 379 +64 -09 87 +48 -13
FR 246 +196 -140 471 +322 -293 115 +54 -27
HR 145 +40 -12 224 -54 -00 62 -05 -10
IT 229 +48 +24 398 +83 +25 81 +14 -29
CY 98 -12 +61 166 -13 +91 20 -31 +35
LV 112 -53 +20 218 -51 +06 34 -20 +14
LT 102 -39 -11 216 -55 -31 38 -13 -14
LU 92 +71 -110 246 +109 -77 88 +48 +10
HU 96 +20 -82 175 -89 -45 57 +02 -21
MT 69 -169 +234 142 -133 +183 14 -213 +225
NL 185 +37 -25 459 +86 -20 72 +08 +08
AT 132 +73 -58 238 +84 -70 54 +14 +02
PL 225 -12 +19 409 +47 +26 93 +09 -38
PT 123 +26 -18 180 -73 +19 34 -04 +07
RO 218 -13 +40 389 +50 +109 88 +06 +30
SI 125 +26 -55 255 +89 -36 38 -08 +12
SK 148 -13 -50 298 +10 -70 86 -36 -33
FI 99 -23 +09 180 +20 -46 17 -19 -29
SE 172 -10 +27 344 +53 +30 72 +17 -03
IS 83 +47 -11 122 -09 +13 14 -28 +11
NO 130 +08 -07 245 +18 -21 51 -16 +21
UK 302 +252 -234 492 +296 -232 191 +148 -126
Types of problems with domestic online retailers
Region
Country
Damaged or wrong delivery Late delivery No delivery
Consumer Survey 2018
178
In the European Union the overall proportion of consumers exposed to damaged or wrong
deliveries is 198 In the South East and West the proportion of consumers who experienced this problem is in line with the EU27_2019 average while it is lower in the North (135) Among the EU Member States the highest levels of this indicator are found in France (246) Greece and Belgium (both 159) Among all the studied countries this level is highest in the UK (302) The lowest levels among the EU countries are found in Malta (69) Luxembourg (92) and Hungary (96) Of all studied countries the level is also low in Iceland (83)
Between 2016 and 2018m the proportion of consumers experiencing damaged or wrong deliveries
increased in the EU27_2019 (+79pp) the South (+49pp) and West (130pp) while it remained stable in the North and East Compared to the survey in 2016 the proportion of consumers experiencing damaged or wrong delivery increased most prominently in France (+196pp) and decreased most steeply in Malta (-169pp) Considering all countries of the study the largest increase is observed in the UK (+252pp)
The largest positive reversal is also found in Malta where the decrease between 2016 and 2018
(reflecting a lower proportion of consumers that experienced damaged or wrong deliveries) was preceded by an increase of 234pp between 2014 and 2016 The largest negative reversal is found
in France where between 2016 and 2018 this indicator increased by 196pp (reflecting a higher proportion of consumers with this problem) whereas between 2014 and 2016 it decreased by 140pp Looking at all countries of the study the largest negative reversal is found in the UK where between 2016 and 2018 this indicator increased by 252pp following a decrease of 234pp between 2014 and 2016
The overall proportion of consumers who experienced late deliveries from domestic online retailers is 393 in the European Union While the proportion of consumers who experienced this problem is in line with the EU27_2019 average in the South it is higher in the West (438) and lower in the North (275) and East (354) Among the EU Member States the highest levels of this indicator are found in France (471) the Netherlands (459) and Germany (453) The lowest levels are found in Malta (142) Cyprus (166) and Hungary (175) Among all studied countries this level is highest in the UK (492) and lowest in Iceland (122)
The proportion of consumers experiencing late deliveries increased in 2018 in the EU27_2019 (+147pp) the East (+32pp) South (+63pp) and West (+243pp) while no changes are observed in the North Compared to the survey in 2016 the proportion of consumers who experienced late delivery increased most prominently in France (+322pp) where also the largest negative reversal
is found Before the increase in the proportion of consumers who experienced late deliveries between 2016 and 2018 this indicator decreased by 293pp between 2014 and 2016 This indicator decreased
most prominently in Malta (-133pp) where also the only positive reversal is found The decrease between 2016 and 2018 (reflecting fewer late deliveries) was preceded by an increase of 183pp between 2014 and 2016
In the European Union the proportion of consumers who experienced deliveries not taking place is 92 In the East the proportion of consumers who experienced this problem is in line with the EU27_2019 average while it is higher in the West (109) and lower in the South (77) and North (50) Among the EU Member States the highest levels of this indicator are found in Germany
(124) Bulgaria (69) and Belgium (67) The lowest levels are found in Malta (14) Finland (17) and Cyprus (20) When looking at all the studied countries the highest level is found in the UK (191) and the lowest in Iceland (14)45
In 2018 the proportion of consumers for whom deliveries had not taken place increased in the EU27_2019 (+33pp) the South (+23pp) and West (+54pp) while it remained stable in the North and the South Compared to the survey in 2016 the proportion of consumers who experienced no
deliveries increased most noticeably in Germany (+74pp) and decreased most prominently in Malta
(-213pp) In this regard the largest negative and positive reversals are found respectively in Germany and Malta In Germany the increase between 2016 and 2018 reflecting a higher proportion of consumers that experienced problems with deliveries not taking place was preceded by a decrease of 41pp between 2014 and 2016 The only positive reversal is found in Malta where between 2016 and 2018 the indicator decreased (reflecting fewer deliveries that had not taken place see above) whereas between 2014 and 2016 it increased by 225pp Looking at all countries of the study the
45 Results for Malta (63) and Cyprus (72) are based on a very small sample size and should therefore be considered as mainly indicative
Consumer Survey 2018
179
largest negative reversal is found in the UK where between 2016 and 2018 the incidence of this
problem increased by 148pp following a decrease of 126pp between 2014 and 2016
Percentage of ldquoYesrdquo answers in Q14a1-3 and Q14b1-3 ndash Base EU27_2019 respondents who shop online
domestically (N=12382)
Male 202 A 401 A 87 A
Female 194 A 380 A 95 A
18-34 224 B 470 113 A
35-54 210 B 396 105 A
55-64 167 A 324 67
65+ 124 A 246 37
Low 166 AB 343 A 98 A
Medium 181 A 371 A 98 A
High 216 B 413 85 A
Very difficult 223 A 412 A 119 AB
Fairly difficult 210 A 410 A 73 A
Fairly easy 189 A 386 A 96 B
Very easy 201 A 381 A 98 AB
Rural area 191 A 408 A 91 A
Small town 190 A 378 A 83 A
Large town 215 A 391 A 100 A
Self-employed 218 B 404 A 114 C
Manager 230 B 405 A 110 BC
Other white collar 194 AB 396 A 77 A
Blue collar 204 B 372 A 75 AB
Student 146 A 389 A 89 ABC
Unemployed 230 B 345 A 86 ABC
Seeking a job 136 A 378 A 89 ABC
Retired 199 AB 388 A 138 C
Age groups
Types of problems with domestic online
retailers
Damaged or wrong
deliveryLate delivery No delivery
Gender
Education
Financial Situation
Urbanisation
Employment status
Consumer Survey 2018
180
Percentage of ldquoYesrdquo answers in Q14a1-3 and Q14b1-3 ndash Base EU27_2019 respondents who shop online
domestically (N=12382)
Regarding the likelihood of having come across the problem of damaged or wrong deliveries of
products purchased online from a domestic retailer the factor associated most closely is age followed by employment status and education
Consumers aged between 18 and 54 years are more likely to have experienced damaged or wrong deliveries for such purchases than those aged 55 or older
Regarding consumersrsquo employment status students and jobseekers are less likely to face this
problem than blue collar workers self-employed unemployed and managers
In terms of education highly educated consumers are more likely to experience damaged or wrong deliveries from domestic retailers than consumers with a medium education level
When it comes to late deliveries of domestic online purchases the factor associated most closely is also age Other characteristics with close links are vulnerability due to the complexity of offers and terms and conditions and education level
Only native 180 A 365 A 87 A
Two 217 B 425 96 A
Three 189 AB 362 A 87 A
Four or more 171 A 339 A 85 A
Not official
language in home
country
177 A 375 A 124 A
Official language
in home country199 A 391 A 89 A
Low 229 A 361 A 90 A
Medium 197 A 403 A 84 A
High 196 A 389 A 94 A
Daily 200 A 391 A 94 B
Weekly 175 A 387 A 49 A
Monthly 158 A 404 A 60 AB
Hardly ever 143 A 332 A 76 AB
Never
Very vulnerable 216 AB 379 AB 96 AB
Somewhat
vulnerable235 B 420 B 125 B
Not vulnerable 180 A 380 A 76 A
Very vulnerable 213 A 480 137
Somewhat
vulnerable216 A 406 A 87 A
Not vulnerable 189 A 374 A 86 A
Types of problems with domestic online
retailers
Consumer vulnerability
(socio-demographic
factors)
Consumer vulnerability
(complexity)
Late delivery No delivery
Languages
Mother Tongue
Numerical skills
Internet use
Damaged or wrong
delivery
Consumer Survey 2018
181
Younger consumers (18-34 years) are more likely to experience this problem than any other age
group In addition those aged 35-54 years are more likely to experience this issue than those aged 55-64 years who in turn report a higher likelihood than those aged 65 years or older
Furthermore consumers who are very vulnerable due to the complexity of offers and terms and conditions are more likely to face this problem than those who are somewhat or not vulnerable
Finally highly educated consumers are more likely to come across this problem than those with a medium or low education level
Regarding socio-demographic characteristics that are linked with the probability of having a domestic
online purchase not delivered age is also the factor associated most closely with this indicator Other characteristics with close links are vulnerability due to the complexity of offers and terms and conditions and employment status
Consumers aged 18-54 years are more likely to encounter problems of not having their domestic online purchase delivered than those aged 55-64 years who in turn report a higher likelihood than those aged 65 years or older
In addition consumers who are very vulnerable due to the complexity of offers and terms and conditions are more likely to have faced this problem than those who are somewhat or not vulnerable
Finally consumers who are self-employed or retired are more likely to come across this problem for a domestic online purchase than other white collars and blue-collar workers Managers are also more likely to come across this problem than other white collars
Consumer Survey 2018
182
Problems with cross-border purchases
The proportion of consumers who experienced problems with domestic retailers based on Q14c46 ndash Base
respondents who shop online cross-border (N=7722)
In the European Union the proportion of persons having experienced problems with cross-border
online purchases is equal to 361 In the West this proportion is in line with the EU27_2019 average while it is higher in the South (436) and lower in the East (247) and North (281)
46 Q14c I will read you some statements about problems consumers may have when shopping online Please tell me whether you experienced any of them when buying in another EU country during the last 12 months
- Yes ndashNo ndashDKNA Q14c1 You have received a damaged product or a different product from the one you ordered Q14c2 Products were delivered later than promised Q14c3 Products were not delivered at all
Region
Country
2018
( = sig
diff EU27)
2018-
2016
2016-
2014
EU27_2019 361 +127 -50
EU28 359 +138 -58
North 281 +58 -51
South 436 +105 +11
East 247 +35 -05
West 363 +195 -116
BE 483 +90 +44
BG 203 -87 -09
CZ 179 +34 +10
DK 303 +74 -85
DE 330 +204 -45
EE 256 -36 -68
IE 525 +337 -301
EL 388 +113 -117
ES 391 +37 +30
FR 343 +254 -241
HR 420 +29 +33
IT 475 +159 +15
CY 482 +101 -137
LV 278 -166 +08
LT 329 -43 -28
LU 469 +240 -258
HU 132 -89 -94
MT 750 +74 +50
NL 207 -07 -13
AT 504 +348 -288
PL 232 +73 +12
PT 412 -05 +84
RO 391 +192 -63
SI 312 +19 -41
SK 297 +37 -52
FI 260 +48 -60
SE 274 +119 -36
IS 355 +125 +20
NO 248 +11 -02
UK 348 +233 -130
Problems experienced with cross-border
online retailers
Consumer Survey 2018
183
In this map values below average are coloured in light and dark green and values above average are coloured
in light and dark red
The highest levels of this indicator are found in Malta (750) Ireland (525) and Austria (504) The lowest levels are found in Hungary (132) the Czech Republic (179) and Bulgaria (203)47
Compared to 2016 the proportion of persons experiencing problems with cross-border online
purchases increased in the EU27_2019 (+127pp) the East (+35pp) North (+58pp) South
(+105pp) and West (+195pp) The proportion of consumers experiencing problems with cross-border online purchases increased most prominently in Austria (+348pp) and decreased most noticeably in Latvia (-166pp) When looking at changes in 2018 (vs 2016) and in 2016 (vs 2014) the largest negative reversal is found in Ireland where between 2016 and 2018 this indicator
47 Results for Romania are based on a very small sample size (84 observations) and they should be therefore considered as mainly indicative
Consumer Survey 2018
184
increased by 337pp (reflecting a higher proportion of consumers experiencing problems) whereas
between 2014 and 2016 it decreased by 301pp No statistically significant positive reversal is found
The proportion of consumers who experienced problems with cross-border online purchases based on Q14c ndash
Base EU27_2019 respondents who shop online cross-border (N=6788)
The proportion of consumers who experienced problems with cross-border online purchases based on Q14c ndash
Base EU27_2019 respondents who shop online cross-border (N=6788)
With regard to the association between the incidence of problems experienced with cross-border online purchases and socio-demographic variables the factor associated most closely with this indicator is vulnerability due to the complexity of offers and terms and conditions followed by language consumersrsquo financial situation frequency of internet use and age
Consumers who are very vulnerable due to the complexity of offers are more likely to experience problems online with cross-border retailers than those who are somewhat or not vulnerable
Regarding consumersrsquo language skills those who speak at least four languages are more likely to experience such problems than the remainder of the population
Those in a very easy financial situation are less likely to experience problems with cross-border retailers than other consumers In addition consumers in a fairly easy financial situation are also less likely to experience problems with those retailers than consumers in a fairly difficult financial
situation
A higher frequency of internet use is surprisingly associated with less problems experienced online with cross-border retailers with daily internet users being less likely to experience problems than those who hardly use the internet
358 A 366 A
409 B 342 A 319 A 313 AB
367 A 383 A 346 A
444 AB 412 B 356 A 299
356 A 357 A 372 A
398 BC 401 BC 333 AB 344 AB
473 C 404 ABC 401 ABC 276 A
GenderMale Female
Problems experienced with cross-border online retailers
Blue collar
Student
65+
Education levelLow Medium High
Age18-34 35-54 55-64
Very easy
UrbanisationRural area Small town Large town
Financial situationVery difficult Fairly difficult Fairly easy
Unemployed Seeking a job RetiredEmployment status
Self-employed Manager Other white collar
330 A 346 A 365 A 488
354 A 362 A
416 A 360 A 358 A
360 A 358 AB 449 AB 697 B
372 A 374 A 356 A
461 353 A 354 A
Four or more
Problems experienced with cross-border online retailers
LanguagesOnly native Two
High
Mother tongue
Not official language
in home country
Official language in
home country
Numerical skillsLow Medium
Three
Consumer
vulnerability
(complexity)
Very vulnerableSomewhat
vulnerableNot vulnerable
Hardly ever Never
Consumer
vulnerability
(socio-demographic
factors)
Very vulnerableSomewhat
vulnerableNot vulnerable
Internet useDaily Weekly Monthly
Consumer Survey 2018
185
Finally concerning consumersrsquo age consumers aged 18-34 years are more likely to experience such
problems than those aged 35-64 years
Consumer Survey 2018
186
1221 Types of problems with cross-border online retailers
Percentage of ldquoYesrdquo answers in Q14c1-3 ndash Base respondents who shop online cross-border (N=7722)
The most common problem with cross-border online retailers is similar to domestic online retailers late delivery (278) followed by damaged and wrong delivery (115) and no delivery (83)
2018
( = sig
diff EU27)
2018-
2016
2016-
2014
2018
( = sig
diff EU27)
2018-
2016
2016-
2014
2018
( = sig
diff EU27)
2018-
2016
2016-
2014
EU27_2019 115 +30 +00 278 +111 -59 83 +38 -04
EU28 116 +36 +03 282 +125 -64 84 +42 -12
North 105 +28 -15 215 +47 -36 50 +03 +03
South 146 +28 +29 346 +107 -22 94 +37 +07
East 95 +10 -15 175 +22 +14 54 +10 -03
West 104 +44 -19 278 +161 -116 90 +53 -13
BE 172 +31 +21 383 +89 +20 136 +74 +14
BG 81 -31 -07 144 -43 -34 56 -25 +11
CZ 62 +23 -00 136 +10 +18 28 -09 +19
DK 83 +24 +03 266 +72 -58 49 +06 -23
DE 66 +09 +08 253 +177 -68 86 +44 +30
EE 117 -23 -03 179 -10 -71 74 +33 -31
IE 183 +125 -86 418 +289 -256 134 +90 -109
EL 136 +28 -41 295 +88 -57 130 +80 -29
ES 159 +12 +60 300 +50 -00 72 +32 -41
FR 107 +87 -53 260 +197 -218 83 +63 -44
HR 157 +11 -06 275 -23 +35 155 -15 +40
IT 135 +44 +16 384 +150 -27 108 +44 +37
CY 245 +109 -52 370 +84 -174 75 -23 -00
LV 153 -31 -13 194 -110 -11 83 -13 +22
LT 135 -66 +27 238 -30 -29 115 -17 +50
LU 194 +142 -152 355 +195 -195 104 +41 -39
HU 57 +06 -129 72 -99 +15 24 -10 -15
MT 290 -71 +139 671 +156 +33 334 +30 +47
NL 64 -17 +59 148 -08 -24 55 +20 -37
AT 189 +159 -141 384 +270 -234 93 +64 -57
PL 116 +40 -00 161 +37 +27 40 +37 -14
PT 144 -57 +90 343 +82 +07 57 -31 +53
RO 80 -34 -08 345 +209 -15 48 +24 -35
SI 104 -13 -31 221 +15 +07 70 +26 -67
SK 97 -02 -19 186 +35 -36 111 +11 -19
FI 108 +34 -45 187 +29 -25 15 -17 -10
SE 102 +57 -23 202 +88 -31 49 +12 +20
IS 87 +45 -01 288 +109 +25 89 +24 +18
NO 80 +07 -07 176 +04 +11 76 +12 +21
UK 121 +83 +04 305 +228 -118 91 +72 -62
Types of problems with cross-border online retailers
Region
Country
Damaged or wrong delivery Late delivery No delivery
Consumer Survey 2018
187
In the European Union the proportion of persons having experienced damaged or wrong cross-
border delivery is equal to 115 This proportion is equal to the EU27_2019 average in the North and the West while it is higher in the South (146) and lower in the East (95) The highest levels of this indicator are found in Malta (290) Cyprus (245) and Luxembourg (194) The lowest levels are found in Hungary (57) the Czech Republic (62) and the Netherlands (64)48
Between 2016 and 2018 the proportion of consumers who experienced damaged or wrong cross-border delivery increased in the EU27_2019 (+30pp) the North (+28pp) and West (+44pp) while it did not statistically change in the South and East Compared to the survey in 2016 the proportion
of consumers who experienced damaged or wrong cross-border delivery increased most markedly in Austria (+159pp) No statistically significant decrease is observed When looking at changes in 2018 (vs 2016) and in 2016 (vs 2014) the largest positive reversal is also found in Austria where the increase between 2016 and 2018 was preceded by a decrease of 141pp between 2014 and 2016 No statistically significant negative reversal is found
The overall proportion of consumers experiencing late cross-border deliveries is 278 in the
European Union The proportion of persons having experienced this problem in the West is in line with the EU27_2019 average while it is higher in the South (346) and lower in the North (215)
and East (175) The highest levels of this indicator are found in Malta (671) Ireland (418) and Italy and Austria (both 384) The lowest levels are found in Hungary (72) the Czech Republic (136) and Bulgaria (144)
Compared to 2016 the proportion of consumers experiencing late cross-border delivery increased in the EU27_2019 (+111pp) the North (+47pp) South (+107pp) and West (+161pp) while it
stayed the same in the East The largest increase is recorded for Ireland (+289pp) whereas the largest decrease is observed in Latvia (-110pp) The largest negative reversal is also found in Ireland where the increase for this indicator between 2016 and 2018 (reflecting a greater proportion of consumers experiencing late deliveries) follows a decrease of 256pp between 2014 and 2016 No statistically significant positive reversal is found
In the European Union the proportion of persons whose purchase was not delivered is 83 The incidence of this problem is in line with the EU27_2019 average in the South and West while it is
lower in the North (50) and East (54) The highest levels of this indicator are found in the Malta (334) Croatia (155) and Belgium (136) The lowest levels are found in Finland (15) Hungary (24) and the Czech Republic (28)
Between 2016 and 2018 the proportion of persons who made cross-border purchases that were not delivered increased in the EU27_2019 (+38pp) the South (+37pp) and West (+53pp) while it did not change in the North and East Compared to the survey in 2016 the proportion of consumers who
experienced no cross-border delivery increased most prominently in Ireland (+90pp) No statistically significant decrease is observed When looking at changes in 2018 (vs 2016) and in 2016 (vs 2014) the largest negative reversal is also found in Ireland where the increase between 2016 and 2018 (reflecting a greater incidence of such problems) follows a decrease of 109pp between 2014 and 2016 No statistically significant positive reversal is found
48 The results of all three types of problems are based on a very small sample size for Romania (84 observations) and they should be therefore considered as mainly indicative
Consumer Survey 2018
188
Percentage of ldquoYesrdquo answers in Q14c1-3 ndash Base EU27_2019 respondents who shop online cross-border
(Q14c1 N=6788 Q14c23 N=6781)
Male 115 A 275 A 81 A
Female 116 A 283 A 86 A
18-34 124 A 325 94 A
35-54 103 A 265 A 78 A
55-64 129 A 223 A 67 A
65+ 110 A 212 A 81 A
Low 167 A 239 A 131 A
Medium 116 A 297 A 80 A
High 112 A 266 A 82 A
Very difficult 191 A 310 AB 62 A
Fairly difficult 128 A 308 B 94 A
Fairly easy 110 A 283 B 82 A
Very easy 96 A 220 A 75 A
Rural area 106 A 283 A 85 A
Small town 123 A 270 A 79 A
Large town 113 A 284 A 87 A
Self-employed 132 B 292 ABC 92 A
Manager 146 B 310 ABC 72 A
Other white collar 107 B 259 AB 74 A
Blue collar 117 B 248 AB 88 A
Student 154 B 351 C 112 A
Unemployed 109 AB 367 BC 123 A
Seeking a job 104 AB 343 ABC 97 A
Retired 52 A 219 A 71 A
Age groups
Types of problems with cross-border
online retailers
Damaged or wrong
deliveryLate delivery No delivery
Gender
Education
Financial Situation
Urbanisation
Employment status
Consumer Survey 2018
189
Percentage of ldquoYesrdquo answers in Q14c1-3 ndash Base EU27_2019 respondents who shop online cross-border
(Q14c1 N=6788 Q14c23 N=6781)
Regarding the association of socio-demo variables with the incidence of experiencing damaged or wrong deliveries when making a cross-border online purchase vulnerability due to the complexity
of offers and terms and conditions is the factor most closely associated with this indicator followed by employment status and the number of languages spoken
Consumers who are very vulnerable due to the complexity of offers are more likely to experience this problem than those who are somewhat or not vulnerable
In terms of employment consumers who are retired are less likely to come across this type of
problem than students other white collars blue collar workers the self-employed managers and
students
Finally those who speak four or more languages are more likely to experience problems with damaged or wrong deliveries from cross-border retailers than those who speak two languages or only their native language
The socio-demographic variable most closely associated with the likelihood of coming across problems with late deliveries when making a cross-border online purchase is internet use followed by age the number of languages spoken consumersrsquo financial situation and employment status
Only native 100 A 266 A 71 A
Two 111 A 269 A 73 A
Three 120 AB 273 A 115 B
Four or more 156 B 358 89 AB
Not official
language in home
country
78 A 296 A 107 A
Official language
in home country118 A 277 A 81 A
Low 143 A 283 A 119 A
Medium 112 A 299 A 73 A
High 114 A 271 A 83 A
Daily 117 B 276 A 83 A
Weekly 79 AB 295 A 67 A
Monthly 33 A 174 A 255 A
Hardly ever 52 AB 727 181 A
Never
Very vulnerable 132 A 271 A 82 A
Somewhat
vulnerable132 A 282 A 93 A
Not vulnerable 106 A 278 A 79 A
Very vulnerable 194 354 A 125 A
Somewhat
vulnerable106 A 268 A 79 A
Not vulnerable 109 A 274 A 79 A
Types of problems with cross-border
online retailers
Consumer vulnerability
(socio-demographic
factors)
Consumer vulnerability
(complexity)
Late delivery No delivery
Languages
Mother Tongue
Numerical skills
Internet use
Damaged or wrong
delivery
Consumer Survey 2018
190
Consumers who hardly ever use the internet are much more likely to experience this problem than
those who use the internet more frequently (ie monthly weekly or daily)
As far as age is concerned those aged 18-34 years are more likely to face late deliveries from cross-border online purchases than all other age groups
Those who speak four or more languages are also more likely to experience late deliveries than those who speak fewer languages or only their native language
Consumers in a very easy financial situation are less likely to experience late deliveries from cross-border retailers than those in a fairly easy or fairly difficult financial situation
Finally consumers who are retired blue collar workers or other white collars are less likely to experience this problem than students Those who are retired are also less likely to experience this problem than those who are unemployed
Regarding the problem of not receiving deliveries when making a cross-border online purchase none of the measured socio-demographic variables is associated closely with this indicator
Consumer Survey 2018
191
Overall problems experienced
The incidence of problems experienced with domestic and cross-border retailers based on Q14a Q14b and
Q14c ndash Base respondents who shop online domestically or cross-border (N=15463)
In the European Union the proportion of persons experiencing problems with either domestic or
cross-border online purchases is 578 In the South the proportion is in line with the EU27_2019 average while it is higher in the West (622) and lower in the East (512) and North (462) The highest levels of this indicator are found in Malta (768) France (670) and Belgium (622) Additionally this level is also high in the UK (675) The lowest levels are found in Hungary
(306) Finland (389) and Lithuania (408)
Compared to 2016 the proportion of consumers experiencing problems with domestic and cross-border online purchases increased in the EU27_2019 (+210pp) the West (+357pp) the South (+77pp) and the East (+39pp) while it remained stable in the North At country level the proportion of consumers experiencing problems with domestic and cross-border online purchases increased most prominently in France (+458pp) and decreased most steeply in Latvia (-121pp)
Region
Country
2016
( = sig
diff EU28)
2018-
2016
2016-
2014
EU27_2019 578 +210 -120
EU28 592 +245 -156
North 462 +27 +24
South 583 +77 +62
East 512 +39 +14
West 622 +357 -265
BE 622 +65 +82
BG 465 +63 -04
CZ 542 +82 +08
DK 443 +30 -13
DE 609 +348 -255
EE 486 -50 +132
IE 613 +366 -262
EL 471 +35 +13
ES 570 +64 +54
FR 670 +458 -363
HR 545 +25 +90
IT 618 +99 +78
CY 495 +06 -17
LV 491 -121 +124
LT 408 -63 +13
LU 533 +298 -294
HU 306 -61 -92
MT 768 +16 +94
NL 563 +69 -04
AT 571 +343 -280
PL 540 +45 +18
PT 467 +28 +43
RO 562 +80 +76
SI 437 +31 +32
SK 505 +06 -28
FI 389 +20 -17
SE 512 +68 +49
IS 466 +161 +21
NO 478 +45 -00
UK 675 +430 -338
Problems experienced
Consumer Survey 2018
192
When looking at changes in 2018 (vs 2016) and in 2016 (vs 2014) the largest negative and positive
reversals are also found respectively in France and Latvia In France this indicator increased between 2016 and 2018 (indicating a higher proportion of consumers experiencing problems) following a decrease of 363pp between 2014 and 2016 (indicating fewer problems) In Latvia this indicator decreased between 2016 and 2018 (see above) following an increase of 24pp between 2014 and 2016 (indicating more problems)
The incidence of problems experienced with domestic and cross-border retailers based on Q14a Q14b and
Q14c ndash Base EU27_2019 respondents who shop online domestically or cross-border (N=13680)
The incidence of problems experienced with domestic and cross-border retailers based on Q14a Q14b and
Q14c ndash Base EU27_2019 respondents who shop online domestically or cross-border (N=13680)
With regard to socio-demographic variables and other characteristics problems with online retailers (both domestic and cross-border) are associated most closely with age The characteristics that have
the next closest links with the indicator are vulnerability due to the complexity of offers and terms and conditions education gender and consumersrsquo financial situation
Consumers aged 18-34 years are more likely to experience problems with online retailers than all
other age groups In addition those aged 35-54 years are more likely to experience such problems than those aged 55-64 years who in turn are more likely to experience such problems than those aged 65+ years
Consumers who are very vulnerable in terms of the complexity of offers and terms and conditions are also more likely to experience problems with online retailers than those who are somewhat or not vulnerable
Regarding consumersrsquo education level those with a high level of education are more likely to encounter problems than those with a medium or low level of education
595 559
671 590 489 397
505 A 563 A 597
605 AB 598 B 577 AB 546 A
582 A 563 A 590 A
616 B 616 B 572 AB 568 AB
592 AB 580 AB 499 A 548 AB
GenderMale Female
Problems experienced
Blue collar
Student
65+
Education levelLow Medium High
Age18-34 35-54 55-64
Very easy
UrbanisationRural area Small town Large town
Financial situationVery difficult Fairly difficult Fairly easy
Unemployed Seeking a job RetiredEmployment status
Self-employed Manager Other white collar
532 A 604 B 574 B 587 AB
510 A 580 A
556 A 570 A 582 A
581 A 533 A 524 A 546 A
596 AB 625 B 554 A
656 573 A 567 A
Four or more
Problems experienced
LanguagesOnly native Two
High
Mother tongue
Not official language
in home country
Official language in
home country
Numerical skillsLow Medium
Three
Consumer
vulnerability
(complexity)
Very vulnerableSomewhat
vulnerableNot vulnerable
Hardly ever Never
Consumer
vulnerability
(socio-demographic
factors)
Very vulnerableSomewhat
vulnerableNot vulnerable
Internet useDaily Weekly Monthly
Consumer Survey 2018
193
As far as gender is concerned males are more likely to encounter problems with online retailers than
females
Finally less exposure to problems is reported by consumers in a very easy financial situation compared to those in a fairly difficult financial situation
1231 Overall types of problems
Percentage of ldquoYesrdquo answers in Q14a1-3 Q14b1-3 or Q14c1-3 ndash Base respondents who shop online
domestically or cross-border (N=15463)
2018
( = sig
diff EU27)
2018-
2016
2016-
2014
2018
( = sig
diff EU27)
2018-
2016
2016-
2014
2018
( = sig
diff EU27)
2018-
2016
2016-
2014
EU27_2019 235 +99 -60 467 +194 -99 133 +62 -22
EU28 250 +127 -89 480 +220 -125 146 +79 -40
North 188 -02 +21 357 +41 +06 87 +05 +08
South 262 +59 +33 464 +81 +41 119 +42 -05
East 219 +05 +12 384 +44 +21 106 +14 -13
West 235 +157 -130 522 +319 -211 159 +99 -35
BE 257 +34 +54 510 +98 +49 166 +60 +26
BG 216 -04 +16 315 +46 +16 97 +12 +10
CZ 211 +23 +42 394 +88 -25 117 +03 +11
DK 158 +06 -07 359 +40 -06 77 +08 -05
DE 206 +133 -158 512 +312 -187 160 +105 -38
EE 219 -24 +51 369 -21 +99 115 -13 +45
IE 253 +201 -119 502 +314 -201 164 +113 -96
EL 198 +33 +17 371 +29 +27 84 +21 -12
ES 268 +73 +12 453 +65 +37 119 +57 -03
FR 285 +233 -143 568 +423 -322 182 +120 -41
HR 255 +51 +37 369 -56 +85 192 -00 +67
IT 271 +58 +50 495 +107 +50 126 +39 -10
CY 292 +89 +05 386 +34 -79 96 -41 +44
LV 241 -54 +79 345 -81 +67 105 -42 +71
LT 167 -61 +43 307 -56 +10 101 -15 +26
LU 256 +215 -190 419 +246 -217 145 +90 -50
HU 123 +35 -99 208 -85 -34 75 +12 -14
MT 309 -131 +188 678 +61 +84 346 -57 +118
NL 195 +25 -06 481 +84 -14 94 +19 +01
AT 247 +182 -135 450 +280 -227 126 +75 -55
PL 243 +04 +17 427 +60 +28 103 +19 -38
PT 203 +24 +32 356 +15 +25 81 +07 +33
RO 224 -10 +36 411 +72 +93 97 +15 +25
SI 182 -07 +07 335 +60 +39 97 +13 +13
SK 198 +14 -39 368 +51 -52 153 +04 -18
FI 168 -01 +06 280 +38 -30 52 -09 -21
SE 210 +09 +33 402 +81 +16 100 +19 +17
IS 178 +98 +18 345 +113 +26 113 +19 +14
NO 189 +28 -11 340 +25 -04 128 +12 +40
UK 333 +277 -234 554 +356 -258 223 +176 -133
Types of problems
Region
Country
Damaged or wrong delivery Late delivery No delivery
Consumer Survey 2018
194
As with domestic and cross-border online retailers the most common problem overall is late delivery (467) followed by damaged or wrong delivery (235) and purchases not being delivered (133)
In the European Union the proportion of people reporting damaged or wrong deliveries both for domestic and cross-border purchases is 235 In the West this proportion is in line with the EU27_2019 average while it is higher in the South (262) and lower in the North (188) and
East (219) The only result at country level that is higher than the EU27_2019 average is observed in France (285) Additionally this proportion is also high in the UK (333) The lowest proportions are found in Hungary (123) Denmark (158) and Lithuania (167)
Compared to 2016 the proportion of persons experiencing damaged or wrong deliveries of domestic and cross-border purchases increased in the EU27_2019 (+99pp) the West (+157pp) and South (+59pp) while no changes are observed in the East and North At country level the proportion of
consumers who experienced damaged or wrong delivery in domestic and cross-border purchases increased most prominently in France (+233pp) No statistically significant decreases are observed
When looking at changes in 2018 (vs 2016) and in 2016 (vs 2014) the largest negative reversal is found in Luxembourg where between 2016 and 2018 this indicator increased by 215pp reflecting a higher incidence of consumers experiencing damaged or wrong deliveries whereas between 2014 and 2016 it decreased by 190pp Considering all countries of this study an even larger negative reversal is found in the UK where an increase between 2016 and 2018 by 277pp follows a decrease
of 234pp between 2014 and 2016 No statistically significant positive reversal is found
The proportion of consumers experiencing late deliveries for both domestic and cross-border online purchases is 467 in the European Union In the South the proportion is in line with the EU27_2019 average while it is higher in the West (522) and lower in the East (384) and North (357) The highest levels of this indicator are found in Malta (678) France (568) and Germany (512) In addition the level is also high in the UK (554) The lowest levels are found in Hungary (208) Finland (280) and Lithuania (307)
Between 2016 and 2018 the proportion of persons experiencing late delivery of domestic and cross-border purchases increased in the EU27_2019 (+194pp) and in all regions (North +41pp East +44pp South +81pp West +319pp) Compared to the survey in 2016 the proportion of persons
having problems with late delivery of domestic and cross-border purchases increased most prominently in France (+423pp) No statistically significant decreases are observed When looking at changes in 2018 (vs 2016) and in 2016 (vs 2014) the largest negative reversal is also found in
France where the increase between 2016 and 2018 (reflecting a higher incidence of such problems) was preceded by a decrease of 322pp between 2014 and 2016 No statistically significant positive reversal is found
The proportion of consumers who made domestic and cross-border online purchases that were not delivered is 133 in the European Union In the South the proportion is in line with the EU27_2019 average while it is higher in the West (159) and lower in the North (87) and East (106) The highest levels of this indicator are found in Malta (346) Hungary (192) and France
(182) In addition the proportion where online cross-border purchased were not delivered is also high in the UK (223) The lowest levels are found in Finland (52) Hungary (75) and Denmark (77)
Compared to 2016 the proportion of consumers experiencing deliveries of domestic and cross-border purchases that did not take place increased in the EU27_2019 (+62pp) the West (+99pp) South
(+42pp) and East (+14pp) while it remained stable in the North At country-level the proportion of consumers who experienced no delivery in domestic and cross-border purchases increased most
prominently in France (+120pp) while no statistically significant decreases are observed Across the EU Member States the largest negative reversal is found in Ireland where between 2016 and 2018 this indicator increased by 113pp (reflecting a higher incidence of such problems) whereas between 2014 and 2016 it decreased by 96pp Looking at all surveyed countries the largest negative reversal is found in the UK where between 2016 and 2018 this indicator increased by 176pp following a decrease of 133pp between 2014 and 2016 No statistically significant positive reversal
is found
Consumer Survey 2018
195
Percentage of ldquoYesrdquo answers in Q14a1-3 Q14b1-3 or Q14c1-3 ndash Base EU27_2019 respondents who shop
online domestically or cross-border (N=13680)
Male 246 A 479 A 131 A
Female 226 A 452 A 132 A
18-34 278 565 177
35-54 240 473 134
55-64 203 380 94
65+ 147 287 59
Low 207 AB 391 A 135 A
Medium 217 A 450 A 134 A
High 255 B 487 129 A
Very difficult 289 A 457 A 146 A
Fairly difficult 251 A 491 A 121 A
Fairly easy 226 A 465 A 137 A
Very easy 230 A 444 A 125 A
Rural area 230 A 479 A 133 A
Small town 230 A 454 A 120 A
Large town 249 A 468 A 143 A
Self-employed 281 D 472 AB 158 B
Manager 272 CD 509 B 149 B
Other white collar 230 ABC 469 AB 112 A
Blue collar 239 BCD 441 A 122 AB
Student 188 AB 497 AB 139 AB
Unemployed 254 BCD 432 AB 127 AB
Seeking a job 174 A 405 A 131 AB
Retired 217 ABC 452 AB 166 AB
Age groups
Types of problemsDamaged or wrong
deliveryLate delivery No delivery
Gender
Education
Financial Situation
Urbanisation
Employment status
Consumer Survey 2018
196
Percentage of ldquoYesrdquo answers in Q14a1-3 Q14b1-3 or Q14c1-3 ndash Base EU27_2019 respondents who shop
online domestically or cross-border (N=13680)
With regard to socio-demographic variables and other characteristics damaged or wrong deliveries for domestic and cross-border purchases is associated most closely with age followed by employment status and education
Younger consumers (aged 18-34 years) are more likely to receive damaged or wrong deliveries than the remainder of the population In addition those aged 35-54 years are more likely to experience
this problem with domestic or cross-border retailers than consumers aged 55 or older
Regarding consumersrsquo employment status those who are self-employed are more likely to
experience damaged or wrong deliveries than other white collars students those seeking a job and those who are retired Blue collar workers and those who are unemployed are also more likely to experience such problems than those who are seeking a job
In terms of education highly educated consumers are more likely to report damaged or wrong deliveries than consumers with a medium education
In terms of experiencing late deliveries for both domestic and cross-border purchases this indicator is associated most closely with age Other characteristics that have a close link with this indicator are vulnerability due to the complexity of offers and terms and conditions education and employment status
Only native 213 A 427 A 117 A
Two 253 B 493 B 134 A
Three 227 AB 452 A 140 A
Four or more 235 AB 473 AB 144 A
Not official
language in home
country
197 A 420 A 166 A
Official language
in home country238 A 468 A 129 A
Low 268 A 432 A 134 A
Medium 228 A 476 A 119 A
High 236 A 465 A 136 A
Daily 240 A 467 A 134 B
Weekly 189 A 443 A 85 A
Monthly 171 A 461 A 118 AB
Hardly ever 137 A 480 A 143 AB
Never
Very vulnerable 253 AB 468 AB 135 AB
Somewhat
vulnerable272 B 492 B 169 B
Not vulnerable 218 A 454 A 115 A
Very vulnerable 273 A 552 186
Somewhat
vulnerable247 A 466 A 125 A
Not vulnerable 226 A 454 A 126 A
Types of problems
Consumer vulnerability
(socio-demographic
factors)
Consumer vulnerability
(complexity)
Late delivery No delivery
Languages
Mother Tongue
Numerical skills
Internet use
Damaged or wrong
delivery
Consumer Survey 2018
197
Similar to experiencing issues with damaged or wrong deliveries younger consumers (aged 18-34
years) are more likely to experience problems with late deliveries than all other age groups In addition those aged 35-54 years are more likely to experience this problem than consumers aged 55-64 years who in turn are more likely to encounter such problems than those aged 65+ years
Consumers who are very vulnerably due to the complexity of offers and terms and conditions are also noticeably more likely to experience late deliveries than those who are somewhat or not vulnerable
Regarding education consumers with a high level of education are more likely to report encountering
such problems than consumers with a low or medium level of education
Finally in terms of consumersrsquo employment status managers are the most likely to experience late deliveries and more so than blue collar workers and jobseekers
Regarding the incidence of consumers having their domestic or cross-border purchases not delivered this indicator is associated most closely with age followed by vulnerability due to the complexity of offers and terms and conditions and employment status
Consistent with the findings for the two other problems with domestic and cross-border purchases consumers aged 18-34 years are more likely to experience the issues of having their purchases not delivered than all other age groups In addition those aged 35-54 years are more likely to encounter this problem than consumers aged 55-64 years who in turn are more likely to encounter this problem than those aged 65+ years
Consumers who are very vulnerable due to complexity of offers and terms and conditions are also more likely to report missing deliveries than those who are somewhat or not vulnerable
Finally in terms of consumersrsquo employment status managers and consumers who are self-employed are more likely compared to other white collars
Consumer Survey 2018
198
13 CONSUMER VULNERABILITY
Since the 2016 edition of the Consumersrsquo attitudes towards cross-border trade and consumer protection survey special attention is given to consumer vulnerability Chapter 12 presents the findings based on self-reported consumer vulnerability based on six concrete pre-defined drivers of vulnerability health problems poor financial circumstances current employment situation terms
and conditions that are too complex age and belonging to a minority group In addition personal issues and other issues were included as potentially relevant categories
The results of the survey show that in 2018 432 of the EU27_2019 citizens believe to be vulnerable as consumers for one or more aspects mainly linked to their socio-demographic status which is higher than in 2016 (351) Perceived vulnerability based on the complexity of offers terms and condition has also increased to 342 in 2018 compared to 238 in 2016
Regarding vulnerability that stems from consumersrsquo socio-demographic status the most prevalent
reasons mentioned are related to economic conditions (poor financial circumstances 252 and current employment situation 174 Overall 150 of consumers surveyed that they feel
vulnerable due to their age while 141 reported health problems as a key factor in feeling vulnerable when purchasing goods or services Being part of a minority group is the factor that is reported by the relatively lowest proportion of the respondents with only 90 of respondents feeling vulnerable to at least some extent
Q2147 ndash Base all EU27_2019 respondents (N=25532)
Self-assessed vulnerability varies largely by geographical area of the European Union Vulnerability that stems from consumers socio-demographic background is highest in the Eastern part of the EU (524) followed by the South (480) and the West and North (both 360) Vulnerability that is based on problems with the complexity of offers or terms and conditions is more evenly spread across the different EU regions The proportion of consumers that reports this type of vulnerability is highest
in the East (381) followed by the South (355) West (319) and North (310)
47 Q21 The following statements are about disadvantages that consumers may have when dealing with retailers
To what extent do they apply to you personally You feel vulnerable or disadvantaged when choosing and buying goods or serviceshellip -To a great extent ndash To some extent ndashHardly at all ndashNot at all ndashDKNA Q211 Because of your health problems Q212 Because of your poor financial circumstances Q213 Because of your current employment situation Q214 Because offers terms or conditions are too complex Q215 Because of your age Q216 Because you belong to a minority group Q217 Because of personal issues Q218 Because of other issues
342
432
111
124
90
150
174
252
141
0 10 20 30 40 50 60 70 80 90 100
Offers terms or conditions are too complex
Any socio-demo
Other
Personal issues
Belonging to a minority group
Age
Current employment situation
Poor financial circumstance
Health problems
Self-reported vulnerability EU27_2019 average
Consumer Survey 2018
199
Q21 ndash Base all EU27_2019 respondents (N=25532)
Additional analyses were done to better understand the relationship between consumer conditions and consumersrsquo self-assessed vulnerability based on their socio-demographic background and how that relationship differs from one regional area to the other Results from the multivariate analysis performed by geographical area show that while this type of perceived vulnerability is highest in the East the link between consumersrsquo self-assessed vulnerability and consumer conditions tends to be the weakest The difference in scores on consumer conditions between very vulnerable and not
vulnerable consumers in the South is more than twice as high as the differences observed in the East Consumers in the South however scored also relatively high on vulnerability The link of vulnerability with consumer conditions in the West and North is relatively moderate with values between the ones of the East and the South
Q21ndash Base all EU27_2019 respondents ndash East (N=7845) West (N=6304) South (N=4851) North
(N=5928) When the difference between the very vulnerable and the not vulnerable consumers is not statistically
significant at 5 probability level it is considered equal to 0 (ex knowledge of consumer rights in the Western and Northern regions)
In a final analysis an alternative way to look at the possible determinants of consumer vulnerability was considered by performing a multivariate analysis between self-assessed vulnerability and the socio-demographic characteristics of the persons interviewed
Consumer conditions EAST WEST SOUTH NORTH
Knowledge of consumer rights 0000 0000 0045 0045
Trust in organisations 0092 0000 0097 0000
Confidence in online shopping 0000 0000 0080 0058
Perception of redress mechanism -0037 0000 0000 0000
No exposure to UCPs 0031 0082 0039 0068
No experience of specific shopping problems 0036 0069 0062 0048
Numerical skills 0023 0000 0000 0040
Trust in product safety 0047 0115 0000 0000
Trust in enviromental claims 0000 0000 0095 0000
Problems and complaints indicator 0000 0000 0000 0031
Average 0019 0027 0042 0029
Consumer Survey 2018
200
Q21 ndash Base all EU27_2019 respondents (N=24928)
By and large the results from the logit regressions confirm what was stated by consumers (as discussed above) The tendency to feel vulnerable regarding their socio-demographic background is associated most closely with the financial situation of the consumers In particular
the easier a consumersrsquo financial situation the less likely they are to perceive themselves vulnerable Also higher levels of vulnerability (in terms of socio-demographics) are also observed in persons with a mother tongue not being one of the official languages spoken in the countryregion of
Male 410 342 A
Female 448 343 A
18-34 474 314 A
35-54 430 B 323 A
55-64 421 AB 384 B
65+ 385 AB 374 B
Low 449 A 364 A
Medium 432 A 331 A
High 422 A 351 A
Very difficult 684 441
Fairly difficult 557 389
Fairly easy 363 325
Very easy 270 267
Rural area 456 353 A
Small town 420 A 334 A
Large town 416 A 342 A
Self-employed 430 BC 357 A
Manager 383 AB 346 A
Other white collar 370 A 342 A
Blue collar 421 BC 355 A
Student 516 E 362 A
Unemployed 443 CD 332 A
Seeking a job 519 E 348 A
Retired 485 DE 327 A
Only native 436 AB 345 A
Two 422 AB 340 A
Three 448 B 350 A
Four or more 398 A 324 A
Not official
language in home
country
517 348 A
Official language
in home country425 342 A
Low 433 AB 337 A
Medium 449 B 341 A
High 419 A 344 A
Daily 416 A 346 B
Weekly 482 B 379 B
Monthly 505 AB 365 AB
Hardly ever 446 AB 315 AB
Never 472 B 292 A
Internet use
Financial Situation
Urbanisation
Employment status
Languages
Mother Tongue
Numerical skills
Education
Vulnerability
(socio-
demographics)
Vulnerability
(complexity)
Gender
Age groups
Consumer Survey 2018
201
residence With regard to employment status white collars and managers are the least likely to
experience feelings of vulnerability while those seeking a job and students are more exposed to this issue Furthermore we observe that consumers of 55 years and older are less likely to be vulnerable than young consumers (18-34-year-old) Males tend to be less vulnerable than females and consumers in rural areas are more vulnerable than consumers living in small and large towns
Fewer links with socio-demographic categories are found for vulnerability that stems from complexity with offer and terms and conditions Similar to the other vulnerability type consumers are more likely to feel vulnerable due to complexity when they are in a more difficult
financial situation In addition consumers aged 55 years or older are less likely to be vulnerable than consumers younger than 55 years Finally internet usage is also associated with this type of vulnerability consumers that never use the internet are less likely to perceive themselves vulnerable due to complexity than daily and weekly internet users
Consumer Survey 2018
202
14 DETERMINANTS OF CONSUMER CONDITIONS
As part of this report on consumersrsquo attitudes towards cross-border trade and consumer protection this chapter presents an overview of the links between the socio-demographic variables and a series of key consumer conditions indicators This overview is a summary of the results of a multivariate analysis which estimates the influence of each individual socio-demographic characteristic with the
other characteristics held constant48 The table below shows the socio-demographic variables as rows and the different key consumer conditions indicators in the columns49 By comparing estimated averages across the different dependent variables conclusions about the link of the different socio-demographic with consumer conditions can be drawn
The financial situation of the persons interviewed is the factor more closely linked with consumer conditions Persons with a difficult financial situation (ie a very or fairly difficult situation) tend to show lower trust in organisations lower confidence in online shopping lower trust in product safety
lower trust in environmental claims and a higher probability to experience UCPs Trust in organisations and confidence in online shopping is also lower for people with severe financial problems (ie a very difficult financial situation) than for people with a fairly difficult financial situation the former group being more likely to be exposed to UCPs Likewise trust in redress
mechanisms is lower for people with severe financial problems than the remainder of the population Finally persons in an easy or very easy financial situation score higher on the problems and
complaints indicator than people with severe financial problems
Age tends to be negatively correlated with most of the variables covering trust and confidence Persons of 55 years old and above tend to express lower levels of trust in organisations trust in redress mechanisms and confidence in online shopping than the rest of the population In addition young persons (less than 35 years old) are more likely to express trust in environmental claims than those aged 55 or more There is also a marked negative correlation between age and consumersrsquo confidence in online shopping In contrast young persons appear less knowledgeable of their
consumer rights than all the other age groups and they are more likely to experience other shopping problems (ie other illicit practices) Finally persons aged 65 and above show slightly less numerical skills than the rest of the population
Levels of education are positively correlated with confidence in online shopping and as it can be expected to numerical skills In contrast highly educated persons are more likely to be exposed to unfair commercial practices they show a lower score on the problems and complaints indicator and
they are less likely to express trust in redress mechanisms than the rest of the population In
48 The analysis has been performed on the micro-data from the 2018 Survey on Consumersrsquo attitudes towards cross-border trade and consumer protection It covers the 27 EU Member States (ie EU27_2019 excluding the UK) The statistical modelling that was used here is a regression analysis This type of analysis is useful when we want to investigate the relationship between a dependent variable and one or more independent variables There are several different types of regression models We have used both a Poisson model and a Logit model The former is typically used when the dependent variable can be thought of as a count variable The latter is used in a situation where the dependent variable is binary ie it takes only two possible values ldquo0rdquo and ldquo1rdquo The Poisson regression model was used for the following dependent variables knowledge of consumer rights trust in organisations confidence in online shopping trust in redress mechanisms (no) exposure to UCPs (no) experience of other illicit commercial practices and numerical skills The Logit regression model was used for the remaining dependent variables trust in product safety trust in environmental claims The composite indicator on problems and complaints was instead modelled through linear regression (assuming that the variable is numerical) In all models a control variable on the region of residence of the person interviewed (Northern EU Southern EU Eastern EU and Western EU) has been included
49 The table shows the estimated averages of the model for each dependent variable according to the different values of the independent variable In addition these averages should be considered statistically different except when the pair of categories shares one letter (see the column adjacent to the right) When a category
is associated with a blank it means that it is statistically different from all the other categories The letters used in the table have no meaning as they are only used for comparing categories For example an estimated average for knowledge of consumer rights is equal to 047 for males and to 044 for females and this difference is statistically significant (both categories are associated with a blank) Conversely an estimated average on trust in product safety is equal to 067 for low educated persons and to 069 for highly educated persons (but the difference is not statistically significant as both categories share the letter A) Similarly estimated averages on trust in environmental claims are equal to 056 for daily internet users and to 059 for monthly internet users (but the difference is not statistically significant as both categories share the letter C) Estimated averages are all standardized (with a range from 0 to 1) they can be compared across both rows and columns
Consumer Survey 2018
203
addition persons with a low level of education show higher trust in organisations than the rest of the
population It should also be underlined that the knowledge of consumer rights seems not to be influenced by the level of education of the respondents
Perceived vulnerability stemming from the perceived complexity of offersterms and conditions tends to be associated with lower scores on several consumer conditions aspects Consumers who consider themselves as not vulnerable have higher trust in organizations and in redress mechanisms and they are also less likely to be exposed to UCPs and to other illicit practices In addition very vulnerable consumers show less confidence in online buying and lower trust in
environmental claims Finally there is a negative correlation between perceived vulnerability and the problems and complaints indicator (ie the more a person feels vulnerable the lower the score on the problems and complaints indicator)
Perceived vulnerability related to the socio-demographic status of the persons interviewed tends to be linked to lower trust in organizations and a higher probability to encounter other illicit practices In addition persons who perceive themselves as very vulnerable show lower numerical
skills and lower trust in product safety than the rest of the population Similarly consumers who do not feel vulnerable have more confidence in online shopping and they are less likely to encounter
unfair commercial practices (UCPs) with respect to those who have declared to be vulnerable or very vulnerable
Internet use shows as it can be expected a strong positive confidence in online shopping with a strong difference between consumers who never use the internet and those who use the internet daily In addition persons who use the internet at least weekly portray higher levels of trust in
product safety with respect to those who use the internet either sporadically or never Conversely daily internet users are more likely to be exposed to UCPs than the rest of the population
Men tend to be more knowledgeable of their rights as consumers more confident in online shopping and more trustful in regard to product safety They also show higher trust in redress mechanism On the other hand women are less likely to be exposed to unfair commercial practices and are less likely to experience other shopping problems
Consumers whose mother tongue is different from the official language(s) of their country of
residence appear less knowledgeable of their rights as consumers and seem to have lower numerical skills On the other hand they are less likely to report other illicit practices and have higher trust in
product safety
As it can be expected consumers with more language skills (ie more than one language) are more confident in online shopping These consumers also tend to have better numerical skills Nevertheless the same group of persons is also slightly more likely to be exposed to unfair
commercial practices and other illicit practices which may be related to a more active (international) shopping behaviour Extensive language skills seem to be partly associated with lower trust in environmental claims as consumers who speak three or more languages trust these claims to a lesser degree than consumers who speak only one language
The influence of employment status on consumer conditions is less clear-cut than what can be observed for other socio-demographic factors White-collar (excluding managers) are slightly more knowledgeable of their rights as consumers Self-employed and managers are more likely to be
exposed to unfair commercial practices and self-employed most likely experience other shopping problems In addition self-employed show the lowest score on the problems and complaints indicator indicating a lower overall level of problems and higher satisfaction with complaint handling
The influence of numerical skills on consumer conditions is limited High numerical skills are associated with higher confidence in online shopping and more trust in product safety
Finally the area of residence (ie urbanisation rural small town and large town) also has a limited link with consumer conditions Trust in organisations is higher in rural areas compared to small and
large towns Numerical skills appear to be slightly lower in small towns than in large towns and rural areas
Consumer Survey 2018
204
Age
18-34 041 067 B 066 041 070 A 085 037 AB 067 A 058 B 088 A
35-54 046 A 066 B 061 038 070 A 088 A 038 B 069 A 055 AB 089 AB
55-64 049 B 062 A 054 034 A 069 A 089 AB 037 A 068 A 052 A 090 B
65+ 048 AB 062 A 045 032 A 071 A 091 B 034 069 A 051 A 091 B
Gender
Female 044 065 A 056 035 071 089 037 A 066 053 A 090 A
Male 047 065 A 061 039 069 087 037 A 071 055 A 089 A
Education
Low (ISCED 0-2) 044 A 068 052 040 A 075 090 B 034 067 A 057 B 091 A
Medium (ISCED 3-4) 046 A 065 A 057 039 A 070 088 AB 036 068 A 055 AB 090 A
High (ISCED 5-8) 045 A 064 A 061 034 069 087 A 038 069 A 053 A 088
Employment status
Self-employed 045 A 063 A 059 BC 036 AB 066 A 085 A 037 B 069 A 055 A 086 A
Manager 045 A 065 AB 061 CD 035 A 064 A 086 AB 038 B 068 A 054 A 088 AB
Other white collar 049 066 B 060 CD 037 AB 071 B 088 BC 038 B 070 A 053 A 090 BCD
Blue Collar 043 A 064 AB 056 AB 038 AB 070 B 089 BC 035 A 067 A 053 A 090 BCD
Student 043 A 067 B 063 D 038 AB 074 B 090 BC 038 B 070 A 059 A 092 CD
Unemployed 043 A 065 AB 057 ABC 040 B 072 B 089 BC 036 AB 068 A 056 A 088 ABC
Seeking a job 045 A 066 AB 061 BCD 038 AB 073 B 086 ABC 035 A 065 A 051 A 092 D
Retired 045 A 064 AB 053 A 037 AB 070 B 089 C 037 AB 067 A 056 A 089 ABCD
Internet use
Daily 047 B 066 B 063 038 B 068 088 A 038 C 069 C 056 C 089 A
Weekly 043 A 062 A 050 B 035 AB 074 A 088 AB 037 BC 069 C 047 A 091 B
Monthly 041 A 063 AB 041 AB 033 AB 074 AB 086 AB 034 AB 070 BC 059 BC 091 AB
Hardly ever 047 AB 054 A 037 A 030 A 075 AB 092 C 033 A 059 AB 050 ABC 091 AB
Never 042 A 060 A 025 035 AB 078 B 090 BC 032 A 061 A 050 AB 093 B
Urbanisation
Rural area 044 A 067 059 A 037 A 069 A 088 AB 037 A 069 A 055 A 090 A
Small town 047 B 064 A 059 A 037 A 070 A 088 B 036 068 A 054 A 089 A
Large town 046 AB 064 A 058 A 037 A 070 A 087 A 037 A 069 A 054 A 090 A
Language
One 045 A 064 AB 055 037 A 071 090 035 068 A 057 C 090 A
Two 046 AB 066 B 060 A 037 A 070 A 088 A 038 A 069 A 054 BC 089 A
Three 046 AB 065 AB 061 A 037 A 068 A 086 A 038 AB 068 A 052 AB 089 A
Four or more 049 B 063 A 061 A 036 A 068 A 085 A 039 B 070 A 049 A 090 A
Financial_difficulty
Very difficult 046 AB 056 048 032 065 085 A 036 A 063 A 047 A 086 A
Fairly difficult 045 A 062 056 036 A 069 087 AB 037 A 066 A 051 A 089 AB
Fairly easy 045 A 067 A 060 A 038 B 071 A 089 C 037 A 070 B 057 B 090 BC
Easy 048 B 068 A 062 A 039 AB 072 A 088 BC 037 A 071 B 055 B 091 C
Numerical skills
Low 045 AB 063 A 055 A 037 A 069 A 089 A 066 A 054 A 090 A
Medium 045 A 064 A 057 A 038 A 070 A 088 A 067 A 054 A 089 A
High 046 B 065 A 060 036 A 070 A 088 A 070 054 A 089 A
Vulner sociodemo
Very vulnerable 044 A 060 055 A 038 A 067 A 084 035 063 052 A 089 A
Somewhat vulnerable 045 A 064 056 A 037 A 067 A 087 037 A 069 A 053 A 089 A
Not vulnerable 046 A 067 060 037 A 072 090 037 A 070 A 056 A 090 A
Vulner complexity
Very vulnerable 046 A 062 A 054 035 A 066 A 085 A 037 A 064 A 050 085
Somewhat vulnerable 046 A 064 A 058 A 035 A 067 A 086 A 037 A 067 AB 054 A 089
Not vulnerable 046 A 066 060 A 038 072 089 037 A 070 B 056 A 091
Mother Tongue
No 042 063 A 056 A 036 A 070 A 084 035 066 A 060 088 A
Yes 046 065 A 059 A 037 A 070 A 088 037 068 A 054 090 A
No
exp
eri
en
ce
wit
h o
ther
illi
cit
pra
cti
ces
Nu
meri
cal
skil
ls
Tru
st
in p
rod
uct
safe
ty
Tru
st
in
en
vir
om
en
tal
cla
ims
Pro
ble
ms a
nd
co
mp
lain
ts
ind
icato
r
Kn
ow
led
ge o
f
co
nsu
mer
rig
hts
Tru
st
in
org
an
isati
on
s
Co
nfi
den
ce i
n
on
lin
e s
ho
pp
ing
Tru
st
in r
ed
ress
mech
an
ism
No
exp
osu
re t
o
UC
Ps
Consumer Survey 2018
205
15 ANNEX I SAMPLING METHODOLOGY
In every country a random sample representative of the national population aged 18 or over was drawn ie each person belonging to the target universe had a chance to participate in the survey For some countries suitable telephone number register(s) are available for both fixed and mobile lines whilst for other countries only register(s) for either fixed or mobile lines can be used and in
some countries no register exists at all In instances where no register was available RDD50-numbers were generated The following variables were used for stratification gender age and region as far as the information was available in the sample frame(s)
A dual sampling frame was introduced
Mobile sample potential respondents within a given country that can be reached via a mobile line (regardless of whether they can also be reached via a fixed line) As such this sample includes respondents from both the mobile only and mixed population
119924119952119939119946119949119942 119956119938119950119953119949119942 =119927119955119952119953119952119955119957119946119952119951 119952119943 119950119952119939119946119949119942 119949119946119951119942119956
119931119952119957119938119949 119953119952119953119958119949119938119957119946119952119951 119952119943 119953119945119952119951119942 119951119958119950119939119942119955119956=
119924 + 119924119917(119924 + 119924119917) + (119917 + 119924119917)
Fixed sample potential respondents within a given country that can be reached via a fixed line (regardless of whether they can also be reached via mobile line) As such this sample includes respondents from both the fixed line only and mixed population
119917119946119961119942119941 119949119946119951119942 119956119938119950119953119949119942 =119927119955119952119953119952119955119957119946119952119951 119952119943 119943119946119961119942119941 119949119946119951119942119956
119931119952119957119938119949 119953119952119953119958119949119938119957119946119952119951 119952119943 119953119945119952119951119942 119951119958119950119939119942119955119956=
119917 + 119924119917
(119924 + 119924119917) + (119917 + 119924119917)
F = fixed only M = mobile only and MF = mobile and fixed
For example Germany was set to have the following proportions in the study 83 mixed 9 fixed only 8 mobile only Therefore the local teams composed a gross sample of 50 fixed numbers defined as ((83+9)(83+9)+(83+8)) and 50 mobile numbers ((83+8)(83+9)+(83+8))
To further guarantee the representativeness of the sample the time of calling was predominantly weekday evenings with interviewing before only authorised upon specific request with a motivated rationale In case of interviews conducted during the weekend or appointments made upon
respondent request calls could take place all day long Also the birthday rule question was included for landlines to ensure a random selection procedure and minimise potential bias related to the person who would answer the call
No quota was set for socio-demographic variables such as gender or age However during fieldwork the overall sample intake was monitored daily to follow up on the overall composition of the sample on gender age region and the possession of a mobile andor a fixed phone in accordance with the
sampling approach adopted
50 Random Digit Dialing With RDD software is used to generate new telephone numbers starting from a list of starting numbers New telephone numbers are created and used by adding and subtracting digits in the existing telephone number The composition of the starting number is important here for obtaining sufficient geographical spread
Consumer Survey 2018
206
HOW TO OBTAIN EU PUBLICATIONS
Free publications
bull one copy via EU Bookshop (httpbookshopeuropaeu)
bull more than one copy or postersmaps from the European Unionrsquos representations (httpeceuropaeurepresent_enhtm) from the delegations in non-EU countries (httpeeaseuropaeudelegationsindex_enhtm) by contacting the Europe Direct service (httpeuropaeueuropedirectindex_enhtm) or calling 00 800 6 7 8
9 10 11 (freephone number from anywhere in the EU) () () The information given is free as are most calls (though some operators phone boxes or hotels may charge you)
Priced publications
bull via EU Bookshop (httpbookshopeuropaeu)
doi 102818209599
EB-0
1-1
9-1
85-E
N-N