consumer staples - max m. fisher college of business · 2017-10-28 · • competition continues to...
TRANSCRIPT

CONSUMER STAPLES
Joel ForwalderRyan FrankMichael Kerr
1

TABLE
OF
CO
NTEN
TSTopics of Discussion
I. Overview
II. Business Analysis
III. Economic Analysis
IV. Financial Analysis
V. Valuation Analysis
VI. Recommendation
Slide 3
Slide 7
Slide13
Slide 23
Slide 30
Slide 39
2

I. OVERVIEW
3

OVER
VIEW
S&P 500 Sector WeightingsCompanies in SIM Portfolio
Consumer Staples Performance vs S&P 500 YTD
4
Tech, 23.60%
Financials, 14.70%
Healthcare, 14.55%
Consumer Discretionary,
11.80%
Industrials, 10.25%
Consumer Staples, 8.05%
Energy, 5.90%
Utilities, 3.15%Materials, 3.00%
Real Estate, 3.00% Telecom, 2.00%
90
95
100
105
110
115
120
12/30/2016 1/30/2017 2/28/2017 3/31/2017 4/30/2017 5/31/2017 6/30/2017 7/31/2017 8/31/2017 9/30/2017
S5CONS Index SPX Index
S&P 500 is up 15% YTD
Consumer Staples are up 4.4% YTD
MarketCap:$3.35/24.06T

OVER
VIEW
• Food Products
• Beverages
• Food & Staples Retailing
• Household Products
• Personal Products
• Tobacco
Sub-Sectors Major Companies
5
Consumer Staples by Sub-Sector
Beverages24.8%
Food & Staples Retailing
21.3%
Household Products
20.7%
Tobacco16.4%
Food Products15.0%
Personal Care Products
1.8%

OVER
VIEWStaples Sub-Sector Performance YTD
6
80
85
90
95
100
105
110
115
120
125
130
12/30/2016 1/30/2017 2/28/2017 3/31/2017 4/30/2017 5/31/2017 6/30/2017 7/31/2017 8/31/2017 9/30/2017
Consumer Staples Beverages Food & Staples Retailing Food Products Household Products Personal Products Tobacco
Personal Products Beverages Tobacco Household
Products
Food & Staples
Retailing
Food Products
YTD Performance 23.6% 10.8% 8.3% 5.2% 1.4% (-7.7%)

II. BUSINESS ANALYSIS
7

BU
SINESS
AN
ALYSISPhase of Business Cycle
• U.S.betweenmid- andlate-cyclephase
• Globaleconomyinsynchronizedexpansionwithlowrecessionrisk
• Upsidetoglobaleconomicmomentummayhavepeaked
• Steadydividendsandlowvolatilitymakethistraditionallystablesectormoreattractivetoinvestorslateinthebusinesscycle
8
BU
SINESS
AN
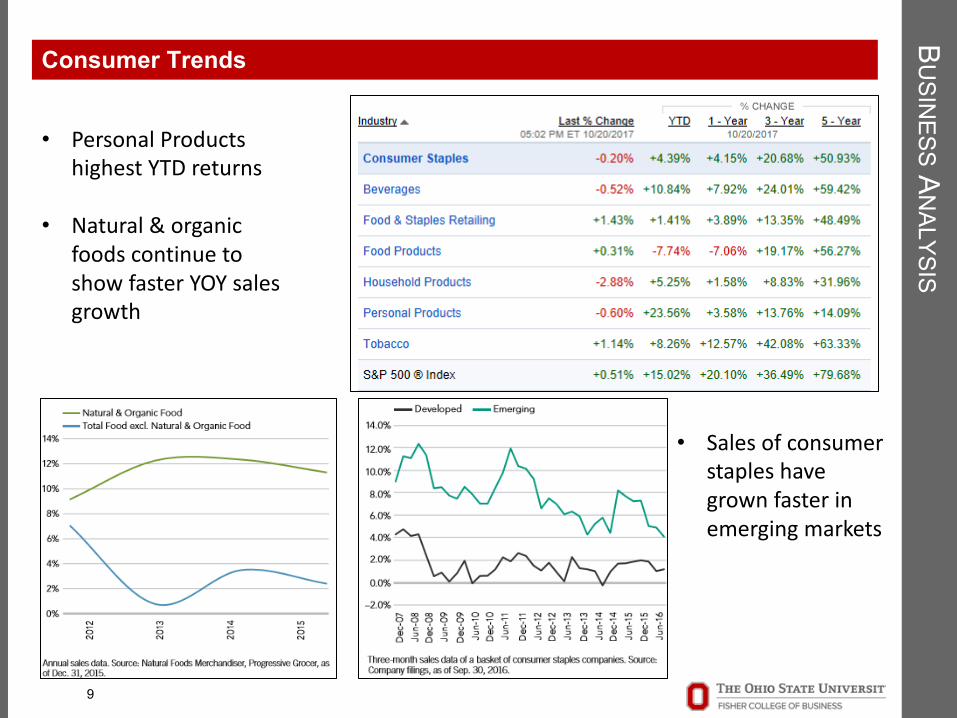
ALYSISConsumer Trends
• PersonalProductshighestYTDreturns
• Natural&organicfoodscontinuetoshowfasterYOYsalesgrowth
• Salesofconsumerstapleshavegrownfasterinemergingmarkets
9
BU
SINESS
AN
ALYSISSupply & Demand
10
• Non-Cyclical/Defensive
• Supplierseasilymatchthedemandgiventherelativelyconsistentnatureofthesector
• Demandfortheproductsusuallygrowsinrelationtooverallpopulationgrowth,excludingspecifictrends
BU
SINESS
AN
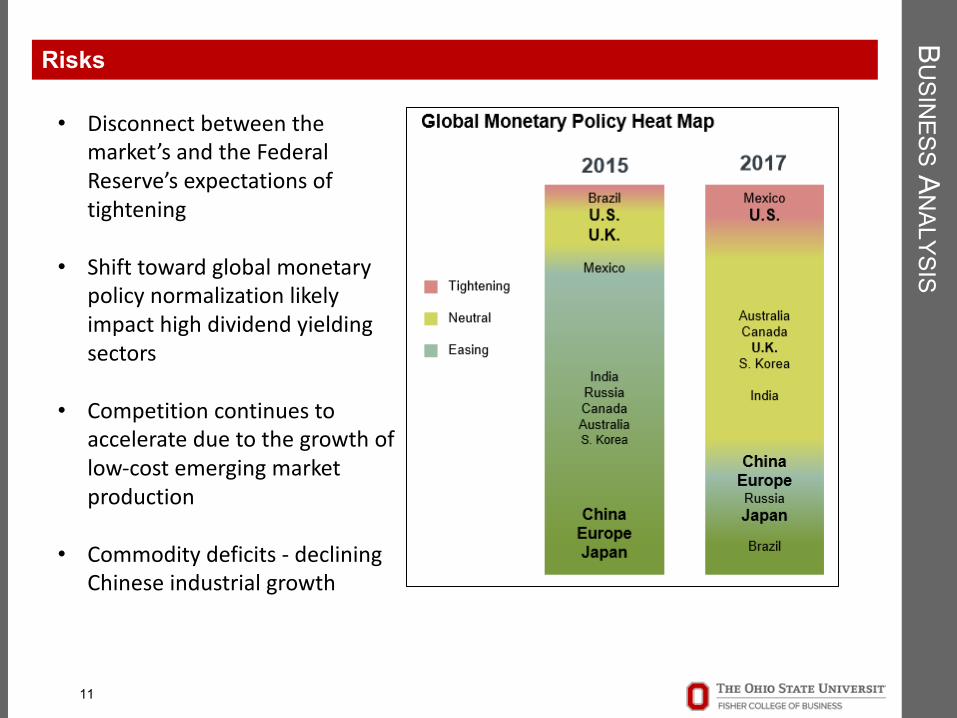
ALYSISRisks
• Disconnectbetweenthemarket’sandtheFederalReserve’sexpectationsoftightening
• Shifttowardglobalmonetarypolicynormalizationlikelyimpacthighdividendyieldingsectors
• Competitioncontinuestoaccelerateduetothegrowthoflow-costemergingmarketproduction
• Commoditydeficits- decliningChineseindustrialgrowth
11
BU
SINESS
AN
ALYSISCompetitive Analysis
12
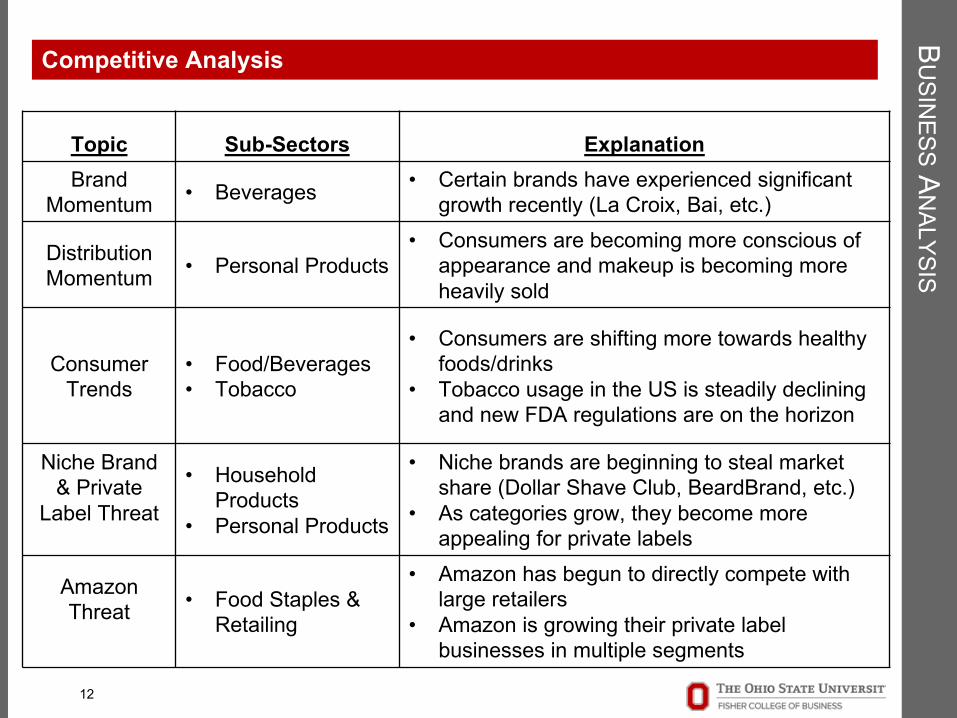
Topic Sub-Sectors ExplanationBrand
Momentum • Beverages • Certain brands have experienced significant growth recently (La Croix, Bai, etc.)
Distribution Momentum • Personal Products
• Consumers are becoming more conscious of appearance and makeup is becoming more heavily sold
Consumer Trends
• Food/Beverages• Tobacco
• Consumers are shifting more towards healthy foods/drinks
• Tobacco usage in the US is steadily declining and new FDA regulations are on the horizon
Niche Brand& Private
Label Threat
• Household Products
• Personal Products
• Niche brands are beginning to steal market share (Dollar Shave Club, BeardBrand, etc.)
• As categories grow, they become more appealing for private labels
Amazon Threat • Food Staples &
Retailing
• Amazon has begun to directly compete with large retailers
• Amazon is growing their private label businesses in multiple segments

III. ECONOMIC ANALYSIS
13

EC
ON
OM
ICA
NALYSIS
U.S 10-Year Treasury vs. Consumer Staples
14
EC
ON
OM
ICA
NALYSIS
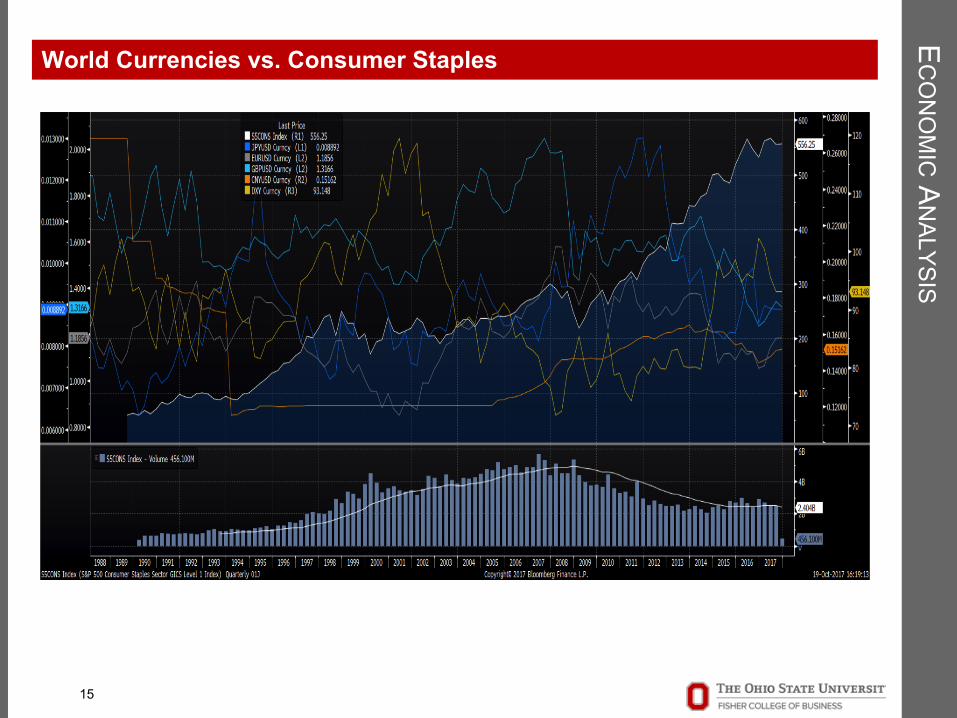
World Currencies vs. Consumer Staples
15

EC
ON
OM
ICA
NALYSIS
Consumer Sentiment vs. Consumer Staples
16
EC
ON
OM
ICA
NALYSIS
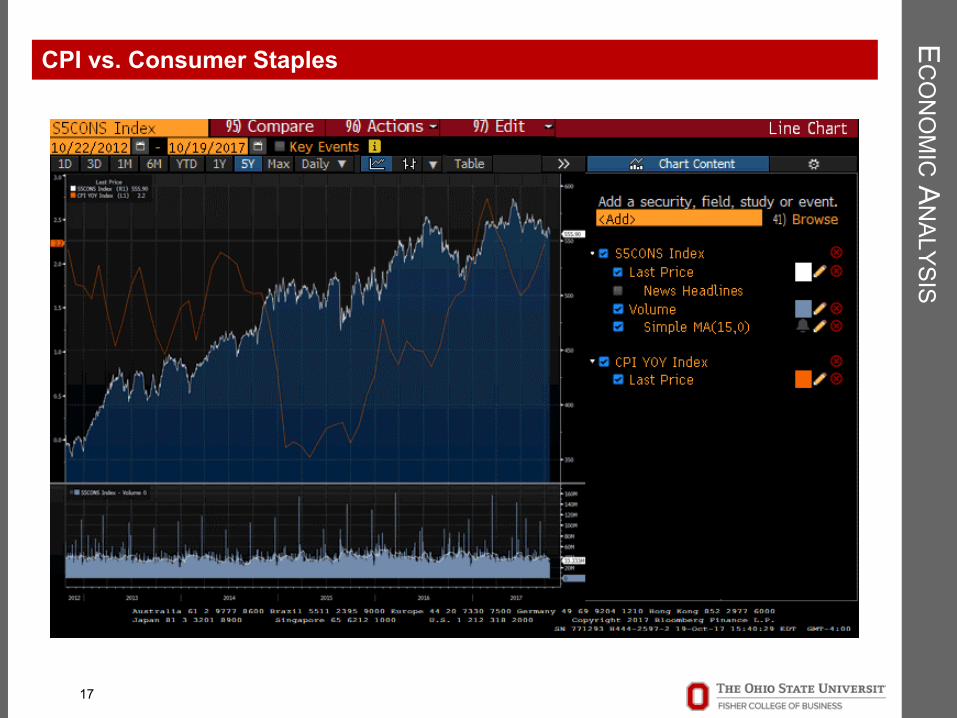
CPI vs. Consumer Staples
17

EC
ON
OM
ICA
NALYSIS
Seasonality Effects On Consumer Staples
18

EC
ON
OM
ICA
NALYSIS
U.S. Retail Trade Industries vs. Consumer Staples
19

EC
ON
OM
ICA
NALYSIS
U.S. Merchant Wholesale Industry vs. Consumer Staples
20
EC
ON
OM
ICA
NALYSIS
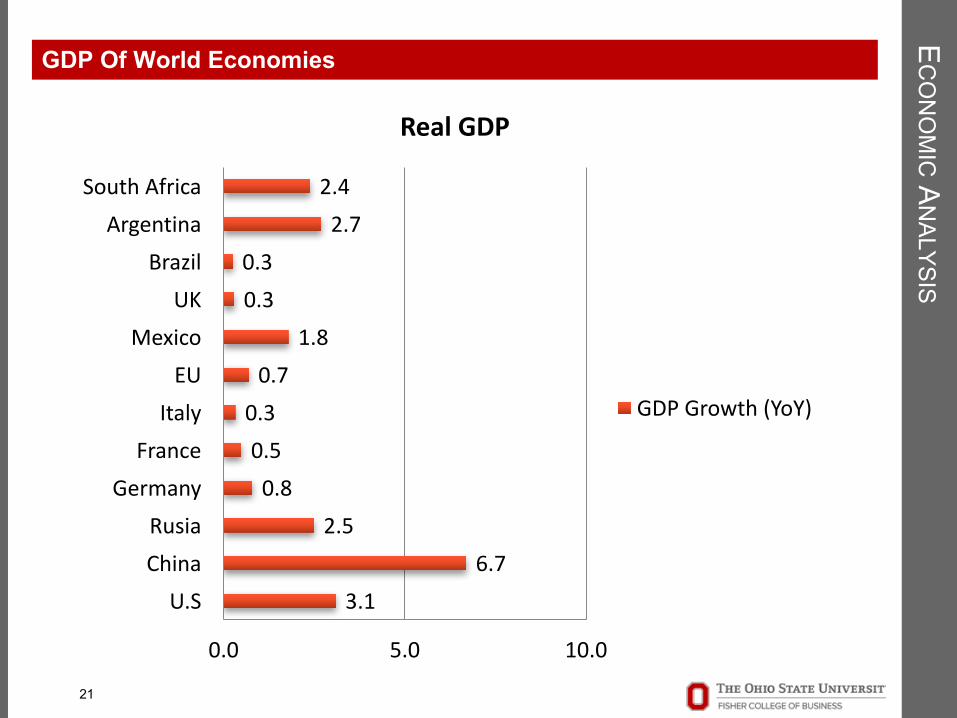
GDP Of World Economies
21
3.16.7
2.50.80.50.30.7
1.80.30.3
2.72.4
0.0 5.0 10.0
U.SChinaRusia
GermanyFranceItalyEU
MexicoUK
BrazilArgentina
SouthAfrica
RealGDP
GDPGrowth(YoY)
EC
ON
OM
ICA
NALYSIS
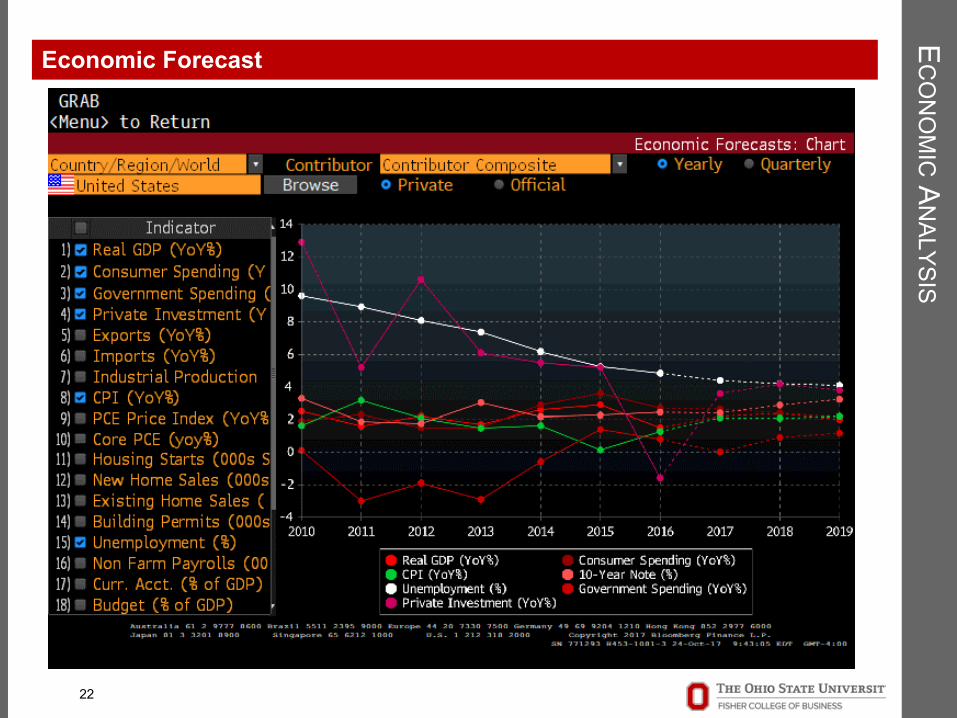
Economic Forecast
22
IV. FINANCIAL ANALYSIS
23

FIN
ANC
IALA
NALYSIS
Staples Sales Growth Staples EBITDA Growth
Staples Earnings Growth
24
-10.0%
-5.0%
0.0%
5.0%
10.0%
15.0%
20.0%
25.0%
30.0%
1990 1995 2000 2005 2010 2015
-5.0%
0.0%
5.0%
10.0%
15.0%
20.0%
1990 1995 2000 2005 2010 2015
-10.0%
-5.0%
0.0%
5.0%
10.0%
15.0%
20.0%
1990 1995 2000 2005 2010 2015

-30%
-20%
-10%
0%
10%
20%
30%
40%
50%
60%
2007 2012 2017
Beverages Average Food & Staples Retailing Average
Food Products Average Household Products Average
Personal Products Average Tobacco Average
FIN
ANC
IALA
NALYSIS
25
Sub-Sector Sales 3 Year Growth Sub-Sector EBITDA 3 Year Growth
Sub-Sector Earnings 3 Year Growth
Most sub-sectors have seen little or negative growth recently -30%
-20%
-10%
0%
10%
20%
30%
40%
50%
60%
70%
2007 2012 2017
Beverages Average Food & Staples Retailing Average
Food Products Average Household Products Average
Personal Products Average Tobacco Average
-20%
-10%
0%
10%
20%
30%
40%
50%
2007 2012 2017
Beverages Average Food & Staples Retailing Average
Food Products Average Household Products Average
Personal Products Average Tobacco Average
FIN
ANC
IALA
NALYSIS
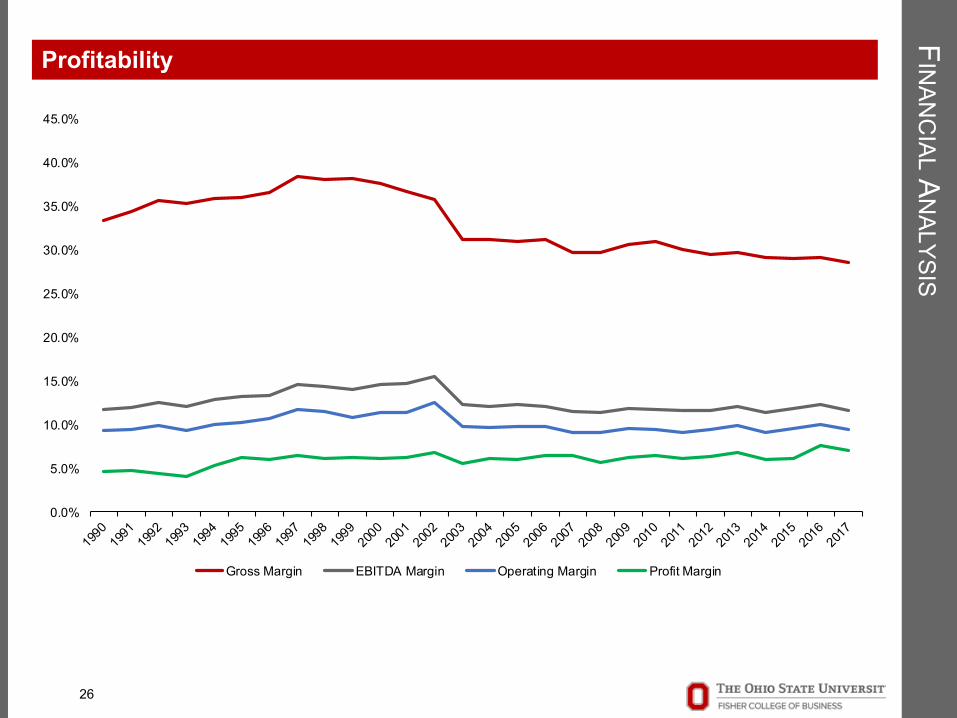
Profitability
26
0.0%
5.0%
10.0%
15.0%
20.0%
25.0%
30.0%
35.0%
40.0%
45.0%
Gross Margin EBITDA Margin Operating Margin Profit Margin
FIN
ANC
IALA
NALYSIS
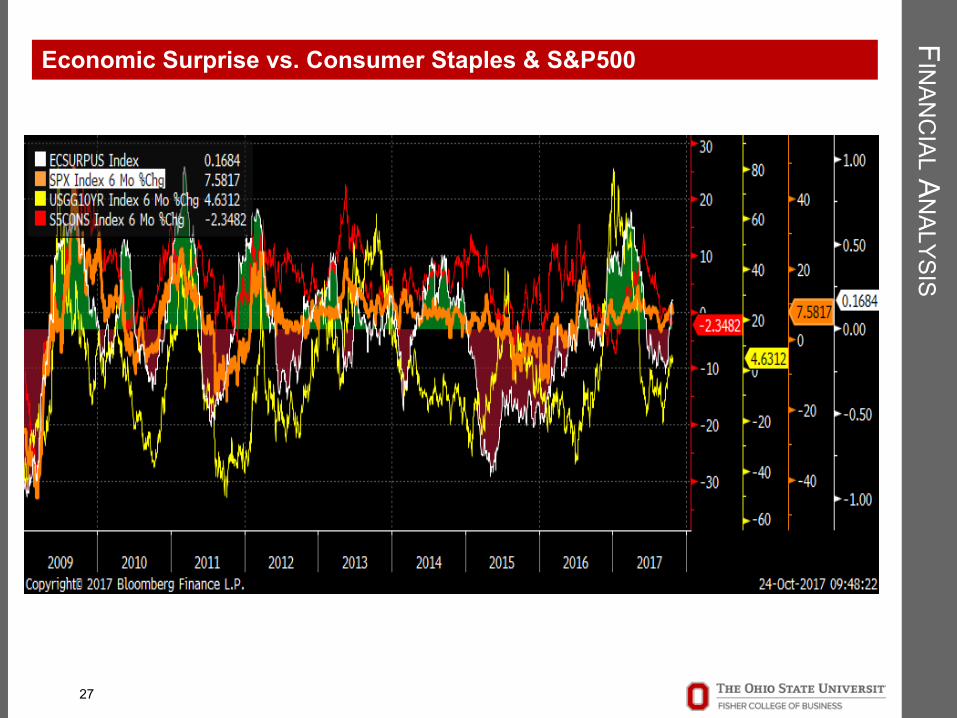
Economic Surprise vs. Consumer Staples & S&P500
27
FIN
ANC
IALA
NALYSIS
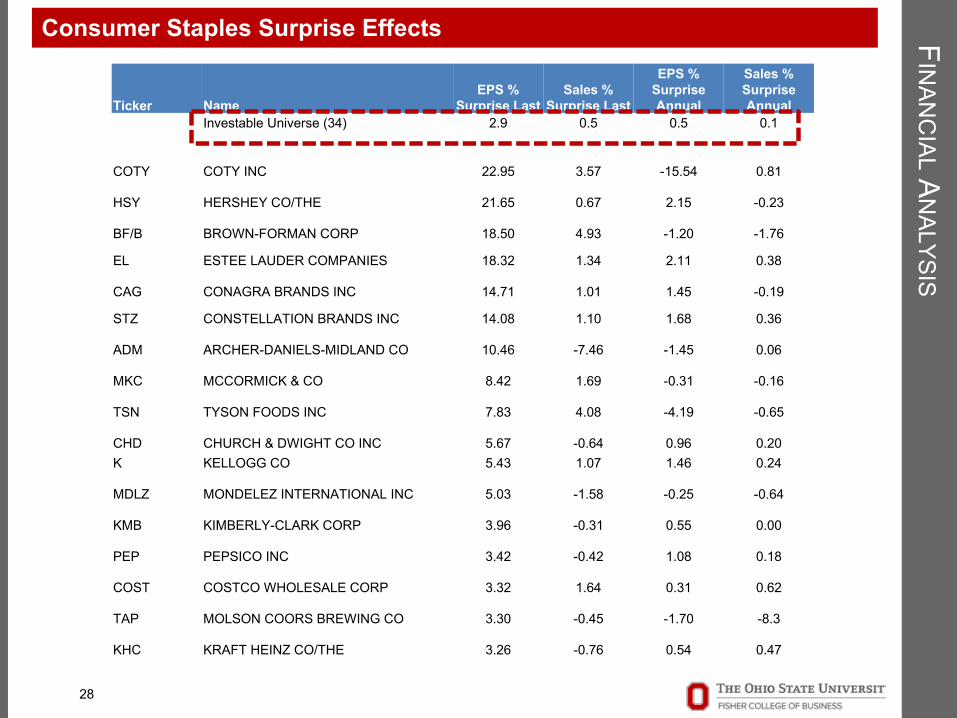
Consumer Staples Surprise Effects
28
Ticker NameEPS %
Surprise LastSales %
Surprise Last
EPS % Surprise Annual
Sales % Surprise Annual
Investable Universe (34) 2.9 0.5 0.5 0.1
COTY COTY INC 22.95 3.57 -15.54 0.81
HSY HERSHEY CO/THE 21.65 0.67 2.15 -0.23
BF/B BROWN-FORMAN CORP 18.50 4.93 -1.20 -1.76
EL ESTEE LAUDER COMPANIES 18.32 1.34 2.11 0.38
CAG CONAGRA BRANDS INC 14.71 1.01 1.45 -0.19
STZ CONSTELLATION BRANDS INC 14.08 1.10 1.68 0.36
ADM ARCHER-DANIELS-MIDLAND CO 10.46 -7.46 -1.45 0.06
MKC MCCORMICK & CO 8.42 1.69 -0.31 -0.16
TSN TYSON FOODS INC 7.83 4.08 -4.19 -0.65
CHD CHURCH & DWIGHT CO INC 5.67 -0.64 0.96 0.20K KELLOGG CO 5.43 1.07 1.46 0.24
MDLZ MONDELEZ INTERNATIONAL INC 5.03 -1.58 -0.25 -0.64
KMB KIMBERLY-CLARK CORP 3.96 -0.31 0.55 0.00
PEP PEPSICO INC 3.42 -0.42 1.08 0.18
COST COSTCO WHOLESALE CORP 3.32 1.64 0.31 0.62
TAP MOLSON COORS BREWING CO 3.30 -0.45 -1.70 -8.3
KHC KRAFT HEINZ CO/THE 3.26 -0.76 0.54 0.47

FIN
ANC
IALA
NALYSIS
Consumer Staples Surprise Effects (Cont.)
29
Ticker NameEPS % Surprise
LastSales % Surprise
LastEPS % Surprise
AnnualSales % Surprise
AnnualInvestable Universe (34) 2.9 0.5 0.5 0.1
WBAWALGREENS BOOTS ALLIANCE INC 2.62 1.27 1.88 -0.45
CLX CLOROX COMPANY 2.61 0.11 0.56 0.07KO COCA-COLA CO/THE 2.60 0.62 -0.05 0.70
CVS CVS HEALTH CORP 1.75 0.74 0.56 -0.29
PGPROCTER & GAMBLE CO/THE 1.20 -0.18 1.92 0.09
WMT WAL-MART STORES INC 0.84 0.16 0.16 0.03SYY SYSCO CORP 0.69 0.50 0.44 0.05
CL COLGATE-PALMOLIVE CO -0.13 -1.69 -0.24 -0.84
KR KROGER CO -0.51 0.40 0.76 0.16MO ALTRIA GROUP INC -1.04 0.97 0.03 -0.43
DPSDR PEPPER SNAPPLE GROUP INC -2.26 1.62 -0.49 0.13
MNSTMONSTER BEVERAGE CORP -3.50 0.63 4.60 0.91
CPB CAMPBELL SOUP CO -5.62 -1.42 -0.26 -0.29
SJM JM SMUCKER CO/THE -6.61 -3.58 1.17 0.18GIS GENERAL MILLS INC -7.18 -0.80 0.91 0.37
HRL HORMEL FOODS CORP -7.88 -1.23 -0.24 0.11
PMPHILIP MORRIS INTERNATIONAL -8.23 -3.59 -0.17 1.15

V. VALUATION ANALYSIS
30
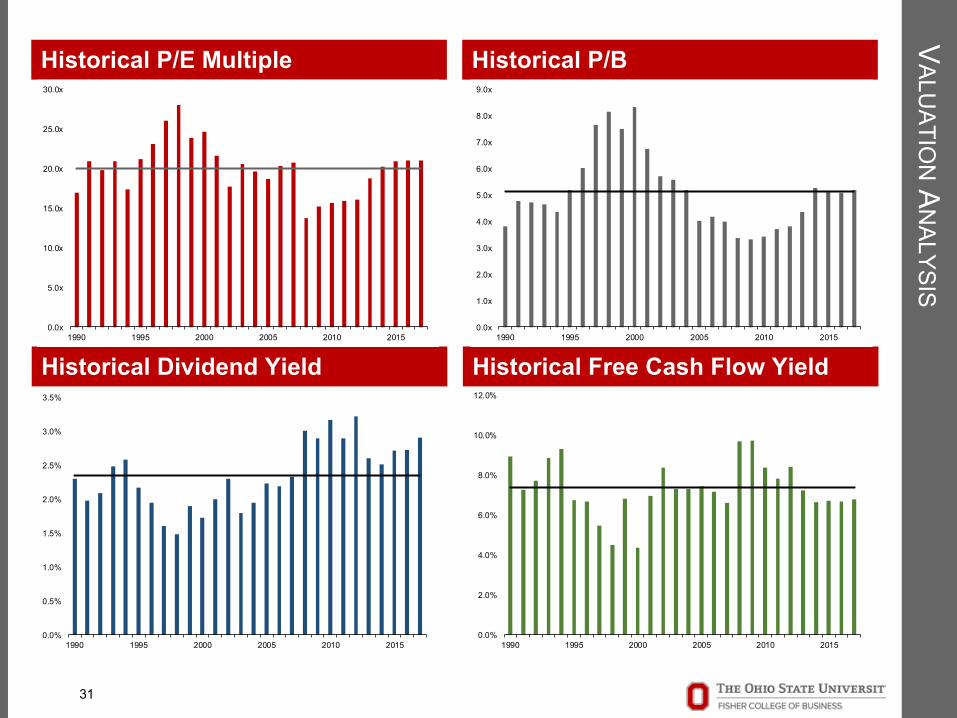
VALU
ATION
AN
ALYSIS
0.0%
2.0%
4.0%
6.0%
8.0%
10.0%
12.0%
1990 1995 2000 2005 2010 2015
Historical Free Cash Flow YieldHistorical Dividend Yield
Historical P/E Multiple Historical P/B
31
0.0%
0.5%
1.0%
1.5%
2.0%
2.5%
3.0%
3.5%
1990 1995 2000 2005 2010 2015
0.0x
5.0x
10.0x
15.0x
20.0x
25.0x
30.0x
1990 1995 2000 2005 2010 20150.0x
1.0x
2.0x
3.0x
4.0x
5.0x
6.0x
7.0x
8.0x
9.0x
1990 1995 2000 2005 2010 2015
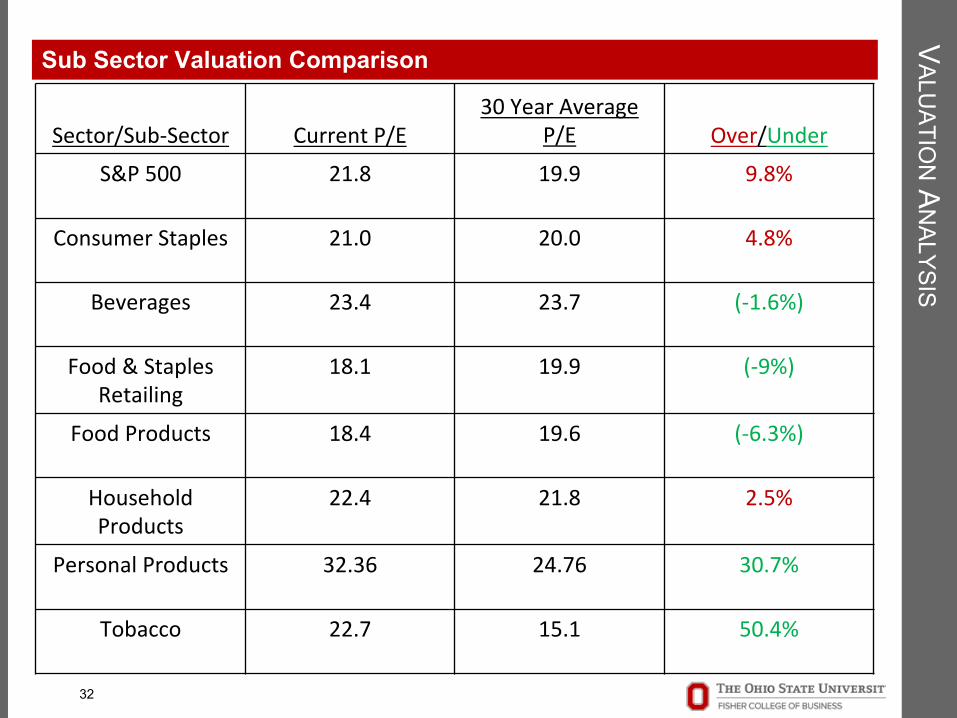
VALU
ATION
AN
ALYSISSub Sector Valuation Comparison
32
Sector/Sub-Sector CurrentP/E30YearAverage
P/E Over/UnderS&P500 21.8 19.9 9.8%
ConsumerStaples 21.0 20.0 4.8%
Beverages 23.4 23.7 (-1.6%)
Food&StaplesRetailing
18.1 19.9 (-9%)
FoodProducts 18.4 19.6 (-6.3%)
HouseholdProducts
22.4 21.8 2.5%
Personal Products 32.36 24.76 30.7%
Tobacco 22.7 15.1 50.4%
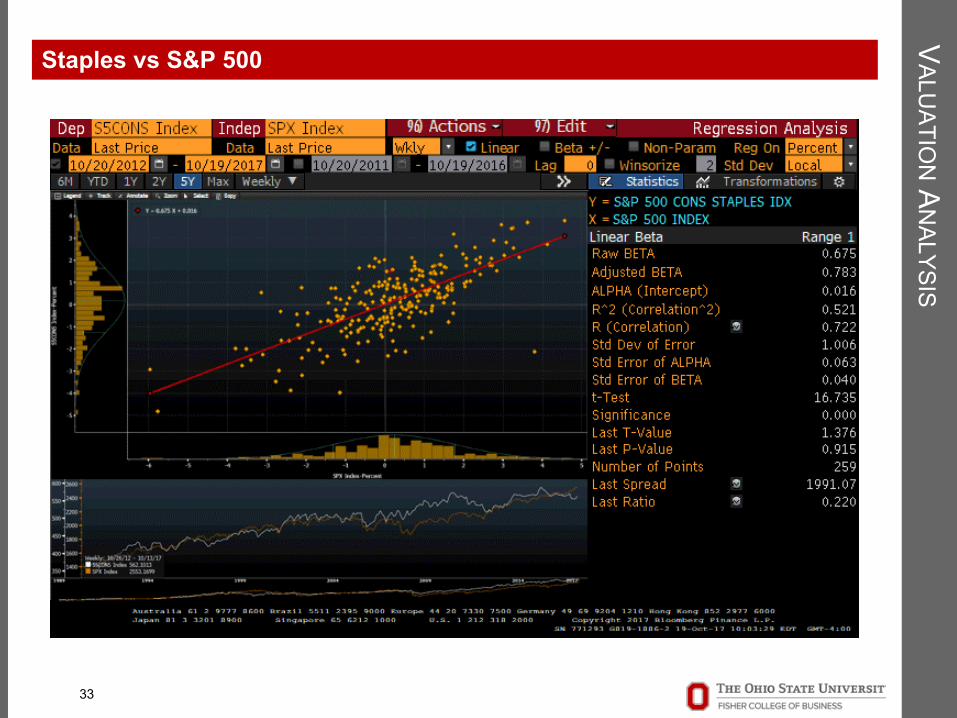
VALU
ATION
AN
ALYSISStaples vs S&P 500
33
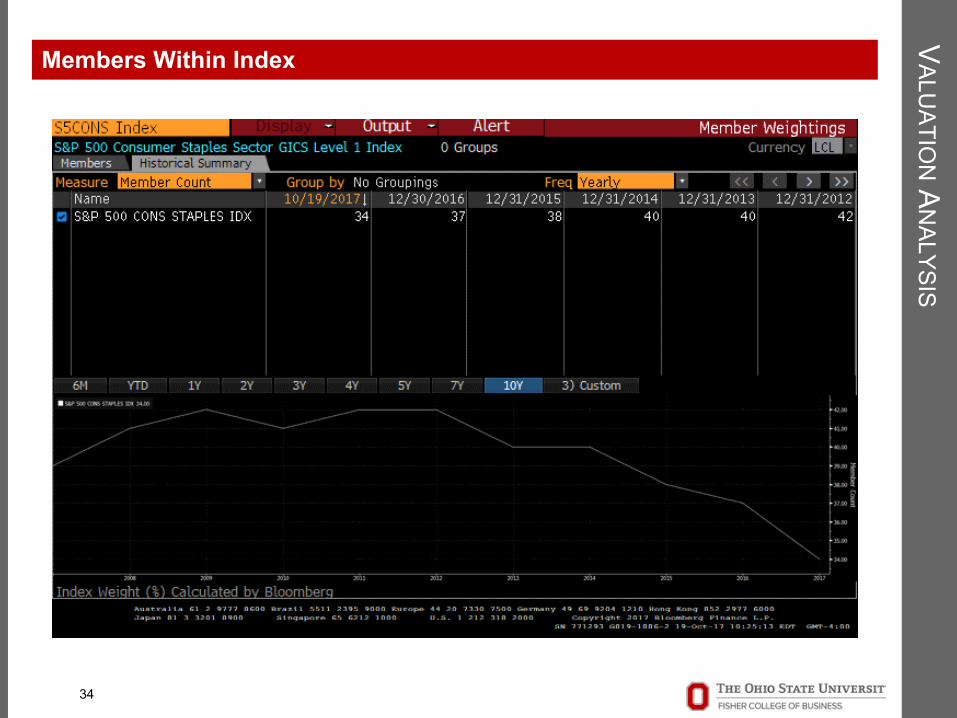
VALU
ATION
AN
ALYSISMembers Within Index
34
VALU
ATION
AN
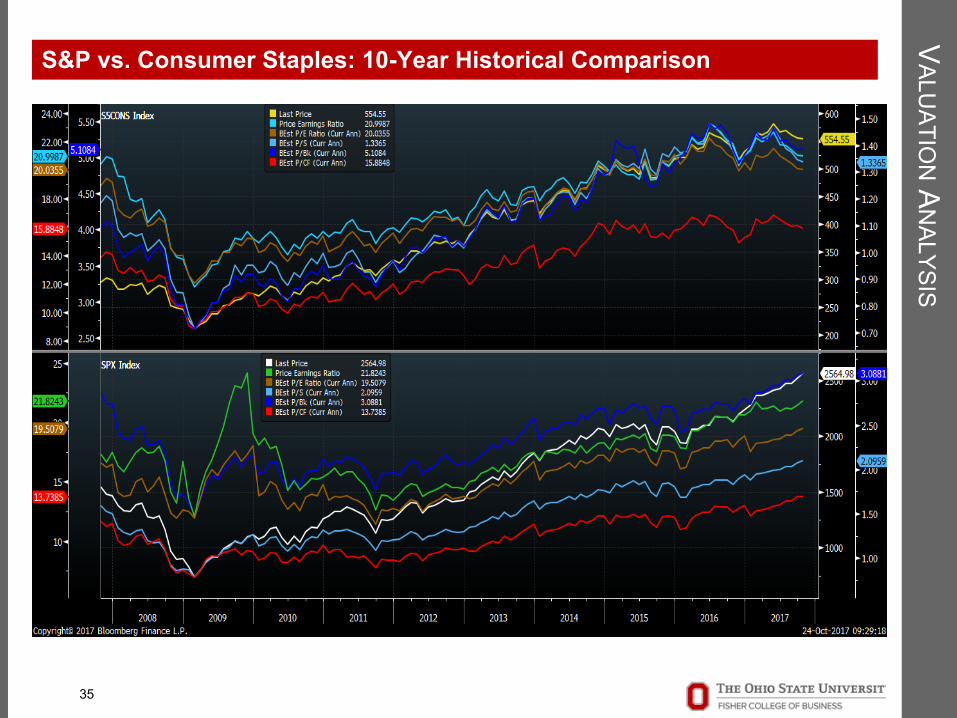
ALYSISS&P vs. Consumer Staples: 10-Year Historical Comparison
35

VALU
ATION
AN
ALYSISVIX Index vs. Consumer Staples & S&P500
36
VALU
ATION
AN
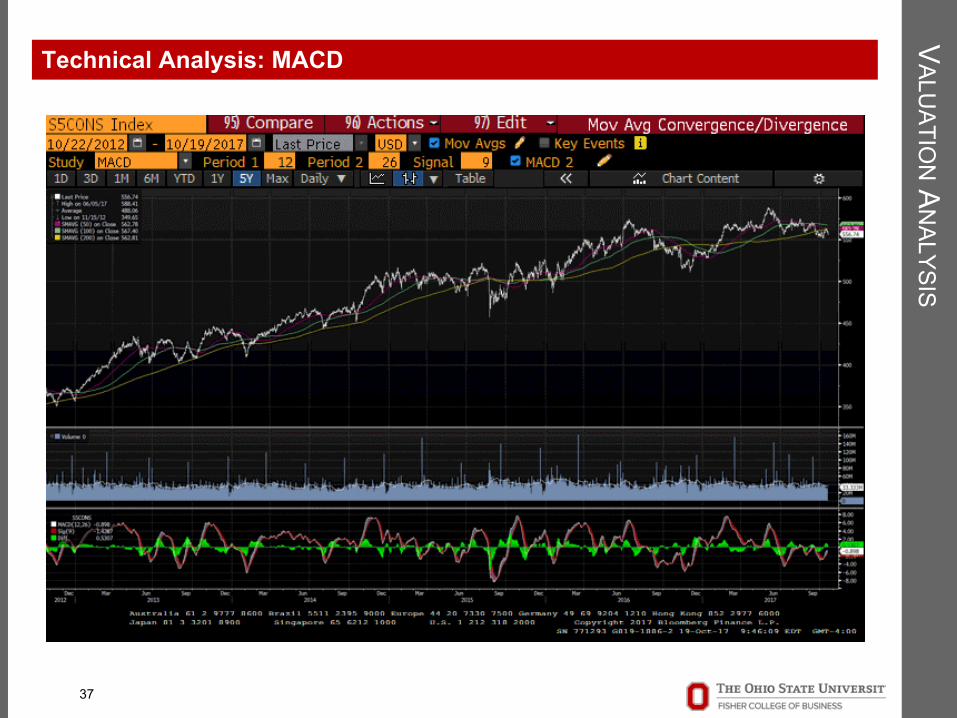
ALYSISTechnical Analysis: MACD
37

VALU
ATION
AN
ALYSISTechnical Analysis: Fibonacci Retracements
38

VI. RECOMMENDATION
39
REC
OM
MEN
DATIO
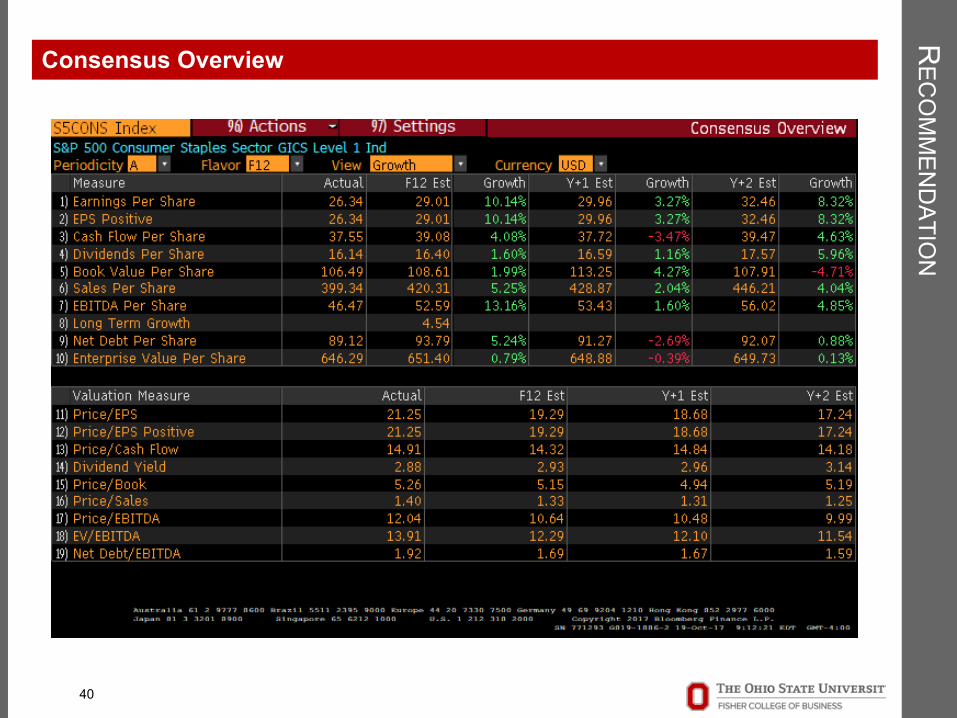
NConsensus Overview
40

Sector:
ConsumerStaples
SubSectors:
FoodProducts
Beverages
Food&StaplesRetailing
HouseholdProducts
PersonalProducts
Tobacco
REC
OM
MEN
DATIO
NOur Recommendation
41
• MajorPositives:• Leavesroomtoinvestinsectors
yieldingpotentialhigherreturns• Potentialpricecorrectionofnon-
cyclicalinvestmentscouldallowthesectortobere-enteredatmorereasonablemultiples
• MajorRisks:• Recessionaryphaseofthebusiness
cyclecouldapproachsoonerthanexpectedandstaplescouldoutperform
• Geopoliticalriskscouldinflatedemandforsaferequityinvestments