consumer perspective on biosimilars - federal … represent the future of the drug industry • 40...
TRANSCRIPT

Title text here
Consumer Perspective on Biosimilars
Leigh Purvis, Senior Strategic Policy Advisor

Overview
AARP 2
• Why does this issue matter to AARP?
• Ongoing concerns
• Outlook for the future

Biologics represent the
future of the drug
industry
• 40 percent of all pharmaceutical industry R&D and products in the pipeline
involve biopharmaceuticals rather than traditional drugs1
• More than 50 percent of the US prescription drug budget is expected to be
biologics by 20182
• It is estimated that 21 biologics with a market value of over $50 billion will lose
patent protection by 2019 in the US alone3
AARP 3

AARP 4
Indications for existing
biologics are expanding
1998 Crohn’s disease – luminal and fistulising
1998 Rheumatoid arthritis signs and symptoms
2000 Rheumatoid arthritis structural damage
2002 Rheumatoid arthritis physical function
2002 Crohn’s disease maintenance (luminal)
2003 Crohn’s disease maintenance (fistulising)
2004
Rheumatoid arthritis signs and symptoms, x-ray
progression, physical function
2004 Ankylosing spondylitis signs and symptoms
2005 Psoriatic arthritis signs and symptoms
2005 Ulcerative colitis
2006 Pediatric Crohn’s disease
2006 Psoriatic arthritis structural damage
2006 Psoriatic arthritis physical function
2006 Chronic severe plaque psoriasis
2006 Ulcerative colitis maintenance
Phase III Pediatric ulcerative colitis
15+ approved indications for Remicade 10+ new indications in development for Avastin

AARP 5
Treatment costs are
extraordinarily high
• On average, biologic drugs are 22 times more expensive than traditional drugs4
• The average annual cost of a branded biologic is estimated to be $34,5505
• Annual costs can range from $25,000 to $200,000 or more6
Older adults are more
likely to use biologics
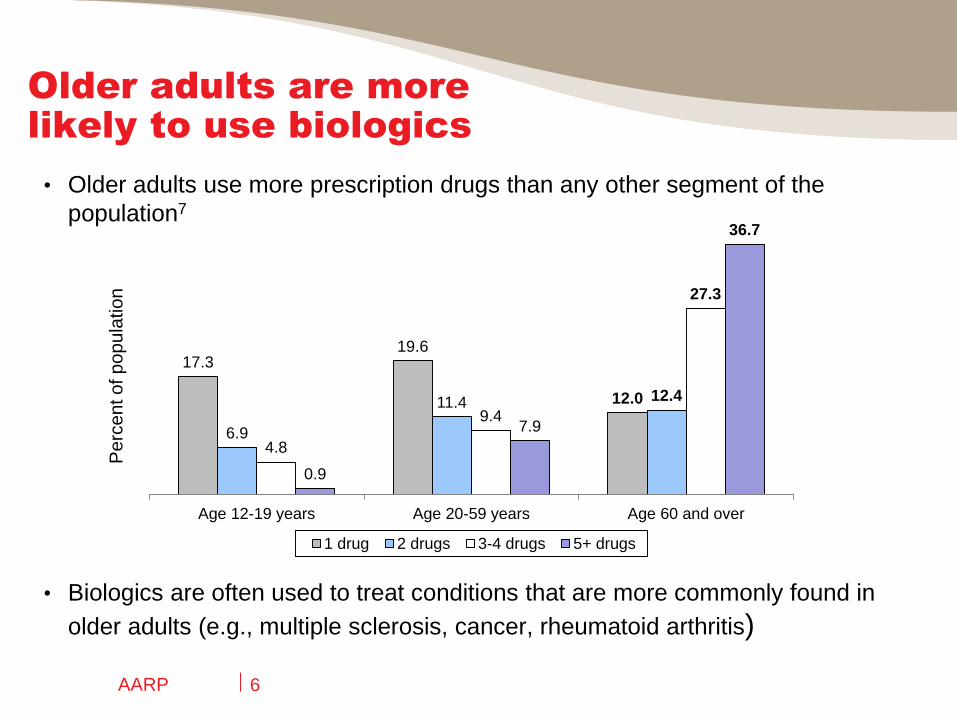
• Older adults use more prescription drugs than any other segment of the
population7
• Biologics are often used to treat conditions that are more commonly found in
older adults (e.g., multiple sclerosis, cancer, rheumatoid arthritis)
AARP 6
17.3 19.6
12.0
6.9
11.4 12.4
4.8
9.4
27.3
0.9
7.9
36.7
Age 12-19 years Age 20-59 years Age 60 and over
1 drug 2 drugs 3-4 drugs 5+ drugs
Pe
rce
nt o
f p
op
ula
tio
n
Medicare beneficiaries
are not healthy or wealthy
• Many beneficiaries live on modest incomes. The median income
among Medicare beneficiaries is roughly $22,5008
• Many beneficiaries have limited financial resources. More than
one in four Medicare beneficiaries have less than $10,000 in savings9
• Many beneficiaries are have multiple chronic conditions. 68
percent of Medicare beneficiaries are being treated for at least two
concurrent chronic illnesses10
AARP 7

AARP 8
Medicare Part B can
lead to high cost-
sharing
• Eight of the ten highest-expenditure Medicare Part B drugs in 2010 were
biologics11
Drug Name Indication Spending
Epogen, Procrit Anemia (ESRD) $2.0B
Rituxan Cancer, rheumatoid arthritis $1.3B
Lucentis Wet AMD $1.2B
Avastin Cancer, wet AMD $1.1B
Remicade Autoimmune disorders $0.9B
Neulasta Infection prevention $0.9B
Aranesp Anemia $0.5B
Epogen/Procrit Anemia (non-ESRD) $0.4B
• Part B beneficiaries are responsible for 20% of their prescription drug costs
o Part B does not cap out-of-pocket spending

AARP 9
Medicare Part D cost-
sharing is growing
• Part D plans are increasingly using coinsurance
• No real incentive for Part D plans to control spending on biologics
• Out-of-pocket spending is limited by catastrophic cap
$310 Deductible
$2,850 in Total Drug Costs
($945 out of pocket)
$6,455 in Total Drug Costs
($4,550 out of pocket)
$3,605 Coverage Gap
(Doughnut Hole)
Enrollee Pays 5%
Plan Pays 15%
Medicare Pays 80%
Enrollee Pays 25%
Plan Pays 75%
Private insurance is
following Part D’s lead
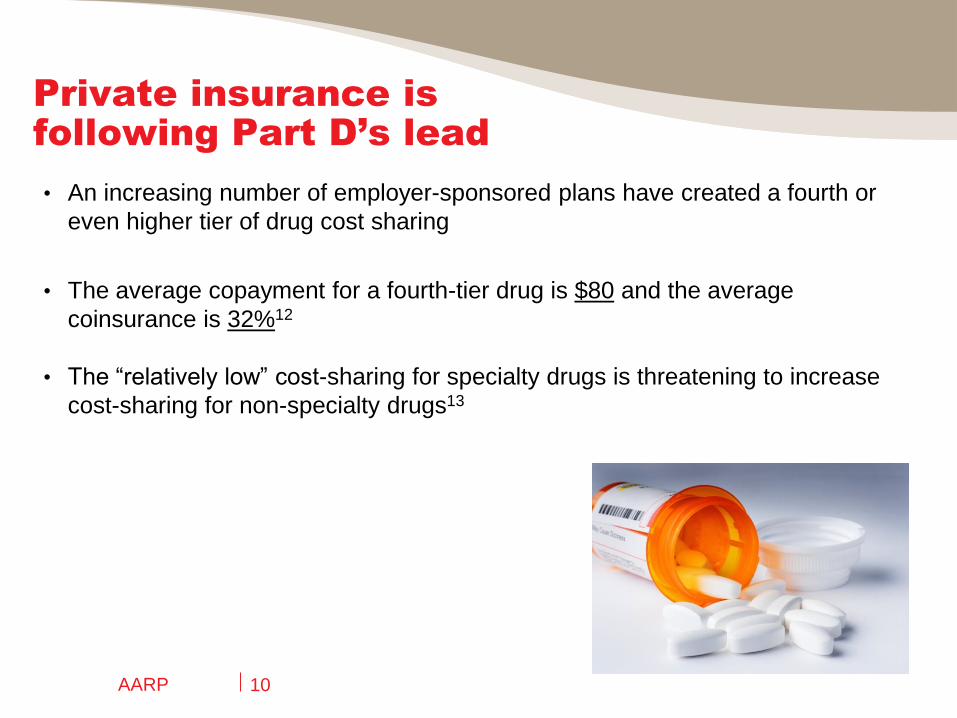
• An increasing number of employer-sponsored plans have created a fourth or
even higher tier of drug cost sharing
• The average copayment for a fourth-tier drug is $80 and the average
coinsurance is 32%12
• The “relatively low” cost-sharing for specialty drugs is threatening to increase
cost-sharing for non-specialty drugs13
AARP 10

Many exchange plans
will have high cost-
sharing
• Enrollees will benefit from new out-of-pocket maximums ($6,350/single,
$12,700/family)
• However, most exchange plans will rely on coinsurance for drugs on
Tier 3 and 4, which could result in extremely high cost-sharing14
AARP 11
Silver Bronze
Average Lowest Highest Average Lowest Highest
Deductible $2,550 $1,500 $5,000 $5,150 $2,000 $6,350
Coinsurance for Tiers 3 & 4 40% 10% 50% 40% 20% 60%

Patient assistance
programs are not a
cure-all
• While helpful, programs can be less than generous
• Patient assistance programs typically do not help insured patients
and have very low income thresholds
o Some also require beneficiaries to spend a certain amount of their
income before they can participate
• Each pharmaceutical company has its own qualifications, forms,
processes for refills, and rules for re-qualifying
o Companies can have a different program for every drug they
manufacture with different eligibility requirements for each drug
AARP 12

Overview
• Why does this issue matter to AARP?
• Ongoing concerns
• Outlook for the future
AARP 13

The debate
continues…
• Exclusivity definition(s)
• Evergreening
• Reverse payments
• State legislation
• Naming
AARP 14
AARP perspective on
state legislation
• Unclear why necessary given that FDA has yet to approve a biosimilar
• If we can trust FDA to approve and regulate biologics, we can trust them
to approve and regulate biosimilars
• Once FDA has approved a biosimilar drug as interchangeable with the
original reference biologic, there is no valid reason for the process for
substituting interchangeable biosimilar products for their reference
biologic counterparts to be different from the process for substituting
traditional generic products for their brand-name counterparts
• If enacted, would reduce substitution and subsequent competition,
increasing health care costs
AARP 15

AARP perspective on
naming
• Different INNs could lead to prescriber and patient confusion and possibly
impact patient safety
o Prescribers would be forced to memorize the names of multiple versions
of drugs with comparable clinical effects
• Would create false impression that biosimilars have a different clinical effect
from the original biologic drug
• Effectively separates biosimilar from existing safety information from the
brand name biologic
• Different INNs would reduce substitution and subsequent competition,
increasing health care costs
AARP 16

Overview
AARP 17
• Why does this issue matter to AARP?
• Ongoing concerns
• Outlook for the future

Many unanswered
questions
• Will the stated purpose of the BPCIA be fulfilled?
• Will the new pathway be used?
• Will adequate competition develop?
o The more roadblocks that are put in place, the less likely it
becomes that companies will be willing or able to pursue
biosimilars
AARP 18

Lots of opportunities
for additional delays
AARP 19
• Innovators could kill old product and launch next generation product (with 12
more years of exclusivity) just as biosimilar competition approaches
• Innovators could constantly tweak the reference product, staying one step
ahead of the biosimilar and precluding substitution indefinitely
• Innovators could compete on price as they already have a full-scale
production line, reducing biosimilars’ cost competitiveness
• Innovators could raise fears of reduced efficacy or increased risk of side
effects
What if the biosimilar
market never develops?
• The costs associated with biologics are not sustainable for
patients or payers
• Many patients will be unable to afford biologics if competition
does not provide some level of price relief
• Medical advances are meaningless if no one can afford to use
them
AARP 20

References
1. R.A. Rader, “FDA Biopharmaceutical Product Approvals and Trends in 2012: Up from 2011, but Innovation and Impact Are Limited,” BioProcess
International 11(3), March 2013.
2. S. Gottlieb and G. Woollett, “Helping Patients Benefit From Biotech Drugs,” Forbes, September 30, 2013.
3. Grant Thornton, Bio-dynamism: Insights into the Biosimilars market: An overall perspective, 2013.
4. A.D. So and S.L. Katz, “Biologics Boondoggle,” New York Times, March 7, 2010.
5. E.A. Blackstone and J.P. Fuhr, Jr., “Innovation and Competition: Will Biosimilars Succeed?” Biotechnology Healthcare, Spring 2012.
6. F. Megerlin, R. Lopert, K. Taymor, and J.-H. Trouvin, “Biosimilars And The European Experience: Implications For The United States,” Health Affairs
32(10): 1803–1810.
7. Q. Gu, C.F. Dillon, and V.L. Burt, “Prescription Drug Use Continues to Increase: U.S. Prescription Drug Data for 2007–2008,” NCHS Data Brief No. 42,
September 2010.
8. Kaiser Family Foundation, “Median Income Among Medicare Beneficiaries, Overall and by Race/Ethnicity, Age, and Gender, 2012,” Kaiser Slides, July
2013.
9. M. Multack and C. Noel-Miller, “Who Relies on Medicare? Profile of the Medicare Population,” AARP Public Policy Institute, June 2012.
10. National Council on Patient Information and Education, Accelerating Progress in Prescription Medicine Adherence: The Adherence Action Agenda,
October 2013.
11. Government Accountability Office, “Medicare: Information on Highest-Expenditure Part B Drugs,” Statement of James Cosgrove, Director, Health
Care, Before the Subcommittee on Health, Committee on Energy and Commerce, House of Representatives, June 28, 2013.
12. Kaiser Family Foundation/Health Research & Educational Trust, 2013 Employer Health Benefits Survey, August 2013.
13. Medco, 2011 Drug Trend Report, 2011.
14. Avalere Health, “Despite Lower Than Expected Premiums, Exchange Consumers Will Face High Cost-Sharing Before the Out-of-Pocket Cap,”
October 1, 2013.
AARP 21

AARP 22
Leigh Purvis
Senior Strategic Policy Advisor
AARP Public Policy Institute
www.aarp.org/ppi
Twitter:@AARPpolicy
www.Facebook.com/AARPpolicy
Blog: www.aarp.org/policyblog