consumer perception of probiotic yogurt: performance of
TRANSCRIPT
Food Research International 54 (2013) 601–610
Contents lists available at ScienceDirect
Food Research International
j ourna l homepage: www.e lsev ie r .com/ locate / foodres
Consumer perception of probiotic yogurt: Performance of check all thatapply (CATA), projective mapping, sorting and intensity scale
A.G. Cruz a,b,⁎, R.S. Cadena a, W.F. Castro c, E.A. Esmerino a, J.B. Rodrigues a, L. Gaze d, J.A.F. Faria a, M.Q. Freitas d,R. Deliza e, H.M.A. Bolini a
a Universidade Estadual de Campinas (UNICAMP), Faculdade de Engenharia de Alimentos (FEA), Cidade Universitária Zeferino Vaz, 13083-862 Campinas, São Paulo, Brazilb Instituto Federal de Educação, Ciência e Tecnologia do Rio de Janeiro (IFRJ), Mestrado Profissional em Ciência e Tecnologia de Alimentos (PGCTA), Rua Senador Furtado, 171, Maracanã,20270-021 Rio de Janeiro, Brazilc Instituto Federal de Educação, Ciência e Tecnologia de São Paulo (IFSP), Avenida C-1, 250, Campus Barretos, 14781502 São Paulo, Brazild Universidade Federal Fluminense (UFF), Faculdade de Medicina Veterinária, Niterói 24230-340, Rio de Janeiro, Brazile Empresa Brasileira de Pesquisa Agropecuária (EMBRAPA), Centro Nacional de Pesquisa de Tecnologia Agroindustrial de Alimentos (CTAA), Av. das Américas, 29.501, Guaratiba,CEP 23020-470 Rio de Janeiro, RJ, Brazil
⁎ Corresponding author at: Universidade Estadual de Cade Engenharia de Alimentos (FEA), Cidade Universitária ZefSão Paulo, Brazil. Tel.: +55 19 35214016.
E-mail address: [email protected] (A.G. Cruz).
0963-9969/$ – see front matter © 2013 Elsevier Ltd. All rihttp://dx.doi.org/10.1016/j.foodres.2013.07.056
a b s t r a c t
a r t i c l e i n f oArticle history:Received 12 November 2012Accepted 26 July 2013
Keywords:Check all that applyProjective mappingSortingIntensity scaleConsumer perceptionProbiotic yogurts
The performance of check-all-that-apply (CATA), projective mapping, sorting and intensity scales was assessedfor determining consumer perception of probiotic yogurts, two prototypes added with glucose oxidase, a poten-tial oxygen scavenger and 04 commercial brands available in the Brazilian market. Each sensory methodologywas tested by administrating the tests to 30 regular consumers of the product. Napping and CATAdid not provideadequate discrimination of the samples while better results were noted for sorting and intensity scales, separat-ing the yogurts containing glucose oxidase from the commercial probiotic yogurt. Sensory methodologies usingconsumer responses present potential options for the characterization of food matrices with multiple sensorysensations, such as probiotic yogurt.
© 2013 Elsevier Ltd. All rights reserved.
1. Introduction
During the development and improvement of food products, compa-nies should strive to understand consumers' wants and needs, as well astheir perception of their food products, in order to assure the products'success (Varela, Ares, Gimenez, & Gambaro, 2010). This means that com-panies should gain a deep understanding of how consumers perceiveproducts, how their needs are shaped and influenced and how theymake product choices based on their needs (Ares, Giménez, Barreiro, &Gámbaro, 2010c).
In traditional sensory studies, consumer tests focus on hedonic mea-sure while the quantitative determination of the product's sensory prop-erties is done by sensory profiling techniques, normally with a trainedgroup of subjects, by quantitative descriptive analysis (QDA), awell established descriptive sensory methodology used on severalfood products, including dairy foods (Allgeyer, Miller, & Lee,2010; Cadena, Cruz, Faria, & Bolini, 2012; Gonzalez, Adhikari, &
mpinas (UNICAMP), Faculdadeerino Vaz, 13083-862 Campinas,
ghts reserved.
Sancho-Madriz, 2011). The high specialization of descriptive panelsallows obtaining very detailed, robust, consistent and reproducible re-sults, stable in time and within a certain sensory space (Moussaoui &Varela, 2010).
However, creating andmaintaining a well-trained, calibrated senso-ry panel can be quite expensive. Small food companies usually cannotafford it, and it could even mean a significant expense for large compa-nies if they have a wide range of products that require various panelsworking in parallel (Valentin, Chollet, Lelievre, & Abdi, 2012). Further-more, the training stage can be relatively long, as it should be detailedand extensive, varying between 10 and 120 h, depending on the rangeand complexity of the sample set (Lawless & Heymann, 2010). Anotherimportant fact is that companies, mainly the small and medium-sizedones, do not have the time, or resources, to maintain a trained panelfor evaluating a specific product. So they need to look for other alterna-tives to obtain information on the sensory characteristics of their foodproduct, even in a general context (Bruzzone, Ares, & Giménez, 2012).In this context, sensory methodologies which use consumer responsescan be a valuable option for obtaining a global perception of the foodproduct, as they consume little time and usually require only one con-sumer test. Then, appropriate statistical data treatment allows thedetermination of important relationships between sensory attributesand samples (Varela & Ares, 2012).
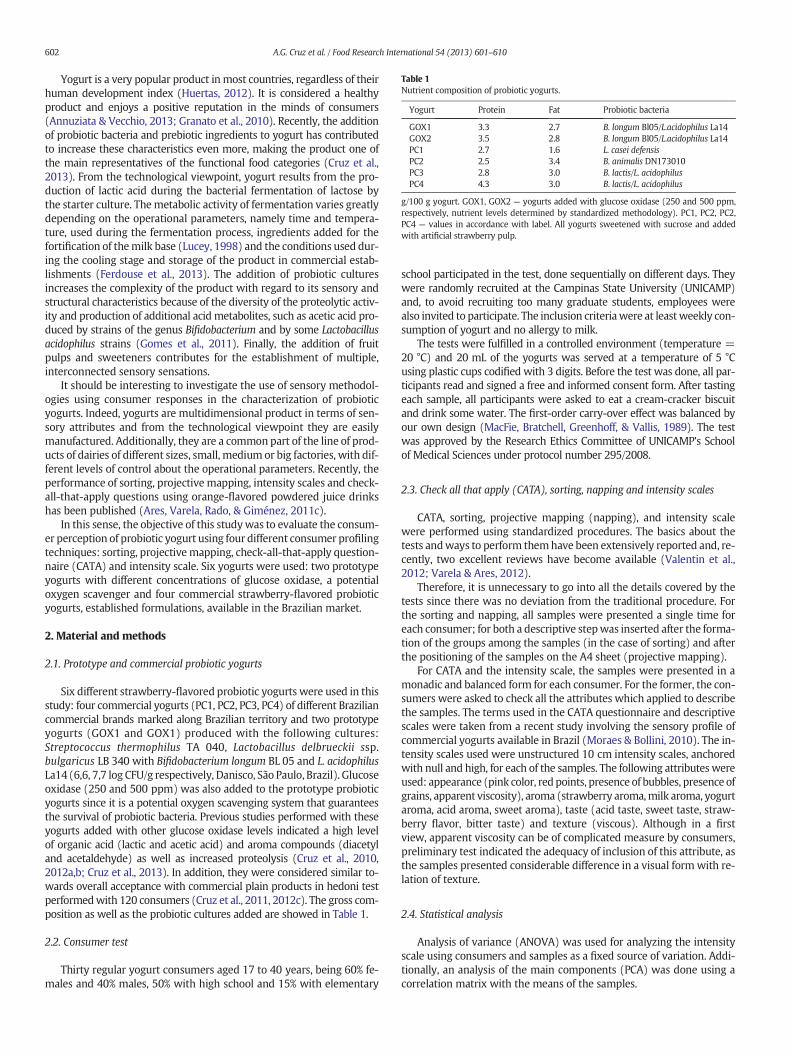
Table 1Nutrient composition of probiotic yogurts.
Yogurt Protein Fat Probiotic bacteria
GOX1 3.3 2.7 B. longum Bl05/L.acidophilus La14GOX2 3.5 2.8 B. longum Bl05/L.acidophilus La14PC1 2.7 1.6 L. casei defensisPC2 2.5 3.4 B. animalis DN173010PC3 2.8 3.0 B. lactis/L. acidophilusPC4 4.3 3.0 B. lactis/L. acidophilus
g/100 g yogurt. GOX1, GOX2 — yogurts added with glucose oxidase (250 and 500 ppm,respectively, nutrient levels determined by standardized methodology). PC1, PC2, PC2,PC4 — values in accordance with label. All yogurts sweetened with sucrose and addedwith artificial strawberry pulp.
602 A.G. Cruz et al. / Food Research International 54 (2013) 601–610
Yogurt is a very popular product inmost countries, regardless of theirhuman development index (Huertas, 2012). It is considered a healthyproduct and enjoys a positive reputation in the minds of consumers(Annuziata & Vecchio, 2013; Granato et al., 2010). Recently, the additionof probiotic bacteria and prebiotic ingredients to yogurt has contributedto increase these characteristics even more, making the product one ofthe main representatives of the functional food categories (Cruz et al.,2013). From the technological viewpoint, yogurt results from the pro-duction of lactic acid during the bacterial fermentation of lactose bythe starter culture. Themetabolic activity of fermentation varies greatlydepending on the operational parameters, namely time and tempera-ture, used during the fermentation process, ingredients added for thefortification of themilk base (Lucey, 1998) and the conditions used dur-ing the cooling stage and storage of the product in commercial estab-lishments (Ferdouse et al., 2013). The addition of probiotic culturesincreases the complexity of the product with regard to its sensory andstructural characteristics because of the diversity of the proteolytic activ-ity and production of additional acid metabolites, such as acetic acid pro-duced by strains of the genus Bifidobacterium and by some Lactobacillusacidophilus strains (Gomes et al., 2011). Finally, the addition of fruitpulps and sweeteners contributes for the establishment of multiple,interconnected sensory sensations.
It should be interesting to investigate the use of sensory methodol-ogies using consumer responses in the characterization of probioticyogurts. Indeed, yogurts are multidimensional product in terms of sen-sory attributes and from the technological viewpoint they are easilymanufactured. Additionally, they are a common part of the line of prod-ucts of dairies of different sizes, small, medium or big factories, with dif-ferent levels of control about the operational parameters. Recently, theperformance of sorting, projective mapping, intensity scales and check-all-that-apply questions using orange-flavored powdered juice drinkshas been published (Ares, Varela, Rado, & Giménez, 2011c).
In this sense, the objective of this studywas to evaluate the consum-er perception of probiotic yogurt using four different consumer profilingtechniques: sorting, projectivemapping, check-all-that-apply question-naire (CATA) and intensity scale. Six yogurts were used: two prototypeyogurts with different concentrations of glucose oxidase, a potentialoxygen scavenger and four commercial strawberry-flavored probioticyogurts, established formulations, available in the Brazilian market.
2. Material and methods
2.1. Prototype and commercial probiotic yogurts
Six different strawberry-flavored probiotic yogurts were used in thisstudy: four commercial yogurts (PC1, PC2, PC3, PC4) of different Braziliancommercial brands marked along Brazilian territory and two prototypeyogurts (GOX1 and GOX1) produced with the following cultures:Streptococcus thermophilus TA 040, Lactobacillus delbrueckii ssp.bulgaricus LB 340 with Bifidobacterium longum BL 05 and L. acidophilusLa14 (6,6, 7,7 log CFU/g respectively, Danisco, São Paulo, Brazil). Glucoseoxidase (250 and 500 ppm) was also added to the prototype probioticyogurts since it is a potential oxygen scavenging system that guaranteesthe survival of probiotic bacteria. Previous studies performed with theseyogurts added with other glucose oxidase levels indicated a high levelof organic acid (lactic and acetic acid) and aroma compounds (diacetyland acetaldehyde) as well as increased proteolysis (Cruz et al., 2010,2012a,b; Cruz et al., 2013). In addition, they were considered similar to-wards overall acceptance with commercial plain products in hedoni testperformedwith 120 consumers (Cruz et al., 2011, 2012c). The gross com-position as well as the probiotic cultures added are showed in Table 1.
2.2. Consumer test
Thirty regular yogurt consumers aged 17 to 40 years, being 60% fe-males and 40% males, 50% with high school and 15% with elementary
school participated in the test, done sequentially on different days. Theywere randomly recruited at the Campinas State University (UNICAMP)and, to avoid recruiting too many graduate students, employees werealso invited to participate. The inclusion criteriawere at leastweekly con-sumption of yogurt and no allergy to milk.
The tests were fulfilled in a controlled environment (temperature =20 °C) and 20 mL of the yogurts was served at a temperature of 5 °Cusing plastic cups codified with 3 digits. Before the test was done, all par-ticipants read and signed a free and informed consent form. After tastingeach sample, all participants were asked to eat a cream-cracker biscuitand drink some water. The first-order carry-over effect was balanced byour own design (MacFie, Bratchell, Greenhoff, & Vallis, 1989). The testwas approved by the Research Ethics Committee of UNICAMP's Schoolof Medical Sciences under protocol number 295/2008.
2.3. Check all that apply (CATA), sorting, napping and intensity scales
CATA, sorting, projective mapping (napping), and intensity scalewere performed using standardized procedures. The basics about thetests andways to perform themhave been extensively reported and, re-cently, two excellent reviews have become available (Valentin et al.,2012; Varela & Ares, 2012).
Therefore, it is unnecessary to go into all the details covered by thetests since there was no deviation from the traditional procedure. Forthe sorting and napping, all samples were presented a single time foreach consumer; for both a descriptive stepwas inserted after the forma-tion of the groups among the samples (in the case of sorting) and afterthe positioning of the samples on the A4 sheet (projective mapping).
For CATA and the intensity scale, the samples were presented in amonadic and balanced form for each consumer. For the former, the con-sumers were asked to check all the attributes which applied to describethe samples. The terms used in the CATA questionnaire and descriptivescales were taken from a recent study involving the sensory profile ofcommercial yogurts available in Brazil (Moraes & Bollini, 2010). The in-tensity scales used were unstructured 10 cm intensity scales, anchoredwith null and high, for each of the samples. The following attributeswereused: appearance (pink color, red points, presence of bubbles, presence ofgrains, apparent viscosity), aroma (strawberry aroma,milk aroma, yogurtaroma, acid aroma, sweet aroma), taste (acid taste, sweet taste, straw-berry flavor, bitter taste) and texture (viscous). Although in a firstview, apparent viscosity can be of complicated measure by consumers,preliminary test indicated the adequacy of inclusion of this attribute, asthe samples presented considerable difference in a visual formwith re-lation of texture.
2.4. Statistical analysis
Analysis of variance (ANOVA) was used for analyzing the intensityscale using consumers and samples as a fixed source of variation. Addi-tionally, an analysis of the main components (PCA) was done using acorrelation matrix with the means of the samples.

603A.G. Cruz et al. / Food Research International 54 (2013) 601–610
Hierarchical cluster analysis (HCA)was also performed to find groupof samples with similar sensory characteristics in each methodology,having as input samples' coordinates in the first and second dimensionof the sensorymaps produced by each technique, considering Euclideandistances (dissimilary) and Warld's techniques (agglomeration method)and automatic truncation (Moussaoui & Varela, 2010).
Multiple factor analysis (MFA)was used for analyzing data obtainedat the sorting, napping and CATA (Ares, Varela, Rado & Gimenez, 2011b,2011c, Moussaoui & Varela, 2010). It involved the establishment of amatrix where the rows were the yogurts (6 lines) and the columnswere the attributes used by the consumers to describe the samples. Aqualitative analysis of the terms used was done previously to avoid su-perposition and similar termswere joined. The analysis consisted of theterms cited by20% of the consumers. Next, the termsused for describingeach sample were counted.
A second MFA was done to obtain a comparison of the methodolo-gies used, assessing the positioning of the products in a single sensorymap. This involved the construction of a 6-row matrix (yogurts) with
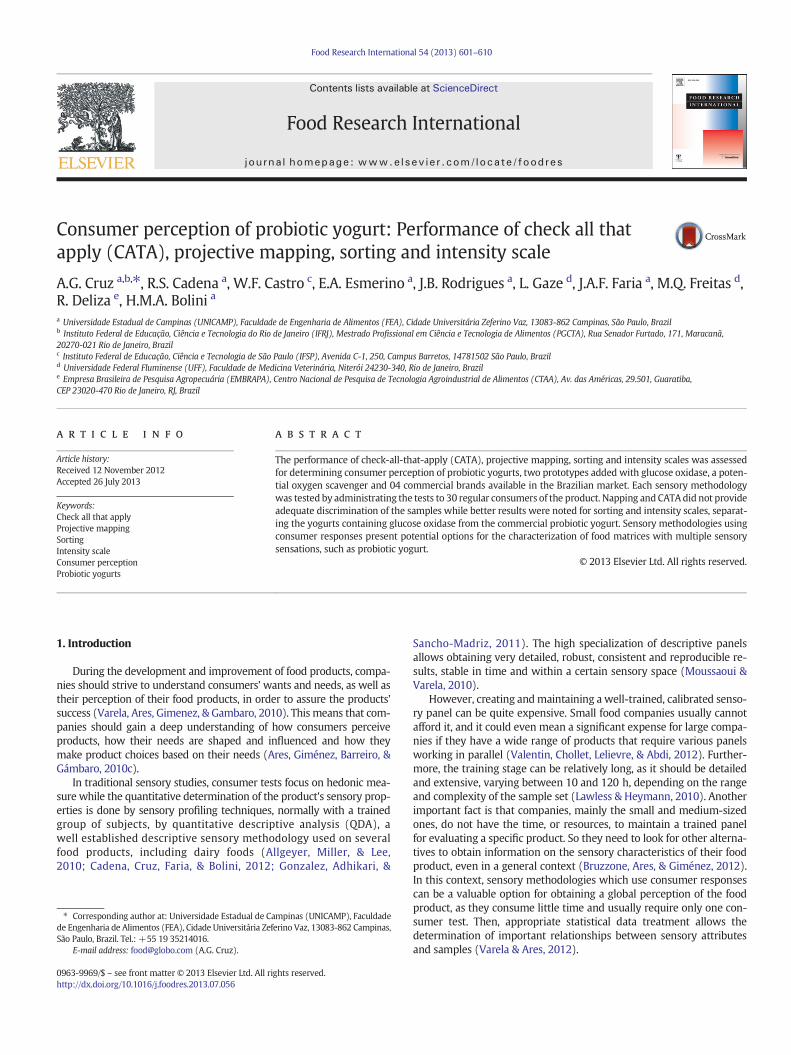
Fig. 1. Representation of the six strawberry probiotic yogurts (b) and the terms used to d
four groups of columns which corresponded to the data used by theconsumers for describing the samples in each methodology. Thesimilarity/correlation coefficient Rv was used as a quantitative measureof this correspondence (Ares, Varela, Rado, & Gimenez, 2011b;Moussaoui & Varela, 2010). All statistical analyses were done bythe software XLSTAT for Windows version 2012.5 (Adinsoft, Paris,France).
3. Results and discussion
3.1. Sensory maps
Figs. 1–4(a,b) show the sensory maps obtained with the sensorytechniques, namely sorting, napping, CATA and intensity scales. CATAand napping did not proportionate a good discrimination of the sam-ples, that is, discriminate the prototype yogurts (GOX1 and GOX2)from the commercial probiotic yogurts (PC1,PC2,PC3 and PC4), as itcould be noted in a visual way in the sensory map of the samples by
escribe the samples (a), in the first two dimensions of the MFA of data from sorting.
604 A.G. Cruz et al. / Food Research International 54 (2013) 601–610
the similar positions occupied. For CATA, Yogurt PC4 and PC3 cameclosest to the prototype yogurts GOX1 and GOX2. Projective mappingresulted in a more different configuration, placing yogurt GOX2 closeto the commercial yogurts PC1, PC2 and PC3 and yogurt GOX1 close tothe yogurt PC4. The use of multiple factor analysis for napping, sortingand CATA explained in two dimension values between 70% and 80%, re-gardless of the methodology used.
According to sorting the samples PC1, PC2 and PC3 were character-ized by an acid taste, strawberry aroma, fluid and heterogeneous appear-ance; yogurts GOX1 and GOX2 were characterized by an acid aroma,strawberry taste, pink color, yogurt taste and viscous; and yogurt PC4was characterized by a sweet taste. Curiously, strawberry aroma andstrawberry taste were placed at the opposite sides of the sorting map,that can be related to the nutrient composition of the yogurts; GOX1and GOX2 present increased protein level compared with yogurts PC1,PC2 and PC3 which is responsible for less intense flavor intensity, in par-ticular fruity notes (Saint-Eve, Lévy, Martin, & Souchon, 2006).
Fig. 2. Representation of the six strawberry probiotic yogurts (b) and the terms used to describ
For projective mapping (Fig. 2,a,b), strawberry aroma and taste,sweet taste and presence of grains were attribute characteristics of thesamples PC1, PC2, PC3 and GOX2; yogurt taste and acid taste were char-acteristic of the sample GOX1; and viscosity, bitter taste and yogurtaroma were characteristic of the sample PC4. HCA confirmed the ob-served groups for each sensory methodology (Fig. 5a–d) showing that,only sorting and intensity scales were able to separate totally GOX1and GOX2 from the commercial probiotic yogurts (PC1, PC2, PC3, PC4).
Indeed, the addition of probiotic bacteria in yogurt can introduce dif-ferent sensory sensations – sometimes called probiotic flavor – whichcan be a result in decreased sensory acceptance of the product; in addi-tion it is important to know the similarities and differences among pro-totype as commercial products as probiotic yogurts added with glucoseoxidase towards the established formulations of the commercial probi-otic yogurts used in this study, which present excellent appreciation bythe consumers. It is also relevant to emphasize that all the commercialbrands are well known for Brazilian consumers, being commercialized
e the samples (a), in the first two dimensions of the MFA of data from projective mapping.
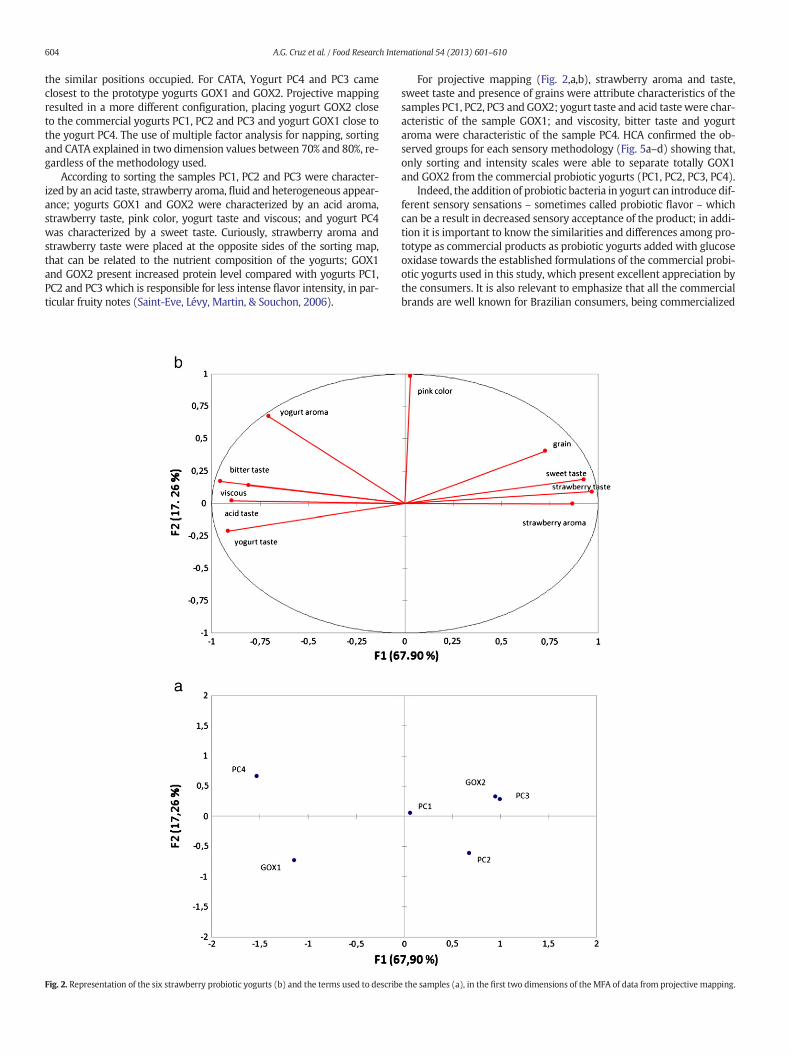
Fig. 3. Representation of the six strawberry probiotic yogurts (b) and the terms used to describe the samples (a), in the first two dimensions of the MFA of data from CATA.
605A.G. Cruz et al. / Food Research International 54 (2013) 601–610
along the Brazilian territory. Therefore, this can guarantee a higherprobability of success for yogurts with probiotic glucose oxidase at theconsumer market, as gives the opportunity for the producers to modifythe formulation, choosing probiotic and lactic culture with adequatemetabolic activity, adequate sugar level and other topics.
Consumers used on average three to four terms to describe the yo-gurts in both methodologies. Viscosity and acid taste were the termsmost commonly cited with 92 and 94 and 65–63 citations, respectively,for sorting and napping. In the case of sorting, there was on average 1–3groups with approximately 80% of the consumers formed in one groupcontaining only the prototypes GOX1 and GOX2. The ability to discrim-inate while using sorting and napping has been observed in other foodmatrices like apples and cheese (Nestrud & Lawless, 2010), milk choco-lates (Kennedy & Heymann, 2009), perfumes (Veramendi, Herencia, &
Ares, 2013), high alcohol products (Louw et al., 2013), granola bars(Kennedy, 2010) and beers (Lelièvre, Sylvie Chollet, Abdi, & Valentin,2008) and even reduced-calorie biscuit packaging (Carrillo, Varela, &Fiszman, 2012a, 2012b). Recently napping was used at a cross culturalstudy covering green tea products with Korean and French consumers(Kim, Jombart, Valentin, & Kin, 2013).
For CATA (Fig. 3,a,b), five to six terms – of a total of fifteen termspresented to consumers – were used for describing the yogurts: pinkcolor and presence of bubbles, with 45 and 46 citations, respectively.The yogurt PC1 was characterized by the attributes pink color, red point,sweet aroma and sweet taste while PC2 was characterized by the pres-ence of bubbles and strawberry aroma, respectively. The yogurts GOX1,GOX2, PC3 and PC4 were characterized by acid taste, milk aroma, bittertaste, presence of grains and viscosity. A significant difference existed
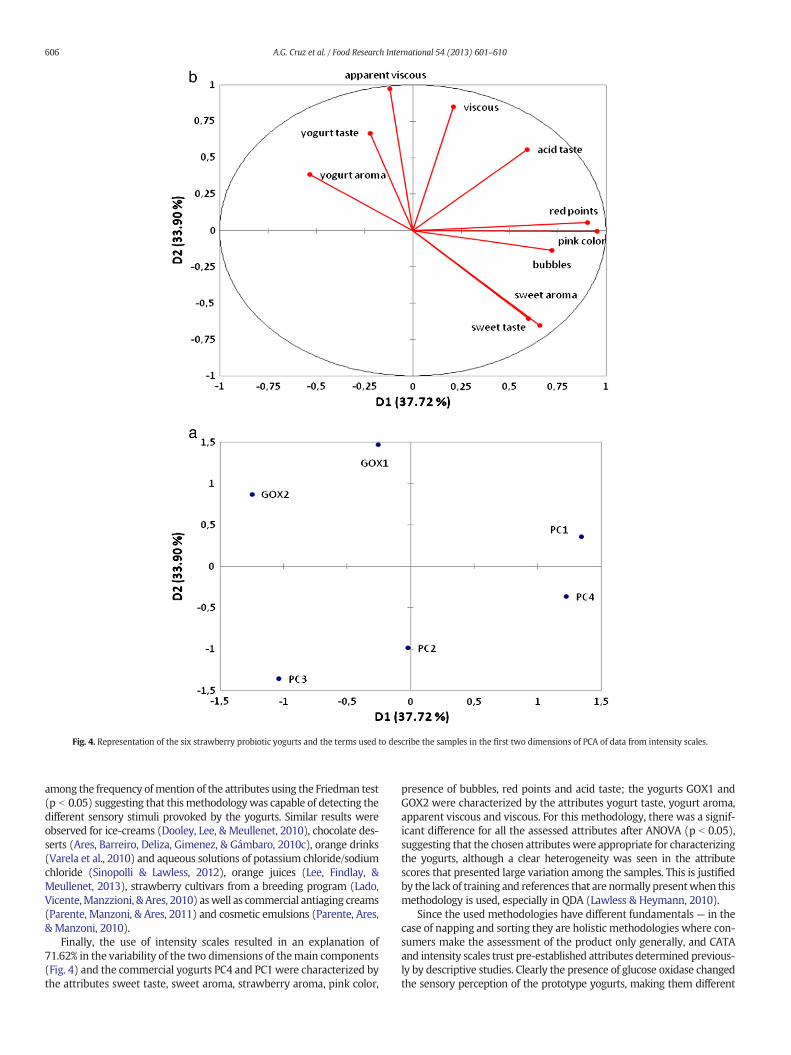
Fig. 4. Representation of the six strawberry probiotic yogurts and the terms used to describe the samples in the first two dimensions of PCA of data from intensity scales.
606 A.G. Cruz et al. / Food Research International 54 (2013) 601–610
among the frequency ofmention of the attributes using the Friedman test(p b 0.05) suggesting that thismethodologywas capable of detecting thedifferent sensory stimuli provoked by the yogurts. Similar results wereobserved for ice-creams (Dooley, Lee, & Meullenet, 2010), chocolate des-serts (Ares, Barreiro, Deliza, Gimenez, & Gámbaro, 2010c), orange drinks(Varela et al., 2010) and aqueous solutions of potassium chloride/sodiumchloride (Sinopolli & Lawless, 2012), orange juices (Lee, Findlay, &Meullenet, 2013), strawberry cultivars from a breeding program (Lado,Vicente,Manzzioni, & Ares, 2010) aswell as commercial antiaging creams(Parente, Manzoni, & Ares, 2011) and cosmetic emulsions (Parente, Ares,& Manzoni, 2010).
Finally, the use of intensity scales resulted in an explanation of71.62% in the variability of the two dimensions of themain components(Fig. 4) and the commercial yogurts PC4 and PC1 were characterized bythe attributes sweet taste, sweet aroma, strawberry aroma, pink color,
presence of bubbles, red points and acid taste; the yogurts GOX1 andGOX2 were characterized by the attributes yogurt taste, yogurt aroma,apparent viscous and viscous. For this methodology, there was a signif-icant difference for all the assessed attributes after ANOVA (p b 0.05),suggesting that the chosen attributeswere appropriate for characterizingthe yogurts, although a clear heterogeneity was seen in the attributescores that presented large variation among the samples. This is justifiedby the lack of training and references that are normally presentwhen thismethodology is used, especially in QDA (Lawless & Heymann, 2010).
Since the used methodologies have different fundamentals — in thecase of napping and sorting they are holistic methodologies where con-sumers make the assessment of the product only generally, and CATAand intensity scales trust pre-established attributes determined previous-ly by descriptive studies. Clearly the presence of glucose oxidase changedthe sensory perception of the prototype yogurts, making them different
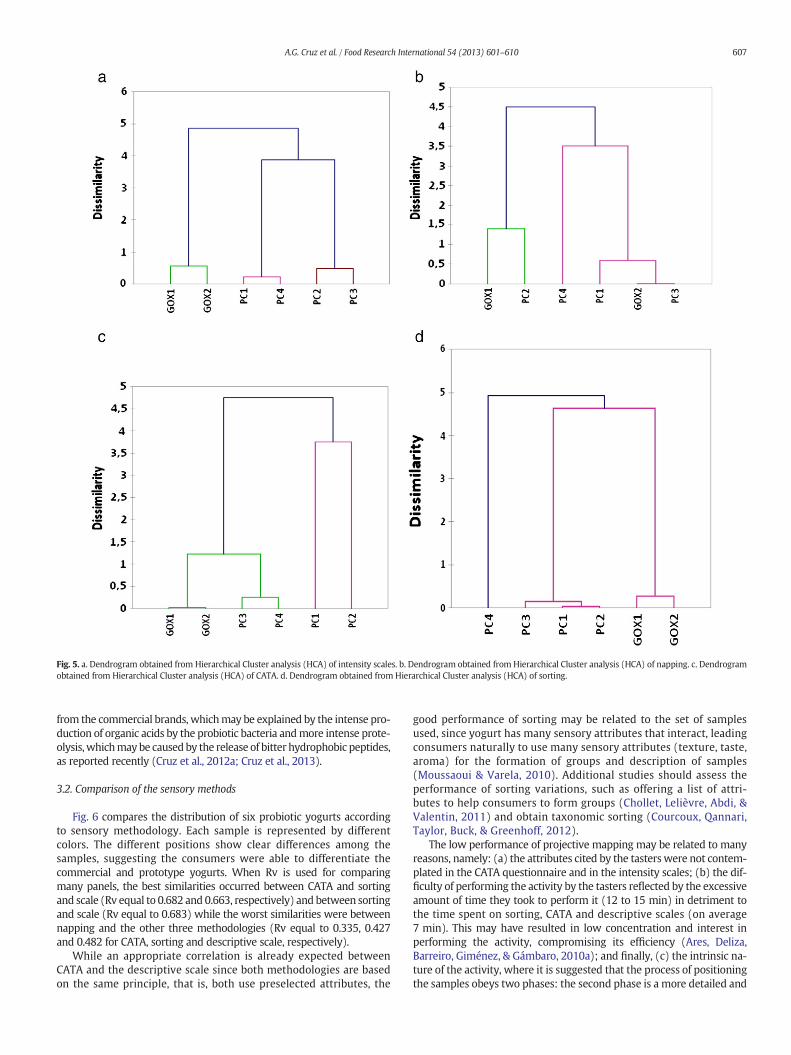
Fig. 5. a. Dendrogram obtained from Hierarchical Cluster analysis (HCA) of intensity scales. b. Dendrogram obtained from Hierarchical Cluster analysis (HCA) of napping. c. Dendrogramobtained from Hierarchical Cluster analysis (HCA) of CATA. d. Dendrogram obtained from Hierarchical Cluster analysis (HCA) of sorting.
607A.G. Cruz et al. / Food Research International 54 (2013) 601–610
from the commercial brands, whichmay be explained by the intense pro-duction of organic acids by the probiotic bacteria andmore intense prote-olysis,whichmaybe causedby the release of bitter hydrophobic peptides,as reported recently (Cruz et al., 2012a; Cruz et al., 2013).
3.2. Comparison of the sensory methods
Fig. 6 compares the distribution of six probiotic yogurts accordingto sensory methodology. Each sample is represented by differentcolors. The different positions show clear differences among thesamples, suggesting the consumers were able to differentiate thecommercial and prototype yogurts. When Rv is used for comparingmany panels, the best similarities occurred between CATA and sortingand scale (Rv equal to 0.682 and 0.663, respectively) and between sortingand scale (Rv equal to 0.683) while the worst similarities were betweennapping and the other three methodologies (Rv equal to 0.335, 0.427and 0.482 for CATA, sorting and descriptive scale, respectively).
While an appropriate correlation is already expected betweenCATA and the descriptive scale since both methodologies are basedon the same principle, that is, both use preselected attributes, the
good performance of sorting may be related to the set of samplesused, since yogurt has many sensory attributes that interact, leadingconsumers naturally to use many sensory attributes (texture, taste,aroma) for the formation of groups and description of samples(Moussaoui & Varela, 2010). Additional studies should assess theperformance of sorting variations, such as offering a list of attri-butes to help consumers to form groups (Chollet, Lelièvre, Abdi, &Valentin, 2011) and obtain taxonomic sorting (Courcoux, Qannari,Taylor, Buck, & Greenhoff, 2012).
The low performance of projective mapping may be related to manyreasons, namely: (a) the attributes cited by the tasters were not contem-plated in the CATA questionnaire and in the intensity scales; (b) the dif-ficulty of performing the activity by the tasters reflected by the excessiveamount of time they took to perform it (12 to 15 min) in detriment tothe time spent on sorting, CATA and descriptive scales (on average7 min). This may have resulted in low concentration and interest inperforming the activity, compromising its efficiency (Ares, Deliza,Barreiro, Giménez, & Gámbaro, 2010a); and finally, (c) the intrinsic na-ture of the activity, where it is suggested that the process of positioningthe samples obeys two phases: the second phase is a more detailed and

Fig. 6. Comparative MFA on individual configurations of sorting, napping, CATA count and intensity scales of the probiotic yogurts.
608 A.G. Cruz et al. / Food Research International 54 (2013) 601–610
refined analysis of the positioning of the samples, so possible changes intheir positions occur, which would directly influence the final configu-ration (Veinand, Godefroy, Adam, & Delarue, 2011).
Table 2 shows the vocabulary obtained by the sorting and nappingtask. Overall, sorting seems to have a better description about the attri-butes related to the yogurts, being observed a total of ten attributes inopposition to just eight attributes obtained in sorting. As example, theattribute appearancewas described in sorting by three sensory descrip-tors, heterogeneous, liquid and pink color while in napping only thesensory descriptor grain was generated.
The results suggest that descriptive sensory methodologies usingconsumer perceptions, especially sorting and intensity scale can be usedfor the development of food matrices with multivariate profiles fromthe sensory point of view, such as probiotic yogurts, and for obtaining ageneralized sensory profiling of the product as these methodologies pro-portionated a total separation of probiotic from commercial yogurts. Thiscan be very interesting for small and medium-sized dairies which oftenhave yogurt as theirmain product and do not have thefinancial resourcesfor recruiting and training a sensory panel for the development of a sen-sory profile via QDA (Bruzzone, Ares, & Giménez, 2013). They may getvaluable information through the use of these methodologies.
However, other sensory techniques such comment analysis(Galmarini, Symoneaux, Chollet, & Zamora, 2013; Lawrence et al.,2013; Symoneaux, Galmarini, & Mehinagic, 2012) and free listing(Hough & Ferraris, 2010; Libertino, Ferraris, Orsonio, & Hough, 2012)should also be when a more complete assessment is desired as well as
Table 2Vocabulary of sorting and napping.
Attributes Sorting Napping
Appearance Heterogeneous GrainLiquidPink color
Aroma Strawberry YogurtAcid Strawberry
Taste Sweet BitterStrawberry AcidResidual YogurtYogurt Strawberry
Texture Viscous Viscous
the partial napping and partial sorting (Dehlholm, Brockhoff, Meinert,Aaslyng, & Bredie, 2012) and the effect of the information allied tothese methodologies (Vidal, Barreiro, Gómez, Ares, & Gimenez, 2013).
In the specific case, probiotic yogurts with added glucose oxidase,characterized by the sensory descriptors pink color, strawberry taste,acid aroma, yogurt aroma and yogurt taste, and apparent viscous an im-proved similaritywith commercial probiotic yogurts necessarily requirethe use of lactic and probiotic cultures with moderate metabolic capac-ity for reducing the acidity and achieving greater control of proteol-ysis in the final product, keeping the gel more consistent. Appropriatethickeners/stabilizers for optimizing the viscosity of the product mayalso be used. They have direct influence on texture, which is a relevantparameter for yogurts and has been object of investigation in recentstudies (Antmann et al., 2011; Ares, Budelli, Bruzzone, Gímenez, &Lema, 2011a).
3.3. Limitations of this study
In thismoment, is a prudent comment about the limitation of this re-search. Firstly, we used a small consumer panel — just thirteen peoplewhile some researches use fifteen consumers at least. Other importanttopic is the use of the same consumer panel to perform the differentmethodologies; perhaps they get used with the samples along the ex-periment and memorized the products, which influenced the low Rvsobserved in the experiment. However, it is important to relate that dif-ferent 3 digit number codes were used in each cup for each methodolo-gy. Other important topic is the absence of the results obtained in thisstudy with a sensory profiling obtained by a trained panel using QDA,which would give better consistency for the results obtained. Futurestudies are needed to confirm this information.
4. Conclusion
Sensory methodologies based at the consumer perception may beused in the initial stage of development of food matrices with multiplesensory characteristics, such as probiotic yogurts, especially sorting andintensity scales because of their ease of use, simplicity and ease of under-standing by the consumer. In particular, improvement of prototype yo-gurt added of glucose oxidase in a sensory point of view necessarily
609A.G. Cruz et al. / Food Research International 54 (2013) 601–610
requires the decrease of the acid and bitter tastes, presence of grains andviscosity of the product.
Our results are interesting especially for small and medium-sizedmanufacturers that do not have the administrative and financial infra-structure to hire a trained panel for each one of their products. Futurestudies should include a comparison of the results obtained from atrained panel using descriptive quantitative analysis. They should alsoinclude assessment of other sensory methodologies that investigateconsumer perception, such as comment analysis and free listing. Addi-tionally, a hedonic test covering a large consumer panel – at least 120consumers – should also be done with the typical consumers of theproduct.
References
Allgeyer, L. C., Miller, M. J., & Lee, S. -Y. (2010). Sensory and microbiological quality of yo-gurt drinks with prebiotics and probiotics. Journal of Dairy Science, 93, 4471–4479.
Annuziata, A., & Vecchio, R. (2013). Consumer perception of functional foods: A conjointanalysis with probiotic. Food Quality and Preference, 28, 348–355.
Antmann, G., Ares, G., Varela, P., Salvador, A., Coste, B., & Fiszman, S. M. (2011). Consumer'screaminess concept perception: A cross cultural study in three Spanish-speaking coun-tries. Journal of Texture Studies, 42, 50–60.
Ares, G., Barreiro, C., Deliza, R., Gimenez, A., & Gámbaro (2010a). Application of check allthat apply question to the development of chocolate milk desserts. Journal of SensoryStudies, 25, 67–86.
Ares, G., Budelli, E., Bruzzone, F., Gímenez, A., & Lema, P. (2011a). Consumers' texture per-ception of milk desserts: Relation with rheological measurements. Journal of TextureStudies, 43, 203–213.
Ares, G., Deliza, R., Barreiro, C., Giménez, A., & Gámbaro, A. (2010b). Comparison of twosensory profiling techniques based on consumer perception. Food Quality and Prefer-ence, 21, 417–426.
Ares, G., Giménez, A., Barreiro, C., & Gámbaro, A. (2010c). Use of an open-ended questionto identify drivers of liking of milk desserts. Comparison with preference mappingtechniques. Food Quality and Preference, 21, 286–294.
Ares, G., Varela, P., Rado, G., & Gimenez, A. (2011b). Are consumer profiling techniquesequivalent for some product categories? The case of orange-flavoured powdereddrinks. International Journal of Food Science and Technology, 46, 1600–1608.
Ares, G., Varela, P., Rado, G., & Giménez, A. (2011c). Identifying ideal products using threedifferent consumer profiling methodologies. Comparison with external preferencemapping. Food Quality and Preference, 22, 581–591.
Bruzzone, F., Ares, G., & Giménez, A. (2012). Consumers' texture perception of milk dessertsII — Comparison with trained assessors' data. Journal of Texture Studies, 43, 214–226.
Bruzzone, F., Ares, G., & Giménez, A. (2013). Temporal aspects of yoghurt texture percep-tion. International Dairy Journal, 29, 124–134.
Cadena, R. S., Cruz, A. G., Faria, J. A. F., & Bolini, H. M.A. (2012). Reduced fat and sugar va-nilla ice creams: Sensory profiling and external preference mapping. Journal of DairyScience, 95, 4842–4850.
Carrillo, E., Varela, P., & Fiszman, S. (2012a). Packaging information as a modulator of con-sumers' perception of enriched and reduced-calorie biscuits in tasting andnon-tasting tests. Food Quality and Preference, 25, 105–115.
Carrillo, E., Varela, P., & Fiszman, S. (2012b). Effects of food package information and sen-sory characteristics on the perception of healthiness and the acceptability of enrichedbiscuits. Food Research International, 48, 209–216.
Chollet, S., Lelièvre, Abdi, H., & Valentin, D. (2011). Sort and beer: Everything you wantedto know about the sorting task but did not dare to ask. Food Quality and Preference, 22,507–520.
Courcoux, P., Qannari, E. M., Taylor, Y., Buck, D., & Greenhoff, K. (2012). Taxonomic freesorting. Food Quality and Preference, 23, 30–35.
Cruz, A. G., Cadena, R. S., Faria, J. A. F., Bolini, H. M.A., Dantas, C., Ferreira, M. M. C., et al.(2012a). PARAFAC: Adjustment for modeling consumer study covering probioticand conventional yogurt. Food Research International, 41, 211–215.
Cruz, A. G., Cadena, R. S., Faria, J. A. F., Oliveira, C. A. F., Cavalcanti, R. N., Bolini, M. H. A.,et al. (2011). Consumer acceptability and purchase intent of probiotic yoghurt withadded glucose oxidase using sensometrics, artificial neural networks and logistic re-gression. International Journal of Dairy Technology, 64, 549–556.
Cruz, A. G., Castro, W. F., Faria, J. A. F., Bogusz, S., Jr., Granato, D., Celeguini, R. M. S., et al.(2012b). Glucose oxidase: A potential option to decrease the oxidative stress instirred probiotic yogurt. LWT — Food Science and Technology, 47, 512–515.
Cruz, A. G., Castro, W. F., Faria, J. A. F., Bolini, H. M.A., Celeguini, R. M. S., Raices, R. S. L., et al.(2013a). Stability of probiotic stirred yogurt added with glucose oxidase in differentpackaging materials along the refrigerated storage. Food Research International, 51,723–728.
Cruz, A. G., Castro, W. F., Faria, J. A. F., Lollo, P. C. B., Amaya-Farfan, J., Freitas, M. Q., et al.(2012c). Probiotic yogurts manufactured with increased glucose oxidase levels:Postacidification, proteolytic patterns, survival of probiotic microorganisms, produc-tion of organic acid and aroma compounds. Journal of Dairy Science, 95, 2261–2269.
Cruz, A. G., Cavalcanti, R. N., Guerreiro, L. M. R., Sant'Ana, A. S., Nogueira, L. C., Oliveira, C. A.F., et al. (2013b). Developing a prebiotic yogurt: Rheological, physico-chemical andmicrobiological aspects and adequacy of survival analysis methodology. Journal ofFood Engineering, 114, 323–330.
Cruz, A. G., Faria, J. A. F., Walter, E. H. M., Andrade, R. R., Walter, E. H. M., Cavalcante,R. N., et al. (2010). Processing optimization of probiotic yogurt containing glu-cose oxidase using response surface methodology. Journal of Dairy Science, 93,5059–5068.
Dehlholm, C., Brockhoff, P. B., Meinert, L., Aaslyng, M.D., & Bredie, W. L. P. (2012). Rapiddescriptive sensory methods — Comparison of free multiple sorting, partial napping,napping, flash profiling and conventional profiling. Food Quality and Preference, 26,267–277.
Dooley, L., Lee, Y. -S., & Meullenet, J. -F. (2010). The application of check-all-that-apply(CATA) consumer profiling to preference mapping of vanilla ice cream and its com-parison to classical external preference mapping. Food Quality and Preference, 21,394–401.
Ferdouse, R., Rouhi, M., Mohammadi, Mohamad, Mortazavian, A.M., Khosravi-Darani, K., &Rad, A. H. (2013). Evaluation of probiotic survivability in yogurt exposed to cold chaininterruption. Iranian Journal of Pharmaceutical Research, 12, 139–144.
Galmarini, M. V., Symoneaux, R., Chollet, S., & Zamora, M. C. (2013). Understanding appleconsumers' expectations in terms of likes and dislikes. Use of comment analysis in across-cultural study. Appetite, 62, 27–33.
Gomes, A. A., Cruz, A. G., Cadena, R. S., Faria, J. A. F., Carvalho, C. C., Lollo, P. C., et al. (2011).Effect of the inoculation level of L. acidophilus in probiotic cheese on the physico-chemical features and sensory performance towards commercial cheeses. Journal ofDairy Science, 94, 4777–7786.
Gonzalez, N. J., Adhikari, K., & Sancho-Madriz, M. F. (2011). Sensory characteristics ofpeach-flavored yogurt drinks containing prebiotics and synbiotics. LWT — Food Sci-ence and Technology, 44, 158–163.
Granato, D., Branco, G. F., Cruz, A. G., Faria, J. A. F., Faria, J. A. F., & Shah, N.P. (2010). Pro-biotic dairy products as functional foods. Comprehensive Reviews in Food Science andFood Safety, 9, 455–470.
Hough, G., & Ferraris, D. (2010). Free listing: A method to gain initial insight of a food cat-egory. Food Quality and Preference, 21, 295–301.
Huertas, R. A. P. (2012). Yogurt en la salud humana. Revista Lasallista de Investigacion, 9,162–177.
Kennedy, J. (2010). Evaluation of replicated projective mapping of granola bars. Journal ofSensory Studies, 25, 672–684.
Kennedy, J., & Heymann, H. (2009). Projective mapping and descriptive analysis of milkand dark chocolate. Journal of Sensory Studies, 24, 220–233.
Kim, Y. -K., Jombart, L., Valentin, D., & Kin, K. -O. (2013). A cross cultural study using napping:Do Korean and French consumers perceive various green tea products differently. FoodResearch International, 53, 534–542.
Lado, J., Vicente, E., Manzzioni, A., & Ares, G. (2010). Application of a check-all-that-applyquestion for the evaluation of strawberry cultivars from a breeding program. Journalof the Science of Food and Agriculture, 90, 2268–2275.
Lawless, H. T., & Heymann, H. (2010). Sensory evaluation of food. Principles and practices(2nd ed.)New York: Springer.
Lawrence, G., Symoneaux, R., Maitre, I., Brossaud, F., Maestrojuan, M., & Mehinagic, E.(2013). Using the free comments method for sensory characterisation of CabernetFranc wines: Comparison with classical profiling in a professional context. Food Qualityand Preference, 30, 145–155.
Lee, Y., Findlay, C., & Meullenet, J. -F. (2013). Experimental consideration for the use ofcheck-all-that-apply questions to describe the sensory properties of orange juices. In-ternational Journal of Food Science and Technology, 48, 215–219.
Lelièvre, M., Sylvie Chollet, S., Abdi, H., & Valentin, D. (2008). What is the validity of thesorting task for describing beers? A study using trained and untrained assessors.Food Quality and Preference, 19, 697–703.
Libertino, L., Ferraris, D., Orsonio, M. M. L., & Hough, G. (2012). Analysis of data from afree-listing study of menus by different income-level populations. Food Quality andPreference, 24, 269–275.
Louw, L., Malherbe, S., Naes, T., Lambrechts, M., Van Rensburg, P., & Nieuwoudt, H. (2013).Validation of two Napping® techniques as rapid sensory screening tools for highalcohol products. Food Quality and Preference, 30, 192–201.
Lucey, J. A. (1998). Cultured dairy products: An overview of their gelation and textureproperties. International Journal of Dairy Technology, 57, 77–84.
MacFie, H. J., Bratchell, N., Greenhoff, K., & Vallis, L. V. (1989). Designs to balance the effectof order of presentation and first-order carry-over effects in hall tests. Journal of Sen-sory Studies, 4, 129–148.
Moraes, P. C. B. T., & Bollini, H. M.A. (2010). Perfil sensorial de iogurtes comerciais sabormorango nas versões tradicional e light. Brazilian Journal of Food Technology, 13,112–119.
Moussaoui, K. A., & Varela, P. (2010). Exploring consumer product profiling techniquesand their linkage to a quantitative descriptive analysis. Food Quality and Preference,21, 1088–1099.
Nestrud, M.A., & Lawless, H. T. (2010). Perceptual mapping of apples and cheeses usingprojective mapping and sorting. Journal of Sensory Studies, 25, 390–405.
Parente, M. E., Ares, G., & Manzoni, A. V. (2010). Applicatin of two consumer profilingtechniques to cosmetic emulsions. Journal of Sensory Studies, 25, 685–705.
Parente, M. E., Manzoni, A. V., & Ares, G. (2011). External preferencemapping of commer-cial antiaging creams based on consumers' responses to a check-all-that-apply ques-tion. Journal of Sensory Studies, 26, 158–166.
Saint-Eve, A., Lévy, C., Martin, N., & Souchon, I. (2006). Influence of proteins on the per-ception of flavored stirred yogurts. Journal of Dairy Science, 89, 922–933.
Sinopolli, D. A., & Lawless, H. T. (2012). Taste properties of potassium chloride alone andin mixtures using sodium chloride using a check-all-that-apply method. Journal ofFood Science, 77, 319–322.
Symoneaux, R., Galmarini, M. V., & Mehinagic, E. (2012). Comment analysis of consumer'slikes and dislikes as an alternative tool to preference mapping. A case study on ap-ples. Food Quality and Preference, 24, 59–66.

610 A.G. Cruz et al. / Food Research International 54 (2013) 601–610
Valentin, D., Chollet, S., Lelievre, M., & Abdi, H. (2012). Quick and dirty but still prettygood: A review of new descriptive methods in food science. International Journal ofFood Science and Technology, 47, 1563–1578.
Varela, P., & Ares, G. (2012). Sensory profiling, the blurred line between sensory and con-sumer science. A review of novel methods for product characterization. Food ResearchInternational, 48, 893–908.
Varela, P., Ares, G., Gimenez, A., & Gambaro, A. (2010). Influence of brand information onconsumers' expectations and liking of powdered drinks in central location tests. FoodQuality and Preference, 21, 873–880.
Veinand, B., Godefroy, C., Adam, C., & Delarue, J. (2011). Highlight of important productcharacteristics for consumers. Comparison of three sensory descriptive methodsperformed by consumers. Food Quality and Preference, 22, 474–485.
Veramendi, M., Herencia, P., & Ares, G. (2013). Perfume odor categorization: To whatextent trained assessors and consumers agree? Journal of Sensory Studies, 28,76–89.
Vidal, L., Barreiro, C., Gómez, B., Ares, G., & Gimenez, A. (2013). Influence of informationon consumers' evaluations using check-all-that-apply questions and sorting: A casestudy with milk desserts. Journal of Sensory Studies, 28, 125–137.