consumer heterogeneity and paid search e ectiveness: a ... · in recent years the internet...
TRANSCRIPT

Consumer Heterogeneity and Paid Search
Effectiveness: A Large Scale Field Experiment∗
Thomas Blake†
Chris Nosko‡
Steven Tadelis§
August 12, 2014
Forthcoming in Econometrica
Abstract
Internet advertising has been the fastest growing advertising channel in recent yearswith paid search ads comprising the bulk of this revenue. We present results from a seriesof large-scale field experiments done at eBay that were designed to measure the causaleffectiveness of paid search ads. Because search clicks and purchase intent are correlated,we show that returns from paid search are a fraction of non-experimental estimates. As anextreme case, we show that brand-keyword ads have no measurable short-term benefits. Fornon-brand keywords we find that new and infrequent users are positively influenced by adsbut that more frequent users whose purchasing behavior is not influenced by ads account formost of the advertising expenses, resulting in average returns that are negative.
∗We are grateful to many eBay employees and executives who made this work possible. We thank SusanAthey, Randall Lewis, Justin Rao, David Reiley, Florian Zettelmeyer, an Editor and three anonymousreferees for comments on earlier drafts.†eBay Research Labs. Email: [email protected]‡University of Chicago and eBay Research Labs. Email: [email protected]§UC Berkeley, NBER, and eBay Research Labs. Email: [email protected]
1 Introduction
Advertising expenses account for a sizable portion of costs for many companies across the
globe. In recent years the internet advertising industry has grown disproportionately, with
revenues in the U.S. alone totaling $36.6 billion for 2012, up 15.2 percent from 2011. Of
the different forms of internet advertising, paid search advertising, also known in industry
as “search engine marketing” (SEM) remains the largest advertising format by revenue,
accounting for 46.3 percent of 2012 revenues, or $16.9 billion, up 14.5 percent from $14.8
billion in 2010. Google Inc., the leading SEM provider, registered $46 billion in global
revenues in 2012, of which $43.7 billion, or 95 percent, were attributed to advertising.1
This paper reports the results from a series of controlled experiments conducted at
eBay Inc., where large-scale SEM campaigns were randomly executed across the U.S. The
experiments show that the effectiveness of SEM is small for a well-known company like
eBay and that the channel has been ineffective on average. We find, however, a significant
positive effect of SEM on new user acquisition and on influencing purchases by infrequent
and less recent users. This supports the informative view of advertising and implies that
targeting uninformed users is a critical factor for successful advertising.
The effects of advertising on business performance have always been considered hard
to measure. Traditional advertising channels such as TV, radio, print and billboards have
limited targeting capabilities, causing advertisers to waste valuable marketing dollars on
“infra-marginal” consumers who are not affected by ads to get to those marginal consumers
who are. The advent of internet marketing channels has been lauded as the answer to this
long-standing dilemma for two reasons.
First, the internet lets advertisers target their ads to the activity that users are engaged
in (Goldfarb, 2012). For instance, when a person reads content related to sports, like
ESPN.com, advertisers can bid to have display ads appear on those pages. Similarly, if a
user searches Google for information about flat-screen TVs, retailers and manufacturers of
these goods can bid for paid search ads that better target the user’s intent.
Second, advertisers can track data needed to measure the efficacy of ads because they
will receive detailed data on visitors who were directed to their websites by the ad, how
1See See the Interactive Advertising Bureau (IAB) 2012 Full Year Results, April 2013, http://www.iab.net/media/file/IAB_Internet_Advertising_Revenue_Report_FY_2012_rev.pdf and Google’s web-page http://investor.google.com/financial/tables.html
1

much was paid for the ad, and whether the visitor purchased anything from their website.
This should allow the advertiser to compute the returns on investment.
Despite these advantages, serious challenges persist in measuring causal relationships
between internet-advertising expenditures and sales. Traditionally, economists have focused
on endogeneity stemming from firm decisions to increase advertising during times of high
demand.2 Our concern, instead, is that the amount spent on internet marketing is a
function not only of the advertiser’s campaign, but is also determined by the behavior and
intent of consumers because expenditures increase with clicks. In contrast, the amount
spent on an ad in the New York Times print edition is independent of consumer behavior.
Our research highlights one potential drawback inherent in this form of targeting: In
many cases, the consumers who choose to click on ads are loyal customers or are otherwise
already informed about the company’s product. Advertising may appear to attract these
consumers, when in reality they would have found other channels to visit the company’s
website. We overcome this endogeneity challenge with our controlled experiments.
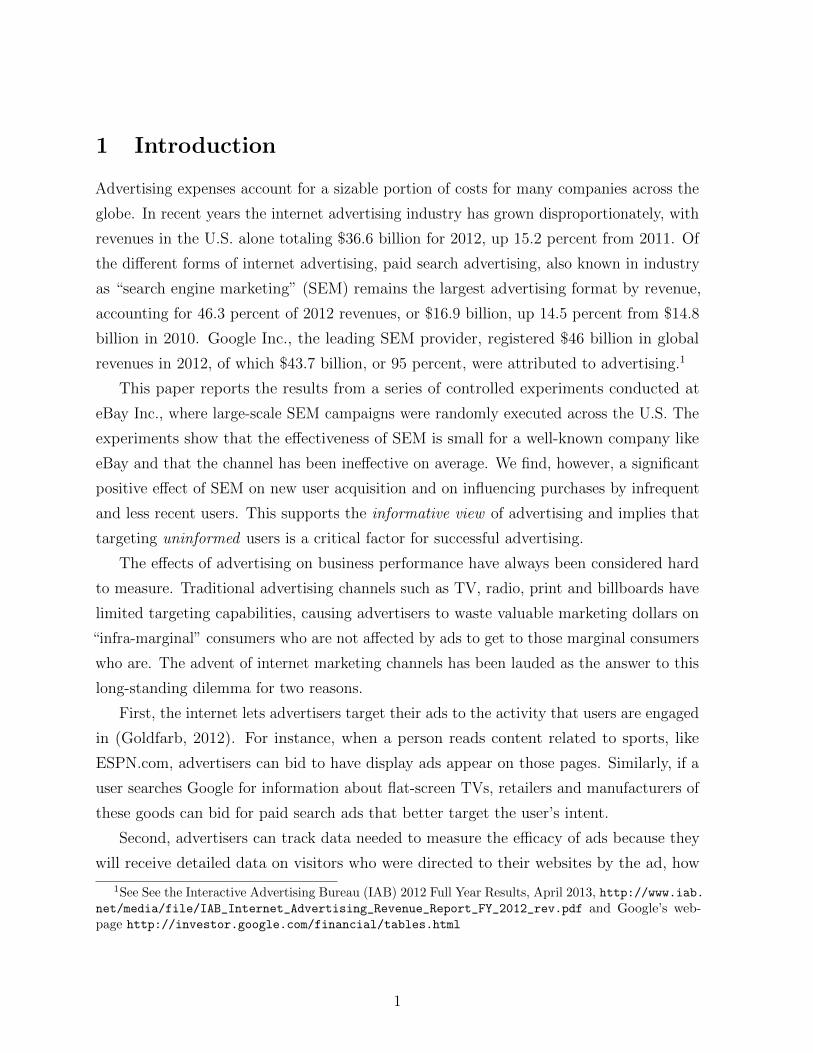
To visualize SEM, Figure 1a shows Google search results for the query “used gibson
les paul”, which fall into two categories: paid (or “sponsored”) search ads (two on top,
five photo ads, and seven on the right), and unpaid (also called “natural” or “organic”)
search results (three at the bottom). Organic results are ranked by Google’s “PageRank”
algorithm, while the placement of paid search ads depends on bids made by advertisers
when a particular query is typed by a user. Advertisers pay only when a user clicks on the
ad, implying that ad expenses are only incurred for users who respond to the ad.
The example in Figure 1a describes what is referred to as a non-brand keyword search,
despite the fact that a particular branded product (Gibson Les Paul) is part of the query,
because many retailers will offer this guitar for sale. This is in contrast to a branded
keyword such as “macys”. Figure 1b shows the results page from searching for “macys”
on Google with only one paid ad that links to Macy’s main webpage.
To illustrate a striking example of the endogeneity problem we first tested the efficacy
of brand keyword advertising, a practice used by many companies. For example, on
February 16, 2013, Google searches for the keywords “AT&T”, “Macy”, “Safeway”, “Ford”
and “Amazon” resulted in paid ads at the top of the search results page directly above
organic unpaid links to the companies’ sites. Brand paid search links simply intercept
2E.g., advertising during the holidays, or when advertising budgets are set as a percentage of previous-quarter revenue. See Berndt (1991), Chapter 8, for a survey of this literature.
2

Figure 1: Google Ad Examples
(a) Used Gibson Les Paul (b) Macys
Panel (a) shows Google search results for a non-brand term ”used gibson les paul” and Panel (b) shows a brand term,
Macy’s.
consumers at the last point in their navigational process, resulting in an extreme version
of the endogeneity concern because users would have found the advertisers’ site anyway.
Section 2 presents experiments showing that there is no measurable short-term value
in brand keyword advertising. eBay halted SEM queries for brand keywords (all queries
that included the term eBay, e.g., “ebay shoes”) on both Yahoo! and Microsoft (MSN),
while continuing to pay for these terms on Google, which we used as a control in our
estimation. The results show that almost all of the forgone click traffic and attributed
sales were captured by natural search.3 That is, substitution between paid and unpaid
traffic was nearly complete. We further confirm this result using several brand-keyword
experiments on Google’s search platform.4
Section 3 presents our main analyses based on experiments for non-branded keyword ad-
vertising. eBay historically managed over 100 million keywords and keyword combinations
using algorithms that are updated daily and automatically feed into Google’s, Microsoft’s
3Throughout, we refer to sales as the total dollar value of goods purchased by users on eBay. Revenueis close to a constant fraction of sales, so percentage changes in the two are almost equivalent.
4Rutz and Bucklin (2011) distinguish between generic and branded search terms similarly to ourdistinction between brand and non-brand terms. They do not measure the efficacy of brand search ads.
3

and Yahoo!’s search platforms.5 Examples of such keyword strings are “memory”, “cell
phone” and “used gibson les paul”. Unlike branded search, where a firm’s website is usually
in the top organic search slot, organic placement for non-branded terms vary widely. The
question is whether absent SEM ads, consumers will use other channels to navigate to
eBay’s website (e.g., by directly navigating to www.ebay.com).6
To address this question, we designed a controlled experiment using Google’s geographic
bid feature (see Vaver and Koehler (2011)) that can determine, with a reasonable degree of
accuracy, the geographic area of the user conducting each query. We designate a random
sample of 30 percent of eBay’s U.S. traffic in which we stopped all bidding for all non-brand
keywords for 60 days. The test was designed to estimate the effect of paid search on sales
and allowed us to explore heterogeneous responses across a wide consumer base.
The experiment showed that SEM had a very small and statistically insignificant effect
on sales. We then segmented users according to the frequency and recency at which they
visit eBay. We found that SEM accounted for a statistically significant increase in new
registered users and purchases made by users who bought infrequently. SEM did not have
a significant effect on the purchasing behavior of consumers who bought more frequently.
We calculate that the short-term returns on investment for SEM were negative because
frequent eBay shoppers account for most of the sales attributed to paid search.
Our results support the informative view of advertising, which posits that advertising
informs consumers of the characteristics, location and prices of products and services that
they may otherwise be ignorant about.7 In particular, consumers who have completed
several eBay transactions in the year before our experiment are likely to be familiar with
eBay and are unaffected by SEM. In contrast, more new users sign up when they are
exposed to SEM ads, and users who only purchased one or two items in the previous year
increase their purchases when exposed to SEM.
5See “Inside eBay’s business intelligence” by Jon Tullett, news analysis editor forITWeb at http://www.itweb.co.za/index.php?option=com_content&view=article&id=60448:
Inside-eBay-s-business-intelligence&catid=2186 Yang and Ghose (2010) investigate whether organic and paid search links are substitutes or comple-
ments. They do not measure sales related to other channels or the total effect of SEM on sales.7Bagwell (2007) gives an excellent review of the economics literature on advertising. The persuasive
view of advertising suggests that consumers who are exposed to persuasive advertising will developa preference for the advertised product. Intuitively, SEM is an advertising medium that affects theinformation that people have, and is unlikely to play a persuasive role. It is possible that display ads,which appear on pages without direct consumer queries, may play more of a persuasive role. A few papershave explored the effects of display ads on offline and online sales. See Manchanda et al. (2006), Goldfarband Tucker (2011) and Lewis and Reiley (2014b).
4
These results echo findings in Ackerberg (2001) who shows, using a reduced form
model, that consumers who were not experienced with a product were more responsive
to ads than consumers who had experienced the product. To the best of our knowledge,
we analyze the first large scale field experiment that documents the causal response of
consumers to changes in advertising differentiated by how informed these consumers were.8
We contribute to a growing literature that exploits rich internet marketing data to
explore how consumers respond to advertising.9 Lewis and Reiley (2014b) examine a
related endogeneity problem to the one we stress, which they call “activity bias”, where
people who are more active online will both see more display-ads and click on more links.10
To illustrate the severity of the endogeneity problem in our data, we calculated the Return
on Investment (ROI) using typical OLS methods, which result in a ROI of over 4, 100%
without time and geographic controls, and a ROI of over 1, 400% with such controls. We
then used our experimental methods to control for endogeneity and found a ROI of −63%,
with a 95% confidence interval of [−124%,−3%], rejecting the hypothesis that the channel
yields any short run positive returns. This result further emphasizes the importance of
using controlled experiments in measuring the effectiveness of advertising, a tradition
going back to at least Lodish et al. (1995).11
If, as we suspect, our results generalize to other well known brands that are in most
consumers’ consideration sets, then our study suggests that much of what is spent on
internet advertising may be beyond the peak of its efficacy. We conclude by discussing the
challenges that companies face in choosing optimal levels of advertising.
2 Brand Search Experiments
In March of 2012, eBay conducted a test to study the returns of brand keyword search
advertising. Brand terms are any queries that include the term eBay such as “ebay shoes.”
8Other recent papers have shown heterogeneous responses of consumers along demographic dimensionssuch as age, gender and location. See Lewis and Reiley (2014a) and Johnson et al. (2014).
9See Yao and Mela (2011), Chan et al. (2011b), Reiley et al. (2010), and Narayanan and Kalyanam(2011) for recent papers that study SEM using other methods.
10Edelman (2013) raises the concern that industry measurement methods, often referred to as “attributionmodels”, may indeed overestimate the efficacy of such ads. Lewis and Rao (2013) expose another problemwith measurement showing that there are significant problems with the power of many experimentaladvertising campaigns, leading to wide confidence intervals.
11Other recent papers that use controlled experiments to investigate related issues include Sahni (2011),Lewis and Reiley (2014b), and Lambrecht and Tucker (2013).
5

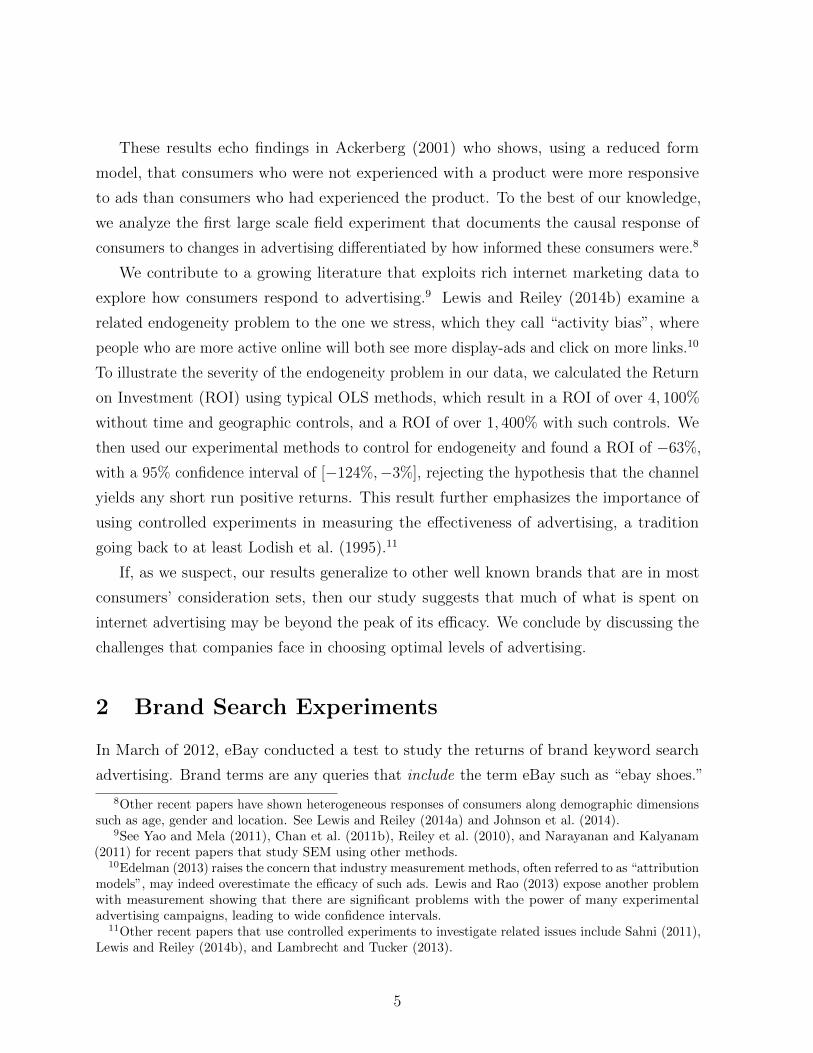
Figure 2: Brand Keyword Click Substitution
Cou
nt o
f Clic
ks01
jan2
012
08ja
n201
215
jan2
012
22ja
n201
229
jan2
012
05fe
b201
212
feb2
012
19fe
b201
226
feb2
012
04m
ar20
1211
mar
2012
18m
ar20
1225
mar
2012
01ap
r201
208
apr2
012
15ap
r201
222
apr2
012
29ap
r201
206
may
2012
13m
ay20
1220
may
2012
27m
ay20
1203
jun2
012
10ju
n201
217
jun2
012
24ju
n201
2
MSN Paid MSN Natural Goog Natural
(a) MSN TestC
ount
of C
licks
01ju
n201
2
08ju
n201
2
15ju
n201
2
22ju
n201
2
29ju
n201
2
06ju
l201
2
13ju
l201
2
20ju
l201
2
27ju
l201
2
03au
g201
2
10au
g201
2
17au
g201
2
24au
g201
2
31au
g201
2
07se
p201
2
14se
p201
2
Goog Paid Goog Natural
(b) Google Test
MSN and Google click-traffic counts to eBay on searches for ‘ebay’ terms is shown for two experiments where paid search
was suspended (Panel a) and suspended and resumed (Panel b).
Our hypothesis was that users who type “eBay” are using search as navigation with the
intent to go to ebay.com. If so, brand ads “intercept” those searches because the natural
search results will serve as an almost perfect substitute. To test this hypothesis, eBay
halted advertising for its brand related terms on Yahoo! and MSN. The experiment revealed
that almost all (99.5 percent) of the forgone click traffic from turning off brand keyword
paid search was immediately captured by natural search traffic from the platform, in this
case Bing. That is, substitution between paid and unpaid traffic was nearly complete.12
Figure 2a plots the paid and natural clicks originating from the search platform. Paid
clicks were driven to zero when advertising was suspended, while there was a noticeable
uptake in natural clicks. Since users intend to find eBay, it is not surprising that shutting
down the paid search path to their desired destination simply diverts traffic to the next
easiest path, natural search, which is free to the advertiser.
To quantify this substitution, we first regressed the log of total daily clicks from MSN
to eBay on an indicator for whether days were in the period with ads turned off. Click
volume was 5.6 percent lower in the period after advertising was suspended. We then used
12The 0.5 percent of all clicks lost represents about 1.5 percent of all paid clicks. In a recent paper,Yang and Ghose (2010) similarly switched off and back on paid search advertising for a random set of 90keywords. We find much smaller differences in total traffic, most likely because we experimented with abrand term where the substitution effect is much larger.
6

data on eBay’s clicks from Google as a control for seasonal factors because during the
test period on MSN, eBay continued to purchase brand keyword advertising on Google.
We performed a difference-in-differences analysis using Google as a control.13 Once the
seasonality is accounted for, only 0.529 percent of the click traffic is lost so 99.5 percent is
retained. Note that this is a lower bound of retention because some of the 0.5 percent of
lost traffic may have switched to typing “ebay.com” into the browser.
These results inspired a follow-up test on Google’s platform that was executed in July
of 2012 which yielded similar results. Figure 2b shows both the substitution to natural
traffic when search advertising was suspended and the substitution back to paid traffic
when advertising resumed. In total, traffic referred by Google dropped by 3.2 percent. It
is likely that a well constructed control group would reduce this estimate as was evident
in the MSN test. During this test, there was no viable control group because there was no
other contemporaneous paid search brand advertising campaign. In an online Appendix
we describe a test in Germany that preserved a control group, which confirms the results.
In summary, the evidence strongly supports the intuitive notion that for brand keywords,
natural search is close to a perfect substitute for paid search, making brand keyword SEM
ineffective for short-term sales. After all, the users who type the brand keyword in the
search query intend to reach the company’s website, and most likely will execute on their
intent regardless of the appearance of a paid search ad.
3 Non-Brand Terms Controlled Experiment
When typing queries for non-brand terms, users may be searching for information on goods
or wish to purchase them. If ads appear for users who do not know that these products
are available at the advertiser’s website, then there is potential to bring these users to the
site, which in turn might generate sales that would not have occurred without the ads.
Because eBay bids on a universe of over 100 million keywords, it provides an ideal
environment to test the effectiveness of paid search ads for non-brand keywords. The
broad set of keywords place ads in front of a wide set of users who search for queries
related to millions of products. Measuring the effects of the full keyword set more directly
addresses the value of informative advertising because we can examine how consumers
with different levels of familiarity with the site respond to advertising. In particular, we
13Detailed results are shown in Table A1 of the online Appendix.
7
can use measures of past activity on eBay to segment users into groups that would be
more or less familiar with eBay’s offerings. Non-brand ads can attract users that are not
directly searching for eBay but the endogeneity problem persists because the ads may
attract informed users who may have visited eBay even if the ad were not present.
3.1 Experimental Design and Basic Results
To measure the effect of advertising on non-brand queries we implemented a large scale
field experiment that exposed a random group of users to ads, while a control group did
not see ads.14 We used Google’s geographic bid feature that determines, with a reasonable
degree of accuracy, the Nielsen Designated Market Area (DMA) of the user conducting
each query. There are 210 DMAs in the United States, which typically correspond to large
metropolitan areas. For example, San Francisco, Oakland, and San Jose, CA, comprise a
large DMA while Butte and Bozeman, MT, comprise a smaller DMA.
For the test, ads were suspended in roughly 30 percent of DMAs. This was done to
reduce the scope of the test and minimize the potential cost and impact to the business (in
the event that the ads created considerable profits). A purely random subsample of DMAs
were chosen as candidates for the test. Next, candidate DMAs were divided into test
and control DMAs using an algorithm that matched historical serial correlation in sales
between the two regions. This was done to create a control group that mirrored the test
group in seasonality. This procedure implies that the test group is not a purely random
sample, but it is certainly an arbitrary sample that does not exhibit any historical (or, ex
post) difference in sales trends. The test design therefore lends itself neatly to a standard
difference-in-differences estimation of the effect of paid search on sales. For robustness,
we explored alternative estimation strategies using the purely random assignment in the
online Appendix.
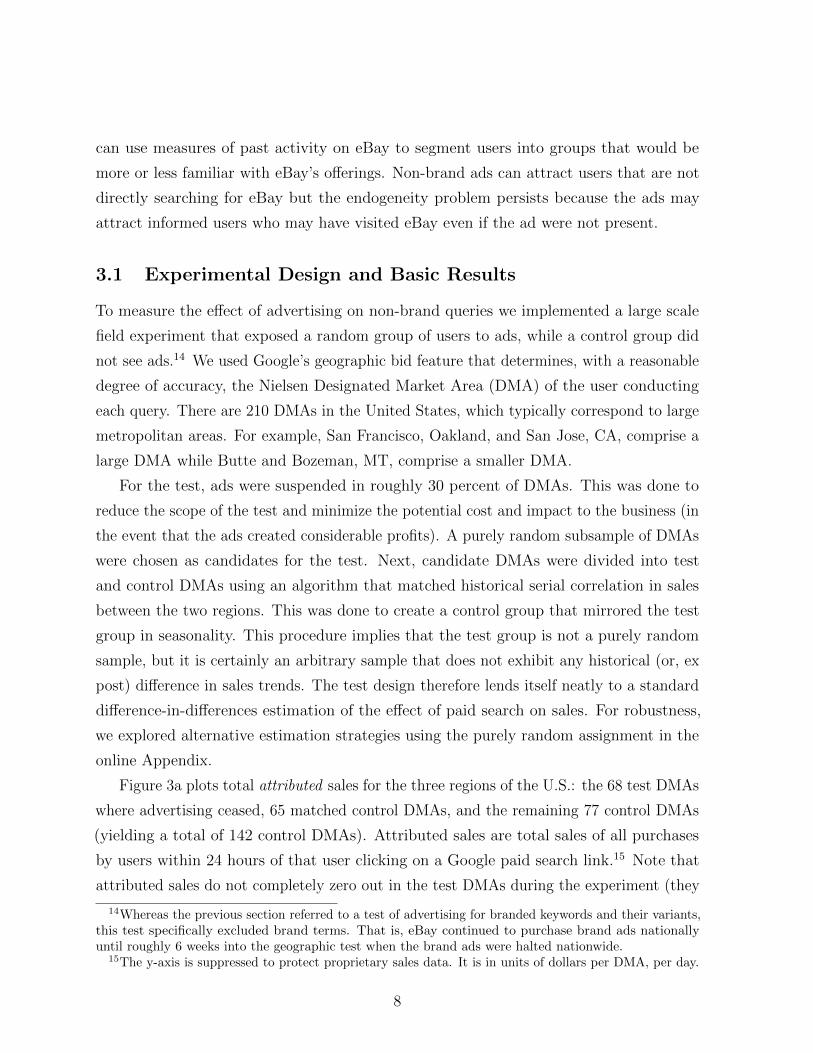
Figure 3a plots total attributed sales for the three regions of the U.S.: the 68 test DMAs
where advertising ceased, 65 matched control DMAs, and the remaining 77 control DMAs
(yielding a total of 142 control DMAs). Attributed sales are total sales of all purchases
by users within 24 hours of that user clicking on a Google paid search link.15 Note that
attributed sales do not completely zero out in the test DMAs during the experiment (they
14Whereas the previous section referred to a test of advertising for branded keywords and their variants,this test specifically excluded brand terms. That is, eBay continued to purchase brand ads nationallyuntil roughly 6 weeks into the geographic test when the brand ads were halted nationwide.
15The y-axis is suppressed to protect proprietary sales data. It is in units of dollars per DMA, per day.
8

Figure 3: Non-Brand Keyword Region Test
Sal
es01
apr2
012
08ap
r201
2
15ap
r201
2
22ap
r201
2
29ap
r201
2
06m
ay20
12
13m
ay20
12
20m
ay20
12
27m
ay20
12
03ju
n201
2
10ju
n201
2
17ju
n201
2
24ju
n201
2
01ju
l201
2
08ju
l201
2
15ju
l201
2
22ju
l201
2
Test Control Rest of U.S.
(a) Attributed Sales by Region
.2.3
.4
2040
60
1.2
1.4
01ap
r201
2
08ap
r201
2
15ap
r201
2
22ap
r201
2
29ap
r201
2
06m
ay20
12
13m
ay20
12
20m
ay20
12
27m
ay20
12
03ju
n201
2
10ju
n201
2
17ju
n201
2
24ju
n201
2
01ju
l201
2
08ju
l201
2
15ju
l201
2
22ju
l201
2
On/Off (On−Off)Log(On)−Log(Off) Test
(b) Differences in Total Sales
Panel (a) plots total purchases by users who clicked on an ad prior to purchase, which drops when the test commences in
the test areas. Panel (b) plots three different measures of the difference between test and control regions before and after
the test. The Y-axis is shown for the ratio, the log difference, and in differences in thousands of dollars per day, per DMA.
fell by over 72 percent). The remaining ad sales from test DMAs are an artifact of the
error both in Google’s ability to determine a user’s location and our determination of the
user’s location. We use the user’s shipping zip code registered with eBay to determine the
user’s DMA and whether or not the user was exposed to ads. If a user makes a purchase
while traveling to a region exposed to ads but still has the product shipped to her home,
we would assign the associated sales to the off region.16
Figure 3b plots the simple difference, ratio, and log difference between daily average
sales in the designated control regions where search remained on and the test regions
where search was off. The regions where search remained on are larger (about 30 percent)
than the regions switched off as a result of the selection algorithm that optimized for
historical trends. There is no noticeable difference between the pre and post experimental
period demonstrating the muted overall effect of paid search. The online appendix contains
details of a difference-in-differences estimation that mimics Figure 3b using daily data
from the full national set of DMAs in a regression of sales on indicators for whether or not
paid search was turned on. Column (5) of Table 1 reports the results showing that the
16This classification error will attenuate the estimated effect towards zero. However, the InstrumentalVariables estimates in Columns (3) and (4) of Table 1 measure an effect on the intensive margin ofspending variation, which overcomes the classification error problem.
9

Table 1: Return on Investment
OLS IV DnD
(1) (2) (3) (4) (5)
Estimated Coefficient 0.88500 0.12600 0.00401 0.00188 0.00659 A
(Std Err) (0.0143) (0.0404) (0.0410) (0.0016) (0.0056)DMA Fixed Effects Yes Yes YesDate Fixed Effects Yes Yes YesN 10500 10500 23730 23730 23730
∆ln(Spend) Adjustment 3.51 3.51 3.51 3.51 1 B
∆ln(Rev) (β) 3.10635 0.44226 0.01408 0.00660 0.00659 C=A*B
Spend (Millions of $) $ 51.00 $ 51.00 $ 51.00 $ 51.00 $ 51.00 D
Gross Revenue (R’) 2,880.64 2,880.64 2,880.64 2,880.64 2,880.64 E
ROI 4173% 1632% -22% -63% -63% F=A/(1+A)*(E/D)-1
ROI Lower Bound 4139% 697% -2168% -124% -124%ROI Upper Bound 4205% 2265% 1191% -3% -3%
The upper panel presents regression estimates of SEM’s effect on sales. Columns (1) and (2) naively regress sales on
spending in the pre-experiment period. Columns (3) and (4) show estimates of spending’s effect on revenue using the
difference-in-differences indicators as excluded instruments. Column (5) shows the reduced form difference-in-differences
interaction coefficient. The lower panel translates these estimates into a return on investment (ROI) as discussed in Section
4 and shows its 95% confidence interval.
entire regime of paid search adds only 0.66 percent to sales with a 95 percent confidence
interval of [-0.42%,1.74%].17
We now examine the magnitude of the endogeneity problem. Absent endogeneity
problems we could estimate the effect of ad spending on sales with a simple regression:
ln(Salesit) = α1 × ln(Spendit) + εit (1)
where i indexes the DMA and t indexes the day. Columns (1) and (2) of Table 1 show the
estimates of such a regression during the period prior to our test. As is evident, the simple
OLS in Column (1) yields unrealistic returns suggesting that every 10 percent increase in
spending raises revenues by 9 percent. The inclusion of DMA and day controls in Column
(2) lowered this estimate to 1.3 percent, which is still very high. The amount spent on ads,
however, depends on the search behavior of users, which is correlated with their intent to
purchase. Our experiment overcomes this endogeneity problem.
17Alternate specifications are presented in Table A2 of the online Appendix.
10

Columns (3) and (4) of Table 1 instrument for spending with dummies for the experiment
regions, experiment period and interaction. We used a two stage least squares estimation
with the following first stage:
ln(Spendit) = α1 × AdsOnit + α2 × Postt + α3 ×Groupi + εit (2)
where Postt is an indicator for whether the test was running, Groupi is an indicator
equal to one if region i kept search spending on and AdsOnit is the interaction of the two
indicators. The instruments isolate the exogenous experimental variation in spending to
estimate the causal effect of spending on changes in revenue. True returns are almost two
orders of magnitude smaller and are no longer statistically different from zero.
3.2 Consumer Response Heterogeneity
The scale of our experiment allows us to separate outcomes by observable user characteris-
tics. Econometrically, this can be accomplished by interacting the treatment dummy with
dummies for each subgroup which produces a set of coefficients representing the total aver-
age effect from the advertising regime on that subgroup. We examine user characteristics
that are common in the literature: the recency and frequency of a user’s prior purchases.
First, we interact the treatment dummy with indicators for the number of purchases by
that user in the year before April 2012. We estimate the following specification:
ln(Salesimt) = βm × AdsOnimt × θm + δt + γi + θm + εit (3)
where m ∈ {0, 1, ..., 10} indexes user segments. Users with no purchases in the prior
year are indexed by m = 0, those who purchased once in the prior year by m = 1, and
so on, while Salesimt is the total sales to all users in segment m in period t and DMA
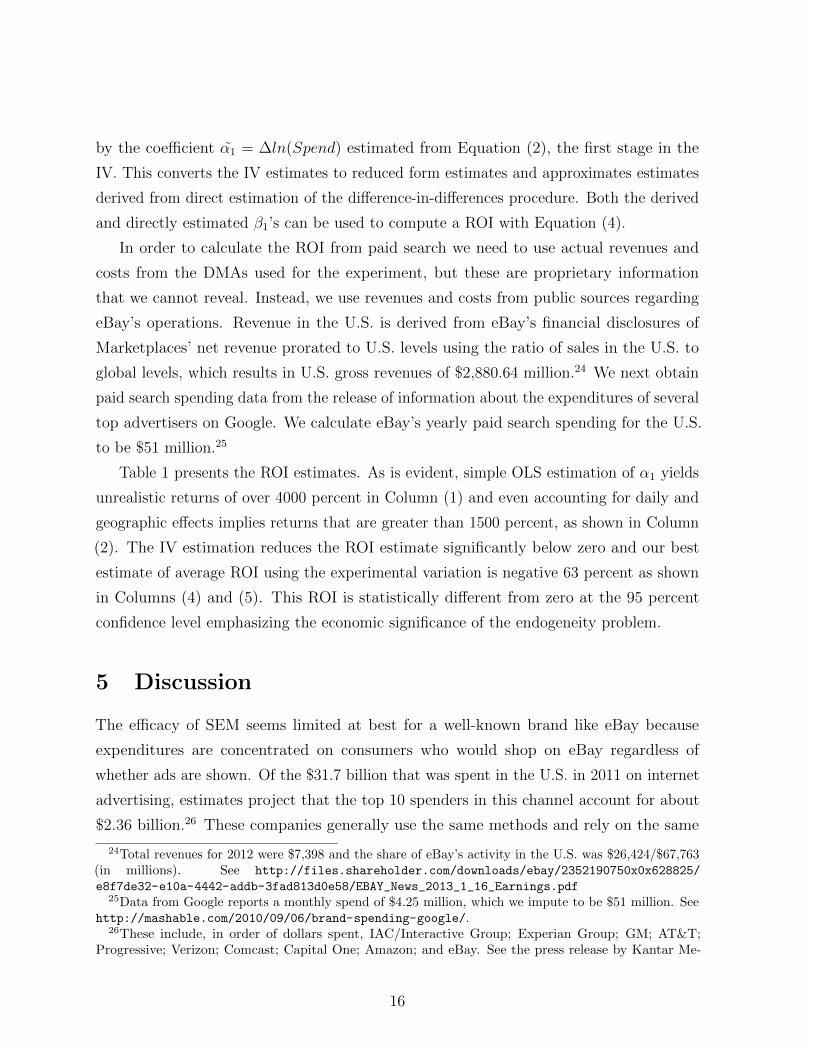
i. This produces 11 estimates, one for each user segment.18 Figure 4a plots the point
estimates of the treatment interactions. The largest effect on sales was for users who had
not purchased before on eBay. Interestingly, the treatment effect diminishes quickly with
purchase frequency as estimates are near zero for users who buy more regularly.19
18This is similar to running 11 separate regressions, which produces qualitatively similar results.19Only the zero purchases effect is statistically distinguishable from other segments, even when pooled
into larger buckets. The slope of the relationship between effect and frequency is statistically negative,
11

Figure 4: Paid Search Effect by User Segment
−0.
050.
000.
050.
100.
15%
Cha
nge
in S
ales
0 2 4 6 8 10User’s Purchase Count for the 12 months ending
Parameter estimate 95% Conf Interval
(a) User Frequency−
0.05
0.00
0.05
0.10
0.15
% C
hang
e in
Sal
es
0 30 60 90 120 150 180 210 240 270 300 330 360Days since User’s Last Purchase
Parameter estimate 95% Conf Interval Spline
(b) User Recency
Panel (a) shows difference-in-differences estimates and 95% confidence bands of paid search effects on sales for different
user segments as defined by how many purchases were made in the previous 12 months. Panel (b) shows similar estimates
where users were segmented by the time since last purchase.
Second, Figure 4b plots the interactions by time since last purchase. Estimates become
noisier as we look at longer periods of inactivity because there are fewer buyers that
return after longer absences. The estimates are tightly estimated zeros for zero days and
consistently centered on zero for 30 and 60 day absences, suggesting that advertising has
little effect on active and moderately active customers. However, the effect then steadily
rises with absence and is once again large and statistically significant for customers who
have not purchased in over a year.20 We estimate a spline with a break at the arbitrarily
chosen 90 day mark and estimate the treatment effect to be 0.02 percentage points larger
per month of absence.21
Figure 4 implies that search advertising works only on a firm’s least active customers.
These are traditionally considered a firms “worst” customers, and advertising is often
however, even excluding the zero purchase users. We illustrate this with a simple spline beginning at onepurchase, shown as the dashed line. The slope of the right segment of this line, derived by replace θm inEquation (3) with a continuous purchase count, is estimated to be -0.0038 with a standard error of 0.0014.
20Gonul and Shi (1998) study a direct mail campaign and find that recent individuals are not influencedby mailing because they are likely to buy anyway.
21This estimate is derived in similar fashion to the spline in Panel (a): with interactions of the treatmentdummy and the number of days since purchase. This is statistically distinguishable from zero, with astandard error of .00004577 so that pooling across user segments provides better evidence of the trendthan the noisier separate coefficients.
12

aimed at high value repeat consumers (Fader et al., 2005). This evidence supports the
informative view where ads affect consumption only when they update a consumer’s
information set. Bluntly, search advertising only works if the consumer has no idea that
the company has the desired product. Large firms like eBay with powerful brands will see
little benefit from paid search advertising because most consumers already know that they
exist, as well as what they have to offer. The modest returns on infrequent users likely
come from informing them that eBay has offerings they did not think were available.
While the least active customers are the best targets for search advertising, we find that
most paid search traffic and attributed sales are from high volume, frequent purchasers.
Figure 5a plots the count of buyers by how many purchases they made in a year. The
counts are shown separately for all buyers and for those that buy, at any point in the year
prior to the experiment, after clicking on a paid search ad. The ratio of the two rises
with purchase frequency because frequent purchasers are more likely to use paid search at
some point. Figure 5b shows the same plot for shares of transaction counts. Even users
who buy more than 50 times in a year still use paid search clicks for 4 percent of their
purchases. The large share of heavy users suggests that most of paid search spending is
wasted because the majority of spending on Google is related to clicks by those users that
would purchase anyway. This explains the large negative ROI computed in Section 4.
We have searched for other indicators of consumer’s propensity to respond in localized
demographic data. We interacted zip code demographic data with our treatment indicator
and found no response that is statistically different across several demographic measures:
income, population size, unemployment rates, household size, and eBay user penetration.
Finally, we looked for differential effects across product types and find no systematic
difference across multiple layers of categorization. See the online appendix for more details.
3.3 Where did the Non-Brand Traffic Go?
The brand query tests demonstrated that causal (incremental) returns were small because
users easily substituted paid search clicks for natural search clicks. Metaphorically, we
closed one door and users simply switched to the next easiest door. This substitution was
expected because users were using brand queries as simple navigational tools. Unbranded
queries are not simply navigational because users are trying to find any destination that
has the desired product. Only experimental variation can quantify the number of users
who are actually directed by the presence of search advertising.
13

Figure 5: Paid Search Attribution by User Segment
0%
5%
10%
15%
20%
25%
1 2 3 4 5 6 7 8 91
01
11
21
31
41
51
61
71
81
92
02
12
22
32
42
52
62
72
82
93
03
13
23
33
43
53
63
73
83
94
04
14
24
34
44
54
64
74
84
95
0-1
00
>10
0
Co
un
t o
f B
uye
rs in
Eac
h G
rou
p
User's Purchase Count for the 12 Months Ending 4/1/2012
Buyers Paid Search Buyers Proportion Tracked
(a) Buyer Count Mix
0.0%
1.0%
2.0%
3.0%
4.0%
5.0%
6.0%
1 2 3 4 5 6 7 8 91
01
11
21
31
41
51
61
71
81
92
02
12
22
32
42
52
62
72
82
93
03
13
23
33
43
53
63
73
83
94
04
14
24
34
44
54
64
74
84
95
0
Tota
l Sal
es
in Q
2 2
01
2 t
o U
sers
in E
ach
Gro
up
User's Purchase Count for the 12 Months Ending 4/1/2012
Sales Paid Search Sales Proportion Paid Search
(b) Transaction Count Mix
Panel (a) shows the histogram of buyers by how many purchases were made in the previous 12 months compared to the
those buyers with paid search clicks preceding purchases. The proportion tracked is the ratio of the two counts in each
bucket. Panel (b) shows the same for the distribution of transaction counts.
Experimentation can also quantify the substitution between SEM and other channels.
For example, in Figure 1a we showed Google’s search results page for the query “used
gibson les paul”. Notice that the second ad from the top, as well as the center image of
the guitar below it, are both paid ads that link to eBay, while the two bottom results of
the natural search part of the page also link to eBay. Hence, some substitution from paid
to natural search may occur for non-brand keywords as well. Also, users who intend to
visit eBay and do not see ads may choose to directly navigate to www.ebay.com.
Clicks to eBay decline measurably in the absence of non-brand ads.22 Advertising
clicks dropped 41 percent, and total clicks fell 2 percent as a result of the non-brand
experiment.23 The total loss in clicks is roughly 58 percent of the number of lost paid search
clicks, suggesting that 42 percent of paid search clicks are newly acquired. Advertising
does increase clicks above and beyond what is taken from natural search. This mirrors
studies from Google that find that the majority of lost paid search clicks would not have
been recouped by natural search (Chan et al., 2011a).
22Recall that 99.5 percent of clicks where retained in the absence of brand paid ads.23Natural clicks are a much larger denominator and therefore the total percentage drop is smaller.
14

But clicks are just part of what generates sales. To make meaningful statements about
internet traffic, we need to make an important distinction in the nature of visits. eBay
servers are able to distinguish between referring clicks (clicks from other sites that lead to
an eBay page) and total visits (clusters of page visits by the same user). In the course of
a single shopping session users will have many clicks referring from other websites because
their search takes them on and off eBay pages. Put simply, users will travel to eBay from
Google multiple times in one sitting.
We defined a paid search visit as a session that begins with a paid search click and
compare the substitution to comparably defined natural search visits. We measured the
potential traffic substitution by regressing the log of eBay visit counts from either organic
search or from direct navigation on the log of eBay visit counts from paid search, using
the experiment as an instrument. We find that a 1 percent drop in paid search visits
leads to a 0.5 percent increase in natural search visits and to a 0.23 percent increase in
direct navigation visits. These substitution results suggest that most, if not all, of the
‘lost’ traffic finds its way back through natural search and direct navigation. This helps
explain why we found that clicks are lost but revenue is not.
4 Deriving Returns on Investment
To demonstrate the economic significance of our results we computed the implied short-
term return on investment (ROI) associated with spending on paid search. Imagine
that the amount spent on paid search was S0 associated with revenues equal to R0. Let
∆R = R1 −R0 be the difference in revenues as a consequence of an increase in spending,
∆S = S1 − S0, and by definition, ROI ≡ ∆R∆S− 1.
Let β1 = ∆ln(R) be our estimated coefficient on paid search effectiveness, which is
the effect of an increase in spend on log-revenues. (See the Appendix for details on the
estimation of β1.) Using the definition of ROI and setting S0 = 0 (no spending on paid
search) some algebraic manipulation (detailed in the online appendix) yields,
ROI ≈ β1
(1 + β1)
R1
S1
− 1 (4)
For the OLS and IV estimates where spending is the independent variable, we translate the
coefficient α1 = ∆ln(Sales)∆ln(Spend)
from Equation (1) to a measure comparable to β1 by multiplying
15
by the coefficient α1 = ∆ln(Spend) estimated from Equation (2), the first stage in the
IV. This converts the IV estimates to reduced form estimates and approximates estimates
derived from direct estimation of the difference-in-differences procedure. Both the derived
and directly estimated β1’s can be used to compute a ROI with Equation (4).
In order to calculate the ROI from paid search we need to use actual revenues and
costs from the DMAs used for the experiment, but these are proprietary information
that we cannot reveal. Instead, we use revenues and costs from public sources regarding
eBay’s operations. Revenue in the U.S. is derived from eBay’s financial disclosures of
Marketplaces’ net revenue prorated to U.S. levels using the ratio of sales in the U.S. to
global levels, which results in U.S. gross revenues of $2,880.64 million.24 We next obtain
paid search spending data from the release of information about the expenditures of several
top advertisers on Google. We calculate eBay’s yearly paid search spending for the U.S.
to be $51 million.25
Table 1 presents the ROI estimates. As is evident, simple OLS estimation of α1 yields
unrealistic returns of over 4000 percent in Column (1) and even accounting for daily and
geographic effects implies returns that are greater than 1500 percent, as shown in Column
(2). The IV estimation reduces the ROI estimate significantly below zero and our best
estimate of average ROI using the experimental variation is negative 63 percent as shown
in Columns (4) and (5). This ROI is statistically different from zero at the 95 percent
confidence level emphasizing the economic significance of the endogeneity problem.
5 Discussion
The efficacy of SEM seems limited at best for a well-known brand like eBay because
expenditures are concentrated on consumers who would shop on eBay regardless of
whether ads are shown. Of the $31.7 billion that was spent in the U.S. in 2011 on internet
advertising, estimates project that the top 10 spenders in this channel account for about
$2.36 billion.26 These companies generally use the same methods and rely on the same
24Total revenues for 2012 were $7,398 and the share of eBay’s activity in the U.S. was $26,424/$67,763(in millions). See http://files.shareholder.com/downloads/ebay/2352190750x0x628825/
e8f7de32-e10a-4442-addb-3fad813d0e58/EBAY_News_2013_1_16_Earnings.pdf25Data from Google reports a monthly spend of $4.25 million, which we impute to be $51 million. See
http://mashable.com/2010/09/06/brand-spending-google/.26These include, in order of dollars spent, IAC/Interactive Group; Experian Group; GM; AT&T;
Progressive; Verizon; Comcast; Capital One; Amazon; and eBay. See the press release by Kantar Me-
16
external support to design their ad campaigns, suggesting many reasons to believe that the
results we presented above would generalize to these large and well known corporations.
This may not be true for small and new entities that have no brand recognition.27
This begs the question: why do well-known companies spend large amounts of money
on what seems to be a rather ineffective marketing channel? One argument is that there
are long term benefits that we are unable to capture in our analysis. This does not seem
to apply for brand-keyword advertising because it is obvious that the user searched for
the brand name and hence is aware of it. Arguments have been made that brand-keyword
advertising acts as a defense against a competitor bidding for a company’s brand name.
This implies that brand-keyword advertising allows competing companies to play a version
of the Prisoner’s Dilemma. A company and its competitor would both be better off
not buying any brand-keywords, but each cannot resist the temptation to pinch away
some of their competitor’s traffic, and in the process, the ad platforms benefit from this
rent-seeking game. It should be noted, however, that since eBay stopped bidding on its
brand-keywords, such behavior by potential competitors was not observed.28
Our experience suggests that one reason companies spend vast amounts on SEM stems
from the challenges they face in generating causal measures of the returns to advertising.
As the results in Table 1 demonstrate, typical regressions of sales on advertising spend
result in astronomical ROI estimates that vastly overestimate the true ROI, which can
only be estimated using controlled experiments. This is in line with results obtained by
Lewis et al. (2011) regarding the effectiveness of display ads.
In the absence of causal measures, the industry relies on ‘attribution’ measures which
correlate clicks and purchases. By this measure, eBay performed very well as shown in
Figure 3a and Table 1. eBay’s ads were very effective at earning clicks and associated
purchases. Our findings suggest, however, that even incremental clicks do not translate
into incremental sales. This is an important way in which our methodology differs from
dia on 3/12/2012, http://kantarmediana.com/sites/default/files/kantareditor/Kantar_Media_2011_Full_Year_US_Ad_Spend.pdf
27If you were to start a new online presence selling a high quality and low-priced widget, someonequerying the word “widget” would still most likely not see your site. This is a consequence of the PageRankalgorithm that relies on established links to webpages. Only after many websites link to your site, relatedto the word widget, will you stand a chance of rising to the top of the organic search results.
28Some retailers have been bidding, both before and after ebay’s response, to “broad” brand phrasessuch as “ebay shoes”. It is also interesting to note that several advertisers pushed unsuccessfully forlitigation to prevent their competitors from bidding on their trademark keywords, suggesting that somecompanies understand the Prisoner’s Dilemma nature of this activity.
17

the one used in studies released by Google. Chan et al. (2011a) report that experimental
studies performed at Google proved that about 89% of paid search clicks were deemed to
be incremental, that is, would not have happened if companies would not pay for search.
As Section 3.3 shows, our results confirm that a majority of ebay’s paid search clicks
are not recovered when ebay stops paying for them. Nonetheless, the majority of these
clicks did not result in incremental sales, which in turn is the reason that paid search
was ineffective as clicks alone are not a source of revenues. It is interesting to note that
the incentives faced by advertising firms, publishers, analytics consulting firms, and even
marketing executives within companies, are all aligned with increasing advertising budgets.
18
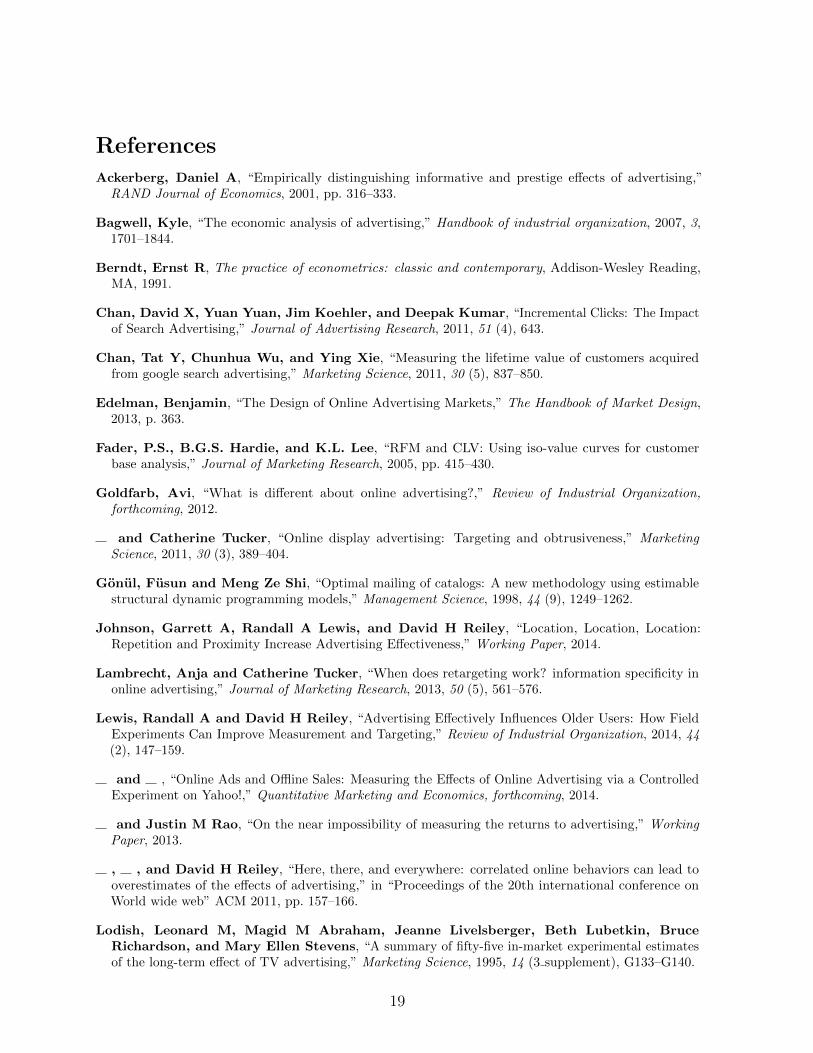
References
Ackerberg, Daniel A, “Empirically distinguishing informative and prestige effects of advertising,”RAND Journal of Economics, 2001, pp. 316–333.
Bagwell, Kyle, “The economic analysis of advertising,” Handbook of industrial organization, 2007, 3,1701–1844.
Berndt, Ernst R, The practice of econometrics: classic and contemporary, Addison-Wesley Reading,MA, 1991.
Chan, David X, Yuan Yuan, Jim Koehler, and Deepak Kumar, “Incremental Clicks: The Impactof Search Advertising,” Journal of Advertising Research, 2011, 51 (4), 643.
Chan, Tat Y, Chunhua Wu, and Ying Xie, “Measuring the lifetime value of customers acquiredfrom google search advertising,” Marketing Science, 2011, 30 (5), 837–850.
Edelman, Benjamin, “The Design of Online Advertising Markets,” The Handbook of Market Design,2013, p. 363.
Fader, P.S., B.G.S. Hardie, and K.L. Lee, “RFM and CLV: Using iso-value curves for customerbase analysis,” Journal of Marketing Research, 2005, pp. 415–430.
Goldfarb, Avi, “What is different about online advertising?,” Review of Industrial Organization,forthcoming, 2012.
and Catherine Tucker, “Online display advertising: Targeting and obtrusiveness,” MarketingScience, 2011, 30 (3), 389–404.
Gonul, Fusun and Meng Ze Shi, “Optimal mailing of catalogs: A new methodology using estimablestructural dynamic programming models,” Management Science, 1998, 44 (9), 1249–1262.
Johnson, Garrett A, Randall A Lewis, and David H Reiley, “Location, Location, Location:Repetition and Proximity Increase Advertising Effectiveness,” Working Paper, 2014.
Lambrecht, Anja and Catherine Tucker, “When does retargeting work? information specificity inonline advertising,” Journal of Marketing Research, 2013, 50 (5), 561–576.
Lewis, Randall A and David H Reiley, “Advertising Effectively Influences Older Users: How FieldExperiments Can Improve Measurement and Targeting,” Review of Industrial Organization, 2014, 44(2), 147–159.
and , “Online Ads and Offline Sales: Measuring the Effects of Online Advertising via a ControlledExperiment on Yahoo!,” Quantitative Marketing and Economics, forthcoming, 2014.
and Justin M Rao, “On the near impossibility of measuring the returns to advertising,” WorkingPaper, 2013.
, , and David H Reiley, “Here, there, and everywhere: correlated online behaviors can lead tooverestimates of the effects of advertising,” in “Proceedings of the 20th international conference onWorld wide web” ACM 2011, pp. 157–166.
Lodish, Leonard M, Magid M Abraham, Jeanne Livelsberger, Beth Lubetkin, BruceRichardson, and Mary Ellen Stevens, “A summary of fifty-five in-market experimental estimatesof the long-term effect of TV advertising,” Marketing Science, 1995, 14 (3 supplement), G133–G140.
19

Manchanda, Puneet, Jean-Pierre Dube, Khim Yong Goh, and Pradeep K Chintagunta, “Theeffect of banner advertising on internet purchasing,” Journal of Marketing Research, 2006, pp. 98–108.
Narayanan, Sridhar and Kirthi Kalyanam, “Measuring position effects in search advertising: Aregression discontinuity approach,” Technical Report, Working Paper 2011.
Reiley, David H, Sai-Ming Li, and Randall A Lewis, “Northern exposure: A field experimentmeasuring externalities between search advertisements,” in “Proceedings of the 11th ACM conferenceon Electronic commerce” ACM 2010, pp. 297–304.
Rutz, Oliver J and Randolph E Bucklin, “From Generic to Branded: A Model of Spillover in PaidSearch Advertising,” Journal of Marketing Research, 2011, 48 (1), 87–102.
Sahni, Navdeep, “Effect of Temporal Spacing between Advertising Exposures: Evidence from an OnlineField Experiment,” 2011.
Vaver, Jon and Jim Koehler, “Measuring Ad Effectiveness Using Geo Experiments,” 2011.
Yang, S. and A. Ghose, “Analyzing the relationship between organic and sponsored search advertising:Positive, negative, or zero interdependence?,” Marketing Science, 2010, 29 (4), 602–623.
Yao, Song and Carl F Mela, “A dynamic model of sponsored search advertising,” Marketing Science,2011, 30 (3), 447–468.
20
Appendix
Brand Keyword Click Magnitude Estimation
To quantify the substitution between natural and organic search for brand terms, we first
regress the log of total daily clicks from MSN to eBay on an indicator for whether days
were in the period with ads turned off. Results are shown in Table A1. Click volume
was 5.6 percent lower in the period after advertising was suspended. We then use data
on eBay’s clicks from Google as a control for seasonal factors because during the test
period on MSN, eBay continued to purchase brand keyword advertising on Google. With
this data, we calculate the change in total click traffic in the presence of brand keyword
advertising. In the difference-in-differences approach, we add observations of daily traffic
from Google and Yahoo! and include in the specification search engine dummies and
trends.29 The variable of interest is thus the interaction between a dummy for the MSN
platform and a dummy for treatment (ad off) period. Column (2) of Table A1 show a
much smaller effect once the seasonality is accounted for. In fact, only 0.529 percent of
the click traffic is lost so 99.5 percent is retained. Notice that this is a lower bound of
retention because some of the 0.5 percent of traffic that no longer comes through Google
may be switching to non-Google traffic (e.g. typing “ebay.com” into the browser).
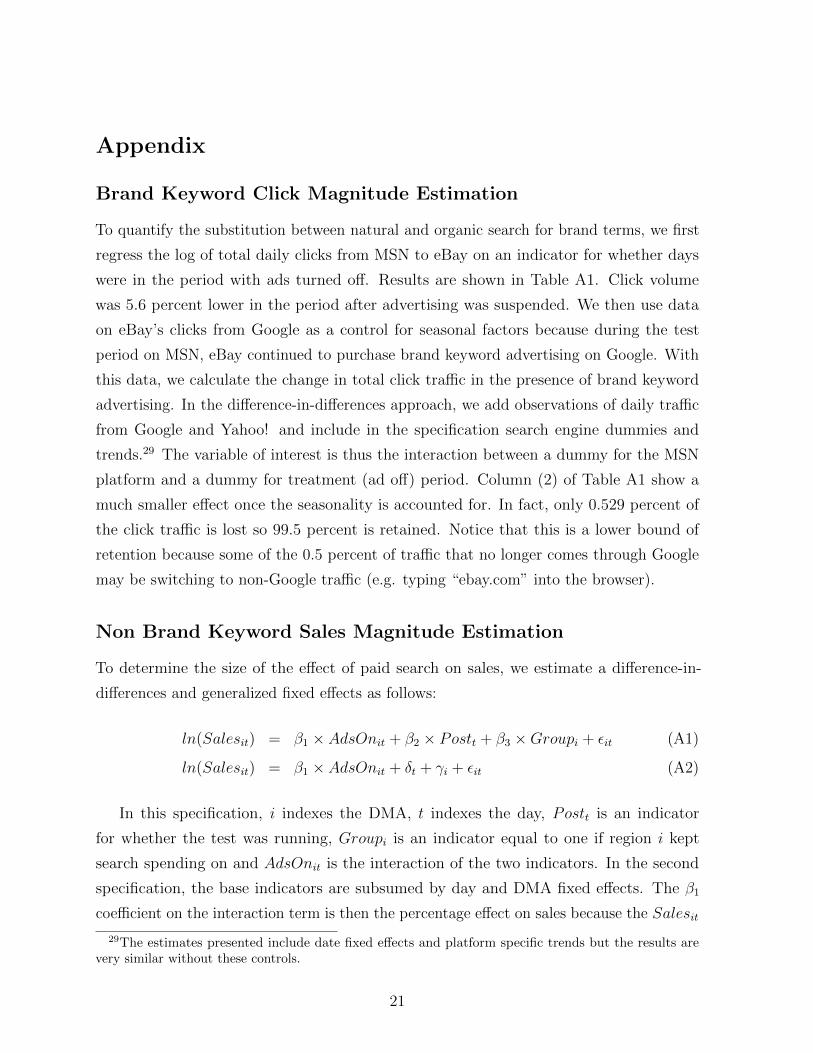
Non Brand Keyword Sales Magnitude Estimation
To determine the size of the effect of paid search on sales, we estimate a difference-in-
differences and generalized fixed effects as follows:
ln(Salesit) = β1 × AdsOnit + β2 × Postt + β3 ×Groupi + εit (A1)
ln(Salesit) = β1 × AdsOnit + δt + γi + εit (A2)
In this specification, i indexes the DMA, t indexes the day, Postt is an indicator
for whether the test was running, Groupi is an indicator equal to one if region i kept
search spending on and AdsOnit is the interaction of the two indicators. In the second
specification, the base indicators are subsumed by day and DMA fixed effects. The β1
coefficient on the interaction term is then the percentage effect on sales because the Salesit
29The estimates presented include date fixed effects and platform specific trends but the results arevery similar without these controls.
21

Table A1: Quantifying Brand Keyword Substitution
MSN Google
(1) (2) (3)Log Clicks Log Clicks Log Clicks
Period -0.0560∗∗∗ -0.0321∗
(0.00861) (0.0124)
Interaction -0.00529(0.0177)
Google 5.088(10.06)
Yahoo 1.375(5.660)
Constant 12.82∗∗∗ 11.33∗ 14.34∗∗∗
(0.00583) (5.664) (0.00630)Date FE YesPlatform Trends YesN 118 180 120
Standard errors in parentheses∗ p < 0.05, ∗∗ p < 0.01, ∗∗∗ p < 0.001
This table shows regression analyses of the data in Figure 2. Column (1) shows estimates of a regression of the log of daily
click counts on an indicator for whether the day is after the brand keyword suspension. Column (2) adds daily data from
Google and Yahoo! and shows the estimates of a difference-in-differences regression. Column (3) mimics Column (1) for
the Google suspension and resumption of brand keyword advertising.
is the log of total sales in region i on day t. We restrict attention to sales from fixed-price
transactions because auctions may pool users from both test and control DMAs, which in
turn would attenuate the effect of ads on sales.30 We control for inter-DMA variation with
DMA clustered standard errors and DMA fixed effects.
Columns (1) and (2) in Table A2 correspond to Equations (A1) and (A2) respectively
where an observation is at the daily DMA level, resulting in 23,730 observations. Columns
(3) and (4) correspond to Equations (A1) and (A2) respectively where an observation is
aggregated over days at the DMA level for the pre and post periods separately, resulting in
420 observations. All regression results confirm the very small and statistically insignificant
effect of paid search ads.
30The results throughout are quantitatively similar even if we include auction transactions.
22
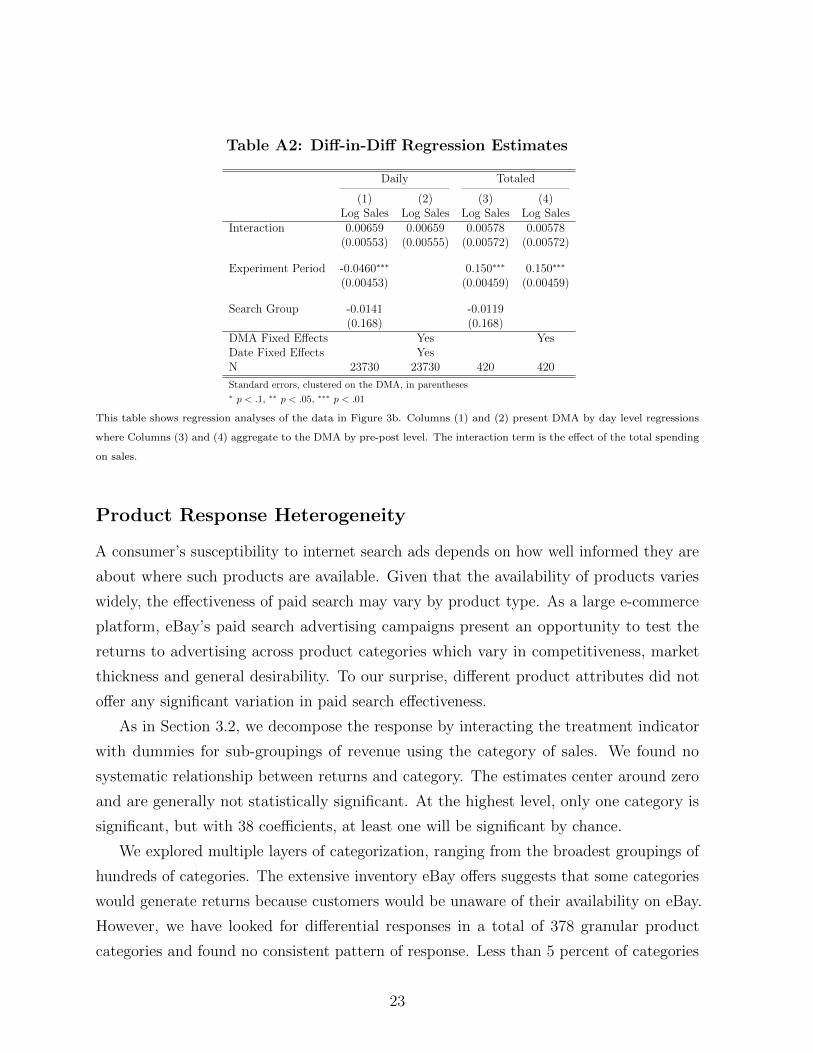
Table A2: Diff-in-Diff Regression Estimates
Daily Totaled
(1) (2) (3) (4)Log Sales Log Sales Log Sales Log Sales
Interaction 0.00659 0.00659 0.00578 0.00578(0.00553) (0.00555) (0.00572) (0.00572)
Experiment Period -0.0460∗∗∗ 0.150∗∗∗ 0.150∗∗∗
(0.00453) (0.00459) (0.00459)
Search Group -0.0141 -0.0119(0.168) (0.168)
DMA Fixed Effects Yes YesDate Fixed Effects YesN 23730 23730 420 420
Standard errors, clustered on the DMA, in parentheses∗ p < .1, ∗∗ p < .05, ∗∗∗ p < .01
This table shows regression analyses of the data in Figure 3b. Columns (1) and (2) present DMA by day level regressions
where Columns (3) and (4) aggregate to the DMA by pre-post level. The interaction term is the effect of the total spending
on sales.
Product Response Heterogeneity
A consumer’s susceptibility to internet search ads depends on how well informed they are
about where such products are available. Given that the availability of products varies
widely, the effectiveness of paid search may vary by product type. As a large e-commerce
platform, eBay’s paid search advertising campaigns present an opportunity to test the
returns to advertising across product categories which vary in competitiveness, market
thickness and general desirability. To our surprise, different product attributes did not
offer any significant variation in paid search effectiveness.
As in Section 3.2, we decompose the response by interacting the treatment indicator
with dummies for sub-groupings of revenue using the category of sales. We found no
systematic relationship between returns and category. The estimates center around zero
and are generally not statistically significant. At the highest level, only one category is
significant, but with 38 coefficients, at least one will be significant by chance.
We explored multiple layers of categorization, ranging from the broadest groupings of
hundreds of categories. The extensive inventory eBay offers suggests that some categories
would generate returns because customers would be unaware of their availability on eBay.
However, we have looked for differential responses in a total of 378 granular product
categories and found no consistent pattern of response. Less than 5 percent of categories
23
are statistically significant at the 5 percent confidence level. Moreover, in an examination
of the estimates at finer levels of categorization, we found no connection between ordinal
ranking of treatment effect product features like sales volume or availability. It is thus
evident that for a well known company like eBay, product attributes are less important in
search advertising than user intent and, more importantly, user information.
Controlled Brand-Keyword Experiments
In January 2013, we conducted a follow-up test of the brand term paid search, specifically
keyword eBay, using geographic variation. Google offers geographic specific advertising
across Germany’s 16 states. So we selected a random half of the country, 8 states, where
brand keyword ads were suspended. This test design preserves a randomly selected control
group which is absent from the simple pre-post analysis shown in Section 3.
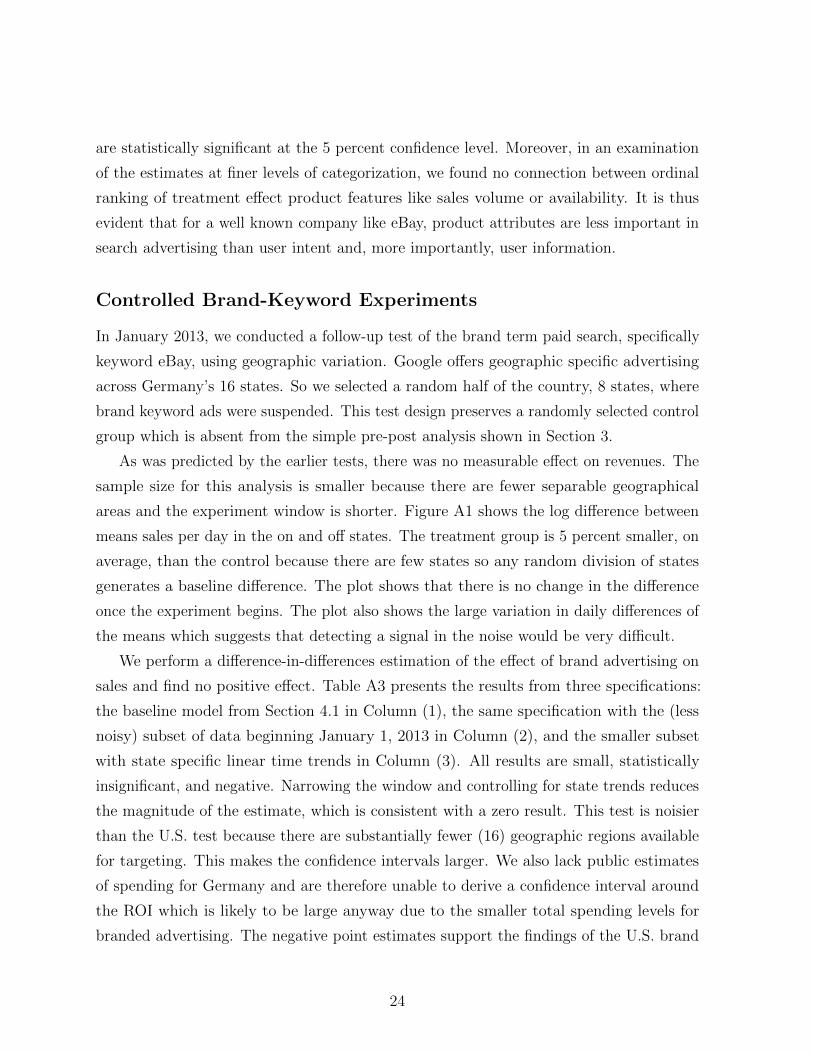
As was predicted by the earlier tests, there was no measurable effect on revenues. The
sample size for this analysis is smaller because there are fewer separable geographical
areas and the experiment window is shorter. Figure A1 shows the log difference between
means sales per day in the on and off states. The treatment group is 5 percent smaller, on
average, than the control because there are few states so any random division of states
generates a baseline difference. The plot shows that there is no change in the difference
once the experiment begins. The plot also shows the large variation in daily differences of
the means which suggests that detecting a signal in the noise would be very difficult.
We perform a difference-in-differences estimation of the effect of brand advertising on
sales and find no positive effect. Table A3 presents the results from three specifications:
the baseline model from Section 4.1 in Column (1), the same specification with the (less
noisy) subset of data beginning January 1, 2013 in Column (2), and the smaller subset
with state specific linear time trends in Column (3). All results are small, statistically
insignificant, and negative. Narrowing the window and controlling for state trends reduces
the magnitude of the estimate, which is consistent with a zero result. This test is noisier
than the U.S. test because there are substantially fewer (16) geographic regions available
for targeting. This makes the confidence intervals larger. We also lack public estimates
of spending for Germany and are therefore unable to derive a confidence interval around
the ROI which is likely to be large anyway due to the smaller total spending levels for
branded advertising. The negative point estimates support the findings of the U.S. brand
24
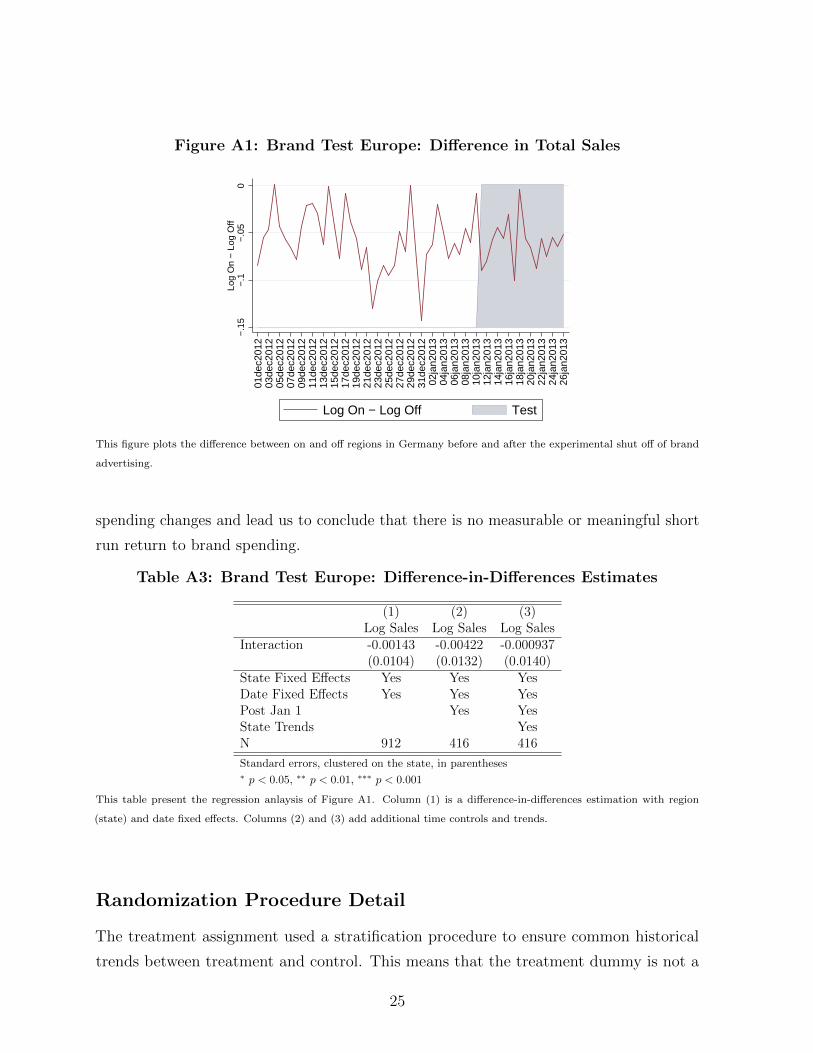
Figure A1: Brand Test Europe: Difference in Total Sales
−.1
5−
.1−
.05
0Lo
g O
n −
Log
Off
01de
c201
203
dec2
012
05de
c201
207
dec2
012
09de
c201
211
dec2
012
13de
c201
215
dec2
012
17de
c201
219
dec2
012
21de
c201
223
dec2
012
25de
c201
227
dec2
012
29de
c201
231
dec2
012
02ja
n201
304
jan2
013
06ja
n201
308
jan2
013
10ja
n201
312
jan2
013
14ja
n201
316
jan2
013
18ja
n201
320
jan2
013
22ja
n201
324
jan2
013
26ja
n201
3
Log On − Log Off Test
This figure plots the difference between on and off regions in Germany before and after the experimental shut off of brand
advertising.
spending changes and lead us to conclude that there is no measurable or meaningful short
run return to brand spending.
Table A3: Brand Test Europe: Difference-in-Differences Estimates
(1) (2) (3)Log Sales Log Sales Log Sales
Interaction -0.00143 -0.00422 -0.000937(0.0104) (0.0132) (0.0140)
State Fixed Effects Yes Yes YesDate Fixed Effects Yes Yes YesPost Jan 1 Yes YesState Trends YesN 912 416 416
Standard errors, clustered on the state, in parentheses∗ p < 0.05, ∗∗ p < 0.01, ∗∗∗ p < 0.001
This table present the regression anlaysis of Figure A1. Column (1) is a difference-in-differences estimation with region
(state) and date fixed effects. Columns (2) and (3) add additional time controls and trends.
Randomization Procedure Detail
The treatment assignment used a stratification procedure to ensure common historical
trends between treatment and control. This means that the treatment dummy is not a
25
simple random variable but instead lends itself to a difference-in-differences estimation.
The test regions, or DMAs, were chosen in two steps. First, 133 of the 210 U.S. regions
were selected to be candidates for treatment purely at random. Of these, only about
half were alloted to be treated (advertising turned off). To minimize historical variation
between test and control, groups of 68 were drawn at random and then the historical
weekly serial correlation was computed. Several draws with very low historical correlation
were discarded before the current draw of 68 in one group and 65 in another. Which group
was actually turned off was decided by a coin flip. The 68 regions were then turned off at
an arbitrary date (based largely on engineering availability). This procedure lends itself
perfectly to a difference-in-differences estimation where the core underlying assumption is
common trends.
Candidacy IV estimation
The assignment of DMAs into treatment cells for the non-brand keyword experiment was
stratified on historical trends. This stratification lacks the clarity of a total random
assignment but the methodology admits an alternative approach that leverages the
completely random assignment to the set of DMAs eligible for testing. We use the
assignment to the candidate group as an instrument for whether or not a DMA was
assigned to the treatment group. We collapse the data to the DMA level and use two stage
least squares to estimate the effect of treatment assignment and advertising spending on
revenue. We include pre-period sales in both stages to control for variations in DMA size.
The first and second stages are as follows:
ln(Salesi) = β0 + β1 × AdsOni + β2 × ln(PreSales)i + εi (A3)
AdsOni = α0 + α1 × Candidatei + µi (A4)
The estimates are shown in Table A4. The coefficients on both extensive (AdsOn) and
intensive (spending level) are smaller than those in Tables A2 and 1, respectively. If the
stratification assignment introduce a bias into the treatment effect, it is a positive bias
which makes our primary estimates an upper bound on the true effect of advertising on
paid search. The standard errors in this IV approach are larger than primary specifications
making this method less precise. The loss of precision in the IV stems from the reduction
26

Table A4: Candidate DMA Instrument
(1) (2)ln(Test Period Sales) ln(Test Period Revenue)
Ads On 0.00207(0.0108)
ln(Test Period Spend) 0.000795(0.00350)
ln(Pre Period Sales) 1.007∗∗∗
(0.00226)
ln(Pre Period Revenue) 0.997∗∗∗
(0.0113)
ln(Pre Period Spend) 0.00877(0.0109)
Constant 0.0436 0.102∗∗
(0.0354) (0.0520)Observations 210 210
Standard errors in parentheses∗ p < .1, ∗∗ p < .05, ∗∗∗ p < .01
This table presents estimates from a two stage least squares estimation where an indicator for whether the DMA was a
‘candidate’ for ad suspension is used as an excluded instrument for whether ads were left on (in Column 1) and test period
spending (Column 2)
27

in observations from 420 in Table A2 to 210 because the difference-in-differences approach
uses the exogenous timing of the treatment. Moreover, the stratification was in fact
designed to reduce inter-temporal variance across treatment cells.
Candidacy Difference-in-Differences
To further check the randomization procedure we estimated the difference-in-differences
using the candidacy indicator as the treatment dummy. This would estimate the diluted
effect on all DMAs that were considered candidates for testing. Column (1) of Table A5
shows the results. The negative coefficient here is expected since ‘candidate’ DMAs were
Table A5: Candidate DMA Diff-in-Diff
(1) (2)Log Sales Log Sales
Interaction -0.00247 0.00124(0.00526) (0.00653)
Candidate for Off DMA 0.167∗∗∗ 1.194∗∗∗
(0.00288) (0.00358)
Experiment Period -0.199∗∗∗ -0.195∗∗∗
(0.0117) (0.0150)
Constant 11.87∗∗∗ 11.87∗∗∗
(0.00738) (0.00924)Date Fixed Effects Yes YesDMA Fixed Effects Yes YesAds On Only DMAs YesN 23730 16046
Standard errors, clustered on the DMA, in parentheses∗ p < .1, ∗∗ p < .05, ∗∗∗ p < .01
This table presents estimates from a difference-in-differences analysis just as in Table A2 where the indicator for whether
spending was suspended is replaced by an indicator for whether the region was a ‘candidate’ for suspension.
candidates for turning ads off. Thus, the 0.25 percent is just under half the magnitude of
the main estimates we present.
To check the randomization, we repeated this estimation on the sub-sample of DMAs
that were not selected into treatment. These DMAs were all controls in the main estimation
and ad spending was on throughout the experiment. The coefficient therefore represents
the change in the candidate control regions over the non-candidate control regions during
the test. Column (2) of Table A5 presents the results, a small positive coefficient which
is statistically zero. We conclude that the stratification procedure did not create any
28
evidence of a biased treatment assignment.
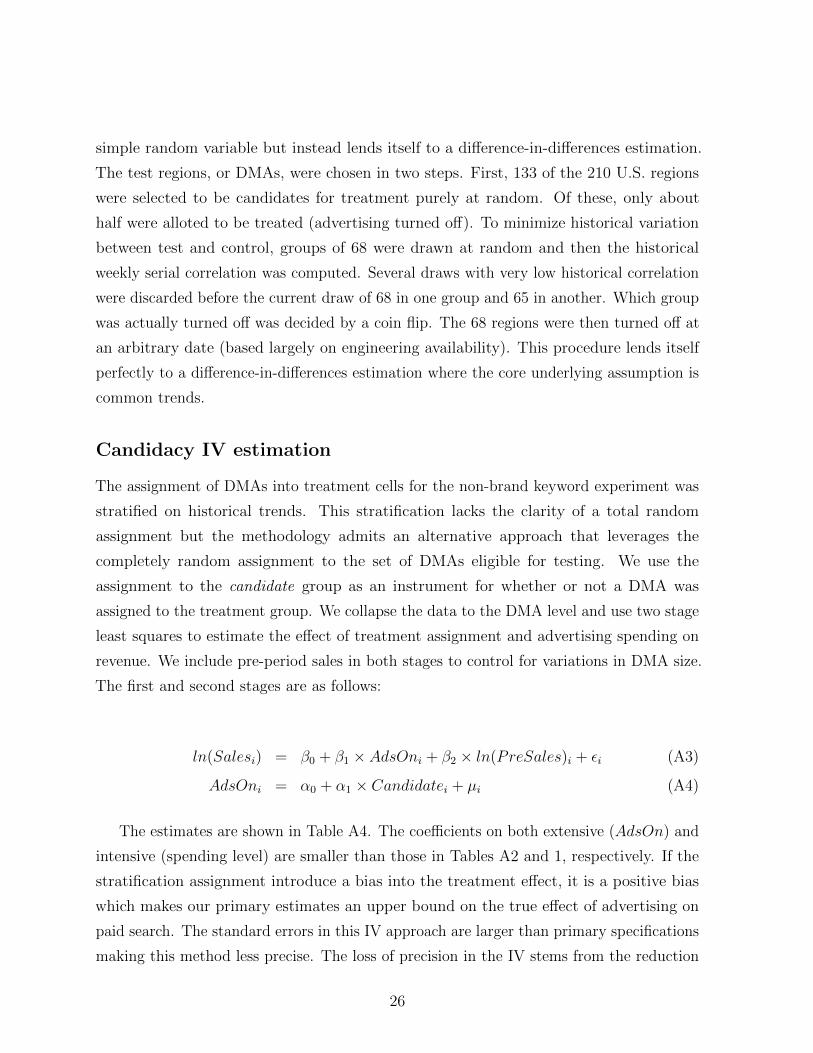
ROI Results in Levels
The preferred specification reports regressions in logged dependent variable because the
dependent variable is very right skewed (some DMAs are very large and some days have
large positive shocks). Given the large variance across days and DMAs, the average is
not particularly meaningful. The IV approach of Equaitons 1 and 2 permits a more
straightforward estimation of ROI using level regressions. Table A6 presents the result of
an estimation of Equaitons 1 and 2 where ln(Spend) and ln(Rev) is replace with spend
and revenue, respectively, in dollars. The coefficient can be interpreted as the dollar
increase in revenue for every dollar spent. A coefficient of 0.199 implies an ROI of -80
percent, comparable but slightly more negative than the primary results of -63 percent.
The confidence interval of this estimate excludes the break-even point of 1. The levels
estimate is qualitatively similar to the log results and so we present the more conservative
estimation as our preferred specification.
Table A6: ROI in Levels
(1)Revenue ($)
Cost ($) 0.199(0.161)
DMA Fixed Effects YesDate Fixed Effects YesN 23730
Standard errors in parentheses∗ p < .1, ∗∗ p < .05, ∗∗∗ p < .01
This table presents estimates similar to Table 1, Column (4) where revenue and spending levels are used in place of logged
values.
ROI Calculations
Recall that ROI is defined as
ROI =R1 −R0
S1 − S0
− 1 ≡ ∆R
∆S− 1. (A5)
29

Let Ri be the revenue in DMA i and let Di = 1 if DMA i was treated (paid search off)
and Di = 0 if it was not (paid search on). The basic difference-in-difference regression we
ran is
ln(Rit) = β1Di + δt + γi + εit
where δt and γi are time and DMA fixed effects. Using the natural logarithm lnRit
implies that for small differences in R1 −R0 the coefficient β1 in the regression is aproxi-
mately the percent change in revenue for the change in the spend level that results from
the experimental treatment. This means that for two revenue levels R1 and R0 we can
write
β1 ≈R1 −R0
R0
,
or,
R0 ≈R1
1 + β1
(A6)
Because the spend in the “off” DMAs is S0 = 0 (or close to it) and in the “on” DMAs
is some S1, then using (A6) and (A5) we can derive the approximate ROI as,
ROI =R1 −R0
S1 − S0
− 1 ≈R1 − R1
1+β1
S1
− 1 =β1
(1 + β1)
R1
S1
− 1. (A7)
Thus, Equation (A7) gives a well defined and financially correct estimate of the ROI based
on the difference-in-difference estimate of the experimental results when S0 = 0.
Unlike the difference-in-difference estimates, the OLS and IV estimates were derived
from the regression
ln(Rit) = α1 ln(Sit) + εit
where the first stage of the IV estimation used the regression
ln(Sit) = α1[AdsOnit] + α2[Postt] + α3[Groupi] + εit
From these, we find α1 = ∆ln(Sales)∆ln(Spend)
and α1 = ∆ln(Spend) for which the approximation to
a percentage change is poor since the change in spend was large. Therefore, to make use
30
of the log-log regression coefficients, it is possible to translate them into a reduced form
effect because,
α1 ∗ α1 =∆ln(Sales)
∆ln(Spend)∗∆ln(Spend) = ∆ln(Sales) = β1
which we can substitute into (A7). Thus, for the estimated α1 of the OLS estimates,
we can use α1 to derive a comparable β1 which can be used to compute an ROI that is
comparable across all specifications.
31